
Bank SinoPac and Subsidiaries · Bank SinoPac and Subsidiaries Consolidated Financial Statements...
120
Bank SinoPac and Subsidiaries Consolidated Financial Statements for the Six Months Ended June 30, 2019 and 2018 and Independent Auditors’ Report
Transcript of Bank SinoPac and Subsidiaries · Bank SinoPac and Subsidiaries Consolidated Financial Statements...
Bank SinoPac and Subsidiaries
Consolidated Financial Statements for the Six Months Ended June 30, 2019 and 2018 and Independent Auditors’ Report
- 1 -
INDEPENDENT AUDITORS’ REPORT
The Board of Directors and Shareholder
Bank SinoPac
Opinion
We have audited the accompanying financial statements of Bank SinoPac and its subsidiaries
(collectively referred to as the Group), which comprise the consolidated balance sheets as of June
30, 2019, December 31, 2018 and June 30, 2018, and the related consolidated statements of
comprehensive income for the three months ended June 30, 2019 and 2018, six months ended June
30, 2019 and 2018, and changes in equity and cash flows for the six months ended June 30, 2019
and 2018, and the notes to the consolidated financial statements, including a summary of
significant accounting policies.
In our opinion, the accompanying consolidated financial statements present fairly, in all material
respects, the consolidated financial position of the Group as of June 30, 2019, December 31, 2018
and June 30, 2018, and its consolidated financial performance for the three months ended June 30,
2019 and 2018, and their consolidated financial performance and cash flows for the six months
ended June 30, 2019 and 2018 in conformity with the Regulations Governing the Preparation of
Financial Reports by Public Banks, Regulations Governing the Preparation of Financial Reports by
Securities Issuers, the guidelines issued by the authority, and International Accounting Standard 34
“Interim Financial Reporting” endorsed and issued into effect by the Financial Supervisory
Commission of the Republic of China.
Basis for Opinion
We conducted our audits in accordance with Regulations Governing Auditing and Attestation of
Financial Statements of Financial Institutions by Certified Public Accountants and auditing
standards generally accepted in the Republic of China. Our responsibilities under those standards
are further described in the Auditors’ Responsibilities for the Audit of the Consolidated Financial
Statements section of our report. We are independent of the Group in accordance with The Norm of
Professional Ethics for Certified Public Accountant of the Republic of China, and we have fulfilled
our other ethical responsibilities in accordance with these requirements. We believe that the audit
evidence we have obtained is sufficient and appropriate to provide a basis for our opinion.
Key Audit Matters
Key audit matters are those matters that, in our professional judgment, were of most significance in
our audit of the consolidated financial statements for the six months ended June 30, 2019. These
matters were addressed in the context of our audit of the consolidated financial statements as a
whole, and in forming our opinion thereon, and we do not provide a separate opinion on these
matters.

- 2 -
Key audit matters for the Group’s consolidated financial statements for the six months ended June
30, 2019 are stated as follows:
Estimated Impairment of Discounts and Loans
To assess collectively the estimated impairment of discounts and loans, management makes
judgments on assumptions of probability of default and loss given default based on historical
experience, current market situation and forward-looking information. Assessment of evidence of
default and credit impairment, whether the credit risk has increased significantly since the original
recognition (including the adoption of forward-looking factors), and the assessment of the
methodology and assumptions used for estimating impairment and the estimation of the amount
and timing of future cash flows are critical judgments and estimates; therefore, the estimation of the
provision for impairment of discounts and loans is identified as a key audit matter for the six
months ended June 30, 2019.
Refer to Notes 4, 5 and 44 c. to the accompanying consolidated financial statements for the relevant
accounting policies, judgments for estimations, estimation uncertainty and other related disclosures
of the estimated impairment of discounts and loans.
Our key audit procedures performed in respect of the above area included the following:
We understood and assessed management’s impairment practices, accounting policies and related
internal control procedures for discounts and loans to evaluate whether the methodology,
assumptions and inputs used conform to the IFRS 9 impairment model and appropriately reflected
the actual outcome. We assessed the rationality and consistency of the probability of default, the
estimation of forward-looking factors, loss given default and exposure at default, etc. We
performed sampling on discounts and loans to verify their completeness and rationality. Finally, we
considered related guidelines issued by the authorities and tested whether the classification and the
provision for impairment of discounts and loans complied with the related regulation issued by the
authority.
Other Matter
We have also audited the parent company only financial statements if Bank SinoPac as of and for
the six months ended June 30, 2019 and 2018 on which we have issued an unmodified opinion.
Responsibilities of Management and Those Charged with Governance for the Consolidated
Financial Statements
Management is responsible for the preparation and fair presentation of the consolidated financial
statements in accordance with the Regulations Governing the Preparation of Financial Reports by
Public Banks, Regulations Governing the Preparation of Financial Reports by Securities Issuers,
the guidelines issued by the authority, and International Accounting Standard 34 “Interim Financial
Reporting” endorsed and issued into effect by the Financial Supervisory Commission of the
Republic of China, and for such internal control as management determines is necessary to enable
the preparation of consolidated financial statements that are free from material misstatement,
whether due to fraud or error.
In preparing the consolidated financial statements, management is responsible for assessing the
Group’s ability to continue as a going concern, disclosing, as applicable, matters related to going
concern and using the going concern basis of accounting unless management either intends to
liquidate the Group or to cease operations, or has no realistic alternative but to do so.
Those charged with governance, including the audit committee, are responsible for overseeing the
Group’s financial reporting process.
- 3 -
Auditors’ Responsibilities for the Audit of the Consolidated Financial Statements
Our objectives are to obtain reasonable assurance about whether the consolidated financial
statements as a whole are free from material misstatement, whether due to fraud or error, and to
issue an auditors’ report that includes our opinion. Reasonable assurance is a high level of
assurance, but is not a guarantee that an audit conducted in accordance with the auditing standards
generally accepted in the Republic of China will always detect a material misstatement when it
exists. Misstatements can arise from fraud or error and are considered material if, individually or in
the aggregate, they could reasonably be expected to influence the economic decisions of users
taken on the basis of these financial statements.
As part of an audit in accordance with the auditing standards generally accepted in the Republic of
China, we exercise professional judgment and maintain professional skepticism throughout the
audit. We also:
1. Identify and assess the risks of material misstatement of the financial statements, whether due
to fraud or error, design and perform audit procedures responsive to those risks, and obtain
audit evidence that is sufficient and appropriate to provide a basis for our opinion. The risk of
not detecting a material misstatement resulting from fraud is higher than for one resulting from
error, as fraud may involve collusion, forgery, intentional omissions, misrepresentations, or the
override of internal control.
2. Obtain an understanding of internal control relevant to the audit in order to design audit
procedures that are appropriate in the circumstances, but not for the purpose of expressing an
opinion on the effectiveness of the Group’s internal control.
3. Evaluate the appropriateness of accounting policies used and the reasonableness of accounting
estimates and related disclosures made by management.
4. Conclude on the appropriateness of management’s use of the going concern basis of
accounting and, based on the audit evidence obtained, whether a material uncertainty exists
related to events or conditions that may cast significant doubt on the Group’s ability to
continue as a going concern. If we conclude that a material uncertainty exists, we are required
to draw attention in our auditors’ report to the related disclosures in the consolidated financial
statements or, if such disclosures are inadequate, to modify our opinion. Our conclusions are
based on the audit evidence obtained up to the date of our auditors’ report. However, future
events or conditions may cause the Group to cease to continue as a going concern.
5. Evaluate the overall presentation, structure and content of the consolidated financial statements,
including the disclosures, and whether the consolidated financial statements represent the
underlying transactions and events in a manner that achieves fair presentation.
6. Obtain sufficient appropriate audit evidence regarding the financial information of the entities
or business activities within the Group to express an opinion on the consolidated financial
statements. We are responsible for the direction, supervision and performance of the group
audit. We remain solely responsible for our audit opinion.
We communicate with those charged with governance regarding, among other matters, the planned
scope and timing of the audit and significant audit findings, including any significant deficiencies
in internal control that we identify during our audit.
- 4 -
We also provide those charged with governance with a statement that we have complied with
relevant ethical requirements regarding independence, and to communicate with them all
relationships and other matters that may reasonably be thought to bear on our independence, and
where applicable, related safeguards.
From the matters communicated with those charged with governance, we determine those matters
that were of most significance in the audit of the consolidated financial statements for the six
months ended June 30, 2019 and are therefore the key audit matters. We describe these matters in
our auditors’ report unless law or regulation precludes public disclosure about the matter or when,
in extremely rare circumstances, we determine that a matter should not be communicated in our
report because the adverse consequences of doing so would reasonably be expected to outweigh the
public interest benefits of such communication.
The engagement partners on the audit resulting in this independent auditors’ report are Yi-Chun
Wu and Cheng-Hung Kuo.
Deloitte & Touche
Taipei, Taiwan
Republic of China
August 16, 2019
The accompanying consolidated financial statements are intended only to present the consolidated
financial position, financial performance and cash flows in accordance with accounting principles
and practices generally accepted in the Republic of China and not those of any other jurisdictions.
The standards, procedures and practices to audit such consolidated financial statements are those
generally applied in the Republic of China.
For the convenience of readers, the independent auditors’ report and the accompanying
consolidated financial statements have been translated into English from the original Chinese
version prepared and used in the Republic of China. If there is any conflict between the English
version and the original Chinese version or any difference in the interpretation of the two versions,
the Chinese-language independent auditors’ report and consolidated financial statements shall
prevail.

- 5 -
BANK SINOPAC AND SUBSIDIARIES
CONSOLIDATED BALANCE SHEETS
(In Thousands of New Taiwan Dollars)
June 30, 2019 December 31, 2018 June 30, 2018
ASSETS Amount % Amount % Amount %
CASH AND CASH EQUIVALENTS, NET (Notes 6 and 40) $ 20,432,317 1 $ 18,168,837 1 $ 20,850,752 2
DUE FROM THE CENTRAL BANK AND CALL LOANS TO BANKS, NET (Notes 7 and 40) 116,350,613 7 91,889,402 6 81,325,798 6
FINANCIAL ASSETS AT FAIR VALUE THROUGH PROFIT OR LOSS (Notes 8 and 40) 59,478,454 4 49,834,007 4 64,529,763 4
FINANCIAL ASSETS AT FAIR VALUE THROUGH OTHER COMPREHENSIVE INCOME
(Notes 9 and 40) 216,296,069 13 205,643,312 14 233,722,318 16
INVESTMENTS IN DEBT INSTRUMENTS AT AMORTIZED COST (Notes 10 and 41) 113,134,428 7 93,540,669 6 78,412,932 5
SECURITIES PURCHASED UNDER RESELL AGREEMENTS (Notes 11 and 40) 16,777,698 1 22,710,233 2 22,312,476 2
RECEIVABLES, NET (Notes 12 and 40) 47,640,830 3 48,086,686 3 46,495,446 3
CURRENT TAX ASSETS (Notes 4, 29 and 40) 1,375,657 - 1,398,667 - 1,390,775 -
DISCOUNTS AND LOANS, NET (Notes 5, 13, 40 and 41) 1,015,948,271 62 919,303,206 62 877,615,359 60
OTHER FINANCIAL ASSETS, NET (Notes 14, 40 and 41) 15,031,576 1 17,455,051 1 11,368,052 1
PROPERTY AND EQUIPMENT, NET (Notes 3, 15, 17 and 40) 9,293,813 1 9,211,115 1 9,285,823 1
RIGHT-OF-USE ASSETS, NET (Notes 3, 4, 16 and 40) 1,818,464 - - - - -
INVESTMENT PROPERTY, NET (Note 17) 1,132,365 - 1,242,195 - 1,220,251 -
INTANGIBLE ASSETS, NET (Notes 18 and 40) 1,387,812 - 1,323,641 - 1,318,051 -
DEFERRED TAX ASSETS (Notes 4 and 29) 1,393,785 - 1,482,450 - 1,567,856 -
OTHER ASSETS, NET (Notes 3, 19 and 40) 2,831,940 - 4,031,550 - 4,836,887 -
TOTAL $ 1,640,324,092 100 $ 1,485,321,021 100 $ 1,456,252,539 100
LIABILITIES AND EQUITY
DEPOSITS FROM THE CENTRAL BANK AND BANKS (Notes 20 and 40) $ 51,638,487 3 $ 37,964,931 3 $ 53,634,753 4
FINANCIAL LIABILITIES AT FAIR VALUE THROUGH PROFIT OR LOSS (Notes 8 and 40) 16,564,532 1 19,766,915 1 22,376,276 1
SECURITIES SOLD UNDER REPURCHASE AGREEMENTS (Notes 8, 9, 10, 11 and 21) 14,961,242 1 25,504,487 2 28,570,603 2
PAYABLES (Notes 22, 27, 36 and 40) 20,612,727 1 17,694,396 1 23,348,996 2
CURRENT TAX LIABILITIES (Notes 4, 29 and 40) 789,981 - 491,436 - 485,489 -
DEPOSITS AND REMITTANCES (Notes 23 and 40) 1,344,195,310 82 1,195,974,154 81 1,142,853,858 78
BANK DEBENTURES (Notes 24 and 40) 37,221,383 3 32,722,483 2 39,720,764 3
OTHER FINANCIAL LIABILITIES (Notes 25 and 40) 16,002,771 1 19,211,583 1 13,328,168 1
PROVISIONS (Notes 26 and 27) 2,799,993 - 2,975,266 - 2,882,901 -
LEASE LIABILITIES (Notes 3, 4, 16 and 40) 1,800,690 - - - - -
DEFERRED TAX LIABILITIES (Notes 4 and 29) 959,564 - 873,352 - 819,893 -
OTHER LIABILITIES (Notes 28 and 40) 3,247,721 - 3,060,319 - 3,605,611 -
Total liabilities 1,510,794,401 92 1,356,239,322 91 1,331,627,312 91
EQUITY
Capital
Common shares 86,061,159 5 86,061,159 6 86,061,159 6
Capital surplus
Additional paid-in capital in excess of par 4,001,872 - 4,001,872 - 4,001,872 -
Capital surplus from business combination 8,076,524 1 8,076,524 1 8,076,524 1
Others 69,244 - 69,244 - 69,244 -
Total capital surplus 12,147,640 1 12,147,640 1 12,147,640 1
Retained earnings
Legal reserve 23,853,943 2 21,049,419 1 21,049,419 2
Special reserve 418,897 - 505,700 - 505,700 -
Unappropriated earnings 5,651,257 - 9,348,415 1 4,461,664 -
Total retained earnings 29,924,097 2 30,903,534 2 26,016,783 2
Other equity 1,396,795 - (30,634) - 399,645 -
Total equity 129,529,691 8 129,081,699 9 124,625,227 9
TOTAL $ 1,640,324,092 100 $ 1,485,321,021 100 $ 1,456,252,539 100
The accompanying notes are an integral part of the consolidated financial statements.
- 6 -
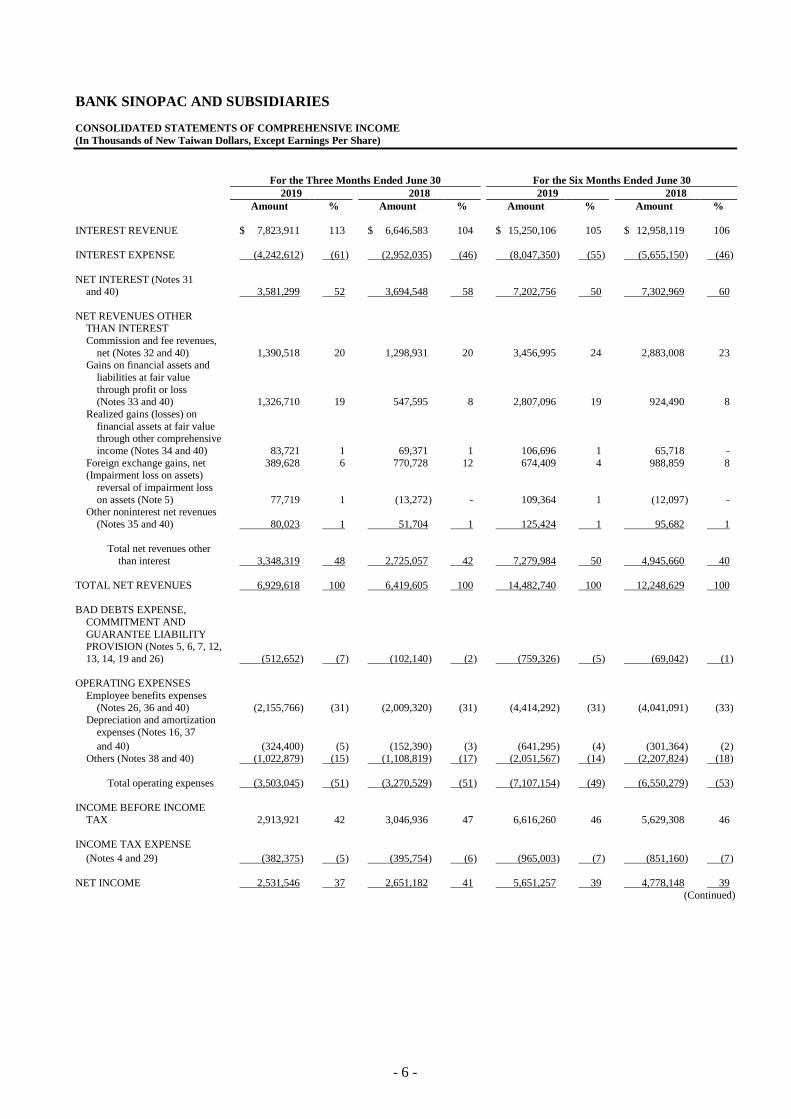
BANK SINOPAC AND SUBSIDIARIES
CONSOLIDATED STATEMENTS OF COMPREHENSIVE INCOME
(In Thousands of New Taiwan Dollars, Except Earnings Per Share)
For the Three Months Ended June 30 For the Six Months Ended June 30
2019 2018 2019 2018
Amount % Amount % Amount % Amount %
INTEREST REVENUE $ 7,823,911 113 $ 6,646,583 104 $ 15,250,106 105 $ 12,958,119 106
INTEREST EXPENSE (4,242,612 ) (61 ) (2,952,035 ) (46 ) (8,047,350 ) (55 ) (5,655,150 ) (46 )
NET INTEREST (Notes 31 and 40) 3,581,299 52 3,694,548 58 7,202,756 50 7,302,969 60
NET REVENUES OTHER THAN INTEREST
Commission and fee revenues,
net (Notes 32 and 40) 1,390,518 20 1,298,931 20 3,456,995 24 2,883,008 23 Gains on financial assets and
liabilities at fair value
through profit or loss (Notes 33 and 40) 1,326,710 19 547,595 8 2,807,096 19 924,490 8
Realized gains (losses) on
financial assets at fair value through other comprehensive
income (Notes 34 and 40) 83,721 1 69,371 1 106,696 1 65,718 -
Foreign exchange gains, net 389,628 6 770,728 12 674,409 4 988,859 8 (Impairment loss on assets)
reversal of impairment loss
on assets (Note 5) 77,719 1 (13,272 ) - 109,364 1 (12,097 ) - Other noninterest net revenues
(Notes 35 and 40) 80,023 1 51,704 1 125,424 1 95,682 1
Total net revenues other
than interest 3,348,319 48 2,725,057 42 7,279,984 50 4,945,660 40
TOTAL NET REVENUES 6,929,618 100 6,419,605 100 14,482,740 100 12,248,629 100
BAD DEBTS EXPENSE,
COMMITMENT AND
GUARANTEE LIABILITY PROVISION (Notes 5, 6, 7, 12,
13, 14, 19 and 26) (512,652 ) (7 ) (102,140 ) (2 ) (759,326 ) (5 ) (69,042 ) (1 )
OPERATING EXPENSES
Employee benefits expenses
(Notes 26, 36 and 40) (2,155,766 ) (31 ) (2,009,320 ) (31 ) (4,414,292 ) (31 ) (4,041,091 ) (33 ) Depreciation and amortization
expenses (Notes 16, 37
and 40) (324,400 ) (5 ) (152,390 ) (3 ) (641,295 ) (4 ) (301,364 ) (2 ) Others (Notes 38 and 40) (1,022,879 ) (15 ) (1,108,819 ) (17 ) (2,051,567 ) (14 ) (2,207,824 ) (18 )
Total operating expenses (3,503,045 ) (51 ) (3,270,529 ) (51 ) (7,107,154 ) (49 ) (6,550,279 ) (53 )
INCOME BEFORE INCOME
TAX 2,913,921 42 3,046,936 47 6,616,260 46 5,629,308 46
INCOME TAX EXPENSE
(Notes 4 and 29) (382,375 ) (5 ) (395,754 ) (6 ) (965,003 ) (7 ) (851,160 ) (7 )
NET INCOME 2,531,546 37 2,651,182 41 5,651,257 39 4,778,148 39
(Continued)

- 7 -
BANK SINOPAC AND SUBSIDIARIES
CONSOLIDATED STATEMENTS OF COMPREHENSIVE INCOME
(In Thousands of New Taiwan Dollars, Except Earnings Per Share)
For the Three Months Ended June 30 For the Six Months Ended June 30
2019 2018 2019 2018
Amount % Amount % Amount % Amount %
OTHER COMPREHENSIVE
INCOME (LOSS) Items that will not be
reclassified subsequently to
profit or loss: Revaluation gains (losses) on
investments in equity
instruments measured at fair value through other
comprehensive income
(Note 30) $ 97,408 1 $ 6,533 - $ 206,150 1 $ (41,129 ) - Change in fair value of
financial liability
attributable to changes in the credit risk of liabilities
(Note 30) (19,973 ) - 11,917 - (59,177 ) - 16,950 -
Income tax relating to items that will not be
reclassified subsequently
to profit or loss (Notes 4, 29 and 30) - - (7,497 ) - - - (3,305 ) -
Items that will not be
reclassified subsequently to profit or
loss 77,435 1 10,953 - 146,973 1 (27,484 ) -
Items that may be reclassified subsequently to profit or
loss: Exchange differences on
translating foreign
operations (Note 30) (126,214 ) (2 ) 30,795 - 102,968 1 (222,971 ) (2 ) Gains (losses) from
investments in debt
instruments measured at fair value through other
comprehensive income
(Note 30) 588,006 9 (21,405 ) - 1,195,552 8 (109,002 ) (1 ) Income tax relating to items
that may be reclassified
subsequently to profit or loss (Notes 4, 29 and 30) 18,637 - (9,215 ) - (18,064 ) - 40,756 -
Items that may be
reclassified subsequently to profit or
loss 480,429 7 175 - 1,280,456 9 (291,217 ) (3 )
Other comprehensive
income (loss) for the
period, net of income
tax 557,864 8 11,128 - 1,427,429 10 (318,701 ) (3 )
TOTAL COMPREHENSIVE INCOME FOR THE PERIOD $ 3,089,410 45 $ 2,662,310 41 $ 7,078,686 49 $ 4,459,447 36
EARNINGS PER SHARE (Note 39)
Basic $0.29 $0.31 $0.66 $0.56
The accompanying notes are an integral part of the consolidated financial statements. (Concluded)

- 8 -
BANK SINOPAC AND SUBSIDIARIES
CONSOLIDATED STATEMENTS OF CHANGES IN EQUITY
(In Thousands of New Taiwan Dollars)
Other Equity (Note 30)
Exchange
Unrealized
Gains
Unrealized
Gains (Losses)
on Financial
Assets
Measured at
Change in Fair
Value of
Financial
Liability
Differences on (Losses) on Fair Value Attributable to
Common Retained Earnings (Note 30) Translating Available-for- through Other Changes in the
Shares Capital Surplus Unappropriated Foreign sale Financial Comprehensive Credit Risk of
(Note 30) (Note 30) Legal Reserve Special Reserve Earnings Total Operations Assets Income Liabilities Total Total Equity
BALANCE AT JANUARY 1, 2018 $ 86,061,159 $ 12,147,640 $ 18,712,695 $ 457,565 $ 7,789,078 $ 26,959,338 $ (9,348) $ (136,290) $ - $ (20,170) $ (165,808) $ 125,002,329
Effect of retrospective application and retrospective restatement - - - - (326,627) (326,627) - 136,290 758,007 - 894,297 567,670
BALANCE AT JANUARY 1, 2018 AS RESTATED 86,061,159 12,147,640 18,712,695 457,565 7,462,451 26,632,711 (9,348) - 758,007 (20,170) 728,489 125,569,999
Appropriation and distribution of retained earnings generated in
2017
Legal reserve - - 2,336,724 - (2,336,724) - - - - - - -
Special revenue - - - 48,135 (48,135) - - - - - - -
Cash dividends - common stock - - - - (5,404,219) (5,404,219) - - - - - (5,404,219)
Net profit for the six months ended June 30, 2018 - - - - 4,778,148 4,778,148 - - - - - 4,778,148
Other comprehensive (loss) income for the six months ended
June 30, 2018, net of income tax - - - - 10,143 10,143 (177,741) - (168,053) 16,950 (328,844) (318,701)
Total comprehensive (loss) income for the six months ended
June 30, 2018 - - - - 4,788,291 4,788,291 (177,741) - (168,053) 16,950 (328,844) 4,459,447
BALANCE AT JUNE 30, 2018 $ 86,061,159 $ 12,147,640 $ 21,049,419 $ 505,700 $ 4,461,664 $ 26,016,783 $ (187,089) $ - $ 589,954 $ (3,220) $ 399,645 $ 124,625,227
BALANCE AT JANUARY 1, 2019 $ 86,061,159 $ 12,147,640 $ 21,049,419 $ 505,700 $ 9,348,415 $ 30,903,534 $ (396,410) $ - $ 373,612 $ (7,836) $ (30,634) $ 129,081,699
Appropriation and distribution of retained earnings generated in
2018
Legal reserve - - 2,804,524 - (2,804,524) - - - - - - -
Reversal of special reserve - - - (86,803) 86,803 - - - - - - -
Cash dividends - common stock - - - - (6,630,694) (6,630,694) - - - - - (6,630,694)
Net profit for the six months ended June 30, 2019 - - - - 5,651,257 5,651,257 - - - - - 5,651,257
Other comprehensive (loss) income for the six months ended
June 30, 2019, net of income tax - - - - - - 82,375 - 1,404,231 (59,177) 1,427,429 1,427,429
Total comprehensive (loss) income for the six months ended
June 30, 2019 - - - - 5,651,257 5,651,257 82,375 - 1,404,231 (59,177) 1,427,429 7,078,686
BALANCE AT JUNE 30, 2019 $ 86,061,159 $ 12,147,640 $ 23,853,943 $ 418,897 $ 5,651,257 $ 29,924,097 $ (314,035) $ - $ 1,777,843 $ (67,013) $ 1,396,795 $ 129,529,691
The accompanying notes are an integral part of the consolidated financial statements.
- 9 -
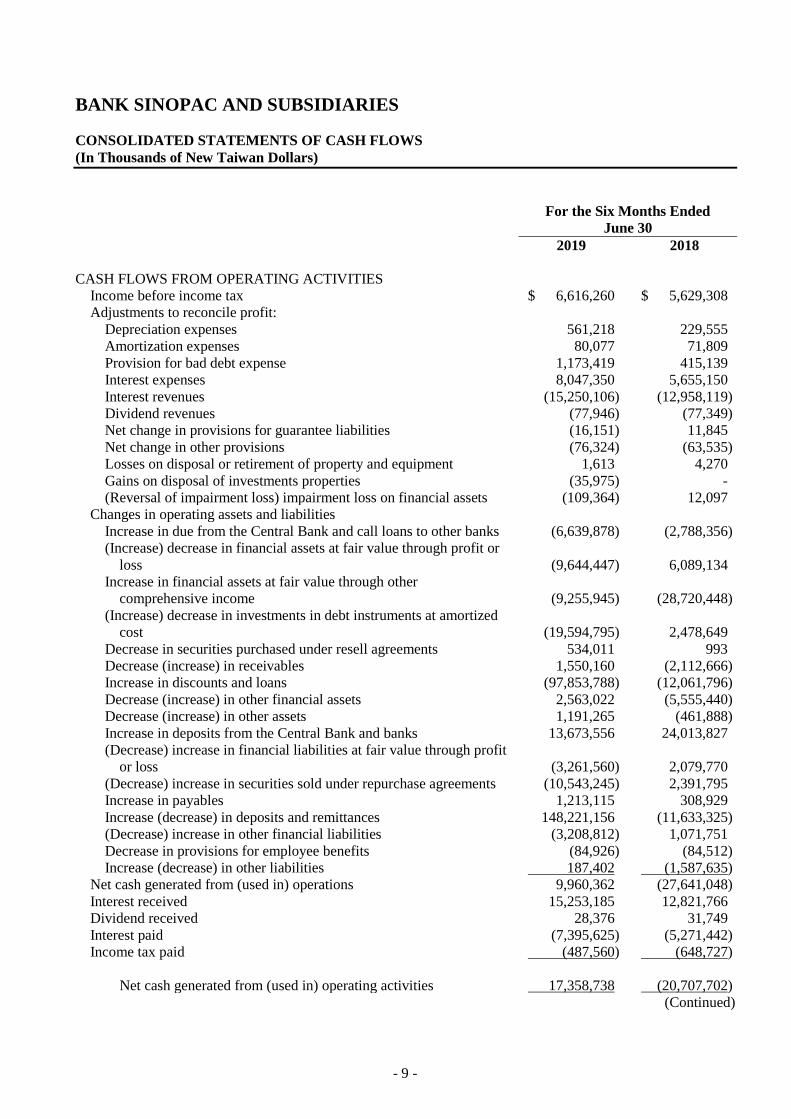
BANK SINOPAC AND SUBSIDIARIES
CONSOLIDATED STATEMENTS OF CASH FLOWS
(In Thousands of New Taiwan Dollars)
For the Six Months Ended
June 30
2019 2018
CASH FLOWS FROM OPERATING ACTIVITIES
Income before income tax $ 6,616,260 $ 5,629,308
Adjustments to reconcile profit:
Depreciation expenses 561,218 229,555
Amortization expenses 80,077 71,809
Provision for bad debt expense 1,173,419 415,139
Interest expenses 8,047,350 5,655,150
Interest revenues (15,250,106) (12,958,119)
Dividend revenues (77,946) (77,349)
Net change in provisions for guarantee liabilities (16,151) 11,845
Net change in other provisions (76,324) (63,535)
Losses on disposal or retirement of property and equipment 1,613 4,270
Gains on disposal of investments properties (35,975) -
(Reversal of impairment loss) impairment loss on financial assets (109,364) 12,097
Changes in operating assets and liabilities
Increase in due from the Central Bank and call loans to other banks (6,639,878) (2,788,356)
(Increase) decrease in financial assets at fair value through profit or
loss (9,644,447) 6,089,134
Increase in financial assets at fair value through other
comprehensive income (9,255,945) (28,720,448)
(Increase) decrease in investments in debt instruments at amortized
cost (19,594,795) 2,478,649
Decrease in securities purchased under resell agreements 534,011 993
Decrease (increase) in receivables 1,550,160 (2,112,666)
Increase in discounts and loans (97,853,788) (12,061,796)
Decrease (increase) in other financial assets 2,563,022 (5,555,440)
Decrease (increase) in other assets 1,191,265 (461,888)
Increase in deposits from the Central Bank and banks 13,673,556 24,013,827
(Decrease) increase in financial liabilities at fair value through profit
or loss (3,261,560) 2,079,770
(Decrease) increase in securities sold under repurchase agreements (10,543,245) 2,391,795
Increase in payables 1,213,115 308,929
Increase (decrease) in deposits and remittances 148,221,156 (11,633,325)
(Decrease) increase in other financial liabilities (3,208,812) 1,071,751
Decrease in provisions for employee benefits (84,926) (84,512)
Increase (decrease) in other liabilities 187,402 (1,587,635)
Net cash generated from (used in) operations 9,960,362 (27,641,048)
Interest received 15,253,185 12,821,766
Dividend received 28,376 31,749
Interest paid (7,395,625) (5,271,442)
Income tax paid (487,560) (648,727)
Net cash generated from (used in) operating activities 17,358,738 (20,707,702)
(Continued)

- 10 -
BANK SINOPAC AND SUBSIDIARIES
CONSOLIDATED STATEMENTS OF CASH FLOWS
(In Thousands of New Taiwan Dollars)
For the Six Months Ended
June 30
2019 2018
CASH FLOWS FROM INVESTING ACTIVITIES
Acquisition of property and equipment $ (260,414) $ (587,026)
Proceeds from disposal of property and equipment 71 1,365
Acquisition of intangible assets (110,338) (34,196)
Acquisition of right-of-use assets (113) -
Acquisition of investment properties (2,669) (1,421)
Proceeds from disposal of investment properties 52,010 -
Net cash used in investing activities (321,453) (621,278)
CASH FLOWS FROM FINANCING ACTIVITIES
Bank debentures issued 8,000,000 1,150,000
Repayment of bank debentures on maturity (3,500,000) (1,000,000)
Repayment of lease liabilities (333,703) -
Cash dividends paid (6,630,694) -
Net cash (used in) generated from financing activities (2,464,397) 150,000
EFFECTS OF EXCHANGE RATE CHANGES ON THE BALANCE
OF CASH HELD IN FOREIGN CURRENCIES 127,663 (176,370)
NET INCREASE (DECREASE) IN CASH AND CASH
EQUIVALENTS 14,700,551 (21,355,350)
CASH AND CASH EQUIVALENTS AT THE BEGINNING OF THE
PERIOD 95,546,383 111,364,388
CASH AND CASH EQUIVALENTS AT THE END OF THE PERIOD $ 110,246,934 $ 90,009,038
Reconciliation of the amounts in the consolidated statements of cash flows with the equivalent items reported in
the consolidated balance sheets as of June 30, 2019 and 2018:
June 30
2019 2018
Cash and cash equivalents in consolidated balance sheets $ 20,432,317 $ 20,850,752
Due from the Central Bank and call loans to other banks reclassified as
cash and cash equivalents under IAS 7 “Statements of Cash Flow” 73,036,919 46,845,810
Securities purchased under agreement to resell reclassified as cash and
cash equivalents under IAS 7 “Statements of Cash Flow” 16,777,698 22,312,476
Cash and cash equivalents in consolidated statements of cash flows $ 110,246,934 $ 90,009,038
The accompanying notes are an integral part of the consolidated financial statements. (Concluded)

- 11 -
BANK SINOPAC AND SUBSIDIARIES
NOTES TO CONSOLIDATED FINANCIAL STATEMENTS
FOR THE SIX MONTHS ENDED JUNE 30, 2019 AND 2018
(In Thousands of New Taiwan Dollars, Unless Stated Otherwise)
1. ORGANIZATION
August 8, 1991 Bank SinoPac (the Bank) obtained government approval to incorporate.
January 28, 1992 The Bank started operations.
May 9, 2002 The Bank swap shares with SinoPac Securities Corporation and SinoPac Securities
Co., Ltd. (the SPS) to establish SinoPac Financial Holdings Company Limited
(the SPH), a financial holding company, resulting in the Bank becoming an
unlisted wholly owned subsidiary of SPH, the ultimate parent company of SPH.
December 26, 2005 SPH finished the merger with International Bank of Taipei Co., Ltd. (IBT), through
a 100% share swap.
May 8, 2006 The board of directors of IBT resolved to transfer credit card business and related
assets and liabilities to SinoPac Card Services Co., Ltd. (SinoPac Card). The
transaction has been approved by the authorities on June 22, 2006 and the assets
have been transferred at the book value of $5,171,080 on August 4, 2006.
November 13, 2006 The preliminary effective date of the share swap and merger. The Bank acquired the
assets and liabilities of IBT through a share swap at ratio of 1.175 shares of the
Bank to swap for 1 share of IBT.
June 1, 2009 The Bank’s cash merger with SinoPac Card took effect, with this merger amounting
to $3,873,675. Under this merger, the Bank was the surviving entity.
November 1, 2015 The Bank assumed all of the assets and liabilities of the Ho Chi Minh City Branch of
Far East National Bank and renamed this branch Bank SinoPac, Ho Chi Minh
City Branch. The transaction price was US$28,540 thousand.
May 1, 2019 SinoPac Call Center Co., Ltd. (SinoPac Call Center) which is a wholly-owned
subsidiary of SPH was cash merged by the Bank. Under this merger, SinoPac Call
Center was the dissolved company and the Bank was the surviving entity,
assuming all business, assets, liabilities and all rights and obligations.
The Bank’s ultimate parent and controller is SinoPac Holdings, which holds 100% common shares of the
Bank.
The functional currency of the Bank is the New Taiwan dollar. The financial statements are presented in
New Taiwan dollars.
For the information on consolidated entities, please refer to Note 4.
2. APPROVAL OF FINANCIAL STATEMENTS
The consolidated financial statements were approved by the board of directors on August 16, 2019.

- 12 -
3. APPLICATION OF NEW, AMENDED AND REVISED STANDARDS AND INTERPRETATIONS
a. Initial application of the amendments to the Regulations Governing the Preparation of Financial Reports
by Public Banks, Regulations Governing the Preparation of Financial Reports by Securities Issuers and
the International Financial Reporting Standards (IFRS), International Accounting Standards (IAS),
Interpretations of IFRS (IFRIC), and Interpretations of IAS (SIC) (collectively referred to as IFRSs)
endorsed and issued into effect by the Financial Supervisory Commission (FSC)
Except for the following, the initial application of the amendments to the Regulations Governing the
Preparation of Financial Reports by Public Banks, Regulations Governing the Preparation of Financial
Reports by Securities Issuers and the IFRSs endorsed and issued into effect by the FSC did not have
any material impact on the Bank and its subsidiaries (the Group)’s accounting policies:
IFRS 16 “Leases”
IFRS 16 provides a comprehensive model for the identification of lease arrangements and their
treatment in the financial statements of both lessee and lessor. It supersedes IAS 17 “Leases”,
IFRIC 4 “Determining whether an Arrangement contains a Lease”, and a number of related
interpretations. Refer to Note 4 for information relating to the relevant accounting policies.
Definition of a lease
The Group elects to apply the guidance of IFRS 16 in determining whether contracts are, or contain,
a lease only to contracts entered into (or changed) on or after January 1, 2019. Contracts identified
as containing a lease under IAS 17 and IFRIC 4 are not reassessed and are accounted for in
accordance with the transitional provisions under IFRS 16.
The Group as lessee
Upon initial application of IFRS 16, the Group will recognize right-of-use assets, and lease
liabilities for all leases on the consolidated balance sheets except for those whose payments under
low-value and short-term leases will be recognized as expenses on a straight-line basis. On the
consolidated statements of comprehensive income, the Group will present the depreciation expense
charged on right-of-use assets separately from interest expense accrued on the lease liability;
interest is computed by using the effective interest method. On the consolidated statements of cash
flows, cash payments for the principal portion of lease liabilities will be classified within financing
activities; cash payments for the interest portion will be classified within operating activities. Prior
to the application IFRS 16, payments under operating lease contracts were recognized as expenses
on a straight-line basis. Cash flows for operating leases were classified within operating activities
on the consolidated statements of cash flows. Leased assets and finance lease payables were
recognized for contracts classified as finance leases.
The Group is expected to recognize lease liability for leases classified as operating leases on the
date of the initial application of IAS 17 and on the basis of individual leases, recognizing the
right-of-use assets of lease liability. Comparative information will not be restated.
Lease liabilities were recognized on January 1, 2019 for leases previously classified as operating
leases under IAS 17. Lease liabilities were measured at the present value of the remaining lease
payments, discounted using the lessee’s incremental borrowing rate on January 1, 2019.
Right-of-use assets are measured at their carrying amount as if IFRS 16 had been applied since the
commencement date, but discounted using the aforementioned incremental borrowing rate. The
Group accessed the impairment to all right-of-use assets under IAS 36.
- 13 -
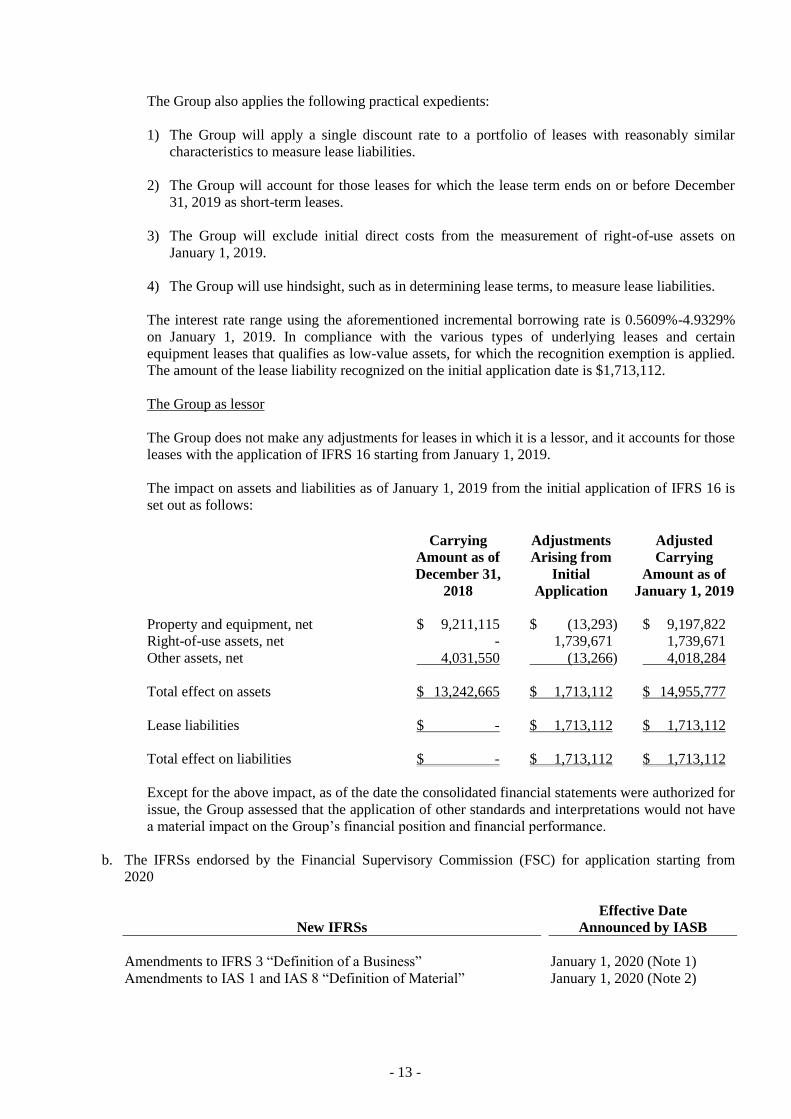
The Group also applies the following practical expedients:
1) The Group will apply a single discount rate to a portfolio of leases with reasonably similar
characteristics to measure lease liabilities.
2) The Group will account for those leases for which the lease term ends on or before December
31, 2019 as short-term leases.
3) The Group will exclude initial direct costs from the measurement of right-of-use assets on
January 1, 2019.
4) The Group will use hindsight, such as in determining lease terms, to measure lease liabilities.
The interest rate range using the aforementioned incremental borrowing rate is 0.5609%-4.9329%
on January 1, 2019. In compliance with the various types of underlying leases and certain
equipment leases that qualifies as low-value assets, for which the recognition exemption is applied.
The amount of the lease liability recognized on the initial application date is $1,713,112.
The Group as lessor
The Group does not make any adjustments for leases in which it is a lessor, and it accounts for those
leases with the application of IFRS 16 starting from January 1, 2019.
The impact on assets and liabilities as of January 1, 2019 from the initial application of IFRS 16 is
set out as follows:
Carrying
Amount as of
December 31,
2018
Adjustments
Arising from
Initial
Application
Adjusted
Carrying
Amount as of
January 1, 2019
Property and equipment, net $ 9,211,115 $ (13,293) $ 9,197,822
Right-of-use assets, net - 1,739,671 1,739,671
Other assets, net 4,031,550 (13,266) 4,018,284
Total effect on assets $ 13,242,665 $ 1,713,112 $ 14,955,777
Lease liabilities $ - $ 1,713,112 $ 1,713,112
Total effect on liabilities $ - $ 1,713,112 $ 1,713,112
Except for the above impact, as of the date the consolidated financial statements were authorized for
issue, the Group assessed that the application of other standards and interpretations would not have
a material impact on the Group’s financial position and financial performance.
b. The IFRSs endorsed by the Financial Supervisory Commission (FSC) for application starting from
2020
New IFRSs
Effective Date
Announced by IASB
Amendments to IFRS 3 “Definition of a Business” January 1, 2020 (Note 1)
Amendments to IAS 1 and IAS 8 “Definition of Material” January 1, 2020 (Note 2)

- 14 -
Note 1: The Group shall apply these amendments to business combinations for which the acquisition
date is on or after the beginning of the first annual reporting period beginning on or after
January 1, 2020 and to asset acquisitions that occur on or after the beginning of that period.
Note 2: The Group shall apply these amendments prospectively for annual reporting periods
beginning on or after January 1, 2020.
Except for the above impact, as of the date the consolidated financial statements were authorized for
issue, the Group is continuously assessing the possible impact that the application of other standards
and interpretations will have on the Group’s financial position and financial performance, and will
disclose the relevant impact when the assessment is completed.
c. New IFRSs in issue but not yet endorsed and issued into effect by the FSC
New IFRSs
Effective Date
Announced by IASB (Note)
Amendments to IFRS 10 and IAS 28 “Sale or Contribution of Assets
between an Investor and its Associate or Joint Venture”
To be determined by IASB
IFRS 17 “Insurance Contracts” January 1, 2021
Note: Unless stated otherwise, the above New IFRSs are effective for annual periods beginning on or
after their respective effective dates.
Except for the above impact, as of the date the consolidated financial statements were authorized for
issue, the Group is continuously assessing the possible impact that the application of other standards
and interpretations will have on the Group’s financial position and financial performance, and will
disclose the relevant impact when the assessment is completed.
4. SUMMARY OF SIGNIFICANT ACCOUNTING POLICIES
Statement of Compliance
The consolidated financial statements have been prepared in accordance with the Regulations Governing
the Preparation of Financial Reports by Public Banks, Regulations Governing the Preparation of Financial
Reports by Securities Issuers, the guidelines issued by the authority, and International Accounting Standard
34 “Interim Financial Reporting” as endorsed and issued into effect by the FSC. Disclosure information
included in the consolidated financial statements is less than the disclosure information required in a
complete set of annual financial statements.
Basis of Preparation
The consolidated financial statements have been prepared on the historical cost basis except for financial
instruments that are measured at fair value, and properties and equipment that are chosen the deemed cost
as exemptions by IFRS 1 through the Regulations Governing the Preparation of Financial Reports by Public
Banks on the IFRS transition date. Historical cost is generally based on the fair value of the consideration
given in exchange for assets.
The fair value measurements are grouped into Levels 1 to 3 based on the degree to which the fair value
measurement inputs are observable and the significance of the inputs to the fair value measurement in its
entirety, which are described as follows:
a. Level 1 inputs are quoted prices (unadjusted) in active markets for identical assets or liabilities;

- 15 -
b. Level 2 inputs are inputs other than quoted prices included within Level 1 that are observable for the
asset or liability, either directly (i.e. as prices) or indirectly (i.e. derived from prices); and
c. Level 3 inputs are unobservable inputs for the asset or liability.
Classification of Current and Non-current Assets and Liabilities
Since the operating cycle in the Banking industry cannot be reasonably identified, the accounts included in
the Group’s consolidated financial statements were not classified as current or noncurrent. Nevertheless,
accounts were properly categorized in accordance with the nature of each account and sequenced by their
liquidity. Please refer to Note 44 for the maturity analysis of assets and liabilities.
Basis of Consolidation
The consolidated financial statements incorporate the financial statements of the Bank and the entities
controlled by the Bank (i.e., its subsidiaries). Control is achieved when the Bank has the power to govern
the financial and operating policies of an entity so as to obtain benefits from its activities.
When necessary, adjustments are made to the financial statements of the subsidiaries to bring their
accounting policies into line with those used by the Bank.
All intra-group transactions, balances, income and expenses are eliminated in full upon consolidation; for
related information please refer to Table 2.
The consolidated entities were as follows:
% of Ownership
Investor Investee Main Business June 30, 2019
December 31,
2018 June 30, 2018 Remark
Bank SinoPac SinoPac Capital Limited In liquidation 100 100 100 Note 1
SinoPac Life Insurance Agent Co., Ltd. Life insurance agent 100 100 100 Note 2
SinoPac Property Insurance Agent Co., Ltd. Property insurance agent 100 100 100 Note 2
Bank SinoPac (China) Ltd. Commercial bank 100 100 100
SinoPac Insurance Brokers Ltd. Insurance service 100 100 100 Note 1 SinoPac Capital Limited SinoPac Capital (B.V.I.) Ltd. In liquidation 100 100 100 Note 1 SinoPac Capital (B.V.I.) Ltd. RSP Information Service Company Limited In liquidation 100 100 100 Note 1
Note 1: To adjust the investment structure of parent-group, the board of directors of the Bank originally
approved the liquidation plan of SinoPac Capital Limited and SinoPac Capital (B.V.I.) Ltd. in
June and September 2016. The board of directors of the Bank also resolved the purchase of 100%
of the shares of SinoPac Insurance Brokers Ltd., a subsidiary of SinoPac Capital Limited, and
transfer 100% of the shares of RSP Information Service Company Limited, a subsidiary of
SinoPac Capital (B.V.I.) Ltd., to SinoPac Venture Capital Co., Ltd. The Bank obtained 100%
equity of SinoPac Insurance Broker Ltd., on November 1, 2017 (using the book value on the day
before the date of the transfer as the transfer price). In August 2018, the board of directors of the
Bank subsequently resolved to adjust the above-mentioned plan, deciding to liquidate RSP
Information Service Company Limited directly and no longer transfer it to SinoPac Venture
Capital Co., Ltd. RSP Information Service Company Limited has entered into the liquidation
process since February 2019. SinoPac Capital (B.V.I.) Ltd. has entered into the liquidation
process since March 2019. SinoPac Capital Limited has entered into the liquidation process since
April 2019.
Note 2: Under legal permission, a bank may also operate within the insurance industry. The board of
directors of the Bank has planned to apply for the qualification to operate as an insurance agency
and for the rights to merge, through 100% shareholdings, SinoPac Life Insurance Agent Co., Ltd.
and SinoPac Property Insurance Agent Co., Ltd., which are both subsidiaries of the Bank. After
the merger, the Bank will be the surviving company, and the two subsidiaries will be liquidated,
and hence the Bank can achieve the integration of resources, reduced operating costs and
improved operational efficiency. The competent authorities approved that the Bank may operate
within the insurance industry in July 2019.

- 16 -
Other Significant Accounting Policies
Please refer to the Group’s consolidated financial statements for the year ended December 31, 2018 for the
significant accounting policies, except for those described below.
a. Leases
2019
At the inception of a contract, the Group assesses whether the contract is, or contains, a lease.
1) The Group as lessor
Leases are classified as finance leases whenever the terms of a lease transfer substantially all the
risks and rewards of ownership to the lessee. All other leases are classified as operating leases.
Under finance leases, the lease payments comprise fixed payments, in-substance fixed payments,
variable lease payments which depend on an index or a rate, residual value guarantees, the exercise
price of a purchase option if the lessee is reasonably certain to exercise that option, and payments of
penalties for terminating a lease if the lease term reflects such termination, less any lease incentives
payable. The net investment in a lease is measured at (a) the present value of the sum of the lease
payments receivable by a lessor and any unguaranteed residual value accrued to the lessor plus (b)
initial direct costs and is presented as a finance lease receivable. Finance lease income is allocated
to the relevant accounting periods so as to reflect a constant, periodic rate of return on the Group’s
net investment outstanding in respect of leases.
Lease payments (less any lease incentives payable) from operating leases are recognized as income
on a straight-line basis over the terms of the relevant leases. Initial direct costs incurred in obtaining
operating leases are added to the carrying amounts of the underlying assets and recognized as
expenses on a straight-line basis over the lease terms.
When a lease includes both land and building elements, the Group assesses the classification of
each element separately as a finance or an operating lease based on the assessment as to whether
substantially all the risks and rewards incidental to ownership of each element have been transferred
to the Group. The lease payments are allocated between the land and the building elements in
proportion to the relative fair values of the leasehold interests in the land element and building
element of the lease at the inception of a contract. If the allocation of the lease payments can be
made reliably, each element is accounted for separately in accordance with its lease classification.
When the lease payments cannot be allocated reliably between the land and building elements, the
entire lease is generally classified as a finance lease unless it is clear that both elements are
operating leases; in which case, the entire lease is classified as an operating lease.
2) The Group as lessee
The Group recognizes right-of-use assets and lease liabilities for all leases at the commencement
date of a lease, except for short-term leases and low-value asset leases accounted for applying a
recognition exemption where lease payments are recognized as expenses on a straight-line basis
over the lease terms.
Right-of-use assets are initially measured at cost, which comprises the initial measurement of lease
liabilities adjusted for lease payments made at or before the commencement date, plus any initial
direct costs incurred and an estimate of costs needed to restore the underlying assets, and less any
lease incentives received. Right-of-use assets are subsequently measured at cost less accumulated
depreciation and impairment losses and adjusted for any remeasurement of the lease liabilities.
Right-of-use assets are presented on a separate line in the consolidated balance sheets.

- 17 -
Right-of-use assets are depreciated using the straight-line method from the commencement dates to
the earlier of the end of the useful lives of the right-of-use assets or the end of the lease terms.
Lease liabilities are initially measured at the present value of the lease payments, which comprise
fixed payments, in-substance fixed payments, variable lease payments which depend on an index or
a rate, and payments of penalties for terminating a lease if the lease term reflects such termination,
less any lease incentives receivable. The lease payments are discounted using the interest rate
implicit in a lease, if that rate can be readily determined. If that rate cannot be readily determined,
the Group uses the lessee’s incremental borrowing rate.
Subsequently, lease liabilities are measured at amortized cost using the effective interest method,
with interest expense recognized over the lease terms. When there is a change in a lease term or a
change in future lease payments resulting from a change in an index or a rate used to determine
those payments, the Group remeasures the lease liabilities with a corresponding adjustment to the
right-of-use-assets. However, if the carrying amount of the right-of-use assets is reduced to zero,
any remaining amount of the remeasurement is recognized in profit or loss. Lease liabilities are
presented on a separate line in the consolidated balance sheets.
Variable lease payments that do not depend on an index or a rate are recognized as expenses in the
periods in which they are incurred.
2018
Leases are classified as finance leases whenever the terms of a lease transfer substantially all the risks
and rewards of ownership to the lessee. All other leases are classified as operating leases.
1) The Group as lessor
Rental income from operating leases is recognized on a straight-line basis over the term of the
relevant lease unless another system could be more representative of the effectiveness of time
consumption of lease assets.
2) The Group as lessee
The financial leases are accounted at the smaller amount of the fair value of the leased assets at the
beginning of the lease and the total amount of minimum lease payment. At the same time, the
leasing liabilities are recognized.
The implied interest on the lease payments for each period is the current financial expense and is
capitalized if it is directly attributable to the assets that meet the requirements.
Operating lease payments are recognized as an expense on a straight-line basis over the lease term
unless another system could be more representative of the effectiveness of time consumption of
lease assets.
3) Leasehold land for own use
When a lease includes both land and building elements, the Group assesses the classification of
each element separately as a finance or an operating lease based on the assessment as to whether
substantially all the risks and rewards incidental to ownership of each element have been transferred
to the Group. The minimum lease payments are allocated between the land and the building
elements in proportion to the relative fair values of the leasehold interests in the land element and
building element of the lease at the inception of the lease.
- 18 -
If the allocation of the lease payments can be made reliably, each element is accounted for
separately in accordance with its lease classification. When the lease payments cannot be allocated
reliably between the land and building elements, the entire lease is generally classified as a finance
lease unless it is clear that both elements are operating leases; in which case, the entire lease is
classified as an operating lease.
b. Retirement benefits
The pension cost of the period adopts the pension cost rate valuated through actuarial valuation based
on the beginning to the end of the previous period. Adjustments might be applied due to significant
market volatility, significant reduce or pay off, or other significant events occurred after the end of the
period.
c. Income tax
Income tax expense represents the sum of the tax currently payable and deferred tax. Interim period
income taxes are assessed on an annual basis and calculated by applying to an interim period’s pre-tax
income the tax rate that would be applicable to expected total annual earnings.
The accounting principle of the effect of tax rate amendment during interim period are the same as
transactions with tax consequences. They are recognized as profit or loss, other comprehensive income
or equity when they occurred.
5. CRITICAL ACCOUNTING JUDGMENTS AND KEY SOURCES OF ESTIMATION
UNCERTAINTY
In the application of the Group’s accounting policies, which are described in Note 4, management is
required to make judgments, estimates and assumptions about the carrying amounts of assets and liabilities
that are not readily apparent from other sources. The estimates and associated assumptions are based on
historical experience and other factors that are considered relevant. Actual results may differ from these
estimates.
The estimates and underlying assumptions are reviewed on an ongoing basis. Revisions to accounting
estimates are recognized in the period in which the estimate is revised if the revision affects only that period
or in the period of the revision and future periods if the revision affects both current and future periods.
Estimated Impairment of Discounts and Loans
The estimate of impairment of discounts and loans is based on assumptions about probability of default and
loss given default. The Group uses judgement in making these assumptions and in selecting the inputs to
the impairment calculation, based on the Group’s past history, existing market conditions as well as
forward looking estimates at the end of each reporting period. For details of the key assumptions and inputs
used, see Note 44. Where the actual future cash inflows are less than expected, a material impairment loss
may arise. Also, the Group considers the specifications of the relevant authorities’ letter to make sure that
the classification and allowance for impairment are in compliance with the requirements of the regulations.
Impairment losses on loans and receivables are shown in Notes 12, 13, 14 and 44.

- 19 -
6. CASH AND CASH EQUIVALENTS, NET
June 30, 2019
December 31,
2018 June 30, 2018
Cash on hand $ 7,055,499 $ 6,917,577 $ 6,653,795
Due from other banks 8,489,382 6,511,092 9,167,221
Notes and checks for clearing 4,887,731 4,741,346 5,031,341
20,432,612 18,170,015 20,852,357
Less: Allowance for credit losses (295) (1,178) (1,605)
Net amount $ 20,432,317 $ 18,168,837 $ 20,850,752
Under the Guidelines on the Management of Country Risk by Banking Financial Institutions issued by the
China Banking Regulatory Commission for countries or regions with low risks, Bank SinoPac (China)
recognized the country risk provision at 0.5% of the due from other banks and call loans to other banks
(Note 7), both due from banks and call loans to other banks are assessed the allowance based on 0.05%.
7. DUE FROM THE CENTRAL BANK AND CALL LOANS TO BANKS, NET
June 30, 2019
December 31,
2018 June 30, 2018
Call loans to banks $ 70,594,433 $ 44,243,397 $ 38,353,759
Trade finance advance - interbank 1,243,173 568,902 2,485,968
Deposit reserve - checking accounts 11,925,883 17,364,948 11,515,793
Due from the Central Bank - interbank settlement
funds 2,500,944 1,533,060 1,522,993
Deposit reserve - demand accounts 27,578,761 25,619,713 25,911,717
Deposit reserve - foreign currencies 326,333 292,139 289,805
Deposit - other 2,210,937 2,282,832 1,252,622
116,380,464 91,904,991 81,332,657
Less: Allowance for credit losses (29,851) (15,589) (6,859)
Net amount $ 116,350,613 $ 91,889,402 $ 81,325,798
Under a directive issued by the Central Bank of the ROC, New Taiwan dollar (NTD) - denominated deposit
reserves are determined monthly at prescribed rates based on average balances of customers’
NTD-denominated deposits. Deposit reserve - demand account should not be used, except for adjusting the
deposit reserve account monthly. In addition, the foreign-currency deposit reserves are determined at
prescribed rates based on the balances of foreign-currency deposits. These reserves can be withdrawn
momentarily anytime at no interest.
Under the relevant provisions issued by the People’s Bank of China, Bank SinoPac (China) showed deposit
reserves in proportion on the basis of deposit account balances at the end of the months.
- 20 -
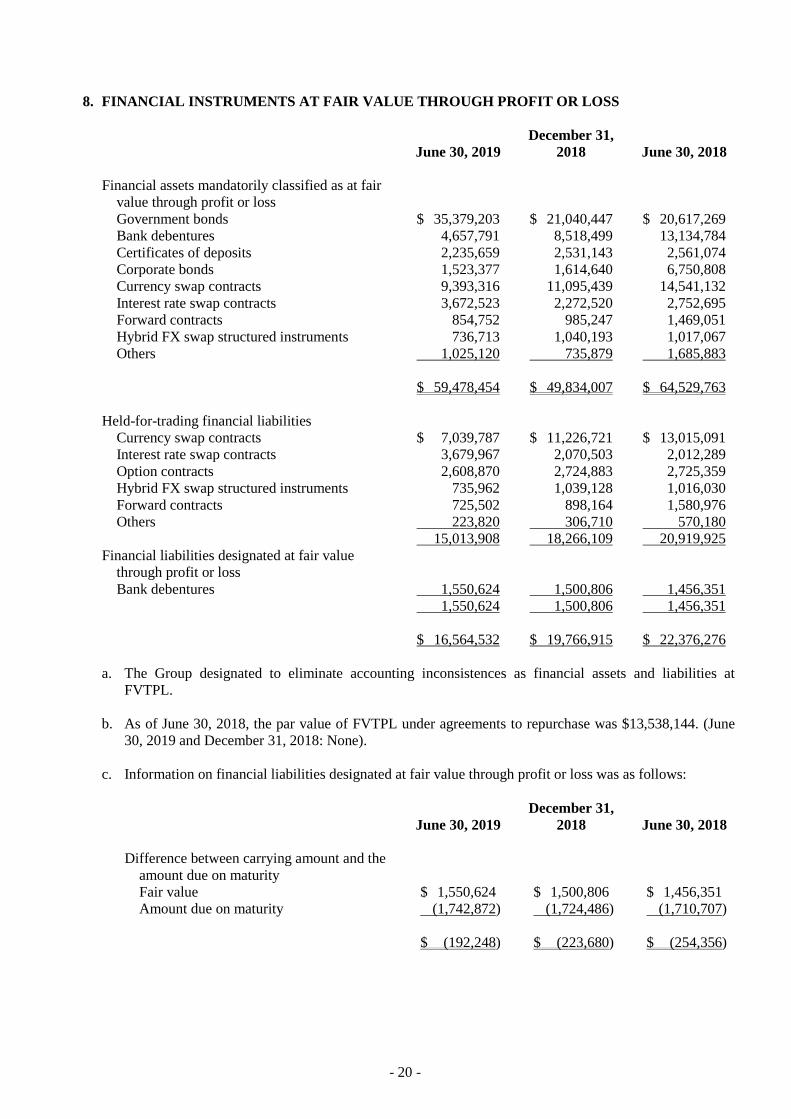
8. FINANCIAL INSTRUMENTS AT FAIR VALUE THROUGH PROFIT OR LOSS
June 30, 2019
December 31,
2018 June 30, 2018
Financial assets mandatorily classified as at fair
value through profit or loss
Government bonds $ 35,379,203 $ 21,040,447 $ 20,617,269
Bank debentures 4,657,791 8,518,499 13,134,784
Certificates of deposits 2,235,659 2,531,143 2,561,074
Corporate bonds 1,523,377 1,614,640 6,750,808
Currency swap contracts 9,393,316 11,095,439 14,541,132
Interest rate swap contracts 3,672,523 2,272,520 2,752,695
Forward contracts 854,752 985,247 1,469,051
Hybrid FX swap structured instruments 736,713 1,040,193 1,017,067
Others 1,025,120 735,879 1,685,883
$ 59,478,454 $ 49,834,007 $ 64,529,763
Held-for-trading financial liabilities
Currency swap contracts $ 7,039,787 $ 11,226,721 $ 13,015,091
Interest rate swap contracts 3,679,967 2,070,503 2,012,289
Option contracts 2,608,870 2,724,883 2,725,359
Hybrid FX swap structured instruments 735,962 1,039,128 1,016,030
Forward contracts 725,502 898,164 1,580,976
Others 223,820 306,710 570,180
15,013,908 18,266,109 20,919,925
Financial liabilities designated at fair value
through profit or loss
Bank debentures 1,550,624 1,500,806 1,456,351
1,550,624 1,500,806 1,456,351
$ 16,564,532 $ 19,766,915 $ 22,376,276
a. The Group designated to eliminate accounting inconsistences as financial assets and liabilities at
FVTPL.
b. As of June 30, 2018, the par value of FVTPL under agreements to repurchase was $13,538,144. (June
30, 2019 and December 31, 2018: None).
c. Information on financial liabilities designated at fair value through profit or loss was as follows:
June 30, 2019
December 31,
2018 June 30, 2018
Difference between carrying amount and the
amount due on maturity
Fair value $ 1,550,624 $ 1,500,806 $ 1,456,351
Amount due on maturity (1,742,872) (1,724,486) (1,710,707)
$ (192,248) $ (223,680) $ (254,356)
- 21 -
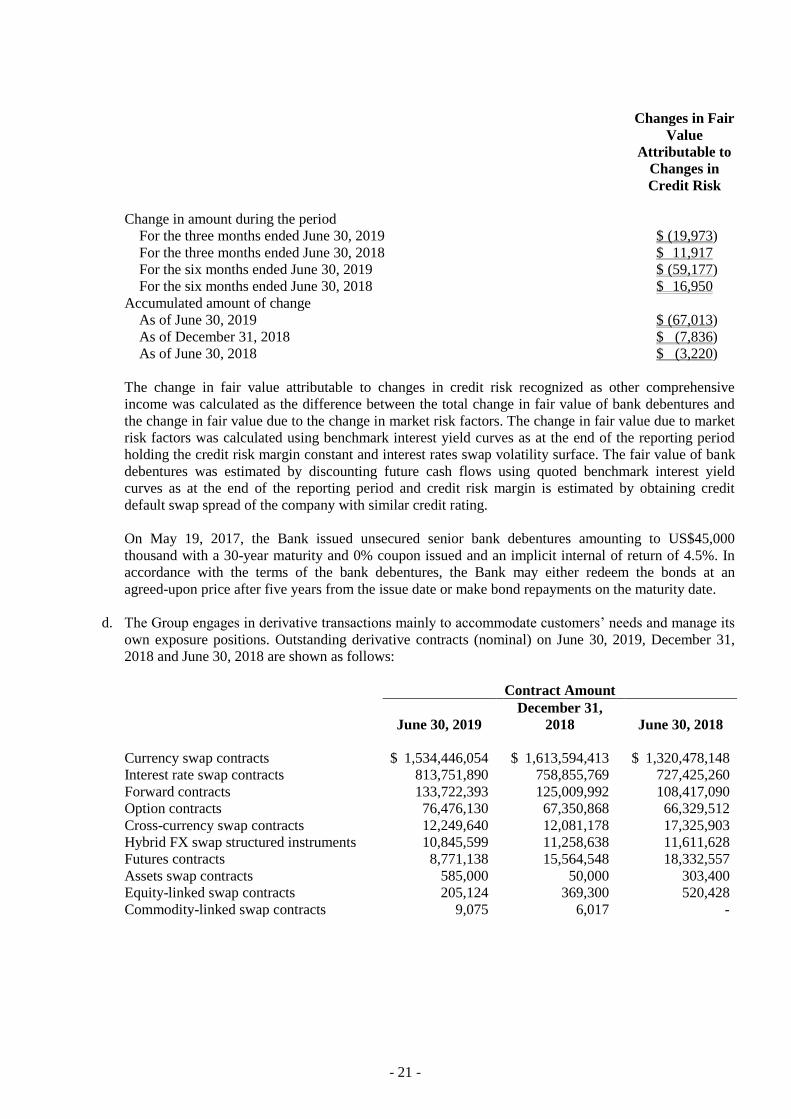
Changes in Fair
Value
Attributable to
Changes in
Credit Risk
Change in amount during the period
For the three months ended June 30, 2019 $ (19,973)
For the three months ended June 30, 2018 $ 11,917
For the six months ended June 30, 2019 $ (59,177)
For the six months ended June 30, 2018 $ 16,950
Accumulated amount of change
As of June 30, 2019 $ (67,013)
As of December 31, 2018 $ (7,836)
As of June 30, 2018 $ (3,220)
The change in fair value attributable to changes in credit risk recognized as other comprehensive
income was calculated as the difference between the total change in fair value of bank debentures and
the change in fair value due to the change in market risk factors. The change in fair value due to market
risk factors was calculated using benchmark interest yield curves as at the end of the reporting period
holding the credit risk margin constant and interest rates swap volatility surface. The fair value of bank
debentures was estimated by discounting future cash flows using quoted benchmark interest yield
curves as at the end of the reporting period and credit risk margin is estimated by obtaining credit
default swap spread of the company with similar credit rating.
On May 19, 2017, the Bank issued unsecured senior bank debentures amounting to US$45,000
thousand with a 30-year maturity and 0% coupon issued and an implicit internal of return of 4.5%. In
accordance with the terms of the bank debentures, the Bank may either redeem the bonds at an
agreed-upon price after five years from the issue date or make bond repayments on the maturity date.
d. The Group engages in derivative transactions mainly to accommodate customers’ needs and manage its
own exposure positions. Outstanding derivative contracts (nominal) on June 30, 2019, December 31,
2018 and June 30, 2018 are shown as follows:
Contract Amount
June 30, 2019
December 31,
2018 June 30, 2018
Currency swap contracts $ 1,534,446,054 $ 1,613,594,413 $ 1,320,478,148
Interest rate swap contracts 813,751,890 758,855,769 727,425,260
Forward contracts 133,722,393 125,009,992 108,417,090
Option contracts 76,476,130 67,350,868 66,329,512
Cross-currency swap contracts 12,249,640 12,081,178 17,325,903
Hybrid FX swap structured instruments 10,845,599 11,258,638 11,611,628
Futures contracts 8,771,138 15,564,548 18,332,557
Assets swap contracts 585,000 50,000 303,400
Equity-linked swap contracts 205,124 369,300 520,428
Commodity-linked swap contracts 9,075 6,017 -
- 22 -
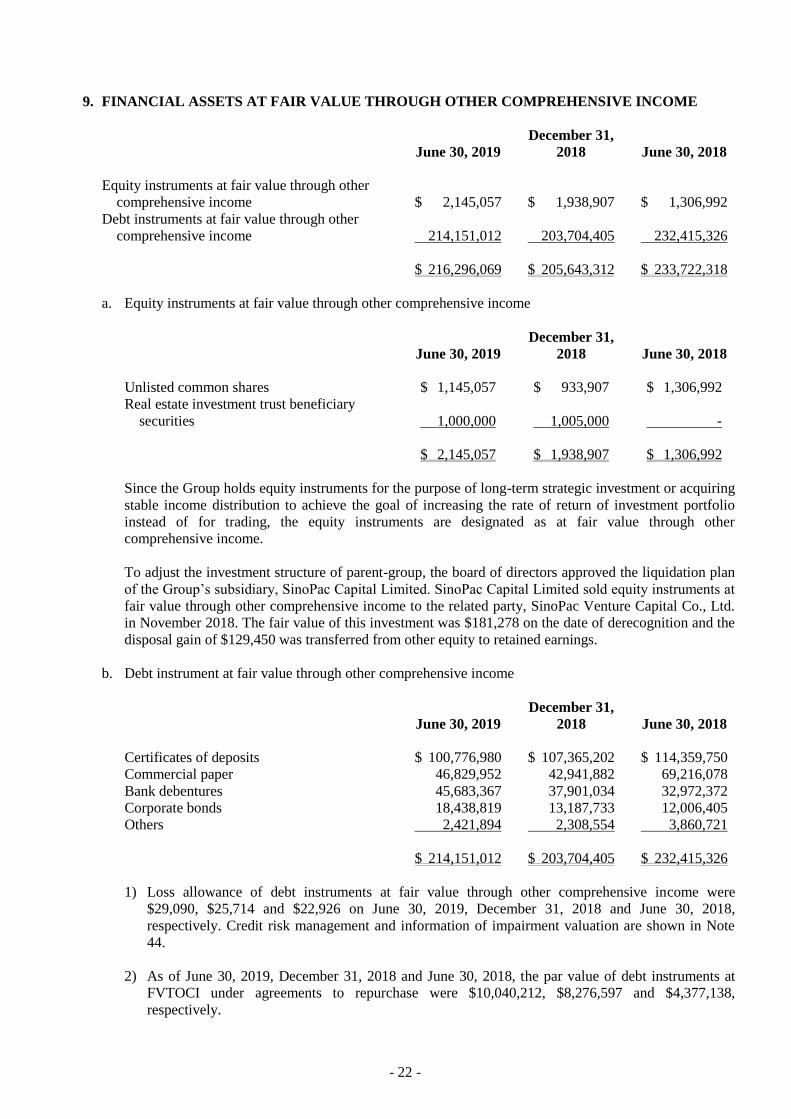
9. FINANCIAL ASSETS AT FAIR VALUE THROUGH OTHER COMPREHENSIVE INCOME
June 30, 2019
December 31,
2018 June 30, 2018
Equity instruments at fair value through other
comprehensive income $ 2,145,057 $ 1,938,907 $ 1,306,992
Debt instruments at fair value through other
comprehensive income 214,151,012 203,704,405 232,415,326
$ 216,296,069 $ 205,643,312 $ 233,722,318
a. Equity instruments at fair value through other comprehensive income
June 30, 2019
December 31,
2018 June 30, 2018
Unlisted common shares $ 1,145,057 $ 933,907 $ 1,306,992
Real estate investment trust beneficiary
securities 1,000,000 1,005,000 -
$ 2,145,057 $ 1,938,907 $ 1,306,992
Since the Group holds equity instruments for the purpose of long-term strategic investment or acquiring
stable income distribution to achieve the goal of increasing the rate of return of investment portfolio
instead of for trading, the equity instruments are designated as at fair value through other
comprehensive income.
To adjust the investment structure of parent-group, the board of directors approved the liquidation plan
of the Group’s subsidiary, SinoPac Capital Limited. SinoPac Capital Limited sold equity instruments at
fair value through other comprehensive income to the related party, SinoPac Venture Capital Co., Ltd.
in November 2018. The fair value of this investment was $181,278 on the date of derecognition and the
disposal gain of $129,450 was transferred from other equity to retained earnings.
b. Debt instrument at fair value through other comprehensive income
June 30, 2019
December 31,
2018 June 30, 2018
Certificates of deposits $ 100,776,980 $ 107,365,202 $ 114,359,750
Commercial paper 46,829,952 42,941,882 69,216,078
Bank debentures 45,683,367 37,901,034 32,972,372
Corporate bonds 18,438,819 13,187,733 12,006,405
Others 2,421,894 2,308,554 3,860,721
$ 214,151,012 $ 203,704,405 $ 232,415,326
1) Loss allowance of debt instruments at fair value through other comprehensive income were
$29,090, $25,714 and $22,926 on June 30, 2019, December 31, 2018 and June 30, 2018,
respectively. Credit risk management and information of impairment valuation are shown in Note
44.
2) As of June 30, 2019, December 31, 2018 and June 30, 2018, the par value of debt instruments at
FVTOCI under agreements to repurchase were $10,040,212, $8,276,597 and $4,377,138,
respectively.

- 23 -
10. INVESTMENTS IN DEBT INSTRUMENTS AT AMORTIZED COST
June 30, 2019
December 31,
2018 June 30, 2018
Government bonds $ 48,424,492 $ 37,655,313 $ 27,719,552
Certificates of deposits 36,900,738 32,204,098 25,697,854
Bank debentures 19,083,587 17,760,343 16,763,361
Corporate bonds 8,054,653 5,255,718 7,548,928
Others 678,283 671,430 690,001
113,141,753 93,546,902 78,419,696
Less: Loss allowance (7,325) (6,233) (6,764)
Net amount $ 113,134,428 $ 93,540,669 $ 78,412,932
a. Credit risk management and information of impairment valuation of debt instrument investment
measured at amortized cost are shown in Note 44.
b. Please refer to Note 41 for information relating to debt instrument investment measured at amortized
cost pledged as security.
c. As of June 30, 2019, December 31, 2018 and June 30, 2018, the par value of financial assets under
agreements to repurchase measured at amortized cost were $4,667,366, $12,467,673 and $12,042,100,
respectively.
11. SECURITIES PURCHASED UNDER RESELL AGREEMENTS
June 30, 2019
December 31,
2018 June 30, 2018
Bills $ 8,593,856 $ 9,967,157 $ 7,489,000
Bonds 8,183,842 12,743,076 14,823,476
$ 16,777,698 $ 22,710,233 $ 22,312,476
Agreed-upon resell amount $ 16,804,605 $ 22,762,145 $ 22,353,700
Par value $ 17,668,905 $ 24,386,008 $ 24,244,664
Expiry September 2019 March 2019 September 2018
As of June 30, 2019, and December 31, 2018, the par value of securities purchased under agreements to
resell under agreements to repurchase were $932,380 and $5,698,057, respectively (June 30, 2018: None).
- 24 -
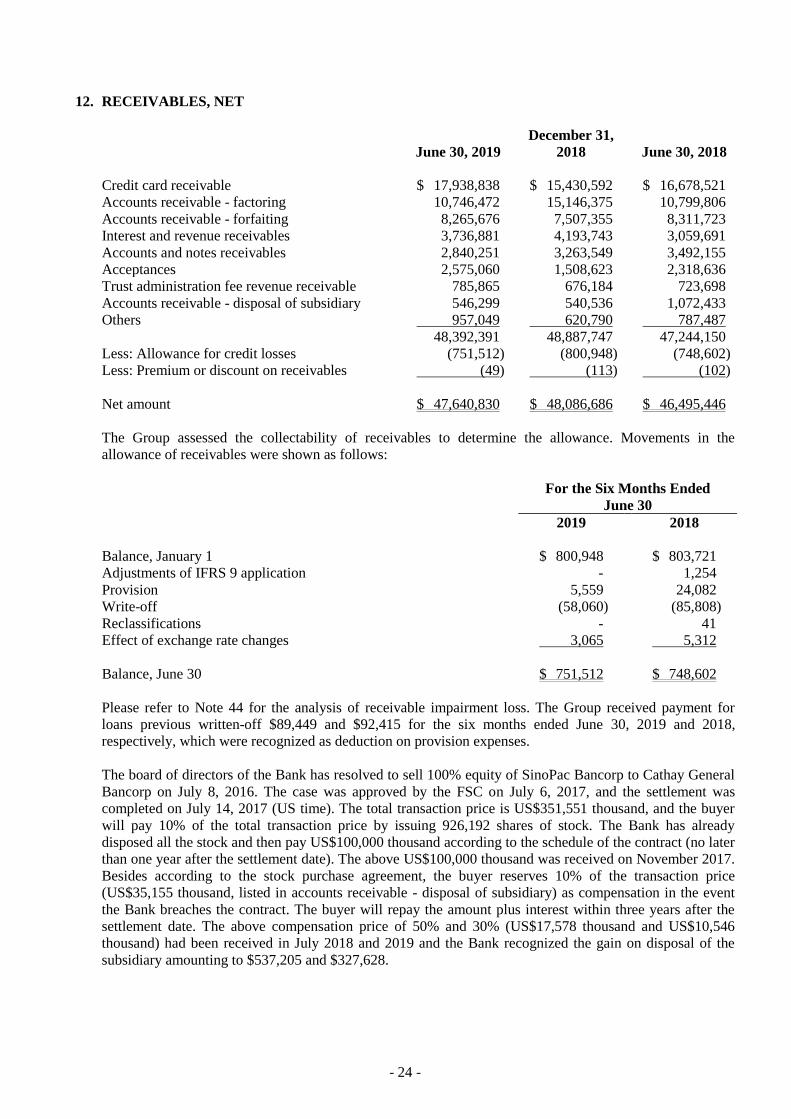
12. RECEIVABLES, NET
June 30, 2019
December 31,
2018 June 30, 2018
Credit card receivable $ 17,938,838 $ 15,430,592 $ 16,678,521
Accounts receivable - factoring 10,746,472 15,146,375 10,799,806
Accounts receivable - forfaiting 8,265,676 7,507,355 8,311,723
Interest and revenue receivables 3,736,881 4,193,743 3,059,691
Accounts and notes receivables 2,840,251 3,263,549 3,492,155
Acceptances 2,575,060 1,508,623 2,318,636
Trust administration fee revenue receivable 785,865 676,184 723,698
Accounts receivable - disposal of subsidiary 546,299 540,536 1,072,433
Others 957,049 620,790 787,487
48,392,391 48,887,747 47,244,150
Less: Allowance for credit losses (751,512) (800,948) (748,602)
Less: Premium or discount on receivables (49) (113) (102)
Net amount $ 47,640,830 $ 48,086,686 $ 46,495,446
The Group assessed the collectability of receivables to determine the allowance. Movements in the
allowance of receivables were shown as follows:
For the Six Months Ended
June 30
2019 2018
Balance, January 1 $ 800,948 $ 803,721
Adjustments of IFRS 9 application - 1,254
Provision 5,559 24,082
Write-off (58,060) (85,808)
Reclassifications - 41
Effect of exchange rate changes 3,065 5,312
Balance, June 30 $ 751,512 $ 748,602
Please refer to Note 44 for the analysis of receivable impairment loss. The Group received payment for
loans previous written-off $89,449 and $92,415 for the six months ended June 30, 2019 and 2018,
respectively, which were recognized as deduction on provision expenses.
The board of directors of the Bank has resolved to sell 100% equity of SinoPac Bancorp to Cathay General
Bancorp on July 8, 2016. The case was approved by the FSC on July 6, 2017, and the settlement was
completed on July 14, 2017 (US time). The total transaction price is US$351,551 thousand, and the buyer
will pay 10% of the total transaction price by issuing 926,192 shares of stock. The Bank has already
disposed all the stock and then pay US$100,000 thousand according to the schedule of the contract (no later
than one year after the settlement date). The above US$100,000 thousand was received on November 2017.
Besides according to the stock purchase agreement, the buyer reserves 10% of the transaction price
(US$35,155 thousand, listed in accounts receivable - disposal of subsidiary) as compensation in the event
the Bank breaches the contract. The buyer will repay the amount plus interest within three years after the
settlement date. The above compensation price of 50% and 30% (US$17,578 thousand and US$10,546
thousand) had been received in July 2018 and 2019 and the Bank recognized the gain on disposal of the
subsidiary amounting to $537,205 and $327,628.

- 25 -
13. DISCOUNTS AND LOANS, NET
June 30, 2019
December 31,
2018 June 30, 2018
Export negotiation $ 693,864 $ 572,583 $ 811,672
Overdrafts - - 7,018
Secured overdrafts 74,116 83,772 84,577
Accounts receivable - financing 1,159,672 1,875,454 1,214,821
Short-term loans 190,735,103 174,019,884 161,355,006
Secured short-term loans 106,706,396 99,753,764 96,974,588
Medium-term loans 193,776,781 165,399,264 150,391,145
Secured medium-term loans 76,680,073 64,671,605 60,796,765
Long-term loans 7,259,072 5,949,425 5,095,446
Secured long-term loans 451,114,060 418,413,005 411,836,899
Nonperforming loans transferred from loans 1,939,225 1,890,228 1,921,100
1,030,138,362 932,628,984 890,489,037
Less: Allowance for credit losses (13,781,219) (13,013,129) (12,578,761)
Less: Premium or discount on discounts and
loans (408,872) (312,649) (294,917)
Net amount $ 1,015,948,271 $ 919,303,206 $ 877,615,359
Please refer to Note 44 for the analysis of impairment loss on discounts and loans and Note 41 for
information relating to discounts and loans pledged as security.
The Group assessed the collectability of discounts and loans to determine the required allowance.
Movements in the allowance of discounts and loans were shown as follows:
For the Six Months Ended
June 30
2019 2018
Balance, January 1 $ 13,013,129 $ 12,511,538
Adjustments of IFRS 9 application - 11,168
Provision 1,181,889 387,503
Write-off (440,633) (369,238)
Effect of exchange rate changes 26,834 37,790
Balance, June 30 $ 13,781,219 $ 12,578,761
The Group received payment for loans previously written-off of $223,327 and $191,857 for the six months
ended June 30, 2019 and 2018, respectively, which were recognized as deduction of provision expenses.

- 26 -
14. OTHER FINANCIAL ASSETS, NET
June 30, 2019
December 31,
2018 June 30, 2018
Time deposits not belong to cash and cash
equivalent $ 12,435,197 $ 15,008,466 $ 9,062,019
Purchase of the PEM Group’s instruments 4,528,271 4,468,375 4,360,747
Nonperforming receivables transferred from other
than loans 51,611 93,857 85,773
Others 42,948 47,546 51,736
17,058,027 19,618,244 13,560,275
Less: Allowance for credit loss (53,329) (96,574) (87,907)
Less: Accumulated impairment (1,973,122) (2,066,619) (2,104,316)
Net amount $ 15,031,576 $ 17,455,051 $ 11,368,052
Above time deposits not belonging to cash and cash equivalent included over three months, no advance
termination or pledged time deposits.
Please refer to Note 41 for information relating to other financial assets pledged as security.
The Bank was delegated by professional investors to sell the PEM Group’s investment products amounting
to US$146,000 thousand through private placement. A U.S. Federal Court appointed a receiver for all
assets that belonged to, were being managed by, or were in the possession of or control of the PEM Group.
To protect the client’s interests, the Bank bought back the products at the price of the initial payment net of
the distribution and redemption costs. On December 24, 2010, the Bank’s board of directors resolved to
abide by a court’s appointment of a PEM Group receiver to take the PEM Group’s insurance policies at the
price of approximately US$40.4 million, and the Bank thus recognized impairment losses of US$11,152
thousand. On March 7, 2011, the receiver transferred a portion of the insurance policies to a trustee
established jointly by certain banks to hold insurance policies. And the Bank had submitted to the
authorities the results of this policy transfer. As of June 30, 2019, according to trust report, a reserve of
US$63,487 thousand (NT$1,973,122) had been set aside to cover the accumulated impairment losses.
The Group assessed the collectability of other financial assets to determine the required allowance.
Movements in the allowance of other financial assets were shown as follows:
For the Six Months Ended
June 30
2019 2018
Balance, January 1 $ 96,574 $ 90,541
Adjustments of IFRS 9 application - 105
(Reversal of) provision (24,255) 5,706
Write-off (18,988) (8,446)
Effect of exchange rate changes (2) 1
Balance, June 30 $ 53,329 $ 87,907
The Group received payment for loans previous written-off $7,552 and $5,426 for the six months ended
June 30, 2019 and 2018, respectively, which were recognized as deduction of provision expenses

- 27 -
15. PROPERTY AND EQUIPMENT, NET
The movements of property and equipment for the six months ended June 30, 2019 and 2018 are
summarized as follows:
For the Six Months Ended June 30, 2019
Land and Land
Improvements Buildings
Machinery and
Computer
Equipment
Transportation
Equipment
Other
Equipment
Leasehold
Improvements
Prepayments
for Equipment
and
Construction in
Progress Total
Cost
Balance, January 1 $ 5,526,334 $ 5,562,496 $ 1,861,133 $ 1,177 $ 1,411,272 $ 1,598,276 $ 115,667 $ 16,076,355
Adjustment on initial
application of IFRS 16 - - - - - (82,963 ) - (82,963 )
Balance, January 1 as
restated 5,526,334 5,562,496 1,861,133 1,177 1,411,272 1,515,313 115,667 15,993,392
Addition 290 11,672 129,506 - 18,146 13,258 80,225 253,097
Deduction - - (25,314 ) - (17,209 ) (667 ) - (43,190 )
Reclassifications 49,128 100,596 5,237 - 1,893 7,953 (50,474 ) 114,333
Effect of exchange rate
changes - 3,866 2,812 17 438 1,547 218 8,898
Other (Note) - 594 13,550 - 13,944 - - 28,088
Balance, June 30 5,575,752 5,679,224 1,986,924 1,194 1,428,484 1,537,404 145,636 16,354,618
Accumulated depreciation
Balance, January 1 - 2,976,725 1,422,437 1,177 1,116,401 1,348,500 - 6,865,240
Adjustment on initial
application of IFRS 16 - - - - - (69,670 ) - (69,670 )
Balance, January 1 as
restated - 2,976,725 1,422,437 1,177 1,116,401 1,278,830 - 6,795,570
Depreciation 2 64,611 79,817 - 37,859 40,931 - 223,220
Deduction - - (24,104 ) - (16,861 ) (665 ) - (41,630 )
Reclassifications - 58,881 199 - (199 ) - - 58,881
Effect of exchange rate
changes - 57 2,345 17 396 1,178 - 3,993
Other (Note) - 282 9,379 - 11,110 - - 20,771
Balance, June 30 2 3,100,556 1,490,073 1,194 1,148,706 1,320,274 - 7,060,805
Net amount
Balance, June 30 $ 5,575,750 $ 2,578,668 $ 496,851 $ - $ 279,778 $ 217,130 $ 145,636 $ 9,293,813
For the Six Months Ended June 30, 2018
Land Buildings
Machinery and
Computer
Equipment
Transportation
Equipment
Other
Equipment
Leasehold
Improvements
Prepayments
for Equipment
and
Construction in
Progress Total
Cost
Balance, January 1 $ 5,534,462 $ 5,153,144 $ 1,776,639 $ 1,150 $ 1,384,761 $ 1,601,336 $ 128,282 $ 15,579,774
Addition - 364,297 102,836 - 34,264 15,396 70,233 587,026
Deduction - - (56,525 ) - (21,781 ) (39,229 ) - (117,535 )
Reclassifications (8,128 ) 18,779 6,485 - 5,031 23,826 (100,962 ) (54,969 )
Effect of exchange rate
changes - - 1,566 17 389 (2,732 ) 43 (717 )
Balance, June 30 5,526,334 5,536,220 1,831,001 1,167 1,402,664 1,598,597 97,596 15,993,579
Accumulated depreciation
Balance, January 1 - 2,857,881 1,360,160 1,150 1,078,320 1,305,261 - 6,602,772
Depreciation - 59,983 73,091 - 40,176 48,563 - 221,813
Deduction - - (53,347 ) - (20,206 ) (38,347 ) - (111,900 )
Reclassifications - (4,426 ) - - - - - (4,426 )
Effect of exchange rate
changes - (48 ) 1,786 17 (125 ) (2,133 ) - (503 )
Balance, June 30 - 2,913,390 1,381,690 1,167 1,098,165 1,313,344 - 6,707,756
Net amount
Balance, June 30 $ 5,526,334 $ 2,622,830 $ 449,311 $ - $ 304,499 $ 285,253 $ 97,596 $ 9,285,823
Note: These are SinoPac Call Center’s assets, liabilities and operations, which generated from merger.

- 28 -
The above property and equipment are depreciated at the following estimated useful lives:
Items Years
Land improvements 8-30 years
Buildings 2-60 years
Machinery and computer equipment 0.58-15 years
Transportation equipment 5 years
Other equipment 2-15 years
Leasehold improvements 1.58-15 years
There was no property and equipment pledged as security. The balance of other equipment rent for others’
using on June 30, 2019 was $2,762.
16. LEASE ARRANGEMENTS
a. Right-of-use assets, net
June 30, 2019
Carrying amounts
Land $ 3,590
Buildings 1,749,485
Machinery and computer equipment 41,208
Transportation equipment 11,534
Other equipment 569
Decommissioning restoration costs 12,078
$ 1,818,464
For the Six
Months Ended
June 30, 2019
Additions to right-of-use assets $ 404,250
Depreciation charge for right-of-use assets
Land $ 793
Buildings 308,075
Machinery and computer equipment 13,130
Transportation equipment 5,047
Other equipment 313
Decommissioning restoration costs 2,584
$ 329,942
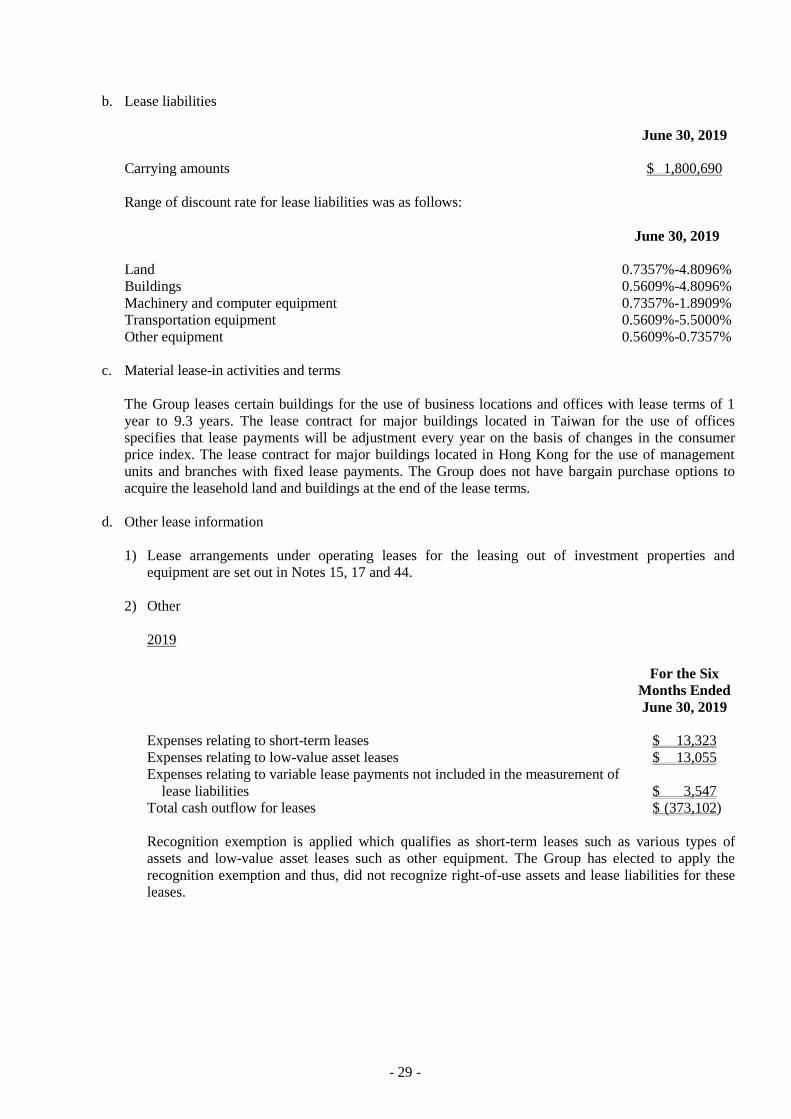
- 29 -
b. Lease liabilities
June 30, 2019
Carrying amounts $ 1,800,690
Range of discount rate for lease liabilities was as follows:
June 30, 2019
Land 0.7357%-4.8096%
Buildings 0.5609%-4.8096%
Machinery and computer equipment 0.7357%-1.8909%
Transportation equipment 0.5609%-5.5000%
Other equipment 0.5609%-0.7357%
c. Material lease-in activities and terms
The Group leases certain buildings for the use of business locations and offices with lease terms of 1
year to 9.3 years. The lease contract for major buildings located in Taiwan for the use of offices
specifies that lease payments will be adjustment every year on the basis of changes in the consumer
price index. The lease contract for major buildings located in Hong Kong for the use of management
units and branches with fixed lease payments. The Group does not have bargain purchase options to
acquire the leasehold land and buildings at the end of the lease terms.
d. Other lease information
1) Lease arrangements under operating leases for the leasing out of investment properties and
equipment are set out in Notes 15, 17 and 44.
2) Other
2019
For the Six
Months Ended
June 30, 2019
Expenses relating to short-term leases $ 13,323
Expenses relating to low-value asset leases $ 13,055
Expenses relating to variable lease payments not included in the measurement of
lease liabilities $ 3,547
Total cash outflow for leases $ (373,102)
Recognition exemption is applied which qualifies as short-term leases such as various types of
assets and low-value asset leases such as other equipment. The Group has elected to apply the
recognition exemption and thus, did not recognize right-of-use assets and lease liabilities for these
leases.
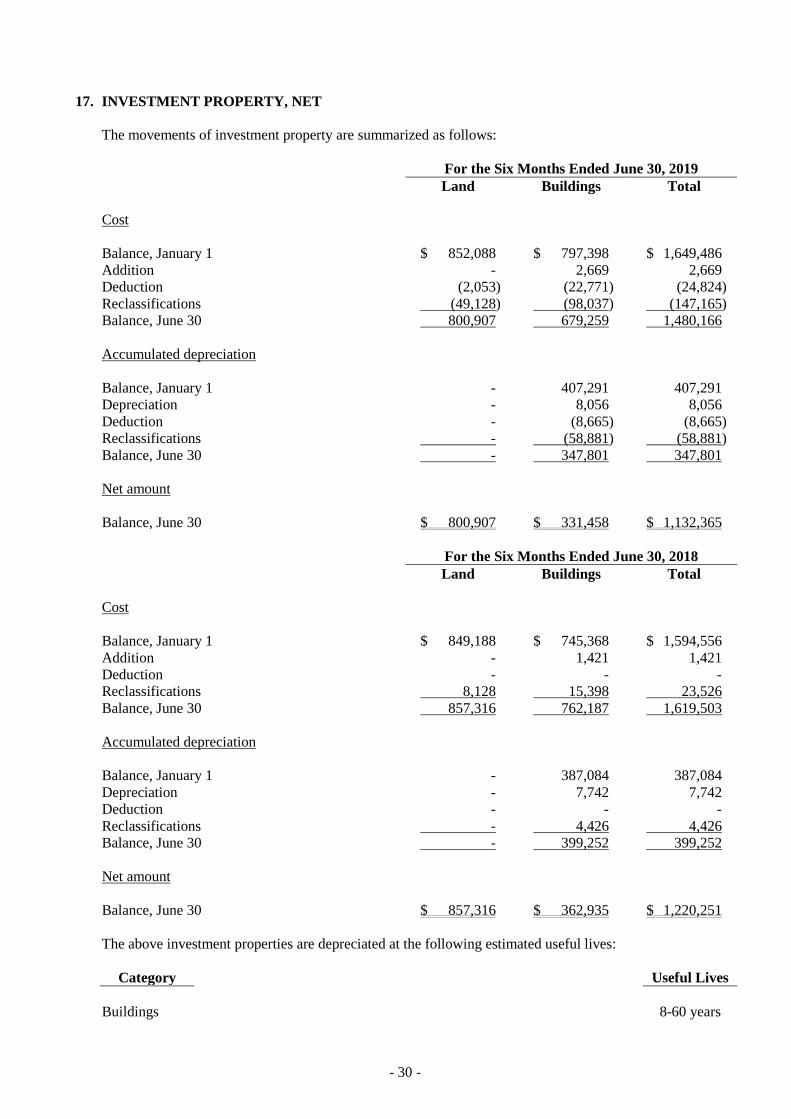
- 30 -
17. INVESTMENT PROPERTY, NET
The movements of investment property are summarized as follows:
For the Six Months Ended June 30, 2019
Land Buildings Total
Cost
Balance, January 1 $ 852,088 $ 797,398 $ 1,649,486
Addition - 2,669 2,669
Deduction (2,053) (22,771) (24,824)
Reclassifications (49,128) (98,037) (147,165)
Balance, June 30 800,907 679,259 1,480,166
Accumulated depreciation
Balance, January 1 - 407,291 407,291
Depreciation - 8,056 8,056
Deduction - (8,665) (8,665)
Reclassifications - (58,881) (58,881)
Balance, June 30 - 347,801 347,801
Net amount
Balance, June 30 $ 800,907 $ 331,458 $ 1,132,365
For the Six Months Ended June 30, 2018
Land Buildings Total
Cost
Balance, January 1 $ 849,188 $ 745,368 $ 1,594,556
Addition - 1,421 1,421
Deduction - - -
Reclassifications 8,128 15,398 23,526
Balance, June 30 857,316 762,187 1,619,503
Accumulated depreciation
Balance, January 1 - 387,084 387,084
Depreciation - 7,742 7,742
Deduction - - -
Reclassifications - 4,426 4,426
Balance, June 30 - 399,252 399,252
Net amount
Balance, June 30 $ 857,316 $ 362,935 $ 1,220,251
The above investment properties are depreciated at the following estimated useful lives:
Category Useful Lives
Buildings 8-60 years
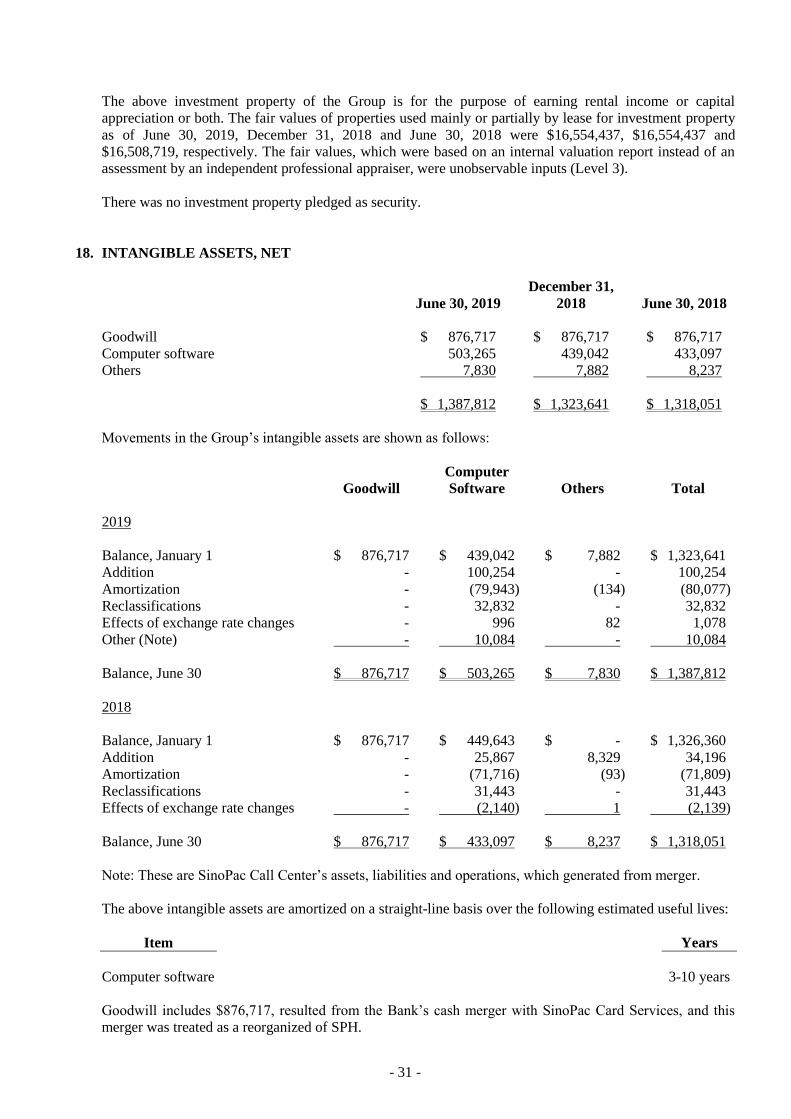
- 31 -
The above investment property of the Group is for the purpose of earning rental income or capital
appreciation or both. The fair values of properties used mainly or partially by lease for investment property
as of June 30, 2019, December 31, 2018 and June 30, 2018 were $16,554,437, $16,554,437 and
$16,508,719, respectively. The fair values, which were based on an internal valuation report instead of an
assessment by an independent professional appraiser, were unobservable inputs (Level 3).
There was no investment property pledged as security.
18. INTANGIBLE ASSETS, NET
June 30, 2019
December 31,
2018 June 30, 2018
Goodwill $ 876,717 $ 876,717 $ 876,717
Computer software 503,265 439,042 433,097
Others 7,830 7,882 8,237
$ 1,387,812 $ 1,323,641 $ 1,318,051
Movements in the Group’s intangible assets are shown as follows:
Goodwill
Computer
Software Others Total
2019
Balance, January 1 $ 876,717 $ 439,042 $ 7,882 $ 1,323,641
Addition - 100,254 - 100,254
Amortization - (79,943) (134) (80,077)
Reclassifications - 32,832 - 32,832
Effects of exchange rate changes - 996 82 1,078
Other (Note) - 10,084 - 10,084
Balance, June 30 $ 876,717 $ 503,265 $ 7,830 $ 1,387,812
2018
Balance, January 1 $ 876,717 $ 449,643 $ - $ 1,326,360
Addition - 25,867 8,329 34,196
Amortization - (71,716) (93) (71,809)
Reclassifications - 31,443 - 31,443
Effects of exchange rate changes - (2,140) 1 (2,139)
Balance, June 30 $ 876,717 $ 433,097 $ 8,237 $ 1,318,051
Note: These are SinoPac Call Center’s assets, liabilities and operations, which generated from merger.
The above intangible assets are amortized on a straight-line basis over the following estimated useful lives:
Item Years
Computer software 3-10 years
Goodwill includes $876,717, resulted from the Bank’s cash merger with SinoPac Card Services, and this
merger was treated as a reorganized of SPH.

- 32 -
In assessing whether goodwill is impaired, the Bank considers the credit card department as a cash
generating unit and estimates the recoverable amount by its value in use. The Bank uses the department’s
actual profitability in making key assumption to predict future cash flows and thus calculates its value in
use. Under a going-concern assumption, the Bank predicted the net cash flows generated from the
investee’s operating activities in the next 5 years and estimated salvage value and used the Bank’s weighted
average cost of capital to calculate the value in use.
The goodwill of the Bank’s credit card department was $876,717 as of June 30, 2019, December 31, 2018
and June 30, 2018. The impairment tests on goodwill were conducted on October 31, 2018 and 2017. The
actual net income for the six months ended June 30, 2019, for the year ended December 31, 2018 and for
the six months ended June 30, 2018 amounted to $26,839, $190,146 and $97,392, respectively. The
expected net income for the years 2019 and 2018 as assessed by the impairment test on goodwill would be
$81,907 and $62,319, respectively. The recoverable amount was expected to be higher than the book value.
Therefore, the Group found no objective evidence that goodwill had been impaired as of June 30, 2019 and
2018.
19. OTHER ASSETS, NET
June 30, 2019
December 31,
2018 June 30, 2018
Guarantee deposits $ 2,321,717 $ 3,537,197 $ 4,365,236
Prepayment 328,324 289,299 293,258
Temporary payment and suspense accounts 138,002 151,630 135,273
Others 50,897 64,420 53,042
2,838,940 4,042,546 4,846,809
Less: Allowance for reduction of inventory to
market - gold - - (96)
Less: Accumulated impairments (7,000) (10,996) (9,826)
Net amount $ 2,831,940 $ 4,031,550 $ 4,836,887
20. DEPOSITS FROM THE CENTRAL BANK AND BANKS
June 30, 2019
December 31,
2018 June 30, 2018
Call loans from banks $ 41,330,980 $ 37,317,591 $ 52,776,084
Redeposits from Chunghwa Post 10,190,900 543,485 664,491
Due to banks 116,607 103,855 194,178
$ 51,638,487 $ 37,964,931 $ 53,634,753
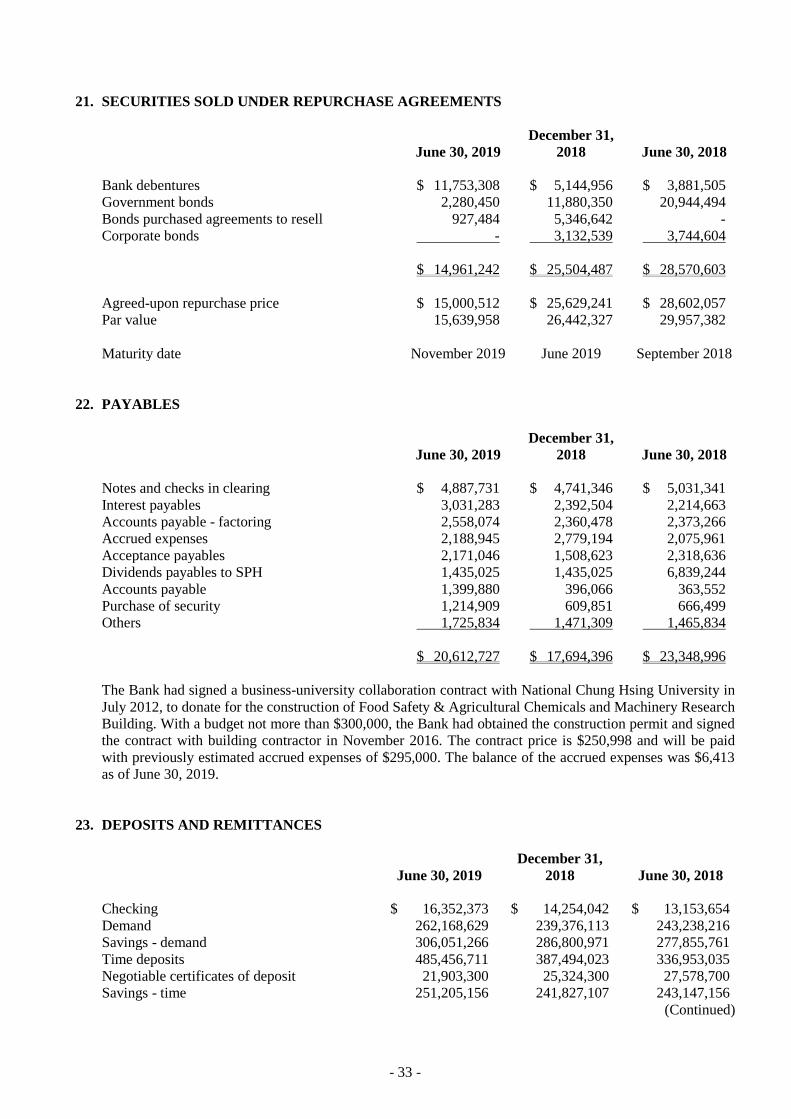
- 33 -
21. SECURITIES SOLD UNDER REPURCHASE AGREEMENTS
June 30, 2019
December 31,
2018 June 30, 2018
Bank debentures $ 11,753,308 $ 5,144,956 $ 3,881,505
Government bonds 2,280,450 11,880,350 20,944,494
Bonds purchased agreements to resell 927,484 5,346,642 -
Corporate bonds - 3,132,539 3,744,604
$ 14,961,242 $ 25,504,487 $ 28,570,603
Agreed-upon repurchase price $ 15,000,512 $ 25,629,241 $ 28,602,057
Par value 15,639,958 26,442,327 29,957,382
Maturity date November 2019 June 2019 September 2018
22. PAYABLES
June 30, 2019
December 31,
2018 June 30, 2018
Notes and checks in clearing $ 4,887,731 $ 4,741,346 $ 5,031,341
Interest payables 3,031,283 2,392,504 2,214,663
Accounts payable - factoring 2,558,074 2,360,478 2,373,266
Accrued expenses 2,188,945 2,779,194 2,075,961
Acceptance payables 2,171,046 1,508,623 2,318,636
Dividends payables to SPH 1,435,025 1,435,025 6,839,244
Accounts payable 1,399,880 396,066 363,552
Purchase of security 1,214,909 609,851 666,499
Others 1,725,834 1,471,309 1,465,834
$ 20,612,727 $ 17,694,396 $ 23,348,996
The Bank had signed a business-university collaboration contract with National Chung Hsing University in
July 2012, to donate for the construction of Food Safety & Agricultural Chemicals and Machinery Research
Building. With a budget not more than $300,000, the Bank had obtained the construction permit and signed
the contract with building contractor in November 2016. The contract price is $250,998 and will be paid
with previously estimated accrued expenses of $295,000. The balance of the accrued expenses was $6,413
as of June 30, 2019.
23. DEPOSITS AND REMITTANCES
June 30, 2019
December 31,
2018 June 30, 2018
Checking $ 16,352,373 $ 14,254,042 $ 13,153,654
Demand 262,168,629 239,376,113 243,238,216
Savings - demand 306,051,266 286,800,971 277,855,761
Time deposits 485,456,711 387,494,023 336,953,035
Negotiable certificates of deposit 21,903,300 25,324,300 27,578,700
Savings - time 251,205,156 241,827,107 243,147,156
(Continued)

- 34 -
June 30, 2019
December 31,
2018 June 30, 2018
Inward remittances $ 1,012,369 $ 809,448 $ 873,186
Outward remittances 45,506 88,150 54,150
$ 1,344,195,310 $ 1,195,974,154 $ 1,142,853,858
(Concluded)
24. BANK DEBENTURES
To raise capital for its financial operation and increase its capital adequacy ratio, the Bank obtained
approval from FSC to issue bank debentures, as follows:
June 30, 2019
December 31,
2018 June 30, 2018 Maturity Date Rates
Second subordinated bank
debentures issued in 2011 (A)
$ - $ - $ 3,799,958 2011.08.18-2018.08.18
Principal is repayable on maturity date.
Fixed interest rate of 1.95%,
interest is paid annually.
Second subordinated bank
debentures issued in 2011 (B)
2,999,635 2,999,553 2,999,470 2011.08.18-2021.08.18
Principal is repayable on maturity date.
Fixed interest rate of 2.18%,
interest is paid annually.
Third subordinated bank
debentures issued in 2011
- - 3,199,907 2011.11.04-2018.11.04
Principal is repayable on maturity date.
Fixed interest rate of 1.85%,
interest is paid annually.
First subordinated bank
debentures issued in 2012 (A)
4,699,917 4,699,735 4,699,549 2012.09.18-2019.09.18
Principal is repayable on maturity date.
Fixed interest rate of 1.53%,
interest is paid annually.
First subordinated bank
debentures issued in 2012 (B)
1,299,766 1,299,731 1,299,696 2012.09.18-2022.09.18
Principal is repayable on maturity date.
Fixed interest rate of 1.65%,
interest is paid annually.
First subordinated bank
debentures issued in 2013
- 1,499,952 1,499,851 2013.09.27-2019.03.27
Principal is repayable on maturity date.
Fixed interest rate of 1.80%,
interest is paid annually.
Second subordinated bank
debentures issued in 2013
- 1,999,873 1,999,746 2013.12.23-2019.06.23
Principal is repayable on maturity date.
Fixed interest rate of 1.75%,
interest is paid annually.
First subordinated bank
debentures issued in 2014
1,999,941 1,999,810 1,999,687 2014.03.20-2019.09.20
Principal is repayable on maturity date.
Fixed interest rate of 1.70%,
interest is paid annually.
Second subordinated bank
debentures issued in 2014
2,499,846 2,499,690 2,499,539 2014.06.23-2019.12.23
Principal is repayable on maturity date.
Fixed interest rate of 1.65%,
interest is paid annually.
Third subordinated bank
debentures issued in 2014 (A)
1,879,802 1,879,677 1,879,551 2014.09.30-2020.03.30
Principal is repayable on maturity date.
Fixed interest rate of 1.75%,
interest is paid annually.
Third subordinated bank
debentures issued in 2014 (B)
699,721 699,697 699,672 2014.09.30-2024.09.30
Principal is repayable on maturity date.
Fixed interest rate of 2.05%,
interest is paid annually.
First subordinated bank
debentures issued in 2015
749,887 749,836 749,785 2015.07.22, no maturity date (Note 1). Fixed interest rate of 3.90%
(Note 4).
Second subordinated bank
debentures issued in 2015
459,922 459,891 459,859 2015.09.08, no maturity date (Note 2). Fixed interest rate of 3.90%
(Note 4).
Third subordinated bank
debentures issued in 2015
709,865 709,818 709,770 2015.11.05, no maturity date (Note 2). Fixed interest rate of 3.90%
(Note 4).
Fourth subordinated bank
debentures issued in 2015
139,970 139,960 139,951 2015.12.15, no maturity date (Note 2). Fixed interest rate of 3.90%
(Note 4).
First subordinated bank
debentures issued in 2016
1,499,682 1,499,588 1,499,499 2016.02.23, no maturity date (Note 2). Fixed interest rate of 3.90%
(Note 4).
Second subordinated bank
debentures issued in 2016
1,029,752 1,029,683 1,029,617 2016.03.30, no maturity date (Note 2). Fixed interest rate of 3.90%
(Note 4).
Third subordinated bank
debentures issued in 2016
1,419,436 1,419,376 1,419,315 2016.12.23-2023.12.23
Principal is repayable on maturity date.
Fixed interest rate of 1.50%,
interest is paid annually.
First subordinated bank
debentures issued in 2017 (A)
149,895 149,884 149,873 2017.02.24-2024.02.24
Principal is repayable on maturity date.
Fixed interest rate of 1.60%,
interest is paid annually.
First subordinated bank
debentures issued in 2017 (B)
2,099,116 2,099,062 2,099,010 2017.02.24-2027.02.24
Principal is repayable on maturity date.
Fixed interest rate of 1.90%,
interest is paid annually.
Third subordinated bank
debentures issued in 2017 (A)
199,902 199,893 199,883 2017.06.28-2024.06.28
Principal is repayable on maturity date.
Fixed interest rate of 1.70%,
interest is paid annually.
Third subordinated bank
debentures issued in 2017 (B)
539,710 539,693 539,677 2017.06.28-2027.06.28
Principal is repayable on maturity date.
Fixed interest rate of 1.95%,
interest is paid annually.
Fourth subordinated bank
debentures issued in 2017
2,998,902 2,998,759 2,998,619 2017.06.28, no maturity date (Note 3). Fixed interest rate of 4.00%
(Note 4).
First subordinated bank
debentures issued in 2018 (A)
649,652 649,623 649,595 2018.04.30-2025.04.30
Principal is repayable on maturity date.
Fixed interest rate of 1.40%,
interest is paid annually.
First subordinated bank
debentures issued in 2018 (B)
499,715 499,699 499,685 2018.04.30-2028.04.30
Principal is repayable on maturity date.
Fixed interest rate of 1.65%,
interest is paid annually.
First subordinated bank
debentures issued in 2019
1,998,930 - - 2019.01.25, no maturity date (Note 3). Fixed interest rate of 2.40%
(Note 4).
Second subordinated bank
debentures issued in 2019 (A)
1,199,374 - - 2019.01.25-2026.01.25
Principal is repayable on maturity date.
Fixed interest rate of 1.40%,
interest is paid annually.
Second subordinated bank
debentures issued in 2019 (B)
1,799,045 - - 2019.01.25-2029.01.25
Principal is repayable on maturity date.
Fixed interest rate of 1.55%,
interest is paid annually.
Third senior bank debentures
issued in 2019
3,000,000
-
-
2019.06.26-2024.06.26
Principal is repayable on maturity date.
Fixed interest rate of 0.76%,
interest is paid annually.
$ 37,221,383 $ 32,722,483 $ 39,720,764
- 35 -
Note 1: The bond has neither a maturity date nor fixed callable date. The Bank has the right to call or buy
back the bond from the market after five years of its issuance if one of the conditions listed below
is met, and bank debenture issuance has been approved by regulatory authorities.
a. The Bank’s ratio of regulatory capital to risk-weighted assets will still meet the minimum
requirement prescribed in Article 5 of Section 1 of the Regulations Governing the Capital
Adequacy and Capital Category of Banks after bond repayment.
b. The Bank replaces the bond with another capital market instrument that offers interest equal to
or higher than that on the bond that has been called.
Note 2: The bond has neither a maturity date nor fixed callable date. The Bank has the right to call or buy
back the bond from the market after five years of its issuance if both of the conditions listed
below are met, and bank debenture issuance has been approved by regulatory authorities.
a. The Bank’s ratio of regulatory capital to risk-weighted assets still meets the minimum
requirement prescribed in Article 5 of Section 1 of the Regulations Governing the Capital
Adequacy and Capital Category of Banks after bond repayment.
b. The Bank replaces the bond with another capital instrument that offers interest equal to or
higher than that on the bond that has been called.
Note 3: The bond has neither a maturity date nor fixed callable date. The Bank has the right to call or buy
back the bond from the market after five and half years of its issuance if one of the conditions
listed below are met, and bank debenture issuance has been approved by regulatory authorities.
a. The Bank’s ratio of regulatory capital to risk-weighted assets still meets the minimum
requirement prescribed in Article 5 of Section 1 of the Regulations Governing the Capital
Adequacy and Capital Category of Banks after bond repayment.
b. The Bank replaces the bond with another capital instrument that offers interest equal to or
higher than that on the bond that has been called.
Note 4: Interest payment amount on the bond will be based on the Bank’s calculation. Calculation of the
interest starts on the issuance date, accrues on the basis of actual days, and is payable annually.
The Bank is not obligated to pay interest when the Bank has no profit from the prior year and does
not distribute any dividends (both cash and stock dividends). However, this does not apply when
accumulated undistributed earnings less the proceeds on unamortized nonperforming loans losses
is larger than the interest payment amount while the condition for interest payment has not been
modified. Interest payments that were not issued due to the reason described previously shall not
be accumulated nor deferred. If the Bank’s regulatory capital to risk-weighted assets ratio does
not meet the minimum requirement prescribed in Article 5, Section 1 of the Regulations
Governing the Capital Adequacy and Capital Category of Banks on an interest payment date, the
bond shall defer interest payments. Accrued interest on the bond shall be deferred till the next
interest payment date that conforms to the condition of an interest payment date described above.
Deferred interest does not incur additional interest.

- 36 -
25. OTHER FINANCIAL LIABILITIES
June 30, 2019
December 31,
2018 June 30, 2018
Principal of structured products $ 15,605,988 $ 18,791,470 $ 13,191,988
Overseas certificate of deposit 310,781 307,488 -
Cumulative earnings on appropriated loan fund 86,002 112,385 135,899
Leases payable - 240 281
$ 16,002,771 $ 19,211,583 $ 13,328,168
26. PROVISIONS
June 30, 2019
December 31,
2018 June 30, 2018
Provision for employee benefits $ 2,388,463 $ 2,473,389 $ 2,342,216
Provision for guarantee liabilities 182,834 198,466 204,489
Provision for financing commitment 111,780 210,276 243,045
Provision for decommissioning liabilities 89,126 87,373 88,387
Other 27,790 5,762 4,764
$ 2,799,993 $ 2,975,266 $ 2,882,901
The movements of provision for financing commitment, provision for guarantee liabilities and other
provision were shown as follows:
For the Six Months Ended June 30, 2019
Provision for
Financing
Commitment
Provision for
Guarantee
Liabilities Other Provision
Balance, January 1 $ 210,276 $ 198,466 $ 5,762
(Reversal of) provision (98,868) (16,151) 22,160
Effect of exchange rate changes 372 519 (132)
Balance, June 30 $ 111,780 $ 182,834 $ 27,790
For the Six Months Ended June 30, 2018
Provision for
Financing
Commitment
Provision for
Guarantee
Liabilities Other Provision
Balance, January 1 $ - $ 199,563 $ -
Adjustments of IFRS 9 application 304,856 - 1,552
(Reversal of) provision (63,213) 11,845 (4,141)
Reclassifications 260 (7,612) 7,311
Effect of exchange rate changes 1,142 693 42
Balance, June 30 $ 243,045 $ 204,489 $ 4,764

- 37 -
27. PROVISIONS FOR EMPLOYEE BENEFITS
June 30, 2019
December 31,
2018 June 30, 2018
Recognized in consolidated balance sheets (listed
in account payables and provision)
Defined contribution plans $ 37,609 $ 36,444 $ 35,259
Defined benefit plans 2,105,868 2,194,514 2,083,894
Preferential interest on employees’ deposits 271,214 264,531 251,880
Deferred annual leave and retirement benefit 11,381 14,344 6,442
$ 2,426,072 $ 2,509,833 $ 2,377,475
The pension expenses related to defined benefit plans and preferential interest on employee’s deposits plan
are recognized according to the results of actuarial valuation on December 31, 2018 and 2017.
For the Six Months Ended
June 30
2019 2018
Operating expenses $ 63,525 $ 67,464
28. OTHER LIABILITIES
June 30, 2019
December 31,
2018 June 30, 2018
Guarantee deposits received $ 1,707,487 $ 1,588,995 $ 1,550,457
Temporary receipt and suspense accounts 719,198 684,698 730,714
Deferred revenue 634,839 623,985 1,161,311
Advance receipts 153,847 134,587 129,706
Others 32,350 28,054 33,423
$ 3,247,721 $ 3,060,319 $ 3,605,611
29. INCOME TAX
Under Article 49 of the Financial Holding Company Act and related directives issued by the Ministry of
Finance, a financial holding company and its domestic subsidiaries that held over 90% of shares issued by
the financial holding company for 12 months within the same tax year may choose to adopt the linked-tax
system for income tax filings. Thus, SPH adopted the linked-tax system for income tax and unappropriated
earnings tax filings with its qualified subsidiaries since 2003.
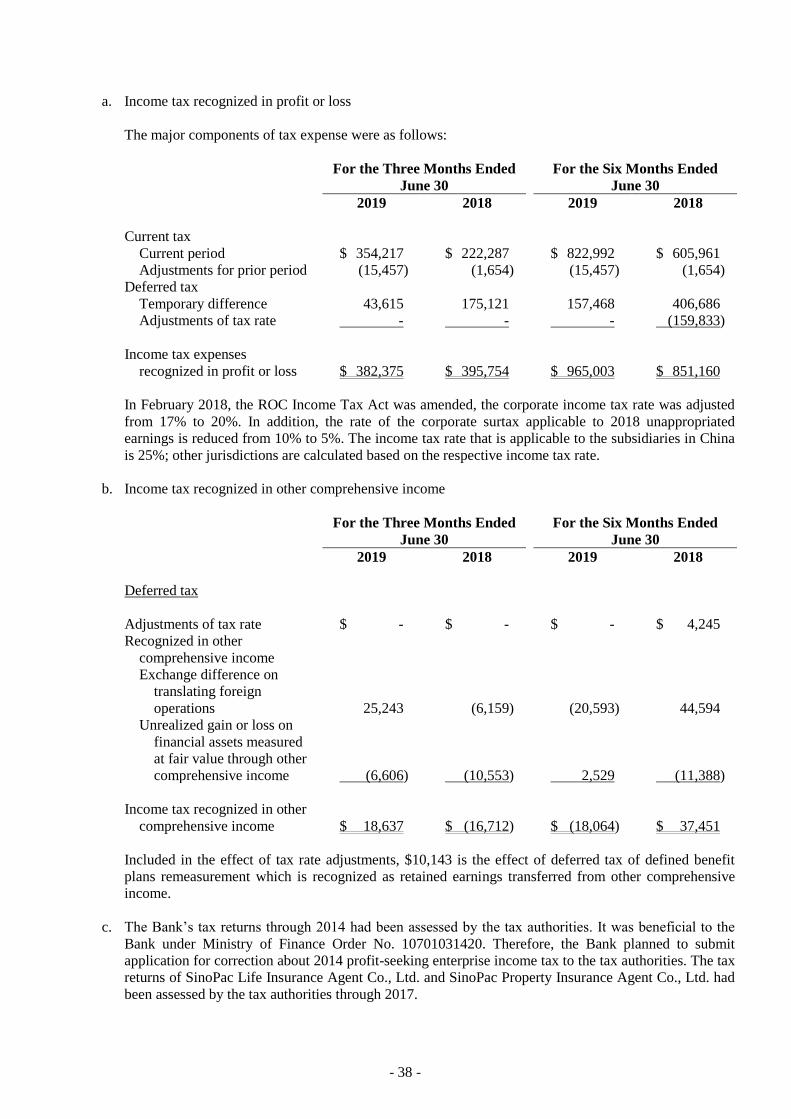
- 38 -
a. Income tax recognized in profit or loss
The major components of tax expense were as follows:
For the Three Months Ended
June 30 For the Six Months Ended
June 30
2019 2018 2019 2018
Current tax
Current period $ 354,217 $ 222,287 $ 822,992 $ 605,961
Adjustments for prior period (15,457) (1,654) (15,457) (1,654)
Deferred tax
Temporary difference 43,615 175,121 157,468 406,686
Adjustments of tax rate - - - (159,833)
Income tax expenses
recognized in profit or loss $ 382,375 $ 395,754 $ 965,003 $ 851,160
In February 2018, the ROC Income Tax Act was amended, the corporate income tax rate was adjusted
from 17% to 20%. In addition, the rate of the corporate surtax applicable to 2018 unappropriated
earnings is reduced from 10% to 5%. The income tax rate that is applicable to the subsidiaries in China
is 25%; other jurisdictions are calculated based on the respective income tax rate.
b. Income tax recognized in other comprehensive income
For the Three Months Ended
June 30 For the Six Months Ended
June 30
2019 2018 2019 2018
Deferred tax
Adjustments of tax rate $ - $ - $ - $ 4,245
Recognized in other
comprehensive income
Exchange difference on
translating foreign
operations 25,243 (6,159) (20,593) 44,594
Unrealized gain or loss on
financial assets measured
at fair value through other
comprehensive income (6,606) (10,553) 2,529 (11,388)
Income tax recognized in other
comprehensive income $ 18,637 $ (16,712) $ (18,064) $ 37,451
Included in the effect of tax rate adjustments, $10,143 is the effect of deferred tax of defined benefit
plans remeasurement which is recognized as retained earnings transferred from other comprehensive
income.
c. The Bank’s tax returns through 2014 had been assessed by the tax authorities. It was beneficial to the
Bank under Ministry of Finance Order No. 10701031420. Therefore, the Bank planned to submit
application for correction about 2014 profit-seeking enterprise income tax to the tax authorities. The tax
returns of SinoPac Life Insurance Agent Co., Ltd. and SinoPac Property Insurance Agent Co., Ltd. had
been assessed by the tax authorities through 2017.

- 39 -
30. EQUITY
Common Shares
The Bank’s authorized capital is $100,000,000. And the Bank issued 10,000,000 thousand common shares
with par value of NT$10. The Bank’s shares issued and fully paid capital is $86,061,159 which is 8,606,116
thousand common shares.
Capital Surplus
The premium from shares issued in excess of par (share premium from issuance of common stock,
conversion of bonds and treasury stock transactions) and donations may be used to offset a deficit; in
addition, when the Group has no deficit, the capital surplus may be distributed as cash dividends or
transferred to capital (limited to a certain percentage of the Bank’s paid-in capital and once a year).
On July 25, 2014, the board of directors of the parent company of the Bank, SPH, approved a capital
increase and retained 10% of shares for subscription by the Bank’s employees. The Bank’s capital surplus -
employee share options, which was determined on the basis of the grant-date fair value of the employee
share options, was $67,511 in 2014.
Other Equity Items
Exchange
Differences
Arising on
Translating
Unrealized Gain or Loss on
Financial Assets Measured at Fair
Value Through Other
Comprehensive Income
Change in Fair
Value of
Financial
Liability
Attributable to
Changes in the
Foreign
Operations
Equity
Instrument
Debt
Instrument
Credit Risk of
Liabilities Total
Balance January 1, 2019 $ (396,410) $ 552,135 $ (178,523) $ (7,836) $ (30,634)
Exchange differences
Exchange differences arising
on translating foreign
operations 102,968 - - - 102,968
Related income tax (20,593) - - - (20,593)
Financial assets at fair value
through other comprehensive
income
Current adjustment for change
in value - 206,150 1,219,064 - 1,425,214
Adjustment for loss allowance
of debt instruments - - 5,238 - 5,238
Current disposal - - (28,750) - (28,750)
Related income tax - - 2,529 - 2,529
Change in fair value of financial
liability attributable to changes
in the credit risk of liabilities
Change in amount - - - (59,177) (59,177)
Balance June 30, 2019 $ (314,035) $ 758,285 $ 1,019,558 $ (67,013) $ 1,396,795
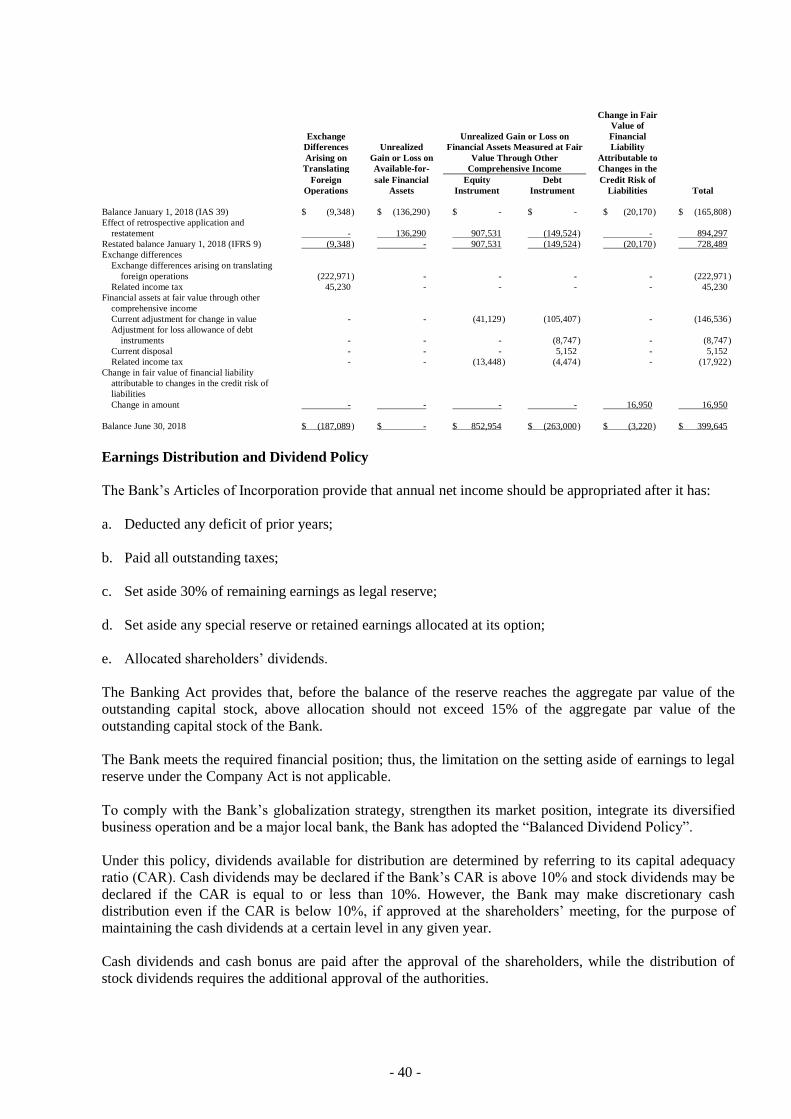
- 40 -
Exchange
Differences
Arising on
Translating
Unrealized
Gain or Loss on
Available-for-
Unrealized Gain or Loss on
Financial Assets Measured at Fair
Value Through Other
Comprehensive Income
Change in Fair
Value of
Financial
Liability
Attributable to
Changes in the
Foreign
Operations
sale Financial
Assets
Equity
Instrument
Debt
Instrument
Credit Risk of
Liabilities Total
Balance January 1, 2018 (IAS 39) $ (9,348 ) $ (136,290 ) $ - $ - $ (20,170 ) $ (165,808 )
Effect of retrospective application and
restatement - 136,290 907,531 (149,524 ) - 894,297
Restated balance January 1, 2018 (IFRS 9) (9,348 ) - 907,531 (149,524 ) (20,170 ) 728,489
Exchange differences
Exchange differences arising on translating
foreign operations (222,971 ) - - - - (222,971 )
Related income tax 45,230 - - - - 45,230
Financial assets at fair value through other
comprehensive income
Current adjustment for change in value - - (41,129 ) (105,407 ) - (146,536 )
Adjustment for loss allowance of debt
instruments - - - (8,747 ) - (8,747 )
Current disposal - - - 5,152 - 5,152
Related income tax - - (13,448 ) (4,474 ) - (17,922 )
Change in fair value of financial liability
attributable to changes in the credit risk of
liabilities
Change in amount - - - - 16,950 16,950
Balance June 30, 2018 $ (187,089 ) $ - $ 852,954 $ (263,000 ) $ (3,220 ) $ 399,645
Earnings Distribution and Dividend Policy
The Bank’s Articles of Incorporation provide that annual net income should be appropriated after it has:
a. Deducted any deficit of prior years;
b. Paid all outstanding taxes;
c. Set aside 30% of remaining earnings as legal reserve;
d. Set aside any special reserve or retained earnings allocated at its option;
e. Allocated shareholders’ dividends.
The Banking Act provides that, before the balance of the reserve reaches the aggregate par value of the
outstanding capital stock, above allocation should not exceed 15% of the aggregate par value of the
outstanding capital stock of the Bank.
The Bank meets the required financial position; thus, the limitation on the setting aside of earnings to legal
reserve under the Company Act is not applicable.
To comply with the Bank’s globalization strategy, strengthen its market position, integrate its diversified
business operation and be a major local bank, the Bank has adopted the “Balanced Dividend Policy”.
Under this policy, dividends available for distribution are determined by referring to its capital adequacy
ratio (CAR). Cash dividends may be declared if the Bank’s CAR is above 10% and stock dividends may be
declared if the CAR is equal to or less than 10%. However, the Bank may make discretionary cash
distribution even if the CAR is below 10%, if approved at the shareholders’ meeting, for the purpose of
maintaining the cash dividends at a certain level in any given year.
Cash dividends and cash bonus are paid after the approval of the shareholders, while the distribution of
stock dividends requires the additional approval of the authorities.
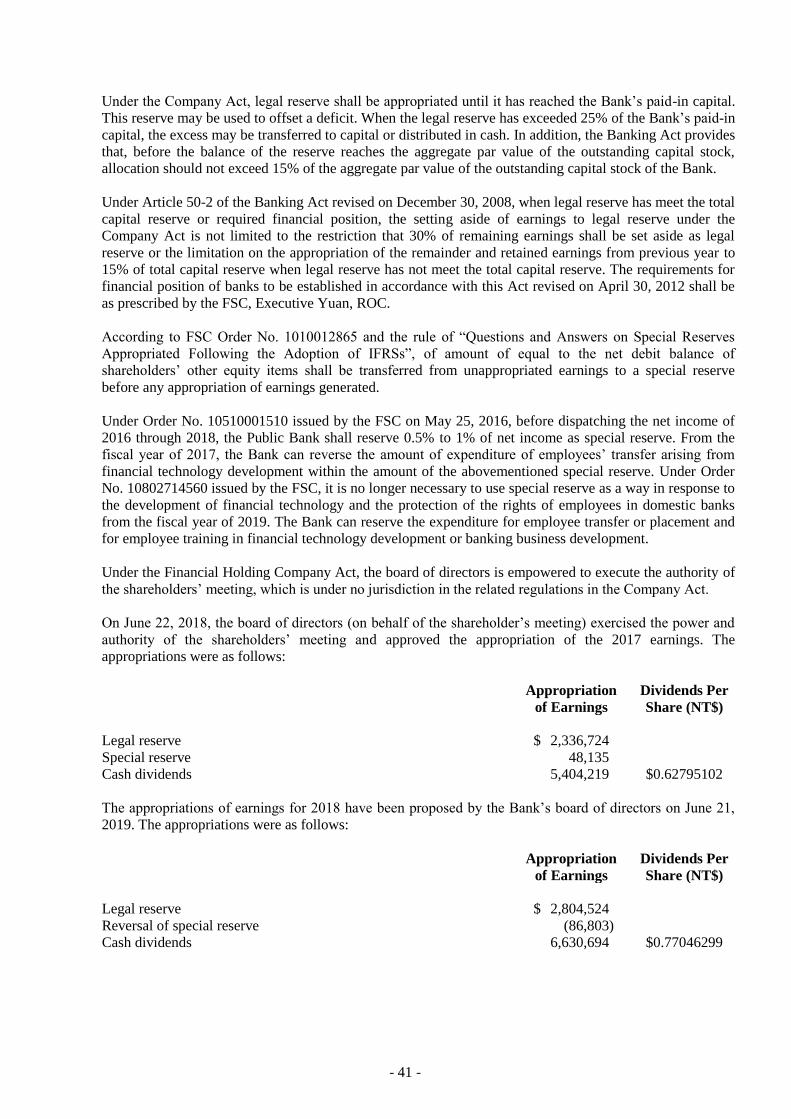
- 41 -
Under the Company Act, legal reserve shall be appropriated until it has reached the Bank’s paid-in capital.
This reserve may be used to offset a deficit. When the legal reserve has exceeded 25% of the Bank’s paid-in
capital, the excess may be transferred to capital or distributed in cash. In addition, the Banking Act provides
that, before the balance of the reserve reaches the aggregate par value of the outstanding capital stock,
allocation should not exceed 15% of the aggregate par value of the outstanding capital stock of the Bank.
Under Article 50-2 of the Banking Act revised on December 30, 2008, when legal reserve has meet the total
capital reserve or required financial position, the setting aside of earnings to legal reserve under the
Company Act is not limited to the restriction that 30% of remaining earnings shall be set aside as legal
reserve or the limitation on the appropriation of the remainder and retained earnings from previous year to
15% of total capital reserve when legal reserve has not meet the total capital reserve. The requirements for
financial position of banks to be established in accordance with this Act revised on April 30, 2012 shall be
as prescribed by the FSC, Executive Yuan, ROC.
According to FSC Order No. 1010012865 and the rule of “Questions and Answers on Special Reserves
Appropriated Following the Adoption of IFRSs”, of amount of equal to the net debit balance of
shareholders’ other equity items shall be transferred from unappropriated earnings to a special reserve
before any appropriation of earnings generated.
Under Order No. 10510001510 issued by the FSC on May 25, 2016, before dispatching the net income of
2016 through 2018, the Public Bank shall reserve 0.5% to 1% of net income as special reserve. From the
fiscal year of 2017, the Bank can reverse the amount of expenditure of employees’ transfer arising from
financial technology development within the amount of the abovementioned special reserve. Under Order
No. 10802714560 issued by the FSC, it is no longer necessary to use special reserve as a way in response to
the development of financial technology and the protection of the rights of employees in domestic banks
from the fiscal year of 2019. The Bank can reserve the expenditure for employee transfer or placement and
for employee training in financial technology development or banking business development.
Under the Financial Holding Company Act, the board of directors is empowered to execute the authority of
the shareholders’ meeting, which is under no jurisdiction in the related regulations in the Company Act.
On June 22, 2018, the board of directors (on behalf of the shareholder’s meeting) exercised the power and
authority of the shareholders’ meeting and approved the appropriation of the 2017 earnings. The
appropriations were as follows:
Appropriation
of Earnings Dividends Per
Share (NT$)
Legal reserve $ 2,336,724
Special reserve 48,135
Cash dividends 5,404,219 $0.62795102
The appropriations of earnings for 2018 have been proposed by the Bank’s board of directors on June 21,
2019. The appropriations were as follows:
Appropriation
of Earnings
Dividends Per
Share (NT$)
Legal reserve $ 2,804,524
Reversal of special reserve (86,803)
Cash dividends 6,630,694 $0.77046299
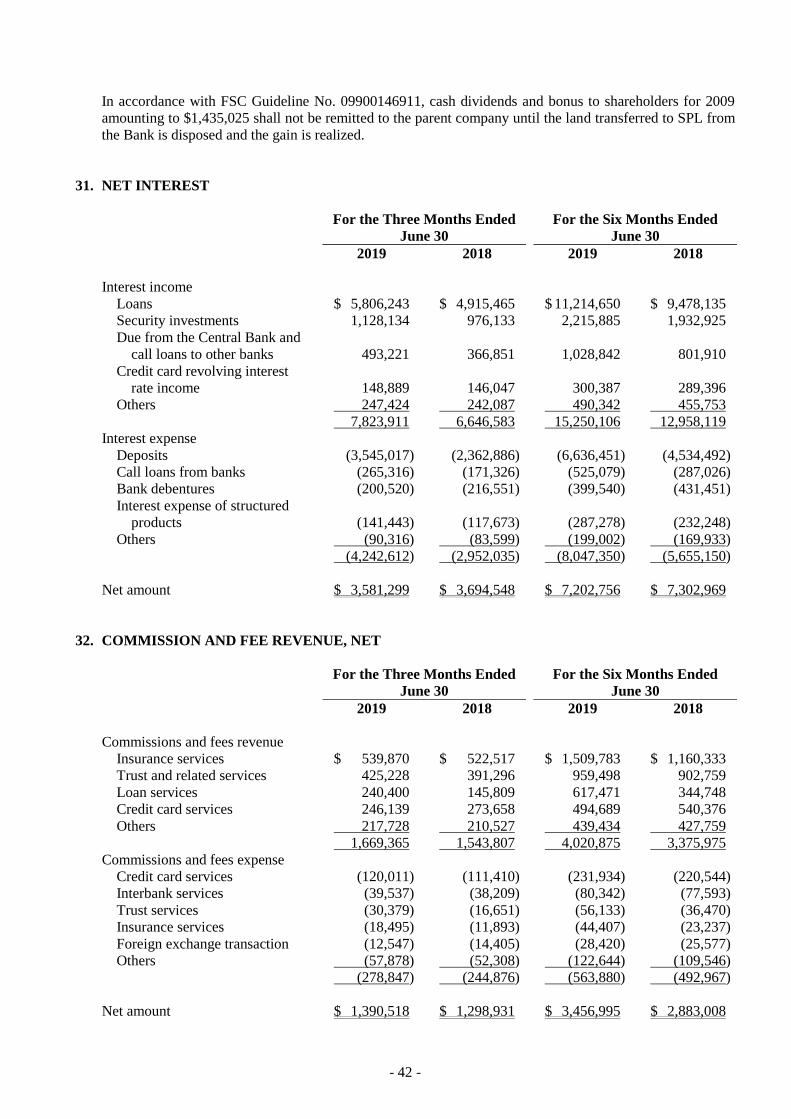
- 42 -
In accordance with FSC Guideline No. 09900146911, cash dividends and bonus to shareholders for 2009
amounting to $1,435,025 shall not be remitted to the parent company until the land transferred to SPL from
the Bank is disposed and the gain is realized.
31. NET INTEREST
For the Three Months Ended
June 30 For the Six Months Ended
June 30
2019 2018 2019 2018
Interest income
Loans $ 5,806,243 $ 4,915,465 $ 11,214,650 $ 9,478,135
Security investments 1,128,134 976,133 2,215,885 1,932,925
Due from the Central Bank and
call loans to other banks 493,221 366,851 1,028,842 801,910
Credit card revolving interest
rate income 148,889 146,047 300,387 289,396
Others 247,424 242,087 490,342 455,753
7,823,911 6,646,583 15,250,106 12,958,119
Interest expense
Deposits (3,545,017) (2,362,886) (6,636,451) (4,534,492)
Call loans from banks (265,316) (171,326) (525,079) (287,026)
Bank debentures (200,520) (216,551) (399,540) (431,451)
Interest expense of structured
products (141,443) (117,673) (287,278) (232,248)
Others (90,316) (83,599) (199,002) (169,933)
(4,242,612) (2,952,035) (8,047,350) (5,655,150)
Net amount $ 3,581,299 $ 3,694,548 $ 7,202,756 $ 7,302,969
32. COMMISSION AND FEE REVENUE, NET
For the Three Months Ended
June 30 For the Six Months Ended
June 30
2019 2018 2019 2018
Commissions and fees revenue
Insurance services $ 539,870 $ 522,517 $ 1,509,783 $ 1,160,333
Trust and related services 425,228 391,296 959,498 902,759
Loan services 240,400 145,809 617,471 344,748
Credit card services 246,139 273,658 494,689 540,376
Others 217,728 210,527 439,434 427,759
1,669,365 1,543,807 4,020,875 3,375,975
Commissions and fees expense
Credit card services (120,011) (111,410) (231,934) (220,544)
Interbank services (39,537) (38,209) (80,342) (77,593)
Trust services (30,379) (16,651) (56,133) (36,470)
Insurance services (18,495) (11,893) (44,407) (23,237)
Foreign exchange transaction (12,547) (14,405) (28,420) (25,577)
Others (57,878) (52,308) (122,644) (109,546)
(278,847) (244,876) (563,880) (492,967)
Net amount $ 1,390,518 $ 1,298,931 $ 3,456,995 $ 2,883,008

- 43 -
33. GAINS OR LOSSES ON FINANCIAL ASSETS AND LIABILITIES AT FAIR VALUE THROUGH
PROFIT OR LOSS
For the Three Months Ended
June 30 For the Six Months Ended
June 30
2019 2018 2019 2018
Realized gain (loss) on financial
assets and liabilities at fair value
through profit or loss
Government bonds $ 198,847 $ (383,874) $ 312,808 $ (259,444)
Bank debentures 95,451 42,775 110,237 127,162
Corporate bonds 15,416 39,149 27,278 79,309
Stocks - 51,400 - 65,269
Currency swap contracts and
hybrid FX swap structured
instruments 1,028,987 438,491 1,546,189 675,635
Interest rate swap contracts 470,748 581,824 316,981 478,843
Forward contracts 104,090 (96,203) 88,270 (102,263)
Cross-currency swap contracts (89,975) (49,689) (157,597) (56,100)
Others (55,594) (24,224) (4,795) 77,764
1,767,970 599,649 2,239,371 1,086,175
Unrealized gain (loss) on financial
assets and liabilities at fair value
through profit or loss
Bank debentures (25,342) (105,765) 97,738 (193,427)
Government bonds (2,180) 184,346 61,743 (487,445)
Stocks - (51,751) - (166,018)
Corporate bonds (8,634) (60,004) (7,406) (90,048)
Currency swap contracts and
hybrid FX swap structured
instruments (87,865) 104,431 501,600 257,936
Option contracts (56,741) 7,613 112,412 (110,755)
Forward contracts 113,136 (25,385) 44,798 (67,382)
Interest rate swap contracts (383,227) (105,800) (211,808) 696,805
Others 9,593 261 (31,352) (1,351)
(441,260) (52,054) 567,725 (161,685)
$ 1,326,710 $ 547,595 $ 2,807,096 $ 924,490
Disposal gain or loss included in realized gain or loss on financial assets and liabilities at fair value through
profit were $1,683,551 and $341,745, for the three months ended June 30, 2019 and 2018; $2,076,231 and
$557,978 for the six months ended June 30, 2019 and 2018, respectively. Related interest and dividend
revenues were $84,419 and $257,904 for the three months ended June 30, 2019 and 2018; $163,140 and
$528,197 for the six months ended June 30, 2019 and 2018, respectively.

- 44 -
34. REALIZED GAINS (LOSSES) ON FINANCIAL ASSETS AT FAIR VALUE THROUGH OTHER
COMPREHENSIVE INCOME
For the Three Months Ended
June 30 For the Six Months Ended
June 30
2019 2018 2019 2018
Dividends revenue - holding at the
end of the reporting period $ 77,946 $ 70,870 $ 77,946 $ 70,870
Gain or loss from disposal of bank
debentures 5,775 (1,499) 28,750 (5,152)
$ 83,721 $ 69,371 $ 106,696 $ 65,718
35. OTHER NONINTEREST NET REVENUES
For the Three Months Ended
June 30 For the Six Months Ended
June 30
2019 2018 2019 2018
Rental income $ 23,545 $ 22,127 $ 48,109 $ 43,947
Net gains on disposal of property
and equipment 35,975 - 35,975 -
Operating assets rental income 6,908 7,019 13,881 14,286
Transaction bonus 3,900 3,980 7,550 7,770
Government subsidy - 9,288 - 9,288
Others 9,695 9,290 19,909 20,391
$ 80,023 $ 51,704 $ 125,424 $ 95,682
36. EMPLOYEE BENEFITS EXPENSES
For the Three Months Ended
June 30 For the Six Months Ended
June 30
2019 2018 2019 2018
Salaries and wages $ 1,791,016 $ 1,653,059 $ 3,661,635 $ 3,303,535
Labor insurance and national health
insurance 111,783 103,521 245,424 231,576
Pension costs 81,628 80,502 161,749 160,468
Others 171,339 172,238 345,484 345,512
$ 2,155,766 $ 2,009,320 $ 4,414,292 $ 4,041,091
The Bank’s Articles of Incorporation provide that the Bank shall allocate from annual profit more than
0.5% as employees’ compensation and not more than 1% as remuneration of directors. But if there are
accumulated losses, the Bank should make up for the losses first.
The employees’ compensation and the remuneration of directors recognized were estimated on the basis of
the Bank’s Articles of Incorporation and past experience. The Bank accrued $31,939 and $27,462 as
employees’ compensation and $13,357 and $11,880 as remuneration of directors for the six months ended
June 30, 2019 and 2018.

- 45 -
If there is a change in the proposed amounts after the annual financial statements are authorized for issue,
the differences are recorded as a change in accounting estimate.
The board of directors approved $61,000 as employees’ compensation and $19,523 as remuneration of
directors on January 25, 2019 and March 15, 2019, respectively. These amounts were the same as those
recognized in the financial statements and will be delivered entirely in cash. The Bank’s board of directors
resolved the remuneration of employees, directors and supervisors on behalf of the shareholder on June 21,
2019.
The board of directors approved $51,000 as employees’ compensation and $14,129 as remuneration of
directors on February 2, 2018 and February 23, 2018, respectively. These amounts were the same as those
recognized in the financial statements and will be delivered entirely in cash. The Bank’s board of directors
resolved the remuneration of employees, directors and supervisors on behalf of the shareholder on June 22,
2018.
The information on employees’ compensation and the remuneration of directors is available at the Market
Observation Post System (M.O.P.S.) website of the Taiwan Stock Exchange.
37. DEPRECIATION AND AMORTIZATION EXPENSES
For the Three Months Ended
June 30 For the Six Months Ended
June 30
2019 2018 2019 2018
Depreciation expense
Buildings $ 36,325 $ 35,258 $ 72,667 $ 67,725
Machinery and computer
equipment 39,181 36,486 79,817 73,091
Other equipment 18,821 20,262 37,859 40,176
Leasehold improvements 20,403 26,898 40,931 48,563
Land improvements 2 - 2 -
Right-of-use assets 167,842 - 329,942 -
282,574 118,904 561,218 229,555
Amortization expense 41,826 33,486 80,077 71,809
$ 324,400 $ 152,390 $ 641,295 $ 301,364
38. OTHER OPERATING EXPENSES
For the Three Months Ended
June 30 For the Six Months Ended
June 30
2019 2018 2019 2018
Taxation and fees $ 310,955 $ 290,322 $ 634,847 $ 582,497
Marketing 134,263 114,699 275,610 225,312
Professional advisory 116,316 123,789 259,688 259,295
Location fee 99,210 93,408 190,698 182,848
Automated equipment 97,383 72,655 172,374 130,290
Insurance 70,716 70,169 141,538 140,207
Communications expense 59,508 56,593 119,033 112,962
Rent 19,891 172,328 40,165 345,296
Others 114,637 114,856 217,614 229,117
$ 1,022,879 $ 1,108,819 $ 2,051,567 $ 2,207,824
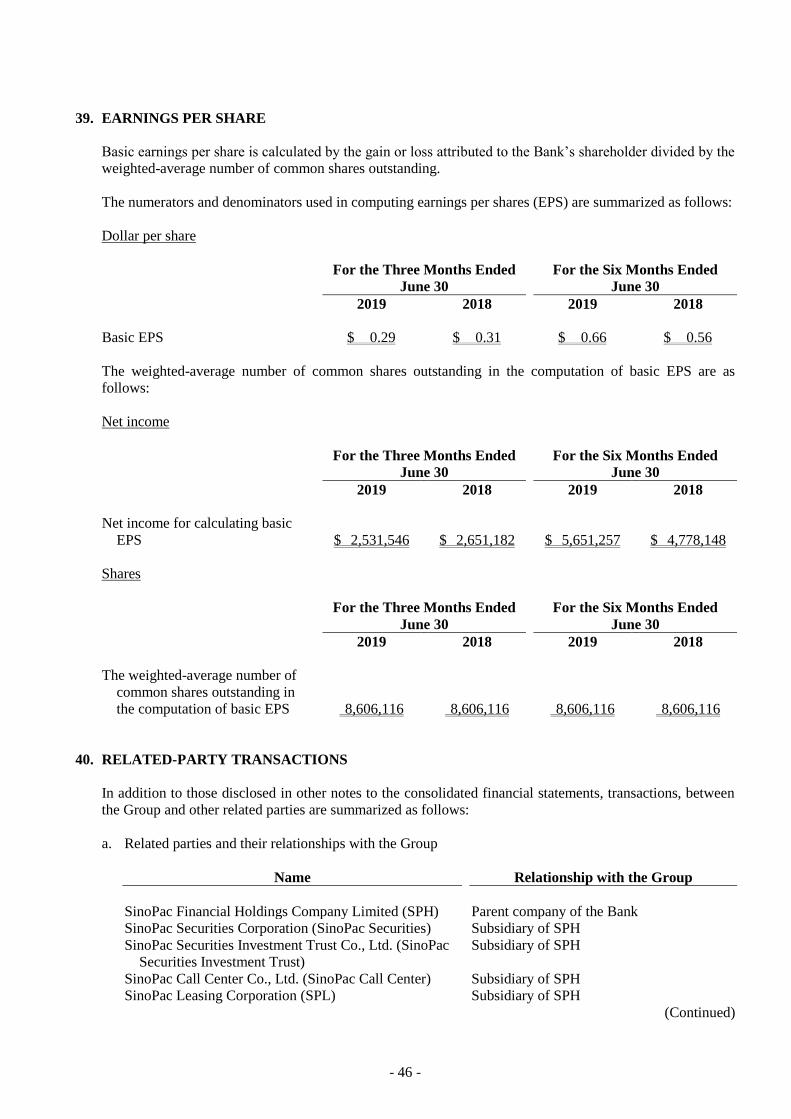
- 46 -
39. EARNINGS PER SHARE
Basic earnings per share is calculated by the gain or loss attributed to the Bank’s shareholder divided by the
weighted-average number of common shares outstanding.
The numerators and denominators used in computing earnings per shares (EPS) are summarized as follows:
Dollar per share
For the Three Months Ended
June 30 For the Six Months Ended
June 30
2019 2018 2019 2018
Basic EPS $ 0.29 $ 0.31 $ 0.66 $ 0.56
The weighted-average number of common shares outstanding in the computation of basic EPS are as
follows:
Net income
For the Three Months Ended
June 30 For the Six Months Ended
June 30
2019 2018 2019 2018
Net income for calculating basic
EPS $ 2,531,546 $ 2,651,182 $ 5,651,257 $ 4,778,148
Shares
For the Three Months Ended
June 30 For the Six Months Ended
June 30
2019 2018 2019 2018
The weighted-average number of
common shares outstanding in
the computation of basic EPS 8,606,116 8,606,116 8,606,116 8,606,116
40. RELATED-PARTY TRANSACTIONS
In addition to those disclosed in other notes to the consolidated financial statements, transactions, between
the Group and other related parties are summarized as follows:
a. Related parties and their relationships with the Group
Name Relationship with the Group
SinoPac Financial Holdings Company Limited (SPH) Parent company of the Bank
SinoPac Securities Corporation (SinoPac Securities) Subsidiary of SPH
SinoPac Securities Investment Trust Co., Ltd. (SinoPac
Securities Investment Trust)
Subsidiary of SPH
SinoPac Call Center Co., Ltd. (SinoPac Call Center) Subsidiary of SPH
SinoPac Leasing Corporation (SPL) Subsidiary of SPH
(Continued)
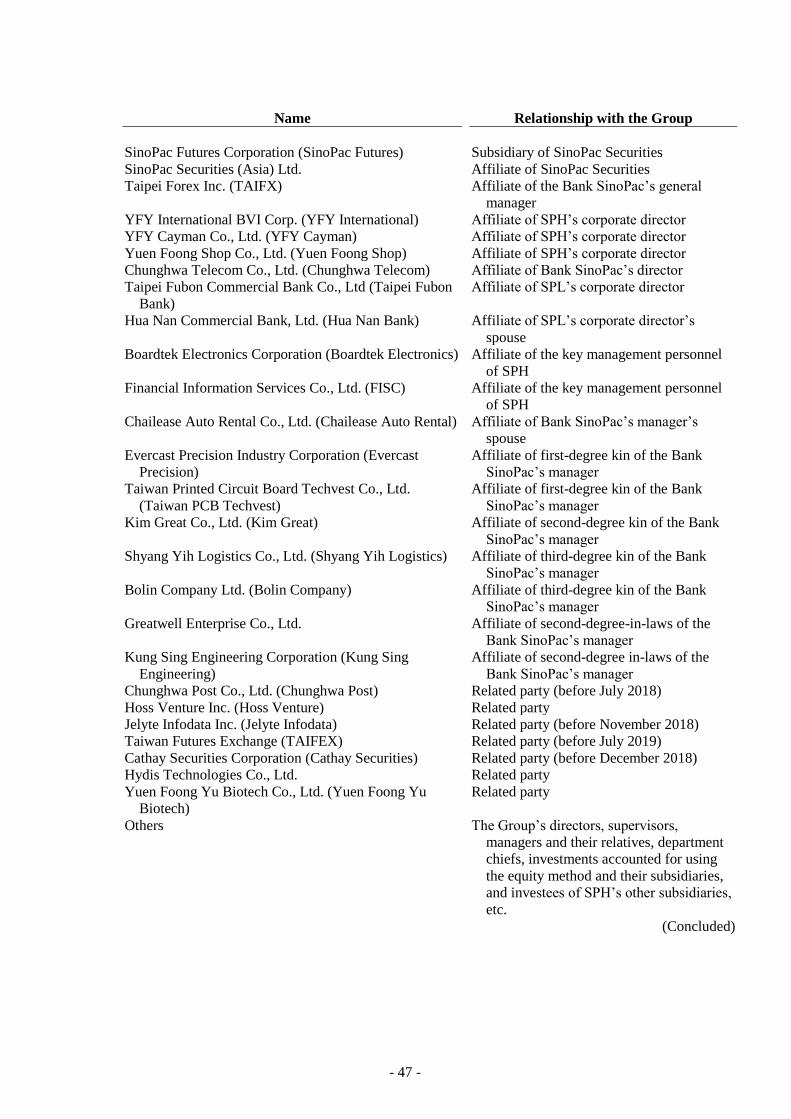
- 47 -
Name Relationship with the Group
SinoPac Futures Corporation (SinoPac Futures) Subsidiary of SinoPac Securities
SinoPac Securities (Asia) Ltd. Affiliate of SinoPac Securities
Taipei Forex Inc. (TAIFX) Affiliate of the Bank SinoPac’s general
manager
YFY International BVI Corp. (YFY International) Affiliate of SPH’s corporate director
YFY Cayman Co., Ltd. (YFY Cayman) Affiliate of SPH’s corporate director
Yuen Foong Shop Co., Ltd. (Yuen Foong Shop) Affiliate of SPH’s corporate director
Chunghwa Telecom Co., Ltd. (Chunghwa Telecom) Affiliate of Bank SinoPac’s director
Taipei Fubon Commercial Bank Co., Ltd (Taipei Fubon
Bank)
Affiliate of SPL’s corporate director
Hua Nan Commercial Bank, Ltd. (Hua Nan Bank) Affiliate of SPL’s corporate director’s
spouse
Boardtek Electronics Corporation (Boardtek Electronics) Affiliate of the key management personnel
of SPH
Financial Information Services Co., Ltd. (FISC) Affiliate of the key management personnel
of SPH
Chailease Auto Rental Co., Ltd. (Chailease Auto Rental) Affiliate of Bank SinoPac’s manager’s
spouse
Evercast Precision Industry Corporation (Evercast
Precision)
Affiliate of first-degree kin of the Bank
SinoPac’s manager
Taiwan Printed Circuit Board Techvest Co., Ltd.
(Taiwan PCB Techvest)
Affiliate of first-degree kin of the Bank
SinoPac’s manager
Kim Great Co., Ltd. (Kim Great) Affiliate of second-degree kin of the Bank
SinoPac’s manager
Shyang Yih Logistics Co., Ltd. (Shyang Yih Logistics) Affiliate of third-degree kin of the Bank
SinoPac’s manager
Bolin Company Ltd. (Bolin Company) Affiliate of third-degree kin of the Bank
SinoPac’s manager
Greatwell Enterprise Co., Ltd. Affiliate of second-degree-in-laws of the
Bank SinoPac’s manager
Kung Sing Engineering Corporation (Kung Sing
Engineering)
Affiliate of second-degree in-laws of the
Bank SinoPac’s manager
Chunghwa Post Co., Ltd. (Chunghwa Post) Related party (before July 2018)
Hoss Venture Inc. (Hoss Venture) Related party
Jelyte Infodata Inc. (Jelyte Infodata) Related party (before November 2018)
Taiwan Futures Exchange (TAIFEX) Related party (before July 2019)
Cathay Securities Corporation (Cathay Securities) Related party (before December 2018)
Hydis Technologies Co., Ltd. Related party
Yuen Foong Yu Biotech Co., Ltd. (Yuen Foong Yu
Biotech)
Related party
Others The Group’s directors, supervisors,
managers and their relatives, department
chiefs, investments accounted for using
the equity method and their subsidiaries,
and investees of SPH’s other subsidiaries,
etc.
(Concluded)

- 48 -
b. Significant transactions with related parties
1) Cash and cash equivalents
June 30, 2019
December 31,
2018 June 30, 2018
Due from banks
Chunghwa Post $ - $ - $ 1,679
2) Due from the Central Bank and call loans to other banks
For the Six Months Ended June 30, 2019
Ending
Balance Interest (%)
Interest
Revenue
Call loans to banks
Taipei Fubon Bank $ - 2.3%-2.91% $ 5,568
Hua Nan Bank 293,923 1.2%-4.9% 1,974
For the Year Ended December 31, 2018
Ending
Balance Interest (%)
Interest
Revenue
Call loans to banks
Taipei Fubon Bank $ 922,544 0.05%-4.10% $ 18,635
For the Six Months Ended June 30, 2018
Ending
Balance Interest (%)
Interest
Revenue
Call loans to banks
Taipei Fubon Bank $ 1,435,702 0.05%-4.10% $ 5,499
3) Derivative financial instruments
June 30, 2019
Contract
(Notional)
Amount
Contract
Period
Valuation
Gains or Losses Account Balance
Interest rate swap contracts
SinoPac Securities $ 900,000 2014.10.2- 2020.8.26
$ (2,442 ) Financial assets at fair value through profit or loss
$ 3,681
SinoPac Securities 300,000 2015.9.1-
2020.9.1
494 Financial liabilities at fair
value through profit or loss
1,350
Forward contracts
YFY International 466,190 2019.5.24-
2019.7.31
1,929 Financial assets at fair value
through profit or loss
1,929
YFY International 621,587 2019.5.9-
2019.7.22
(5,461 ) Financial liabilities at fair
value through profit or loss
5,461
YFY Cayman 621,587 2019.5.24- 2019.7.31
3,245 Financial assets at fair value through profit or loss
3,245
YFY Cayman 1,553,967 2019.5.2-
2019.7.24
(15,046 ) Financial liabilities at fair
value through profit or loss
15,046
Boardtek Electronics 31,079 2019.5.8-
2019.7.10
295 Financial assets at fair value
through profit or loss
295
Boardtek Electronics 31,079 2019.6.4- 2019.8.2
(319 ) Financial liabilities at fair value through profit or loss
319
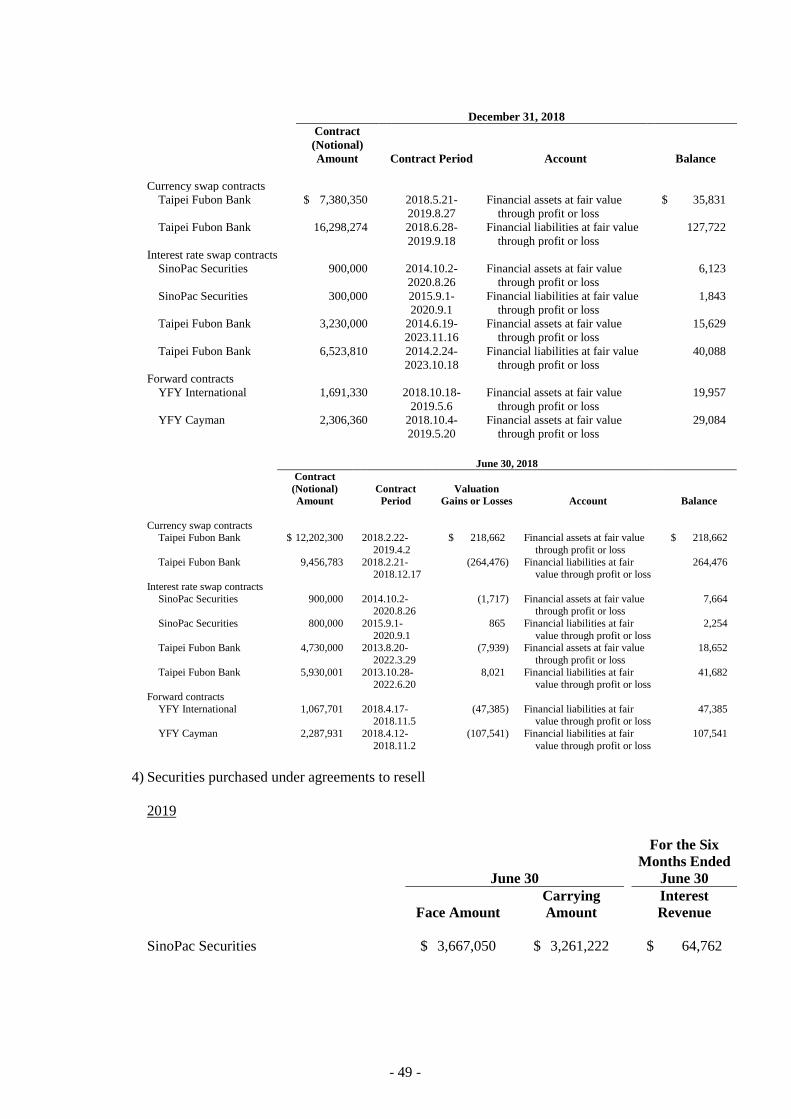
- 49 -
December 31, 2018
Contract
(Notional)
Amount Contract Period Account Balance
Currency swap contracts
Taipei Fubon Bank $ 7,380,350 2018.5.21-
2019.8.27
Financial assets at fair value
through profit or loss
$ 35,831
Taipei Fubon Bank 16,298,274 2018.6.28-
2019.9.18
Financial liabilities at fair value
through profit or loss
127,722
Interest rate swap contracts
SinoPac Securities 900,000 2014.10.2-
2020.8.26
Financial assets at fair value
through profit or loss
6,123
SinoPac Securities 300,000 2015.9.1-
2020.9.1
Financial liabilities at fair value
through profit or loss
1,843
Taipei Fubon Bank 3,230,000 2014.6.19-
2023.11.16
Financial assets at fair value
through profit or loss
15,629
Taipei Fubon Bank 6,523,810 2014.2.24-
2023.10.18
Financial liabilities at fair value
through profit or loss
40,088
Forward contracts
YFY International 1,691,330 2018.10.18-
2019.5.6
Financial assets at fair value
through profit or loss
19,957
YFY Cayman 2,306,360 2018.10.4-
2019.5.20
Financial assets at fair value
through profit or loss
29,084
June 30, 2018
Contract
(Notional)
Amount
Contract
Period
Valuation
Gains or Losses Account Balance
Currency swap contracts Taipei Fubon Bank $ 12,202,300 2018.2.22-
2019.4.2
$ 218,662 Financial assets at fair value
through profit or loss
$ 218,662
Taipei Fubon Bank 9,456,783 2018.2.21- 2018.12.17
(264,476 ) Financial liabilities at fair value through profit or loss
264,476
Interest rate swap contracts
SinoPac Securities 900,000 2014.10.2- 2020.8.26
(1,717 ) Financial assets at fair value through profit or loss
7,664
SinoPac Securities 800,000 2015.9.1-
2020.9.1
865 Financial liabilities at fair
value through profit or loss
2,254
Taipei Fubon Bank 4,730,000 2013.8.20-
2022.3.29
(7,939 ) Financial assets at fair value
through profit or loss
18,652
Taipei Fubon Bank 5,930,001 2013.10.28- 2022.6.20
8,021 Financial liabilities at fair value through profit or loss
41,682
Forward contracts
YFY International 1,067,701 2018.4.17- 2018.11.5
(47,385 ) Financial liabilities at fair value through profit or loss
47,385
YFY Cayman 2,287,931 2018.4.12-
2018.11.2
(107,541 ) Financial liabilities at fair
value through profit or loss
107,541
4) Securities purchased under agreements to resell
2019
June 30
For the Six
Months Ended
June 30
Face Amount Carrying
Amount Interest
Revenue
SinoPac Securities $ 3,667,050 $ 3,261,222 $ 64,762

- 50 -
2018
December 31
Face Amount Carrying
Amount
SinoPac Securities $ 4,446,661 $ 3,963,434
2018
June 30
For the Six
Months Ended
June 30
Face Amount Carrying
Amount Interest
Revenue
SinoPac Securities $ 2,275,729 $ 2,033,536 $ 3,035
5) Receivables and payables
June 30, 2019
December 31,
2018 June 30, 2018
Receivables $ 58,717 $ 16,363 $ 57,848
Payables $ 40,277 $ 44,139 $ 50,533
Cash dividends payable to SPH $ 1,435,025 $ 1,435,025 $ 6,839,244
6) Current tax assets and liabilities
June 30, 2019
December 31,
2018 June 30, 2018
Receivables from adopting the linked-tax
system $ 1,276,102 $ 1,276,102 $ 1,273,998
Payables from adopting the linked-tax
system $ 472,429 $ 272,975 $ 262,421
7) Loans
For the Six Months Ended June 30, 2019
Ending
Balance
Highest
Balance
Interest/
Fee Rates (%)
Interest
Revenue
Loans $ 9,001,577 $ 9,519,872 0-11.99 $ 67,810

- 51 -
Category
June 30, 2019
Account Volume
or Name of
Related Party
Highest
Balance
Ending
Balance Normal Overdue Type of Collaterals
Is the
Transaction
at Arm’s
Length
Commercial
Term
Employees’ consumer
loans
314 $ 486,165 $ 455,650 V - None Yes
Household mortgage loans
1,001 4,960,766 4,743,730 V - Real estate Yes
Others:
SPL 900,000 900,000 V - Real estate Yes
Boardtek
Electronics
600,000 600,000 V - Real estate Yes
Evercast Precision 70,955 47,901 V - Real estate Yes
Hoss Venture 30,000 30,000 V - Real estate Yes
Taiwan PCB
Techvest
19,938 16,313 V - None, Note 1 Yes
Kim Great 18,721 18,004 V - Real estate Yes
Greatwell
Enterprise Co.,
Ltd.
8,200 8,200 V - Real estate Yes
Shyang Yih Logistics
493 267 V - Vehicle Yes
Others 2,424,634 2,181,512 V - Certificates of
deposit, certificates of fund and real
estate
Yes
Others subtotal 4,072,941 3,802,197
Total $ 9,519,872 $ 9,001,577
For the Year Ended December 31, 2018
Ending
Balance
Highest
Balance
Interest/
Fee Rates (%)
Loans $ 8,692,573 $ 9,696,429 0-8.66
Category
December 31, 2018
Account Volume
or Name of
Related Party
Highest
Balance
Ending
Balance Normal Overdue Type of Collaterals
Is the
Transaction
at Arm’s
Length
Commercial
Term
Employees’ consumer
loans
450 $ 187,307 $ 137,893 V - None Yes
Household mortgage
loans
1,369 7,736,223 7,072,522 V - Real estate Yes
Others:
SPL 900,000 900,000 V - Real estate Yes
Boardtek
Electronics
450,000 450,000 V - Real estate Yes
Taiwan PCB
Techvest
216,857 19,938 V - None, Note 1 Yes
Evercast Precision 39,034 36,955 V - Real estate Yes
Hoss Venture 30,000 30,000 V - Real estate Yes
Bolin Company 26,400 - V - Real estate Yes
Kim Great 20,129 18,721 V - Real estate Yes
Greatwell Enterprise Co.,
Ltd.
8,200 8,200 V - Real estate Yes
Kung Sing
Engineering
6,323 - V - None, Note 1 Yes
Shyang Yih
Logistics
936 493 V - Vehicle Yes
Others 75,020 17,851 V - Vehicle, certificates
of deposit, certificates of fund
and real estate
Yes
Others subtotal 1,772,899 1,482,158
Total $ 9,696,429 $ 8,692,573
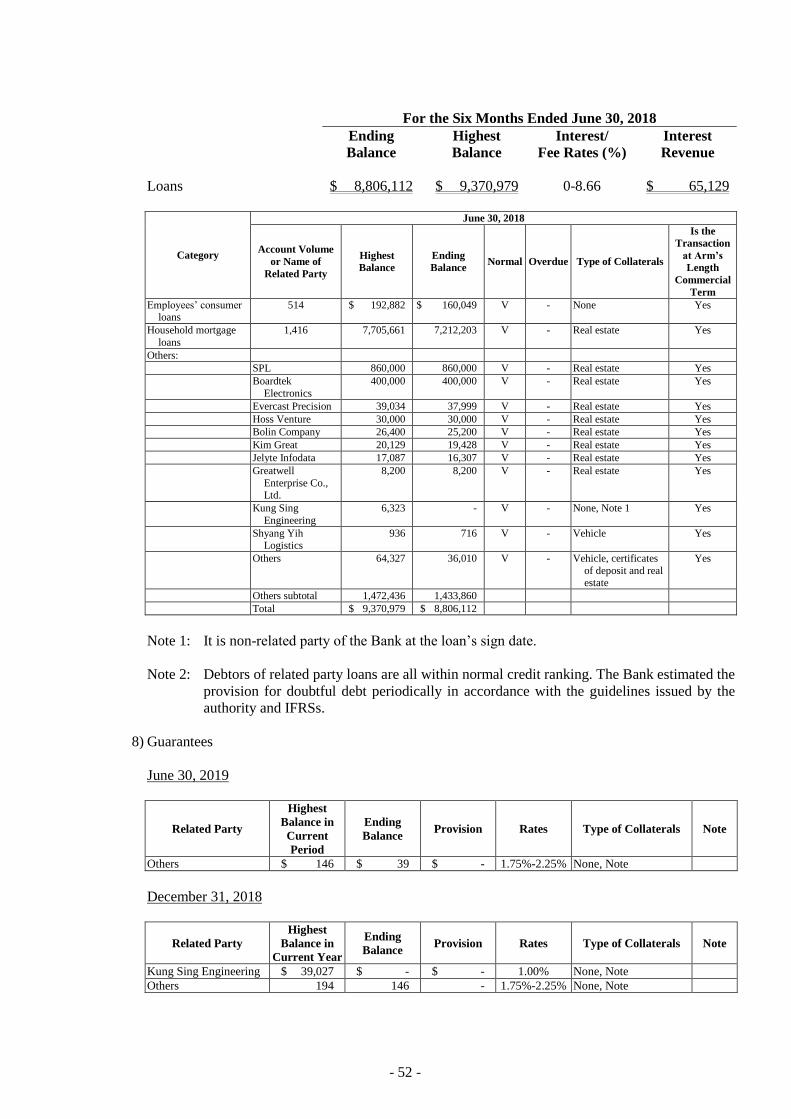
- 52 -
For the Six Months Ended June 30, 2018
Ending
Balance
Highest
Balance
Interest/
Fee Rates (%)
Interest
Revenue
Loans $ 8,806,112 $ 9,370,979 0-8.66 $ 65,129
Category
June 30, 2018
Account Volume
or Name of
Related Party
Highest
Balance
Ending
Balance Normal Overdue Type of Collaterals
Is the
Transaction
at Arm’s
Length
Commercial
Term
Employees’ consumer loans
514 $ 192,882 $ 160,049 V - None Yes
Household mortgage
loans
1,416 7,705,661 7,212,203 V - Real estate Yes
Others:
SPL 860,000 860,000 V - Real estate Yes
Boardtek
Electronics
400,000 400,000 V - Real estate Yes
Evercast Precision 39,034 37,999 V - Real estate Yes
Hoss Venture 30,000 30,000 V - Real estate Yes
Bolin Company 26,400 25,200 V - Real estate Yes
Kim Great 20,129 19,428 V - Real estate Yes
Jelyte Infodata 17,087 16,307 V - Real estate Yes
Greatwell
Enterprise Co., Ltd.
8,200 8,200 V - Real estate Yes
Kung Sing
Engineering
6,323 - V - None, Note 1 Yes
Shyang Yih Logistics
936 716 V - Vehicle Yes
Others 64,327 36,010 V - Vehicle, certificates
of deposit and real estate
Yes
Others subtotal 1,472,436 1,433,860
Total $ 9,370,979 $ 8,806,112
Note 1: It is non-related party of the Bank at the loan’s sign date.
Note 2: Debtors of related party loans are all within normal credit ranking. The Bank estimated the
provision for doubtful debt periodically in accordance with the guidelines issued by the
authority and IFRSs.
8) Guarantees
June 30, 2019
Related Party
Highest
Balance in
Current
Period
Ending
Balance Provision Rates Type of Collaterals Note
Others $ 146 $ 39 $ - 1.75%-2.25% None, Note
December 31, 2018
Related Party
Highest
Balance in
Current Year
Ending
Balance Provision Rates Type of Collaterals Note
Kung Sing Engineering $ 39,027 $ - $ - 1.00% None, Note
Others 194 146 - 1.75%-2.25% None, Note
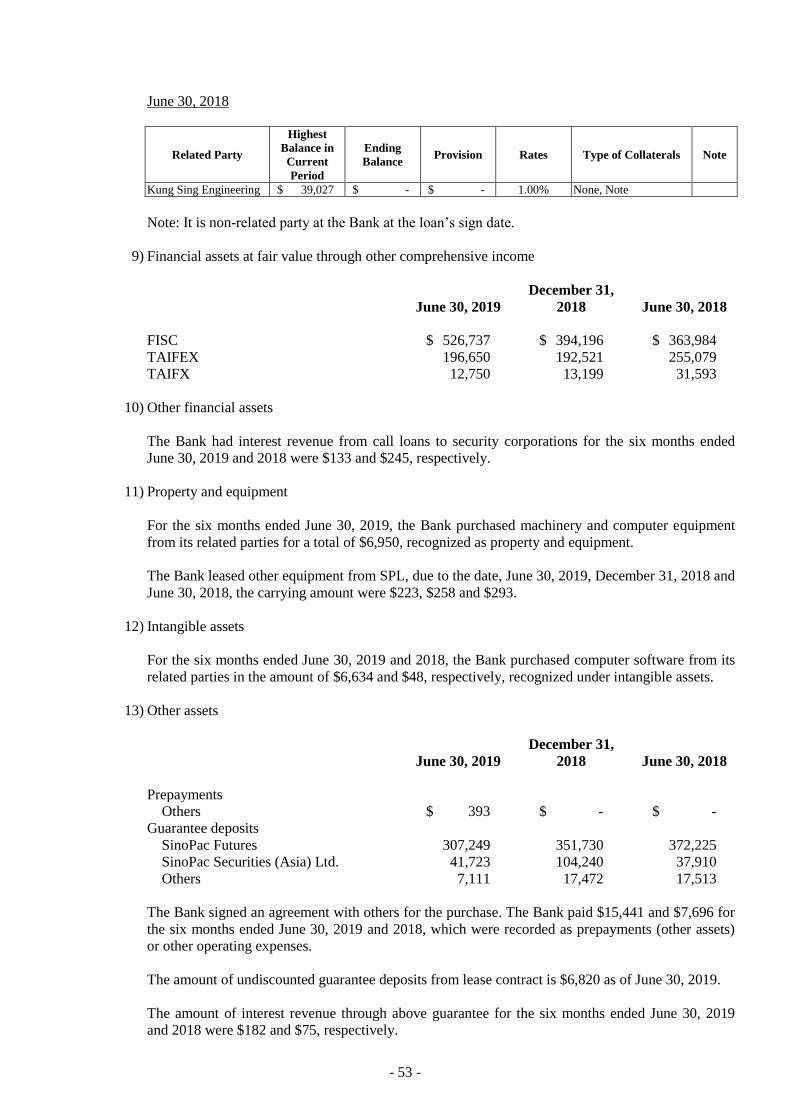
- 53 -
June 30, 2018
Related Party
Highest
Balance in
Current
Period
Ending
Balance Provision Rates Type of Collaterals Note
Kung Sing Engineering $ 39,027 $ - $ - 1.00% None, Note
Note: It is non-related party at the Bank at the loan’s sign date.
9) Financial assets at fair value through other comprehensive income
June 30, 2019 December 31,
2018 June 30, 2018
FISC $ 526,737 $ 394,196 $ 363,984
TAIFEX 196,650 192,521 255,079
TAIFX 12,750 13,199 31,593
10) Other financial assets
The Bank had interest revenue from call loans to security corporations for the six months ended
June 30, 2019 and 2018 were $133 and $245, respectively.
11) Property and equipment
For the six months ended June 30, 2019, the Bank purchased machinery and computer equipment
from its related parties for a total of $6,950, recognized as property and equipment.
The Bank leased other equipment from SPL, due to the date, June 30, 2019, December 31, 2018 and
June 30, 2018, the carrying amount were $223, $258 and $293.
12) Intangible assets
For the six months ended June 30, 2019 and 2018, the Bank purchased computer software from its
related parties in the amount of $6,634 and $48, respectively, recognized under intangible assets.
13) Other assets
June 30, 2019
December 31,
2018 June 30, 2018
Prepayments
Others $ 393 $ - $ -
Guarantee deposits
SinoPac Futures 307,249 351,730 372,225
SinoPac Securities (Asia) Ltd. 41,723 104,240 37,910
Others 7,111 17,472 17,513
The Bank signed an agreement with others for the purchase. The Bank paid $15,441 and $7,696 for
the six months ended June 30, 2019 and 2018, which were recorded as prepayments (other assets)
or other operating expenses.
The amount of undiscounted guarantee deposits from lease contract is $6,820 as of June 30, 2019.
The amount of interest revenue through above guarantee for the six months ended June 30, 2019
and 2018 were $182 and $75, respectively.

- 54 -
14) Notes and bonds transaction
For the Six Months Ended
June 30, 2019
Purchase of
Notes and
Bonds
Sell of Notes
and Bonds
Hua Nan Bank $ 2,701,671 $ 2,705,613
Chailease Auto Rental 199,928 199,993
SPL 99,962 99,995
SinoPac Securities - 4,800,000
For the Six Months Ended
June 30, 2018
Purchase of
Notes and
Bonds
Sell of Notes
and Bonds
Taipei Fubon Bank $ 14,621,178 $ 12,625,485
Chunghwa Post - 3,235,943
Cathay Securities - 1,649,927
15) Deposits from the Central Bank and other banks
2019
June 30
For the Six
Months Ended
June 30
Ending Balance Interest Rates
(%) Interest
Expense
Taipei Fubon Bank $ - 0.05-4.4 $ 898
Hua Nan Bank 621,587 0.7-3.8 2,915
2018
For the Year Ended
December 31, 2018
Ending Balance Interest Rates
(%)
Taipei Fubon Bank $ 800,043 0.05-4.8
Chunghwa Post - 0.001-1.11
June 30
For the Six
Months Ended
June 30
Ending Balance Interest Rates
(%) Interest
Expense
Taipei Fubon Bank $ 2,370,391 1.47-4.40 $ 11,345
Chunghwa Post 819,936 0.001-1.11 5,460
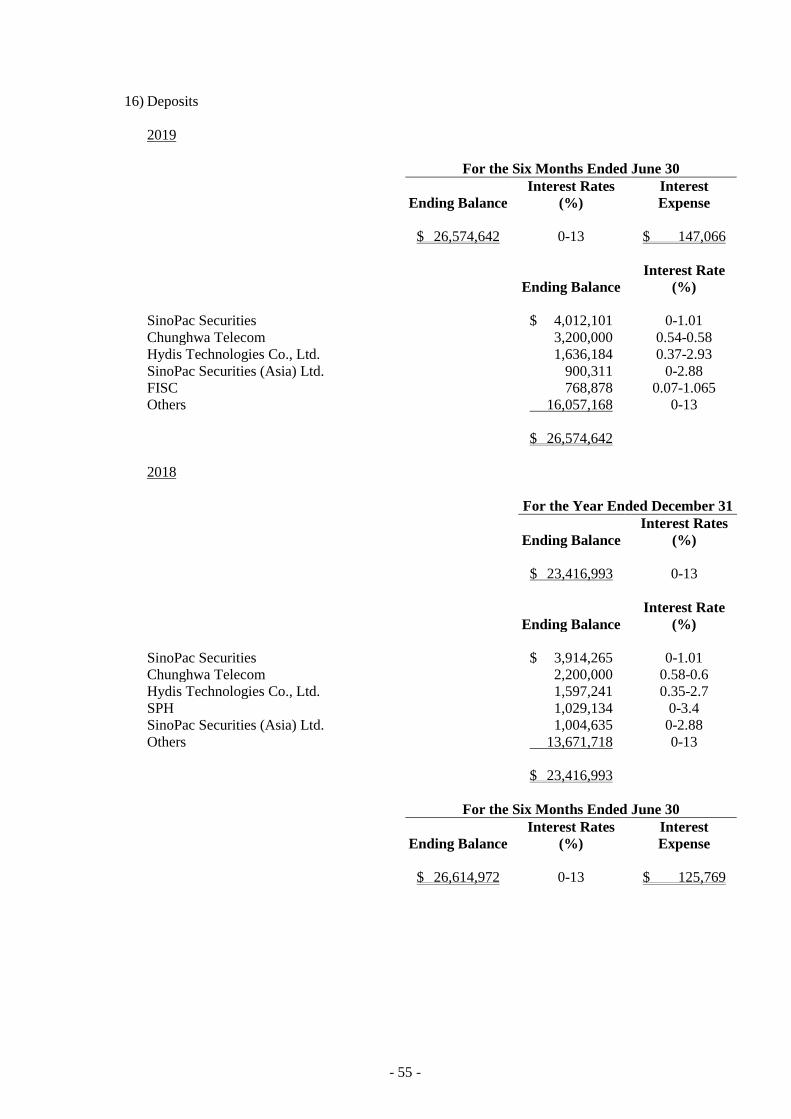
- 55 -
16) Deposits
2019
For the Six Months Ended June 30
Ending Balance Interest Rates
(%) Interest
Expense
$ 26,574,642 0-13 $ 147,066
Interest Rate
Ending Balance (%)
SinoPac Securities $ 4,012,101 0-1.01
Chunghwa Telecom 3,200,000 0.54-0.58
Hydis Technologies Co., Ltd. 1,636,184 0.37-2.93
SinoPac Securities (Asia) Ltd. 900,311 0-2.88
FISC 768,878 0.07-1.065
Others 16,057,168 0-13
$ 26,574,642
2018
For the Year Ended December 31
Ending Balance Interest Rates
(%)
$ 23,416,993 0-13
Interest Rate
Ending Balance (%)
SinoPac Securities $ 3,914,265 0-1.01
Chunghwa Telecom 2,200,000 0.58-0.6
Hydis Technologies Co., Ltd. 1,597,241 0.35-2.7
SPH 1,029,134 0-3.4
SinoPac Securities (Asia) Ltd. 1,004,635 0-2.88
Others 13,671,718 0-13
$ 23,416,993
For the Six Months Ended June 30
Ending Balance Interest Rates
(%) Interest
Expense
$ 26,614,972 0-13 $ 125,769
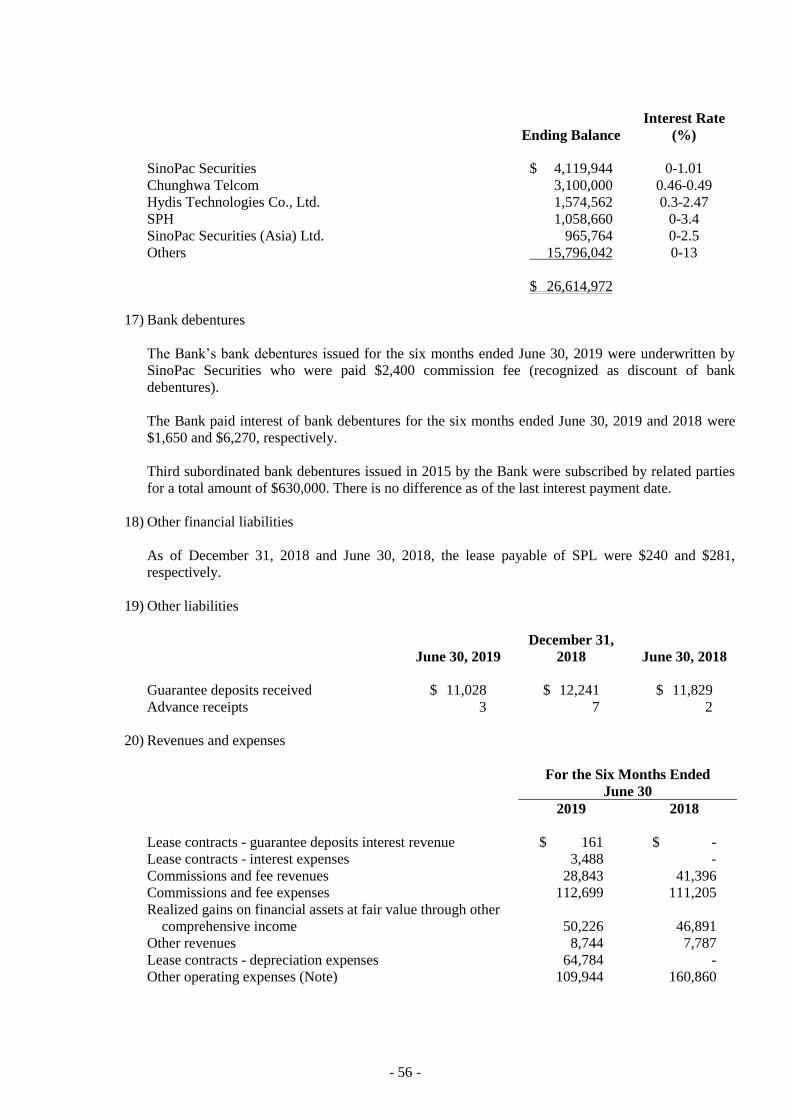
- 56 -
Interest Rate
Ending Balance (%)
SinoPac Securities $ 4,119,944 0-1.01
Chunghwa Telcom 3,100,000 0.46-0.49
Hydis Technologies Co., Ltd. 1,574,562 0.3-2.47
SPH 1,058,660 0-3.4
SinoPac Securities (Asia) Ltd. 965,764 0-2.5
Others 15,796,042 0-13
$ 26,614,972
17) Bank debentures
The Bank’s bank debentures issued for the six months ended June 30, 2019 were underwritten by
SinoPac Securities who were paid $2,400 commission fee (recognized as discount of bank
debentures).
The Bank paid interest of bank debentures for the six months ended June 30, 2019 and 2018 were
$1,650 and $6,270, respectively.
Third subordinated bank debentures issued in 2015 by the Bank were subscribed by related parties
for a total amount of $630,000. There is no difference as of the last interest payment date.
18) Other financial liabilities
As of December 31, 2018 and June 30, 2018, the lease payable of SPL were $240 and $281,
respectively.
19) Other liabilities
June 30, 2019
December 31,
2018 June 30, 2018
Guarantee deposits received $ 11,028 $ 12,241 $ 11,829
Advance receipts 3 7 2
20) Revenues and expenses
For the Six Months Ended
June 30
2019 2018
Lease contracts - guarantee deposits interest revenue $ 161 $ -
Lease contracts - interest expenses 3,488 -
Commissions and fee revenues 28,843 41,396
Commissions and fee expenses 112,699 111,205
Realized gains on financial assets at fair value through other
comprehensive income 50,226 46,891
Other revenues 8,744 7,787
Lease contracts - depreciation expenses 64,784 -
Other operating expenses (Note) 109,944 160,860

- 57 -
Note: Other operating expenses are mainly for professional advisory charges and marketing
expenses. The Bank entered into professional advisory contracts with SinoPac Call Center,
and the professional advisory charges and other operating expenses paid for the three
months and six months ended June 30, 2019 and 2018 were $12,769, $38,448, $50,043 and
$77,651, respectively.
21) Operating lease
The Group as a lessee
a) Right-of-use assets, net
The Group are in contract with SPL and others. The amount of right-of-use assets, net is
$95,669 on June 30, 2019.
b) Lease liabilities
The Group are in contract with SPL and others. The amount of lease liabilities is $96,707 on
June 30, 2019.
c) Guarantee deposits - 2019
Please refer to Note 40,b.13).
d) The guarantee deposits interest revenue, lease interest expense, lease depreciation expense and
other lease expense (recognized as other operating expense), please refer to Note 40,b.20).
e) Operating lease - 2018
Other
Operating
Expense
Lessor
For the Six
Months Ended
June 30, 2018 Lease Term Payment Frequency
SPL $ 62,345 February 2020 Rentals paid monthly
Others 919 January 2021 Rentals paid quarterly or monthly
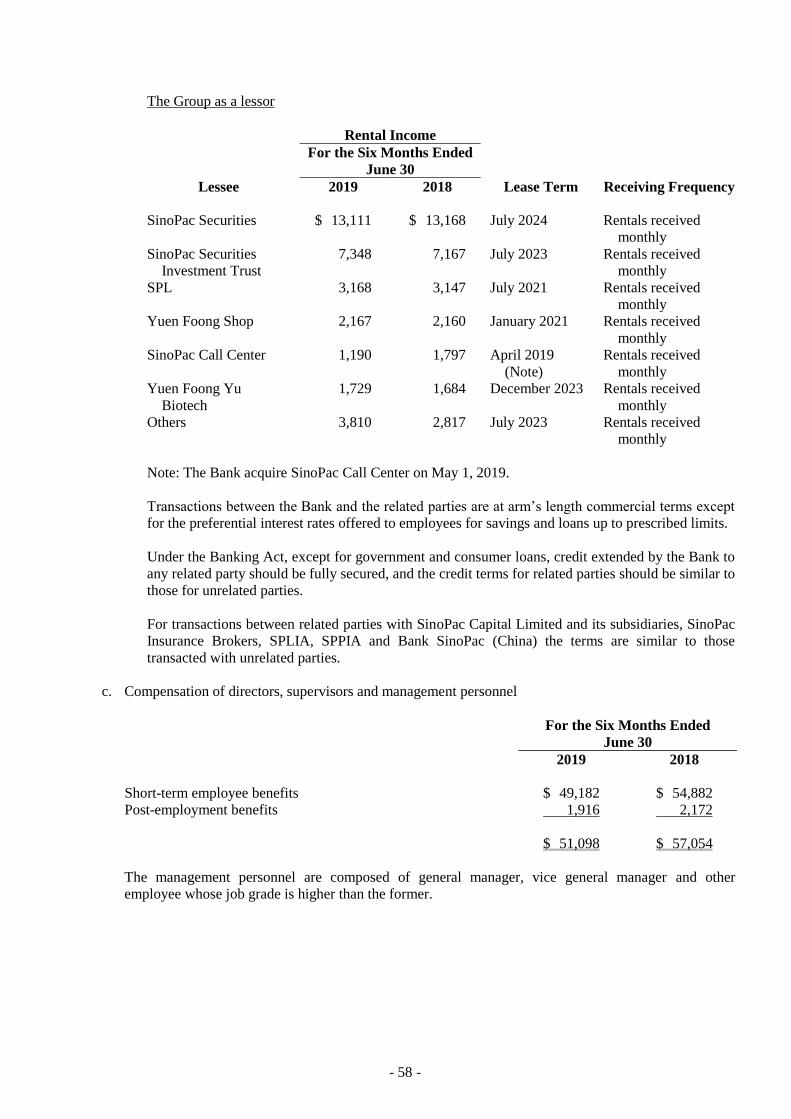
- 58 -
The Group as a lessor
Rental Income
For the Six Months Ended
June 30
Lessee 2019 2018 Lease Term Receiving Frequency
SinoPac Securities $ 13,111 $ 13,168 July 2024 Rentals received
monthly
SinoPac Securities
Investment Trust
7,348 7,167 July 2023 Rentals received
monthly
SPL 3,168 3,147 July 2021 Rentals received
monthly
Yuen Foong Shop 2,167 2,160 January 2021 Rentals received
monthly
SinoPac Call Center 1,190 1,797 April 2019
(Note)
Rentals received
monthly
Yuen Foong Yu
Biotech
1,729 1,684 December 2023 Rentals received
monthly
Others 3,810 2,817 July 2023 Rentals received
monthly
Note: The Bank acquire SinoPac Call Center on May 1, 2019.
Transactions between the Bank and the related parties are at arm’s length commercial terms except
for the preferential interest rates offered to employees for savings and loans up to prescribed limits.
Under the Banking Act, except for government and consumer loans, credit extended by the Bank to
any related party should be fully secured, and the credit terms for related parties should be similar to
those for unrelated parties.
For transactions between related parties with SinoPac Capital Limited and its subsidiaries, SinoPac
Insurance Brokers, SPLIA, SPPIA and Bank SinoPac (China) the terms are similar to those
transacted with unrelated parties.
c. Compensation of directors, supervisors and management personnel
For the Six Months Ended
June 30
2019 2018
Short-term employee benefits $ 49,182 $ 54,882
Post-employment benefits 1,916 2,172
$ 51,098 $ 57,054
The management personnel are composed of general manager, vice general manager and other
employee whose job grade is higher than the former.

- 59 -
41. PLEDGED OR MORTGAGED ASSETS
In addition to those disclosed in other notes, pledged or restricted assets of the Group are summarized as
follows:
Restricted Assets Object June 30, 2019
December 31,
2018 June 30, 2018 Purposes
Investment in debt instruments
measured at amortized cost
Certificate of deposits $ 8,155,397 $ 5,153,757 $ 8,152,529 Note 1
Investment in debt instruments
measured at amortized cost
Government bonds 1,404,177 1,674,078 1,616,691 Note 2
Discounts and loans Loans 2,338,539 3,113,555 3,706,022 Note 3
Other financial assets Certificates of deposits 2,713,134 2,685,720 2,760,006 Note 4
Note 1: Pledged in accordance with the Central Bank for foreign-exchange, with the Mega Bank for USD
foreign-exchange settlement and with requirements of the California Department of Financial
Institutions.
Note 2: Guarantees of dealing and underwriting business, a trust reserve fund, guarantees of bills financial
service, reserve for payment of VISA international card, pledged to court as collaterals for filing
provisional seizure and disposition, Hong Kong branch’s clearing system of real-time gross
settlement and mortgage of derivative instrument outstanding.
Note 3: Pledged with the Federal Reserve Bank under the discount window program.
Note 4: Pledged with intraday overdraft of settlement banks.
42. SIGNIFICANT CONTINGENT LIABILITIES AND UNRECOGNIZED COMMITMENTS
a. In addition to those disclosed in other notes, significant unrecognized commitments of the Group as of
June 30, 2019, December 31, 2018 and June 30, 2018 were as follows:
June 30, 2019
December 31,
2018 June 30, 2018
Trust assets $ 407,043,274 $ 292,990,512 $ 264,766,757
Securities under custody 151,474,416 147,845,328 148,884,111
Agent for government bonds 77,925,700 46,772,200 28,388,600
Receipts under custody 30,479,020 31,876,430 33,698,519
Guarantee notes payable 11,986,331 9,063,977 12,215,735
Agent for marketable securities under custody 9,207,100 9,412,200 4,274,300
Appointment of investment 3,286,851 3,612,119 4,057,404
Goods under custody 1,125,794 1,295,570 1,149,046
Travelers’ checks consigned-in 179,001 189,626 194,078
Others - 3,299 5,028
Entrusted loan - - 28,903
As of June 30, 2019, in addition to abovementioned unrecognized commitments, the Bank and SinoPac
Securities had applied for tax concessions to Ministry of Finance regarding their technical support
service expenditure relating to the financial transaction system, and had jointly signed to the system
manufacturer the letter of indemnity of which the total compensation is not more than US$1,300
thousand to obtain the proxy of the manufacturer thereof to apply for foresaid tax concession. The
compensation distributable to the Bank is US$867 thousand and to SinoPac Securities is US$433
thousand. The deadline of compensation guarantee period is December 31, 2027.

- 60 -
In response to the development of technology, the Bank signed with National Cheng Kung University
an enterprise and industry cooperation and donation agreement with budget amount of $120,000. The
donation will be used to build a research center for developing AI depth learning and big data
application about FinTech. The cooperation agreement was signed on August 7, 2017, and is valid
retrospectively from July 1, 2017. Except when the two parties agreed to extend the maturity date, the
agreement is valid from July 1, 2017 to September 30, 2020. As of June 30, 2019, the Bank recognized
operating expense in the amount of $111,000 and related payable in the amount of $42,482.
b. The Group entered into contracts to buy computers and office equipment for $685,300 of which
$539,664 had not been paid as of June 30, 2019.
c. Contingencies
1) The Securities and Futures Investors Protection Center (SFIPC) filed a lawsuit against the Bank and
SinoPac Leasing Corporation’s (SPL) subsidiary, Grand Capital (renamed as SinoPac Capital
International Limited on October 4, 2018) on the ground that Procomp Informatics Ltd. (Procomp)
deposited US$10,000 thousand in the Bank’s Shisung Branch (formally Sungshan Branch) and
placed a restriction on the use of this deposit as a condition for a short-term loan to Addie
International Limited granted by SPL and for allegedly helping Yeh, Sue-Fei and Procomp do
irregular trading and, at the same time, Procomp used the restricted deposit for fictitious sale
transactions. Later, when problems on Procomp’s account arose, the Bank and Grand Cathay
demanded compensation, which was taken from Procomp’s account, resulting in damage to
Procomp. The Bank was suspected of misleading investors by concealing the restricted status of
Procomp’s deposit and window dressing Procomp’s financial statements. On behalf of investors, the
SFIPC filed a lawsuit against the Bank, SPL and all other parties related to Procomp for $4,207,212.
Both the courts of the first instance and the second instance ruled in favor of the Bank and SinoPac
Leasing. However, the SFIPC decided to file an appeal on January 20, 2016. The Supreme Court
reversed the declared judgment on July 26, 2017 and remanded the case to Taiwan High Court. The
case is still under process. The SFIPC reduced their declaration to $4,161,219 because it reached an
accord with part of the defendants and some investors withdrew their right to litigation. The Bank
and SinoPac Leasing filed the appeal to Taiwan High Court on May 7, 2019. However, the SFIPC
decided to file an appeal on June 6, 2019.
2) The SFIPC filed a lawsuit against the Bank on the ground that the Bank’s Tunpei Branch provided
National Aerospace Fasteners Corporation (NAFC) with its accounts receivable factoring services.
NAFC recorded this significant-amount loan transaction as an accounts receivable financing to
window-dress its financial position in order to attract investments. The SFIPC filed a lawsuit against
the Bank and other parties and demanded a compensation of approximately $543,233; the court of
the first instance ruled in favor of the Bank. However, the SFIPC decided to file an appeal for the
second instance and stated to reduce the amount of compensation to $293,940 on November 13,
2015; Taiwan High Court ruled in favor of the Bank on December 13, 2016. Nevertheless, the
SFIPC filed another appeal to the Supreme Court on January 6, 2017. Supreme Court ruled in favor
of the Bank on June 13, 2019. The case is affirmed.
3) The Bank dealt with Skwentex International Corporation (Skwentex) regarding Skwentex’s
receivables from Siltrontech Electronics Corporation. The relevant accounts receivable transaction
involved suspected false cycle trading and was investigated by the Taiwan New Taipei District
Prosecutors in 2015. This case was still under process by the Taiwan New Taipei District
Prosecutors in 2016. Due to the abnormal and suspected unlawful accounts receivable transaction,
the Bank cannot pay the consideration of accounts receivable to Skwentex in accordance with the
credit contract. Skwentex sued the Bank in July 2017 and demanded a compensation of $214,471.
This case was still under process.
- 61 -
43. HIERARCHY AND FAIR VALUE INFORMATION OF FINANCIAL INSTRUMENTS
a. The definition of the hierarchy:
1) Level one
Level 1 financial instruments are traded in active market and have the identical price for the same
financial instruments. “Active market” should fit the following characteristics:
a) All financial instruments in the market are homogeneous;
b) Willing buyers and sellers exist in the market all the time;
c) The public can access the price information easily.
2) Level two
The products categorized in this level have the prices that can be inferred from either direct or
indirect observable inputs other than the active market’s prices. Examples of these inputs are:
a) Quoted prices from the similar products in the active market. This means the fair value can be
derived from the current trading prices of similar products. It is also noted that whether they are
similar products should be judged by the characteristics and trading rules. The fair value
valuation in this circumstance may make some adjustment due to time lags, trading rule’s
differences, related parties’ prices, and the correlation of price between itself and the similar
instruments.
b) Quoted prices for identical or similar financial instruments in inactive markets.
c) When marking-to-model, the input of model in this level should be observable (such as interest
rates, yield curves and volatilities). The observable inputs mean that they can be attained from
market and can reflect the expectation of market participants.
d) Inputs which can be derived from other observable prices or whose correlation can be verified
through other observable market data.
3) Level three
The fair prices of the products in this level are based on the inputs other than the direct market data.

- 62 -
b. Financial instrument measured at fair value
1) Hierarchy information of fair value of financial instruments
Financial Instruments Measured at Fair Value June 30, 2019
Total Level 1 Level 2 Level 3
Measured on a recurring basis
Non-derivative financial instruments
Assets
Financial assets at fair value through profit or loss
Financial assets mandatorily classified as at FVTPL Bonds $ 41,560,371 $ 37,042,360 $ 2,093,224 $ 2,424,787
Others 2,235,659 - 2,235,659 -
Financial assets at fair value through other comprehensive income
Equity instruments at FVTOCI
Stocks and others 2,145,057 - 1,000,000 1,145,057 Debt instruments at FVTOCI
Bonds 66,471,685 45,040,040 20,499,265 932,380
Certificates of deposits and others 147,679,327 - 147,679,327 -
Liabilities
Financial liabilities at fair value through profit or loss
Financial liabilities designed at fair value through profit or loss 1,550,624 - 1,550,624 -
Derivative financial instruments
Assets
Financial assets at fair value through profit or loss
Financial assets mandatorily classified as at FVTPL 15,682,424 53,079 14,836,665 792,680
Liabilities
Financial liabilities at fair value through profit or loss Held-for-trading financial liabilities 15,013,908 47,036 13,934,632 1,032,240

- 63 -
Financial Instruments Measured at Fair Value December 31, 2018
Total Level 1 Level 2 Level 3
Measured on a recurring basis
Non-derivative financial instruments
Assets
Financial assets at fair value through profit or loss Financial assets mandatorily classified as at FVTPL
Bonds $ 31,173,586 $ 25,079,132 $ 2,874,567 $ 3,219,887
Others 2,531,143 - 2,531,143 - Financial assets at fair value through other comprehensive
income
Equity instruments at FVTOCI Stocks and others 1,938,907 - 1,005,000 933,907
Debt instruments at FVTOCI
Bonds 53,339,088 39,636,506 12,780,038 922,544 Certificates of deposit and others 150,365,317 - 150,365,317 -
Liabilities
Financial liabilities at fair value through profit or loss
Financial liabilities designed at fair value through profit or loss 1,500,806 - 1,500,806 -
Derivative financial instruments
Assets
Financial assets at fair value through profit or loss
Financial assets mandatorily classified as at FVTPL 16,129,278 72,909 14,625,619 1,430,750
Liabilities
Financial liabilities at fair value through profit or loss Held-for-trading financial liabilities 18,266,109 73,309 16,982,337 1,210,463

- 64 -
Financial Instruments Measured at Fair Value June 30, 2018
Total Level 1 Level 2 Level 3
Measured on a recurring basis
Non-derivative financial instruments
Assets
Financial assets at fair value through profit or loss Financial assets mandatorily classified as at FVTPL
Stocks $ 653,815 $ 653,815 $ - $ -
Bonds 40,502,861 34,261,954 6,240,907 - Others 2,761,074 - 2,761,074 -
Financial assets at fair value through other comprehensive
income Equity instruments at FVTOCI
Stocks 1,306,992 - - 1,306,992
Debt instruments at FVTOCI Bonds 48,839,498 33,785,428 15,054,070 -
Certificates of deposits and others 183,575,828 - 183,575,828 -
Liabilities
Financial liabilities at fair value through profit or loss Financial liabilities designed at fair value through profit
or loss 1,456,351 - 1,456,351 -
Derivative financial instruments
Assets
Financial assets at fair value through profit or loss
Financial assets mandatorily classified as at FVTPL 20,612,013 189,886 18,907,384 1,514,743
Liabilities
Financial liabilities at fair value through profit or loss
Held-for-trading financial liabilities 20,919,925 203,937 19,538,994 1,176,994
2) Fair value measurement technique
Financial instruments at fair value through profit or loss, financial assets at fair value through other
comprehensive income with quoted price in an active market are using market price as fair value;
financial instruments above with no quoted price in an active market are estimated by valuation
methods. The estimation and assumption of valuation method the Group used is the same as market
participants’. The Group can obtain this information.
The basis of fair value estimation used by the Group is shown as follows:
The fair value of forward contract, interest rate swap contracts and cross-currency swap contracts is
measured by the discounted cash flow method; the fair value of option is measured by Black &
Scholes Model.
Fair values of forward contracts are estimated on the basis of the foreign exchange rates provided
by Reuters. Structured product is measured by opponents’ price based on match basis. This method
diminished market risk to zero. Fair value of interest rate swap contracts and cross-currency swap
contracts are estimated on the basis of market quotation provided by Reuters.
Fair value is determined as follows: (a) domestic listed stocks, Taipei Exchange Stocks and Stocks
of Real Estate Investment Trust - closing prices as of the balance sheet date; (b) beneficial
certificates (open-end funds), net asset values as of the balance sheet date or price calculated
through an internal price; (c) bonds - period-end reference prices published by the Taipei Exchange;
(d) bank debentures issued overseas and the overseas bonds-period-end reference prices published
by Bloomberg, calculated through an internal model or provided by a counter-party.
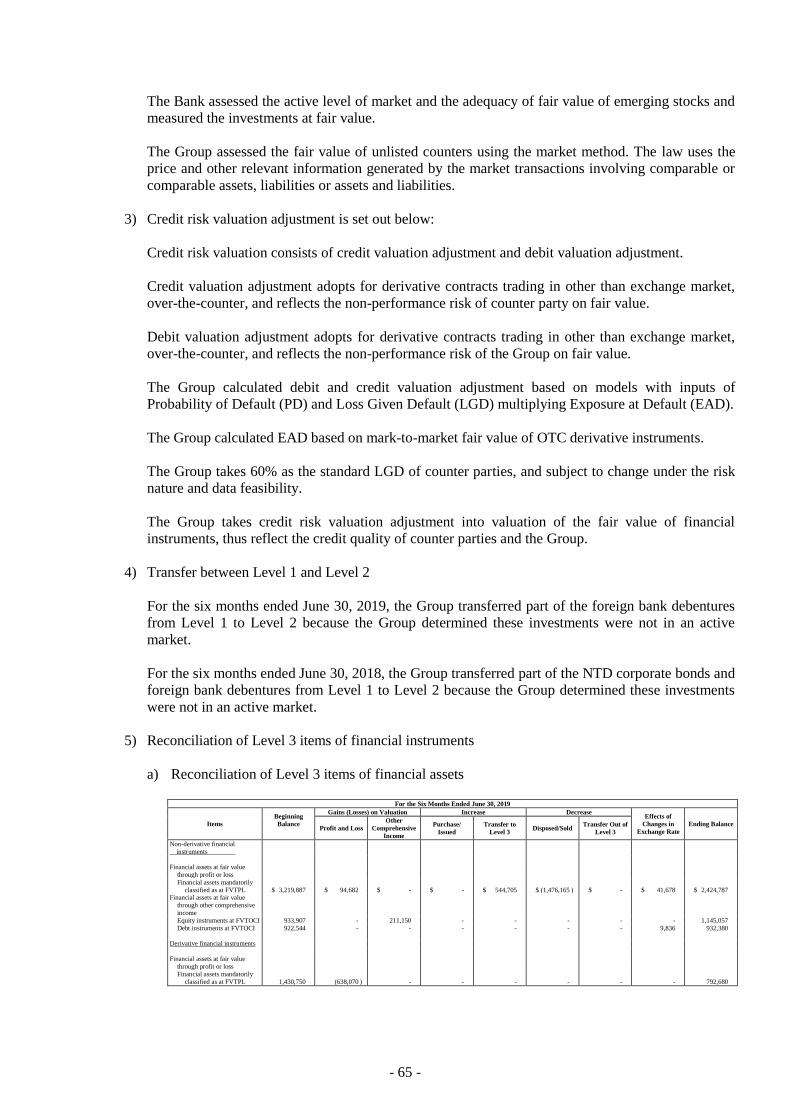
- 65 -
The Bank assessed the active level of market and the adequacy of fair value of emerging stocks and
measured the investments at fair value.
The Group assessed the fair value of unlisted counters using the market method. The law uses the
price and other relevant information generated by the market transactions involving comparable or
comparable assets, liabilities or assets and liabilities.
3) Credit risk valuation adjustment is set out below:
Credit risk valuation consists of credit valuation adjustment and debit valuation adjustment.
Credit valuation adjustment adopts for derivative contracts trading in other than exchange market,
over-the-counter, and reflects the non-performance risk of counter party on fair value.
Debit valuation adjustment adopts for derivative contracts trading in other than exchange market,
over-the-counter, and reflects the non-performance risk of the Group on fair value.
The Group calculated debit and credit valuation adjustment based on models with inputs of
Probability of Default (PD) and Loss Given Default (LGD) multiplying Exposure at Default (EAD).
The Group calculated EAD based on mark-to-market fair value of OTC derivative instruments.
The Group takes 60% as the standard LGD of counter parties, and subject to change under the risk
nature and data feasibility.
The Group takes credit risk valuation adjustment into valuation of the fair value of financial
instruments, thus reflect the credit quality of counter parties and the Group.
4) Transfer between Level 1 and Level 2
For the six months ended June 30, 2019, the Group transferred part of the foreign bank debentures
from Level 1 to Level 2 because the Group determined these investments were not in an active
market.
For the six months ended June 30, 2018, the Group transferred part of the NTD corporate bonds and
foreign bank debentures from Level 1 to Level 2 because the Group determined these investments
were not in an active market.
5) Reconciliation of Level 3 items of financial instruments
a) Reconciliation of Level 3 items of financial assets
For the Six Months Ended June 30, 2019
Items
Beginning
Balance
Gains (Losses) on Valuation Increase Decrease Effects of
Changes in
Exchange Rate
Ending Balance Profit and Loss
Other
Comprehensive
Income
Purchase/
Issued
Transfer to
Level 3 Disposed/Sold
Transfer Out of
Level 3
Non-derivative financial
instruments
Financial assets at fair value
through profit or loss
Financial assets mandatorily
classified as at FVTPL $ 3,219,887 $ 94,682 $ - $ - $ 544,705 $ (1,476,165 ) $ - $ 41,678 $ 2,424,787 Financial assets at fair value
through other comprehensive
income
Equity instruments at FVTOCI 933,907 - 211,150 - - - - - 1,145,057
Debt instruments at FVTOCI 922,544 - - - - - - 9,836 932,380
Derivative financial instruments
Financial assets at fair value
through profit or loss
Financial assets mandatorily
classified as at FVTPL 1,430,750 (638,070 ) - - - - - - 792,680

- 66 -
For the Six Months Ended June 30, 2018
Items
Beginning
Balance
(Note)
Gains (Losses) on Valuation Increase Decrease Effects of
Changes in
Exchange Rate
Ending Balance Profit and Loss
Other
Comprehensive
Income
Purchase/
Issued
Transfer to
Level 3 Disposed/Sold
Transfer Out of
Level 3
Non-derivative financial
instruments
Financial assets at fair value
through other comprehensive
income
Equity instruments at FVTOCI $ 1,342,786 $ - $ (41,129 ) $ - $ - $ - $ - $ 5,335 $ 1,306,992
Derivative financial instruments
Financial assets at fair value through profit or loss
Financial assets mandatorily
classified as at FVTPL 654,607 860,136 - - - - - - 1,514,743
Note: The beginning balance of equity instruments at FVTOCI contains emerging stocks
classified as available-for-sale and unlisted shares measured at cost under IAS 39.
For the six months ended June 30, 2019 and 2018, the gains and losses on valuation included in
net losses with assets still held were losses $197,682 and gains $880,031, respectively.
For the six months ended June 30, 2019 and 2018, the gains and losses on valuation included in
other comprehensive income with assets still held were gains $211,150 and losses $41,129,
respectively.
b) Reconciliation of Level 3 items of financial liabilities
For the Six Months Ended June 30, 2019
Items Beginning
Balance
Valuation
Gain/Loss
Reflected on
Profit or Loss
Increase Decrease Effects of
Changes in
Exchange Rate
Ending Balance Purchase/
Issued
Transfer to
Level 3 Disposed/Sold
Transfer Out of
Level 3
Derivative financial instruments
Financial liabilities at fair value through profit or loss Held-for-trading financial liabilities $ 1,210,463 $ (178,223 ) $ - $ - $ - $ - $ - $ 1,032,240
For the Six Months Ended June 30, 2018
Items Beginning
Balance
Valuation
Gain/Loss
Reflected on
Profit or Loss
Increase Decrease Effects of
Changes in
Exchange Rate
Ending Balance Purchase/
Issued
Transfer to
Level 3 Disposed/Sold
Transfer Out of
Level 3
Derivative financial instruments
Financial liabilities at fair value through profit or loss
Held-for-trading financial liabilities $ 686,411 $ 490,583 $ - $ - $ - $ - $ - $ 1,176,994
For the six months ended June 30, 2019 and 2018, the gains and losses on valuation results
included in net income from liabilities still held were gains $66,318 and losses $536,966,
respectively.
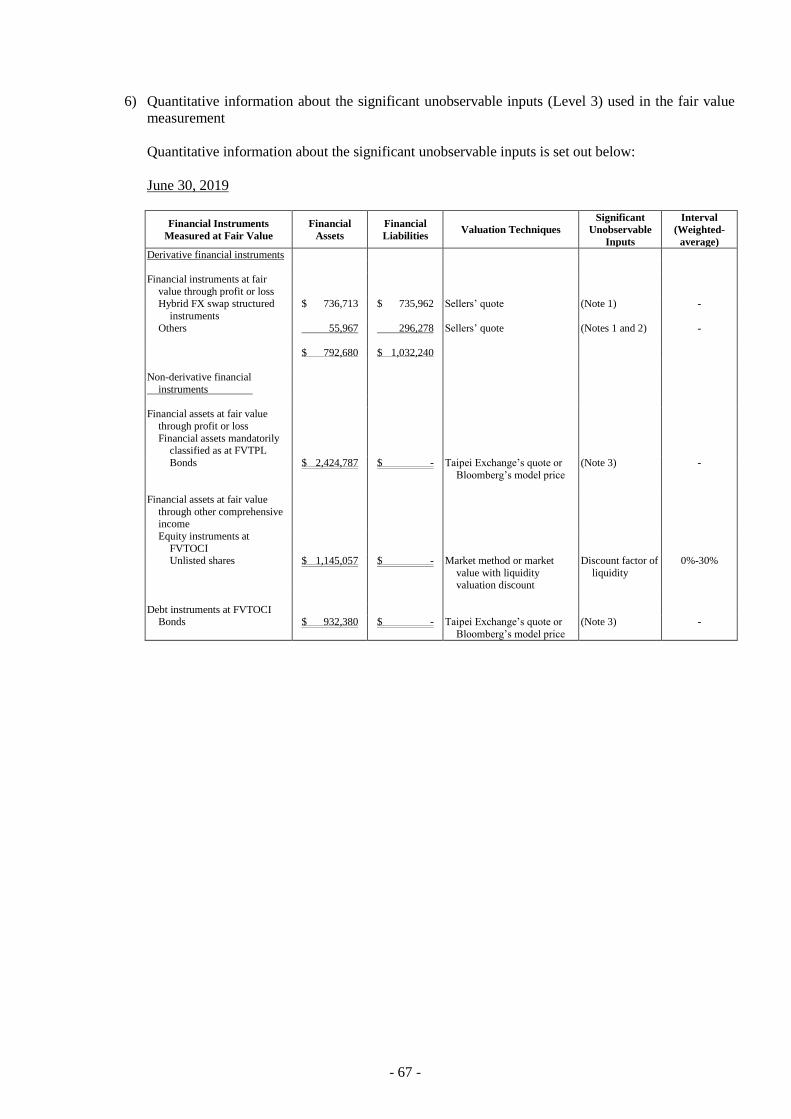
- 67 -
6) Quantitative information about the significant unobservable inputs (Level 3) used in the fair value
measurement
Quantitative information about the significant unobservable inputs is set out below:
June 30, 2019
Financial Instruments
Measured at Fair Value
Financial
Assets
Financial
Liabilities Valuation Techniques
Significant
Unobservable
Inputs
Interval
(Weighted-
average)
Derivative financial instruments
Financial instruments at fair
value through profit or loss
Hybrid FX swap structured
instruments
$ 736,713 $ 735,962 Sellers’ quote (Note 1) -
Others 55,967 296,278 Sellers’ quote (Notes 1 and 2) -
$ 792,680 $ 1,032,240
Non-derivative financial
instruments
Financial assets at fair value
through profit or loss
Financial assets mandatorily classified as at FVTPL
Bonds $ 2,424,787 $ - Taipei Exchange’s quote or
Bloomberg’s model price
(Note 3) -
Financial assets at fair value
through other comprehensive income
Equity instruments at
FVTOCI
Unlisted shares $ 1,145,057 $ - Market method or market
value with liquidity valuation discount
Discount factor of
liquidity
0%-30%
Debt instruments at FVTOCI Bonds $ 932,380 $ - Taipei Exchange’s quote or
Bloomberg’s model price
(Note 3) -
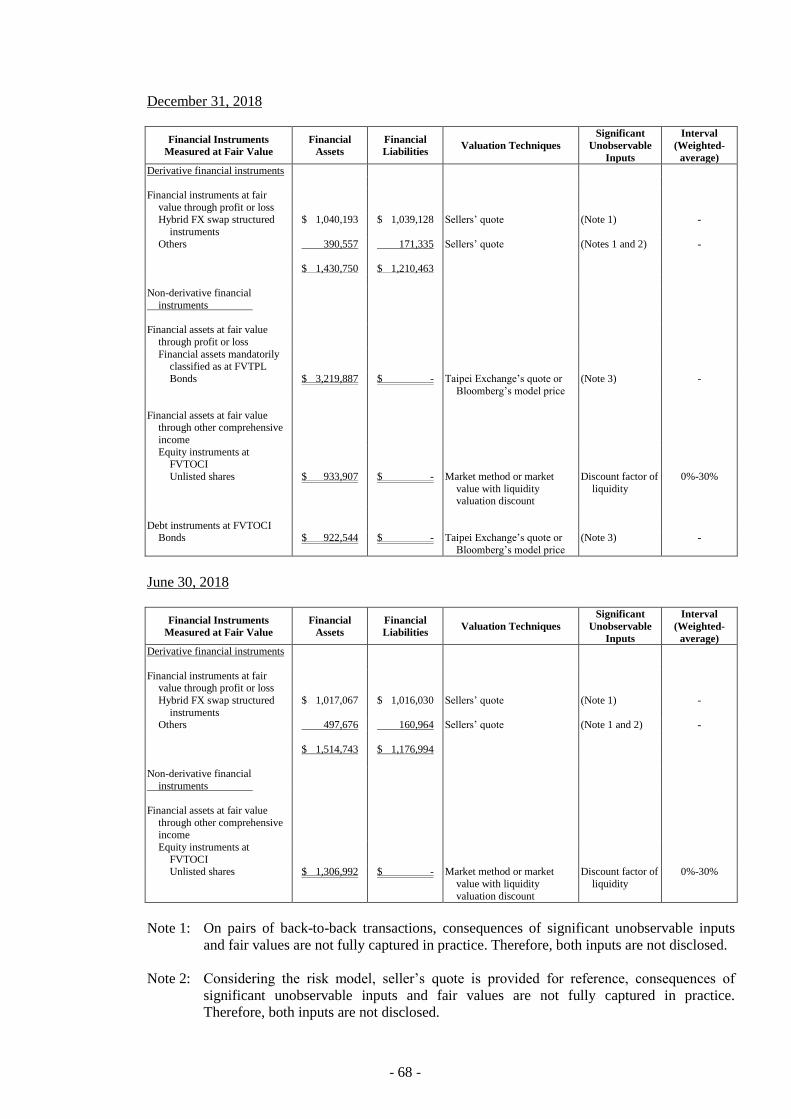
- 68 -
December 31, 2018
Financial Instruments
Measured at Fair Value
Financial
Assets
Financial
Liabilities Valuation Techniques
Significant
Unobservable
Inputs
Interval
(Weighted-
average)
Derivative financial instruments
Financial instruments at fair
value through profit or loss
Hybrid FX swap structured
instruments
$ 1,040,193 $ 1,039,128 Sellers’ quote (Note 1) -
Others 390,557 171,335 Sellers’ quote (Notes 1 and 2) -
$ 1,430,750 $ 1,210,463
Non-derivative financial
instruments
Financial assets at fair value
through profit or loss
Financial assets mandatorily classified as at FVTPL
Bonds $ 3,219,887 $ - Taipei Exchange’s quote or
Bloomberg’s model price
(Note 3) -
Financial assets at fair value through other comprehensive
income
Equity instruments at FVTOCI
Unlisted shares $ 933,907 $ - Market method or market
value with liquidity valuation discount
Discount factor of
liquidity
0%-30%
Debt instruments at FVTOCI Bonds $ 922,544 $ - Taipei Exchange’s quote or
Bloomberg’s model price
(Note 3) -
June 30, 2018
Financial Instruments
Measured at Fair Value
Financial
Assets
Financial
Liabilities Valuation Techniques
Significant
Unobservable
Inputs
Interval
(Weighted-
average)
Derivative financial instruments
Financial instruments at fair value through profit or loss
Hybrid FX swap structured
instruments
$ 1,017,067 $ 1,016,030 Sellers’ quote (Note 1) -
Others 497,676 160,964 Sellers’ quote (Note 1 and 2) -
$ 1,514,743 $ 1,176,994
Non-derivative financial
instruments
Financial assets at fair value
through other comprehensive
income
Equity instruments at
FVTOCI
Unlisted shares $ 1,306,992 $ - Market method or market
value with liquidity
valuation discount
Discount factor of
liquidity
0%-30%
Note 1: On pairs of back-to-back transactions, consequences of significant unobservable inputs
and fair values are not fully captured in practice. Therefore, both inputs are not disclosed.
Note 2: Considering the risk model, seller’s quote is provided for reference, consequences of
significant unobservable inputs and fair values are not fully captured in practice.
Therefore, both inputs are not disclosed.
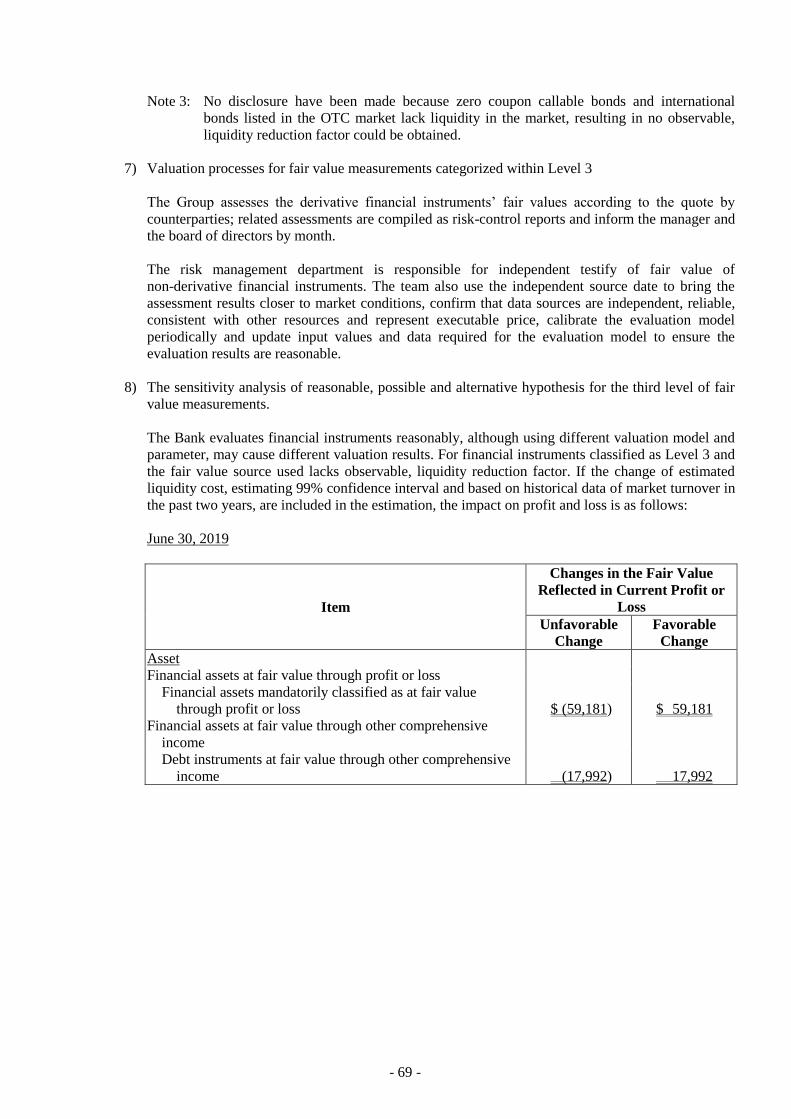
- 69 -
Note 3: No disclosure have been made because zero coupon callable bonds and international
bonds listed in the OTC market lack liquidity in the market, resulting in no observable,
liquidity reduction factor could be obtained.
7) Valuation processes for fair value measurements categorized within Level 3
The Group assesses the derivative financial instruments’ fair values according to the quote by
counterparties; related assessments are compiled as risk-control reports and inform the manager and
the board of directors by month.
The risk management department is responsible for independent testify of fair value of
non-derivative financial instruments. The team also use the independent source date to bring the
assessment results closer to market conditions, confirm that data sources are independent, reliable,
consistent with other resources and represent executable price, calibrate the evaluation model
periodically and update input values and data required for the evaluation model to ensure the
evaluation results are reasonable.
8) The sensitivity analysis of reasonable, possible and alternative hypothesis for the third level of fair
value measurements.
The Bank evaluates financial instruments reasonably, although using different valuation model and
parameter, may cause different valuation results. For financial instruments classified as Level 3 and
the fair value source used lacks observable, liquidity reduction factor. If the change of estimated
liquidity cost, estimating 99% confidence interval and based on historical data of market turnover in
the past two years, are included in the estimation, the impact on profit and loss is as follows:
June 30, 2019
Item
Changes in the Fair Value
Reflected in Current Profit or
Loss
Unfavorable
Change
Favorable
Change
Asset
Financial assets at fair value through profit or loss
Financial assets mandatorily classified as at fair value
through profit or loss $ (59,181) $ 59,181
Financial assets at fair value through other comprehensive
income
Debt instruments at fair value through other comprehensive
income (17,992) 17,992
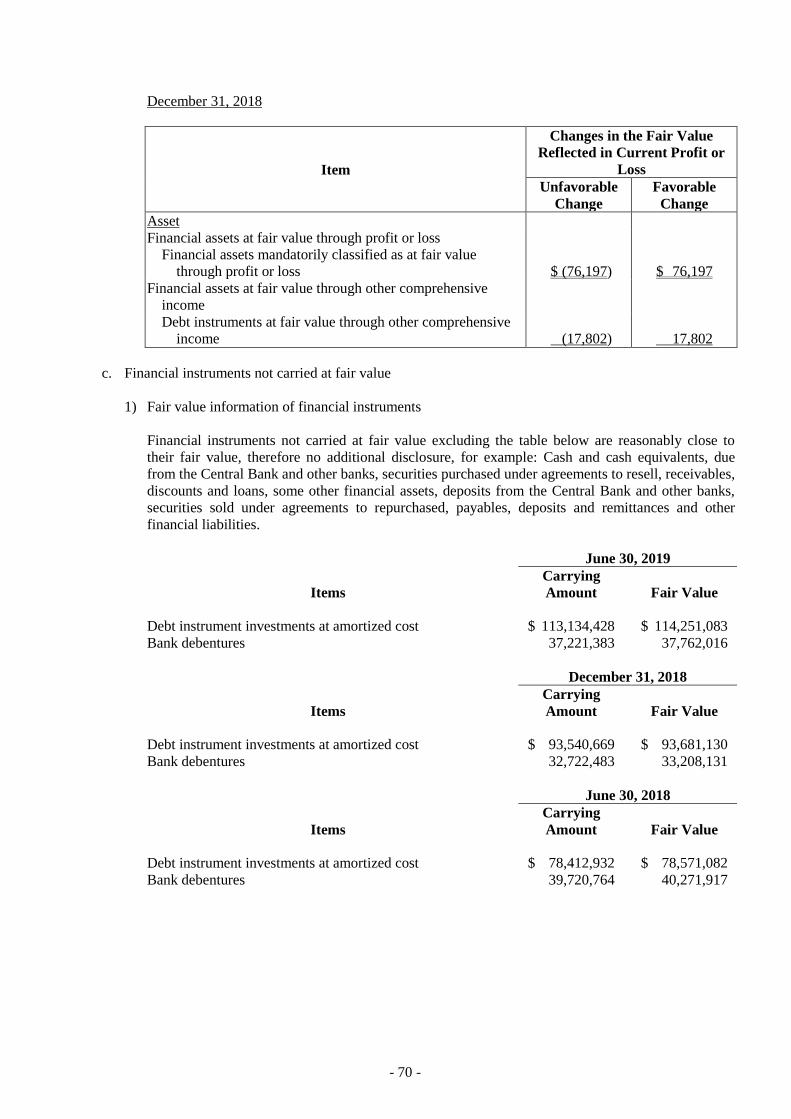
- 70 -
December 31, 2018
Item
Changes in the Fair Value
Reflected in Current Profit or
Loss
Unfavorable
Change
Favorable
Change
Asset
Financial assets at fair value through profit or loss
Financial assets mandatorily classified as at fair value
through profit or loss $ (76,197) $ 76,197
Financial assets at fair value through other comprehensive
income
Debt instruments at fair value through other comprehensive
income (17,802) 17,802
c. Financial instruments not carried at fair value
1) Fair value information of financial instruments
Financial instruments not carried at fair value excluding the table below are reasonably close to
their fair value, therefore no additional disclosure, for example: Cash and cash equivalents, due
from the Central Bank and other banks, securities purchased under agreements to resell, receivables,
discounts and loans, some other financial assets, deposits from the Central Bank and other banks,
securities sold under agreements to repurchased, payables, deposits and remittances and other
financial liabilities.
June 30, 2019
Items
Carrying
Amount Fair Value
Debt instrument investments at amortized cost $ 113,134,428 $ 114,251,083
Bank debentures 37,221,383 37,762,016
December 31, 2018
Items
Carrying
Amount Fair Value
Debt instrument investments at amortized cost $ 93,540,669 $ 93,681,130
Bank debentures 32,722,483 33,208,131
June 30, 2018
Items
Carrying
Amount Fair Value
Debt instrument investments at amortized cost $ 78,412,932 $ 78,571,082
Bank debentures 39,720,764 40,271,917
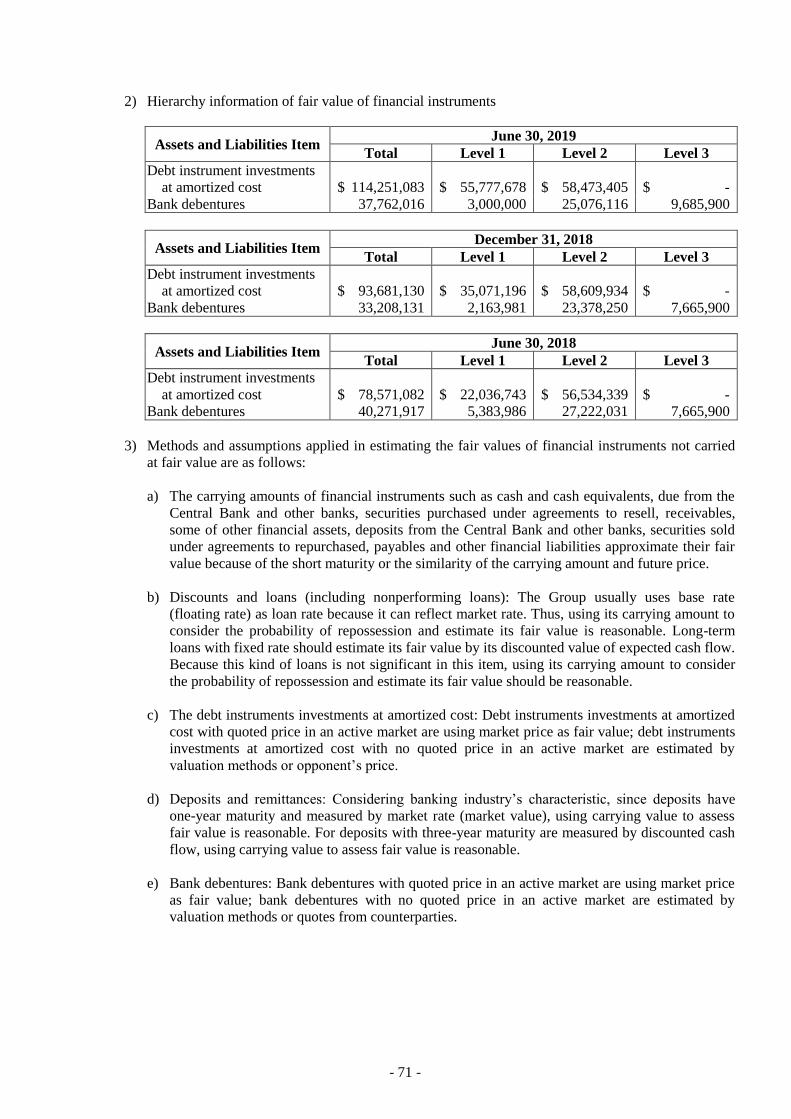
- 71 -
2) Hierarchy information of fair value of financial instruments
Assets and Liabilities Item June 30, 2019
Total Level 1 Level 2 Level 3
Debt instrument investments
at amortized cost $ 114,251,083 $ 55,777,678 $ 58,473,405 $ -
Bank debentures 37,762,016 3,000,000 25,076,116 9,685,900
Assets and Liabilities Item December 31, 2018
Total Level 1 Level 2 Level 3
Debt instrument investments
at amortized cost $ 93,681,130 $ 35,071,196 $ 58,609,934 $ -
Bank debentures 33,208,131 2,163,981 23,378,250 7,665,900
Assets and Liabilities Item June 30, 2018
Total Level 1 Level 2 Level 3
Debt instrument investments
at amortized cost $ 78,571,082 $ 22,036,743 $ 56,534,339 $ -
Bank debentures 40,271,917 5,383,986 27,222,031 7,665,900
3) Methods and assumptions applied in estimating the fair values of financial instruments not carried
at fair value are as follows:
a) The carrying amounts of financial instruments such as cash and cash equivalents, due from the
Central Bank and other banks, securities purchased under agreements to resell, receivables,
some of other financial assets, deposits from the Central Bank and other banks, securities sold
under agreements to repurchased, payables and other financial liabilities approximate their fair
value because of the short maturity or the similarity of the carrying amount and future price.
b) Discounts and loans (including nonperforming loans): The Group usually uses base rate
(floating rate) as loan rate because it can reflect market rate. Thus, using its carrying amount to
consider the probability of repossession and estimate its fair value is reasonable. Long-term
loans with fixed rate should estimate its fair value by its discounted value of expected cash flow.
Because this kind of loans is not significant in this item, using its carrying amount to consider
the probability of repossession and estimate its fair value should be reasonable.
c) The debt instruments investments at amortized cost: Debt instruments investments at amortized
cost with quoted price in an active market are using market price as fair value; debt instruments
investments at amortized cost with no quoted price in an active market are estimated by
valuation methods or opponent’s price.
d) Deposits and remittances: Considering banking industry’s characteristic, since deposits have
one-year maturity and measured by market rate (market value), using carrying value to assess
fair value is reasonable. For deposits with three-year maturity are measured by discounted cash
flow, using carrying value to assess fair value is reasonable.
e) Bank debentures: Bank debentures with quoted price in an active market are using market price
as fair value; bank debentures with no quoted price in an active market are estimated by
valuation methods or quotes from counterparties.

- 72 -
44. FINANCIAL RISK MANAGEMENT
a. Overview
The Group documents the risk management policies, including overall operating strategies and risks
control philosophy. The Group’s overall risk management policies are to minimize the possibility of
potential unfavorable factors. The board of directors approves the documentation of overall risk
management policies and specific risk management policies; including credit risk, liquidity risk, market
risk, operational risk, derivative instruments transactions and managements. The board of directors
reviews the policies regularly, and reviews the operation to make sure the Group’s policies are executed
properly.
b. Risk management framework
The board of directors is the top risk supervisor of the Group. The board not only reviewed risk
management policies and rules but also authorized management to be in charge of daily risk
management work. The Bank has set up a risk management committee to be responsible for the services
above; the Bank has also set up a credit committee to review the policies and supervise the abnormal
cases. The credit committee also helps the board of directors approve cases over general manager’s
authority under the board’s authorization.
The board of directors authorized the Group’s management to supervise risk management activities,
evaluate the performance and confirm every risk management agent having essential code of ethic and
professional skills. Internal audit is responsible for the periodic review of risk management and the
control environment, then reports the results directly to the board of directors.
The Bank has set up a risk management department to control risk management policies, establish rules,
plan and set up risk management system. The risk management department executes these policies
based on the board’s approval, then reports the results and performance reviews to the authority or the
board.
c. Credit risk
1) Sources and definitions of credit risk
Credit risk is the risk of financial loss if a customer or counterparty fails to meet an obligation under
a contract. It arises principally from lending, trade finance, treasury, and credit derivatives. The
issuer’s credit risk should be considered as part of the market risk when the investment target is
securities in an active market.
2) Policies and strategies
The Group established policies based on operating goals and strategies, business plans and risk
management goals authorized by the board of directors. These policies were established to lower
potential financial losses, minimize risks and rewards to raise the performance and protect
shareholders’ equity through appropriate managing policies and procedures based on
risk-diversification principle.
The Group’s risk strategy is to strengthen the credit risk management framework, establish
complete credit verification system and procedure, develop and use efficient and scientific credit
risk managing instruments to identify, measure, manage and supervise credit risks. These strategies
transparentize, systematize, specialize and formalize credit risk management to manage loans,
nonperforming assets and every kind of assets’ credit risk.

- 73 -
The Group has set up policies of main risks as prime direction based on legislations and operational
goals. These policies include risk appetite, management goals, organization structure of
responsibility and accountability, measurement, evaluation, supervision and report procedure of
risks. These policies are established to reach the purposes of consistency and centralized
management and are put into practice in corporate government.
Credit risk management procedures and measurements are as follows:
a) Loan business (includes loan commitment and guarantee)
Loan business classification and qualities are shown as follows:
i. Classification
Under the “Regulations Governing the Procedures for Banking Institutions to Evaluate
Assets and Deal with Nonperforming/Nonaccrual Loans” (the Regulations) issued by the
Banking Bureau, the Bank evaluates credit losses on the basis of the estimated collectability.
In accordance with the Regulations, credit assets are classified as normal assets, assets that
require special mentioned, assets with substandard, assets with doubtful collectability, and
assets on which there is loss. In order to manage credit problem, the Bank issued “Evaluate
Assets and Deal with Non-performing/Non-accrual Loans” for managing credit problem and
debt collection.
Bank SinoPac (China) Ltd. strictly follows the “Guidance for the Risk-Based Loan
Categorization” established by the China Banking Regulatory Commission. It divides its
loans into five categories based on a debtor’s ability to repay the full principal and interest
on time. The five categories are normal, special mention, substandard, doubtful, and loss.
The last three categories are considered nonperforming loans.
ii. Credit quality level
The Group sets up credit quality level (ex. internal credit risk assessment model, credit
assessment rules) based on business characteristic and scale to manage risks.
In order to measure clients’ credit risks, the Group established credit risk assessment model
for corporate banking, personal banking and consumer banking through statistic methods,
professional judgment and clients’ information. Every model should be reviewed regularly
to examine whether the calculations match to the actual conditions or not, then the Bank will
adjust parameters to optimize the results.
For personal banking and consumer banking customers, every case will be reviewed
individually to assess default risks except that micro-credit and credit card business should
be assessed by internal credit assessment model.
b) Investment business
The Group manages and identifies credit risks of debt investment through credit ratings by
outsiders, credit qualities of the debt, regional conditions and counterparties’ risks.
The Group carry out derivative instrument transactions with counterparties in financial industry
which are almost above the investment level. The Bank would control credit risks based on
counterparties’ credit lines; counterparties with no credit ratings or at non-investment level
should be reviewed individually. Normal customers’ credit exposure positions should be
controlled by approved derivative instrument credit line and condition based on normal credit
procedure.

- 74 -
3) Credit risk hedge or mitigation policies
a) Collateral
The Group has set up several standards dealing with credit exposures and collateral
requirements in order to mitigate credit risks and maintain creditor’s rights. The standards cover
areas such as disposal of collateral, acceptance of real estate as collateral, real estate appraisal;
credit policies for every commodity to regulate collateral categories, appraisals, procedures,
deduction percentages, loan rate, loan-to-value ratio, maturity analysis, control, and
management.
To maintain collateral’s effectiveness, the Group supervises and manages the collateral by
examining the usage, custody and maintenance of collateral regularly and irregularly to avoid
selling, leasing, pledging, moving and disposing collaterals without authorization. Once the loan
is due but will be extended, the contract should be seen as a new case and the collateral should
be revalued.
b) Credit risk limits and credit risk concentration control
The Group manages credit line and concentration of credit assets through appropriate
information managing system that gathers information on credit exposure to centralized
conditions, exposure of credit asset combinations, including national risk, large credit exposure,
credit line of single corporation, group and industry. For cases approaching credit limit, the
concerned unit should report to management and make control strategies; for cases exceeding
credit limit, the management should take appropriate action and the Group should review the
credit approval process and authorization level.
c) Agreement of net settlement
The Group often makes gross settlement on transactions, sign net settlement contract with other
counterparties or cancel every transactions and make net settlement when default occurs to
mitigate credit risk.
4) The determination since the initial recognition of the credit risk has increased significantly
a) Loan business
The group assess the change in the risk of default of various credit assets during the lifetime on
each reporting date to determine if the credit risk has increased significantly since the initial
recognition.
In order to make this assessment, the main consideration is reasonable and supportable
information that the credit risk has increased significantly since the initial recognition (including
forward-looking information).
Key indicators include:
i. Quantitative indicators
Information on overdue conditions: When the contractual payments were overdue for more
than 30 days to overdue 89 days, it has been determined that credit risk of the financial
assets after the initial recognition was significantly increased.
- 75 -
ii. Qualitative indicators
i) Although the loan has not been repaid or due on the maturity date, there are other bad
debts and the asset classification is not normal.
ii) The loan review report belonging to an abnormal credit.
iii) The credit card transaction with the Bank is abnormal.
On the basis of various credit asset evaluation benchmark days of the Group, if the credit risk
does not increase significantly and not belong to an impaired financial asset, it can be
determined that the credit risk does not increase significantly after the initial recognition.
b) Investment business
The Group adopts external credit rating scales to measure whether the credit risk after the initial
recognition is significantly increased for debt instrument measured at amortized cost and debt
instrument measured at fair value through other comprehensive income.
The external credit rating is determined by international credit rating agency. When the external
credit rating changes and the following situations occur, the credit risk is regarded to have
significantly increased after the initial recognition.
i. From investment grade (Aaa-Baa3) to non-investment grade (Ba1 (inclusive) or less,
without Ca-D)
ii. From grade Ba1-Ba3 to grade B1-Caa3
iii. The bonds in grade B1-Caa3 at initial recognition.
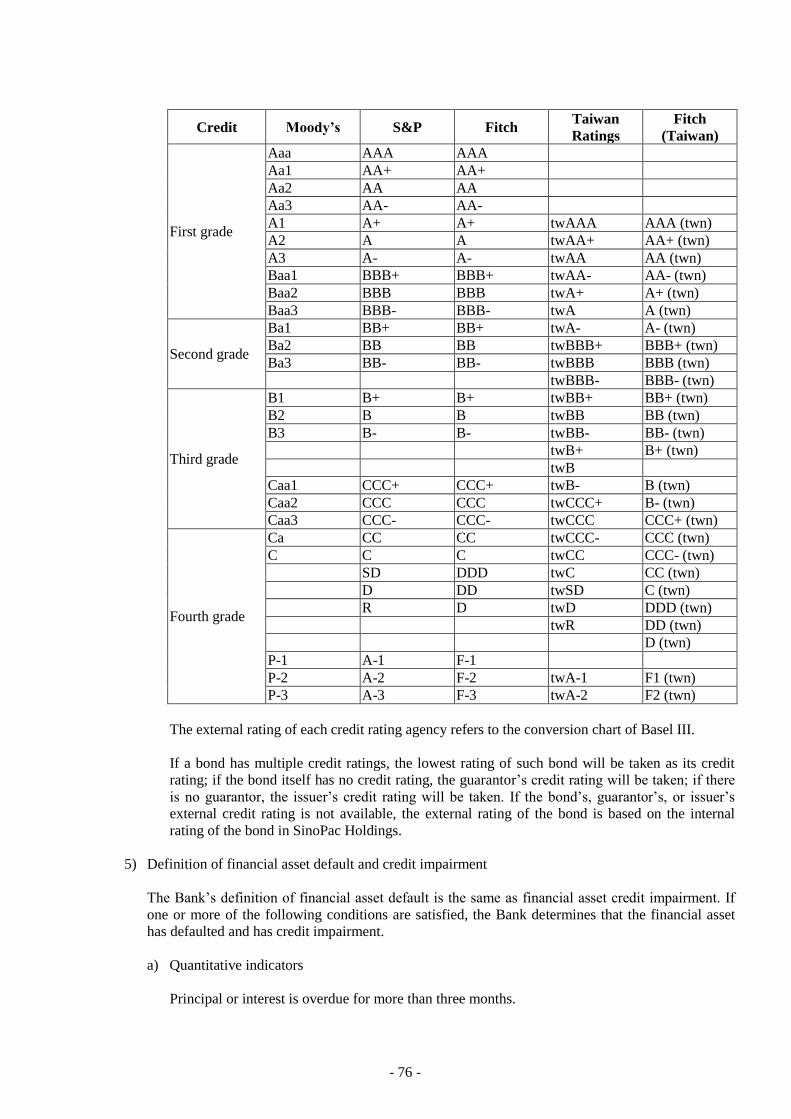
- 76 -
Credit Moody’s S&P Fitch Taiwan
Ratings
Fitch
(Taiwan)
First grade
Aaa AAA AAA
Aa1 AA+ AA+
Aa2 AA AA
Aa3 AA- AA-
A1 A+ A+ twAAA AAA (twn)
A2 A A twAA+ AA+ (twn)
A3 A- A- twAA AA (twn)
Baa1 BBB+ BBB+ twAA- AA- (twn)
Baa2 BBB BBB twA+ A+ (twn)
Baa3 BBB- BBB- twA A (twn)
Second grade
Ba1 BB+ BB+ twA- A- (twn)
Ba2 BB BB twBBB+ BBB+ (twn)
Ba3 BB- BB- twBBB BBB (twn)
twBBB- BBB- (twn)
Third grade
B1 B+ B+ twBB+ BB+ (twn)
B2 B B twBB BB (twn)
B3 B- B- twBB- BB- (twn)
twB+ B+ (twn)
twB
Caa1 CCC+ CCC+ twB- B (twn)
Caa2 CCC CCC twCCC+ B- (twn)
Caa3 CCC- CCC- twCCC CCC+ (twn)
Fourth grade
Ca CC CC twCCC- CCC (twn)
C C C twCC CCC- (twn)
SD DDD twC CC (twn)
D DD twSD C (twn)
R D twD DDD (twn)
twR DD (twn)
D (twn)
P-1 A-1 F-1
P-2 A-2 F-2 twA-1 F1 (twn)
P-3 A-3 F-3 twA-2 F2 (twn)
The external rating of each credit rating agency refers to the conversion chart of Basel III.
If a bond has multiple credit ratings, the lowest rating of such bond will be taken as its credit
rating; if the bond itself has no credit rating, the guarantor’s credit rating will be taken; if there
is no guarantor, the issuer’s credit rating will be taken. If the bond’s, guarantor’s, or issuer’s
external credit rating is not available, the external rating of the bond is based on the internal
rating of the bond in SinoPac Holdings.
5) Definition of financial asset default and credit impairment
The Bank’s definition of financial asset default is the same as financial asset credit impairment. If
one or more of the following conditions are satisfied, the Bank determines that the financial asset
has defaulted and has credit impairment.
a) Quantitative indicators
Principal or interest is overdue for more than three months.

- 77 -
b) Qualitative indicators
If there is evidence that the debtor will not be able to pay the contract money, or the debtor is
facing significant financial difficulties, for examples:
i. The main debtor has been chased, or the collateral has been disposed of.
ii. The main debtor has not paid short-term advance to the Bank.
iii. The debtor applies for debt negotiation, debt extension and debt restructuring, etc. due to
financial difficulties.
iv. Other situation with objective evidence of impairment.
Bond investment belongs to credit ratings Ca-D bonds when the following situations occur:
i. The issuer probably cannot repay the principal or interest on the bond maturity date.
ii. It could be objectively judged that the issuer will not be able to repay the principal and
interest of the bond on time before maturity.
iii. Probability that the debtor will enter into bankruptcy or undergo financial reorganization.
iv. The issuer encounters bankruptcy or being reorganized or taken over due to financial
difficulties before bond maturity.
The above definition of default and credit impairment applies to all financial assets held by the
Bank. It is consistent with the definition of relevant financial assets for internal credit risk
management, and applicable to relevant impairment assessment model as well.
6) Write-off policy
If one of the following situations occurred, overdue and nonperforming loans of the Bank, after
deducting any estimated recoverable part, will be written off as bad debts.
a) All or part of the creditor’s right could not be enforced due to dissolution, escape, settlement,
bankruptcy or other reasons of the debtors.
b) The values of collateral and properties of the main and subordinate debtors are very low,
compensation are not available after deducting the first mortgage, or it is unbeneficial that
execution fee is close to or may exceed the bank’s reimbursable amount.
c) The collateral and the properties of the main and subordinate debtors are unsold after multiple
discount auctions and not beneficial to the Bank.
d) Overdue and nonperforming loans have not been recovered after more than 2 years from the
maturity date.
The Bank has procedures for recording accounts written-off and for keeping such records for
inspection. Relevant business department continues to watch for movements of the main and
subordinate debtors all the time. If there is any property available for execution, the Bank will take
appropriate legal action.
- 78 -
7) Amendment to financial asset contract cash flows
The Group will amend financial asset contract cash flows when borrowers are in financial
difficulties, as a result of improvement of problematic debtors’ recovery rate or for maintenance of
customer relationships. Financial asset contract cash flows amendment include extension of contract
period, interest payment date modification, contract interest modification, or exemption from
certain requirements of part of debts. The amendment could result in the Group’ disposal of existing
financial asset and recording of new financial asset at fair value.
If the modification of the contractual cash flows of financial asset does not result in derecognition
of asset, the Group will assess whether the credit risk of financial asset has increased significantly
by comparing the following:
a) Risk of breaching the contract on the reporting date (based on revised contract terms)
b) The risk of default in the original recognition (based on the original unmodified contract terms)
The Group will consider the borrower’s subsequent payment in accordance with the revised terms
and several relevant behavior indicators to assess the probability of default on the revised financial
asset, and confirm whether the contract modification improves or restore the Group’s ability to
recover related contract payments.
8) Measurement of expected credit losses
For the purpose of measuring expected credit losses, the Group will look into the business attributes
of the credit assets (such as corporate finance, personal finance, consumer finance, e-finance, etc.)
as well as the size of the company, types of collateral, and remaining period of maturities, etc. and
group the credit risk characteristics into three stages: No significant increase in credit risk (stage 1),
significant increase in credit risk (stage 2), and credit impairment (stage 3) according to the credit
risk level at the valuation date.
The Group provides allowance for 12-month expected credit losses when financial instruments did
not have a significant increase in credit risk since the initial recognition. Financial instruments are
provided with allowance for full-lifetime expected credit losses when there is significant increase in
credit risk or credit impairment since the initial recognition.
To measure expected credit losses, the Group takes into account the borrower’s probability of
default (“PD”) for the next 12 months and for the period of existence, and includes loss given
default (“LGD”), and exposure at default (“EAD”) taking into account the impact of the time value
of money. The expected credit losses for 12 months and for full-lifetime are calculated.
The Bank assesses the amount of Exposure at default of lending based on outstanding loan principal
of customers, interest receivable and short-term advances at the end of each period. In addition,
when estimating the expected credit losses of lending financing commitments, Exposure at default
used to calculate expected credit losses is determined based on the conditions and days of the
financing commitment and by reference to the credit risk conversion factor of Basel Capital Accord.
Probability of default is the default probability of the borrower, and the default loss rate is the rate
of loss caused by default of the borrower. The default probability and default loss rate used in the
impairment assessment and calculation of expected credit losses of the Bank loan business are
based on internal historical information (such as credit loss experience, etc.) of each borrower group,
with adjustments to the historical data based on the current observable data and forward-looking
economic information. The expected loss of debt instrument investment is calculated according to
the default rate information and external recovery rate information published by the external credit
rating agencies.

- 79 -
9) Forward-looking information considerations
a) Credit assets
The Bank takes forward-looking information into account when determining whether the credit
risk of the credit assets has increased significantly since the initial recognition and measures the
expected credit losses. The Bank uses historical data and expert judgments to analyze and
identify the economic factors that affect the credit risk and expected credit losses of various
asset groups, such as GDP and unemployment rate. The Bank obtains quarterly historical data
and forecast information of the relevant economic factors from international financial
organizations (such as the International Monetary Fund (IMF)). This forecast information
contains the best estimate of the economic situation in the next five years.
The relevant economic factors and their impact on PD differ among different credit business.
The Bank classifies credit product types as:
i. Enterprise, sovereignty, and bank credit exposure.
ii. Home Mortgage Insurance credit exposure.
iii. Qualified cycling retail credit exposure.
iv. Other retail credit exposure.
With reference to the Basel Capital Accord IRB method, the correlation coefficient of various
types of credit products and risk category is calculated and forward-looking information is used
to adjust the default probability.
b) Investment business
For the debt instrument investment measured at amortized cost and measured at fair value
through other comprehensive income, one of the indicators of significant increase in credit risk
is the quantified change in the external rating class announced by the international credit rating
agencies, and the measurement of expected credit losses is based on the information of the
default ratings and default loss rates regularly announced by external rating agencies and
international credit rating agencies.
As international credit rating agencies have considered forward-looking information in
assessing credit ratings, the Bank’s assessment of forward-looking information is appropriate,
and is included in the bank’s assessment of expected credit losses.
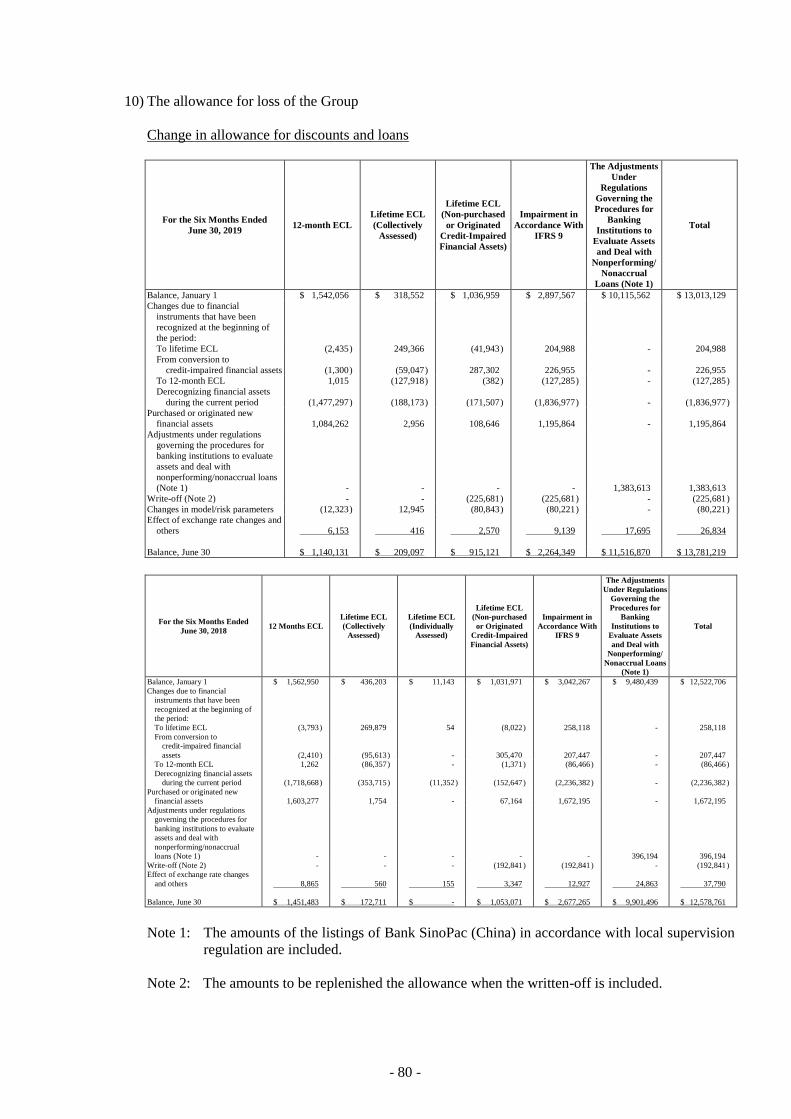
- 80 -
10) The allowance for loss of the Group
Change in allowance for discounts and loans
For the Six Months Ended
June 30, 2019 12-month ECL
Lifetime ECL
(Collectively
Assessed)
Lifetime ECL
(Non-purchased
or Originated
Credit-Impaired
Financial Assets)
Impairment in
Accordance With
IFRS 9
The Adjustments
Under
Regulations
Governing the
Procedures for
Banking
Institutions to
Evaluate Assets
and Deal with
Nonperforming/
Nonaccrual
Loans (Note 1)
Total
Balance, January 1 $ 1,542,056 $ 318,552 $ 1,036,959 $ 2,897,567 $ 10,115,562 $ 13,013,129
Changes due to financial
instruments that have been
recognized at the beginning of
the period:
To lifetime ECL (2,435 ) 249,366 (41,943 ) 204,988 - 204,988
From conversion to
credit-impaired financial assets (1,300 ) (59,047 ) 287,302 226,955 - 226,955
To 12-month ECL 1,015 (127,918 ) (382 ) (127,285 ) - (127,285 )
Derecognizing financial assets
during the current period (1,477,297 ) (188,173 ) (171,507 ) (1,836,977 ) - (1,836,977 )
Purchased or originated new
financial assets 1,084,262 2,956 108,646 1,195,864 - 1,195,864
Adjustments under regulations
governing the procedures for
banking institutions to evaluate
assets and deal with
nonperforming/nonaccrual loans
(Note 1) - - - - 1,383,613 1,383,613
Write-off (Note 2) - - (225,681 ) (225,681 ) - (225,681 )
Changes in model/risk parameters (12,323 ) 12,945 (80,843 ) (80,221 ) - (80,221 )
Effect of exchange rate changes and
others 6,153 416 2,570 9,139 17,695 26,834
Balance, June 30 $ 1,140,131 $ 209,097 $ 915,121 $ 2,264,349 $ 11,516,870 $ 13,781,219
For the Six Months Ended
June 30, 2018 12 Months ECL
Lifetime ECL
(Collectively
Assessed)
Lifetime ECL
(Individually
Assessed)
Lifetime ECL
(Non-purchased
or Originated
Credit-Impaired
Financial Assets)
Impairment in
Accordance With
IFRS 9
The Adjustments
Under Regulations
Governing the
Procedures for
Banking
Institutions to
Evaluate Assets
and Deal with
Nonperforming/
Nonaccrual Loans
(Note 1)
Total
Balance, January 1 $ 1,562,950 $ 436,203 $ 11,143 $ 1,031,971 $ 3,042,267 $ 9,480,439 $ 12,522,706
Changes due to financial
instruments that have been
recognized at the beginning of
the period:
To lifetime ECL (3,793 ) 269,879 54 (8,022 ) 258,118 - 258,118
From conversion to
credit-impaired financial
assets (2,410 ) (95,613 ) - 305,470 207,447 - 207,447
To 12-month ECL 1,262 (86,357 ) - (1,371 ) (86,466 ) - (86,466 )
Derecognizing financial assets
during the current period (1,718,668 ) (353,715 ) (11,352 ) (152,647 ) (2,236,382 ) - (2,236,382 )
Purchased or originated new
financial assets 1,603,277 1,754 - 67,164 1,672,195 - 1,672,195
Adjustments under regulations
governing the procedures for
banking institutions to evaluate
assets and deal with
nonperforming/nonaccrual
loans (Note 1) - - - - - 396,194 396,194
Write-off (Note 2) - - - (192,841 ) (192,841 ) - (192,841 )
Effect of exchange rate changes
and others 8,865 560 155 3,347 12,927 24,863 37,790
Balance, June 30 $ 1,451,483 $ 172,711 $ - $ 1,053,071 $ 2,677,265 $ 9,901,496 $ 12,578,761
Note 1: The amounts of the listings of Bank SinoPac (China) in accordance with local supervision
regulation are included.
Note 2: The amounts to be replenished the allowance when the written-off is included.
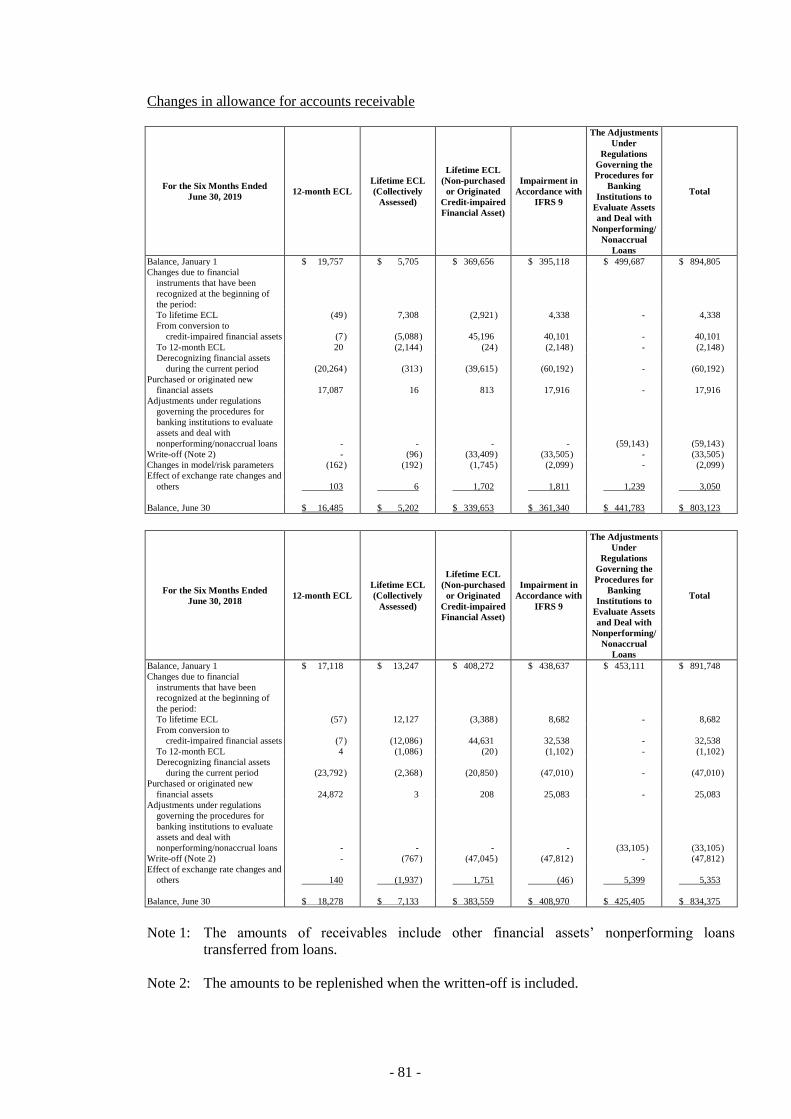
- 81 -
Changes in allowance for accounts receivable
For the Six Months Ended
June 30, 2019 12-month ECL
Lifetime ECL
(Collectively
Assessed)
Lifetime ECL
(Non-purchased
or Originated
Credit-impaired
Financial Asset)
Impairment in
Accordance with
IFRS 9
The Adjustments
Under
Regulations
Governing the
Procedures for
Banking
Institutions to
Evaluate Assets
and Deal with
Nonperforming/
Nonaccrual
Loans
Total
Balance, January 1 $ 19,757 $ 5,705 $ 369,656 $ 395,118 $ 499,687 $ 894,805
Changes due to financial
instruments that have been
recognized at the beginning of
the period:
To lifetime ECL (49 ) 7,308 (2,921 ) 4,338 - 4,338
From conversion to
credit-impaired financial assets (7 ) (5,088 ) 45,196 40,101 - 40,101
To 12-month ECL 20 (2,144 ) (24 ) (2,148 ) - (2,148 )
Derecognizing financial assets
during the current period (20,264 ) (313 ) (39,615 ) (60,192 ) - (60,192 )
Purchased or originated new
financial assets 17,087 16 813 17,916 - 17,916
Adjustments under regulations
governing the procedures for
banking institutions to evaluate
assets and deal with
nonperforming/nonaccrual loans - - - - (59,143 ) (59,143 )
Write-off (Note 2) - (96 ) (33,409 ) (33,505 ) - (33,505 )
Changes in model/risk parameters (162 ) (192 ) (1,745 ) (2,099 ) - (2,099 )
Effect of exchange rate changes and
others 103 6 1,702 1,811 1,239 3,050
Balance, June 30 $ 16,485 $ 5,202 $ 339,653 $ 361,340 $ 441,783 $ 803,123
For the Six Months Ended
June 30, 2018 12-month ECL
Lifetime ECL
(Collectively
Assessed)
Lifetime ECL
(Non-purchased
or Originated
Credit-impaired
Financial Asset)
Impairment in
Accordance with
IFRS 9
The Adjustments
Under
Regulations
Governing the
Procedures for
Banking
Institutions to
Evaluate Assets
and Deal with
Nonperforming/
Nonaccrual
Loans
Total
Balance, January 1 $ 17,118 $ 13,247 $ 408,272 $ 438,637 $ 453,111 $ 891,748
Changes due to financial
instruments that have been
recognized at the beginning of
the period:
To lifetime ECL (57 ) 12,127 (3,388 ) 8,682 - 8,682
From conversion to
credit-impaired financial assets (7 ) (12,086 ) 44,631 32,538 - 32,538
To 12-month ECL 4 (1,086 ) (20 ) (1,102 ) - (1,102 )
Derecognizing financial assets
during the current period (23,792 ) (2,368 ) (20,850 ) (47,010 ) - (47,010 )
Purchased or originated new
financial assets 24,872 3 208 25,083 - 25,083
Adjustments under regulations
governing the procedures for
banking institutions to evaluate
assets and deal with
nonperforming/nonaccrual loans - - - - (33,105 ) (33,105 )
Write-off (Note 2) - (767 ) (47,045 ) (47,812 ) - (47,812 )
Effect of exchange rate changes and
others 140 (1,937 ) 1,751 (46 ) 5,399 5,353
Balance, June 30 $ 18,278 $ 7,133 $ 383,559 $ 408,970 $ 425,405 $ 834,375
Note 1: The amounts of receivables include other financial assets’ nonperforming loans
transferred from loans.
Note 2: The amounts to be replenished when the written-off is included.

- 82 -
11) The maximum credit exposure of the financial instruments held by the Bank and Bank SinoPac
(China) Ltd.
Maximum credit exposures of assets on balance sheet (excluding collaterals and other credit
enhancement instruments) are almost equivalent to the carrying value. The maximum credit
exposures (excluding collaterals, other credit enhancement instruments and undrawn maximum
exposure) off balance sheet are shown as follows:
Off-Balance Sheet Items
The Maximum Credit Exposure
June 30, 2019 December 31,
2018 June 30, 2018
Undrawn credit card commitments $ 166,369,721 $ 157,665,810 $ 153,643,616
Undrawn loan commitments 29,243,297 21,429,676 18,455,265
Guarantees 18,083,869 16,416,274 21,616,351
Standby letter of credit 4,784,873 3,796,932 3,141,045
The Bank and Bank SinoPac (China) Ltd. adopt a strict and continuous evaluation procedure and
review the result regularly to control and minimize off-balance sheet credit risk exposures.
The contract amount in the credit business and financial instruments may not be fully paid before
the maturity; therefore, the contract amount is not deemed as the amount of future cash outflow. In
other words, the future cash demand is lower than contract amount. If the credit limit is exceeded
and collaterals lose their value, the amount of credit risk is equal to the contract amount which is the
possible maximum loss.
12) Credit risk exposures concentration of the Group
When financial instruments transactions concentrated on one counter-party or several
counter-parties, which engaged in similar business activities, had similar economic characteristics
and abilities to execute contracts, the credit risk concentration arises.
Credit risk concentrations can arise in the Group’s assets, liabilities or off-balance sheet items
through the execution or processing of transactions (either product or service) or through a
combination of exposures across these broad categories. It includes credit, loan and deposits, call
loan to banks, investment, receivables and derivatives. The Group maintains a diversified portfolio
to limit its exposure to any geographic region, country or individual creditor and monitor its
exposures continually. The Group’s most significant concentrations of credit risk are summarized
by industry, region and collateral as follows:
a) By industry
Industries June 30, 2019 December 31, 2018 June 30, 2018
Amount % Amount % Amount %
Private enterprise $ 507,716,562 49.29 $ 453,640,544 48.64 $ 409,369,267 45.97
Public enterprise 9,618,079 0.93 11,883,947 1.28 10,869,325 1.22
Government sponsored
enterprise and business 9,263,330 0.90 4,126,846 0.44 4,417,233 0.50
Nonprofit organization 289,858 0.03 217,467 0.02 131,816 0.01
Private 482,552,993 46.84 447,344,776 47.97 438,839,755 49.28
Financial institutions 20,697,540 2.01 15,415,404 1.65 26,861,641 3.02
Total $ 1,030,138,362 100.00 $ 932,628,984 100.00 $ 890,489,037 100.00
- 83 -
b) By region
Regions June 30, 2019 December 31, 2018 June 30, 2018
Amount % Amount % Amount %
Domestic $ 844,703,445 82.00 $ 785,273,030 84.20 $ 745,881,752 83.76
Asia 103,132,640 10.01 83,307,763 8.93 84,944,000 9.54
North America 55,072,724 5.35 41,589,575 4.46 37,654,716 4.23
Others 27,229,553 2.64 22,458,616 2.41 22,008,569 2.47
Total $ 1,030,138,362 100.00 $ 932,628,984 100.00 $ 890,489,037 100.00
c) By collateral
Collaterals June 30, 2019 December 31, 2018 June 30, 2018
Amount % Amount % Amount %
Credit $ 384,748,149 37.35 $ 340,758,579 36.54 $ 312,075,012 35.05
Secured
Stocks 4,021,229 0.39 3,492,609 0.37 4,620,027 0.52
Bonds 17,470,331 1.69 16,043,250 1.72 13,779,875 1.55
Real estate 568,343,881 55.17 524,644,868 56.25 513,312,976 57.64
Movable collaterals 32,620,813 3.17 27,214,932 2.92 23,705,709 2.66
Guarantees 9,962,975 0.97 8,100,113 0.87 10,420,934 1.17
Others 12,970,984 1.26 12,374,633 1.33 12,574,504 1.41
Total $ 1,030,138,362 100.00 $ 932,628,984 100.00 $ 890,489,037 100.00

- 84 -
d) Credit risk exposure rating
June 30, 2019
Principal Allowance
Stage 1
12 Months ECL
Stage 2
Lifetime ECL
(Collectively
Assessed)
Stage 3
Lifetime ECL
(Non-purchased
or Originated
Credit-impaired
Financial Asset)
Total Stage 1
12 Months ECL
Stage 2
Lifetime ECL
(Collectively
Assessed)
Stage 3
Lifetime ECL
(Non-purchased
or Originated
Credit-impaired
Financial Asset)
The Adjustments
Under
Regulations
Governing the
Procedures for
Banking
Institutions to
Evaluate Assets
and Deal with
Nonperforming
Nonaccrual
Loans (Note 1)
Total
Discounts and loans
Corporate banking $ 545,771,288 $ 602,715 $ 2,683,367 $ 549,057,370 $ 1,076,000 $ 76,278 $ 681,693 $ 5,529,510 $ 7,363,481
Consumer banking 474,802,082 4,710,908 1,568,002 481,080,992 64,131 132,819 233,428 5,987,360 6,417,738 Receivables
Credit card 16,816,194 234,346 888,298 17,938,838 3,173 4,532 53,850 158,759 220,314
Accounts receivable - factoring (Note 2) 8,188,398 - - 8,188,398 1,360 - - 121,448 122,808
Other receivable (Note 3) 19,410,171 12,125 336,396 19,758,692 11,952 670 285,803 161,576 460,001
December 31, 2018
Principal Allowance
Stage 1
12 Months ECL
Stage 2
Lifetime ECL
(Collectively
Assessed)
Stage 3
Lifetime ECL
(Non-purchased
or Originated
Credit-impaired
Financial Asset)
Total Stage 1
12 Months ECL
Stage 2
Lifetime ECL
(Collectively
Assessed)
Stage 3
Lifetime ECL
(Non-purchased
or Originated
Credit-impaired
Financial Asset)
The Adjustments
Under
Regulations
Governing the
Procedures for
Banking
Institutions to
Evaluate Assets
and Deal with
Nonperforming
Nonaccrual
Loans (Note 1)
Total
Discounts and loans
Corporate banking $ 482,797,976 $ 365,015 $ 2,875,406 $ 486,038,397 $ 1,488,884 $ 194,797 $ 833,836 $ 4,520,625 $ 7,038,142
Consumer banking 440,539,124 4,617,595 1,433,868 446,590,587 53,172 123,755 203,123 5,594,937 5,974,987 Receivables
Credit card 14,289,719 234,006 906,867 15,430,592 3,219 5,198 58,601 153,432 220,450
Accounts receivable - factoring (Note 2) 12,785,897 - - 12,785,897 5,765 - - 185,424 191,189
Other receivable (Note 3) 18,041,742 9,631 353,264 18,404,637 10,773 507 311,055 160,831 483,166
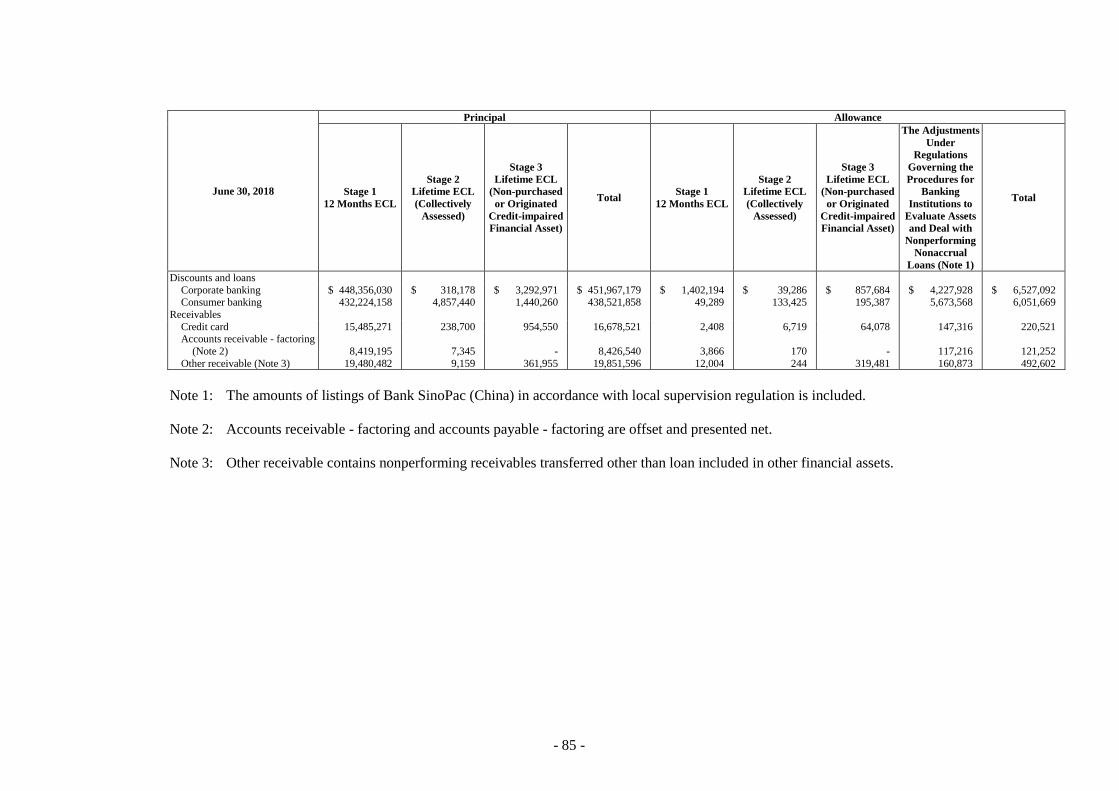
- 85 -
June 30, 2018
Principal Allowance
Stage 1
12 Months ECL
Stage 2
Lifetime ECL
(Collectively
Assessed)
Stage 3
Lifetime ECL
(Non-purchased
or Originated
Credit-impaired
Financial Asset)
Total Stage 1
12 Months ECL
Stage 2
Lifetime ECL
(Collectively
Assessed)
Stage 3
Lifetime ECL
(Non-purchased
or Originated
Credit-impaired
Financial Asset)
The Adjustments
Under
Regulations
Governing the
Procedures for
Banking
Institutions to
Evaluate Assets
and Deal with
Nonperforming
Nonaccrual
Loans (Note 1)
Total
Discounts and loans
Corporate banking $ 448,356,030 $ 318,178 $ 3,292,971 $ 451,967,179 $ 1,402,194 $ 39,286 $ 857,684 $ 4,227,928 $ 6,527,092 Consumer banking 432,224,158 4,857,440 1,440,260 438,521,858 49,289 133,425 195,387 5,673,568 6,051,669
Receivables
Credit card 15,485,271 238,700 954,550 16,678,521 2,408 6,719 64,078 147,316 220,521 Accounts receivable - factoring
(Note 2) 8,419,195 7,345 - 8,426,540 3,866 170 - 117,216 121,252
Other receivable (Note 3) 19,480,482 9,159 361,955 19,851,596 12,004 244 319,481 160,873 492,602
Note 1: The amounts of listings of Bank SinoPac (China) in accordance with local supervision regulation is included.
Note 2: Accounts receivable - factoring and accounts payable - factoring are offset and presented net.
Note 3: Other receivable contains nonperforming receivables transferred other than loan included in other financial assets.
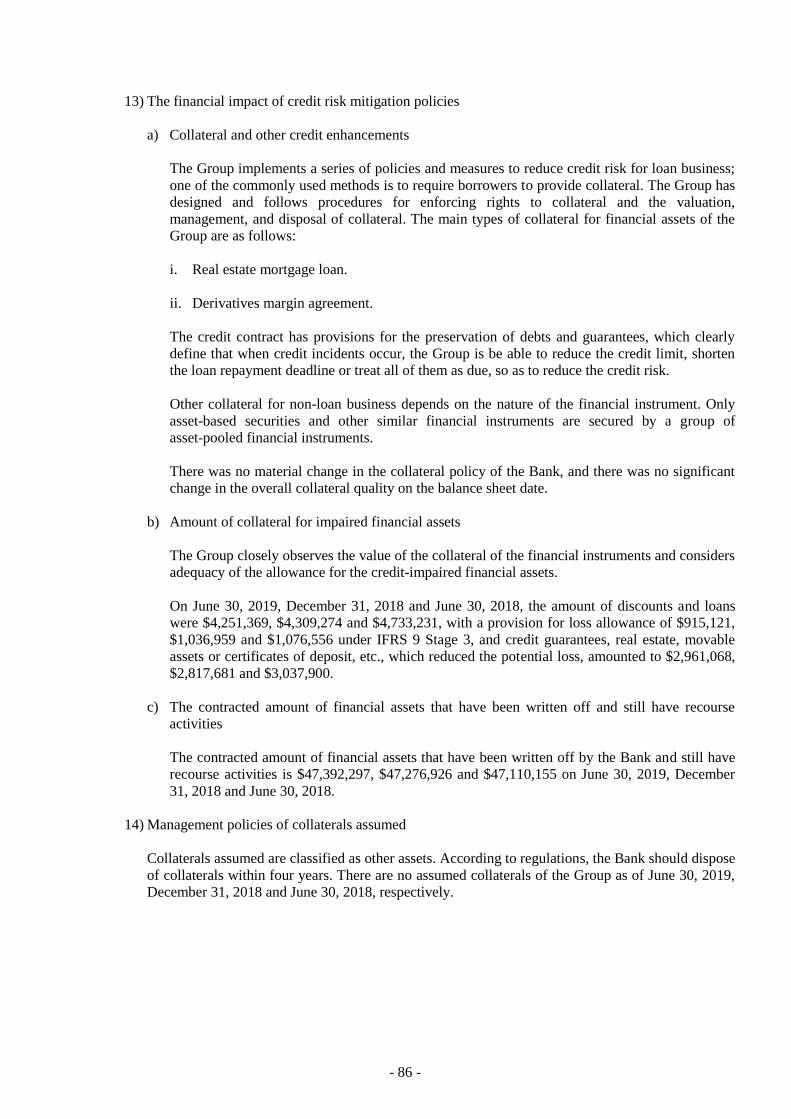
- 86 -
13) The financial impact of credit risk mitigation policies
a) Collateral and other credit enhancements
The Group implements a series of policies and measures to reduce credit risk for loan business;
one of the commonly used methods is to require borrowers to provide collateral. The Group has
designed and follows procedures for enforcing rights to collateral and the valuation,
management, and disposal of collateral. The main types of collateral for financial assets of the
Group are as follows:
i. Real estate mortgage loan.
ii. Derivatives margin agreement.
The credit contract has provisions for the preservation of debts and guarantees, which clearly
define that when credit incidents occur, the Group is be able to reduce the credit limit, shorten
the loan repayment deadline or treat all of them as due, so as to reduce the credit risk.
Other collateral for non-loan business depends on the nature of the financial instrument. Only
asset-based securities and other similar financial instruments are secured by a group of
asset-pooled financial instruments.
There was no material change in the collateral policy of the Bank, and there was no significant
change in the overall collateral quality on the balance sheet date.
b) Amount of collateral for impaired financial assets
The Group closely observes the value of the collateral of the financial instruments and considers
adequacy of the allowance for the credit-impaired financial assets.
On June 30, 2019, December 31, 2018 and June 30, 2018, the amount of discounts and loans
were $4,251,369, $4,309,274 and $4,733,231, with a provision for loss allowance of $915,121,
$1,036,959 and $1,076,556 under IFRS 9 Stage 3, and credit guarantees, real estate, movable
assets or certificates of deposit, etc., which reduced the potential loss, amounted to $2,961,068,
$2,817,681 and $3,037,900.
c) The contracted amount of financial assets that have been written off and still have recourse
activities
The contracted amount of financial assets that have been written off by the Bank and still have
recourse activities is $47,392,297, $47,276,926 and $47,110,155 on June 30, 2019, December
31, 2018 and June 30, 2018.
14) Management policies of collaterals assumed
Collaterals assumed are classified as other assets. According to regulations, the Bank should dispose
of collaterals within four years. There are no assumed collaterals of the Group as of June 30, 2019,
December 31, 2018 and June 30, 2018, respectively.
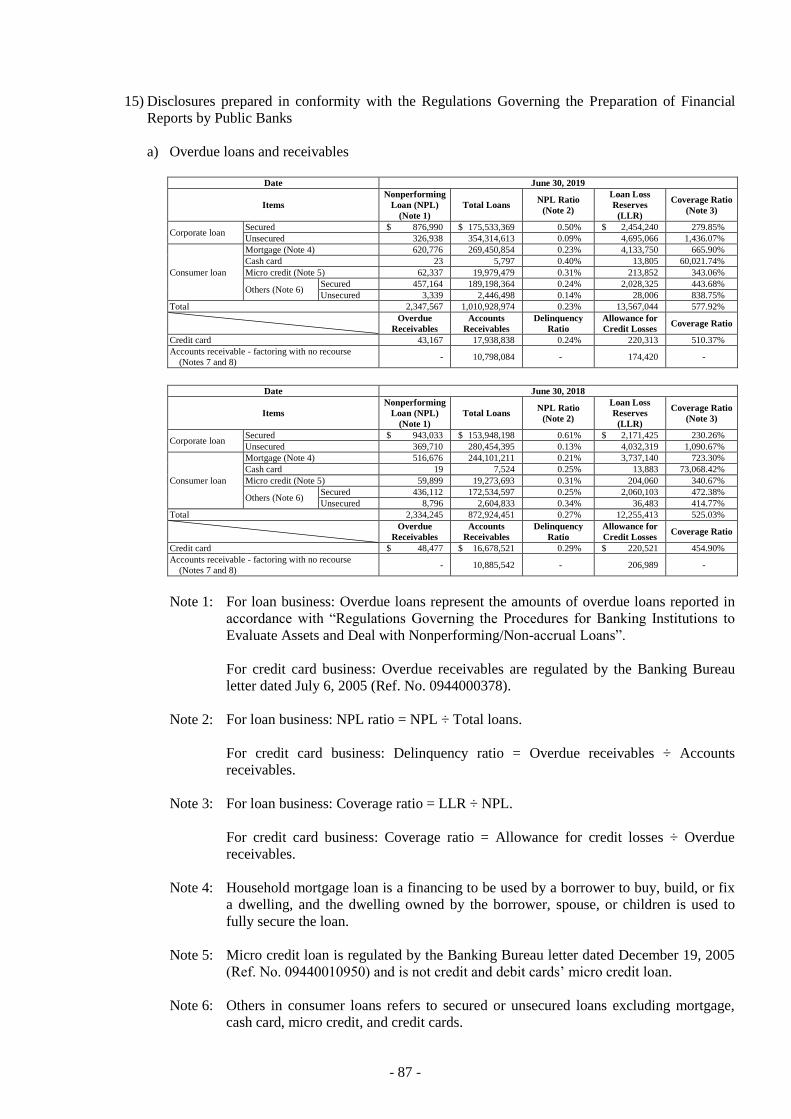
- 87 -
15) Disclosures prepared in conformity with the Regulations Governing the Preparation of Financial
Reports by Public Banks
a) Overdue loans and receivables
Date June 30, 2019
Items
Nonperforming
Loan (NPL)
(Note 1)
Total Loans NPL Ratio
(Note 2)
Loan Loss
Reserves
(LLR)
Coverage Ratio
(Note 3)
Corporate loan Secured $ 876,990 $ 175,533,369 0.50% $ 2,454,240 279.85%
Unsecured 326,938 354,314,613 0.09% 4,695,066 1,436.07%
Consumer loan
Mortgage (Note 4) 620,776 269,450,854 0.23% 4,133,750 665.90%
Cash card 23 5,797 0.40% 13,805 60,021.74%
Micro credit (Note 5) 62,337 19,979,479 0.31% 213,852 343.06%
Others (Note 6) Secured 457,164 189,198,364 0.24% 2,028,325 443.68%
Unsecured 3,339 2,446,498 0.14% 28,006 838.75%
Total 2,347,567 1,010,928,974 0.23% 13,567,044 577.92%
Overdue
Receivables
Accounts
Receivables
Delinquency
Ratio
Allowance for
Credit Losses Coverage Ratio
Credit card 43,167 17,938,838 0.24% 220,313 510.37%
Accounts receivable - factoring with no recourse
(Notes 7 and 8) - 10,798,084 - 174,420 -
Date June 30, 2018
Items
Nonperforming
Loan (NPL)
(Note 1)
Total Loans NPL Ratio
(Note 2)
Loan Loss
Reserves
(LLR)
Coverage Ratio
(Note 3)
Corporate loan Secured $ 943,033 $ 153,948,198 0.61% $ 2,171,425 230.26%
Unsecured 369,710 280,454,395 0.13% 4,032,319 1,090.67%
Consumer loan
Mortgage (Note 4) 516,676 244,101,211 0.21% 3,737,140 723.30%
Cash card 19 7,524 0.25% 13,883 73,068.42%
Micro credit (Note 5) 59,899 19,273,693 0.31% 204,060 340.67%
Others (Note 6) Secured 436,112 172,534,597 0.25% 2,060,103 472.38%
Unsecured 8,796 2,604,833 0.34% 36,483 414.77%
Total 2,334,245 872,924,451 0.27% 12,255,413 525.03%
Overdue
Receivables
Accounts
Receivables
Delinquency
Ratio
Allowance for
Credit Losses Coverage Ratio
Credit card $ 48,477 $ 16,678,521 0.29% $ 220,521 454.90%
Accounts receivable - factoring with no recourse
(Notes 7 and 8) - 10,885,542 - 206,989 -
Note 1: For loan business: Overdue loans represent the amounts of overdue loans reported in
accordance with “Regulations Governing the Procedures for Banking Institutions to
Evaluate Assets and Deal with Nonperforming/Non-accrual Loans”.
For credit card business: Overdue receivables are regulated by the Banking Bureau
letter dated July 6, 2005 (Ref. No. 0944000378).
Note 2: For loan business: NPL ratio = NPL ÷ Total loans.
For credit card business: Delinquency ratio = Overdue receivables ÷ Accounts
receivables.
Note 3: For loan business: Coverage ratio = LLR ÷ NPL.
For credit card business: Coverage ratio = Allowance for credit losses ÷ Overdue
receivables.
Note 4: Household mortgage loan is a financing to be used by a borrower to buy, build, or fix
a dwelling, and the dwelling owned by the borrower, spouse, or children is used to
fully secure the loan.
Note 5: Micro credit loan is regulated by the Banking Bureau letter dated December 19, 2005
(Ref. No. 09440010950) and is not credit and debit cards’ micro credit loan.
Note 6: Others in consumer loans refers to secured or unsecured loans excluding mortgage,
cash card, micro credit, and credit cards.
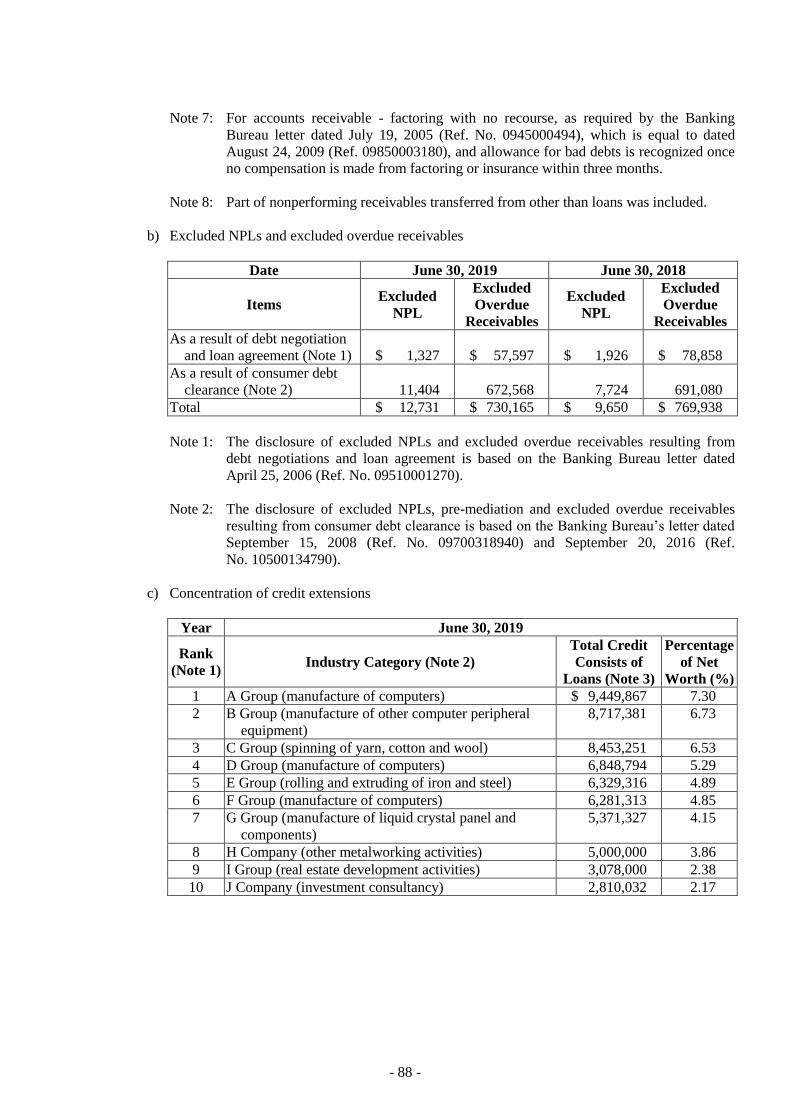
- 88 -
Note 7: For accounts receivable - factoring with no recourse, as required by the Banking
Bureau letter dated July 19, 2005 (Ref. No. 0945000494), which is equal to dated
August 24, 2009 (Ref. 09850003180), and allowance for bad debts is recognized once
no compensation is made from factoring or insurance within three months.
Note 8: Part of nonperforming receivables transferred from other than loans was included.
b) Excluded NPLs and excluded overdue receivables
Date June 30, 2019 June 30, 2018
Items Excluded
NPL
Excluded
Overdue
Receivables
Excluded
NPL
Excluded
Overdue
Receivables
As a result of debt negotiation
and loan agreement (Note 1) $ 1,327 $ 57,597 $ 1,926 $ 78,858
As a result of consumer debt
clearance (Note 2) 11,404 672,568 7,724 691,080
Total $ 12,731 $ 730,165 $ 9,650 $ 769,938
Note 1: The disclosure of excluded NPLs and excluded overdue receivables resulting from
debt negotiations and loan agreement is based on the Banking Bureau letter dated
April 25, 2006 (Ref. No. 09510001270).
Note 2: The disclosure of excluded NPLs, pre-mediation and excluded overdue receivables
resulting from consumer debt clearance is based on the Banking Bureau’s letter dated
September 15, 2008 (Ref. No. 09700318940) and September 20, 2016 (Ref.
No. 10500134790).
c) Concentration of credit extensions
Year June 30, 2019
Rank
(Note 1) Industry Category (Note 2)
Total Credit
Consists of
Loans (Note 3)
Percentage
of Net
Worth (%)
1 A Group (manufacture of computers) $ 9,449,867 7.30
2 B Group (manufacture of other computer peripheral
equipment)
8,717,381 6.73
3 C Group (spinning of yarn, cotton and wool) 8,453,251 6.53
4 D Group (manufacture of computers) 6,848,794 5.29
5 E Group (rolling and extruding of iron and steel) 6,329,316 4.89
6 F Group (manufacture of computers) 6,281,313 4.85
7 G Group (manufacture of liquid crystal panel and
components)
5,371,327 4.15
8 H Company (other metalworking activities) 5,000,000 3.86
9 I Group (real estate development activities) 3,078,000 2.38
10 J Company (investment consultancy) 2,810,032 2.17

- 89 -
Year June 30, 2018
Rank
(Note 1) Industry Category (Note 2)
Total Credit
Consists of
Loans (Note 3)
Percentage
of Net
Worth (%)
1 A Group (manufacture of computers) $ 8,645,636 6.94
2 B Group (manufacture of liquid crystal panel and
components)
5,230,020 4.20
3 C Group (rolling and extruding of iron and steel) 5,171,178 4.15
4 D Company (manufacture of metal die) 5,000,000 4.01
5 E Group (manufacture of computers) 4,684,762 3.76
6 F Group (manufacture of other computer peripheral
equipment)
4,519,672 3.63
7 G Group (wired telecommunications activities) 3,582,495 2.87
8 H Group (securities) 3,475,000 2.79
9 I Group (government) 3,050,575 2.45
10 J Company (manufacture of other computer peripheral
equipment)
2,894,115 2.32
Note 1: Ranking of top 10 groups (excluding government or state - owned utilities) whose
total credit consists of loans.
Note 2: Groups were those as defined in Articles 6 of the Supplementary Provision to the
Taiwan Stock Exchange Corporation’s Rules for Review of Securities Listings Law.
Note 3: Total credit is the sum of all loans (including import and export bills negotiated,
discounts, overdrafts, short-term loans, short-term secured loans, marginal receivables,
medium-term loans, medium-term secured loans, long-term loans, long-term secured
loans, and nonperforming loans), exchange bills negotiated, accounts receivable
factored without recourse, acceptances receivable, and guarantee deposit issued.
d. Liquidity risk management
1) Definition of liquidity risk
Liquidity is the Bank’s ability to provide sufficient funding for asset growth and matured liabilities.
Liquidity risk means the risk banks cannot obtain sufficient fund with reasonable cost and correct
timing, and then suffer losses on earnings or capital.
The measures of enhancing cash liquidity are holding sufficient cash and highly liquid able
securities, adjusting maturities differences, savings absorption or arranging borrowings, etc.
a) Strategies
The Bank established a sound liquidity risk managing system based on business’ scale and
characteristic, assets and liabilities’ structure, funding strategies and diversity of funding
sources to ensure it would have sufficient funding for obligations in normal or worst scenario.
b) Risk measurement
The Bank uses quantitative analysis to manage liquidity risk. Cash flow deficit and liquidity
management goals are used as measure instruments to report monthly the analysis results to the
assets and liabilities managing committee.

- 90 -
Stress testing is done to ensure the Bank would have sufficient funding for asset growth and
matured liabilities despite any internal operating problems or adverse changes in the financial
environment.
c) Risk monitoring
The Bank established a liquidity deficit limit and an early warning system to detect liquidity risk
and take appropriate action at the right time.
The Bank has formed a crisis management team to handle any liquidity crisis. The general
manager is the team convener, and the managers of the financial obligation department and the
risk management department are the team members. The general manager can also assign the
managers of related departments to join the team, depending on the situation. Members’ rights
and responsibilities are listed in “Bank SinoPac’s Liquidity Risk Emergency Response Rule”.
2) Maturity analysis of financial liabilities held to manage liquidity risk
a) Maturity analysis of non-derivative financial liabilities
Cash outflow analyses of non-derivative financial liabilities of the Bank and Bank SinoPac
(China) are summarized in the following tables. The amounts are provided on a contract cash
flow basis so some of the amounts will not match the amounts in the consolidated balance
sheets.
The Bank
June 30, 2019 0-30 Days 31-90 Days 91-180 Days 181 Days to 1 Year Over 1 Year Total
Deposits from the Central Bank and banks $ 21,984,724 $ 8,975,093 $ 12,753,093 $ 5,096,884 $ - $ 48,809,794
Financial liabilities at fair value through
profit or loss - - - - 1,742,872 1,742,872
Securities sold under repurchase
agreements 5,322,294 6,319,034 3,359,184 - - 15,000,512
Payables 9,202,463 540,060 85,404 1,670,581 2,544,061 14,042,569
Deposits and remittances 724,853,147 189,952,352 153,031,100 236,505,948 27,857,621 1,332,200,168
Bank debentures 73,965 6,857,788 99,488 4,722,386 28,061,064 39,814,691
Other financial liabilities - certificate of
deposit - - 311,131 - - 311,131
December 31, 2018 0-30 Days 31-90 Days 91-180 Days 181 Days to 1 Year Over 1 Year Total
Deposits from the Central Bank and banks $ 20,918,546 $ 10,159,918 $ 2,630,152 $ 948,255 $ - $ 34,656,871
Financial liabilities at fair value through
profit or loss - - - - 1,724,486 1,724,486
Securities sold under repurchase
agreements 18,359,589 2,959,860 4,309,792 - - 25,629,241
Payables 9,315,463 794,156 455,975 94,401 2,086,294 12,746,289
Deposits and remittances 681,629,361 161,666,678 116,558,942 201,872,039 25,871,769 1,187,598,789
Bank debentures 60,504 1,664,195 81,796 11,596,898 21,524,156 34,927,549
Other financial liabilities - certificate of
deposit - - - 307,838 - 307,838
June 30, 2018 0-30 Days 31-90 Days 91-180 Days 181 Days to 1 Year Over 1 Year Total
Deposits from the Central Bank and banks $ 40,319,817 $ 5,165,370 $ 4,373,257 $ 2,765,615 $ - $ 52,624,059
Financial liabilities at fair value through
profit or loss - - - - 1,710,707 1,710,707
Securities sold under repurchase
agreements 23,541,133 5,060,924 - - - 28,602,057
Payables 13,329,652 985,002 536,621 1,529,847 2,253,775 18,634,897
Deposits and remittances 654,624,166 147,612,657 117,107,792 192,101,391 24,525,119 1,135,971,125
Bank debentures 23,426 3,941,859 3,398,377 3,895,279 31,056,244 42,315,185
Bank SinoPac (China)
(In Thousands of CNY)
June 30, 2019 0-30 Days 31-90 Days 91-180 Days 181 Days to 1
Year Over 1 Year Total
Deposits from the Central Bank
and banks $ 609,176 $ 69,237 $ - $ - $ - $ 678,413 Payables 135,225 1,212 89 115,219 - 251,745
Deposits and remittances 1,046,994 914,722 1,609,125 666,446 432,555 4,669,842

- 91 -
(In Thousands of CNY)
December 31, 2018 0-30 Days 31-90 Days 91-180 Days 181 Days to 1
Year Over 1 Year Total
Deposits from the Central Bank
and banks $ 718,400 $ 367,105 $ 6,448 $ - $ - $ 1,091,953
Payables 27,607 1,235 5,932 28,707 447 63,928 Deposits and remittances 787,332 1,281,707 550,300 776,533 404,072 3,799,944
(In Thousands of CNY)
June 30, 2018 0-30 Days 31-90 Days 91-180 Days 181 Days to 1
Year Over 1 Year Total
Deposits from the Central Bank and banks $ 577,222 $ 271,785 $ 305,696 $ - $ - $ 1,154,703
Payables 25,921 1,974 170 14,644 447 43,156
Deposits and remittances 683,802 1,275,410 416,468 290,962 375,350 3,041,992
b) Maturity analysis of derivative financial liabilities
A hedging derivative financial instrument is managed within the contract period and it is
disclosed as undiscounted cash flow based on its maturity. The Bank and Bank SinoPac (China)
use derivative financial liabilities at fair value through profit or loss mainly to accommodate
customers’ needs and manage their own exposure positions, and disclosed at fair value based on
shortest period.
The Bank
June 30, 2019 0-30 Days 31-90 Days 91-180 Days 181 Days to 1
Year Over 1 Year Total
Financial liabilities at fair value
through profit or loss $ 14,666,112 $ - $ - $ - $ - $ 14,666,112
December 31, 2018 0-30 Days 31-90 Days 91-180 Days 181 Days to 1
Year Over 1 Year Total
Financial liabilities at fair value
through profit or loss $ 18,235,839 $ - $ - $ - $ - $ 18,235,839
June 30, 2018 0-30 Days 31-90 Days 91-180 Days 181 Days to 1
Year Over 1 Year Total
Financial liabilities at fair value
through profit or loss $ 20,919,925 $ - $ - $ - $ - $ 20,919,925
Bank SinoPac (China)
(In Thousands of CNY)
June 30, 2019 0-30 Days 31-90 Days 91-180 Days 181 Days to
1 Year Over 1 Year Total
Financial liabilities at fair
value through profit or
loss $ 76,914 $ - $ - $ - $ - $ 76,914
(In Thousands of CNY)
December 31, 2018 0-30 Days 31-90 Days 91-180 Days 181 Days to
1 Year Over 1 Year Total
Financial liabilities at fair
value through profit or
loss $ 6,763 $ - $ - $ - $ - $ 6,763
June 30, 2018: None.

- 92 -
3) Maturity analysis of off-balance sheet items
Maturity analysis of off-balance sheet items are summarized in the following tables. Financial
guarantee contracts of the Bank and Bank SinoPac (China) that assume full amount are available or
require to execute at the earliest time. The amounts are provided on a contract cash flow basis so
some of the amounts will not match the amounts in the consolidated balance sheets.
The Bank
June 30, 2019 0-30 Days 31-90 Days 91-180 Days 181 Days to 1
Year Over 1 Year Total
Undrawn loan commitments $ 299,943 $ 1,736,056 $ 2,751,941 $ 3,599,282 $ 20,714,766 $ 29,101,988
Guarantees 3,718,150 3,108,632 1,278,549 4,393,373 5,123,160 17,621,864
Standby letter of credit 1,471,430 1,654,392 597,762 253,478 14,839 3,991,901
December 31, 2018 0-30 Days 31-90 Days 91-180 Days 181 Days to 1
Year Over 1 Year Total
Undrawn loan commitments $ 127,470 $ 976,779 $ 847,249 $ 3,762,510 $ 15,715,668 $ 21,429,676
Guarantees 3,232,580 2,138,261 2,059,442 2,588,994 5,970,995 15,990,272
Standby letter of credit 902,827 2,045,620 749,387 43,640 - 3,741,474
June 30, 2018 0-30 Days 31-90 Days 91-180 Days 181 Days to 1
Year Over 1 Year Total
Undrawn loan commitments $ 621,680 $ 391,374 $ 1,344,663 $ 2,411,890 $ 13,685,658 $ 18,455,265
Guarantees 3,516,893 1,616,074 3,189,368 2,172,716 6,739,634 17,234,685
Standby letter of credit 1,076,777 1,474,794 443,128 94,324 - 3,089,023
Bank SinoPac (China)
(In Thousands of CNY)
June 30, 2019 0-30 Days 31-90 Days 91-180 Days 181 Days to
1 Year Over 1 Year Total
Undrawn loans commitments $ - $ - $ 31,250 $ - $ - $ 31,250
Guarantee 33,402 110,543 509,202 457,519 35,030 1,145,696
Standby letter of credit 24,391 15,395 - 135,577 - 175,363
(In Thousands of CNY)
December 31, 2018 0-30 Days 31-90 Days 91-180 Days 181 Days to
1 Year Over 1 Year Total
Guarantee $ 21,526 $ 136,612 $ 55,500 $ 664,781 $ 96,085 $ 974,504
Standby letter of credit 7,445 - 4,945 - - 12,390
(In Thousands of CNY)
June 30, 2018 0-30 Days 31-90 Days 91-180 Days 181 Days to
1 Year Over 1 Year Total
Guarantee $ 599 $ 105,299 $ 228,349 $ 614,287 $ 4,000 $ 952,534
Standby letter of credit 7,276 4,033 - - - 11,309
4) Maturity analysis of lease commitments
Lease agreement commitment is the minimum lease payment when the Group is lessee or lessor
with non-cancelling condition.
Maturity analysis of lease commitments is summarized as follows:
June 30, 2019 Less than
1 Year 1-5 Years Over 5 Years Total
Lease agreement commitments
Lease liabilities (lessee) $ 665,995 $ 1,136,792 $ 58,812 $ 1,861,599
Operating lease income (lessor) 88,808 158,490 1,474 248,772

- 93 -
December 31, 2018 Less than
1 Year 1-5 Years Over 5 Years Total
Lease commitments
Operating lease expense (lessee) $ 669,045 $ 1,061,532 $ 60,078 $ 1,790,655
Operating lease income (lessor) 89,997 178,337 3,080 271,414
Financial lease expense total
amount (lessee) 97 162 - 259
Financial lease expense present
value (lessee) 86 154 - 240
June 30, 2018 Less than
1 Year 1-5 Years Over 5 Years Total
Lease commitments
Operating lease expense (lessee) $ 469,173 $ 913,660 $ 68,706 $ 1,451,539
Operating lease income (lessor) 79,340 127,107 4,760 211,207
Financial lease expense total
amount (lessee) 97 211 - 308
Financial lease expense present
value (lessee) 83 198 - 281
5) Disclosures prepared in conformity with the Regulations Governing the Preparation of Financial
Reports by Public Banks
a) Maturity analysis of assets and liabilities of the Bank (New Taiwan dollars)
June 30, 2019
Total 0-10 Days 11-30 Days 31-90 Days 91-180 Days 181 Days to 1
Year Over 1 Year
Main capital inflow on
maturity $ 1,443,605,803 $ 193,867,897 $ 193,552,338 $ 224,772,571 $ 118,671,584 $ 100,486,796 $ 612,254,617
Main capital outflow on
maturity 1,812,303,821 110,056,417 129,192,056 294,419,955 248,011,636 350,382,332 680,241,425
Gap (368,698,018 ) 83,811,480 64,360,282 (69,647,384 ) (129,340,052 ) (249,895,536 ) (67,986,808 )
June 30, 2018
Total 0-10 Days 11-30 Days 31-90 Days 91-180 Days 181 Days to 1
Year Over 1 Year
Main capital inflow on
maturity $ 1,236,633,382 $ 140,016,163 $ 214,141,641 $ 186,656,042 $ 95,452,412 $ 74,904,311 $ 525,462,813
Main capital outflow on
maturity 1,605,482,906 94,997,892 126,351,611 246,075,097 212,352,407 302,416,268 623,289,631
Gap (368,849,524 ) 45,018,271 87,790,030 (59,419,055 ) (116,899,995 ) (227,511,957 ) (97,826,818 )
Note: The amounts shown in this table are the Bank’s position denominated in NTD.
b) Maturity analysis of assets and liabilities of the Bank (U.S. dollars)
(In Thousands of U.S. Dollars)
June 30, 2019
Total 0-30 Days 31-90 Days 91-180 Days 181 Days to
1 Year Over 1 Year
Main capital
inflow on
maturity $ 38,363,838 $ 12,293,582 $ 9,915,444 $ 5,808,920 $ 5,863,063 $ 4,482,829
Main capital
outflow on
maturity 39,403,883 10,817,254 10,610,550 7,417,600 7,238,497 3,319,982
Gap (1,040,045) 1,476,328 (695,106) (1,608,680) (1,375,434) 1,162,847

- 94 -
(In Thousands of U.S. Dollars)
June 30, 2018
Total 0-30 Days 31-90 Days 91-180 Days 181 Days to
1 Year Over 1 Year
Main capital
inflow on
maturity $ 34,177,042 $ 12,014,247 $ 9,760,495 $ 4,585,294 $ 4,433,678 $ 3,383,328
Main capital
outflow on
maturity 34,755,220 11,132,398 9,830,268 5,398,547 5,617,803 2,776,204
Gap (578,178) 881,849 (69,773) (813,253) (1,184,125) 607,124
Note: The amounts shown in this table are the Bank’s position denominated in USD.
e. Market risk
1) Definition of market risk
Market risk arises from market changes (such as those referring to interest rates, exchange rates,
equity securities and commodity prices) which may cause the fluctuation of a financial instrument’s
fair value or future cash flow. The Bank’s net revenue and investment portfolio value may fluctuate
when risk factors above change.
The main market risks the Bank should overcome pertain to interest rate, exchange rate and equity
securities. Interest rate risks primarily refer to bonds and interest rate related derivative instruments
such as fixed rate and floating rate interest rate swaps and bond options; the exchange rate risk
refers to foreign currency investments the Bank holds such as exchange rate related derivative
instruments and foreign currency bonds; equity securities risk includes listed stocks and equity
related derivative financial instruments.
2) Management strategies and procedures
To follow the “Market Risk Management Rule” and other regulations, the Bank established
standards for risk identification, measurement, supervision and reporting to set up appropriate risk
management framework for every kind of market risk.
In accordance with the risk management limit approved by the board of directors, the Bank
supervises every loss limit and position at risk such as interest rate, exchange rate, equity security,
spot trading and forward contract, option, future, swap, and related sensitivity information derived
from spot trading to confirm that market risk exposure is accepted to the Bank.
The Bank separates its transactions into hedge and non-hedge on the basis of trading purposes. For
hedge transactions, the Bank should measure hedge relations, risk management goals and hedge
strategies. The Bank should also perform hedge testing for hedging effectiveness.
3) Organization and framework
The board of directors is the top supervision and decision making level of the Bank; it determines
every risk management procedure and limit on the basis of its operating strategy and the business
environment.
The Bank also set up a risk management department headed by a general manager to establish risk
managing principles, regulate risk managing policies, and plan and set up a risk management
system.

- 95 -
Following the internal control and segregation of duties principles, the Bank had certain related
functions with market risk exposures transformed into three independent departments: Trading, risk
control and settlement departments, usually called front office, middle office and back office.
Nevertheless, the risk management department remains in charge of market risk control, i.e., it is
responsible for identifying measuring, controlling and reporting market risk.
4) Market risk control procedure
a) Identification and measurement
Risk measurement includes exposures changes in the market of interest rates, exchange rates,
and equity securities, which affect spot trading and forward exchange, option, futures, and swap
transactions or related combined transactions derived from spot trading. The Bank set up
appropriate market risk limits based on commodity category, characteristic and complexity. The
limits are the nominal exposure limit, the risk factor sensitivity limit of options as measured by
Delta/Vega/DV01 and the loss control limit. These limits are calculated by the risk control
department through measurements (such as those of the Black & Scholes Model) provided by
financial data and company information providers (e.g. Murex and Bloomberg) based on market
prices.
b) Supervision and reporting
The Bank’s market risk management department prepares risk management reports such as
those on daily market valuations, value at risk and risk limits. If the risk is over the limit, the
department should report this situation to the transaction department and appropriate managers
in the risk management department. The department should also collect and organize bank
market risk exposure information, risk value, risk limit rules, and information on situations in
which limits are exceeded, analyze security investments, and submit regularly to the board of
directors reports on the collected information and security investment analysis.
5) Trading book risk management policies
a) Definitions
The trading book is an accounting book of the financial instruments and physical commodities
held for trading or hedged by the Bank. Held-for-trading position refers to revenues earned from
practical or impractical trading differences. Positions that should not be recorded in the trading
book are recorded in the banking book.
b) Strategies
The Bank earns revenues from trading spreads or fixed arbitrage debt and equity instruments are
held for short periods of time, purchased with the intention of profiting from short-term price
changes through properly control short-term fluctuation of market risk factors (interest rate,
exchange rate and stock price). It executes hedge transactions as needed.
c) Policies and procedures
The Bank carries out “Market Risk Management Policy” to control market risk.
Under the above policy, traders may autonomously operate and manage positions within the
range of authorized limits and the approved trading strategy. The market risk management
department supervises trading positions (including limit, liquidity, the ability to establish hedge
positions and investment portfolio risk) based on market information and evaluates market
information quality, acquirability, liquidity and scale which are calculated into the pricing
model.
- 96 -
d) Assessment policies
The Bank assesses financial instruments once a day on the basis of information obtained from
independent sources if market prices are acquirable. If the Bank assesses financial instruments
using a pricing model, it should be careful in making mathematical calculations and should
review the pricing model’s assumptions and parameters regularly.
e) Measurements
i. The risk valuation and calculation methods are described in Note 44 e, 10).
ii. The calculation of the nominal exposure amount and the risk factor sensitivity value
Delta/Vega/DV01 is done through the trading systems.
iii. The Bank makes stress tests using a light scenario (change in interest rate ± 100 bp, change
in securities ± 15% and change in exchange rate ± 3%) and serious scenario (change in
interest rate ± 200 bp, change in securities ± 30% and change in exchange rate ± 6%) and
reports the stress test results to the board of directors.
6) Trading book interest rate risk management
a) Definitions
Interest rate risk refers to a decrease in earnings and value of financial instruments due to
adverse interest rate fluctuations. Major instruments with interest rate risk include securities and
derivative instruments.
b) Procedures
The Bank has a trading limit and a stop-loss limit (which should be applied to trading
instrument by the dealing room and dealers) based on management strategy and market
conditions; limits have been approved by the board of directors.
c) Measurements
i. The risk valuation assumptions and calculation methods are described in Note 44 e, 10).
ii. DV01 is used daily to measure the impact of interest rate changes on investment portfolios.
7) Trading book exchange rate risk management
a) Definitions
Exchange rate risk refers to the incurrence of loss from the exchange of currencies in different
timing. The Bank’s major financial instruments exposed to exchange rate risk spot contract,
forward contracts, and FX option.
b) Policies and procedures
To control the exchange rate risk, the Bank sets trading limit and stop-loss limit and requires the
dealing room, dealers, etc., to observe these limits.
- 97 -
c) Measurements
i. The risk valuation assumptions and calculation methods are described in Note 44 e, 10).
ii. Exposure positions are measured daily for the impact of exchange rate changes on
investment portfolio value.
8) Trading book equity risk management
a) Definitions
Market risk of equity securities includes individual risk which arises from volatility of market
price on individual equity securities and general market risk which arises from volatility of
overall market price.
b) Procedures
To control equity risk, the Bank sets investment position limits and stop-loss limits. The limits
are approved by the board of directors. Within the limit of authority, The Bank sets investment
position limits and stop-loss limits for each dealer.
c) Measurements
i. The risk valuation assumptions and calculation methods are described in Note 44 e, 10).
ii. Exposure positions are measured daily to measure the impact of equity risk on investment
portfolio value due from equity risk.
9) Banking book interest rate risk management
Banking book interest rate risk refers to the decrease in the value of the banking book portfolio due
to unfavorable interest rate changes. The banking book interest rate risk is not related to the interest
rate position shown in the trading book.
Through managing the banking book interest rate risk, the Bank can measure and manage the risk to
earnings and financial position caused by interest rate fluctuations.
a) Strategies
To reduce the negative effect of interest rate changes on of net interest revenue and economic
value, the Bank adjusts positions within certain limits for better performance. It reviews the
interest rate sensitivity regularly to create maximum profit and manage interest rate risk.
b) Risk measurement
Risk measurement refers to the interest rate risk of assets, liabilities, and off-balance-sheet
positions. The Bank periodically reports interest rate sensitivity positions and measures the
impact of interest rate fluctuations on interest rate-sensitive assets and net interest revenue.
c) Risk monitoring
The asset and liability management committee examines and monitors exposure to interest rate
risk on the basis of the measurement provided by the risk management sector.
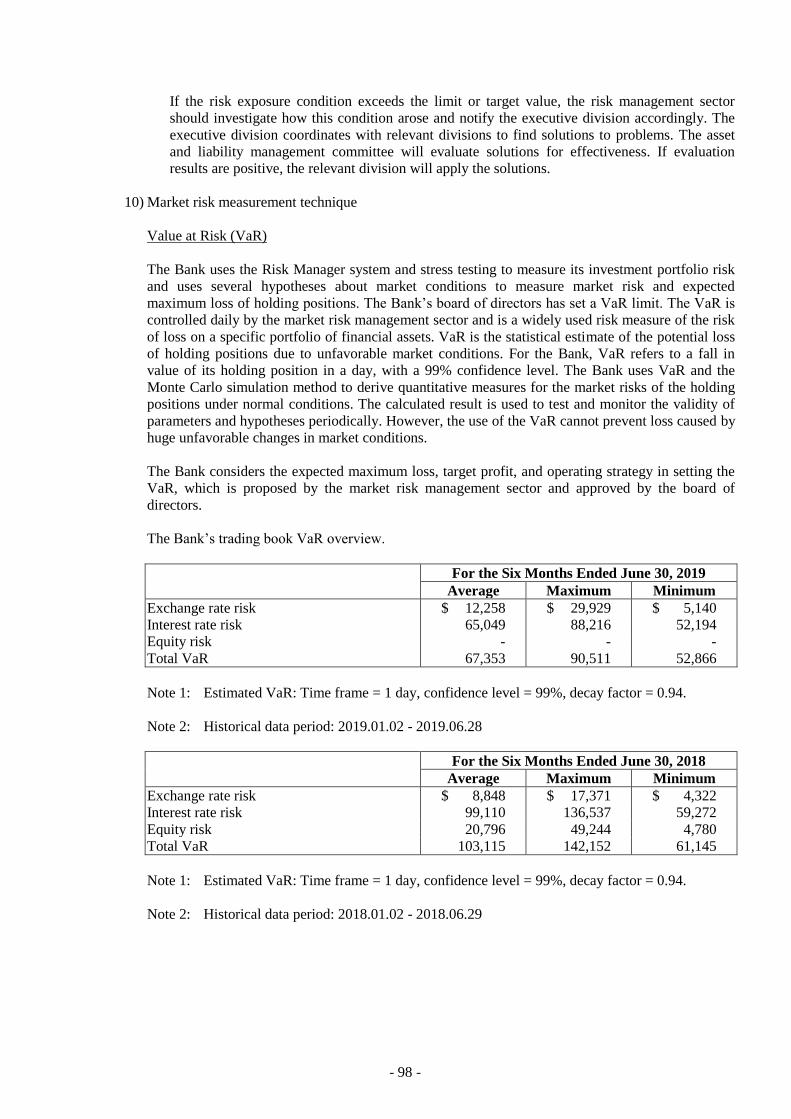
- 98 -
If the risk exposure condition exceeds the limit or target value, the risk management sector
should investigate how this condition arose and notify the executive division accordingly. The
executive division coordinates with relevant divisions to find solutions to problems. The asset
and liability management committee will evaluate solutions for effectiveness. If evaluation
results are positive, the relevant division will apply the solutions.
10) Market risk measurement technique
Value at Risk (VaR)
The Bank uses the Risk Manager system and stress testing to measure its investment portfolio risk
and uses several hypotheses about market conditions to measure market risk and expected
maximum loss of holding positions. The Bank’s board of directors has set a VaR limit. The VaR is
controlled daily by the market risk management sector and is a widely used risk measure of the risk
of loss on a specific portfolio of financial assets. VaR is the statistical estimate of the potential loss
of holding positions due to unfavorable market conditions. For the Bank, VaR refers to a fall in
value of its holding position in a day, with a 99% confidence level. The Bank uses VaR and the
Monte Carlo simulation method to derive quantitative measures for the market risks of the holding
positions under normal conditions. The calculated result is used to test and monitor the validity of
parameters and hypotheses periodically. However, the use of the VaR cannot prevent loss caused by
huge unfavorable changes in market conditions.
The Bank considers the expected maximum loss, target profit, and operating strategy in setting the
VaR, which is proposed by the market risk management sector and approved by the board of
directors.
The Bank’s trading book VaR overview.
For the Six Months Ended June 30, 2019
Average Maximum Minimum
Exchange rate risk $ 12,258 $ 29,929 $ 5,140
Interest rate risk 65,049 88,216 52,194
Equity risk - - -
Total VaR 67,353 90,511 52,866
Note 1: Estimated VaR: Time frame = 1 day, confidence level = 99%, decay factor = 0.94.
Note 2: Historical data period: 2019.01.02 - 2019.06.28
For the Six Months Ended June 30, 2018
Average Maximum Minimum
Exchange rate risk $ 8,848 $ 17,371 $ 4,322
Interest rate risk 99,110 136,537 59,272
Equity risk 20,796 49,244 4,780
Total VaR 103,115 142,152 61,145
Note 1: Estimated VaR: Time frame = 1 day, confidence level = 99%, decay factor = 0.94.
Note 2: Historical data period: 2018.01.02 - 2018.06.29

- 99 -
Bank SinoPac (China)’s trading book VaR overview.
(In Thousands of CNY)
For the Six Months Ended June 30, 2019
Average Maximum Minimum
Exchange rate risk $ 310 $ 773 $ 61
Interest rate risk 223 1,204 -
Equity risk - - -
Total VaR 436 1,266 49
Note 1: Estimated VaR: Time frame = 1 day, confidence level = 99%, decay factor = 0.94.
Note 2: Historical data period: 2019.01.01 - 2019.06.30
(In Thousands of USD)
For the Six Months Ended June 30, 2018
Average Maximum Minimum
Exchange rate risk $ 43 $ 130 $ 6
Interest rate risk 13 32 4
Equity risk - - -
Total VaR 39 99 13
Note 1: Estimated VaR: Time frame = 1 day, confidence level = 99%, decay factor = 0.94.
Note 2: Historical data period: 2018.01.02 - 2018.06.30
11) Exchange rate risks
Exchange rate risks of holding net positions in foreign currencies are shown as below:
June 30, 2019
Foreign
Currency
(In Thousands) Exchange Rate
Converted to
NTD
Financial assets
Monetary items
USD $ 10,514,995 31.07933 $ 326,798,990
CNY 14,692,855 4.52189 66,439,475
Nonmonetary items
USD 410,535 31.07933 12,759,146
Financial liabilities
Monetary items
USD 13,634,987 31.07933 423,766,266
CNY 15,362,274 4.52189 69,466,513
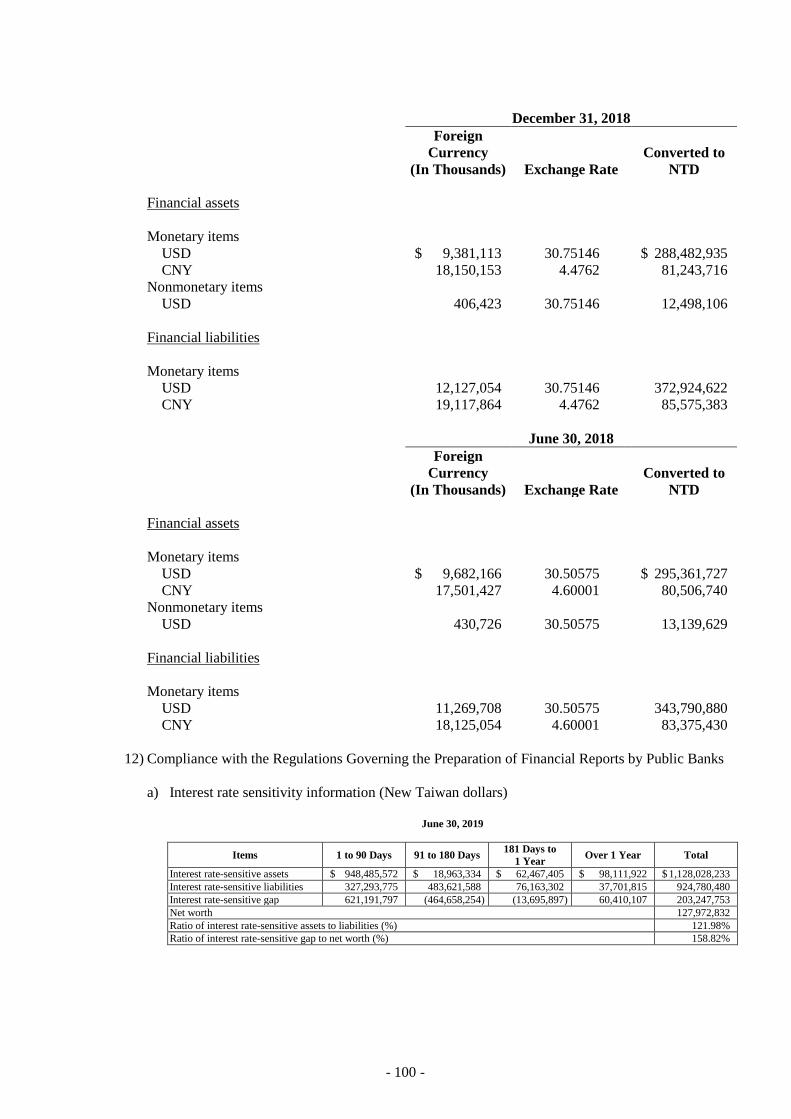
- 100 -
December 31, 2018
Foreign
Currency
(In Thousands) Exchange Rate
Converted to
NTD
Financial assets
Monetary items
USD $ 9,381,113 30.75146 $ 288,482,935
CNY 18,150,153 4.4762 81,243,716
Nonmonetary items
USD 406,423 30.75146 12,498,106
Financial liabilities
Monetary items
USD 12,127,054 30.75146 372,924,622
CNY 19,117,864 4.4762 85,575,383
June 30, 2018
Foreign
Currency
(In Thousands) Exchange Rate
Converted to
NTD
Financial assets
Monetary items
USD $ 9,682,166 30.50575 $ 295,361,727
CNY 17,501,427 4.60001 80,506,740
Nonmonetary items
USD 430,726 30.50575 13,139,629
Financial liabilities
Monetary items
USD 11,269,708 30.50575 343,790,880
CNY 18,125,054 4.60001 83,375,430
12) Compliance with the Regulations Governing the Preparation of Financial Reports by Public Banks
a) Interest rate sensitivity information (New Taiwan dollars)
June 30, 2019
Items 1 to 90 Days 91 to 180 Days 181 Days to
1 Year Over 1 Year Total
Interest rate-sensitive assets $ 948,485,572 $ 18,963,334 $ 62,467,405 $ 98,111,922 $ 1,128,028,233
Interest rate-sensitive liabilities 327,293,775 483,621,588 76,163,302 37,701,815 924,780,480
Interest rate-sensitive gap 621,191,797 (464,658,254 ) (13,695,897 ) 60,410,107 203,247,753
Net worth 127,972,832
Ratio of interest rate-sensitive assets to liabilities (%) 121.98%
Ratio of interest rate-sensitive gap to net worth (%) 158.82%
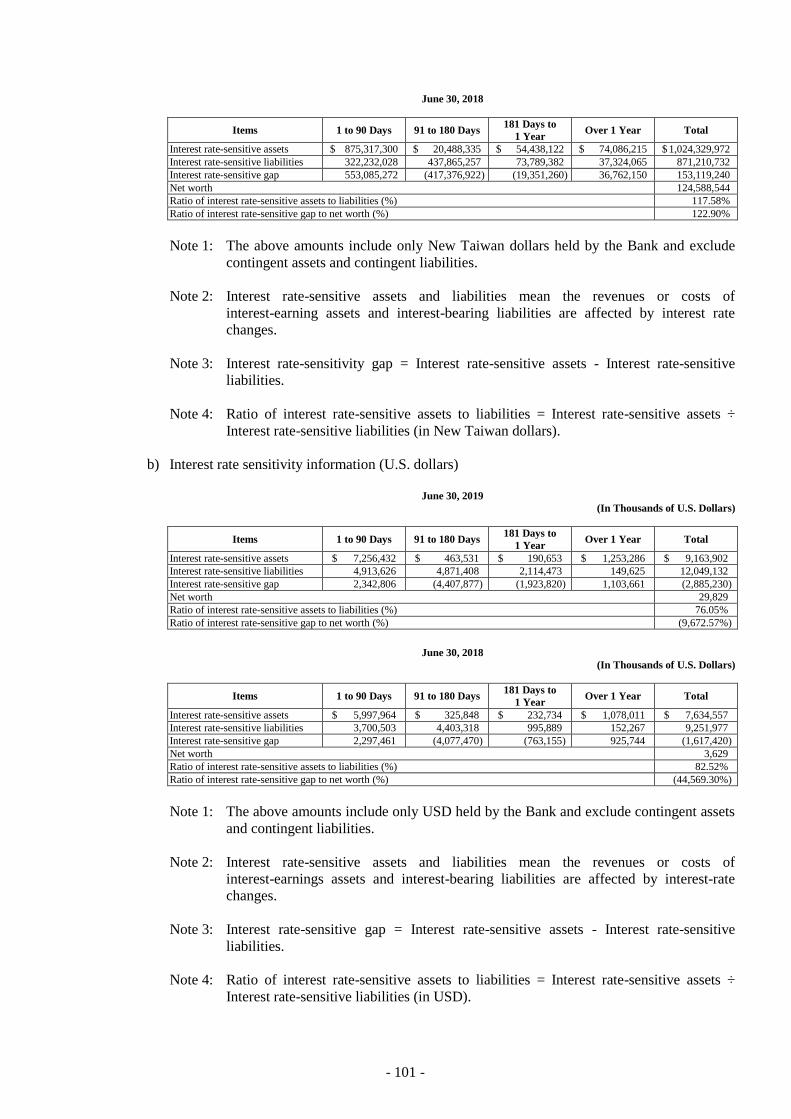
- 101 -
June 30, 2018
Items 1 to 90 Days 91 to 180 Days 181 Days to
1 Year Over 1 Year Total
Interest rate-sensitive assets $ 875,317,300 $ 20,488,335 $ 54,438,122 $ 74,086,215 $ 1,024,329,972
Interest rate-sensitive liabilities 322,232,028 437,865,257 73,789,382 37,324,065 871,210,732
Interest rate-sensitive gap 553,085,272 (417,376,922 ) (19,351,260 ) 36,762,150 153,119,240
Net worth 124,588,544
Ratio of interest rate-sensitive assets to liabilities (%) 117.58%
Ratio of interest rate-sensitive gap to net worth (%) 122.90%
Note 1: The above amounts include only New Taiwan dollars held by the Bank and exclude
contingent assets and contingent liabilities.
Note 2: Interest rate-sensitive assets and liabilities mean the revenues or costs of
interest-earning assets and interest-bearing liabilities are affected by interest rate
changes.
Note 3: Interest rate-sensitivity gap = Interest rate-sensitive assets - Interest rate-sensitive
liabilities.
Note 4: Ratio of interest rate-sensitive assets to liabilities = Interest rate-sensitive assets ÷
Interest rate-sensitive liabilities (in New Taiwan dollars).
b) Interest rate sensitivity information (U.S. dollars)
June 30, 2019
(In Thousands of U.S. Dollars)
Items 1 to 90 Days 91 to 180 Days 181 Days to
1 Year Over 1 Year Total
Interest rate-sensitive assets $ 7,256,432 $ 463,531 $ 190,653 $ 1,253,286 $ 9,163,902
Interest rate-sensitive liabilities 4,913,626 4,871,408 2,114,473 149,625 12,049,132
Interest rate-sensitive gap 2,342,806 (4,407,877 ) (1,923,820 ) 1,103,661 (2,885,230 )
Net worth 29,829
Ratio of interest rate-sensitive assets to liabilities (%) 76.05%
Ratio of interest rate-sensitive gap to net worth (%) (9,672.57% )
June 30, 2018
(In Thousands of U.S. Dollars)
Items 1 to 90 Days 91 to 180 Days 181 Days to
1 Year Over 1 Year Total
Interest rate-sensitive assets $ 5,997,964 $ 325,848 $ 232,734 $ 1,078,011 $ 7,634,557
Interest rate-sensitive liabilities 3,700,503 4,403,318 995,889 152,267 9,251,977
Interest rate-sensitive gap 2,297,461 (4,077,470 ) (763,155 ) 925,744 (1,617,420 )
Net worth 3,629
Ratio of interest rate-sensitive assets to liabilities (%) 82.52%
Ratio of interest rate-sensitive gap to net worth (%) (44,569.30% )
Note 1: The above amounts include only USD held by the Bank and exclude contingent assets
and contingent liabilities.
Note 2: Interest rate-sensitive assets and liabilities mean the revenues or costs of
interest-earnings assets and interest-bearing liabilities are affected by interest-rate
changes.
Note 3: Interest rate-sensitive gap = Interest rate-sensitive assets - Interest rate-sensitive
liabilities.
Note 4: Ratio of interest rate-sensitive assets to liabilities = Interest rate-sensitive assets ÷
Interest rate-sensitive liabilities (in USD).

- 102 -
13) Transfers of financial assets
The transferred financial assets of the Group that do not qualify for derecognition in the daily
operation are mainly securities sold under agreements to repurchase.
The transaction transfers the contractual rights to receive the cash flows of the financial assets but
the Group retains the liabilities to repurchase the transferred financial assets at fixed price in the
future period.
The Group cannot use, sell, or pledge these transferred financial assets within the validity period of
the transaction. However, the Group still bear the interest rate risk and credit risk thus, the Group do
not derecognize it.
The analysis of financial assets and related liabilities that did not completely meet the derecognizing
condition is shown in the following table:
Category of Financial Asset
June 30, 2019
Transferred
Financial
Assets - Book
Value
Related
Financial
Liabilities -
Book Value
Transferred
Financial
Assets - Fair
Value
Related
Financial
Liabilities -
Fair Value
Net Position -
Fair Value
Financial assets at fair value through
other comprehensive income
Transactions under agreements to
repurchase $ 10,135,658 $ 9,416,511 $ 10,135,658 $ 9,416,511 $ 719,147
Investment in debt instruments at
amortized cost
Transactions under agreements to
repurchase 4,409,360 4,286,796 4,529,403 4,286,796 242,607
Securities purchased under resell
agreements
Transactions under agreements to
repurchase 855,418 927,484 855,418 927,484 (72,066)
Category of Financial Asset
December 31, 2018
Transferred
Financial
Assets - Book
Value
Related
Financial
Liabilities -
Book Value
Transferred
Financial
Assets - Fair
Value
Related
Financial
Liabilities -
Fair Value
Net Position -
Fair Value
Financial assets at fair value through
other comprehensive income
Transactions under agreements to
repurchase $ 8,148,104 $ 7,766,751 $ 8,148,104 $ 7,766,751 $ 381,353
Investment in debt instruments at
amortized cost
Transactions under agreements to
repurchase 12,388,738 12,160,744 12,400,139 12,160,744 239,395
Securities purchased under resell
agreements
Transactions under agreements to
repurchase 5,037,558 5,346,642 5,037,558 5,346,642 (309,084)

- 103 -
Category of Financial Asset
June 30, 2018
Transferred
Financial
Assets - Book
Value
Related
Financial
Liabilities -
Book Value
Transferred
Financial
Assets - Fair
Value
Related
Financial
Liabilities -
Fair Value
Net Position -
Fair Value
Financial assets at fair value through
profit or loss
Transactions under agreements to
repurchase $ 13,151,566 $ 12,404,326 $13,151,566 $ 12,404,326 $ 747,240
Financial assets at fair value through
other comprehensive income
Transactions under agreements to
repurchase 4,332,737 4,124,021 4,332,737 4,124,021 208,716
Investment in debt instruments at
amortized cost
Transactions under agreements to
repurchase 12,328,801 11,800,000 12,387,530 11,800,000 587,530
14) Offsetting of financial assets and financial liabilities
The Group did not hold financial instruments covered by Section 42 of the IAS 32 “Financial
Instruments: Presentation” endorsed by the Financial Supervisory Commission; thus, it made an
offset of financial assets and liabilities and reported the net amount in the balance sheet.
The Group engages in transactions on the following financial assets and liabilities that are not
subject to balance sheet offsetting based on IAS 32 but are under master netting arrangements or
similar agreements. These agreements allow both the Group and its counterparties to opt for the net
settlement of financial assets and financial liabilities. If one party defaults, the other one may
choose net settlement.
The netting information of financial assets and financial liabilities is set out below:
June 30, 2019
Recognized
Netted
Financial
Liabilities
Recognized on Recognized
Related Amount Not Netted on
the Balance Sheet
Financial Assets
Financial
Assets - Gross
Amount
the Balance
Sheet - Gross
Amount
Financial
Assets - Net
Amount
Financial
Instruments
(Note)
Cash Received
as Collaterals Net Amount
Derivative
instruments $ 14,828,503 $ - $ 14,828,503 $ 10,213,767 $ 1,034,782 $ 3,579,954 Securities purchased
under agreements
to resell 16,777,698 - 16,777,698 16,777,281 - 417
$ 31,606,201 $ - $ 31,606,201 $ 26,991,048 $ 1,034,782 $ 3,580,371
Recognized
Netted
Financial
Assets
Recognized on Recognized
Related Amount Not Netted on
the Balance Sheet
Financial
Liabilities
Financial
Liabilities -
Gross Amount
the Balance
Sheet - Gross
Amount
Financial
Liabilities - Net
Amount
Financial
Instruments
Cash
Collaterals
Pledged Net Amount
Derivative instruments $ 14,579,907 $ - $ 14,579,907 $ 10,552,422 $ 574,552 $ 3,452,933
Securities sold under
agreements to repurchase 14,961,242 - 14,961,242 14,958,924 - 2,318
$ 29,541,149 $ - $ 29,541,149 $ 25,511,346 $ 574,552 $ 3,455,251
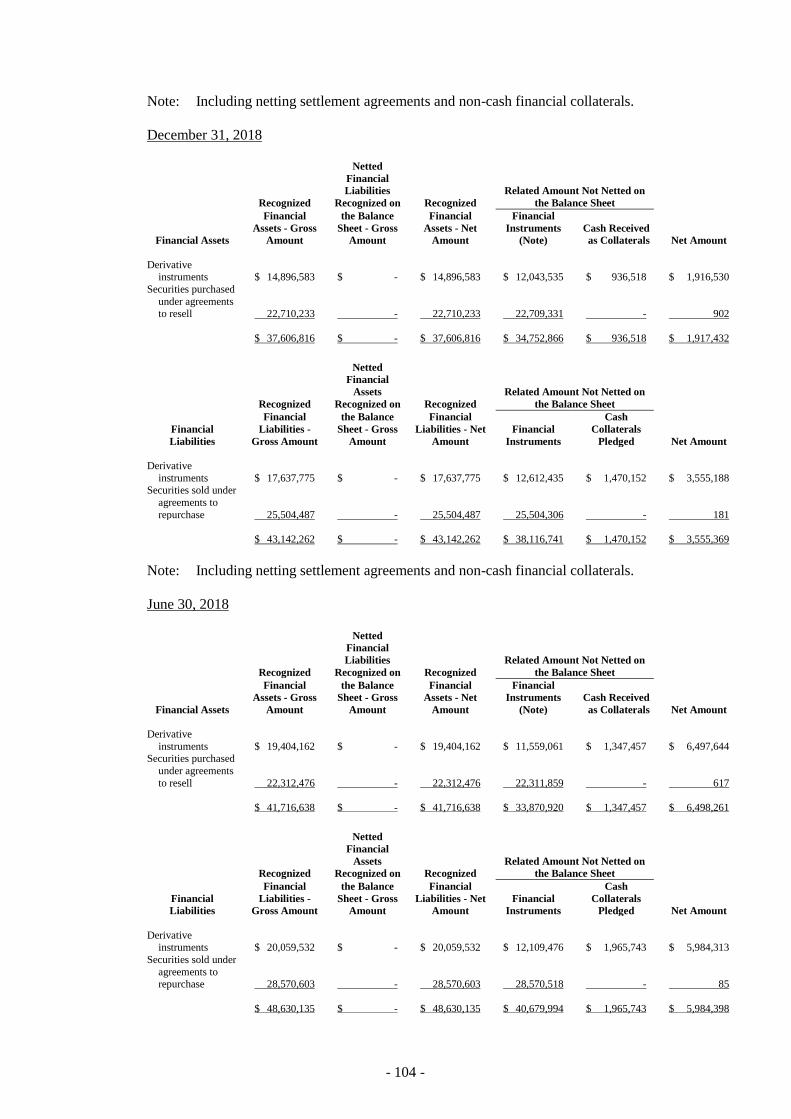
- 104 -
Note: Including netting settlement agreements and non-cash financial collaterals.
December 31, 2018
Recognized
Netted
Financial
Liabilities
Recognized on Recognized
Related Amount Not Netted on
the Balance Sheet
Financial Assets
Financial
Assets - Gross
Amount
the Balance
Sheet - Gross
Amount
Financial
Assets - Net
Amount
Financial
Instruments
(Note)
Cash Received
as Collaterals Net Amount
Derivative instruments $ 14,896,583 $ - $ 14,896,583 $ 12,043,535 $ 936,518 $ 1,916,530
Securities purchased
under agreements to resell 22,710,233 - 22,710,233 22,709,331 - 902
$ 37,606,816 $ - $ 37,606,816 $ 34,752,866 $ 936,518 $ 1,917,432
Recognized
Netted
Financial
Assets
Recognized on Recognized
Related Amount Not Netted on
the Balance Sheet
Financial
Liabilities
Financial
Liabilities -
Gross Amount
the Balance
Sheet - Gross
Amount
Financial
Liabilities - Net
Amount
Financial
Instruments
Cash
Collaterals
Pledged Net Amount
Derivative
instruments $ 17,637,775 $ - $ 17,637,775 $ 12,612,435 $ 1,470,152 $ 3,555,188 Securities sold under
agreements to
repurchase 25,504,487 - 25,504,487 25,504,306 - 181
$ 43,142,262 $ - $ 43,142,262 $ $ 38,116,741 $ 1,470,152 $ 3,555,369
Note: Including netting settlement agreements and non-cash financial collaterals.
June 30, 2018
Recognized
Netted
Financial
Liabilities
Recognized on Recognized
Related Amount Not Netted on
the Balance Sheet
Financial Assets
Financial
Assets - Gross
Amount
the Balance
Sheet - Gross
Amount
Financial
Assets - Net
Amount
Financial
Instruments
(Note)
Cash Received
as Collaterals Net Amount
Derivative
instruments $ 19,404,162 $ - $ 19,404,162 $ 11,559,061 $ 1,347,457 $ 6,497,644 Securities purchased
under agreements
to resell 22,312,476 - 22,312,476 22,311,859 - 617
$ 41,716,638 $ - $ 41,716,638 $ 33,870,920 $ 1,347,457 $ 6,498,261
Recognized
Netted
Financial
Assets
Recognized on Recognized
Related Amount Not Netted on
the Balance Sheet
Financial
Liabilities
Financial
Liabilities -
Gross Amount
the Balance
Sheet - Gross
Amount
Financial
Liabilities - Net
Amount
Financial
Instruments
Cash
Collaterals
Pledged Net Amount
Derivative instruments $ 20,059,532 $ - $ 20,059,532 $ 12,109,476 $ 1,965,743 $ 5,984,313
Securities sold under
agreements to repurchase 28,570,603 - 28,570,603 28,570,518 - 85
$ 48,630,135 $ - $ 48,630,135 $ 40,679,994 $ 1,965,743 $ 5,984,398
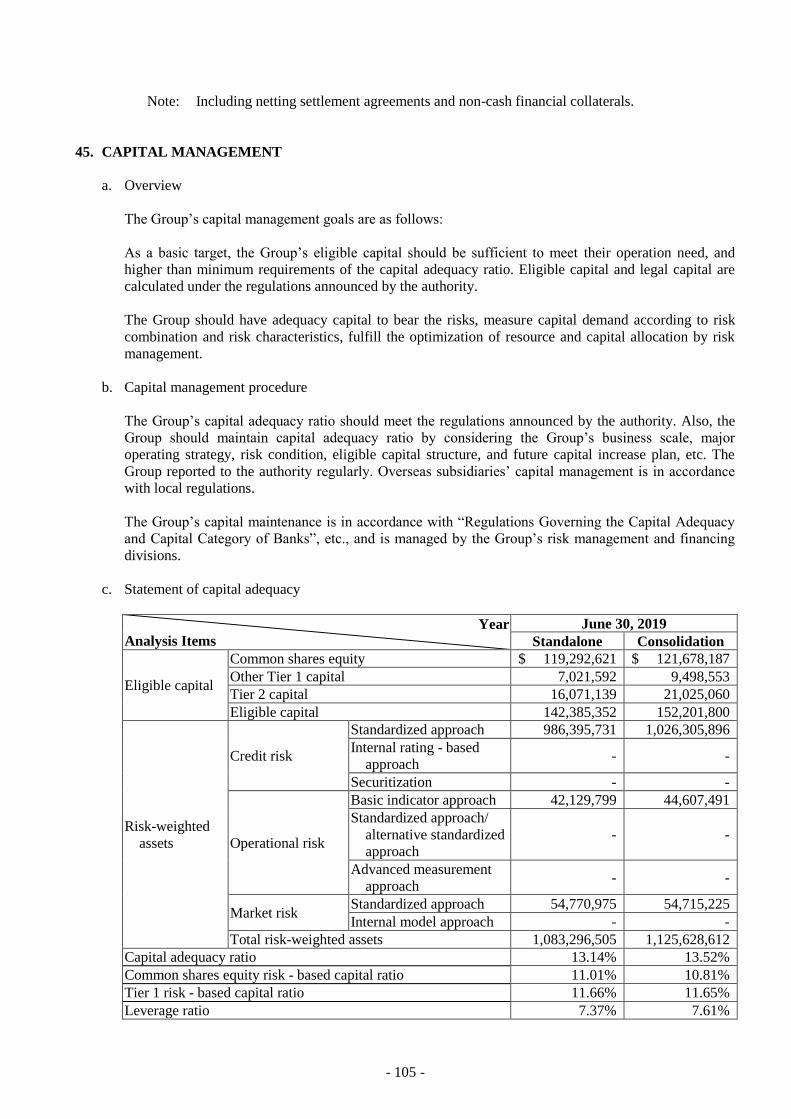
- 105 -
Note: Including netting settlement agreements and non-cash financial collaterals.
45. CAPITAL MANAGEMENT
a. Overview
The Group’s capital management goals are as follows:
As a basic target, the Group’s eligible capital should be sufficient to meet their operation need, and
higher than minimum requirements of the capital adequacy ratio. Eligible capital and legal capital are
calculated under the regulations announced by the authority.
The Group should have adequacy capital to bear the risks, measure capital demand according to risk
combination and risk characteristics, fulfill the optimization of resource and capital allocation by risk
management.
b. Capital management procedure
The Group’s capital adequacy ratio should meet the regulations announced by the authority. Also, the
Group should maintain capital adequacy ratio by considering the Group’s business scale, major
operating strategy, risk condition, eligible capital structure, and future capital increase plan, etc. The
Group reported to the authority regularly. Overseas subsidiaries’ capital management is in accordance
with local regulations.
The Group’s capital maintenance is in accordance with “Regulations Governing the Capital Adequacy
and Capital Category of Banks”, etc., and is managed by the Group’s risk management and financing
divisions.
c. Statement of capital adequacy
Year
Analysis Items
June 30, 2019
Standalone Consolidation
Eligible capital
Common shares equity $ 119,292,621 $ 121,678,187
Other Tier 1 capital 7,021,592 9,498,553
Tier 2 capital 16,071,139 21,025,060
Eligible capital 142,385,352 152,201,800
Risk-weighted
assets
Credit risk
Standardized approach 986,395,731 1,026,305,896
Internal rating - based
approach - -
Securitization - -
Operational risk
Basic indicator approach 42,129,799 44,607,491
Standardized approach/
alternative standardized
approach
- -
Advanced measurement
approach - -
Market risk Standardized approach 54,770,975 54,715,225
Internal model approach - -
Total risk-weighted assets 1,083,296,505 1,125,628,612
Capital adequacy ratio 13.14% 13.52%
Common shares equity risk - based capital ratio 11.01% 10.81%
Tier 1 risk - based capital ratio 11.66% 11.65%
Leverage ratio 7.37% 7.61%
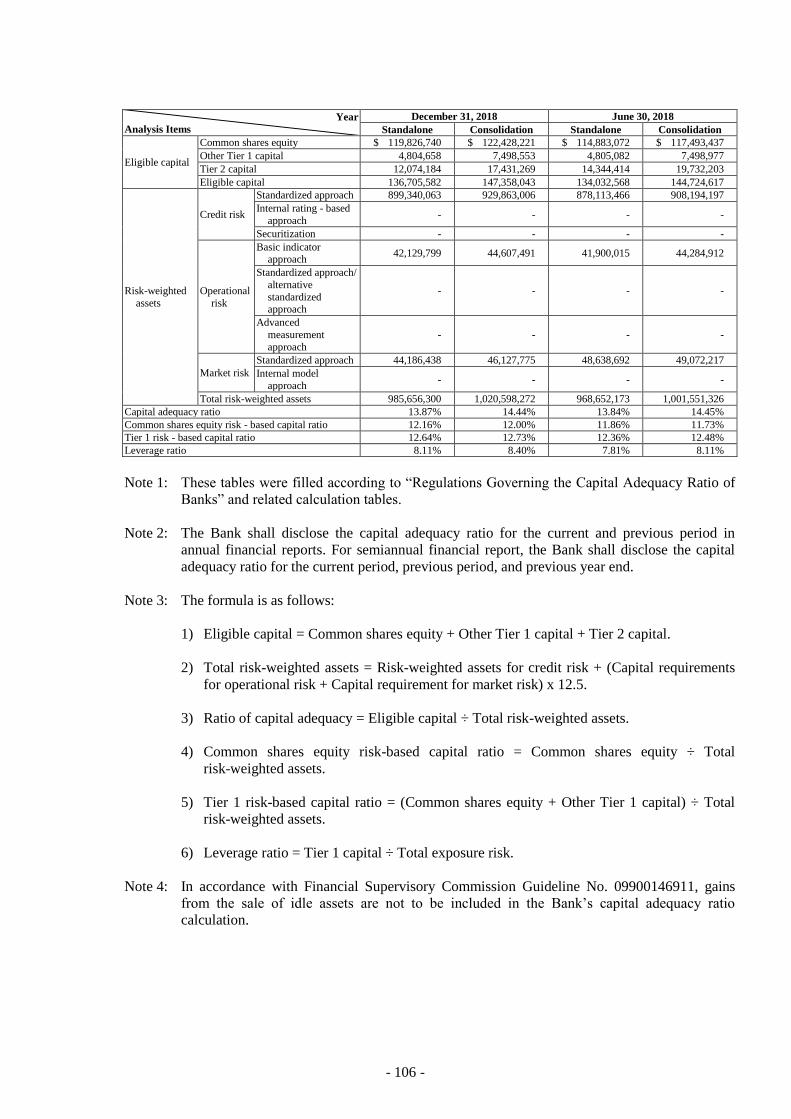
- 106 -
Year
Analysis Items
December 31, 2018 June 30, 2018
Standalone Consolidation Standalone Consolidation
Eligible capital
Common shares equity $ 119,826,740 $ 122,428,221 $ 114,883,072 $ 117,493,437
Other Tier 1 capital 4,804,658 7,498,553 4,805,082 7,498,977
Tier 2 capital 12,074,184 17,431,269 14,344,414 19,732,203
Eligible capital 136,705,582 147,358,043 134,032,568 144,724,617
Risk-weighted
assets
Credit risk
Standardized approach 899,340,063 929,863,006 878,113,466 908,194,197
Internal rating - based
approach - - - -
Securitization - - - -
Operational
risk
Basic indicator approach
42,129,799 44,607,491 41,900,015 44,284,912
Standardized approach/
alternative
standardized approach
- - - -
Advanced
measurement
approach
- - - -
Market risk
Standardized approach 44,186,438 46,127,775 48,638,692 49,072,217
Internal model
approach - - - -
Total risk-weighted assets 985,656,300 1,020,598,272 968,652,173 1,001,551,326
Capital adequacy ratio 13.87% 14.44% 13.84% 14.45%
Common shares equity risk - based capital ratio 12.16% 12.00% 11.86% 11.73%
Tier 1 risk - based capital ratio 12.64% 12.73% 12.36% 12.48%
Leverage ratio 8.11% 8.40% 7.81% 8.11%
Note 1: These tables were filled according to “Regulations Governing the Capital Adequacy Ratio of
Banks” and related calculation tables.
Note 2: The Bank shall disclose the capital adequacy ratio for the current and previous period in
annual financial reports. For semiannual financial report, the Bank shall disclose the capital
adequacy ratio for the current period, previous period, and previous year end.
Note 3: The formula is as follows:
1) Eligible capital = Common shares equity + Other Tier 1 capital + Tier 2 capital.
2) Total risk-weighted assets = Risk-weighted assets for credit risk + (Capital requirements
for operational risk + Capital requirement for market risk) x 12.5.
3) Ratio of capital adequacy = Eligible capital ÷ Total risk-weighted assets.
4) Common shares equity risk-based capital ratio = Common shares equity ÷ Total
risk-weighted assets.
5) Tier 1 risk-based capital ratio = (Common shares equity + Other Tier 1 capital) ÷ Total
risk-weighted assets.
6) Leverage ratio = Tier 1 capital ÷ Total exposure risk.
Note 4: In accordance with Financial Supervisory Commission Guideline No. 09900146911, gains
from the sale of idle assets are not to be included in the Bank’s capital adequacy ratio
calculation.

- 107 -
46. CROSS-SELLING INFORMATION
For the six months ended June 30, 2019 and 2018, the Bank charged SinoPac Securities for $1,272 and
$1,992, respectively, as marketing and opening accounts. The rental fee the Bank charged SinoPac
Securities for the six months ended June 30, 2019 and 2018 were $1,634 and $1,791, respectively.
The Bank paid to SinoPac Securities $2,434 and $2,044 for the six months ended June 30, 2019 and 2018
for bonus as part of the cross-selling agreement.
The Bank paid to SinoPac Venture Capital $6 for the six months ended June 30, 2019 for bonus as part of
the cross-selling agreement.
For other transactions between SPH and its subsidiaries, please refer to Note 40 and Table 2.
47. PROFITABILITY
Items June 30, 2019 June 30, 2018
Return on total assets Before income tax 0.42% 0.39%
After income tax 0.36% 0.33%
Return on net worth Before income tax 5.12% 4.50%
After income tax 4.37% 3.82%
Profit margin 39.02% 39.01%
Note 1: Return on total assets = Income before (after) income tax ÷ Average total assets.
Note 2: Return on net worth = Income before (after) income tax ÷ Average net worth.
Note 3: Profit margin = Income after income tax ÷ Total net revenues.
Note 4: Income before (after) income tax represents income for the six months ended June 30, 2019 and
2018.

- 108 -
48. TRUST BUSINESS UNDER THE TRUST LAW
a. Balance sheets, income statement and trust properties of trust accounts
These statements were managed by the Bank’s Trust Department. However, these items were not
included in the Bank’s financial statements.
Balance Sheets of Trust Accounts
June 30, 2019 and 2018
June 30, 2019
Other Trust
Business
Financial Assets
and Real Estate
Trust Plan Total %
Trust assets
Bank deposits $ 2,749,371 $ - $ 2,749,371 1
Bonds 8,249,477 - 8,249,477 2
Stocks 16,714,173 - 16,714,173 4
Funds 106,241,890 - 106,241,890 26
Securities lent 519,725 - 519,725 -
Receivables 95,156 - 95,156 -
Prepayments 118 - 118 -
Real estate
Land 3,884,427 - 3,884,427 1
Buildings 98,202 - 98,202 -
Construction in progress 729,133 - 729,133 -
Securities under custody 267,762,404 - 267,762,404 66
Total trust assets $ 407,044,076 $ - $ 407,044,076 100
Trust liabilities
Payables $ 802 $ - $ 802 -
Payable on securities under custody 267,762,404 - 267,762,404 66
Trust capital 137,658,902 - 137,658,902 34
Reserves and cumulative earnings
Net income 1,422,769 - 1,422,769 -
Cumulative earnings 270,011 - 270,011 -
Deferred amount (70,812) - (70,812) -
Total trust liabilities $ 407,044,076 $ - $ 407,044,076 100

- 109 -
June 30, 2018
Other Trust
Business
Financial Assets
and Real Estate
Trust Plan Total %
Trust assets
Bank deposits $ 5,886,060 $ - $ 5,886,060 2
Bonds 7,842,013 - 7,842,013 3
Stocks 14,444,329 - 14,444,329 6
Funds 105,919,935 - 105,919,935 40
Securities lent 2,114,842 - 2,114,842 1
Receivables 98,511 - 98,511 -
Prepayments 1,527 - 1,527 -
Real estate
Land 3,430,286 - 3,430,286 1
Buildings 84,358 - 84,358 -
Construction in progress 608,331 - 608,331 -
Securities under custody 124,338,149 - 124,338,149 47
Total trust assets $ 264,768,341 $ - $ 264,768,341 100
Trust liabilities
Payables $ 1,584 $ - $ 1,584 -
Payable on securities under custody 124,338,149 - 124,338,149 47
Trust capital 138,774,227 - 138,774,227 52
Reserves and cumulative earnings
Net income 189,776 - 189,776 -
Cumulative earnings 1,501,796 - 1,501,796 1
Deferred amount (37,191) - (37,191) -
Total trust liabilities $ 264,768,341 $ - $ 264,768,341 100
Trust Properties of Trust Accounts
June 30, 2019 and 2018
June 30
Investment Portfolio 2019 2018
Bank deposits $ 2,749,371 $ 5,886,060
Bonds 8,249,477 7,842,013
Stocks 16,714,173 14,444,329
Funds 106,241,890 105,919,935
Securities lent 519,725 2,114,842
Real estate
Land 3,884,427 3,430,286
Buildings 98,202 84,358
Construction in progress 729,133 608,331
Securities under custody 267,762,404 124,338,149
Total $ 406,948,802 $ 264,668,303

- 110 -
Income Statements of Trust Account
For the Six Months Ended June 30, 2019
Other Trust
Business
Financial Assets
and Real Estate
Trust Plan Total %
Trust income
Interest income $ 8,616 $ - $ 8,616 -
Borrowed Securities income 7,368 - 7,368 -
Cash dividends 2,580 - 2,580 -
Gains from beneficial certificates 1,141 - 1,141 -
Realized investment income 45,282 - 45,282 3
Unrealized investment income 1,891,398 - 1,891,398 97
Other revenues 125 - 125 -
Donation revenue - charitable trust - - - -
Total trust income 1,956,510 - 1,956,510 100
Trust expense
Trust administrative expenses 2,443 - 2,443 -
Tax expenses - - - -
Donation expense - charitable
trust 2,744 - 2,744 -
Realized investment loss 13,383 - 13,383 1
Unrealized investment loss 514,987 - 514,987 26
Other expense 184 - 184 -
Total trust expense 533,741 - 533,741 27
Income before income tax 1,422,769 - 1,422,769 73
Income tax expense - - - -
Income after income tax $ 1,422,769 $ - $ 1,422,769 73
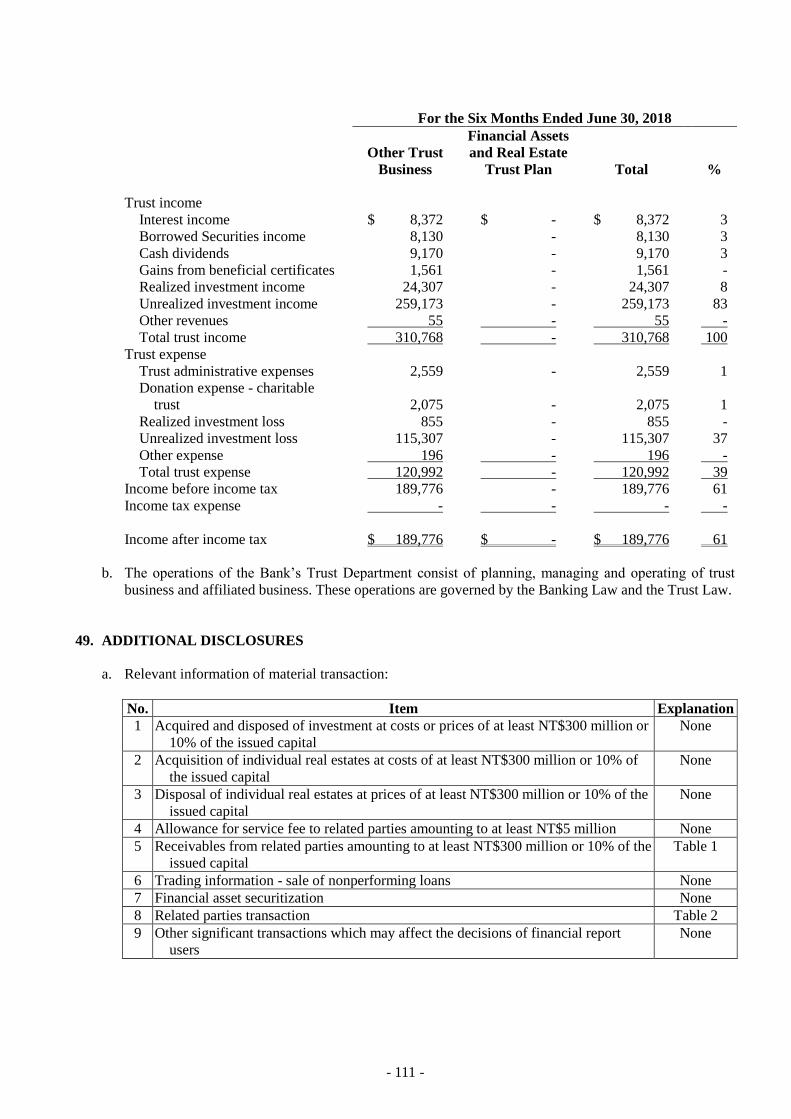
- 111 -
For the Six Months Ended June 30, 2018
Other Trust
Business
Financial Assets
and Real Estate
Trust Plan Total %
Trust income
Interest income $ 8,372 $ - $ 8,372 3
Borrowed Securities income 8,130 - 8,130 3
Cash dividends 9,170 - 9,170 3
Gains from beneficial certificates 1,561 - 1,561 -
Realized investment income 24,307 - 24,307 8
Unrealized investment income 259,173 - 259,173 83
Other revenues 55 - 55 -
Total trust income 310,768 - 310,768 100
Trust expense
Trust administrative expenses 2,559 - 2,559 1
Donation expense - charitable
trust 2,075 - 2,075 1
Realized investment loss 855 - 855 -
Unrealized investment loss 115,307 - 115,307 37
Other expense 196 - 196 -
Total trust expense 120,992 - 120,992 39
Income before income tax 189,776 - 189,776 61
Income tax expense - - - -
Income after income tax $ 189,776 $ - $ 189,776 61
b. The operations of the Bank’s Trust Department consist of planning, managing and operating of trust
business and affiliated business. These operations are governed by the Banking Law and the Trust Law.
49. ADDITIONAL DISCLOSURES
a. Relevant information of material transaction:
No. Item Explanation
1 Acquired and disposed of investment at costs or prices of at least NT$300 million or
10% of the issued capital
None
2 Acquisition of individual real estates at costs of at least NT$300 million or 10% of
the issued capital
None
3 Disposal of individual real estates at prices of at least NT$300 million or 10% of the
issued capital
None
4 Allowance for service fee to related parties amounting to at least NT$5 million None
5 Receivables from related parties amounting to at least NT$300 million or 10% of the
issued capital
Table 1
6 Trading information - sale of nonperforming loans None
7 Financial asset securitization None
8 Related parties transaction Table 2
9 Other significant transactions which may affect the decisions of financial report
users
None
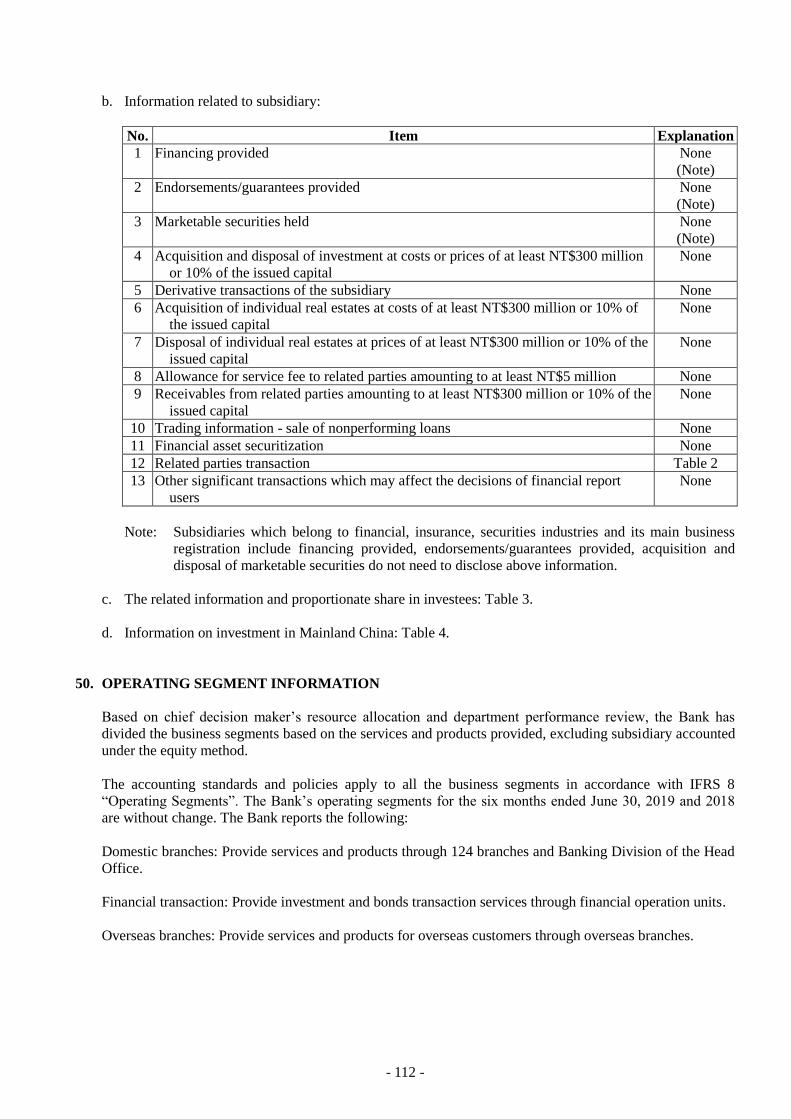
- 112 -
b. Information related to subsidiary:
No. Item Explanation
1 Financing provided None
(Note)
2 Endorsements/guarantees provided None
(Note)
3 Marketable securities held None
(Note)
4 Acquisition and disposal of investment at costs or prices of at least NT$300 million
or 10% of the issued capital
None
5 Derivative transactions of the subsidiary None
6 Acquisition of individual real estates at costs of at least NT$300 million or 10% of
the issued capital
None
7 Disposal of individual real estates at prices of at least NT$300 million or 10% of the
issued capital
None
8 Allowance for service fee to related parties amounting to at least NT$5 million None
9 Receivables from related parties amounting to at least NT$300 million or 10% of the
issued capital
None
10 Trading information - sale of nonperforming loans None
11 Financial asset securitization None
12 Related parties transaction Table 2
13 Other significant transactions which may affect the decisions of financial report
users
None
Note: Subsidiaries which belong to financial, insurance, securities industries and its main business
registration include financing provided, endorsements/guarantees provided, acquisition and
disposal of marketable securities do not need to disclose above information.
c. The related information and proportionate share in investees: Table 3.
d. Information on investment in Mainland China: Table 4.
50. OPERATING SEGMENT INFORMATION
Based on chief decision maker’s resource allocation and department performance review, the Bank has
divided the business segments based on the services and products provided, excluding subsidiary accounted
under the equity method.
The accounting standards and policies apply to all the business segments in accordance with IFRS 8
“Operating Segments”. The Bank’s operating segments for the six months ended June 30, 2019 and 2018
are without change. The Bank reports the following:
Domestic branches: Provide services and products through 124 branches and Banking Division of the Head
Office.
Financial transaction: Provide investment and bonds transaction services through financial operation units.
Overseas branches: Provide services and products for overseas customers through overseas branches.

- 113 -
Other business segments: Include consumer finance, automobile loan and SinoPac Insurance Brokers - the
Bank’s subsidiary, SinoPac Capital Limited - the Bank’s subsidiary and Bank SinoPac (China) Ltd. - the
Bank’s subsidiary were not identified to disclose as individual segments.
The Group’s reporting segments revenue and operating result are shown in the following table.

- 114 -
Segment revenues and results
For the Six Months Ended June 30, 2019
Domestic Branches Financial
Transaction Overseas Branches Others Operating Segments
Non-operating
Segments Total
Income (loss)
Net interest $ 5,873,961 $ (136,050) $ 1,300,327 $ 815,262 $ 7,853,500 $ (650,744) $ 7,202,756
Interest revenue 8,640,410 101,891 2,932,072 1,337,487 13,011,860 2,238,246 15,250,106
Revenue amount segments 2,986,451 (19,418) (723,645) (141,057) 2,102,331 (2,102,331) -
Interest expense (5,752,900) (218,523) (908,100) (381,168) (7,260,691) (786,659) (8,047,350)
Commission and fee revenues net 2,844,018 (13,700) 203,635 337,528 3,371,481 85,514 3,456,995
Others 285,457 1,371,597 193,131 31,753 1,881,938 1,941,051 3,822,989
Net revenue 9,003,436 1,221,847 1,697,093 1,184,543 13,106,919 1,375,821 14,482,740
Bad debts expense, commitment and guarantee liability
provision (630,517) - (311,373) 45,389 (896,501) 137,175 (759,326)
Operating expense (4,552,553) (196,587) (617,793) (1,107,734) (6,474,667) (632,487) (7,107,154)
Income before income tax 3,820,366 1,025,260 767,927 122,198 5,735,751 880,509 6,616,260
Income tax expense (516,256) (138,546) (103,772) (22,134) (780,708) (184,295) (965,003)
Net income 3,304,110 886,714 664,155 100,064 4,955,043 696,214 5,651,257
Segment revenues and results
For the Six Months Ended June 30, 2018
Domestic Branches Financial
Transaction Overseas Branches Others Operating Segments
Non-operating
Segments Total
Income (loss)
Net interest $ 5,243,978 $ (414,059) $ 1,030,049 $ 789,209 $ 6,649,177 $ 653,792 $ 7,302,969
Interest revenue 7,489,312 7,005 2,075,534 1,172,988 10,744,839 2,213,280 12,958,119
Revenue amount segments 1,382,492 (203,826) (456,339) (129,362) 592,965 (592,965) -
Interest expense (3,627,826) (217,238) (589,146) (254,417) (4,688,627) (966,523) (5,655,150)
Commission and fee revenues, net 2,350,858 (502) 118,388 348,436 2,817,180 65,828 2,883,008
Others 198,983 878,382 254,736 225,157 1,557,258 505,394 2,062,652
Net revenue 7,793,819 463,821 1,403,173 1,362,802 11,023,615 1,225,014 12,248,629
Bad debts expense and guarantee liability provision 64,816 - (146,882) 25,309 (56,757) (12,285) (69,042)
Operating expense (4,824,360) (147,882) (587,790) (971,288) (6,531,320) (18,959) (6,550,279)
Income before income tax 3,034,275 315,939 668,501 416,823 4,435,538 1,193,770 5,629,308
Income tax profit (expense) (425,228) (44,276) (93,685) (77,569) (640,758) (210,402) (851,160)
Net income 2,609,047 271,663 574,816 339,254 3,794,780 983,368 4,778,148
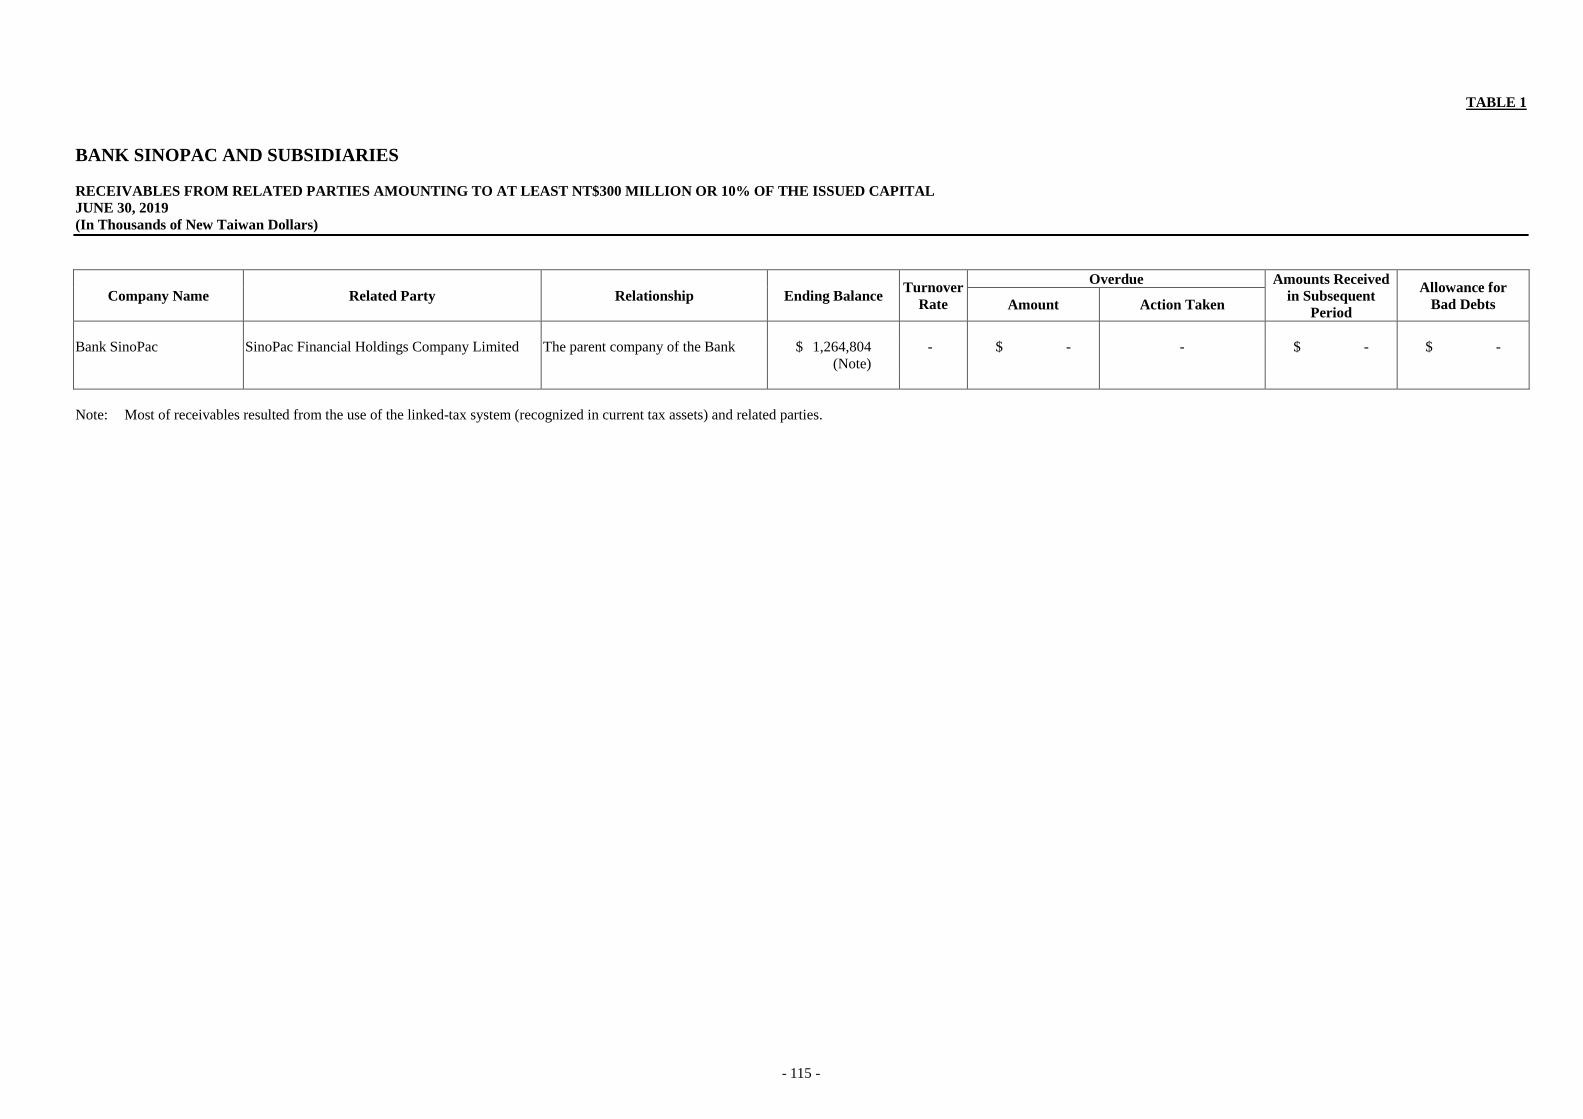
- 115 -
TABLE 1
BANK SINOPAC AND SUBSIDIARIES
RECEIVABLES FROM RELATED PARTIES AMOUNTING TO AT LEAST NT$300 MILLION OR 10% OF THE ISSUED CAPITAL
JUNE 30, 2019
(In Thousands of New Taiwan Dollars)
Company Name Related Party Relationship Ending Balance Turnover
Rate
Overdue Amounts Received
in Subsequent
Period
Allowance for
Bad Debts Amount Action Taken
Bank SinoPac SinoPac Financial Holdings Company Limited The parent company of the Bank $ 1,264,804
(Note)
- $ - - $ - $ -
Note: Most of receivables resulted from the use of the linked-tax system (recognized in current tax assets) and related parties.

- 116 -
TABLE 2
BANK SINOPAC AND SUBSIDIARIES
RELATED PARTIES TRANSACTIONS
FOR THE SIX MONTHS ENDED JUNE 30, 2019
(In Thousands of New Taiwan Dollars)
No.
(Note 1) Transaction Company Counterparty
Nature of
Relationship
(Note 2)
Description of Transactions
Financial Statements Account Transaction
Amount
Transaction
Item
Percentage of
Consolidated
Revenue/Assets
(Note 3)
0 Bank SinoPac Bank SinoPac (China) Ltd. a Receivables, net $ 100,700 Note 4 0.01
SinoPac Insurance Brokers Ltd. a Deposits and remittances 70,688 Note 4 -
SinoPac Capital Limited a Deposits and remittances 359,128 Note 4 0.02
SinoPac Capital (B.V.I.) Ltd. a Deposits and remittances 49,772 Note 4 -
RSP Information Service Company Limited a Deposits and remittances 13,408 Note 4 -
SinoPac Life Insurance Agency Co., Ltd. a Receivables, net 131,626 Note 4 0.01
SinoPac Life Insurance Agency Co., Ltd. a Deposits and remittances 954,750 Note 4 0.06
SinoPac Life Insurance Agency Co., Ltd. a Fee revenues, net (fee revenues) 384,937 Note 4 2.66
SinoPac Life Insurance Agency Co., Ltd. a Other noninterest net revenues 3,870 Note 4 0.03
1 Bank SinoPac (China) Ltd. Bank SinoPac b Payables 100,700 Note 4 0.01
2 SinoPac Insurance Brokers Ltd. Bank SinoPac b Cash and cash equivalents, net 18,938 Note 4 -
Bank SinoPac b Other financial assets, net 51,750 Note 4 -
3 SinoPac Capital Limited Bank SinoPac b Cash and cash equivalents, net 8,527 Note 4 -
Bank SinoPac b Other financial assets, net 350,601 Note 4 0.02
4 SinoPac Capital (B.V.I.) Ltd. Bank SinoPac b Cash and cash equivalents, net 2,005 Note 4 -
Bank SinoPac b Other financial assets, net 47,767 Note 4 -
5 RSP Information Service Company Limited Bank SinoPac b Cash and cash equivalents, net 13,408 Note 4 -
6 SinoPac Life Insurance Agency Co., Ltd. Bank SinoPac b Cash and cash equivalents, net 954,750 Note 4 0.06
Bank SinoPac b Right-of-use assets, net 20,730 Note 4 -
Bank SinoPac b Payables 131,626 Note 4 0.01
Bank SinoPac b Lease liabilities 20,788 Note 4 -
Bank SinoPac b Interest expense 125 Note 4 -
Bank SinoPac b Fee revenues, net (fee expenses) 384,937 Note 4 2.66
Bank SinoPac b Depreciation and amortization expenses 2,303 Note 4 0.02
Bank SinoPac b Other operating expenses 1,500 Note 4 0.01
Note 1: Transactions between parent company and subsidiaries should be distinguished as follows:
a. Parent company: 0.
b. Subsidiaries are numbered in sequence from 1.
(Continued)

- 117 -
Note 2: Types of transactions with related parties were classified as follows:
a. Parent company to subsidiaries.
b. Subsidiaries to parent company.
c. Subsidiaries to subsidiaries.
Types of transactions with related parties classified as category a, in the trading relationship and material intercompany transactions between parent company and subsidiaries above, are XBRL reporting items which are based on the
Taiwan Stock Exchange letter (Ref. No. 1030005380).
Note 3: In the computation of percentage of consolidated revenue/assets, if the amount is the ending balance of assets or liabilities, the accounts percentage will be calculated by dividing the consolidated assets or liabilities; if the amount is the
amount of income or expense, the accounts percentage will be cumulated by dividing the consolidated revenues in the same period.
Note 4: For the transactions between the Bank and related parties, the terms were similar to those for unrelated parties.
(Concluded)

- 118 -
TABLE 3
BANK SINOPAC AND SUBSIDIARIES
INFORMATION ON INVESTED ENTERPRISES
FOR THE SIX MONTHS ENDED JUNE 30, 2019
(In Thousands of New Taiwan Dollars or Shares)
Investee Company Location Main Businesses and Products
Percentage of
Ownership
(%)
Carrying
Amount
Investment
Gains (Losses)
Consolidated Investment
Note Shares (In
Thousands)
Imitated
Shares
Total
Shares
Percentage of
Ownership
(%)
Financial related enterprise
Bank SinoPac (China) Ltd. China Commercial Bank 100.00 $ 9,771,279 $ 47,404 - - - 100.00 Subsidiary and
Note 1
SinoPac Capital Limited Hong Kong Credit and investment service 100.00 422,957 498 29,998 - 29,998 100.00 Subsidiary and
Note 1
SinoPac Life Insurance Agent Co., Ltd. Taiwan Life insurance agent 100.00 785,222 776,857 500 - 500 100.00 Subsidiary
SinoPac Insurance Brokers Ltd. Hong Kong Insurance services 100.00 75,562 9,639 100 - 100 100.00 Subsidiary and
Note 1
SinoPac Property Insurance Agent Co., Ltd. Taiwan Property insurance agent 100.00 15,689 7,423 500 - 500 100.00 Subsidiary
Global Securities Finance Corporation Taiwan Securities financing 2.63 49,830 1,555 11,494 - 11,494 2.87 Note 2
Taipei Foreign Exchange Inc. Taiwan Foreign exchange market maker 3.43 12,750 4,080 680 - 680 3.43 Note 2
Taiwan Futures Exchange Taiwan Futures exchange and settlement 1.07 196,650 13,103 6,964 - 6,964 2.08 Note 2
Fuh Hwa Securities Investment Trust Co.,
Ltd.
Taiwan Securities investment trust and consultant 4.63 89,914 22,235 2,779 - 2,779 4.63 Note 2
Financial Information Service Co., Ltd. Taiwan Planning and developing the information system of
across banking institution and managing the
information web system
2.34 526,737 33,043 12,238 - 12,238 2.34 Note 2
Taiwan Asset Management Corporation Taiwan Evaluating, auctioning, and managing for financial
institutions’ loan
0.28 19,650 1,950 3,000 - 3,000 0.28 Note 2
Taiwan Financial Asset Service Co. Taiwan Auction 5.88 136,200 700 10,000 - 10,000 5.88 Note 2
Sunny Asset Management Corp. Taiwan Purchasing for financial institutions’ loan assets 1.42 674 110 85 - 85 1.42 Note 2
Taiwan Depository and Clearing Co. Taiwan Computerizing book-entry operation for securities 0.08 16,336 1,076 3,408 - 3,408 0.92 Note 2
Taiwan Mobile Payment Corporation Taiwan Promoting E-commerce and developing E-billing 1.00 3,366 - 600 - 600 1.00
Nonfinancial related enterprise
Taiwan Television Enterprise, Ltd. Taiwan Wireless television company 4.84 91,317 - 13,717 - 13,717 4.89
Victor Taichung Machinery Works Co., Ltd. Taiwan Manufacturer and seller of tool machine, plastic
machine and other precise equipment
0.08 1,633 94 157 - 157 0.08 Note 2
Note 1: Foreign-currency amounts were translated at the exchange rate on the balance sheet date, except for foreign-currency-denominated income and expenses, which were translated to New Taiwan dollars at the average exchange rate for the
six months ended June 30, 2019.
Note 2: Investment gains are dividend income.
Note 3: Above shares are in thousands of shares.
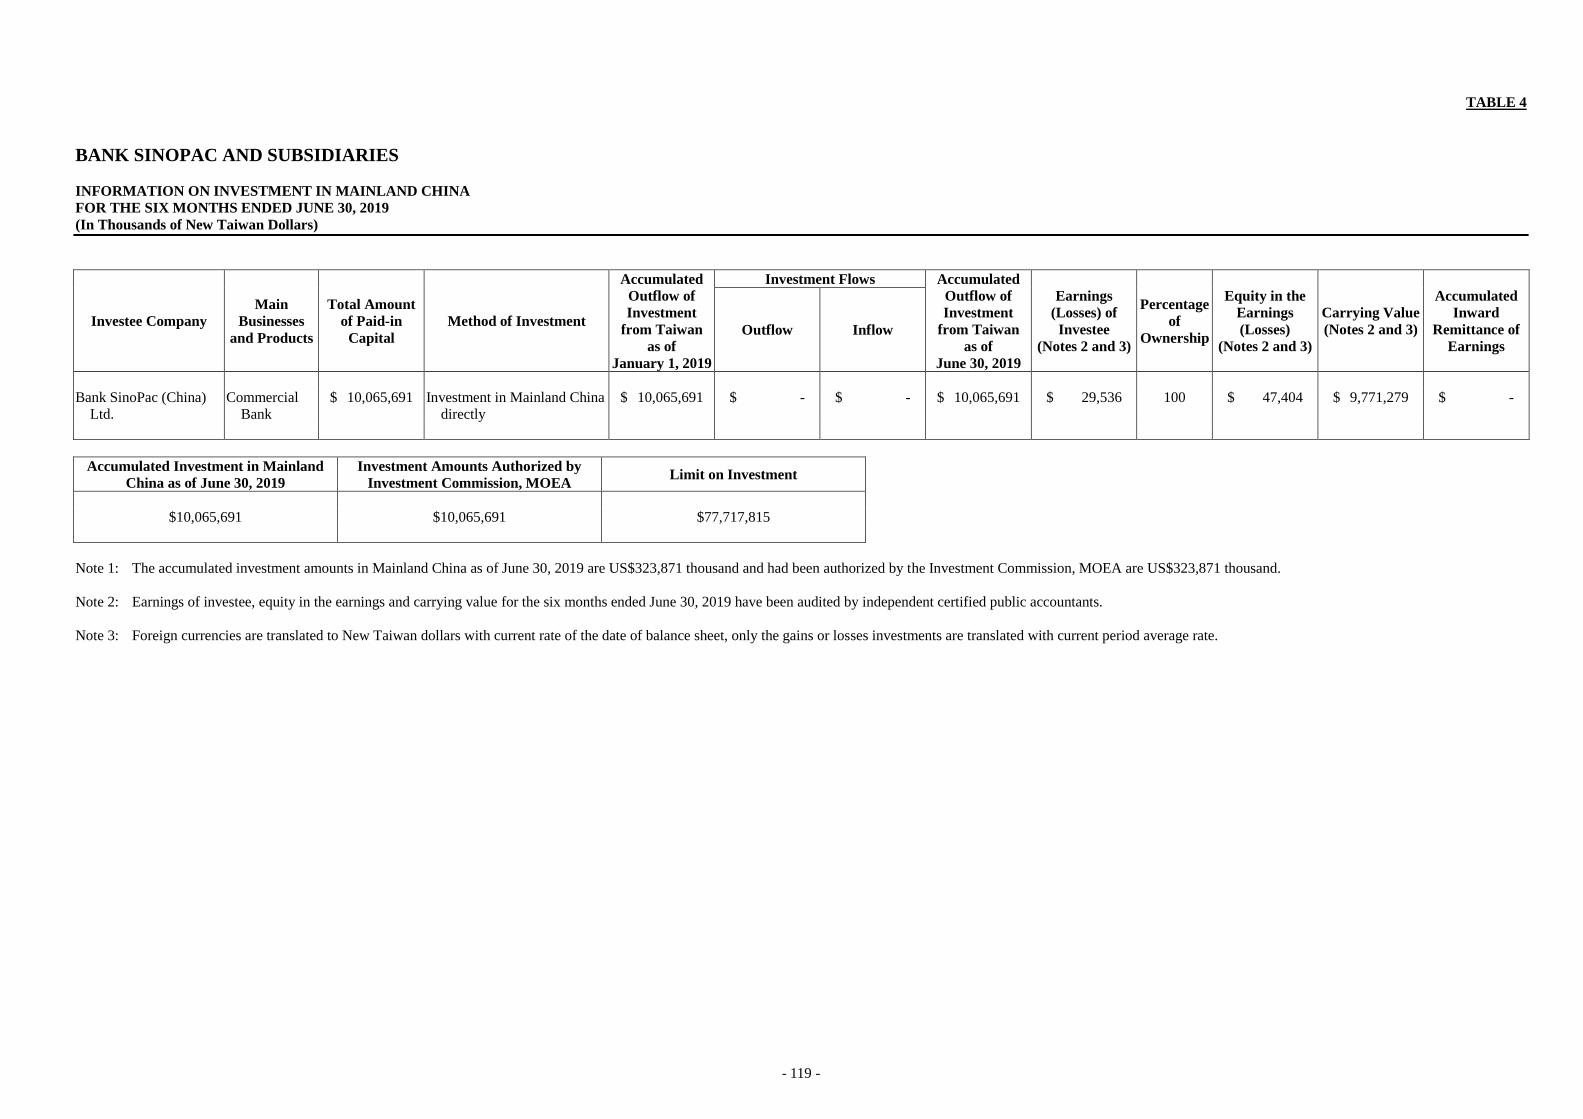
- 119 -
TABLE 4
BANK SINOPAC AND SUBSIDIARIES
INFORMATION ON INVESTMENT IN MAINLAND CHINA
FOR THE SIX MONTHS ENDED JUNE 30, 2019
(In Thousands of New Taiwan Dollars)
Investee Company
Main
Businesses
and Products
Total Amount
of Paid-in
Capital
Method of Investment
Accumulated
Outflow of
Investment
from Taiwan
as of
January 1, 2019
Investment Flows Accumulated
Outflow of
Investment
from Taiwan
as of
June 30, 2019
Earnings
(Losses) of
Investee
(Notes 2 and 3)
Percentage
of
Ownership
Equity in the
Earnings
(Losses)
(Notes 2 and 3)
Carrying Value
(Notes 2 and 3)
Accumulated
Inward
Remittance of
Earnings
Outflow Inflow
Bank SinoPac (China)
Ltd.
Commercial
Bank
$ 10,065,691 Investment in Mainland China
directly
$ 10,065,691 $ - $ - $ 10,065,691 $ 29,536 100 $ 47,404 $ 9,771,279 $ -
Accumulated Investment in Mainland
China as of June 30, 2019
Investment Amounts Authorized by
Investment Commission, MOEA Limit on Investment
$10,065,691 $10,065,691 $77,717,815
Note 1: The accumulated investment amounts in Mainland China as of June 30, 2019 are US$323,871 thousand and had been authorized by the Investment Commission, MOEA are US$323,871 thousand.
Note 2: Earnings of investee, equity in the earnings and carrying value for the six months ended June 30, 2019 have been audited by independent certified public accountants.
Note 3: Foreign currencies are translated to New Taiwan dollars with current rate of the date of balance sheet, only the gains or losses investments are translated with current period average rate.