The Shanghai Commercial & Savings Bank, Ltd. and Subsidiaries Financial... · -5- THE SHANGHAI...
92
The Shanghai Commercial & Savings Bank, Ltd. and Subsidiaries Consolidated Financial Statements for the Nine Months Ended September 30, 2019 and 2018 and Independent Auditors’ Review Report Stock code: 5876 Taiwan Stock Exchange Address: No. 2, Sec.1 Min Chuan E. Rd., Taipei, Taiwan Telephone: 886-2-2581-7111
Transcript of The Shanghai Commercial & Savings Bank, Ltd. and Subsidiaries Financial... · -5- THE SHANGHAI...

The Shanghai Commercial & Savings Bank, Ltd. and Subsidiaries Consolidated Financial Statements for the Nine Months Ended September 30, 2019 and 2018 and Independent Auditors’ Review Report
Stock code: 5876 Taiwan Stock Exchange
Address: No. 2, Sec.1 Min Chuan E. Rd., Taipei, Taiwan Telephone: 886-2-2581-7111

-1-
Table of Contents
Contents Page Notes
1. Table of Contents 1 -
2. Independent Auditors’ Review Report 2~3 -
3. Balance Sheets 4 -
4. Statements of Comprehensive Income 5~6 -
5. Statements of Changes in Stockholders’ Equity 7 -
6. Statements of Cash Flows 8~9 -
7. Notes to Financial Statements
(1) Organization and Operations 10 1
(2) Authorization of Financial Statements 10 2
(3) Application of New, Amended and Revised Standards and Interpretations 10~12 3
(4) Summary of Significant Accounting Policies 12~15 4
(5) Critical Accounting Judgments and Key Sources of Estimation Uncertainty 15 5
(6) Summary of Major Accounts 15~45 6~38
(7) Related-Party Transactions 45~48 39
(8) Pledged Assets 48 40
(9) Significant Contingent Liabilities and Unrecognized Commitments 48~50 41
(10) Significant Catastrophic Losses - -
(11) Significant Subsequent Events - -
(12) Others 50~79 42~48
(13) Disclosure Required
(a) Related Information on Significant Transactions 79~80 82~86
49
(b) Related Information on Investee Companies 80 49
(c) Related Information on Investments in Mainland China 80.87 49
(d) Related Information on Intercompany Relationships and Significant Intercompany Transactions
80 88~91
49
(14) Segment Information 81 50

-2-
INDEPENDENT AUDITORS’ REVIEW REPORT The Board of Directors and Shareholders The Shanghai Commercial & Savings Bank, Ltd. Taipei, Taiwan Introduction We have reviewed the accompanying consolidated balance sheets of The Shanghai Commercial & Savings Bank, Ltd. (the “Bank”) and its subsidiaries (collectively, the “Group”) as of September 30, 2019 and 2018, the related consolidated statements of comprehensive income for the three months ended September 30, 2019 and 2018 and the nine months ended September 30, 2019 and 2018, the consolidated statements of changes in equity and cash flows for the nine months ended September 30, 2019 and 2018, and the related notes to the consolidated financial statements, including a summary of significant accounting policies (collectively referred to as the consolidated financial statements). Management is responsible for the preparation and fair presentation of the consolidated financial statements in accordance with the Regulations Governing the Preparation of Financial Reports by Public Banks, and International Accounting Standard 34 “Interim Financial Reporting” endorsed and issued into effect by the Financial Supervisory Commission of Taiwan (R.O.C). Our responsibility is to express a conclusion on the consolidated financial statements based on our reviews. Scope of Review We conducted our reviews in accordance with Statement of Auditing Standards No. 65 “Review of Financial Information Performed by the Independent Auditor of the Entity”. A review of consolidated financial statements consists of making inquiries, primarily of persons responsible for financial and accounting matters, and applying analytical and other review procedures. A review is substantially less in scope than an audit and consequently does not enable us to obtain assurance that we would become aware of all significant matters that might be identified in an audit. Accordingly, we do not express an audit opinion. Conclusion Based on our reviews, nothing has come to our attention that caused us to believe that the accompanying consolidated financial statements do not present fairly, in all material respects, the consolidated financial position of the Group as of September 30, 2019 and 2018, and of its consolidated financial performance for the three months ended September 30, 2019 and 2018, and its consolidated financial performance and its consolidated cash flows for the nine months ended September 30, 2019 and 2018 in accordance with the Regulations Governing the Preparation of Financial Reports by Public Banks, and International Accounting Standard 34 “Interim Financial Reporting” endorsed and issued into effect by the Financial Supervisory Commission of Taiwan (R.O.C).

-3-
Emphasis of Matter As stated in Note 37 to the consolidated financial statements, the Group had not completed the acquisition purchase price allocation report when submitted to the board of directors in the third quarter of 2018, and the relevant accounting treatment was only tentative. The purchase price allocation report was completed in March, 2019.Therefore, the financial statements of the comparative period was retrospectively reviewed in accordance with the provisions of the IFRS 3 Business Combination. The accountant did not correct the review conclusions as a result. The engagement partners on the reviews resulting in this independent auditors’ reviews report are Chun-Hung Chen and Tzu-Jung Kuo. Deloitte & Touche Taipei, Taiwan Republic of China November 8, 2019
Notice to Readers The accompanying consolidated financial statements are intended only to present the consolidated financial position, financial performance and cash flows in accordance with accounting principles and practices generally accepted in Taiwan (R.O.C) and not those of any other jurisdictions. The standards, procedures and practices to review audit such consolidated financial statements are those generally applied in Taiwan (R.O.C). For the convenience of readers, the independent auditors’ review report and the accompanying consolidated financial statements have been translated into English from the original Chinese version prepared and used in Taiwan (R.O.C). If there is any conflict between the English version and the original Chinese version or any difference in the interpretation of the two versions, the Chinese-language independent auditors’ review report and consolidated financial statements shall prevail.

-4-
THE SHANGHAI COMMERCIAL & SAVINGS BANK, LTD. AND SUBSIDIARIES Consolidated Balance Sheets
September 30, 2019, December 31, 2018 and September 30, 2018 (Expressed in Thousands of New Taiwan Dollars)
September 30, 2019 (Reviewed)
December 31, 2018 (Audited)
September 30, 2018 (Restatement and Reviewed)
Codes ASSETS Amount % Amount % Amount % 11000 Cash and cash equivalents (Note 6) $49,330,482 3 $60,496,417 3 $70,365,291 4 11500 Due from the Central Bank and call loans to banks (Note 7) 215,997,804 11 191,069,205 10 211,840,511 12 12000 Financial assets measured at fair value through profit or loss (Note 8) 11,567,168 1 13,580,032 1 14,198,240 1 12100 Financial assets measured at fair value through other comprehensive income (Notes 9, 11 and 40) 466,674,454 23 436,008,517 23 401,643,697 22 12200 Investments in debt instruments measured at amortized cost (Notes 10, 11 and 40) 110,456,425 5 106,071,194 6 95,868,572 5 12500 Securities purchased under resale agreements (Note 12) 1,337,883 - 438,017 - 144,875 - 13000 Receivables, net (Notes 13 and 39) 18,015,451 1 16,993,738 1 20,895,984 1 13200 Current income tax assets (Note 34) 171,312 - 89,235 - 197,906 - 13500 Discounts and loans, net (Notes 14 and 39) 1,122,778,206 55 1,029,803,185 55 1,005,598,124 54 15000 Investments under the equity method, net (Note 16) 1,898,927 - 1,738,636 - 1,573,700 - 15500 Other financial assets, net (Note 17) 5,659,144 - 2,461,333 - 860 - 18500 Properties, net (Note 18) 21,390,471 1 21,546,669 1 21,489,205 1 18600 Right-of-use assets, net (Note 19) 2,453,841 - - - - - 18700 Investment properties, net (Note 20) 5,775,231 - 5,661,390 - 5,457,708 - 19000 Intangible assets, net (Note 21) 1,864,894 - 1,837,331 - 1,820,970 - 19300 Deferred income tax assets (Note 34) 767,667 - 1,325,996 - 1,192,611 - 19500 Other assets, net (Note 22) 3,553,151 - 3,288,862 - 3,313,570 - 10000 Total assets $2,039,692,511 100 $1,892,409,757 100 $1,855,601,824 100 Codes LIABILITIES AND EQUITY 21000 Due to the Central Bank and banks (Note 23) $82,990,566 4 $60,263,330 3 $57,422,943 3 22000 Financial liabilities measured at fair value through profit or loss (Note 8) 4,023,657 - 3,781,474 - 2,062,314 - 22500 Securities sold under repurchase agreements (Note 24) 12,808,245 1 14,629,530 1 25,306,706 2 23000 Payables (Notes 25 and 39) 31,417,900 2 30,113,575 2 31,552,165 2 23200 Current income tax liabilities (Note 34) 2,007,679 - 1,168,875 - 2,375,139 - 23500 Deposits and remittances (Notes 26 and 39) 1,610,210,195 79 1,520,625,615 80 1,486,492,676 80 24000 Bank debentures (Note 27) 79,114,628 4 64,785,252 4 57,723,924 3 25500 Other financial liabilities (Note 28) 3,664,819 - 4,211,038 - 4,099,869 - 25600 Provisions (Note 29) 2,585,046 - 2,385,217 - 2,312,427 - 26000 Lease liabilities (Note 19) 2,521,803 - - - - - 29300 Deferred income tax liabilities (Note 34) 10,031,136 - 9,411,303 1 9,087,094 1 29500 Other liabilities (Notes 30 and 39) 3,871,778 - 3,012,622 - 3,868,985 - 20000 Total liabilities 1,845,247,452 90 1,714,387,831 91 1,682,304,242 91 Equity (Note 32) Equity attributable to owners of the Bank
Share capital 31101 Ordinary shares 41,016,031 2 41,016,031 2 40,791,031 2 31111 Capital collected in advance 1,643,259 - - - - - 31500 Capital surplus 10,624,510 1 5,893,238 1 5,351,666 -
Retained earnings 32001 Legal reserve 51,946,585 3 47,832,994 3 47,832,994 3 32003 Special reserve 7,669,374 - 7,600,814 - 7,600,814 - 32005 Unappropriated earnings 22,312,022 1 23,499,036 1 20,126,458 1 32000 Total retained earnings 81,927,981 4 78,932,844 4 75,560,266 4 32500 Other equity 8,869,606 - 5,396,978 - 5,850,614 1 32600 Treasury shares (83,144 ) - (83,144 ) - (83,144 ) - 31000 Total equity attributable to owners of the Bank 143,998,243 7 131,155,947 7 127,470,433 7 38000 Non-controlling interests 50,446,816 3 46,865,979 2 45,827,149 2 30000 Total equity 194,445,059 10 178,021,926 9 173,297,582 9 Total liabilities and equity 2,039,692,511 100 1,892,409,757 100 1,855,601,824 100
The accompanying notes are an integral part of the consolidated financial statements.

-5-
THE SHANGHAI COMMERCIAL & SAVINGS BANK, LTD. AND SUBSIDIARIES Consolidated Statements of Comprehensive Income
For the nine months ended September 30, 2019 and 2018(Reviewed, Not Audited) (Expressed in Thousands of New Taiwan Dollars, Except Earnings Per Share)
For the Three Months Ended September 30 For the Nine Months Ended September 30 2019(Reviewed) 2018(Restatement) 2019(Reviewed) 2018(Restatement) Codes Amount % Amount % Amount % Amount % 41000 Interest revenue $13,188,618 121 $10,954,440 116 $37,817,885 120 $30,391,712 110 51000 Interest expenses 5,404,852 49 3,871,979 41 15,550,972 49 10,257,258 37 49010 Net interest (Notes 33 and 39) 7,783,766 72 7,082,461 75 22,266,913 71 20,134,454 73 Non-interest revenue 49100 Service fee income, net (Note 33) 1,741,887 16 1,200,785 13 5,330,391 17 4,071,198 15 49200 Gain on financial assets and liabilities measured at
fair value through profit or loss (Note 33) 166,326 1 90,700 1 579,267 2 (12,432) - 49310 Realized gain on financial assets measured at fair
value through other comprehensive income (Note 33) 420,161 4 398,999 4 1,286,759 4 1,034,613 4 49450 Loss on financial assets measured at amortized cost (215) - (138) - (215) - (1,807) - 49600 Foreign exchange gain, net 499,464 5 324,563 3 1,207,199 4 1,195,447 4 49700 Impairment gain(loss) on assets (Note 11) 9,503 - (14,402) - 5,376 - (22,237) - 49750 Proportionate share of profit of subsidiaries,
associates and joint ventures under the equity method, net (Note 16) (8,884) - (808) - 99,505 - 124,823 -
49800 Other non-interest revenue (Note 39) 269,331 2 394,289 4 754,463 2 994,305 4 49020 Total non-interest revenue 3,097,573 28 2,393,988 25 9,262,745 29 7,383,910 27 4xxxx Consolidated net revenue 10,881,339 100 9,476,449 100 31,529,658 100 27,518,364 100 58200 Provisions for bad-debt expense, commitment and
guarantee liability (Note 14) 275,228 3 151,876 1 852,705 3 517,510 2
Operating expenses 58500 Employee benefits (Notes 31, 33 and 39) 2,708,642 25 2,090,042 22 7,175,552 23 5,864,278 21 59000 Depreciation and amortization (Note 33) 413,470 4 203,105 2 1,235,242 4 606,397 2 59500 Other general and administrative 1,161,544 10 1,187,433 13 3,294,672 10 3,447,158 13 58400 Total operating expenses 4,283,656 39 3,480,580 37 11,705,466 37 9,917,833 36 61001 Profit before income tax 6,322,455 58 5,843,993 62 18,971,487 60 17,083,021 62 61003 Income tax expense (Note 34) (1,248,679) (11) (1,078,720) (12) (3,702,310) (12) (3,469,687) (13) 64000 Consolidated net income 5,073,776 47 4,765,273 50 15,269,177 48 13,613,334 49 Other comprehensive income (loss) Items that will not be reclassified subsequently to
profit or loss: 65204 Gain on investments in equity instruments measured at fair value through other comprehensive income $277,959 2 $1,146,923 12 $860,874 3 $1,943,620 7 65205 Financial liabilities designated at FVTPL which the amount of change derived from credit risk (Note 8) (15,796) - - - (26,112) - - -

-6-
THE SHANGHAI COMMERCIAL & SAVINGS BANK, LTD. AND SUBSIDIARIES Consolidated Statements of Comprehensive Income
For the nine months ended September 30, 2019 and 2018(Reviewed, Not Audited) (Expressed in Thousands of New Taiwan Dollars, Except Earnings Per Share)
The accompanying notes are an integral part of the consolidated financial statements. (Concluded)
For the Three Months Ended September 30 For the Nine Months Ended September 30 2019(Reviewed) 2018(Restatement) 2019(Reviewed) 2018(Restatement) Codes Amount % Amount % Amount % Amount % 65206 Proportionate share of other comprehensive income
of associates and joint ventures under the equity method 1 - (42) - (51) - (31) -
65220 Income tax relating to items that may not be reclassified subsequently to profit or loss (Note 34) 7,186 - 37,704 1 (21,665) - 1,601,464 6
65200 Subtotal of items that will not be reclassified subsequently to profit or loss 269,350 2 1,184,585 13 813,046 3 3,545,053 13
Items that may be reclassified subsequently to profit
or loss: 65301 Exchange differences on translating foreign operations (109,542) (1) 587,048 6 1,139,464 4 2,813,582 10
65306 Share of the other comprehensive income of associates and joint ventures accounted for using the equity method 18,476 - 834 - 64,187 - (35,159) -
65309 Gain(loss) on debt instruments measured at fair value through other comprehensive income 287,793 3 101,544 1 3,972,569 12 (1,727,515) (6) 65310 Loss allowance on debt instruments measured at fair value through other comprehensive income (Note 11) (9,416) - 14,962 - (4,705) - 22,174 -
65320 Income tax relating to items that may be reclassified subsequently to profit or loss (Note 34) (562,892) (5) (898,319) (9) (1,298,047) (4) (43,359) -
65300 Subtotal of items that may be reclassified subsequently to profit or loss (375,581) (3) (193,931) (2) 3,873,468 12 1,029,723 4
65000 Other comprehensive income (loss) for the period, net of income tax (106,231) (1) 990,654 11 4,686,514 15 4,574,776 17
66000 Total comprehensive income for the period $4,967,545 46 $5,755,927 61 $19,955,691 63 $18,188,110 66 Net profit attributable to: 67101 Owners of the Bank $3,725,283 34 $3,565,837 37 $11,309,560 36 $10,215,540 37 67111 Non-controlling interests 1,348,493 13 1,199,436 13 3,959,617 12 3,397,794 12 67100 $5,073,776 47 $4,765,273 50 $15,269,177 48 $13,613,334 49 Total comprehensive income attributable to: 67301 Owners of the Bank $3,845,796 36 $4,020,811 43 $14,693,768 46 $12,086,174 44 67311 Non-controlling interests 1,121,749 10 1,735,116 18 5,261,923 17 6,101,936 22 67300 $4,967,545 46 $5,755,927 61 $19,955,691 63 $18,188,110 66 Earnings per share (Note 35) 67500 Basic $0.91 $0.88 $2.76 $2.51 67700 Diluted $0.91 $0.88 $2.76 $2.51

-7-
THE SHANGHAI COMMERCIAL & SAVINGS BANK, LTD. AND SUBSIDIARIES Consolidated Statements of Changes in Equity
For the nine months ended September 30, 2019 and 2018(Reviewed, Not Audited) (Expressed in Thousands of New Taiwan Dollars)
Equity Attributable to Owners of the Bank (Note 3 and Note 32) Codes Share Capital Retained Earnings Other Equity
Change in Change in
Exchange
Differences on Unrealized Gain
(Loss) on Financial Assets at
Fair Value Credit Risk From
Financial Total Equity Capital Translating Available-for- Through Other Liabilities Attributable to Non-controlling Ordinary Collected Unappropriated Foreign sale Financial Comprehensive Designated at Owners of the Interests Shares in Advance Capital Surplus Legal Reserve Special Reserve Earnings Operations Assets Income FVTPL Treasury Shares Bank (Note 32) Total Equity
A1 Balance at January 1, 2018 $ 40,791,031 $ - $ 4,655,555 $ 44,117,426 $ 7,538,888 $ 21,066,873 $ (1,564,469) $ 5,887,639 $ - $ - $ (83,144) $ 122,409,799 $ 40,623,295 $ 163,033,094 A3 Effect of retrospective application and retrospective restatement - - - - - 55,374 - (5,887,639) 5,453,000 - - (379,265) (16,386) (395,651) A5 Balance at January 1, 2018 as restated 40,791,031 - 4,655,555 44,117,426 7,538,888 21,122,247 (1,564,469) - 5,453,000 - (83,144) 122,030,534 40,606,909 162,637,443 Appropriation of 2017 earnings B1 Legal reserve - - - 3,715,568 - (3,715,568) - - - - - - - - B3 Special reserve - - - - 61,926 (61,926) - - - - - - - - B5 Cash dividends - - - - - (7,342,386) - - - - - (7,342,386) - (7,342,386) C7 Changes in capital surplus from investments in associates and
joint ventures accounted for using the equity method - - 9,480 - - - - - - - - 9,480 - 9,480
C17 Dividends not yet collected - - 686,631 - - - - - - - - 686,631 - 686,631 D1 Net profit for the nine months ended September 30, 2018 - - - - - 10,215,540 - - - - - 10,215,540 3,397,794 13,613,334 D3 Other comprehensive income for the nine months ended
September 30, 2018, net of income tax - - - - - 10,843 957,909 - 901,882 - - 1,870,634 2,704,142 4,574,776
D5 Total comprehensive income for the nine months ended
September 30, 2018 - - - - - 10,226,383 957,909 - 901,882 - - 12,086,174 6,101,936 18,188,110
Q1 Disposal of equity instruments at fair value through other
comprehensive income - - - - - (102,292) - - 102,292 - - - - -
O1 Changes in non-controlling interests - - - - - - - - - - - - (881,696) (881,696) Z1 Balance at September 30, 2018 $ 40,791,031 $ - $ 5,351,666 $ 47,832,994 $ 7,600,814 $ 20,126,458 $ (606,560) $ - $ 6,457,174 $ - $ (83,144) $ 127,470,433 $ 45,827,149 $ 173,297,582 A1 Balance at January 1, 2019 $ 41,016,031 $ - $ 5,893,238 $ 47,832,994 $ 7,600,814 $ 23,499,036 $ (165,709) $ - $ 5,562,687 $ - $ (83,144) $ 131,155,947 $ 46,865,979 $ 178,021,926 A3 Effect of retrospective application and retrospective restatement - - - - - (22,797) - - - - - (22,797) (15,229) (38,026) A5 Balance at January 1, 2019 as restated 41,016,031 - 5,893,238 47,832,994 7,600,814 23,476,239 (165,709) - 5,562,687 - (83,144) 131,133,150 46,850,750 177,983,900 Appropriation of 2018 earnings B1 Legal reserve - - - 4,113,591 - (4,113,591) - - - - - - - - B3 Cash dividends - - - - 68,560 (68,560) - - - - - - - - B5 Share dividends - - - - - (8,203,206) - - - - - (8,203,206) - (8,203,206) C7 Changes in capital surplus from investments in associates and
joint ventures accounted for using the equity method - - 10,534 - - - - - - - - 10,534 - 10,534
M7 Changes in equity of subsidiaries - - 85,518 - - - - - - - - 85,518 (85,518) - D1 Net profit for the nine months ended September 30, 2019 - - - - - 11,309,560 - - - - - 11,309,560 3,959,617 15,269,177 D3 Other comprehensive income (loss) for the nine months ended
September 30, 2019, net of income tax - - - - - - 289,123 - 3,121,197 (26,112) - 3,384,208 1,302,306 4,686,514
D5 Total comprehensive income (loss) for the nine months ended
September 30, 2019 - - - - - 11,309,560 289,123 - 3,121,197 (26,112) - 14,693,768 5,261,923 19,955,691
E1 Issue of ordinary shares for capital increase by cash - 1,643,259 4,635,220 - - - - - - - - 6,278,479 - 6,278,479 Q1 Disposal of equity instruments at fair value through other
comprehensive income - - - - - (88,420) - - 88,420 - - - - -
O1 Changes in non-controlling interests - - - - - - - - - - - - (1,580,339) (1,580,339) Z1 Balance at September 30, 2019 $ 41,016,031 $ 1,643,259 $ 10,624,510 $ 51,946,585 $ 7,669,374 $ 22,312,022 $ 123,414 $ - $ 8,772,304 $ (26,112) $ (83,144) $ 143,998,243 $ 50,446,816 $ 194,445,059 The accompanying notes are an integral part of the consolidated financial statements.

-8-
THE SHANGHAI COMMERCIAL & SAVINGS BANK, LTD. AND SUBSIDIARIES
Consolidated Statements of Cash Flows For the nine months ended September 30, 2019 and 2018(Reviewed, Not Audited)
(Expressed in Thousands of New Taiwan Dollars)
(Continued)
For the Nine Months Ended September 30
Codes 2019
(Reviewed) 2018
(Restatement)
Cash flows from operating activities A00010 Consolidated net profit before income tax $18,971,487 $17,083,021 A20010 Adjustments to reconcile net profit to net cash provided by operating activities A20100 Depreciation expenses 1,074,837 445,906 A20200 Amortization expenses 160,405 160,491 A20300 Bad debt expense, commitment and guarantee liability provisions 852,705 517,510 A21400 Loss(gain) on expected credit impairment (5,376) 22,237 A20400 Loss(gain) on financial assets and liabilities at fair value through profit or loss (255,211) 365,429 A20900 Interest expenses 15,550,972 10,257,258 A21200 Interest revenue (37,817,885) (30,391,711) A21300 Dividend income (981,124) (593,391) A22400 Proportionate share of profit of associates and joint ventures (99,505) (124,823) A22500 Loss(gain) on disposal of properties and equipment, net (18,768) 8,014 A29900 Other adjustments (326,709) (447,686) A40000 Changes in operating assets and liabilities A41110 Decrease in due from the Central Bank and call loans to banks 17,424,710 9,476,553 A41120 Decrease(increase) in financial assets measured at fair value through profit or loss 2,369,040 (998,790) A41123 Increase in financial assets measured at fair value through other comprehensive
income (28,397,803) (50,906,936) A41125 (Increase) decrease in investments in debt instrument measured at amortized cost (1,132,095) 16,103,181
A41150 Increase in receivables (1,515,473) (3,894,561) A41160 Increase in discounts and loans (91,009,417) (72,484,221) A41190 (Increase)decrease in other financial assets (3,197,787) 4,954 A42110 Increase in due to the Central Bank and banks 22,295,122 21,700,905 A42120 Increase in financial liabilities at fair value through profit or loss 173,720 1,201,151 A42140 Decrease in securities sold under repurchase agreements (1,821,285) (4,485,361) A42150 (Decrease) increase in payables (129,013) 2,301,702 A42160 Increase in deposits and remittances 84,876,482 78,658,185 A42170 (Decrease) increase in other financial liabilities (950,393) 850,063 A42180 Increase in employee benefit provisions 111,067 78,131 A42990 Increase in other liabilities 1,008,400 125,725
A33000 Cash used in operations (2,788,897) (4,967,064)
A33100 Interest received 38,495,149 30,320,761 A33200 Dividends received 981,124 593,391 A33300 Interest paid (14,199,879) (9,184,325) A33500 Income tax paid (2,021,331) (2,778,260)
AAAA Net cash generated from operating activities 20,466,166 13,984,503
-9-
THE SHANGHAI COMMERCIAL & SAVINGS BANK, LTD. AND SUBSIDIARIES Consolidated Statements of Cash Flows
For the nine months ended September 30, 2019 and 2018(Reviewed, Not Audited) (Expressed in Thousands of New Taiwan Dollars)
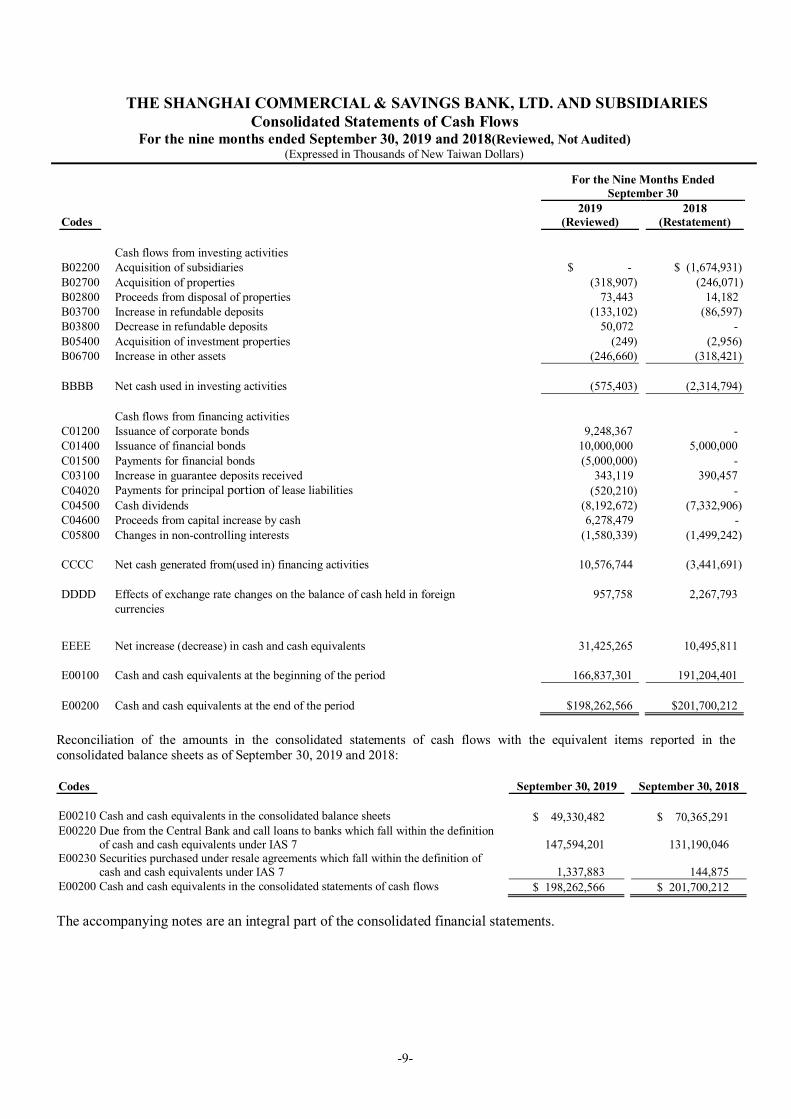
Reconciliation of the amounts in the consolidated statements of cash flows with the equivalent items reported in the consolidated balance sheets as of September 30, 2019 and 2018: Codes September 30, 2019 September 30, 2018
E00210 Cash and cash equivalents in the consolidated balance sheets $ 49,330,482 $ 70,365,291 E00220 Due from the Central Bank and call loans to banks which fall within the definition
of cash and cash equivalents under IAS 7
147,594,201 131,190,046 E00230 Securities purchased under resale agreements which fall within the definition of
cash and cash equivalents under IAS 7
1,337,883 144,875 E00200 Cash and cash equivalents in the consolidated statements of cash flows $ 198,262,566 $ 201,700,212
The accompanying notes are an integral part of the consolidated financial statements.
For the Nine Months Ended September 30
Codes 2019
(Reviewed) 2018
(Restatement)
Cash flows from investing activities B02200 Acquisition of subsidiaries $ - $ (1,674,931) B02700 Acquisition of properties (318,907) (246,071) B02800 Proceeds from disposal of properties 73,443 14,182 B03700 Increase in refundable deposits (133,102) (86,597) B03800 Decrease in refundable deposits 50,072 - B05400 Acquisition of investment properties (249) (2,956) B06700 Increase in other assets (246,660) (318,421) BBBB Net cash used in investing activities (575,403) (2,314,794) Cash flows from financing activities C01200 Issuance of corporate bonds 9,248,367 - C01400 Issuance of financial bonds 10,000,000 5,000,000 C01500 Payments for financial bonds (5,000,000) - C03100 Increase in guarantee deposits received 343,119 390,457 C04020 Payments for principal portion of lease liabilities (520,210) - C04500 Cash dividends (8,192,672) (7,332,906) C04600 Proceeds from capital increase by cash 6,278,479 - C05800 Changes in non-controlling interests (1,580,339) (1,499,242) CCCC Net cash generated from(used in) financing activities 10,576,744 (3,441,691) DDDD Effects of exchange rate changes on the balance of cash held in foreign 957,758 2,267,793 currencies
EEEE Net increase (decrease) in cash and cash equivalents 31,425,265 10,495,811 E00100 Cash and cash equivalents at the beginning of the period 166,837,301 191,204,401 E00200 Cash and cash equivalents at the end of the period $198,262,566 $201,700,212

10
THE SHANGHAI COMMERCIAL & SAVINGS BANK, LTD. AND SUBSIDIARIES Notes to Consolidated Financial Statements
For the nine months ended September 30, 2019 and 2018(Reviewed, Not Audited) (Expressed in thousands of New Taiwan Dollars, unless otherwise stated)
1. ORGANIZATION AND OPERATIONS
The Shanghai Commercial & Savings Bank (the “Bank”) was incorporated in Taiwan and engaged in the commercial banking businesses under related laws and regulations. The Bank has a head office in Taipei, 71 domestic branches, 3 foreign branches located in Hong Kong, Vietnam and Singapore, and 3 representative offices located in Thailand, Cambodia and Indonesia. The operations of the Bank’s trust department include services related to planning, managing and operating a trust business under the Banking Act and Trust Enterprise Act. The shares of the Bank have been listed and traded on the Taiwan Stock Exchange since October 19, 2018. The consolidated financial statements are presented in the Bank’s functional currency, the New Taiwan dollar. In order to integrate the use of resources and achieve operating synergy, the Bank merged SCSB Life Insurance Agency and SCSB Property Insurance Agency on May 6, 2019, which were both 100% owned by the Bank. The shareholder’s equity would not be affected after the merger, refer to Note 48.
2. AUTHORIZATION OF CONSOLIDATED FINANCIAL STATEMENTS On November 8, 2019, the consolidated financial statements were approved by the board of directors and issued afterward.
3. APPLICATION OF NEW, AMENDED AND REVISED STANDARDS AND INTERPRETATIONS 3.1 Initial application of the amendments to the Regulations Governing the Preparation of Financial
Reports by Securities Issuers and the International Financial Reporting Standards (IFRS), International Accounting Standards (IAS), IFRIC Interpretations (IFRIC), and SIC Interpretations (SIC) (collectively, the “IFRSs”) endorsed and issued into effect by the Financial Supervisory Commission (FSC). Aside from the following explanations, the applicable amendments to the Regulations Governing the Preparation of Financial Reports by Public Banks and the IFRSs approved and issued by the FSC will not result in significant changes to the Bank's accounting policies: IFRS 16 “Lease” IFRS 16 sets out the identification of lease agreements and the accounting standards for lessor and lessee that will supersede IAS 17 and a number of related interpretations. For the related accounting policy, see Note 4. Definition of Lease When applying IFRS 16 for the first time, the Bank will choose whether a contract signed or changed on or after January 1, 2019 will be assessed as a lease according to IFRS 16. Currently, lease contracts under IAS 17 and IFRIC 4 are not allowed to be reassessed, which should be processed in accordance with the transitional provisions of IFRS 16.

11
The Bank as lessee
When IFRS 16 is applied, leases are recognized as the right-of-use assets and lease liabilities in the consolidated balance sheets, except for the low value underlying asset leases and short-term leases, which are recognized under a straight-line basis. However, assets, which are eligible for use under the definition of investment real estate, will be presented as investments in real estate.
The consolidated comprehensive income statements will represent the depreciation expense of the right-of-use assets and the interest expense arising from the effective interest method on the lease liabilities separately.
In the consolidated cash flow statements, the principal amount of lease liabilities is expressed as financing activities, and the interest payment portion is classified as operating activities. Prior to the application of IFRS 16, the operating leases were recognized as expenses on a straight-line basis. Operating lease cash flows are expressed in operating activities in the consolidated cash flow statements. Contracts classified as finance leases are recognized in the consolidated balance sheets as lease assets and lease payables. The Group elects to apply IFRS 16 retrospectively with the cumulative effect of the initial application of this standard recognized in retained earnings on January 1, 2019. Comparative information is not restated. In accordance with the agreement of IAS 17 for operating leases, the measurement of lease liabilities on January 1, 2019 had been discounted by the remaining lease payments at the incremental borrowing rate of the lessee at that date. Parts of right-of-use assets were measured at the amount of lease liabilities on that date. Parts of the right-of-use assets were discounted at the aforementioned interest rate and measured as if IFRS 16 had been applied at the commencement date of the lease. The identified right-of-use assets will be subject to an IAS 36 impairment assessment. For the leases classified as financing leases under IAS 17, the carrying amount of the lease assets and lease liabilities on January 1, 2019 was the same as those on December 31, 2018.
The Bank as lessor
No adjustments were made to the lessor's lease during the transition and IFRS 16 was applied from January 1, 2019. The adjustments of assets, liabilities and equities accounts that applied IFRS 16 for the first time are summarized as follows:
Carrying Amount as of
December 31, 2018
Adjustments Arising from Initial Application
Adjusted Carrying Amount as of
January 1, 2019 Other assets, net $ 3,288,862 $ (17,368) $ 3,271,494 Right-of-use assets - 2,092,410 2,092,410 Total effect on assets $ 3,288,862 $ 2,075,042 $ 5,363,904 Accounts payable $ 30,113,575 $ (3,121) $ 30,110,454 Liabilities provisions 2,385,217 2,748 2,387,965 Deferred income tax liabilities 9,411,303 (5,699) 9,405,604 Lease liabilities - 2,119,140 2,119,140 Total effect on liabilities $ 41,910,095 $ 2,113,068 $ 44,023,163 Retained earnings $ 78,932,844 $ (22,797) $ 78,910,047 Non-controlling interests 46,865,979 (15,229) 46,850,750 Total effect on equities $ 125,798,823 $ (38,026) $ 125,760,797

12
3.2 IFRSs approved by the FSC for application starting from 2020
New IFRSs Effective Date
Announced by IASB Amendments to IFRS 3 “Definition of a Business” January 1, 2020 (Note 1) Amendments to IAS 1 and IAS 8 “Definition of Material” January 1, 2020 (Note 2)
Note 1: The Group shall apply these amendments to business combinations for which the acquisition date is on or after the beginning of the first annual reporting period beginning on or after January 1, 2020 and to asset acquisitions that occur on or after the beginning of that period.
Note 2: The Group shall apply these amendments prospectively for annual reporting periods
beginning on or after January 1, 2020. As of the date the consolidated financial statements were authorized for issue, the Group is continuously assessing the possible impact that the application of other standards and interpretations will have on the Group’s financial position and financial performance and will disclose the relevant impact when the assessment is completed.
3.3 New IFRSs in issue but not yet endorsed and issued into effect by the FSC
New IFRSs Effective Date
Announced by IASB (Note 1) Amendments to IFRS 9, IAS39 and IFRS 7 “Inter Bank Offered Rate Change” January 1, 2020 Amendments to IFRS 10 and IAS 28 “Sale or Contribution of Assets between an Investor and its Associate or Joint Venture”
To be determined by IASB
IFRS 17 “Insurance Contracts” January 1, 2021
Note 1: Unless stated otherwise, the above New IFRSs are effective for annual periods beginning on or after their respective effective dates.
As of the date the consolidated financial statements were authorized for issue, the Group is continuously assessing the possible impact that the application of other standards and interpretations will have on the Group’s financial position and financial performance and will disclose the relevant impact when the assessment is completed.
4. SUMMARY OF SIGNIFICANT ACCOUNTING POLICIES
4.1 Statement of Compliance
The consolidated financial statements have been prepared in accordance with the Regulations Governing the Preparation of Financial Reports by Public Banks, and IAS 34 “Interim Financial Reporting” as endorsed and issued into effect by the FSC. Under IFRSs, disclosure information included in these interim consolidated financial statements is less than the disclosure information required in a complete set of annual consolidated financial statements.
4.2 Basis of Preparation
The consolidated financial statements have been prepared on the historical cost basis except for financial instruments which are measured at fair value. The fair value measurements are grouped into Levels 1 to 3 based on the degree to which the fair value measurement inputs are observable and the significance of the inputs to the fair value measurement in its entirety, which are described as follows: 4.2.1 Level 1 inputs are quoted prices (unadjusted) in active markets for identical assets or liabilities;

13
4.2.2 Level 2 inputs are observable parameters other than quoted prices included within Level 1,
either directly (i.e. as prices) or indirectly (i.e. derived from prices); 4.2.3 Level 3 inputs are unobservable inputs for an asset or liability.
4.3 Basis of Consolidation
The consolidated financial statements contain the financial statements of the Bank and the subsidiaries controlled by the Bank. The consolidated statements of comprehensive income have included the operating gains and losses of acquired or divested companies in the current period from the date of acquisition or to the date of disposal. The financial statements of subsidiaries have been adjusted to align their accounting policies with the Bank's accounting policies. In the preparation of the consolidated financial statements, all intra-company transactions, account balances, income and losses have been eliminated. The comprehensive income of the subsidiaries is attributed to the owner of the Bank and non-controlling interests, even if the non-controlling interests have negative balance. For details on subsidiaries, shareholding ratios and business items, refer to Note 15.
4.4 Other Significant Accounting Policies
Except for lease related accounting policies and the following the accounting policies applied in these consolidated financial statements are consistent with those applied in the consolidated financial statements for the year ended December 31, 2018. For the summary of other significant accounting policies, refer to the consolidated financial statements for the year ended December 31, 2018.
4.4.1 Retirement benefits Pension cost for an interim period is calculated on a year-to-date basis by using the actuarially determined annual pension cost rate at the end of the prior financial year, adjusted for significant market fluctuations since that time and for significant plan amendments, settlements, or other significant one-off events. 4.4.2 Taxation Income tax expense represents the sum of the tax currently payable and deferred tax. Interim period income taxes are assessed on an annual basis and calculated by applying to an interim period's pre-tax income the tax rate that would be applicable to expected total annual earnings. 4.4.3 Properties In order to cope with the redevelopment of the head office building, the original building is expected to be demolished in January 2020. Based on this actual situation, the Group re-evaluated the durability period of the accounting items “ Properties –Buildings” of the original building, and proposed to change its estimated useful life by amortizing the unreduced book value of $159,069 thousand from the original accounting item of the building before end of 2019. This matter was approved by the competent authority and applied on October 17, 2019. 4.4.4 Leases
2019 The Group assesses whether the contract is (or includes) the lease on the contract establishment date. For contracts that include the lease and non-lease components, the Group distributes the consideration in the contract on a relatively separate price basis and deals with them separately.

14
(1) The Group as lessor
When the lease terms transfer almost all the risks and rewards attached to the ownership of the assets to the lessee, they are classified as finance leases. All other leases are classified as operating leases. Under finance leases, lease payments include fixed payments, substantially fixed payments, variable lease payments which depend on an index or a rate, guaranteed residual values, and the exercise price of the purchase option that is reasonably certain to be exercised, and the rental termination penalties reflected in the lease term, less the incentives for the lease to be paid. The net amount of the leased investment is measured as the sum of the present value of both the lease receivable and the unguaranteed residual value plus the original direct costs and expressed as a finance lease receivable. The financing income is apportioned to each accounting period so as to reflect a periodic fixed rate of return that the Group's unexpired net lease investment is available for each period. Under operating leases, the lease payments deducted from the lease incentives are recognized as income on a straight-line basis over the relevant lease periods. The original direct costs incurred in obtaining the operating leases are added to the carrying amount of the underlying assets and recognized as an expense on a straight-line basis over the lease terms.
(2) The Group as lessee
The Group recognizes right-of-use assets and lease liabilities for all leases at the commencement date of a lease, except for short-term leases and low value asset leases accounted for applying a recognition exemption where lease payments are recognized as expenses on a straight line basis over the lease terms. Right-of-use assets are initially measured at cost, which comprises the initial measurement of lease liabilities adjusted for lease payments made at or before the commencement date, plus any initial direct costs incurred and an estimate of costs needed to restore the underlying assets, and less any lease incentives received. Right-of-use assets are subsequently measured at cost less accumulated depreciation and impairment losses and adjusted for any remeasurement of the lease liabilities.
Right-of-use assets are depreciated using the straight-line basis from the commencement dates of the lease to the earlier of the end of the useful lives of the right-of-use assets or the end of the lease terms. Lease liabilities are initially measured at the present value of the lease payments, which comprise fixed payments, substantially fixed payments, variable lease payments which depend on an index or a rate, residual value guarantees, the exercise price of a purchase option if the Group is reasonably certain to exercise that option, and payments of penalties for terminating a lease if the lease term reflects such termination, less any lease incentives receivable. The lease payments are discounted using the interest rate implicit in a lease, if that rate can be readily determined. If that rate cannot be readily determined, the Group uses the lessee’s incremental borrowing rate. Subsequently, lease liabilities are measured at amortized cost using the effective interest method, with interest expense recognized over the lease terms. When there is a change in the amounts expected to be payable under a residual value guarantee, a change in the assessment of an option to purchase an underlying asset, or a change in future lease payments resulting from a change in an index or a rate used to determine those payments, the Group remeasures the lease liabilities with a corresponding adjustment to the right-of-use assets. However, if the carrying amount of the right-of-use asset has been reduced to zero, the remaining amount of remeasurement is recognized in profit or loss. Lease liabilities are presented separately in the consolidated balance sheets.

15
2018
Leases are classified as finance leases whenever the terms of the lease transfer substantially all the risks and rewards of ownership to the lessee. All other leases are classified as operating leases. (1) The Group as lessor
Rental income from operating leases is recognized on a straight-line basis over the term of the relevant lease.
(2) The Group as lessee
Operating lease payments are recognized as an expense on a straight-line basis over the lease term.
5. CRITICAL ACCOUNTING JUDGMENTS AND KEY SOURCES OF ESTIMATION UNCERTAINTY In the application of the Bank's accounting policies, the management is required to make judgments, estimates and assumptions about the carrying amounts of assets and liabilities that are not readily apparent from other sources. The estimates and associated assumptions are based on historical experience and other factors that are considered to be relevant. Actual results may differ from these estimates. The estimates and underlying assumptions are reviewed on an ongoing basis. Revisions to accounting estimates are recognized in the period in which the estimate is revised if the revision affects only that period or in the period of the revision and future periods if the revision affects both current and future periods.
Estimated impairment of financial assets Estimates of impairment on loans and receivables are based on management’s assumptions about default rates and expected loss rates. The Bank considers historical experience, current market conditions and forward-looking information to make assumptions and select input values for impairment assessments. Refer to Note 42 for the important assumptions and input values used. If the actual cash flows in the future are less than expected, significant impairment losses may occur.
6. CASH AND CASH EQUIVALENTS
September 30, 2019 December 31, 2018 September 30, 2018 Cash on hand and working fund $ 8,734,127 $ 8,598,419 $ 8,512,794 Notes and checks in clearing 1,926,741 3,105,616 3,354,229 Due from other banks 38,669,614 48,792,382 58,498,268 $ 49,330,482 $ 60,496,417 $ 70,365,291 The reconciliation of the amounts of cash and cash equivalents reported in the consolidated statements of cash flows and consolidated balance sheets as of December 31, 2018 is shown below. For the reconciliation of the period ended September 30, 2019 and 2018, refer to the consolidated statements of cash flows.

16
December 31, 2018 Cash and cash equivalents in consolidated balance sheets $ 60,496,417 Due from the Central Bank and call loans to banks which are categorized as cash and cash
equivalents under IAS 7 105,902,867 Securities purchased under resale agreements which are categorized as cash and cash
equivalents under IAS 7 438,017 Cash and cash equivalents $ 166,837,301 The Group assesses the allowance for cash and cash equivalents based on the expected credit loss model. Due to the low credit risk of cash and cash equivalents, allowance losses are recognized based on the 12-month expected credit losses. On September 30, 2019, December 31 and September 30, 2018, cash and cash equivalents recognized as allowances were in the amounts of $1,869 thousand, $1,505 thousand and $254 thousand, respectively.
7. DUE FROM THE CENTRAL BANK AND CALL LOANS TO BANKS, NET
September 30, 2019 December 31, 2018 September 30, 2018 Call loans to banks $ 182,031,562 $ 162,795,368 $ 181,994,658 Deposit reserves - I 10,051,606 5,825,635 9,008,937 Deposit reserves - II 21,209,002 19,651,176 18,527,161 Deposit reserves - foreign 160,689 158,795 158,389 Due from foreign central banks 2,544,945 2,638,231 2,151,366 $ 215,997,804 $ 191,069,205 $ 211,840,511 Deposit reserves are statutory reserves and determined monthly at prescribed rates based on average balances of customers’ deposits. The entire balance of deposit reserves - II is subject to withdrawal restrictions while no restrictions are placed on other deposit reserves. The Group assesses the allowance for due from the Central Bank and call loans to banks in accordance with the expected credit loss model. Due to the low credit risk of due from the Central Bank and call loans to banks, the loss allowance is recognized as 12-month expected credit losses. On September 30, 2019, December 31 and September 30, 2018, the allowances recognized for the due from the Central Bank and call loans to banks were in the amounts of $1,373 thousand, 2,253 thousand and 10,431 thousand, respectively.

17
8. FINANCIAL INSTRUMENTS AT FAIR VALUE THROUGH PROFIT OR LOSS
September 30, 2019 December 31, 2018 September 30, 2018 Financial assets at fair value through profit
or loss Financial assets measured at fair value
through profit or loss Corporate bonds $ 7,872,706 $ 8,294,566 $ 8,040,206 Forward contracts 1,356,223 1,245,817 1,759,313 Shares 965,735 891,791 808,354 Beneficiary securities 503,849 2,630,218 3,027,662 Interest rate swap contracts 394,476 140,200 48,963 Government bonds 182,744 - 136,955 Option contracts 204,517 284,402 314,266 Others 86,918 93,038 62,521 $ 11,567,168 $ 13,580,032 $ 14,198,240 Financial liabilities at fair value through profit or loss Held-for-trading financial liabilities Forward contracts $ 1,258,976 $ 1,171,737 $ 1,684,052 Option contracts 225,775 319,039 346,459 Others 50,923 48,177 31,803 1,535,674 1,538,953 2,062,314 Financial liabilities designated at fair value through profit or loss Bank debentures 2,487,983 2,242,521 - $ 4,023,657 $ 3,781,474 $ 2,062,314 The Group engages in derivative transactions mainly to accommodate customers’ needs and manage its exposure positions. The financial assets and liabilities at FVTPL contract (nominal) amounts of derivative transactions were as follows: September 30, 2019 December 31, 2018 September 30, 2018 Option contracts $ 286,481,302 $ 212,466,269 $ 223,466,795 Forward contracts 224,211,378 137,644,001 197,733,765 Currency swap contracts 19,950,330 19,892,282 17,353,082 Interest rate swap contracts 2,608,020 2,258,760 266,650 Asset exchange transactions 558,468 1,014,354 854,000 Future contracts 10,176 54,209 11,039
Information for financial liabilities designated by the Bank at FVTPL is as follows (September 30, 2018:
None):
September 30, 2019 December 31, 2018
The difference between the fair value and the maturity value -Fair value $ 2,487,983 $ 2,242,521 -Maturity value 2,550,401 2,250,590 $ (62,418) $ (8,069)

18
Effects of changes in credit risk Current amount of change From January1, 2019 to September 30, 2019 $(26,112) Cumulative amount of change Up to September 30, 2019 $(26,112) The financial liabilities designated by the Bank at FVTPL were the second issuance of unsecured debentures amounting to US$70,000 thousand with a 30-year maturity and a fixed interest rate of 0% on October 29, 2018. On the expiration of 5 years and every subsequent year, the Bank may exercise the option at the agreed redemption price. If the option is not exercised during the period, the payment will be made on the expiration date.
The Bank arranged an interest rate swap contract to reduce the interest rate risk of the aforementioned financial bonds. The interest rate swap contract was measured at fair value and the fair value changes were included in profit or loss. The Bank designated the aforementioned financial bonds as financial liabilities measured at FVTPL for consistencies. The amount of change in the fair value of financial bonds and the combination of financial assets attributable to the changes in the fair value of financial liabilities and the combination of the fair value of financial assets is calculated as the difference between the changes in the fair value of market risk factor. The amount of change in fair value attributable to the market risk factor is calculated using the benchmark yield curve at the balance sheet date. Fair value of financial bonds and combined commodities is based on the benchmark yield curve on the balance sheet date and the estimated credit risk spread by the creditor's interest rate quote on the similar maturity date of the combined company, such that the estimated future cash flow is discounted.
9. FINANCIAL ASSETS AT FAIR VALUE THROUGH OTHER COMPREHENSIVE INCOME
September 30, 2019 December 31, 2018 September 30, 2018 Financial assets at fair value through
other comprehensive income Investments in equity instruments measured
at FVTOCI Shares $ 20,526,185 $ 19,245,827 $ 20,868,009 Investments in debt instruments measured at
FVTOCI Bank debentures 163,630,242 186,430,516 185,737,697 Corporate bonds 143,638,928 103,366,162 90,901,887 Government bonds 105,555,261 81,577,905 60,191,756 Commercial papers 31,794,046 43,122,083 38,181,426 Asset backed securities 1,529,792 274,292 278,708 Treasury bonds - 1,991,732 5,484,214 446,148,269 416,762,690 380,775,688 $ 466,674,454 $ 436,008,517 $ 401,643,697
The Bank invests in ordinary shares for medium- and long-term strategic purposes and expects to make a profit through long-term investments. The management of the Bank considers that if the short-term fair value fluctuations of these investments are included in profit or loss, they are inconsistent with the aforementioned long-term investment plans. Therefore, the designated investments are selected to be measured at FVTOCI.
For the information on credit risk management and impairment assessment of investments in debt instruments at FVTOCI, refer to Note 11. Parts of the aforementioned financial assets at FVTOCI were sold under repurchase agreements as of September 30, 2019, December 31 and September 30, 2018. The par value of bonds and commercial

19
papers sold under repurchase agreements were $12,071,796 thousand, $14,450,800 thousand and $25,104,500 thousand, respectively. For the information on financial assets pledged at FVTOCI, refer to Note 40.
10. INVESTMENTS IN DEBT INSTRUMENTS MEASURED AT AMORTIZED COST
September 30, 2019 December 31, 2018 September 30, 2018 Negotiable certificates of deposit $ 94,830,000 $ 88,165,000 $ 74,175,000 Government bonds 11,894,377 12,534,538 15,617,080 Corporate bonds 2,648,768 3,148,504 3,102,160 Bank debentures 1,084,732 1,228,948 1,281,875 Treasury bonds - 995,971 1,694,126 Less: Loss allowance (1,452) (1,767) (1,669) $ 110,456,425 $ 106,071,194 $ 95,868,572
For the information on financial assets’ related credit risk management and impairment at amortized cost, refer to Note 11. For the information on related financial assets at amortized cost pledged as collateral, refer to Note 40.
11. CREDIT RISK MANAGEMENT OF INVESTMENTS IN DEBT INSTRUMENTS
The investments in debt instruments are classified as financial assets at FVTOCI and financial assets at amortized cost.
September 30, 2019
At FVTOCI At Amortized Cost Total Total carrying amount $ 443,911,256 $ 110,457,877 $ 554,369,133 Allowance loss (96,024) (1,452) (97,476) Amortized cost 443,815,232 $ 110,456,425 554,271,657 Fair value adjustment 2,333,037 2,333,037 $ 446,148,269 $ 556,604,694
December 31, 2018
At FVTOCI At Amortized Cost Total Total carrying amount $ 418,496,103 $ 106,072,961 $ 524,569,064 Allowance loss (100,729) (1,767) (102,496) Amortized cost 418,395,374 $ 106,071,194 524,466,568 Fair value adjustment (1,632,684) (1,632,684) $ 416,762,690 $ 522,833,884
September 30, 2018
At FVTOCI At Amortized Cost Total Total carrying amount $ 381,710,900 $ 95,870,241 $ 477,581,141 Allowance loss (94,710) (1,669) (96,379) Amortized cost 381,616,190 $ 95,868,572 477,484,762 Fair value adjustment (840,502) (840,502) $ 380,775,688 $ 476,644,260
The Group implements a policy of only investing in debt instruments with investment grade and have low credit risk for the purpose of impairment assessment. The Group continues to track external rating information and monitor changes in credit risk of the investments of debt instruments and to review

20
other information such as the bond yield curve and the debtor’s material information to assess whether the credit risk of investments in debt instrument has increased significantly since the initial recognition. The Bank considers the historical default loss rate provided by the independent rating agencies, the debtor’s current financial status and the industry’s forward-looking forecast to measure the 12-month expected credit loss or full-lifetime expected credit loss of the investments in debt instruments. The Bank’s current credit risk rating mechanism and the total carrying amount of each credit rating investment in debt instruments are as follows: September 30, 2019
Credit Rating
Definitions
Expected Credit Loss
Recognition Base
Expected Credit Loss Rate
September 30, 2019
Total Carrying Amount
Normal The debtor has a low credit risk and is fully capable of paying off contractual cash flows
12-month expected credit loss
0.000%~0.880% $ 554,206,057
Abnormal Overdue for more than 30 days or credit risk has increased significantly since the initial recognition
Expected credit loss during the period of existence (no credit impairment)
1.633%~8.522% 163,076
December 31, 2018
Credit Rating
Definitions
Expected Credit Loss
Recognition Base
Expected Credit
Loss Rate
December 31, 2018 Total Carrying
Amount Normal The debtor has a low credit risk and
is fully capable of paying off contractual cash flows
12-month expected credit loss
0.000%~1.096% $ 524,448,188
Abnormal Overdue for more than 30 days or credit risk has increased significantly since the initial recognition
Expected credit loss during the period of existence (no credit impairment)
2.859%~9.960% 120,876
September 30, 2018
Credit Rating
Definitions
Expected Credit Loss
Recognition Base
Expected Credit Loss Rate
September 30, 2018
Total Carrying Amount
Normal The debtor has a low credit risk and is fully capable of paying off contractual cash flows
12-month expected credit loss
0.000%~0.470 % $ 477,581,141

21
The information of changes in allowance for loss under the normal credit rating (12-month expected credit loss) assessment of investments in debt instruments at FVTOCI and at amortized cost is summarized as follows:
At FVTOCI At Amortized Cost Total
Balance at January 1, 2019 $ 100,729 $ 1,767 $ 102,496 Purchase of new debt instruments 40,341 188 40,529 Derecognition (36,642) (486) (37,128) )Model/risk parameter changes (8,761) (16) (8,777) )Exchange rate and other changes 357 (1) 356 Balance at September 30, 2019 $ 96,024 $ 1,452 $ 97,476 Balance on January 1, 2018 (IAS 39) $ - $ - $ - Retrospective application of the impact of IFRS 9 72,536 1,406 73,942 Balance at January 1, 2018 (IFRS 9) 72,536 1,406 73,942 Purchase of new debt instruments 39,600 439 40,039 Derecognition (20,793) (117) (20,910) )Model/risk parameter changes 3,096 12 3,108 Exchange rate and other changes 271 (71) 200 Balance at September 30, 2018 $ 94,710 $ 1,669 $ 96,379
12. SECURITIES PURCHASED UNDER RESALE AGREEMENTS Securities purchased under resale agreements as of September 30, 2019, December 31, 2018 and September 30, 2018 were $1,337,883 thousand, $438,017 thousand and $144,875 thousand, respectively. The aforementioned securities will be bought back one after another before November 20, 2019, January 14, 2019 and October 19, 2020 at $1,340,353 thousand, $439,091 thousand and $144,951 thousand, respectively.
13. RECEIVABLES, NET
September 30, 2019 December 31, 2018 September 30, 2018 Accrued interest $ 5,576,661 $ 5,931,285 $ 5,233,679 Acceptances 3,477,478 4,001,533 4,185,740 Credit cards receivable 3,186,284 2,894,491 2,884,268 Accounts receivable due from sales of securities 2,038,064 1,000,414 3,781,599 Accounts receivable - factoring 992,213 811,314 919,664 Others 3,206,114 2,838,463 4,381,360 18,476,814 17,477,500 21,386,310 Less allowance for credit losses (461,363) (483,762) (490,326) $ 18,015,451 $ 16,993,738 $ 20,895,984

22
The changes in total carrying amount and the allowance of receivables and other financial assets for the nine months ended September 30, 2019 and 2018 (including collections not included in loans and purchase of remittance, refer to Note 17) are as follows:
For the Nine Months Ended September 30, 2019
12-Month ECLs Lifetime
ECLs (Collectively)
Lifetime ECLs (Individually)
Lifetime ECLs
(Non-Purchase or Original Credit Impairment on
Financial Assets)
Total
Receivables and other financial assets Beginning on January 1, 2019 $ 16,228,239 $ 246,377 $ 355,156 $ 651,093 $ 17,480,865 Changes due to financial assets recognized at
the beginning of the period: Transfer to lifetime ECLs (92,381) 21,857 59,000 (510) (12,034) Transfer to ECLs on financial assets (16,829) (7,588) (4,343) 42,965 14,205 Transfer to 12-month ECLs 67,270 (214,544) (59,209) (23,074) (229,557) Financial assets derecognized in the
current period (3,970,172) (86,920) (224,082) (4,613) (4,285,787) Purchased or original financial assets 4,650,757 17,530 121,741 6,225 4,796,253 Write-offs (148) (2,585) - (54,216) (56,949) Exchange rate and other changes 678,164 93,669 2,701 590 775,124 Balance on September 30, 2019 $ 17,544,900 $ 67,796 $ 250,964 $ 618,460 $ 18,482,120
12-Month Expected
Credit Loss
Lifetime ECLs (Collectively)
Lifetime ECLs (Individually)
Lifetime ECLs (Non-Purchase
or Original Credit
Impairment on Financial
Assets)
Impairment Under the
Guidelines of IFRS 9
The Difference of Impairment Under the
Decree Regulation
Total
Allowance January 1, 2019 $ 63,747 $ 47,499 $ 6,018 $ 338,807 $ 456,071 $ 30,863 $ 486,934 Changes due to financial assets recognized at
the beginning of the period: Transfer to lifetime ECLs (935) 10,034 2,179 (385) 10,893 - 10,893 Transfer to ECLs on financial assets (285) (2,122) (399) 32,263 29,457 - 29,457 Transfer to 12-month ECLs 2,562 (27,162) (2,053) (22,457) (49,110) - (49,110) Financial assets derecognized in the
current period (8,897) (9,977) (225) (1,683) (20,782) - (20,782) Purchased or original financial assets 10,581 10,354 241 1,744 22,920 - 22,920 The difference of impairment under the decree
regulation - - - - - 3,284 3,284 Write-offs (148) (2,585) - (54,216) (56,949) - (56,949) Recoveries after write-off - - - 24,156 24,156 - 24,156 Exchange rate and other changes 12,257 85 14 3,007 15,363 - 15,363 Balance on September 30, 2019 $ 78,882 $ 26,126 $ 5,775 $ 321,236 $ 432,019 $ 34,147 $ 466,166
For the Nine Months Ended September, 2018
12-Month ECLs Lifetime
ECLs (Collectively)
Lifetime ECLs (Individually)
Lifetime ECLs
(Non-Purchase or Original Credit Impairment on
Financial Assets)
Total
Receivables and other financial assets Beginning on January 1, 2018 $ 15,794,845 $ 415,848 $ 431,783 $ 546,774 $ 17,189,250 Changes due to financial assets recognized at
the beginning of the period: Transfer to lifetime ECLs (76,269) 32,119 30,307 (348) (14,191) Transfer to ECLs on financial assets (14,454) (10,879) (5,237) 57,063 26,493 Transfer to 12-month ECLs 965,819 (343,725) (69,569) (4,370) 548,155 Financial assets derecognized in the
current period (2,519,827) (107,864) (253,614) (8,493) (2,889,798) Purchased or original financial assets 3,047,202 23,785 13,662 66,565 3,151,214 Write-offs (2,853) (6,324) - (59,078) (68,255) Exchange rate and other changes 3,347,944 26,942 25,142 48,834 3,448,862 Balance on September 30, 2018 $ 20,542,407 $ 29,902 $ 172,474 $ 646,947 $ 21,391,730

23
12-Month Expected
Credit Loss
Lifetime ECLs (Collectively)
Lifetime ECLs (Individually)
Lifetime ECLs (Non-Purchase
or Original Credit
Impairment on Financial
Assets)
Impairment Under the
Guidelines of IFRS 9
The Difference of Impairment Under the
Decree Regulation
Total
Allowance January 1, 2018 $ 60,993 $ 46,673 $ 8,152 $ 363,619 $ 479,437 $ 24,479 $ 503,916 Changes due to financial assets recognized at
the beginning of the period: Transfer to lifetime ECLs (864) 11,205 1,649 (2,120) 9,870 - 9,870 Transfer to ECLs on financial assets (247) (753) (410) 35,069 33,659 - 33,659 Transfer to 12-month ECLs 6,681 (20,819) (3,504) (1,092) (18,734) - (18,734) Financial assets derecognized in the
current period (11,891) (5,110) (313) (7,827) (25,141) - (25,141) Purchased or original financial assets 5,674 5,824 272 5,058 16,828 - 16,828 The difference of impairment under the decree
regulation - - - - - 7,650 7,650 Write-offs (2,853) (6,324) - (59,078) (68,255) - (68,255) Recoveries after write-off - - - 24,146 24,146 - 24,146 Exchange rate and other changes 4,849 2,429 403 3,266 10,947 - 10,947 Balance on September 30, 2018 $ 62,342 $ 33,125 $ 6,249 $ 361,041 $ 462,757 $ 32,129 $ 494,886
14. DISCOUNTS AND LOANS, NET
September 30, 2019 December 31, 2018 September 30, 2018 Loans $ 1,110,978,275 $ 1,014,096,799 $ 991,520,171 Inward/outward documentary bills 19,829,992 22,782,139 21,107,869 Non-performing loans 3,141,046 3,384,938 3,225,604 1,133,949,313 1,040,263,876 1,015,853,644 Discount and premium adjustments 391,945 559,913 719,674 Allowance for credit losses (11,563,052) (11,020,604) (10,975,194) $ 1,122,778,206 $ 1,029,803,185 $ 1,005,598,124
The Bank discontinues accruing interest when loans are deemed non-performing. For the nine months ended September 30, 2019 and 2018, the unrecognized interest revenue on the non-performing loans amounted to $29,075 thousand and $34,481 thousand, respectively. For the nine months ended September 30, 2019 and 2018, the Group only had written off certain credits after completing the required legal procedures.
The changes in carrying amount and allowance for discounts and loans for the nine months ended September 30, 2019 and 2018 are as follows: For the Nine Months Ended September, 2019
12-Month ECLs Lifetime ECLs (Collectively)
Lifetime ECLs (Individually)
Lifetime ECLs (Non-Purchase or Original Credit Impairment on
Financial Assets)
Lifetime ECLs (Purchase or
Original Credit Impairment on
Financial Assets)
Total
Discounts and loans Beginning on January 1, 2019 $ 1,011,099,721 $ 10,788,122 $ 13,707,860 $ 4,563,914 $ 104,259 $ 1,040,263,876 Changes due to financial assets recognized at the
beginning of the period: Transfer to lifetime ECLs (12,177,569) 3,296,251 8,826,280 (12,059) - (67,097) Transfer to ECLs on financial assets (802,407) (744,222) (79,832) 1,772,877 - 146,416 Transfer to 12-month ECLs 11,016,719 (3,993,714) (4,146,158) (458,241) - 2,418,606 Financial assets derecognized in the current
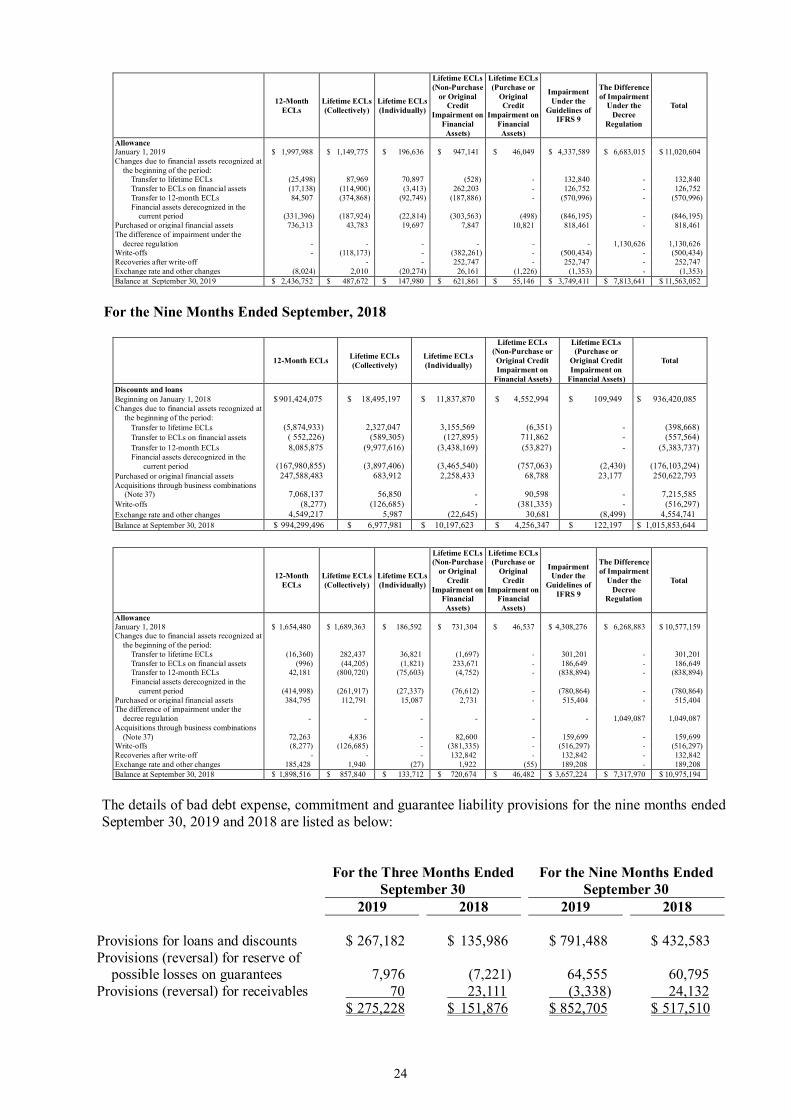
period (201,369,750) (2,556,057) (5,046,385) (1,375,587) (39,857) (210,387,636) Purchased or original financial assets 291,332,416 612,123 3,606,365 103,118 64,636 295,718,658 Write-offs - (118,173) - (382,261) - (500,434) Exchange rate and other changes 6,190,435 16,933 82,024 66,629 903 6,356,924 Balance at September 30, 2019 $ 1,105,289,565 $ 7,301,263 $ 16,950,154 $ 4,278,390 $ 129,941 $ 1,133,949,313
24
12-Month ECLs
Lifetime ECLs (Collectively)
Lifetime ECLs (Individually)
Lifetime ECLs (Non-Purchase
or Original Credit
Impairment on Financial Assets)
Lifetime ECLs (Purchase or
Original Credit
Impairment on Financial Assets)
Impairment Under the
Guidelines of IFRS 9
The Difference of Impairment
Under the Decree
Regulation
Total
Allowance January 1, 2019 $ 1,997,988 $ 1,149,775 $ 196,636 $ 947,141 $ 46,049 $ 4,337,589 $ 6,683,015 $ 11,020,604 Changes due to financial assets recognized at
the beginning of the period: Transfer to lifetime ECLs (25,498) 87,969 70,897 (528) - 132,840 - 132,840 Transfer to ECLs on financial assets (17,138) (114,900) (3,413) 262,203 - 126,752 - 126,752 Transfer to 12-month ECLs 84,507 (374,868) (92,749) (187,886) - (570,996) - (570,996) Financial assets derecognized in the
current period (331,396) (187,924) (22,814) (303,563) (498) (846,195) - (846,195) Purchased or original financial assets 736,313 43,783 19,697 7,847 10,821 818,461 - 818,461 The difference of impairment under the
decree regulation - - - - - - 1,130,626 1,130,626 Write-offs - (118,173) - (382,261) - (500,434) - (500,434) Recoveries after write-off - - 252,747 - 252,747 - 252,747 Exchange rate and other changes (8,024) 2,010 (20,274) 26,161 (1,226) (1,353) - (1,353) Balance at September 30, 2019 $ 2,436,752 $ 487,672 $ 147,980 $ 621,861 $ 55,146 $ 3,749,411 $ 7,813,641 $ 11,563,052
For the Nine Months Ended September, 2018
12-Month ECLs Lifetime ECLs (Collectively)
Lifetime ECLs (Individually)
Lifetime ECLs (Non-Purchase or Original Credit Impairment on
Financial Assets)
Lifetime ECLs (Purchase or
Original Credit Impairment on
Financial Assets)
Total
Discounts and loans Beginning on January 1, 2018 $ 901,424,075 $ 18,495,197 $ 11,837,870 $ 4,552,994 $ 109,949 $ 936,420,085 Changes due to financial assets recognized at
the beginning of the period: Transfer to lifetime ECLs (5,874,933) 2,327,047 3,155,569 (6,351) - (398,668) Transfer to ECLs on financial assets ( 552,226) (589,305) (127,895) 711,862 - (557,564) Transfer to 12-month ECLs 8,085,875 (9,977,616) (3,438,169) (53,827) - (5,383,737) Financial assets derecognized in the
current period (167,980,855) (3,897,406) (3,465,540) (757,063) (2,430) (176,103,294) Purchased or original financial assets 247,588,483 683,912 2,258,433 68,788 23,177 250,622,793 Acquisitions through business combinations
(Note 37) 7,068,137 56,850 - 90,598 - 7,215,585 Write-offs (8,277) (126,685) - (381,335) - (516,297) Exchange rate and other changes 4,549,217 5,987 (22,645) 30,681 (8,499) 4,554,741 Balance at September 30, 2018 $ 994,299,496 $ 6,977,981 $ 10,197,623 $ 4,256,347 $ 122,197 $ 1,015,853,644
12-Month ECLs
Lifetime ECLs (Collectively)
Lifetime ECLs (Individually)
Lifetime ECLs (Non-Purchase
or Original Credit
Impairment on Financial Assets)
Lifetime ECLs (Purchase or
Original Credit
Impairment on Financial Assets)
Impairment Under the
Guidelines of IFRS 9
The Difference of Impairment
Under the Decree
Regulation
Total
Allowance January 1, 2018 $ 1,654,480 $ 1,689,363 $ 186,592 $ 731,304 $ 46,537 $ 4,308,276 $ 6,268,883 $ 10,577,159 Changes due to financial assets recognized at
the beginning of the period: Transfer to lifetime ECLs (16,360) 282,437 36,821 (1,697) - 301,201 - 301,201 Transfer to ECLs on financial assets (996) (44,205) (1,821) 233,671 - 186,649 - 186,649 Transfer to 12-month ECLs 42,181 (800,720) (75,603) (4,752) - (838,894) - (838,894) Financial assets derecognized in the
current period (414,998) (261,917) (27,337) (76,612) - (780,864) - (780,864) Purchased or original financial assets 384,795 112,791 15,087 2,731 - 515,404 - 515,404 The difference of impairment under the
decree regulation - - - - - - 1,049,087 1,049,087 Acquisitions through business combinations
(Note 37) 72,263 4,836 - 82,600 - 159,699 - 159,699 Write-offs (8,277) (126,685) - (381,335) - (516,297) - (516,297) Recoveries after write-off - - - 132,842 - 132,842 - 132,842 Exchange rate and other changes 185,428 1,940 (27) 1,922 (55) 189,208 - 189,208 Balance at September 30, 2018 $ 1,898,516 $ 857,840 $ 133,712 $ 720,674 $ 46,482 $ 3,657,224 $ 7,317,970 $ 10,975,194
The details of bad debt expense, commitment and guarantee liability provisions for the nine months ended September 30, 2019 and 2018 are listed as below:
For the Three Months Ended
September 30 For the Nine Months Ended
September 30 2019 2018 2019 2018 Provisions for loans and discounts $ 267,182 $ 135,986 $ 791,488 $ 432,583 Provisions (reversal) for reserve of
possible losses on guarantees 7,976 (7,221) 64,555 60,795 Provisions (reversal) for receivables 70 23,111 (3,338) 24,132 $ 275,228 $ 151,876 $ 852,705 $ 517,510

25
15. SUBSIDIARIES 15.1 Subsidiaries included in the consolidated financial statements
The consolidated financial statements include the Bank and entities controlled by the Bank (i.e. subsidiaries).
Proportion of Ownership (%)
Investor Investee Nature of Activities September
30, 2019 December 31, 2018
September 30, 2018
Remark
Domestic subsidiaries The Bank China Travel Service (Taiwan) Travel agency 99.99 99.99 99.99 1. The Bank SCSB Marketing Ltd. Human resource services 100.00 100.00 100.00 1.
The Bank SCSB Asset Management Ltd.
Purchase, evaluation, auction and management of creditor’s right of financial institutions
100.00 100.00 100.00
1.
China Travel Service (Taiwan) CTS Travel International Ltd. Travel agency 100.00 100.00 100.00 1. Foreign subsidiaries The Bank Shancom Reconstruction Inc. Investment holding 100.00 100.00 100.00 The Bank Wresqueue Limitada Investment holding 100.00 100.00 100.00 1. The Bank Paofoong Insurance Company Ltd. Insurance 40.00 40.00 40.00 1. The Bank AMK Microfinance Institution Plc. Microfinance 84.89 80.01 80.01 1. SCSB Asset Management Ltd. SCSB Leasing (China) Co., Ltd. Leasing operation 100.00 100.00 100.00 1. Wresqueue Limitada Prosperity Realty Inc. Real estate service 100.00 100.00 100.00 Shancom Reconstruction Inc. Empresa Inversiones Generales, S.A. Investment holding 100.00 100.00 100.00 Shancom Reconstruction Inc. Krinein Company Investment holding 100.00 100.00 100.00 Shancom Reconstruction Inc. Safehaven Investment Corporation Investment holding 100.00 100.00 100.00 Empresa Inversiones Generales, S.A. Shanghai Commercial Bank (HK) Banking 48.00 48.00 48.00 2. Krinein Company Shanghai Commercial Bank (HK) Banking 9.60 9.60 9.60 2.
Shanghai Commercial Bank (HK) Shanghai Commercial Bank (Nominees) Ltd. Nominee services 100.00 100.00 100.00 1.
Shanghai Commercial Bank (HK) Shanghai Commercial Bank Trustee Ltd. Trustee services 60.00 60.00 60.00 1.
Shanghai Commercial Bank (HK) Shacom Futures Ltd. Commodities trading 100.00 100.00 100.00 1.
Shanghai Commercial Bank (HK) Shacom Investment Ltd. Investment in exchange fund bills and notes 100.00 100.00 100.00 1.
Shanghai Commercial Bank (HK) Shacom Property Holdings (BVI) Limited Property holding 100.00 100.00 100.00 1.
Shanghai Commercial Bank (HK) Shacom Property (NY) Inc. Property holding 100.00 100.00 100.00 1. Shanghai Commercial Bank (HK) Shacom Property (CA) Inc. Property holding 100.00 100.00 100.00 1. Shanghai Commercial Bank (HK) Shacom Assets Investment Ltd. Investment in bonds 100.00 100.00 100.00 1.
Shanghai Commercial Bank (HK) Infinite Financial Solutions Limited I.T. application services provider 100.00 100.00 100.00 1.
Shanghai Commercial Bank (HK) Shacom Insurance Brokers Ltd. Insurance broker 100.00 100.00 100.00 1. Shanghai Commercial Bank (HK) Shacom Securities Ltd. Securities brokerage services 100.00 100.00 100.00 1.
Shanghai Commercial Bank (HK) Hai Kwang Property Management Co., Ltd. Property management 100.00 100.00 100.00 1.
Shanghai Commercial Bank (HK) Paofoong Insurance Company Ltd. Insurance 60.00 60.00 60.00 1. Shanghai Commercial Bank (HK) Right Honour Investments Limited Property holding 100.00 100.00 100.00 1. Shanghai Commercial Bank (HK) KCC 23F Limited Property holding 100.00 100.00 100.00 1. Shanghai Commercial Bank (HK) KCC 25F Limited Property holding 100.00 100.00 100.00 1. Shanghai Commercial Bank (HK) KCC 26F Limited Property holding 100.00 100.00 100.00 1.
Right Honour Investments Limited Glory Step Westpoint Investment Limited Property holding 100.00 100.00 100.00 1.
Right Honour Investments Limited Silver Wisdom Westpoint Investment Limited Property holding 100.00 100.00 100.00 1.
Remark 1: The entity is an immaterial subsidiary; its financial statements have not been reviewed. Remark 2: This entity is a subsidiary with material non-controlling interests. On September 18, 2017, the board made a resolution to purchase 80.01% of the shares of AMK Microfinance (AMK). The resolution was approved by the FSC and MOEAIC of Taiwan in November 2017 and January 2018, respectively. It was approved by the Cambodian authorities on July 9, 2018. The Group acquired 80.01% equity of AMK for US$80,103 thousand (equivalent to NT$2,457,470 thousand) on August 28, 2018, refer to Note 37. In addition, on November 10, 2018, the Bank’s board approved to purchase additional 1,560 thousand shares of AMK. The additional investment was US$15,300 thousand, and the number of shares obtained through capital increase was 1,554 thousand shares. The case was approved by the FSC and Cambodian authorities on January 19, 2019 and July 16, 2019, respectively. The shareholding ratio increased from 80.01% to 84.89% on July 29, 2019. Refer to Note 38.

26
15.2 Details of subsidiaries that have material non-controlling interests (“NCI”)
Principal Place of Proportion of Ownership and Voting Rights Held by Non-controlling Interests Name of Subsidiary Business September 30, 2019 December 31, 2018 September 30, 2018
Shanghai Commercial Bank (H.K.) Hong Kong 42.4% 42.4% 42.4%
Profit Allocated to Non-controlling Interests For the Three Months Ended For the Nine Months Ended Accumulated Non-controlling September 30 September 30 September 30, December 31, September 30,
Name of Subsidiary 2019 2018 2019 2018 2019 2018 2018 Shanghai Commercial Bank (H.K.) (excluding NCI in its subsidiaries) $ 1,343,427 $ 1,195,141 $ 3,946,789 $ 3,393,453 $ 49,863,694 $ 46,198,858 $ 45,119,683
Summarized financial information in respect of the Group’s subsidiary that has material non-controlling interests is set out below. The summarized financial information below represents amounts before intragroup eliminations. Shanghai Commercial Bank (H.K.) and its subsidiaries
September 30, 2019 December 31, 2018 September 30, 2018 Assets $ 852,359,094 $ 776,338,670 $ 753,584,511 Liabilities (734,418,414) (666,920,867) (646,860,600) Non-controlling interests of Shanghai
Commercial Bank (H.K.)
(337,629)
(317,413) (309,564) Equity $ 117,603,051 $ 109,100,390 $ 106,414,347 Owners of Shanghai Commercial Bank (H.K.) Non-controlling interests of Shanghai
Commercial Bank (H.K.)
$ 67,739,357
$ 62,901,532 $ 61,294,664 Non-controlling interests of Shanghai
Commercial Bank (H.K.)
49,863,694
46,198,858 45,119,683 $ 117,603,051 $ 109,100,390 $ 106,414,347
For the Three Months Ended
September 30 For the Nine Months Ended
September 30 2019 2018 2019 2018 Revenue $ 5,558,252 $ 4,765,594 $ 16,633,544 $ 14,444,845 Net profit for the period $ 3,172,006 $ 2,828,722 $ 9,325,986 $ 8,026,984 Allocated to NCI in subsidiaries of
Shanghai Commercial Bank (H.K.) (3,545) (2,794) (17,521) (16,357)
3,168,461 2,825,928 9,308,465 8,010,627 Other comprehensive income for the
period 1,218,207 651,088 2,939,088 5,762,459
Other comprehensive income (loss) allocated to NCI in subsidiaries of Shanghai Commercial Bank (H.K.) 27 (12)
(91) 484 Total comprehensive income for the period $ 4,386,695 $ 3,477,004 $ 12,247,462 $ 13,773,570 Profit attributable to:
Owners of Shanghai Commercial Bank (H.K.) $ 1,825,034 $ 1,630,787
$ 5,361,676 $ 4,617,174
Non-controlling interests in Shanghai Commercial Bank (H.K.) 1,343,427 1,195,141
3,946,789 3,393,453
$ 3,168,461 $ 2,825,928 $ 9,308,465 $ 8,010,627 Total comprehensive income attributable
to: Owners of Shanghai Commercial Bank
(H.K.) $ 2,526,736 $ 2,005,807 $ 7,054,538 $ 7,936,629
Non-controlling interests of Shanghai Commercial Bank (H.K.) 1,859,959 1,471,197
5,192,924 5,836,941
$ 4,386,695 $ 3,477,004 $ 12,247,462 $ 13,773,570

27
For the Nine Months Ended September 30 2019 2018 Net cash inflow (outflow) from:
Operating activities $ 9,779,888 $ 18,527,827 Investing activities (265,920) (182,384) Financing activities 4,695,215 (3,682,368)
Net cash inflow (outflow) $ 14,209,183 $ 14,663,075
16. INVESTMENTS UNDER THE EQUITY METHOD September 30, 2019 December 31, 2018 September 30, 2018 Investments in associates $ 1,898,927 $ 1,738,636 $ 1,573,700 The Bank decreased the carrying value of Kuo Hai to zero and recognized losses on this investment because of the investee’s continuing operating losses over the years. Associates’ information of business combinations were as follows:
For the Three Months Ended
September 30 For the Nine Months Ended
September 30 2019 2018 2019 2018 Profit (loss) from continuing
operations $ (8,884) $ (808) $ 99,505 $124,823 Other comprehensive income (loss) 18,477 792 64,136 (35,190) The comprehensive income for the
period $ 9,593 $ (16) $163,641 $ 89,633 17. OTHER FINANCIALASSETS, NET
September 30, 2019 December 31, 2018 September 30, 2018 Due from other banks $ 5,658,641 $ 2,461,140 $ - Non-performing receivables 4,795 3,164 4,560 Purchase of remittance 511 201 860 5,663,947 2,464,505 5,420 Allowance for non-performing credit card
receivables (4,803) (3,172) (4,560) $ 5,659,144 $ 2,461,333 $ 860 The Bank accounts for the deposit of other financial assets with a fixed deposit of more than three months on the original maturity date. The amount of non-performing credit card receivables is made up of unsettled transactional for forward exchange contracts and credit cards receivables. The balances of credit card receivables which were reported as non-performing amounted to $4,795 thousand, $3,164 thousand and $4,560 thousand as of September 30, 2019, December 31, 2018 and September 30, 2018, respectively. The unrecognized interest revenue on the receivables amounted to $68 thousand and $72 thousand for the nine months ended September 30, 2019 and 2018, respectively.

28
18. PROPERTIES, NET
September 30, 2019 December 31, 2018 September 30, 2018 Land $ 14,627,661 $ 14,633,963 $ 14,538,853 Buildings and improvements 4,881,154 5,009,771 5,035,246 Mechanical equipment 446,145 394,351 358,388 Transportation equipment 100,749 103,616 105,243 Miscellaneous equipment 806,617 882,364 900,474 Construction-in-progress and prepayments 528,145 522,604 551,001 $ 21,390,471 $ 21,546,669 $ 21,489,205
The Group did not have any impairment losses on the properties for the nine months ended September 30, 2019 and 2018. The land which was owned by SCB (HK) disclosed above is a leasehold interest. Depreciation expense of properties held by SCSB is computed using the straight-line method over the useful lives as follows: Buildings and improvements Branches offices 43-55 years Air conditioning and machine rooms 9 years Office equipment 3-8 years Transportation equipment 5-10 years Miscellaneous equipment 5-20 years Depreciation expense of the land held by SCB (HK) is computed using the straight-line method; depreciation expense of the buildings is computed over the lease term or the straight-line method of less than 40 durable years. Other equipment is computed using the straight-line method within the durability of 4 to 10 years.
19. LEASE ARRANGEMENTS-2019 19.1 Right-of-use assets
September 30, 2019 Carrying amount of right-of-use assets Land $ 1,897 Buildings and improvements 2,349,905
Mechanical equipment 31,101 Office equipment 41,159 Transportation equipment 29,779
$ 2,453,841
For the Three Months
Ended September 30, 2019 For the Nine Months
Ended September 30, 2019 Increase in right-of-use assets $ 953,647 Depreciation expenses of right-of-use assets Land $ 76 $ 330 Buildings and improvements 184,830 544,932
Mechanical equipment 4,758 17,376 Office equipment 6,675 19,819 Transportation equipment 3,023 8,065
$ 199,362 $ 590,522
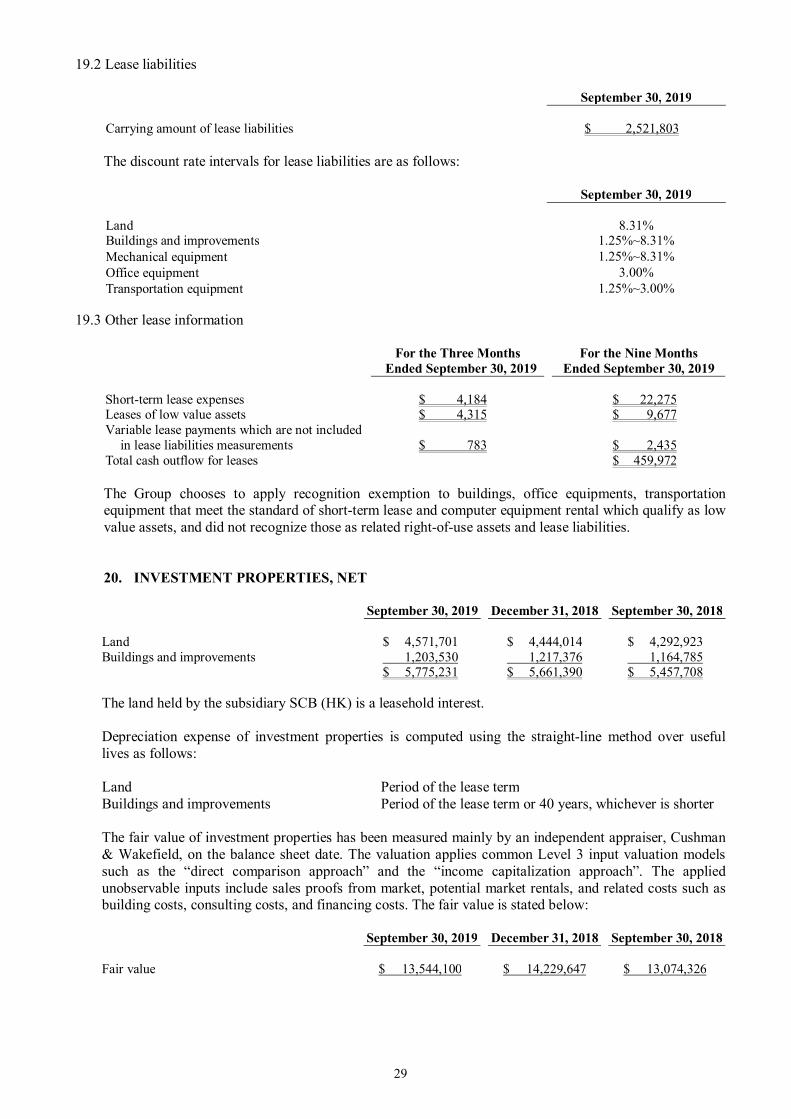
29
19.2 Lease liabilities
September 30, 2019 Carrying amount of lease liabilities $ 2,521,803
The discount rate intervals for lease liabilities are as follows:
September 30, 2019 Land 8.31% Buildings and improvements 1.25%~8.31% Mechanical equipment 1.25%~8.31% Office equipment 3.00% Transportation equipment 1.25%~3.00%
19.3 Other lease information
For the Three Months
Ended September 30, 2019 For the Nine Months
Ended September 30, 2019 Short-term lease expenses $ 4,184 $ 22,275 Leases of low value assets $ 4,315 $ 9,677 Variable lease payments which are not included
in lease liabilities measurements
$ 783
$ 2,435 Total cash outflow for leases $ 459,972 The Group chooses to apply recognition exemption to buildings, office equipments, transportation equipment that meet the standard of short-term lease and computer equipment rental which qualify as low value assets, and did not recognize those as related right-of-use assets and lease liabilities. 20. INVESTMENT PROPERTIES, NET
September 30, 2019 December 31, 2018 September 30, 2018 Land $ 4,571,701 $ 4,444,014 $ 4,292,923 Buildings and improvements 1,203,530 1,217,376 1,164,785 $ 5,775,231 $ 5,661,390 $ 5,457,708
The land held by the subsidiary SCB (HK) is a leasehold interest. Depreciation expense of investment properties is computed using the straight-line method over useful lives as follows: Land Period of the lease term Buildings and improvements Period of the lease term or 40 years, whichever is shorter The fair value of investment properties has been measured mainly by an independent appraiser, Cushman & Wakefield, on the balance sheet date. The valuation applies common Level 3 input valuation models such as the “direct comparison approach” and the “income capitalization approach”. The applied unobservable inputs include sales proofs from market, potential market rentals, and related costs such as building costs, consulting costs, and financing costs. The fair value is stated below: September 30, 2019 December 31, 2018 September 30, 2018 Fair value $ 13,544,100 $ 14,229,647 $ 13,074,326

30
The rental income from investment properties is stated below:
For the Three Months Ended
September 30 For the Nine Months Ended
September 30 2019 2018 2019 2018 Rental income from investment
properties $ 92,744 $ 79,247 $ 256,726 $ 223,589
21. INTANGIBLE ASSETS, NET
September 30, 2019 December 31, 2018 September 30, 2018
Operating license $ 1,522,104 $ 1,521,666 $ 1,514,404 Computer software 249,262 223,005 214,624 Goodwill 93,528 92,660 91,942 $ 1,864,894 $ 1,837,331 $ 1,820,970
Depreciation expense of intangible assets is computed using the straight-line method over the useful lives as follows:
Bank license 84 years Computer software 3-5 years
The Bank acquired goodwill mainly from the control premium generated by the acquisition of Cambodian AMK on August 28, 2018. In addition, the consideration paid by the merger included the expected synergies, revenue growth, future market development and other values. The Bank underwent the impairment assessment of the recoverable amount of goodwill, and the calculation of the recoverable amount was based on the value in use. The calculation of the value in use was based on the cash flow of AMK's future financial projections and was calculated using the annual discount rate to reflect the specific risks of AMK. The assessment results did not incur any impairment. The Bank does not need to recognize impairment loss on goodwill for the nine months ended September 30, 2019 and the period from August 28, 2018 to September 30, 2018.
22. OTHER ASSETS, NET
September 30, 2019 December 31, 2018 September 30, 2018 Prepaid expenses $ 1,906,835 $ 1,927,630 $ 1,559,247 Refundable deposits 933,236 847,676 986,902 Deferred charges 220,725 189,783 198,270 Temporary payments and suspension 208,643 160,655 229,207 Others 283,712 163,118 339,944 $ 3,553,151 $ 3,288,862 $ 3,313,570
23. DUE TO THE CENTRAL BANK AND BANKS
September 30, 2019 December 31, 2018 September 30, 2018
Call loans from banks $ 71,407,509 $ 46,641,154 $ 48,715,160 Due to banks 7,697,158 8,531,281 3,742,101 Deposit transferred from Chunghwa Post
Co., Ltd. 1,839,203 2,325,302 2,417,820 Overdraft on banks 2,046,696 1,843,453 2,547,862 Call loans from the Central Bank - 922,140 - $ 82,990,566 $ 60,263,330 $ 57,422,943

31
24. SECURITIES SOLD UNDER REPURCHASE AGREEMENTS Securities sold under repurchase agreements as of September 30, 2019, December 31,2018 and September 30, 2018 were $12,808,245 thousand, $14,629,530 thousand and $25,306,706 thousand, respectively. The aforementioned securities will be sold back by September 15, 2020, September 19, 2019 and September 19, 2019 at $12,814,422 thousand, $14,636,445 thousand and $25,317,576 thousand, respectively.
25. PAYABLES
September 30, 2019 December 31, 2018 September 30, 2018
Dividends payable $ 13,280,046 $ 12,162,073 $ 12,162,073 Accounts payable 7,271,623 8,176,835 9,598,135 Interest payable 5,042,656 3,622,202 3,564,151 Liabilities on bank acceptances 3,551,312 4,052,269 4,280,103 Expenses payable 1,760,102 1,624,223 1,484,796 Others 512,161 475,973 462,907 $ 31,417,900 $ 30,113,575 $ 31,552,165
26. DEPOSITS AND REMITTANCES
September 30, 2019 December 31, 2018 September 30, 2018
Time deposits $ 802,908,299 $ 748,953,809 $ 714,481,139 Savings deposits 464,976,449 451,965,944 452,738,953 Demand deposits 298,591,670 286,238,664 287,392,672 Checking deposits 10,042,096 11,063,284 9,998,122 Negotiable certificates of deposit 31,330,500 21,550,500 21,307,800 Remittances 2,361,181 853,414 573,990 $ 1,610,210,195 $ 1,520,625,615 $ 1,486,492,676
27. BANK DEBENTURES
27.1 The Bank September 30, 2019 December 31, 2018 September 30, 2018 The subordinate bank debenture - 7 years
maturity; first issued in 2012; maturity date is on April 2019 $ - $ 4,000,000 $ 4,000,000
The subordinate bank debenture - 7 years maturity; second issued in 2012; maturity date is on May 2019 - 1,000,000 1,000,000
The subordinate bank debenture - 7-10 years maturity, third issued in 2012; maturity date is from November 2019 to November 2022. 5,000,000 5,000,000 5,000,000
The subordinate bank debenture - 7-10 years maturity, fourth issued in 2012; maturity date is from December 2019 to December 2022. 10,000,000 10,000,000 10,000,000
The subordinate bank debenture - 7-10 years maturity, first issued in 2014; maturity date is from March 2021 to March 2024 6,700,000 6,700,000 6,700,000
The subordinate bank debenture - 7 years maturity, second issued in 2014; maturity date is on November 2021 3,300,000 3,300,000 3,300,000
The subordinate bank debenture - 7 years maturity; first issued in 2015; maturity date is on June 2022 2,150,000 2,150,000 2,150,000
The subordinate bank debenture - 8.5 years 3,000,000 3,000,000 3,000,000

32
September 30, 2019 December 31, 2018 September 30, 2018 maturity; second issued in 2015; maturity date is on June 2024
The subordinate bank debenture - 7-10 years maturity; first issued in 2017; maturity date is from June 2024 to 2027 5,000,000 5,000,000 5,000,000
The subordinate bank debenture - 7-10 years maturity; second issued in 2017; maturity date is from December 2024 to 2027 5,000,000 5,000,000 5,000,000
The subordinate bank debenture - 7-10 years maturity; first issued in 2018; maturity date is from June 2025 to 2028 5,000,000 5,000,000 5,000,000
The subordinate bank; third issued in 2018; no maturity date 7,000,000 7,000,000 -
The subordinate bank debenture - 5 years maturity; first issued in 2019; maturity date is on September 2024 6,900,000 - -
The subordinate bank debenture - 3 years maturity; first issued in 2019; maturity date is on September 2022 3,100,000 - -
$ 62,150,000 $ 57,150,000 $ 50,150,000
The first issuance of the 2012 subordinated bank debenture had a fixed interest rate of 1.48% with the interest paid annually and the repayment of principal at maturity. The second issuance of the 2012 subordinated bank debenture had a fixed interest rate of 1.54% with the interest paid annually and the repayment of principal at maturity. The third issuance of the 2012 bank debenture was classified into two types, Types A and B, in accordance with the issued terms. Their terms and methods of interest accrual were as follows: Type A, seven-year of subordinate bank debenture at a fixed annual interest rate of 1.43%; Type B, ten-year of subordinate bank debenture at a fixed annual interest rate of 1.55%. The interests were paid annually with the repayment of principals at maturity. The fourth issuance of the 2012 bank debenture was classified into two types, Types A and B, in accordance with the issued terms. Their terms and methods of interest accrual were as follows: Type A, seven-year of subordinate bank debenture at a fixed annual interest rate of 1.43%; Type B, ten-year of subordinate bank debenture at a fixed annual interest rate of 1.55%. The interests were paid annually with the repayment of principals at maturity. The first issuance of the 2014 bank debenture was classified into two types, Types A and B, in accordance with the issued terms. Their terms and methods of interest accrual were as follows: Type A, seven-year of subordinate bank debenture at a fixed annual interest rate of 1.70%; Type B, ten-year of subordinate bank debenture at a fixed annual interest rate of 1.85%. The interests were paid annually with the repayment of principals at maturity. The second issuance of the 2014 subordinated bank debenture had a fixed interest rate of 1.83% with the interest paid annually and the repayment of principal at maturity. The first issuance of the 2015 subordinated bank debenture had a fixed interest rate of 1.83% with the interest paid annually and the repayment of principal at maturity. The second issuance of the 2015 subordinated bank debenture had a fixed interest rate of 1.83% with the interest paid annually and the repayment of principal at maturity. The first issuance of the 2017 bank debenture was classified into two types, Types A and B, in accordance with the issued terms. Their terms and methods of interest accrual were as follows: Type A, seven-year of subordinate bank debenture at a fixed annual interest rate of 1.50%; Type B, ten-year of subordinate bank debenture at a fixed annual interest rate of 1.85%. The interests were paid annually with the repayment of principals at maturity.

33
The second issuance of the 2017 bank debenture was classified into two types in accordance with the issued terms and the methods of interest accrual: Types A and B. Their terms and methods of interest accrual were as follows: Type A, seven-year of subordinate bank debenture at a fixed annual interest rate of 1.30%; Type B, ten-year of subordinate bank debenture at a fixed annual interest rate of 1.55%. Their interests were paid annually with repayment of principals at maturity.
The first issuance of the 2018 bank debenture was classified into two types in accordance with the issued terms and the methods of interest accrual: Types A and B. Their terms were as follows: Type A, seven-year of subordinate bank debenture at a fixed annual interest rate of 1.25%; Type B, ten-year of subordinate bank debenture at a fixed annual interest rate of 1.45%. Their interests were paid annually with repayment of principals at maturity. The third issuance of the 2018 subordinate bank debenture was at a fixed annual interest rate of 2.15% with the interest paid annually. The first issuance of the 2019 bank debenture was classified into two types in accordance with the issued terms and the methods of interest accrual: Types A and B. Their terms were as follows: Type A, three-year of subordinate bank debenture at a fixed annual interest rate of 0.65%; Type B, five-year of subordinate bank debenture at a fixed annual interest rate of 0.69%. Their interests were paid annually with repayment of principals at maturity. 27.2 SCB (HK) September 30, 2019 December 31, 2018 September 30, 2018 The subordinate bank debenture with a 10
years maturity and maturity date on November 2027 $ 7,711,895 $ 7,635,252 $ 7,573,924
The subordinate bank debenture with a 10 years maturity and maturity date on January 2029 9,252,733 - -
$ 16,964,628 $ 7,635,252 $ 7,573,924
The first issuance of the 2017 subordinated bank debenture had a fixed interest rate of 3.75% with interest to be paid semi-annually. The second issuance of the 2019 subordinated bank debenture had a fixed interest rate of 5.00% with interest to be paid semi-annually.
28. OTHER FINANCIAL LIABILITIES
September 30, 2019 December 31, 2018 September 30, 2018 Appropriated loan funds $ 1,453,852 $ 1,504,200 $ 1,564,024 Principals of structured instruments 1,288,862 2,188,907 2,334,456 Bank borrowings 724,520 252,951 201,389 Other financial liabilities 197,585 264,980 - $ 3,664,819 $ 4,211,038 $ 4,099,869
29. PROVISIONS
September 30, 2019 December 31, 2018 September 30, 2018 Reserve for employee benefits $ 1,408,977 $ 1,295,274 $ 1,202,239 Reserve for guarantees liabilities 719,691 650,001 597,902 Reserve for other operations 382,281 363,149 426,580 Reserve for financing commitment 70,533 73,229 82,142 Reserve for unexpected losses 3,564 3,564 3,564 $ 2,585,046 $ 2,385,217 $ 2,312,427

34
Changes in financing commitment and guarantee liability provisions of the Bank for the nine months ended September 30, 2018 and 2019 were as follows:
For the Nine Months Ended September 30, 2019
12-Month ECLs
Lifetime ECLs (Collectively)
Lifetime ECLs (Individually)
Lifetime ECLs (Non-Purchased
or Original Credit
Impairment on Financial
Assets)
Impairment Under the
Guidelines of IFRS 9
The difference of impairment
under the decree
regulation
Total
Commitment and guarantee liability provisions January 1, 2019 $ 150,974 $ 115,497 $ 1,028 $ - $ 267,499 $ 455,731 $ 723,230 Changes due to financial assets recognized at the
beginning of the period: Transfer to lifetime ECLs (440) 5,721 1,198 - 6,479 - 6,479 Transfer to credit impairment financial assets (5) - - 906 901 - 901 Transfer to 12-month ECLs 4,196 (45,622) (150) - (41,576) - (41,576) Financial assets derecognized in the current period (127,970) (66,286) (668) - (194,924) - (194,924)
Purchased or original financial assets 195,907 11,507 3,935 3,343 214,692 - 214,692 The difference of impairment under the decree regulation - - - - - 78,983 78,983 Exchange rate and other changes 630 54 1,755 - 2,439 - 2,439 September 30, 2019 $ 223,292 $ 20,871 $ 7,098 $ 4,249 $ 255,510 $ 534,714 $ 790,224
For the Nine Months Ended September 30, 2018
12-Month ECLs
Lifetime ECLs (Collectively)
Lifetime ECLs (Individually)
Lifetime ECLs (Non-Purchased
or Original Credit
Impairment on Financial
Assets)
Impairment Under the
Guidelines of IFRS 9
The difference of impairment
under the decree
regulation
Total
Commitment and guarantee liability provisions January 1, 2018 $ 80,286 $ 106,515 $ 1,727 $ - $ 188,528 $ 423,638 $ 612,166 Changes due to financial assets recognized at the
beginning of the period: Transfer to lifetime ECLs (43) 44,286 57 - 44,300 - 44,300 Transfer to credit impairment financial assets (4) - - 797 793 - 793 Transfer to 12-month ECLs 2,864 (1,048) (785) - 1,031 - 1,031 Financial assets derecognized in the current period (64,304) (78,684) (914) - (143,902) - (143,902)
Purchased or original financial assets 82,320 77,026 1,207 - 160,553 - 160,553 The difference of impairment under the decree regulation - - - - - (1,980) (1,980) Exchange rate and other changes 2,595 4,413 22 53 7,083 - 7,083 September 30, 2018 $ 103,714 $ 152,508 $ 1,314 $ 850 $ 258,386 $ 421,658 $ 680,044
30. OTHER LIABILITIES
September 30, 2019 December 31, 2018 September 30, 2018 Guarantee deposits received $ 2,067,795 $ 1,714,413 $ 1,909,483 Deferred revenue 831,530 673,400 1,025,604 Temporary credit 37,029 67,248 56,333 Interest received in advance 32,229 32,821 57,707 Others 903,195 524,740 819,858 $ 3,871,778 $ 3,012,622 $ 3,868,985
31. PENSION PLAN
The expenses related to the post-retirement benefit plan for the nine months ended September 30, 2019 and 2018 were recognized as employee benefit expenses in each period at the cost rate determined by the actuarial calculations as of December 31, 2018 and 2017. The breakdown of employee benefit expenses for the periods ended September 30, 2019 and 2018 were as follows:
For the Three Months Ended
September 30 For the Nine Months Ended
September 30 2019 2018 2019 2018 Defined benefit plan $ 47,416 $ 46,944 $ 140,640 $ 140,176 Employee preferential interest deposits 11,000 16,500 16,500 49,500 Other long-term employment benefits 220 205 660 615 $ 58,636 $ 63,649 $ 157,800 $ 190,291

35
32. EQUITY
32.1 Share capital
September 30, 2019 December 31, 2018 September 30, 2018 Ordinary shares Authorized shares (in thousands) 6,000,000 6,000,000 6,000,000 Authorized capital $ 60,000,000 $ 60,000,000 $ 60,000,000 Issued and fully paid shares (in thousands) 4,101,603 4,101,603 4,079,103 Issued capital $ 41,016,031 $ 41,016,031 $ 40,791,031 Capital collected in advance $ 1,643,259 $ - $ -
The issued ordinary shares have par value of $10. Each shareholder is entitled with the right to vote and to receive dividends. With the application of Initial Public Offering (IPO) on the Taiwan Stock Exchange (“TWSE”), the board of directors approved to issue 22,500 thousand of new shares with a par value of $10 in additional capital on August 18, 2018. Subsequently, TWSE approved the IPO on September 7, 2018, and October 17, 2018 was the record date for capital addition. The abovementioned new shares included public subscription, employee subscription and auction of 4,000 thousand shares, 2,500 thousand shares and 16,000 thousand shares, respectively. The public subscription and employee subscription were issued at a premium of $32.28 per share. The auction was issued at a premium to the average weighted average price of $34.31 per share. The net capital addition was $755,797 thousand after collecting the share proceeds and deducting relevant commission expense on October 17, 2018. The board of directors approved to issue 380,000 thousand of new shares in additional capital on June 14, 2019. It was issued at a premium of $36 per share and the paid-up share capital was $44,816,031 thousand after the capital increase. The cash capital increase was approved by the SEC on August 7, 2019 and was resolved by the board of directors. The base date for capital increase was on October 15, 2019. On September 30, 2019, the recognized compensation cost and the amount of payment for shares received amounted to $6,278,479 thousand, which was included in the capital collected in advance and capital reserve as the relevant statutory procedures have not been completed. The change of registration was completed on November 8, 2019.
32.2 Capital surplus
September 30, 2019 December 31, 2018 September 30, 2018 Share premium $ 7,824,375 $ 3,189,155 $ 2,647,583 Treasury shares transaction 2,026,768 2,016,234 2,016,234 Proportionate share in investee’s surplus
from donated assets under the equity-method 1,218 1,218 1,218
Dividends not yet collected 686,631 686,631 686,631 Recognition of changes in all equity of
subsidiaries 85,518 - - $ 10,624,510 $ 5,893,238 $ 5,351,666
Under the Company Act, capital surplus is only allowed to offset a deficit. However, the capital surplus from shares issued in excess of par (including additional paid-in capital from the issuance of ordinary shares, conversion of bonds and treasury share transactions) and donations may be capitalized from capital surplus into share capital, which is limited to a certain percentage of the Bank’s paid-in capital. In addition, the capital surpluses generated by the issuance of employee stock options were $2,728,290 thousand, $2,609,220 thousand and $2,601,445 thousand on September 30, 2019, December 31, 2018 and September 30, 2018, respectively, which are limited to offset losses.

36
The capital surplus from investments accounted for using the equity method and dividends yet to be collected by shareholder are limited to offset losses. Since the shares held by subsidiaries were reclassified as treasury shares, cash dividend distributed to subsidiaries was then recorded as capital surplus - treasury shares according to the shareholding ratio.
32.3 Retained earnings and dividend policy The Bank passed a resolution to amend the regulations on June 14, 2019, and authorized the board of directors to stipulate its surplus distribution or loss, which focused on special dividends and dividends distributed in cash and the report to the shareholders' meeting.
According to the Bank's revised earnings distribution policy, if there is surplus in the Bank's annual accounts, it should first complete the tax payment and then make up for the accumulated losses. According to the law, 30% of the statutory surplus reserve is required. However, when the statutory surplus reserve has reached the total paid-in capital of the Bank (not subject to the limit), it will appropriate or reverse the special surplus reserve from the balance and distribute the special dividend. The surplus balance and accumulated undistributed surplus in the previous year including the special surplus reserve will be an available surplus. The board of directors drafts a surplus allocation case and proposes for it to be recognized at the shareholders' meeting. The distribution of dividends or bonuses depends on the attendance of more than two-thirds of the board of directors and the resolution of more than half of the directors is required to distribute all or some of the dividends or bonuses in cash and the report to the shareholders' meeting. According to the Bank’s Articles of Incorporation, a legal reserve shall be appropriated at the amount equal to 30% of earnings after tax. The legal reserve shall be appropriated until it reaches the Bank’s paid-in capital, the remaining profit together with undistributed retained earnings shall be as the basis for proposing a distribution plan, which should be resolved in the shareholders’ meeting for the distribution of dividends and bonuses to shareholders. If the Bank has no deficit and the legal reserve has exceeded 25% of the Bank’s paid-in capital, the excess may be corrected into capital (share capital) or distributed in cash. However, under the Banking Law, if legal reserve is less than its paid-in capital, the Bank is allowed to distribute cash earnings only up to 15% of its capital. For the basis of the employees’ compensation and directors’ remuneration estimates, refer to employee benefits expense in Note 33 (f).
The Bank has made special reserves for the adoption of IFRS in accordance with Rule No. 1010012865 issued by the FSC on April 6, 2012 and the directive titled “Questions and Answers for Special Reserves Appropriated Following Adoption of IFRSs”.
The Bank held the board of directors and the shareholders' meeting on June 14, 2019 and June 15, 2018, respectively. The proposals and resolutions for the appropriations of earnings and dividends per share for 2018 and 2017 were as follows: Appropriation of Earnings Dividends Per Share (In NTD) 2018 2017 2018 2017 Legal reserve $ 4,113,591 $ 3,715,568 Special reserve 68,560 61,926 Cash dividends - ordinary shares 8,203,206 7,342,386 $ 2.00 $ 1.80 $ 12,385,357 $ 11,119,880 $ 2.00 $ 1.80
32.4 Special reserve
The Bank made a special reserve due to the transfer of $1,256,859 thousand of its cumulative translation adjustment reported in equity to retained earnings upon first-time IFRS adoption. There was no change in the balance of the special reserve for the nine-month period ended September 30, 2019.

37
According to Rule No. 10510001510 issued by the FSC on May 25, 2016, public banks shall appropriate a special reserve for 0.5% to 1.0% of net profit when making appropriations of earnings from 2016 to 2018 to cope with staff transformation for financial technology development. Public banks may reverse the same amount of transfers or resettle the expenses starting from 2017. The Bank made a special reserve in the amounts of $68,560 thousand and $61,926 thousand from earnings of 2018 and 2017 proposed by the Bank’s board of directors on June 14, 2019 and June 15, 2018, respectively. The Bank made a special reserve in the amount of $189,228 thousand according to the rule for the nine-month period ended September 30, 2019.
32.5 Treasury shares
On September 30, 2019, December 31, 2018 and September 30, 2018, Shancom Reconstruction Inc. and China Travel Service (Taiwan) held 11,370 thousand shares and 27 thousand shares of the Bank, respectively.
Under the Securities and Exchange Act, the Bank shall neither pledge treasury shares nor exercise shareholders’ rights on these shares, such as rights to receive dividends, to vote and to subscribe for new shares of capital increase by cash. Under the Company Act, the Bank is not allowed to buy back more than 5% of its issued shares. In addition, the total cost of treasury shares may not exceed the sum of the retained earnings and realized capital surplus. The Bank is not allowed to exercise shareholders’ rights on these shares before they are resold. The shares held by its subsidiaries are treated as treasury shares, except for participating in the Bank's cash addition and voting rights, the rest is the same as the general shareholder's rights. In addition, the treasury stocks held by the Bank shall not be pledged, nor shall they have the rights of dividend distribution and voting rights under the Securities and Exchange Act.
32.6. Non-controlling interests
For the Nine Months Ended September 30 2019 2018 Beginning balance (IAS 39) $ 46,865,979 $ 40,623,295 Retrospective application of the impact of IFRS 9 - (16,386) Retrospective application of the impact of IFRS 16 (15,229) - Beginning balance (IFRS 9 and IFRS 16) 46,850,750 40,606,909 Attribution to non-controlling interests
Acquisition of non-controlling interests in subsidiaries (Note 37) $ - $ 617,546
Changes in equity of subsidiaries (Note 38) (85,518) - Net income 3,959,617 3,397,794 Translation adjustments for foreign operations $ (80,479) $ 1,198,017 Unrealized gain on financial assets measured at FVTOCI 1,482,369 699,102 Share of other comprehensive profit and loss under the
equity method 26,301 (11,315) Income tax effect (125,885) 818,338
Cash dividends distribution (1,580,339) (1,499,242) Ending balance $ 50,446,816 $ 45,827,149

38
33. DETAILS OF COMPREHENSIVE INCOME STATEMENT ITEMS
33.1 Interest revenue, net
For the Three Months Ended
September 30 For the Nine Months Ended
September 30 2019 2018 2019 2018 Interest revenue
Discounts and loans $ 9,086,710 $ 7,409,703 $ 25,843,960 $ 20,688,263 Securities investments 2,797,600 2,279,900 8,139,963 6,281,394 Due from banks 1,124,208 1,057,977 3,458,081 3,043,852 Others 180,100 206,860 375,881 378,203
13,188,618 10,954,440 37,817,885 30,391,712 Interest expense
Deposits 4,397,395 3,186,218 12,568,049 8,488,644 Bank debentures 444,359 281,577 1,320,204 788,828 Due to banks 479,358 339,881 1,325,020 797,266 Securities sold under repurchase
agreements 11,032 25,159 51,443 84,789 Leased liability 15,681 - 52,632 - Others 57,027 39,144 233,624 97,731
5,404,852 3,871,979 15,550,972 10,257,258 Interest revenue, net $ 7,783,766 $ 7,082,461 $ 22,266,913 $ 20,134,454
33.2 Service fee income, net
For the Three Months Ended
September 30 For the Nine Months Ended
September 30 2019 2018 2019 2018 Service fee income
Trust and custody services $ 518,240 $ 213,214 $ 1,357,887 $ 1,236,735 Nominee and brokerage service
charge 199,210 188,124
630,738 742,162 Loan service fees 130,209 220,731 1,193,829 718,104 Insurance commission fees 91,530 124,454 458,901 289,213 Guarantees related fees 130,565 98,644 398,668 298,005 Credit card related fees 133,901 116,393 402,057 321,429 Exchange related fees 111,310 105,139 315,464 298,393 Inward/outward business 96,623 103,783 291,513 296,821 Others 520,045 211,882 904,264 367,191
1,931,633 1,382,364 5,953,321 4,568,053 Service charge
Credit card service charge 60,769 38,734 176,344 100,804 Nominee and brokerage service
charge 21,135 20,446
63,066 60,482 Finance service charge 14,435 16,789 46,063 46,073 Custody service charge 11,612 9,421 33,809 27,434 Others 81,795 96,189 303,648 262,062 189,746 181,579 622,930 496,855
$ 1,741,887 $ 1,200,785 $ 5,330,391 $ 4,071,198
33.3 Gain (loss) on financial assets and liabilities at FVTPL
For the Three Months Ended September 30, 2019
Realized
(Loss) Gain Unrealized (Loss) Gain Total
Financial assets mandatorily classified as at FVTPL $ 961,562 $ 11,836 $ 973,398 Held-for-trading financial liabilities (776,803) (11,074) (787,877) Financial liabilities designated as at FVTPL - (19,195) (19,195) $ 184,759 $ (18,433) $ 166,326

39
For the Three Months Ended September 30, 2018
Realized
(Loss) Gain Unrealized
(Loss) Gain Total Financial assets mandatorily classified as at FVTPL $ 1,110,264 $ (356,663) $ 753,601 Held-for-trading financial liabilities (1,126,924) 464,023 (662,901) $ (16,660) $ 107,360 $ 90,700
For the Nine Months Ended September 30, 2019
Realized
(Loss) Gain Unrealized (Loss) Gain Total
Financial assets mandatorily classified as at FVTPL $ 2,759,677 $ 287,984 $ 3,047,661 Held-for-trading financial liabilities (2,435,621) 166,417 (2,269,204) Financial liabilities designated as at FVTPL - (199,190) (199,190) $ 324,056 $ 255,211 $ 579,267 For the Nine Months Ended September 30, 2018
Realized
(Loss) Gain Unrealized
(Loss) Gain Total Financial assets mandatorily classified as at FVTPL $ 3,096,201 $ (411,650) $ 2,684,551 Held-for-trading financial liabilities (2,743,204) 46,221 (2,696,983) $ 352,997 $ (365,429) $ (12,432)
33.4 Realized gain or loss on financial assets at FVTOCI
For the Three Months Ended
September 30 For the Nine Months Ended
September 30 2019 2018 2019 2018 Disposal of debt instruments $ 123,798 $ 77,160 $ 322,492 $ 183,132 Dividend income 296,363 321,839 964,267 851,481
$ 420,161 $ 398,999 $ 1,286,759 $ 1,034,613 33.5 Employment benefits expense
For the Three Months Ended
September 30 For the Nine Months Ended
September 30 2019 2018 2019 2018 Short-term employment benefits $ 2,470,971 $ 1,865,099 $ 6,483,627 $ 5,202,693 Retirement benefits
Defined contribution plan 89,317 81,707 275,941 240,468 Defined benefit plan 47,416 46,944 140,640 140,176
Other employment benefits 100,938 96,292 275,344 280,941 $ 2,708,642 $ 2,090,042 $ 7,175,552 $ 5,864,278
The distribution of employees’ compensation and remuneration of directors is at the rates of no less than 0.1% and no more than 0.6%, respectively, of net profit before income tax, employees’ compensation and directors’ remuneration. For the nine months ended September 30, 2019 and 2018, the employees’ compensation and the remuneration of directors were as follows: For the Nine Months Ended September 30 2019 2018 Employees’ compensation $ 47,486 $ 25,495 Remuneration of directors $ 41,247 $ 41,247

40
The employees’ compensation and the remuneration of directors for 2018 and 2017 as approved in the board meetings on March 23, 2019 and March 24, 2018, respectively, were as follows: For the Years Ended December 31 2018 2017 Cash Shares Cash Shares Employees’ compensation $ 38,000 $ - $ 38,000 $ - Remuneration of directors 58,000 - 58,000 - There was no difference between the actual amounts of employees’ compensation and remuneration of directors paid and the amounts recognized in the consolidated financial statements for the years ended December 31, 2018 and 2017. Information regarding the employees’ compensation and remuneration of directors resolved by the Bank’s board in 2019 and 2018 is available at the Market Observation Post System website of the Taiwan Stock Exchange.
33.6 Depreciation and amortization
For the Three Months Ended
September 30 For the Nine Months Ended
September 30 2019 2018 2019 2018 Depreciation expense
Properties $ 152,650 $ 143,736 $ 457,934 $ 420,501 Right-of-use assets 199,362 - 590,522 - Investment properties 8,844 8,680 26,381 25,405
360,856 152,416 1,074,837 445,906 Amortization expense
Other assets 20,919 47,582 62,180 157,384 Other intangible assets 31,695 3,107 98,225 3,107
52,614 50,689 160,405 160,491 $ 413,470 $ 203,105 $ 1,235,242 $ 606,397
34. INCOME TAXES RELATING TO CONTINUING OPERATIONS
34.1 Income tax expense recognized in profit or loss
The major components of tax expenses were as follows:
For the Three Months Ended
September 30 For the Nine Months Ended
September 30 2019 2018 2019 2018 Current tax
In respect of the current year $ 977,550 $ 888,732 $ 3,301,659 $ 3,049,220 In respect of prior periods 19,299 - 30,292 (39,554 ) 996,849 888,732 3,331,951 3,009,666
Deferred tax In respect of the current year 251,830 189,988 399,270 187,662 In respect of prior periods - - (28,911) 25,510 Effect of change in tax rate - - - 246,849 251,830 189,988 370,359 460,021
Income tax expense recognized in profit or loss $ 1,248,679 $ 1,078,720 $ 3,702,310 $ 3,469,687 In 2018, The Income Tax Act in Taiwan was amended. Starting from 2018, the corporate income tax rate was adjusted from 17% to 20%. In addition, the unappropriated tax earnings had been reduced from 10% to 5%. Tax rate used by subsidiary in China is 25%, tax rate used by subsidiary in
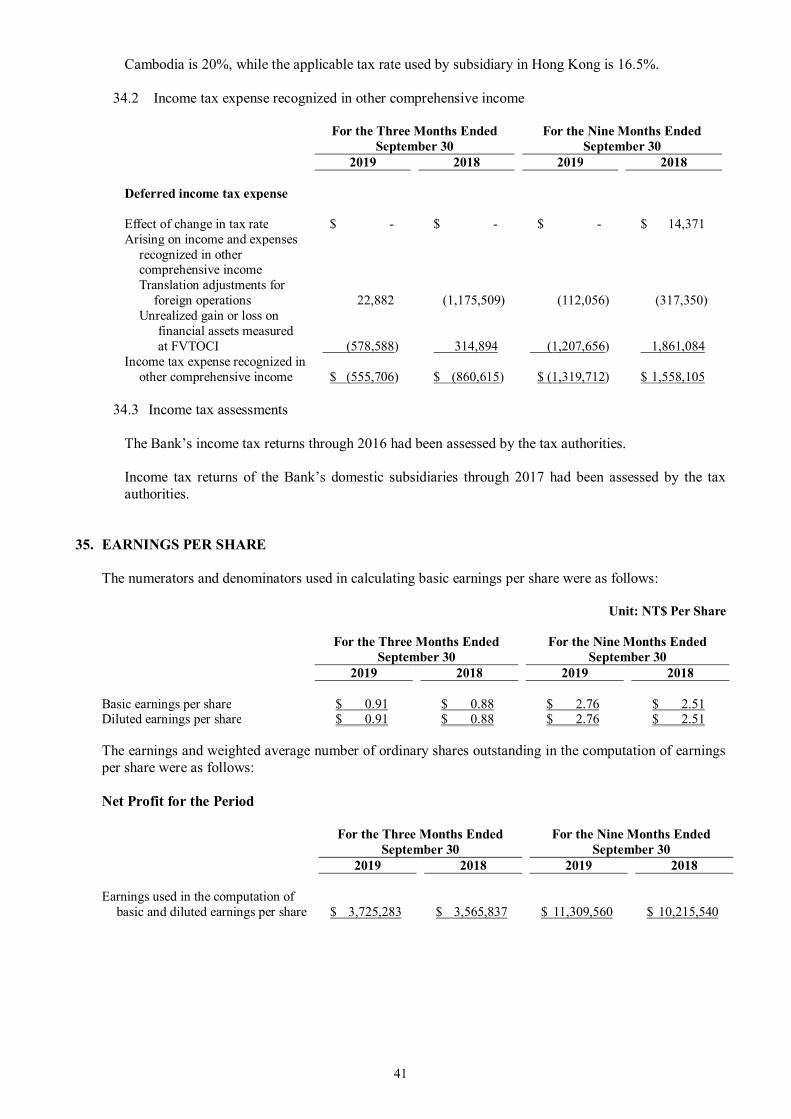
41
Cambodia is 20%, while the applicable tax rate used by subsidiary in Hong Kong is 16.5%.
34.2 Income tax expense recognized in other comprehensive income
For the Three Months Ended
September 30 For the Nine Months Ended
September 30 2019 2018 2019 2018 Deferred income tax expense Effect of change in tax rate $ - $ - $ - $ 14,371 Arising on income and expenses
recognized in other comprehensive income Translation adjustments for
foreign operations 22,882 (1,175,509) (112,056) (317,350) Unrealized gain or loss on
financial assets measured at FVTOCI (578,588) 314,894 (1,207,656) 1,861,084
Income tax expense recognized in other comprehensive income $ (555,706) $ (860,615) $ (1,319,712) $ 1,558,105
34.3 Income tax assessments
The Bank’s income tax returns through 2016 had been assessed by the tax authorities. Income tax returns of the Bank’s domestic subsidiaries through 2017 had been assessed by the tax authorities.
35. EARNINGS PER SHARE
The numerators and denominators used in calculating basic earnings per share were as follows:
Unit: NT$ Per Share
For the Three Months Ended
September 30 For the Nine Months Ended
September 30 2019 2018 2019 2018 Basic earnings per share $ 0.91 $ 0.88 $ 2.76 $ 2.51 Diluted earnings per share $ 0.91 $ 0.88 $ 2.76 $ 2.51
The earnings and weighted average number of ordinary shares outstanding in the computation of earnings per share were as follows: Net Profit for the Period
For the Three Months Ended
September 30 For the Nine Months Ended
September 30 2019 2018 2019 2018 Earnings used in the computation of
basic and diluted earnings per share $ 3,725,283 $ 3,565,837 $ 11,309,560 $ 10,215,540

42
Weighted average number of ordinary shares outstanding (in thousands of shares):
For the Three Months Ended
September 30 For the Nine Months Ended
September 30 2019 2018 2019 2018 Weighted average number of ordinary
shares in computation of basic earnings per share 4,096,616 4,067,706 4,096,616 4,067,706
Effect of potentially dilutive ordinary shares: Employees’ compensation 1,318 2,071 1,318 2,071
Weighted average number of ordinary
shares used in the computation of diluted earnings per share 4,097,934 4,069,777 4,097,934 4,069,777
In the computation of diluted earnings per share, it assumed the entire amount of the compensation will be settled in potential shares. If the Bank offered to settle compensation paid to employees in cash or shares, the potential shares are included in the computation of diluted earnings per share until the number of shares to be distributed to employees is resolved in the following year.
36. SHARE-BASED PAYMENT ARRANGEMENTS Employee share option plan of the Bank
The board approved the issuance of new shares on June 14, 2019 and August 18, 2018 and resolved to allocate 15% and 11.11% of the new shares for subscription by its employees according to the Company Law. According to IFRS 2 “share-based payment”, the employee’s share options should be measured at fair value, and the related compensation costs were $362,748 thousand and $7,775 thousand respectively. The relevant information of employee share options are as follows:
For the Nine Months Ended
September 30, 2019
2018 Employee Share Option Unit (thousand share) Unit (thousand share)
Options granted 57,000 2,500 Options exercised 18,710 2,473 Options expired - 27 Weighted-average fair value of options granted (NT$/per share) $ 6.36 $ 3.11
Options granted were priced using the Black-Scholes pricing model, and the inputs to the model are as follows:
For the Nine Months Ended
September 30, 2019
2018 Acquisition date share price (NT$/per share) 42.29 35.39 Exercise price (NT$/per share) 36 32.28 Expected volatility 25.00% 19.93% Option life (in days) 33 12 Dividend yield - - Risk-free interest rate 0.45% 0.36% The expected volatility is based on the historical stock price volatility calculated by peers.

43
37. BUSINESS COMBINATION 37.1 Acquisition of subsidiaries
Main Operating
Activities
Acquisition Date
Voting Rights/ Proportion of
Acquisition (%) Transfer
Consideration AMK Microfinance
Institution Plc. (AMK) Microfinance
business 2018/8/28 80.01 $ 2,457,470
The Bank acquired AMK at US$80,103 thousand (equivalent to NT$2,457,470 thousand) on August 28, 2018 to expand the market share in Southeast Asia and enhance its competitiveness of international financial business. The acquisition-related costs have been excluded from the transfer consideration and are recognized in the current period of the acquisition.
37.2 Assets acquired and liabilities assumed at the date of acquisition
AMK Microfinance ASSETS Cash and cash equivalents $ 524,548 Due from the Central Bank and call loans to banks, net 1,843,446 Discounts and loans, net 7,055,886 Properties, net 144,134 Deferred income tax assets 44,270 Other assets 230,145 Total assets 9,842,429 LIABILITIES Deposits and remittances ((4,099,760) Other financial liabilities (299,140) Deferred income tax liabilities (7,827) Other liabilities (4,077,019) Total liabilities (8,483,746) Intangible assets due to acquisition Operating license $ 1,524,808 Computer software 95,481 1,620,289 $ 2,978,972
The fair value of discounts and loans from business combination of AMK was NT$7,055,886 thousand, and the total amount of contract was NT$7,215,585 thousand. The best estimate of contractual cash flow that is expected to be unrecoverable on the acquisition date was NT$159,699 thousand.
37.3 Non-controlling equity
The non-controlling equity of AMK is measured at the identifiable assets on the acquisition date.
37.4 Goodwill of acquisition
Amount Transfer consideration $ 2,457,470 Add: Non-controlling equity (19.99% of AMK’s equity) 613,984 Less: Identifiable assets at fair value of acquisition (2,978,972) Goodwill due to acquisition $ 92,482 Goodwill on the acquisition date is mainly derived from controlling premium. In addition, the consideration paid by the merger includes the expected synergies, revenue growth, future market
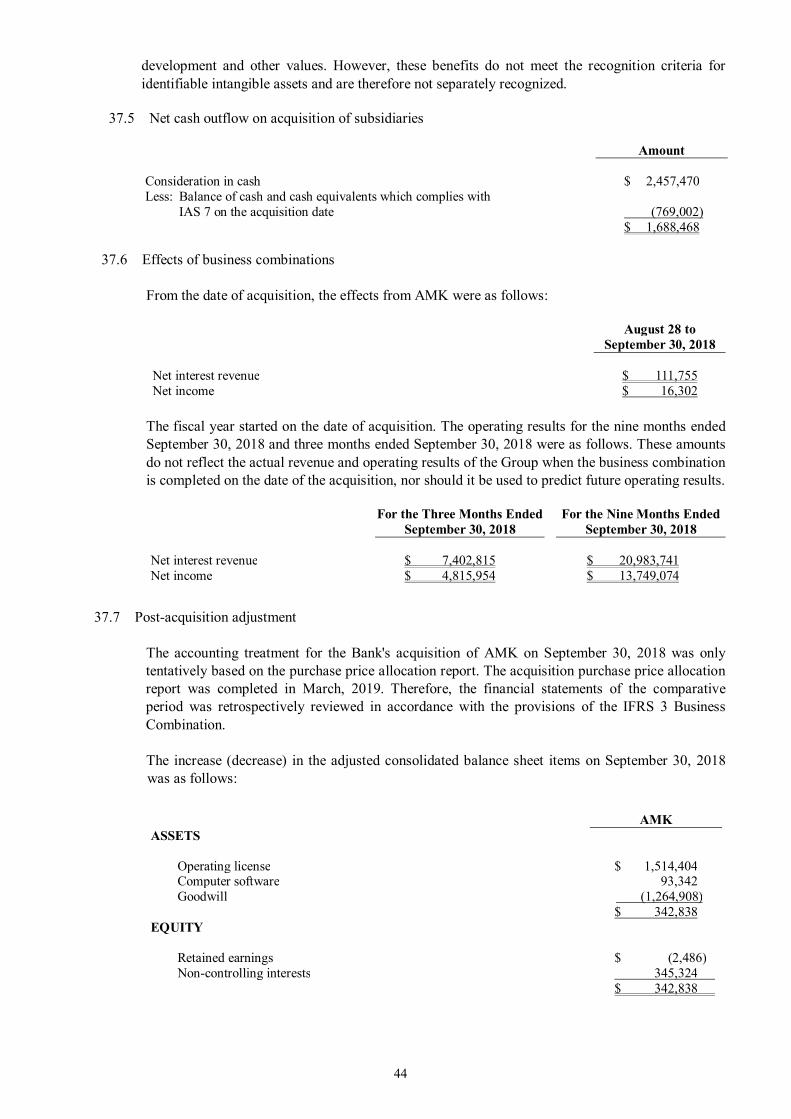
44
development and other values. However, these benefits do not meet the recognition criteria for identifiable intangible assets and are therefore not separately recognized.
37.5 Net cash outflow on acquisition of subsidiaries
Amount
Consideration in cash $ 2,457,470 Less: Balance of cash and cash equivalents which complies with
IAS 7 on the acquisition date
(769,002) $ 1,688,468
37.6 Effects of business combinations
From the date of acquisition, the effects from AMK were as follows:
August 28 to
September 30, 2018 Net interest revenue $ 111,755 Net income $ 16,302
The fiscal year started on the date of acquisition. The operating results for the nine months ended September 30, 2018 and three months ended September 30, 2018 were as follows. These amounts do not reflect the actual revenue and operating results of the Group when the business combination is completed on the date of the acquisition, nor should it be used to predict future operating results.
For the Three Months Ended
September 30, 2018 For the Nine Months Ended
September 30, 2018 Net interest revenue $ 7,402,815 $ 20,983,741 Net income $ 4,815,954 $ 13,749,074
37.7 Post-acquisition adjustment The accounting treatment for the Bank's acquisition of AMK on September 30, 2018 was only tentatively based on the purchase price allocation report. The acquisition purchase price allocation report was completed in March, 2019. Therefore, the financial statements of the comparative period was retrospectively reviewed in accordance with the provisions of the IFRS 3 Business Combination. The increase (decrease) in the adjusted consolidated balance sheet items on September 30, 2018 was as follows:
AMK ASSETS
Operating license $ 1,514,404 Computer software 93,342 Goodwill (1,264,908) $ 342,838 EQUITY
Retained earnings $ (2,486) Non-controlling interests 345,324 $ 342,838

45
The adjustments to the consolidated income statement items affected in the third quarter of 2018 were as follows:
For the Nine Months Ended
September 30, 2018 Depreciation and amortization expenses $ 3,107
38. EQUITY TRADING WITH NON-CONTROLLING INTERESTS
The Bank did not subscribe for cash capital increase of AMK in proportion to its shareholding, and the shareholding ratio increased from 80.01% to 84.89% on July 29, 2019.
Since the above transaction does not change the equity attributable to owners of the Bank, the Bank treated this transaction as an equity trading with non-controlling interests.
AMK
Cash consideration $ - The carrying amount of the subsidiary's net assets is calculated as the amount of
non-controlling interests transferred from the change in relative equity
85,518 Equity trading balance $ 85,518 Equity transaction balance adjustment account Capital reserve-recognition of changes in equity ownership of subsidiaries $ 85,518
39. RELATED-PARTY TRANSACTIONS
The relationship, significant transactions and account balances of the Group and its related parties (except those disclosed in other notes) are summarized as follows: 39.1 The Bank’s related parties
Related Party Relationship with the Bank The SCSB Cultural & Educational
Foundation Exceeding 1/3 of total fund donated by the Bank
The SCSB Charity Foundation Exceeding 1/3 of total fund donated by the Bank Silks Place Taroko Investment under the equity method held by subsidiary Hung Ta Investment Corporation The chairman and the Bank’s chairman are related by
marriage Hung Shen Investment Corporation The chairman and the Bank’s chairman are related by
marriage GTM Corporation The director of the Bank is the director of the company Chi-Li Investment Co., Ltd. The director of the Bank is the director of the company Goldsun Co., Ltd The director of the Bank is the director of the company Qin Mao Consultants Ltd. The chairman and the Bank’s director are related by
marriage Lian Yi Investment Co., Ltd. The director and the Bank’s director are related by
marriage Other related parties The Bank’s directors and managers are the relatives of
the Bank’s directors and managers
39.2 Significant transactions between related parties Balances and transactions between the Bank and its subsidiaries, which are related parties of the Bank, have been eliminated on consolidation and are not disclosed in this note. Details of transactions

46
between the Bank and other related parties are disclosed below. 39.2.1 Deposits
September 30, 2019
For the Nine Months Ended
September 30, 2019
Maximum
Balance Ending Balance
Interest Rate (%) Interest Expense
Directors and related
management $21,036,753 $20,699,736 0.00-4.90 $ 364,751 Employees 597,892 251,248 0.00-9.97 3,370 The SCSB Cultural &
Educational Foundation 338,369 329,989 0.01-1.07 1,432 Others 62,035 61,888 0.00-1.03 248 $ 22,035,049 $ 21,342,861 $ 369,801
December 31, 2018 For the Year Ended December 31, 2018
Maximum
Balance Ending Balance
Interest Rate (%) Interest Expense
Directors and related
management $ 21,603,580 $ 21,506,184 0.00-4.90 $ 339,455 Employees 491,609 254,973 0.00-9.96 3,820 The SCSB Cultural &
Educational Foundation 334,122 314,922 0.01-1.07 1,918 Others 91,667 59,811 0.00-1.03 333 $ 22,520,978 $ 22,135,890 $ 345,526
September 30, 2018
For the Nine Months Ended
September 30, 2018
Maximum
Balance Ending Balance
Interest Rate (%) Interest Expense
Directors and related
management $ 20,329,198 $ 20,229,910 0.00-4.90 $ 246,625 Employees 483,260 295,566 0.00-9.96 2,782 The SCSB Cultural &
Educational Foundation 334,122 332,634 0.01-1.07 1,434 Others 66,670 60,658 0.00-1.03 248 $ 21,213,250 $ 20,918,768 $ 251,089
39.2.2 Interest receivable (accounted for as receivables)
September 30, 2019 December 31, 2018 September 30, 2018 Directors and related management $ 114 $ 54 $ 90
39.2.3 Interest payable (accounted for as payables)
September 30, 2019 December 31, 2018 September 30, 2018 Directors and related management $ 284 $ 289 $ 290 The SCSB Cultural & Educational
Foundation
187
154 138 The SCSB Charity Foundation 27 12 12 Hung Ta Investment Corporation 38 - 25 $ 536 $ 455 $ 465

47
39.2.4 Guarantee deposits received (accounted for as other liabilities)
September 30, 2019 December 31, 2018 September 30, 2018 The SCSB Cultural & Educational Foundation
$ 211
$ 211
$ 211
39.2.5 Rental income (accounted for as other non-interest revenue, net)
For the Three Months Ended
September 30 For the Nine Months Ended
September 30 2019 2018 2019 2018 The SCSB Cultural &
Educational Foundation $ 211 $ 211 $ 632 $ 632
For the rental contracts with related parties, the rental is determined in proportion to similar rentals in the area, based on a reference to the rentals in the neighborhood, and is received on a monthly basis.
39.2.6 Loans
September 30, 2019 For the
Difference of Nine Months
Ended
Performance Terms of the September
30, Non- Transactions 2019 Maximum Ending Normal performing Interest with Unrelated Interest
Category Name Balance Balance Loans Loans Collateral Rate (%) Parties Income Loans for
personal house mortgages
Directors and related management (1)
$ 11,036 $ 2,626 $ 2,626
- Real estate 2.09 None $ 93
Others Directors and related management (9)
903,905 892,960 892,960 - Real estate/ financial instruments
1.58-2.66 None 87,811
$ 914,941 $ 895,586 $ 896,586 $ 87,904
December 31, 2018 For the Difference of Year Ended Performance Terms of the December 31, Non- Transactions 2018 Maximum Ending Normal performing Interest with Unrelated Interest
Category Name Balance Balance Loans Loans Collateral Rate (%) Parties Income Loans for
personal house mortgages
Directors and related management (1)
$ 16,747 $ 8,469 $ 8,469
- Real estate 2.09-2.10 None $ 264
Others Directors and related management (10)
1,775,640 1,733,519 1,733,519 - Real estate/ stock/ financial
instruments
1.68-2.66 None 53,589
Silks Place Taroko 5,000 - - - Real estate 1.63 None 6 $1,797,387 $ 1,741,988 $ 1,741,988 $ 53,859
September 30, 2018 For the
Difference of Nine Months
Ended
Performance Terms of the September
30, Non- Transactions 2018 Maximum Ending Normal performing Interest with Unrelated Interest
Category Name Balance Balance Loans Loans Collateral Rate (%) Parties Income Loans for
personal house mortgages
Directors and related management (1)
$ 18,631 $ 10,396 $ 10,396
- Real estate 2.09-2.10 None $ 213
Others Directors and related management (10)
1,766,383 1,749,471 1,749,471 - Real estate/ Deposit
slip/ stock/
1.68-2.66 None 35,528
Silks Place Taroko 5,000 - - - Real estate 1.63 None 6 $1,790,014 $1,759,867 $1,759,867 $ 35,747
Employee deposits and loans have interest rates that are better than ordinary rates but within regulated limits, while other related party transactions have similar terms as non-related party transactions. Under the provisions of Articles 32 and 33 of the Banking Act, the Bank shall not make unsecured loans to related party, except for consumer loans under certain limits, and government loans. Secured loans to a related party should be fully guaranteed, and the relevant terms should not be superior to other similar credit clients.

48
39.3 Compensation of directors and management personnel
For the Three Months Ended
September 30 For the Nine Months Ended
September 30 2019 2018 2019 2018 Salaries and other short-term
employee benefits $ 84,909 $ 76,281 $ 253,467 $ 260,843 Bonuses of employees 905 1,102 13,279 6,560 Remuneration of directors 21,143 23,687 69,724 69,088 Post-employment benefits 10,069 9,062 28,776 27,022 Others 36 50 375 364 $ 117,062 $ 110,182 $ 365,621 $ 363,877
40. PLEDGED ASSETS
Under the Central Bank’s clearing system of Real-Time Gross Settlement (RTGS), on September 30, 2019, December 31, 2018 and September 30, 2018, the assets listed below had been provided as collateral for day-term overdrafts with the pledged amount adjustable at any time.
September 30, 2019 December 31, 2018 September 30, 2018 Guaranty Purpose The Bank Financial assets at amortized cost $ 15,000,000 $ 15,000,000 $ 15,000,000 Day-term overdraft
with the pledge On September 30, 2019, December 31, 2018 and September 30, 2018, the assets listed below were provided as refundable deposits for operating guarantees and for executing legal proceedings against defaulting borrowers as required by the court.
September 30, 2019 December 31, 2018 September 30, 2018 Guaranty Purpose The Bank Financial assets at FVTOCI $ 205,854 $ 323,074 $ 323,543 Operating guarantee On September 30, 2019, December 31, 2018 and September 30, 2018, SCB HK and its overseas branch provided financial assets at amortized cost as operating guarantees.
September 30, 2019 December 31, 2018 September 30, 2018 Guaranty Purpose The SCB Financial assets at amortized cost $ 9,227,635 $ 9,317,130 $ 9,270,006 Overseas branch
operating guarantee
41. SIGNIFICANT CONTINGENT LIABILITIES AND UNRECOGNIZED COMMITMENTS 41.1 In addition to those disclosed in other notes, significant commitments and contingencies of the Bank
as of September 30, 2019, December 31, 2018 and September 30, 2018, were as follows:
September 30, 2019 December 31, 2018 September 30, 2018 Receivables under custody $ 30,191,755 $ 27,981,614 $ 29,569,709 Consigned travelers' checks 181,322 192,808 198,728 Guarantee notes payable 124,800,673 132,536,048 123,990,226 Assets under trust 169,861,414 164,466,181 148,870,303 Securities in custody 233,465,332 235,833,631 247,830,034 Government bonds in brokerage accounts 46,310,200 39,161,200 32,410,500 Short-term bills in brokerage accounts 838,600 974,600 753,300 Commitments of forward contracts with
customers 449,337,574 315,736,359 385,330,639

49
41.2 Operational risk and legal risk
Item Reason and Amount
For the Nine Months Ended September 30, 2019
For the Nine Months Ended September 30, 2018
Chief director and staff indicted by prosecutor for breaking law in the conduct of operational activities in recent year
None None
Violating the law and being punished by authorities in recent year
None 1. Fined $1 million by the Banking Bureau on its letter dated October 25, 2017 (Ref. No. 10620004740) for violating anti-money laundering rules.
2. Fined $2 million by the Banking Bureau’s on its letter dated October 25, 2017 (Ref. No. 10620004740) for violating banking transaction operations due to the actions of a teller in receipt of fraudulent instructions via the phone application LINE.
Deficiency corrected by authorities in the recent year
None None
Punished by authorities according to Bank Law No. 61-1 in recent year
The Banking Bureau on its letter dated April 17, 2019 (Ref. No. 1081028630) for violating anti-money laundering rules, which was corrected in accordance with the rules of Item 1 of Article 61 of the Banking Act. As for the DBU legal person's confirmation of identity operations, there are no adequate documents for the identification of the substantial beneficiaries to the customers with more complicated ownership structure; and for the transactions suspected of money laundering, there are no authenticity to verify the client's trading background and purpose, and to retain the relevant verification check, etc.
The Banking Bureau on its letter dated October 25, 2017 (Ref. No. 10620004741) in response to the staff of Yuanlin branch illegally keeping the application documents of the customer's stamped deposit withdrawal slip.
Single or whole security events due to fraudulence, accident or against “Outlines Governing the Security Maintenance and Administration of Financial Institutions” which caused losses amounting to $50 million in the recent year
None None
Others None None

50
41.3 Legal risks of the subsidiary SCB (HK)
SCB (HK) has violated anti-money laundering and terrorism fundraising regulations because it has not established and maintained effective measures to fulfill its responsibility to continuously monitor business relationships, prevent money laundering activities and counter-terrorism operations. On August 17, 2018, the Hong Kong Monetary Authority imposed a fine of HK$5 million (equivalent to NT$19,480 thousand) and requested remedial measures from SCB (HK).
42. FINANCIAL INSTRUMENTS
42.1 Fair value information - financial instruments not measured at fair value
42.1.1 Financial assets and liabilities with significant differences between carrying amounts and fair values.
Except as detailed in the following table, the Group’s management considers that the carrying amounts of financial instruments not measured at fair values are approximate of their fair values or the fair values could not otherwise be reliably measured:
September 30, 2019 December 31, 2018 September 30, 2018 Carrying Amount Fair Value Carrying Amount Fair Value Carrying Amount Fair Value
Financial assets Investments in debt instruments measured at
amortized cost $ 110,456,425 $ 110,596,660 $ 106,071,194 $ 106,046,775 $ 95,868,572 $ 95,863,499 Financial liabilities Bank debentures 79,114,628 80,257,132 64,785,252 64,923,150 57,723,924 57,785,102
42.1.2 Fair value level
September 30, 2019 Total Level 1 Level 2 Level 3
Financial assets Investments in debt instruments measured
at amortized cost $ 110,596,660 $ 12,375,647 $ 98,221,013 $ - Financial liabilities Bank debentures 80,257,132 - 80,257,132 -
December 31, 2018 Total Level 1 Level 2 Level 3 Financial assets Investments in debt instruments measured
at amortized cost $ 106,046,775 $ 13,444,185 $ 92,602,590 $ - Financial liabilities Bank debentures 64,923,150 - 64,923,150 -
September 30, 2018 Total Level 1 Level 2 Level 3
Financial assets Investments in debt instruments measured
at amortized cost $ 95,863,499 $ 14,062,508 $ 81,800,991 $ - Financial liabilities Bank debentures 57,785,102 - 57,785,102 -
42.1.3 The evaluation method and assumptions used in measuring fair value.
The fair value of financial assets and liabilities are determined as follows: (1) The fair value of financial assets with standard clauses and terms is quoted market price. (2) The fair value of financial instruments other than the above is determined by the discounted
cash flow analysis or other generally accepted pricing models.

51
42.2 Fair value information – financial instrument measured at fair value under repetitive basis
42.2.1 Fair value level
Information of the financial instruments measured at fair value categorized by level is as follows:
Financial Instruments September 30, 2019 Measured at Fair Value Total Level 1 Level 2 Level 3
Non-derivative instruments Assets Financial assets measured at FVTPL Financial assets mandatorily classified as at FVTPL
Shares $ 965,735 $ 941,927 $ 23,808 $ - Bonds 8,055,450 132,609 7,353,825 569,016 Others 503,849 503,849 - -
Financial assets measured at FVTOCI Equity instruments 20,526,185 18,770,627 - 1,755,558 Debt instruments 446,148,269 205,870,042 240,266,855 11,372
$ 476,199,488 $ 226,218,054 $ 247,644,488 $ 2,335,946 Liabilities Financial liabilities measured at FVTPL $ 2,487,983 $ - $ 2,487,983 $ - Derivative instruments Assets Financial assets measured at FVTPL $ 2,042,134 $ 46,362 $ 1,601,297 $ 394,475
Liabilities Financial liabilities measured at FVTPL $ 1,535,674 $ 3,410 $ 1,502,184 $ 30,080
Financial Instruments December 31, 2018 Measured at Fair Value Total Level 1 Level 2 Level 3
Non-derivative instruments Assets Financial assets measured at FVTPL Financial assets mandatorily classified as at FVTPL
Shares $ 891,791 $ 868,172 $ 23,619 $ - Bonds 8,294,566 113,451 7,193,091 988,024 Others 2,631,922 2,631,922 - -
Financial assets measured at FVTOCI Equity instruments 19,245,827 17,503,079 - 1,742,748 Debt instruments 416,762,690 165,861,711 250,122,983 777,996
$ 447,826,796 $ 186,978,335 $ 257,339,693 $ 3,508,768 Liabilities Financial liabilities measured at FVTPL $ 2,242,521 $ - $ 2,242,521 $ - Derivative instruments Assets Financial assets measured at FVTPL $ 1,761,753 $ 35,606 $ 1,585,947 $ 140,200
Liabilities Financial liabilities measured at FVTPL $ 1,538,953 $ 6,980 $ 1,494,144 $ 37,829
Financial Instruments September 30, 2018
Measured at Fair Value Total Level 1 Level 2 Level 3 Non-derivative instruments Assets Financial assets measured at FVTPL Financial assets mandatorily classified as at FVTPL
Shares $ 808,354 $ 788,427 $ 19,927 $ - Bonds 8,180,905 150,602 7,210,158 820,145 Others 3,030,297 3,030,297 - -
Financial assets measured at FVTOCI Equity instruments 20,868,009 19,119,101 - 1,748,908 Debt instruments 380,775,688 145,504,112 234,500,428 771,148
$ 413,663,253 $ 168,592,539 $ 241,730,513 $ 3,340,201 Derivative instruments Assets Financial assets measured at FVTPL $ 2,178,684 $ 32,257 $ 2,097,810 $ 48,617
Liabilities Financial liabilities measured at FVTPL $ 2,062,314 $ 2,459 $ 2,027,491 $ 32,364

52
There were no transfers of financial instruments between Level 1 and Level 2 fair value measurement for the nine months ended September 30, 2019 and 2018.
42.2.2 Reconciliation of Level 3 fair value measurement
For the Nine Months Ended September 30, 2019
Item Beginning Balance
Amount of Valuation Gain or Loss Addition Reduction
Exchange Ending Balance Included in
Profit or Loss
Included in Other
Comprehensive Income
Buy or Issue Transferred In Sell Out,
Disposal or Settlement
Transferred Out from
Third Level
Assets Financial assets measured at FVTPL
Financial assets mandatorily classified as at FVTPL $ 1,128,224 $ 289,719 $ - $ - $ - $ (447,941) $ - $ (6,511) $ 963,491 Financial assets measured at FVTOCI 2,520,744 - 4,753 10,748 - (618,564) (154,641) 3,890 1,766,930
Liabilities Financial liabilities measured at FVTPL Held-for-trading financial liabilities 37,829 14,959 - - - - - (22,708) 30,080
For the Nine Months Ended September 30, 2018
Item Beginning Balance
Amount of Valuation Gain or Loss Addition Reduction
Exchange Ending Balance Included in
Profit or Loss
Included in Other
Comprehensive Income
Buy or Issue Transferred In Sell Out,
Disposal or Settlement
Transferred Out from
Third Level
Assets Financial assets measured at FVTPL
Financial assets mandatorily classified as at FVTPL $ 736,163 $ 8,991 $ - $ 477,804 $ - $ (226,063) $ (148,618) $ 20,485 $ 868,762 Financial assets measured at FVTOCI 2,883,117 - (237,064) 42,279 - (162,142) - (6,134) 2,520,056
Liabilities Financial liabilities at FVTPL
Held-for-trading financial liabilities 32,263 14,796 - - - (8,512) (6,183) - 32,364
Some of the Group’s investments became listed during the nine months ended September 30, 2018 and 2019. After the assessment, the fair market values are available for reference. Therefore, such targets have been transferred from Level 3 to Level 1.
42.2.3 Valuation techniques and inputs applied for Level 2 fair value measurement
Financial Instruments Valuation Techniques and Inputs
Bonds Valuation was based on observable market prices or assessed by using
cash-flow method through observable elements. Derivatives Valuation was based on widely-adapted pricing techniques. The inputs were
assessed by observable elements in the market. Others Valuation was based on observable market prices or assessed by using
cash-flow method through observable elements. 42.2.4 Valuation techniques and inputs applied for Level 3 fair value measurement
Fair value evaluation of financial instruments classified as Level 3 included but was not limited to instruments classified as at FVTPL such as bonds, derivatives, and available-for-sale equity securities. Most financial instruments with fair value measurements classified as Level 3 only possess single, unobservable inputs. Non-active market debt instruments possess unobservable inputs. The non-active market equity instruments are independent and thus, are irrelevant to each other. The quantified information of significant unobservable inputs is tabled as follows:

53
Fair Value September 30, 2019
Valuation Techniques
Significant Unobservable Inputs
Interval (Weighted-Average) Notes
Non-derivative financial assets Financial assets measured at FVTPL Bonds
$ 569,016 Counterparty quote and check with other quotations
Discount for lack of market liquidity
0%-10% The higher of the discount for lack of liquidity, and the lower of the fair value.
Financial assets measured at FVTOCI Shares 1,755,558 1. Market approach
1. Market liquidity reduction
1. 10%-19%
1. The higher the liquidity reduction, and the lower of the fair value.
2. Net asset value
method 2. Market liquidity
reduction
2. 10%-19% 2. The higher the liquidity reduction, and the lower of the fair value
Bonds
11,372 1.Counterparty quote
2.Discounted cash flow method
Discount rate
0%-10%
The higher of the discount rate, and the lower of the fair value.
Derivative financial assets Financial assets measured at FVTPL Interest rate exchange 394,475 Discounted cash
flow method Discount rate 0%-10% The higher of the
discount rate, and the lower of the fair value.
Derivative financial liabilities Financial liabilities measured at FVTPL Sell options 30,080 Black-Scholes
Model Volatility 0%-15% The higher of the
volatility, and the higher of the fair value.
42.2.5 Sensitivity analysis of alternative assumptions of Level 3 fair value measurements The Group reasonably measured the fair values of its financial instruments; however, using different valuation models, evaluation methods and underlying assumptions may lead to different results. For financial instruments classified as having Level 3 fair value measurements, if the parameters were to go up 1%, the influence on net income or other comprehensive income would be as follows:
September 30, 2019
Changes in Fair Value Reflected
in Profit or Loss Changes in Fair Value Reflected in Other Comprehensive Income
Favorable Unfavorable Favorable Unfavorable Assets Financial assets measured at FVTPL
Financial assets mandatorily classified as at FVTPL $ 3,505 $ (237) $ - $ -
Financial assets measured at FVTOCI - - 19,394 (3,304) December 31, 2018
Changes in Fair Value Reflected
in Profit or Loss Changes in Fair Value Reflected in Other Comprehensive Income
Favorable Unfavorable Favorable Unfavorable Assets Financial assets measured at FVTPL
Financial assets mandatorily classified as at FVTPL $ 236 $ (4,156) $ - $ -
Financial assets measured at FVTOCI - - 19,552 (28,099)

54
September 30, 2018
Changes in Fair Value Reflected
in Profit or Loss Changes in Fair Value Reflected in Other Comprehensive Income
Favorable Unfavorable Favorable Unfavorable Assets Financial assets measured at FVTPL
Financial assets mandatorily classified as at FVTPL $ 199 $ (4,273) $ - $ -
Financial assets measured at FVTOCI - - 19,042 (28,447) For financial instruments classified as having Level 3 fair value measurements, if the parameters were to go down 1%, the influence of net income or other comprehensive income would be as follows: September 30, 2019
Changes in Fair Value Reflected
in Profit or Loss Changes in Fair Value Reflected in Other Comprehensive Income
Favorable Unfavorable Favorable Unfavorable Assets Financial assets measured at FVTPL
Financial assets mandatorily classified as at FVTPL $ 237 $ (3,505) $ - $ -
Financial assets measured at FVTOCI - - 3,304 (19,394) December 31, 2018
Changes in Fair Value Reflected
in Profit or Loss Changes in Fair Value Reflected in Other Comprehensive Income
Favorable Unfavorable Favorable Unfavorable Assets Financial assets measured at FVTPL
Financial assets mandatorily classified as at FVTPL $ 4,156 $ (236) $ - $ -
Financial assets measured at FVTOCI - - 28,099 (19,552) September 30, 2018
Changes in Fair Value Reflected
in Profit or Loss Changes in Fair Value Reflected in Other Comprehensive Income
Favorable Unfavorable Favorable Unfavorable Assets Financial assets measured at FVTPL
Financial assets mandatorily classified as at FVTPL $ 4,273 $ (199) $ - $ -
Financial assets measured at FVTOCI - - 28,447 (19,042)
42.3 Financial risk management
42.3.1 Risk management
The Group’s objective in risk management is to establish a risk control mechanism weighing the entire risk of the Group, restrictions from laws and regulations, to diversify, transfer, and avoid risk, and to pursue the maximum benefits of the Group’s customers, shareholders, and employees. The Group’s major risks include credit risk, market risk (interest rate, exchange rate and equity securities), operational risk, liquidity risk and so on. The Group established written risk management policies and procedures that are considered and approved by the board of directors to identify, measure, monitor, and control the credit risk,

55
market risk, operation risk and liquidity risk. The Group’s risk management department performs the Group’s risk management activities pursuant to the policies approve by the board of directors. Risk management department works with other business departments in order to identify, evaluate, and avoid any financial risks. The board of directors formulates the written policies for risk management; the policy included specific exposures such as currency risk, interest rate risk, credit risk, derivative and non-derivative financial instruments. In addition, the department of internal audit is responsible for independent review of risk management and control environment.
42.3.2 Credit risks
Credit risk is the risk of counterparties’ failure to fulfill their contractual obligations causing the Group’s financial losses. Both in-balance-sheet and off-balance-sheet items are exposed to credit risks. For the Group’s credit exposures, in-balance-sheet items mainly consisted of discounts and loans, credit card business, due from and call loans to banks, debt investments, and derivative instruments. Off-balance sheet items mainly consisted of financial guarantee, acceptances, letters of credit, loan commitments, and other services which also generate credit exposure. To ensure that the credit risk is controlled within a tolerable range, the Group established an internal standard for credit risk. In that standard, all transactions are analyzed whether in the banking book or in the trading book, and either in-balance-sheet or off-balance-sheet, to identify the inherent and potential risks. The Group examines and confirms credit risk in accordance with the rules before launching new products and business. Furthermore, the Group also establishes a risk management system for complicated credit business such as factoring, credit derivative financial instruments and so on. The Group’s foreign operation units adopt policies and standards same as above to assess their asset quality and provision for contingent loss, and also include policies that comply with the regulations of the local financial supervisory commission. (1) Procedures of credit risk management
The major procedures and methods for credit risk management are as follows: A Credit business (including loan commitments and guarantees)
The Bank
a . The credit risk has increased significantly after initial recognition
The Bank assesses the change in the risk of default over the expected duration of each type of credit asset on each reporting date in order to determine whether the credit risk has increased significantly since initial recognition. For this assessment, the Bank's considerations (including forward-looking information) show that the credit risk has increased significantly since initial recognition and can be corroborated. The main considerations include:
i. Changes in internal and external credit ratings (e.g. external Taiwan Corporate Credit Risk Index (TCRI) ratings are above the high risk level).
ii. Information of overdue status (e.g. if the payment is overdue for more than
30 days). iii. Unfavorable changes in current or projected operating, financial or
economic conditions that are expected to result in significant changes in the ability of the debtor to perform its debt obligations.
iv. Significant changes in actual or expected results of the debtor’s operations.

56
v. The credit risk of other financial instruments of the same debtor has
increased significantly.
b. The definition of default and credit impairment on financial assets
The Bank's definition of default on financial assets is the same as the judgment of credit impairment on financial assets. If one or more of the following conditions are met, the Bank determines that the financial assets have defaulted and have credit impairment:
i. Changes in internal and external credit ratings from the significant increase
in credit risk. i i. Information of overdue status (e.g. if the payment is overdue for more than
90 days). i i i. The debtor has become bankrupt or may file for bankruptcy or financial
restructuring. iv. The debtor has become bankrupt or may file for bankruptcy or financial
restructuring. v. Contracts of other debt instruments of the debtor have defaulted. vi. The active market of the financial assets disappeared due to financial
difficulties. vii. The debtor's creditor gives the borrower a concession that would not have
been considered due to economic or contractual reasons related to the debtor's financial difficulties.
vii i. There is a purchase or initiation of financial assets at a significant discount
reflecting that credit losses have occurred. The aforementioned default and credit impairment definitions apply to all financial assets held by the Bank and are consistent with the definitions used for the internal credit risk management purposes of the financial assets and are applied to the relevant impairment assessment model.
c. Measurement of expected credit loss
For the objective of assessing expected credit loss, credit assets are classified according to the credit risk characteristics (such as the purpose of the borrowing, the nature of the industry, the type of collateral and the state of the borrowing) into two categories: corporate finance and personal finance. Furthermore, the credit risk characteristics are divided according to each category. The 12-month expected credit loss amounts of the Bank's financial instruments whose credit risk has not significantly increased since initial recognition are used to measure the allowance loss of the financial instruments; for financial instruments whose credit risk has increased significantly or which have had credit impairment since initial recognition, such financial instruments are measured at the amount of full lifetime expected credit losses. The estimation method and significant assumptions used to assess expected credit losses have not changed significantly since September 30, 2019.

57
d. Forward-looking information considerations
When measuring the expected credit losses, the Bank uses forward-looking economic factors that affect credit risk and takes such forward-looking information regarding expected credit losses into consideration. Based on professional economic judgment, the Bank uses statistical analysis results of GDP growth rate to provide forecast information of economic factors on a quarterly basis and re-evaluates such data on each financial reporting date.
SCB (HK)
a. The credit risk has increased significantly after initial recognition
SCB assesses the change in the risk of default over the expected duration of each type of credit asset on each reporting date in order to determine whether the credit risk has increased significantly since initial recognition. For this assessment, SCB considerations (including forward-looking information) show that the credit risk has increased significantly since initial recognition and can be corroborated. The main considerations include:
i. Changes in internal and external credit ratings and probability of default in the next 12 months.
i i. Information of overdue status (e.g. if the payment is overdue for more than
30 days). i i i. Unfavorable changes in current or projected operating, financial or
economic conditions that are expected to result in significant changes in the ability of the debtor to perform its debt obligations.
iv. Significant changes in actual or expected results of the debtor’s operations. v. The credit risk of other financial instruments of the same debtor has
increased significantly. vi. There is doubt about the collateral rights under the debt, or the collateral
price is affected by the surrounding economic environment, and the mortgage value will decline due to economic recession.
vii. There are unfavorable changes in the business of the debtor industry which are affected by the surrounding economy or policy.
vii i. Key person in debt companies has financial difficulties, debt or dispute
litigation, or serious illness or death, all of which have a negative impact on the ability of debt companies to meet their debt obligations.
b. The definition of default and credit impairment on financial assets
SCB’s definition of default on financial assets is the same as the judgment of credit impairment on financial assets. If one or more of the following conditions are met, SCB determines that the financial assets have defaulted and have credit impairment:
i. Information of overdue status (e.g. if the payment is overdue for more than 90 days).
i i. The debtor has become bankrupt or may file for bankruptcy or financial
restructuring.
i i i. The debtor has died or been dissolved.
iv. Contracts of other debt instruments of the debtor have defaulted.

58
v. The active market of the financial assets disappeared due to financial difficulties.
vi. The debtor's creditor gives the borrower a concession that would not have
been considered due to economic or contractual reasons related to the debtor's financial difficulties.
vii. The debtor’s overall debt rises and is not proportional to its business
growth.
vii i. If the debtor invests in a project or delays the construction of a project, the cost exceeds the budget, and the creditor needs to arrange for debt restructuring.
ix. There is a purchase or initiation of financial assets at a significant discount
reflecting that credit losses have occurred. x. Estimated debt contract payments failed to be fully recovered.
The aforementioned default and credit impairment definitions apply to all financial assets held by SCB and are consistent with the definitions used for the internal credit risk management purposes of the financial assets and are applied to the relevant impairment assessment model. If the financial assets no longer meet the definition of default and credit impairment for six consecutive months, their statuses are judged to have returned to performance level and are no longer regarded as financial assets that have defaulted and have been credited.
c. Measurement of expected credit loss
For the objective of assessing expected credit loss, credit assets are classified according to the credit risk characteristics (such as the purpose of the borrowing, the nature of the industry, the type of collateral and the state of the borrowing) into two categories: corporate finance and personal finance. Furthermore, the credit risk characteristics are divided according to each category. For financial instruments whose credit risk has not significantly increased since initial recognition, SCB measures the allowance loss of the financial instruments based on the 12-month expected credit loss amounts; for financial instruments and operating lease receivables whose financial risk has significantly increased or which have had credit impairment since initial recognition, such instruments and operating lease receivables are measured at the amount of expected credit losses during the duration of the period. The estimation method and significant assumptions used to assess expected credit losses have not changed significantly since September 30, 2019.
d. Forward-looking information considerations
When measuring the expected credit losses, SCB uses forward-looking economic factors that affect credit risk and takes such forward-looking information regarding expected credit losses into consideration. Based on professional economic judgment, SCB uses the statistical analysis results of GDP growth rate to provide forecast information of economic factors on a quarterly basis and re-evaluates such data on each financial reporting date.

59
B. Due from and call loans to bank The Group assesses the credit position of counterparties and consults a credit rating agency for credit rating information and sets limits to the credit facilities.
C. Debt investments and derivative financial instruments
For the credit risk management of debt investments, the Group identifies credit risk by using information from external institutions about credit ratings, quality of debts, region, and the risk of counterparties. Most of the Group’s counterparties in derivative transactions are assessed at higher than investment grade, and the Group controls the investments according to counterparties’ facilities (including call loans); counterparties that do not have credit ratings or are not assessed at investment grade are reviewed case by case. Counterparties which are non-financial or non-banking clients are assessed according to the general procedures for the approval of credit facilities and control of credit exposure situations of the counterparties.
(2) Policies of credit risk hedging or mitigation
A. Collateral
The Group applies series of policies to decrease credit risks in its lending business. Among those policies is to request collateral from creditors. To secure the creditor’s rights, the Group has established procedures for pledges, valuations, management, and disposals of collateral. The contracts between the Group and the borrowers clearly state the protocols, including but not limited to the security of credit, procedures for collateral and for offsets. To further decrease credit risks, the contracts also proclaim that the Group may decrease the credit facilities at its discretion, accelerate the maturity of the borrowings, demand immediate payback, or offset borrowers’ assets in the Group against the borrowings.
B. Limitation of credit risk and credit concentration management
The credit policies of the Group regulate the credit limitations, as applied to a single counterparty or group, to avoid excessive credit concentration. The Group further implements concentration policies, which monitor and manage the credit limitation and concentration in one single counterparty, different enterprises, related parties, industries, and countries. The policies are based on individual criteria in different categories including but not limited to industries, enterprises, and share-pledge related loans.
C. Other mechanisms for credit risk management
The contracts between the Group and the borrowers clearly state the protocols, including but not limited to the security of the credit, procedures for collateral and setoff. To further decrease credit risks, the contracts also proclaim that the Group may decrease the balances, shorten the maturity period, demand immediate payback, or use borrowers’ assets in the Group to offset their liabilities. In most circumstances, the Group applies gross settlement with counterparties. However, to further decrease credit risks, the Group applies net settlement or even terminates transactions with certain counterparties when default may occur. The table below analyzes the collateral held as security and other credit enhancements, and their financial effects in respect of the financial assets recognized in the Group’s consolidated balance sheet:

60
September 30, 2019 Maximum Exposure to Credit Risk Mitigated by Financial instruments subject to IFRS 9 impairment requirements and credit impairment Book Value Collateral
Master Netting Arrangement
Other Credit Enhancement Total
Receivables $ 618,460 $ 86,072 $ - $ - $ 86,072 Discounts and loans 4,408,331 3,486,376 - 225,241 3,711,617 December 31, 2018 Maximum Exposure to Credit Risk Mitigated by Financial instruments subject to IFRS 9 impairment requirements and credit impairment Book Value Collateral
Master Netting Arrangement
Other Credit Enhancement Total
Receivables $ 651,093 $ 91,937 $ - $ - $ 91,937Discounts and loans 4,668,173 3,867,369 - 260,033 4,127,402 September 30, 2018 Maximum Exposure to Credit Risk Mitigated by Financial instruments subject to IFRS 9 impairment requirements and credit impairment Book Value Collateral
Master Netting Arrangement
Other Credit Enhancement Total
Receivables $ 646,947 $ 84,145 $ - $ - $ 84,145 Discounts and loans 4,378,544 3,444,482 - 275,482 3,719,964
(3) Credit risk exposures
The maximum exposure of the Group’s assets in the balance sheet is equivalent to the book value, while the pledged assets and other credit instruments are not considered. The off-balance sheet items related to the maximum credit exposure (without considering collateral or other credit enhancements and irrevocable maximum exposure) are as follows: September 30, 2019 December 31, 2018 September 30, 2018 Developed and non-cancelable loan
commitments $ 57,087,609 $ 55,979,093 $ 51,521,337 Non-cancelable credit card commitments 697,997 706,663 696,092 Issued but unused letters of credit 38,201,105 36,814,452 43,488,743 Other guarantees 75,703,028 60,305,984 54,790,610
The Group assessed that it could continually control and minimize credit risk exposure of off-balance sheet items because it adopts stricter procedures and regularly audits credit accounts. The table of total carrying amounts of the financial assets with the largest credit risk exposure in the Group is as follows:

61
September 30, 2019
12-Month ECLs Lifetime ECLs - Unimpaired
Lifetime ECLs - Impaired Total
Discounts and loans Consumer banking -Residential mortgage loans $ 232,271,978 $ 2,138,228 $ 864,836 $ 235,275,042 -Small scale credit loans 13,375,336 205,850 139,508 13,720,694 -Others 73,421,978 918,941 230,651 74,571,570 Corporate banking -Secured 495,813,562 13,237,354 2,385,462 511,436,378 -Unsecured 290,406,711 7,751,044 787,874 298,945,629 Total $ 1,105,289,565 $ 24,251,417 $ 4,408,331 $ 1,133,949,313 Accounts receivable (including non-performing credit
card receivables) Credit cards $ 2,893,362 $ 194,141 $ 73,771 $ 3,161,274 Others 14,651,538 124,619 544,689 15,320,846 Total $ 17,544,900 $ 318,760 $ 618,460 $ 18,482,120 Debt instruments measured at FVTOCI $ 443,748,180 $ 163,076 $ - $ 443,911,256 Investments in debt instruments measured at amortized
cost $ 110,456,877 $ - $ - $ 110,456,877 December 31, 2018
12-Month ECLs Lifetime ECLs - Unimpaired
Lifetime ECLs - Impaired Total
Discounts and loans Consumer banking -Residential mortgage loans $ 240,611,439 $ 2,744,852 $ 866,384 $ 244,222,675 -Small scale credit loans 10,798,037 227,797 114,221 11,140,055 -Others 46,960,063 328,238 139,010 47,427,311 Corporate banking -Secured 455,365,600 12,078,587 2,691,675 470,135,862 -Unsecured 257,364,582 9,116,508 856,883 267,337,973 Total $ 1,011,099,721 $ 24,495,982 $ 4,668,173 $1,040,263,876 Accounts receivable (including non-performing credit
card receivables) Credit cards $ 2,554,994 $ 199,408 $ 73,959 $ 2,828,361 Others 13,673,245 402,125 577,134 14,652,504 Total $ 16,228,239 $ 601,533 $ 651,093 $ 17,480,865 Debt instruments measured at FVTOCI $ 418,375,227 $ 120,876 $ - $ 418,496,103 Investments in debt instruments measured at amortized
cost $ 106,072,961 $ - $ - $ 106,072,961
September 30, 2018
12-Month ECLs Lifetime ECLs - Unimpaired
Lifetime ECLs - Impaired Total
Discounts and loans Consumer banking -Residential mortgage loans $ 232,141,042 $ 2,958,837 $ 838,810 $ 235,938,689 -Small scale credit loans 9,188,047 191,977 125,954 9,505,978 -Others 48,927,790 475,321 102,937 49,506,048 Corporate banking -Secured 480,486,994 7,703,967 2,623,549 490,814,510 -Unsecured 223,555,623 5,845,502 687,294 230,088,419 Total $ 994,299,496 $ 17,175,604 $ 4,378,544 $ 1,015,853,644 Accounts receivable (including non-performing credit
card receivables) Credit cards $ 2,568,310 $ 154,555 $ 161,969 $ 2,884,834 Others 17,973,237 47,821 484,978 18,506,036 Total $ 20,541,547 $ 202,376 $ 646,947 $ 21,390,870 Debt instruments measured at FVTOCI $ 381,616,190 $ - $ - $ 381,616,190 Investments in debt instruments measured at amortized
cost $ 95,870,241 $ - $ - $ 95,870,241

62
(4) Information on concentration of credit risk Concentration of credit risk exists if transaction counterparties are significantly concentrated on same individuals or groups engaged in activities with similar economic characteristics, which may lead their ability to fulfill contractual obligations being affected by similar changes in economic or other conditions. Concentration of credit risk can be on assets, liabilities or off-balance sheet items and can arise in the course of the enforcement and implementation of transactions (regardless of products or service) or in the combination of exposures across categories, including credit, due from and call loans to banks, marketable securities, receivables and derivatives, etc. The Group maintains a diversified loan portfolio to mitigate the credit risk concentration to same customers; total discounts and loans transactions with same customers and non-performing loans are not material. The Group’s most significant concentrations of credit risk of discounts and loans and non-performing loans by industry, region, and collateral were summarized as follows:
A. Industry
September 30, 2019 December 31, 2018 September 30, 2018
Sector Amount % to Total Amount
% to Total Amount
% to Total
Private sector $ 704,529,075 62 $ 627,579,912 60 $ 610,874,197 60 Consumer 363,021,261 32 337,724,944 33 328,861,017 33 Financial institution 54,892,510 5 62,411,715 6 64,426,264 6 Others 11,506,467 1 12,547,305 1 11,692,166 1 $1,133,949,313 100 $1,040,263,876 100 $1,015,853,644 100
B. Region
September 30, 2019 December 31, 2018 September 30, 2018
Region Amount % to Total Amount
% to Total Amount
% to Total
Taiwan $ 623,297,288 55 $ 592,985,754 57 $ 583,856,902 57 Asia Pacific except Taiwan 381,242,374 34 336,871,857 32 330,940,054 33 Others 129,409,651 11 110,406,265 11 101,056,688 10 $1,133,949,313 100 $1,040,263,876 100 $1,015,853,644 100
C. Collateral
September 30, 2019 December 31, 2018 September 30, 2018
Collaterals Assumed Amount % to Total Amount
% to Total Amount
% to Total
Unsecured $ 261,589,584 23 $ 218,274,179 21 $ 220,065,614 22 Secured Properties 725,224,999 63 677,924,678 65 654,363,752 64 Guarantee 66,457,562 6 66,298,162 6 69,741,391 7 Financial collateral 46,861,819 4 45,782,975 4 43,259,944 4 Movable properties 5,148,818 1 4,820,936 1 4,902,540 1 Other collaterals 28,666,531 3 27,162,946 3 23,520,403 2 $1,133,949,313 100 $1,040,263,876 100 $1,015,853,644 100
(5) Information on credit risk quality
Part of the financial assets held by the Group, cash and cash equivalents, financial assets at fair value through profit or loss, investments in bills and bonds with resale agreements, guarantee deposits paid, security businesses, clearing and settlement funds, etc. are assessed to have very low credit risk because the counterparties have good credit ratings.
42.3.3 Market risk
(1) The sources and definition of market risk
63
Market risk is the risk resulting from changes in fair value and future cash flows of on- and off-balance-sheet financial instruments caused by changes in market prices, interest rates, foreign exchange rate, including equity securities price and commodity price. Changes in above risk elements can cause risks to shift the net profit of the Group or its investment structures. The Group’s financial instruments are exposed to price, interest rate and foreign exchange rate risks. Major market price risk positions of equity securities include domestic listed shares and funds. Major interest risks include bonds and interest rate derivative instruments such as fixed and floating interest rate swap and bond options whereas the major foreign exchange risks include foreign currency positions held by the Group.
(2) Market risk management policies
The Group monitors its market risk and tolerable loss according to the risk management objectives and limits approved by the board of directors. The Group also builds a market risk information system, which enables the Group to effectively monitor the management of the investment limits, assessment of gains and losses, and analysis of sensitivity factors. The results of the monitoring, assessment and analysis are reported to the board of directors in risk control meetings and serve as references for the decision making of the management. The Group splits market risk exposures into trading and held for fixed income portfolios which are controlled by both the Group’s operation and risk management section, respectively. Routine control reports are reviewed by the board of directors and relevant committees.
(3) Market risk management process
A. Recognition and measurement The Group’s operation and risk management sections both identify market risk factors of exposure positions, which are used to measure market risks. Market risk factors include interest rates, foreign exchange rates and market price of equity securities, and exposures, gains and losses and sensitivity (PVO1, Delta, Beta) etc. Measurement of investment portfolio is affected by interest rate risk, foreign exchange risk and price of equity securities.
B. Monitoring and reporting The Group’s risk management department regularly reviews market risk management objective, positions and control of gains and losses, sensitivity analysis and pressure test and reports to the board of directors. Therefore, the board of directors could well understand market risk control. The Group has established explicit notification process, the limit and stop-loss regulation for various transactions. Stop-loss order must be taken when the limit is reached, otherwise the trading department’s reasons and plans must be approved by the management, and the department should report to relevant committee regularly.
(4) Interest rate management policies A. Definition of interest rate risk
Interest rate risk represents risks of changes in fair value of investment portfolio and loss in earnings resulting from changes in interest rates. Major products include interest rate-related financial securities and derivative instruments.
B. Purpose of interest risk management

64
Interest rate risk management enhances the Group’s ability to deal with a contingency, to measure, manage and avoid negative influence on earnings and economic values of balance sheet items affected by the changes in interest rates. In addition, it enhances the efficiency of capital and the business management.
C. Procedures of interest risk management The Group carefully chooses investment target through conducting research about issuers’ credit, financial status, country risks and interest rate trend. The Group also establishes trading amount limit and stop-loss limit including limit for trading department, trading personnel and trading commodity, etc. which are approved by top management and the board of directors. The Group identifies re-pricing risk of interest rate and yield curve risk and measures possible effects on the Group’s earnings and economic values of changes in interest rate. On a monthly basis, the Group reports the analysis and monitoring of limit on interest rate risk position and various interest rate management objectives to the strategy management committee and the board of directors. Report to the strategy management committee is required when certain risk management objective has exceeded limit in order to resolve response action.
D. Measurement methods The Group measures risks of price reset periods gap from difference in maturity date and price reset date of assets, liabilities, and off-balance sheet items. The Group also established interest rate sensitivity monitoring index for major periods in order to maintain long-term profitability and business growth. Such interest rate indexes and results of pressure test are reviewed by management personnel regularly. In addition, the Group regularly uses DV01 to measure portfolio affected by interest rate.
(5) Foreign exchange rate risk management
A. Definition of foreign exchange risk Foreign exchange risk means losses resulting from currencies exchange at different times. The Group’s foreign exchange rate risk results mainly from spot and forward foreign exchange. The Group’s foreign exchange rate risk is relatively insignificant due to the fact that transactions are basically settled immediately on transaction date.
B. Policies, procedures and measurement method for foreign exchange rate risk management In order to control foreign exchange rate risk within tolerable range, the Group has established trading limit, stop-loss limit and maximum loss for trading department and trading personnel and the risk is controlled within the tolerable range. The Group undertakes pressure test on a seasonal basis and uses 3% fluctuation in major foreign exchange rate (USD) as the sensitivity threshold and reports test results to the board of directors.
(6) Equity securities price risk management
A. Definition of equity securities price risk The market risk of equity securities held by the Group includes individual and general risk

65
from price fluctuations of both individual equity security and the entire equity security market.
B. Purpose of equity security price risk management
The main purpose of equity security price risk management is to prevent financial status from deteriorating and to avoid a decrease in earnings due to violent fluctuation in equity security prices, and to enhance capital efficiency and strengthen operation.
C. Procedures of equity security price risk management The Group regularly uses β value to measure the degree of influence on investment portfolio system risk. Stop-loss point is set according to the policy approved by the assets and liabilities management committee. Stop-loss action must be taken when limit is reached, otherwise the investment department must submit request to top management personnel for approval.
D. Measurement method The Group’s control of security price risk is based on risk values.
(7) Market valuation technique The Group assesses its exposures to market risk and the anticipated loss under market pressures by using assumptions on changes in several market conditions. The limits of various financial instruments are set by the board of directors and monitored by its risk management department. The Group also establishes sensitivity analysis based on major risk factors of various financial products in order to monitor the changes in various market risk factors of financial products. A. Sensitivity analysis
a. Interest rate risk The Group has assessed the possible impact on income if global yield curve moves between -1 to +1 basis points simultaneously on September 30, 2019, December 31, 2018 and September 30, 2018 while other factors remain unchanged.
b. Foreign exchange rate risk The Group assesses the possible impact on income when exchange rates of the NTD against various currencies fluctuate between -1% and +1% on September 30, 2019, December 31, 2018 and September 30, 2018 while other factors remain unchanged. The functional currency of SCB (HK) is the HKD, and the net on-balance-sheet position of SCB (HK) was denominated in the USD; as the two currencies were under the Linked Exchange Rate System, there was insignificant foreign exchange rate risk.
c. Equity securities price risk The Group has assessed the possible impact on income when equity security prices on September 30, 2019, December 31, 2018 and September 30, 2018 rise or fall by 1% while other factors remain unchanged. The analysis assumed that the trends of equity instruments are consistent with historical data.

66
B. Sensitivity analysis is summarized as follows:
September 30, 2019
Major Risk Fluctuation Range Amount Equity Profit or Loss
Foreign exchange risk
Foreign currency appreciated 1% against the NTD
$ 703,045 $ 21,014
Foreign currency depreciated 1% against the NTD
(703,045) (21,014)
Interest rate risk
Interest rate curve edged up 1bp (48,217) (37) Interest rate curve edged down 1bp 48,217 37
Equity price risk Equity price increased 1% 13,428 5,595 Equity price decreased 1% (13,428) (5,595)
December 31,2018
Major Risk Fluctuation Range Amount Equity Profit or Loss
Foreign exchange risk
Foreign currency appreciated 1% against the NTD
$ 656,270 $ 2,292
Foreign currency depreciated 1% against the NTD
(656,270) (2,292)
Interest rate risk
Interest rate curve edged up 1bp (59,634) (5,691) Interest rate curve edged down 1bp 59,634 5,691
Equity price risk Equity price increased 1% 182,157 12,568 Equity price decreased 1% (182,157) (12,568)
September 30, 2018
Major Risk Fluctuation Range Amount Equity Profit or Loss
Foreign exchange risk
Foreign currency appreciated 1% against the NTD
$ 634,400 $ 381
Foreign currency depreciated 1% against the NTD
(634,400) (381)
Interest rate risk
Interest rate curve edged up 1bp (49,348) (4,035) Interest rate curve edged down 1bp 49,348 4,035
Equity price risk Equity price increased 1% 201,648 13,454 Equity price decreased 1% (201,648) (13,454)
42.3.4 Liquidity risk
(1) The sources and definition of liquidity risk
Liquidity risk is the possibility that the Group is unable to liquidate assets or obtain financing to fulfill matured financial liabilities which may result in financial loss. Liquidity risk may be present when, for example, deposits are withdrawn in advance of the original date of settlement, the market becomes worse and borrowing from other banks becomes difficult, the clients’ credit deteriorates leading to the occurrence of defaults, liquidation of financial instruments becomes difficult, early redemption of interest-sensitive instruments happens, etc. The aforementioned factors may reduce cash balance to be used in the areas of loans, trading, and investment. In some extreme circumstances, the lack of liquidity may lead to the decrease in the overall assets and liabilities, and the need to liquidate the Group’s assets and the possibility of being unable to fulfill loan commitments. Liquidity risks include inherent risks that may be affected by some specific industry events or overall market condition. These events include but are not limited to credit, merger and acquisitions, systemic breakdown and natural disasters.
(2) The management policies are as follows:
The management procedures are monitored by the independent department of risk management; the procedures are as follows:

67
A. Regular financing and monitoring of cash flows to ensure the fulfillment of the requirements in the future.
B. Maintaining appropriate position of high liquidity assets which are easily realizable. C. Monitoring of liquidity ratios of the balance sheet accounts according to the internal
management purposes and external monitoring rules. D. Managing the maturity date of debt instruments. The procedures for monitoring and reporting liquidity risk are applied and measured based on the estimated cash flows (the time gap is based on how the Group manages the liquidity risk) of 1 day, 10 days, and 1 month. Estimates of future cash flows are based on the maturity analysis of financial assets and liabilities. The risk management department also monitors the use of loan commitment, discount facilities, guarantee letters, and other types of contingent liabilities, and furthermore reports the related information to the risk management committee and the board of directors regularly. The Group holds certain position of highly liquid interest bearing assets to fulfill its obligation and for future needs. To manage the liquidity risk, the Group holds the following assets: Cash and cash equivalents, due from the Central Bank and banks, and financial assets at fair value through profit or loss, etc.
(3) Maturity analysis The Group analyzed cash outflows of non-derivative financial liabilities according to the remaining terms from date of the balance sheet to maturity date of the contract. The disclosure of cash outflows of non-derivative financial liabilities is based on the cash flows of contracts so that the items could not correspond with all items in the balance sheet.
September 30, 2019 0~30 days 31~90 days 91~180 days 181 days~1 year Over 1 year Total Due to the Central Bank and banks $ 50,427,643 $ 20,658,190 $ 6,751,163 $ 3,076,302 $ 2,077,268 $ 82,990,566 Financial liabilities measured at FVTPL - - - - 2,550,401 2,550,401 Securities sold under repurchase agreements 10,015,916 2,633,127 155,088 4,114 - 12,808,245 Payables 27,319,971 2,266,944 868,273 830,636 132,076 31,417,900 Deposits and remittances 921,406,572 305,962,970 187,045,718 184,015,106 11,779,829 1,610,210,195 Bank debentures - 5,445,436 232,695 378,131 73,058,366 79,114,628 Other financial liabilities 2,275,922 41,071 90,067 161,676 1,096,083 3,664,819 Lease liabilities 43,418 137,020 127,625 293,175 1,920,565 2,521,803
December 31, 2018 0~30 days 31~90 days 91~180 days 181 days~1 year Over 1 year Total
Due to the Central Bank and banks $ 33,101,058 $ 17,095,169 $ 4,282,054 $ 3,941,937 $ 1,843,112 $ 60,263,330 Financial liabilities measured at FVTPL - - - - 2,250,590 2,250,590 Securities sold under repurchase agreements 10,835,957 3,010,998 219,247 563,328 - 14,629,530 Payables 28,565,460 667,076 349,849 507,933 23,257 30,113,575 Deposits and remittances 864,477,888 298,164,617 145,988,475 201,793,787 10,200,848 1,520,625,615 Bank debentures - - 5,144,083 5,444,083 54,197,086 64,785,252 Other financial liabilities 2,799,494 28,842 126,049 253,286 1,003,367 4,211,038
September 30, 2018 0~30 days 31~90 days 91~180 days 181 days~1 year Over 1 year Total
Due to the Central Bank and banks $ 35,060,145 $ 14,403,144 $ 3,741,432 $ 3,477,455 $ 740,767 $ 57,422,943 Securities sold under repurchase agreements 15,512,966 9,542,937 245,700 5,103 - 25,306,706 Payables 29,968,277 1,226,186 187,138 167,311 3,253 31,552,165 Deposits and remittances 891,570,704 278,831,439 145,249,020 162,486,234 8,355,279 1,486,492,676 Bank debentures - 142,967 142,967 5,142,967 52,295,023 57,723,924 Other financial liabilities 2,535,845 - 1,564,024 - - 4,099,869
The Group evaluated the contractual maturity date to comprehend all derivative financial instruments on the consolidated balance sheets. Because the maturity analysis of derivative financial liabilities is based on the contractual cash flows, the amounts would not correspond with related items on the consolidated balance sheets. Maturity analysis of derivative financial liabilities is as follows: A. Derivative financial liabilities in net settlement
September 30, 2019 0~30 days 31~90 days 91~180 days 181 days~1 year Over 1 year Total Derivative financial liabilities measured at FVTPL
Foreign exchange derivatives $ 22,246 $ 23,159 $ 10,477 $ 20,475 $ 722 $ 77,079 Rate derivatives - 23,774 - - 43,375 67,149 Equity securities derivatives 121 - - - - 121

68
December 31, 2018 0~30 days 31~90 days 91~180 days 181 days~1 year Over 1 year Total Derivative financial liabilities measured at FVTPL Foreign exchange derivatives $ 18,491 $ 15,649 $ 13,939 $ 22,881 $ 745 $ 71,705 Rate derivatives 20 - 28,638 - 9,191 37,849 Equity securities derivatives 116 - - - - 116
September 30, 2018 0~30 days 31~90 days 91~180 days 181 days~1 year Over 1 year Total
Derivative financial liabilities measured at FVTPL Foreign exchange derivatives $ 9,158 $ 16,565 $ 7,253 $ 26,133 $ - $ 59,109 Rate derivatives - 4 - 11,759 20,601 32,364
B. Derivative financial liabilities in total settlement
September 30, 2019 0~30 days 31~90 days 91~180 days 181 days~1 year Over 1 year Total Derivative financial liabilities measured at FVTPL
Foreign exchange derivatives Cash inflow $ 83,001,046 $ 49,708,840 $ 70,617,797 $ 164,696,709 $ 122,712,064 $ 490,736,456 Cash outflow 83,254,522 49,855,441 70,930,952 164,952,728 122,712,641 491,706,284
December 31, 2018 0~30 days 31~90 days 91~180 days 181 days~1 year Over 1 year Total
Derivative financial liabilities measured at FVTPL Foreign exchange derivatives
Cash inflow $ 49,621,207 $ 54,381,089 $ 65,116,337 $ 105,005,353 $ 78,396,809 $ 352,520,795 Cash outflow 49,798,017 54,672,679 65,481,678 105,091,508 78,396,809 353,440,691
September 30, 2018 0~30 days 31~90 days 91~180 days 181 days~1 year Over 1 year Total Derivative financial liabilities measured at FVTPL
Foreign exchange derivatives Cash inflow $ 53,891,488 $ 14,580,796 $ 16,814,570 $ 11,612,291 $ 152,340 $ 97,051,485 Cash outflow 54,004,206 14,643,276 17,001,055 11,772,124 156,202 97,576,863
The analysis of cash outflows of off-balance-sheet items is illustrated according to the remaining terms from date of the balance sheet to maturity date of the contract. For financial guarantee contracts, the largest amount is categorized under the nearest time-zone of being asked to fulfill the guarantees. The disclosure of cash outflows of off-balance sheet items is based on the cash flows of contracts so that part items could not correspond with all items in the balance sheet.
September 30, 2019 0~30 days 31~90 days 91~180 days 181 days~1 year Over 1 year Total Developed and non-cancelable loan commitments $ 5,300,733 $ 934,028 $ 2,002,037 $ 4,921,796 $ 43,929,015 $ 57,087,609 Non-cancelable credit card commitments 70,707 141,484 212,191 273,615 - 697,997 Issued but unused letters of credit 32,674,731 3,919,461 1,319,210 287,703 - 38,201,105 Other guarantees 17,059,013 15,949,441 8,804,896 19,137,577 14,752,101 75,703,028
December 31, 2018 0~30 days 31~90 days 91~180 days 181 days~1 year Over 1 year Total
Developed and non-cancelable loan commitments $ 4,817,873 $ 3,536,654 $ 1,990,655 $ 4,153,507 $ 41,480,404 $ 55,979,093 Non-cancelable credit card commitments 68,122 136,174 204,296 298,071 - 706,663 Issued but unused letters of credit 33,223,391 3,012,705 442,615 118,119 17,622 36,814,452 Other guarantees 13,737,286 11,674,979 6,496,931 12,678,166 15,718,622 60,305,984
September 30, 2018 0~30 days 31~90 days 91~180 days 181 days~1 year Over 1 year Total
Developed and non-cancelable loan commitments $ 3,435,051 $ 1,910,020 $ 6,522,009 $ 4,484,099 $ 35,170,158 $ 51,521,337 Non-cancelable credit card commitments 67,103 134,137 201,240 293,612 - 696,092 Issued but unused letters of credit 36,745,213 5,151,142 1,416,266 73,423 102,699 43,488,743 Other guarantees 8,801,321 9,334,482 8,461,927 12,400,364 15,792,516 54,790,610
42.4 Transfer of financial assets
In the daily transactions of the Group, most of the transferred financial assets not eligible for full derecognition are repurchase notes and bonds. The cash flows of the transactions have been transferred to outsiders and the liabilities for repurchasing the transferred financial assets in a fixed amount have been recognized; the Group may repurchase the transferred financial assets in the future. The Group is not eligible to conduct, sell, or pledge the transferred financial assets during the effective period prior to derecognition. However, the Group is still exposed to the interest risks and credit risks. As a result, the transferred financial assets are not derecognized. The following tables show the transferred financial assets which are not qualified for derecognition and related financial liabilities. September 30, 2019
Type of Financial Assets
The Book Value of Financial
Assets Transferred
The Book Value of Related Financial Liabilities
The Fair Value of Financial
Assets Transferred
The Fair Value of Related Financial Liabilities
Net Amount
Financial assets measured at FVTOCI - purchased call options $ 12,054,063 $ 12,808,245 $ 12,054,063 $ 12,808,245 $ (754,182)

69
December 31, 2018
Type of Financial Assets
The Book Value of Financial
Assets Transferred
The Book Value of Related Financial Liabilities
The Fair Value of Financial
Assets Transferred
The Fair Value of Related Financial Liabilities
Net Amount
Financial assets measured at FVTOCI - purchased call options $ 14,605,863 $ 14,629,530 $ 14,605,863 $ 14,629,530 $ (23,667)
September 30, 2018
Type of Financial Assets
The Book Value of Financial
Assets Transferred
The Book Value of Related Financial Liabilities
The Fair Value of Financial
Assets Transferred
The Fair Value of Related Financial Liabilities
Net Amount
Financial assets measured at FVTOCI - purchased call options $ 25,672,017 $ 25,306,706 $ 25,672,017 $ 25,306,706 $ 365,311
43. AVERAGE AMOUNT AND AVERAGE INTEREST RATE OF INTEREST-EARNING ASSETS
AND INTEREST-BEARING LIABILITIES Average amount and average interest rate of interest-earning assets and interest-bearing liabilities that were affected by interest rate fluctuations are as follows: Average balances were calculated by the daily average balances of interest-earning assets and interest-bearing liabilities. 43.1 The Bank
For the Nine Months Ended September 30, 2019
Average Balance
Average Rate (%)
Interest-earning assets Cash and cash equivalents - due from other banks $ 14,013,999 0.92 Due from the Central Bank and call loans to banks 103,026,882 1.33 Financial assets measured at FVTPL 48,779 0.60 Securities purchased under resale agreements 1,863,039 1.83 Credit card revolving balances 672,077 12.57 Discounts and loans (excluding non-performing loans) 709,399,079 2.37 Financial assets measured at FVTOCI – investments in debt
instruments 185,116,767 1.64 Financial assets measured at amortized cost 101,341,835 0.64 Other financial assets due from other banks (time deposits of more
than three months) 5,223,360 2.31
Interest-bearing liabilities Due to the Central Bank and banks $ 27,750,816 2.06 Financial liabilities measured at FVTPL 2,169,932 4.88 Securities sold under repurchase agreements 15,181,980 0.45 Negotiable certificates of deposits 31,606,008 0.65 Demand deposits 219,373,567 0.26 Savings deposits 145,062,013 0.31 Time deposits 402,548,927 1.32 Time savings 142,610,136 1.03 Bank debentures 54,358,602 1.68 Principal amount of structured deposit 1,935,664 2.30

70
For the Nine Months Ended September 30, 2018
Average Balance
Average Rate (%)
Interest-earning assets Cash and cash equivalents - due from other banks $ 18,055,969 1.10 Due from the Central Bank and call loans to banks 95,140,704 1.01 Financial assets measured at FVTPL 12,685 1.07 Securities purchased under resale agreements 137,584 0.30 Credit card revolving balances 672,134 12.30 Discounts and loans (excluding non-performing loans) 654,990,823 2.35 Financial assets measured at FVTOCI – investments in debt
instruments 169,690,440 1.57 Financial assets measured at amortized cost 97,623,597 0.56 Interest-bearing liabilities Due to the Central Bank and banks $ 16,593,698 1.60 Securities sold under repurchase agreements 31,657,582 0.36 Negotiable certificates of deposits 10,249,043 0.50 Demand deposits 210,598,480 0.22 Savings deposits 133,911,853 0.31 Time deposits 366,490,714 1.04 Time savings 135,546,442 1.02 Bank debentures 47,001,852 1.63 Principal amount of structured deposit 2,868,761 2.33
43.2 SCB (HK)
For the Nine Months Ended September 30, 2019
Average Balance
Average Rate (%)
Interest-earning assets Due from other banks $151,436,342 1.98 Discounts and loans (excluding non-performing loans) 370,675,878 4.36 Credit card revolving balances 159,391 30.76 Debt instruments (including financial assets measured at FVTOCI
and amortized cost) 246,719,039 2.91 Interest-bearing liabilities Due to other banks $ 50,909,000 2.31 Demand deposits 245,161,306 0.07 Time deposits 391,322,931 2.17 Bank debentures 16,434,473 4.51

71
For the Nine Months Ended September 30, 2018
Average Balance
Average Rate (%)
Interest-earning assets Due from other banks $ 178,697,326 1.67 Discounts and loans (excluding non-performing loans) 311,333,267 3.92 Credit card revolving balances 168,987 31.18 Debt instruments (including available-for-sale financial assets, and
held-to-maturity financial assets) 193,650,373 2.74 Interest-bearing liabilities Due to other banks 41,025,277 1.93 Demand deposits 255,387,609 0.03 Time deposits 320,213,679 1.72 Bank debentures 7,591,047 3.86
44. CAPITAL MANAGEMENT
All the Group’s risks were included in the scope of assessment of capital adequacy according to “Regulations Governing the Capital Adequacy”. The business objectives and project budget are approved by the board of directors, and furthermore the Bank considered the development strategy, capital adequacy, debt ratio, and dividend policy in its assessments. The contents are included in stress test, estimate of capital adequacy ratio to ensure achieving the objective of capital adequacy and strengthening of the capital structure.
45. ASSET QUALITY, CONCENTRATION OF CREDIT EXTENSIONS, INTEREST RATE
SENSITIVITY, PROFITABILITY AND MATURITY ANALYSIS OF ASSETS AND LIABILITIES 45.1 Assets quality: as stated in Table 1 45.2 Concentration of credit risks
Top 10 credit extensions information of head office and SCB (HK) was as below:
Ranking (Note 1)
September 30, 2019 The Bank SCB (HK)
Categorized by Sector (Note 2) Credit
Amount (Note 3)
Credit Amount / Stockholders’
equity (%) Categorized by Sector (Note 2)
Credit Amount (Note 3)
Credit Amount / Stockholders’
equity (%) (Note 4)
1 A Group (general management agency) 5,876,186 4.08%
a Group (real estate, financial services, electronics, wine and lifestyle)
22,375,403 18.92%
2 B Group (real estate selling and leasing) 5,331,261 3.70% b Group (automobile retail) 10,058,582 8.51%
3 C Group (metallic furniture manufacturing ) 4,779,042 3.32% c Group (hotel property
development) 9,206,514 7.79% 4 D Group (computer manufacturing) 4,554,611 3.16% d Group (hotel property
development ) 8,168,117 6.91% 5 E Group (other computer peripheral
manufacturing ) 4,283,542 2.97% e Group (property investment and reconstruction) 6,854,731 5.80%
6 F Group (other holding companies) 3,937,411 2.73% f Group (hotel property development ) 6,703,067 5.67%
7 G Group (computer manufacturing) 3,838,218 2.67% g Group (property investment) 5,881,420 4.97% 8 H Group (import and export of
garments and accessories) 3,744,959 2.60% h Group (property investment and construction) 5,549,615 4.69%
9 I Group (general management agency) 3,665,362 2.55% i Group (import and export of
garments and accessories) 5,187,398 4.39% 10 J Group (general management
agency) 3,567,990 2.48% j Group (investment holding and steel sales) 5,132,276 4.34%

72
Ranking (Note 1)
December 31, 2018 The Bank SCB (HK)
Categorized by Sector (Note 2) Credit
Amount (Note 3)
Credit Amount / Stockholders’
equity (%) Categorized by Sector (Note 2)
Credit Amount (Note 3)
Credit Amount / Stockholders’
equity (%) (Note 4)
1 B Group (real estate selling and leasing) 5,733,267 4.37% b Group (automobile retail) 11,409,641 10.42%
2 A Group (general management agency) 5,385,673 4.11% d Group (hotel property development) 9,458,664 8.64%
3 K Group (chemical material and wholesale of chemical products) 5,298,681 4.04% k Group (construction industry) 6,692,676 6.11%
4 L Group (computer manufacturing) 4,666,708 3.56% j Group (investment holding and steel sales) 5,879,623 5.37%
5 C Group (metallic furniture manufacturing) 4,599,252 3.51% f Group (hotel property
development) 5,529,185 5.05% 6 M Group (computer manufacturing) 4,343,939 3.31% i Group (import and export of
garments and accessories) 5,325,142 4.86% 7 E Group (wiring and cable system
manufacturing) 4,138,604 3.16% h Group (property investment and construction) 5,065,495 4.62%
8 H Group (apparel manufacturing) 3,697,879 2.82% l Group (property development) 4,676,231 4.27% 9 D Group (integrated circuit
manufacturing) 3,510,792 2.68% m Group (property investment) 3,978,295 3.63% 10 N Group (retail industry via
e-shopping and mail order) 3,104,632 2.37% n Group (property development) 3,887,320 3.55%
Ranking (Note 1)
September 30, 2018 The Bank SCB (HK)
Categorized by Sector (Note 2) Credit
Amount (Note 3)
Credit Amount / Stockholders’
equity (%) Categorized by Sector (Note 2)
Credit Amount (Note 3)
Credit Amount / Stockholders’
equity (%) (Note 4)
1 B Group (real estate activities for sale and rental with own or leased property)
6,884,078 5.40% b Group (automobile retail) 11,754,123 10.74%
2 A Group (general management agency) 5,746,462 4.51% d Group (hotel property development) 8,781,676 8.02%
3 K Group (chemical material and chemical product wholesale) 5,115,576 4.01% k Group (construction industry) 7,140,965 6.52%
4 L Group (computer manufacturing) 5,076,834 3.98% j Group (investment holding and steel sales) 6,587,662 6.02%
5 M Group (computer manufacturing ) 5,015,529 3.93% f Group (hotel property development) 5,623,509 5.14%
6 C Group (metallic furniture manufacturing) 4,138,128 3.25% h Group (property investment and
construction) 5,347,739 4.89% 7 H Group (apparel manufacturing) 4,098,152 3.21% i Group (import and export of
garments and accessories) 5,252,373 4.80% 8 N Group (retail industry via
e-shopping and mail order) 3,123,500 2.45% l Group (property development) 4,322,188 3.95% 9 O Group (television program design
and broadcasting) 3,122,550 2.45% m Group (property investment) 3,867,613 3.53% 10 P Group (unclassified other monopoly
wholesale) 3,080,500 2.42% n Group (property investment) 3,860,472 3.53%
Note 1: The top 10 credit extensions ranking is made up of total credit balance, which excluded
government-owned or state-run enterprises. If the borrower is an affiliate of the Group enterprise, the credit balance of the borrower is then aggregated to the Group enterprise’s credit balance. The borrower is marked by specific codes as well as its major industry. The major industry of a borrower is determined by its maximum exposures by industries. The classification of industry should be in line with the Standard Industrial Classification System of the Republic of China published by the Directorate General of Budget, Accounting and Statistics under the Executive Yuan.
Note 2: “Group Enterprise” conforms to the definition of Article 6 in “Supplementary Provisions to
the Taiwan Stock Exchange Corporation Rules for Review of Securities Listings.” Note 3: Credit balance includes each item of loan (including import bill negotiated, export bill
negotiated, discounts, overdrafts, short-term loans, short-term secured loans, marginal receivables, medium-term loans, medium-term secured loans, long-term loans, long-term secured loans and non-performing loans), exchange bills negotiated, accounts receivable - without recourse factoring, acceptances receivable and grantees issued.
Note 4: It is net equity of SCB (HK).

73
45.3 Interest rate sensitivity information 45.3.1 The Bank
Interest Rate Sensitivity Analysis September 30, 2019
(In Thousands of NT$)
Items 1 to 90 Days (Included)
91 to 180 Days (Included)
181 Days to 1 Year (Included) Over 1 Year Total
Interest rate sensitive assets $ 676,367,493 $ 13,815,474 $ 22,602,155 $ 78,501,540 $ 791,286,662 Interest rate sensitive liabilities 299,502,911 292,213,661 75,419,434 62,090,101 729,226,107 Interest rate sensitivity gap 376,864,582 (278,398,187) (52,817,279) 16,411,439 62,060,555 Net equity 143,998,243 Ratio of interest rate sensitive assets to liabilities 108.51% Ratio of interest rate sensitivity gap to net equity 43.10%
Interest Rate Sensitivity Analysis
December 31, 2018
(In Thousands of NT$)
Items 1 to 90 Days 91 to 180 Days 181 Days to 1 Year Over 1 Year Total
Interest rate sensitive assets $ 658,897,092 $ 10,687,289 $ 21,063,226 $ 73,929,131 $ 764,576,738 Interest rate sensitive liabilities 268,452,452 269,005,348 110,353,743 50,524,038 698,335,581 Interest rate sensitivity gap 390,444,640 (258,318,059) (89,290,517) 23,405,093 66,241,157 Net equity 131,155,947 Ratio of interest rate sensitive assets to liabilities 109.49% Ratio of interest rate sensitivity gap to net equity 50.51%
Interest Rate Sensitivity Analysis
September 30, 2018
(In Thousands of NT$)
Items 1 to 90 Days 91 to 180 Days 181 Days to 1 Year Over 1 Year Total
Interest rate sensitive assets $ 654,697,252 $ 22,992,922 $ 14,497,837 $ 56,734,393 $ 748,922,404 Interest rate sensitive liabilities 301,584,795 265,874,282 77,463,100 48,857,225 693,779,402 Interest rate sensitivity gap 353,112,457 (242,881,360) (62,965,263) 7,877,168 55,143,002 Net equity 127,470,433 Ratio of interest rate sensitive assets to liabilities 107.95% Ratio of interest rate sensitivity gap to net equity 43.26%
Note 1: The tables above refer only to the financial assets/liabilities denominated in New Taiwan dollars
held by the whole bank, excluded contingent assets and liabilities. Note 2: Interest rate-sensitive assets/liabilities refer to financial assets/liabilities which returns are driven
by interest rate fluctuations. Note 3: Interest rate sensitivity gap = Interest rate-sensitive assets - Interest rate-sensitive liabilities. Note 4: Ratio of interest rate-sensitive assets to liabilities = Interest rate-sensitive assets ÷ Interest
rate-sensitive liabilities. (The interest rate-sensitive assets and liabilities are in the New Taiwan dollars).
Interest Rate Sensitivity Analysis
September 30, 2019
(In Thousands of US$)
Items 1 to 90 Days 91 to 180 Days 181 Days to 1 Year Over 1 Year Total
Interest rate sensitive assets $ 6,243,379 $ 153,728 $ 82,006 $ 1,654,233 $ 8,133,346 Interest rate sensitive liabilities 3,094,950 4,334,548 586,466 76,009 8,091,973 Interest rate sensitivity gap 3,148,429 (4,180,820) (504,460) 1,578,224 41,373 Net equity 4,641,212 Ratio of Interest rate sensitive assets to liabilities 100.51% Ratio of interest rate sensitivity gap to net equity 0.89%

74
Interest Rate Sensitivity Analysis December 31, 2018
(In Thousands of US$)
Items 1 to 90 Days 91 to 180 Days 181 Days to 1 Year Over 1 Year Total
Interest rate sensitive assets $ 5,539,454 $ 88,961 $ 78,232 $ 1,571,322 $ 7,277,969 Interest rate sensitive liabilities 2,707,616 3,976,449 687,813 70,530 7,442,408 Interest rate sensitivity gap 2,831,838 (3,887,488) (609,581) 1,500,792 (164,439) Net equity 4,266,899 Ratio of Interest rate sensitive assets to liabilities 97.79% Ratio of interest rate sensitivity gap to net equity (3.85%)
Interest Rate Sensitivity Analysis
September 30, 2018
(In Thousands of US$)
Items 1 to 90 Days 91 to 180 Days 181 Days to 1 Year Over 1 Year Total
Interest rate sensitive assets $ 5,456,025 $ 137,975 $ 82,884 $ 1,615,894 $ 7,292,778 Interest rate sensitive liabilities 2,420,176 4,141,939 745,214 3,280 7,310,609 Interest rate sensitivity gap 3,035,849 (4,003,964) (662,330) 1,612,614 (17,831) Net equity 4,179,440 Ratio of Interest rate sensitive assets to liabilities 99.76% Ratio of interest rate sensitivity gap to net equity (0.43%)
Note 1: The tables above refer only to the financial assets/liabilities denominated in the US dollars held
by the whole bank, contingent assets and liabilities excluded. Note 2: Interest rate-sensitive assets/liabilities refer to financial assets/liabilities which returns are driven
by interest rate fluctuations. Note 3: Interest rate sensitivity gap = Interest rate-sensitive assets - Interest rate-sensitive liabilities. Note 4: Ratio of interest rate-sensitive assets to liabilities = Interest rate-sensitive assets ÷ Interest
rate-sensitive liabilities. (The interest rate-sensitive assets and liabilities are denominated in the US dollars).
45.3.2 SCB (HK)
Interest Rate Sensitivity Analysis September 30, 2019
(In Thousands of US$)
Items 1 to 90 Days 91 to 180 Days 181 Days to 1 Year Over 1 Year Total
Interest rate sensitive assets $ 6,463,107 $ 351,423 $ 305,836 $ 1,790,386 $ 8,910,752 Interest rate sensitive liabilities 5,576,538 1,048,774 1,043,891 894,488 8,563,691 Interest rate sensitivity gap 886,569 (697,351) (738,055) 895,898 347,061 Net equity 3,759,290 Ratio of interest rate sensitive assets to liabilities 104.05% Ratio of interest rate sensitivity gap to net equity 9.23%
Interest Rate Sensitivity Analysis December 31, 2018
(In Thousands of US$)
Items 1 to 90 Days 91 to 180 Days 181 Days to 1 Year Over 1 Year Total
Interest rate sensitive assets $ 6,323,254 $ 526,771 $ 148,642 $ 1,227,561 $ 8,226,228 Interest rate sensitive liabilities 5,567,714 722,225 509,214 248,398 7,047,551 Interest rate sensitivity gap 755,540 (195,454) (360,572) 979,163 1,178,677 Net equity 3,519,204 Ratio of interest rate sensitive assets to liabilities 116.72% Ratio of interest rate sensitivity gap to net equity 33.49%

75
Interest Rate Sensitivity Analysis September 30, 2018
(In Thousands of US$)
Items 1 to 90 Days 91 to 180 Days 181 Days to 1 Year Over 1 Year Total
Interest rate sensitive assets $ 5,632,898 $ 572,109 $ 225,693 $ 1,079,533 $ 7,510,233 Interest rate sensitive liabilities 5,531,340 419,467 496,336 248,425 6,695,568 Interest rate sensitivity gap 101,558 152,642 (270,643) 831,108 814,665 Net equity 3,455,927 Ratio of interest rate sensitive assets to liabilities 112.17% Ratio of interest rate sensitivity gap to net equity 23.57%
Note 1: The tables above refer only to the financial assets/liabilities denominated in the US dollars held by SCB (HK), contingent assets and liabilities excluded.
Note 2: Interest rate-sensitive assets/liabilities refer to financial assets/liabilities which returns are driven
by interest rate fluctuations. Note 3: Interest rate sensitivity gap = Interest rate-sensitive assets - Interest rate-sensitive liabilities. Note 4: Ratio of interest rate-sensitive assets to liabilities = Interest rate-sensitive assets ÷ Interest
rate-sensitive liabilities. (The interest rate-sensitive assets and liabilities are in the US dollars). 45.4 Profitability
The Group
Items September 30, 2019 September 30, 2018
Return on total assets Before income tax 1.29 1.27 After income tax 1.04 1.01
Return on equity Before income tax 13.58 13.54 After income tax 10.93 10.79
Profit margin 48.43 49.47
Note 1: Return on total assets = Income before (after) income tax ÷ Average total assets. Note 2: Return on equity = Income before (after) income tax ÷ Average equity. Note 3: Profit margin = Income after income tax ÷ Total net revenue. Note 4: Income before (after) income tax represents income YTD. Note5: The quarterly profitability of each quarter is converted to the annual benchmark figures
expressed in the annual rates.
45.5 Maturity analysis of assets and liabilities 45.5.1 The Bank
(1) In Thousands of New Taiwan Dollars
Total
September 30, 2019 by remaining period to maturity date
0 to 10 Days 11 to 30 Days 31 to 90 Days 91 to 180 Days 181 Days to 1 Year Over 1 Year
Major cash inflow at maturity $ 837,807,518 $ 89,648,318 $ 67,356,591 $ 54,084,436 $ 65,612,294 $ 127,916,527 $ 433,189,352 Major cash outflow at maturity 1,076,261,943 73,530,181 76,069,248 159,331,997 154,390,473 216,815,320 396,124,724 Gap (238,454,425) 16,118,137 (8,712,657) (105,247,561) (88,778,179) (88,898,793) 37,064,628

76
Total
December 31, 2018 by remaining period to maturity date
0 to 10 Days 11 to 30 Days 31 to 90 Days 91 to 180 Days 181 Days to 1 Year Over 1 Year
Major cash inflow at maturity $ 805,209,799 $ 59,741,653 $ 82,353,990 $ 73,963,411 $ 64,700,918 $ 120,714,817 $ 403,735,010 Major cash outflow at maturity 1,025,382,416 41,194,433 80,712,801 165,681,308 139,229,021 261,357,144 337,207,709 Gap (220,172,617) 18,547,220 1,641,189 (91,717,897) (74,528,103) (140,642,327) 66,527,301
Total
September 30, 2018 by remaining period to maturity date
0 to 10 Days 11 to 30 Days 31 to 90 Days 91 to 180 Days 181 Days to 1 Year Over 1 Year
Major cash inflow at maturity $ 810,898,867 $ 81,275,133 $ 98,638,281 $ 57,923,783 $ 79,027,582 $113,666,233 $ 380,367,855 Major cash outflow at maturity 1,012,414,604 47,128,113 96,732,587 169,698,449 148,136,445 224,751,706 325,967,304 Gap (201,515,737) 34,147,020 1,905,694 (111,774,666) (69,108,863) (111,085,473) 54,400,551
Note: This table includes only financial assets/liabilities denominated in the New Taiwan
dollars held by the head office and domestic branches.
(2) In Thousands of US dollars
Total
September 30, 2019 by remaining period to maturity date
0 to 30 Days 31 to 90 Days 91 to 180 Days 181 Days to 1 Year Over 1 Year Major cash inflow at maturity $ 10,792,731 $ 1,770,301 $ 1,358,511 $ 1,067,194 $ 670,083 $ 5,926,642 Major cash outflow at maturity 13,058,701 1,917,804 2,236,553 1,628,038 2,105,389 5,170,917 Gap (2,265,970) (147,503) (878,042) (560,844) (1,435,306) 755,725
Total
December 31, 2018 by remaining period to maturity date
0 to 30 Days 31 to 90 Days 91 to 180 Days 181 Days to 1 Year Over 1 Year Major cash inflow at maturity $ 19,753,818 $ 1,671,324 $ 888,960 $ 969,044 $ 5,444,378 $ 10,780,112 Major cash outflow at maturity 23,053,481 2,132,552 1,573,116 2,199,215 4,426,529 12,722,069 Gap (3,299,663) (461,228) (684,156) (1,230,171) 1,017,849 (1,941,957)
Total September 30, 2018
by remaining period to maturity date 0 to 30 Days 31 to 90 Days 91 to 180 Days 181 Days to 1 Year Over 1 Year
Major cash inflow at maturity $ 10,800,330 $ 1,658,520 $ 1,228,684 $ 1,123,515 $ 1,176,669 $ 5,612,942 Major cash outflow at maturity 12,247,343 2,093,762 1,732,404 1,568,646 2,384,441 4,468,090 Gap (1,447,013) (435,242) (503,720) (445,131) (1,207,772) 1,144,852
Note: This table includes only financial assets/liabilities denominated in the US dollars held
by the head office, branches and OBU.
45.5.2 SCB (HK)
In Thousands of US dollars
Total September 30, 2019
by remaining period to maturity date 0 to 30 Days 31 to 90 Days 91 to 180 Days 181 Days to 1 Year Over 1 Year
Major cash inflow at maturity $ 9,336,456 $ 2,036,156 $ 568,559 $ 570,164 $ 662,550 $ 5,499,027 Major cash outflow at maturity 8,684,963 4,479,555 1,970,484 944,109 740,439 550,376 Gap 651,493 (2,443,399) (1,401,925) (373,945) (77,889) 4,948,651
Total December 31, 2018
by remaining period to maturity date 0 to 30 Days 31 to 90 Days 91 to 180 Days 181 Days to 1 Year Over 1 Year
Major cash inflow at maturity $ 8,571,979 $ 1,999,315 $ 821,408 $ 593,124 $ 732,877 $ 4,425,255 Major cash outflow at maturity 7,706,111 4,478,987 1,778,223 680,776 512,287 255,838 Gap 865,868 (2,479,672) (956,815) (87,652) 220,590 4,169,417
Total September 30, 2018
by remaining period to maturity date 0 to 30 Days 31 to 90 Days 91 to 180 Days 181 Days to 1 Year Over 1 Year
Major cash inflow at maturity $ 7,917,241 $ 1,343,497 $ 799,689 $ 733,954 $ 776,864 $ 4,263,237 Major cash outflow at maturity 7,383,686 4,454,606 1,755,889 420,000 497,071 256,120 Gap 533,555 (3,111,109) (956,200) 313,954 279,793 4,007,117
Note: This table includes only financial assets/liabilities held by SCB.

77
46. THE CONTENTS AND AMOUNTS OF TRUST ACTIVITIES BY PROCESSING TRUST ENTERPRISE ACT The trust account balance sheets, income statements and the details of trust assets are as follows:
Balance Sheet of Trust Account
Trust Assets September 30,
2019 December 31,
2018 September 30,
2018 Trust Liabilities September 30,
2019 December 31,
2018 September 30,
2018 Bank deposit $ 3,406,979 $ 2,674,179 $ 2,646,116 Account payables $ 74 $ 196 $ 162 Short-term investments 82,060,487 81,749,855 81,128,019 Depository of security payable 58,993,617 57,599,477 48,385,379 Net asset value of collective Trust capital 110,417,497 106,676,741 100,272,592 investment trust fund 4,486,658 2,854,520 3,027,800 Accumulated loss and equity 254,468 (420) 4,634 Accounts receivable 21,797 1,966 16,005 Land 18,579,228 18,269,878 12,343,213 Buildings and improvement, net 213,561 210,482 233,257 Construction in progress 1,848,401 861,566 829,566 Depository of security 58,993,617 57,599,477 48,385,379 Other assets 54,928 54,071 53,412 Total trust assets $ 169,665,656 $ 164,275,994 $ 148,662,767 Total trust liabilities $ 169,665,656 $ 164,275,994 $ 148,662,767
Trust Asset Lists
Item September 30, 2019 December 31, 2018 September 30, 2018
Cash in banks $ 3,406,979 $ 2,674,179 $ 2,646,116 Short-term investment
Funds 61,745,069 60,062,308 60,419,494 Bonds 18,094,016 18,904,978 17,967,370 Common stocks 1,978,941 2,513,566 2,454,124 Preferred stock 2,782 - - Principals of structured instruments 239,679 269,003 287,031
Net asset value of collective trust accounts 4,486,658 2,854,520 3,027,800 Receivable 21,797 1,966 16,005 Land 18,579,228 18,269,878 12,343,213 Buildings and improvement, net 213,561 210,482 233,257 Construction in progress 1,848,401 861,566 829,566 Depository of securities 58,993,617 57,599,477 48,385,379 Other assets - principal deferred expense 54,928 54,071 53,412 Total $ 169,665,656 $ 164,275,994 $ 148,662,767
Income Statements of Trust Account
For the Nine Months Ended
September 30 2019 2018 Trust income
Interest revenue $ 10,121 $ 7,676 Common stock cash dividend income 110,240 120,941 Realized investment gains 5,767 2,601 Unrealized investment gains 270,096 131,606 Other revenue 871 2,904
397,095 265,728 Trust expenses
Tax expenditures 488 75,399 Management fees 2,290 2,477 Service fees 3,408 4,242 Realized investment losses 66 165 Unrealized investment losses 45,978 37,522 Other expenses 829 1,387
53,059 121,192 Income before income tax 344,036 144,536 Income tax expense - - Net income $ 344,036 $ 144,536

78
47. EXCHANGE RATE INFORMATION OF FOREIGN FINANCIAL ASSETS AND LIABILITIES
The information regarding financial assets/liabilities denominated in significant foreign currencies held by the Group was as follows: 47.1 The Bank
September 30, 2019 December 31, 2018 September 30, 2018
Foreign
Currencies Exchange
Rate New Taiwan
Dollars Foreign
Currencies Exchange
Rate New Taiwan
Dollars Foreign
Currencies Exchange
Rate New Taiwan
Dollars Finance assets Monetary items
Cash and cash equivalents JPY $ 19,406,194 0.2875 $ 5,579,281 $ 9,475,621 0.2776 $ 2,630,432 $ 23,432,279 0.2687 $ 6,296,253 USD 126,545 31.0260 3,926,185 86,998 30.7380 2,674,145 47,478 30.5000 1,448,079 EUR 61,295 33.9254 2,079,457 52,272 35.1889 1,839,394 45,346 35.5112 1,610,291
Due from the Central Bank and call loans to banks
USD 1,333,514 31.0260 41,373,605 611,964 30.7380 18,810,549 285,899 30.5000 8,719,920 CNY 1,832,600 4.3528 7,976,941 2,747,600 4.4748 12,294,960 2,526,750 4.4310 11,196,029 AUD 135,000 20.9844 2,832,894 79,000 21.6549 1,710,737 235,000 3.9019 916,947
Receivables USD 340,269 31.0260 10,557,186 379,719 30.7380 11,671,803 269,589 30.5000 8,222,465 ZAR 730,546 2.0494 1,497,181 1,103,239 2.1208 2,339,749 1,018,132 2.1615 2,200,692 NZD 53,498 19.4564 1,040,878 46,000 20.6283 948,902 46,055 20.1758 929,196
Discounts and loans USD 4,659,524 31.0260 144,566,392 4,747,030 30.7380 145,914,208 5,057,587 30.5000 154,256,404 HKD 4,999,199 3.9567 19,780,331 3,642,937 3.9238 14,294,156 3,988,219 3.9019 15,561,632 EUR 463,469 33.9254 15,723,371 249,512 35.1889 8,780,053 227,584 35.5112 8,081,781
Financial assets at FVTOCI USD 1,792,767 31.0260 55,622,389 1,695,157 30.7380 52,105,736 1,773,869 30.5000 54,103,005 CNY 1,463,941 4.3528 6,372,242 1,161,447 4.4748 5,197,243 1,181,930 4.4310 5,237,132 AUD 96,634 20.9844 2,027,807 125,471 21.6549 2,717,062 164,529 22.0073 3,620,839
Financial assets measured at amortized cost
SGD 66,654 22.4533 1,496,602 47,481 22.4398 1,065,464 42,599 22.3092 950,350 USD 45,347 31.026 1,406,936 49,602 30.7380 1,524,666 44,813 30.5000 1,366,797 CNY 15,004 4.3528 65,309 15,104 4.4748 67,587 60,143 4.4310 266,494
Financial assets at FVTPL USD 52,759 31.0260 1,636,901 59,055 30.7380 1,815,233 49,883 30.5000 1,521,432 EUR 2,047 33.9254 69,445 1,525 35.1889 53,663 1,254 35.5112 44,531 HKD 3,042 3.9567 12,036 1,564 3.9238 6,137 5,719 3.9019 22,315 Non-monetary items
Equity investments under the equity method
USD 2,291,203 31.0260 71,086,864 2,208,320 30.7380 67,879,340 2,175,284 30.5000 66,346,162 HKD 77,441 3.9567 306,411 74,718 3.9238 293,178 73,555 3.9019 287,004 Other financial assets CNY 1,300,000 4.3528 5,658,640 550,000 4.4748 2,461,140 - - - Financial liabilities Monetary items
Payables USD 127,603 31.0260 3,959,011 252,902 30.7380 7,773,702 261,225 30.5000 7,967,363 JPY 1,126,782 0.2875 323,950 3,991,755 0.2776 1,108,111 3,921,644 0.2687 1,053,746 EUR 3,989 33.9254 135,328 55,700 35.1889 1,960,022 66,007 35.5112 2,343,988
Central Bank and interbank deposits
USD 375,378 31.0260 11,646,478 418,733 30.7380 12,871,015 394,945 30.5000 12,045,823 HKD 2,330,000 3.9567 9,219,111 306,003 3.9238 1,200,695 28,168 3.9019 109,909 EUR 38,000 33.9254 1,289,165 13 35.1889 457 274 35.5112 9,730
Deposits and remittances USD 7,613,494 31.0260 236,216,265 7,066,331 30.7380 217,204,882 7,007,564 30.5000 213,730,702 CNY 5,299,188 4.3528 23,066,306 5,712,780 4.4748 25,563,548 5,877,391 4.4881 26,378,319 EUR 490,579 33.9254 16,643,089 328,192 35.1889 11,548,715 326,238 35.5112 11,585,103
Financial liabilities at FVTPL USD 87,776 31.0260 2,723,338 79,475 30.7380 2,442,903 4,887 30.5000 149,054 EUR 627 33.9254 21,271 373 35.1889 13,125 106 35.5112 3,764 JPY 2,165 0.2875 622 2,446 0.2776 679 2,816 0.2687 757

79
47.2 SCB (HK)
September 30, 2019 December 31, 2018 September 30, 2018
Foreign
Currencies Exchange
Rate New Taiwan
Dollars Foreign
Currencies Exchange
Rate New Taiwan
Dollars Foreign
Currencies Exchange
Rate New Taiwan
Dollars Finance assets Monetary items
Cash and cash equivalents CNY $ 1,741,601 4.3528 $ 7,580,841 $ 870,680 4.4748 $ 3,896,119 $ 925,545 4.4310 $ 4,101,090 EUR 84,670 33.9254 2,872,464 110,618 35.1889 3,892,526 70,743 35.5112 2,512,169 USD 33,147 31.0260 1,028,419 465,724 30.7380 14,315,424 18,601 30.5000 567,331
Due from the Central Bank and call loans to banks
USD 1,689,403 31.0260 52,415,417 1,542,648 30.7380 47,417,914 1,559,708 30.5000 47,571,094 CNY 4,661,833 4.3528 20,292,027 2,469,584 4.4748 11,050,894 3,522,952 4.4310 15,610,200
Receivables USD 79,814 31.0260 2,476,309 39,349 30.7380 1,209,510 126,819 30.5000 3,867,980 CNY - - - 16,245 4.4748 72,693 - - -
Discounts and loans USD 4,078,925 31.0260 126,552,727 3,727,568 30.7380 114,577,985 3,631,187 30.5000 110,751,204 CNY 4,991,013 4.3528 21,724,881 4,336,849 4.4748 19,406,532 3,837,022 4.4310 17,001,844 Non-monetary items
Forward exchange contract CNY 110,827 4.3528 482,408 190,678 4.4748 853,246 309,274 4.4310 1,370,393 NZD 10,570 19.4564 205,654 490 20.6283 10,108 542 20.1758 10,935 GBP 5,031 38.1341 191,853 1,047 38.8989 40,727 161 39.8986 6,424 Financial liabilities Monetary items
Payables USD 83,430 31.0260 2,588,499 39,761 30.7380 1,222,174 128,673 30.5000 3,924,527 CNY 17,506 4.3528 76,200 5,799 4.4748 25,949 39,681 4.4310 175,827
Central Bank and interbank deposits
USD 662,786 31.0260 20,563,598 668,415 30.7380 20,545,740 704,593 30.5000 21,490,087 CNY 3,570,005 4.3528 15,539,518 2,001,865 4.4748 8,957,946 2,635,359 4.4310 11,677,276 GBP 267,670 38.1341 10,207,355 176,508 38.8989 6,865,967 114,063 39.8986 4,550,954
Deposits and remittances USD 7,346,834 31.0260 227,942,872 6,719,250 30.7380 206,536,307 6,318,666 30.5000 192,719,313 CNY 11,793,544 4.3528 51,334,938 11,672,250 4.4748 52,230,984 11,766,376 4.4310 52,136,812 Non-monetary items
Forward exchange contract CNY 123,561 4.3528 537,836 188,464 4.4748 843,339 314,188 4.4310 1,392,167 USD 7,136 31.0260 221,402 9,286 30.7380 285,433 11,084 30.5000 338,062 NZD 10,151 19.4564 197,502 302 20.6283 6,230 424 20.1758 8,555
48. OTHERS
The Bank merged SCSB Life Insurance Agency and SCSB Property Insurance Agency on May 6, 2019. Since the SCSB Life Insurance Agency and SCSB Property Insurance Agency are all 100% owned by the Bank, according to the IFRS question and answer set published by the Accounting Research and Development Foundation, the "Issues for the treatment of corporate mergers under the joint control of IFRS 3", as the IFRS 3 “Business Combination” does not clearly stipulate the business combination under common control, the relevant interpretation letter issued by Republic of China should still be applied.
The merger of SCSB Life Insurance Agency and SCSB Property Insurance Agency was organized by the
organization. According to the relevant interpretation letter issued by the Accounting Research and Development Foundation, when the Bank merged with SCSB Life Insurance Agency and SCSB Property Insurance Agency, it should account for the book value of all assets and liabilities, and prepared the consolidated balance sheet accordingly. When preparing comparative financial statements, it should be considered that the previous comparative financial statements have been consolidated and recompiled from the outset. The Bank's consolidated net assets of SCSB Life Insurance Agency and SCSB Property Insurance Agency amounted to the total of $169,729 thousand.
49. ADDITIONAL DISCLOSURES
Information of significant transaction items 49.1 and other business investment 49.2 is as follows: 49.1.1 Financing provided: The Bank - not applicable; investees - Table 2.
49.1.2 Endorsement/guarantee provided: The Bank - not applicable; investees - not applicable or none.

80
49.1.3 Marketable securities held: The Bank - not applicable; investees - Table 3.
49.1.4 Marketable securities (for investees) or investee investment (for the Bank) acquired and
disposed of, at costs or prices of at least NT$300 million or 10% of the issued capital: The Bank - not applicable; investees - Table 4.
49.1.5 Acquisition of individual real estate at costs of at least $300 million or 10% of the issued capital:
None.
49.1.6 Disposal of individual real estate at prices of at least $300 million or 10% of the issued capital: None.
49.1.7 Allowance for service fees to related-parties amounting to more than $5 million: None.
49.1.8 Receivables from related parties amounting to at least $300 million or 10% of the issued capital:
None.
49.1.9 Sale of non-performing loans: None.
49.1.10 Application for approval of securitization product types and information according to Financial Asset Securitization Clause of the Real State Securitization Act: None.
49.1.11 Other significant transactions which may have effects on decision making of financial statement
users: None. 49.1.12 Names, locations, and other information of investees on which the Bank exercises significant
influence: The Bank - not applicable. 49.1.13 Derivative financial transactions: Note 8 on which the Bank exercises significant influence has
no such transactions.
49.3 Investments in mainland China:
49.3.1 Name of the investees in mainland China, main businesses and products, paid-in capital, method of investment, information on inflow or outflow of capital, percentage of ownership, investment income or loss, ending balance of investment, dividends remitted by the investee, and the limit of investment in mainland China: Table 5.
49.3.2 Significant direct or indirect transactions with the investees, prices and terms of payment,
unrealized gain or loss: None. 49.4 Significant transactions and the amount among the parent and its subsidiaries: Table 6.

81
50. SEGMENT INFORMATION Information reported to the chief operating decision makers focuses on the major geographical areas and profit or loss of the segments. The Group’s segments mainly operate in Taiwan and Hong Kong. The Group provides income before tax of each operating segment to the chief operating decision makers as the basis of resource allocation and assessment of segment performance. The significant accounting policies of each operating segment are in line with the Group’s significant accounting policies stated in Note 4. The operating segments information is as follows:
For the Nine Months Ended September 30, 2019
Taiwan Hong Kong Others Other
Adjustments Total Net interest $ 9,665,109 $11,868,060 $ 733,742 $ 2 $22,266,913 Net revenue other than from
interest 3,754,284 4,856,793 700,185 (48,517) 9,262,745 Net revenue 13,419,393 16,724,853 1,433,927 (48,515) 31,529,658 Bad debt expenses and
reserve for possible losses on guarantees (452,106) (240,559) (160,040) - (852,705)
Operating expenses (5,783,376) (4,936,624) (960,825) (24,641) (11,705,466) Profit before income tax $ 7,183,911 $11,547,670 $ 313,062 $ (73,156) $18,971,487
For the Nine Months Ended September 30, 2018
Taiwan Hong Kong Others Other
Adjustments Total Net interest $ 9,506,738 $10,297,067 $ 330,649 $ - $20,134,454 Net revenue other than from
interest 3,013,457 4,177,461 240,075 (47,083) 7,383,910 Net revenue 12,520,195 14,474,528 570,724 (47,083) 27,518,364 Bad debt expenses and
reserve for possible losses on guarantees (450,000) (55,225) (12,285) - (517,510)
Operating expenses (5,187,490) (4,500,203) (232,340) 2,200 (9,917,833) Profit before income tax $ 6,882,705 $ 9,919,100 $ 326,099 $ (44,883) $17,083,021
The Group did not periodically provide all information of assets of each operating segment to the operating decision maker, thus the measurement of assets was zero. Main operating clients The Group’s revenue from any single external client did not exceed 10% of the total revenue, thus main operating clients were not disclosed.

82
TABLE 1
THE SHANGHAI COMMERCIAL & SAVINGS BANK, LTD. AND SUBSIDIARIES
OVERDUE LOANS AND RECEIVABLES
SEPTEMBER 30, 2019, DECEMBER 31, 2018 AND SEPTEMBER 30 , 2018 (In Thousands of New Taiwan Dollars, %)
Date September 30, 2019 December 31, 2018 September 30, 2018
Business Non-performing
Loans (Note 1)
Loans Ratio of
Non-performing Loans (Note 2)
Allowance for Possible Losses
Coverage Ratio (Note 3)
Non-performing Loans
(Note 1) Loans
Ratio of Non-performing Loans (Note 2)
Allowance for Possible Losses
Coverage Ratio (Note 3)
Non-performing Loans
(Note 1) Loans
Ratio of Non-performing Loans (Note 2)
Allowance for Possible Losses
Coverage Ratio (Note 3)
Corporate banking
Secured 513,201 253,026,107 0.20 2,970,059 578.73 554,999 239,654,163 0.23 2,981,948 537.29 651,540 236,447,895 0.28 3,029,222 464.93 Unsecured 269,482 191,988,915 0.14 2,150,828 798.13 339,234 183,056,416 0.19 2,188,385 645.10 283,076 184,805,150 0.15 2,136,863 754.87
Consumer banking
Housing mortgages (Note 4) 560,021 149,638,978 0.37 2,721,707 486.00 521,811 138,622,287 0.38 2,627,125 503.46 528,077 134,597,221 0.39 2,555,096 483.85 Cash cards - - - - - - - - - - - - - - - Small scale credit loans (Note 5) 4,645 646,173 0.72 10,442 224.80 5,817 564,768 1.03 11,783 202.56 6,058 541,064 1.12 11,592 191.35
Others (Note 6) Secured 447,872 132,919,152 0.34 1,713,005 382.48 327,497 122,458,132 0.27 1,570,020 479.40 303,605 119,293,756 0.25 1,502,695 494.95 Unsecured 3,270 7,589,926 0.04 78,702 2,406.79 4,812 7,168,475 0.07 76,760 1,595.18 4,431 7,100,048 0.06 75,521 1,704.38
Total 1,798,491 735,809,251 0.24 9,644,743 536.27 1,754,170 691,524,241 0.25 9,456,021 539,06 1,776,787 682,785,134 0.26 9,310,989 524.04
Non-performing
Receivables (Note 1)
Accounts Receivable
Ratio of Non-performing
Receivables (Note 2)
Allowance for Possible Losses
Coverage Ratio (Note 3)
Non-performing Receivables
(Note 1)
Accounts Receivable
Ratio of Non-performing
Receivables (Note 2)
Allowance for Possible Losses
Coverage Ratio (Note 3)
Non-performing Receivables
(Note 1)
Accounts Receivable
Ratio of Non-performing
Receivables (Note 2)
Allowance for Possible Losses
Coverage Ratio (Note 3)
Credit cards 13,173 2,397,243 0.55 92,292 700.61 10,293 2,008,135 0.51 86,839 843.67 13,162 2,041,536 0.64 86,730 658.94 Accounts receivable factored without recourse
(Note 7) - 992,213 - 9,922 - - 811,314 - 8,113 - - 905,190 - 9,052 - Note 1: Non-performing loans represent the amounts of non-performing loans reported to the authorities and disclosed to the public, as required by the “Regulations Governing the Procedures for Banking Institutions to Evaluate Assets and Deal with Non-performing/Non-accrued Loans.” Non-performing credit card receivables represent the amounts of non-performing receivables reported to the authorities and disclosed to the public, as required by the Banking Bureau’s letter dated July 6, 2005 (Ref. No. 0944000378). Note 2: Ratio of non-performing loans: Non-performing loans ÷ Outstanding loan balance. Ratio of non-performing credit cards receivables: Non-performing credit cards receivables ÷ Outstanding credit cards receivables balance. Note 3: Coverage ratio of loans: Allowance for possible losses on loans ÷ Non-performing loans. Coverage ratio of credit cards receivable: Allowance for possible losses on credit cards receivable ÷ Non-performing credit cards receivable. Note 4: Housing mortgage is fully secured by property, which is purchased (owned) by the borrower, the spouse or the minor children of the borrower and the rights on mortgage are pledged to the financial institution, for the purpose of purchasing or decorating property. Note 5: Small scale credit loans, as categorized in accordance with the Banking Bureau’s letter dated December 19, 2005 (Ref. No. 09440010950), are unsecured loans with small amounts exclusive of credit cards and cash cards. Note 6: Other loans of consumer banking refer to secured or unsecured loans exclusive of housing mortgage, cash card, small scale credit loans and credit card. Note 7: As required by the Banking Bureau’s letter dated July 19, 2005 (Ref. No. 0945000494), factoring without recourse is disclosed as non-performing receivables in three months after the factors or insurance companies reject indemnification.

83
TABLE 1-1
THE SHANGHAI COMMERCIAL & SAVINGS BANK, LTD. AND SUBSIDIARIES
OVERDUE LOANS AND RECEIVABLES SEPTEMBER 30, 2019, DECEMBER 31, 2018 AND SEPTEMBER 30, 2018
(In Thousands of New Taiwan Dollars)
September 30, 2019 December 31, 2018 September 30, 2018
Excluded NPL Excluded Overdue Receivables Excluded NPL Excluded Overdue
Receivables Excluded NPL Excluded Overdue Receivables
As a result of debt consultation and loan agreements (Note 1) - - - - - -
As a result of consumer debt clearance (Note 2) - 35,197 - 35,447 - 35,296 Note 1: The disclosure of excluded NPLs and excluded overdue receivables resulting from debt consultation and loan agreements is based on the Banking Bureau’s letter dated April 25, 2006 (Ref. No. 09510001270). Note 2: The disclosure of excluded NPLs and excluded overdue receivables resulting from consumer debt clearance is based on the Banking Bureau’s letter dated September 15, 2008 (Ref. No. 09700318940) and September 20, 2016 (Ref. No.
10500134790).

84
TABLE 2 THE SHANGHAI COMMERCIAL & SAVINGS BANK, LTD. AND SUBSIDIARIES
LOANS AND OTHER INFORMATION
SEPTEMBER 30, 2019 (In Thousands of New Taiwan Dollars)
Information of Lenders, Borrowers and Others
No (Note 1) Lender Borrower Corresponding
Account Related Parties
The Highest Period
Balance
Ending Balance
Actual Amount
Interest Rate Range
Capital Loan
(Note 2)
Business Dealing Amount
Reasons of Short-term Financing
Allowance
Collateral Individual Fund Loan and Limit (Note 3)
Total Loan Limit
(Note 3) Name Value
1 SCSB Leasing (China) Co., Ltd. A Co., Ltd. Entrusted loan
receivables N/A $ 108,820 $ 95,762 $ 95,762 6%~11% 1 $ 95,762 - $ 1,915 Real estate $ 186,909 $ 363,755 $ 909,388
1 SCSB Leasing (China) Co., Ltd. B Co., Ltd. Entrusted loan receivables
N/A 108,820 97,938 97,938 6%~11% 1 97,938 - 1,959 Real estate 262,474 363,755 909,388
1 SCSB Leasing (China) Co., Ltd. C Co., Ltd. Entrusted loan receivables
N/A 156,701 156,701 156,701 6%~11% 2 - Operation turnovers
3,134 Real estate 211,111 181,878 363,755
Note 1: The numbers refer to the following:
(1) Issuer is 0. (2) Investees are numbered sequentially starting from 1.
Note 2: The nature of capital loans correspond to the following values:
(1) 1 for business dealing. (2) 2 for reasons of short-term financing facility.
Note 3: The amounts and calculation of the loan limit are as follows:
1. Individual fund loans and limits
(1) For an enterprise or organization that has no business relationship with the lender but has short-term financing facility, the loan amount to the single enterprise or organization shall not exceed 40% of the net value as presented in the latest financial statements of the lender as audited by the accountant.
(2) For an enterprise or organization that has no business dealings with the lender but has short-term financing facility, the loan amount to the single enterprise or organization shall not exceed 20% of the net value as presented in the
latest financial statements of the lender as audited by the accountant.
2. Capital loans and total loan limits
(1) For an enterprise or organization that has no business dealings with the lender but has short-term financing facility, the total accumulated loan balance of the single enterprise or organization shall not exceed twice the net value as presented in the latest financial statements of the lender as audited by the accountant.
(2) For an enterprise or organization that has no business dealings with the lender but has short-term financing facility, the total accumulated loan balance of the single enterprise or organization shall not exceed 40% of the net value
as presented in the latest financial statements of the lender as audited by the accountant.
The total accumulated loan balance of the above two parties shall not exceed twice the net value as presented in the latest financial statements of the lender as audited by the accountant.

85
TABLE 3 THE SHANGHAI COMMERCIAL & SAVINGS BANK, LTD. AND SUBSIDIARIES
MARKETABLE SECURITIES HELD
SEPTEMBER 30, 2019 (Amounts in Thousands of New Taiwan Dollars)
Holding Company Name Name Security Issuer’s Relationship with Holding Company
Financial Statement Account
September 30, 2019
Note Shares (In Thousands)
Carrying Amount (Note 1)
Percentage of Ownership (%)
Market Value or Net Asset
Value Shancom Reconstruction Inc. Empresa Inversiones Generales, S.A. Indirect subsidiary Investments in subsidiaries 1 $ 1,781,127 100.00 $ 1,781,127 Note1 Krinein Company Indirect subsidiary Investments in subsidiaries 2 519,341 100.00 519,341 Note1 Safehaven Investment Corporation Indirect subsidiary Investments in subsidiaries 1 49,904 100.00 49,904 Note1 Wresqueue Limitada Prosperity Realty Inc. Indirect subsidiary Investments in subsidiaries 4 18,555 100.00 18,555 Note1 China Travel Service (Taiwan) Silks Place Taroko - Equity investments under the equity method 20,372 231,064 45.00 231,064 Note1 CTS Travel International Ltd. Indirect subsidiary Investments in subsidiaries 600 7,003 100.00 7,003 Note1 Joy Tour Service Co., Ltd. - Financial assets measured at FVTOCI 100 1,000 10.00 1,000 Note1 Shanghai Commercial & Savings Bank, Ltd. The Bank Financial assets measured at FVTOCI 27 1,449 - 1,449 Note1 SCSB Asset Management Ltd. SCSB Leasing (China) Co., Ltd. Indirect subsidiary Investments in subsidiaries N/A 942,252 100.00 942,252 Note1 Krinein Company Shanghai Commercial Bank (HK) Indirect subsidiary Investments in subsidiaries 1,920 11,318,128 9.60 11,318,128 Note1 Empresa Inversiones Generales, S.A. Shanghai Commercial Bank (HK) Indirect subsidiary Investments in subsidiaries 9,600 56,590,640 48.00 56,590,640 Note1 Note1: A consolidated entity; the related intercompany transaction was eliminated in the consolidated financial statements.

86
TABLE 4
THE SHANGHAI COMMERCIAL & SAVINGS BANK, LTD. AND SUBSIDIARIES
MARKETABLE SECURITIES (FOR INVESTEES) OR INVESTEE INVESTMENT (FOR THE BANK) ACQUIRED AND DISPOSED OF, AT COSTS OR PRICES OF AT LEAST NT$300 MILLION OR 10% OF THE ISSUED CAPITAL SEPTEMBER 30, 2019
(Amounts in Thousands of New Taiwan Dollars and United States Dollars)
Trading company Name Financial Statement Account
Counterparty Relationship
Beginning Buy Sell Ending
Shares Amount Shares Amount Shares Price Book Value
Disposal of Profit and Loss
Shares
Amount
The Shanghai
Commercial & Savings Bank, Ltd.
AMK Microfinance Institution Plc.
Equity investments under the equity method
- None 3,850,954 $2,515,083 US$81,399
(Note 1 and Note3)
1,553,906 $ 475,065 US$15,300
(Note 2)
- $ - $ - $ - 5,404,860 $2,990,148 US$96,699
(Note 1 and Note 3)
Note 1: It included an acquisition cost of $2,457,470 thousand (US$80,103 thousand), share of the subsidiaries’ interests accounted for using the equity method of $42,059 thousand (US$1,296 thousand) and net increase of $15,554 thousand in owner's other equity attributable to the parent company.
Note 2:The issuance of ordinary shares for capital increase by cash amounting to $475,065 thousand. Note 3:When preparing the consolidated financial statements, it had been fully written off.

87
TABLE 5
THE SHANGHAI COMMERCIAL & SAVINGS BANK, LTD. AND SUBSIDIARIES
INVESTMENT IN MAINLAND CHINA SEPTEMBER 30, 2019
(Amounts in Thousands of New Taiwan Dollars and United States Dollars) 1. Investee company name, main business and products, total amount of paid-in capital, investment type, investment outflows and inflows, % ownership, investment gain (loss), carrying amount as of September 30, 2019 and inward remittance of earnings:
Investee Company Name Main Businesses and Products Total Amount of Paid-in Capital
Investment Type (Note 1)
Accumulated Outflow of
Investment as of December 31,
2018
Investment Flows Accumulated Outflow of
Investment as of September 30,
2019
% Ownership of Direct or Indirect
Investment
Investment Gain (Loss) (Note 2)
Carrying Amount as of September 30,
2019 (Note 3)
Accumulated Inward
Remittance of Earnings as of December 31,
2019
Outflow Inflow
SCSB Leasing (China) Co., Ltd. Leasing operation US$ 30,000 c US$ 30,000 US$ - US$ - US$ 30,000 100% $ 33,957
US$ 1,094 $ 942,252 US$ 30,370
$ -
Bank of Shanghai Banking business approved by local
government US$ 1,993,108 Note 4
US$ 112,743 US$ - US$ - US$ 112,743 3% -
US$ - 17,347,088 US$ 559,115
-
Shanghai Commercial Bank Ltd. - Shenzhen Branch Banking business approved by local
government US$ 98,431 Note 4
US$ 63,893 US$ - US$ - US$ 63,893 100% 266,917
US$ 8,610 2,917,292 US$ 94,027
-
Shanghai Commercial Bank Ltd. - Shanghai Branch Banking business approved by local
government US$ 107,680 Note 4
US$ 64,717 US$ - US$ - US$ 64,717 100% 97,266
US$ 3,137 3,457,627 US$ 111,443
-
2. Upper limit on investments in mainland China:
Accumulated Investment in Mainland China as of September 30, 2019 (Note 3)
Investment Amounts Authorized by Investment Commission, MOEA (Note 3)
Upper Limit on Investment Authorized by Investment Commission MOEA
$8,418,998 (US$271,353) $8,658,085 (US$279,059) $116,667,035
Note 1: Methods of investment in mainland China are listed below:
(a) Directly invest. (b) Invest indirectly via a third company. (c) Others.
Note 2: It should be specified from financial report audited by international accounting firm associated with accounting firm in the ROC. Note 3: Calculated using the exchange rate on September 30, 2019. Note 4: To invest via sub-subsidiary of the Bank, “Shanghai Commercial Bank (HK)”.

88
TABLE 6-1 THE SHANGHAI COMMERCIAL & SAVINGS BANK, LTD. AND SUBSIDIARIES
INTERCOMPANY RELATIONSHIPS AND SIGNIFICANT INTERCOMPANY TRANSACTIONS
FOR THE NINE MONTHS ENDED SEPTEMBER 30, 2019 (Amounts in Thousands of New Taiwan Dollars)
No. Company Name Counterparty Nature of Relationship
Intercompany Transaction
Financial Statement Item Amount Term
Percentage of Consolidated
Total Gross Sales or Total Assets
(Note 3) 0 The Shanghai Commercial & SCSB Asset Management Ltd. From parent company to subsidiary Accounts payable $ 107 Note 4 - Savings Bank, Ltd. SCSB Asset Management Ltd. From parent company to subsidiary Deposits and remittances 556,914 Note 4 - SCSB Asset Management Ltd. From parent company to subsidiary Other liabilities 47 Note 4 - SCSB Asset Management Ltd. From parent company to subsidiary Interest expenses 9,420 Note 4 - SCSB Asset Management Ltd. From parent company to subsidiary Net revenue other than from interest 127 Note 4 - SCSB Marketing From parent company to subsidiary Accounts payable 6 Note 4 - SCSB Marketing From parent company to subsidiary Deposits and remittances 16,241 Note 4 - SCSB Marketing From parent company to subsidiary Other liabilities 20 Note 4 - SCSB Marketing From parent company to subsidiary Interest expenses 57 Note 4 - SCSB Marketing From parent company to subsidiary Net revenue other than from interest 63 Note 4 - SCSB Marketing From parent company to subsidiary Other general and administrative 60,237 Note 4 - China Travel Service (Taiwan) From parent company to subsidiary Accounts payable 147 Note 4 - China Travel Service (Taiwan) From parent company to subsidiary Deposits and remittances 76,391 Note 4 - China Travel Service (Taiwan) From parent company to subsidiary Other liabilities 180 Note 4 - China Travel Service (Taiwan) From parent company to subsidiary Interest expenses 419 Note 4 - China Travel Service (Taiwan) From parent company to subsidiary Net revenue other than from interest 554 Note 4 - China Travel Service (Taiwan) From parent company to subsidiary Other general and administrative expenses 858 Note 4 - CTS Travel International Ltd. From parent company to subsidiary Accounts payable 47 Note 4 - CTS Travel International Ltd. From parent company to subsidiary Deposits and remittances 7,365 Note 4 - CTS Travel International Ltd. From parent company to subsidiary Interest expenses 44 Note 4 - Shancom Reconstruction Inc. From parent company to subsidiary Cash and cash equivalents 134,499 Note 4 - Shancom Reconstruction Inc. From parent company to subsidiary Accounts payable 1,390 Note 4 -
Shancom Reconstruction Inc. From parent company to subsidiary Deposits and remittances 1,489,083 Note 4 - Shancom Reconstruction Inc. From parent company to subsidiary Deposits and remittances 87 Note 4 - Shancom Reconstruction Inc. From parent company to subsidiary Interest expenses 32,386 Note 4 -
1 SCSB Asset Management Ltd. The Shanghai Commercial & Savings Bank, Ltd. From subsidiary to parent company Cash and cash equivalents 556,914 Note 4 - The Shanghai Commercial & Savings Bank, Ltd. From subsidiary to parent company Accounts receivable 107 Note 4 - The Shanghai Commercial & Savings Bank, Ltd. From subsidiary to parent company Other assets 47 Note 4 - The Shanghai Commercial & Savings Bank, Ltd. From subsidiary to parent company Interest revenue 9,420 Note 4 - The Shanghai Commercial & Savings Bank, Ltd. From subsidiary to parent company Right-of-use assets 57 Note 4 - The Shanghai Commercial & Savings Bank, Ltd. From subsidiary to parent company Lease liabilities 57 Note 4 - The Shanghai Commercial & Savings Bank, Ltd. From subsidiary to parent company Depreciation expense 127 Note 4 -
2 SCSB Marketing The Shanghai Commercial & Savings Bank, Ltd. From subsidiary to parent company Cash and cash equivalents 16,241 Note 4 - The Shanghai Commercial & Savings Bank, Ltd. From subsidiary to parent company Accounts receivable 6 Note 4 - The Shanghai Commercial & Savings Bank, Ltd. From subsidiary to parent company Other assets 20 Note 4 - The Shanghai Commercial & Savings Bank, Ltd. From subsidiary to parent company Interest revenue 57 Note 4 - The Shanghai Commercial & Savings Bank, Ltd. From subsidiary to parent company Net revenue other than from interest 60,237 Note 4 - The Shanghai Commercial & Savings Bank, Ltd. From subsidiary to parent company Right-of-use assets 133 Note 4 - The Shanghai Commercial & Savings Bank, Ltd. From subsidiary to parent company Lease liabilities 133 Note 4 -
(Continued)
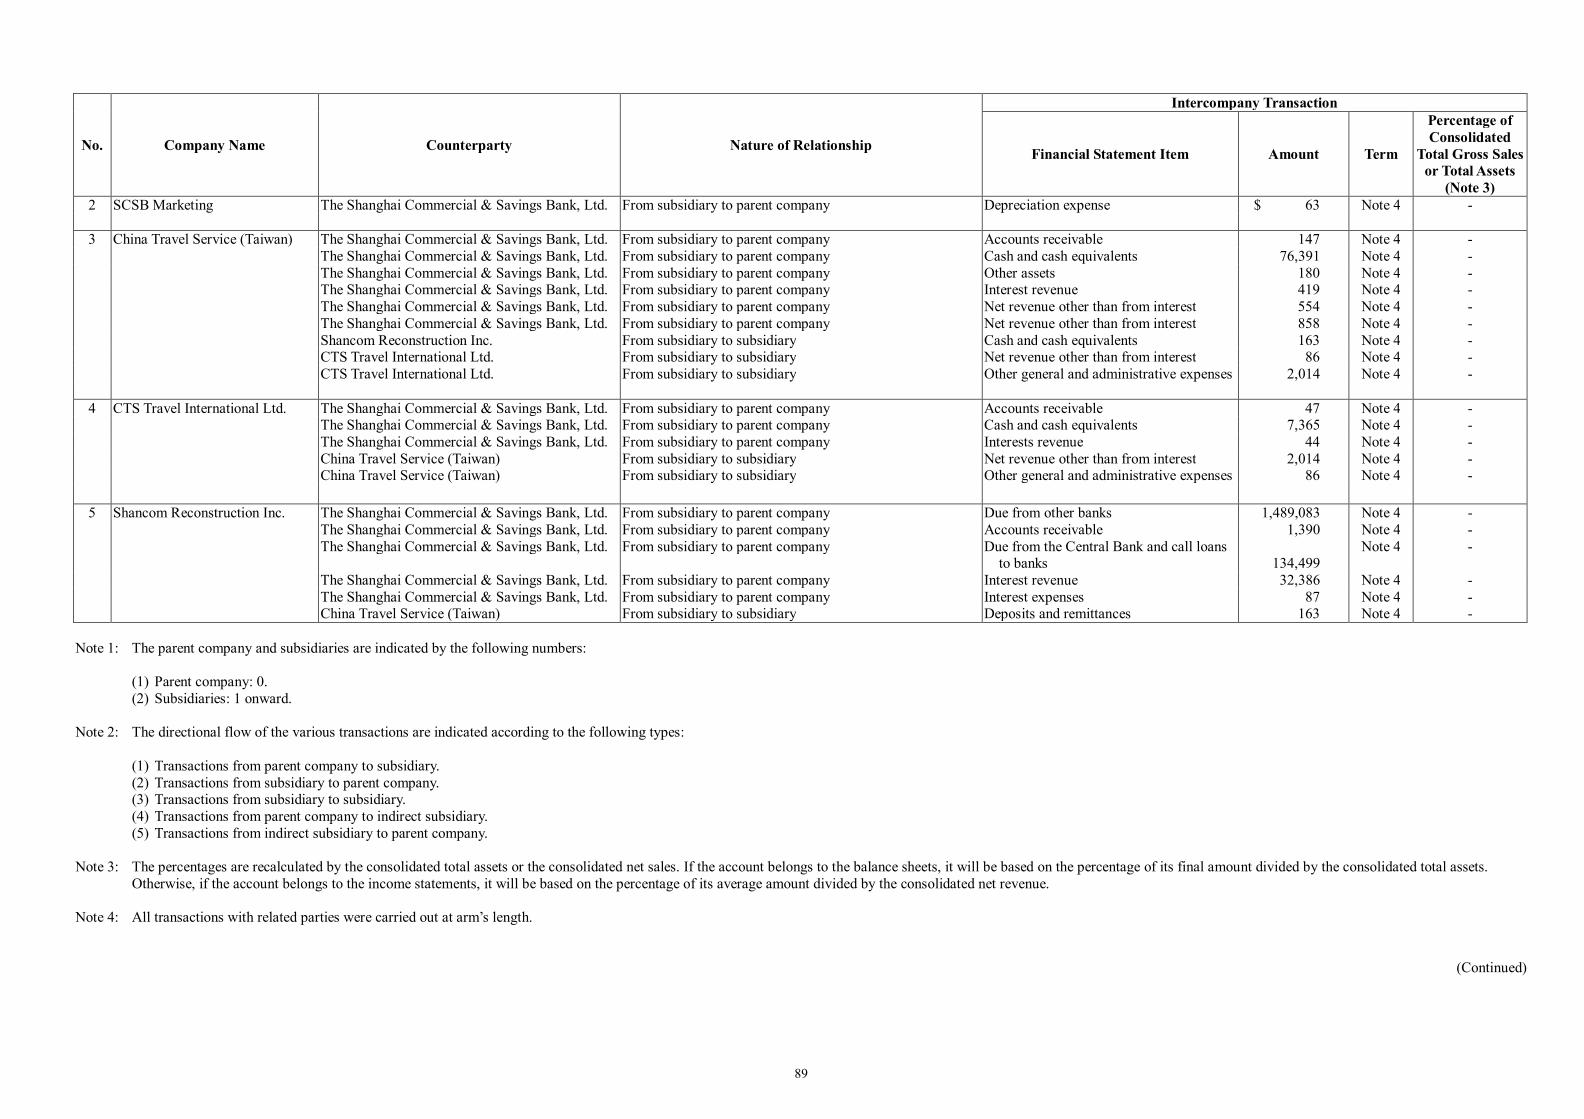
89
No. Company Name Counterparty Nature of Relationship
Intercompany Transaction
Financial Statement Item Amount Term
Percentage of Consolidated
Total Gross Sales or Total Assets
(Note 3) 2 SCSB Marketing The Shanghai Commercial & Savings Bank, Ltd. From subsidiary to parent company Depreciation expense $ 63 Note 4 -
3 China Travel Service (Taiwan) The Shanghai Commercial & Savings Bank, Ltd. From subsidiary to parent company Accounts receivable 147 Note 4 - The Shanghai Commercial & Savings Bank, Ltd. From subsidiary to parent company Cash and cash equivalents 76,391 Note 4 - The Shanghai Commercial & Savings Bank, Ltd. From subsidiary to parent company Other assets 180 Note 4 - The Shanghai Commercial & Savings Bank, Ltd. From subsidiary to parent company Interest revenue 419 Note 4 - The Shanghai Commercial & Savings Bank, Ltd. From subsidiary to parent company Net revenue other than from interest 554 Note 4 - The Shanghai Commercial & Savings Bank, Ltd. From subsidiary to parent company Net revenue other than from interest 858 Note 4 - Shancom Reconstruction Inc. From subsidiary to subsidiary Cash and cash equivalents 163 Note 4 - CTS Travel International Ltd. From subsidiary to subsidiary Net revenue other than from interest 86 Note 4 - CTS Travel International Ltd. From subsidiary to subsidiary Other general and administrative expenses 2,014 Note 4 -
4 CTS Travel International Ltd. The Shanghai Commercial & Savings Bank, Ltd. From subsidiary to parent company Accounts receivable 47 Note 4 - The Shanghai Commercial & Savings Bank, Ltd. From subsidiary to parent company Cash and cash equivalents 7,365 Note 4 - The Shanghai Commercial & Savings Bank, Ltd. From subsidiary to parent company Interests revenue 44 Note 4 - China Travel Service (Taiwan) From subsidiary to subsidiary Net revenue other than from interest 2,014 Note 4 - China Travel Service (Taiwan) From subsidiary to subsidiary Other general and administrative expenses 86 Note 4 -
5 Shancom Reconstruction Inc. The Shanghai Commercial & Savings Bank, Ltd. From subsidiary to parent company Due from other banks 1,489,083 Note 4 - The Shanghai Commercial & Savings Bank, Ltd. From subsidiary to parent company Accounts receivable 1,390 Note 4 - The Shanghai Commercial & Savings Bank, Ltd. From subsidiary to parent company Due from the Central Bank and call loans
to banks 134,499 Note 4 -
The Shanghai Commercial & Savings Bank, Ltd. From subsidiary to parent company Interest revenue 32,386 Note 4 - The Shanghai Commercial & Savings Bank, Ltd. From subsidiary to parent company Interest expenses 87 Note 4 - China Travel Service (Taiwan) From subsidiary to subsidiary Deposits and remittances 163 Note 4 -
Note 1: The parent company and subsidiaries are indicated by the following numbers:
(1) Parent company: 0. (2) Subsidiaries: 1 onward.
Note 2: The directional flow of the various transactions are indicated according to the following types:
(1) Transactions from parent company to subsidiary. (2) Transactions from subsidiary to parent company. (3) Transactions from subsidiary to subsidiary. (4) Transactions from parent company to indirect subsidiary. (5) Transactions from indirect subsidiary to parent company.
Note 3: The percentages are recalculated by the consolidated total assets or the consolidated net sales. If the account belongs to the balance sheets, it will be based on the percentage of its final amount divided by the consolidated total assets.
Otherwise, if the account belongs to the income statements, it will be based on the percentage of its average amount divided by the consolidated net revenue. Note 4: All transactions with related parties were carried out at arm’s length.
(Continued)

90
TABLE 6-2
THE SHANGHAI COMMERCIAL & SAVINGS BANK, LTD. AND SUBSIDIARIES
INTERCOMPANY RELATIONSHIPS AND SIGNIFICANT INTERCOMPANY TRANSACTIONS FOR THE NINE MONTHS ENDED SEPTEMBER 30, 2018
(Amounts in Thousands of New Taiwan Dollars)
No. Company Name Counterparty Nature of Relationship
Intercompany Transaction
Financial Statement Item Amount Term
Percentage of Consolidated
Total Gross Sales or Total Assets
(Note 3) 0 The Shanghai Commercial & SCSB Asset Management Ltd. From parent company to subsidiary Accounts payable $ 100 Note 4 - Savings Bank, Ltd. SCSB Asset Management Ltd. From parent company to subsidiary Deposits and remittances 280,526 Note 4 - SCSB Asset Management Ltd. From parent company to subsidiary Other liabilities 47 Note 4 - SCSB Asset Management Ltd. From parent company to subsidiary Interest expenses 2,338 Note 4 - SCSB Asset Management Ltd. From parent company to subsidiary Net revenue other than from interest 128 Note 4 - SCSB Marketing From parent company to subsidiary Accounts payable 10 Note 4 - SCSB Marketing From parent company to subsidiary Deposits and remittances 10,842 Note 4 - SCSB Marketing From parent company to subsidiary Other liabilities 20 Note 4 - SCSB Marketing From parent company to subsidiary Interest expenses 58 Note 4 - SCSB Marketing From parent company to subsidiary Net revenue other than from interest 63 Note 4 - SCSB Marketing From parent company to subsidiary Other general and administrative 53,993 Note 4 - China Travel Service (Taiwan) From parent company to subsidiary Accounts payable 3 Note 4 - China Travel Service (Taiwan) From parent company to subsidiary Deposits and remittances 69,877 Note 4 - China Travel Service (Taiwan) From parent company to subsidiary Other liabilities 180 Note 4 - China Travel Service (Taiwan) From parent company to subsidiary Interest expenses 558 Note 4 - China Travel Service (Taiwan) From parent company to subsidiary Net revenue other than from interest 554 Note 4 - China Travel Service (Taiwan) From parent company to subsidiary Other general and administrative expenses 892 Note 4 - CTS Travel International Ltd. From parent company to subsidiary Deposits and remittances 5,588 Note 4 - CTS Travel International Ltd From parent company to subsidiary Interest expenses 44 Note 4 - Shancom Reconstruction Inc. From parent company to subsidiary Cash and cash equivalents 271,530 Note 4 - Shancom Reconstruction Inc. From parent company to subsidiary
Due from the Central Bank and call loans
to banks 47
Note 4 -
Shancom Reconstruction Inc. From parent company to subsidiary Accounts payable 8,277 Note 4 - Shancom Reconstruction Inc. From parent company to subsidiary Deposits and remittances 1,424,990 Note 4 - Shancom Reconstruction Inc. From parent company to subsidiary Interest expenses 23,500 Note 4 -
1 SCSB Asset Management Ltd. The Shanghai Commercial & Savings Bank, Ltd. From subsidiary to parent company Cash and cash equivalents 280,562 Note 4 - The Shanghai Commercial & Savings Bank, Ltd. From subsidiary to parent company Accounts receivable 100 Note 4 - The Shanghai Commercial & Savings Bank, Ltd. From subsidiary to parent company Other assets 47 Note 4 - The Shanghai Commercial & Savings Bank, Ltd. From subsidiary to parent company Interest revenue 2,338 Note 4 - The Shanghai Commercial & Savings Bank, Ltd. From subsidiary to parent company Net revenue other than from interest 128 Note 4 -
2 SCSB Marketing The Shanghai Commercial & Savings Bank, Ltd. From subsidiary to parent company Cash and cash equivalents 10,842 Note 4 - The Shanghai Commercial & Savings Bank, Ltd. From subsidiary to parent company Accounts receivable 10 Note 4 - The Shanghai Commercial & Savings Bank, Ltd. From subsidiary to parent company Other assets 20 Note 4 - The Shanghai Commercial & Savings Bank, Ltd. From subsidiary to parent company Interest revenue 58 Note 4 - The Shanghai Commercial & Savings Bank, Ltd. From subsidiary to parent company Net revenue other than from interest 53,993 Note 4 - The Shanghai Commercial & Savings Bank, Ltd. From subsidiary to parent company Net revenue other than from interest 63 Note 4 -
(Continued)

91
No. Company Name Counterparty Nature of Relationship
Intercompany Transaction
Financial Statement Item Amount Term
Percentage of Consolidated
Total Gross Sales or Total Assets
(Note 3) 3 China Travel Service (Taiwan) The Shanghai Commercial & Savings Bank, Ltd. From subsidiary to parent company Accounts receivable $ 3 Note 4 - The Shanghai Commercial & Savings Bank, Ltd. From subsidiary to parent company Cash and cash equivalents 69,877 Note 4 - The Shanghai Commercial & Savings Bank, Ltd. From subsidiary to parent company Other assets 180 Note 4 - The Shanghai Commercial & Savings Bank, Ltd. From subsidiary to parent company Interest revenue 558 Note 4 - The Shanghai Commercial & Savings Bank, Ltd. From subsidiary to parent company Net revenue other than from interest 554 Note 4 - The Shanghai Commercial & Savings Bank, Ltd. From subsidiary to parent company Net revenue other than from interest 892 Note 4 - Shancom Reconstruction Inc. From subsidiary to subsidiary Cash and cash equivalents 534 Note 4 - CTS Travel International Ltd. From subsidiary to subsidiary Net revenue other than from interest 86 Note 4 - CTS Travel International Ltd. From subsidiary to subsidiary Other general and administrative expenses 1,994 Note 4 -
4 CTS Travel International Ltd. The Shanghai Commercial & Savings Bank, Ltd. From subsidiary to parent company Cash and cash equivalents 5,588 Note 4 - The Shanghai Commercial & Savings Bank, Ltd. From subsidiary to parent company Interests revenue 44 Note 4 - China Travel Service (Taiwan) From subsidiary to subsidiary Net revenue other than from interest 1,994 Note 4 - China Travel Service (Taiwan) From subsidiary to subsidiary Net revenue other than from interest 86 Note 4 -
5 Shancom Reconstruction Inc. The Shanghai Commercial & Savings Bank, Ltd. From subsidiary to parent company Cash and cash equivalents 47 Note 4 - The Shanghai Commercial & Savings Bank, Ltd. From subsidiary to parent company Due from other banks 1,424,990 Note 4 - The Shanghai Commercial & Savings Bank, Ltd. From subsidiary to parent company Accounts receivable 8,277 Note 4 - The Shanghai Commercial & Savings Bank, Ltd. From subsidiary to parent company Due to the Central Bank and call loans to
banks 271,530 Note 4 -
The Shanghai Commercial & Savings Bank, Ltd. From subsidiary to parent company Interest revenue 23,500 Note 4 - China Travel Service (Taiwan) From subsidiary to subsidiary Deposits and remittances 534 Note 4 -
Note 1: The transactions between the parent company and its subsidiaries are as follows:
(1) Parent company: 0. (2) Subsidiaries are numbered sequentially from 1 in accordance to company type.
Note 2: There are five transactional relationships, and they are as follows:
(1) Transactions from parent company to subsidiary. (2) Transactions from subsidiary to parent company. (3) Transactions from subsidiary to subsidiary. (4) Transactions from parent company to indirect subsidiary. (5) Transactions from indirect subsidiary to parent company.
Note 3: The percentages are calculated by the consolidated total assets or the consolidated total net sales. If the account refers only to the financial assets/liabilities on the balance sheets, it will be counted by the percentage of its final amount
divided by the consolidated total assets. Otherwise, if the account refers to income statement, it will be counted by the percentage of its average amount divided by the consolidated total net revenue. Note 4: All transactions with related parties were carried at arm’s length.