RBTT Merchant Bank Limited and its subsidiaries · RBTT Merchant Bank Limited and its subsidiaries...
16
57 RBTT Merchant Bank Limited and its subsidiaries Consolidated Financial Statements (expressed in Trinidad & Tobago dollars) 31 October 2010 Chairman’s report e period ended 31 October, 2010 was challenging for RBTT Merchant Bank. e company has changed its reporting period to 31 October from 31 March to align the year-end with that of its ultimate parent company, Royal Bank of Canada (RBC), resulting in financial statements for 19 months from 1 April, 2009 to 31 October, 2010. e loss for the period was TT$114 million as the performance of the Merchant Bank was affected by the difficult economic conditions resulting in impairment losses on the legacy portfolio of TT$ 258 million. RBTT Merchant Bank is focusing its business model on advisory and capital market services. e Group has a strong capital base and is well positioned to take advantage of growth opportunities in the future. In closing, I would like to thank the customers of the RBTT Merchant Bank for their continued confidence over the period. I would also like to thank our employees for their continued commitment to our values, to our clients and to one another has positioned us for long-term growth and success. Suresh Sookoo Chairman 20 January 2011 Statement of management responsibility e Financial Institutions Act, 2008 (FIA 2008) requires management to prepare financial statements for each financial period which give a true and fair view of the state of affairs of the group as at the end of the financial period and of the operating results of the group for the period. It also requires management to ensure that the group keeps proper accounting records which disclose with reasonable accuracy at any time the financial position of the group. ey are also responsible for safeguarding the assets of the group. Management is responsible for the preparation and fair presentation of these financial statements in accordance with International Financial Reporting Standards. is responsibility includes: designing, implementing and maintaining internal controls relevant to the preparation and fair presentation of financial statements that are free from material misstatement, whether due to fraud or error; selecting and applying appropriate accounting policies; and making accounting estimates that are reasonable in the circumstances. Management accepts responsibility for the annual financial statements, which have been prepared using appropriate accounting policies supported by reasonable and prudent judgments and estimates, in conformity with International Financial Reporting Standards and in the manner required by the FIA 2008. Management is of the opinion that the financial statements give a true and fair view of the state of the financial affairs of the group and of its operating results. Management further accepts responsibility for the maintenance of accounting records which may be relied upon in the preparation of financial statements, as well as adequate systems of internal financial control. Nothing has come to the attention of Management to indicate that the group will not remain a going concern for at least the next twelve months from the date of this statement. Suresh Sookoo Waheed Ali Head, Head – Finance, RBTT Merchant Bank RBTT Merchant Bank 20 January 2011 20 January 2011 Independent auditor’s report To the shareholder of RBTT Merchant Bank Limited Report on the consolidated financial statements We have audited the accompanying consolidated financial statements of RBTT Merchant Bank Limited (the Company) and its subsidiaries (together, the Group) which comprise the consolidated statement of financial position as of 31 October 2010 and the consolidated statement of comprehensive income, consolidated statement of changes in equity and consolidated statement of cash flows for the period then ended and a summary of significant accounting policies and other explanatory notes. Management’s responsibility for the financial statements Management is responsible for the preparation and fair presentation of these consolidated financial statements in accordance with International Financial Reporting Standards. is responsibility includes: designing, implementing and maintaining internal control relevant to the preparation and fair presentation of financial statements that are free from material misstatement, whether due to fraud or error; selecting and applying appropriate accounting policies; and making accounting estimates that are reasonable in the circumstances. Auditors’ responsibility Our responsibility is to express an opinion on these consolidated financial statements based on our audit. We conducted our audit in accordance with International Standards on Auditing. ose standards require that we comply with ethical requirements and plan and perform the audit to obtain reasonable assurance whether the financial statements are free from material misstatement. An audit involves performing procedures to obtain audit evidence about the amounts and disclosures in the financial statements. e procedures selected depend on the auditors’ judgment, including the assessment of the risks of mate- rial misstatement of the financial statements, whether due to fraud or error. In making those risk assessments, the auditor considers internal control relevant to the entity’s preparation and fair presentation of the financial statements in order to design audit procedures that are appropriate in the circum- stances, but not for the purpose of expressing an opinion on the effectiveness of the entity’s internal control. An audit also includes evaluating the appropriateness of accounting poli- cies used and the reasonableness of accounting estimates made by management, as well as evaluating the overall pre- sentation of the financial statements. We believe that the audit evidence we have obtained is sufficient and appropriate to provide a basis for our audit opinion. Opinion In our opinion, the accompanying consolidated financial statements present fairly, in all material respects, the financial position of the Group as of 31 October 2010, and its financial performance and cash flows for the nineteen month period then ended in accordance with International Financial Reporting Standards. Deloitte and Touche Port of Spain, Trinidad, West Indies 20 January 2011
Transcript of RBTT Merchant Bank Limited and its subsidiaries · RBTT Merchant Bank Limited and its subsidiaries...

57
RBTT Merchant Bank Limitedand its subsidiariesConsolidated Financial Statements (expressed in Trinidad & Tobago dollars)
31 October 2010
Chairman’s report
The period ended 31 October, 2010 was challenging for RBTT Merchant Bank. The company has changed its reporting period to 31 October from 31 March to align the year-end with that of its ultimate parent company, Royal Bank of Canada (RBC), resulting in financial statements for 19 months from 1 April, 2009 to 31 October, 2010. The loss for the period was TT$114 million as the performance of the Merchant Bank
was affected by the difficult economic conditions resulting in impairment losses on the legacy portfolio of TT$ 258 million.
RBTT Merchant Bank is focusing its business model on advisory and capital market services. The Group has a strong capital base and is well positioned to take advantage of growth opportunities in the future.
In closing, I would like to thank the customers of the RBTT Merchant Bank for their continued confidence over the period. I would also like to thank our employees for their
continued commitment to our values, to our clients and to one another has positioned us for long-term growth and success.
Suresh SookooChairman20 January 2011
Statement of management responsibility
The Financial Institutions Act, 2008 (FIA 2008) requires management to prepare financial statements for each financial period which give a true and fair view of the state of affairs of the group as at the end of the financial period and of the operating results of the group for the period. It also requires management to ensure that the group keeps proper accounting records which disclose with reasonable accuracy at any time the financial position of the group. They are also responsible for safeguarding the assets of the group.
Management is responsible for the preparation and fair presentation of these financial statements in accordance with International Financial Reporting Standards. This
responsibility includes: designing, implementing and maintaining internal controls relevant to the preparation and fair presentation of financial statements that are free from material misstatement, whether due to fraud or error; selecting and applying appropriate accounting policies; and making accounting estimates that are reasonable in the circumstances.
Management accepts responsibility for the annual financial statements, which have been prepared using appropriate accounting policies supported by reasonable and prudent judgments and estimates, in conformity with International Financial Reporting Standards and in the manner required by the FIA 2008. Management is of the opinion that the financial statements give a true and fair view of the state of the financial affairs of the group and of its operating results. Management further accepts responsibility for the maintenance of accounting records which may be relied
upon in the preparation of financial statements, as well as adequate systems of internal financial control.
Nothing has come to the attention of Management to indicate that the group will not remain a going concern for at least the next twelve months from the date of this statement.
Suresh Sookoo Waheed AliHead, Head – Finance, RBTT Merchant Bank RBTT Merchant Bank 20 January 2011 20 January 2011
Independent auditor’s report
To the shareholder of RBTT Merchant Bank Limited
Report on the consolidated financial statements
We have audited the accompanying consolidated financial statements of RBTT Merchant Bank Limited (the Company) and its subsidiaries (together, the Group) which comprise the consolidated statement of financial position as of 31 October 2010 and the consolidated statement of comprehensive income, consolidated statement of changes in equity and consolidated statement of cash flows for the period then ended and a summary of significant accounting policies and other explanatory notes.
Management’s responsibility for the financial statements
Management is responsible for the preparation and fair presentation of these consolidated financial statements in accordance with International Financial Reporting Standards. This responsibility includes: designing, implementing and maintaining internal control relevant to the preparation and fair presentation of financial statements that are free
from material misstatement, whether due to fraud or error; selecting and applying appropriate accounting policies; and making accounting estimates that are reasonable in the circumstances.
Auditors’ responsibility
Our responsibility is to express an opinion on these consolidated financial statements based on our audit. We conducted our audit in accordance with International Standards on Auditing. Those standards require that we comply with ethical requirements and plan and perform the audit to obtain reasonable assurance whether the financial statements are free from material misstatement.
An audit involves performing procedures to obtain audit evidence about the amounts and disclosures in the financial statements. The procedures selected depend on the auditors’ judgment, including the assessment of the risks of mate-rial misstatement of the financial statements, whether due to fraud or error. In making those risk assessments, the auditor considers internal control relevant to the entity’s preparation and fair presentation of the financial statements in order to design audit procedures that are appropriate in the circum-stances, but not for the purpose of expressing an opinion on
the effectiveness of the entity’s internal control. An audit also includes evaluating the appropriateness of accounting poli-cies used and the reasonableness of accounting estimates made by management, as well as evaluating the overall pre-sentation of the financial statements.
We believe that the audit evidence we have obtained is sufficient and appropriate to provide a basis for our audit opinion.
Opinion
In our opinion, the accompanying consolidated financial statements present fairly, in all material respects, the financial position of the Group as of 31 October 2010, and its financial performance and cash flows for the nineteen month period then ended in accordance with International Financial Reporting Standards.
Deloitte and TouchePort of Spain, Trinidad, West Indies20 January 2011

58
(expressed in Trinidad & Tobago dollars)31 October 2010 - continuedConsolidated Financial Statements
Consolidated statement of financial position At 31 At 31 October March Notes 2010 2009 ($’000) ($’000) restatedAssetsCash on hand and due from banks 4 308,380 1,045,699 Deposit with Central Bank 5 58,440 45,103 Investment in associated company and joint venture 6 139,356 125,848 Financial assets at fair value through profit or loss 7 472,926 1,426,166 Financial assets available for sale 8 982,979 1,068,642 Loans to customers 9 1,575,797 1,159,022 Derivative financial instruments 10 1,010,811 1,450,415 Equipment 11 2,676 3,613 Intangible assets - software 12 9,765 -- Taxation recoverable 52,766 25,919 Deferred tax asset 17 306,844 406,890 Other assets 13 295,693 247,294
Total assets 5,216,433 7,004,611 Liabilities Customers’ deposits 14 276,942 281,894 Other funding instruments 15 1,771,645 2,944,912 Other borrowed funds 16 504,370 643,384 Derivative financial instruments 10 1,116,853 1,403,052 Taxation payable -- 23,645 Deferred tax liability 17 260,673 342,831 Other liabilities 18 69,176 173,789 Post-retirement benefit obligation 19 4,232 3,197 Provisions 20 51,392 18,538
Total liabilities 4,055,283 5,835,242 Shareholders’ equity Share capital 21 140,000 140,000 Statutory reserve 22 105,205 105,205 Investment revaluation reserve 22.1 20,554 (85,557)Retained earnings 895,391 1,009,721
Total shareholders’ equity 1,161,150 1,169,369
Total liabilities and equity 5,216,433 7,004,611
The accompanying notes form an integral part of these financial statements.
On 20 January, 2011 the Board of Directors of RBTT Merchant Bank Limited authorised these consolidated financial statements for issue.
______________________ Director ______________________ Director
Consolidated statement of comprehensive income
Nineteen Months Year ended ended 31 October 31 March Notes 2010 2009 ($’000) ($’000) restated
Interest income 23 428,649 363,140 Interest expense 24 (165,831) (182,839)
Net interest income 262,818 180,301
Net trading losses (67,277) (330,106)Fees and commissions 16,411 47,159
Total non-interest loss (50,866) (282,947)
Total net income/(loss) 211,952 (102,646)
Impairment losses on loans and advances to customers 9.2 (258,103) (20)Impairment losses on financial assets available for sale 8.2 (10,657) (4,448)Operating expenses 25 (104,758) (70,598)
Total non-interest expenses (373,518) (75,066)
Share of profits of associated company 6.1 1,158 440 Share of profits of joint venture 6.2 16,301 8,905
Total share of profits of associated
company and joint venture 17,459 9,345
Loss before taxation (144,107) (168,367)
Taxation credit 26 29,777 69,001
Loss after taxation (114,330) (99,366)
Other comprehensive income: Net value gain/(loss) on available for sale financial assets 106,111 (128,274)
Other comprehensive income for the period, net of tax 106,811 (128,274)
Total comprehensive loss for the period (8,219) (227,640)
The accompanying notes form an integral part of these financial statements.
Consolidated statement of cash flows Nineteen Months Year ended ended 31 October 31 March 2010 2009 ($’000) ($’000) restated
Operating Activities Loss before taxation (114,330) (99,366)Adjustment for: Depreciation 1,384 930 Taxation credit (29,777) (69,001) Impairment losses/(credit) on financial assets available for sale, net of write-backs 10,657 4,448 Impairment losses/(credit) on loans to customers 258,103 20 Unrealised losses/(gains) on financial assets at fair value including trading securities (77,334) 213,747 Capitalised interest on investment securities (35,180) (96,862) Unrealised (gains)/losses on derivatives and other trading liabilities 388,102 89,395 Dividends received from associated company and joint venture 10,743 4,590 Losses/(gains) transferred from investment revaluation reserve 1,378 (5,689) Share of profits of associated company and joint venture (17,459) (9,343)Profit before changes in operating assets/liabilities 396,287 32,869 (Increase)/decrease in operating assets: Loans to customers (674,878) (169,355) Financial assets at fair value through profit or loss 1,018,415 244,913 Purchase of financial assets at fair value (366,913) (1,656) Sale of financial assets at fair value 377,722 915 Other assets (94,215) (158,069) Statutory deposit with Central Bank (13,337) (376)Increase/(decrease) in operating liabilities: Customers’ deposits (4,952) (19,330) Other funding instruments (1,173,267) (680,013) Other borrowed funds (139,014) (21,179) Other liabilities (118,015) 163,114 Corporation taxes paid (29,234) (206,758)
Cash used in operating activities (821,401) (814,925) Investing Activities Net decrease in financial assets available for sale (20,342) 174,840 Purchase of financial assets available for sale (1,162,693) (1,437) Sale of financial assets available for sale 1,287,439 993 Purchase of equipment and assets held under operating leases (468) (643) Proceeds from sale of equipment and assets under operating leases 271 382 Purchase of Software (10,016) -- Purchase of additional shares in joint venture and associated company (10,109) (60)Cash provided by investing activities 84,082 174,075 Financing activity Dividends paid -- (90,545) Net decrease in cash on hand and due from banks (737,319) (731,395) Cash on hand and due from banks at beginning of period 1,045,699 1,777,094 Cash on hand and due from banks at end of period 308,380 1,045,699
The accompanying notes form an integral part of these financial statements.
Consolidated statement of changes in equity
Notes Share Statutory Revaluation Retained capital reserve reserve earnings Total ($’000) ($’000) ($’000) ($’000) ($’000)Year ended 31 October 2010 Balance at beginning of period - as previously stated 140,000 105,205 (85,557) 1,012,918 1,172,566 Prior year adjustment 35 -- -- -- (3,197) (3,197)Balance at beginning of period as restated 140,000 105,205 (85,557) 1,009,721 1,169,369 Other comprehensive income -- -- 106,111 -- 106,111 Loss after taxation -- -- -- (114,330) (114,330)
Total comprehensive loss -- -- 106,111 (114,330) (8,219)
Balance at end of period 140,000 105,205 20,554 895,391 1,161,150 Year ended 31 March 2009 Balance at beginning of year 140,000 105,205 42,717 1,199,632 1,487,554 Other comprehensive income -- -- (128,274) -- (128,274)Loss after taxation -- -- -- (99,366) (99,366)
Total comprehensive loss -- -- (128,274) (99,366) (227,640)Dividends 27 -- -- -- (90,545) (90,545)
Balance at end of year 140,000 105,205 (85,557) 1,009,721 1,169,369
The accompanying notes form an integral part of these consolidated financial statements.

59
(expressed in Trinidad & Tobago dollars)31 October 2010 - continuedConsolidated Financial Statements
Notes to the consolidated financial statements
1 Incorporation and business activities
RBTT Merchant Bank Limited (the Company) was incorporated in the Republic of Trinidad and Tobago in 1975. The Company is a wholly owned subsidiary of RBC Financial (Caribbean) Limited formerly RBTT Financial Holdings Limited, also incorporated in the Republic of Trinidad and Tobago. The ultimate parent company is Royal Bank of Canada which is incorporated in Canada. The Company operates under the provisions of the Financial Institutions Act 2008 and is licensed to carry on the business of a merchant bank, trust company, mortgage institution, finance house, confirming house and leasing corporation.
The Company offers a comprehensive range of financial services associated with the business activities which it is authorised to conduct, including arranging and underwriting of securities, loan syndication, securities trading, advisory services and other capital market transactions in the Republic of Trinidad and Tobago and in other jurisdictions. The address of the Company’s registered office is 7 – 9 St. Clair Avenue, St. Clair, Trinidad.
RMB Holdings Limited is a wholly owned subsidiary of the Company incorporated in Nevis under the Nevis Business Corporation Ordinance 1984 and was continued on 28 July 2005 in St. Lucia under the St. Lucia International Business Act 1999. The principal activities of this Company are those of an investment and holding company. RMB Holdings Limited has wholly owned subsidiaries, RMB Investments Limited, which is incorporated in the British Virgin Islands and RMB Financing Limited, which is incorporated in St. Lucia. Both these companies principal activities are the syndication of securities and managing portfolios of investment securities and loans.
RMB Services CR, Sociedad Anonima, a wholly owned subsidiary of RBTT Merchant Bank Limited, was incorporated in Costa Rica on 25 July 2005 and registered in the public registry on the 23 August 2005. The Company provides consultancy and administrative services to its parent company.
The Company is also an equal shareholder in RGM Limited, a joint venture with Sagicor Life Inc. and Guardian Life of the Caribbean Limited. The Company also has a 20% equity interest in Park Court Limited which, like RGM Limited, is a property development company.
During the fiscal period 2010, the Group changed its reporting period to 31 October to align the Group’s year-end with that of its ultimate parent company, Royal Bank of Canada. Consequently, the consolidated results for the year ended 31 October 2010 include the results of operations for nineteen months from 1 April 2009 to 31 October 2010. The consolidated results for the comparative year ended 31 March 2009 include the results of operations for twelve months.
2 Significant Accounting Policies
Adoption of new and revised International Financial Reporting Standards (IFRSs)
The following new and revised Standards and Interpretations have been adopted in the current period and have affected the amounts reported in these financial statements.
Standards affecting presentation and disclosure
• IAS1,PresentationofFinancialStatements.Comprehensiverevision requiring a statement of comprehensive income (effective 1 January 2009).
• IAS 1, Presentation of Financial Statements. Amendmentsresulting from May 2008 annual improvements to IFRSs (effective 1 January 2009).
IAS 1 has introduced terminology changes (including revised titles for the financial statements) and changes in the format and content of the financial statements.
• Improving Disclosures about Financial Instruments -Amendments to IFRS 7 Financial Instruments: Disclosures (effective for accounting periods beginning on or after 1 January 2009).
The amendments to IFRS 7 expand the disclosures required in respect of fair value measurements and liquidity risk. The Group has elected not to provide comparative information for these expanded disclosures in the current period in accordance with the transitional reliefs offered in these amendments.
• AmendmentstoIAS39FinancialInstruments:Recognitionand Measurement and IFRS 7 Financial Instruments: Disclosures regarding reclassification of financial assets (effective 1 July 2008)
The amendments to IAS 39 permit an entity to reclassify non-derivative financial assets out of the ‘fair value through profit or loss’ (FVTPL) and ‘available for sale’ (AFS) categories. Such reclassifications are permitted from 1 July 2008. Reclassifications of financial assets made in periods beginning on or after 1 November 2008 take effect only from the date when the reclassification is made.
In April 2009, the Group reclassified certain debt securities from fair value through profit and loss and available for sale to loans and advances to customers. These securities would have met the definition of loans and advances to customers if they had not been designated as at fair value through profit and loss and available for sale at initial recognition. The Group’s original intention at initial recognition was to sell the securities at fair value through profit and loss in the short-term and to hold the available for sale securities for an indefinite period. However, as a result of adverse world economic conditions accompanied by the Group’s intent and ability to hold the financial assets for the foreseeable future or until maturity, the Group concluded that the criteria for reclassification were met. Consequently, the assets were reclassified at 1 April 2009 (see note 7 for further details). The reclassification has been accounted for in accordance with the relevant transitional provisions and took effect only from the date of reclassification.
The effect of the reclassification is that all transferred securities have been recorded as loans and advances to customers at their fair value on the date of reclassification which became its new amortised cost. For those reclassifications made from securities at fair value through profit and loss, any gain or loss already recognised in profit or loss shall not be reversed. For those reclassifications made from available for sale securities with a fixed maturity, any previous gain or loss is amortised to profit and loss over the remaining life of the security using the effective interest method. Any difference between the new amortised cost and the maturity amount shall also be amortised over the remaining life of the financial asset using the effective interest method. If the security becomes impaired, any gain or loss that was previously recognised in other comprehensive income is reclassified to profit and loss.
• IFRS 3, BusinessCombinations –Comprehension revisionon applying the acquisition method (effective for accounting periods beginning on or after 1 July 2009).
IFRS 3 has been adopted in the current period in advance of its effective date (business combinations for which the acquisition date is on or after the beginning of the first annual period beginning on or after 1 July 2009). Its adoption has affected the accounting for business combinations in the current period.
In accordance with the relevant transitional provisions, IFRS 3 has been applied prospectively to business combinations for which the acquisition date is on or after 1 January 2009. The impact of the adoption of IFRS 3 (2008) Business Combinations has been:
• toallowachoiceona transaction-by-transactionbasis forthe measurement of non-controlling interests (previously referred to as ‘minority’ interests) either at fair value or at the non-controlling interests’ share of the fair value of the identifiable net assets of the acquiree.
• to change the recognition and subsequent accountingrequirements for contingent consideration. Under the previous version of the Standard, contingent consideration was recognised at the acquisition date only if payment of the contingent consideration was probable and it could be measured reliably; any subsequent adjustments to the contingent consideration were recognised against goodwill. Under the revised Standard, contingent consideration is measured at fair value at the acquisition date; subsequent adjustments to the consideration are recognised against goodwill only to the extent that they arise from better information about the fair value at the acquisition date, and they occur within the ‘measurement period’ (a maximum of 12 months from the acquisition date). All other subsequent adjustments are recognised in profit or loss;
• where the business combination in effect settles a pre-existing relationship between the Group and the acquiree, to require the recognition of a settlement gain or loss; and
• to require that acquisition-related costs be accounted forseparately from the business combination, generally leading to those costs being recognised as an expense in profit or loss as incurred, whereas previously they were accounted for as part of the cost of the acquisition. The acquisition related costs in connection with the purchase of RBC Barbados Limited were expensed.
Standards and Interpretations adopted with no effect on financial statements
• IFRS8,OperatingSegments(effectiveforaccountingperiodsbeginning on or after 1 January 2009).
• IAS23,BorrowingCosts,Comprehensiverevisiontoprohibitimmediate expensing and amendments resulting from May 2008 improvements to IFRSs (effective for accounting periods beginning on or after 1 January 2009).
• IFRIC 15, Agreements for the construction of Real Estate(effective for accounting periods beginning on or after 1 January 2009).
• IFRS 1, First-Time Adoption of International FinancialReporting Standards – Amendment relating to cost of an investment on first-time adoption (effective for accounting periods beginning on or after 1 January 2009).
• IAS32,FinancialInstruments:DisclosureandPresentation:Amendments relating to puttable instruments and obligations arising on liquidation (effective for accounting periods beginning on or after 1 January 2009).
• IAS 16, Property, Plant and Equipment. Amendmentsresulting from May 2008 annual improvements to IFRSs (effective 1 January 2009).
• IAS 19, Employee Benefits. Amendments resulting fromMay 2008 annual improvements to IFRSs (effective 1 January 2009).
• IAS36,ImpairmentofAssets. AmendmentsresultingfromMay 2008 annual improvements to IFRSs (effective 1 January 2009).
• IAS38,IntangibleAssets.AmendmentsresultingfromMay2008 annual improvements to IFRSs (effective 1 January 2009).
• IAS 40, Investment Property. Amendments resulting fromMay 2008 annual improvements to IFRSs (effective 1 January 2009).
Standards and Interpretations in issue not yet adopted
• IFRIC 18, Transfer of assets to Customers (effective fortransfers of assets from customers received beginning on or after 1 July 2009).
• IAS 27, Consolidated and Separate Financial Statements:Consequential amendments arising from amendments to IFRS 3 (effective for accounting periods beginning on or after 1 July 2009.
• IAS 28, Investments in Associates: Consequentialamendments arising from amendments to IFRS 3 (effective for accounting periods beginning on or after 1 July 2009).
• IFRIC 17, Distributions of Non-cash Assets to Owners(effective for accounting periods beginning on or after 1 July 2009).
• IAS 31, Interests in Joint Ventures: Consequentialamendments arising from amendments to IFRS 3 (effective for accounting periods beginning on or after 1 July 2009).
• IAS 39, Financial Instruments: Recognition andMeasurement: Amendments for eligible hedged items (effective for accounting periods beginning on or after 1 July 2009).
• IFRS5,Non-CurrentAssetsHeldforSaleandDiscontinuedOperations. Amendment resulting from May 2008 annual improvements to IFRSs (effective 1 July 2009).
• IFRS5,Non-CurrentAssetsHeldforSaleandDiscontinuedOperations. Amendments resulting from April 2009 annual improvements to IFRS (effective 1 January 2009).

60
(expressed in Trinidad & Tobago dollars)31 October 2010 - continuedConsolidated Financial Statements(expressed in Trinidad & Tobago dollars)
31 October 2010 - continuedConsolidated Financial Statements
Notes to the consolidated financial statements
2 Significant accounting policies (continued)
Adoption of new and revised International Financial Reporting Standards (IFRSs) (continued)
Standards and Interpretations in issue not yet adopted (continued)
• IFRS 9, Financial Instruments. Classification andMeasurement (effective for accounting periods beginning on or after 1 January 2013).
• IAS1,PresentationofFinancialStatements. Amendmentsresulting from April 2009 annual improvements to IFRSs (effective 1 January 2010).
• IAS 7, Statement of Cash Flows. Amendments resultingfrom April 2009 annual improvements to IFRSs (effective 1 January 2010).
• IAS 17, Leases. Amendments resulting from April 2009annual improvements to IFRSs (effective 1 January 2010).
• IAS 24, Related Party Disclosures. Revised definition ofrelated parties (effective 1 January 2010).
• IAS 32, Financial Instruments. Amendment relating toclassification of rights issues (effective 1 January 2010).
• IAS36, ImpairmentofAssets.Amendments resulting fromApril 2009 annual improvements to IFRSs (effective 1 January 2010).
• IAS38,IntangibleAssets.AmendmentsresultingfromApril2009 annual improvements to IFRSs (effective 1 January 2010).
• IFRIC 14, Requirements and their Interaction. November2009 amendment with respect to voluntary prepaid contributions (to be effected 1 January 2011).
Management is unable to provide a reasonable estimate of the potential impact of the adoption of these amendments until a detailed review is completed.
a Basis of preparation
These consolidated financial statements are prepared in Trinidad and Tobago dollars in accordance with International Financial Reporting Standards (IFRS). They have been prepared under the historical cost convention as modified by the revaluation of financial assets available for sale, financial assets at fair value though the profit or loss, derivative financial instruments and other trading liabilities.
The preparation of these consolidated financial statements in conformity with IFRS requires the use of certain critical accounting estimates. It also requires management to exercise its judgment in the process of applying the Group’s accounting policies. The areas involving a higher degree of judgment or complexity, or areas where assumptions and estimates are significant to the consolidated financial statements are disclosed in Note 3.
b Principles of consolidation
(i) Subsidiaries
Subsidiaries are all entities (including special purpose entities) over which the Group has the power to govern the financial and operating policies generally accompanying a shareholding of more than one half of the voting rights. The existence and effect of potential voting rights that are currently exercisable or convertible are considered when assessing whether the Group controls another entity. Subsidiaries are fully consolidated from the date on which control is transferred to the Group. They are de-consolidated from the date on which control ceases. Inter-company transactions, balances and unrealised gains on transactions between group companies are eliminated. Unrealised losses are also eliminated unless the transaction provides evidence of impairment of the asset transferred. The accounting policies of the subsidiaries have been changed where necessary to ensure consistency with the policies adopted by the Group.
A listing of the subsidiaries is set out in note 34.
(ii) Investment in Associates
An associate is an entity over which the Group has significant influence and that is neither a subsidiary nor an interest in a joint venture. Significant influence is the power to participate in
the financial and operating policy decisions of the investee but is not control or joint control over those policies.
The results and assets and liabilities of associates are incorporated in these financial statements using the equity method of accounting, except when the investment is classified as held for sale, in which case it is accounted for in accordance with IFRS 5 Non-current Assets Held for Sale and Discontinued Operations. Under the equity method, investments in associates are carried in the consolidated statement of financial position at cost as adjusted for post-acquisition changes in the Group’s share of the net assets of the associate, less any impairment in the value of individual investments. Losses of an associate in excess of the Group’s interest in that associate (which includes any long-term interests that, in substance, form part of the Group’s net investment in the associate) are not recognised, unless the Group has incurred legal or constructive obligation or made payments on behalf of the associate.
Any excess of the cost of acquisition over the Group’s share of the net fair value of the identifiable assets, liabilities and contingent liabilities of the associate recognised at the date of acquisition is recognised as goodwill.
The goodwill is included within the carrying amount of the investment and is assessed for impairment as part of the investment. Any excess of the Group’s share of the net fair value of the identifiable assets, liabilities and contingent liabilities over the cost of acquisition, after reassessment, is recognised immediately in profit or loss.
Where a group entity transacts with an associate of the Group, profits and losses are eliminated to the extent of the Group’s interest in the relevant associate.
(iii) Joint Venture
A joint venture is a contractual arrangement whereby the Group and other parties undertake an economic activity that is subject to joint control that is when the strategic financial and operating policy decisions relating to the activities of the joint venture require the unanimous consent of the parties sharing control.
Where a group entity undertakes its activities under joint venture arrangements directly, the Group’s share of jointly controlled assets and any liabilities incurred jointly with other venturers are recognised in the financial statements of the relevant entity and classified according to their nature. Liabilities and expenses incurred directly in respect of interest in jointly controlled assets are accounted for on an accrual basis. Income from the sale or use of the Group’s share of the output of jointly controlled assets, and its share of joint venture expenses, are recognised when it is probable that the economic benefits associated with the transactions will flow to/from the Group and their amount can be measured reliably. c Foreign currency translation
The individual financial statements of each group entity are presented in the currency of the primary economic environment in which the entity operates (its functional currency). For the purpose of the consolidated financial statements, the results and financial position of each group entity are expressed in Trinidad and Tobago dollars, which is the functional currency of the Company and the presentation currency for the consolidated financial statements.
In preparing the financial statements of the individual entities, transactions in currencies other than the entity’s functional currency (foreign currencies) are recognised at the rates of exchange prevailing at the dates of the transactions. At the end of each reporting period, monetary items denominated in foreign currencies are retranslated at the rates prevailing at that date. Non-monetary items carried at fair value that are denominated in foreign currencies are retranslated at the rates prevailing at the date when the fair value was determined. Non-monetary items that are measured in terms of historical cost in a foreign currency are not retranslated.
Exchange differences are recognised in profit or loss in the period in which they arise except for:
• Exchangedifferencesonforeigncurrencyborrowingsrelatingto assets under construction for future productive use, which are included in the cost of those assets when they are regarded as an adjustment to interest costs on those foreign currency borrowings;
• Exchangedifferencesontransactionsenteredintoinordertohedge certain foreign currency risks and
• Exchangedifferencesonmonetary itemsreceivable fromorpayable to a foreign operation for which settlement is neither planned nor likely to occur (therefore forming part of the net investment in the foreign operation), which are recognised initially in other comprehensive income and reclassified from equity to profit or loss on disposal or partial disposal of the net investment.
For the purpose of presenting consolidated financial statements, the assets and liabilities of the Group’s foreign operations are expressed in Trinidad and Tobago dollars using exchange rates prevailing at the end of the reporting period. Income and expense items are translated at the average exchange rates for the period, unless exchange rates fluctuated significantly during that period, in which case the exchange rates at the dates of the transactions are used. Exchange differences arising, if any, are recognised in other comprehensive income and accumulated in equity (attributed to non-controlling interests as appropriate).
On the disposal of a foreign operation (i.e. a disposal of the Group’s entire interest in a foreign operation, or a disposal involving loss of control over a subsidiary that includes a foreign operation, loss of joint control over a jointly controlled entity that includes a foreign operation, or loss of significant influence over an associate that includes a foreign operation), all of the accumulated exchange differences in respect of that operation attributable to the Group are reclassified to profit or loss. Any exchange differences that have previously been attributed to non-controlling interests are derecognised, but they are not reclassified to profit or loss.
In the case of a partial disposal (i.e. no loss of control) of a subsidiary that includes a foreign operation, the proportionate share of accumulated exchange differences are re-attributed to non-controlling interests and are not recognised in profit or loss. For all other partial disposals (i.e. of associates or jointly controlled entities not involving a change of accounting basis), the proportionate share of the accumulated exchange differences is reclassified to profit or loss.
Goodwill and fair value adjustments arising on the acquisition of a foreign operation are treated as assets and liabilities of the foreign operation and translated at the closing rate.
d Cash on hand and due from banks
Cash on hand and due from banks comprise cash and short term investments, amounts due from affiliated banks and amounts due from non affiliated banks.
e Financial assets
The Group classifies its financial assets into the following categories: financial assets at fair value through profit or loss, financial assets available for sale and loans to and advances to customers. Management determines the classification of its financial assets at initial recognition.
Effective interest method
The effective interest method is a method of calculating the amortised cost of a debt instrument and of allocating interest income over the relevant period. The effective interest rate is the rate that exactly discounts estimated future cash receipts (including all fees on points paid or received that form an integral part of the effective interest rate, transaction costs and other premiums or discounts) through the expected life of the debt instrument, or, where appropriate, a shorter period to the net carrying amount on initial recognition.
Income is recognised on an effective interest basis for debt instruments other than those financial assets classified as at FVTPL.
i) Financial assets at fair value through profit or loss
This category has two sub-categories: financial assets held for trading and those designated at fair value through profit or loss from inception.
A financial asset is classified as held for trading if it is acquired or incurred principally for the purpose of selling or repurchasing in the near term or if it is part of a portfolio of identified financial instruments that are managed together and for which there is evidence of a recent actual pattern of short term profit taking. Derivatives are also categorised as held for trading unless they are designated as hedging instruments.
61
(expressed in Trinidad & Tobago dollars)31 October 2010 - continuedConsolidated Financial Statements
Notes to the consolidated financial statements
2 Significant accounting policies (continued)
e Financial assets (continued)
i) Financial assets at fair value through profit or loss (continued)
Financial assets and liabilities are designated at fair value through profit or loss when:
• The designation significantly reduces measurementinconsistencies that would arise from measuring the assets or liabilities or recognising gains or losses on them on a different basis; or
• Assets and liabilities are part of a group of financialassets, financial liabilities or both which are managed and evaluated on a fair value basis in accordance with a documented risk management or investment strategy and reported to key management personnel on that basis are designated at fair value through profit or loss.
Financial instruments, such as debt securities held, containing one or more embedded derivatives which significantly modify the cash flows, are designated at fair value through profit or loss.
Gains and losses arising from changes in the fair value of derivatives that are managed in conjunction with designated financial assets or financial liabilities are included in ‘net trading income’.
ii) Loans to customers
Loans to customers are non-derivative financial assets with fixed determinable payments that are not quoted in an active market, other than: (a) those the entity intends to sell immediately or in the short term, which are classified as held for trading, and those that the entity upon initial recognition designates at fair value through the profit or loss; (b) those that the entity upon initial recognition designates as available for sale; or (c) those for which the holder may not recover substantially all of its initial investment, other than because of credit deterioration.
iii) Available for sale financial assets
Available for sale investments are those intended to be held for an indefinite period of time, which may be sold in response to needs for liquidity or changes in interest rates, exchange rates or equity prices.
Purchases and sales of financial assets at fair value through profit or loss and available for sale are recognised on the settlement date – the date on which there is a cash outflow or inflow.
Financial assets are initially recognised at fair value plus transaction costs for all financial assets not carried at fair value through profit or loss. Financial assets carried at fair value through profit or loss are initially recognised at fair value, and transaction costs are expensed in the statement of comprehensive income.
Available for sale financial assets and financial assets at fair value through profit or loss are subsequently carried at fair value. Loans and Advances to customers are carried at amortised cost using the effective interest method. Gains and losses arising from changes in the fair value of the ‘financial assets at fair value through profit or loss’ category are included in the statement of comprehensive income for the period in which they arise. Gains and losses arising from changes in the fair value of available for sale financial assets are recognised directly in other comprehensive income, until the financial asset is derecognised or impaired. At this time, the cumulative gain or loss previously recognised in other comprehensive income is recognised in profit or loss. Interest calculated using the effective interest method and foreign currency gains and losses on monetary assets classifies as available for sale are recognised in the profit or loss. Dividends on available for sale equity instruments are recognised in the profit or loss when the entity’s right to receive payment is established.
The fair values of quoted investments in active markets are based on current bid prices. If there is no active market for a financial asset, the Group establishes fair value using valuation techniques. These include the use of recent
arm’s length transactions, discounted cash flow analysis, option pricing models and other valuation techniques used by market participants.
iv) Derecognition of financial assets
The Group derecognises a financial asset only when the contractual rights to the cash flows from the asset expire, or when it transfers the financial asset and substantially all the risks and rewards of ownership of the asset to another entity. If the Group neither transfers nor retains substantially all the risks and rewards of ownership and continues to control the transferred asset, the Group recognises its retained interest in the asset and an associated liability for amounts it may have to pay. If the Group retains substantially all the risks and rewards of ownership of a transferred financial asset, the Group continues to recognise both the financial asset, as well as the collateralised borrowing for the proceeds received.
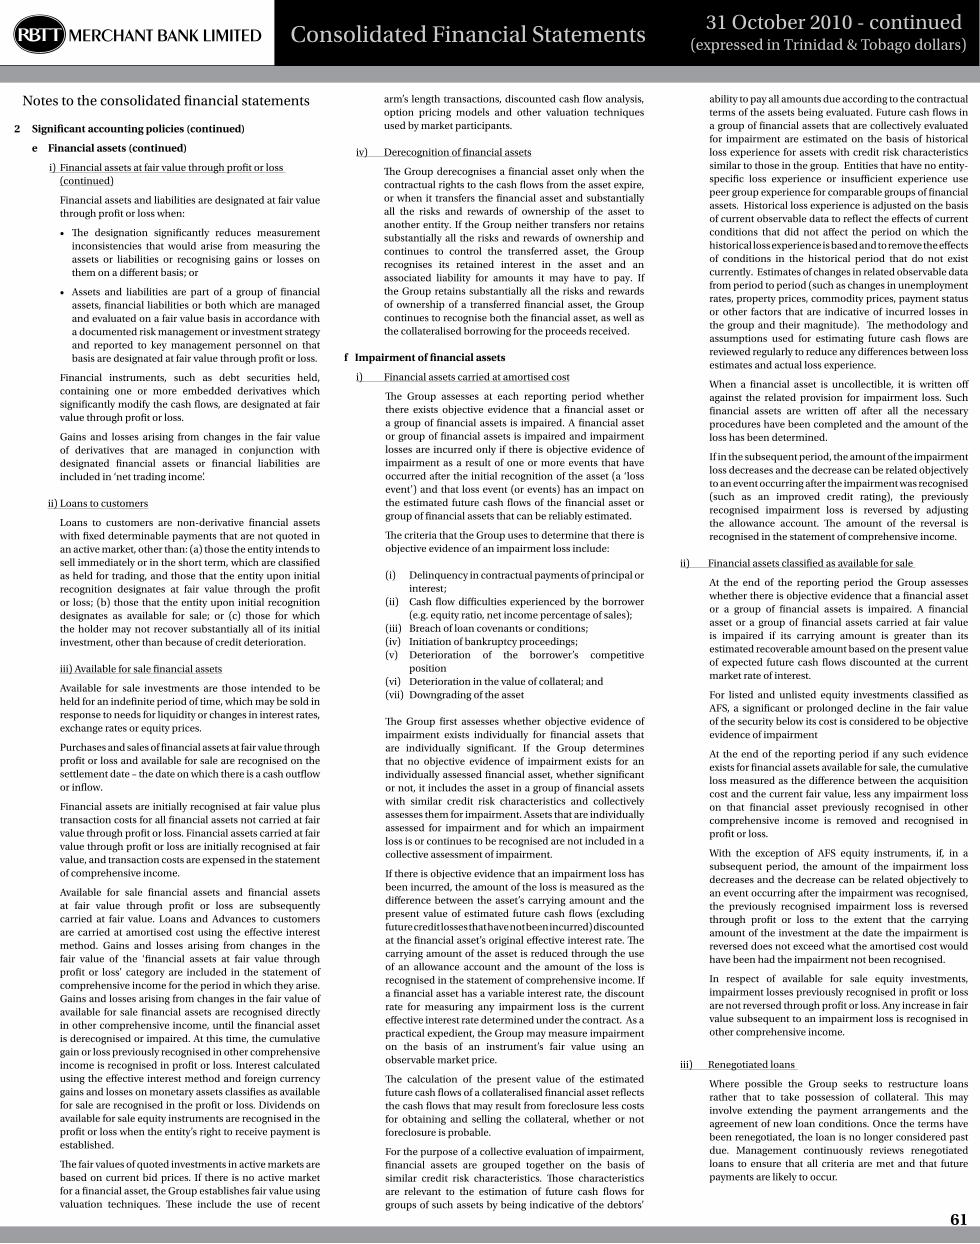
f Impairment of financial assets
i) Financial assets carried at amortised cost
The Group assesses at each reporting period whether there exists objective evidence that a financial asset or a group of financial assets is impaired. A financial asset or group of financial assets is impaired and impairment losses are incurred only if there is objective evidence of impairment as a result of one or more events that have occurred after the initial recognition of the asset (a ‘loss event’) and that loss event (or events) has an impact on the estimated future cash flows of the financial asset or group of financial assets that can be reliably estimated.
The criteria that the Group uses to determine that there is objective evidence of an impairment loss include:
(i) Delinquency in contractual payments of principal or interest;
(ii) Cash flow difficulties experienced by the borrower (e.g. equity ratio, net income percentage of sales);
(iii) Breach of loan covenants or conditions;(iv) Initiation of bankruptcy proceedings;(v) Deterioration of the borrower’s competitive
position(vi) Deterioration in the value of collateral; and (vii) Downgrading of the asset
The Group first assesses whether objective evidence of impairment exists individually for financial assets that are individually significant. If the Group determines that no objective evidence of impairment exists for an individually assessed financial asset, whether significant or not, it includes the asset in a group of financial assets with similar credit risk characteristics and collectively assesses them for impairment. Assets that are individually assessed for impairment and for which an impairment loss is or continues to be recognised are not included in a collective assessment of impairment.
If there is objective evidence that an impairment loss has been incurred, the amount of the loss is measured as the difference between the asset’s carrying amount and the present value of estimated future cash flows (excluding future credit losses that have not been incurred) discounted at the financial asset’s original effective interest rate. The carrying amount of the asset is reduced through the use of an allowance account and the amount of the loss is recognised in the statement of comprehensive income. If a financial asset has a variable interest rate, the discount rate for measuring any impairment loss is the current effective interest rate determined under the contract. As a practical expedient, the Group may measure impairment on the basis of an instrument’s fair value using an observable market price.
The calculation of the present value of the estimated future cash flows of a collateralised financial asset reflects the cash flows that may result from foreclosure less costs for obtaining and selling the collateral, whether or not foreclosure is probable.
For the purpose of a collective evaluation of impairment, financial assets are grouped together on the basis of similar credit risk characteristics. Those characteristics are relevant to the estimation of future cash flows for groups of such assets by being indicative of the debtors’
ability to pay all amounts due according to the contractual terms of the assets being evaluated. Future cash flows in a group of financial assets that are collectively evaluated for impairment are estimated on the basis of historical loss experience for assets with credit risk characteristics similar to those in the group. Entities that have no entity-specific loss experience or insufficient experience use peer group experience for comparable groups of financial assets. Historical loss experience is adjusted on the basis of current observable data to reflect the effects of current conditions that did not affect the period on which the historical loss experience is based and to remove the effects of conditions in the historical period that do not exist currently. Estimates of changes in related observable data from period to period (such as changes in unemployment rates, property prices, commodity prices, payment status or other factors that are indicative of incurred losses in the group and their magnitude). The methodology and assumptions used for estimating future cash flows are reviewed regularly to reduce any differences between loss estimates and actual loss experience.
When a financial asset is uncollectible, it is written off against the related provision for impairment loss. Such financial assets are written off after all the necessary procedures have been completed and the amount of the loss has been determined.
If in the subsequent period, the amount of the impairment loss decreases and the decrease can be related objectively to an event occurring after the impairment was recognised (such as an improved credit rating), the previously recognised impairment loss is reversed by adjusting the allowance account. The amount of the reversal is recognised in the statement of comprehensive income.
ii) Financial assets classified as available for sale
At the end of the reporting period the Group assesses whether there is objective evidence that a financial asset or a group of financial assets is impaired. A financial asset or a group of financial assets carried at fair value is impaired if its carrying amount is greater than its estimated recoverable amount based on the present value of expected future cash flows discounted at the current market rate of interest.
For listed and unlisted equity investments classified as AFS, a significant or prolonged decline in the fair value of the security below its cost is considered to be objective evidence of impairment
At the end of the reporting period if any such evidence exists for financial assets available for sale, the cumulative loss measured as the difference between the acquisition cost and the current fair value, less any impairment loss on that financial asset previously recognised in other comprehensive income is removed and recognised in profit or loss.
With the exception of AFS equity instruments, if, in a subsequent period, the amount of the impairment loss decreases and the decrease can be related objectively to an event occurring after the impairment was recognised, the previously recognised impairment loss is reversed through profit or loss to the extent that the carrying amount of the investment at the date the impairment is reversed does not exceed what the amortised cost would have been had the impairment not been recognised.
In respect of available for sale equity investments, impairment losses previously recognised in profit or loss are not reversed through profit or loss. Any increase in fair value subsequent to an impairment loss is recognised in other comprehensive income.
iii) Renegotiated loans
Where possible the Group seeks to restructure loans rather that to take possession of collateral. This may involve extending the payment arrangements and the agreement of new loan conditions. Once the terms have been renegotiated, the loan is no longer considered past due. Management continuously reviews renegotiated loans to ensure that all criteria are met and that future payments are likely to occur.

62
(expressed in Trinidad & Tobago dollars)31 October 2010 - continuedConsolidated Financial Statements(expressed in Trinidad & Tobago dollars)
31 October 2010 - continuedConsolidated Financial Statements
Notes to the consolidated financial statements
2 Significant accounting policies (continued)
g Financial liabilities
Financial liabilities are classified as either financial liabilities at Fair Value Through Profit and Loss (FVTPL) or other financial liabilities.
Financial liabilities at FVTPL
Financial liabilities are classified as at FVTPL where the financial liability is either held for trading or it is designated as at FVTPL.
A financial liability is classified as held for trading if:
• it has been incurred principally for the purpose ofrepurchasing in the near future; or
• itisapartofanidentifiedportfoliooffinancialinstrumentsthat the Group manages together and has a recent actual pattern of short-term profit-taking; or
• itisaderivativethatisnotdesignatedandeffectiveasahedging instrument.
A financial liability other than a financial liability held for trading may be designated as at FVTPL upon initial recognition if:
• such designation eliminates or significantly reduces ameasurement or recognition inconsistency that would otherwise arise; or
• the financial liability forms part of a group of financialassets or financial liabilities or both, which is managed and its performance is evaluated on a fair value basis, in accordance with the Group’s documented risk management or investment strategy, and information about the grouping is provided internally on that basis; or
• it forms part of a contract containing one or moreembedded derivatives, and IAS 39 permits the entire combined contract (asset or liability) to be designated as at FVTPL.
Financial liabilities at FVTPL are stated at fair value, with any resultant gain or loss recognised in profit or loss. The net gain or loss recognised in profit or loss incorporates any interest paid on the financial liability.
Other financial liabilities
Other financial liabilities, including borrowings, are initially measured at fair value net of transaction costs.
Other financial liabilities are subsequently measured at amortised cost using the effective interest method, with interest expense recognised on an effective yield basis.
The effective interest method is a method of calculating the amortised cost of a financial liability and of allocating interest expense over the relevant period. The effective interest rate is the rate that exactly discounts estimated future cash payments through the expected life of the financial liability, or, where appropriate, a shorter period.
Derecognition of financial liabilities
The Group derecognises financial liabilities when, and only when, the Group’s obligations are discharged, cancelled or they expire.
h Derivative financial instruments
Derivative financial instruments including currency and interest rate swaps, equity and commodity options (both written and purchased) and other derivative financial instruments are initially recognised at fair value on the date on which a derivative contract is entered into and are subsequently measured at their fair value. Fair values are obtained from quoted market prices in active markets, including recent market transactions, and valuation techniques, including discounted cash flow models and options pricing models as appropriate. All derivatives are carried as assets when fair value is positive and as liabilities when fair value is negative.
Certain derivatives embedded in other financial instruments, such as the equity option in an index linked instrument, are treated as separate derivatives when their economic
characteristics and risks are not closely related to those of the host contract and the host contract is not carried at fair value through profit or loss.
Changes in the fair value of derivatives are recognised immediately in the statement of comprehensive income and are included in net trading income.
i Leases
i) A group company is the lessee
The leases entered into by the Group which do not transfer substantially all the risk and benefits of ownership are classified as operating leases. The total payments made under operating leases are charged to other operating expenses in the statement of comprehensive income on a straight-line basis over the period of the lease.
When an operating lease is terminated before the lease period has expired, any payment required to be made to the lessor by way of penalty is recognised as an expense in the period in which termination takes place.
ii) A group company is the lessor
When assets are held subject to a finance lease, all associated risks and rewards incidental to legal ownership are substantially transferred by the lessor and therefore the present value of the lease payments is recognised as a receivable and reported in loans and advances to customers. Lease income is recognised over the term of the lease using the net investment method (before tax), which reflects a constant period rate of return.
Leases where the Group does not transfer substantially all the risk and benefits of ownership of the asset are classified as operating leases. Rental payments received under operating leases are recognised on a straight-line basis over the lease period.
j Intangible assets
i) Intangible assets acquired separately
Intangible assets acquired separately are reported at cost less accumulated amortisation and accumulated impairment losses. Amortisation is charged on a straight-line basis over their estimated useful lives. The estimated useful life and amortisation method are reviewed at the end of each annual reporting period, with the effect of any changes in estimate being accounted for on a prospective basis.
ii) Intangible assets acquired in a business combination
Intangible assets acquired in a business combination are identified and recognised separately from goodwill where they satisfy the definition of an intangible asset and their fair values can be measured reliably. The cost of such intangible assets is their fair value at the acquisition date.
Subsequent to initial recognition, intangible assets acquired in a business combination are reported at cost less accumulated amortisation and accumulated impairment losses, on the same basis as intangible assets acquired separately.
Amortisation is charged on a straight-line basis over the estimated useful lives of the intangible assets which are estimated to be 7 years.
k Impairment of tangible and intangible assets excluding goodwill
At each statement of financial position date, the Group reviews the carrying amounts of its tangible and intangible assets to determine whether there is any indication that those assets have suffered an impairment loss. If any such indication exists, the recoverable amount of the assets is estimated in order to determine the extent of the impairment loss (if any). Where it is not possible to estimate the recoverable amount of an individual assets, the Group estimates the recoverable amount of the cash-generating unit to which the assets belongs. Where a reasonable and consistent basis of allocation can be identified, corporate assets are also allocated to individual cash-generating units, or otherwise they are allocated to the smallest group of cash-generating units for which a reasonable and consistent allocation basis can be identified.
Intangible assets with indefinite useful lives and intangible assets not yet available for use are tested for impairment
annually, and whenever there is an indication that the asset may be impaired.
Recoverable amount is the higher of fair value less costs to sell and value in use. In assessing value in use the estimated future cash flows are discounted to their present value using a pre-tax discount rate that reflects current market assessments of the time value of money and the risks specific to the asset for which the estimates of future cash flows have not been adjusted.
If the recoverable amount of an assets (or cash-generating unit) is estimated to be less than its carrying amount, the carrying amount of the asset (cash-generating unit) is reduced to its recoverable amount. An impairment loss is recognised immediately in profit or loss, unless the relevant assets is carried at a revalued amount, in which case the impairment loss is treated as a revaluation decrease.
Where an impairment loss subsequently reverses, the carrying amount of the asset (or cash-generating unit) is increased to the revised estimate of its recoverable amount, but so that the increased carrying amount does not exceed the carrying amount that would have been determined had no impairment loss been recognised for the asset (or cash-generating unit) in prior years. A reversal of an impairment loss is recognised immediately in profit or loss, unless the relevant asset is carried at a revalued amount, in which case the reversal of the impairment loss is treated as a revaluation increase.
l Premises and equipment
Premises and equipment are stated at cost less accumulated depreciation and accumulated impairment losses.
Management reviews the estimated useful lives, residual values and method of depreciation at each period-end. Any changes are accounted for prospectively as a change in accounting estimate.
Depreciation is computed principally on the straight line method. Rates in effect are designed to write off the depreciable amounts of assets over their estimated useful lives. The following rates are used:
Furniture and equipment - 10% - 25%Computer equipment - 10% - 25%Motor vehicles - 25%
Gains and losses on disposal of premises and equipment are determined by reference to their carrying amounts and are taken into account in determining operating profit. Costs of repairs and renewals are charged to the statement of comprehensive income when the expenditure is incurred.
m Borrowings
Borrowings are initially recognised at fair value net of transaction costs incurred. Borrowings are subsequently stated at amortised cost. Any difference between proceeds net of transaction costs and the redemption value is recognised in the statement of comprehensive income over the period using the effective interest method.
n Provisions
Provisions are recognised when the Group has a present legal or constructive obligation as a result of past events, it is more likely than not that an outflow of resources will be required to settle the obligation and the amount has been reliably estimated.
The amount recognised as a provision is the best estimate of the consideration required to settle the present obligation at the end of the reporting period, taking into account the risks and uncertainties surrounding the obligation. Where a provision is measured using the cash flows estimated to settle the present obligation, its carrying amount is the present value of those cash flows.
Where there are a number of similar obligations, the likelihood that an outflow will be required in settlement is determined by considering the class of obligations as a whole. A provision is recognised even if the likelihood of an outflow with respect to any one item included in the same class of obligations may be small.

63
(expressed in Trinidad & Tobago dollars)31 October 2010 - continuedConsolidated Financial Statements
Notes to the consolidated financial statements
2 Significant accounting policies (continued)
o Retirement benefits
The Group’s employees are members of the ultimate parent company’s retirement plan. The plan is a defined contribution plan, the assets of which are held in a separate trustee-administered fund. The plan is funded by payments from the Group based on the recommendations of independent consultants who value the plan once every three years. The contributions are recognised as an employee benefit expense when they are due.
p Other post-retirement benefits
Some Group companies provide other post-retirement benefits to their retirees. The entitlement to these benefits is conditional on the employee remaining in service up to retirement age and the completion of a minimum service period. The cost of providing benefits is determined using the Projected Unit Method, with actuarial valuations being carried out at the end of each reporting period. Actuarial gains and losses that exceed 10 per cent of the greater of the present value of the Group’s defined benefit obligation and the fair value of plan assets as at the end of the prior year are amortised over the expected average remaining working lives of the participating employees. Past service cost is recognised immediately to the extent that the benefits are already vested, and otherwise is amortised on a straight-line basis over the average period until the benefits become vested.
A full valuation of these obligations is carried out by independent qualified actuaries every three years.
q Revenue recognition
i) Interest income and expense
Interest income and interest expense are recognised in the statement of comprehensive income for all interest bearing instruments on an accrual basis using the effective interest method.
The effective interest method is a method of calculating the amortised cost of a financial asset or a financial liability and of allocating the interest income and interest expense over the relevant period. The effective interest rate is the rate that exactly discounts estimated future cash payments or receipts through the expected life of the financial instrument or where appropriate, a shorter period to the net carrying amount of the financial asset or liability. When calculating the effective interest rate, the Group estimates cash flows considering all contractual terms of the financial instrument but does not consider future credit losses. The calculation includes all fees paid or received between parties to the contract that are an integral part of the effective interest rate, transactions costs and all other premiums or discounts.
ii) Fees and commissions
Fees and commissions are generally recognised on an accrual basis when the service has been provided. Loan commitment fees for loans that are likely to be drawn down are deferred and recognised as an adjustment to the effective interest rate on the loan. Loan syndication and underwriting fees are recognised as revenue when the service of syndication or underwriting has been completed and the Group has retained no part of the loan package for itself or has retained a part at the same effective interest rate as the other participants. Commissions and fees arising from negotiating, or participating in the negotiation of, a transaction for a third party – such as the arrangement of the acquisition of shares or other securities or the purchase or sale of businesses – are recognised on completion of the underlying transaction.
iii) Dividend income
Dividend income is recognised when the right to receive dividend is established.
r Dividends
Dividends that are proposed and declared during the period are accounted for as an appropriation of retained earnings in the statement of changes in equity.
Dividends that are proposed and declared after the statement of financial position date are not shown as a liability on the statement of financial position but are disclosed as a note to the consolidated financial statements.
s Taxation
Current tax
The tax currently payable is based on taxable profit for the year. Taxable profit differs from profit as reported in the consolidated statement of comprehensive income because of items of income or expense that are taxable or deductible in other years and items that are never taxable or deductible. The Group’s liability for current tax is calculated using tax rates that have been enacted or substantively enacted by the end of the reporting period.
Deferred tax
Deferred tax is recognised on temporary differences between the carrying amounts of assets and liabilities in the financial statements and the corresponding tax bases used in the computation of taxable profit. Deferred tax liabilities are generally recognised for all taxable temporary differences. Deferred tax assets are generally recognised for all deductible temporary differences to the extent that it is probable that taxable profits will be available against which those deductible temporary differences can be utilised. Such deferred tax assets and liabilities are not recognised if the temporary difference arises from goodwill or from the initial recognition (other than in a business combination) of other assets and liabilities in a transaction that affects neither the taxable profit nor the accounting profit.
Deferred tax liabilities are recognised for taxable temporary differences associated with investments in subsidiaries and associates, and interests in joint ventures, except where the Group is able to control the reversal of the temporary difference and it is probable that the temporary difference will not reverse in the foreseeable future. Deferred tax assets arising from deductible temporary differences associated with such investments and interests are only recognised to the extent that it is probable that there will be sufficient taxable profits against which to utilise the benefits of the temporary differences and they are expected to reverse in the foreseeable future.
The carrying amount of deferred tax assets is reviewed at the end of each reporting period and reduced to the extent that it is no longer probable that sufficient taxable profits will be available to allow all or part of the asset to be recovered.
Deferred tax assets and liabilities are measured at the tax rates that are expected to apply in the period in which the liability is settled or the asset realised, based on tax rates (and tax laws) that have been enacted or substantively enacted by the end of the reporting period. The measurement of deferred tax liabilities and assets reflects the tax consequences that would follow from the manner in which the Group expects, at the end of the reporting period, to recover or settle the carrying amount of its assets and liabilities.
Deferred tax assets and liabilities are offset when there is a legally enforceable right to set off current tax assets against current tax liabilities and when they relate to income taxes levied by the same taxation authority and the Group intends to settle its current tax assets and liabilities on a net basis.
Current and deferred tax for the period
Current and deferred tax are recognised as an expense or income in profit or loss, except when they relate to items that are recognised in other comprehensive income, in which case the tax is also recognised outside profit or loss, or where they arise from the initial accounting for a business combination. In the case of a business combination, the tax effect is taken into account in the accounting for the business combination.
t Offsetting
Financial assets and liabilities are offset and the net amount reported in the statement of financial position when there is
a legally enforceable right to set off the recognised amounts and there is an intention to settle on a net basis, or realise the asset and settle the liability simultaneously.
u Acceptances, guarantees, indemnities and letters of credit
The Group’s potential liability under acceptances, guarantees and letters of credit are reported as contingent liabilities. The Group has equal and offsetting claims against its customers in the event of a call on these commitments.
v Comparative information
Where necessary, comparative figures have been adjusted to conform with changes in presentation in the current period. Adjustments to previously reported results were made in accordance with International Accounting Standard #8 – Accounting policies, changes in accounting estimates and errors. The impact of these adjustments and reclassifications are summarized in Note 35 - Restatements and reclassifications.
3 Critical accounting estimates and judgements in applying accounting policies
The Group makes estimates and assumptions that affect the reported amounts of assets and liabilities within the next financial year. Estimates and judgements are continually evaluated and are based on historical experience and other factors, including expectations of future events that are believed to be reasonable under the circumstances.
a. Impairment losses on financial assets
The Group reviews its loan and investment portfolios to assess impairment at least on an annual basis. In determining whether an impairment loss should be recorded in the statement of comprehensive income, the Group makes judgements as to whether there is any observable data indicating that there is a measurable decrease in the estimated future cash flows from a portfolio of assets before the decrease can be identified with an individual asset in that portfolio. This evidence may include observable data indicating that there has been an adverse change in the payment status of borrowers in a group, or national or local economic conditions that correlate with defaults on assets in the group. Management uses estimates based on historical loss experience for assets with credit risk characteristics and objective evidence of impairment similar to those in the portfolio when scheduling its future cash flows. The methodology and assumptions used for estimating both the amount and timing of future cash flows are reviewed regularly to reduce any differences between loss estimates and actual loss experience.
b. Fair value of financial instruments including derivatives
The fair value of financial instruments which are not quoted in active markets are determined by using valuation techniques. Where valuation techniques (for example, models) are used to determine fair values, they are validated and periodically reviewed by qualified personnel independent of the area that created them. To the extent where practical, models use only observable data, however areas such as credit risk (both own and counterparty), volatilities and correlations require management to make estimates.
c. Income taxes
Estimates are required in determining the provision for income taxes. There are some transactions and calculations for which the ultimate tax determination is uncertain during the ordinary course of business. The Group recognises liabilities for anticipated tax issues based on estimates of whether additional taxes will be due. Where the final outcome of these matters is different from the amounts that were initially recorded, such differences will impact the income tax and deferred tax provisions in the period in which such determination is made.

64
(expressed in Trinidad & Tobago dollars)31 October 2010 - continuedConsolidated Financial Statements(expressed in Trinidad & Tobago dollars)
31 October 2010 - continuedConsolidated Financial Statements
Notes to the consolidated financial statements
3 Critical accounting estimates and judgements in applying accounting policies
d. Securitisations and special purpose entities
The Group supports the formation of special purpose entities (SPEs) primarily for the purpose of allowing clients to hold investments for asset securitisation purposes and for buying and selling credit protection. The Group does not consolidate SPEs that it does not control. As it can sometimes be difficult to determine whether the Group does control an SPE, it may make judgements about its exposure to the risks and rewards as well as about its ability to make operational decisions about the SPE in question. In many instances, elements are present that, when considered in isolation, indicate control or lack of control over an SPE, but when considered together, make it difficult to reach a clear conclusion. In such cases, the SPE is consolidated.
4 Cash on hand and due from banks
2010 2009 ($’000) ($’000)Cash on hand 3 4Short term investments 101,225 545,513Due from affiliated banks 128,100 200,103Items in the course of collection from other banks 79,052 300,079
308,380 1,045,699
Cash on hand comprises petty cash. Short term investments are funds with maturities of less than three months. Due from affiliated banks and other banks include deposits held on demand as well as items in the process of clearing.
5 Deposit with Central Bank
The Financial Institutions Act 2008 requires every non-banking financial institution to maintain a non-interest bearing deposit with the Central Bank of Trinidad and Tobago equivalent to 9% of deposits and other specified funding liabilities of the institution.
6 Investment in associated company and joint venture
Associated company 14,253 14,596Joint venture 125,103 111,252
139,356 125,848
6.1 Movement in the equity interest in associated company
Balance at beginning of period 14,596 14,448Share of current period profits 964 383Dividends 194 57Other reserve movements (1,501) (292)
Balance at end of period 14,253 14,596
The Group’s equity interest in its associated company, Park Court Limited, which was incorporated in Trinidad and Tobago, is as follows:
Profit % of Assets Liabilities Revenues after tax Interest ($’000) ($’000) ($’000) ($’000) heldAs at 31 October 2010 72,065 (62,289) 7,362 964 20%As at 31 March 2009 67,213 (52,325) 2,560 383 20%
6.2 Movement in interest in joint venture 2010 2009 ($’000) ($’000)
Balance at beginning of period 111,252 106,052Share of current period profits: 2010 16,301 10,199 Less : 2009 – adjustment -- (1,294)Tax on share of current period profits (2,010) 825Dividends received (10,549) (4,590)Purchase of additional shares 10,109 60
Balance at end of period 125,103 111,252
The Group’s equity interest in joint venture is as follows:
Country of Percentage of incorporation equity capital heldRGM Republic of Limited Trinidad and Tobago 33.30%
The Group’s 33.30% interest in RGM Limited comprises:
2010 2009 ($’000) ($’000)
Assets Investment properties 308,090 280,019Other non-current assets 43,882 33,967
351,972 313,986Current assets 14,493 14,880
366,465 328,866Liabilities Non-current liabilities 227,785 186,635Current liabilities 13,577 30,979
241,362 217,614
Net assets 125,103 111,252 Summary profit & loss account Income 72,644 45,814Expenses (56,343) (35,615)
Profit before tax 16,301 10,199Taxation (2,010) 825
Profit after tax 14,291 11,024Proportionate interest in joint venture’s commitments -- 12,703
7 Financial assets at fair value through profit or loss
Investment securities held for trading Government securities 4 304,756Corporate securities 190,442 753,365
190,446 1,058,121Interest receivable 871 5,818
191,317 1,063,939Loans held for trading Corporate loans 278,378 359,125Interest receivable 3,231 3,102
281,609 362,227
472,926 1,426,166
During the fiscal period, the Group reclassified some securities from fair value through profit and loss (including trading) amounting to $741,673,728 to loans and advances to customers. The maturity dates range from September 2013 to August 2023. The fair value loss included in the other comprehensive income relating to these securities amounted to $79,308,411.
Certain investment securities amounting to $396,782,423 (2009 - $1,410,221,530) have been pledged for the benefit of investors in other funding instruments (See Note 15).
8 Financial assets available for sale
Government securities 674,626 482,364Corporate securities 313,485 579,929
988,111 1,062,293Unearned interest (544) --Interest receivable 10,835 18,186
998,402 1,080,479Allowance for impaired financial assets available for sale (15,423) (11,837)
982,979 1,068,642
Certain investment securities amounting to $578,251,924 (2009 - $470,627,126) have been pledged for the benefit of investors in other funding instruments (See Note 15).
8.1 Allowance for impaired financial assets available for sale
2010 2009 ($’000) ($’000)
Balance at beginning of period 11,837 5,975Foreign exchange adjustment 131 (18)Charge against profits for the period 10,657 5,880Transfer of provision to receivables (7,202) --
15,423 11,837
8.2 Impairment losses on financial assets available for sale
Recoveries previously written off -- (1,432)Charge against profits for the period 10,657 5,880
10,657 4,448
9 Loans to customers
Sectoral analysisCommercial/corporate 1,352,485 885,014Mortgage 195,499 260,197Finance leases 19,947 21,799
Gross loans to customers 1,567,931 1,167,010 Unearned interest (83) (17,086)Interest receivable 19,168 11,234Allowance for impaired loans (11,219) (2,136)
1,575,797 1,159,022 Neither past due nor impaired 1,339,543 1,117,285Past due but not impaired 226,156 47,666Impaired 2,232 2,059
1,567,931 1,167,010
During the fiscal period, the Group reclassified some securities from fair value through profit and loss (including trading) amounting to $741,673,728 to loans and advances to customers. The fair value loss on these securities included in other comprehensive income amounts to $79,308,411. The effective interest rate ranged from 6.05% to 8.17% and the estimated cashflow to be recovered is $1,425,299,269.
During the fiscal period, certain loans amounting to $1,400,794,330 (2009 - $858,929,000) have been pledged for the benefit of investors in other funding instruments (See Note 15).
9.1 Allowance for impaired loans to customers
Balance at beginning of period 2,136 2,136Amounts previously provided for (2,136) --Increase in allowance 11,219 --
Balance at end of period 11,219 2,136 Collective 11,219 2,136
11,219 2,136
Allowance for impairment by sector
Commercial/Corporate -- --Mortgages 11,219 2,136
11,219 2,136
9.2 Impairment losses on loans and advance to customers
Direct write-offs 249,008 20Reversals (2,124) --Increase in allowance for the period 11,219 --
258,103 20
Impairment losses by sectorRetail -- 20Commercial/corporate 249,008 --Mortgages 9,095 --
258,103 20

65
(expressed in Trinidad & Tobago dollars)31 October 2010 - continuedConsolidated Financial Statements
Notes to the consolidated financial statements
9 Loans to customers (continued)
9.3 Maturity profile of gross investments in leased assets
2010 2009 ($’000) ($’000)
Within 1 year 1,530 2,1121 to 5 years 18,417 19,687Over 5 years -- --
19,947 21,799
10 Derivative financial instruments and other trading liabilities
Types
Derivative financial instruments are financial contracts whose values are derived from underlying interest rates, foreign exchange rates, equity or bond prices, commodity prices or indices. The Group utilises the following derivative instruments:
Interest rate swaps
These are financial transactions in which two counterparties exchange fixed and floating interest cash flows over a period of time based on rates applied to defined notional principal amounts.
Currency swaps
These are commitments to exchange one set of cash flows for another. Swaps result in an economic exchange of currencies and/or interest rates (for example fixed rate for floating rate, US for Euro etc.). The Group’s credit risk represents the potential cost to replace the swap contracts if counterparties fail to perform their obligation. The risk is monitored on an ongoing basis with reference to interest rates, curvature of the yield curve and foreign exchange rates. To control the level of risk taken, the Group assesses counterparties using the same techniques as for its lending activities.
Options
Options are contractual agreements under which the seller (writer) grants the purchaser the right, but not the obligation, either to buy (call option) or sell (put option) a security or other financial instrument at a pre-determined price, at or by a specified future date. The seller (writer) of and option can also settle the contract by paying the cash settlement value of the purchaser’s right. The seller (writer) receives a premium from the purchaser for this right. The Merchant Bank both writes and purchases options and the credit risk on these option contracts is limited as the counterparty to these contracts are other companies in the RBTT Group.
Notional amounts and fair values
The notional amount of certain types of financial instruments provide a basis for comparison with instruments recognised on the statement of financial position but do not necessarily indicate the amounts of future cash flows involved or the current fair value of the instruments and, therefore, do not indicate the Group’s exposure to credit or price risks. The derivative instruments become favourable (assets) or unfavourable (liabilities) as a result of fluctuations in market interest or foreign exchange rates, commodity prices or indices relative to their terms. The aggregate contractual or notional amount of derivative financial instruments on hand, the extent to which instruments are favourable or unfavourable and, thus the aggregate fair values of derivative financial assets and liabilities can fluctuate significantly from time to time. The notional amounts and fair values of derivative financial instruments held are set out in the following table:
Contract/ Fair values notional amount Assets Liabilities ($’000) ($’000) ($’000)Period ended 31 October 2010 Derivatives held for trading Interest rate swaps 545,821 13,167 40,178Currency swaps 1,024,133 997,644 1,044,570
1,010,811 1,084,748Other derivatives Written option 109,947 -- 32,105
1,010,811 1,116,853
Year ended 31 March 2009 Derivatives held for trading Interest rate swaps 1,007,353 72,966 50,263Currency swaps 1,282,658 1,377,449 1,319,428
1,450,415 1,369,691Other derivatives Written option 118,997 -- 33,361
1,450,415 1,403,052
Credit risk
Credit risk from derivative transactions is generated by the potential for the counterparty to default on its contractual obligations. The Group restricts its exposure to credit losses on derivative instruments by entering into master netting arrangements contained in the “ISDA Agreements” with its counterparties and where applicable supplements its position with collateral.
11 Equipment
Furniture Computer and Motor equipment equipment vehicles Total ($’000) ($’000) ($’000) ($’000)Period ended 31 October 2010 Opening net book value 1,099 1,625 889 3,613Additions 183 66 219 468Disposals (28) -- (244) (272)Depreciation charge (578) (268) (287) (1,133)
Closing net book value 676 1,423 577 2,676 At 31 October 2010 Cost 6,585 4,281 1,106 11,972Accumulated depreciation (5,909) (2,858) (529) (9,296)
Net book value 676 1,423 577 2,676
Year ended 31 March 2009 Opening net book value 1280 1,733 1,243 4,256Additions 256 73 340 669Disposals (2) (1) (379) (382)Depreciation charge (435) (180) (315) (930)
Closing net book value 1,099 1,625 889 3,613 At 31 March 2009 Cost 6,453 4,207 1,515 12,175Accumulated depreciation (5,354) (2,582) (626) (8,562)
Net book value 1,099 1,625 889 3,613
12 Intangible assets - software
2010 2009 ($’000) ($’000)Opening net carrying value -- --Additions 10,016 --Amortisation Charge for the period (251) --
Closing net carrying amount 9,765 --
Cost 10,016 --Accumulated amortisation (251) --
Net Book Value 9,765 --
13 Other assets 2010 2009 ($’000) ($’000)Matured investments 5,971 232,000Receivable from investments sold 255,906 --Other 33,816 15,294
295,693 247,294
14 Customers’ deposits
Deposit balances 272,850 276,227Accrued interest 4,092 5,667
276,942 281,894 Sectoral analysis Consumers 255,291 203,682Private sector 15,663 70,497Other 1,896 2,048
272,850 276,227
15 Other funding instruments
Other funding instruments 1,734,686 2,897,636Accrued interest 36,959 47,276
1,771,645 2,944,912 Sectoral analysis Consumers 707,188 420,742Private sector 332,823 2,261,369State sector 590,517 215,525Banks 104,158 --
1,734,686 2,897,636
Loans and other financial assets amounting to $2,375,828,677 (2009 - $2,739,777,656) have been pledged for the benefit of investors in other funding instruments.
16 Other borrowed funds
Other borrowed funds 500,736 638,026Accrued Interest 3,634 5,358
504,370 643,384
In a continued effort to diversify its funding base, the Group has entered into several loan arrangements with various international financing institutions with maturities up to three years. Interest rates as at 31 October 2010 ranged from .25% to 6.19% (2009 – 3.09% to 6.19%).
17 Deferred tax
Deferred tax assetProvision for impairment losses on loans and financial assets 2,700 534 Defined pension benefit 1,073 -- Financial assets at fair value through profit and loss 25,879 35,314 Financial assets available for sale -- 28,619 Derivative financial instrument 277,192 342,423
Total deferred tax asset 306,844 406,890
Total deferred tax liability Accelerated tax depreciation 1,194 140 Derivative financial instrument 252,703 342,736 Financial assets available for sale 6,776 (45)
Total deferred tax liability 260,673 342,831
Deferred tax liability/(asset) The movement on the deferred tax account is as follows:
At the beginning of the period (64,059) 73,697Investment revaluation reserve - fair value (losses)/gains 35,854 (44,754)- transfer to statement of comprehensive income (459) 1,896Statement of comprehensive income (see Note 26) - current period (17,507) (94,898)
At the end of the period (46,171) (64,059)
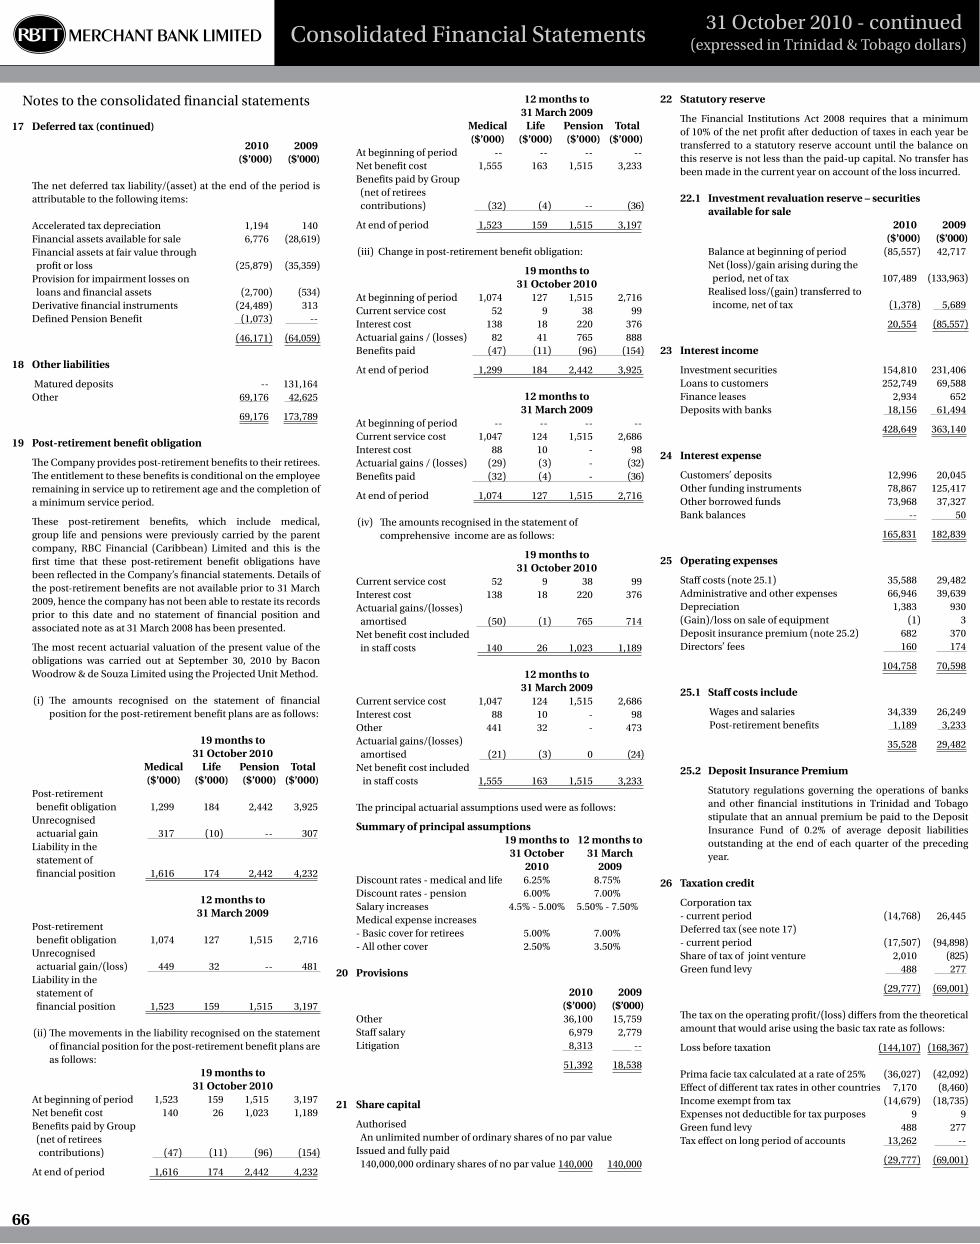
66
(expressed in Trinidad & Tobago dollars)31 October 2010 - continuedConsolidated Financial Statements(expressed in Trinidad & Tobago dollars)
31 October 2010 - continuedConsolidated Financial Statements
Notes to the consolidated financial statements
17 Deferred tax (continued)
2010 2009 ($’000) ($’000)
The net deferred tax liability/(asset) at the end of the period is attributable to the following items: Accelerated tax depreciation 1,194 140Financial assets available for sale 6,776 (28,619)Financial assets at fair value through profit or loss (25,879) (35,359)Provision for impairment losses on loans and financial assets (2,700) (534)Derivative financial instruments (24,489) 313Defined Pension Benefit (1,073) --
(46,171) (64,059)
18 Other liabilities
Matured deposits -- 131,164Other 69,176 42,625
69,176 173,789
19 Post-retirement benefit obligation
The Company provides post-retirement benefits to their retirees. The entitlement to these benefits is conditional on the employee remaining in service up to retirement age and the completion of a minimum service period.
These post-retirement benefits, which include medical, group life and pensions were previously carried by the parent company, RBC Financial (Caribbean) Limited and this is the first time that these post-retirement benefit obligations have been reflected in the Company’s financial statements. Details of the post-retirement benefits are not available prior to 31 March 2009, hence the company has not been able to restate its records prior to this date and no statement of financial position and associated note as at 31 March 2008 has been presented.
The most recent actuarial valuation of the present value of the obligations was carried out at September 30, 2010 by Bacon Woodrow & de Souza Limited using the Projected Unit Method.
(i) The amounts recognised on the statement of financial position for the post-retirement benefit plans are as follows:
19 months to 31 October 2010 Medical Life Pension Total ($’000) ($’000) ($’000) ($’000)Post-retirement benefit obligation 1,299 184 2,442 3,925Unrecognised actuarial gain 317 (10) -- 307Liability in the statement of financial position 1,616 174 2,442 4,232
12 months to 31 March 2009Post-retirement benefit obligation 1,074 127 1,515 2,716 Unrecognised actuarial gain/(loss) 449 32 -- 481 Liability in the statement of financial position 1,523 159 1,515 3,197
(ii) The movements in the liability recognised on the statement of financial position for the post-retirement benefit plans are as follows:
19 months to 31 October 2010At beginning of period 1,523 159 1,515 3,197 Net benefit cost 140 26 1,023 1,189 Benefits paid by Group (net of retirees contributions) (47) (11) (96) (154)
At end of period 1,616 174 2,442 4,232
12 months to 31 March 2009 Medical Life Pension Total ($’000) ($’000) ($’000) ($’000)At beginning of period -- -- -- --Net benefit cost 1,555 163 1,515 3,233Benefits paid by Group (net of retirees contributions) (32) (4) -- (36)
At end of period 1,523 159 1,515 3,197
(iii) Change in post-retirement benefit obligation:
19 months to 31 October 2010At beginning of period 1,074 127 1,515 2,716 Current service cost 52 9 38 99 Interest cost 138 18 220 376 Actuarial gains / (losses) 82 41 765 888 Benefits paid (47) (11) (96) (154)
At end of period 1,299 184 2,442 3,925
12 months to 31 March 2009At beginning of period -- -- -- -- Current service cost 1,047 124 1,515 2,686 Interest cost 88 10 - 98 Actuarial gains / (losses) (29) (3) - (32)Benefits paid (32) (4) - (36)
At end of period 1,074 127 1,515 2,716
(iv) The amounts recognised in the statement of comprehensive income are as follows:
19 months to 31 October 2010Current service cost 52 9 38 99 Interest cost 138 18 220 376 Actuarial gains/(losses) amortised (50) (1) 765 714 Net benefit cost included in staff costs 140 26 1,023 1,189
12 months to 31 March 2009Current service cost 1,047 124 1,515 2,686 Interest cost 88 10 - 98 Other 441 32 - 473Actuarial gains/(losses) amortised (21) (3) 0 (24)Net benefit cost included in staff costs 1,555 163 1,515 3,233
The principal actuarial assumptions used were as follows:
Summary of principal assumptions 19 months to 12 months to 31 October 31 March 2010 2009Discount rates - medical and life 6.25% 8.75%Discount rates - pension 6.00% 7.00%Salary increases 4.5% - 5.00% 5.50% - 7.50%Medical expense increases - Basic cover for retirees 5.00% 7.00%- All other cover 2.50% 3.50%
20 Provisions
2010 2009 ($’000) ($’000)Other 36,100 15,759Staff salary 6,979 2,779Litigation 8,313 --
51,392 18,538
21 Share capital
Authorised An unlimited number of ordinary shares of no par value Issued and fully paid 140,000,000 ordinary shares of no par value 140,000 140,000
22 Statutory reserve
The Financial Institutions Act 2008 requires that a minimum of 10% of the net profit after deduction of taxes in each year be transferred to a statutory reserve account until the balance on this reserve is not less than the paid-up capital. No transfer has been made in the current year on account of the loss incurred.
22.1 Investment revaluation reserve – securities available for sale
2010 2009 ($’000) ($’000)
Balance at beginning of period (85,557) 42,717Net (loss)/gain arising during the period, net of tax 107,489 (133,963)Realised loss/(gain) transferred to income, net of tax (1,378) 5,689
20,554 (85,557)
23 Interest income
Investment securities 154,810 231,406Loans to customers 252,749 69,588Finance leases 2,934 652Deposits with banks 18,156 61,494
428,649 363,140
24 Interest expense
Customers’ deposits 12,996 20,045Other funding instruments 78,867 125,417Other borrowed funds 73,968 37,327Bank balances -- 50
165,831 182,839
25 Operating expenses
Staff costs (note 25.1) 35,588 29,482Administrative and other expenses 66,946 39,639Depreciation 1,383 930(Gain)/loss on sale of equipment (1) 3Deposit insurance premium (note 25.2) 682 370Directors’ fees 160 174
104,758 70,598
25.1 Staff costs include
Wages and salaries 34,339 26,249Post-retirement benefits 1,189 3,233
35,528 29,482
25.2 Deposit Insurance Premium
Statutory regulations governing the operations of banks and other financial institutions in Trinidad and Tobago stipulate that an annual premium be paid to the Deposit Insurance Fund of 0.2% of average deposit liabilities outstanding at the end of each quarter of the preceding year.
26 Taxation credit
Corporation tax - current period (14,768) 26,445Deferred tax (see note 17) - current period (17,507) (94,898)Share of tax of joint venture 2,010 (825)Green fund levy 488 277
(29,777) (69,001)
The tax on the operating profit/(loss) differs from the theoretical amount that would arise using the basic tax rate as follows:
Loss before taxation (144,107) (168,367) Prima facie tax calculated at a rate of 25% (36,027) (42,092)Effect of different tax rates in other countries 7,170 (8,460)Income exempt from tax (14,679) (18,735)Expenses not deductible for tax purposes 9 9Green fund levy 488 277Tax effect on long period of accounts 13,262 --
(29,777) (69,001)

67
(expressed in Trinidad & Tobago dollars)31 October 2010 - continuedConsolidated Financial Statements
Notes to the consolidated financial statements
26 Taxation charge/(credit) (continued)
The deferred income tax (credit)/charge for the period comprises the following temporary differences: 2010 2009 ($’000) ($’000)Accelerated tax depreciation 1,054 57Financial assets at fair value through profit or loss 9,481 (52,780)Provision for impairment losses on loans and financial assets (2,166) --Derivative financial instruments (24,803) (42,175)Defined pension benefit (1,073) --
(17,507) (94,898)
27 Dividends
No interim or final dividend has been proposed in respect of the current period.
Dividends accounted for as an appropriation of retained earnings are as follows:
Final dividend for 2008 - $0.65 per share -- 90,545
28 Related Party Transactions
Parties are considered to be related if one party has the ability to control the other party or exercise significant influence over the other party in making financial or operational decisions. The ultimate parent of the Group is Royal Bank of Canada which owns 100% of the Group. A number of banking transactions are entered into with related parties in the normal course of business. These transactions are carried out on commercial terms and conditions and at market rates.
(i) Outstanding balances and related income and expense:
Cash and short term funds Affiliated companies 9,738 462,584 Investment securities Affiliated companies 2 60,419Joint Venture 12,959 14,118
12,961 74,537
Loans to customers Affiliated companies 10,067 15,434 Derivative financial instruments Affiliated companies (13,072) (33,361) Other assets Affiliated companies 256,329 3,995 Deposits and other liabilities Affiliated companies 111,162 594,542 Interest income Directors and key management personnel -- 6,575Affiliated companies 18,382 41,052
18,382 47,627 Net trading income/loss Parent company -- (48,986)Affiliated companies 13,668 221
13,668 (48,765) Fees and commissions Parent company 18 --Affiliated companies 2,502 6,791
2,520 6,791
(i) Outstanding balances and related income and expense (continued)
2010 2009 ($’000) ($’000)Interest expense Affiliated companies 10,683 13,298 Other operating expenses Affiliated companies 42,746 26,500
(ii) Key management compensation
Salaries and other short term benefits 5,603 7,810Bonus -- 1,611
5,603 9,421
29 Contingent liabilities, guarantees and operating lease commitments
a) Legal proceedings
As at 31 October 2010, there were certain legal proceedings outstanding against the Group for which a provision has been made of $8.3 million based on the likely loss that will eventuate.
b) Customers’ liabilities under acceptances, guarantees, indemnities and letters of credit
These represent the Group’s potential liability for which there are equal and offsetting claims against its customers in the event of a call on these commitments. These amounts are not reflected in the statement of financial position.
Guarantees, acceptances, indemnities and letters of credit 109,025 104,660
30 Credit commitments
Commitments of a credit nature which fall within the capital adequacy requirements specified in the Financial Institutions (Prudential Criteria) Regulations 1994 are: Undisbursed loan funds 7,521 81,653
31 Capital commitments
There are no commitments for capital expenditure at period-end (2009 - $nil).
32 Financial risk management
32.1 Risk management
Risk is inherent in the Group’s activities but it is managed through a process of ongoing identification, measurement and monitoring subject to risk limits and other controls. This process of risk management is critical to the Group’s continuing profitability and each individual company within the Group is accountable for the risk exposures relating to its responsibilities. The Group is exposed to credit risk, liquidity risk and market risk, the latter being subdivided into trading and non-trading risks.
Risk management structureThe Board of Directors is ultimately responsible for identifying and controlling risks; however, there are separate independent bodies responsible for managing and monitoring risks, some of which operate at the level of the ultimate parent.
Board of directorsThe Board of Directors is responsible for the overall risk management approach and for approving the risk strategies and principles.
Parent board risk committeeThe Board of Directors discharges its responsibility for overall risk management through the Board Risk Committee which has the overall responsibility to oversee the development, interpretation and implementation to Group policies for identifying, evaluating, monitoring and measuring the significant risks to which the Group is exposed. The Committee also approves all new policies and reviews such policies annually to ensure that they remain appropriate and prudent.
Parent board credit and investment committeeThis Committee is comprised of three (3) Non-Executive Directors of the parent company together with the Group CEO.
The Committee is responsible for the review and approval of all credits over limits delegated to management throughout the Group. The Committee also reviews the amount, nature, risk characteristics and concentration of the Group’s credit portfolio and ensures appropriate responses to changing conditions.
Group risk management unitA centralised Risk Management Unit provides oversight of the implementation and maintenance of risk related procedures to ensure an independent control process. The unit which is sub-divided into three departments (Group Market Risk, Group Credit Risk and Group Compliance and Operational Risk), is also responsible for monitoring compliance with risk policies and limits across the Group in the three key areas of credit risk, market risk and operational risk. Each business group has decentralised units which are responsible for the independent control of risks, including monitoring the risk or exposures against limits and the assessment of risks of new products and structured transactions. These decentralised units also ensure the complete capture of the risks in the risk measurement and reporting systems. Group asset/liability committee (ALCO)The Group ALCO has a mandate which includes the recommendation of policies covering investments, liquidity and market risk to the parent Board, and the monitoring of compliance with risk policies and limits in the areas of credit risk and market risk.
Mark to market committeeThe Group has established a Mark to Market Committee which is responsible for the review and validation of the policies and procedures applied in the valuation of financial assets and liabilities.
Internal auditRisk management processes throughout the Group are audited annually by the internal audit function that examines both the adequacy of the procedures and the Group’s compliance with the procedures. Internal Audit discusses the results of all assessments with management, and reports its findings and recommendations to the parent Board Audit Committee and subsidiary boards’ Audit Committees.
Risk measurement and reporting systemsThe Group’s risks are measured using methods which reflect the expected loss likely to arise in normal circumstances.
Monitoring and controlling risks is primarily performed based on limits established by the Group. These limits reflect the business strategy and market environment of the Group as well as the level of risk that the Group is willing to accept, with additional emphasis on selected industries and geographies.
Information compiled from all the business units is examined and processed in order to analyse, control and identify early risks. This information which consist of several reports is presented and explained to the Board of Directors, the Board Committees, the Asset/Liability Committees, and the head of each business division. The reports include but are not limited to aggregate credit exposure, open currency positions, liquidity ratios and risk profile changes. On a quarterly basis senior management assesses the appropriateness of the allowance for credit losses.
For all levels throughout the Group, specifically tailored risk reports are prepared and distributed in order to ensure that all business units have access to necessary and up-to-date information.
Risk mitigationAs part of its overall risk management, the Group uses derivatives and other instruments to manage exposures resulting from changes in interest rates, foreign currencies.
The risk profile is assessed before entering into hedge transactions, which are authorised by the appropriate level of seniority within the Group. The effectiveness of hedges is assessed by the Group Market Risk and Group Finance units (based on economic considerations). The effectiveness of all the hedge relationships is monitored by the Group Market Risk Unit monthly.
The Group actively uses collateral to reduce its credit risks.

68
(expressed in Trinidad & Tobago dollars)31 October 2010 - continuedConsolidated Financial Statements
Notes to the consolidated financial statements
32 Financial risk management (continued)
32.2 Liquidity risk
Liquidity risk is the risk that the Group will be unable to meet its payment obligations when they fall due under normal and stress circumstances. To limit this risk, management has arranged diversified funding sources in addition to its core deposit base, manages assets with liquidity in mind, and monitors future cash flows and liquidity on a daily basis. This incorporates an assessment of expected cash flows and the availability of high grade collateral which could be used to secure additional funding if required.
The Group’s liquidity management process is carried out by the Treasury department of each business unit and monitored by Group ALCO. The Group’s liquidity management framework is designed to ensure that there are adequate reserves of cash and other liquid securities to satisfy current and prospective commitments arising from either on-balance sheet or off-balance sheet liabilities. The Group manages liquidity risk by preserving a large and diversified base of core client deposits, by maintaining ongoing access to wholesale funding and by maintaining a liquid pool of marketable securities dedicated to mitigating liquidity risk as a contingency measure. Each business unit has conservative internal liquidity requirements, defined by the Group’s liquidity management framework, which are at least equal to, but generally greater than, the statutory liquidity requirements.
32.2.1 Categories of financial instruments
The table below presents the classification assets, liabilities and equity instruments by the Group at the statement of financial position date.
2010 2009 ($’000) ($’000)Assets Financial assets at fair value through profit or loss 472,926 1,426,166Derivative financial instruments 1,010,811 1,450,415
1,483,737 2,876,581Financial assets at available for sale Investment securities 982,979 1,068,643
Loans and receivables Cash on hand and due from banks 308,380 1,045,699Balances with central banks 58,440 45,103Loans and advances to customers 1,575,797 1,159,022Other assets 283,380 246,788
2,225,997 2,496,612
Total financial assets 4,692,713 6,441,836
Non-financial assets 523,720 562,775
Total assets 5,216,433 7,004,611
Liabilities Financial liabilities at fair value through profit or loss Derivative financial instruments 1,116,853 1,403,052
Financial liabilities at amortised cost Customers’ deposits 276,942 281,894Other funding instruments 1,771,645 2,944,912Other borrowed funds 504,370 643,384Other liabilities 44,910 166,929
2,597,867 4,037,119
Total financial liabilities 3,714,720 5,440,171
Non-financial liabilities 340,563 395,071
Total liabilities 4,055,283 5,835,242
Total equity instruments 1,161,150 1,169,369
Total equity and liabilities 5,216,433 7,004,611 32.2.2 Non-derivative cash flows
The table below presents the cash flows payable by the Group under non-derivative financial liabilities by remaining contractual maturities at the statement of financial position date.
Up to One to Over one five five year years years Total ($’000) ($’000) ($’000) ($’000)As at 31 October 2010 Liabilities Customers’ deposits 216,760 60,182 -- 276,942Other funding instruments 1,431,789 339,856 -- 1,771,645Other borrowed funds 146,828 285,498 72,044 504,370Other liabilities 44,910 -- -- 44,910 Total liabilities (contractual maturity dates) 1,840,287 685,536 72,044 2,597,867 Credit commitments Loan credit commitments 7,521 -- -- 7,521
As at 31 March 2009 Liabilities Customers’ deposits 240,324 41,570 -- 281,894Other funding instruments 2,524,224 419,457 1,231 2,944,912Other borrowed funds 5,358 628,056 9,970 643,384Other liabilities 166,929 -- -- 166,929 Total liabilities (contractual maturity dates) 2,936,835 1,089,083 11,201 4,037,119 Credit commitments Loan credit commitments 36,927 44,726 -- 81,653
32.2.3 Derivative cash flows
The table below analyses the Group’s derivative financial instruments that will be settled on a gross basis into relevant maturity groupings based on the remaining period at the statement of financial position date to the contractual maturity date. The amounts disclosed in the table are the contractual undiscounted cash flows.
a) Derivatives settled on a gross basis Up to One to Over one five five year years years Total ($’000) ($’000) ($’000) ($’000)As at 31 October 2010 Foreign exchange derivatives - Outflow (301,185) (504,903) (357,362) (1,163,450)- Inflow 307,555 509,287 266,488 1,083,330 Interest rate derivatives - Outflow (16,172) (27,633) (19,922) (63,727)- Inflow 11,146 9,827 14,689 35,662
Total outflow (317,357) (532,536) (377,284) (1,227,177)
Total inflow 318,701 519,114 281,177 1,118,992
b) Derivatives settled on a gross basis
As at 31 March 2009 Foreign exchange derivatives - Outflow (139,992) (732,475) (628,096) (1,500,563)- Inflow 165,320 782,480 460,527 1,408,327 Interest rate derivatives - Outflow (23,688) (64,383) (8,884) (96,955)- Inflow 27,933 81,823 12,903 122,659
Total outflow (163,680) (796,858) (636,980) (1,597,518)
Total inflow 193,253 864,303 473,430 1,530,986
32.3 Market risk
The Group takes on exposure to market risks, which is the risk that the fair value or future cash flows of a financial instrument will fluctuate because of changes in market prices. Market risks arise from open positions in interest rate, currency and equity products, all of which are exposed to general and specific market movements and changes in the level of volatility of market rates
or prices such as interest rates, credit spreads, foreign exchange rates and equity prices. The Group separates exposures to market risk into either trading or non-trading portfolios.
The market risks arising from trading and non-trading activities are measured separately by the Group Market Risk department who submits on a regular basis the Mark to Market Committee reviews and approves the valuation of all investment securities and derivatives. Additionally, reports are submitted to the Group Asset/Liability Committee on a regular basis. Additionally, on a quarterly basis, the Mark to Market Committee reviews and approves the valuation of all investment securities, derivatives and trading liabilities.
Trading portfolios include those portfolios arising from market-making transactions where the Group acts as a principal with clients or with the market.
Non-trading portfolios primarily arise from the interest-rate management of the Group’s retail and commercial banking assets and liabilities. Non-trading portfolios also consist of interest rate, foreign exchange and equity risks arising from the Group’s available for sale investments.
32.3.1 Market risk measurement techniques
The major measurement techniques used to measure and control market risk is stress testing.
The Group applies stress tests to provide an indication of the potential size of losses that could arise in extreme conditions. The stress tests carried out by Group Market Risk include changes in the general level of interest rates and the depreciation of foreign currency rates on the Group’s position. The impact of the stress test is measured to calculate the effect on net interest income. The test does not impact on fair values.
32.4 Interest rate risk
Interest rate risk arises from the possibility that changes in interest rates will affect future cash flows or the fair values of financial instruments. The Board has established limits on the level of mismatch of interest rate repricing that may be taken, which is monitored by the Treasurers and Asset/Liability Committees of group companies.
32.4.1 Sensitivity analysis
Sensitivity analyses were conducted to determine the effect on net profit and other components of equity arising from a reasonable change in interest rates with all other variables held constant. Effect on other Change in Effect compre- interest on profit hensive rates before tax income (%) ($’000) ($’000)Year ended 31 October 2010 Increase in interest ratesTTD 1.00 2,297 (6,500)USD 1.00 (9,641) (48,983)XCD 1.00 (507) 85BBD 1.00 (52) 12EUR 1.00 5,552 (5,220)
(2,351) (60,606)
Year ended 31 March 2009 Increase in interest rates TTD 1.00 (5,167) (10,885)USD 1.00 8,796 (52,694)XCD 1.00 (99) (214)BBD 1.00 (726) (5,310)EUR 1.00 (4,453) 26,067
(1,649) (43,036)
Year ended 31 October 2010 Decrease in interest rates TTD 1.00 (2,297) 6,500USD 1.00 9,641 48,983XCD 1.00 507 (85)BBD 1.00 52 (12)EUR 1.00 (5,552) 5,220
2,351 60,606

69
(expressed in Trinidad & Tobago dollars)31 October 2010 - continuedConsolidated Financial Statements
Notes to the consolidated financial statements
32 Financial risk management (continued)
32.4 Interest rate risk (continued)
32.4.1 Sensitivity analysis (continued)
Effect on other Change in Effect compre- interest on profit hensive rates before tax income (%) ($’000) ($’000)Year ended March 31, 2009 Decrease in interest ratesTTD 1.00 5,167 10,885USD 1.00 (8,796) 52,694XCD 1.00 99 214BBD 1.00 726 5,310EUR 1.00 4,543 (26,067)
1,739 43,036
32.4.2 Interest sensitivity of assets and liabilities to re-pricing risk
The table below summarises the Group’s exposure to interest rate re-pricing risk. It includes the Group’s financial instruments at carrying amounts, categorised by the earlier of contractual re-pricing or maturity dates.
Up to One to Over one five five year years years Total ($’000) ($’000) ($’000) ($’000)As at 31 October 2010 Assets Cash on hand and due from banks 308,380 -- -- 308,380Balances with Central Bank 58,440 -- -- 58,440Financial assets at fair value through profit or loss 400,883 40,656 31,387 472,926Financial assets available for sale 228,668 583,640 170,671 982,979Loans and advances to customers 632,460 455,395 487,942 1,575,797Derivatives 1,010,811 -- -- 1,010,811Other Assets 283,380 -- -- 283,380
Total financial assets 2,923,022 1,079,691 690,000 4,692,713 Liabilities Customers’ deposits 216,760 60,182 -- 276,942Other funding instruments 1,431,789 339,856 -- 1,771,645Other borrowed funds 146,828 285,498 72,044 504,370Derivatives 1,116,853 -- -- 1,116,853Other liabilities 44,910 -- -- 44,910Total financial liabilities 2,957,140 685,536 72,044 3,714,720
Interest sensitivity gap (34,118) 394,155 617,956 977,993
As at 31 March 2009 Assets Cash on hand and due from banks 1,045,699 -- -- 1,045,699Balances with Central Bank 45,103 -- -- 45,103Financial assets at fair value through profit or loss 174,029 497,737 754,400 1,426,166Financial assets available for sale 506,653 186,706 375,283 1,068,642Loans and advances to customers 882,332 192,625 84,065 1,159,022Derivatives 1,450,415 -- -- 1,450,415Other assets 246,789 -- -- 246,789
Total financial assets 4,351,020 877,068 1,213,748 6,441,836
Up to One to Over one five five year years years Total ($’000) ($’000) ($’000) ($’000)
Liabilities Customers’ deposits 240,324 41,570 -- 281,894Other funding instruments 2,524,224 419,457 1,231 2,944,912Other borrowed funds 21,738 611,676 9,970 643,384Derivatives 1,403,052 -- -- 1,403,052Other liabilities 166,929 -- -- 166,929Total financial liabilities 4,356,267 1,072,703 11,201 5,440,171
Interest sensitivity gap (5,247) (195,635) 1,202,547 1,001,665
32.5 Currency risk
Currency risk is the risk that the value of a financial instrument will fluctuate due to changes in foreign exchange rates. The Board has set limits on positions by currency. Positions are monitored on a daily basis and hedging strategies are used to ensure positions are maintained within established limits.
32.5.1 Concentrations of currency risk – on and off-balance sheet financial instruments
Assets are primarily funded by like currency liabilities thus reducing the element of cross-currency risk and in most regional markets US dollar denominated transactions must be officially sanctioned by the relevant authorities thus reducing exposure. Currency exposure resides mainly in trading activity. The tables below summarise the Group’s exposure to foreign currency exchange rate risk as at 31 October 2010 and 31 March 2009 respectively.
TTD USD XCD BBD EUR Total ($’000) ($’000) ($’000) ($’000) ($’000) ($’000)As at 31 October 2010 Assets Cash on hand and due from banks 98,466 149,486 3,932 348 56,148 308,380Cash with Central Bank 58,440 -- -- -- -- 58,440Financial assets at fair value through profit or loss 213,242 187,470 -- 72,214 -- 472,926Financial assets available for sale 386,913 596,066 -- -- -- 982,979Loans 634,243 941,554 -- -- -- 1,575,797Derivative financial instruments 62,813 947,998 -- -- -- 1,010,811Other assets (172) 27,166 2 -- 256,384 283,380Total financial assets 1,453,945 2,849,740 3,934 72,562 312,532 4,692,713 Liabilities Customer’s deposits 170,137 104,369 2,436 -- -- 276,942Other funding instruments 403,553 1,309,405 2,301 263 56,123 1,771,645Other borrowed funds -- 432,153 -- 72,217 -- 504,370Derivative financial instruments 629,168 161,851 -- -- 325,834 1,116,853Other liabilities (17,925) 62,835 -- -- -- 44,910Total financial liabilities 1,184,933 2,070,613 4,737 72,480 381,957 3,714,720 Net balance sheet position 269,012 779,127 (803) 82 (69,425) 977,993Credit commitments -- 7,521 -- -- -- 7,521
As at 31 March 2009 Total financial assets 1,754,647 3,709,566 38,440 103,380 835,803 6,441,836Total financial liabilities 1,477,717 3,421,077 6,135 95,962 439,280 5,440,171Net balance sheet position 276,930 288,489 32,305 7,418 396,523 1,001,665Credit commitments -- 81,653 -- -- -- 81,653
32.5.2 Sensitivity analysis
Foreign currency exchange risk
The tables below demonstrate the sensitivity to reasonable possible movement of select currencies against the Trinidad and Tobago dollar to which the Group had significant exposure at 31 October 2010 and 31 March 2009 in respect of its non-trading financial assets and liabilities holding all other variables constant. Effect on other Change in Effect compre- exchange on profit hensive rates before tax income (%) ($’000) ($’000)Year ended 31 October 2010 Increase in exchange rates USD 1.00 7,681 110XCD 1.00 (8) --EUR 1.00 1 --BBD 1.00 (694) --
6,980 110Decrease in exchange rates USD 1.00 (7,681) (110)XCD 1.00 8 --EUR 1.00 (1) --BBD 1.00 694 --
(6,980) (110)
Year ended 31 March 2009 Increase in exchange rates USD 1.00 4,030 (1,145)XCD 1.00 323 --EUR 1.00 3,965 --BBD 1.00 74 --
8,392 (1,145)Decrease in exchange rates USD 1.00 (4,030) 1,145XCD 1.00 (323) --EUR 1.00 (3,965) --BBD 1.00 (74) --
(8,392) 1,145
32.6 Credit risk
Credit risk is the risk that the Group will incur a loss because its customers, clients or counterparties failure to discharge their contractual obligations. The Group manages and controls credit risk by setting limits on the amount of risk it is willing to accept for individual counterparties and for geographical and industry concentrations, and by monitoring exposures in relation to such limits.
The Group has established a credit quality review process to provide early identification of possible changes in the credit worthiness of counterparties, including regular collateral reviews. Counterparty limits are established by the use of a credit risk classification system, which assigns each counterparty a risk rating. Risk ratings are subject to regular revision. For the retail portfolio, the Group has stringent lending criteria which include conservative debt service coverage, loan to value ratios and stability earnings. These exposures are continuously monitored to identify any change in credit worthiness of the borrower. The credit quality review process allows the Group to assess the potential loss as a result of the risks to which it is exposed and take corrective action.
32.6.1 Credit risk management
a) Loans to customers
The Group measures the credit risk of loans to Corporate and Commercial customers and to banks at the counterparty level using an internal risk rating matrix. The ratings are generated by combining weighted financial and statistical criteria with credit officer judgement which is mapped against established internal benchmarks at the time credit is granted. The Group risk rating is seven tiered as showed below and reflects the perceived counterparty risk. This means that, in principle exposures migrate between levels as assessment of their riskiness changes. The risk weightings and internal benchmarks are consistently reviewed and upgraded as necessary.
(expressed in Trinidad & Tobago dollars)31 October 2010 - continuedConsolidated Financial Statements

70
(expressed in Trinidad & Tobago dollars)31 October 2010 - continuedConsolidated Financial Statements
Notes to the consolidated financial statements
32 Financial risk management (continued)
32.6 Credit risk (continued)
32.6.1 Credit risk management (continued)
a) Loans to customers (continued)
Group’s internal ratings scale and mapping of external ratings
Group’s rating Description of the grade Credit quality1 Excellent High grade2 Very Good High grade3 Good Standard grade4 Special Mention Substandard grade5 Unacceptable Past due or impaired6 Bad and Doubtful Past due or impaired7 Virtual Certain Loss Past due or impaired
b) Debt securities and other bills
For debt securities and other bills, external rating such as Standard & Poor’s rating or their equivalents are used by Group Risk Management Unit for managing of the credit risk exposures.
32.6.2 Risk limit control and mitigation policies
The Group structures the levels of credit risk it undertakes by placing limits on the amount of risk accepted in relation to one borrower, or group of borrowers, and to geographical and industry segments. Such risks are monitored on a revolving basis and subject to an annual or more frequent review, when considered necessary. Limits on the level of credit risk by product, industry sector and by country are approved quarterly by the Board of Directors.
Collateral The Group employs a range of policies and practices to mitigate credit risk. The most traditional of these is the taking of security for funds advances, which is common practice. The Group implements guidelines on the acceptability of specific classes of collateral or credit risk mitigation. The principal collateral types for loans and advances to customers are:
• Mortgagesoverresidentialproperties;• Chargesoverbusinessassetssuchaspremises,inventoryand
accounts receivable;• Charges over financial instruments such as debt securities
and equities.
Management monitors the market value of collateral, requests additional collateral in accordance with the underlying agreement, and monitors the market value of collateral obtained during its periodic review of loan accounts in arrears.
DerivativesThe amount subject to credit risk is limited to the current fair value of instruments that are favourable to the Group (i.e. assets where their fair value is positive), which in relation to derivatives is only a small fraction of the contract, or notional values used to express the volume of instruments outstanding. This credit risk exposure is managed as part of the overall lending limits with customers, together with potential exposures from market movements. Collateral or other security is not usually obtained for credit risk exposures on these instruments, except where the Group requires margin deposits from counterparties.
Master netting arrangementsThe Group further restricts its exposure to credit losses by entering into master netting arrangements with counterparties with which it undertakes a significant volume of transactions. Master netting arrangements do not generally result in an offset of balance sheet assets and liabilities, as transactions are usually settled on a gross basis. However, the credit risk associated with favourable contracts is reduced by a master netting arrangement to the extent that if a default occurs, all amounts with the counterparty are terminated and settled on a net basis.
Credit-related commitmentsThe primary purpose of those instruments is to ensure that funds are available to a customer as required. Guarantees and standby letters of credit carry the same credit risk as loans. Documentary and commercial letters of credit – which are written undertakings by the Group on behalf of a customer authorising a third party to draw drafts on the Group up to a stipulated amount under specific terms and conditions – are collateralised by the underlying shipments of goods to which they relate and therefore carry less risk than a direct loan.
32.6.3 Impairment and provisioning policies
Impairment provisions are recognised for financial reporting purposes only for losses that have been incurred at the statement of financial position date based on objective evidence of impairment (see Note 2.f ). Due to the different methodologies applied, the amount of incurred credit losses provided for in the financial statements are usually lower than the amount determined from the expected loss model that is used for internal operational management and banking regulation purposes.
The Group’s policy requires the review of individual financial assets that are above materiality thresholds at least annually or more regularly when individual circumstances require. Impairment allowances on individually assessed accounts are determined by an evaluation of the incurred loss at statement of financial position date on a case-by-case basis, and are applied to all individually significant accounts.
The assessment normally encompasses collateral held (including re-confirmation of its enforceability) and the anticipated receipts for that individual account.
Collectively assessed impairment allowances are provided for portfolios of homogenous assets that are individually below the materiality threshold.
32.6.4 Maximum exposure to credit risk before collateral held or other credit enhancements
Credit risk exposures relating to on and off-balance sheet assets are as follows: Gross maximum exposure 2010 2009 ($’000) ($’000)On-balance sheet Due from banks and short term investments 308,380 1,045,699Securities at fair value through profit or loss 468,824 1,417,246Securities available for sale at fair value 972,458 1,047,242Loans and advances to customers 1,567,931 1,167,010Derivative financial instruments 1,010,811 1,450,415
Total 4,328,404 6,127,612 Off-balance sheet Contingent liabilities (letter of credit and financial guarantees):
Credit commitments 7,521 81,653
Total credit risk exposure 4,335,925 6,209,265
32.6.5 Concentration of risk of financial assets with credit risk exposure by industry sectors
The following table breaks down the Group’s main credit exposure of their carrying amounts, as categorised by industry sectors of counterparties.
Manufacturing 1,449 14,306Distribution 465,386 420,069Financial services 1,290,256 2,035,023Transport 307,320 358,039 Construction 35,850 53,348Real estate 65,626 586,422Tourism 107,545 250,499Utilities 493,400 439,554Government 958,506 1,399,457Other 603,066 570,895
4,328,404 6,127,612
32.6.6 Risk concentrations of the maximum exposure to credit risk
Concentration of risk is managed by client/counterparty, by geographical region and by industry sector. The maximum credit exposure to any client or counterparty as at 31 October 2010 was $378,345,018 (2009: $600,715,868) before taking account of collateral or other credit enhancements.
32.6.7 Credit quality by class of financial assets
Neither past Past due due nor but not impaired impaired Impaired Total ($’000) ($’000) ($’000) ($’000)As at 31 October 2010 Due from banks and short term investments 308,380 -- -- 308,380
Investment securities: Trading: Government 4 -- -- 4 Corporate 190,442 -- -- 190,442 Other 278,378 -- -- 278,378Available for sale: Government 674,603 -- 23 674,626 Corporate 282,627 -- 15,205 297,832Investment securities – gross: 1,426,054 -- 15,228 1,441,282 Loans to customers: Commercial/ corporate 1,183,678 168,807 -- 1,352,485Mortgages 141,806 51,461 2,232 195,499Finance leases 14,059 5,888 -- 19,947Loans to customers – gross 1,339,543 226,156 2,232 1,567,931 Derivative financial instruments: Government 30,144 -- -- 30,144Corporate 980,667 -- -- 980,667Derivatives – gross: 1,010,811 -- -- 1,010,811
Total 4,084,788 226,156 17,460 4,328,404
For those exposures that are neither past due nor impaired, the majority are rated between standard (good) to excellent which is high grade.
As at 31 March 2009 Due from banks and short term investments 1,045,699 -- -- 1,045,699
Investment securities: Trading: Government 303,190 -- 1,566 304,756Corporate 753,363 2 -- 753,365Other 359,125 -- -- 359,125Available for sale: Government 472,965 -- 9,399 482,364Corporate 300,799 264,079 -- 564,878Investment securities – gross: 2,189,442 264,081 10,965 2,464,488 Loans to customers: Commercial/ Corporate 885,014 -- -- 885,014Mortgages 210,475 47,666 2,056 260,197Finance Leases 21,799 -- -- 21,799Loans to customers – gross 1,117,288 47,666 2,056 1,167,010 Derivative financial instruments: Government 540,821 -- -- 540,821Corporate 909,594 -- -- 909,594Derivatives – gross: 1,450,415 -- -- 1,450,415
Total 5,802,844 311,747 13,021 6,127,612
For those exposures that are neither past due nor impaired, the majority are rated between standard (good) to excellent which is high grade.

71
(expressed in Trinidad & Tobago dollars)31 October 2010 - continuedConsolidated Financial Statements
Notes to the consolidated financial statements
32 Financial risk management (continued)
32.6 Credit risk (continued)
32.6.8 Credit risk exposure of investment securities based on the Group’s internal corporate rating system
Standard & Poor’s Total Total equivalent grades 2010 2009 ( $’000) ($’000)Excellent AA BB+ 324,840 2 Very Good A+ BB 1,247 --A BB- 141,777 200,205 Good A- B+ 381,215 --B+ B 476,625 1,635,416 Special Mention B B- 115,555 --C+ CCC+ -- 617,900 Unacceptable C CCC 23 --D+ CCC- -- 10,965
1,441,282 2,464,488
32.6.9 Aging analysis of past due but not impaired loans and advances by class
Less More than than 1 1-3 3-6 6 mth mths mths mths Total ($’000) ($’000) ($’000) ($’000) ($’000)As at 31 October 2010Commercial/Corporate 168,807 -- -- -- 168,807Mortgages -- 51,461 -- -- 51,461Finance Leases -- 5,888 -- -- 5,888
168,807 57,349 -- -- 226,156
As at 31 March 2009Commercial/Corporate -- -- -- -- --Mortgages 43,120 4,546 -- -- 47,666
43,120 4,546 -- -- 47,666
32.6.10 Repossessed collateral
Repossessed collateral are sold as soon as practicable, with the proceeds used to reduce the outstanding indebtedness.
The Group did not hold any repossessed collateral as of the end of the year (2009-nil).
32.6.11 Capital management
The Group’s objectives when managing capital, which is a broader concept than the ‘equity’ on the face of statement of financial position, are:• Tocomplywiththecapitalrequirementssetbytheregulators
of the banking markets where the entities within the Group operate;
• To safeguard the Group’s ability to continue as a goingconcern so that it can continue to provide returns for shareholders and benefits for other stakeholders; and
• Tomaintainastrongcapitalbasetosupportthedevelopmentof its business
Capital adequacy and the use of regulatory capital are monitored daily by the Group’s management, employing techniques based on the guidelines developed by the Basel Committee on Banking Supervision as implemented by the Central Banks of various territories in which the Group operates for supervisory purposes. The required information is filed with the Authority on a monthly basis.
The table below summarises the composition of regulatory capital and the ratios of the Group for the periods ended 31 October 2010 and 31 March 2009. During those two periods, the individual licensed entities within the Group complied with all of the externally imposed capital requirements to which they are subject.
31 31 October March 2010 2009 ($’000) ($’000)Tier 1 capital Share capital 140,000 140,000Statutory reserve 105,205 105,205Retained earnings 895,391 1,009,721Less: Goodwill (6,569) (6,569)
Total Qualifying Tier 1 capital 1,134,027 1,248,357 Tier 2 capital Revaluation reserve – Available-for Sale Investments 20,554 (85,557)Collective impairment allowance (26,642) 13,972Total qualifying Tier 2 capital (6,088) (71,585)Less: investments in associates & joint ventures (139,356) (125,854)
Total Regulatory Capital 988,583 1,050,918
Risk-weighted assets:On-balance sheet 3,642,962 4,576,215Off-balance sheet 7,521 115,520
Total risk-weighted assets 3,650,483 4,691,735
Total regulatory capital to risk weighted assets 27.08% 22.40%
33 Fair value of financial assets and liabilities
Financial assets and liabilities not carried at fair value include cash resources, loans to customers, customers’ deposits, other funding instruments and other borrowed funds. The following comments are relevant to their fair value.
Assets
Cash on hand and due from banks and balances with central banks Since these assets are short-term in nature, the values are taken as indicative of realisable value.
Loans to customers Loans are stated net of specific provision for impairment. These assets result from transactions conducted under typical market conditions and their values are not adversely affected by unusual terms. The estimated fair value of loans represents the discounted amount of estimated future cash flows expected to be received.
Liabilities
Customers’ deposits, other funding instruments and other borrowed fundsThe estimated fair value of deposits with no stated maturity, which includes non-interest bearing deposits, is the amount repayable on demand.
Deposits and other borrowed funds with fixed rate characteristics are at rates that are not significantly different from current rates and are assumed to have discounted cash flow values that approximate the carrying value.
The following table provides an analysis of financial instruments that are measured subsequent to initial recognition at fair value, grouped into Levels 1 to 3 based on the degree to which the fair value is observable.
• Level 1 fair value measurements are those derived fromquoted prices (unadjusted) in active markets for identical assets or liabilities.
• Level 2 fair value measurements are those derived frominputs other than quoted prices included within Level 1 that are observable for the asset or liability, either directly (i.e. as prices) or indirectly (i.e. derived from prices).
• Level 3 fair value measurements are those derived fromvaluation techniques that include inputs for the asset or liability that are not based on observable market data (unobservable inputs).
Level 1 Level 2 Level 3 Total ($’000) ($’000) ($’000) ($’000)Securities available-for-sale at fair valueGovernment and state-owned enterprises debt securities -- 674,603 23 674,626Corporate debt securities -- 297,839 15,646 313,485
-- 972,442 15,669 988,111 Securities held-for-trading at fair valueGovernment and state-owned enterprises debt securities -- 4 -- 4Corporate debt securities -- 118,401 72,041 190,442
-- 118,405 72,041 190,446
Loans held-for-trading at fair valueGovernment and state-owned enterprises loans -- -- -- --Corporate debt loans -- -- 278,378 278,378
-- -- 278,378 278,378
Total investments -- 1,090,847 366,088 1,456,935
Reconciliation of Level 3 fair value measurements of financial assets Loans Securities held for Securities held for trading available trading at at fair for sale fair value value Total ($’000) ($’000) ($’000) ($’000)
As at 1 April 2009 79,919 96,223 150,639 326,781Additions -- -- 130,234 130,234Disposal (sale and redemption) (67,040) (24,216) (3,468) (94,724)Gains/(losses) from changes in fair value 2,790 34 973 3,797
As at 31 October 2010 15,669 72,041 278,378 366,088
34 Subsidiaries
Name Country of Percentage of incorporation equity capital held %RMB Holdings Limited Nevis 100RMB Investments Limited British Virgin Islands 100 *RMB Financing Limited St. Lucia 100 *RMB Services CR Costa Rica 100
* The equity share capital in RMB Investments Limited and RMB Financing Limited is held by RMB Holdings Limited.
35 Restatements and re-classifications
Adjustments and re-classifications to prior year figures have been made to correct errors and to represent balances in conformity with the current period’s reporting.
(expressed in Trinidad & Tobago dollars)31 October 2010 - continuedConsolidated Financial Statements

72
(expressed in Trinidad & Tobago dollars)31 October 2010 - continuedConsolidated Financial Statements
Notes to the consolidated financial statements
35 Restatements and re-classifications (continued)
The effect of these changes to the 2009 statement of financial position and statement of comprehensive income is summarised in the table below.
As Re- previously classi- Adjust- Revised stated fication ments balance ($’000) ($’000) ($’000) ($’000)As at 31 March 2009 Statement of financial position Assets Cash on hand and due from banks 1,045,699 -- -- 1,045,699Deposits with Central Bank 45,103 -- -- 45,103Investment in associate company and joint venture 125,848 -- -- 125,848Financial assets at fair value through profit or loss 1,426,166 -- -- 1,426,166Financial assets available for sale 1,068,642 -- -- 1,068,642Loans to customers 1,159,022 -- -- 1,159,022Derivative financial instruments 1,450,415 -- -- 1,450,415Equipment 3,613 -- -- 3,613Taxation recoverable 25,919 -- -- 25,919Deferred tax asset 64,059 342,831 -- 406,890Other assets 247,294 -- -- 247,294
Total assets 6,661,780 342,831 -- 7,004,611
Liabilities Customers’ deposits 281,894 -- -- 281,894Other funding instruments 2,944,912 -- -- 2,944,912Other borrowed funds 643,384 -- -- 643,384Derivative financial instruments 1,403,052 -- -- 1,403,052Taxation payable 23,645 -- -- 23,645Deferred tax liabilities -- 342,831 -- 342,831Other liabilities 192,327 (18,538) -- 173,789Post-retirement benefit -- -- 3,197 3,197Provisions -- 18,538 -- 18,538
Total liabilities 5,489,214 342,831 3,197 5,835,242
As Re- previously classi- Adjust- Revised stated fication ments balance ($’000) ($’000) ($’000) ($’000)
As at 31 March 2009 Statement of financial position Shareholders’ equity Share capital 140,000 -- -- 140,000Statutory reserves 105,205 -- -- 105,205Other reserves (85,557) -- -- (85,557)Retained earnings 1,012,918 -- (3,197) 1,009,721Total shareholders’ equity 1,172,566 -- (3,197) 1,169,369
Total equity and liabilities 6,661,780 -- (3,197) 7,004,611
Statement of comprehensive incomeInterest income 363,140 -- -- 363,140Interest expense (182,839) -- -- (182,839)
Net interest income 180,301 -- -- 180,301
Net trading (losses) (330,106) -- -- (330,106)Fees and commissions 47,159 -- -- 47,159
Total non-interest income (282,947) -- -- (282,947)
Total net income (102,646) -- -- (102,646)
Impairment (losses) on loans to customers (20) -- -- (20)Impairment (losses) on financial assets, AFS net write-backs (4,448) -- -- (4,448)Operating expenses (67,401) -- (3,197) (70,598)
Total non-interest expenses (71,869) -- (3,197) (75,066)
Share of profits of associate companies 440 -- -- 440Share of profits of joint venture 8,905 -- -- 8,905Total share of profit of associate company and joint venture 9,345 -- -- 9,345
Loss before taxation (165,170) -- (3,197) (168,367)Taxation 69,001 -- -- 69,001
Loss after taxation (96,169) -- (3,197) (99,366)
Reconciliation of prior year adjustments to the statement of changes in shareholders’ equity
Total Share- retained holders’ earnings equity ($’000) ($’000)Adjustments to opening shareholders equity as at 1 April 2008 (--) (--) Adjustments during the period ended 31 March 2009 (3,197) (3,197) Total charge to equity (3,197) (3,197)
The prior year adjustment relates to post-retirement benefits previously carried by the Parent Company, RBC Financial (Caribbean) Limited. Further details are set out in note 19.