
Baker IDI Research Online
28
Baker IDI Research Online http://library.bakeridi.edu.au This is the preprint version of the work. It is the manuscript that was submitted to the journal and has not undergone peer review. Forbes JM, Cowan SP, Andrikopoulos S, Morley AL, Ward LC, Walker KZ, Cooper ME, Coughlan MT. Glucose homeostasis can be differentially modulated by varying individual components of a western diet. J Nutr Biochem 2013;24(7):1251-7. http://hdl.handle.net/11187/1553 Copyright © Elsevier. This file is for personal use. Further distribution is not permitted.
Transcript of Baker IDI Research Online
Baker IDI Research Online http://library.bakeridi.edu.au
This is the preprint version of the work. It is the manuscript that was submitted to the journal and has not undergone peer review.
Forbes JM, Cowan SP, Andrikopoulos S, Morley AL, Ward LC, Walker KZ, Cooper ME, Coughlan MT. Glucose homeostasis can be differentially modulated by varying individual components of a
western diet. J Nutr Biochem 2013;24(7):1251-7.
http://hdl.handle.net/11187/1553
Copyright © Elsevier. This file is for personal use. Further distribution is not permitted.
Dietary Maillard Reaction Products and macronutrients have disparate effects
glucose homeostasis and pancreatic function in rodents1,2
Josephine M. Forbes3,4, Samantha P. Cowan3,5, Sofianos Andrikopoulos6, Amy L.
Morley3, Leigh C. Ward7, Karen Z. Walker5, Mark E. Cooper3, Melinda T. Coughlan3,7*.
3Diabetes Complications, Baker IDI Heart and Diabetes Research Institute, Melbourne,
Victoria, Australia
4Department of Immunology, Alfred Medical Research and Education Precinct, Monash
University, Melbourne, Australia.
5Department of Nutrition and Dietetics, Monash University, Melbourne, Australia.
6Department of Medicine, The University of Melbourne, Melbourne, Australia.
7School of Chemistry and Molecular Biosciences, University of Queensland, Brisbane,
Queensland, Australia.
8Department of Medicine, Alfred Medical Research and Education Precinct, Monash
University, Melbourne, Australia.
1This project was funded by a National Health and Medical Research Council of
Australia (NHMRC) New Investigator Project Grant (586645), the Juvenile Diabetes
Research Foundation (5-2010-163) and in part by the Victorian Government's
Operational Infrastructure Support Program. Melinda Coughlan holds an Australian
Diabetes Society Early Career Fellowship. Josephine Forbes and Sofianos
Andrikopoulos hold NHMRC Senior Research Fellowships. Mark Cooper is an NHMRC
Australia Fellow and a Juvenile Diabetes Research Foundation Scholar.
The Journal of Nutrition NUTRITION/2011/150151 Version 1
2
2Author disclosure: JM Forbes, SP Cowan, S Andrikopoulos, AL Morley, LC Ward, KZ
Walker, ME Cooper and MT Coughlan have no conflicts of interest.
*To whom correspondence should be addressed:
Dr Melinda T. Coughlan
Glycation & Diabetes Complications
Baker IDI Heart & Diabetes Institute, PO Box 6492, St Kilda Rd Central
Melbourne, 8008, Australia.
Telephone: +61 3 8532 1278, Fax: +61 3 8532 1480
Email: [email protected]
Running title: Heat treated diets and glucose homeostasis
Word Count: 5372
Number of Figures: 4
Number of Tables: 1
List of author’s names for Pubmed indexing:
Forbes, Cowan, Andrikopoulos, Morley, Ward, Walker, Cooper, Coughlan.
Abbreviations used: AGE (advanced glycation end product), BIS (bioelectrical
impedance spectroscopy), GLP-1 (glucagon-like peptide-1), HOMA-IR (homeostatic
model assessment of insulin resistance), IVGTT (intravenous glucose tolerance test),
ipITT (intra-peritoneal insulin tolerance test), MRP (Maillard reaction product).
The Journal of Nutrition NUTRITION/2011/150151 Version 1
3
Abstract 1
Maillard reaction products (MRPs) are generated when protein-rich foods are subjected 2
to intensive heat during cooking. Overconsumption of a Western diet, high in MRP has 3
been identified as a major risk factor for diabetes; yet precisely how MRPs contribute to 4
defects in glucose homeostasis independent of consumption of other macronutrients 5
remains unclear. Eight-week old male Sprague Dawley rats were randomized to feeding 6
with one of six semi-pure diets: control, heat processed (high MRPs), high protein, high 7
dextrose, high in saturated fat (of plant origin), or high in saturated fat (of animal origin). 8
After feeding for 24 weeks body composition was determined by bioelectrical impedance 9
spectroscopy and glucose homeostasis was assessed. When compared to the high 10
MRP diet, excess consumption of the diet high in saturated fat (from an animal source) 11
increased body weight and fat mass, and impaired insulin sensitivity, as defined by 12
impaired skeletal muscle insulin signaling and insulin hypersecretion in the context of 13
increased circulating glucagon-like peptide (GLP-1). Compared to the control diet, 14
chronic consumption of the high MRP diet increased fasting glucose, decreased fasting 15
insulin and insulin secretory capacity. It also resulted in lower GLP-1 and an increase in 16
urinary 15-isoprostane F2t, a sensitive marker of oxidative stress status. These data 17
suggest that excessive consumption of heat-treated foodstuffs can impair glucose 18
homeostasis and pancreatic function in rodents independent of excesses in other 19
macronutrients. These data provide a link between over-consumption of processed 20
foods and the development of diabetes. 21
22
The Journal of Nutrition NUTRITION/2011/150151 Version 1
4
Introduction 23
Diabetes prevalence, now estimated as 171 million people worldwide, is expected 24
to double within the next 20 years (1). Diabetes is characterized by both hyperglycemia 25
and a relative deficiency in insulin secretion, required before development of overt 26
disease. In type 2 diabetes this is seen in the context of reduced insulin sensitivity, 27
whereas in type 1 diabetes, autoimmune destruction of the pancreatic beta cells leads to 28
absolute insulin deficiency. Reducing the global burden of diabetes is a high priority for 29
the WHO (1). 30
The global increase in diabetes has arisen in parallel with the increasing 31
popularity of Western-style diets, so that it has been argued that dietary factors and 32
diabetes are closely associated (2-5). The adverse effects of the Western diet are most 33
often attributed to its high energy density and poor nutrient profile with large amounts of 34
saturated and trans fatty acids and poor quality carbohydrate. Yet other adverse 35
features that derive from modern methods of food processing need also to be 36
considered, one of which is the high generation of Maillard reaction products (MRPs) 37
(6). MRPs, also known as advanced glycation end products (AGEs), are formed through 38
the non-enzymatic irreversible modification of free amino groups within proteins and 39
amino acids by reducing sugars and reactive aldehydes and can increase the shelf-life 40
and taste of manufactured foods (7). Once ingested, 10 to 30% of dietary MRPs are 41
thought to become absorbed into the circulation (8, 9) where they can form deleterious 42
cross-linkages with many body tissues before excretion into the urine via the kidneys 43
(9). Some MRPs can also arise endogenously under physiologic conditions within 44
tissues particularly in people with diabetes (7). 45
The Journal of Nutrition NUTRITION/2011/150151 Version 1
5
Recent studies in rodent models indicate that the restriction of dietary MRP intake 46
not only improves insulin sensitivity, but can also extend the lifespan (10, 11). Moreover, 47
other rodent studies suggest an association between AGEs and type 1 diabetes (12-14). 48
There remains a need however, to distinguish the effects pertaining to MRPs from 49
effects arising from other adverse dietary factors, particularly in relation to glucose 50
homeostasis, insulin sensitivity and pancreatic function. In this study, undertaken in 51
healthy rats, comparisons have therefore been made between the effect of a highly 52
processed, heat-treated rodent diet (high in MRPs) with unheated rodent diets that are 53
high in either saturated fatty acids, dietary protein or refined carbohydrates. 54
55
The Journal of Nutrition NUTRITION/2011/150151 Version 1
6
Materials and Methods 56
Rodents 57
All animal experiments were performed in accordance with the Alfred Medical 58
Research and Education Precinct Animal Ethics Committee. Rats were housed in 59
groups of three per cage with a 12 h light/dark cycle and ad libitum access to food and 60
water. Healthy male 8-week-old Sprague Dawley rats, weighing 250 to 300g, were 61
randomized into groups (n=10/group) and given one of the following diets: a control (C) 62
diet (unbaked AIN93G (15)); a baked diet high in MRP (MRP diet) (AIN93G baked at 63
160°C for 1 h); a high protein (Pr) diet with 48% of total energy (%E) as protein; a high 64
glucose (Glu) diet (with 636 g dextrose/kg); a high saturated fat diet of plant origin (Pla 65
Fat) (40%E from hydrogenated coconut oil) or a high saturated fat diet of animal origin 66
(Ani Fat) (40%E from clarified butter, ghee) and followed for a period of 24 weeks. 67
All diets were semi-pure formulations manufactured by Specialty Feeds (Western 68
Australia, Australia). Unlike the high MRP diet, the control, protein, dextrose, and high 69
fat diets were not heat treated (i.e., were kept raw) and were not dehydrated and formed 70
into pellets. The MRP diet thus had a five times higher MRP content than the control 71
diet, as determined by an ELISA specific to the AGE carboxymethyllysine (CML) (16). 72
CML was chosen as a surrogate marker of all MRPs because it is present in tissues and 73
serum from humans and rodents and correlates with other MRPs and oxidants (17). 74
At 23 weeks after feeding, rats were placed individually in metabolic cages 75
(Tecniplast, VA, Italy) to collect a single 24-hour urine sample and to measure water and 76
food intake. After 24 weeks, rats were anaesthetized with pentobarbitone sodium (50 77
mg/kg body weight) and perfused via the abdominal aorta with 0.1 mol/L PBS for 1-2 78
The Journal of Nutrition NUTRITION/2011/150151 Version 1
7
min to remove circulating blood. The liver, gastrocnemius skeletal muscle, fat pads and 79
pancreas were removed, frozen in liquid nitrogen and stored at -80°C. Glycated 80
hemoglobin was determined by HPLC as previously described (18). 81
82
Bioelectrical impedance spectroscopy (BIS) 83
At 23 weeks and after feeding, bioelectrical impedance spectroscopy was 84
performed in rats anaesthetized with 2.5% isofluorane in 1.75 L/min of oxygen delivered 85
via nose cone using a bioelectrical impedance analyzer (ImpSFB7, Impedimed, 86
Brisbane, Australia) as previously described (19, 20). 87
88
Intravenous glucose tolerance testing (IVGTT) 89
After 24 weeks of feeding, intravenous glucose tolerance testing was performed 90
(21). In brief, rats (n=6/group) were anaesthetized and the left carotid artery cannulated. 91
After equilibration and a bolus glucose injection of 1 g/kg, 0.5 ml blood samples were 92
taken at 2, 5, 10, 15, 30 and 45 min for the measurement of plasma glucose (glucose 93
oxidase method using an autoanalyser, Beckman Coulter LX20PRO) and plasma insulin 94
by radioimmunoassay (Rat Sensitive RIA, Linco Research, MO, USA). Whole blood was 95
reconstituted in saline and returned to the rats after plasma was extracted. Area under 96
the curve (AUC) was calculated by the trapezoidal rule (GraphPad Prism, GraphPad 97
Software, San Diego, CA, USA). 98
99
100
101
The Journal of Nutrition NUTRITION/2011/150151 Version 1
8
Intra-peritoneal insulin tolerance testing (ipITT) 102
ipITT was performed after 23 weeks of feeding. After a fasting blood sample was 103
collected, a 0.5 U/kg insulin bolus (Humalog, Insulin Lispro, Eli Lilly, USA) was injected 104
intra-peritoneally into rats and blood samples were taken at 15, 30, 60 and 120 min 105
post-bolus. Plasma glucose was measured as described above. 106
107
Homeostatic model assessment of insulin resistance (HOMA-IR) 108
HOMA-IR was used calculated to determine the relative insulin sensitivity (22) 109
using the formula (insulin (μU/ml) x glucose (mmol/L)) divided by 22.5. 110
111
pAKT/AKT immunoblotting 112
Western immuno-blotting was used to determine the ratio of phosphorylated Akt 113
(phosphoAkt) to total Akt as a marker of insulin signaling in both liver and skeletal 114
muscle. Thirty μg of protein (liver or gastrocnemius skeletal muscle) was reduced with 115
2% β-mercaptoethanol and proteins were separated using polyacrylamide gel 116
electrophoresis (Bio-Rad Laboratories, Gladesville, Australia). Separated protein bands 117
were transferred onto a Hybond-P PVDF membrane (Millipore, Maryland, USA) using a 118
semi-dry blotting apparatus (Bio-Rad Laboratories, Gladesville, Australia). After 119
transfer, membranes were blocked with 5% skim milk powder diluted in a 1M Tris 120
buffered saline solution with 0.05% Tween-20 (TBS-T) for 1 h. After blocking, 121
membranes were washed in 1M TBS-T solution for 10 min before incubating overnight 122
with either Akt or phospho-Akt primary antibodies (rabbit anti-rat S473, Cell Signaling 123
Technologies, Massachusetts, USA, Akt antibody at a dilution of 1/10,000 and pAkt 124
The Journal of Nutrition NUTRITION/2011/150151 Version 1
9
antibody 1/5000). Akt and phosphoAkt membranes were washed six times in 1M TBS-T 125
solution before incubating for 1 h at room temperature with an anti rabbit, HRP-labeled 126
polymer secondary antibody (Dako, California, USA). Membranes were probed with 127
Chemiluminescent Peroxidase Substrate-3 (Sigma-Aldrich, St.Louis, USA) for 3 min. 128
Light emission was captured on CL-XPosure film (Thermo Scientific, Rockford, IL, USA). 129
The density of each band was quantitated using Adobe Photoshop. Results were 130
expressed as a ratio of phosphoAkt to Akt. 131
132
GLP-1, glucagon and Urinary 15-isoprostane F2t 133
Plasma GLP-1 and glucagon were determined using ELISA kits from Wako 134
(Osaka, Japan). Urinary 15-isoprostane F2t was measured using an EIA kit specifically 135
designed to assay urine samples (Oxford Biomedical Research, Rochester Hills, MI, 136
USA). 137
138
Statistical analysis 139
All statistical computations were performed using GraphPad Prism version 4.0a 140
for Mac OS X (GraphPad Software, San Diego, California, USA). Values for 141
experimental groups are given as mean, with bars showing the SEM, unless otherwise 142
stated. One-way ANOVA with Tukey’s post-test analysis, or two-way ANOVA with 143
Bonferroni post-test analysis was used to determine statistical significance. Where 144
appropriate, two-tailed t tests were performed. A probability of P < 0.05 was considered 145
to be statistically significant. 146
147
The Journal of Nutrition NUTRITION/2011/150151 Version 1
10
Results 148
To determine the effects of excess consumption of macronutrients and heat 149
treated foodstuffs (MRPs) on glucose homeostasis and pancreatic function, healthy 150
Sprague Dawley rats were fed one of the following diets for 24 weeks: a MRP (baked; 151
MRP) or control (unbaked; C) diet, a high protein (Pr) diet, a high dextrose (Glu) diet, or 152
a high fat diet in saturated fat from either a plant (hydrogenated coconut oil; Pla Fat) or 153
animal fat (clarified butter; Ani Fat) source. The nutrient and energy content of each diet 154
are presented in Table 1. All diets were isoenergetic but differed in specific 155
macronutrients. The MRP content, specifically carboxymethyllsine (CML), was 5-fold 156
higher in the MRP diet than in the unbaked control diet (101.9 versus 20.9 nmol/mol 157
lysine/100 mg, respectively). 158
159
Body composition 160
After 24 weeks of chronic feeding, mean body weight was lower in rats that 161
consumed high protein (Pr) diet (Figure 1A) than in controls. Conversely, body weight 162
was significantly increased in rats fed the high saturated fat diet of animal origin (Ani 163
Fat) (15% increase, P < 0.05). Total visceral adipose tissue was also increased in these 164
rats (Figure 1B). In contrast, both the high protein (Pr) and high glucose (Glu) diets 165
resulted in a smaller accumulation of total visceral adipose tissue. Consumption of the 166
high saturated fat diet of animal origin (Ani fat) led to significant increases in both 167
absolute and relative (% of body weight) fat mass as determined by BIS, (28%, P < 0.05 168
and 10%, P < 0.05, Figures 1C and 1D respectively). Whereas both absolute and 169
relative fat mass was lower in rats consuming the high glucose diet (22%, P < 0.05 and 170
The Journal of Nutrition NUTRITION/2011/150151 Version 1
11
21%, P < 0.05, Figure 1C and 1D respectively) compared to those fed the control diet. 171
Relative fat mass was also lower in the MRP and high protein diet groups (Figure 1D). 172
Although absolute fat free mass was greater in rats fed high glucose diets and both high 173
fat diets (Figure 1E), when expressed as a % of body weight, fat free mass was 174
increased in MRP, protein and glucose-fed rats, and not significantly altered in the high 175
fat-fed rats (Figure 1F). 176
177
Assessment of glucose homeostasis and insulin sensitivity 178
Fasting plasma glucose was increased in rats that consumed excess MRPs 179
(10%, P < 0.05, Figure 2A) or saturated fat from plant (18%, P < 0.05, Figure 2A) or 180
animal sources (19%, P < 0.05, Figure 2A). Fasting plasma insulin was lower in rats fed 181
the high MRP diet or the high glucose diet and also showed a tendency to increase in 182
rats fed a diet high in animal fat (not of statistical significance) (Figure 2B). The diet high 183
in animal fat, however, increased HOMA-IR, a surrogate measure of insulin resistance, 184
(Figure 2C) and compromised long-term glucose control as reflected by the increase in 185
glycated hemoglobin (Figure 2D). Compared with the control group, rats consuming the 186
diet high in animal fat had lower insulin sensitivity, as plasma glucose did not normalize 187
to control levels over 120 minutes post-insulin injection (Figure 2E), confirmed by the 188
increased AUC calculated in this group (Figure 2F). Rats consuming all other diets had 189
normal insulin sensitivity. 190
Circulating GLP-1, a gut hormone responsive to macronutrient intake, which 191
stimulates pancreatic insulin secretion, was decreased in rats that consumed diets high 192
in excess MRP and glucose, whilst GLP-1 increased in rats consuming the high 193
The Journal of Nutrition NUTRITION/2011/150151 Version 1
12
saturated fat animal diet (Figure 3A). Consumption of both high fat diets led to a 194
decrease in circulating glucagon levels compared to the control diet (Figure 3B), an 195
effect not observed in other groups. 196
The ratio of phospho-AKT to total AKT protein in the insulin target tissues, liver 197
and skeletal muscle was also determined. AKT is a key protein of the insulin signaling 198
pathway and a decrease in the ratio of phospho-AKT to total AKT indicates impaired 199
insulin signaling. While there was no change in the ratio of phospho-AKT to total AKT in 200
liver (Figure 3C), in gastrocnemius skeletal muscle (Figure 3D), chronic consumption of 201
the high fat diet of animal origin led to a decrease in this ratio. Interestingly, urinary 15-202
isoprostane F2t, a sensitive marker of oxidative stress status, was increased in rats that 203
consumed the high MRP, high protein or high glucose diets, but not the high fat diets 204
(Figure 3E). 205
206
Determination of pancreatic function 207
To test the insulin secretory capacity of the pancreas, IVGTTs were performed 208
after 24 weeks of feeding. After glucose challenge, there were no differences in plasma 209
glucose concentrations over time between diet groups (Figure 4A). Plasma insulin, 210
however, during IVGTT, was reduced in rats that consumed the high MRP, high protein 211
or high glucose diets and this was confirmed by a decrease in total AUC for insulin in 212
these three groups (Figure 4C). In contrast, consumption of the high fat diet of animal 213
origin led to an increase in plasma insulin at 2, 5 and 10 min post-glucose injection 214
(Figure 4B), reflected by the elevated first phase AUC insulin (Figure 4D). 215
216
The Journal of Nutrition NUTRITION/2011/150151 Version 1
13
Discussion 217
While many studies now support the concept that dietary factors are involved in 218
the development of diabetes, controversy exists as to the relative contribution of single 219
dietary elements to disease pathogenesis. Before the development of agriculture, 220
dietary choices were limited to minimally processed plant and animal foods. With 221
advancing technology, and particularly since industrialization, original nutrient 222
characteristics have changed (23), so that highly processed foods now dominate the 223
typical western diet. In the current study, we examined the effects of raw unbaked diets 224
predominating in different macronutrients as compared with a processed diet subjected 225
to high heat to determine effects on pancreatic function, glucose homeostasis and 226
insulin sensitivity in healthy rodents. 227
Data obtained in this study indicate that in rodents, heat-treated food high in 228
MRPs can impair glucose homeostasis and pancreatic function independent of other 229
macronutrient excesses. These findings provide a clear association between 230
overconsumption of highly processed food and the development of diabetes. Indeed, 231
overt diabetes does not develop without pancreatic islet dysfunction (24). We found that 232
excess consumption of a heat treated diet (AIN93G baked at 160°C for 1 h), baked to 233
increase the content of MRPs, led to a decrease in relative fat mass and an increase in 234
fasting glucose in parallel with a decrease in fasting insulin concentrations when 235
compared to consumption of an unbaked diet (AIN93G, control). Further investigation 236
using an IVGTT revealed a defect in glucose-induced insulin secretion with chronic 237
consumption of a diet high in MRPs. The defects elicited by the high MRP diet appear 238
similar to those occurring in patients prior to the onset of type 1 diabetes. This is in line 239
The Journal of Nutrition NUTRITION/2011/150151 Version 1
14
with previous studies that have suggested that dietary MRPs may have direct effects on 240
beta cell function. Indeed, AGEs, formed by heat treatment, have been implicated to 241
mediate defects in insulin secretion in pancreatic beta cell lines (25, 26) and in rodent 242
models (10, 12-14, 27). 243
The delivery of nutrients from the stomach into the duodenum and the 244
subsequent interaction of these nutrients with the small intestine to stimulate incretin 245
hormone release are considered key determinants of acute insulin secretion in response 246
to food (28). The incretin effect has been attributed to the secretion of glucagon-like 247
peptide-1 (GLP-1) from cells in the intestinal epithelium with GLP-1 enhancing insulin 248
secretion (29). In the current study, it was interesting to note that plasma GLP-1 levels 249
were suppressed in rats that consumed diets high in either MRPs or glucose, both diets 250
that also elicited defective insulin secretion. Conversely, consumption of the high fat diet 251
of animal origin, which caused insulin hypersecretion, also resulted in an increase in 252
GLP-1 in the circulation. Other studies in rodents have demonstrated an increase in 253
GLP-1 secretion in response to high fat feeding (30). These data are consistent with the 254
view that GLP-1 plays a key role as a modulator of insulin secretion in response to 255
dietary intake. GLP-1 also strongly inhibits glucagon secretion (29) and it was 256
noteworthy that a decrease in plasma glucagon was observed in rats that consumed the 257
high fat plant or animal diets. These data suggest that further examination of the direct 258
effects of MRPs and saturated fats on gut incretins should be a focus of future studies. 259
Consumption of high protein or high glucose diets led to variable metabolic 260
responses, including lower accumulation of fat mass. Even though ad libitum feeding 261
was used, the effect of the high protein diet on smaller body weight and fat mass could 262
The Journal of Nutrition NUTRITION/2011/150151 Version 1
15
not be attributed to a decreased energy intake. Similarly, the increase in body fat mass 263
in the rats fed a high fat diet of animal origin was not accompanied by higher energy 264
intake. Differences in fat accumulation seem rather to relate to differences in 265
macronutrient metabolism and energy expenditure. Fasting plasma insulin was 266
decreased after 24 weeks of high glucose feeding in parallel with reduced plasma GLP-267
1 concentrations. Impaired insulin secretion was also seen in rodents that consumed 268
high glucose or high protein diets. Interestingly, the diets that suppressed insulin 269
secretion, namely those high in MRP, protein or glucose, also increased urinary 270
excretion of 15-isoprostane F2t, a biomarker of oxidative stress, suggesting that 271
oxidative stress may be a key mediator of diet-induced pancreatic dysfunction. Indeed, 272
there is a large body of evidence to implicate reactive oxygen species in beta cell 273
dysfunction, albeit in other contexts (31-33). 274
In the current study, we found that excess consumption for 24 weeks, of an 275
unbaked and unprocessed high saturated fat diet derived from clarified butter led to 276
increased body weight and fat mass, insulin resistance and an elevation in plasma 277
glucose and glycated haemoglobin. Although the high saturated fat diet derived from 278
hydrogenated coconut oil also increased fasting plasma glucose, it did not impair 279
glucose and insulin sensitivity, consistent with previous studies (34). It is also clear that 280
animal and coconut-sourced saturated fats exert differential effects on insulin sensitivity 281
and type 2 diabetes risk in humans. Polynesian islanders following a traditional diet with 282
a high proportion of total energy intake from coconut-sourced saturated fat 283
(approximately 40% of total energy) have very low prevalence rates of type 2 diabetes. 284
In contrast, Polynesians who migrate to countries which consume western style diets, 285
The Journal of Nutrition NUTRITION/2011/150151 Version 1
16
consume less saturated fat in total (<30% of total energy), but a larger quantity of that 286
saturated fat is derived from animal sources. In turn, their prevalence rate of type 2 287
diabetes is much higher (4, 35-37). It is possible that the differences in fatty acid 288
composition observed between plant and animal-sourced saturated fats, in addition to 289
the different metabolic fates of these fatty acids, may be responsible. For example, it is 290
known that long and medium chain saturated fatty acids undergo different pathways of 291
hydrolysis, absorption, storage, and oxidation (38, 39). However, although both high fat 292
diets were not heat processed, the clarified butter diet contained cholesterol. Our study 293
is unique, in assessing these effects in an unbaked diet where they are not confounded 294
by the introduction of MRPs, as would be the case in other studies where conventional 295
heat-treated rodent diets have been used. 296
In conclusion, data obtained from this study indicate that consumption of heat-297
treated food can in itself impair glucose homeostasis and pancreatic function in 298
susceptible rodents. Further studies are now warranted to explore potential synergistic 299
effects between high dietary MRPs and other macronutrients, particularly simple sugars 300
and saturated fat, in the promotion of risk factors for diabetes. 301
The Journal of Nutrition NUTRITION/2011/150151 Version 1
17
References 1. World Health Organisation, International Diabetes Foundation. Definition and Diagnosis of Diabetes Mellitus and Intermediate Hyperglycaemia. Geneva: World Health Organisation; 2006. 2. Fung TT, McCullough M, van Dam RM, Hu FB. A prospective study of overall diet quality and risk of type 2 diabetes in women. Diabetes Care. 2007 Jul;30:1753-7. 3. Fung TT, Schulze M, Manson JE, Willett WC, Hu FB. Dietary patterns, meat intake, and the risk of type 2 diabetes in women. Arch Intern Med. 2004 Nov 8;164:2235-40. 4. Zimmet P, Alberti KG, Shaw J. Global and societal implications of the diabetes epidemic. Nature. 2001 Dec 13;414:782-7. 5. Sandu O, Song K, Cai W, Zheng F, Uribarri J, Vlassara H. Insulin resistance and type 2 diabetes in high-fat-fed mice are linked to high glycotoxin intake. Diabetes. 2005 Aug;54:2314-9. 6. O'Brien J, Morrissey PA. Nutritional and toxicological aspects of the Maillard browning reaction in foods. Crit Rev Food Sci Nutr. 1989;28:211-48. 7. Thornalley PJ, Battah S, Ahmed N, Karachalias N, Agalou S, Babaei-Jadidi R, Dawnay A. Quantitative screening of advanced glycation endproducts in cellular and extracellular proteins by tandem mass spectrometry. Biochem J. 2003 Nov 1;375:581-92. 8. Koschinsky T, He CJ, Mitsuhashi T, Bucala R, Liu C, Buenting C, Heitmann K, Vlassara H. Orally absorbed reactive glycation products (glycotoxins): an environmental risk factor in diabetic nephropathy. Proc Natl Acad Sci U S A. 1997 Jun 10;94:6474-9. 9. Somoza V, Wenzel E, Weiss C, Clawin-Radecker I, Grubel N, Erbersdobler HF. Dose-dependent utilisation of casein-linked lysinoalanine, N(epsilon)-fructoselysine and N(epsilon)-carboxymethyllysine in rats. Mol Nutr Food Res. 2006 Sep;50:833-41. 10. Cai W, He JC, Zhu L, Chen X, Zheng F, Striker GE, Vlassara H. Oral glycotoxins determine the effects of calorie restriction on oxidant stress, age-related diseases, and lifespan. Am J Pathol. 2008 Aug;173:327-36. 11. Hofmann SM, Dong H-J, Li Z, Cai W, Altomonte J, Thung SN, Zeng F, Fisher EA, Vlassar H. Improved insulin sensitivity is associated with restricted intake of dietary glycoxidation products in the db/db mouse. Diabetes. 2002;51:2082(8). 12. Coughlan MT, Yap FYT, Tong DCK, Andrikopoulos S, Gasser A, Thallas-Bonke V, Webster DE, Miyazaki J, Kay TW, et al. Advanced Glycation End Products are Direct Modulators of Beta Cell Function. Diabetes. 2011;Accepted for publication 13th July 2011. 13. Peppa M, He C, Hattori M, McEvoy R, Zheng F, Vlassara H. Fetal or neonatal low-glycotoxin environment prevents autoimmune diabetes in NOD mice. Diabetes. 2003 Jun;52:1441-8. 14. Zhao Z, Zhao C, Zhang XH, Zheng F, Cai W, Vlassara H, Ma ZA. Advanced glycation end products inhibit glucose-stimulated insulin secretion through nitric oxide-dependent inhibition of cytochrome c oxidase and adenosine triphosphate synthesis. Endocrinology. 2009 Jun;150:2569-76. 15. Reeves PG, Nielsen FH, Fahey GC, Jr. AIN-93 Purified Diets for Laboratory Rodents: Final Report of the American Institute of Nutrition Ad Hoc Writing Committee
The Journal of Nutrition NUTRITION/2011/150151 Version 1
18
on the Reformulation of the AIN-76A Rodent Diet. J Nutr. 1993 November 1, 1993;123:1939-51. 16. Coughlan MT, Forbes JM. Temporal increases in urinary carboxymethyllysine correlate with albuminuria development in diabetes. Am J Nephrol. 2011;34:9-17. 17. Cai W, He JC, Zhu L, Chen X, Wallenstein S, Striker GE, Vlassara H. Reduced oxidant stress and extended lifespan in mice exposed to a low glycotoxin diet: association with increased AGER1 expression. Am J Pathol. 2007 Jun;170:1893-902. 18. Cefalu WT, Wang ZQ, Bell-Farrow A, Kiger FD, Izlar C. Glycohemoglobin measured by automated affinity HPLC correlates with both short-term and long-term antecedent glycemia. Clin Chem. 1994 Jul;40:1317-21. 19. Ward LC, Mason S, Battersby KJ. Bioimpedance spectroscopy for the measurement of body composition of laboratory rats in vivo. International Journal of Body Composition Research. 2009;7:27-35. 20. Ward LC, Battersby KJ. Assessment of body composition of rats by bioimpedance spectroscopy: Validation against dual-energy X-ray absorptiometry. Scandinavian Journal of Laboratory Animal Science 2009;36:253-61. 21. Kebede M, Favaloro J, Gunton JE, Laybutt DR, Shaw M, Wong N, Fam BC, Aston-Mourney K, Rantzau C, et al. Fructose-1,6-bisphosphatase overexpression in pancreatic beta-cells results in reduced insulin secretion: a new mechanism for fat-induced impairment of beta-cell function. Diabetes. 2008 Jul;57:1887-95. 22. Matthews DR, Hosker JP, Rudenski AS, Naylor BA, Treacher DF, Turner RC. Homeostasis model assessment: insulin resistance and beta-cell function from fasting plasma glucose and insulin concentrations in man. Diabetologia. 1985 Jul;28:412-9. 23. Cordain L, Eaton SB, Sebastian A, Mann N, Lindeberg S, Watkins BA, O'Keefe JH, Brand-Miller J. Origins and evolution of the Western diet: health implications for the 21st century. Am J Clin Nutr. 2005 Feb;81:341-54. 24. Kahn SE, Zraika S, Utzschneider KM, Hull RL. The beta cell lesion in type 2 diabetes: there has to be a primary functional abnormality. Diabetologia. 2009 Jun;52:1003-12. 25. Matsuoka T, Kajimoto Y, Watada H, Kaneto H, Kishimoto M, Umayahara Y, Fujitani Y, Kamada T, Kawamori R, Yamasaki Y. Glycation-dependent, reactive oxygen species-mediated suppression of the insulin gene promoter activity in HIT cells. J Clin Invest. 1997 Jan 1;99:144-50. 26. Tajiri Y, Grill V. Aminoguanidine exerts a beta-cell function-preserving effect in high glucose-cultured beta-cells (INS-1). Int J Exp Diabetes Res. 2000;1:111-9. 27. Hofmann SM, Dong HJ, Li Z, Cai W, Altomonte J, Thung SN, Zeng F, Fisher EA, Vlassara H. Improved insulin sensitivity is associated with restricted intake of dietary glycoxidation products in the db/db mouse. Diabetes. 2002 Jul;51:2082-9. 28. Wu T, Rayner CK, Jones K, Horowitz M. Dietary effects on incretin hormone secretion. Vitam Horm. 2010;84:81-110. 29. Holst JJ. The physiology of glucagon-like peptide 1. Physiol Rev. 2007 Oct;87:1409-39. 30. Knauf C, Cani PD, Ait-Belgnaoui A, Benani A, Dray C, Cabou C, Colom A, Uldry M, Rastrelli S, et al. Brain glucagon-like peptide 1 signaling controls the onset of high-fat diet-induced insulin resistance and reduces energy expenditure. Endocrinology. 2008 Oct;149:4768-77.
The Journal of Nutrition NUTRITION/2011/150151 Version 1
19
31. Drews G, Krippeit-Drews P, Dufer M. Oxidative stress and beta-cell dysfunction. Pflugers Arch. 2010 Sep;460:703-18. 32. Rains JL, Jain SK. Oxidative stress, insulin signaling, and diabetes. Free Radic Biol Med. 2011 Mar 1;50:567-75. 33. Lenzen S. Oxidative stress: the vulnerable beta-cell. Biochem Soc Trans. 2008 Jun;36:343-7. 34. Wein S, Wolffram S, Schrezenmeir J, Gašperiková D, Klimeš I, Šeböková E. Medium-chain fatty acids ameliorate insulin resistance caused by high-fat diets in rats. Diabetes Metab Res Rev. 2009;25:185-94. 35. Zimmet P. Epidemiology of diabetes and its macrovascular manifestations in Pacific populations: the medical effects of social progress. Diabetes Care. 1979 March 1, 1979;2:144-53. 36. Prior IA, Davidson F, Salmond CE, Czochanska Z. Cholesterol, coconuts, and diet on Polynesian atolls: a natural experiment: the Pukapuka and Tokelau island studies. Am J Clin Nutr. 1981 Aug;34:1552-61. 37. Taylor RJ, Bennett PH, LeGonidec G, Lacoste J, Combe D, Joffres M, Uili R, Charpin M, Zimmet PZ. The prevalence of diabetes mellitus in a traditional-living Polynesian population: the Wallis Island survey. Diabetes Care. 1983 Jul-Aug;6:334-40. 38. Greenberger NJ, Rodgers JB, Isselbacher KJ. Absorption of medium and long chain triglycerides: factors influencing their hydrolysis and transport. J Clin Invest. 1966 Feb;45:217-27. 39. Little TJ, Horowitz M, Feinle-Bisset C. Modulation by high-fat diets of gastrointestinal function and hormones associated with the regulation of energy intake: implications for the pathophysiology of obesity. Am J Clin Nutr. 2007 September 1, 2007;86:531-41.
The Journal of Nutrition NUTRITION/2011/150151 Version 1
20
Acknowledgments
We thank Amy Blair, Tuong-Vi Nguyen, Brooke Harcourt, Vicki Thallas-Bonke, Felicia
Yap, Sally Penfold, Karly Sourris and Maryann Arnstein for technical assistance and
Gavin Langmaid for the expert care of the rats.
Statement of authors’ contribution to manuscript
JMF and MTC designed the research; MTC, SPC, ALM and SA conducted the research;
MTC analyzed the data; MTC, SPC and JMF wrote the paper; and MTC had primary
responsibility for the final content; KZW and MEC had input into the manuscript. LCW
analyzed the BIS data and had input into the manuscript. All authors have read and
approved the final manuscript.
The Journal of Nutrition NUTRITION/2011/150151 Version 1
21
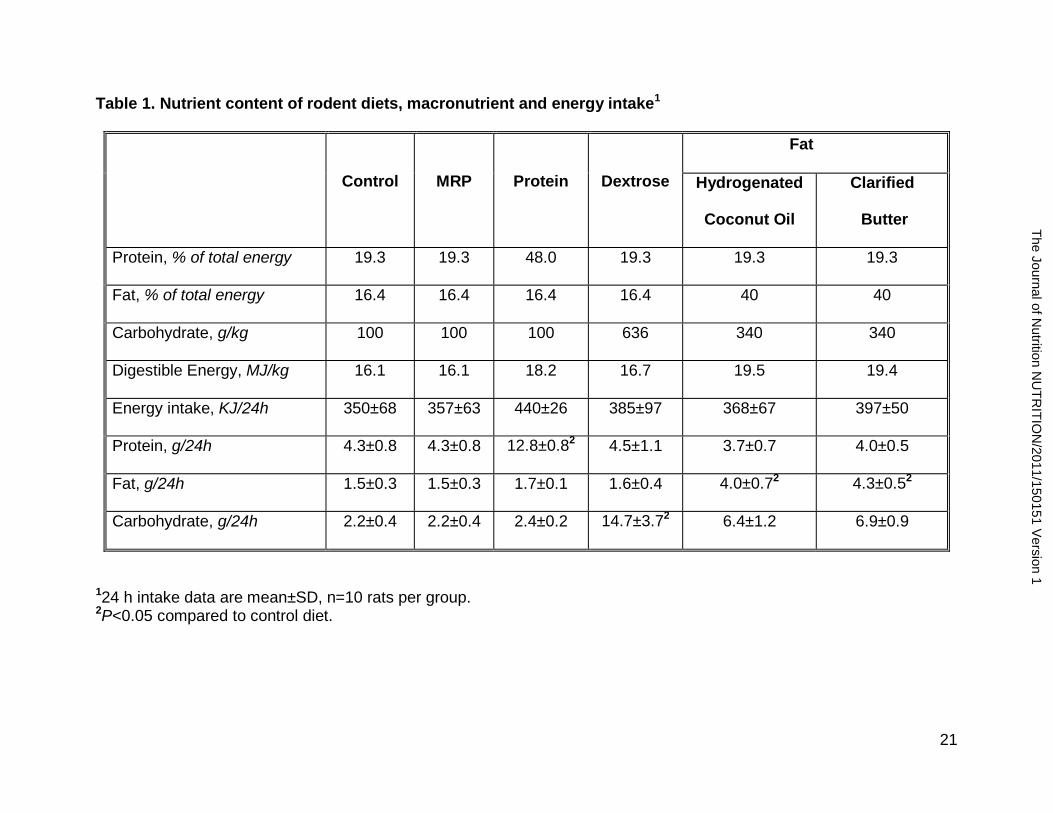
Table 1. Nutrient content of rodent diets, macronutrient and energy intake1
Control MRP Protein Dextrose
Fat
Hydrogenated
Coconut Oil
Clarified
Butter
Protein, % of total energy 19.3 19.3 48.0 19.3 19.3 19.3
Fat, % of total energy 16.4 16.4 16.4 16.4 40 40
Carbohydrate, g/kg 100 100 100 636 340 340
Digestible Energy, MJ/kg 16.1 16.1 18.2 16.7 19.5 19.4
Energy intake, KJ/24h 350±68 357±63 440±26 385±97 368±67 397±50
Protein, g/24h 4.3±0.8 4.3±0.8 12.8±0.82 4.5±1.1 3.7±0.7 4.0±0.5
Fat, g/24h 1.5±0.3 1.5±0.3 1.7±0.1 1.6±0.4 4.0±0.72 4.3±0.52
Carbohydrate, g/24h 2.2±0.4 2.2±0.4 2.4±0.2 14.7±3.72 6.4±1.2 6.9±0.9
124 h intake data are mean±SD, n=10 rats per group. 2P<0.05 compared to control diet.
T
he Journal of Nutrition N
UT
RIT
ION
/2011/150151 Version 1
22
Figure Legends Figure 1
Body weights (A), absolute total visceral depot fat pad weights (B), absolute fat mass
(C), relative fat mass (D), absolute fat free mass (E) relative fat-free mass (F) were
measured in rats after 24 weeks feeding of control (C), MRP, protein (Pr), glucose (Glu),
saturated plant fat (Pla Fat) or saturated animal fat (Ani Fat) diets. Data are mean±SEM.
*p<0.05 compared to control, n=10 rats/group.
Figure 2
Fasting glucose (A), fasting insulin (B), HOMA-IR (C), glycated Hb (GHb) (D), plasma
glucose during ipITT (E), and corresponding AUC glucose (mmol/l) (F) were measured
in rats after 24 weeks feeding of control, MRP, protein (Pr), glucose (Glu), saturated
plant fat (Pla Fat) or saturated animal fat (Ani Fat) diets. Data are mean±SEM. *p<0.05
compared to control, n=6-10 rats/group.
Figure 3
Plasma GLP-1 (A), plasma glucagon (B), liver phospho-AKT to AKT ratio (C),
gastrocnemius phospho-AKT to AKT ratio (GHb) (D), urinary excretion of 15-isoprostane
F2t (E) were measured in rats after 24 weeks feeding of control, MRP, protein (Pr),
glucose (Glu), saturated plant fat (Pla Fat) or saturated animal fat (Ani Fat) diets. Data
are mean±SEM. *p<0.05 compared to control, n=10 rats/group.
Figure 4
The Journal of Nutrition NUTRITION/2011/150151 Version 1
23
Plasma glucose during IVGTT (A), plasma insulin during IVGTT (B), total AUC insulin
(ng/ml) (C), first phase AUC insulin (ng/ml) (D), were measured in rats after 24 weeks
feeding of control, MRP, protein (Pr), glucose (Glu), saturated plant fat (Pla Fat) or
saturated animal fat (Ani Fat) diets. Data are mean±SEM. *p<0.05 compared to control,
n=6 rats/group.
The Journal of Nutrition NUTRITION/2011/150151 Version 1
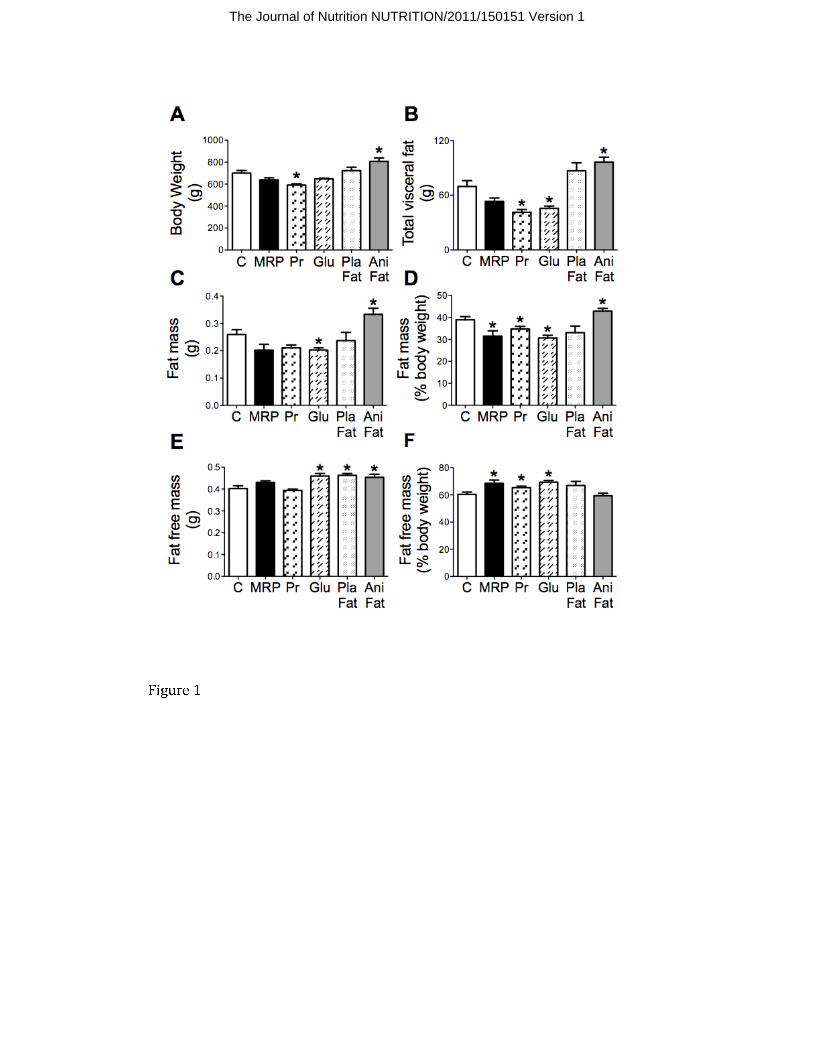
Figure 1
The Journal of Nutrition NUTRITION/2011/150151 Version 1
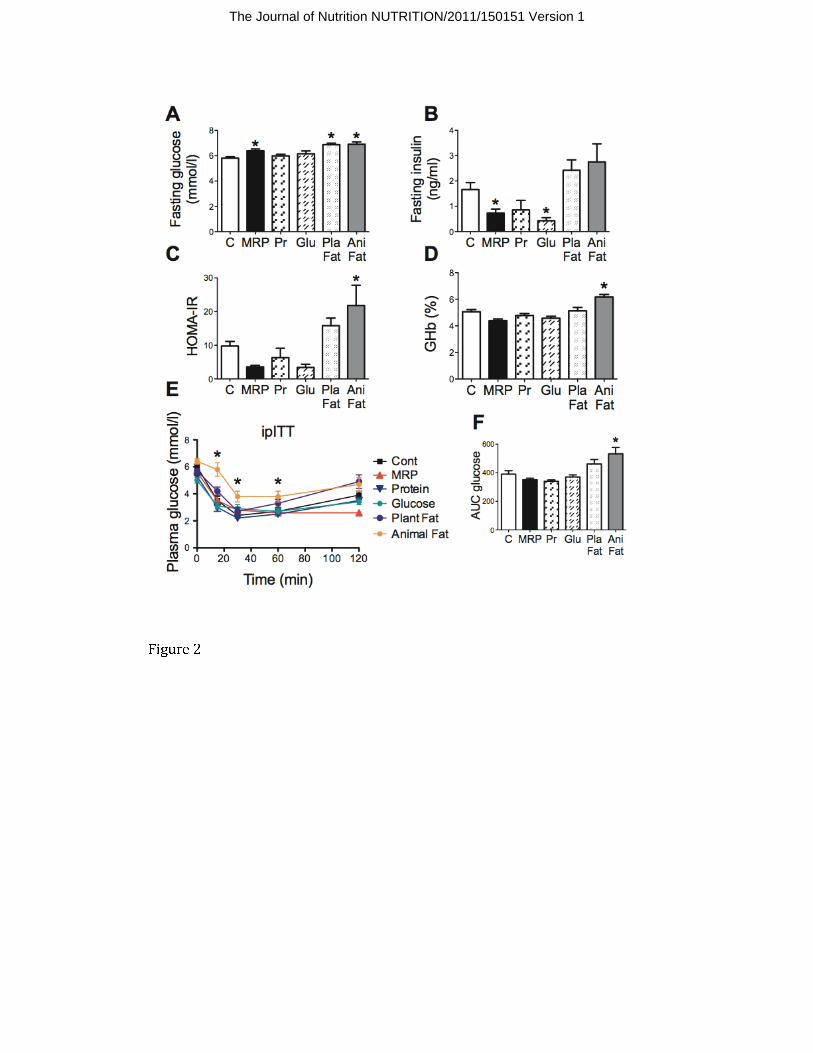
Figure 2
The Journal of Nutrition NUTRITION/2011/150151 Version 1
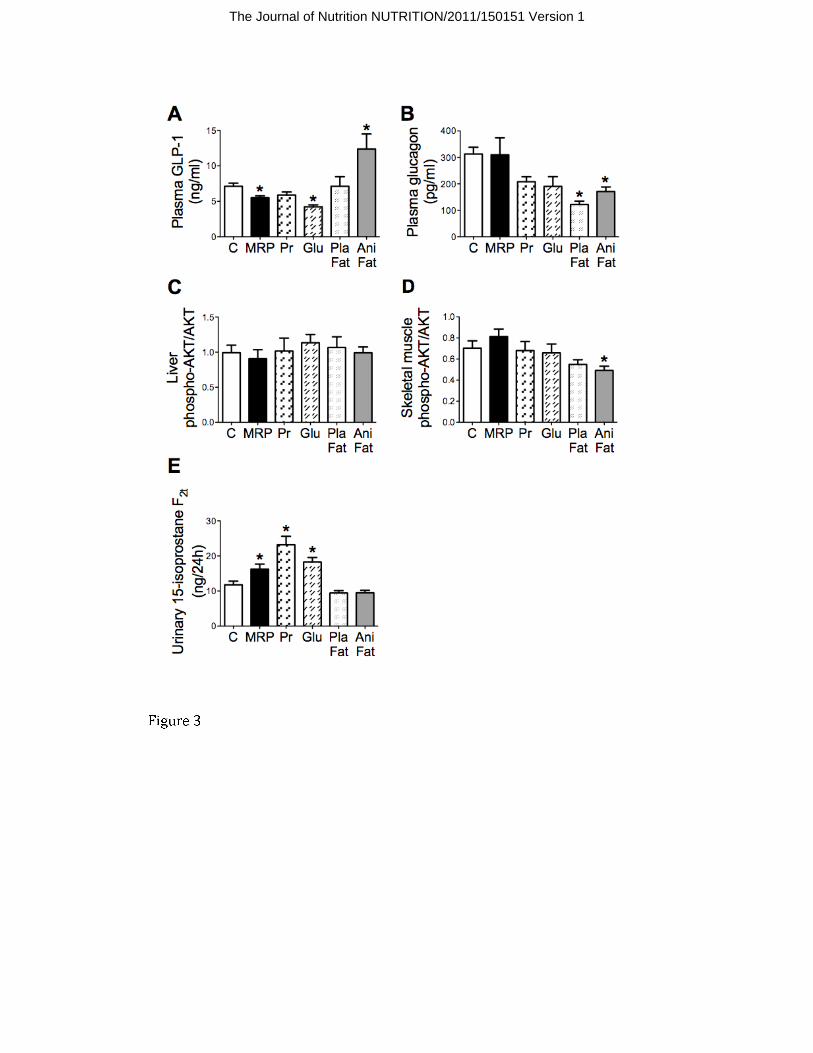
Figure 3
The Journal of Nutrition NUTRITION/2011/150151 Version 1
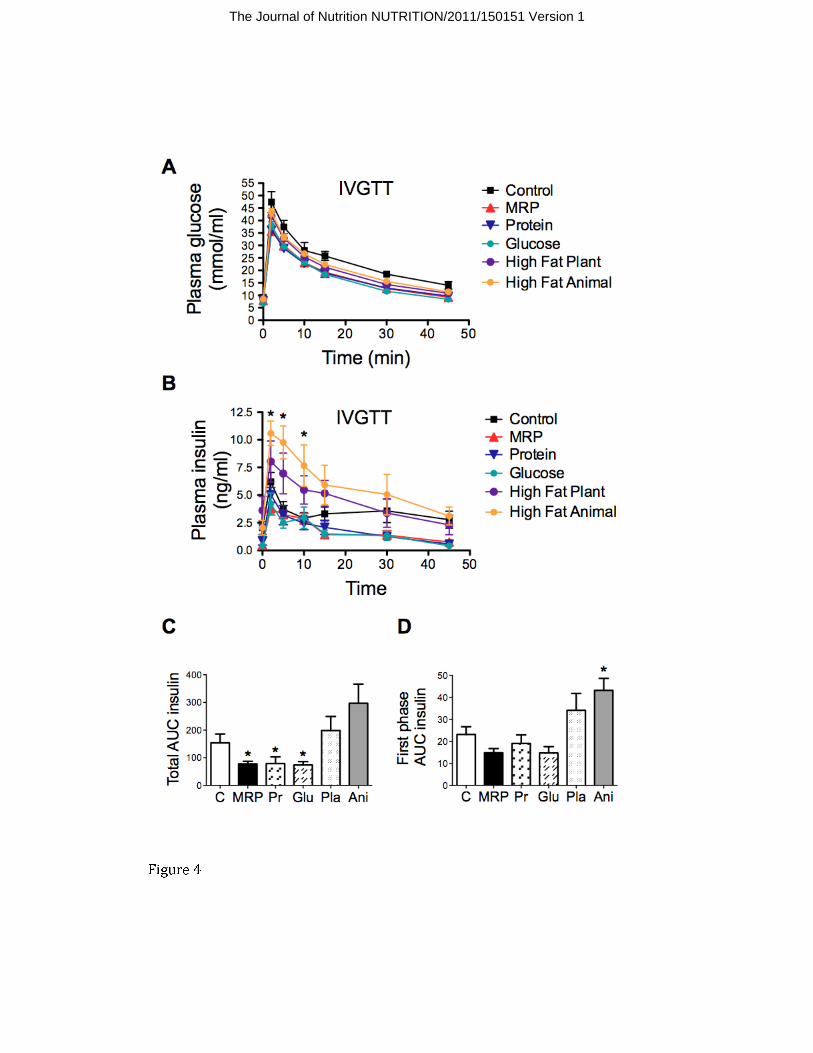
Figure 4
The Journal of Nutrition NUTRITION/2011/150151 Version 1