Avianca Holdings Price (COP) 3,120 - investorideas.com · August 4th, 2015 Colombia, Equities...
16
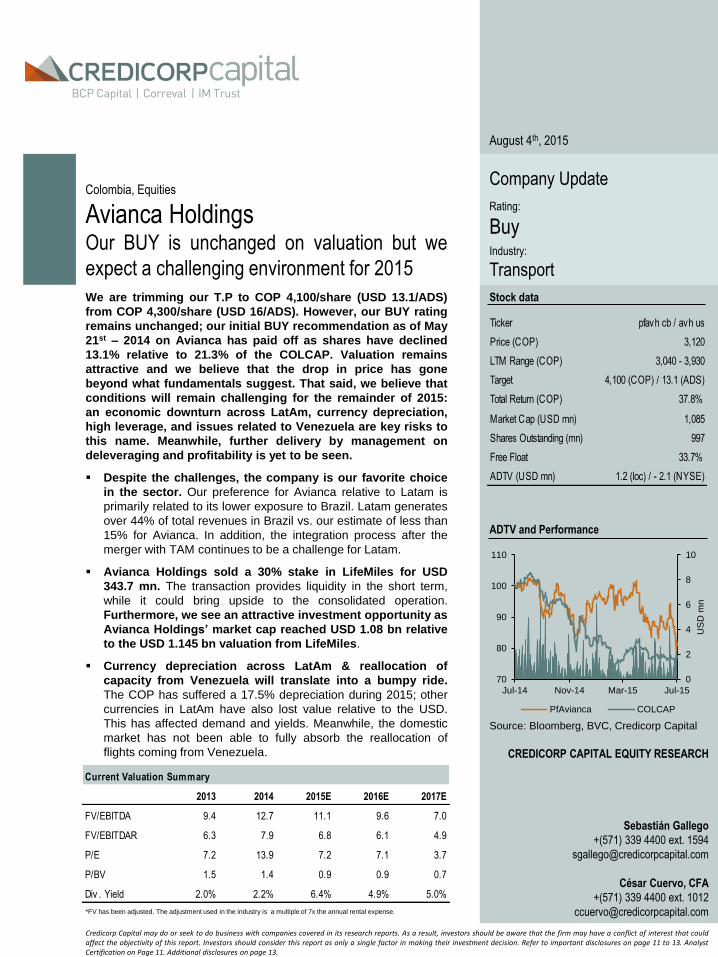
August 4 th , 2015 Colombia, Equities Avianca Holdings Our BUY is unchanged on valuation but we expect a challenging environment for 2015 Company Update Rating: Buy Industry: Transport We are trimming our T.P to COP 4,100/share (USD 13.1/ADS) from COP 4,300/share (USD 16/ADS). However, our BUY rating remains unchanged; our initial BUY recommendation as of May 21 st – 2014 on Avianca has paid off as shares have declined 13.1% relative to 21.3% of the COLCAP. Valuation remains attractive and we believe that the drop in price has gone beyond what fundamentals suggest. That said, we believe that conditions will remain challenging for the remainder of 2015: an economic downturn across LatAm, currency depreciation, high leverage, and issues related to Venezuela are key risks to this name. Meanwhile, further delivery by management on deleveraging and profitability is yet to be seen. Despite the challenges, the company is our favorite choice in the sector. Our preference for Avianca relative to Latam is primarily related to its lower exposure to Brazil. Latam generates over 44% of total revenues in Brazil vs. our estimate of less than 15% for Avianca. In addition, the integration process after the merger with TAM continues to be a challenge for Latam. Avianca Holdings sold a 30% stake in LifeMiles for USD 343.7 mn. The transaction provides liquidity in the short term, while it could bring upside to the consolidated operation. Furthermore, we see an attractive investment opportunity as Avianca Holdings’ market cap reached USD 1.08 bn relative to the USD 1.145 bn valuation from LifeMiles. Currency depreciation across LatAm & reallocation of capacity from Venezuela will translate into a bumpy ride. The COP has suffered a 17.5% depreciation during 2015; other currencies in LatAm have also lost value relative to the USD. This has affected demand and yields. Meanwhile, the domestic market has not been able to fully absorb the reallocation of flights coming from Venezuela. *FV has been adjusted. The adjustment used in the industry is a multiple of 7x the annual rental expense. Stock data ADTV and Performance Source: Bloomberg, BVC, Credicorp Capital CREDICORP CAPITAL EQUITY RESEARCH Sebastián Gallego +(571) 339 4400 ext. 1594 [email protected] César Cuervo, CFA +(571) 339 4400 ext. 1012 [email protected] Credicorp Capital may do or seek to do business with companies covered in its research reports. As a result, investors should be aware that the firm may have a conflict of interest that could affect the objectivity of this report. Investors should consider this report as only a single factor in making their investment decision. Refer to important disclosures on page 11 to 13. Analyst Certification on Page 11. Additional disclosures on page 13. 0 2 4 6 8 10 70 80 90 100 110 Jul-14 Nov-14 Mar-15 Jul-15 USD mn PfAvianca COLCAP Current Valuation Summary 2013 2014 2015E 2016E 2017E FV/EBITDA 9.4 12.7 11.1 9.6 7.0 FV/EBITDAR 6.3 7.9 6.8 6.1 4.9 P/E 7.2 13.9 7.2 7.1 3.7 P/BV 1.5 1.4 0.9 0.9 0.7 Div . Yield 2.0% 2.2% 6.4% 4.9% 5.0% Ticker pfav h cb / av h us Price (COP) 3,120 LTM Range (COP) 3,040 - 3,930 Target 4,100 (COP) / 13.1 (ADS) Total Return (C OP) 37.8% Market Cap (USD mn) 1,085 Shares Outstanding (mn) 997 Free Float 33.7% ADTV (USD mn) 1.2 (loc) / - 2.1 (NYSE)
Transcript of Avianca Holdings Price (COP) 3,120 - investorideas.com · August 4th, 2015 Colombia, Equities...
August 4th, 2015
Colombia, Equities
Avianca Holdings Our BUY is unchanged on valuation but we
expect a challenging environment for 2015
Company Update
Rating:
Buy
Industry:
Transport
We are trimming our T.P to COP 4,100/share (USD 13.1/ADS)
from COP 4,300/share (USD 16/ADS). However, our BUY rating
remains unchanged; our initial BUY recommendation as of May
21st – 2014 on Avianca has paid off as shares have declined
13.1% relative to 21.3% of the COLCAP. Valuation remains
attractive and we believe that the drop in price has gone
beyond what fundamentals suggest. That said, we believe that
conditions will remain challenging for the remainder of 2015:
an economic downturn across LatAm, currency depreciation,
high leverage, and issues related to Venezuela are key risks to
this name. Meanwhile, further delivery by management on
deleveraging and profitability is yet to be seen.
Despite the challenges, the company is our favorite choice
in the sector. Our preference for Avianca relative to Latam is
primarily related to its lower exposure to Brazil. Latam generates
over 44% of total revenues in Brazil vs. our estimate of less than
15% for Avianca. In addition, the integration process after the
merger with TAM continues to be a challenge for Latam.
Avianca Holdings sold a 30% stake in LifeMiles for USD
343.7 mn. The transaction provides liquidity in the short term,
while it could bring upside to the consolidated operation.
Furthermore, we see an attractive investment opportunity as
Avianca Holdings’ market cap reached USD 1.08 bn relative
to the USD 1.145 bn valuation from LifeMiles.
Currency depreciation across LatAm & reallocation of
capacity from Venezuela will translate into a bumpy ride.
The COP has suffered a 17.5% depreciation during 2015; other
currencies in LatAm have also lost value relative to the USD.
This has affected demand and yields. Meanwhile, the domestic
market has not been able to fully absorb the reallocation of
flights coming from Venezuela.
*FV has been adjusted. The adjustment used in the industry is a multiple of 7x the annual rental expense.
Stock data
ADTV and Performance
Source: Bloomberg, BVC, Credicorp Capital
CREDICORP CAPITAL EQUITY RESEARCH
Sebastián Gallego
+(571) 339 4400 ext. 1594
César Cuervo, CFA
+(571) 339 4400 ext. 1012
Credicorp Capital may do or seek to do business with companies covered in its research reports. As a result, investors should be aware that the firm may have a conflict of interest that could affect the objectivity of this report. Investors should consider this report as only a single factor in making their investment decision. Refer to important disclosures on page 11 to 13. Analyst Certification on Page 11. Additional disclosures on page 13.
0
2
4
6
8
10
70
80
90
100
110
Jul-14 Nov-14 Mar-15 Jul-15U
SD
mn
PfAvianca COLCAP
Current Valuation Summary
2013 2014 2015E 2016E 2017E
FV/EBITDA 9.4 12.7 11.1 9.6 7.0
FV/EBITDAR 6.3 7.9 6.8 6.1 4.9
P/E 7.2 13.9 7.2 7.1 3.7
P/BV 1.5 1.4 0.9 0.9 0.7
Div . Yield 2.0% 2.2% 6.4% 4.9% 5.0%
Ticker pfavh cb / avh us
Price (COP) 3,120
LTM Range (COP) 3,040 - 3,930
Target 4,100 (COP) / 13.1 (ADS)
Total Return (COP) 37.8%
Market Cap (USD mn) 1,085
Shares Outstanding (mn) 997
Free Float 33.7%
ADTV (USD mn) 1.2 (loc) / - 2.1 (NYSE)

2
Avianca Holdings - Company Summary Company Description
Sector: Transport
Rating: BUY
Target Price: COP 4,100/share (13.1/ADS)
Stock Data
Ticker pfav h cb / av h us
Price (COP) 3,120
LTM Range (COP) 3,040 - 3,930
Market Cap (USD mn) 1,085
Shares Outstanding (mn) 997.0
Free Float 33.7%
ADTV (USD mn) 1.2 (loc) / - 2.1 (NYSE)
Revenue breakdown - 2014 Income statement
USD mn 2013 2014 2015E 2016E 2017E
Rev enues 4,610 4,702 4,613 4,995 5,749
EBIT 385 285 278 370 579
EBITDAR 828 784 848 945 1,178
Net Income 249 120 172 173 330
Basic EPS (USD/share) 0.27 0.12 0.17 0.17 0.33
EBIT Margin 8.4% 6.1% 6.0% 7.4% 10.1%
EBITDAR Margin 18.0% 16.7% 18.4% 18.9% 20.5%
Net Margin 5.4% 2.6% 3.7% 3.5% 5.7%
Balance Sheet
USD mn 2013 2014 2015E 2016E 2017E
Cash & Equiv alents 736 641 692 738 825
Total Current Assets 1,295 1,324 1,335 1,430 1,614
Costs breakdown - 2014 Total Assets 5,179 6,176 6,615 7,034 7,582
Current Liabilities 1,658 1,872 1,883 1,977 2,149
Financial Debt 2,265 3,171 3,162 3,172 3,182
Total liabilities 3,964 4,959 5,291 5,598 5,877
Minority interest 6.3 8.1 9.1 9.1 9.1
Shareholder's equity 1,208 1,209 1,314 1,427 1,696
Total liabilities + Equity + MI 5,179 6,176 6,615 7,034 7,582
EBITDAR / Fin. Ex penses 7.3x 5.8x 5.5x 6.2x 8.0x
Adjusted Financial Debt / EBITDAR 5.0x 6.7x 6.4x 5.9x 4.8x
Financial Debt / Equity 1.9x 2.6x 2.4x 2.2x 1.9x
ROE 20.6% 10.0% 13.1% 12.1% 19.4%
ROA 4.8% 2.0% 2.6% 2.5% 4.3%
Management ROIC 8.5% 4.3% 3.9% 4.9% 7.2%
Chairman: German Efromov ich
CEO: Fabio Villegas Cash Flow Statement
CFO: Gerardo Grajales USD mn 2013 2014 2015E 2016E 2017E
IR Manager: Andres Ruiz Initial Cash 403 736 641 692 738
w w w .av iancaholdings.com Cash from Operation 545 259 515 534 693
Cash from Inv esting -483 -244 -697 -534 -575
Changes in Financial Debt 411 905 -9 10 10
Div idends (Paid) Receiv ed -37 -39 -67 -60 -61
Other financing -286 -977 309 97 20
Changes in Equity 183 0 0 0 0
Final Cash 736 641 692 738 825
Change in Cash 333 -95 51 46 87
Sources: Company Reports, Bloomberg and Credicorp Capital; E Credicorp Capital Estimates
Source: Company reports - Credicorp Capital
Source: Company reports - Credicorp Capital
Sources: Company Reports, Bloomberg and Credicorp Capital; E
Credicorp Capital Estimates
Av ianca Holdings S.A. is a Panamanian company that represents the integrated operation of severalairlines that operate nationally and internationally, including Av ianca, Taca, among others. AviancaHoldings S.A. holds investments primarily in: passenger airlines, cargo airlines and related activ ities
including tourism, engineering, maintenance and specialized maintenanceservices.
The company generates around 80% of its operating rev enues from passengers, while the remainingoperating rev enues come from cargo, LifeMiles, and other segments.
- Market share leader
- Lifemiles: liquidity in ST and further
v alue discovery in the LT
- Rev enue diversification
- Valuation
ConcernsPositives
- Lev erage
- Economic growth in LatAm
- currency depreciation
- Redeploy ment from Venezuela
- Cash trapped
Passengers, 82.3%
Cargo & others, 17.7%
Aircraft fuel, 30.5%
Aircraft rental, 6.8%
Maintenance & repairs,
6.0%
Ground operations,
9.0%
Others, 47.7%

Avianca remains as
one of the top
airlines in LatAm.
The deal of LifeMiles
was a milestone for
Avianca.
Investment Thesis
We are trimming our T.P to COP 4,100/share (USD 13.1/ADS) from COP 4,300/share
(USD 16/ADS). However, our BUY rating is unchanged. Here, it is worth mentioning
that our initial BUY rating on Avianca was successful as shares have declined 13.1%
relative to 21.3% of the COLCAP. Valuation remains attractive and we believe that
the drop in price has gone beyond what fundamentals suggest. Furthermore, the
upcoming dividend, new synergies in terms of cost, and revenue diversification
mitigates current conditions across the industry. We warn investors that conditions
will remain challenging for the remainder of 2015: an economic downturn across
LatAm, currency depreciation, high leverage, and issues related to Venezuela are
key risks to this name. Meanwhile, further delivery by management on deleveraging
and profitability is yet to be seen. We have updated our T.P to better reflect these
conditions as we expect passenger yields to remain weak during the year, while
there are risks to the company meeting its guidance for operating margin in 2015.
Avianca’s leadership is not questioned. The company is the top airline in Colombia with
a domestic market share of roughly 60%. In addition, Avianca Holdings is a regional leader
through a multi-hub strategy based on Bogota, Lima, and San Salvador. Its market share
among intra home markets1 is currently placed at 65%, while this figure is placed at 28%
for flights between domestic markets to North America. On the other hand, Avianca is
currently flying to more than 100 destinations in 26 countries, while it is a member of the
Star Alliance group which flights to 194 countries and offers 21,900 daily flights.
Valuation2 remains attractive, while the dividend yield could support share price.
Avianca Holdings is currently trading below 8x earnings, which contrast to an average P/E
of 13.3x since April - 2013. In terms of P/B multiple, the company is trading below 1x, while
its average since April - 2013 is placed at 1.8x. Finally, Avianca is currently trading below
its average EV/EBITDAR since 2013 (6.8x vs. 7.5x). On the other hand, valuation also
remains attractive relative to peers in the region on a forward basis. In fact, Copa Holdings,
Latam, and Gol are currently trading at 8.52x, 7.6x and 7.83x on a EV/EBITDAR 2015E
basis. This contrasts with 6.83x from Avianca Holdings.
On the other hand, Avianca declared on April – 2015 a dividend payment of USD
0.06691/share, which is currently equivalent to a 6.4% dividend yield. The payment is
expected no later than the end of October 31st – 2015 while other major dividend payments
from other companies in the Colombian market have been already paid.
Cash is king - LifeMiles. The frequent flyer program of Avianca Holdings has become one
of the fastest growing segments of the company. As of today, it has nearly 6 million clients
and recorded revenues of USD 133 mn in 2014. Avianca Holdings recently announced that
it has sold a 30% stake of this segment to PE fund Advent International for USD 343.7 mn.
We consider that the transaction is positive for Avianca as it provides fresh resources that
could be used to deleverage and/or support its fleet renewal process. This is particularly
the case as adjusted debt/EBITDAR has increased over the last quarters (despite a small
decline in 1Q15) and ended 1Q15 at 6.6x. Meanwhile, the company continues to have
USD 280 mn in cash trapped in Venezuela. All in all, we estimate that new resources could
reduce adjusted debt/EBITDAR by 0.6x.
1 Colombia, Ecuador, Peru, El Salvador, Costa Rica, Nicaragua, Honduras, Guatemala, Belize, excluding Central American &
Caribbean (non-regional).
2*FV has been adjusted. The adjustment used in the industry is a multiple of 7x the annual rental expense.
3

The conversion of
common shares into
preferred shares
represents an
overhang to the
stock.
The company has lower exposure to Brazil relative to peers. The economic downturn
in Brazil has had a negative effect for airlines. For 2015, the consensus expects a
contraction of 1.6% in Brazil; the economic growth forecast for 2016 is below 1.0%. This is
particularly negative for passenger demand, especially in the corporate sector which has
been suffering in the recent quarters. Despite this ongoing situation, Avianca Holdings has
less exposure to Brazil relative to its LatAm peers. At the end of 2014, the local airline’s
passenger revenue towards South America was below 17% (Brazil by itself should be
less). This contrasts with Copa, LATAM, and Gol which at the end of last year had an
exposure to Brazil of 14.6%, 44.3%, and 88%, respectively.
Key risks to our T.P and rating on Avianca include: i) further economic downturn in
Colombia and LatAm; ii) further currency depreciation iii) higher than expected competition
iv) political instability in the region, particularly a further deterioration in Venezuela; v)
higher than expected oil prices vi) inability to successfully reallocate capacity from
Venezuela; vii) deterioration of debt metrics; viii) delay in fleet renewal delivery and ix)
significant changes in the regulatory front.
We would like to point out an additional risk which institutional investors have
expressed and it is worth mentioning: the conversion of common shares into
preferred shares by insiders. In connection with the ADS issuance, insiders converted
75.6 mn common shares into preferred shares. This represented 14.7 mn ADS, an amount
which was even higher than the 12.5 mn ADS issued by the company. Avianca Holdings
did not receive any proceeds from this conversion made by insiders, while the initial price
set for the ADS was lower than the equivalent of the company’s IPO price in Colombia
(COP 3,564.8/share vs. COP 5,000/share). Although insiders have not expressed any new
intention to convert more common shares, we believe that this has prevented investors
from being more constructive on Avianca Holdings; this overhang could continue to
interfere with the company’s fundamentals as investors remain uncertain when new
conversions could occur.
Finally, the company recently announced that Mr. Fabio Villegas, CEO of Avianca
Holdings, has resigned. Mr. Villegas will be in charge of the company until the year end,
but there is no news on the potential CEO. The news came in as a surprise for us as we
believe that Mr. Villegas has successfully led Avianca Holdings for the last 10 years. In our
view, the timing of his resignation is not the best as the company is currently engaged on a
major strategic plan to renovate the fleet and increase efficiencies. Meanwhile, the current
industry conditions remain challenging and therefore the transition for a new CEO could
delay key projects.
4

We expect the
company to use the
proceeds from
LifeMiles to
deleverage.
Compared to
Avianca, LifeMiles
has higher margins,
no debt, and
minimum CAPEX
needs.
LifeMiles provides liquidity, while it may contribute to
unlock further hidden value; delivery is yet to be seen
On July 13th – 2015, Avianca Holdings announced that it has entered into an agreement
with Advent International, where the latter will acquire 30% of LifeMiles, Avianca’s loyalty
program. Due to this transaction, the local airline expects to receive USD 343.7 mn while
retaining a 70% majority stake. (Please refer to: Advent International to acquire a 30%
stake in LifeMiles for USD 343.7 mn, released on July 14th – 2015 for further details on the
transaction). We believe that the operation was consistent with Avianca’s long term
strategy while it provides short-medium term financial flexibility given that leverage has
become an issue. We have also made a breakdown of what we consider key aspects for
Avianca and why this transaction could boost the airline’s valuation. At the same time, we
provide some pieces where we believe there is work to be done.
First, we consider that Avianca Holdings will benefit from the cash received in order to
improve liquidity and deleverage. We estimate that Adjusted debt/EBITDAR could be
reduced by 0.6x at the end of 2015 relative to 1Q15, should the company use these
proceeds to bring down debt. Here, we highlight that our estimate is consistent with the
company’s forecast. As a result, we anticipate that this indicator may be close to 6x at the
end of the year compared to 6.72x reported at the end of 2014.
Avianca’s leverage – before the LifeMiles transaction
Source: Credicorp Capital & company reports
Beyond the deleveraging process, we believe that this transaction should represent an
inflexion point regarding Avianca’s valuation. According to the transaction with Advent
International, LifeMiles is valued at USD 1.145 bn, which is equivalent to over 100% to the
whole company’s market cap. This seems particularly attractive even in the current
environment of the industry and the region. Here, we see an interesting investment
opportunity as investors are currently assigning no value to Avianca Holdings.
However, there is one case in LatAm related to the IPO of SMILES which suggest that
investors assign more value to the loyalty program relative to the airline itself. In fact, the
current market cap of SMILES is placed at USD 1.9 bn, 47.4% higher than when it began
trading; meanwhile, GOL has lost 61.2% during the same time frame. This could be the
case for LifeMiles, a business that does not demand significant CAPEX, it has no
debt, and generates operating margins close to 30% vs. single digit figure for the
airline. However, we reiterate that LifeMiles is more dependent upon the airline that the
other way around and therefore valuation on Avianca seems particularly attractive at the
moment.
5
5.53x 5.05x
6.72x 6.43x
5.91x
0.0x
1.0x
2.0x
3.0x
4.0x
5.0x
6.0x
7.0x
8.0x
2012 2013 2014 2015E 2016E
Adjusted debt/EBITDAR

Further value
creation on LifeMiles
is yet to be seen. We
estimate that the
deal was passed at
25x earnings.
Even though we believe that this transaction was positive from both a short and long term
perspective, we also reiterate that synergies and further value creation is yet to be
seen. We describe some aspects that may improve in order to boost Avianca’s value. At
the end of 2014, LifeMiles’ revenue per customer reached USD 22.5; this contrasts with
peers in the region such as Multiplus and Smiles who recorded USD 59.9/customer and
USD 32.5/customer, respectively. Higher revenue per customer could come from a faster
redemption period relative to the 10-month frame that the company currently has.
Meanwhile, Avianca needs to have a higher sustained earn-burn ratio as it is the case for
peers in LatAm. Here, we highlight that LifeMiles’ earn-burn ratio has been quite volatile
over the last quarters, ranging from 67% to 93% (average for Multiplus is above 80% on a
consistent basis).
In addition to higher revenue per customer and a more consistent earn-burn ratio, LifeMiles
will experience challenging macro conditions across the region at least for the next year.
Lower expected economic growth in Colombia and some other countries in LatAm may
harm demand. As a result, we consider that it is determinant for both Avianca and Advent
International to create key commercial partnerships as well as designing new marketing
strategies that could boost redemption of miles.
Adding value to shareholders will not be easy. However, we believe that Avianca’s new
partner, Advent International brings to the table both – key personnel and a well defined
strategic proposal. First, we believe that Advent’s operating partners and industry advisors
that have surrounded this operation are strong. This team not only includes Mr. Jorge
Londoño, former CEO of Bancolombia, but also two industry experts that have led key
projects similar to LifeMiles (JV between Aeromexico and AIMIA). Furthermore, under the
new strategic framework, both parties will look to enter new markets as well as strengthen
the commercial partnership network. Meanwhile, we believe that Advent’s ability and
expertise in non-airline retail relations could provide/lock new alliances for the loyalty
program.
Finally, we believe that further addition of value could come from new initiatives that have
been recently launched and will be tossed in the near future, so that customers could
increase redemption of mileage points. Avianca recently announced the mobile app for
LifeMiles, while the airline also enabled customers the use of the loyalty’s program card to
accumulate and redeem miles through a multichannel (Redeban) payment terminal in more
than 240 stores.
All in all, Avianca is expecting LifeMiles to continue to be the company’s crown jewel.
Although guidance has been limited, the new strategy designed for LifeMiles
includes an expected 16%-17% growth in revenues for the upcoming years, while
maintaining operating margins close to 30%. A successful delivery on both the
operating and financial figures should result in a fruitful IPO, the exit strategy (for Advent)
that we see as most likely given the cases of Smiles and Multiplus. Furthermore, a
successful exit strategy through an IPO could prove to be a new milestone towards
Avianca’s valuation as we estimate that the deal with Advent was closed at near 25x
earnings (based on 2014 figures). In any case, we expect Avianca to maintain the
control of Lifemiles in line with the company’s comments.
6

The macro
environment across
LatAm has
deteriorated.
What has changed?
The decision made in 1Q14 to redeploy the vast majority of flying capacity to/from
Venezuela brought a whole new picture for Avianca Holdings. Here, we expected a milder
effect given a different demand environment across the markets where Avianca Holdings
operates. That said, the economic downturn both in Colombia and LatAm along with higher
than expected currency depreciation across the continent presents a challenging
environment for the local airline for the remainder of 2015 and 2016.
Given the difficult economic situation and the political instability in Venezuela along with the
USD 280 mn trapped, Avianca Holdings decided to cut the frequency of flights to this
country from 7 to 2 daily roundtrips. Under the new strategy, the local airline reallocated
this capacity mostly to the domestic market in Colombia. However, the decline in oil prices
that started in mid 2014 has caused a major recoil of the local economy (we have adjusted
our GDP growth forecast for both 2015 and 2016 to 3.7% and 3% from 4.7%, respectively).
This has hurt demand in the domestic market, which has been unable to fully absorb the
capacity coming from Venezuela. The negative sentiment towards the local economy has
also caused a sharp depreciation of the COP relative to the USD (over 15% in 2015). In
addition to the internal shocks, the LatAm region has been suffering an economic
downturn. The consensus anticipates a negative growth of 0.2% for the region in 2015, led
by a negative economic growth of 1.4% in Brazil. Given this scenario, we expect a negative
effect on passenger demand, yields, and profitability for Avianca Holdings.
Due to the these effects, we anticipate for Avianca that growth in consolidated ASKs will be
in the higher range of the company’s guidance for 2015, at 6.8%. This will be driven by a
double digit growth in the domestic market. Meanwhile, the reallocation of flights from
Venezuela will harm the domestic load factors even below 75% as it has been the case for
1H15; however, we expect the consolidated figure to be slightly below 80% which is still
healthy given the challenging environment. On the other hand, the currency depreciation
across LatAm and lower economic growth will continue to harm consolidated passenger
yields as we expect negative growth in this indicator for the remainder of 2015. All in all,
we expect a 6% EBIT margin for 2015, which is below the company’s guidance of
8%-10%. At the same time, we estimate the company’s ROIC for 2015 to be the
lowest since 2012, and lower than the WACC (3.91% vs 8.04%). Going forward, we
expect a recovery; however, it is too early and we prefer to be conservative ahead of 2016.
Load factor and Avianca Holdings’ key profitability indicators
Source: Credicorp Capital & company reports
7
80.4%
79.4%
78.6%
78.0%
80.0%
76.5%
77.0%
77.5%
78.0%
78.5%
79.0%
79.5%
80.0%
80.5%
81.0%
0.0%
2.0%
4.0%
6.0%
8.0%
10.0%
12.0%
2013 2014 2015E 2016E 2017E
Lo
ad facto
r (on
ly)
Load factor EBIT Margin ROIC

Change in financial estimates
Source: Credicorp Capital & company reports
Valuation
Our valuation model is based on a 10 year - DCF model, which assumes a 6% and 7.6%
CAGR on revenues and EBITDAR (2015 – 2024 period), respectively. Despite our forecast
of 6% in terms of EBIT margin for 2015, we anticipate that the company will be able to
achieve an operating margin between 10%-11% in the long term. This is supported by
further synergies coming from the merger with TACA, the fleet renewal plan, and the new
initiatives to cut operating costs. Currently, the local airline is engaged in a fleet renewal
process that includes an optimization of aircraft families from 9 to 4. By doing so, Avianca
expects to increase fuel efficiency (A320 neos consume 15% less fuel), reduce training
cost, and decrease maintenance related expenses.
On the other hand, according to our DCF and the investment plan of the company, we
anticipate that the company will not generate FCF to the firm during 2015 and 2016, while
we expect a gradual recovery going forward. Finally, it is worth mentioning that the
proceeds from LifeMiles have been included in addition to the current cash position, while
we have included only 80% of the USD 280 mn trapped, to somehow incorporate this risk.
We reiterate our T.P of COP 4,100/share (USD 13.1/ADS). Here, it is worth mentioning that
our T.P derived in COP is based on an exchange rate of COPUSD 2,500 for 2015.
In terms of our WACC, we have followed our in-house methodology for key inputs such as
risk free rate, country risk, and market premium. Meanwhile, we have used a leveraged
beta of 1.89. Meanwhile, the cost of debt of Avianca remains low at nearly 4.3% before
taxes. All in all, our WACC for Avianca is placed at 8.04% in USD terms.
Avianca Holdings base case valuation
Source: Credicorp Capital & company reports
8
Avianca Holdings
USD mn Update Prior Diff Update Prior Diff
Income statement
Rev enues 4,613 5,175 -10.9% 4,995 5,608 -10.9%
EBITDAR 848 1,167 -27.3% 945 1,203 -21.5%
Net income 172 369 -53.3% 173 509 -66.0%
EPS (COP) 0.2 0.4 -53.3% 0.2 0.5 -66.0%
2015E 2016E
Risk free rate 2.22% Cash & equiv alents 788
Risk Premium 6.00% Inv estments 0
Lev ered Beta 1.89 Financial debt -3,210
Country Risk Premium 3.44% Others -206
Cost of Equity (USD) 20.04% Minority Interest -9
WACC 8.04% Equity value 1,637
EBITDAR ex it multiple 4x Shares outstanding (mn) 997
PV from DCF (USD mn) 903
PV from perpetuity (USD mn) 3,372
T.P 2015E (USD/share) 13.14
PV total (USD mn) 4,275 T.P 2015E (COP/share) 4,105

Relative valuation
Our target price set at COP 4,100 (USD 13.1/ADS) implies an EV/EBITDAR 2015E of 7.5x.
This multiple remains conservative relative to other peers in Latam. That said, we believe
that Avianca should still trade below a company such as Copa Holdings as this company
has higher operating margins and lower leverage.
Share price performance across the industry in LatAm has been weak on a YTD basis and
we do not anticipate a significant re-rating before the year end. That said, we highlight that
Avianca has outperform its LatAm’s peers, while it still remains negative on a USD
adjusted basis. Once again, we reiterate that in terms of our regional strategy we
prefer Avianca vs. Latam Group given a lower exposure to Brazil.
Finally, a re-rating for Avianca and across the industry could come from any improvements
on the macro front, which seems challenging at least for 2015. Meanwhile, any successful
strategy of Avianca to redeploy capacity from Venezuela and higher than expected growth
on passenger revenues should be positive for shares of Avianca Holdings.
Avianca Holdings – relative valuation across LatAm
Source: Credicorp Capital & Company Reports
** Consensus anticipates a net loss for GOL, but we have placed at 60x for illustration purposes
9
Market Cap EBIT Mg. EBITDAR Mg.
Company USD mn 2015E 2016E 2015E 2016E 2015E 2015E
LatAm
Av ianca Holdings 1,085 7.2x 7.1x 6.8x 6.1x 6.0% 18.4%
Latam Airlines 3,447 40.2x 17.9x 7.6x 7.2x 6.2% 19.1%
Gol 471 NM NM 7.8x 6.4x 3.0% 16.7%
Copa Holdings 3,322 10.2x 8.6x 8.5x 7.1x 12.7% 23.5%
Latam Average 2,081 19.2x 11.2x 7.7x 6.7x 7.0% 19.4%
North America
American Airlines 26,940 4.5x 6.8x 4.5x 4.2x 16.7% 24%
United Continental 21,302 5.5x 8.3x 4.5x 4.3x 12.8% 20%
Delta Airlines 35,268 9.9x 8.7x 5.0x 4.6x 15.7% 21%
North America average 27,837 6.6x 7.9x 4.7x 4.3x 15.1% 21.5%
Consolidated average 14,959 12.9x 9.6x 6.2x 5.5x 11.0% 20.5%
P/E FV/EBITDAR
Latam
GOL**
Copa Holdings
Avianca
-10.0x
0.0x
10.0x
20.0x
30.0x
40.0x
50.0x
60.0x
70.0x
5.0x 6.0x 7.0x 8.0x 9.0x 10.0x
P/E
201
5E
EV/EBITDAR 2015E
Financial Statements
10
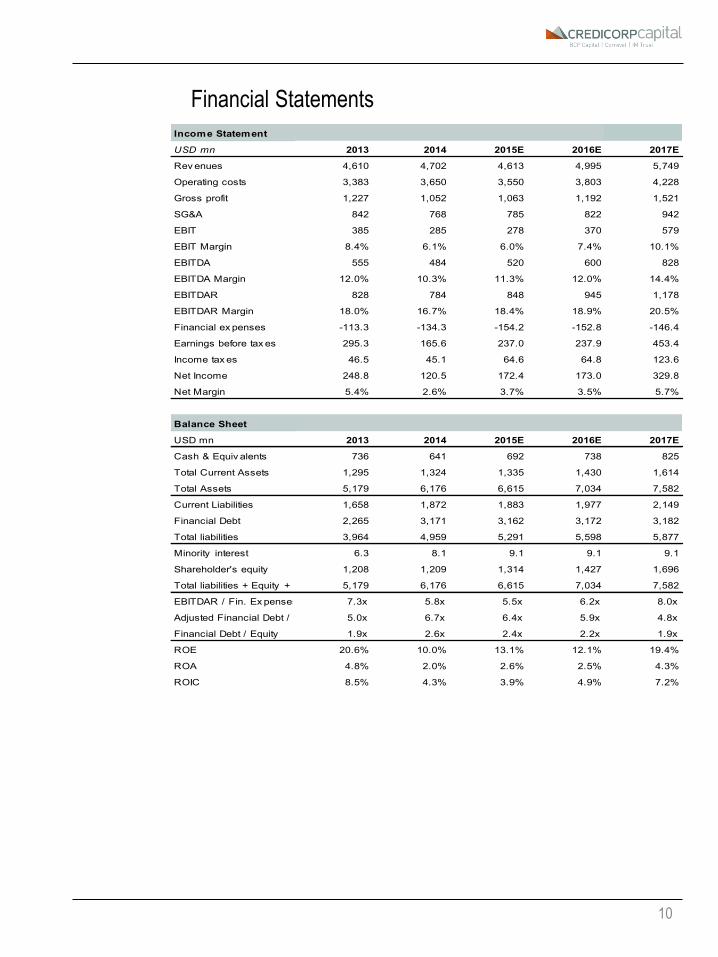
Income Statement
USD mn 2013 2014 2015E 2016E 2017E
Rev enues 4,610 4,702 4,613 4,995 5,749
Operating costs 3,383 3,650 3,550 3,803 4,228
Gross profit 1,227 1,052 1,063 1,192 1,521
SG&A 842 768 785 822 942
EBIT 385 285 278 370 579
EBIT Margin 8.4% 6.1% 6.0% 7.4% 10.1%
EBITDA 555 484 520 600 828
EBITDA Margin 12.0% 10.3% 11.3% 12.0% 14.4%
EBITDAR 828 784 848 945 1,178
EBITDAR Margin 18.0% 16.7% 18.4% 18.9% 20.5%
Financial ex penses -113.3 -134.3 -154.2 -152.8 -146.4
Earnings before tax es 295.3 165.6 237.0 237.9 453.4
Income tax es 46.5 45.1 64.6 64.8 123.6
Net Income 248.8 120.5 172.4 173.0 329.8
Net Margin 5.4% 2.6% 3.7% 3.5% 5.7%
Balance Sheet
USD mn 2013 2014 2015E 2016E 2017E
Cash & Equiv alents 736 641 692 738 825
Total Current Assets 1,295 1,324 1,335 1,430 1,614
Total Assets 5,179 6,176 6,615 7,034 7,582
Current Liabilities 1,658 1,872 1,883 1,977 2,149
Financial Debt 2,265 3,171 3,162 3,172 3,182
Total liabilities 3,964 4,959 5,291 5,598 5,877
Minority interest 6.3 8.1 9.1 9.1 9.1
Shareholder's equity 1,208 1,209 1,314 1,427 1,696
Total liabilities + Equity + Min int. 5,179 6,176 6,615 7,034 7,582
EBITDAR / Fin. Ex penses 7.3x 5.8x 5.5x 6.2x 8.0x
Adjusted Financial Debt / EBITDAR 5.0x 6.7x 6.4x 5.9x 4.8x
Financial Debt / Equity 1.9x 2.6x 2.4x 2.2x 1.9x
ROE 20.6% 10.0% 13.1% 12.1% 19.4%
ROA 4.8% 2.0% 2.6% 2.5% 4.3%
ROIC 8.5% 4.3% 3.9% 4.9% 7.2%

11
Important Disclosures This research report was prepared by CredicorpCapital Peru S.A and/or Credicorp Capital Colombia Sociedad Comisionista de
Bolsa and/or IM Trust S.A. Corredores de Bolsa, companies authorized to engage in securities activities in Peru, Colombia and
Chile, respectively and indirect subsidiaries of Credicorp Capital Ltd. (jointly referred to as “Credicorp Capital”). None of the
companies jointly referred to as Credicorp Capital are registered as broker-dealers in the United States and, therefore, they are not
subject to U.S. rules regarding the preparation of research reports and the independence of research analysts. This research report
is provided for distribution only to “major U.S. institutional investors” in reliance on the exemption from registration provided by Rule
15a-6 of the U.S. Securities Exchange Act of 1934, as amended (the “Exchange Act”).
Any U.S. recipient of this research report wishing to effect any transaction to buy or sell securities or related financial instruments
based on the information provided in this research report can do so only through Credicorp Securities Inc., a registered broker-
dealer in the United States. Under no circumstances may a U.S. recipient of this research report effect any transaction to buy or sell
securities or related financial instruments directly through Credicorp Capital.
Credicorp Securities Inc. accepts responsibility for the contents of this research report, subject to the terms set out below, to the
extent that it is delivered to a U.S. person other than a major U.S. institutional investor.
Any analyst whose name appears on this research report is not registered or qualified as a research analyst with the Financial
Industry Regulatory Authority (“FINRA”) and is not a registered representative of Credicorp Securities Inc. and, therefore, is not
subject to applicable restrictions under FINRA Rules on communications with a subject company, public appearances and trading
securities held by a research analyst account.
A.Analyst Disclosures
The functional job title of the person(s) responsible for the recommendations contained in this report is Equity Research Analyst
unless otherwise stated on the cover.
Regulation AC - Analyst Certification: Each Equity Research Analyst listed on the front-page of this report is principally
responsible for the preparation and content of all or any identified portion of this research report and hereby certifies thatwith
respect to each issuer or security or any identified portion of the report with respect to an issuer or security that the Equity Research
Analyst covers in this research report, all of the views expressed in this research report accurately reflect their personal views about
those issuer(s) or securities. Each Equity Research Analyst also certifies that no part of their compensation was, is, or will be,
directly or indirectly, related to the specific recommendation(s) or view(s) expressed by that Equity Research Analyst in this research
report.
Each Equity Research Analyst certifies that he or she is acting independently and impartially from the referenced
company/shareholders, directors and is not affected by any current or potential conflict of interest that may arise from any of the
companies’ activities.
Analyst Compensation: The research analyst(s) primarily responsible for the preparation of the content of this research report
attest(s) that no part of his or her compensation was, is or will be, directly or indirectly, related to the specific recommendations that
he or she expressed in the research report.
Registration of non-US Analysts: Unless otherwise noted, the non-US analysts listed on the front of this report are employees of
one of the companies jointly referred as Credicorp Capital, which are non-US affiliates of Credicorp Securities Inc., a SEC registered
and FINRA member broker-dealer. Equity Research Analysts employed by the companies jointly referred as Credicorp Capital, are
not registered/ qualified as research analysts under FINRA/NYSE rules, are not registered representatives of CredicorpSecurities
Inc. and may not be subject to NASD Rule 2711 and NYSE Rule 472 restrictions on communications with covered companies, public
appearances, and trading securities held by a research analyst account. Please refer to www.credicorpcapital.com for further
information relating to research and conflict of interest management.

12
B.Ownership and Material Conflicts of Interest
Neither Credicorp Securities Inc. or its affiliates ‘beneficially own’, as determined in accordance with Section 13(d) of the Exchange
Act, 1% or more of the equity securities of the company referenced in this report. Credicorp Securities Inc., its affiliates and/or their
respective officers, directors or employees may have interests, or long or short positions, and may at any time make purchases or
sales as a principal or agent of the securities referred to herein.
C.Compensation and Investment Banking Activities
Neither Credicorp Securities Inc. or any of its affiliates have managed or co-managed a public offering of securities for the subject
company in the past 12 months. Neither Credicorp Securities Inc. or its affiliates have received compensation for investment banking
services from the subject company in the past 12 months. Neither Credicorp Securities Inc. or its affiliates do expect to receive or
intend to seek compensation for investment banking services from the subject company in the next 3 months.
D. Rating System
Stock ratings are based on the analyst’s expectation of the stock’s total return during the twelve to eighteen months following
assignment of the rating. This view is based on the target price, set as described below, and on the analyst’s opinion, general market
conditions and economic developments.
Buy: Expected returns of 5 percentage points or more in excess over the expected return of the local index, over the next 12-18
months.
Hold: Expected returns of +/- 5% in excess/below the expected return of the local index over the next 12-18 months.
Underperform: Expected to underperform the local index by 5 percentage points or more over the next 12-18 months.
Under Review / Restricted: Company coverage is under review or restricted.
The IPSA, COLCAP and IGBVL indexes are the selective equity indexes calculated by the Bolsa de Comercio de Santiago, the
Bolsa de Valores de Colombia, and the Bolsa de Valores de Lima, respectively.
In making a recommendation, the analyst compares the target price with the actual share price, and compares the resulting
expected return for the IPSA, the COLCAP, and/or the IGBVL indexes, as estimated by IM Trust Corredores de Bolsa S.A.,
Credicorp Capital Colombia Sociedad Comisionista de Bolsa, and/or CredicorpCapital Peru S.A, and then makes a recommendation
derived from the difference in upside potential between the shares and the respective index.
E. Distribution of Ratings
Rating
N° of Companies covered with this
rating
Companies covered with this
rating (% )
Buy 29 35%
Hold 44 53%
Underperform 8 10%
Under Review 2 2%
Total 83 100%
13
F.Price Target
Unless otherwise stated in the text of this report, target prices in this report are based on either a discounted cash flow valuation or
comparison of valuation ratios with companies seen by the analyst as comparable or a combination of the two methods. The result of
this fundamental valuation is adjusted to reflect the analyst’s views on the likely course of investor sentiment. Whichever valuation
method is used there is a significant risk that the target price will not be achieved within the expected timeframe. Risk factors include
unforeseen changes in competitive pressures or in the level of demand for the company’s products. Such demand variations may
result from changes in technology, in the overall level of economic activity or, in some cases, in fashion. Valuations may also be
affected by changes in taxation, in exchange rates and, in certain industries, in regulations. Investment in overseas markets and
instruments such as ADRs can result in increased risk from factors such as exchange rates, exchange controls, taxation, and
political and social conditions. This discussion of valuation methods and risk factors is not comprehensive – further information is
available upon request.
II.ADDITIONAL DISCLOSURES
This product is not for retail clients or private individuals.
The information contained in this publication was obtained from various publicly available sources believed to be reliable, but has not
been independently verified by the companies jointly referred as Credicorp Capital, therefore they do not warrant the completeness
or accuracy of such information and does not accept any liability with respect to the accuracy or completeness of such information,
except to the extent required by applicable law.
This publication is a brief summary and does not purport to contain all available information on the subjects covered. Further
information may be available on request. This report may not be reproduced for further publication unless the source is quoted. This
publication is for information purposes only and shall not be construed as an offer or solicitation for the subscription or purchase or
sale of any securities, or as an invitation, inducement or intermediation for the sale, subscription or purchase of any securities, or for
engaging in any other transaction. This publication is not for private individuals.
Any opinions, projections, forecasts or estimates in this report are those of the author only, who has acted with a high degree of
expertise. They reflect only the current views of the author at the date of this report and are subject to change without notice. The
companies jointly referred to as Credicorp Capital have no obligation to update, modify or amend this publication or to otherwise
notify a reader or recipient of this publication in the event that any matter, opinion, projection, forecast or estimate contained herein,
changes or subsequently becomes inaccurate, or if research on the subject company is withdrawn. The analysis, opinions,
projections, forecasts and estimates expressed in this report were in no way affected or influenced by the issuer. The author of this
publication benefits financially from the overall success of Credicorp Capital.
The investments referred to in this publication may not be suitable for all recipients. Recipients are urged to base their investment
decisions upon their own appropriate investigations that they deem necessary. Any loss or other consequence arising from the use
of the material contained in this publication shall be the sole and exclusive responsibility of the investor and Credicorp Capital
accepts no liability for any such loss or consequence. In the event of any doubt about any investment, recipients should contact their
own investment, legal and/or tax advisers to seek advice regarding the appropriateness of investing. Some of the investments
mentioned in this publication may not be readily liquid investments. Consequently it may be difficult to sell or realize such
investments. The past is not necessarily a guide to future performance of an investment. The value of investments and the income
derived from them may fall as well as rise and investors may not get back the amount invested. Some investments discussed in this
publication may have a high level of volatility. High volatility investments may experience sudden and large falls in their value which
may cause losses. International investing includes risks related to political and economic uncertainties of foreign countries, as well
as currency risk.

14
To the extent permitted by applicable law, no liability whatsoever is accepted for any direct or consequential loss, damages, costs or
prejudices whatsoever arising from the use of this publication or its contents.
Credicorp Capital (and its affiliates) has implemented written procedures designed to identify and manage potential conflicts of
interest that arise in connection with its research business, which are available upon request. The Credicorp Capital research
analysts and other staff involved in issuing and disseminating research reports operate independently of Credicorp Capital’s
Investment Banking business. Information barriers and procedures are in place between the research analysts and staff involved in
securities trading for the account of Credicorp Capital or clients to ensure that price sensitive information is handled according to
applicable laws and regulations.
Country and region disclosures
United Kingdom: This document is for persons who are Eligible Counterparties or Professional Clients only and is exempt from the
general restriction in section 21 of the Financial Services and Markets Act 2000 on the communication of invitations or inducements
to engage in investment activity on the grounds that it is being distributed in the United Kingdom only to persons of a kind described
in Articles 19(5) (Investment professionals) and 49(2) (High net worth companies, unincorporated associations, etc.) of the Financial
Services and Markets Act 2000 (Financial Promotion) Order 2005 (as amended). It is not intended to be distributed or passed on,
directly or indirectly, to any other class of persons. Any investment to which this document relates is available only to such persons
and other classes of person should not rely on this document.
United States: This communication is only intended for, and will only be distributed to, persons residing in any jurisdictions where
such distribution or availability would not be contrary to local law or regulation. This communication must not be acted upon or relied
on by persons in any jurisdiction other than in accordance with local law or regulation and where such person is an investment
professional with the requisite sophistication to understand an investment in such securities of the type communicated and assume
the risks associated therewith.
This communication is confidential and is intended solely for the addressee. It is not to be forwarded to any other person or copied
without the permission of the sender. This communication is provided for information only. It is not a personal recommendation or an
offer to sell or a solicitation to buy the securities mentioned. Investors should obtain independent professional advice before making
an investment.
Notice to U.S. Investors: This material is not for distribution in the United States, except to “major US institutional investors” as
defined in SEC Rule 15a-6 ("Rule 15a-6") and related guidance. Credicorp Capital and its affiliates has entered into arrangements
with Credicorp Securities Inc., which enables this report to be furnished to certain U.S. recipients in reliance on Rule 15a-6 through
Credicorp Securities Inc., which is registered under the U.S. Securities Exchange Act of 1934, as amended.
Each U.S. recipient of this report represents and agrees, by virtue of its acceptance thereof, that it is a "major U.S. institutional
investor" (as such term is defined in Rule 15a-6) and that it understands the risks involved in executing transactions in such
securities. Any U.S. recipient of this report that wishes to discuss or receive additional information regarding any security or issuer
mentioned herein, or engages in any transaction to purchase or sell or solicit or offer the purchase or sale of such securities, should
contact a registered representative of the Credicorp Securities Inc. that provided the report.
Credicorp Securities Inc. is a broker-dealer registered with the SEC, a member of FINRA and SIPC. You can reach Credicorp
Securities Inc. At 121 Alhambra Plaza, suite 1200, Coral Gables, Miami 33134, phone (305) 4480971 Equity trading: 786 999 1633.
You may obtain information about SIPC, including the SIPC brochure, by contacting SIPC directly at 202-371-8300; website:
http://www.sipc.org

15
Credicorp Securities Inc., is a wholly owned subsidiary of Credicorp Capital Ltd.
Nothing herein excludes or restricts any duty or liability to a customer that Credicorp Securities Inc. have under applicable law.
Investment products provided by or through Credicorp Securities Inc. are not insured by the Federal Deposit Insurance Corporation
and are not deposits or other obligations of any insured depository institution, may lose value and are not guaranteed by the entity
that published the research as disclosed on the front page and are not guaranteed by Credicorp Securities Inc.
Investing in non-U.S. Securities may entail certain risks. The securities referred to in this report and non-U.S. issuers may not be
registered under the U.S. Securities Act of 1933, as amended, and the issuer of such securities may not be subject to U.S. reporting
and/or other requirements. Rule 144A securities may be offered or sold only to persons in the U.S. who are Qualified Institutional
Buyers within the meaning of Rule 144A under the Securities Act. The information available about non-U.S. companies may be
limited, and non-U.S. companies are generally not subject to the same uniform auditing and reporting standards as U.S. companies.
Securities of some non-U.S. companies may not be as liquid as securities of comparable U.S. companies. Securities discussed
herein may be rated below investment grade and should therefore only be considered for inclusion in accounts qualified for
speculative investment.
Analysts employed by one of the companies jointly referred to as Credicorp Capital, all of which are non-U.S. broker-dealers, are not
required to take the FINRA analyst exam. The information contained in this report is intended solely for certain "major U.S.
institutional investors" and may not be used or relied upon by any other person for any purpose. Such information is provided for
informational purposes only and does not constitute a solicitation to buy or an offer to sell any securities under the Securities Act of
1933, as amended, or under any other U.S. federal or state securities laws, rules or regulations. The investment opportunities
discussed in this report may be unsuitable for certain investors depending on their specific investment objectives, risk tolerance and
financial position.
In jurisdictions where Credicorp Securities Inc. is not registered or licensed to trade in securities, or other financial products,
transactions may be executed only in accordance with applicable law and legislation, which may vary from jurisdiction to jurisdiction
and which may require that a transaction be made in accordance with applicable exemptions from registration or licensing
requirements.
The information in this publication is based on sources believed to be reliable, but Credicorp Securities Inc. does not make any
representation with respect to its completeness or accuracy. All opinions expressed herein reflect the author's judgment at the
original time of publication, without regard to the date on which you may receive such information, and are subject to change without
notice.
Credicorp Securities Inc. or its affiliates may have issued other reports that are inconsistent with, and reach different conclusions
from, the information presented in this report. These publications reflect the different assumptions, views and analytical methods of
the analysts who prepared them. Past performance should not be taken as an indication or guarantee of future performance, and no
representation or warranty, express or implied, is provided in relation to future performance.
Credicorp Securities Inc. and any company affiliated with it may, with respect to any securities discussed herein: (a) take a long or
short position and buy or sell such securities; (b) act as investment and/or commercial bankers for issuers of such securities; (c) act
as market makers for such securities; (d) serve on the board of any issuer of such securities; and (e) act as paid consultant or
advisor to any issuer. The information contained herein may include forward-looking statements within the meaning of U.S. federal
securities laws that are subject to risks and uncertainties. Factors that could cause a company's actual results and financial condition
to differ from expectations include, without limitation: political uncertainty, changes in general economic conditions that adversely
affect the level of demand for the company's products or services, changes in foreign exchange markets, changes in international
and domestic financial markets and in the competitive environment, and other factors relating to the foregoing. All forward-looking
statements contained in this report are qualified in their entirety by this cautionary statement.
Other countries: Laws and regulations of other countries may also restrict the distribution of this report. Persons in possession of
this document should inform themselves about possible legal restrictions and observe them accordingly.
16
Hugo Horta
Director of Sales & Trading
CHILE COLOMBIA PERU Hernán Arellano
Head of Equities
Carolina Ratto Mallie César Cuervo Héctor Collantes [email protected]
Head of Equity Research - Retail Head of North Andean Equity Research Head of Equity Research
[email protected] [email protected] [email protected]
# (562) 2446 1768 # (571) 339 4400 Ext 1012 # (511) 416 3333 Ext 33052 Javier Günther Marilyn Macdonald Cristián Castillo
International Equity Sales International Equity Sales International Sales Trader
Arturo Prado Jaime Pedroza Iván Bogarín [email protected] [email protected] [email protected]
Senior Analyst: Natural Resources Senior Analyst: Utilities Senior Analyst: Utilities, Consumer & Others # (562) 2450 1695 # (4477) 7151 5855 # (786) 999 1633
[email protected] [email protected] [email protected]
# (562) 2450 1688 # (571) 339 4400 Ext 1025 # (511) 416 3333 Ext 33055 Christopher DiSalvatore
Institutional Sales
Andrés Ossa Juan C. Domínguez Jasmine Helme [email protected]
Analyst: Utilities, Telecom & I.T. Senior Analyst: Banks Senior Analyst: Mining & Infrastructure # (786) 999 1236
[email protected] [email protected] [email protected]
# (562) 2651 9332 # (571) 339 4400 Ext 1026 # (511) 416 3333 Ext 36065 CHILE PERU COLOMBIA
Tomás Sanhueza Sebastián Gallego Tamara Vasquez René Ossa Rodrigo Zavala Juan A. Jiménez
Analyst: Oil & Gas Research Assistant International Equity Sales Head of Equity - Peru Head of International Equity Sales
[email protected] [email protected] [email protected] [email protected] [email protected]
[email protected] # (571) 339 4400 Ext 1594 # (511) 416 3333 Ext 37946 # (562) 2651 9324 # (511) 313 2918 Ext 36044 # (571) 339 4400 Ext 1701
# (562) 2446 1751
Carlos E. Rodriguez Christian Munchmeyer Ursula Mitterhofer Santiago Castro
Andrés Cereceda Analyst: GEA & infrastructure International Sales & Trading Sales & Trading International Sales & Trading
Analyst [email protected] [email protected] [email protected] [email protected]
[email protected] # (571) 339 4400 Ext 1365 # (562) 2450 1613 # (511) 313 2918 Ext 32922 # (571) 339 4400 Ext 1344
# (562) 2446 1798
Lourdes Alamos
Research Coordinator & Holdings Analyst
[email protected] Felipe García
# (562) 2450 1609 Head of Fixed Income
Christian Jarrin
Fixed Income RM
CHILE COLOMBIA PERU # (786) 999 1616
Paulina Yazigi Daniel Velandia Irvin León CHILE COLOMBIA PERU
Head of Research & Chief Economist Head of Research & Chief Economist Senior Fixed Income Analyst
[email protected] [email protected] [email protected] Gonzalo Covarrubias Carlos Sanchez Alfredo Bejar
# (562) 2450 1637 # (571) 339 4400 Ext 1505 # (511) 416 3333 Ext 37854 Head of Capital Markets Head of Fixed Income Head of Fixed Income / FX
[email protected] [email protected] [email protected]
Felipe Lubiano Sergio Ferro Alberto Zapata # (562) 2450 1635 # (571) 323 9154 # (511) 205 9190 Ext 36148
Senior Fixed Income Analyst Fixed Income Analyst Fixed Income Analyst
[email protected] [email protected] [email protected] Guido Riquelme Camilo Moreno Evangeline Arapoglou
# (562) 2651 9308 # (571) 339 4400 Ext 1609 # (511) 416 3333 Ext 36018 Head of Sales Head of Sales Head of international FI Sales
[email protected] [email protected] [email protected]
Paulina Valdivieso Camilo A. Durán Catalina Luna # (562) 2446 1712 # (571) 323 9252 # (511) 313 2902 - # (511) 313 2908
Fixed Income Analyst Macro Analyst Research Assistant
[email protected] [email protected] [email protected] Belén Larraín Andrés Valderrama Tatiana Dasso
# (562) 2651 9337 # (5511) 339 4400 Ext. 1383 # (511) 416 3333 Ext 40332 Head of International FI Sales Fixed Income Trader Fixed Income Sales
[email protected] [email protected] [email protected]
Andrés Osorio # (562) 2446 1720 # (571) 323 9163 # (511) 313 2902
Economist
[email protected] Paz Stepke José Andrés Riveros Santiago de Aubeyzon
# (562) 2446 1760 International Fixed Income Sales Fixed Income Trader Fixed Income Sales
[email protected] [email protected] [email protected]
# (562) 2651 9336 # (571) 339 4400 Ext 1180 # (511) 313 2000 Ext. 36168
Benjamín Diaz
Local Fixed Income Sales
# (562) 2446 1738
FIXED INCOME SALES & TRADING
FIXED INCOME & ECONOMICS RESEARCH
ANDEAN RESEARCH TEAM SALES & TRADING
EQUITY RESEARCH EQUITY SALES & TRADING
Analyst: Food & Beverages, Healthcare,
Transport


![[Revista Avianca] Entrevista Luiza Possi](https://static.fdocuments.us/doc/165x107/568c0e621a28ab955a904383/revista-avianca-entrevista-luiza-possi.jpg)