Avianca Holdings S.A.s22.q4cdn.com/896295308/files/doc_financials/2018/q3/Earnings... · Avianca...
18
Avianca Holdings S.A. 3Q 2018 Earnings Presentation 2018
Transcript of Avianca Holdings S.A.s22.q4cdn.com/896295308/files/doc_financials/2018/q3/Earnings... · Avianca...
Avianca Holdings S.A.3Q 2018 Earnings Presentation 2018

Disclaimer
The present document consolidates information from Avianca Holdings S.A. and its
subsidiaries, including unaudited financial figures, operational managerial
indicators, financial indicators and managerial projections of future performance,
in line with Avianca Holdings S.A. and its subsidiaries’ business plans. References
to future behaviors are indicative and do not constitute a guarantee of compliance
by the Company, its shareholders or directors. Unaudited accounting and financial
information and projections presented in this document are based on internal data
and calculations made by the Company, which may be subject to changes or
adjustments. Any change in the current economic conditions, the aviation industry,
fuel prices, international markets and external events, among others, may affect
the ongoing business results and future projections.
Avianca Holdings S.A. herein after Avianca Holdings and its subsidiaries warn
investors and potential investors that future projections are not a guarantee of
performance and that actual results may differ materially. Every investor or
potential investor will be responsible for investment decisions taken or not taken
as a result of his or her assessment of the information contained herein. Avianca
Holdings S.A. is not responsible for any third parties’ content. Avianca Holdings
may make changes and updates to the information contained herein.
The information, tables and logos contained in this presentation may not be
reproduced without the consent of Avianca Holdings S.A.

ExecutiveSummary
3Q 2018

Executive Summary
• New routes:• Lima-Orlando 7F per week• Salvador-Orlando 4F per
Week• Guatemala-Orlando 3F per
week• Salvador-Boston 4F per week
• US$ 1.2 Billion in
Revenues in 3Q’18; +6.1%
year on year
• Strongest 3Q revenue
since IPO
• CASK ex-fuel1 reached 6.3
US ¢ a 5.1% reduction
• 7.0% EBIT1 margin for
3Q18
• Continuous Yield
recovery since 3Q17
• Yield increase of 6.0% to
9.4 US¢
• Cargo business unit
continues focus on yield
improvement
• Cargo revenues increase
of 6.4%
• Load Factor of 84.7% +10
bps vs 3Q17
• 7.9 million transported
passengers for 3Q18
• Skytrax: “Best LaTam
Airline” y “Best Economy
Class” in the region
• AVH inaugurated its new VIP
lounge in the domestic
terminal At El Dorado
• Avianca Holdings S.A.
celebrates 5 year listing
anniversary on NYSE
1. When indicated the figures are adjusted by the following one-time items: ACDAC’s operatives expenses; $ -17,854M
• AVH returned all wet
leased aircraft and
recoverd 100% of its
domestic and
international post strike
operation

FinancialAnd
Operat ionalResults
3Q 2018

• Fleet incorporation pace
reduction:
• Targeted deferral of ~50
AC
• Reassessing status of
additional ~50 AC6
Embraer 190
ATR 72/42
Cessna 208
Airbus 330
Boeing 787
Airbus 330F
Airbus 300F
Boeing 787F
• (+2) A320neo and +1 787-8
Out In Fleet Update
Executing on our
fleet plan3Q 2018
Airbus 320
116|-2|+2
8
17
13
9
12 |+1
5
5
2
190Total Fleet
• Out of fleet: end of Operating
Lease one A319+ one A320

9.5 8.8 8.9
9.4 8.7
9.3
3Q15 3Q16 3Q17 3Q18 9M17 9M18
11,618
11,973
12,389
13,220
3Q15 3Q16 3Q17 3Q18
37,190 38,907
9M17 9M18
9,441
9,997
10,483
11,194
3Q15 3Q16 3Q17 3Q18
30,800 32,496
9M17 9M18
7
Fifth consecutive quarterly Yield YoY increase; 3Q18 Yield increased 6.0% to 9.4 cents
3Q RPKs – Millions 3Q Load Factor
3Q ASKs – Millions 3Q Yield - US¢
+6.8%+6 bps
+71 bps
+6.7%
+4.6% +6.0%+7.0%
+5.5%
Quarterly Full Year
81.3%
83.5%84.6% 84.7%
82.8% 83.5%
3Q15 3Q16 3Q17 3Q18 9M17 9M18
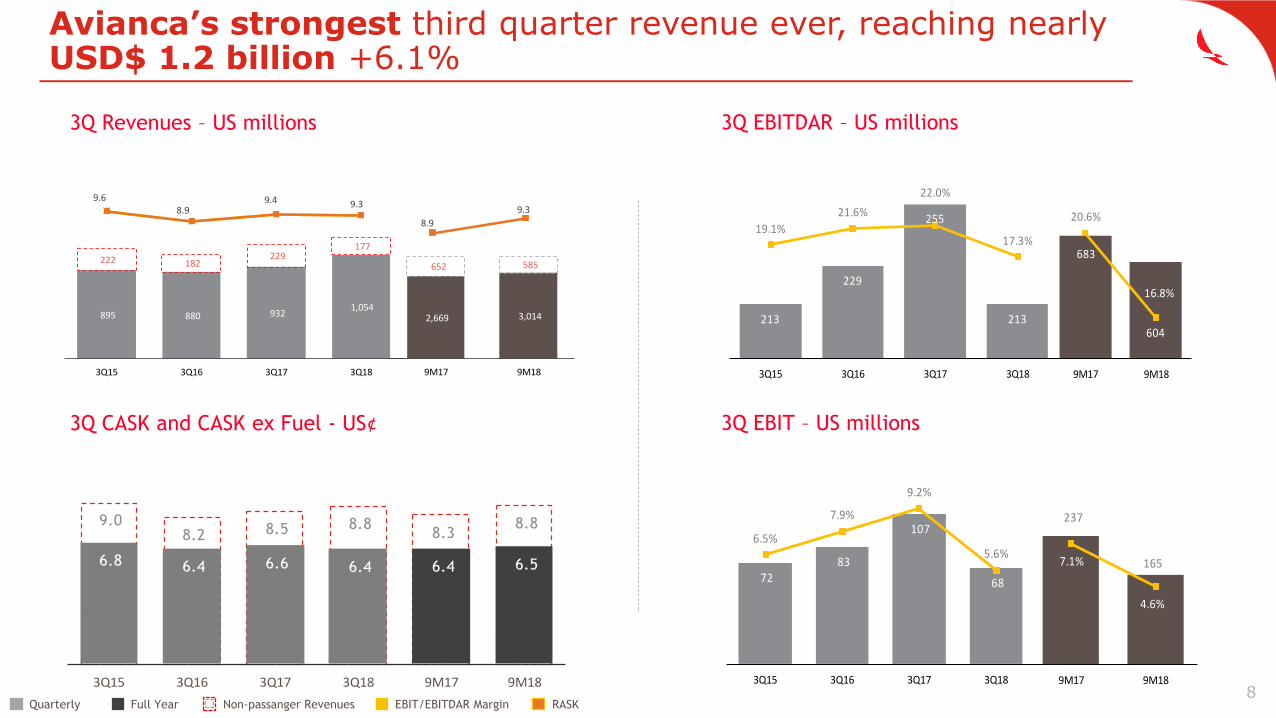
9.0 8.2 8.5 8.8
8.3 8.8
6.8 6.4 6.6 6.4 6.4 6.5
3Q15 3Q16 3Q17 3Q18 9M17 9M18
683
604
20.6%
16.8%
9M17 9M18
213
229
255
213
19.1%
21.6%
22.0%
17.3%
3Q15 3Q16 3Q17 3Q18
72 83
107
68
6.5%
7.9%
9.2%
5.6%
3Q15 3Q16 3Q17 3Q18
237
1657.1%
4.6%
9M17 9M18
9.6 8.9
9.4 9.3
895 880 932 1,054
222 182 229
177
3Q15 3Q16 3Q17 3Q18
8.9
9.3
2,669 3,014
652 585
9M17 9M18
Quarterly Full Year Non-passanger Revenues EBIT/EBITDAR Margin RASK8
2017
2016
Avianca’s strongest third quarter revenue ever, reaching nearly USD$ 1.2 billion +6.1%
3Q Revenues – US millions 3Q EBITDAR – US millions
3Q CASK and CASK ex Fuel - US¢ 3Q EBIT – US millions

9
2016
3Q EBITDAR – US millions
3Q CASK and CASK ex Fuel - US¢ 3Q EBIT – US millions
3Q Revenues – US millions
1. When indicated the figures are adjusted by the following one-time items: ACDAC’s operatives expenses $-17,854MQuarterly Full Year Non-passanger Revenues EBIT/EBITDAR Margin RASK
Passenger Revenue for the 3Q18 results in the strongest passenger for a 3Q (Adjusted)
709
665
21.1%
18.5%
9M17 9M18
223 229279
22920.4%21.6%
23.4%
18.6%
3Q15 3Q16 3Q17 3Q18
9.4 8.9
9.6 9.3
895 880 963 1,054
198 182 229
177
3Q15 3Q16 3Q17 3Q18
9.0 9.3
2,701 3,014
652 585
9M17 9M18
82 83
132
86
7.5% 7.9%
11.0%
7.0%
3Q15 3Q16 3Q17 3Q18
265
237
7.9%
6.6%
9M17 9M18
8.7 8.2 8.6 8.7 8.3 8.6
6.5 6.4 6.6 6.3 6.4 6.4
3Q15 3Q16 3Q17 3Q18 9M17 9M18

Region
Domestic*
Intra Home
Markets1
Home Markets to
North America2
Home Markets to
South America3
Central America &
Caribbean4
Home Markets
to Europe
Total
10
Avianca reports the strongest Load Factor in company history of 84.7%
3Q18 RPK Growth 3Q18 ASK Growth
*Domestic Market: Colombia, Peru, Ecuador 1 Local Intra-Markets: Colombia, Peru, Ecuador, Salvador, Costa Rica, Guatemala; 2 From Local Markets to North América including México 3 From Colombia, Perú, Ecuador and Costa Rica to Bolivia, Chile, Argentina, Brazil and Uruguay, 4 Belize, Cuba Curazao, Republica Dominicana,
Panamá, Costa Rica, Guatemala, Honduras, Nicaragua
3Q18 Load Factor
84.9%
81.0%
86.0%
82.8%
76.8%
88.5%
RPK 6.8% ASK 6.7% Load Factor 84.7%
12.13%
7.16%
-5.78%
15.11%
1.59%
3.05%
13.04%
4.86%
-7.13%
14.72%
4.16%
3.14%

Copa1.6%
11
1%
Intra-HomeMarkets
Home Markets To North America
Home Markets To South America
Home MarketsTo Spain
Despite the strike, Avianca continues to consolidate its Leadership Position in the Colombian domestic market
Colombia Domestic1 Peru Domestic2
Source: Aeronáutica Civil, MIDT1: Sep-18; 2: Ago-18; *Domestic Market: Colombia, Peru, Ecuador; Local Intra-Markets: Colombia, Peru, Ecuador, Salvador, Costa Rica, Guatemala; From Local Markets to North América including México 3 From Colombia, Perú, Ecuador and Costa Rica to Bolivia, Chile, Argentina, Brazil ,Uruguay and Venezuela, 4 Belize, Cuba Curazao, Republica Dominicana, Panamá, Costa Rica, Guatemala, Honduras, Nicaragua
Avianca53.8%
Latam20.7%
VivaCo13.4%
Satena4.7%
Easyfly5.0%
Others0.8%
63.7% 25.5%
33.4%
28.6%
Avianca9.9%
Peruvian12.8%
Latam59.2%
Starup2.7%
Others9.4%

Business Units
3Q 2018

59.7% 56.5%
3Q17 3Q18
140.2
149.1
3Q17 3Q18
397
449
9M17 9M18
13
Avianca Cargo: financial and operational results
Source: Company.
(1) On a per trip basis. (2) Includes consolidated revenues from the cargo operation in Mexico and Deprisa (Other Business Unit) (3) Includes bellies and excludes Colombia domestic operations. Includes commercial agreements with OceanAir Linhas Aereas, not included in official statistics.
(4) International Cargo – Aeronáutica Civil de Colombia (as of Sep 2018) (5) Miami-Dade Aviation Statistics, by airline group (as of Sep 2018)
Segment Overview Key Metrics (Cargo and Courier)
Market Share Colombia (3Q18)4 Market Share Miami (3Q18)5
▪ Strong performance for the first 9M18 and for 3Q 2018 Avianca Cargo focused
in yield boosting trough fare increase, awaiting for best cargo prices in the
4Q18 season
▪ Network improving thanks to the connections increase to and from Asia and
Europe through commercial partnerships and increased widebodies capacity
utilizationRTK (MM)(3)
Revenue (US$MM)(2)ATK (MM) (3)
Load Factor
+13.3%
-3.2%
+6.4%
617.8 590.5
3Q17 3Q18
1,903 1,836
9M17 9M18
-4.4%
369.0 333.5
3Q17 3Q18
1,055 1,039
9M17 9M18
-9.6%
55.4% 56.6%
9M17 9M18
38.5%
7.4% 9.0% 8.1%5.4%
31.7%
AVH Atlas Latam UPS Skylease Others
13.3% 14.5%11.4% 12.0%
8.1%6.2%
34.5%
Atlas Latam AVH UPS Amerijet AmericanAirlines
Others
14
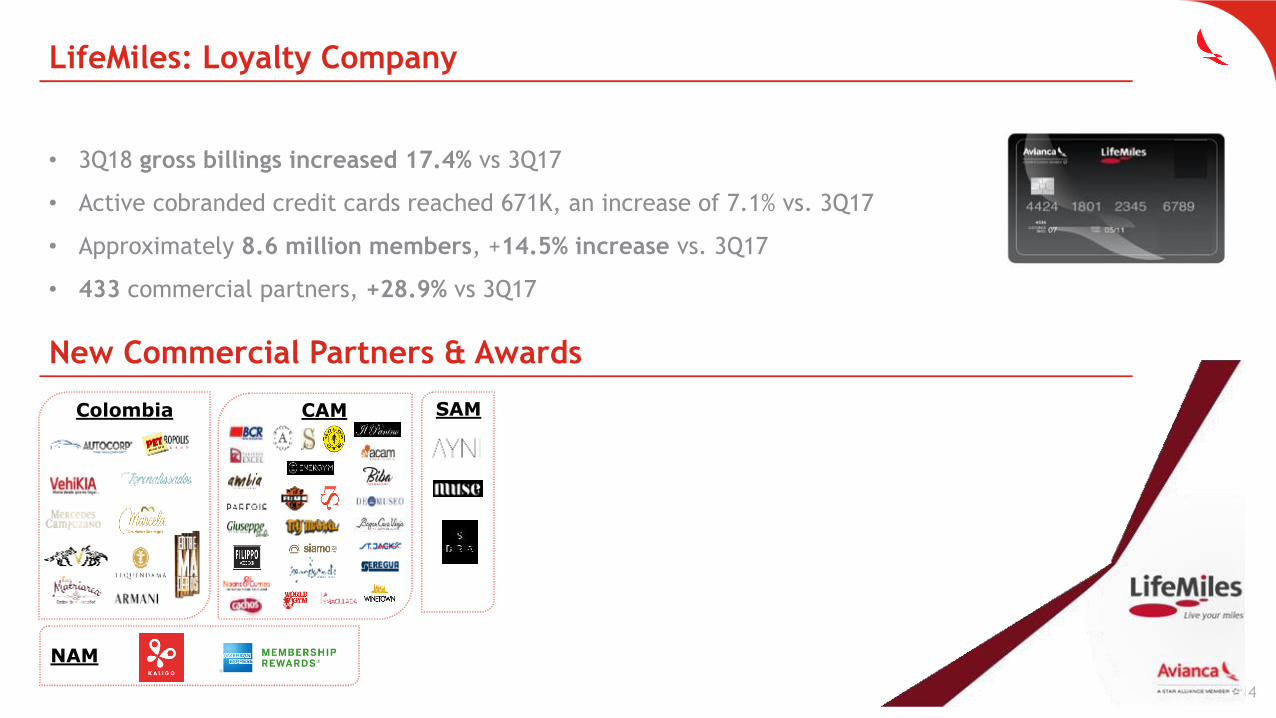
LifeMiles: Loyalty Company
• 3Q18 gross billings increased 17.4% vs 3Q17
• Active cobranded credit cards reached 671K, an increase of 7.1% vs. 3Q17
• Approximately 8.6 million members, +14.5% increase vs. 3Q17
• 433 commercial partners, +28.9% vs 3Q17
New Commercial Partners & Awards
Colombia CAM SAM
NAM

Flight Plan 2018

3Q 2018 2018 OUTLOOK
PAX
ASK
LF
3.3% 5.0% – 7.0%
6.7% 8.0% – 10.0%
84.7% 81.0% – 83.0%
7.0%6.0% – 8.0%
EBIT¹
EBIT 5.6%
Source: Company Information
1. When indicated the figures are adjusted by the following one-time items: ACDAC’s operatives expenses; $ -17,854

17
In Summary
CASK ex-fuel1 reached 6.3 US¢ - 5.1% year over year
US$1.2 B in revenues a +6.1% YoY increase, best 3Q
revenue since IPO
Continuous yield1 recovery of +6.0% vs 3Q17 reaching
9.4 US¢
7.0% EBIT1 margin for 3Q18
Avianca reports strongest 3Q Load Factor in company
history of 84.7%
This quarter Avianca, perceives strong demand across
its network, despite remaining impact of pilot strike,
jet fuel price increase and FX volatility achieving:
1. When indicated the figures are adjusted by the following one-time items: ACDAC’s operatives expenses; $-17,854M

Thank YouContact Information:
Investor Relations Office
T: (57) 1 – 5877700
www.aviancaholdings.com