Autumn 2016 Freshmen Enrollment Projections - UW …€¦ · · 2016-07-18Autumn 2016 Freshmen...
22
A–6 STANDING COMMITTEES Academic and Student Affairs Committee A–6/207-16 7/14/16 Autumn 2016 Freshmen Enrollment Projections INFORMATION For information only. BACKGROUND As an ongoing July report to the Board, this presentation will update and inform the Board on autumn 2016 freshmen enrollment projections across all three campuses. This enrollment information is preliminary, but provides the board with a good picture of what the University can expect in the fall. Final enrollment information will be available after the autumn quarter “10 Day Census." Freshman applications, resident enrollment and diversity are projected to increase across all three campuses, and academic profiles remain stable. In addition, this presentation includes an overview of key observations and admission strategies for each campus. This information includes freshman only. Transfer and graduate program admissions information is available later in the summer after admission processes are complete. Detailed information will be provided to the Board in fall. Attachment Autumn 2016 Freshmen Enrollment Projections
-
Upload
truongxuyen -
Category
Documents
-
view
218 -
download
4
Transcript of Autumn 2016 Freshmen Enrollment Projections - UW …€¦ · · 2016-07-18Autumn 2016 Freshmen...

A–6 STANDING COMMITTEES Academic and Student Affairs Committee
A–6/207-16 7/14/16
Autumn 2016 Freshmen Enrollment Projections INFORMATION For information only. BACKGROUND As an ongoing July report to the Board, this presentation will update and inform the Board on autumn 2016 freshmen enrollment projections across all three campuses. This enrollment information is preliminary, but provides the board with a good picture of what the University can expect in the fall. Final enrollment information will be available after the autumn quarter “10 Day Census." Freshman applications, resident enrollment and diversity are projected to increase across all three campuses, and academic profiles remain stable. In addition, this presentation includes an overview of key observations and admission strategies for each campus. This information includes freshman only. Transfer and graduate program admissions information is available later in the summer after admission processes are complete. Detailed information will be provided to the Board in fall. Attachment Autumn 2016 Freshmen Enrollment Projections

Autumn 2016 Freshmen Enrollment Projections
• Philip Ballinger, Associate Vice Provost for Enrollment & Undergraduate Admissions
• Karl Smith, Associate Vice Chancellor, Chief Admissions Officer, UW Tacoma
• Steve Syverson, Associate Vice Chancellor, Enrollment Management, UW Bothell UW Board of Regents Meeting
July 14, 2016
ATTACHMENTA–6.1/207-16 7/14/16
Page 1 of 21
SEATTLE
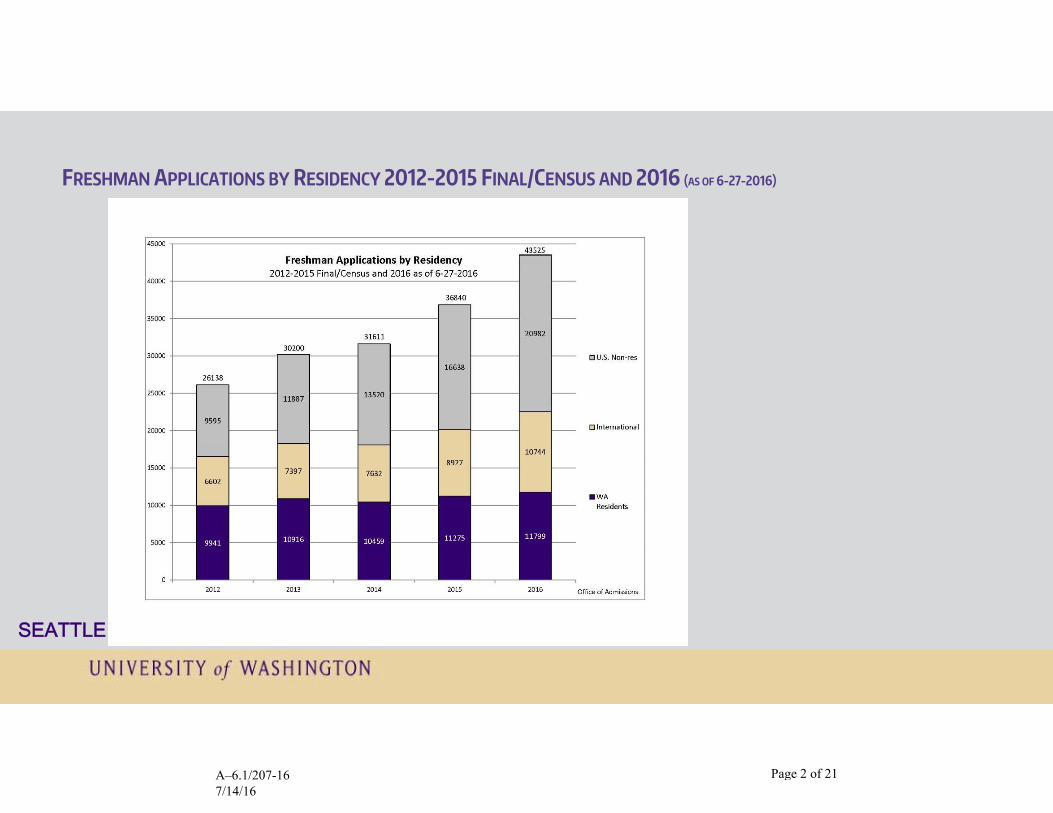
FRESHMAN APPLICATIONS BY RESIDENCY 2012-2015 FINAL/CENSUS AND 2016 (AS OF 6-27-2016)
A–6.1/207-16 7/14/16
Page 2 of 21

SEATTLE
FRESHMAN ADMIT RATES (%) BY RESIDENCY WITH PROJECTIONS FOR 2016 (AS OF 6-27-2016)
A–6.1/207-16 7/14/16
Page 3 of 21
SEATTLE
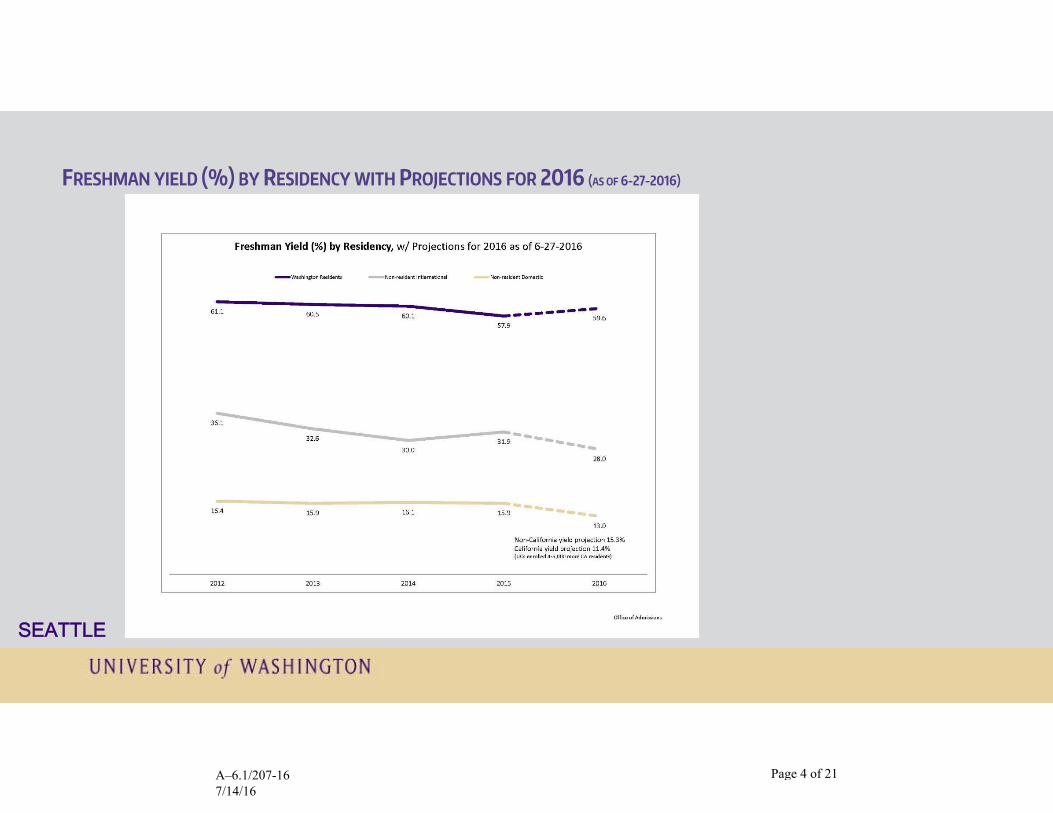
FRESHMAN YIELD (%) BY RESIDENCY WITH PROJECTIONS FOR 2016 (AS OF 6-27-2016)
A–6.1/207-16 7/14/16
Page 4 of 21
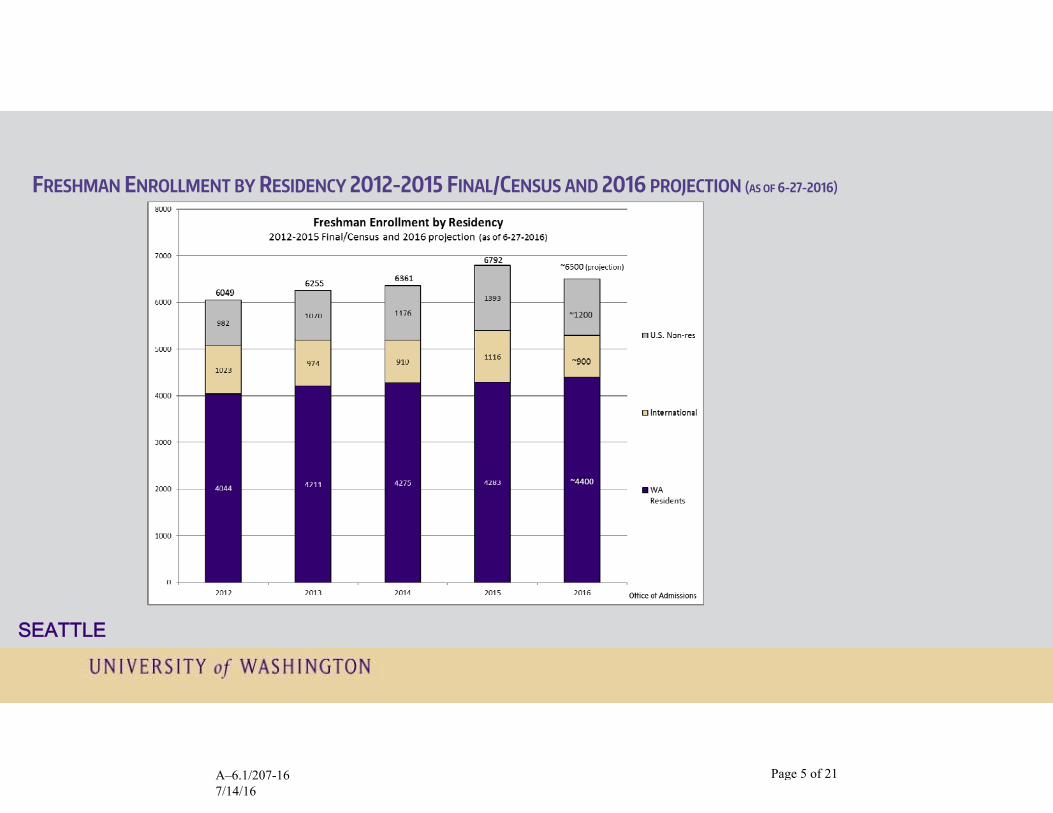
FRESHMAN ENROLLMENT BY RESIDENCY 2012-2015 FINAL/CENSUS AND 2016 PROJECTION (AS OF 6-27-2016)
SEATTLE
A–6.1/207-16 7/14/16
Page 5 of 21
2015 2016 PercentageChange
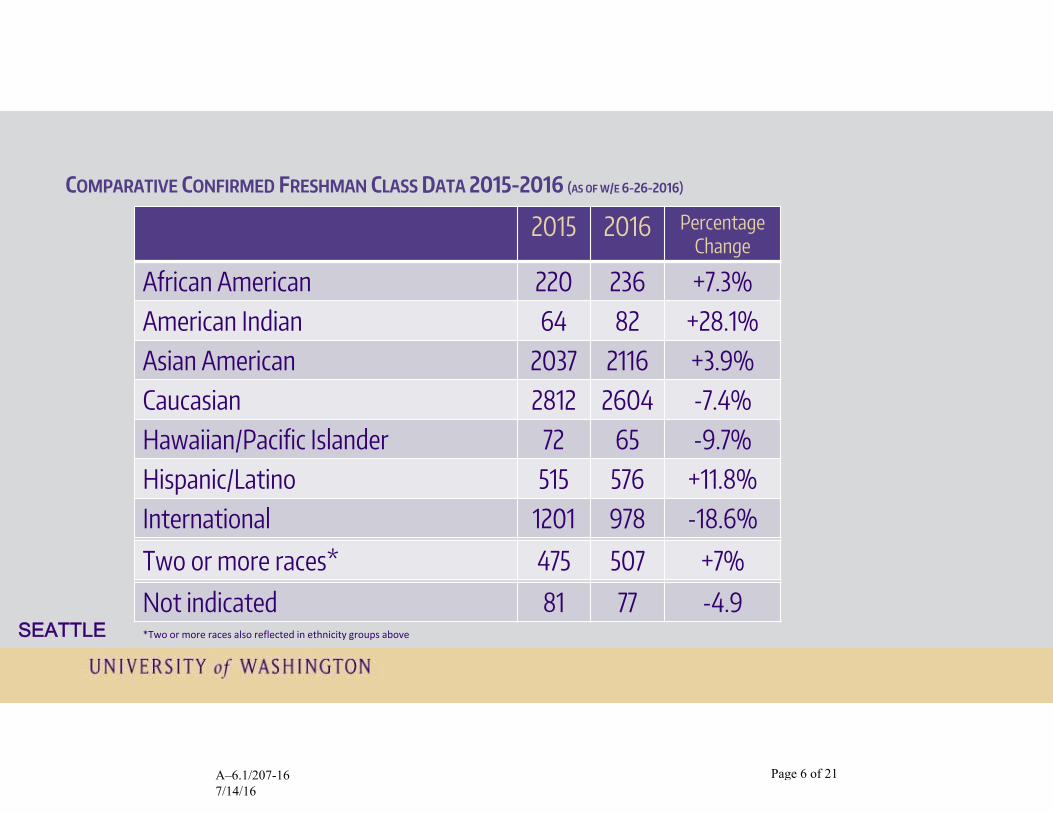
African American 220 236 +7.3%American Indian 64 82 +28.1%Asian American 2037 2116 +3.9%Caucasian 2812 2604 -7.4%Hawaiian/Pacific Islander 72 65 -9.7%Hispanic/Latino 515 576 +11.8%International 1201 978 -18.6%
COMPARATIVE CONFIRMED FRESHMAN CLASS DATA 2015-2016 (AS OF W/E 6-26-2016)
SEATTLENot indicated 81 77 -4.9
Two or more races* 475 507 +7%
*Two or more races also reflected in ethnicity groups above
A–6.1/207-16 7/14/16
Page 6 of 21

2015 Actual
2016
HS GPA 3.78 3.78SAT Math 648 644SAT Critical Reading 599 602
ACADEMIC PROFILE OF FIRST YEAR CLASS 2015 ACTUAL VS 2016 (AS OF 7-1-2016)
SEATTLE
A–6.1/207-16 7/14/16
Page 7 of 21

SEATTLE
2012 2013 2014 2015 2016
First Generation 27.9% 28.3% 27.2% 25.7% 27.9%
CONFIRMED FRESHMAN APPLICANTS BY FIRST‐GENERATIONSTATUS 2012‐2015 Final/Census and 2016 (AS OF 7‐1‐2016)
A–6.1/207-16 7/14/16
Page 8 of 21

OBSERVATIONS & KEY STRATEGIES
SEATTLE
The 2016 fall freshman class reflects a 2016‐2020 plan to stabilize class size at 6,500 students of whom at least 4,300 will be Washington residents.
o The fall class will enroll a record number of resident students – approximately 4,400.o The fall class will enroll a record number of under‐represented students.o The fall class maintains academic profile.
While stabilizing class size at around 6,500, we will modulate this number according to graduation outcomes.
o The Office of Institutional Research is refining an enrollment projection model that associates incoming undergraduate student numbers with progressive overall undergraduate enrollment levels and projected degree production.
o The better our graduation rates become, the more enrollment capacity we will create.
The University will continue to monitor significant changes in the competitive enrollment environment.
o For example, the University of California system sharply increased new undergraduate enrollment levels this year and will do so again next year. UC Berkeley, UCLA, UCSD, UC Davis, UC Santa Barbara, and UC Irvine are all primary competing institutions for the UW for both resident and non‐resident students.
A–6.1/207-16 7/14/16
Page 9 of 21

FRESHMAN APPLICATIONS BY RESIDENCY 2012-2015 FINAL/CENSUS AND 2016 (AS OF 6-27-2016)
1166 1198
1382
1577
1851
A–6.1/207-16 7/14/16
Page 10 of 21

FRESHMAN ENROLLMENT BY RESIDENCY 2012-2015 FINAL/CENSUS AND 2016 (AS OF 6-27-2016)
338
409 431
460
556
A–6.1/207-16 7/14/16
Page 11 of 21

2015 2016 PercentageChange
African American 43 43 0%American Indian 3 6 +100%Asian American 118 123 +4%Caucasian 164 192 +17%Hawaiian/Pacific Islander 10 14 +40%Hispanic/Latino 82 108 +32%International 6 8 +33%
COMPARATIVE CONFIRMED FRESHMAN CLASS DATA 2015-2016 (AS OF 6-14-2016)
Two or more races 48 55 +15%Not indicated 4 7 +75%
A–6.1/207-16 7/14/16
Page 12 of 21

ACADEMIC PROFILE OF FIRST YEAR CLASS 2015 ACTUAL VS 2016 (AS OF 6-28-2016)
2015 Actual
2016
HS GPA 3.22 3.24SAT Math 491 484SAT Critical Reading 484 491
A–6.1/207-16 7/14/16
Page 13 of 21

2012 2013 2014 2015 2016
First Generation 58.9% 65.8% 68.7% 63.7% 61.3%
CONFIRMED FRESHMAN APPLICANTS BY FIRST‐GENERATIONSTATUS 2012‐2015 Final/Census and 2016 (AS OF 6‐27‐2016)
A–6.1/207-16 7/14/16
Page 14 of 21

OBSERVATIONS & KEY STRATEGIES
• UW Tacoma outreach, recruitment and admissions practices are aligned with its Urban Serving emphasis. In the coming years the University will continue to solidify its market positioning in the South Sound, and lay the ground work to expand into new Washington markets.
• Establish a seamless pathway for high school students in the South Sound region to the UW Tacoma. • Support the college going culture in the South Sound while increasing market share from feeder schools. • Execute a tiered territory recruitment plan that focuses on serving the students of the South Puget Sound and surrounding areas.
• Evidence recruitment plan is on track: • Freshman applications increased 18%• Freshmen confirmation increased 16% • Application growth was driven by applicants from Pierce, Thurston and South King County• 61% of confirmed students are first‐generation 37% of confirmed students are from underrepresented minority backgrounds
• Pathway to Promise will expand to 3 new school districts during the 2016‐2017 school year.
A–6.1/207-16 7/14/16
Page 15 of 21

UNIVERSITY of WASHINGTON │BOTHELL
FRESHMAN APPLICATIONS BY RESIDENCY 2012-2015 FINAL/CENSUS AND 2016 (AS OF 6-30-2016)
A–6.1/207-16 7/14/16
Page 16 of 21

UNIVERSITY of WASHINGTON │BOTHELL
FRESHMAN ENROLLMENT BY RESIDENCY 2012-2015 FINAL/CENSUS AND 2016 (AS OF 6-30-2016)
A–6.1/207-16 7/14/16
Page 17 of 21REVISED

2015 2016 PercentageChange
African American 62 81 +31%American Indian 2 0 -100%Asian American 233 289 +24%Caucasian 267 252 -6%Hawaiian/Pacific Islander 4 8 +100%Hispanic/Latino 112 109 -3%International 21 34 +62%
COMPARATIVE CONFIRMED FRESHMAN CLASS DATA 2015-2016 (AS OF 6-14-2016)
UNIVERSITY of WASHINGTON │BOTHELL
Two or more races 50 61 +22%Not indicated 7 11 +57%
A–6.1/207-16 7/14/16
Page 18 of 21

UNIVERSITY of WASHINGTON │BOTHELL
2015 Actual
2016
HS GPA 3.28 3.3SAT Math 529 529SAT Critical Reading 516 506
ACADEMIC PROFILE OF FIRST YEAR CLASS 2015 ACTUAL VS 2016 (AS OF 6-28-2016)
A–6.1/207-16 7/14/16
Page 19 of 21

UNIVERSITY of WASHINGTON │BOTHELL
2012 2013 2014 2015 2016
First Generation 49.9% 47.3% 49.3% 49.2% 47.9%
CONFIRMED FRESHMAN APPLICANTS BY FIRST‐GENERATIONSTATUS 2012‐2015 Final/Census and 2016 (AS OF 6‐30‐2016)
A–6.1/207-16 7/14/16
Page 20 of 21

UNIVERSITY of WASHINGTON │BOTHELL
OBSERVATIONS & KEY STRATEGIES
Freshman applications surpassed 3,000 for the first time in history.
Some new yield strategies appear to have increased the freshmen yield, resulting in a substantially larger freshman class.
For the future we are focusing on process‐related issues that have delayed timely responses to applicants and believe it will improve our yield.
We are developing strategies to better target the Hispanic and first generation students earlier in their High School careers.
We are developing closer collaboration to improve transition from our primary feeder schools.
A–6.1/207-16 7/14/16
Page 21 of 21