Northwest Enrollment Independent Projections School District
23
Learn from Yesterday… Understand Today… Plan for Tomorrow Northwest Independent School District Enrollment Projections
Transcript of Northwest Enrollment Independent Projections School District

Learn from Yesterday…Understand Today…Plan for Tomorrow
NorthwestIndependentSchool District
Enrollment Projections

Economic Conditions – DFW Area (December 2015)
2
UnemploymentRate
-0.2%
99,000 new jobsNational rate 1.8%
Job Growth
2.9%2,713 more than 2014
AnnualizedHome Starts
26,840
Sources: Texas Workforce Commission & Metrostudy
U.S. 4.8%Texas 4.2%
DFW MSA 3.7%Fort Worth 3.7%

DFW New Home Ranking Report ISD Ranked by Annual Closings – 3Q15
3
*Adjusted based on additional research by Templeton Demographics staff(Added McElvey Ranch 2000 lots, Wellington 1622 lots, Stardust Ranch 143 lots, Entrada (Westlake) 10 lots; Subtracted 1,517 lots from Tradition)
Rank District Name Annual Starts Annual Closings VDL Future1 Frisco ISD 2,907 2,768 3,621 8,9152 Denton ISD 1,846 1,694 2,706 16,6133 Prosper ISD 1,570 1,374 2,925 31,7594 Northwest ISD 1,151 1,105 1,773 25,099*5 Lewisville ISD 1,188 988 2,194 3,1426 Keller ISD 973 971 1,015 2,3727 Dallas ISD 1,125 968 2,334 5,6418 Eagle Mtn. ‐ Saginaw ISD 948 869 1,328 19,7969 Little Elm ISD 955 708 1,676 4,82110 Rockwall ISD 681 665 1,836 8,37911 Allen ISD 478 550 781 1,53112 McKinney ISD 531 547 1,425 5,96813 Mansfield ISD 608 517 1,012 5,65714 Crowley ISD 534 508 1,319 8,05715 Wylie ISD 641 460 728 4,35316 HEB ISD 422 436 481 5,06417 Forney ISD 409 435 679 12,46618 Plano ISD 494 427 910 2,77119 Midlothian ISD 480 415 1,255 20,52420 Garland ISD 370 401 725 3,313

New Housing Activity 3Q15
• 3Q15 starts jumped 22% from 2Q15• Closings continue to average more than 275 per quarter• Inventory remains in a good position to sustain the current closing rates
Northwest ISD
4
0
100
200
300
400
500
600
700
1Q10
2Q10
3Q10
4Q10
1Q11
2Q11
3Q11
4Q11
1Q12
2Q12
3Q12
4Q12
1Q13
2Q13
3Q13
4Q13
1Q14
2Q14
3Q14
4Q14
1Q15
2Q15
3Q15
Starts Closings Inventory
Starts 2010 2011 2012 2013 2014 2015 Closings 2010 2011 2012 2013 2014 20151Q 297 230 251 288 357 230 1Q 229 224 220 225 269 2872Q 357 268 293 362 282 307 2Q 349 230 331 318 341 2623Q 264 285 286 347 350 375 3Q 348 263 332 299 347 2834Q 204 254 257 270 239 4Q 277 295 258 344 273
Total 1,122 1,037 1,087 1,267 1,228 912 Total 1,203 1,012 1,141 1,186 1,230 832
Annual Closing Distribution 3Q15
5
Top 10 Subdivisions ‐ 3Q15 (Ranked by Annual Closings)
Rank SubdivisionAnnual Closings
Quarter Closings VDL
1 Dorado Ranch 86 40 142 Harmon Ranch 83 30 843 Willow Ridge Estates (Ft. Worth) 83 26 324 Briarwyck (Roanoke) 60 15 375 Reata Meadows 59 13 96 Fairway Ranch 55 15 947 Trophy Club/Highlands at (Beck) 53 10 1258 Trails of Fossil Creek 52 13 1589 Villages Woodland Springs/Woodlands 50 14 1210 Fairways of Champions Circle 49 2 0
TOTALS 630 178 565

Future Lots 3Q15
6
Top 10 Subdivisions ‐ 3Q15 (Ranked by Future Inventory)
Rank Subdivision VDL Future1 Sendera Ranch (Thompson) 83 3,6402 Tradition 0 3,0003 Sendera Ranch (Sendera Ranch) 12 2,6934 McKelvey Ranch 0 2,0005 Wellington 0 1,6226 Bonds Ranch/Bonds Ranch (NWISD) 0 1,1627 Canyon Falls (Northlake) 186 8718 Champions Circle/Oak Creek Trails 0 8259 Berkshire 0 79110 Shale Creek 4 600
TOTALS 285 17,204

Ten Year ForecastBy Grade Level
*Yellow box = largest grade per year*Green box = second largest grade per year
• Northwest ISD will enroll nearly 22,000 students next fall• 5 year growth = 5,559 students• 2020/21 enrollment = 26,507 students• 10 year growth = 12,412 students• 2025/26 enrollment = 33,360 students
7
Year (Oct.) EE/PK K 1st 2nd 3rd 4th 5th 6th 7th 8th 9th 10th 11th 12th Total Growth % Growth 2011/12 301 1,383 1,391 1,407 1,368 1,331 1,291 1,317 1,281 1,190 1,278 1,210 1,013 865 16,6262012/13 300 1,448 1,465 1,448 1,466 1,433 1,402 1,400 1,375 1,325 1,344 1,302 1,153 950 17,811 1,185 7.1%2013/14 301 1,485 1,545 1,512 1,514 1,529 1,517 1,479 1,489 1,457 1,489 1,334 1,232 1,067 18,950 1,139 6.4%2014/15 311 1,550 1,538 1,618 1,596 1,553 1,557 1,550 1,521 1,541 1,595 1,481 1,275 1,145 19,831 881 4.6%2015/16 319 1,527 1,650 1,661 1,658 1,653 1,668 1,639 1,599 1,575 1,745 1,643 1,414 1,197 20,948 1,117 5.6%2016/17 319 1,591 1,623 1,756 1,740 1,733 1,743 1,763 1,713 1,679 1,787 1,651 1,581 1,319 21,998 1,050 5.0%2017/18 319 1,677 1,693 1,721 1,851 1,823 1,831 1,833 1,849 1,813 1,900 1,678 1,596 1,488 23,073 1,074 4.9%2018/19 319 1,763 1,784 1,795 1,809 1,947 1,917 1,924 1,927 1,948 2,042 1,807 1,621 1,513 24,115 1,043 4.5%2019/20 319 1,843 1,870 1,896 1,895 1,905 2,045 2,014 2,019 2,036 2,191 1,956 1,747 1,532 25,268 1,153 4.8%2020/21 319 1,946 1,960 1,989 1,996 1,986 2,005 2,146 2,113 2,132 2,286 2,078 1,890 1,661 26,507 1,239 4.9%2021/22 319 2,062 2,074 2,082 2,098 2,111 2,089 2,101 2,254 2,232 2,391 2,195 2,008 1,796 27,812 1,305 4.9%2022/23 319 2,183 2,199 2,217 2,199 2,227 2,223 2,204 2,210 2,377 2,499 2,288 2,120 1,908 29,174 1,362 4.9%2023/24 319 2,301 2,343 2,319 2,326 2,298 2,353 2,331 2,300 2,327 2,656 2,380 2,210 2,033 30,496 1,322 4.5%2024/25 319 2,427 2,462 2,478 2,454 2,426 2,428 2,467 2,433 2,421 2,603 2,547 2,299 2,112 31,876 1,380 4.5%2025/26 319 2,560 2,607 2,606 2,606 2,559 2,566 2,547 2,574 2,558 2,706 2,490 2,458 2,205 33,360 1,485 4.7%

Ten Year ForecastBy Elementary Campus
• Schluter Elementary may have more than 700 students next fall• Cox Elementary may enroll 600 students by 2017, a rise of 48.4%• Peterson Elementary may have more than 1,000 students by 2018
8
Current ENROLLMENT PROJECTIONSCampus Capacity 2015/16 2016/17 2017/18 2018/19 2019/20 2020/21 2021/22 2022/23 2023/24 2024/25 2025/26
Beck Elementary 850 789 823 849 867 859 862 866 867 866 869 871Clara Love Elementary 850 720 712 698 715 714 702 701 705 715 721 727Cox Elementary 850 442 535 656 796 974 1,157 1,381 1,646 1,828 2,005 2,231Granger Elementary 850 906 910 911 898 879 894 897 902 909 917 926Haslet Elementary 650 424 408 395 398 396 404 412 425 439 454 469Hatfield Elementary 450 444 469 491 518 551 586 666 779 925 1,085 1,269Hughes Elementary 650 555 566 564 572 567 571 592 617 642 669 698Justin Elementary 650 528 532 554 570 586 596 620 641 663 686 710Lakeview Elementary 650 563 596 630 637 666 668 676 681 688 695 711Nance Elementary 650 497 493 494 500 506 513 544 570 601 635 667Peterson Elementary 850 847 927 994 1,073 1,121 1,160 1,164 1,165 1,163 1,173 1,182Prairie View Elementary 650 421 439 447 455 479 495 516 537 559 581 603Roanoke Elementary 850 707 688 696 704 693 685 722 763 807 852 903Sendera Ranch Elementary 650 580 575 593 600 643 648 688 730 773 818 863Seven Hills Elementary 650 544 550 556 550 553 557 573 589 611 631 650Schluter Elementary 650 622 706 777 845 927 1,009 1,094 1,193 1,275 1,366 1,459Thompson Elementary 650 547 576 610 636 659 694 723 757 795 837 884ELEMENTARY SCHOOL TOTALS 12,050 10,136 10,505 10,915 11,334 11,773 12,201 12,835 13,567 14,259 14,994 15,823Elementary Absolute Growth 413 369 410 419 438 428 634 732 692 735 829Elementary Percent Growth 4.25% 3.64% 3.90% 3.84% 3.87% 3.64% 5.20% 5.70% 5.10% 5.15% 5.53%
*Green box = within 5% of capacity*Yellow box = over capacity

Ten Year ForecastBy Secondary Campus
• Tidwell Middle School may have more than 1,300 students by 2017• Eaton High School opened this fall with nearly 1,000 students, and
is anticipated to reach 1,500 students next fall9
Current ENROLLMENT PROJECTIONSCampus Capacity 2015/16 2016/17 2017/18 2018/19 2019/20 2020/21 2021/22 2022/23 2023/24 2024/25 2025/26
Chisholm Trail Middle School 1,100 994 1,057 1,135 1,179 1,245 1,297 1,314 1,361 1,423 1,511 1,611Gene Pike Middle School 1,100 766 767 843 886 909 957 983 988 975 1,032 1,108Medlin Middle School 1,100 1,106 1,200 1,245 1,326 1,366 1,462 1,470 1,447 1,386 1,391 1,407Tidwell Middle School 1,200 1,113 1,252 1,372 1,456 1,591 1,663 1,788 1,902 2,061 2,220 2,333Wilson Middle School 1,200 834 879 900 952 958 1,012 1,032 1,093 1,113 1,167 1,220MIDDLE SCHOOL TOTALS 5,700 4,813 5,155 5,495 5,799 6,069 6,391 6,587 6,791 6,958 7,321 7,679Middle School Absolute Growth 201 342 340 304 270 322 196 204 167 363 358Middle School Percent Growth 4.36% 7.11% 6.60% 5.53% 4.66% 5.31% 3.07% 3.10% 2.46% 5.22% 4.89%Northwest High School 2,525 2,263 2,030 1,703 1,685 1,740 1,815 1,929 2,015 2,118 2,151 2,208Byron Nelson High School 2,400 2,571 2,630 2,732 2,871 3,112 3,367 3,584 3,822 4,037 4,181 4,310Eaton High School 2,500 984 1,505 2,054 2,253 2,401 2,560 2,703 2,806 2,951 3,056 3,168Steele Accelerated High School 450 141 141 141 141 141 141 141 141 141 141 141Denton County JJAEP 2 2 2 2 2 2 2 2 2 2 2Denton Creek 38 30 30 30 30 30 30 30 30 30 30HIGH SCHOOL TOTALS 7,875 5,999 6,338 6,662 6,982 7,426 7,915 8,389 8,816 9,279 9,561 9,859High School Absolute Growth 503 339 324 320 444 488 475 427 463 282 298High School Percent Growth 9.15% 5.65% 5.12% 4.80% 6.36% 6.58% 6.00% 5.08% 5.25% 3.04% 3.11%DISTRICT TOTALS 25,625 20,948 21,998 23,073 24,115 25,268 26,507 27,812 29,174 30,496 31,876 33,360District Absolute Growth 1,117 1,050 1,074 1,043 1,153 1,239 1,305 1,362 1,322 1,380 1,485District Percent Growth 5.6% 5.0% 4.9% 4.5% 4.8% 4.9% 4.9% 4.9% 4.5% 4.5% 4.7%
*Green box = within 5% of capacity*Yellow box = over capacity

Attendance Zone Planning - Elementary
10
20
Roanoke HillsVineyard
Roanoke Hills and Vineyard from Beck Elem. To Roanoke 20 Elementary students

11
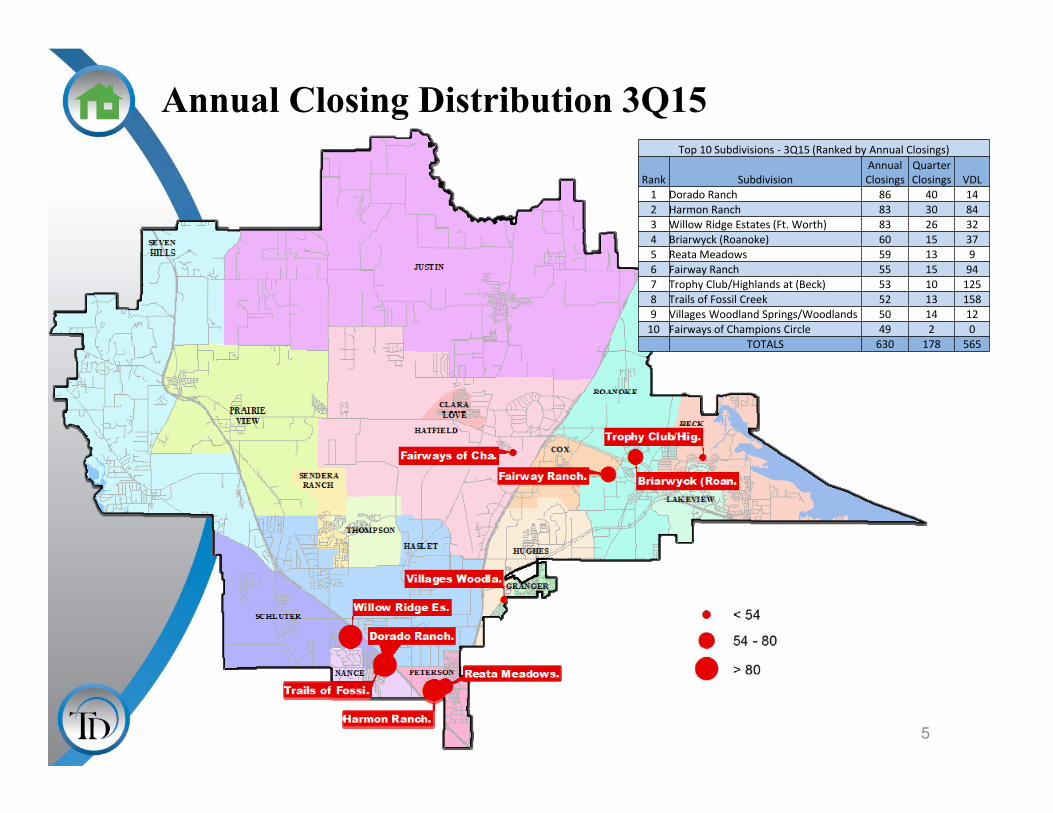
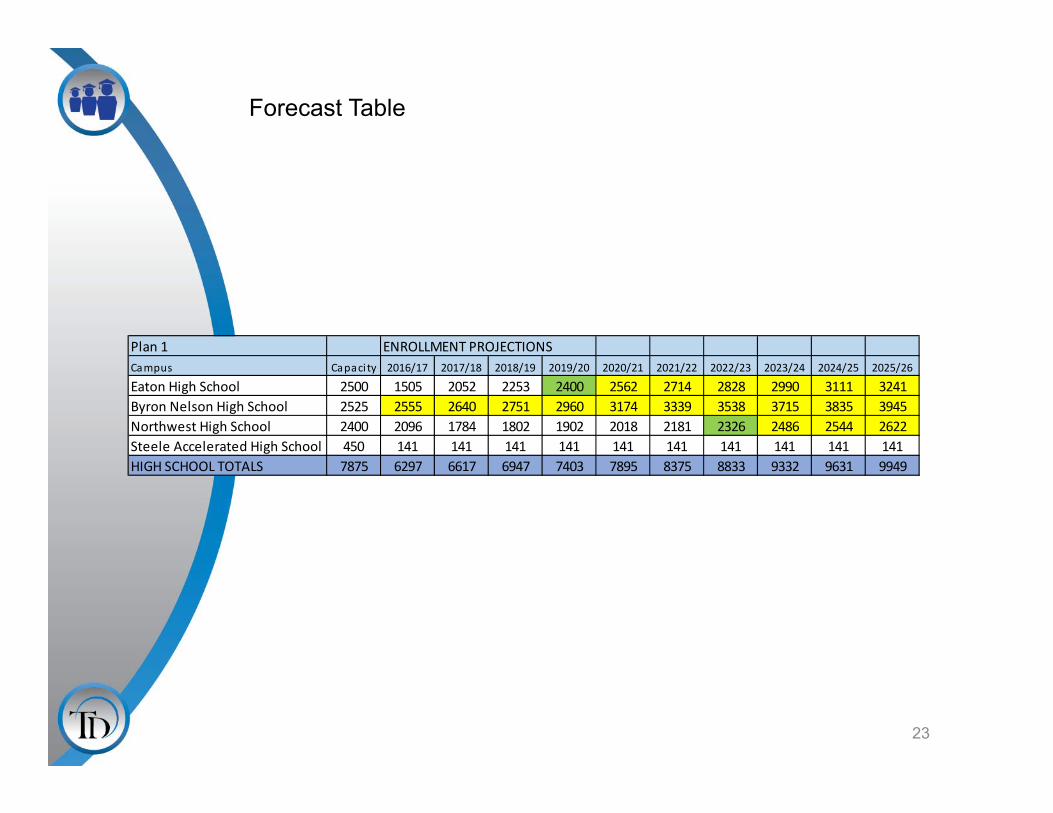
Forecast Table
Plan 1 ENROLLMENT PROJECTIONSCampus Capaci ty 2016/17 2017/18 2018/19 2019/20 2020/21 2021/22 2022/23 2023/24 2024/25 2025/26
Beck Elementary 850 802 827 845 839 843 845 846 845 849 849Clara Love Elementary 850 712 698 715 714 702 701 705 714 720 727Cox Elementary 850 535 655 796 972 1,157 1,380 1,647 1,828 2,004 2,231Granger Elementary 850 910 910 900 879 894 896 902 908 917 926Haslet Elementary 650 617 635 678 685 712 697 711 723 742 759Hatfield Elementary 450 470 491 519 551 584 668 777 925 1,086 1,270Hughes Elementary 650 564 565 573 567 570 592 616 644 669 698Justin Elementary 650 535 556 569 588 598 622 643 667 688 711Lakeview Elementary 650 595 630 637 665 667 675 680 685 695 710Nance Elementary 650 526 563 602 639 679 726 769 815 858 910Peterson Elementary 850 720 754 794 834 852 878 881 877 883 892Prairie View Elementary 650 438 446 453 479 493 515 538 559 579 603Roanoke Elementary 850 707 715 723 716 707 743 782 826 873 922Schluter Elementary 650 707 778 846 927 1,009 1,095 1,192 1,275 1,366 1,457Sendera Ranch Elementary 650 574 593 600 644 649 689 729 773 818 862Seven Hills Elementary 650 552 558 552 555 559 576 587 609 631 647Thompson Elementary 650 576 610 637 658 694 724 758 794 837 884ELEMENTARY SCHOOL TOTALS 12050 10,540 10,984 11,439 11,912 12,369 13,022 13,763 14,467 15,215 16,058

_̂
_̂
_̂
_̂
_̂
_̂
_̂
_̂
GRANGER
GRA
HASLET
HATFIELD
HUGHES
NANCEPETERSON
SCHLUTER
SENDERARANCH
THOMPSON
£¤81
£¤287
£¤287
£¤81§̈¦35W
HASLET
NANCE
HUGHES
GRANGER
SENDERA RANCH
PETERSON
THOMPSON
SCHLUTER
Attendance Zone Planning - Elementary
12
Harmon Ranch
Harmon Ranch from Peterson Elem. To Nance172 Elementary students
172

13
Forecast Table
Plan 2 ENROLLMENT PROJECTIONSCampus Capaci ty 2016/17 2017/18 2018/19 2019/20 2020/21 2021/22 2022/23 2023/24 2024/25 2025/26
Beck Elementary 850 802 827 845 839 843 845 846 845 849 849Clara Love Elementary 850 712 698 715 714 702 701 705 714 720 727Cox Elementary 850 535 655 796 972 1,157 1,380 1,647 1,828 2,004 2,231Granger Elementary 850 910 910 900 879 894 896 902 908 917 926Haslet Elementary 650 410 395 398 397 404 411 425 438 454 469Hatfield Elementary 450 470 491 519 551 584 668 777 925 1,086 1,270Hughes Elementary 650 564 565 573 567 570 592 616 644 669 698Justin Elementary 650 535 556 569 588 598 622 643 667 688 711Lakeview Elementary 650 595 630 637 665 667 675 680 685 695 710Nance Elementary 650 733 803 882 927 987 1,012 1,055 1,100 1,146 1,200Peterson Elementary 850 720 754 794 834 852 878 881 877 883 892Prairie View Elementary 650 438 446 453 479 493 515 538 559 579 603Roanoke Elementary 850 707 715 723 716 707 743 782 826 873 922Schluter Elementary 650 707 778 846 927 1,009 1,095 1,192 1,275 1,366 1,457Sendera Ranch Elementary 650 574 593 600 644 649 689 729 773 818 862Seven Hills Elementary 650 552 558 552 555 559 576 587 609 631 647Thompson Elementary 650 576 610 637 658 694 724 758 794 837 884ELEMENTARY SCHOOL TOTALS 12050 10,540 10,984 11,439 11,912 12,369 13,022 13,763 14,467 15,215 16,058

_̂
_̂
_̂
_̂
_̂
_̂
_̂
_̂
GRANGER
GR
HASLET
HATFIELD
HUGHES
NANCEPETERSON
SCHLUTER
SENDERARANCH
THOMPSON
£¤81
£¤287
£¤287
£¤81§̈¦35W
HASLET
NANCE
HUGHES
GRANGER
SENDERA RANCH
PETERSON
THOMPSON
SCHLUTER
Attendance Zone Planning - Elementary
14
Harmon Ranch
Harmon Ranch from Peterson Elem. To Haslet172 Elementary students
172

15
Forecast Table
Plan 1 ENROLLMENT PROJECTIONSCampus Capaci ty 2016/17 2017/18 2018/19 2019/20 2020/21 2021/22 2022/23 2023/24 2024/25 2025/26
Beck Elementary 850 802 827 845 839 843 845 846 845 849 849Clara Love Elementary 850 712 698 715 714 702 701 705 714 720 727Cox Elementary 850 535 655 796 972 1,157 1,380 1,647 1,828 2,004 2,231Granger Elementary 850 910 910 900 879 894 896 902 908 917 926Haslet Elementary 650 617 635 678 685 712 697 711 723 742 759Hatfield Elementary 450 470 491 519 551 584 668 777 925 1,086 1,270Hughes Elementary 650 564 565 573 567 570 592 616 644 669 698Justin Elementary 650 535 556 569 588 598 622 643 667 688 711Lakeview Elementary 650 595 630 637 665 667 675 680 685 695 710Nance Elementary 650 526 563 602 639 679 726 769 815 858 910Peterson Elementary 850 720 754 794 834 852 878 881 877 883 892Prairie View Elementary 650 438 446 453 479 493 515 538 559 579 603Roanoke Elementary 850 707 715 723 716 707 743 782 826 873 922Schluter Elementary 650 707 778 846 927 1,009 1,095 1,192 1,275 1,366 1,457Sendera Ranch Elementary 650 574 593 600 644 649 689 729 773 818 862Seven Hills Elementary 650 552 558 552 555 559 576 587 609 631 647Thompson Elementary 650 576 610 637 658 694 724 758 794 837 884ELEMENTARY SCHOOL TOTALS 12050 10,540 10,984 11,439 11,912 12,369 13,022 13,763 14,467 15,215 16,058

Attendance Zone Planning – Middle School
16
Vineyard
78
Harmon Ranch from Tidwell toChisholm Trail78 Middle School students

17
Forecast Table
Plan 2 ENROLLMENT PROJECTIONSCampus Capaci ty 2016/17 2017/18 2018/19 2019/20 2020/21 2021/22 2022/23 2023/24 2024/25 2025/26
Chisholm Trail Middle School 1100 1155 1251 1322 1421 1513 1550 1621 1694 1815 1927Gene Pike Middle School 1100 824 909 977 1030 1110 1152 1178 1180 1243 1326Medlin Middle School 1100 1145 1173 1233 1250 1315 1295 1257 1182 1179 1184Tidwell Middle School 1200 1160 1262 1334 1455 1515 1637 1742 1895 2040 2146Wilson Middle School 1200 878 897 953 958 1012 1034 1095 1114 1165 1221MIDDLE SCHOOL TOTALS 5700 5162 5492 5819 6114 6465 6668 6893 7065 7442 7804

_̂ _̂
_̂_̂
_̂
£¤81
£¤287
£¤81
§̈¦35W
§̈¦35W
CHISHOLM TRAIL PIKE
TIDWELL
WILSON
MS6
PIKEWILSON
PIKE
TIDW
ELL
CHISHOLM
TRAIL
WILSONWILSO
NTIDW
ELL
Attendance Zone Planning – Middle School
18
Vineyard
78
Harmon Ranch from Tidwell toWilson78 Middle School students
19
Forecast Table
Plan 3 ENROLLMENT PROJECTIONSCampus Capaci ty 2016/17 2017/18 2018/19 2019/20 2020/21 2021/22 2022/23 2023/24 2024/25 2025/26
Chisholm Trail Middle School 1100 1062 1142 1202 1285 1367 1398 1460 1526 1634 1741Gene Pike Middle School 1100 824 909 977 1030 1110 1152 1178 1180 1243 1326Medlin Middle School 1100 1145 1173 1233 1250 1315 1295 1257 1182 1179 1184Tidwell Middle School 1200 1160 1262 1334 1455 1515 1637 1742 1895 2040 2146Wilson Middle School 1200 971 1006 1073 1094 1158 1186 1256 1282 1346 1407MIDDLE SCHOOL TOTALS 5700 5162 5492 5819 6114 6465 6668 6893 7065 7442 7804

_̂_̂
^_̂
£¤377
¬«114
¬«170
¬«114
§̈¦35W
MEDLIN
PIKE
TIDWELL
WILSON
KESON
PIKE
TIDW
ELL
PIKE
MED
L IN
WILS
ONTIDW
ELL
TIDWELL
MEDLIN
Attendance Zone Planning – Middle School
20
North Ridge Est.
North Ridge, Harvest, CanyonFalls from Medlin to Pike36 Middle School Students
36
Harvest
Canyon Falls

21
Forecast Table
Plan 3 ENROLLMENT PROJECTIONSCampus Capaci ty 2016/17 2017/18 2018/19 2019/20 2020/21 2021/22 2022/23 2023/24 2024/25 2025/26
Chisholm Trail Middle School 1100 1062 1142 1202 1285 1367 1398 1460 1526 1634 1741Gene Pike Middle School 1100 824 909 977 1030 1110 1152 1178 1180 1243 1326Medlin Middle School 1100 1145 1173 1233 1250 1315 1295 1257 1182 1179 1184Tidwell Middle School 1200 1160 1262 1334 1455 1515 1637 1742 1895 2040 2146Wilson Middle School 1200 971 1006 1073 1094 1158 1186 1256 1282 1346 1407MIDDLE SCHOOL TOTALS 5700 5162 5492 5819 6114 6465 6668 6893 7065 7442 7804
_̂_̂£¤377¬«114
¬«170
¬«114
§̈¦35W
NORTHWESTNELSON
NELSON
NORTHWEST
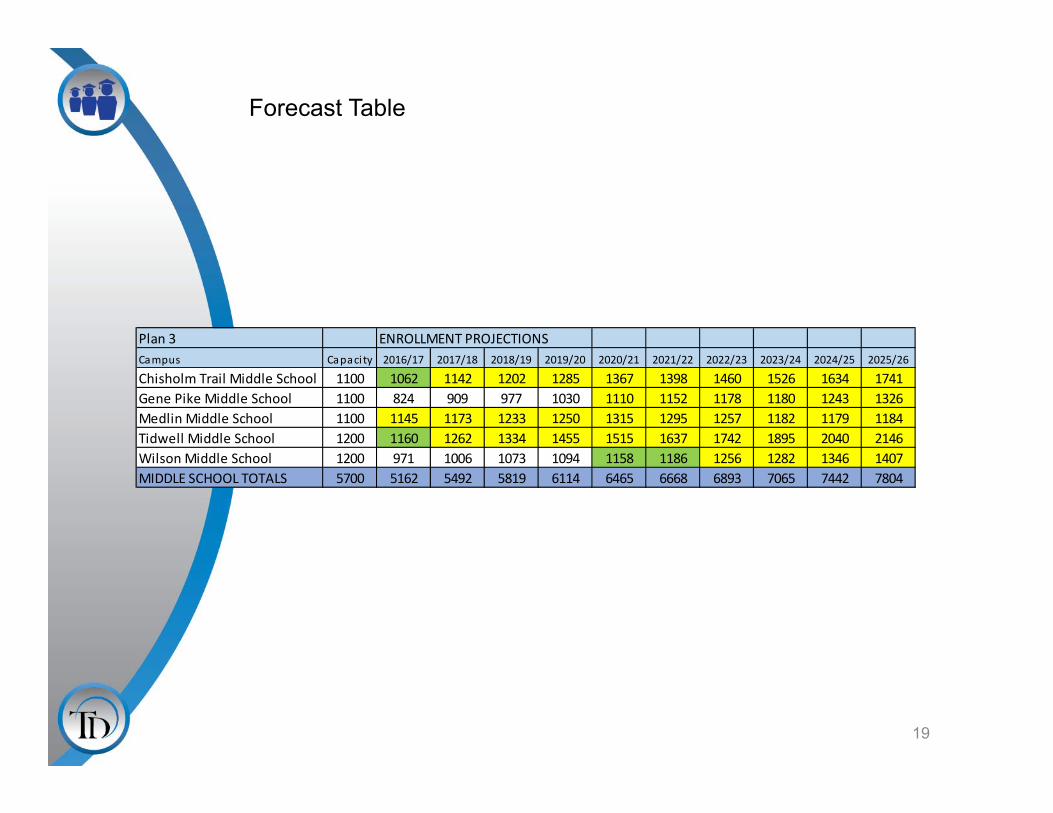
Attendance Zone Planning – High School
22
North Ridge Est.
North Ridge, Harvest, CanyonFalls from Nelson to Northwest53 High School Students
53
Harvest
Canyon Falls
23
Forecast Table
Plan 1 ENROLLMENT PROJECTIONSCampus Capaci ty 2016/17 2017/18 2018/19 2019/20 2020/21 2021/22 2022/23 2023/24 2024/25 2025/26
Eaton High School 2500 1505 2052 2253 2400 2562 2714 2828 2990 3111 3241Byron Nelson High School 2525 2555 2640 2751 2960 3174 3339 3538 3715 3835 3945Northwest High School 2400 2096 1784 1802 1902 2018 2181 2326 2486 2544 2622Steele Accelerated High School 450 141 141 141 141 141 141 141 141 141 141HIGH SCHOOL TOTALS 7875 6297 6617 6947 7403 7895 8375 8833 9332 9631 9949


![ENROLLMENT ANALYSIS JANUARY 9, 2017 · ENROLLMENT PROJECTION DISTRICTWIDE STUDENT ENROLLMENT PROJECTIONS BY SCHOOL YEAR[2] Projection Window [1] School Year 2016/2017 Enrollment is](https://static.fdocuments.us/doc/165x107/5f8b9146b2f36505874904a0/enrollment-analysis-january-9-2017-enrollment-projection-districtwide-student-enrollment.jpg)