AUSTRALIAN TEACHERS and - OECD TALIS 2013 national report.pdfTALIS 2013 in Australia ... 2. Profile...
226
Australian Council for Educational Research AUSTRALIAN TEACHERS and THE LEARNING ENVIRONMENT AN ANALYSIS OF TEACHER RESPONSE TO TALIS 2013
Transcript of AUSTRALIAN TEACHERS and - OECD TALIS 2013 national report.pdfTALIS 2013 in Australia ... 2. Profile...

Australian Council for Educational Research
AUSTRALIAN TEACHERS and THE LEARNING ENVIRONMENT
AN ANALYSIS OF TEACHER RESPONSE TO TALIS 2013
© Commonwealth of Australia 2014
With the exception of the Commonwealth Coat of Arms, the department’s logo, any material protected by a trade mark and where otherwise noted all material presented in this document is provided under a Creative Commons Attribution-NonCommercial-ShareAlike 3.0 Australia (http://creativecommons.org/licenses/by-nc-sa/3.0/au/) licence.
The details of the relevant licence conditions are available on the Creative Commons website (accessible using the links provided) as is the full legal code for the CC BY-NC-SA 3.0 AU licence (http://creativecommons.org/licenses/by-nc-sa/3.0/au/legalcode).
This material must be attributed as Australian Teachers and the Learning Environment: An Analysis of teacher response to TALIS 2013, 2014 authored by Chris Freeman, Kate O’Malley and Frances Eveleigh (Australian Council for Educational Research) under contract with the Commonwealth of Australia as represented by the Department of Education who is the copyright owner of the material.
Copyright requests and enquiries concerning further authorisation should be addressed to:
The Copyright Officer, Department of Education, Location code C10MT1 GPO Box 9880 Canberra ACT 2601 or emailed to [email protected] <mailto:[email protected]>.
The terms of use for the Commonwealth Coat of Arms are available from the It’s an Honour <http://www.itsanhonour.gov.au/> website.
Where a copyright owner, other than the Commonwealth, is identified with respect to this material, please contact that third party copyright owner directly to seek permission.
ISBN 978-1-74286-264-4
AuthorsChris FreemanKate O’MalleyFrances Eveleigh
Australian Council for Educational Research
ACN: 004 398 145; ABN: 19 004 398 145
August 2014
Australian teachers and the learning environment
An analysis of teacher response to TALIS 2013Final Report
ii
Teaching and Learning International Survey – Australian Report
Contents
List of Tables vList of Figures ixAbbreviations xi
Executive Summary xii
Introduction ..................................................................................................... xiiTALIS 2013 in Australia .................................................................................... xiiiAustralian teacher profile ............................................................................... xiiiDistribution of teachers in Australian schools ................................................ xivAustralian school profile .................................................................................. xvAustralian principal profile ............................................................................. xviDeveloping and supporting teachers ............................................................ xviiTeacher appraisal and feedback .................................................................. xviiiTeacher practices and beliefs ......................................................................... xixTeacher self efficacy and job satisfaction ........................................................ xx
1. Overview of TALIS 2013 1
1.1 Introduction ............................................................................................11.2 Overview of TALIS 2013 in Australia .......................................................21.3 Characteristics of countries in TALIS 2013 ..............................................3
Caveats surrounding international comparisons ...............................7Comparative groups ..........................................................................7
1.4 Aims of the study ....................................................................................71.5 Interpreting the data ..............................................................................81.6 Report outline ........................................................................................8
2. Profile of Australian teachers and the schools in which they work 10
2.1 Overview ..............................................................................................10How TALIS data differ from other data collections .........................10A teacher-centric perspective .........................................................11
2.1 Demographic profile of Australian teachers .........................................11Gender distribution .........................................................................11Age distribution ...............................................................................14Employment status ..........................................................................15Educational attainment and teacher education ..............................17Out of field teaching ........................................................................19Teacher preparedness ....................................................................21
2.3 Distribution of teachers in Australian schools ......................................23Teachers’ level of experience and the likelihood of working in a ‘more challenging’ school ............................................................23Teachers’ level of experience and the likelihood of working in a rural school ..................................................................................28
2.4 Demographic profile of the schools in which Australian teachers work ......................................................................................................29
School type (public/private) ............................................................30School and class size ........................................................................31School resources .............................................................................34School climate .................................................................................35School autonomy .............................................................................37
2.5 International Summary: Highlights from the International Report ......39

iii
Teaching and Learning International Survey – Australian Report
3. School Principals’ Leadership 40
3.1 Overview ..............................................................................................403.2 Introduction ..........................................................................................403.3 The Principal’s Work .............................................................................413.4 School Leadership .................................................................................423.5 Planning, school goals, programmes and professional development ..453.6 Sharing Responsibilities ........................................................................463.7 Collaborative school culture for decision making: Distributed
leadership .............................................................................................473.8 Who are today’s school leaders? ..........................................................49
Age and gender of principals ...........................................................49Principals’ years of experience ........................................................51Formal education of school principals .............................................51Principals’ work experience ............................................................56Principals’ professional development .............................................58
3.9 Principals’ leadership: Providing directions to the school and supporting teachers..............................................................................61
Instructional leadership and principals’ engagement in school and teacher development ...............................................................62
3.10 Principals’ job satisfaction ....................................................................643.11 Summary and main policy implications ................................................67
Develop formal programmes to prepare school leaders for principalship ....................................................................................67Provide opportunities for, and remove barriers to, continuing professional development for principals .........................................67Encourage the use of distributed leadership among school principals .........................................................................................68Ensure that principals receive training in, and have opportunities to, employ instructional leadership ..........................68
3.12 International Summary: Highlights from the International Report ......69
4. Developing and supporting teachers 70
4.1 Overview ..............................................................................................70Types of Professional Development ................................................70
4.2 Induction and mentoring programmes ................................................71Induction .........................................................................................71Mentoring ........................................................................................75
4.3 Professional Development ....................................................................77Participation rates ...........................................................................77Intensity and diversity of professional development ......................81Effectiveness of professional development – teachers’ perceptions ......................................................................................84Professional development – support received ................................87Professional development – teachers’ needs ..................................88Professional development – barriers ..............................................91
4.4 International Summary: Highlights from the International Report ......94
5. Teacher appraisal and feedback 95
5.1 Overview ..............................................................................................95Defining teacher appraisal and feedback ........................................95
5.2 Formal teacher appraisal ......................................................................965.3 Teacher feedback ................................................................................101
Sources of feedback .....................................................................101Methods for providing teacher feedback ......................................103Focus of teacher feedback .............................................................105
5.4 Outcomes of teacher appraisal and feedback ...................................109

iv
Teaching and Learning International Survey – Australian Report
5.5 Perceptions of teacher appraisal and feedback systems in schools ..111Does school autonomy make a difference to teacher appraisal and feedback? ...............................................................112
5.6 Summary and main policy implications ..............................................1155.7 International Summary: Highlights from the International Report ....115
6 Teacher practices and beliefs 117
6.1 Introduction ....................................................................................... 1176.2 Teaching practices ..............................................................................1176.3 Assessment practices .........................................................................1216.4 Teacher working hours .......................................................................1226.5 Teacher Beliefs....................................................................................1256.6 Teacher cooperation ...........................................................................1266.7 Time on task and the classroom environment ...................................1286.8 International Summary: Highlights from the International Report ....135
7 Teacher self-efficacy and job satisfaction 136
7.1 Introduction .......................................................................................1367.2 Teacher self-efficacy and job satisfaction in TALIS countries .............137
Self-efficacy ...................................................................................137Job satisfaction ..............................................................................140
7.3 The relationship between demographic variables and teacher self-efficacy, job satisfaction .............................................................142
7.4 The relationship between teacher professional development and teacher self-efficacy, job satisfaction ................................................145
7.5 The relationship between teacher appraisal and teacher self-efficacy, job satisfaction ....................................................................146
7.6 International Summary: Highlights from the International Report ....147
References 148
Appendix A: Research Design and Data Collection Methods 151
Appendix B: TALIS Teacher Questionnaire 158
Appendix C: TALIS Principal Questionnaire 183

v
Teaching and Learning International Survey – Australian Report
List of Tables
Executive SummaryTable 1: TALIS 2013 participating countries and economies ...................................... xiiTable 2: An overview of the TALIS design in Australia ................................................xiiiTable 3: A profile of lower secondary teachers in Australia .......................................xiiiTable 4: A profile of lower secondary schools in Australia ......................................... xvTable 5: A profile of lower secondary principals in Australia .................................... xvi
Chapter 1Table 1.1: An overview of the TALIS design ..................................................................... 3Table 1.2: TALIS 2013 participating countries and economies ........................................ 3Table 1.3: Characteristics of TALIS 2013 countries .......................................................... 5
Chapter 2Table 2.1: Gender Distribution of teachers, all countries, 2008 - 2013 .........................13Table 2.2: Age distribution of teachers in Australia over time and compared
with 2013 comparison group averages ......................................................... 14Table 2.3: Proportion of permanent and contract teachers in Australia over
time and compared with 2013 comparison group averages ........................ 16Table 2.4: Employment status of teachers in Australia over time and compared
with 2013 comparison group averages ......................................................... 16Table 2.5: Teachers’ highest level of formal education completed in Australia
over time and compared with 2013 comparison group averages ................ 17Table 2.6: Completion of teacher education or training program and the
elements included in these programmes in Australia over time and compared with 2013 comparison group averages ........................................ 18
Table 2.7: Proportion of teachers teaching certain subject areas and the level of education or training they have undertaken in this subject area ................. 20
Table 2.8: Distribution of teachers in urban and rural schools based on teaching experience ..................................................................................................... 29
Table 2.9: School type and competition: proportion of teachers whose principal reported the following characteristics ..........................................................30
Table 2.10: School and class sizes, all countries .............................................................. 32Table 2.11: Proportion of teachers whose principal reported that the following
resources issues hinder the school’s capacity to provide quality instruction ..................................................................................................... 35
Table 2.12: Proportion of teachers whose principal considered the following student behaviours to occur at least weekly in their school ........................ 36
Table 2.13: Proportion of teachers whose principal considered the following teacher behaviours to occur at least weekly in their school ........................ 36
Table 2.14: Proportion of teachers whose principal reported that considerable responsibility for the following tasks is held at the school level ..................38
Chapter 3Table 3.1: Principals’ working time: Average proportion of time principals
report spending on the following activities .................................................. 41Table 3.2: Principals’ leadership: Percentage of principals who report having
engaged often or very often in the following leadership activities during the 12 months prior to the survey .....................................................44
Table 3.3: Principals’ participation in a school development plan: Percentage of principals who report having engaged in the following activities related to a school development plan in the 12 months prior to the survey ............................................................................................................45

vi
Teaching and Learning International Survey – Australian Report
Table 3.4: Principals’ shared responsibilities: Percentage of principals in lower secondary education who report a shared responsibility for the following tasks ............................................................................................... 46
Table 3.5: School decisions and collaborative school culture: Percentage of principals in lower secondary education who ‘strongly disagree’, ‘disagree’, ‘agree’ or ‘strongly agree’ with the following statement about their school .........................................................................................48
Table 3.6: Gender and age of principals: Percentage of principals in lower secondary education with the following characteristics and mean age of principals ................................................................................................... 49
Table 3.7: Experience of principals: Mean years of experience of principals in lower secondary education as a teacher prior to appointment as a principal and during their appointment as a principal .................................. 51
Table 3.8: Principals’ educational attainment: Percentage of principals in lower secondary education by highest level of formal education completed ........ 52
Table 3.9: Principals’ formal education: Percentage of principals in lower secondary education who report that the following elements were included in their formal education ................................................................ 53
Table 3.10: Principals’ formal education including leadership training: Percentage of principals who report having received leadership training in their formal education ........................................................................................... 54
Table 3.11: Work experience of principals: Percentage of principals in lower secondary education with the following work experience and average years of experience in each role ...................................................... 57
Table 3.12: Employment status of principals: Percentage of full time and part time principals in lower secondary education with and without teaching obligations ...................................................................................... 58
Table 3.13: Principals’ recent professional development: Participation rates, types and average number of days of professional development reported to be undertaken by principals in lower secondary education in the twelve months prior to the survey .................................... 59
Table 3.14: Barriers to principals’ participation in professional development: Percentage of principals in lower secondary education who ‘agree’ or ‘strongly agree’ that the following presented barriers to their participation in professional development ...................................................60
Table 3.15: Relationship between instructional leadership and teacher appraisal and school planning ...................................................................................... 63
Table 3.16: Principals’ perceived barriers to their effectiveness: Percentage of principals in lower secondary education who report that the following limit ‘to some extent’ or ‘a lot’ their effectiveness as principal in the school ...................................................................................64
Table 3.17: Principals’ job satisfaction, detailed results: Percentage of principals in lower secondary education who ‘strongly disagree’, ‘disagree’, ‘agree’ or ‘strongly agree’ with the following statements ...........................65
Table 3.17: Principals’ job satisfaction, detailed results: Percentage of principals in lower secondary education who ‘strongly disagree’, ‘disagree’, ‘agree’ or ‘strongly agree’ with the following statements (continued) .......66
Chapter 4Table 4.1: Access to and participation in induction programmes in lower
secondary education: Percentage of teachers whose school principal reports the existence of induction processes for new teachers in the school and the percentage who report having taken part in an induction programme during their first regular employment as a teacher ..73
Table 4.2: Teachers’ participation in formal induction programmes, by work status and gender: Percentage of lower secondary education teachers with the following characteristics who report having participated in a formal induction programme in their first regular employment as a teacher .............................................................................. 74
vii
Teaching and Learning International Survey – Australian Report
Table 4.3: Mentoring programmes in lower secondary education: Percentage of lower secondary education teachers whose school principal reports the existence of a mentoring system in the school, the characteristics of the mentors and the percentage of teachers in lower secondary education who are involved in mentoring activities ..................................... 76
Table 4.4: Teachers’ recent professional development and personal cost involved: Participation rates and reported personal financial cost of professional development activities undertaken by lower secondary education teachers in the twelve months prior to the survey ..................... 78
Table 4.5: Teachers’ recent professional development, by work status, experience and gender: Percentage of lower secondary education teachers with the following characteristics who participated in professional development activities in the twelve months prior to the survey ............................................................................................................80
Table 4.6: Teachers’ recent professional development by school type and location1: Percentage of lower secondary education teachers who work in schools with the following characteristics and who participated in professional development in the twelve months prior to the survey ................................................................................................. 81
Table 4.7: Types of professional development recently undertaken by teachers: Participation rates and average number of days for each type of professional development reported to be undertaken by lower secondary education teachers in the twelve months prior to the survey ....82
Table 4.8: Content and positive impact of professional development activities: Percentage of lower secondary education teachers who report having participated in professional development with the following content in the twelve months prior to the survey and who report a ‘moderate’ or ‘large’ positive impact of this professional development on their teaching ..................................................................... 85
Table 4.9: Forms of support other than full compensation received by teachers for professional development: Percentage of lower secondary education teachers who report having received the following types of support for the professional development undertaken in the twelve months prior to the survey ................................................................88
Table 4.10: Teachers’ needs for professional development: Percentage of lower secondary education teachers indicating they have a high level of need for professional development in the following areas ..........................90
Table 4.11: Barriers to professional development participation: Percentage of lower secondary education teachers indicating that they ‘agree’ or ‘strongly agree’ that the following reasons represent barriers to their participation in professional development ................................................... 93
Chapter 5Table 5.1: Teachers who never received formal appraisal: Percentage of lower
secondary education teachers whose school principal reports that their teachers were never appraised by the following bodies or never appraised at all .............................................................................................. 96
Table 5.2: Methods of formally appraising teachers: Percentage of lower secondary education teachers whose principal reports that appraisal is used in their school and that teachers are formally appraised using the following methods ................................................................................. 98
Table 5.3: Outcomes of formal teacher appraisal: Percentage of teachers in lower secondary education who work in schools whose principal reports that the following outcomes occurred sometimes, most of the time or always after formal teacher appraisal ........................................99
viii
Teaching and Learning International Survey – Australian Report
Table 5.4: Teachers’ feedback by source of feedback: Percentage of lower secondary education teachers who report receiving feedback from various sources and teachers who report never having received feedback in their school .............................................................................. 101
Table 5.5: Methods for providing feedback to teachers: Percentage of lower secondary education teachers who report receiving feedback via the following methods ......................................................................................104
Table 5.7: Emphasis of teacher feedback: Percentage of lower secondary education TALIS teachers who report the feedback they received emphasised the following issues with a moderate or high importance .... 107
Table 5.8: Emphasis on student performance in teacher feedback: Percentage of teachers who report a moderate or high emphasis placed on student performance in the feedback - TALIS 2008 and TALIS 2013 ..........108
Table 5.9: Outcomes of teacher feedback: Percentage of lower secondary education teachers who report a moderate or large positive change in the following issues after they received feedback on their work at their school ................................................................................................. 109
Table 5.10: Impact of teacher appraisal and feedback systems in schools: Percentage of lower secondary education teachers who agree or strongly agree with the following statements about teacher appraisal and feedback systems in their schools ....................................................... 111
Table 5.11: Impact of teacher appraisal and feedback in schools by salary control: Percentage of lower secondary education teachers working in schools with different levels of responsibility for determining teachers’ salary increases and the percentage of lower secondary education teachers who agree or strongly agree with the following statements about teacher appraisal and feedback systems in their school ......................................................................................................... 113
Chapter 6Table 6.1: Assessment practices: Percentage of lower secondary education
teachers who report using the following methods of assessing student learning ‘frequently’ or ‘in all or nearly all lessons’.......................122
Table 6.2: Teachers’ working hours: Average number of hours teachers report having spent on the following activities during the most recent complete calendar week ............................................................................. 123
Table 6.3: Teacher beliefs: Percentage of lower secondary education teachers who ‘agree’ or ‘strongly agree’ with the following statements .................. 126
Table 6.4: Teacher Cooperation: Percentage of lower secondary education teachers who report never doing certain activities ................................... 128
Table 6.5: Time spent on activities in the classroom ...................................................130Table 6.6: Classroom discipline: Percentage of lower secondary education
teachers who ‘agree’ or ‘strongly agree’ with the following statements about their target class ............................................................ 131
Table 6.7: Correlation between time on task (actual teaching and learning) and the classroom disciplinary climate ..............................................................133
Chapter 7Table 7.1: Teachers’ self efficacy: Percentage of lower secondary education
teachers who feel they can do the following ‘quite a bit’ or ‘a lot’ ............139Table 7.2: Teachers’ job satisfaction: Percentage of lower secondary education
teachers who ‘agree’ or ‘strongly agree’ with the following statements ... 141Table 7.3: Relationship between various characteristics and Australian
teachers’ self efficacy and job satisfaction ................................................144
ix
Teaching and Learning International Survey – Australian Report
List of Figures
Chapter 2Figure 2.1: Age distribution of teachers 2013, all countries ...........................................15Figure 2.2: Teachers’ feelings of preparedness with regard to pedagogy and
content of subject being taught ....................................................................22Figure 2.3: Schools with more than 30% of students from socioeconomically
disadvantaged homes: proportion of more experienced teachers working in more or less challenging schools ................................................. 26
Figure 2.4: Schools with more than 10% students with special needs: proportion of more experienced teachers working in more or less challenging schools ........................................................................................................... 27
Figure 2.5: Schools with more than 10% students whose first language is different from the language of instruction: proportion of more experienced teachers working in more or less challenging schools .............28
Chapter 3Figure 3.1: Principals’ leadership: Percentage of principals who report having
engaged often or very often in the following leadership activities during the twelve months prior to the survey .............................................. 43
Figure 3.2: Gender and age distribution of principals: Percentage of female principals in OECD lower secondary education and age of principals ..........50
Figure 3.3: Principals’ formal education, including leadership training: Percentage of principals who report having received leadership training in their formal education ................................................................. 55
Chapter 4Figure 4.1: Access to formal and informal induction programmes or activities:
Percentage of lower secondary education teachers whose school principal reports the existence of formal and informal induction processes .......................................................................................................72
Figure 4.2: Professional development recently undertaken by teachers at courses and workshops: Percentage of lower secondary education teachers who report having participated in courses/workshops in the twelve months prior to the survey and the number of reported days they participated in courses/workshops over the same period ...................84
Figure 4.3: Teachers’ recent participation in professional development by their personal financial cost: Percentage of teachers who reported paying for none of the professional development activities undertaken and level of support received for the three following elements in lower secondary education ..................................................................................... 87
Figure 4.4: Teachers’ needs for professional development: Percentage of lower secondary education TALIS teachers indicating they have a high level of need for professional development in the following areas ......................89
Figure 4.5: Barriers to professional development participation: Percentage of lower secondary education TALIS teachers who ‘strongly disagree’, ‘disagree’, ‘agree’ or ‘strongly agree’ that the following elements represent barriers to their participation in professional development activities ........................................................................................................ 92
Chapter 5Figure 5.1: Teachers who never receive formal appraisal: Percentage of lower
secondary education teachers whose school principal reports that their teachers were never appraised by the following bodies ...................... 97
x
Teaching and Learning International Survey – Australian Report
Figure 5.2: Outcomes of formal teacher appraisal - development plan and mentoring: Percentage of lower secondary education teachers who work in schools whose principal reports that the following outcomes occurred sometimes, most of the time or always after formal teacher appraisal ......................................................................................................100
Figure 5.3: Teachers’ feedback by principals and school management team: Percentage of lower secondary education teachers who report receiving feedback from members of the school management team and by the school principal ......................................................................... 102
Figure 5.4: Sources for teachers’ feedback: Percentage of lower secondary education TALIS teachers who report receiving feedback from zero, one, two, three, four or all of the five bodies that could provide feedback to teachers ................................................................................... 103
Figure 5.5: Methods for teachers’ feedback: Percentage of lower secondary education teachers who report receiving feedback from zero, one, two, three, four, five or all of the six methods surveyed for teacher feedback ...................................................................................................... 105
Figure 5.6: Emphasis of teacher feedback: Percentage of lower secondary education TALIS teachers who report that the feedback they received emphasised the following issues with a moderate or high importance ....106
Chapter 6Figure 6.1: Teaching practices: Percentage of lower secondary education
teachers who report using the following teaching practices in ‘all or nearly all lessons’ or ‘frequently’ ................................................................ 119
Figure 6.2: Teaching practices: Percentage of lower secondary teachers who report using small groups, ICT and longer term projects in their teaching ‘frequently’ or ‘very frequently’................................................... 120
Figure 6.3: Time on task: Average proportion of time teachers in lower secondary education report spending on each of the following activities in an average lesson .................................................................... 129
Figure 6.4: Distribution of variance in classroom disciplinary climate based on variance of responses at teacher, school and country levels ......................134

xi
Teaching and Learning International Survey – Australian Report
ABBREVIATIONSACER Australian Council for Educational ResearchACT Australian Capital TerritoryDEEWR Department of Education, Employment and Workplace RelationsDEST Department of Education, Science and TrainingDPC IEA Data Processing and Research Center (Part of IEA)FT Field TrialICT Information and Communication TechnologyIQCM International Quality Control Monitor IDEG OECD TALIS Instrument Development GroupIEA International Association for the Evaluation of Educational AchievementINES OECD Education Indicators ProgrammeISC International Study Center (IEA Data Processing and Research Center)ISCED International Standard Classification of EducationMOS Measure of SizeMS Main StudyNAF National Adaptation FormNDM National Data ManagerNPM National Project ManagerNQM National Quality MonitorNSW New South WalesNT Northern TerritoryODC Online Data CollectionOECD Organisation for Economic Co-operation and DevelopmentP&P Paper and PencilPISA Programs for International Student AssessmentPQ Principal/School QuestionnaireQLD QueenslandSA South AustraliaSE Standard ErrorSC School CoordinatorSITES Second Information Technology in Education StudySTF School Tracking FormTALIS Teaching and Learning International SurveyTAS TasmaniaTLF Teacher Listing Form TQ Teacher QuestionnaireTTF Teacher Tracking Form VIC VictoriaWA Western AustraliaWinDEM Windows Data Entry Manager SoftwareWinW3S Windows Within School Sampling Software
xii
Teaching and Learning International Survey – Australian Report
Executive Summary
IntroductionThe OECD Teaching and Learning International Survey (TALIS) is the first international survey programme to focus on the learning environment and the working conditions of teachers in schools. It aims to overcome significant gaps in international education data and to provide robust, policy relevant indicators and analysis on teachers and the learning environment for an international audience. TALIS provides an opportunity to examine best practice from education systems around the world, to allow countries to identify other education systems facing similar challenges to their own and to learn from other policy approaches.
Specifically, TALIS aims to provide internationally comparable information in the areas of teacher demographic characteristics, school leadership, teacher professional development, systems of feedback and appraisals for the teaching workforce, school effectiveness, and teacher practices and beliefs.
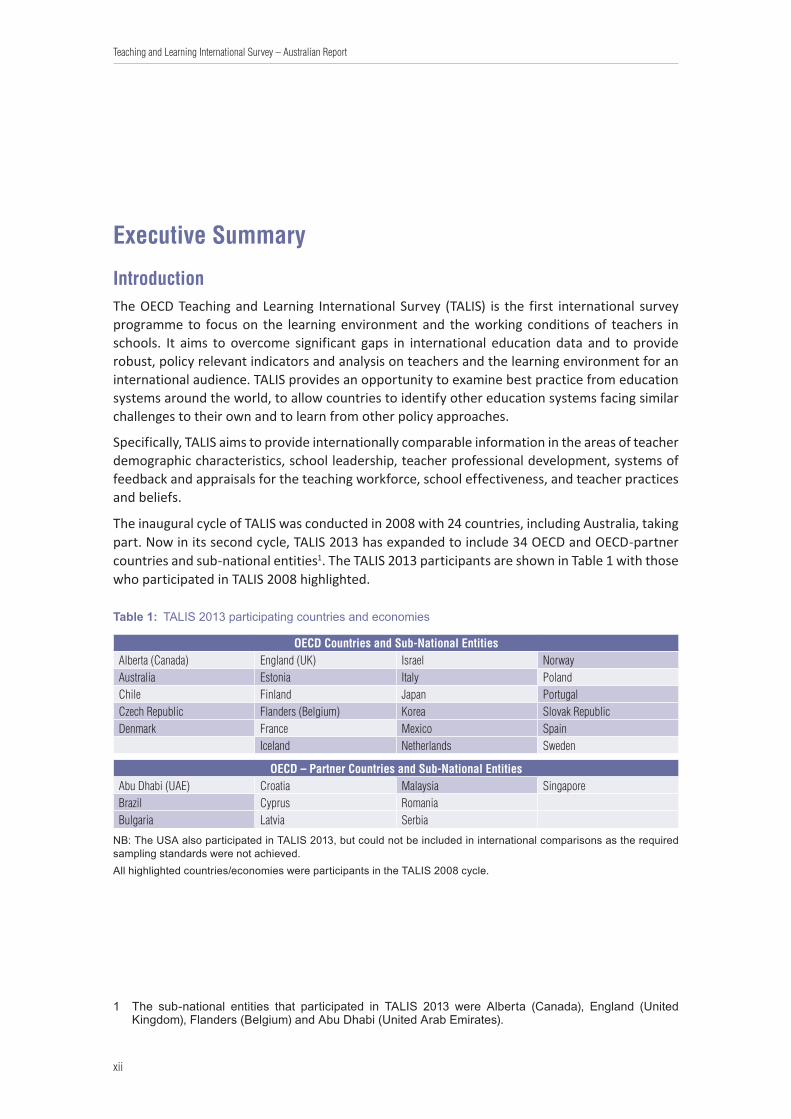
The inaugural cycle of TALIS was conducted in 2008 with 24 countries, including Australia, taking part. Now in its second cycle, TALIS 2013 has expanded to include 34 OECD and OECD-partner countries and sub-national entities1. The TALIS 2013 participants are shown in Table 1 with those who participated in TALIS 2008 highlighted.
Table 1: TALIS 2013 participating countries and economies
OECD Countries and Sub-National EntitiesAlberta (Canada) England (UK) Israel NorwayAustralia Estonia Italy PolandChile Finland Japan PortugalCzech Republic Flanders (Belgium) Korea Slovak RepublicDenmark France Mexico Spain
Iceland Netherlands Sweden
OECD – Partner Countries and Sub-National EntitiesAbu Dhabi (UAE) Croatia Malaysia SingaporeBrazil Cyprus RomaniaBulgaria Latvia Serbia
NB: The USA also participated in TALIS 2013, but could not be included in international comparisons as the required sampling standards were not achieved.All highlighted countries/economies were participants in the TALIS 2008 cycle.
1 The sub-national entities that participated in TALIS 2013 were Alberta (Canada), England (United Kingdom), Flanders (Belgium) and Abu Dhabi (United Arab Emirates).

xiii
Teaching and Learning International Survey – Australian Report
TALIS 2013 in AustraliaIn Australia, over 2000 lower secondary teachers (i.e. teachers of Years 7-10) and 149 principals in 149 schools were sampled. The Australian sample comprised schools from all Australian states and territories, and from the Government, Catholic and Independent sectors. Table 2 provides details of the sample design, achieved participation rates and data collection methods.
Table 2: An overview of the TALIS design in Australia
TALIS Design
Target Population Principals and teachers of students in Years 7 - 10 (lower secondary or ‘ISCED 2’) within mainstream schools across all states/territories and sectors in Australia.
Achieved sample size 2059 lower secondary teachers and 116 principals from 123 schools across Australia submitted a TALIS questionnaire.
Participation rates Australia’s overall school participation rate was 82.6%, and our overall teacher participation rate was 86.8%. This exceeded the requisite participation rates needed to meet sampling standards.
Questionnaires Separate questionnaires for teachers and principals, each requiring between 45 and 60 minutes to complete.
Mode of data collection The predominant mode of delivery in Australia was online, though small numbers of teachers were given paper questionnaires on request.
Survey window September - December 2012 (the window for Northern Hemisphere countries was February - June 2013)
Australian teacher profileTable 3 provides a summary of the teacher demographic data captured by the TALIS teacher questionnaire.
Table 3: A profile of lower secondary teachers in Australia
Australian teacher profile
Gender 59.2% of Australian teachers are female. This figure has remained constant since 2008, and is almost 10 percentage points lower than the TALIS average of 68.9%.
Age
The average age of the Australian teacher is 43.4. This is only marginally higher than the TALIS average of 42.9, but the proportion of Australian teachers who are 50 years and above is higher than almost all other countries (37.1%). The proportion of Australian teachers in the age groups below 30 has decreased from 18.2% in 2008 to just 15.7% in 2013. This has significant implications for succession planning.
Employment status
87.4% of Australian teachers are permanently employed and 84.3% work full time. These numbers have remained relatively constant since 2008. Of those teachers who work part time in Australia, 89.9% do so through choice, whilst 10.1% do so as there is no opportunity to work full time.
Level of education Virtually 100% of the Australian teaching workforce hold a qualification at ISCED level 5A (undergraduate and postgraduate diploma or degree), or above. The TALIS average is 90.9%.
Teacher training components
In Australia, only 62.2% of teachers reported that the content of all subjects they now teach was included in their teacher training programme, whilst 64% reported that the pedagogy of all their subjects was included. These figures are lower than the TALIS averages of 72.5% and 69.6% respectively.
Out of field teachingIn Australia, 7.2% of English teachers have received no formal education or training in this subject, whilst 8.7% of foreign language teachers have received no education or training in their subject area. Figures for out of field mathematics and science teachers are slightly lower at 5.3% and 5.6% respectively.
Teacher preparednessAcross all subject domains, 7.4% of Australian teachers report feeling ‘not at all prepared’ or ‘somewhat prepared’ with respect to subject content, whilst 9.4% report feeling underprepared with regard to subject pedagogy. The TALIS averages were 6.8% and 11.1% respectively.
xiv
Teaching and Learning International Survey – Australian Report
Distribution of teachers in Australian schoolsTALIS looked at how teachers with varying levels of experience are distributed amongst different types of schools. The most salient points with regard to Australian teacher distribution are given below:
1. Twenty-six per cent of Australian lower secondary teachers work in schools in which more than 30 per cent of their students are from socioeconomically disadvantaged homes. This figure is above the TALIS average of 20 per cent and places Australia 9th overall in terms of our proportion of teachers working in these types of schools. Futhermore, the Australian data show that teachers working in these types of schools are more likely to have less teaching experience than their colleagues in less challenging schools. This is also true for the majority of TALIS countries.
2. Twenty-four per cent of Australian lower secondary teachers work in schools deemed to be ‘more challenging’ due to the relatively high percentage (i.e. more than 10 per cent) of special needs students. Again, these teachers are more likely to have less teaching experience than teachers in less challenging schools, but the difference in this instance is only marginal.
3. Thirty-three per cent of Australian lower secondary teachers work in schools where more than 10 per cent of students whose first language is different from the language of instruction. Compared to other TALIS countries, this is a fairly high percentage, with only Singapore, Malaysia, Abu Dhabi, Sweden and Alberta (Canada) having a higher percentage of teachers in this category. Again we see that, like most other countries, Australian teachers in these schools are more likely to be less experienced than teachers in less challenging schools, but again, this difference is minimal.
4. Just over ten per cent (10.5 per cent) of Australian teachers work in schools that are located in towns with fewer than 15 000 people2. Of this number, more than 26 per cent of teachers have less than five years’ teaching experience. This figure is ten percentage points higher than that for both small cities (16.1 per cent) and large cities (18.1 per cent), meaning that teachers in rural schools have a higher proportion of less experienced teachers than other, more urban schools. Whilst this may well reflect staffing policies enacted in various Australian states and territories, it is important to ensure that these less experienced teachers in rural areas have access to the same level of support and resources as their colleagues from schools in more urban locations.
2 From our complete dataset, we know that this figure comprises 0.9 per cent who work in schools located in communities with 1000 people or fewer; 2.3 per cent who work in schools located in communities with between 1001 and 3000 people; and the remainder (7.3 per cent) work in schools in towns with between 3001 and 15 000 people.

xv
Teaching and Learning International Survey – Australian Report
Australian school profileTable 4 provides a profile of Australian lower secondary schools as reported by school principals and lower secondary teachers.
Table 4: A profile of lower secondary schools in Australia
Australian school profile
Number of students in schools
The average number of students in Australian schools which teach students in Years 7-10 is 814.2. This is considerably larger than the TALIS average of 546.4. Australia also exhibits the most variation with regard to school size, with a standard error of 51.5.
Number of teachers in schools
The average number of teachers in schools which teach students in Years 7-10 is 66.6. Again, this is considerably higher than the TALIS average of 45.5. Australia is placed 8th overall in terms of teacher numbers as compared with all other TALIS countries.
Student:Teacher ratio The average student:teacher ratio in Australian schools which teach students in Years 7-10 is 12.3:1, which is very similar to the TALIS average of 12.4:1.
Class size
The average class size in Australian schools which teach students in Years 7-10 is 24.7, which is again very similar to the TALIS average of 24.1. Australia’s standard error for this variable is also the largest of any other TALIS country at 0.7, meaning there is more variation in class size in Australia than in other countries.
Staffing resources
Almost half (47.8%) of Australian lower secondary teachers work in schools whose principal reported that quality instruction is hindered by a shortage of qualified and/or well performing teachers. A shortage of teachers with competencies in teaching students with special needs was also commonly reported in Australia (37.4%), as was a shortage of vocational teachers (27.6%) and a shortage of support personnel (28.2%). Australian principals were far less likely than their international counterparts to report a shortage or inadequacy of computers and computer software, library materials or insufficient internet access as barriers to providing quality instruction.
School climate
Students arriving late at school and student absenteeism are both significant issues in Australian schools. More than two thirds of Australian teachers work at schools whose principal reported that students arriving late occurred at least weekly in their school, and just under 60% work at schools where student absenteeism is commonplace. Both figures are substantially above the TALIS averages of 51.8% and 38.7% respectively.Almost 10% of Australian teachers work in schools where intimidation or verbal abuse of teachers and staff by students occurs on a weekly basis, and over a quarter work at schools where verbal abuse amongst students occurs frequently. This is considerably higher than the TALIS averages of 3.4% and 16% respectively.
Teacher behaviours
Over 15% of Australian lower secondary teachers work in schools where teacher absenteeism and teachers arriving late at school occurs at least weekly. Comparing these figures to reports from other TALIS countries places Australia 10th overall with regard to the prevalence of teachers arriving late at school, and 5th overall with respect to teacher absenteeism.
School autonomy
In Australia, schools generally enjoy a high level of autonomy in many areas. In all Australian schools, the decision on which courses the school offers, as well as the learning materials used for instruction, sit with the school. The vast majority of Australian teachers work in schools in which the principal or other members of the management team and/or governing board have considerable responsibility for appointing and dismissing/suspending teachers, on allocating budgets within the school, on establishing student disciplinary processes and student assessment procedures, of approving student admission and determining course content.However, the majority of Australian schools do not have jurisdiction to make decisions relating to the area of teacher remuneration. One third of Australian teachers work in schools in which decisions concerning the establishment of teacher starting salaries are made at school-level, and a smaller figure (29.5%) work at schools where salary increases can be initiated and actioned by the principal, management team or governing board.

xvi
Teaching and Learning International Survey – Australian Report
Australian principal profileTable 5 provides a summary of the principal demographic data captured by the TALIS ISCED 2 principal questionnaire.
Table 5: A profile of lower secondary principals in Australia
Australian principal profile
Gender 38.6% of Australian lower secondary school principals are female. This statistic has remained constant since 2008, and is significantly lower than the TALIS average of 49.4%.
Age
The average age of the Australian principal is 53.2. This is only marginally higher than, and not significantly different from, the TALIS average of 51.5. What is noteworthy is that the proportion of Australian principals aged 50 years and above is considerably higher than the TALIS average, with 73.5% of Australian principals being 50+, as compared to the TALIS average of 62.5%. This shows a marked rise from the 2008 figure of 65.9%.
Experience of principalsThe average tenure of Australian principals is 8 years which is similar to the TALIS average (8.9 years), although Australian principals spend significantly more time in other school management roles (average 10.5 years) compared to the TALIS average of 5.7 years.
Level of educationAustralian principals are among the most highly qualified compared to the comparison countries, with all respondents having completed ISCED level 5A (undergraduate and postgraduate diploma or degree) or higher as their academic qualification.
Principal training components
Australian principals tend to have more years of experience in schools before being promoted to principalship. Australian principals tend to have significantly less formal preparation for the role in relation to administration and instructional leadership compared to the TALIS sample and the comparison groups. Nearly one-third of Australian principals have never engaged in any form of formal instructional leadership courses.
On the TALIS Leadership Training Index, developed from principal responses to the items regarding pre-service and in-service training, Australia ranks 28/30 in the “Weak Leadership scale” with a value of 26.5 compared to the TALIS index of 9.4.
Professional development
Although the proportion of Australian principals who participate in professional development courses is relatively high (84.2%) compared to the TALIS average of 51.1%, the average time commitment to those courses of 4.5 days is considerably less than the TALIS average of 10.4 days. The major impediment to principals’ participation in professional development is reported as ‘Conflicts with work schedule’.
Time on task allocationAustralian principals report that almost 64% of their time is dedicated to administrative and leadership tasks including meetings, and curriculum and teaching related tasks. This is similar to the TALIS average of 62.7%.
Principal leadership role
In the Australian context, the role of a principal is acknowledged as complex and demanding. Australian principals tend to engage with the professional activities related to new teaching practices, improving teaching skills and ensuring a climate of responsibility for improving student learning outcomes. The TALIS averages for engagement with more administrative activities like timetabling and discipline are significantly higher than those reported by Australian principals.
Principals’ perceived barriers to effectiveness
Principals perceive inadequate school budget and resources (80.4%), government regulation and policy (71.5%) and high workload and level of responsibilities (79.8%) as the major impediments to maximising their effectiveness.
Principal job satisfaction
Australian principals report high levels of job satisfaction compared to their international counterparts. Typically, the positive responses to the items that contribute to this scale are in the high 90% range which is generally 10% above the TALIS average.
The TALIS data confirm that the position of principal is very demanding both in terms of the breadth of its responsibilities and the time that those responsibilities consume. As the connection between teachers, students, their parents or guardians, the educational system and the wider community in which the school exists, principals often feel pulled in different directions by demands that they see as incompatible.

xvii
Teaching and Learning International Survey – Australian Report
One strategy for addressing those demands is to share the work and decision-making authority with others (Schleicher 2012). The data collected within the teacher questionnaire indicated a high correlation between teacher job satisfaction with involvement in school decision making.
Developing and supporting teachers Australian teachers reported on their professional development opportunities, the support received for undertaking these activities, their effect, and the areas of work that teachers found most in need of further development.
Formal induction for all new teachers to lower secondary schools is common practice in Australia with 91 per cent of school principals reporting the availability of such programmes. Australia is one of the leaders in the provision of induction to new teachers in a school, with over twice the percentage of principals reporting the existence of these practices than the TALIS average. However, the number of teachers new to a lower secondary school actually electing to participate in a formal induction activity is approximately half of the principal-reported availability of such an activity.
Australia is also a leader in the provision of mentoring systems to teachers as reported by principals, with percentages well above the TALIS average. This is encouraging given the research providing evidence that teachers with mentoring support have higher student achievement gains (Rockoff, 2008).
Australia presents one of the highest percentages of teachers in lower secondary schools who report undertaking some sort of professional development in the 12-month period prior to the survey. In addition, approximately 75 per cent of Australian secondary teachers indicate these activities were not self-funded. These professional development undertakings also appear unhindered by either location or school type, signifying access to professional development activities in rural centres.
In terms of types of professional development experiences, Australian teachers are more likely to attend workshops and conferences and participate in networks but are less likely to visit other schools or undertake formal qualifications than their international counterparts.
With respect to undertaking professional development activities, Australia displays a comparatively high teacher participation rate when measured against other TALIS countries. This is, however, countered by a comparatively lower number of professional development days. Similar to the findings obtained from the TALIS 2008 analysis, the 2013 data suggest that Australian school systems are centred more on maximising overall participation in professional development than focussing on the intensity or duration of offered professional development.
In general, somewhat fewer Australian teachers report a moderate or large positive impact resulting from professional development than TALIS countries on average. Given that Australia reported a comparatively low number of average days for professional development experiences for teachers, one possibility may be that teachers need additional days to gain full benefit from these opportunities.
Where a comparison with 2008 is available, overall, fewer Australian teachers indicate a high professional development need in 2013 than five years ago. The data indicate that further professional development targeting the introduction and use of new technology to enhance current instructional practices would be well-targeted to Australian teachers.
The findings indicate that Australian teachers assimilate unstructured professional development activities on a daily basis. Given the lower than average number of days expended by Australian

xviii
Teaching and Learning International Survey – Australian Report
teachers on formal professional development, and conflict with work schedule cited as the biggest barrier, Australian teachers appear to embrace and utilise less formal avenues of professional development.
Teacher appraisal and feedback Australian teachers were asked about the various types of teacher appraisal and feedback they experience in both a formal and informal context.
The data indicate that Australian teachers are far more likely than teachers in other OECD countries to be appraised by a mentor or members of the school management team, other than the principal, yet less likely to be formally appraised by the principal and much less likely to be formally appraised by an external party. Consequently, Australian teachers are less likely than their international peers to receive feedback from the school principal or external body; and more likely to receive feedback from a member of the school management team, other teachers or an assigned mentor, than teachers from other TALIS countries.
The most commonly reported methods of formally appraising teachers’ work in Australia and TALIS countries focus on classroom observation and analysis of student results. Australia also ranks more highly than the TALIS and OECD averages for using both the discussion of teachers’ self-assessments of their work, and assessment of teachers’ content knowledge as methods of formally appraising teachers in lower secondary schools.
With respect to the outcomes of teacher appraisal, Australia reveals a notably low percentage of teachers who work in schools where the principal reports that teachers will experience material consequences due to poor performance, which is somewhat lower than the TALIS average. In contrast, Australia ranks comparatively highly as a country where the percentage of teachers whose principal reports the likelihood of career advancement as an outcome of teacher appraisal.
The most common method of receiving feedback, as reported by Australian teachers, was following classroom observation. With respect to emphasis on feedback, the highest percentage of teachers indicates a moderate or high emphasis on feedback related to student performance. Interestingly, at 81 per cent in 2013, this figure is considerably higher than it was in 2008, when 51 per cent of Australian teachers indicated a moderate or high emphasis on student performance received as feedback.
Perhaps of concern, just under half of Australia’s teachers report increased job satisfaction or increased motivation after receiving feedback compared to almost two thirds of TALIS teachers. Less than one third of Australian teachers report the positive outcome of increased professional development following feedback, which is 15 per cent below the TALIS average. Australian teachers report similarly to the positive outcome of likelihood of career advancement, with just 31 per cent indicating a change resulting from feedback received. Australia also compares less favourably with only 12 per cent of teachers receiving financial gain as an outcome of feedback on their work.
Almost 40 per cent of Australian teachers within schools report a positive change to their roles and responsibilities as a result of feedback, indicative of decisive steps taken by school leadership to respond, to adapt and utilise the available skills of teachers, matching them appropriately to roles. Another shift is the increase from 2008 to 2013 of the percentage of Australian lower secondary teachers who report the likelihood of career advancement as an outcome of teacher feedback, almost doubling in the past five years.
Australian teachers’ perceived level of importance of appraisal and feedback has risen over the past five years for some aspects, with an increased impact on teaching practices and the wider
xix
Teaching and Learning International Survey – Australian Report
belief that excellence in teaching is recognised. With the introduction of NAPLAN, a consequence has been greater emphasis on student performance as a component of teacher feedback.
However, the opinion held by many teachers is that appraisal systems are in place merely to fulfil administrative requirements and that identified underperforming colleagues will remain untouched. The majority of teachers also question the appraisal process, deeming it an inaccurate assessment of their skills and practice. The interaction of appraisal and feedback is further complicated by the changing levels of school autonomy.
Teacher practices and beliefsOn average, Australian teachers report working for a total of 42.7 hours per week. This places Australia seventh internationally with respect to the length of a teacher’s working week after Japan, Alberta [Canada], Singapore, England, Malaysia and Portugal. Comparing the number of hours Australian teachers report spending on certain tasks with the international figures show that Australian teachers spend a comparatively large amount of their time on paperwork and general administrative work, as well as a higher than average number of hours spent in meetings with colleagues within the school.
Australian lower secondary teachers report spending seven per cent of class time on administrative tasks, and 14.5 per cent of class time on keeping order in the classroom, meaning that 78.1 per cent of classroom time is typically devoted to actual teaching and learning. If the percentage of actual teaching and learning or ‘time on task’ is used as a measure for determining effective use of lesson time, Australia would be placed 19th out of 33 countries, with more than 20 per cent of lesson time spent on duties other than teaching and learning. These figures remain relatively unchanged from those reported by Australian teachers in TALIS 2008.
Classroom climate and time on task are positively correlated across all TALIS countries and Australia demonstrates the strongest link between these two elements. This suggests that in all TALIS countries, and particularly in Australia, time spent on actual teaching and learning increases with the quality of the classroom climate.
Looking at ICT use in the classroom, Australia ranks 4th overall with regard to the proportion of teachers frequently using ICT with their students (66.7 per cent) after Denmark (73.9 per cent), Norway (73.8 per cent) and Abu Dhabi (72.1 per cent). In terms of subject domains, Australian humanities teachers are more likely than other teachers to report frequent ICT use, whilst the use of ICT does not appear to be taking place as frequently in mathematics and science classrooms.
As was the case for TALIS 2008, the 2013 data show that Australian teachers exhibit practices of exchange and coordination far more frequently than those of professional collaboration. This means that practices of team teaching, teacher observation and engagement in joint activities are far less frequent occurrences in Australian classrooms than cooperative activities involving, for instance, teachers exchanging teaching materials or discussing specific students learning development with colleagues.
With regard to assessment practices, TALIS data suggest that many Australian lower secondary teachers are using multiple assessment approaches and opportunities, which is more likely to gather a complete picture of student learning (OECD 2013a). Larger proportions of Australian teachers are using more formative, as opposed to summative, forms of assessment. Ninety per cent of Australian teachers report that they frequently observe students and provide immediate feedback to them, which is higher than the TALIS average of 79.7 per cent. Australian teachers are also more likely to provide written feedback on student work in addition to solely a mark or

xx
Teaching and Learning International Survey – Australian Report
grade than their international counterparts, and are also more likely to develop and administer their own assessment than in the majority of other TALIS countries.
Teacher self-efficacy and job satisfactionOverall, lower secondary teachers demonstrate a relatively high level of self-efficacy both in Australia and internationally. Australian teachers report a very high level of self-efficacy in relation to both classroom management and instruction and it seems they demonstrate a particularly widespread ability to make their expectations about student behaviour clear (93.4 per cent) and to provide an alternative explanation for an example when students are confused (94 per cent).
In Australia, male teachers tend to display lower self-efficacy than their female counterparts. This is true in Australia more so than in almost all other TALIS countries, with the exception of Denmark and Estonia.
With respect to work experience, TALIS data suggest that more experienced teachers report higher levels of self-efficacy, which is a trend seen in Australia as well as the majority of other TALIS countries. Furthermore, levels of self-efficacy amongst Australian teachers tend to increase when there are large numbers (i.e. more than 10 per cent) of academically gifted students in their classroom. Conversely, Australian teachers will report lower levels of self-efficacy when they have large number of students with behavioural problems in their classes or when they spend more time dealing with administrative or behavioural issues during class time.
With regard to job satisfaction, 90 per cent of Australian lower secondary teachers report being satisfied with their job, which shows an increase from 82 per cent in 2008. It is noteworthy, however, that only 38.5 per cent of Australian lower secondary education teachers believe that the teaching profession is valued in society. The percentage is similarly low among many of the other TALIS countries with the notable exception of teachers in Korea, Malaysia and Singapore.
The perception amongst teachers that their profession is one that is not valued in society can have negative implications for the recruitment and retention of high quality teachers. Whilst many countries, including Australia, have enacted policies to increase the prestige of the teaching profession (Schleicher 2011), further investigation is warranted into what it is that engenders these negative perceptions of the teaching profession.

1
Teaching and Learning International Survey – Australian Report
1. Overview of TALIS 2013
1.1 IntroductionThe OECD Teaching and Learning International Survey (TALIS) is the first international survey programme to focus on the learning environment and the working conditions of teachers in schools. Originally emerging from the OECD’s international educational indicators programme (INES), TALIS aims to overcome significant gaps in international education data and to improve our collective ability to make comparisons between different education systems around the world. It is a large-scale international survey that is a collaborative endeavour between the governments of participating countries, the OECD, an international research consortium, and education professionals around the world.
Specifically, TALIS aims to provide internationally comparable information in the areas of teacher professional development, systems of feedback and appraisals for the teaching workforce, school effectiveness, and teacher practices and beliefs. It offers teachers and school leaders the opportunity to provide input into educational policy analysis and development in key areas, whilst also allowing countries to identify with other participating countries facing similar challenges and to learn from other policy approaches.
The inaugural cycle of TALIS was conducted in 2008 with a total of 24 OECD countries and OECD-partner countries taking part. The initial international report, Creating Effective Teaching and Learning Environments: First Results from TALIS, published in 2009, as well as the first Australian report Australian teachers and the learning environment, published in 2010, provided important findings on the learning environment and the working conditions of the teaching workforce - findings that are still being used today.
Now in its second cycle, TALIS 2013 has expanded to include 34 OECD and OECD-partner countries and sub-national entities3. As per the previous cycle, the primary focus of TALIS remains on lower secondary education (Years 7-10 in the Australian school system, or ISCED level 24). However, TALIS 2013 also gave countries the option of surveying teachers in their primary (ISCED level 1) and upper secondary (ISCED level 3) schools. Furthermore, countries were also offered the opportunity of participating in the TALIS-PISA link option, which involved conducting the survey in schools that participated in the 2012 Programme for International Student Assessment (PISA). Teachers of 15 year old students (15 being the age of students participating in PISA) were surveyed in these schools.
3 The sub-national entities that participated in TALIS 2013 were Alberta (Canada), England (United Kingdom), Flanders (Belgium) and Abu Dhabi (United Arab Emirates).
4 As classified by the International Standard Classification of Education (ISCED 1997), which identifies comparable levels of education across countries.
2
Teaching and Learning International Survey – Australian Report
In addition to participating at the lower secondary (ISCED 2) level, Australia also chose to take part in both the upper secondary (ISCED 3) and TALIS-PISA link options, meaning that a total of over 8500 teachers from approximately 450 schools were sampled for all three surveys (150 schools per option). The information relayed in this report, however, relates only to the data collected from the ISCED 2 level survey. Additional reports concerning the ISCED 3 and TALIS-PISA link options will be released separately.
1.2 Overview of TALIS 2013 in AustraliaAs was the case for the 2008 cycle of TALIS, the Department of Education (formerly DEEWR) again commissioned the Australian Council for Educational Research (ACER) to oversee and conduct the implementation of TALIS 2013 in Australia. At an international level, TALIS was coordinated and managed by the International Association for the Evaluation of Education Achievement (IEA), and the study’s implementation was overseen by the IEA’s Data Processing and Research Centre (DPC). The IEA Secretariat was responsible for overseeing the quality control of the data collection, and Statistics Canada was responsible for developing the sampling plan, calculating sampling weights and advising on the calculation of sampling errors. Ultimately, the OECD Secretariat had overall responsibility for managing TALIS and monitoring its implementation in all participating countries.
In Australia, over 2000 teachers and 149 principals in 149 schools comprised the ISCED 2 sample. In the Australian context, ISCED 2 teachers are defined as teachers of students in lower secondary education or, more specifically, teachers of students in Years 7, 8, 9 or 10. For the purposes of TALIS, a teacher was defined as ‘one whose primary or major activity in the school is student instruction, involving the delivery of lessons to students’ (OECD 2014), and who was not a teacher aide, a pedagogical support staff member or a health and social support staff member. Also excluded from the target population of teachers were substitute, emergency or occasional teachers, teachers teaching adults exclusively and teachers on long-term leave. Unlike TALIS 2008, teachers of special needs students in mainstream schools are now included in the target population.
As mentioned previously, a series of additional international options was made available to all participating countries. These options comprised ISCED 1, ISCED 3 and TALIS-PISA link surveys. In addition to participating in the ISCED 2 level, Australia also chose to take part in both the ISCED 3 and TALIS-PISA link options but it is only the data collected from the ISCED 2 survey that form the basis of this report (reports on ISCED 3 and TALIS-PISA link options are forthcoming).
Whilst a detailed discussion of the TALIS 2013 research design and data collection methods undertaken in Australia is provided in the appendix to this report, an overview of this study’s design and implementation is given below in Table 1.1.

3
Teaching and Learning International Survey – Australian Report
Table 1.1: An overview of the TALIS design
TALIS Design
Target Population Principals and teachers of students in Years 7 – 10 (lower secondary or ‘ISCED 2’) within mainstream schools across all states/territories and sectors in Australia.
Target sample size 149 lower secondary schools; 20 teachers and 1 principal in each school
Target response rates75% of the sampled schools, together with a 75% response rate from all sampled teachers in the country. Schools were considered as non-participants if fewer than 50% of their sampled teachers responded to the survey.
Questionnaires Separate questionnaires for teachers and principals, each requiring between 45 and 60 minutes to complete
Mode of data collection The predominant mode of delivery in Australia was online, though small numbers of teachers were given paper questionnaires on request.
Survey window September – December 2012 (the window for Northern Hemisphere countries was February – June 2013)
1.3 Characteristics of countries in TALIS 2013Australia was one of 34 OECD and OECD-partner countries and sub-national entities to participate in TALIS 2013. TALIS 2013 garnered participation across five continents, from 30 countries and 4 sub-national entities (though internationally comparable results are reported for only 33 of these participants due to one country not meeting the requisite sampling standards). The list of participating OECD and OECD-partner countries and sub-national entities is provided in Table 1.2 below. The participants in the previous cycle of TALIS in 2008 have been highlighted.
Table 1.2: TALIS 2013 participating countries and economies
OECD Countries and Sub-National EntitiesAlberta (Canada) England (UK) Israel NorwayAustralia Estonia Italy PolandChile Finland Japan PortugalCzech Republic Flanders (Belgium) Korea Slovak RepublicDenmark France Mexico Spain
Iceland Netherlands Sweden
OECD – Partner Countries and Sub-National EntitiesAbu Dhabi (UAE) Croatia Malaysia SingaporeBrazil Cyprus RomaniaBulgaria Latvia Serbia
NB: The USA also participated in TALIS 2013 but could not be included in international comparisons as the required sampling standards were not achieved.All highlighted countries/economies were participants in the TALIS 2008 cycle.

4
Teaching and Learning International Survey – Australian Report
The countries and sub-national entities involved in the study provided a cross-section of demographic, economic and social characteristics, as Table 1.3 shows. Those participating ranged in population from 0.3 million (Iceland) to 315.8 million (United States). Australia was the thirteenth most populated nation involved (22.9 million). With respect to land mass, Australia had the fourth largest area of land of the participating countries and sub-national entities, with United States having the largest (at 9 147 420 square kilometres) and Singapore the smallest (at 700 square kilometres). The percentage of urbanisation also ranged widely in this group of countries. For example, 100 per cent of the Singaporean population lived in urban areas, and just over 50 per cent of the Romanian population did so. Australia had a comparatively high level of urbanisation (89.4 per cent).
The Human Development Index rank, calculated using the HDI values of life expectancy, education variables and the GDP index, shows the true extent of divergence amongst this group with respect to social and economic factors, with ranks ranging from 1 (Norway) to 85 (Brazil). Australia was calculated as having an HDI rank of 2.
Accordingly, economic indicators such as GDP per capita varied considerably. GDP per capita, measured in US dollars, was highest in Norway ($99 636), and lowest in Serbia ($5190). Australia recorded the second highest GDP per capita of the group in this year (2012), with $67 442.
Public expenditure on education was markedly different amongst the countries and sub-national entities in this study. Denmark, Cyprus and Iceland recorded the highest expenditure (as a percentage of GDP) on education with 8.7 per cent, 7.9 per cent, and 7.8 per cent respectively in 2009. At the other end of the spectrum, United Arab Emirates spent 1.0 per cent of annual GDP on education. Australia was placed equal 17th within this group with public expenditure totalling 5.1 per cent of GDP5.
World Bank data reported that Australia had a total of 86 per cent enrolment at the secondary level. The majority of countries and sub-national entities taking part in the study demonstrated a similar rate of enrolment at the secondary level. Only two countries (Malaysia and Mexico) had a figure below 80 per cent6.
TALIS 2013 countries and sub-national entities demonstrated a significant divergence in internet technology use. In this instance, internet users per 100 head of population indicated internet usage. Along this indicator, Iceland recorded the highest number of internet users with 95.6 per 100 people, whilst Mexico recorded the lowest with 31.1 users per 100 people. Australia places as the fourteenth highest for internet usage within this group of countries and sub-national entities, with 75.9 users per 100 people.
5 Note: not all participating countries and sub-national entities had extant data in this category for the year reported in Table 1.3.
6 Note: not all participating countries and sub-national entities had extant data in this category for the year reported in Table 1.3.
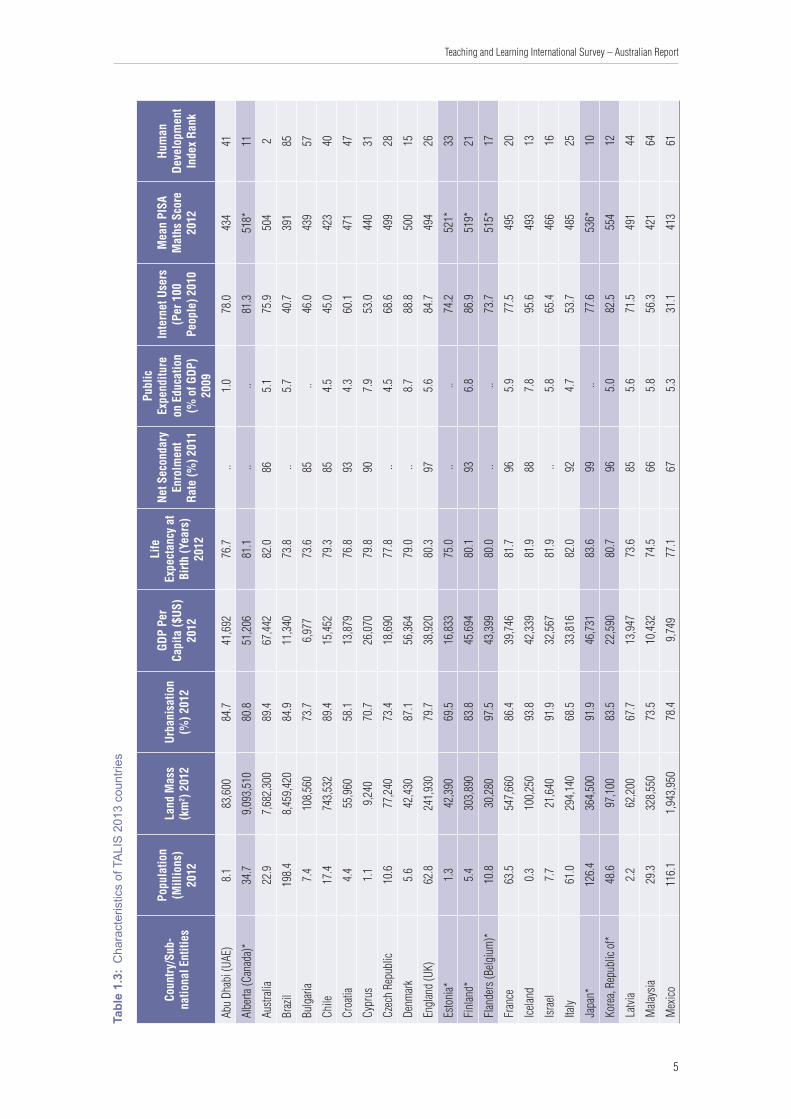
5
Teaching and Learning International Survey – Australian Report
Tabl
e 1.
3: C
hara
cter
istic
s of
TA
LIS
201
3 co
untri
es
Coun
try/
Sub-
natio
nal E
ntiti
es
Popu
latio
n (M
illio
ns)
2012
Land
Mas
s (k
m2 )
201
2Ur
bani
satio
n (%
) 201
2
GDP
Per
Capi
ta ($
US)
2012
Life
Ex
pect
ancy
at
Birth
(Yea
rs)
2012
Net S
econ
dary
En
rolm
ent
Rate
(%) 2
011
Publ
ic
Expe
nditu
re
on E
duca
tion
(%
of G
DP)
2009
Inte
rnet
Use
rs
(Per
100
Pe
ople
) 201
0
Mea
n PI
SA
Mat
hs S
core
20
12
Hum
an
Deve
lopm
ent
Inde
x Ra
nk
Abu
Dhab
i (UA
E)8.
183
,600
84.7
41,6
9276
.7..
1.0
78.0
434
41
Albe
rta (C
anad
a)*
34.7
9,09
3,51
080
.851
,206
81.1
....
81.3
518*
11
Austr
alia
22.9
7,68
2,30
089
.467
,442
82.0
865.
175
.950
42
Braz
il19
8.4
8,45
9,42
084
.911
,340
73.8
..5.
740
.739
185
Bulg
aria
7.4
108,
560
73.7
6,97
773
.685
..46
.043
957
Chile
17.4
743,
532
89.4
15,4
5279
.385
4.5
45.0
423
40
Croa
tia4.
455
,960
58.1
13,8
7976
.893
4.3
60.1
471
47
Cypr
us1.
19,
240
70.7
26,0
7079
.890
7.9
53.0
440
31
Czec
h Re
publ
ic10
.677
,240
73.4
18,6
9077
.8..
4.5
68.6
499
28
Denm
ark
5.6
42,4
3087
.156
,364
79.0
..8.
788
.850
015
Engl
and
(UK)
62.8
241,
930
79.7
38,9
2080
.397
5.6
84.7
494
26
Esto
nia*
1.3
42,3
9069
.516
,833
75.0
....
74.2
521*
33
Finl
and*
5.4
303,
890
83.8
45,6
9480
.193
6.8
86.9
519*
21
Flan
ders
(Belg
ium
)*10
.830
,280
97.5
43,3
9980
.0..
..73
.751
5*17
Fran
ce63
.554
7,66
086
.439
,746
81.7
965.
977
.549
520
Icelan
d0.
310
0,25
093
.842
,339
81.9
887.
895
.649
313
Israe
l7.
721
,640
91.9
32,5
6781
.9..
5.8
65.4
466
16
Italy
61.0
294,
140
68.5
33,8
1682
.092
4.7
53.7
485
25
Japa
n*12
6.4
364,
500
91.9
46,7
3183
.699
..77
.653
6*10
Kore
a, Re
publ
ic of
*48
.697
,100
83.5
22,5
9080
.796
5.0
82.5
554
12
Latvi
a2.
262
,200
67.7
13,9
4773
.685
5.6
71.5
491
44
Mala
ysia
29.3
328,
550
73.5
10,4
3274
.566
5.8
56.3
421
64
Mex
ico11
6.1
1,94
3,95
078
.49,
749
77.1
675.
331
.141
361
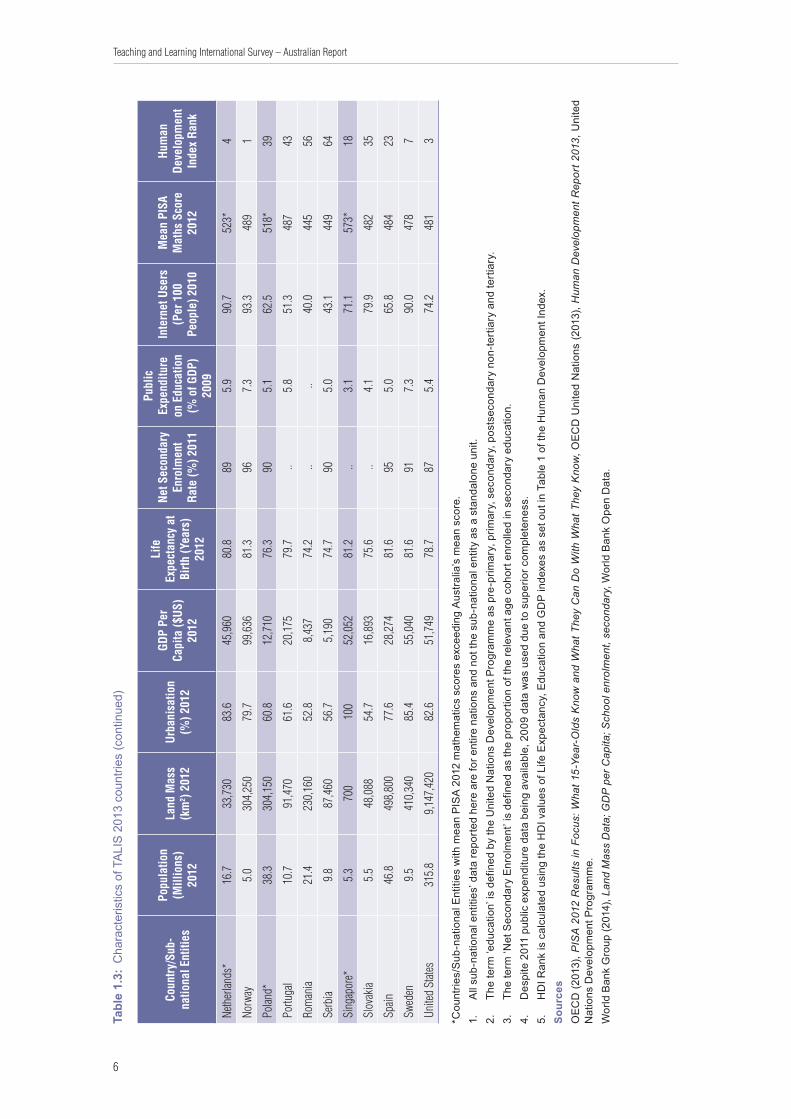
6
Teaching and Learning International Survey – Australian Report
Coun
try/
Sub-
natio
nal E
ntiti
es
Popu
latio
n (M
illio
ns)
2012
Land
Mas
s (k
m2 )
201
2Ur
bani
satio
n (%
) 201
2
GDP
Per
Capi
ta ($
US)
2012
Life
Ex
pect
ancy
at
Birth
(Yea
rs)
2012
Net S
econ
dary
En
rolm
ent
Rate
(%) 2
011
Publ
ic
Expe
nditu
re
on E
duca
tion
(%
of G
DP)
2009
Inte
rnet
Use
rs
(Per
100
Pe
ople
) 201
0
Mea
n PI
SA
Mat
hs S
core
20
12
Hum
an
Deve
lopm
ent
Inde
x Ra
nk
Neth
erlan
ds*
16.7
33,7
3083
.645
,960
80.8
895.
990
.752
3*4
Norw
ay5.
030
4,25
079
.799
,636
81.3
967.
393
.348
91
Polan
d*38
.330
4,15
060
.812
,710
76.3
905.
162
.551
8*39
Portu
gal
10.7
91,4
7061
.620
,175
79.7
..5.
851
.348
743
Rom
ania
21.4
230,
160
52.8
8,43
774
.2..
..40
.044
556
Serb
ia9.
887
,460
56.7
5,19
074
.790
5.0
43.1
449
64
Sing
apor
e*5.
370
010
052
,052
81.2
..3.
171
.157
3*18
Slov
akia
5.5
48,0
8854
.716
,893
75.6
..4.
179
.948
235
Spain
46.8
498,
800
77.6
28,2
7481
.695
5.0
65.8
484
23
Swed
en9.
541
0,34
085
.455
,040
81.6
917.
390
.047
87
Unite
d St
ates
315.
89,
147,
420
82.6
51,7
4978
.787
5.4
74.2
481
3
*Cou
ntrie
s/S
ub-n
atio
nal E
ntiti
es w
ith m
ean
PIS
A 2
012
mat
hem
atic
s sc
ores
exc
eedi
ng A
ustra
lia’s
mea
n sc
ore.
1.
All
sub-
natio
nal e
ntiti
es’ d
ata
repo
rted
here
are
for e
ntire
nat
ions
and
not
the
sub-
natio
nal e
ntity
as
a st
anda
lone
uni
t.2.
Th
e te
rm ‘e
duca
tion’
is d
efin
ed b
y th
e U
nite
d N
atio
ns D
evel
opm
ent P
rogr
amm
e as
pre
-prim
ary,
prim
ary,
sec
onda
ry, p
osts
econ
dary
non
-tert
iary
and
tert
iary
.3.
Th
e te
rm ‘N
et S
econ
dary
Enr
olm
ent’
is d
efin
ed a
s th
e pr
opor
tion
of th
e re
leva
nt a
ge c
ohor
t enr
olle
d in
sec
onda
ry e
duca
tion.
4.
Des
pite
201
1 pu
blic
exp
endi
ture
dat
a be
ing
avai
labl
e, 2
009
data
was
use
d du
e to
sup
erio
r com
plet
enes
s.5.
H
DI R
ank
is c
alcu
late
d us
ing
the
HD
I val
ues
of L
ife E
xpec
tanc
y, E
duca
tion
and
GD
P in
dexe
s as
set
out
in T
able
1 o
f the
Hum
an D
evel
opm
ent I
ndex
.So
urce
sO
ECD
(201
3), P
ISA
201
2 R
esul
ts in
Foc
us: W
hat 1
5-Ye
ar-O
lds
Kno
w a
nd W
hat T
hey
Can
Do
With
Wha
t The
y K
now
, OEC
D U
nite
d N
atio
ns (2
013)
, Hum
an D
evel
opm
ent R
epor
t 201
3, U
nite
d N
atio
ns D
evel
opm
ent P
rogr
amm
e.W
orld
Ban
k G
roup
(201
4), L
and
Mas
s D
ata;
GD
P p
er C
apita
; Sch
ool e
nrol
men
t, se
cond
ary,
Wor
ld B
ank
Ope
n D
ata.
Tabl
e 1.
3: C
hara
cter
istic
s of
TA
LIS
201
3 co
untri
es (c
ontin
ued)

7
Teaching and Learning International Survey – Australian Report
Caveats surrounding international comparisons
The degree of variation between TALIS 2013 countries with regard to demographic, social and economic factors described previously makes cross-country comparisons a fascinating yet irrefutably complex task. Given the differences across TALIS countries in policies relating to teachers and their working conditions, comparisons made between Australia and the other TALIS 2013 countries should always be made with caution, and with recognition of the factors which may play a role in making comparisons unfeasible or inappropriate.
Furthermore, comparisons with any of the sub-national entities of Alberta (Canada), England (UK), Flanders (Belgium) and Abu Dhabi (UAE) should also be made with caution as survey results from these regions may not necessarily be representative of the teachers and principals of the entire nation state in which they reside.
Comparative groups
Throughout this report, comparisons will be made between Australia and three specific groups of countries that participated in TALIS 2013. These groups are:
1. OECD countries: The list of OECD member countries and sub-national entities that participated in TALIS 2013 is presented in Table 1.2. They are, in alphabetical order, Alberta (Canada), Australia7, Chile, Czech Republic, Denmark, England (UK), Estonia, Finland, Flanders (Belgium), France, Iceland, Israel, Italy, Japan, Korea, Mexico, Netherlands, Norway, Poland, Portugal, Slovak Republic, Spain and Sweden. The US is also an OECD member country, but its data will not be used in the calculation of the OECD average as they did not meet the required sampling standards.
2. Asian countries: The Asian country participants in TALIS 2013 were Japan, Korea, Malaysia and Singapore.
3. PISA-Best countries: The nine TALIS 2013 participants which out-performed Australia in PISA 2012 Mathematics were Canada (as represented by Alberta), Estonia, Finland, Belgium (as represented by Flanders), Japan, Korea, Netherlands, Poland and Singapore. Mathematics results were used as the significant identifier in this instance as the subject focus of PISA 2012 was that of Mathematics.
These groups in particular were chosen for comparison because they represent groups which are of considerable interest to contemporary Australian and international educational researchers. It is hoped that such comparisons may provide useful insights into educational policy and practice on an international scale for a broad range of research interests.
1.4 Aims of the studyThe overarching aim of TALIS is to provide robust, policy relevant indicators and analysis on teachers and the learning environment for an international audience. It aims to provide an opportunity to examine best practice in education systems around the world, to allow countries to identify other education systems facing similar challenges to their own and to learn from other policy approaches.
7 Note that any discussion of an ‘OECD mean’ for any question or scale will have included Australia’s data in the calculation of this mean.

8
Teaching and Learning International Survey – Australian Report
TALIS aims to provide an analysis of key policy areas and to highlight the options that are available to policymakers. Specifically, the policy themes for TALIS 2013 are:
• Teacher training, including professional development and new indicators on initial teacher education.
• Systems of appraisal and feedback for the teaching workforce.
• School leadership, including new indicators on distributed or team leadership.
• Teachers’ pedagogical beliefs, attitudes and teaching practices, including new indicators on the profile of student-assessment practices.
• Teachers’ reported feelings of self-efficacy, their job satisfaction and the climate in the schools and classrooms in which they work.
These themes were essentially retained from TALIS 2008, with the addition of some new questions and indicators. This means that some comparison of responses from teachers and principals between cycles may be possible for countries that participated in both the 2008 and 2013 cycles, such as Australia.
1.5 Interpreting the dataThe TALIS data provide an important contribution to understanding the working conditions of teachers and the learning environment in schools. When interpreting the data presented in this report, however, care must be taken when making any comparisons between countries, or between groups of countries. As outlined previously, comparisons must be made with an understanding of the cultural, social or economic factors that underpin these responses in various countries.
In addition, it must also be borne in mind that TALIS data are based on self-reports by teachers and principals and therefore represent teachers’ and principals’ own sets of opinions, perspectives and beliefs on a given matter. As such, responses may be subjective and/or carry personal or cultural bias of some nature. In this way, these data differ from more objectively collected data, and therefore may differ from administrative data provided by national or state governments.
In many respects, however, it is the very ‘subjectiveness’ of the TALIS responses that allow and provide powerful insights into the experiences and perspectives of teachers and principals in Australian schools. As stated in the TALIS 2013 International Report, it is such information that enables a shared understanding of what motivates teachers and principals, and how policies that are put in place are carried out or experienced in practice.
1.6 Report outlineThe structure of this report mirrors that of the TALIS 2013 International Report, and is organised around seven chapters.
• Chapter 1 presents an overview of TALIS 2013, its aims and objectives, and a brief discussion of how the survey was implemented in Australia. It also provides an overview of some important demographic, economic and social indicators of the participating countries (as reported in the UN’s Human Development Report 2013) in order to provide some country-level context for any subsequent cross-country comparisons that may be made with these data.
9
Teaching and Learning International Survey – Australian Report
• Chapter 2 provides a demographic profile of Australian teachers and principals, and a description of the schools in which they work. In doing so, this chapter provides an important context for the later analytical chapters.
• Chapter 3 provides a profile of school principals and will examine the personal attributes and demographic characteristics of school leaders, the instructional leadership they provide and their perceived impediments to more effective instructional environments.
• Chapter 4 focuses on the professional development experiences of Australian teachers as compared to their international colleagues. It will look at teacher participation in induction and mentoring programmes with a view to identifying characteristics that may help explain teacher participation is such programmes.
• Chapter 5 looks at the importance of teacher appraisal and feedback, examining the type of appraisal and feedback teachers receive and exploring its impact on teaching practices and possible connections with other school factors.
• Chapter 6 examines the type and prevalence of various teacher practices and beliefs that are evident in teachers across and between schools and countries. It explores the relationships between a teacher’s reported practices and various school- and teacher-level factors such as teacher cooperation, time on task and classroom climate.
• Chapter 7 looks at various factors that relate to teachers’ reported levels of self-efficacy and job satisfaction. It revisits themes from previous chapters to elucidate a greater understanding of how teachers feel about their abilities, their effectiveness and their profession in general.
Further to this, a detailed description of the TALIS research design and the data collection methods used in Australia is presented in the appendix to this report. This will involve a detailed explanation of sampling methodology, a summary of achieved participation rates, and a discussion about the measures taken to implement quality control procedures so as to ensure data quality.
10
Teaching and Learning International Survey – Australian Report
2. Profile of Australian teachers and the schools in which they work
2.1 OverviewThis chapter provides a demographic profile of Australian lower secondary teachers and a description of the schools in which they work. It also looks at how teachers with varying amounts of teaching experience are distributed across their respective education systems in Australia as compared to other participating TALIS countries.
Mirroring the form of the International Report, this chapter is structured around two distinct sections. The first section pertains to teachers themselves and presents analyses of a number of demographic teacher characteristics, namely gender and age distribution, employment status, as well as the educational attainment and training of teachers. This section also looks at how these teachers are distributed across the Australian educational system with respect to geographical location (rural versus urban), and in schools that are perceived as being more challenging environments for teachers due to high levels of special needs students, students from socioeconomically disadvantaged homes, and students whose first language is different to the language of instruction8.
The second section of this chapter provides a profile of the schools in which teachers work. This section looks at the proportion of teachers who work in the government and non-government sectors, the average size of classes and schools (the latter with respect to both student enrolments and number of teachers), school resources (both human and material), levels of school autonomy, and an analysis of school climate factors.
The focus of much of the above analysis concerns Australian teachers, and how their demographic profile compares with other TALIS countries. In order to provide a greater contextual backdrop to these data, we have included a short section at the end of each chapter which presents a summary of more general findings from the International Report with regard to each of the chapter themes. This section is entitled ‘Highlights from the International Report’ and is presented at the end of this chapter.
How TALIS data differ from other data collections
In Australia, there is a large number of surveys and data collection studies that occur at a jurisdictional or national level. For example, the Staff in Australia’s Schools (SiAS) survey of primary and secondary school teachers and school leaders was conducted once every three years in Australia, and there is also a significant number of data collection exercises that are
8 This is generally understood to be English in Australian settings, though this may not always be the case. It is also acknowledged that the LBOTE (language background other than English) category can sometimes be a problematic marker of disadvantage in the Australian context. These issues are discussed further in later sections of this chapter.
11
Teaching and Learning International Survey – Australian Report
conducted by both state/territory and federal educational authorities every year. TALIS is distinct from these studies as, uniquely, it is a survey that places Australia within an international context, and makes possible the comparison of various teacher and school-level characteristics across participating countries. Crucially, the collection of this internationally comparable dataset allows us to both identify with other countries facing similar challenges, and to learn from other policy approaches.
TALIS also differs from other data collections with respect to the teacher population it seeks to represent. This report refers to data collected from lower secondary or ‘ISCED 2’ teachers, which refers specifically to teachers of students in Year 7 through to Year 10. Whilst teachers surveyed in this data collection may also teach students from other year levels, they must teach some lower secondary students in order to be sampled for this particular survey. Where noteworthy and feasible, longitudinal data are also presented in this report. Australian data from this most recent cycle of TALIS are compared to the data collected from the previous, inaugural TALIS cycle in 2008. This is possible because Australia is one of 16 countries and sub-national entities that participated in both cycles of TALIS.
A teacher-centric perspective
As was the case for the previous cycle of TALIS, the predominant focus of this report is lower secondary (or ‘ISCED 2’) teachers and the environments in which they work. Analyses are therefore undertaken from a teacher perspective. For this reason, most tables and figures in this chapter, and throughout the report, are presented as the ‘proportion of teachers who work in schools’ with certain characteristics, rather than the ‘proportion of schools’ with certain characteristics9.
It is also worth reiterating that TALIS data are based on self-reports by teachers and principals and that these data may therefore differ from administrative data provided by national and state governments or educational authorities.
2.1 Demographic profile of Australian teachers
Gender distribution
TALIS data show that in almost all participating countries, including Australia, more than 50 per cent of the lower secondary teaching workforce is female. Across all TALIS countries, an average of 68 per cent of all teachers are women. In Australia, this figure, at 59 per cent, is almost 10 points lower than the TALIS average. This means that whilst almost six out of every ten lower secondary teachers in Australia are women, we are actually on the lower end of the international spectrum with regard to females in the teaching profession. Indeed, Australia’s female teacher demographic is lower than all but three of the 33 TALIS countries, with the most notable exception being Japan (at 39 per cent), as well as Mexico (at 54 per cent) and the Netherlands (55 per cent). Australia’s female teacher composition is roughly equivalent to that of both Spain and Abu Dhabi, with a shared figure of 59 per cent (rounded to the nearest whole percentage).
9 This focus shifts to the school level in Chapter 3, so it is for this reason that analyses in this section are spoken about at a school, rather than teacher, level. The majority of data in Chapter 3 are gleaned from school-level (i.e. principal) questionnaires, and analyses are therefore presented as ‘proportion of schools’ with certain characteristics throughout the Chapter.
12
Teaching and Learning International Survey – Australian Report
Across all TALIS countries, the country with the largest percentage of female teachers is Latvia with 89 per cent, followed by Estonia (with 84 per cent), Slovak Republic (with 82 per cent) and Bulgaria (81 per cent).
With regard to our three comparative groups, the averages for these groups are not dissimilar to the TALIS average of 68 per cent, with the OECD average at 67 per cent, the ‘PISA Best’ average at 65 per cent and the Asian countries average at 61 per cent. It is worth noting here that the Asian countries (Japan, Korea, Malaysia and Singapore) are far from an homogenous group in this respect, with Japan considerably lowering the average figure for the Asian countries. Regardless of this, the Australian figure of 59 per cent is still lower than all comparative group averages.
Table 2.1 shows the gender distribution percentages for all 2013 TALIS countries and provides longitudinal data comparisons for all countries that participated in the 2008 TALIS cycle.

13
Teaching and Learning International Survey – Australian Report
Table 2.1: Gender Distribution of teachers, all countries, 2008 - 2013
Country20081 2013
Change from 2008 to 2013Female Female
% (S.E.) % (S.E.)Australia 59.2 (1.1) 59.2 (1.4) 0%Brazil 73.6 (1.0) 71.1 (0.7) -3%Bulgaria 82.7 (1.0) 81.2 (0.8) -2%Chile 62.8 (1.3) Croatia 74.3 (0.8) Cyprus2,3 70.1 (1.1) Czech Republic 76.5 (0.7) Denmark 58.1 (1.2) 59.6 (1.2) 3%Estonia 83.7 (0.6) 84.5 (0.6) 1%Finland 72.4 (0.7) France 66.0 (0.7) Iceland 69.1 (1.5) 71.9 (1.2) 4%Israel 76.3 (1.4) Italy 77.7 (0.7) 78.5 (0.7) 1%Japan 39.0 (0.8) Korea 64.4 (1.3) 68.2 (1.1) 6%Latvia 88.7 (0.6) Malaysia 66.0 (1.0) 70.5 (1.0) 7%Mexico 53.2 (1.3) 53.8 (1.1) 2%Netherlands 54.6 (1.3) Norway 60.4 (1.1) 61.0 (1.0) 1%Poland 76.3 (0.7) 74.9 (1.0) -2%Portugal 70.7 (0.9) 73.2 (0.8) 4%Romania 69.2 (1.0) Serbia 65.6 (0.7) Singapore 65.0 (0.9) Slovak Republic 81.7 (0.8) 81.9 (0.8) 0%Spain 56.9 (1.0) 58.8 (1.0) 3%Sweden 66.5 (0.8) Sub-national entitiesAbu Dhabi (UAE) 58.9 (1.9) Alberta (Canada) 60.3 (1.3) England (UK) 63.2 (1.1) Flanders (Belgium) 68.9 (1.4) 68.1 (1.4) -1%TALIS Average 68.9 (0.4) 68.1 (0.2) -1%Asian Average 60.7 (0.5)OECD Average 66.6 (0.2)PISA Best Average 65.2 (0.3)United States 64.4 (1.1)
1. Data cells for countries that did not participate in the 2008 cycle of TALIS have been shaded grey.2. Footnote by Turkey: The information in this document with reference to “Cyprus” relates to the southern part of
the Island. There is no single authority representing both Turkish and Greek Cypriot people on the Island. Turkey recognises the Turkish Republic of Northern Cyprus (TRNC). Until a lasting and equitable solution is found within the context of the United Nations, Turkey shall preserve its position concerning the “Cyprus issue”.
3. Footnote by all the European Union Member States of the OECD and the European Union: The Republic of Cyprus is recognised by all members of the United Nations with the exception of Turkey. The information in this document relates to the area under the effective control of the Government of the Republic of Cyprus.
Source: OECD, TALIS 2013 Database
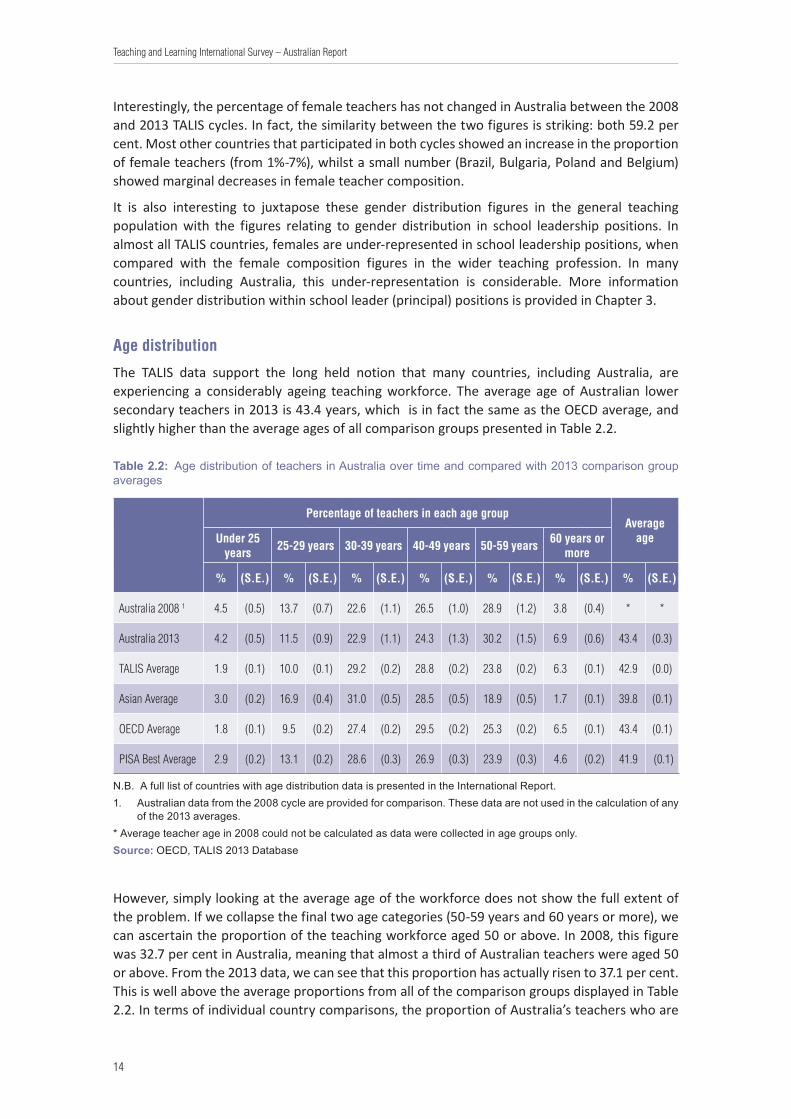
14
Teaching and Learning International Survey – Australian Report
Interestingly, the percentage of female teachers has not changed in Australia between the 2008 and 2013 TALIS cycles. In fact, the similarity between the two figures is striking: both 59.2 per cent. Most other countries that participated in both cycles showed an increase in the proportion of female teachers (from 1%-7%), whilst a small number (Brazil, Bulgaria, Poland and Belgium) showed marginal decreases in female teacher composition.
It is also interesting to juxtapose these gender distribution figures in the general teaching population with the figures relating to gender distribution in school leadership positions. In almost all TALIS countries, females are under-represented in school leadership positions, when compared with the female composition figures in the wider teaching profession. In many countries, including Australia, this under-representation is considerable. More information about gender distribution within school leader (principal) positions is provided in Chapter 3.
Age distribution
The TALIS data support the long held notion that many countries, including Australia, are experiencing a considerably ageing teaching workforce. The average age of Australian lower secondary teachers in 2013 is 43.4 years, which is in fact the same as the OECD average, and slightly higher than the average ages of all comparison groups presented in Table 2.2.
Table 2.2: Age distribution of teachers in Australia over time and compared with 2013 comparison group averages
Percentage of teachers in each age groupAverage
ageUnder 25 years 25-29 years 30-39 years 40-49 years 50-59 years 60 years or
more
% (S.E.) % (S.E.) % (S.E.) % (S.E.) % (S.E.) % (S.E.) % (S.E.)
Australia 2008 1 4.5 (0.5) 13.7 (0.7) 22.6 (1.1) 26.5 (1.0) 28.9 (1.2) 3.8 (0.4) * *
Australia 2013 4.2 (0.5) 11.5 (0.9) 22.9 (1.1) 24.3 (1.3) 30.2 (1.5) 6.9 (0.6) 43.4 (0.3)
TALIS Average 1.9 (0.1) 10.0 (0.1) 29.2 (0.2) 28.8 (0.2) 23.8 (0.2) 6.3 (0.1) 42.9 (0.0)
Asian Average 3.0 (0.2) 16.9 (0.4) 31.0 (0.5) 28.5 (0.5) 18.9 (0.5) 1.7 (0.1) 39.8 (0.1)
OECD Average 1.8 (0.1) 9.5 (0.2) 27.4 (0.2) 29.5 (0.2) 25.3 (0.2) 6.5 (0.1) 43.4 (0.1)
PISA Best Average 2.9 (0.2) 13.1 (0.2) 28.6 (0.3) 26.9 (0.3) 23.9 (0.3) 4.6 (0.2) 41.9 (0.1)
N.B. A full list of countries with age distribution data is presented in the International Report.1. Australian data from the 2008 cycle are provided for comparison. These data are not used in the calculation of any
of the 2013 averages.* Average teacher age in 2008 could not be calculated as data were collected in age groups only.Source: OECD, TALIS 2013 Database
However, simply looking at the average age of the workforce does not show the full extent of the problem. If we collapse the final two age categories (50-59 years and 60 years or more), we can ascertain the proportion of the teaching workforce aged 50 or above. In 2008, this figure was 32.7 per cent in Australia, meaning that almost a third of Australian teachers were aged 50 or above. From the 2013 data, we can see that this proportion has actually risen to 37.1 per cent. This is well above the average proportions from all of the comparison groups displayed in Table 2.2. In terms of individual country comparisons, the proportion of Australia’s teachers who are
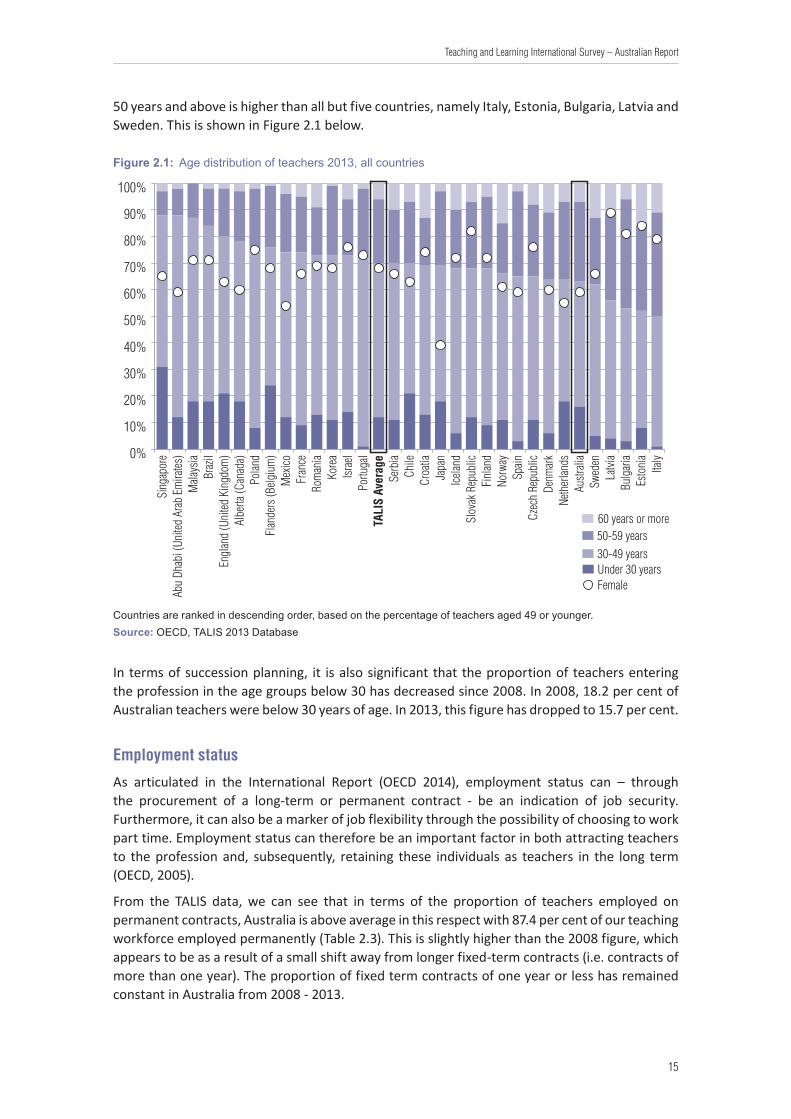
15
Teaching and Learning International Survey – Australian Report
50 years and above is higher than all but five countries, namely Italy, Estonia, Bulgaria, Latvia and Sweden. This is shown in Figure 2.1 below.
Figure 2.1: Age distribution of teachers 2013, all countriesSi
ngap
ore
Abu
Dhab
i (Un
ited
Arab
Em
irates
)M
alays
iaBr
azil
Engl
and
(Uni
ted K
ingd
om)
Albe
rta (C
anad
a)Po
land
Flan
ders
(Belg
ium
)M
exico
Fran
ceRo
man
iaKo
rea
Israe
lPo
rtuga
lTA
LIS
Aver
age
Serb
iaCh
ileCr
oatia
Japa
nIce
land
Slov
ak R
epub
licFi
nlan
dNo
rway
Spain
Czec
h Re
publ
icDe
nmar
kNe
ther
lands
Austr
alia
Swed
enLa
tvia
Bulg
aria
Esto
nia
Italy0%
10%
20%
30%
40%
50%
60%
70%
80%
90%
100%
60 years or more50-59 years30-49 yearsUnder 30 yearsFemale
Countries are ranked in descending order, based on the percentage of teachers aged 49 or younger.Source: OECD, TALIS 2013 Database
In terms of succession planning, it is also significant that the proportion of teachers entering the profession in the age groups below 30 has decreased since 2008. In 2008, 18.2 per cent of Australian teachers were below 30 years of age. In 2013, this figure has dropped to 15.7 per cent.
Employment status
As articulated in the International Report (OECD 2014), employment status can – through the procurement of a long-term or permanent contract - be an indication of job security. Furthermore, it can also be a marker of job flexibility through the possibility of choosing to work part time. Employment status can therefore be an important factor in both attracting teachers to the profession and, subsequently, retaining these individuals as teachers in the long term (OECD, 2005).
From the TALIS data, we can see that in terms of the proportion of teachers employed on permanent contracts, Australia is above average in this respect with 87.4 per cent of our teaching workforce employed permanently (Table 2.3). This is slightly higher than the 2008 figure, which appears to be as a result of a small shift away from longer fixed-term contracts (i.e. contracts of more than one year). The proportion of fixed term contracts of one year or less has remained constant in Australia from 2008 - 2013.
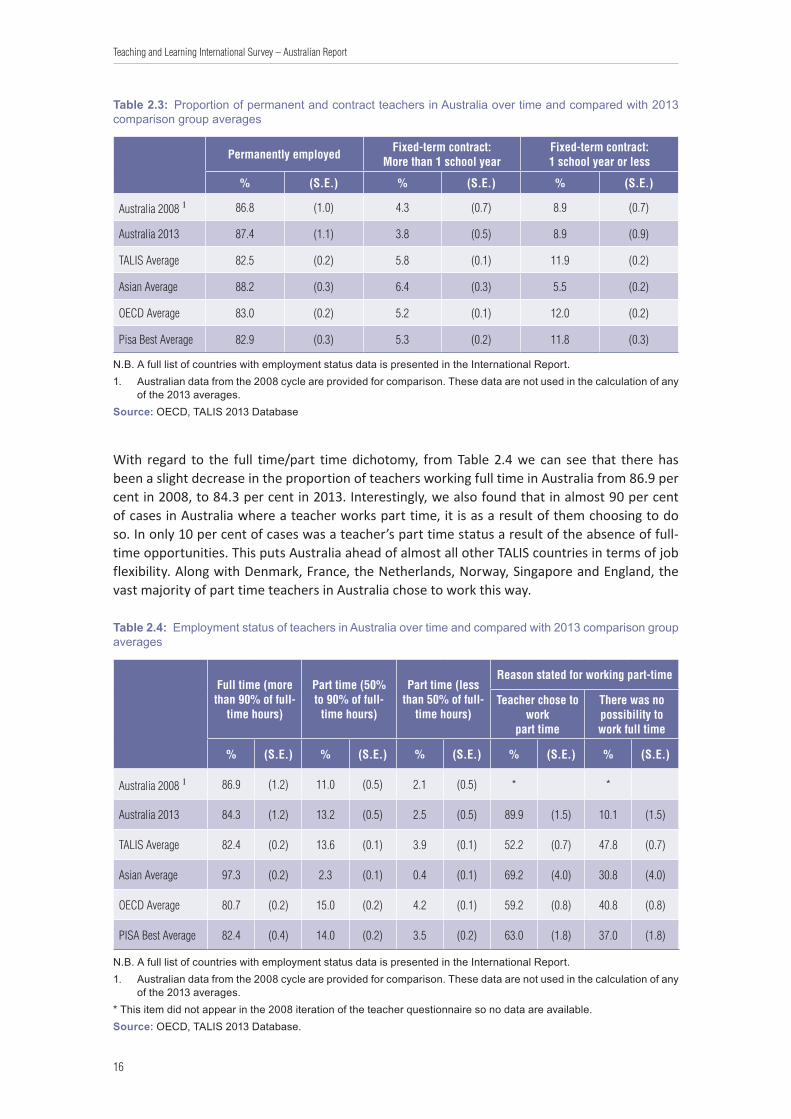
16
Teaching and Learning International Survey – Australian Report
Table 2.3: Proportion of permanent and contract teachers in Australia over time and compared with 2013 comparison group averages
Permanently employed Fixed-term contract:
More than 1 school yearFixed-term contract: 1 school year or less
% (S.E.) % (S.E.) % (S.E.)
Australia 2008 1 86.8 (1.0) 4.3 (0.7) 8.9 (0.7)
Australia 2013 87.4 (1.1) 3.8 (0.5) 8.9 (0.9)
TALIS Average 82.5 (0.2) 5.8 (0.1) 11.9 (0.2)
Asian Average 88.2 (0.3) 6.4 (0.3) 5.5 (0.2)
OECD Average 83.0 (0.2) 5.2 (0.1) 12.0 (0.2)
Pisa Best Average 82.9 (0.3) 5.3 (0.2) 11.8 (0.3)
N.B. A full list of countries with employment status data is presented in the International Report.1. Australian data from the 2008 cycle are provided for comparison. These data are not used in the calculation of any
of the 2013 averages.Source: OECD, TALIS 2013 Database
With regard to the full time/part time dichotomy, from Table 2.4 we can see that there has been a slight decrease in the proportion of teachers working full time in Australia from 86.9 per cent in 2008, to 84.3 per cent in 2013. Interestingly, we also found that in almost 90 per cent of cases in Australia where a teacher works part time, it is as a result of them choosing to do so. In only 10 per cent of cases was a teacher’s part time status a result of the absence of full-time opportunities. This puts Australia ahead of almost all other TALIS countries in terms of job flexibility. Along with Denmark, France, the Netherlands, Norway, Singapore and England, the vast majority of part time teachers in Australia chose to work this way.
Table 2.4: Employment status of teachers in Australia over time and compared with 2013 comparison group averages
Full time (more than 90% of full-
time hours)
Part time (50% to 90% of full-
time hours)
Part time (less than 50% of full-
time hours)
Reason stated for working part-time
Teacher chose to work
part time
There was no possibility to work full time
% (S.E.) % (S.E.) % (S.E.) % (S.E.) % (S.E.)
Australia 2008 1 86.9 (1.2) 11.0 (0.5) 2.1 (0.5) * *
Australia 2013 84.3 (1.2) 13.2 (0.5) 2.5 (0.5) 89.9 (1.5) 10.1 (1.5)
TALIS Average 82.4 (0.2) 13.6 (0.1) 3.9 (0.1) 52.2 (0.7) 47.8 (0.7)
Asian Average 97.3 (0.2) 2.3 (0.1) 0.4 (0.1) 69.2 (4.0) 30.8 (4.0)
OECD Average 80.7 (0.2) 15.0 (0.2) 4.2 (0.1) 59.2 (0.8) 40.8 (0.8)
PISA Best Average 82.4 (0.4) 14.0 (0.2) 3.5 (0.2) 63.0 (1.8) 37.0 (1.8)
N.B. A full list of countries with employment status data is presented in the International Report.1. Australian data from the 2008 cycle are provided for comparison. These data are not used in the calculation of any
of the 2013 averages.* This item did not appear in the 2008 iteration of the teacher questionnaire so no data are available.Source: OECD, TALIS 2013 Database.

17
Teaching and Learning International Survey – Australian Report
Educational attainment and teacher education
Table 2.5 presents a longitudinal and international comparison of the highest level of formal education completed amongst teachers in TALIS countries. The categories are broken down into a series of education levels, or ISCED (International Standard Classification of Education) levels, which allows direct comparisons to be made across countries. ISCED level 5 represents the first level of tertiary education and is split between levels 5A and 5B. In Australia, level 5B represents first stage of tertiary education not leading to an advanced research qualification, including programmes that are generally more practical, technical or occupation specific (e.g. Vocational Training Certificate, TAFE, Trade Certificate). Level 5A10 includes both undergraduate and postgraduate diplomas and degrees (e.g. a DipEd, BEd, GradDipEd, MEd, etc), and ISCED level 6 represents further education at the tertiary level that leads to an advanced research qualification (e.g. a Doctorate).
As Table 2.5 shows, virtually 100 per cent11 of the teaching workforce in Australia hold an ISCED level 5A qualification, or above. Together with Korea and Poland, Australian teachers collectively hold the highest level of tertiary education amongst all TALIS counties. This is considerably above the TALIS, OECD and PISA Best comparative group averages, and is about five percentage points ahead of the Asian countries’ average of 95.1.
The Australian 2013 figures are roughly equivalent to the 2008 figures, with the exception of a slight drop in the proportion of teachers with doctorates (from 2.2 to 0.9 per cent).
Table 2.5: Teachers’ highest level of formal education completed in Australia over time and compared with 2013 comparison group averages
Highest level of formal education completed
Below ISCED level 5 ISCED level 5B ISCED level 5A ISCED level 6
% (S.E.) % (S.E.) % (S.E.) % (S.E.)
Australia 2008 0.3 (0.1) 1.0 (0.3) 96.5 (0.5) 2.2 (0.3)
Australia 2013 0.1 (0.1) 0.0 (0.0) 98.9 (0.2) 0.9 (0.2)
TALIS Average 2.3 (0.1) 7.1 (0.1) 89.5 (0.1) 1.4 (0.0)
Asian Average 0.9 (0.1) 4.0 (0.2) 94.4 (0.3) 0.7 (0.1)
OECD Average 2.5 (0.1) 7.3 (0.1) 88.8 (0.1) 1.7 (0.1)
PISA Best Average 1.7 (0.1) 11.7 (0.1) 85.8 (0.2) 0.9 (0.1)
N.B. A full list of countries with employment status data is presented in the International Report.Australian data from the 2008 cycle are provided for comparison. These data are not used in the calculation of any of the 2013 averages.Source: OECD, TALIS 2013 Database
10 It is worth noting that in the Australian teacher questionnaire, the ISCED level 5A category was further broken down into the sub-categories of 1: Undergraduate diploma, 2: Undergraduate degree, 3: Postgraduate diploma, 4: Postgraduate degree. These categories were then collapsed into ISCED level 5A in order to make international comparisons possible. Because data were collected with this level of granularity, further analysis of diploma/degree education for Australian teachers is possible.
11 99.9 per cent. The 0.1 per cent figure in the ‘Below ISCED 5’ category equates to only three teachers, all in large cities, and who may have selected this category in error.

18
Teaching and Learning International Survey – Australian Report
Generally speaking, teacher formal education usually includes subject-matter training and pedagogical training, as well as opportunities for the development of practical experience (practicum, internship or student teaching in the Australian context). Table 2.6 shows the proportion of teachers who reported that these elements were included in their teacher education for all or some of the subjects they teach.
Australia rates highly with regard to our teachers’ completion of general teacher education or training programmes, with almost 98 per cent of the teaching population reporting that they had undertaken such programmes. This is higher than all comparison group averages and places Australia sixth amongst all TALIS countries, only marginally behind Poland, Singapore, Canada, Belgium and Bulgaria.
However, Australia does not fare as well when it comes to the coverage of the content and pedagogy of the subjects eventually taught by teachers in our schools. Of the 98 per cent of teachers who completed teacher education and training programs, only 62 per cent reported that the content of all the subjects they now teach was included in these programmes, and only 64 per cent reported that the pedogogy of all their subjects was included. This is below all comparison group averages and indicates that quite a high proportion of teachers are teaching subjects for which they may not have been specifically prepared as part of their formal education.
This issue is further explored in the following section ‘Out of field teaching’.
Table 2.6: Completion of teacher education or training program and the elements included in these programmes in Australia over time and compared with 2013 comparison group averages
Completion of teacher education or training programme
Elements included in formal education and training
Content of the subject(s) being taught
Pedagogy of the subject(s) being taught
Practice in the subject(s) being taught
For all subjects
For some subjects
For all subjects
For some subjects
For all subjects
For some subjects
% (S.E.) % (S.E.) % (S.E.) % (S.E.) % (S.E.) % (S.E.) % (S.E.)
Australia 2013 97.6 (0.3) 62.2 (1.1) 31.1 (1.2) 64.0 (1.2) 31.1 (1.0) 70.1 (1.2) 26.8 (1.3)
TALIS Average 89.8 (0.1) 72.5 (0.2) 22.6 (0.2) 69.6 (0.2) 22.7 (0.2) 67.1 (0.2) 22.0 (0.2)
Asian Average 93.8 (0.3) 79.1 (0.4) 19.2 (0.4) 77.2 (0.4) 20.3 (0.4) 76.5 (0.4) 20.1 (0.4)
OECD Average 90.1 (0.1) 69.6 (0.2) 25.3 (0.2) 67.0 (0.2) 25.1 (0.2) 63.9 (0.2) 24.3 (0.2)
PISA Best Average 95.3 (0.2) 77.2 (0.3) 19.3 (0.3) 77.5 (0.3) 19.1 (0.3) 74.3 (0.3) 19.8 (0.3)
N.B. A full list of countries with employment status data is presented in the International Report.Source: OECD, TALIS 2013 Database.
19
Teaching and Learning International Survey – Australian Report
Out of field teaching
In many countries and education systems around the world, teachers may be allocated to subjects for which they have not been adequately prepared in an attempt to overcome qualified teacher shortages in particular subject areas. The issue of out of field teaching is one which is experienced by many TALIS countries, and Australia is no exception.
As shown in Table 2.7, 37.6 per cent of Australian teachers currently teach in the domain of Reading, Writing and Literature (usually referred to collectively as ‘English’ in Australian lower secondary education). Of this number, 7.2 per cent have received no formal education or training in this subject. Rather worryingly, this is higher than all comparative group averages for this subject area. Furthermore, the figure for teachers of foreign languages is higher still, with 8.7 per cent of teachers not having received any formal qualification or training in this subject area. Figures for out of field teaching with regard to teachers of mathematics and science are lower at 5.3 per cent and 5.6 per cent respectively.
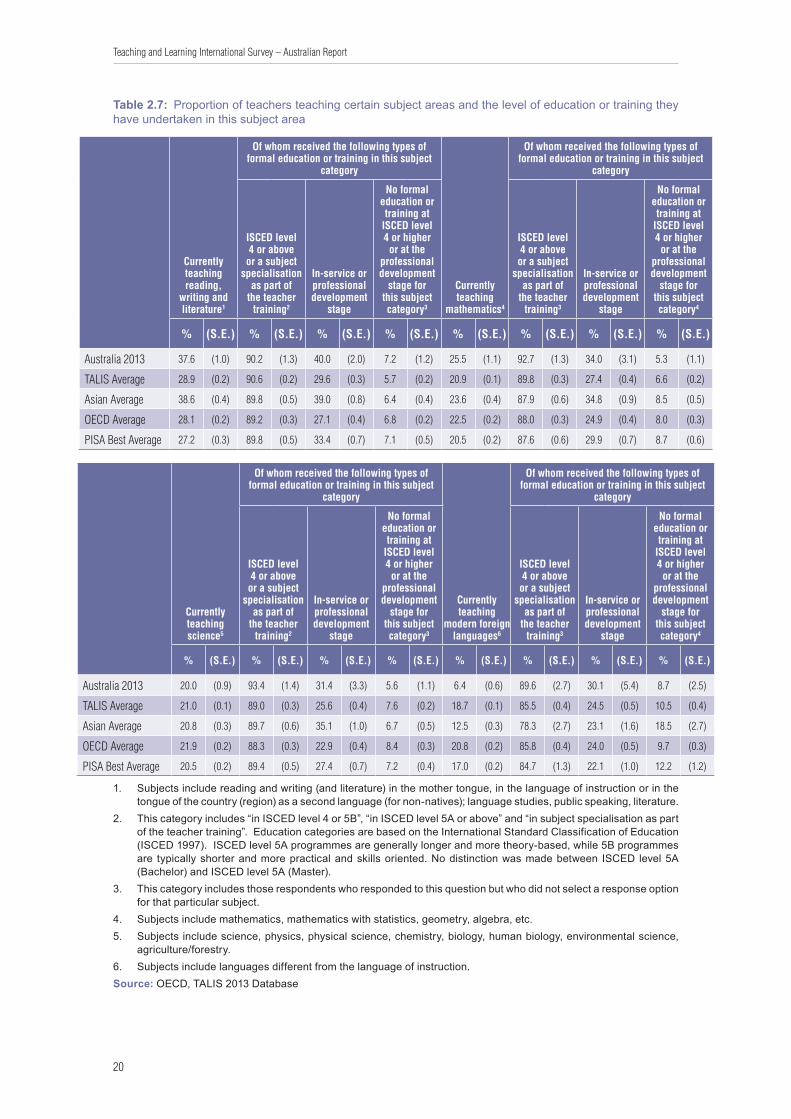
20
Teaching and Learning International Survey – Australian Report
Table 2.7: Proportion of teachers teaching certain subject areas and the level of education or training they have undertaken in this subject area
Currently teaching reading,
writing and literature1
Of whom received the following types of formal education or training in this subject
category
Currently teaching
mathematics4
Of whom received the following types of formal education or training in this subject
category
ISCED level 4 or above or a subject
specialisation as part of
the teacher training2
In-service or professional development
stage
No formal education or training at
ISCED level 4 or higher
or at the professional development
stage for this subject category3
ISCED level 4 or above or a subject
specialisation as part of
the teacher training3
In-service or professional development
stage
No formal education or training at
ISCED level 4 or higher
or at the professional development
stage for this subject category4
% (S.E.) % (S.E.) % (S.E.) % (S.E.) % (S.E.) % (S.E.) % (S.E.) % (S.E.)
Australia 2013 37.6 (1.0) 90.2 (1.3) 40.0 (2.0) 7.2 (1.2) 25.5 (1.1) 92.7 (1.3) 34.0 (3.1) 5.3 (1.1)
TALIS Average 28.9 (0.2) 90.6 (0.2) 29.6 (0.3) 5.7 (0.2) 20.9 (0.1) 89.8 (0.3) 27.4 (0.4) 6.6 (0.2)
Asian Average 38.6 (0.4) 89.8 (0.5) 39.0 (0.8) 6.4 (0.4) 23.6 (0.4) 87.9 (0.6) 34.8 (0.9) 8.5 (0.5)
OECD Average 28.1 (0.2) 89.2 (0.3) 27.1 (0.4) 6.8 (0.2) 22.5 (0.2) 88.0 (0.3) 24.9 (0.4) 8.0 (0.3)
PISA Best Average 27.2 (0.3) 89.8 (0.5) 33.4 (0.7) 7.1 (0.5) 20.5 (0.2) 87.6 (0.6) 29.9 (0.7) 8.7 (0.6)
Currently teaching science5
Of whom received the following types of formal education or training in this subject
category
Currently teaching
modern foreign languages6
Of whom received the following types of formal education or training in this subject
category
ISCED level 4 or above or a subject
specialisation as part of
the teacher training2
In-service or professional development
stage
No formal education or training at
ISCED level 4 or higher
or at the professional development
stage for this subject category3
ISCED level 4 or above or a subject
specialisation as part of
the teacher training3
In-service or professional development
stage
No formal education or training at
ISCED level 4 or higher
or at the professional development
stage for this subject category4
% (S.E.) % (S.E.) % (S.E.) % (S.E.) % (S.E.) % (S.E.) % (S.E.) % (S.E.)
Australia 2013 20.0 (0.9) 93.4 (1.4) 31.4 (3.3) 5.6 (1.1) 6.4 (0.6) 89.6 (2.7) 30.1 (5.4) 8.7 (2.5)
TALIS Average 21.0 (0.1) 89.0 (0.3) 25.6 (0.4) 7.6 (0.2) 18.7 (0.1) 85.5 (0.4) 24.5 (0.5) 10.5 (0.4)
Asian Average 20.8 (0.3) 89.7 (0.6) 35.1 (1.0) 6.7 (0.5) 12.5 (0.3) 78.3 (2.7) 23.1 (1.6) 18.5 (2.7)
OECD Average 21.9 (0.2) 88.3 (0.3) 22.9 (0.4) 8.4 (0.3) 20.8 (0.2) 85.8 (0.4) 24.0 (0.5) 9.7 (0.3)
PISA Best Average 20.5 (0.2) 89.4 (0.5) 27.4 (0.7) 7.2 (0.4) 17.0 (0.2) 84.7 (1.3) 22.1 (1.0) 12.2 (1.2)
1. Subjects include reading and writing (and literature) in the mother tongue, in the language of instruction or in the tongue of the country (region) as a second language (for non-natives); language studies, public speaking, literature.
2. This category includes “in ISCED level 4 or 5B”, “in ISCED level 5A or above” and “in subject specialisation as part of the teacher training”. Education categories are based on the International Standard Classification of Education (ISCED 1997). ISCED level 5A programmes are generally longer and more theory-based, while 5B programmes are typically shorter and more practical and skills oriented. No distinction was made between ISCED level 5A (Bachelor) and ISCED level 5A (Master).
3. This category includes those respondents who responded to this question but who did not select a response option for that particular subject.
4. Subjects include mathematics, mathematics with statistics, geometry, algebra, etc.5. Subjects include science, physics, physical science, chemistry, biology, human biology, environmental science,
agriculture/forestry.6. Subjects include languages different from the language of instruction.Source: OECD, TALIS 2013 Database
21
Teaching and Learning International Survey – Australian Report
Teacher preparedness
Teachers were asked to what extent they felt prepared for teaching with respect to the content, pedagogy and practice of the subject/s they teach. They could choose from a discrete list of four categories: not at all prepared, somewhat prepared, well prepared, or very well prepared.
TALIS data show that the majority of Australian teachers feel “prepared” or “well prepared” with respect to subject content (92.6 per cent), subject pedagogy (90.6 per cent) and subject practice (91.3 per cent). Whilst these numbers undoubtedly represent a large majority of Australian teachers, it also means that almost 10 per cent of teachers feel ill-prepared for these elements. Based on the proportion of teachers who reported feeling ‘not at all prepared’ or ‘somewhat prepared’, an ordered list of teacher preparedness in all TALIS countries (Figure 2.2) was created. In Figure 2.2, countries are ranked in ascending order based on the percentage of teachers who feel ‘not at all prepared’ or ‘somewhat prepared’ for the content of the subject/s they teach. Australia is towards the bottom of this figure, and below the TALIS average, which means that a comparatively high percentage of Australian teachers feel underprepared with regard to the subject/s they teach.
Importantly, less than one per cent of teachers checked the ‘not at all prepared’ category in terms of either content or pedagogy in Australia, meaning that the majority of respondents in the collapsed ‘underprepared’ category at least reported a small level of preparedness. Seven per cent of Australian teachers reported feeling ‘somewhat prepared’ in terms of content, whereas 8.6 per cent reported feeling ‘somewhat prepared’ in terms of pedagogy.
These data show that it is not just a teacher’s formal education that contributes to feeling better prepared for their work as a teacher. Crucially, it is also the specific elements included in their training (such as subject content, pedagogical training and classroom practice) which can make a significant difference to feelings of preparedness. As one would expect, the upward trend of feeling prepared is even stronger if teachers received this formal training for all of the subjects they teach (as opposed to only some of the subjects they teach).

22
Teaching and Learning International Survey – Australian Report
Figure 2.2: Teachers’ feelings of preparedness with regard to pedagogy and content of subject being taught
Finland
Japan
Mexico
Iceland
Korea
Singapore
Alberta (Canada)
France
Bulgaria
Australia
Denmark
Norway
Netherlands
England (United Kingdom)
Average
Flanders (Belgium)
Italy
Chile
Sweden
Abu Dhabi (United Arab Emirates)
Estonia
Portugal
Croatia
Poland
Brazil
Czech Republic
Latvia
Serbia
Spain
Slovak Republic
Israel
Malaysia
Romania
20 0 20 40 60 80 100406080100
Very well preparedWell preparedSomewhat preparedNot at all prepared Included in formal education and training for all subjects being taught
Content of the subject(s) being taught Pedagogy of the subject(s) being taught
Source: OECD, TALIS 2013 Database
23
Teaching and Learning International Survey – Australian Report
2.3 Distribution of teachers in Australian schoolsAs outlined in the International Report (OECD 2014), it is important to consider the distribution of teachers across educational systems:
Across countries, schools vary in terms of their location (rural vs. urban), the kinds of challenging circumstances they face and the particular subject areas for which they need teachers. Many countries are considering issues of teacher distribution as they try to find the right teachers to fill the needs in different areas of the system (Schleicher, 2012). Teacher distribution also becomes relevant in conversations about creating equity across an education system. A number of studies have found that teachers with weaker qualifications are more likely to teach in disadvantaged schools, which could lead to potential discrepancies in educational opportunities for the student population of these schools (Jackson, 2009; Bonesronning, Falch and Strom, 2005; Boyd et al., 2008; Lankford, Loeb and Wyckoff, 2002).
OECD 2014
Analyses from the International Report examine the relationship between teachers’ formal education (measured by the highest ISCED level of educational attainment), and their distribution in challenging or disadvantaged schools.
This type of analysis provides us with few useful insights in the Australian context because, as we have previously shown, effectively 100 per cent of the teaching workforce in this country have ISCED level 5A qualifications (i.e. a tertiary-level diploma or degree) or above. All teachers in Australia have an ISCED level 5A qualification as their minimum level of educational attainment regardless of what type of school they work in, thereby making any analysis of their distribution across school types somewhat redundant.
However, some interesting results become apparent in examining the relationship between Australian teachers’ years of teaching experience and their distribution in more and less challenging schools.
Teachers’ level of experience and the likelihood of working in a ‘more challenging’ school
The International Report frequently discusses the concept of a ‘more challenging school’ as a quasi-indicator of disadvantage, and uses this concept in analyses of teacher distribution throughout education systems across all TALIS countries. It is important to define exactly what this term means and how a ‘more challenging school’ is identified for the purposes of these analyses.
In TALIS analyses, three school-derived categories of disadvantage were analysed independently from one another. These were:
1. Schools with more than 30 per cent of their students coming from socioeconomically disadvantaged homes
In the TALIS questionnaires, the concept of ‘socioeconomically disadvantaged homes’ was universally defined for all respondents as referring to homes ‘lacking the basic necessities or advantages of life, such as adequate housing, nutrition or medical care. They are those that receive or are eligible to receive subsidies or other welfare benefits. The type of benefits accorded to disadvantaged homes may vary among the countries. The

24
Teaching and Learning International Survey – Australian Report
disadvantaged homes may in some countries correspond to those that are eligible for free school meals, in others to those that get housing allowance, or other social assistance.’
2. Schools with more than 10 per cent of their students being special needs students
It is acknowledged that what constitutes a ‘special needs student’ is neither well nor consistently defined internationally. For the purposes of TALIS, respondents were instructed to define a special needs student as one ‘for whom a special learning need has been formally identified because they are mentally, physically or emotionally disadvantaged. Often, special-needs students will be those for whom additional public or private resources (personnel, material or financial) have been provided to support their education.’ It was also outlined for respondents that ‘gifted students are not considered to have special needs under the definition used here and in other OECD work. Some teachers perceive all students as unique learners and thus having some special learning needs. For the purpose of this survey, it is important to assure a more objective judgment of who is a special-need student and who is not. That is why a formal identification is stressed in this instance’.
3. Schools with more than 10 per cent of students whose first language is different from the language of instruction12
This category may be somewhat more problematic in an Australian setting than the previous two. Having a large number of students with a first language other than English is not necessarily a marker of disadvantage in the Australian setting, although there may be a high level of correlation is some cases. Due to Australia’s multicultural and multi-ethnic composition, those whose first language is one other than English comprise a rather diverse group of people, and therefore such a concept really covers quite a broad range of students. In the Australian context, it may well be more useful to increase specificity in this area, and instead look at the figures relating to, for instance, newly arrived migrants with a language background other than English. This level of specificity did not form part of the TALIS definition, but may be a useful addition to future iterations of the Australian TALIS questionnaires in particular.
Classification into one or more of these three categories was based on principals’ estimates of the broad percentage in their schools of students belonging to each of these three categories.
Figure 2.3, Figure 2.4 and Figure 2.5 below present the series of analyses conducted with regard to the international data collected on the relationship between teacher experience and teacher distribution in more challenging schools. These figures present two sets of useful information.
Firstly, the percentage of teachers working in schools meeting the criteria of ‘more challenging school’ with respect to each of the three criteria outlined above is presented. Countries with higher percentages in this field than Australia are highlighted in red.
Secondly, the difference in the proportion of teachers with more than five years teaching experience who work in more challenging schools and those who do not is shown for all TALIS countries. A positive figure (i.e greater than 0) signifies that a higher proportion of more experienced teachers work in more challenging schools in that country. A negative figure signifies
12 In the Australian context, the language of instruction is generally assumed to be English, though it is important to note that this is not always the case. A small number of schools in Australia offer tuition in languages other than English. For the purposes of this report and for the sake of simplicity, we refer to English as the language of instruction. We caveat this generality with a reminder that a very small number of respondents may not have been referring to English when they answered questions concerning the language of instruction.
25
Teaching and Learning International Survey – Australian Report
that a lower proportion of more experienced teachers work in these schools (or, conversely, that a higher proportion of less experienced teachers work in these schools). The list of countries in all figures is presented in descending order of difference in teaching experience, meaning that countries appearing at the top of the figure (Brazil in Figure 2.3, for instance) demonstrate a higher proportion of more experienced teachers in challenging schools that other countries.
It can be seen in Figure 2.3 that 26 per cent of Australian teachers work in schools in which more than 30 per cent of their students are from socioeconomically disadvantaged homes. This figure is above the TALIS average of 20 per cent and places Australia ninth overall in terms of our proportion of teachers working in these types of schools. By comparison, Japan, Croatia, Serbia and Korea have the smallest proportions, with less than 10 per cent of their teachers working in these types of schools. On the other end of the spectrum, both Chile and Malaysia have more than half of their teaching workforce in schools where more than 30 per cent of students are from disadvantaged homes.
We can also see that, in Australia, teachers working in these types of schools are more likely to have less teaching experience than their colleagues in less challenging schools, as is the case with the majority of TALIS countries.
In examining Figure 2.4, it is evident that 24 per cent of Australian teachers work in schools deemed to be ‘more challenging’ due to the relatively high percentage (i.e. more than 10 per cent) of special needs students. Again, these teachers are more likely to have less teaching experience than teachers in less challenging schools, but the difference in this instance is only marginal.
Figure 2.5 shows that 33 per cent of Australian teachers work in schools where more than 10 per cent of students whose first language is different from the language of instruction. Compared to other TALIS countries, this is a fairly high percentage, with only Singapore, Malaysia, Abu Dhabi, Sweden and Alberta having a higher percentage of teachers in this category. Again we see that, like most other countries, Australian teachers in these schools are more likely to be less experienced that teachers in less challenging schools, but again, this difference is minimal.
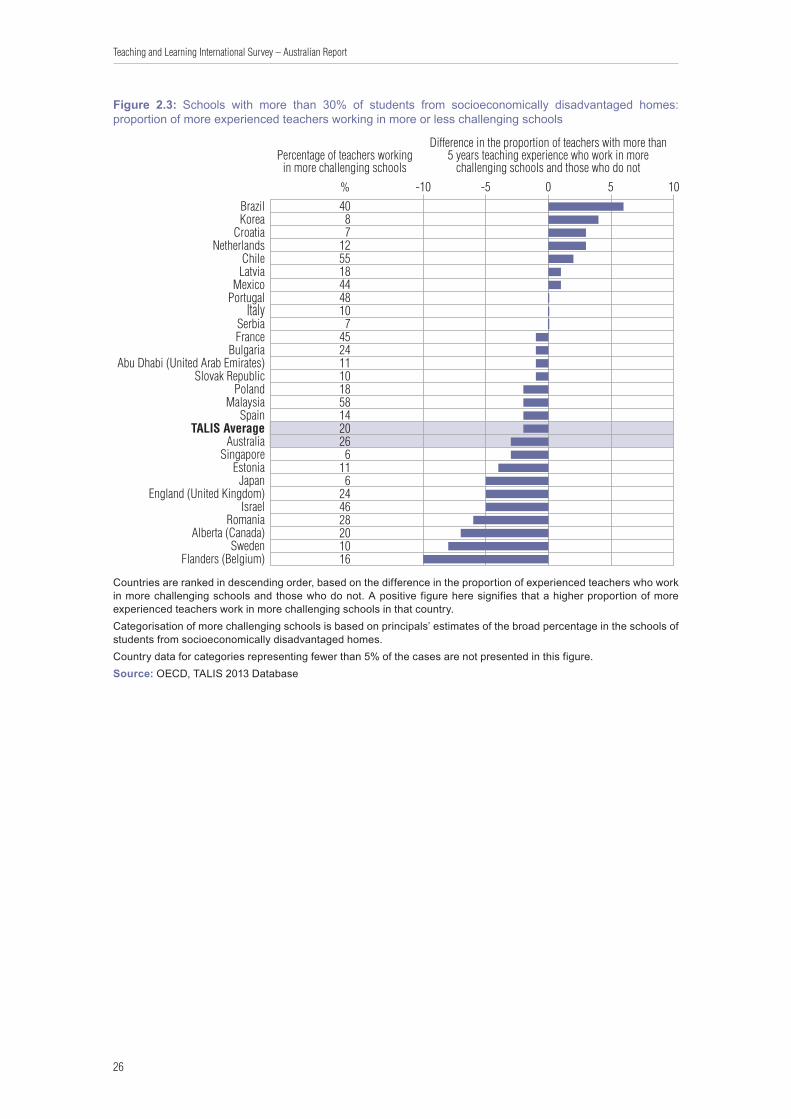
26
Teaching and Learning International Survey – Australian Report
Figure 2.3: Schools with more than 30% of students from socioeconomically disadvantaged homes: proportion of more experienced teachers working in more or less challenging schools
%
Source: OECD, TALIS 2013 Database, Table 2.11.
Percentage of teachers workingin more challenging schools
Difference in the proportion of teachers with more than5 years teaching experience who work in more
challenging schools and those who do not
4087
1255184448107
4524111018581420266
116
244628201016
-10 -5 0 5 10
Flanders (Belgium)Sweden
Alberta (Canada)Romania
IsraelEngland (United Kingdom)
JapanEstonia
SingaporeAustralia
TALIS AverageSpain
MalaysiaPoland
Slovak RepublicAbu Dhabi (United Arab Emirates)
BulgariaFranceSerbia
ItalyPortugalMexico
LatviaChile
NetherlandsCroatia
KoreaBrazil
Countries are ranked in descending order, based on the difference in the proportion of experienced teachers who work in more challenging schools and those who do not. A positive figure here signifies that a higher proportion of more experienced teachers work in more challenging schools in that country.Categorisation of more challenging schools is based on principals’ estimates of the broad percentage in the schools of students from socioeconomically disadvantaged homes.Country data for categories representing fewer than 5% of the cases are not presented in this figure.Source: OECD, TALIS 2013 Database
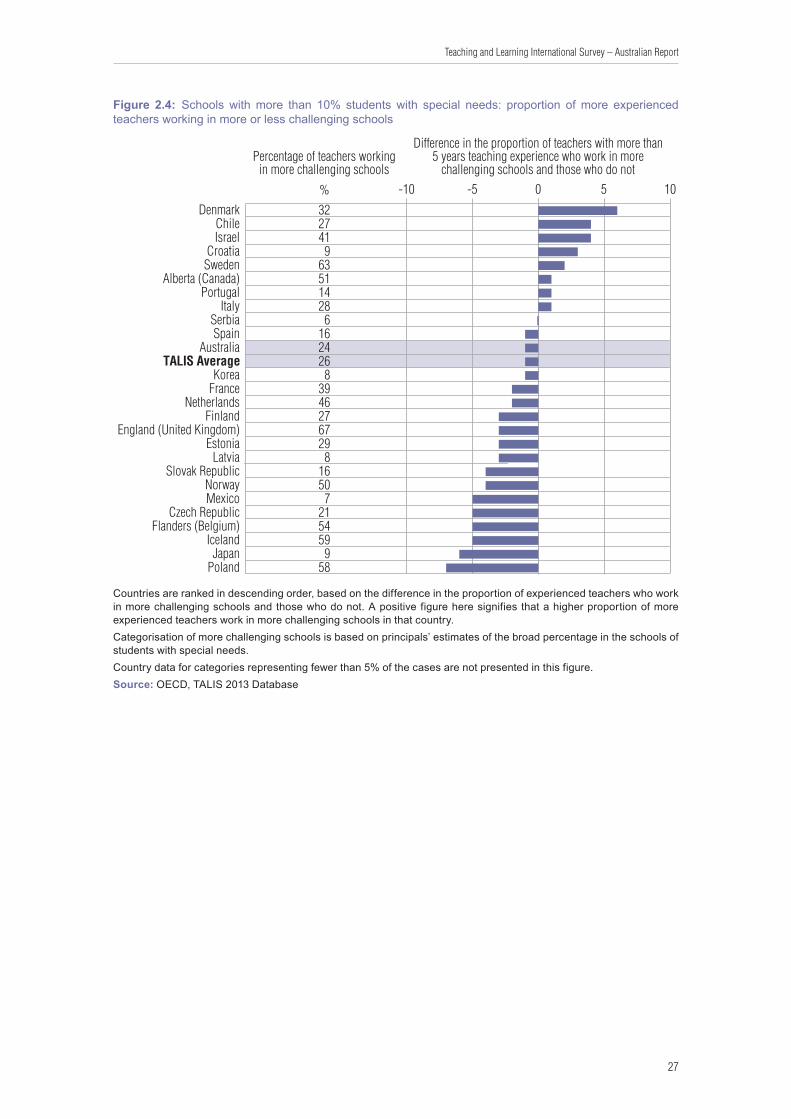
27
Teaching and Learning International Survey – Australian Report
Figure 2.4: Schools with more than 10% students with special needs: proportion of more experienced teachers working in more or less challenging schools
-10 -5 0 5 10
PolandJapan
IcelandFlanders (Belgium)
Czech RepublicMexicoNorway
Slovak RepublicLatvia
EstoniaEngland (United Kingdom)
FinlandNetherlands
FranceKorea
TALIS AverageAustralia
SpainSerbia
ItalyPortugal
Alberta (Canada)SwedenCroatia
IsraelChile
Denmark%
Percentage of teachers workingin more challenging schools
Difference in the proportion of teachers with more than5 years teaching experience who work in more
challenging schools and those who do not
3227419
635114286
1624268
39462767298
16507
2154599
58
Countries are ranked in descending order, based on the difference in the proportion of experienced teachers who work in more challenging schools and those who do not. A positive figure here signifies that a higher proportion of more experienced teachers work in more challenging schools in that country.Categorisation of more challenging schools is based on principals’ estimates of the broad percentage in the schools of students with special needs.Country data for categories representing fewer than 5% of the cases are not presented in this figure.Source: OECD, TALIS 2013 Database

28
Teaching and Learning International Survey – Australian Report
Figure 2.5: Schools with more than 10% students whose first language is different from the language of instruction: proportion of more experienced teachers working in more or less challenging schools
-15 -10 -5 0 5 10
Abu Dhabi (United Arab Emirates)England (United Kingdom)
Flanders (Belgium)MalaysiaRomania
CroatiaSingapore
SerbiaNorwayIceland
TALIS AverageSwedenFinlandFrance
NetherlandsItaly
AustraliaLatvia
EstoniaIsrael
Slovak RepublicSpain
BulgariaAlberta (Canada)
Denmark
%
Percentage of teachers workingin more challenging schools
Difference in the proportion of teachers with more than5 years teaching experience who work in more
challenging schools and those who do not
264133301025102133321418
942212122
989
61055272844
Countries are ranked in descending order, based on the difference in the proportion of experienced teachers who work in more challenging schools and those who do not. A positive figure here signifies that a higher proportion of more experienced teachers work in more challenging schools in that country.Categorisation of more challenging schools is based on principals’ estimates of the broad percentage in the schools of students whose first language is different from the language of instruction.Country data for categories representing fewer than 5% of the cases are not presented in this figure.Source: OECD, TALIS 2013 Database
Teachers’ level of experience and the likelihood of working in a rural school
The analyses presented in the International Report show that in most countries, teaching experience is related to the likelihood of teaching in more populated areas, and this is particularly true for Australia.
As we can see from Table 2.8, 10.5 per cent of Australian teachers work in schools that are located in towns with fewer than 15 000 people13. Of this number, more than 26 per cent of teachers have less than five years teaching experience. This figure is ten percentage points higher than that for both small cities (16.1 per cent) and large cities (18.1 per cent), meaning that teachers in rural schools have a higher proportion of less experienced teachers than other, more urban schools.
13 From our complete dataset, we know that this figure comprises 0.9 per cent who work in schools located in communities with 1,000 people or fewer; 2.3 per cent who work in schools located in communities with between 1,001 and 3,000 people; and the remainder (7.3 per cent) work in schools in towns with between 3,001 and 15 000 people.
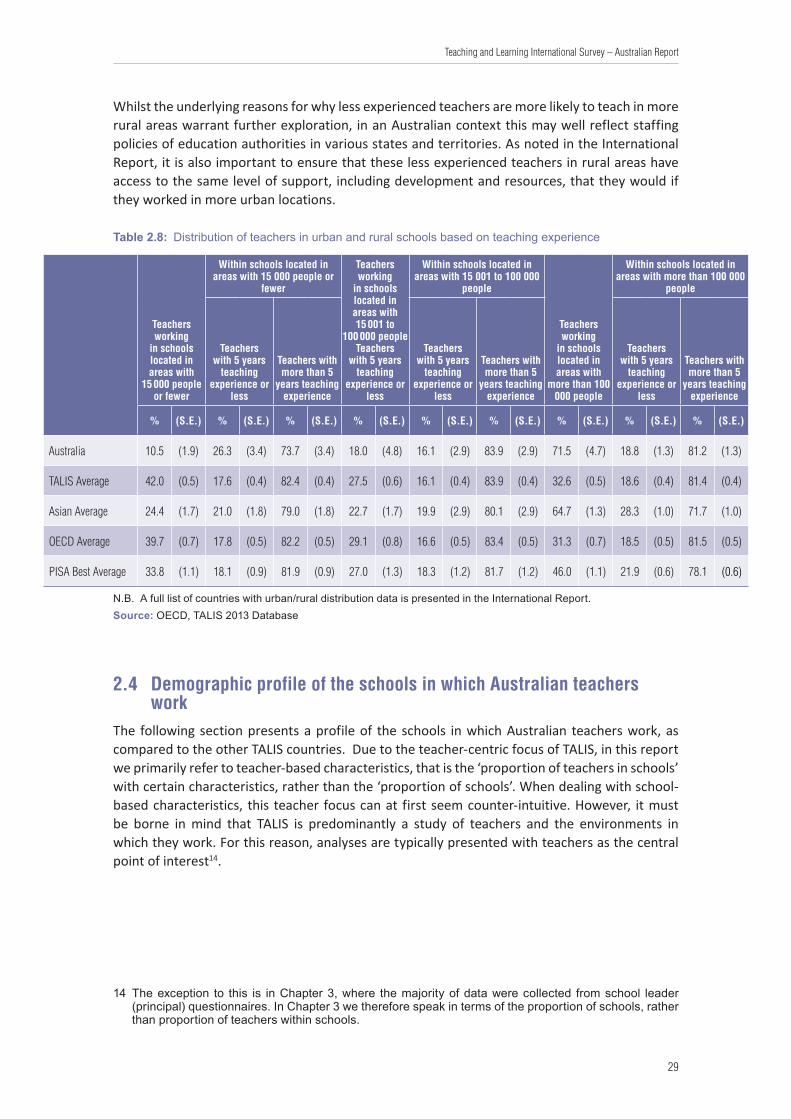
29
Teaching and Learning International Survey – Australian Report
Whilst the underlying reasons for why less experienced teachers are more likely to teach in more rural areas warrant further exploration, in an Australian context this may well reflect staffing policies of education authorities in various states and territories. As noted in the International Report, it is also important to ensure that these less experienced teachers in rural areas have access to the same level of support, including development and resources, that they would if they worked in more urban locations.
Table 2.8: Distribution of teachers in urban and rural schools based on teaching experience
Teachers working
in schools located in areas with
15 000 people or fewer
Within schools located in areas with 15 000 people or
fewer
Teachers working
in schools located in areas with 15 001 to
100 000 peopleTeachers
with 5 years teaching
experience or less
Within schools located in areas with 15 001 to 100 000
people
Teachers working
in schools located in areas with
more than 100 000 people
Within schools located in areas with more than 100 000
people
Teachers with 5 years
teaching experience or
less
Teachers with more than 5
years teaching experience
Teachers with 5 years
teaching experience or
less
Teachers with more than 5
years teaching experience
Teachers with 5 years
teaching experience or
less
Teachers with more than 5
years teaching experience
% (S.E.) % (S.E.) % (S.E.) % (S.E.) % (S.E.) % (S.E.) % (S.E.) % (S.E.) % (S.E.)
Australia 10.5 (1.9) 26.3 (3.4) 73.7 (3.4) 18.0 (4.8) 16.1 (2.9) 83.9 (2.9) 71.5 (4.7) 18.8 (1.3) 81.2 (1.3)
TALIS Average 42.0 (0.5) 17.6 (0.4) 82.4 (0.4) 27.5 (0.6) 16.1 (0.4) 83.9 (0.4) 32.6 (0.5) 18.6 (0.4) 81.4 (0.4)
Asian Average 24.4 (1.7) 21.0 (1.8) 79.0 (1.8) 22.7 (1.7) 19.9 (2.9) 80.1 (2.9) 64.7 (1.3) 28.3 (1.0) 71.7 (1.0)
OECD Average 39.7 (0.7) 17.8 (0.5) 82.2 (0.5) 29.1 (0.8) 16.6 (0.5) 83.4 (0.5) 31.3 (0.7) 18.5 (0.5) 81.5 (0.5)
PISA Best Average 33.8 (1.1) 18.1 (0.9) 81.9 (0.9) 27.0 (1.3) 18.3 (1.2) 81.7 (1.2) 46.0 (1.1) 21.9 (0.6) 78.1 (0.6)
N.B. A full list of countries with urban/rural distribution data is presented in the International Report.Source: OECD, TALIS 2013 Database
2.4 Demographic profile of the schools in which Australian teachers work
The following section presents a profile of the schools in which Australian teachers work, as compared to the other TALIS countries. Due to the teacher-centric focus of TALIS, in this report we primarily refer to teacher-based characteristics, that is the ‘proportion of teachers in schools’ with certain characteristics, rather than the ‘proportion of schools’. When dealing with school-based characteristics, this teacher focus can at first seem counter-intuitive. However, it must be borne in mind that TALIS is predominantly a study of teachers and the environments in which they work. For this reason, analyses are typically presented with teachers as the central point of interest14.
14 The exception to this is in Chapter 3, where the majority of data were collected from school leader (principal) questionnaires. In Chapter 3 we therefore speak in terms of the proportion of schools, rather than proportion of teachers within schools.

30
Teaching and Learning International Survey – Australian Report
School type (public/private)
Table 2.9 presents a breakdown of the proportion of teachers in Australia and the comparison groups who work at publicly or privately managed schools (or government and non-government schools in Australian nomenclature). It is of course the case that the non-government sector in the Australian school system is further broken down into the Catholic and Independent sectors but in order to make international comparison with other TALIS countries possible, the Catholic and Independent sector categories were collapsed to form one non-government or ‘private’ school category15.
As we can see from Table 2.9, the percentage of lower secondary teachers working in private schools in Australia is 48.1 per cent and is well above the averages for all comparison groups. This does not reflect the split of the general teaching workforce in Australia16 as the population of interest is only lower secondary, as opposed to primary and/or upper secondary. Across all TALIS countries, Australia places sixth highest in terms of the proportion of teachers in the private sector, behind the Netherlands (77.9 per cent), Flanders-Belgium (73.5 per cent), Chile (60.3 per cent) Abu Dhabi-UAE (55.2 per cent) and England (48.6 per cent).
Interestingly, Australia also has one of the highest figures with regard to school-level competition for students. Over 90 per cent of teachers work in schools whose principals reported that their school competed with two or more other schools for at least some of their students. This is well above all comparison group averages, and places Australia third overall, behind only Singapore (98.4) and England (92.4).
Table 2.9: School type and competition: proportion of teachers whose principal reported their school as being public or private and competing with other schools
Public schools1 Private schools2
Schools that compete with two or more
other schools for at least some of their students
Schools that compete with
one other school for at least some of their students
Schools that do not compete with other
schools for their students
% (S.E.) % (S.E.) % (S.E.) % (S.E.) % (S.E.)
Australia 2013 51.9 (3.6) 48.1 (3.6) 91.3 (1.9) 4.4 (1.5) 4.3 (1.2)
TALIS Average 81.8 (0.3) 19.4 (0.4) 63.1 (0.6) 14.3 (0.5) 22.7 (0.5)
Asian Average 92.8 (0.3) 7.2 (0.3) 62.6 (1.6) 6.6 (1.1) 30.8 (1.5)
OECD Average 78.1 (0.5) 21.9 (0.5) 63.4 (0.8) 14.4 (0.6) 22.2 (0.6)
PISA Best Average 77.8 (0.7) 22.2 (0.7) 63.9 (1.2) 13.5 (1.0) 22.5 (1.0)
1. Refers to the percentage of lower secondary education teachers who work in schools where principals reported that their school was publicly managed.
2. Refers to the percentage of lower secondary education teachers who work in schools where principals reported that their school was privately managed.
3. The averages do not add up to 100 across categories because of the presence of cells that are not applicable in some countries.
Source: OECD, TALIS 2013 Database
15 However, this level of sectoral granularity was actually collected in the Australian questionnaires so further analysis at this tri-sector level is possible when looking at the Australian data in isolation.
16 ABS data suggest that 64% of all FTE teaching staff are in Government schools, whilst 58% of all secondary FTE teaching staff are in Government schools.

31
Teaching and Learning International Survey – Australian Report
School and class size
Australia is on the upper end of the spectrum with regard to school size, having an average of 814 students per school with teachers of lower secondary students (Table 2.10). Across all TALIS countries, Australia places seventh in terms of school size, after Singapore (1,251), Portugal (1,153) Malaysia (1,151), England (890), Abu Dhabi-UAE (888) and the Netherlands (870). It is, however, important to note that Australia also has one of the largest standard errors for this statistic, at 51.5. This means that there is a substantial amount of variation in enrolment numbers across schools, and that many Australian schools would have a considerably higher or lower number of enrolled students17.
Looking at the averages of the comparison groups, all fall within the low- to mid-500 bracket, except for the Asian group, at a much larger 831 students per school. Again, the Asian countries that comprise this comparison group are not homogenous in this respect and the average figure has been inflated by the very large numbers in Malaysia and Singapore. In comparison, Korea and Japan have far fewer students in their schools, with an average of 567 and 357 students respectively.
17 It is important to reiterate that these figures reflect characteristics of only those schools which employ teachers of lower secondary students. Data from ABS Schools Australia would show that, on average, primary schools have fewer students and teachers per school but higher student:teacher ratios than secondary schools.

32
Teaching and Learning International Survey – Australian Report
Table 2.10: School and class sizes, and ratios of teachers to students and other personnel, for all TALIS countries
Number of students in
schools1
Number of teachers in
schools1
Ratio of students to number of teachers2
Ratio of teachers to number of
personnel for pedagogical
support
Ratio of teachers to number of school
administrative or management
personnel
Average class size3
Average (S.E.) Average (S.E.) Average (S.E.) Average (S.E.) Average (S.E.) Average (S.E.)
Australia 814.2 (51.5) 66.6 (4.2) 12.3 (0.2) 8.1 (1.0) 4.4 (0.3) 24.7 (0.7)
Brazil 586.0 (12.8) 33.8 (1.3) 19.1 (0.6) 13.8 (0.7) 4.5 (0.2) 30.8 (0.3)
Bulgaria 345.0 (9.7) 25.9 (0.6) 12.5 (0.3) 9.4 (0.7) 2.3 (0.1) 21.7 (0.2)
Chile 483.7 (20.2) 25.7 (1.2) 20.4 (1.8) 5.4 (0.4) 3.7 (0.2) 31.8 (0.6)
Croatia 433.0 (20.6) 39.4 (1.8) 10.8 (0.6) 14.8 (0.5) 11.1 (0.4) 20.0 (0.2)
Cyprus4,5 364.1 (20.0) 49.5 (1.8) 7.1 (0.2) 22.5 (2.1) 4.9 (0.2) 20.7 (0.1)
Czech Republic 341.7 (7.7) 26.0 (0.6) 13.0 (0.2) 16.6 (0.9) 5.3 (0.1) 21.1 (0.2)
Denmark 401.4 (13.2) 32.8 (1.3) 12.1 (0.2) 10.3 (0.9) 6.5 (0.2) 21.2 (0.2)
Estonia 297.3 (17.3) 32.2 (1.2) 7.7 (0.2) 9.5 (0.4) 6.7 (0.2) 17.3 (0.3)
Finland 348.0 (12.3) 33.1 (0.9) 10.0 (0.2) 8.2 (0.5) 12.4 (0.4) 17.8 (0.2)
France 542.9 (16.3) 39.9 (1.1) 13.6 (0.3) 5.6 (0.5) 6.8 (0.2) 25.5 (0.1)
Iceland 247.8 (13.2) 27.0 (1.2) 8.4 (0.2) 4.3 (0.3) 6.9 (0.2) 19.6 (0.3)
Israel 494.2 (35.4) 47.7 (3.4) 10.8 (0.5) 6.8 (0.8) 3.9 (0.3) 27.6 (0.4)
Italy 794.6 (29.3) 85.8 (2.5) 9.8 (0.3) 60.1 (3.6) 11.4 (0.3) 21.8 (0.2)
Japan 357.3 (9.7) 24.2 (0.6) 20.3 (3.6) 11.5 (0.6) 6.0 (0.1) 31.2 (0.3)
Korea 567.2 (14.0) 31.7 (0.7) 15.5 (0.3) 8.6 (0.5) 3.8 (0.1) 32.4 (0.3)
Latvia 295.1 (10.3) 32.8 (1.1) 9.1 (0.8) 8.1 (0.4) 5.2 (0.3) 17.7 (0.4)
Malaysia 1151.1 (20.6) 82.7 (1.1) 13.6 (0.2) 53.1 (2.8) 5.9 (0.2) 32.1 (0.3)
Mexico 416.8 (23.2) 25.4 (0.9) 15.1 (0.7) 12.1 (0.8) 4.4 (0.3) 33.0 (0.6)
Netherlands 869.9 (71.4) 74.4 (6.1) 11.4 (0.2) 9.8 (1.2) 7.5 (0.5) 25.4 (0.3)
Norway 257.0 (13.6) 29.1 (1.5) 8.5 (0.2) 5.4 (0.3) 5.4 (0.3) 22.5 (0.5)
Poland 220.6 (9.4) 27.2 (0.9) 7.9 (0.3) 11.6 (0.7) 6.2 (0.3) 21.4 (0.2)
Portugal 1152.5 (51.9) 109.5 (4.7) 10.5 (0.2) 7.5 (1.2) 8.5 (0.3) 22.6 (0.2)
Romania 474.0 (21.6) 31.6 (1.4) 15.1 (0.5) 22.0 (1.7) 7.9 (0.3) 21.7 (0.4)
Serbia 554.6 (21.4) 45.1 (1.7) 11.8 (0.4) 24.1 (1.3) 9.9 (0.4) 21.9 (0.3)
Singapore 1251.4 (34.9) 91.1 (3.2) 14.0 (0.2) 11.9 (1.0) 2.7 (0.1) 35.5 (0.2)
Slovak Republic 314.3 (9.0) 25.0 (0.6) 12.1 (0.2) 16.9 (0.7) 4.0 (0.2) 19.1 (0.2)
Spain 545.4 (26.3) 44.5 (1.8) 11.8 (0.3) 19.2 (1.1) 5.6 (0.2) 23.6 (0.2)
Sweden 373.5 (17.5) 35.1 (1.4) 10.8 (0.4) 7.1 (0.4) 10.5 (0.4) 21.4 (0.3)
Abu Dhabi (UAE) 887.6 (44.3) 61.6 (2.8) 14.0 (0.7) 12.7 (1.6) 5.9 (0.3) 25.1 (0.6)

33
Teaching and Learning International Survey – Australian Report
Number of students in
schools1
Number of teachers in
schools1
Ratio of students to number of teachers2
Ratio of teachers to number of
personnel for pedagogical
support
Ratio of teachers to number of school
administrative or management
personnel
Average class size3
Average (S.E.) Average (S.E.) Average (S.E.) Average (S.E.) Average (S.E.) Average (S.E.)
Sub-national entities
Alberta (Canada) 334.9 (11.5) 18.4 (0.7) 18.0 (0.6) 3.8 (0.2) 4.2 (0.1) 25.8 (0.4)
England (UK) 890.2 (27.4) 67.5 (2.8) 13.6 (0.2) 4.1 (0.2) 3.3 (0.2) 23.9 (0.3)
Flanders (Belgium) 623.7 (49.8) 78.6 (4.9) 7.9 (0.5) 31.3 (3.5) 10.0 (0.6) 17.3 (0.3)
TALIS Average 546.4 (4.8) 45.5 (0.4) 12.4 (0.1) 14.4 (0.2) 6.3 (0.0) 24.1 (0.1)
Asian Average 831.8 (11.0) 57.4 (0.9) 15.8 (0.9) 21.3 (0.8) 4.6 (0.1) 32.8 (0.1)
OECD Average 508.2 (6.1) 43.8 (0.5) 12.2 (0.2) 12.3 (0.3) 6.4 (0.1) 23.8 (0.1)
PISA Best Average 541.2 (11.0) 45.7 (1.0) 12.5 (0.4) 11.8 (0.4) 6.6 (0.1) 24.9 (0.1)
United States 566.5 (43.6) 38.2 (2.3) 14.9 (1.0) 8.0 (1.4) 6.4 (0.3) 27.0 (0.6)
1. Data are reported by principals and represent the average of school-level data in each country. For example, in Australia, 814 represents the average number of students per school where lower secondary teachers work and 67 represents the average number of teachers in schools where lower secondary teachers work. The education provision in these schools may extend across ISCED levels (e.g., in schools that offer both lower and upper secondary education) and therefore may not apply only to teachers or students in lower secondary education.
2. The average ratio of students to number of teachers is derived from the principal questionnaire. It is calculated by making the average of the school ratios in each country and can therefore be different from the ratio of the averages you could calculate from this table.
3. These data are reported by lower secondary teachers and refer to a randomly chosen class they currently teach from their weekly timetable.
4. Footnote by Turkey: The information in this document with reference to “Cyprus” relates to the southern part of the Island. There is no single authority representing both Turkish and Greek Cypriot people on the island. Turkey recognises the Turkish Republic of Northern Cyprus (TRNC). Until a lasting and equitable solution is found within the context of the United Nations, Turkey shall preserve its position concerning the “Cyprus issue”.
5. Footnote by all the European Union Member States of the OECD and the European Union: The Republic of Cyprus is recognised by all members of the United Nations with the exception of Turkey. The information in this document relates to the area under the effective control of the Government of the Republic of Cyprus.
Source: OECD, TALIS 2013 Database

34
Teaching and Learning International Survey – Australian Report
As would be expected in a country with a larger than average school student enrolment per school, Australia’s average number of teachers per school, 66.6, is also comparatively high. This is well above all comparison group averages and places Australia eighth overall.
With regard to student:teacher ratios, Australia has the 15th highest ratio amongst all TALIS countries. With an average student:teacher ratio of 12.3:1, the Australian figure roughly equates to most of the comparison group averages, but is below the Asian group average of 15.8:1. The Asian countries are a more homogenous group in this respect, all displaying moderately high or very high ratios: Japan (20.3:1), Korea (15.5:1), Singapore (14:1) and Malaysia (13.6:1).
Australia compares quite favourably to other TALIS countries with regard to both our ratio of teachers to pedagogical support staff (8.1), and our ratio of teachers to administrative or management personnel (4.4). These ratios are well below the comparison group averages for both variables, as shown in Table 2.10. That said, Australian teachers still have less administrative and managerial support, and considerably less pedagogical support, than their Canadian and English counterparts. The ratio for teacher to administrative and managerial staff is 4.2:1 for Alberta (Canada) and 3.3:1 for England. With regard to teacher to pedagogical support staff ratios, the ratios for both countries are roughly half that of Australia’s: namely 3.8 for Alberta (Canada) and 4.1 for England.
Finally, in terms of average class size, Australia places 13th amongst the TALIS countries in this respect. The average Australian class size is 24.7, but our standard error is also the largest of any other TALIS country at 0.7, meaning there is more variation in class size in Australia than in the other countries.
School resources
Table 2.11 shows the proportion of teachers whose principal reported that certain issues hinder the school’s capacity to provide quality instruction either ‘a lot’ or ‘to some extent’. Almost half (47.8 per cent) of Australian teachers work in schools whose principal reported that quality instruction is hindered by a shortage of qualified and/or well performing teachers. This is higher than all comparison group averages except for the Asian country group at 49.5 per cent. This seems to be a fairly widespread issue amongst TALIS countries with more than 20 per cent of teachers in most countries working in schools whose principals report this as an issue which impedes quality instruction. The exceptions to this are Denmark (14.8 per cent), Finland (17.1 per cent) and Iceland (13.9 per cent).
The next most reported issue in Australia concerns a shortage of teachers with competences in teaching students with special needs. 37.4 per cent of teachers work in schools whose principals report this as issue which negatively impacts teaching and learning in their schools. A shortage of vocational teachers (27.6 per cent) and shortage of support personnel (28.2 per cent) were also reported as being issues in Australian schools.
With regard to ICT resources, almost 15 per cent of Australian teachers work in schools whose principal reported that insufficient internet access impeded instruction, and 12 per cent work in schools in which a shortage or inadequacy of computer software was an issue. However, it is noteworthy that reported shortages or inadequacies in relation to ICT resources are considerably lower than for any of the comparative group averages.
It is also interesting to note that the standard error for these school resource statistics is considerably higher in Australia (between two and six) than in other TALIS countries (less than two). This shows that there are higher levels of variation at a school level in Australia than in other countries.
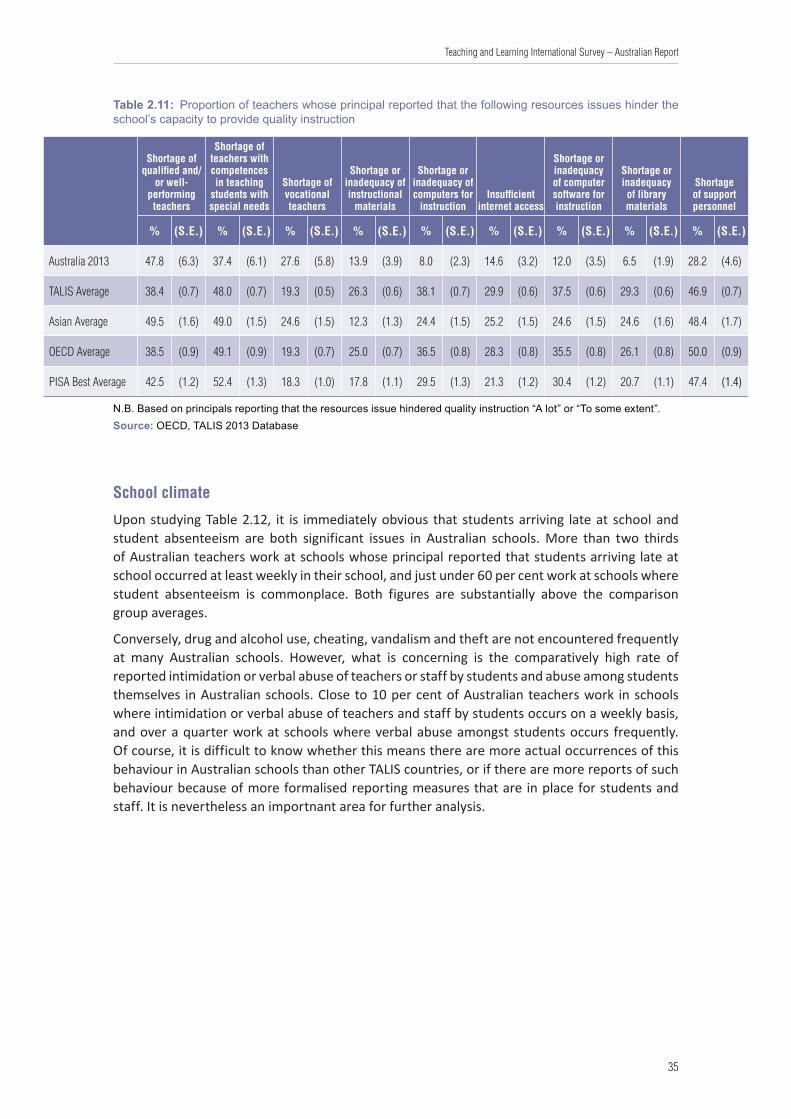
35
Teaching and Learning International Survey – Australian Report
Table 2.11: Proportion of teachers whose principal reported that the following resources issues hinder the school’s capacity to provide quality instruction
Shortage of qualified and/
or well-performing
teachers
Shortage of teachers with competences in teaching
students with special needs
Shortage of vocational teachers
Shortage or inadequacy of instructional
materials
Shortage or inadequacy of computers for
instructionInsufficient
internet access
Shortage or inadequacy of computer software for instruction
Shortage or inadequacy of library materials
Shortage of support personnel
% (S.E.) % (S.E.) % (S.E.) % (S.E.) % (S.E.) % (S.E.) % (S.E.) % (S.E.) % (S.E.)
Australia 2013 47.8 (6.3) 37.4 (6.1) 27.6 (5.8) 13.9 (3.9) 8.0 (2.3) 14.6 (3.2) 12.0 (3.5) 6.5 (1.9) 28.2 (4.6)
TALIS Average 38.4 (0.7) 48.0 (0.7) 19.3 (0.5) 26.3 (0.6) 38.1 (0.7) 29.9 (0.6) 37.5 (0.6) 29.3 (0.6) 46.9 (0.7)
Asian Average 49.5 (1.6) 49.0 (1.5) 24.6 (1.5) 12.3 (1.3) 24.4 (1.5) 25.2 (1.5) 24.6 (1.5) 24.6 (1.6) 48.4 (1.7)
OECD Average 38.5 (0.9) 49.1 (0.9) 19.3 (0.7) 25.0 (0.7) 36.5 (0.8) 28.3 (0.8) 35.5 (0.8) 26.1 (0.8) 50.0 (0.9)
PISA Best Average 42.5 (1.2) 52.4 (1.3) 18.3 (1.0) 17.8 (1.1) 29.5 (1.3) 21.3 (1.2) 30.4 (1.2) 20.7 (1.1) 47.4 (1.4)
N.B. Based on principals reporting that the resources issue hindered quality instruction “A lot” or “To some extent”.Source: OECD, TALIS 2013 Database
School climate
Upon studying Table 2.12, it is immediately obvious that students arriving late at school and student absenteeism are both significant issues in Australian schools. More than two thirds of Australian teachers work at schools whose principal reported that students arriving late at school occurred at least weekly in their school, and just under 60 per cent work at schools where student absenteeism is commonplace. Both figures are substantially above the comparison group averages.
Conversely, drug and alcohol use, cheating, vandalism and theft are not encountered frequently at many Australian schools. However, what is concerning is the comparatively high rate of reported intimidation or verbal abuse of teachers or staff by students and abuse among students themselves in Australian schools. Close to 10 per cent of Australian teachers work in schools where intimidation or verbal abuse of teachers and staff by students occurs on a weekly basis, and over a quarter work at schools where verbal abuse amongst students occurs frequently. Of course, it is difficult to know whether this means there are more actual occurrences of this behaviour in Australian schools than other TALIS countries, or if there are more reports of such behaviour because of more formalised reporting measures that are in place for students and staff. It is nevertheless an importnant area for further analysis.

36
Teaching and Learning International Survey – Australian Report
Table 2.12: Proportion of teachers whose principal considered the following student behaviours to occur at least weekly in their school
Arriving late at school Absenteeism Cheating
Vandalism and theft
Intimidation or verbal
abuse among students
Physical injury caused by violence
among students
Intimidation or verbal abuse of
teachers or staff
Use/possession of drugs and/or
alcohol
% (S.E.) % (S.E.) % (S.E.) % (S.E.) % (S.E.) % (S.E.) % (S.E.) % (S.E.)
Australia 66.1 (4.9) 58.9 (5.2) 2.5 (1.8) 3.1 (1.6) 25.2 (4.4) 3.5 (1.6) 9.7 (2.8) 0.0 (0.0)
TALIS Average 51.8 (0.7) 38.7 (0.6) 13.2 (0.5) 4.4 (0.3) 16.0 (0.5) 2.3 (0.2) 3.4 (0.3) 1.2 (0.1)
Asian Average 46.4 (1.7) 38.2 (1.5) 2.5 (0.7) 4.3 (0.9) 3.4 (0.7) 0.9 (0.4) 0.7 (0.3) 0.0 (0.0)
OECD Average 54.7 (0.9) 39.7 (0.8) 13.2 (0.6) 4.3 (0.4) 16.7 (0.7) 2.3 (0.2) 3.7 (0.3) 1.4 (0.2)
PISA Best Average 59.0 (1.3) 43.4 (1.3) 17.0 (1.0) 3.5 (0.6) 17.1 (1.1) 1.1 (0.3) 3.6 (0.5) 1.7 (0.4)
Source: OECD, TALIS 2013 Database
Turning now to teacher-related behaviours, Table 2.13 shows the proportion of teachers whose principal reported that teachers arriving late or teacher absenteeism occurs at least weekly. As we can see, over 15 per cent of teachers work in schools where both of these teacher behaviours occur frequently. These proportions are considerably higher than all comparison group averages. This places Australia tenth overall with regard to the prevalence of teachers arriving late at school, and fifth overall with respect to teacher absenteeism.
Table 2.13: Proportion of teachers whose principal considered the following teacher behaviours to occur at least weekly in their school
Arriving late at school Absenteeism
% (S.E.) % (S.E.)
Australia 2013 15.6 (4.7) 15.6 (5.6)
TALIS Average 10.9 (0.4) 4.7 (0.3)
Asian Average 6.6 (0.8) 0.7 (0.3)
OECD Average 11.1 (0.6) 4.5 (0.4)
PISA Best Average 8.1 (0.7) 1.4 (0.3)
Source: OECD, TALIS 2013 Database

37
Teaching and Learning International Survey – Australian Report
School autonomy
Principals were asked about the level of school automony, or the degree to which responsibility for decision making is held at the school level in certain areas, as opposed to at a state or federal government level. As we can see from Table 2.14, it is possible for schools to have a considerable level of autonomy in some areas but not others.
In Australia, schools generally enjoy a high level of automony in many areas. In all Australian schools, the decision on which courses the school offers, as well as the learning materials used for instruction, sit with the school. The vast majority of Australian teachers work in schools in which the principal or other members of management team and/or governing board make decisions on appointing and dismissing/suspending teachers, on allocating budgets within the school, on establishing student disciplinary process and student assessment procedures, on approving student admission and determining course content. The proportion of teachers working at schools which have the authority to make these decisions is higher than any of the comparison group averages.
However, the area in which many Australian schools do not have jurisdiction to make decisions relates to the area of teacher remuneration. One third of Australian teachers work in schools in which decisions concerning the establishment of teacher starting salaries are made at school level, and a smaller figure (29.5 per cent) work at schools where salary increases can be initiated and actioned by the principal, management team or governing board.
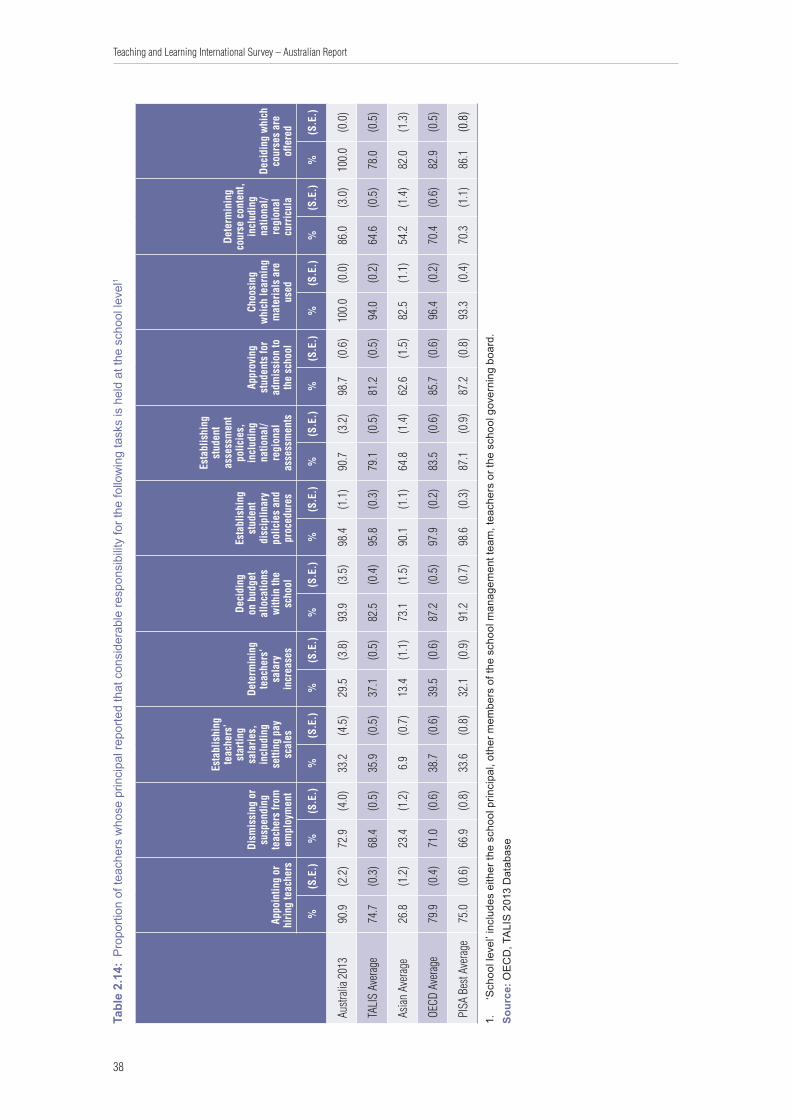
38
Teaching and Learning International Survey – Australian Report
Tabl
e 2.
14:
Pro
porti
on o
f tea
cher
s w
hose
prin
cipa
l rep
orte
d th
at c
onsi
dera
ble
resp
onsi
bilit
y fo
r the
follo
win
g ta
sks
is h
eld
at th
e sc
hool
leve
l1
Appo
intin
g or
hi
ring
teac
hers
Dism
issi
ng o
r su
spen
ding
te
ache
rs fr
om
empl
oym
ent
Esta
blis
hing
te
ache
rs’
star
ting
sala
ries,
in
clud
ing
setti
ng p
ay
scal
es
Dete
rmin
ing
teac
hers
’ sa
lary
in
crea
ses
Deci
ding
on
bud
get
allo
catio
ns
with
in th
e sc
hool
Esta
blis
hing
st
uden
t di
scip
linar
y po
licie
s an
d pr
oced
ures
Esta
blis
hing
st
uden
t as
sess
men
t po
licie
s,
incl
udin
g na
tiona
l/re
gion
al
asse
ssm
ents
Appr
ovin
g st
uden
ts fo
r ad
mis
sion
to
the
scho
ol
Choo
sing
w
hich
lear
ning
m
ater
ials
are
us
ed
Dete
rmin
ing
cour
se c
onte
nt,
incl
udin
g na
tiona
l/re
gion
al
curr
icul
a
Deci
ding
whi
ch
cour
ses
are
offe
red
%(S
.E.)
%(S
.E.)
%(S
.E.)
%(S
.E.)
%(S
.E.)
%(S
.E.)
%(S
.E.)
%(S
.E.)
%(S
.E.)
%(S
.E.)
%(S
.E.)
Austr
alia 2
013
90.9
(2.2
)72
.9(4
.0)
33.2
(4.5
)29
.5(3
.8)
93.9
(3.5
)98
.4(1
.1)
90.7
(3.2
)98
.7(0
.6)
100.
0(0
.0)
86.0
(3.0
)10
0.0
(0.0
)
TALI
S Av
erag
e74
.7(0
.3)
68.4
(0.5
)35
.9(0
.5)
37.1
(0.5
)82
.5(0
.4)
95.8
(0.3
)79
.1(0
.5)
81.2
(0.5
)94
.0(0
.2)
64.6
(0.5
)78
.0(0
.5)
Asian
Ave
rage
26.8
(1.2
)23
.4(1
.2)
6.9
(0.7
)13
.4(1
.1)
73.1
(1.5
)90
.1(1
.1)
64.8
(1.4
)62
.6(1
.5)
82.5
(1.1
)54
.2(1
.4)
82.0
(1.3
)
OECD
Ave
rage
79.9
(0.4
)71
.0(0
.6)
38.7
(0.6
)39
.5(0
.6)
87.2
(0.5
)97
.9(0
.2)
83.5
(0.6
)85
.7(0
.6)
96.4
(0.2
)70
.4(0
.6)
82.9
(0.5
)
PISA
Bes
t Ave
rage
75.0
(0.6
)66
.9(0
.8)
33.6
(0.8
)32
.1(0
.9)
91.2
(0.7
)98
.6(0
.3)
87.1
(0.9
)87
.2(0
.8)
93.3
(0.4
)70
.3(1
.1)
86.1
(0.8
)
1.
‘Sch
ool l
evel
’ inc
lude
s ei
ther
the
scho
ol p
rinci
pal,
othe
r mem
bers
of t
he s
choo
l man
agem
ent t
eam
, tea
cher
s or
the
scho
ol g
over
ning
boa
rd.
Sour
ce: O
ECD
, TA
LIS
201
3 D
atab
ase

39
Teaching and Learning International Survey – Australian Report
2.5 International Summary: Highlights from the International Report• More than half of lower secondary teachers in all TALIS countries and economies except
Japan are women, and in 22 countries two-thirds or more of teachers are women. Furthermore, several countries may face the prospect of significant teacher shortages as a result of large numbers of teachers reaching retirement age.
• More than a third of teachers work in schools where the school principal reported a significant shortage of qualified teachers. Additionally, almost half of teachers work in schools where there is a reported need for teachers of students with special needs and a need for support personnel.
• Teachers who benefited from formal education that included content, pedagogy and practical components for the subjects they teach feel better prepared for their work than their colleagues whose formal education did not contain these elements.
• Across most TALIS countries and economies, the majority of teachers work in environments with a positive professional climate among the teaching staff. This positive climate is characterised by a common set of beliefs, mutual respect for colleagues’ ideas, a culture of sharing success, high levels of co-operation between the school and the local community and the ability to have open discussions about difficulties.
• Most teachers work in schools in which there is little to no authority at the school level for making decisions related to teacher pay. In almost all countries, however, a large proportion of teachers work in schools that enjoy a high level of autonomy for establishing student disciplinary procedures or selecting the learning materials used.
40
Teaching and Learning International Survey – Australian Report
3. School Principals’ Leadership
3.1 OverviewThis chapter focuses on the role of principals in schools and follows the principal questionnaire sequence rigorously to investigate aspects of the relationships between principals, their personal attributes and demographic characteristics, the instructional leadership they provide and their perceived impediments to more effective instructional environments. The chapter concludes with a discussion of principals’ job satisfaction and implications for policy and practice that can be drawn from all of the data examined. In reporting on the Australian context, comparisons with other participating countries are drawn to support inferences and policy implications.
Due to the modifications in the focus of the 2013 principal survey relative to that of 2008, there are multiple cases in which comparative data across TALIS cycles are not available due to new items or significant changes in the wording of items making direct comparisons untenable.
It should be emphasised that these data relate to ISCED 2 – lower secondary school responses only. Australia did not participate in the ISCED 1 (primary school) survey and the results of ISCED 3 (upper secondary schools) and PISA link studies will be the focus of separate reports.
3.2 IntroductionA key focus of the TALIS instruments is to better understand the role of principals in the variety of leadership capacities that they fulfil within a school. The international report cites Marzano, Waters and McNulty (2005) in the assertion that ‘there is no clear, well articulated body of research about the role of the principal and school leadership’. The report further references Aydin, Sarierf and Uysal, (2003), Lucas et al (2013), Chin (2007) and others in the contention that ‘principals influence the climate and organisation of their school and the conditions under which staff, especially teachers work’.
Masters (2013) highlights the role of the principal in developing the environment for an ‘effective’ school and identifies a number of criteria that are common to effective schools including the ability to articulate a shared vision and provide instructional leadership as well as provide an accountability function in relation to the allocation of resources.
Clearly, the role of a principal is multi-faceted and extremely demanding yet critical aspect of a school and a significant factor in its operational and academic success. The chapter attempts to tease out the increasing complexity of the position and the demands of the contemporary principal. In addressing the outcomes of the instruments, it articulates the range and multiplicity of the tasks required and the approaches implemented by Australian principals, together with a section devoted to the instructional leadership functions.
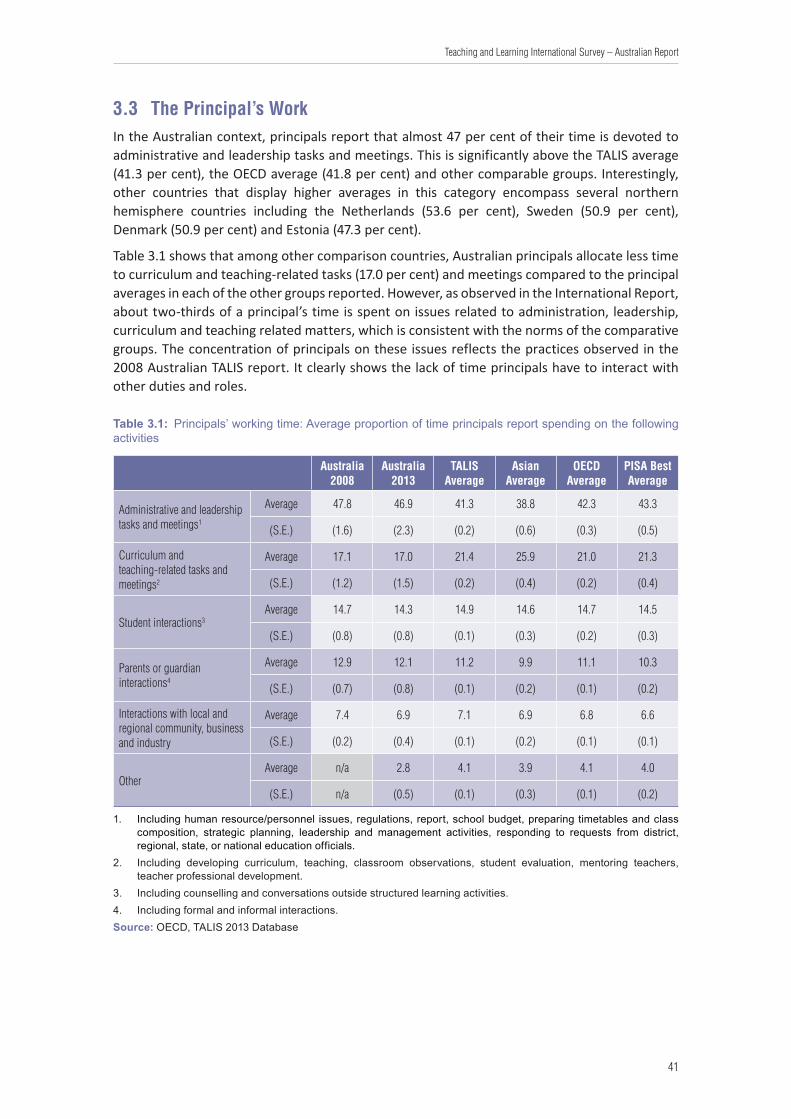
41
Teaching and Learning International Survey – Australian Report
3.3 The Principal’s WorkIn the Australian context, principals report that almost 47 per cent of their time is devoted to administrative and leadership tasks and meetings. This is significantly above the TALIS average (41.3 per cent), the OECD average (41.8 per cent) and other comparable groups. Interestingly, other countries that display higher averages in this category encompass several northern hemisphere countries including the Netherlands (53.6 per cent), Sweden (50.9 per cent), Denmark (50.9 per cent) and Estonia (47.3 per cent).
Table 3.1 shows that among other comparison countries, Australian principals allocate less time to curriculum and teaching-related tasks (17.0 per cent) and meetings compared to the principal averages in each of the other groups reported. However, as observed in the International Report, about two-thirds of a principal’s time is spent on issues related to administration, leadership, curriculum and teaching related matters, which is consistent with the norms of the comparative groups. The concentration of principals on these issues reflects the practices observed in the 2008 Australian TALIS report. It clearly shows the lack of time principals have to interact with other duties and roles.
Table 3.1: Principals’ working time: Average proportion of time principals report spending on the following activities
Australia 2008
Australia 2013
TALIS Average
Asian Average
OECD Average
PISA Best Average
Administrative and leadership tasks and meetings1
Average 47.8 46.9 41.3 38.8 42.3 43.3
(S.E.) (1.6) (2.3) (0.2) (0.6) (0.3) (0.5)
Curriculum and teaching-related tasks and meetings2
Average 17.1 17.0 21.4 25.9 21.0 21.3
(S.E.) (1.2) (1.5) (0.2) (0.4) (0.2) (0.4)
Student interactions3Average 14.7 14.3 14.9 14.6 14.7 14.5
(S.E.) (0.8) (0.8) (0.1) (0.3) (0.2) (0.3)
Parents or guardian interactions4
Average 12.9 12.1 11.2 9.9 11.1 10.3
(S.E.) (0.7) (0.8) (0.1) (0.2) (0.1) (0.2)
Interactions with local and regional community, business and industry
Average 7.4 6.9 7.1 6.9 6.8 6.6
(S.E.) (0.2) (0.4) (0.1) (0.2) (0.1) (0.1)
OtherAverage n/a 2.8 4.1 3.9 4.1 4.0
(S.E.) n/a (0.5) (0.1) (0.3) (0.1) (0.2)
1. Including human resource/personnel issues, regulations, report, school budget, preparing timetables and class composition, strategic planning, leadership and management activities, responding to requests from district, regional, state, or national education officials.
2. Including developing curriculum, teaching, classroom observations, student evaluation, mentoring teachers, teacher professional development.
3. Including counselling and conversations outside structured learning activities. 4. Including formal and informal interactions.Source: OECD, TALIS 2013 Database

42
Teaching and Learning International Survey – Australian Report
3.4 School LeadershipSchool leadership is a significant aspect of the principal’s role both in administrative duties and as a pedagogical leader. The TALIS survey enquired specifically about a number of activities that enhance the effectiveness of the school in relation to leadership activities. Figure 3.1 and Table 3.2 below provide the data about the proportion of principals who report having ‘frequently’ engaged in the activities identified, compared with the Australian TALIS comparative groups.
The International Report cites Pont et al. (2008) in asserting that ‘a strong school leader establishes a climate conducive to teaching and learning and fosters community support for the efforts of the teaching staff’, referring to a strong body of literature regarding the role of principals in key areas that include: the trend towards accountability as a driver in prioritising the improvement of student achievement results; planning the school’s goals and programme (Grissom, Loeb and Master 2013) and its professional development plan (OECD 2013); collaborating with teachers to solve classroom discipline problems (MacNeil and Prater 1999); observing instruction (Veenman, Visser and Wijkamp 1998); encouraging teachers to take responsibility for improving their teaching and student learning; and providing parents or guardians with information about the school and student performance (Jeynes 2011).
In reviewing these data there are a number of aspects in which there are significant differences between the reported Australian practices and those observed in the comparison groups. In particular, Australian principals do not engage in classroom discipline problems to a similar extent as other groups. In Australia, principals’ report that about 35 per cent of their time is involved with classroom discipline compared to 68 per cent which is observed as the TALIS average, and around 60 per cent in each of the comparison groups. Similarly, Table 3.2 shows that, on average, Australian principals spend significantly less time on observing classroom instruction and in resolving timetabling issues.
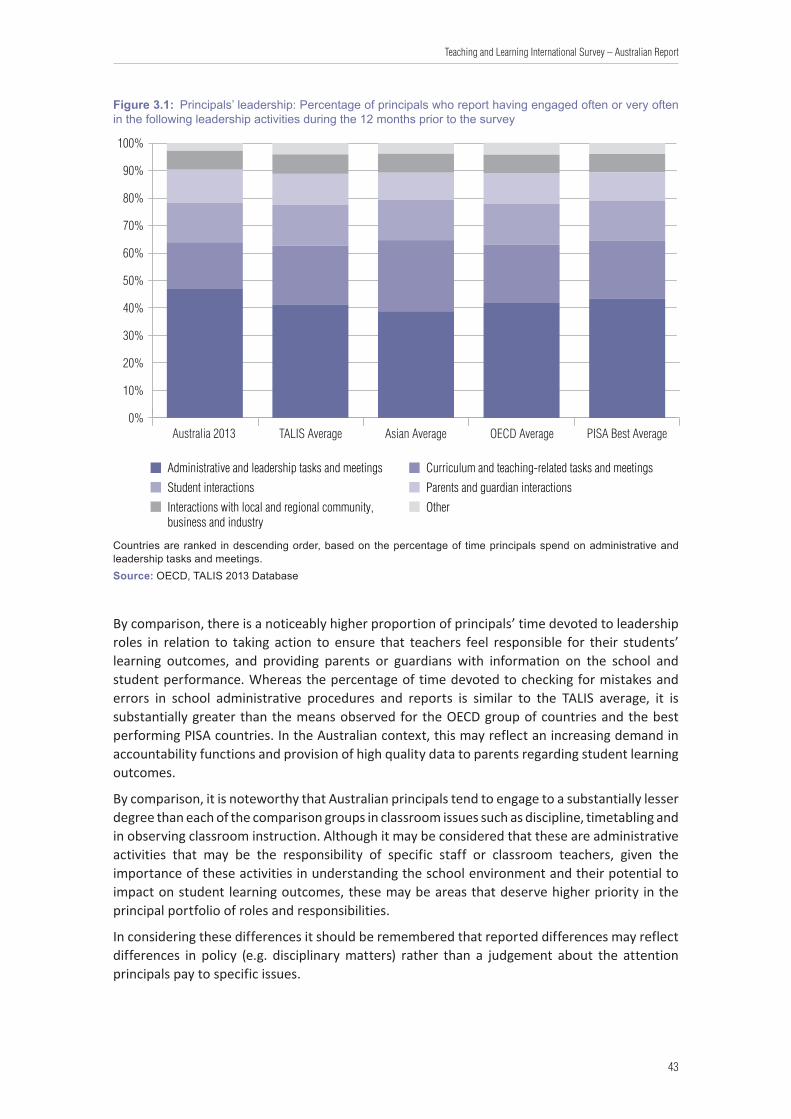
43
Teaching and Learning International Survey – Australian Report
Figure 3.1: Principals’ leadership: Percentage of principals who report having engaged often or very often in the following leadership activities during the 12 months prior to the survey
0%
10%
20%
30%
40%
50%
60%
70%
80%
90%
100%
PISA Best AverageOECD AverageAsian AverageTALIS AverageAustralia 2013
Administrative and leadership tasks and meetings
Student interactions
Interactions with local and regional community, business and industry
Curriculum and teaching-related tasks and meetings
Parents and guardian interactions
Other
Countries are ranked in descending order, based on the percentage of time principals spend on administrative and leadership tasks and meetings. Source: OECD, TALIS 2013 Database
By comparison, there is a noticeably higher proportion of principals’ time devoted to leadership roles in relation to taking action to ensure that teachers feel responsible for their students’ learning outcomes, and providing parents or guardians with information on the school and student performance. Whereas the percentage of time devoted to checking for mistakes and errors in school administrative procedures and reports is similar to the TALIS average, it is substantially greater than the means observed for the OECD group of countries and the best performing PISA countries. In the Australian context, this may reflect an increasing demand in accountability functions and provision of high quality data to parents regarding student learning outcomes.
By comparison, it is noteworthy that Australian principals tend to engage to a substantially lesser degree than each of the comparison groups in classroom issues such as discipline, timetabling and in observing classroom instruction. Although it may be considered that these are administrative activities that may be the responsibility of specific staff or classroom teachers, given the importance of these activities in understanding the school environment and their potential to impact on student learning outcomes, these may be areas that deserve higher priority in the principal portfolio of roles and responsibilities.
In considering these differences it should be remembered that reported differences may reflect differences in policy (e.g. disciplinary matters) rather than a judgement about the attention principals pay to specific issues.
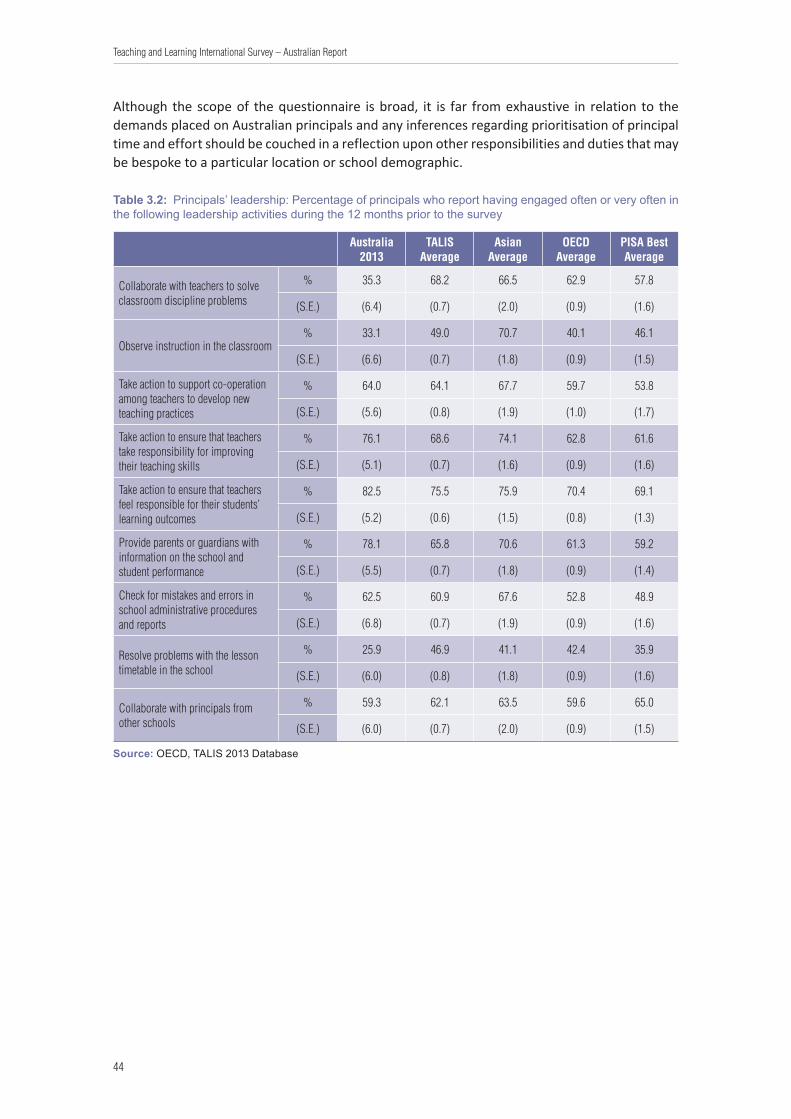
44
Teaching and Learning International Survey – Australian Report
Although the scope of the questionnaire is broad, it is far from exhaustive in relation to the demands placed on Australian principals and any inferences regarding prioritisation of principal time and effort should be couched in a reflection upon other responsibilities and duties that may be bespoke to a particular location or school demographic.
Table 3.2: Principals’ leadership: Percentage of principals who report having engaged often or very often in the following leadership activities during the 12 months prior to the survey
Australia 2013
TALIS Average
Asian Average
OECD Average
PISA Best Average
Collaborate with teachers to solve classroom discipline problems
% 35.3 68.2 66.5 62.9 57.8
(S.E.) (6.4) (0.7) (2.0) (0.9) (1.6)
Observe instruction in the classroom% 33.1 49.0 70.7 40.1 46.1
(S.E.) (6.6) (0.7) (1.8) (0.9) (1.5)
Take action to support co-operation among teachers to develop new teaching practices
% 64.0 64.1 67.7 59.7 53.8
(S.E.) (5.6) (0.8) (1.9) (1.0) (1.7)
Take action to ensure that teachers take responsibility for improving their teaching skills
% 76.1 68.6 74.1 62.8 61.6
(S.E.) (5.1) (0.7) (1.6) (0.9) (1.6)
Take action to ensure that teachers feel responsible for their students’ learning outcomes
% 82.5 75.5 75.9 70.4 69.1
(S.E.) (5.2) (0.6) (1.5) (0.8) (1.3)
Provide parents or guardians with information on the school and student performance
% 78.1 65.8 70.6 61.3 59.2
(S.E.) (5.5) (0.7) (1.8) (0.9) (1.4)
Check for mistakes and errors in school administrative procedures and reports
% 62.5 60.9 67.6 52.8 48.9
(S.E.) (6.8) (0.7) (1.9) (0.9) (1.6)
Resolve problems with the lesson timetable in the school
% 25.9 46.9 41.1 42.4 35.9
(S.E.) (6.0) (0.8) (1.8) (0.9) (1.6)
Collaborate with principals from other schools
% 59.3 62.1 63.5 59.6 65.0
(S.E.) (6.0) (0.7) (2.0) (0.9) (1.5)
Source: OECD, TALIS 2013 Database

45
Teaching and Learning International Survey – Australian Report
3.5 Planning, school goals, programmes and professional developmentThe impact of increasing accountability in Australian schools has been accompanied by an increasing supply of data through national programs like the National Assessment Program – Literacy and Numeracy (NAPLAN), that measures cohort level achievement annually in Years 3, 5, 7 and 9. In addition, there are international student sample achievement studies in which Australia participates, including Performance of International Students Achievement (PISA), Trends in Mathematics and Science Survey (TIMSS) and Performance in Reading Literacy Study (PIRLS), which are administered at regular three, four or five year intervals (respectively) across a wide spectrum of countries.
Table 3.3 shows that Australian principals consider these aspects of their responsibility as a relatively high priority compared with other groups. However, it is notable that all comparison groups have very high proportions of principals who report reference to school national and international performance as a driver in the development of the school’s educational goals and intervention programs.
Table 3.3: Principals’ participation in a school development plan: Percentage of principals who report having engaged in the following activities related to a school development plan in the 12 months prior to the survey
Used student performance and student evaluation results (including national/international assessments) to develop
the school’s educational goals and programmes
Worked on a professional development plan for the school
% (S.E.) % (S.E.)
Australia 2013 94.7 (2.5) 89.2 (4.6)
TALIS Average 88.8 (0.5) 79.1 (0.6)
Asian Average 96.8 (0.8) 95.6 (1.1)
OECD Average 88.7 (0.6) 76.2 (0.8)
PISA Best Average 86.3 (1.1) 79.0 (1.5)
Source: OECD, TALIS 2013 Database

46
Teaching and Learning International Survey – Australian Report
3.6 Sharing ResponsibilitiesSchleicher (2012) contends that ‘because of its complexity, the work of the school and especially the work of the principal are increasingly recognised as responsibilities that are, or should be more broadly shared’. Chapter 2 of this report describes the general area of school autonomy in the Australian context compared to the comparison groups and, in general, reports a relatively high incidence of devolution of responsibility to principals, and a relatively high rate of school autonomy compared to many countries.
The data in respect of shared responsibilities show significant variation in policy and practices among the TALIS participating countries. Table 3.4 shows the Australian averages for each of the tasks investigated compared to the comparison groups.
Table 3.4: Principals’ shared responsibilities: Percentage of principals in lower secondary education who report a shared responsibility for the following tasks1
Australia 2013
TALIS Average
Asian Average
OECD Average
PISA Best Average
Appointing or hiring teachers% 50.9 39.0 14.6 39.8 37.7
(S.E.) (5.7) (0.7) (1.4) (0.9) (1.5)
Dismissing or suspending teachers from employment
% 26.2 29.5 13.2 28.6 28.0
(S.E.) (5.2) (0.7) (1.5) (0.9) (1.6)
Establishing teachers’ starting salaries, including setting payscales
% 15.3 14.2 2.2 13.9 11.5
(S.E.) (4.2) (0.6) (0.6) (0.7) (1.2)
Determining teachers’ salary increases% 18.5 17.5 8.2 18.3 18.2
(S.E.) (4.8) (0.6) (1.2) (0.8) (1.3)
Deciding on budget allocations within the school
% 55.4 46.7 35.2 47.2 49.8
(S.E.) (6.2) (0.8) (1.9) (0.9) (1.6)
Establishing student disciplinary policies and procedures
% 62.5 61.0 47.6 62.0 60.2
(S.E.) (6.5) (0.8) (2.1) (0.9) (1.7)
Establishing student assessment policies, including national/regional assessments
% 55.4 52.2 39.1 56.3 57.7
(S.E.) (5.5) (0.7) (1.9) (0.9) (1.6)
Approving students for admission to the school
% 39.9 36.9 28.5 37.4 40.9
(S.E.) (6.2) (0.7) (1.8) (0.9) (1.4)
Choosing which learning materials are used% 34.5 44.7 31.2 47.2 41.7
(S.E.) (5.9) (0.8) (2.0) (1.0) (1.6)
Determining course content, including national/regional curricula
% 42.7 34.6 23.0 38.8 32.3
(S.E.) (5.7) (0.7) (1.7) (0.9) (1.5)
Deciding which courses are offered% 75.8 51.8 40.0 58.0 58.0
(S.E.) (4.9) (0.7) (2.0) (0.8) (1.4)
1. A shared responsibility occurs when an active role is played in decision making by the principal and one of the following entities: ‘other members of the school management team’, ‘teachers (not as part of the school management team)’, ‘school governing board’, ‘local, municipality/regional, state, or national/federal authority’.
Source: OECD, TALIS 2013 Database
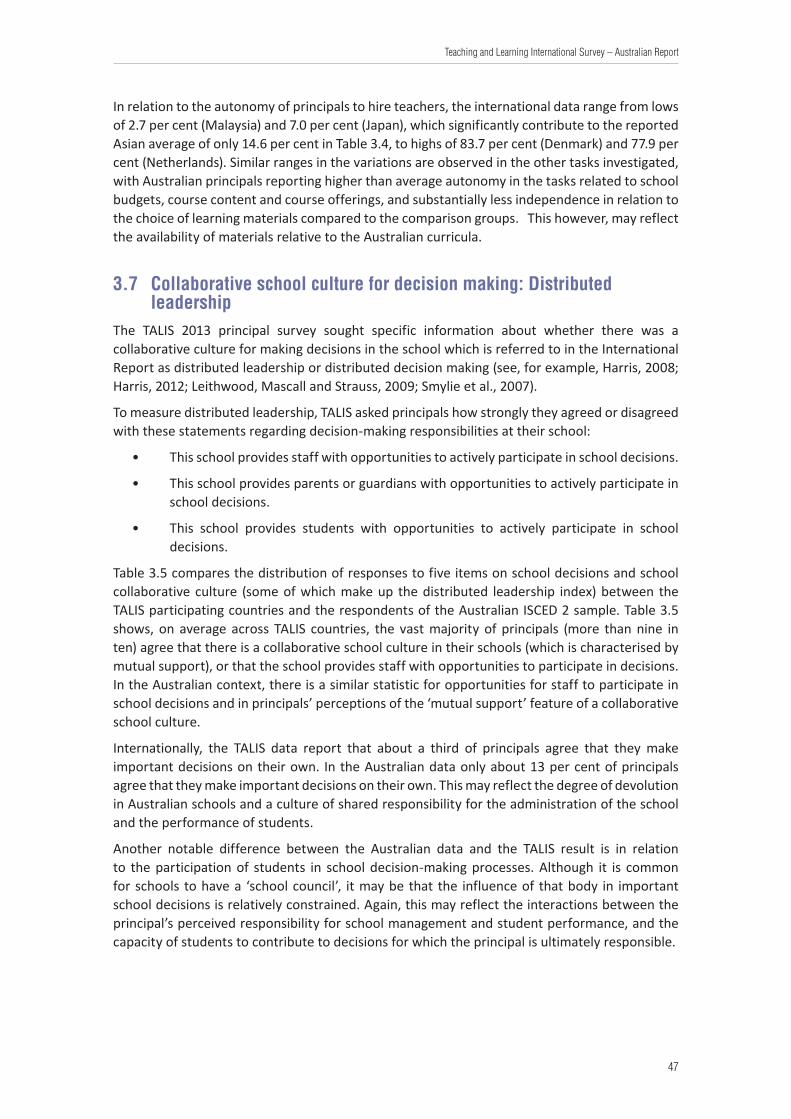
47
Teaching and Learning International Survey – Australian Report
In relation to the autonomy of principals to hire teachers, the international data range from lows of 2.7 per cent (Malaysia) and 7.0 per cent (Japan), which significantly contribute to the reported Asian average of only 14.6 per cent in Table 3.4, to highs of 83.7 per cent (Denmark) and 77.9 per cent (Netherlands). Similar ranges in the variations are observed in the other tasks investigated, with Australian principals reporting higher than average autonomy in the tasks related to school budgets, course content and course offerings, and substantially less independence in relation to the choice of learning materials compared to the comparison groups. This however, may reflect the availability of materials relative to the Australian curricula.
3.7 Collaborative school culture for decision making: Distributed leadership
The TALIS 2013 principal survey sought specific information about whether there was a collaborative culture for making decisions in the school which is referred to in the International Report as distributed leadership or distributed decision making (see, for example, Harris, 2008; Harris, 2012; Leithwood, Mascall and Strauss, 2009; Smylie et al., 2007).
To measure distributed leadership, TALIS asked principals how strongly they agreed or disagreed with these statements regarding decision-making responsibilities at their school:
• This school provides staff with opportunities to actively participate in school decisions.
• This school provides parents or guardians with opportunities to actively participate in school decisions.
• This school provides students with opportunities to actively participate in school decisions.
Table 3.5 compares the distribution of responses to five items on school decisions and school collaborative culture (some of which make up the distributed leadership index) between the TALIS participating countries and the respondents of the Australian ISCED 2 sample. Table 3.5 shows, on average across TALIS countries, the vast majority of principals (more than nine in ten) agree that there is a collaborative school culture in their schools (which is characterised by mutual support), or that the school provides staff with opportunities to participate in decisions. In the Australian context, there is a similar statistic for opportunities for staff to participate in school decisions and in principals’ perceptions of the ‘mutual support’ feature of a collaborative school culture.
Internationally, the TALIS data report that about a third of principals agree that they make important decisions on their own. In the Australian data only about 13 per cent of principals agree that they make important decisions on their own. This may reflect the degree of devolution in Australian schools and a culture of shared responsibility for the administration of the school and the performance of students.
Another notable difference between the Australian data and the TALIS result is in relation to the participation of students in school decision-making processes. Although it is common for schools to have a ‘school council’, it may be that the influence of that body in important school decisions is relatively constrained. Again, this may reflect the interactions between the principal’s perceived responsibility for school management and student performance, and the capacity of students to contribute to decisions for which the principal is ultimately responsible.
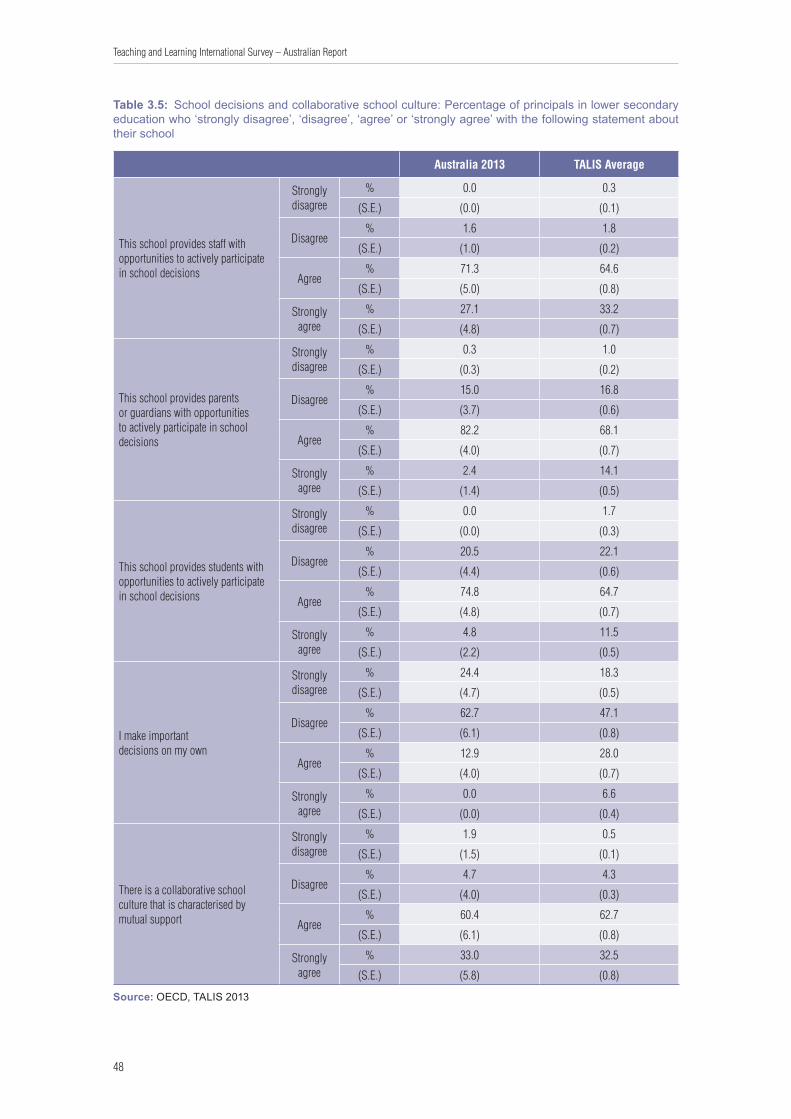
48
Teaching and Learning International Survey – Australian Report
Table 3.5: School decisions and collaborative school culture: Percentage of principals in lower secondary education who ‘strongly disagree’, ‘disagree’, ‘agree’ or ‘strongly agree’ with the following statement about their school
Australia 2013 TALIS Average
This school provides staff with opportunities to actively participate in school decisions
Strongly disagree
% 0.0 0.3
(S.E.) (0.0) (0.1)
Disagree% 1.6 1.8
(S.E.) (1.0) (0.2)
Agree% 71.3 64.6
(S.E.) (5.0) (0.8)
Strongly agree
% 27.1 33.2
(S.E.) (4.8) (0.7)
This school provides parents or guardians with opportunities to actively participate in school decisions
Strongly disagree
% 0.3 1.0
(S.E.) (0.3) (0.2)
Disagree% 15.0 16.8
(S.E.) (3.7) (0.6)
Agree% 82.2 68.1
(S.E.) (4.0) (0.7)
Strongly agree
% 2.4 14.1
(S.E.) (1.4) (0.5)
This school provides students with opportunities to actively participate in school decisions
Strongly disagree
% 0.0 1.7
(S.E.) (0.0) (0.3)
Disagree% 20.5 22.1
(S.E.) (4.4) (0.6)
Agree% 74.8 64.7
(S.E.) (4.8) (0.7)
Strongly agree
% 4.8 11.5
(S.E.) (2.2) (0.5)
I make important decisions on my own
Strongly disagree
% 24.4 18.3
(S.E.) (4.7) (0.5)
Disagree% 62.7 47.1
(S.E.) (6.1) (0.8)
Agree% 12.9 28.0
(S.E.) (4.0) (0.7)
Strongly agree
% 0.0 6.6
(S.E.) (0.0) (0.4)
There is a collaborative school culture that is characterised by mutual support
Strongly disagree
% 1.9 0.5
(S.E.) (1.5) (0.1)
Disagree% 4.7 4.3
(S.E.) (4.0) (0.3)
Agree% 60.4 62.7
(S.E.) (6.1) (0.8)
Strongly agree
% 33.0 32.5
(S.E.) (5.8) (0.8)
Source: OECD, TALIS 2013
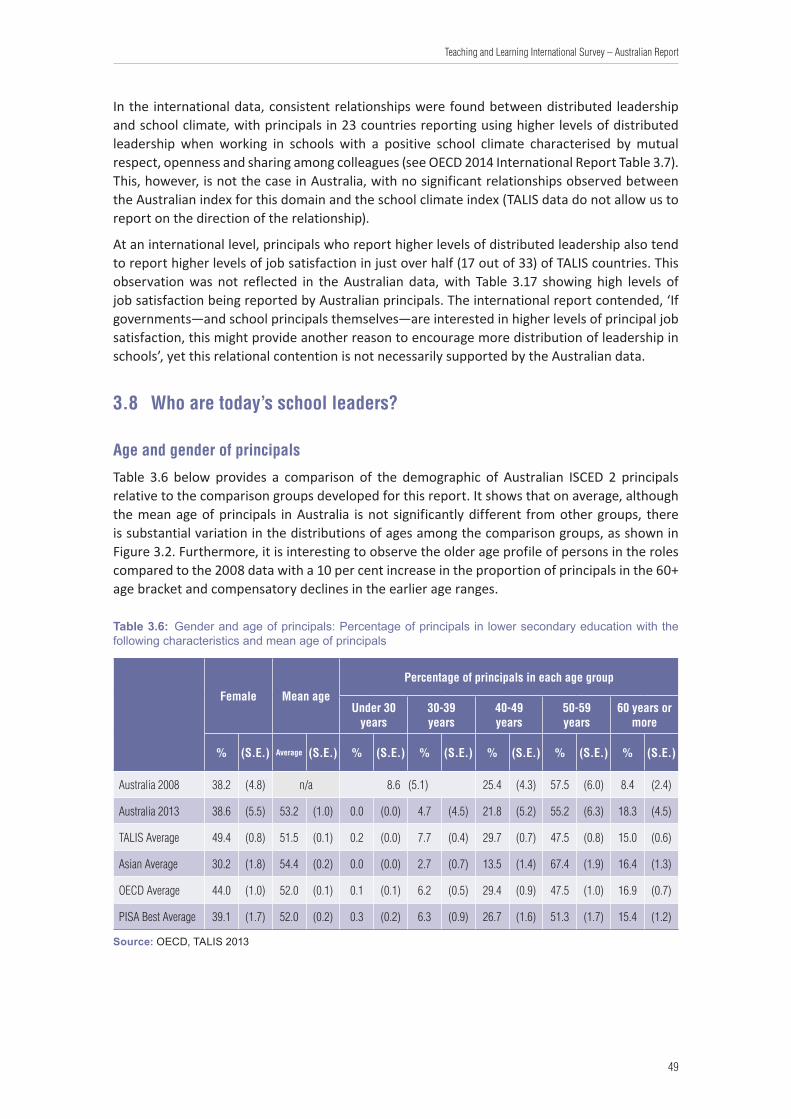
49
Teaching and Learning International Survey – Australian Report
In the international data, consistent relationships were found between distributed leadership and school climate, with principals in 23 countries reporting using higher levels of distributed leadership when working in schools with a positive school climate characterised by mutual respect, openness and sharing among colleagues (see OECD 2014 International Report Table 3.7). This, however, is not the case in Australia, with no significant relationships observed between the Australian index for this domain and the school climate index (TALIS data do not allow us to report on the direction of the relationship).
At an international level, principals who report higher levels of distributed leadership also tend to report higher levels of job satisfaction in just over half (17 out of 33) of TALIS countries. This observation was not reflected in the Australian data, with Table 3.17 showing high levels of job satisfaction being reported by Australian principals. The international report contended, ‘If governments—and school principals themselves—are interested in higher levels of principal job satisfaction, this might provide another reason to encourage more distribution of leadership in schools’, yet this relational contention is not necessarily supported by the Australian data.
3.8 Who are today’s school leaders?
Age and gender of principals
Table 3.6 below provides a comparison of the demographic of Australian ISCED 2 principals relative to the comparison groups developed for this report. It shows that on average, although the mean age of principals in Australia is not significantly different from other groups, there is substantial variation in the distributions of ages among the comparison groups, as shown in Figure 3.2. Furthermore, it is interesting to observe the older age profile of persons in the roles compared to the 2008 data with a 10 per cent increase in the proportion of principals in the 60+ age bracket and compensatory declines in the earlier age ranges.
Table 3.6: Gender and age of principals: Percentage of principals in lower secondary education with the following characteristics and mean age of principals
Female Mean age
Percentage of principals in each age group
Under 30 years
30-39 years
40-49 years
50-59 years
60 years or more
% (S.E.) Average (S.E.) % (S.E.) % (S.E.) % (S.E.) % (S.E.) % (S.E.)
Australia 2008 38.2 (4.8) n/a 8.6 (5.1) 25.4 (4.3) 57.5 (6.0) 8.4 (2.4)
Australia 2013 38.6 (5.5) 53.2 (1.0) 0.0 (0.0) 4.7 (4.5) 21.8 (5.2) 55.2 (6.3) 18.3 (4.5)
TALIS Average 49.4 (0.8) 51.5 (0.1) 0.2 (0.0) 7.7 (0.4) 29.7 (0.7) 47.5 (0.8) 15.0 (0.6)
Asian Average 30.2 (1.8) 54.4 (0.2) 0.0 (0.0) 2.7 (0.7) 13.5 (1.4) 67.4 (1.9) 16.4 (1.3)
OECD Average 44.0 (1.0) 52.0 (0.1) 0.1 (0.1) 6.2 (0.5) 29.4 (0.9) 47.5 (1.0) 16.9 (0.7)
PISA Best Average 39.1 (1.7) 52.0 (0.2) 0.3 (0.2) 6.3 (0.9) 26.7 (1.6) 51.3 (1.7) 15.4 (1.2)
Source: OECD, TALIS 2013
50
Teaching and Learning International Survey – Australian Report
The ratio of female principals in Australian schools compared to the proportion of principals in 2013 is remarkably constant compared to the 2008 statistic. This disparity is further exacerbated by the fact that, as reported in Chapter 2, females comprise 59 per cent of the lower secondary teaching workforce in Australia.
Although the TALIS proportions approach 50:50, the ratios in other comparable groups show a similar tendency to that observed in Australia. This may suggest an area that requires further investigation into the conditions, constraints and issues that impede female teachers aspiring to, or achieving, the role of school principal.
Care should be taken with the reporting of the statistic regarding the proportion of female principals in lower secondary schools (ISCED 2) as the SiAS (Staff in Australian Schools) data report that 58 per cent of principals in the Primary School sample (ISCED 1) are female. This TALIS report represents a specific sample of lower secondary teachers in Australian schools.
Figure 3.2 shows that although the proportion of Australian female principals is in the lower range this is not an uncommon phenomenon when compared to other OECD countries.
Figure 3.2: Gender and age distribution of principals: Percentage of female principals in OECD lower secondary education and age of principals
Female Under 40 years 40–49 years 50–59 years 60 years or more
0%
10%
20%
30%
40%
50%
60%
70%
80%
90%
100%
Kore
a
Japa
n
Italy
Fran
ce
Norw
ay
Denm
ark
Swed
en
Austr
alia
Portu
gal
Esto
nia
Czec
h Re
publ
ic
Polan
d
Neth
erlan
ds
Chile
Icelan
d
Engl
and
(Uni
ted K
ingd
om)
TALI
S Av
erag
e
Finl
and
Mex
ico
Slov
ak R
epub
lic
Flan
ders
(Belg
ium
)
Albe
rta (C
anad
a)
Israe
l
Spain
Countries are ranked in descending order, based on the percentage of principals who are under 40 years old.Source: OECD, TALIS 2013 Database

51
Teaching and Learning International Survey – Australian Report
Principals’ years of experience
Table 3.7 below shows the relative experience of principals as teachers and principals compared to the comparison groups. Here we see that there is a substantial difference in the experience of Australian principals in their professional careers as teachers compared to the TALIS average. When these data are considered in conjunction with the mean experience as a principal (Table 3.10), it is apparent that, on average, Australian principals serve a longer period in classrooms and in executive roles before being promoted to the school principalship.
Table 3.7: Experience of principals: Mean years of experience of principals in lower secondary education, as a teacher prior to appointment as a principal, and as a principal
Experience as Teacher Experience as Principal
Mean Yrs (S.E) Mean Yrs (S.E)
Australia 2013Female 27.6 (1.2) 6.6 (0.7)
Male 26.2 (1.5) 8.8 (0.8)
TALIS AverageFemale 20.7 (0.2) 7.9 (0.2)
Male 20.2 (0.2) 10 (0.2)
Asian AverageFemale 25.8 (0.7) 5.2 (0.2)
Male 24.1 (0.4) 5.4 (0.3)
OECD AverageFemale 21.3 (0.3) 7.8 (0.2)
Male 20.5 (0.2) 10 (0.2)
PISA Best AverageFemale 22.7 (0.6) 7.5 (0.4)
Male 21.2 (0.4) 9.2 (0.3)
The ‘Experience as a Teacher’ and ‘Experience as a Principal’ statistics collected in 2008 were variables grouped by category and not comparable with the 2013 statistic.Source: OECD, TALIS 2013
Formal education of school principals
Branch, Hanushek and Rivkin (2013) argue that because school leaders affect the achievement of all the students in a school, improving the quality of school leadership is more important than improving the quality of a single teacher’s practice. This section investigates the formal education of principals and their subsequent involvement with pre-service preparation as a principal and in-service development through professional development courses.
Given the complexity of the position and the fact that most principals typically begin their careers as teachers, it is not surprising that all Australian principals have formal education at ISCED level 5A18 or above (Table 3.8). This statistic is approximated only by the Asian group in relation to the comparative groups investigated and indicates that Australian principals are required to be well qualified as a pre-requisite of the role.
18 ISCED level 5A typically includes Bachelor’s degrees and Master’s degrees from universities or equivalent institutions. See Chapter 2 for a description of the ISCED levels of classification.

52
Teaching and Learning International Survey – Australian Report
Table 3.8: Principals’ educational attainment: Percentage of principals in lower secondary education by highest level of formal education completed1
Highest level of formal education completed
Below ISCED level 5 ISCED level 5B2 ISCED level 5A2 ISCED level 6
% (S.E.) % (S.E.) % (S.E.) % (S.E.)
Australia 2008 0.3 (0.10) 1.0 (0.25) 96.5 (0.89) 2.2 (0.33)
Australia 2013 0.0 (0.0) 0.0 (0.0) 97.0 (1.6) 3.0 (1.6)
TALIS Average 0.6 (0.1) 3.9 (0.3) 92.5 (0.4) 3.2 (0.3)
Asian Average 0.1 (0.1) 0.1 (0.1) 98.1 (0.4) 1.7 (0.4)
OECD Average 0.7 (0.2) 4.4 (0.3) 91.6 (0.5) 3.5 (0.3)
PISA Best Average 0.2 (0.1) 4.7 (0.6) 92.9 (0.7) 2.2 (0.4)
1. The wording and order of questions may have changed slightly between the 2008 and 2013 surveys.2. Education categories are based on the International Standard Classification of Education (ISCED 1997). ISCED
Level 5A programmes are generally longer and more theory-based, while 5B programmes are typically shorter and more practical and skills oriented. No distinction was made between ISCED Level 5A (Bachelor) and ISCED Level 5A (Master).
Source: OECD, TALIS 2013 Database
Given the complexities of a principal’s role and the manner in which it differs from the roles and responsibilities of a teacher, it is reasonable to expect that specific formal education programs would accompany promotion to the role in the same way in which teachers are inducted into the profession.
In relation to their formal education, Table 3.9 shows that over one-third of Australian principals have had no formal school administration or principal training programs and nearly one-third have not engaged in any forms of instructional leadership training or courses.
Table 3.9 shows that the major source of preparation for the principal role is through in-service experiences as teachers and administrators in school executive positions.
In relation to pre-appointment, or in-service courses, the Australian statistic is significantly weaker than all the comparison groups, particularly given the demands on principals to provide pedagogical and curriculum leadership (see Tables 3.1 and 3.2) seems paradoxical that, in at least one-third of cases, these skills are acquired through the administrative and executive experiences of teachers and school leadership positions without any formal training to support instructional leadership with a consolidated theory and shared practice from the wider educational community.
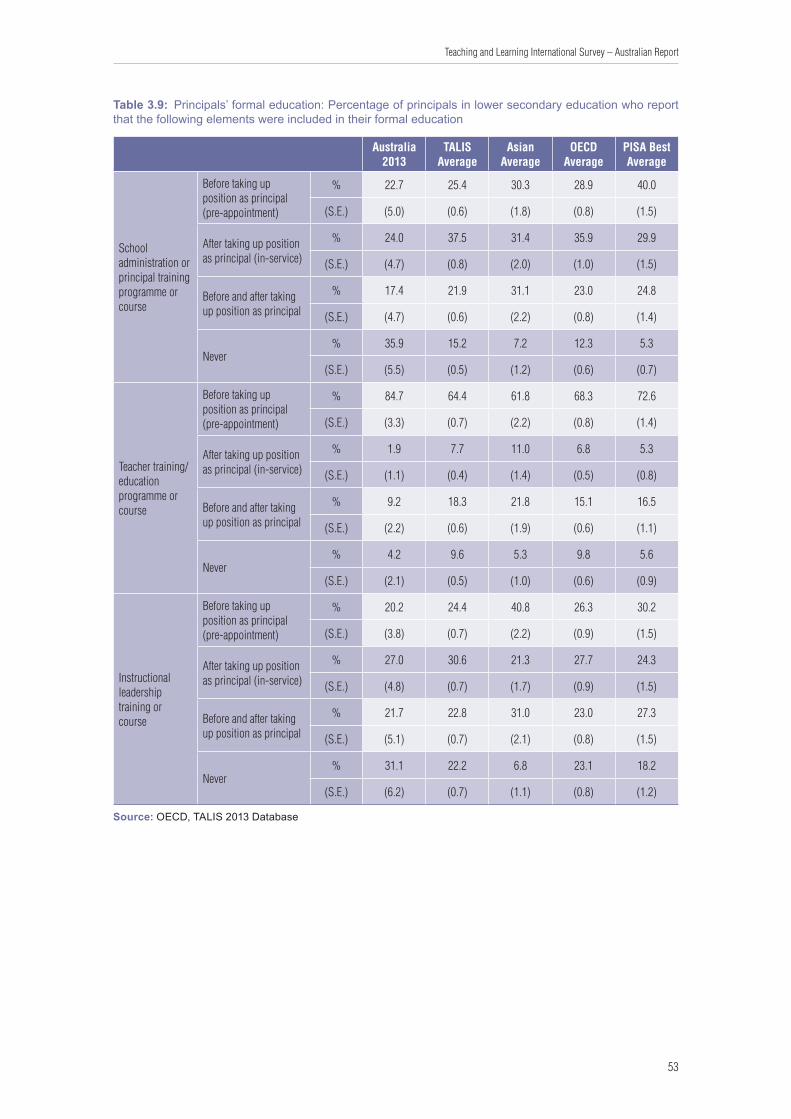
53
Teaching and Learning International Survey – Australian Report
Table 3.9: Principals’ formal education: Percentage of principals in lower secondary education who report that the following elements were included in their formal education
Australia 2013
TALIS Average
Asian Average
OECD Average
PISA Best Average
School administration or principal training programme or course
Before taking up position as principal (pre-appointment)
% 22.7 25.4 30.3 28.9 40.0
(S.E.) (5.0) (0.6) (1.8) (0.8) (1.5)
After taking up position as principal (in-service)
% 24.0 37.5 31.4 35.9 29.9
(S.E.) (4.7) (0.8) (2.0) (1.0) (1.5)
Before and after taking up position as principal
% 17.4 21.9 31.1 23.0 24.8
(S.E.) (4.7) (0.6) (2.2) (0.8) (1.4)
Never% 35.9 15.2 7.2 12.3 5.3
(S.E.) (5.5) (0.5) (1.2) (0.6) (0.7)
Teacher training/education programme or course
Before taking up position as principal (pre-appointment)
% 84.7 64.4 61.8 68.3 72.6
(S.E.) (3.3) (0.7) (2.2) (0.8) (1.4)
After taking up position as principal (in-service)
% 1.9 7.7 11.0 6.8 5.3
(S.E.) (1.1) (0.4) (1.4) (0.5) (0.8)
Before and after taking up position as principal
% 9.2 18.3 21.8 15.1 16.5
(S.E.) (2.2) (0.6) (1.9) (0.6) (1.1)
Never% 4.2 9.6 5.3 9.8 5.6
(S.E.) (2.1) (0.5) (1.0) (0.6) (0.9)
Instructional leadership training or course
Before taking up position as principal (pre-appointment)
% 20.2 24.4 40.8 26.3 30.2
(S.E.) (3.8) (0.7) (2.2) (0.9) (1.5)
After taking up position as principal (in-service)
% 27.0 30.6 21.3 27.7 24.3
(S.E.) (4.8) (0.7) (1.7) (0.9) (1.5)
Before and after taking up position as principal
% 21.7 22.8 31.0 23.0 27.3
(S.E.) (5.1) (0.7) (2.1) (0.8) (1.5)
Never% 31.1 22.2 6.8 23.1 18.2
(S.E.) (6.2) (0.7) (1.1) (0.8) (1.2)
Source: OECD, TALIS 2013 Database
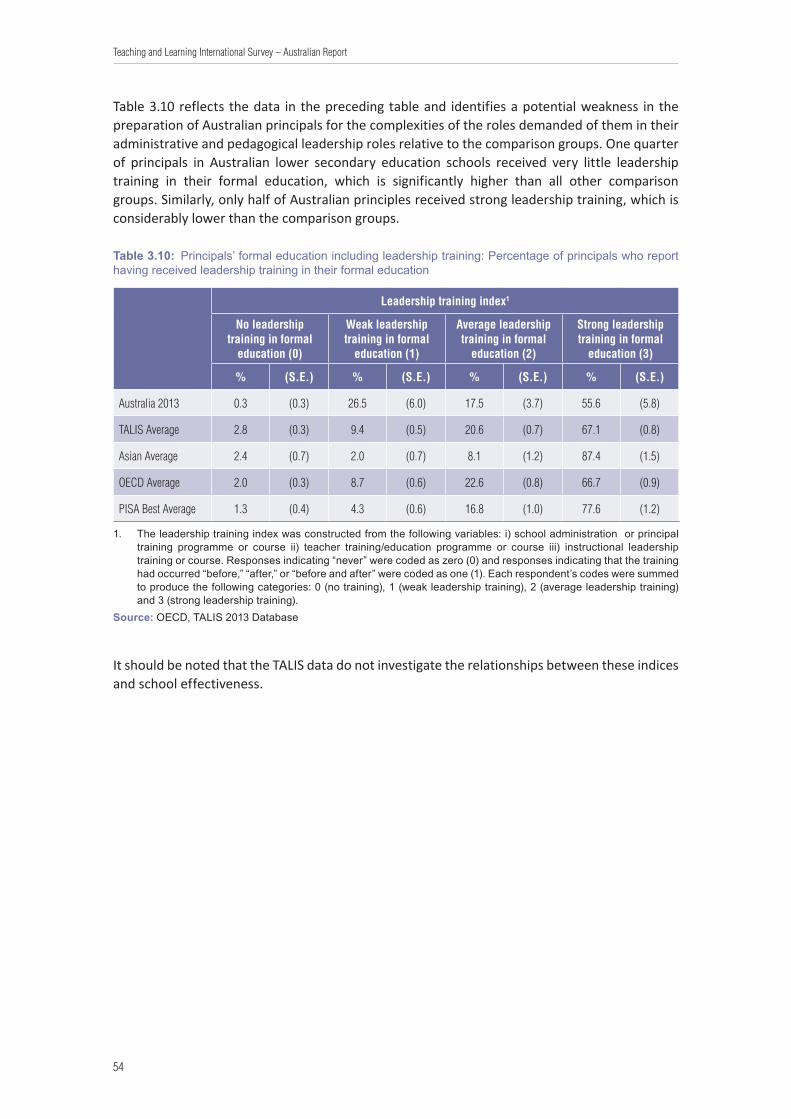
54
Teaching and Learning International Survey – Australian Report
Table 3.10 reflects the data in the preceding table and identifies a potential weakness in the preparation of Australian principals for the complexities of the roles demanded of them in their administrative and pedagogical leadership roles relative to the comparison groups. One quarter of principals in Australian lower secondary education schools received very little leadership training in their formal education, which is significantly higher than all other comparison groups. Similarly, only half of Australian principles received strong leadership training, which is considerably lower than the comparison groups.
Table 3.10: Principals’ formal education including leadership training: Percentage of principals who report having received leadership training in their formal education
Leadership training index1
No leadership training in formal
education (0)
Weak leadership training in formal
education (1)
Average leadership training in formal
education (2)
Strong leadership training in formal
education (3)
% (S.E.) % (S.E.) % (S.E.) % (S.E.)
Australia 2013 0.3 (0.3) 26.5 (6.0) 17.5 (3.7) 55.6 (5.8)
TALIS Average 2.8 (0.3) 9.4 (0.5) 20.6 (0.7) 67.1 (0.8)
Asian Average 2.4 (0.7) 2.0 (0.7) 8.1 (1.2) 87.4 (1.5)
OECD Average 2.0 (0.3) 8.7 (0.6) 22.6 (0.8) 66.7 (0.9)
PISA Best Average 1.3 (0.4) 4.3 (0.6) 16.8 (1.0) 77.6 (1.2)
1. The leadership training index was constructed from the following variables: i) school administration or principal training programme or course ii) teacher training/education programme or course iii) instructional leadership training or course. Responses indicating “never” were coded as zero (0) and responses indicating that the training had occurred “before,” “after,” or “before and after” were coded as one (1). Each respondent’s codes were summed to produce the following categories: 0 (no training), 1 (weak leadership training), 2 (average leadership training) and 3 (strong leadership training).
Source: OECD, TALIS 2013 Database
It should be noted that the TALIS data do not investigate the relationships between these indices and school effectiveness.

55
Teaching and Learning International Survey – Australian Report
Figure 3.3 displays the relative position of Australian principals with regard to leadership training in their formal education.
It shows Australia to be on par with England but significantly below OECD countries that feature in the PISA best group who out-performed Australia in PISA 2012, such as Japan, Korea, Netherlands, Sweden and Finland. Although this relationship cannot be assumed to be causal, it is noteworthy.
Figure 3.3: Principals’ formal education, including leadership training: Percentage of principals who report having received leadership training in their formal education1
No leadership training in formal education (0)
Weak leadership training in formal education (1)
Average leadership training in formal education (2)
Strong leadership training in formal education (3)
0%
10%
20%
30%
40%
50%
60%
70%
80%
90%
100%
Portu
gal
Polan
d
Denm
ark
Czec
h Re
publ
ic
Spain
Engl
and
(Uni
ted K
ingd
om)
Austr
alia
Israe
l
Fran
ce
Italy
Norw
ay
TALI
S Av
erag
e
Finl
and
Flan
ders
(Belg
ium
)
Mex
ico
Icelan
d
Swed
en
Albe
rta (C
anad
a)
Neth
erlan
ds
Esto
nia
Sing
apor
e
Kore
a
Japa
n
1. Leadership training index was constructed from the following variables: i) School administration or principal training programme or course ii) Teacher training/education programme or course iii) Instructional leadership training or course. Responses indicating “never” were coded as zero (0) and responses indicating that the training had occurred “before,” “after,” or “before and after” were coded as one (1). Each respondent’s codes were summed to produce the following categories: 0 (no training), 1 (weak leadership training), 2 (average leadership training) and 3 (strong leadership training).
2. Not all participating countries are displayed in this figure.Source: OECD, TALIS 2013 Database

56
Teaching and Learning International Survey – Australian Report
Box 3.1 describes the curriculum recommended by the Stanford Educational Leadership Institute of an exemplary program for the development of strong leaders and proffers common characteristics that provide a useful starting point for the conduct and appraisal of leadership preparation programs.
Box 3.1 Characteristics of exemplary leadership programs
Commissioned by the Wallace Foundation, a study by the Stanford Educational Leadership Institute examined eight exemplary pre-service and in-service program models that develop strong educational leaders. All of the programs of initial preparation that were characterised as exemplary shared the following characteristics:
• a comprehensive and coherent curriculum aligned with professional standards
• a philosophy and curriculum that explicitly focus on instructional leadership and school improvement
• student-centered instruction that integrates theory and practice and stimulates reflection
• faculty knowledgeable about their subject areas and experienced in school administration
• social and professional support in the form of a cohort structure and formalized mentoring and advising by expert principals
• vigorous, targeted recruitment and selection to seek out expert teachers with leadership potential
• well-designed and supervised administrative internships under the guidance of expert veterans.
Source: Darling-Hammond et al. (2007)
Principals’ work experience
Although there may be limitations in the formal preparation of Australian principals for the appointment to a leadership role, there is general agreement that experience in all facets of the teaching environment is a strong platform to develop the skills to assume the role.
This section examines the profile of Australian principals in relation to their experiences in the professions prior to, and currently engaged in, their appointment as principals. The data in Tables 3.11 and 3.12 relate to their relative experiences as current or previous principals, their service in school management roles and as teachers overall, and any other jobs that have been experienced outside the teaching arena.
The data shows that, on average, Australian principals tend to have longer ‘apprenticeships’ in school management roles and as teachers than the comparative groups, and on average they have similar average tenure in their current roles as other comparative countries.
The longer pre-principal experiences may contribute to the relatively low proportion of long serving principals (more than 20 years’ experience) observed in Table 3.11.
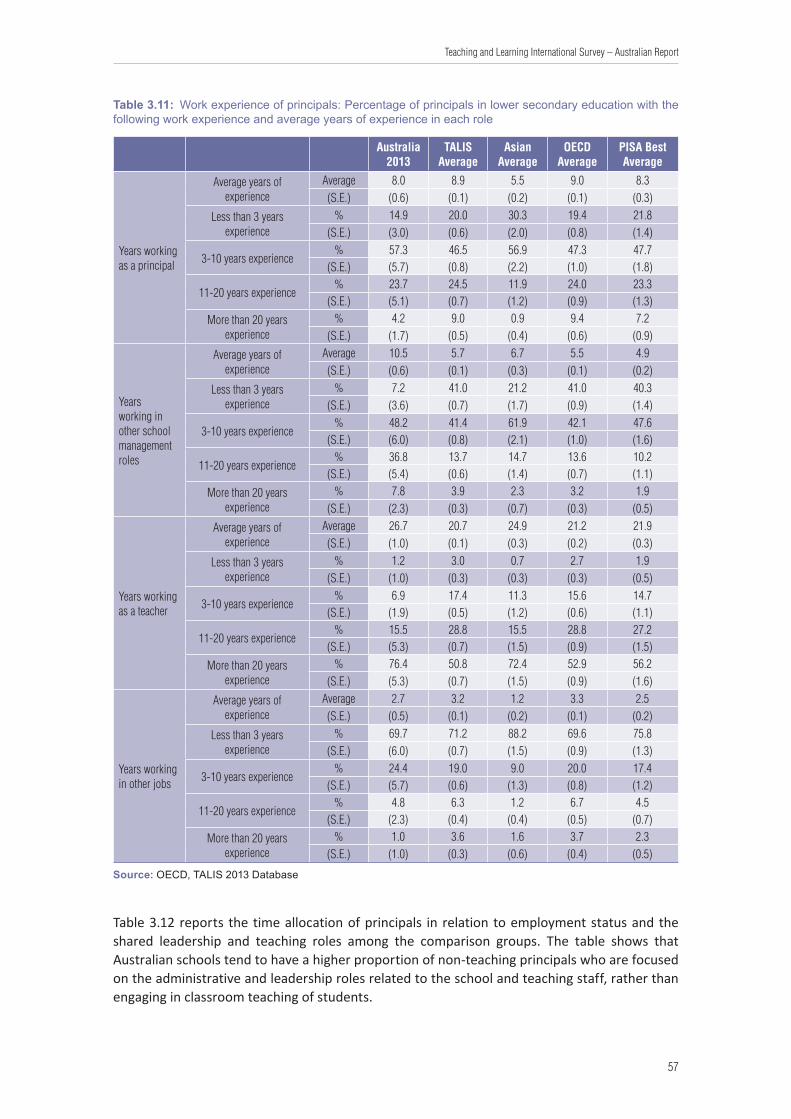
57
Teaching and Learning International Survey – Australian Report
Table 3.11: Work experience of principals: Percentage of principals in lower secondary education with the following work experience and average years of experience in each role
Australia 2013
TALIS Average
Asian Average
OECD Average
PISA Best Average
Years working as a principal
Average years of experience
Average 8.0 8.9 5.5 9.0 8.3(S.E.) (0.6) (0.1) (0.2) (0.1) (0.3)
Less than 3 years experience
% 14.9 20.0 30.3 19.4 21.8(S.E.) (3.0) (0.6) (2.0) (0.8) (1.4)
3-10 years experience% 57.3 46.5 56.9 47.3 47.7
(S.E.) (5.7) (0.8) (2.2) (1.0) (1.8)
11-20 years experience% 23.7 24.5 11.9 24.0 23.3
(S.E.) (5.1) (0.7) (1.2) (0.9) (1.3)
More than 20 years experience
% 4.2 9.0 0.9 9.4 7.2(S.E.) (1.7) (0.5) (0.4) (0.6) (0.9)
Years working in other school management roles
Average years of experience
Average 10.5 5.7 6.7 5.5 4.9(S.E.) (0.6) (0.1) (0.3) (0.1) (0.2)
Less than 3 years experience
% 7.2 41.0 21.2 41.0 40.3(S.E.) (3.6) (0.7) (1.7) (0.9) (1.4)
3-10 years experience% 48.2 41.4 61.9 42.1 47.6
(S.E.) (6.0) (0.8) (2.1) (1.0) (1.6)
11-20 years experience% 36.8 13.7 14.7 13.6 10.2
(S.E.) (5.4) (0.6) (1.4) (0.7) (1.1)
More than 20 years experience
% 7.8 3.9 2.3 3.2 1.9(S.E.) (2.3) (0.3) (0.7) (0.3) (0.5)
Years working as a teacher
Average years of experience
Average 26.7 20.7 24.9 21.2 21.9(S.E.) (1.0) (0.1) (0.3) (0.2) (0.3)
Less than 3 years experience
% 1.2 3.0 0.7 2.7 1.9(S.E.) (1.0) (0.3) (0.3) (0.3) (0.5)
3-10 years experience% 6.9 17.4 11.3 15.6 14.7
(S.E.) (1.9) (0.5) (1.2) (0.6) (1.1)
11-20 years experience% 15.5 28.8 15.5 28.8 27.2
(S.E.) (5.3) (0.7) (1.5) (0.9) (1.5)
More than 20 years experience
% 76.4 50.8 72.4 52.9 56.2(S.E.) (5.3) (0.7) (1.5) (0.9) (1.6)
Years working in other jobs
Average years of experience
Average 2.7 3.2 1.2 3.3 2.5(S.E.) (0.5) (0.1) (0.2) (0.1) (0.2)
Less than 3 years experience
% 69.7 71.2 88.2 69.6 75.8(S.E.) (6.0) (0.7) (1.5) (0.9) (1.3)
3-10 years experience% 24.4 19.0 9.0 20.0 17.4
(S.E.) (5.7) (0.6) (1.3) (0.8) (1.2)
11-20 years experience% 4.8 6.3 1.2 6.7 4.5
(S.E.) (2.3) (0.4) (0.4) (0.5) (0.7)
More than 20 years experience
% 1.0 3.6 1.6 3.7 2.3(S.E.) (1.0) (0.3) (0.6) (0.4) (0.5)
Source: OECD, TALIS 2013 Database
Table 3.12 reports the time allocation of principals in relation to employment status and the shared leadership and teaching roles among the comparison groups. The table shows that Australian schools tend to have a higher proportion of non-teaching principals who are focused on the administrative and leadership roles related to the school and teaching staff, rather than engaging in classroom teaching of students.

58
Teaching and Learning International Survey – Australian Report
Table 3.12: Employment status of principals: Percentage of full time and part time principals in lower secondary education with and without teaching obligations
Full time without teaching obligations1
Full time with teaching obligations1
Part time without teaching obligations2
Part time with teaching obligations2
% (S.E.) % (S.E.) % (S.E.) % (S.E.)
Australia 2013 78.9 (5.1) 20.6 (5.1) 0.5 (0.5) 0.0 (0.0)
TALIS Average 62.4 (0.6) 35.4 (0.6) 1.2 (0.2) 3.4 (0.3)
Asian Average 75.1 (0.6) 24.9 (0.6) 0.0 (0.0) 0.0 (0.0)
OECD Average 64.6 (0.8) 34.4 (0.8) 1.2 (0.2) 2.9 (0.4)
PISA Best Average 70.3 (1.2) 26.3 (1.3) 1.2 (0.4) 2.2 (0.6)
Source: OECD, TALIS 2013 Database
Principals’ professional development
Table 3.13 shows the interactions of Australian principals with a broad classification of professional development activities in the twelve months preceding the implementation of the TALIS survey in term four of the 2012 Australian school calendar.
The data shows that there are few principals in Australia who did not participate in any form of development activities in the target period, with high proportions of participation in professional networks, mentoring or research activities and courses, conferences or observation visits. However, it is notable that the commitment to these activities tends to be on a lesser scale, and on a fewer number of days than each of the comparison groups for each category.

59
Teaching and Learning International Survey – Australian Report
Table 3.13: Principals’ recent professional development: Participation rates, types and average number of days of professional development reported to be undertaken by principals in lower secondary education in the 12 months prior to the survey
Australia 2013
TALIS Average
Asian Average
OECD Average
PISA Best Average
Percentage of principals who did not participate in any professional development
% 3.1 9.5 5.4 9.3 4.4
(S.E.) (3.0) (0.4) (1.0) (0.5) (0.7)
Percentage of principals who participated in a professional network, mentoring or research activity
% 84.2 51.1 73.3 51.4 64.4
(S.E.) (3.7) (0.7) (1.9) (0.9) (1.7)
Average number of days among those who participated in the above activities
Average 7.6 20.2 11.4 19.9 9.7
(S.E.) (0.6) (2.5) (0.9) (3.4) (1.0)
Percentage of principals who participated in courses, conferences or observation visits
% 93.4 83.4 91.8 84.2 92.2
(S.E.) (3.5) (0.5) (1.3) (0.6) (0.9)
Average number of days among those who participated in the above activities
Average 8.1 12.6 13.0 10.6 9.7
(S.E.) (0.6) (0.5) (0.8) (0.4) (0.5)
Percentage of principals who participated in other types of professional development activities
% 36.4 33.5 42.2 31.2 35.9
(S.E.) (5.1) (0.7) (2.0) (0.9) (1.6)
Average number of days among those who participated in the above activities
Average 4.5 10.4 8.8 9.8 6.7
(S.E.) (0.7) (0.7) (1.5) (0.8) (0.8)
Source: OECD, TALIS 2013 Database
The principal survey specifically asked participants what the major impediments were to their participating in professional development activities. The responses to the major categories are presented in Table 3.14 below.

60
Teaching and Learning International Survey – Australian Report
Table 3.14: Barriers to principals’ participation in professional development: Percentage of principals in lower secondary education who ‘agree’ or ‘strongly agree’ that the following presented barriers to their participation in professional development
Australia 2013
TALIS Average
Asian Average
OECD Average
PISA Best Average
Missing prerequisites% 0.6 7.2 13.7 7.5 8.4
(S.E.) (0.6) (0.4) (1.5) (0.5) (1.0)
Too expensive% 31.6 29.9 18.2 28.6 23.5
(S.E.) (6.1) (0.7) (1.7) (0.9) (1.6)
Lack of employer support% 9.2 20.7 20.1 21.9 16.3
(S.E.) (2.9) (0.6) (1.7) (0.8) (1.4)
Conflicts with work schedule% 60.9 43.1 57.7 47.3 44.7
(S.E.) (5.9) (0.8) (2.1) (1.0) (1.6)
Conflicts with family responsibilities% 28.2 13.3 7.2 14.8 12.8
(S.E.) (6.1) (0.5) (1.1) (0.7) (1.0)
No relevant opportunities available% 10.5 22.4 18.0 22.8 16.9
(S.E.) (4.7) (0.6) (1.7) (0.7) (1.3)
No incentives% 34.2 35.4 23.3 35.3 24.4
(S.E.) (5.5) (0.7) (1.7) (0.9) (1.5)
Source: OECD, TALIS 2013 Database
Table 3.14 shows that Australian principals on average are supported in attending activities with only nine per cent citing ‘lack of employer support’ as a reason for non participation. Whilst expense and incentives feature prominently as barriers to participation with 32 per cent and 34 per cent respectively, principals perceive that the greatest impediment to professional development is time, with 61 per cent reporting conflicts with work schedule as the barrier to participation. When this is considered in conjunction with the relatively high proportion of respondents (28 per cent) citing conflict with family responsibilities as a barrier, these appear to be significant contributors to the results observed in Tables 3.13 and 3.14.
The International Report cites the Australian context as providing an interesting example of developing a standard for the role of the principal that takes into account the overarching goals held for schooling and the cultural context in which schooling occurs (Box 3.2). It also comments that ‘the adoption of such a standard could, over time, help elevate the status of the principal and provide guidance to their preparation, conduct and professional development’.

61
Teaching and Learning International Survey – Australian Report
Box 3.2 Strengthening the role of the principal by developing a national standard: Australia
Australia has formally recognised the importance of the role of the principal in raising student achievement, “promoting equity and excellence, creating and sustaining the conditions under which quality teaching and learning thrive, influencing, developing and delivering community expectations and government policy, contributing to the development of a 21st century education system at local, national and international levels” (Australian Institute for Teaching and School Leadership, 2011: 2). Australia has adopted a National Professional Standard for Principals (the Standard). The Standard is intended to “define the role of the principal and unify the profession nationally, to describe the professional practice of principals in a common language and to make explicit the role of quality school leadership in improving learning outcomes” (Australian Institute for Teaching and School Leadership, 2011: 1). The Standard is founded on requirements in three domains—vision and values, knowledge and understanding, and personal qualities and social and interpersonal skills—and represented in five areas of professional practice: leading teaching and learning; developing self and others; leading improvement, innovation and change; leading the management of the school; and engaging and working with the community.
Source: Australian Institute for Teaching and School Leadership (2011)
The International Report further comments that Principals engagement in professional development activities is an indicator of the value placed upon maintenance and development of professional knowledge by the individual principal and by those who employ the principal. It is thus important to stimulate interest in and opportunities for continuing professional development for principals as well as to remove the personal and professional barriers to principal participation in such activities (OECD 2014).
3.9 Principals’ leadership: Providing directions to the school and supporting teachers
Schools have multiple responsibilities, chief among them equipping students with the knowledge and dispositions they need to assume the responsibilities that come with adult citizenship. Improving student achievement, while always an important goal of schooling, has become more prominent as a consequence of increased international economic competition. The pressure to ensure that students possess an education required for a competitive economy and the accompanying demand for greater accountability for results have increased the emphasis on the principal’s instructional leadership.
Instructional leadership is evident in much of the work that principals do, including ensuring that the goals of the school are well articulated, that the school’s environment is one that is safe and conducive to learning and that teachers’ efforts are focussed on instruction and their own instructional improvement.
This section explores the impact of instructional leadership on the work principals do around setting goals and programmes, professional development planning and the time they spend on curriculum and teaching-related tasks.

62
Teaching and Learning International Survey – Australian Report
To measure instructional leadership, TALIS developed an instructional leadership index. In order to create this index, TALIS asked principals to indicate how frequently they engaged in instructional leadership activities in their school during the preceding 12 months. Response options ranged from never or rarely to very often for the following activities:
• I took actions to support co-operation among teachers to develop new teaching practices.
• I took actions to ensure that teachers take responsibility for improving their teaching skills.
• I took actions to ensure that teachers feel responsible for their students’ learning outcomes.
Instructional leadership and principals’ engagement in school and teacher development
Table 3.15 indicates that Australian principals who show high levels of instructional leadership tend to be more likely to say that they use student performance and student evaluation results to develop the school’s educational goals and programmes. Similarly, Australian principals with higher levels of instructional leadership are more likely to report working on a professional development plan for their school. In addition, in six TALIS countries (Australia, Denmark, Israel, the Netherlands, Sweden and Flanders [Belgium]), principals with higher levels of instructional leadership tend to spend more time on curriculum and teaching-related tasks.
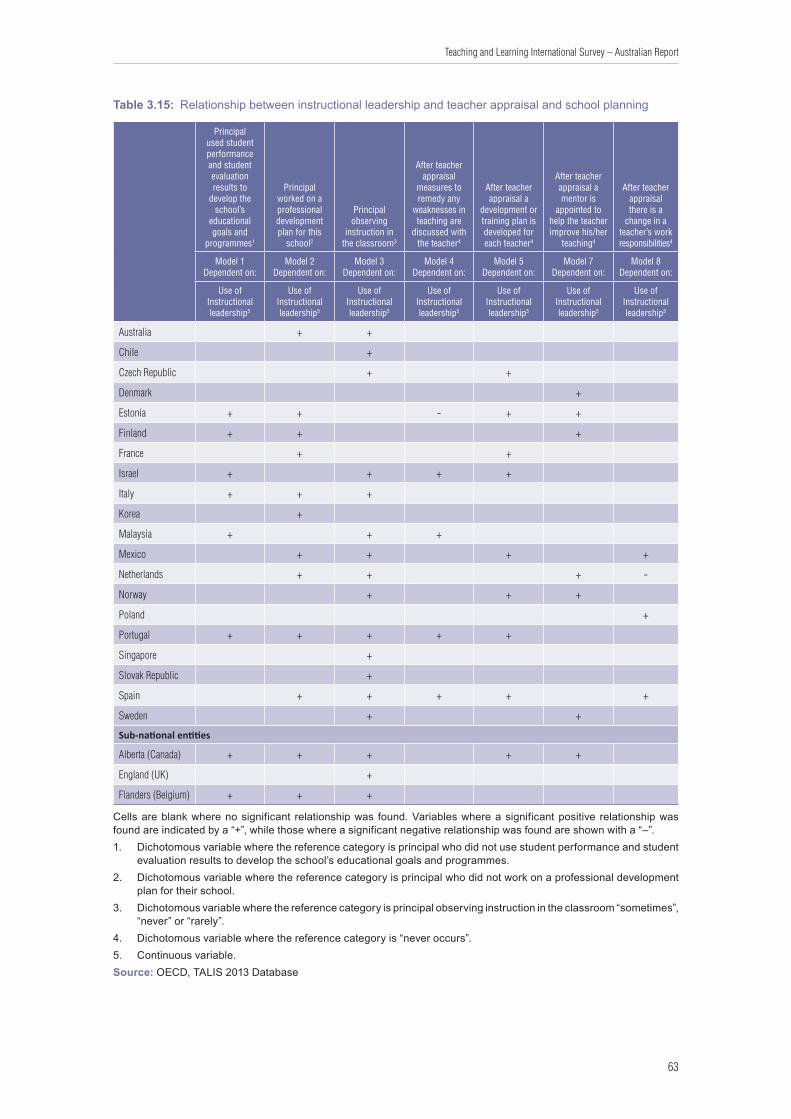
63
Teaching and Learning International Survey – Australian Report
Table 3.15: Relationship between instructional leadership and teacher appraisal and school planning
Principal used student performance and student evaluation results to
develop the school’s
educational goals and
programmes1
Principal worked on a professional development plan for this
school2
Principal observing
instruction in the classroom3
After teacher appraisal
measures to remedy any
weaknesses in teaching are
discussed with the teacher4
After teacher appraisal a
development or training plan is developed for each teacher4
After teacher appraisal a mentor is
appointed to help the teacher improve his/her
teaching4
After teacher appraisal there is a
change in a teacher’s work responsibilities4
Model 1 Dependent on:
Model 2 Dependent on:
Model 3 Dependent on:
Model 4 Dependent on:
Model 5 Dependent on:
Model 7 Dependent on:
Model 8 Dependent on:
Use of Instructional leadership5
Use of Instructional leadership5
Use of Instructional leadership5
Use of Instructional leadership5
Use of Instructional leadership5
Use of Instructional leadership5
Use of Instructional leadership5
Australia + +
Chile +
Czech Republic + +
Denmark +
Estonia + + - + +
Finland + + +
France + +
Israel + + + +
Italy + + +
Korea +
Malaysia + + +
Mexico + + + +
Netherlands + + + -
Norway + + +
Poland +
Portugal + + + + +
Singapore +
Slovak Republic +
Spain + + + + +
Sweden + +
Sub-national entities
Alberta (Canada) + + + + +
England (UK) +
Flanders (Belgium) + + +
Cells are blank where no significant relationship was found. Variables where a significant positive relationship was found are indicated by a “+”, while those where a significant negative relationship was found are shown with a “–”. 1. Dichotomous variable where the reference category is principal who did not use student performance and student
evaluation results to develop the school’s educational goals and programmes. 2. Dichotomous variable where the reference category is principal who did not work on a professional development
plan for their school. 3. Dichotomous variable where the reference category is principal observing instruction in the classroom “sometimes”,
“never” or “rarely”.4. Dichotomous variable where the reference category is “never occurs”.5. Continuous variable. Source: OECD, TALIS 2013 Database
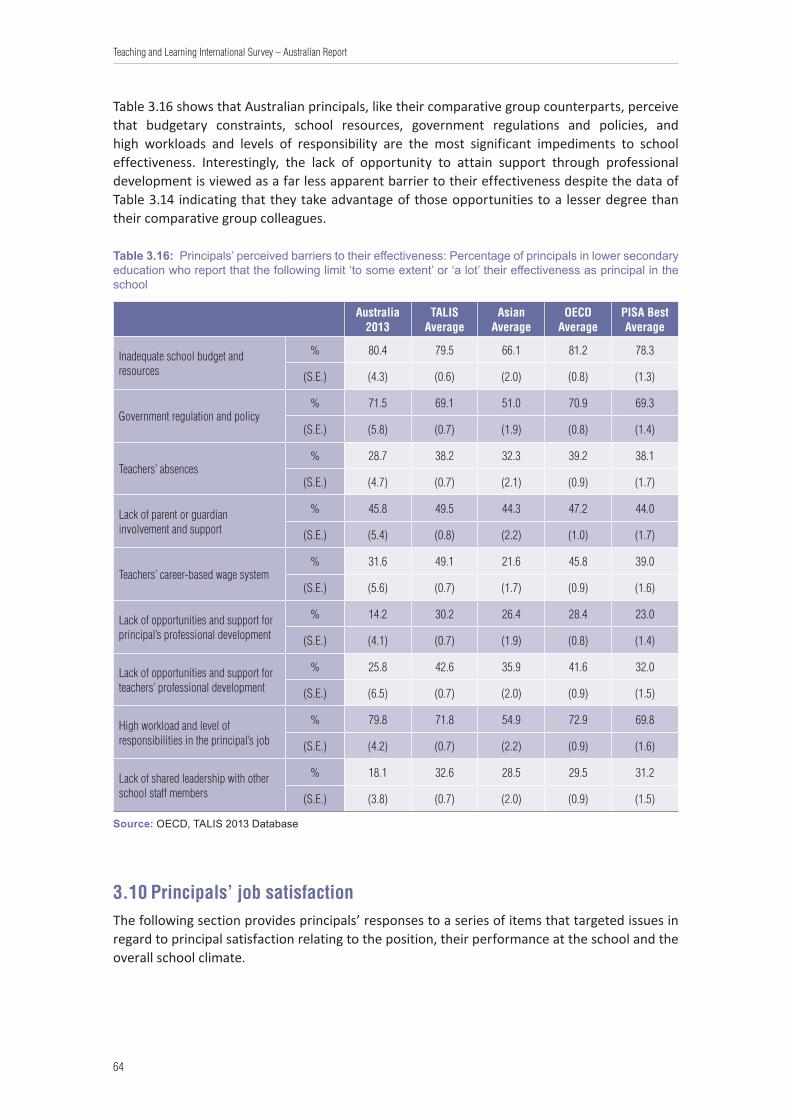
64
Teaching and Learning International Survey – Australian Report
Table 3.16 shows that Australian principals, like their comparative group counterparts, perceive that budgetary constraints, school resources, government regulations and policies, and high workloads and levels of responsibility are the most significant impediments to school effectiveness. Interestingly, the lack of opportunity to attain support through professional development is viewed as a far less apparent barrier to their effectiveness despite the data of Table 3.14 indicating that they take advantage of those opportunities to a lesser degree than their comparative group colleagues.
Table 3.16: Principals’ perceived barriers to their effectiveness: Percentage of principals in lower secondary education who report that the following limit ‘to some extent’ or ‘a lot’ their effectiveness as principal in the school
Australia 2013
TALIS Average
Asian Average
OECD Average
PISA Best Average
Inadequate school budget and resources
% 80.4 79.5 66.1 81.2 78.3
(S.E.) (4.3) (0.6) (2.0) (0.8) (1.3)
Government regulation and policy% 71.5 69.1 51.0 70.9 69.3
(S.E.) (5.8) (0.7) (1.9) (0.8) (1.4)
Teachers’ absences% 28.7 38.2 32.3 39.2 38.1
(S.E.) (4.7) (0.7) (2.1) (0.9) (1.7)
Lack of parent or guardian involvement and support
% 45.8 49.5 44.3 47.2 44.0
(S.E.) (5.4) (0.8) (2.2) (1.0) (1.7)
Teachers’ career-based wage system% 31.6 49.1 21.6 45.8 39.0
(S.E.) (5.6) (0.7) (1.7) (0.9) (1.6)
Lack of opportunities and support for principal’s professional development
% 14.2 30.2 26.4 28.4 23.0
(S.E.) (4.1) (0.7) (1.9) (0.8) (1.4)
Lack of opportunities and support for teachers’ professional development
% 25.8 42.6 35.9 41.6 32.0
(S.E.) (6.5) (0.7) (2.0) (0.9) (1.5)
High workload and level of responsibilities in the principal’s job
% 79.8 71.8 54.9 72.9 69.8
(S.E.) (4.2) (0.7) (2.2) (0.9) (1.6)
Lack of shared leadership with other school staff members
% 18.1 32.6 28.5 29.5 31.2
(S.E.) (3.8) (0.7) (2.0) (0.9) (1.5)
Source: OECD, TALIS 2013 Database
3.10 Principals’ job satisfactionThe following section provides principals’ responses to a series of items that targeted issues in regard to principal satisfaction relating to the position, their performance at the school and the overall school climate.

65
Teaching and Learning International Survey – Australian Report
The data in Table 3.17 provide an indication that Australian principals consistently demonstrate more positive perceptions of their job, their school and their career choice, compared to each of the comparative groups.
Table 3.17: Principals’ job satisfaction, detailed results: Percentage of principals in lower secondary education who ‘strongly disagree’, ‘disagree’, ‘agree’ or ‘strongly agree’ with the following statements
Australia 2013
TALIS Average
Asian Average
OECD Average
PISA Best Average
The advantages of the profession clearly outweigh the disadvantages
Strongly disagree% 2.5 2.4 1.2 2.2 1.6
(S.E.) (1.2) (0.2) (0.4) (0.3) (0.5)
Disagree% 3.7 14.3 11.0 12.6 12.6
(S.E.) (2.4) (0.5) (1.0) (0.6) (1.0)
Agree% 26.5 48.5 44.0 48.3 53.2
(S.E.) (5.0) (0.8) (2.2) (1.0) (1.8)
Strongly agree% 67.3 34.8 43.8 36.9 32.5
(S.E.) (5.7) (0.7) (2.1) (0.9) (1.6)
If I could decide again, I would still choose this job/position
Strongly disagree% 3.2 2.2 2.5 2.0 2.1
(S.E.) (2.7) (0.2) (0.6) (0.3) (0.5)
Disagree% 1.2 11.0 11.4 9.3 11.0
(S.E.) (0.8) (0.5) (1.2) (0.5) (0.9)
Agree% 30.3 45.5 39.9 45.4 48.8
(S.E.) (5.3) (0.8) (2.2) (0.9) (1.7)
Strongly agree% 65.2 41.4 46.2 43.3 38.1
(S.E.) (5.2) (0.8) (2.1) (0.9) (1.7)
I would like to change to another school if that were possible
Strongly disagree% 59.1 46.3 31.7 47.1 43.7
(S.E.) (5.7) (0.8) (2.0) (1.0) (1.7)
Disagree% 33.8 39.7 51.7 39.0 44.2
(S.E.) (5.7) (0.8) (2.1) (1.0) (1.7)
Agree% 5.2 10.4 13.3 10.3 9.1
(S.E.) (2.5) (0.5) (1.6) (0.6) (1.0)
Strongly agree% 2.0 3.6 3.3 3.7 3.0
(S.E.) (1.2) (0.3) (0.8) (0.3) (0.5)
I regret that I decided to become a principal
Strongly disagree% 77.1 56.9 57.8 60.0 53.4
(S.E.) (5.0) (0.8) (2.2) (0.9) (1.7)
Disagree% 19.7 36.8 38.6 34.2 41.5
(S.E.) (4.4) (0.8) (2.1) (0.9) (1.7)
Agree% 1.8 4.4 2.2 3.8 3.3
(S.E.) (1.6) (0.3) (0.6) (0.4) (0.6)
Strongly agree% 1.4 1.9 1.3 2.0 1.9
(S.E.) (1.4) (0.2) (0.6) (0.3) (0.5)
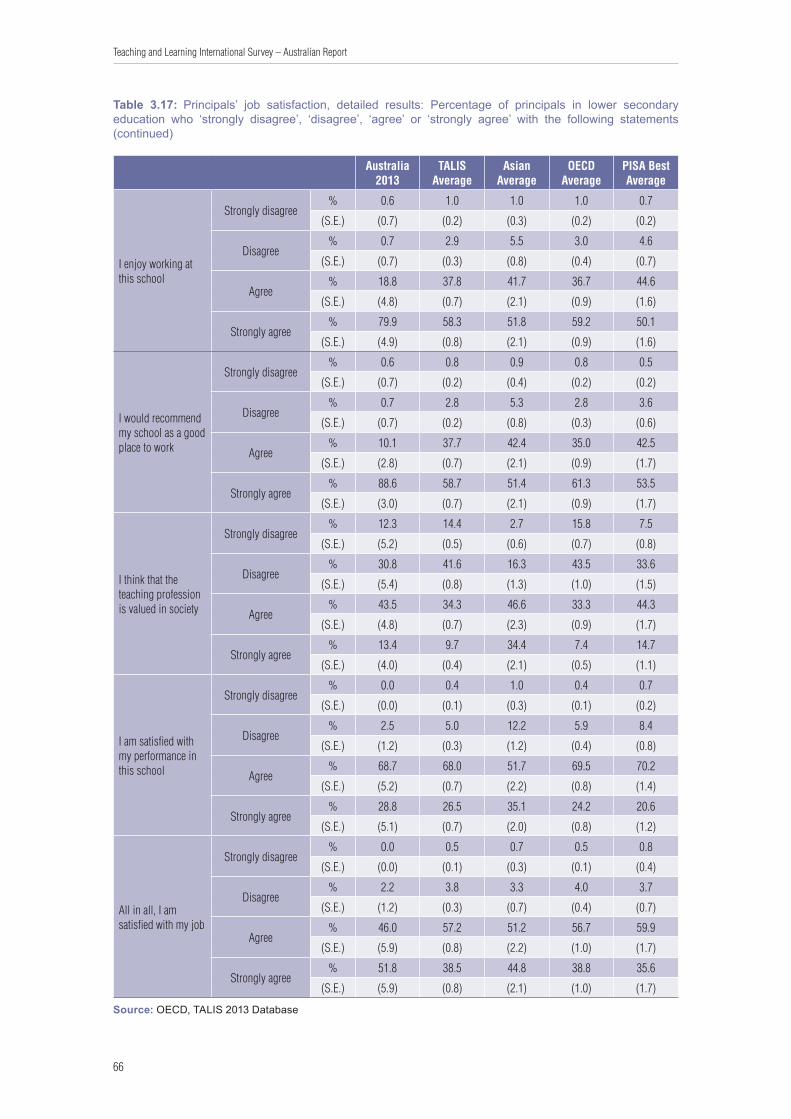
66
Teaching and Learning International Survey – Australian Report
Australia 2013
TALIS Average
Asian Average
OECD Average
PISA Best Average
I enjoy working at this school
Strongly disagree% 0.6 1.0 1.0 1.0 0.7
(S.E.) (0.7) (0.2) (0.3) (0.2) (0.2)
Disagree% 0.7 2.9 5.5 3.0 4.6
(S.E.) (0.7) (0.3) (0.8) (0.4) (0.7)
Agree% 18.8 37.8 41.7 36.7 44.6
(S.E.) (4.8) (0.7) (2.1) (0.9) (1.6)
Strongly agree% 79.9 58.3 51.8 59.2 50.1
(S.E.) (4.9) (0.8) (2.1) (0.9) (1.6)
I would recommend my school as a good place to work
Strongly disagree% 0.6 0.8 0.9 0.8 0.5
(S.E.) (0.7) (0.2) (0.4) (0.2) (0.2)
Disagree% 0.7 2.8 5.3 2.8 3.6
(S.E.) (0.7) (0.2) (0.8) (0.3) (0.6)
Agree% 10.1 37.7 42.4 35.0 42.5
(S.E.) (2.8) (0.7) (2.1) (0.9) (1.7)
Strongly agree% 88.6 58.7 51.4 61.3 53.5
(S.E.) (3.0) (0.7) (2.1) (0.9) (1.7)
I think that the teaching profession is valued in society
Strongly disagree% 12.3 14.4 2.7 15.8 7.5
(S.E.) (5.2) (0.5) (0.6) (0.7) (0.8)
Disagree% 30.8 41.6 16.3 43.5 33.6
(S.E.) (5.4) (0.8) (1.3) (1.0) (1.5)
Agree% 43.5 34.3 46.6 33.3 44.3
(S.E.) (4.8) (0.7) (2.3) (0.9) (1.7)
Strongly agree% 13.4 9.7 34.4 7.4 14.7
(S.E.) (4.0) (0.4) (2.1) (0.5) (1.1)
I am satisfied with my performance in this school
Strongly disagree% 0.0 0.4 1.0 0.4 0.7
(S.E.) (0.0) (0.1) (0.3) (0.1) (0.2)
Disagree% 2.5 5.0 12.2 5.9 8.4
(S.E.) (1.2) (0.3) (1.2) (0.4) (0.8)
Agree% 68.7 68.0 51.7 69.5 70.2
(S.E.) (5.2) (0.7) (2.2) (0.8) (1.4)
Strongly agree% 28.8 26.5 35.1 24.2 20.6
(S.E.) (5.1) (0.7) (2.0) (0.8) (1.2)
All in all, I am satisfied with my job
Strongly disagree% 0.0 0.5 0.7 0.5 0.8
(S.E.) (0.0) (0.1) (0.3) (0.1) (0.4)
Disagree% 2.2 3.8 3.3 4.0 3.7
(S.E.) (1.2) (0.3) (0.7) (0.4) (0.7)
Agree% 46.0 57.2 51.2 56.7 59.9
(S.E.) (5.9) (0.8) (2.2) (1.0) (1.7)
Strongly agree% 51.8 38.5 44.8 38.8 35.6
(S.E.) (5.9) (0.8) (2.1) (1.0) (1.7)
Source: OECD, TALIS 2013 Database
Table 3.17: Principals’ job satisfaction, detailed results: Percentage of principals in lower secondary education who ‘strongly disagree’, ‘disagree’, ‘agree’ or ‘strongly agree’ with the following statements (continued)

67
Teaching and Learning International Survey – Australian Report
3.11 Summary and main policy implicationsThese TALIS data serve to confirm what is already known: that the job of a principal encompasses a wide range of complex tasks and responsibilities. When comparing the TALIS data across countries, the extent of participation in various administrative and leadership activities by principals is found to differ significantly, either by choice, circumstance or authority. However, a majority of principals in all countries work to develop their school’s educational goals and programmes. Principals are aided in both these endeavours by the increasing availability of student performance and evaluation data. Finally, the extent to which principals share responsibility for tasks or decisions also varies by country as well as by the nature of the specific task or decision.
Develop formal programmes to prepare school leaders for principalship
On average, two thirds of Australian principals do not participate in a formal school administration or principal training programme prior to becoming a principal, with about a third of the sample reporting that they have never participated in any formal training before or since being appointed to the position.
The TALIS data clearly demonstrate that the responsibilities of principals are many and complex. It seems a reasonable contention that attention to the principals’ participation in teacher preparation programmes, school administration or principal training programmes and instructional leadership training should produce tangible benefits for students and increased professionalism for principals.
Provide opportunities for, and remove barriers to, continuing professional development for principals
The TALIS data in this area serve as an interesting profile of the profession of a principal and may be useful in supporting the development of standards for the profession as well as to help identify the kinds of initial training or professional development that might be required for this role.
In most professions that involve care for others there is a requirement that professionals maintain their currency and applicability of their professional knowledge. Australian principals report that their access to such updates is affected by many different factors, including the opportunities that are available, and in particular, having the time to take advantage of the opportunities. The percentages of principals who have engaged in collaborative professional development activities during the preceding twelve months, and the average numbers of days spent by those who participated, is quite varied with Australian principals having relatively high participation rates, but relatively few days of engagement in those activities. Like many comparative group principals, Australian principals said their work schedules conflicted with opportunities for professional development.
Given the importance of this aspect of a principal’s professional development it is imperative that systems should strive to minimise obstacles to professional development for principals, align state-supported opportunities with the country’s long-term educational goals (OECD, 2013) and set standards for high-quality professional learning. Because what they do affects the achievement of all the students in a school, principals must make improving the quality of their practice a priority and must take advantage of the opportunities afforded to them.
68
Teaching and Learning International Survey – Australian Report
Encourage the use of distributed leadership among school principals
Given a principal’s importance to the school’s operations and a principal’s impact on instruction, it is important that being a principal be, and remain, a satisfying position. Internationally, principals who feel their schools have climates of mutual respect also exhibit higher levels of job satisfaction.
Principals, through the work they do and the relationships they establish with teachers, staff and students, help to create a positive, mutually supportive climate that, in turn, contributes to their satisfaction. It is likely that personal qualities and social and interpersonal skills are among the important traits upon which successful professional practice is based. However as Australia’s standard for principals appreciates, personal qualities and social and interpersonal skills must be complemented by vision and values as well as by knowledge and understanding. These attributes should also be realised in leading learning and teaching, the development of one’s self and others, improving and innovating, managing the school, and engaging and working with the community.
The TALIS data confirm that the position of principal is very demanding both in terms of the breadth of its responsibilities and the time that those responsibilities consume. As the connection between teachers, students, their parents or guardians, the educational system and the wider community in which the school exists, principals often feel pulled in different directions by demands that they see as incompatible. One strategy for addressing those demands is to share the work and decision-making authority with others (Schleicher, 2012).
Ensure that principals receive training in, and have opportunities to, employ instructional leadership
It is reasonable to argue that instructional leadership - focusing on the teaching and learning that takes place in the school - is the most important of all of the principal’s tasks.
Internationally, the TALIS data demonstrate that when principals exhibit higher levels of instructional leadership, they are also more likely to develop a professional development plan for their school (13 countries), observe teaching as part of a teacher’s formal appraisal (20 countries) and report that there is a high level of mutual respect among colleagues at the school (17 countries). Principals with higher levels of instructional leadership tend to spend more time on curriculum and teaching-related tasks and exhibit higher levels of job satisfaction.
Thus it is obvious that instructional leadership is important in a variety of ways. Yet of all the elements that principals reported as being included in their formal education, fewer principals report taking part in instructional leadership training than in any other. Nearly one-third (31 per cent) of Australian principals report never having participated in instructional training, and 27 per cent have had this training only after they became a principal.
Given the relationships identified in the TALIS data between this aspect of the principal profile and its impact on a variety of key drivers in school effectiveness, there is a need to review the training that is provided to principals on instructional leadership and how that leadership is actually enacted at a school level. As recommended previously, there is an opportunity for additional professional development to be provided on instructional leadership, however principals need to be made aware of its importance and be familiar with its practices during their initial principal training as well.
The change in focus of the TALIS principal survey from perceptions of teachers within the school and other demographic data to an instrument that focuses on the principal has revealed a number of strengths and weaknesses in the profile of the Australian educational contexts.
69
Teaching and Learning International Survey – Australian Report
The policy implications and recommendations above address some of these issues. However these data also raise a number of issues that need further investigation which may be the focus of future TALIS instruments.
3.12 International Summary: Highlights from the International Report• Principals in countries and economies taking part in the OECD Teaching and Learning
International Survey (TALIS) have a demanding and far-ranging set of responsibilities. On average, principals spend the most time (41%) managing human and material resources, planning, reporting and adhering to regulations.
• In some countries, principals who show high levels of instructional leadership are more likely to report using student performance and student evaluation results to develop the school’s educational goals and programmes and to report working on a professional development plan for their school.
• Principals with higher levels of instructional leadership tend to spend more time on curriculum and teaching-related tasks, and in most countries they are more likely to directly observe classroom teaching as part of the formal appraisal of teachers’ work in their school.
• The gender distribution of principals differs from the gender distribution of teachers. Although the majority of teachers in all but one country are women, the proportion of female principals is generally lower.
• Across TALIS countries and economies, principals are well educated. The majority of principals have completed formal education at the tertiary level, which, on average, included participation in school administration or principal training programmes, teacher preparation programmes or instructional leadership training.
• On average across TALIS countries and economies, school principals have 21 years of teaching experience.
• While principals who report high levels of distributed leadership and instructional leadership also report higher job satisfaction, heavier workloads and lack of shared work and decision making have a negative relationship with principals’ job satisfaction.
70
Teaching and Learning International Survey – Australian Report
4. Developing and supporting teachers
4.1 OverviewThis chapter focuses on the professional development experiences of Australian lower secondary teachers. Professional development refers to the opportunities and activities undertaken to develop teachers’ skills with the ultimate aim of improving teaching practice in the classroom.
This chapter examines the self-reported data collected from Australian lower secondary teachers about their opportunities for professional development, and compares this with the international data. It begins by looking at the degree of participation in induction and mentoring programmes and the variations within countries, with the view of identifying characteristics that may explain participation in these programmes. The chapter continues by examining the range of variables that may explain the types and frequencies of these programmes; and understanding the factors that may influence teachers’ decisions regarding participation in certain activities.
Following the format of the International Report, the third part of the chapter discusses teachers’ professional development needs and the barriers preventing teachers from attaining the appropriate professional development. The chapter concludes with highlights from the TALIS International Report.
Types of Professional Development
The TALIS questionnaire asked teachers about the professional development they participated in during the 12 months prior to the survey. For Australian teachers this covered the period approximately bounded by term four 2011 through to term four 2012. Teachers were asked to indicate whether they had participated in any of the following activities:
• Courses/workshops (on subject matter or methods and/or other education- related topics).
• Education conferences or seminars (where teachers and/or researchers present their research results and discuss education problems).
• Observation visits to other schools.
• Observation visits to business premises, public organisations, or non-governmental organisations.
• In-service training courses in business premises, public organisations or non-governmental organisations.
• Qualification programmes (e.g., a degree programme).
• Participation in a network of teachers formed specifically for the professional development of teachers.
• Individual or collaborative research on a topic of professional interest.

71
Teaching and Learning International Survey – Australian Report
• Mentoring and/or peer observation and coaching as part of a formal school arrangement.
In the TALIS questionnaire, teachers were asked about the support they received for undertaking these activities, their effect, and the areas of their work that they found most in need of further development. Teachers responded to questions about the perceived barriers hindering them from completing professional development. Teachers were also asked about their participation in induction and mentoring activities. For the purposes of TALIS, induction activities refer to activities completed during the teacher’s first regular employment. In addition, TALIS asked school principals about the availability of induction and mentoring programmes in their schools.
While interpreting the results, a limitation of the present analyses of the TALIS data to consider is that the evolution of individual professional development participation, and how it adapts or responds to policy changes, is not shown. Further, as previously referred to, because TALIS is self-reporting and subjective, teachers’ responses regarding their participation in induction, mentoring and professional development activities rely on memory and perception (OECD, 2014).
4.2 Induction and mentoring programmes
Induction
To ascertain the extent to which induction and mentoring exist in lower secondary schools, TALIS 2013 synthesised the data collected from principals and teachers. Principals were asked about teacher access to induction and mentoring programmes, and teachers were asked about their participation in induction programmes in their first job as a teacher and their current participation in mentoring activities.
Formal induction for all new teachers to lower secondary schools is common practice in Australia with 91 per cent of school principals reporting the availability of such programmes. Australia is one of the leaders in the provision of induction for teachers new to a school, with over twice the percentage of principals reporting the existence of these practices than the TALIS average. In contrast, the reports of Italian principals indicate that only 11 per cent of schools offer induction for teachers new to a school, although 75 per cent of Italian secondary schools offer induction to teachers new to teaching.
In Australia, Malaysia, the Netherlands, Singapore, England (United Kingdom) and Flanders (Belgium), formal induction programs are offered to new teachers in nearly all schools. In contrast, most teachers in Brazil, Mexico, Poland, Portugal and Spain, are employed in schools that do not offer any formal induction programmes. As can be seen in Figure 4.1, the countries with a greater number of formal induction programmes are also those with more informal ones (OECD 2014).
However, in some countries large differences are observed between both types of induction programmes, for example in the Czech Republic, Estonia, Finland, Iceland, Latvia, Poland and Portugal where informal induction activities are much more frequent than formal induction activities. In contrast, in Japan, formal induction activities are much more common than informal induction programmes.
Figure 4.1 shows the percentage of lower secondary education teachers whose school principal reports the existence of formal and informal induction processes.
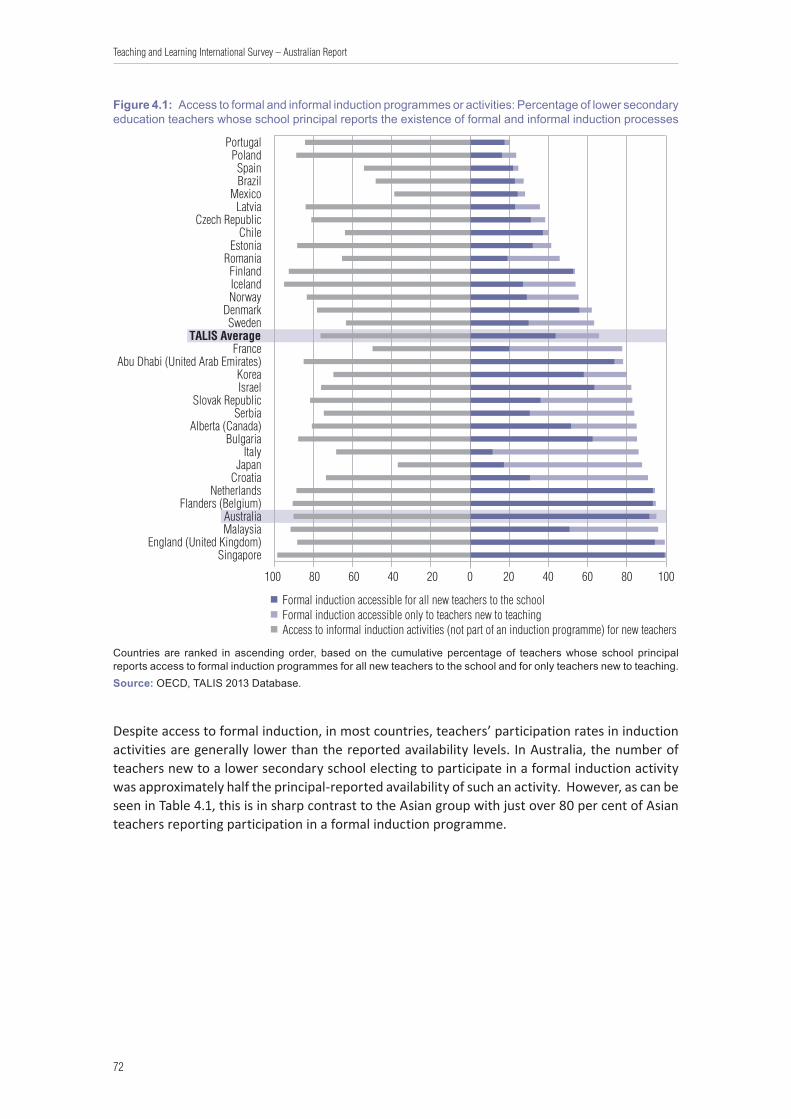
72
Teaching and Learning International Survey – Australian Report
Figure 4.1: Access to formal and informal induction programmes or activities: Percentage of lower secondary education teachers whose school principal reports the existence of formal and informal induction processes
100 80 60 40 20 0 20 40 60 80 100
SingaporeEngland (United Kingdom)
MalaysiaAustralia
Flanders (Belgium)Netherlands
CroatiaJapan
ItalyBulgaria
Alberta (Canada)Serbia
Slovak RepublicIsraelKorea
Abu Dhabi (United Arab Emirates)France
TALIS AverageSweden
DenmarkNorwayIcelandFinland
RomaniaEstonia
ChileCzech Republic
LatviaMexico
BrazilSpain
PolandPortugal
Access to informal induction activities (not part of an induction programme) for new teachersFormal induction accessible only to teachers new to teachingFormal induction accessible for all new teachers to the school
Countries are ranked in ascending order, based on the cumulative percentage of teachers whose school principal reports access to formal induction programmes for all new teachers to the school and for only teachers new to teaching.Source: OECD, TALIS 2013 Database.
Despite access to formal induction, in most countries, teachers’ participation rates in induction activities are generally lower than the reported availability levels. In Australia, the number of teachers new to a lower secondary school electing to participate in a formal induction activity was approximately half the principal-reported availability of such an activity. However, as can be seen in Table 4.1, this is in sharp contrast to the Asian group with just over 80 per cent of Asian teachers reporting participation in a formal induction programme.
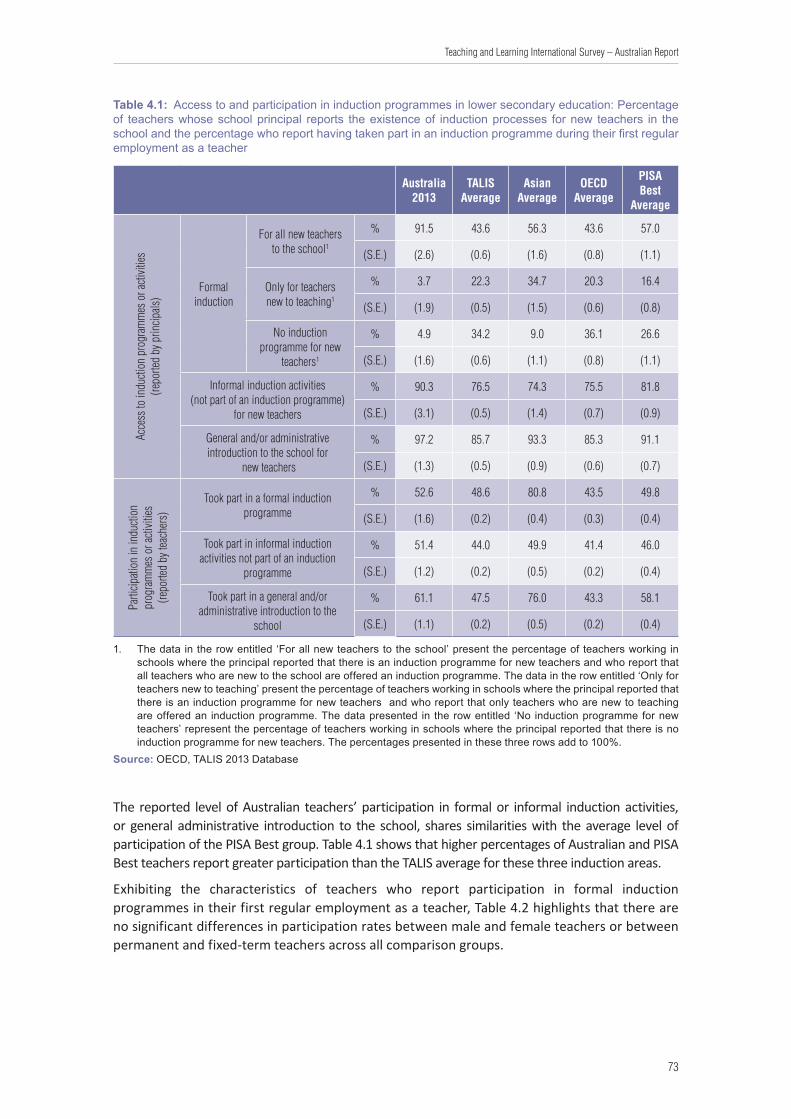
73
Teaching and Learning International Survey – Australian Report
Table 4.1: Access to and participation in induction programmes in lower secondary education: Percentage of teachers whose school principal reports the existence of induction processes for new teachers in the school and the percentage who report having taken part in an induction programme during their first regular employment as a teacher
Australia 2013
TALIS Average
Asian Average
OECD Average
PISA Best
Average
Acce
ss to
indu
ction
pro
gram
mes
or a
ctivit
ies
(repo
rted
by p
rincip
als)
Formal induction
For all new teachers to the school1
% 91.5 43.6 56.3 43.6 57.0
(S.E.) (2.6) (0.6) (1.6) (0.8) (1.1)
Only for teachers new to teaching1
% 3.7 22.3 34.7 20.3 16.4
(S.E.) (1.9) (0.5) (1.5) (0.6) (0.8)
No induction programme for new
teachers1
% 4.9 34.2 9.0 36.1 26.6
(S.E.) (1.6) (0.6) (1.1) (0.8) (1.1)
Informal induction activities (not part of an induction programme)
for new teachers
% 90.3 76.5 74.3 75.5 81.8
(S.E.) (3.1) (0.5) (1.4) (0.7) (0.9)
General and/or administrative introduction to the school for
new teachers
% 97.2 85.7 93.3 85.3 91.1
(S.E.) (1.3) (0.5) (0.9) (0.6) (0.7)
Parti
cipati
on in
indu
ction
pr
ogra
mm
es o
r acti
vities
(re
porte
d by
teac
hers
)
Took part in a formal induction programme
% 52.6 48.6 80.8 43.5 49.8
(S.E.) (1.6) (0.2) (0.4) (0.3) (0.4)
Took part in informal induction activities not part of an induction
programme
% 51.4 44.0 49.9 41.4 46.0
(S.E.) (1.2) (0.2) (0.5) (0.2) (0.4)
Took part in a general and/or administrative introduction to the
school
% 61.1 47.5 76.0 43.3 58.1
(S.E.) (1.1) (0.2) (0.5) (0.2) (0.4)
1. The data in the row entitled ‘For all new teachers to the school’ present the percentage of teachers working in schools where the principal reported that there is an induction programme for new teachers and who report that all teachers who are new to the school are offered an induction programme. The data in the row entitled ‘Only for teachers new to teaching’ present the percentage of teachers working in schools where the principal reported that there is an induction programme for new teachers and who report that only teachers who are new to teaching are offered an induction programme. The data presented in the row entitled ‘No induction programme for new teachers’ represent the percentage of teachers working in schools where the principal reported that there is no induction programme for new teachers. The percentages presented in these three rows add to 100%.
Source: OECD, TALIS 2013 Database
The reported level of Australian teachers’ participation in formal or informal induction activities, or general administrative introduction to the school, shares similarities with the average level of participation of the PISA Best group. Table 4.1 shows that higher percentages of Australian and PISA Best teachers report greater participation than the TALIS average for these three induction areas.
Exhibiting the characteristics of teachers who report participation in formal induction programmes in their first regular employment as a teacher, Table 4.2 highlights that there are no significant differences in participation rates between male and female teachers or between permanent and fixed-term teachers across all comparison groups.

74
Teaching and Learning International Survey – Australian Report
Table 4.2: Teachers’ participation in formal induction programmes, by work status and gender: Percentage of lower secondary education teachers with the following characteristics who report having participated in a formal induction programme in their first regular employment as a teacher1
Australia 2013
TALIS Average
Asian Average
OECD Average
PISA Best
Average
Gender
Male teachers% 54.7 48.9 81.3 43.8 51.0
(S.E.) (2.2) (0.4) (0.7) (0.4) (0.7)
Female teachers% 51.1 48.3 80.1 43.2 49.3
(S.E.) (2.3) (0.3) (0.5) (0.3) (0.5)
Experience
Teachers with 5 years teaching experience or less
% 71.5 51.9 81.4 47.9 56.9
(S.E.) (3.0) (0.5) (0.8) (0.6) (0.9)
Teachers with more than 5 years teaching experience
% 48.0 47.3 78.8 42.0 47.0
(S.E.) (1.7) (0.2) (0.5) (0.3) (0.4)
Work status
Permanent teachers % 52.7 49.0 83.9 43.8 49.9
(S.E.) (1.8) (0.2) (0.4) (0.3) (0.4)
Fixed-term teachers2% 51.9 45.7 64.6 40.9 49.8
(S.E.) (2.2) (0.8) (5.3) (0.6) (1.0)
Hours of work per week3
Teachers working less than 30 hours per week
% 58.1 46.1 78.3 41.0 49.1
(S.E.) (3.5) (0.4) (1.0) (0.6) (0.8)
Teachers working 30 hours per week or more
% 51.2 49.5 81.2 44.2 49.9
(S.E.) (1.7) (0.3) (0.4) (0.3) (0.4)
1. The percentages presented in this table reflect the level of participation in induction programmes based on different characteristics of the teachers. It is important to note that participation in informal induction activities not part of an induction programme and participation in a general and/or administrative introduction to the school are not taken into account in the percentages presented in this table.
2. Including teachers with fixed-term contract for a period of more than one school year and teachers with fixed-term contract for a period of one school year or less.
3. Refers to question 16 of the teacher questionnaire where teachers were asked about the approximate number of hours they spent in total on teaching, planning lessons, marking, collaborating with other teachers, participating in staff meetings and on other tasks related to their job at their school during their most recent calendar week.
Source: OECD, TALIS 2013 Database
Perhaps not surprisingly, Table 4.2 shows a greater percentage of less experienced Australian teachers participated in formal induction programmes.
As shown in Tables 4.1 and 4.2, the Asian comparison group’s participation is significantly higher than the TALIS average. The data for this group reveal more at country level. In Singapore, the proportion of more-experienced teachers who report participating in induction (69 per cent) is comparatively high. In Japan, the opposite behaviour is exhibited with less-experienced teachers participating less often than experienced teachers (although participation is still relatively high). Further, in Japan, approximately twice as many permanent teachers as fixed-term teachers report participation in induction programmes, whereas for the Asian group, the difference between these work status groups is less marked.

75
Teaching and Learning International Survey – Australian Report
The TALIS International Report provides further country specific data with further analyses indicating that teachers’ participation in formal induction is an important predictor of participation in professional development later in a teacher’s career (OECD, 2014).
Mentoring
TALIS defines mentoring as a support structure in schools where more-experienced teachers support less-experienced teachers.
As stated in the National School Improvement Tool, an effective school is one that:
‘.... encourage(s) the development of a culture of continuous professional improvement that includes classroom-based learning, mentoring and coaching arrangements.’ (Masters 2012)
The overall objective of teacher mentoring programmes is to impart the knowledge of those who are experienced to the newcomers or those with less experience.
For TALIS countries, the data show that one quarter of teachers work in schools where principals report that there is no mentoring programme in existence. For countries where mentoring programmes are offered to teachers, there is wide variation with respect to which groups of teachers they are offered to.
Table 4.3 shows the percentage of lower secondary education teachers whose school principal reports the existence of a mentoring system in the school, the characteristics of the mentors and the percentage of teachers in lower secondary education who are involved in mentoring activities.

76
Teaching and Learning International Survey – Australian Report
Table 4.3: Mentoring programmes in lower secondary education: Percentage of lower secondary education teachers whose school principal reports the existence of a mentoring system in the school, the characteristics of the mentors and the percentage of teachers in lower secondary education who are involved in mentoring activities1
Australia 2013
TALISAverage
Asian Average
OECD Average
PISA Best Average
Acce
ss to
men
torin
g pr
ogra
mm
es
(repo
rted
by p
rincip
als)
Target group of mentoring
system
Only for teachers who are new to teaching
% 18.6 27.0 38.3 24.9 21.7
(S.E.) (4.5) (0.5) (1.6) (0.7) (1.0)
For all teachers who are new to the school
% 39.3 22.2 25.7 23.3 30.1
(S.E.) (5.6) (0.6) (1.4) (0.7) (1.1)
For all teachers in the school
% 39.5 24.9 25.1 21.7 26.2
(S.E.) (6.0) (0.6) (1.5) (0.7) (1.1)
There is no access to a mentoring system for teachers in the school
% 2.6 25.8 10.8 30.1 22.0
(S.E.) (1.4) (0.6) (1.1) (0.8) (1.0)
The subject field(s) of the mentor is the
same as that of the teacher being
mentored
Most of the time% 55.3 68.1 72.6 64.2 61.9
(S.E.) (6.5) (0.8) (1.7) (1.0) (1.5)
Sometimes% 42.8 26.0 22.2 29.0 26.3
(S.E.) (6.6) (0.8) (1.6) (1.0) (1.5)
Rarely or never% 1.9 5.8 5.2 6.8 11.7
(S.E.) (1.2) (0.4) (0.8) (0.5) (1.0)
Parti
cipati
on in
m
ento
ring
prog
ram
mes
(re
porte
d by
teac
hers
)
Teachers who presently have an assigned mentor to support them
% 16.7 12.8 29.5 10.1 16.5
(S.E.) (1.4) (0.2) (0.5) (0.2) (0.3)
Teachers who serve as an assigned mentor for one or more teachers
% 28.0 14.2 29.2 13.4 18.7
(S.E.) (1.1) (0.1) (0.5) (0.2) (0.3)
1. Refers to mentoring by or for teachers at the school. Does not refer to students within teacher education programmes who are practising as teachers at the school.
Source: OECD, TALIS 2013 Database
In TALIS 2013, greater focus was given to questions regarding mentoring and hence more information collected from teachers. The proportion of mentors to mentees varies considerably across countries, although a third to half of the TALIS countries have a similar proportion to Australia.
Exhibiting higher percentages of mentoring systems available to teachers as reported by principals, Australia is well above the TALIS average and comparative group averages (with the exception of mentoring programmes for teachers who are new to teaching, the proportion of which is comparatively low). This relatively higher priority on the provision of mentoring by Australian principals is encouraging given the research providing evidence that teachers with mentoring support have higher student achievement gains (Rockoff 2008).
77
Teaching and Learning International Survey – Australian Report
TALIS asked principals to report on the frequency of a mentor sharing the same field of expertise as their mentee. Table 4.3 shows that on average 68 per cent of all TALIS teachers at schools with a mentoring system worked with a mentor of a similar subject area.
Following on from the evidence regarding access to a mentoring programme, Table 4.3 also provides information regarding participation in such activities. The TALIS averages show similar figures for teachers who report acting as either a mentee (12.8 per cent) or mentor (14.2 per cent). The percentage of Australian lower secondary teachers who report being mentored is 16.7 per cent, slightly higher than the international average; and the percentage of Australian teachers acting as mentors at 28 per cent is twice the international average. The Asian group reports a similar percentage of almost 30 per cent for mentoring or being mentored. Higher than the international average, but lower than Australia and the Asian group, the PISA Best group showed little difference in the reported percentages of teachers acting as either mentors or mentees.
However, the difference between the percentage of teachers who presently reported have a mentor assigned to them and those who reported they were acting in a mentoring role is greater in Australia than for any other TALIS country, with the exception of England and Korea. Several countries exhibit differences in the percentages of teachers reportedly receiving and administering mentoring; in these countries, the percentage of teachers receiving mentoring outweighs the percentage of mentors.
4.3 Professional Development
Participation rates
This section analyses teachers’ participation rates in a range of professional development activities. The self-reported participation rates are measured in terms of the percentage of teachers who participated in any of the professional development activities outlined previously, including formal and informal induction and mentoring programmes, during the twelve-month period prior to the survey.
Table 4.4 below shows the participation rates and reported personal financial cost of professional development activities undertaken by lower secondary education teachers in the twelve months prior to the survey. This table indicates that an average of about 88 per cent of teachers report participation in a professional development activity or activities during this period, similar to the previous cycle of TALIS wherein the average international participation rate was 89 per cent.

78
Teaching and Learning International Survey – Australian Report
Table 4.4: Teachers’ recent professional development and personal cost involved: Participation rates and reported personal financial cost of professional development activities undertaken by lower secondary education teachers in the twelve months prior to the survey
Percentage of teachers who
undertook some professional development activities in
the previous 12 months1
Percentage of teachers who
undertook some professional development activities in
the previous 12 months without
any type of support2
Percentage of teachers who had to pay for none, some or all of the professional development activities
undertaken
None Some All
% (S.E.) % (S.E.) % (S.E.) % (S.E.) % (S.E.)
Australia 96.6 (0.5) 1.2 (0.4) 75.0 (1.5) 23.5 (1.3) 1.5 (0.4)
Brazil 91.5 (0.5) 14.7 (0.9) 58.4 (1.1) 21.8 (0.7) 19.8 (1.0)
Bulgaria 85.2 (1.1) 1.4 (0.3) 84.9 (1.2) 12.1 (1.0) 3.0 (0.5)
Chile 71.7 (1.8) 11.2 (1.1) 58.9 (1.8) 23.9 (1.6) 17.2 (1.5)
Croatia 96.8 (0.3) 1.3 (0.2) 73.3 (0.9) 22.9 (0.8) 3.8 (0.4)
Cyprus3,4 89.1 (0.7) 4.7 (0.7) 81.8 (1.2) 9.7 (0.9) 8.5 (0.9)
Czech Republic 82.5 (1.0) 2.3 (0.4) 77.2 (1.1) 17.5 (0.9) 5.4 (0.6)
Denmark 86.4 (1.1) 1.5 (0.3) 84.9 (1.2) 13.3 (1.1) 1.8 (0.5)
Estonia 93.0 (0.5) 0.4 (0.1) 69.1 (1.1) 29.0 (1.0) 1.9 (0.3)
Finland 79.3 (1.0) 4.1 (0.5) 72.6 (1.1) 21.6 (1.0) 5.8 (0.6)
France 76.4 (0.9) 2.7 (0.4) 75.8 (1.1) 18.8 (1.0) 5.4 (0.6)
Iceland 91.1 (0.8) 2.6 (0.6) 60.8 (1.4) 32.9 (1.4) 6.3 (0.8)
Israel 91.1 (0.6) 10.0 (0.7) 45.0 (1.1) 40.0 (1.2) 15.0 (0.7)
Italy 75.4 (0.9) 9.5 (0.8) 69.2 (1.2) 16.6 (0.9) 14.2 (0.9)
Japan 83.2 (0.8) 6.7 (0.6) 56.4 (1.4) 32.9 (1.2) 10.7 (0.8)
Korea 91.4 (0.6) 7.5 (0.6) 25.2 (1.1) 64.1 (1.3) 10.8 (0.8)
Latvia 96.1 (0.6) 2.1 (0.5) 71.1 (1.7) 24.7 (1.6) 4.3 (0.6)
Malaysia 96.6 (0.4) 0.3 (0.1) 46.8 (1.4) 49.7 (1.4) 3.5 (0.3)
Mexico 95.6 (0.4) 10.0 (0.8) 59.5 (1.2) 26.3 (1.1) 14.3 (0.9)
Netherlands 93.2 (0.6) 2.5 (0.6) 77.5 (1.1) 18.0 (0.9) 4.5 (0.6)
Norway 87.0 (0.9) 2.5 (0.4) 81.0 (1.2) 15.3 (1.0) 3.7 (0.4)
Poland 93.7 (0.7) 7.8 (0.6) 60.9 (1.2) 26.9 (1.1) 12.2 (0.8)
Portugal 88.5 (0.7) 28.6 (1.1) 42.8 (1.3) 24.4 (0.8) 32.8 (1.1)
Romania 83.3 (1.2) 20.9 (1.1) 30.7 (1.2) 41.0 (1.3) 28.3 (1.4)
Serbia 92.9 (0.5) 5.5 (0.6) 52.7 (1.4) 36.7 (1.1) 10.6 (1.0)
Singapore 98.0 (0.3) 0.2 (0.1) 89.7 (0.5) 9.5 (0.5) 0.8 (0.1)
Slovak Republic 73.3 (1.0) 6.8 (0.9) 54.3 (1.8) 31.6 (1.4) 14.0 (1.3)
Spain 84.3 (1.0) 10.5 (0.7) 57.0 (1.2) 30.9 (1.0) 12.1 (0.8)
Sweden 83.4 (1.0) 1.6 (0.3) 86.3 (0.7) 10.7 (0.6) 3.0 (0.4)

79
Teaching and Learning International Survey – Australian Report
Percentage of teachers who
undertook some professional development activities in
the previous 12 months1
Percentage of teachers who
undertook some professional development activities in
the previous 12 months without
any type of support2
Percentage of teachers who had to pay for none, some or all of the professional development activities
undertaken
None Some All
% (S.E.) % (S.E.) % (S.E.) % (S.E.) % (S.E.)
Sub-national entities
Abu Dhabi (United Arab Emirates) 92.0 (1.3) 1.7 (0.3) 62.5 (1.8) 33.9 (1.8) 3.6 (0.5)
Alberta (Canada) 97.7 (0.4) 1.1 (0.2) 61.9 (1.5) 36.3 (1.5) 1.8 (0.4)
England (United Kingdom) 91.7 (0.7) 0.8 (0.3) 92.7 (0.7) 6.4 (0.6) 0.9 (0.3)
Flanders (Belgium) 88.2 (0.9) 2.4 (0.3) 86.8 (0.7) 9.7 (0.7) 3.5 (0.4)
TALIS Average 88.4 (0.1) 5.7 (0.1) 66.1 (0.2) 25.2 (0.2) 8.6 (0.1)
United States 95.2 (0.8) 1.7 (0.5) 74.1 (1.5) 22.8 (1.2) 3.2 (0.6)
1. Percentage of teachers who report having participated in at least one professional development activity, which may include induction and/or mentoring, in the twelve months prior to the survey.
2. Percentage of teachers participating in professional development activities without receiving financial support, time for activities that took place during the regular working hours at their school or non-monetary support for activities outside working hours.
3. Footnote by Turkey: The information in this document with reference to ‘Cyprus’ relates to the southern part of the Island. There is no single authority representing both Turkish and Greek Cypriot people on the Island. Turkey recognises the Turkish Republic of Northern Cyprus (TRNC). Until a lasting and equitable solution is found within the context of the United Nations, Turkey shall preserve its position concerning the ‘Cyprus issue’.
4. Footnote by all the European Union Member States of the OECD and the European Union: The Republic of Cyprus is recognised by all members of the United Nations with the exception of Turkey. The information in this document relates to the area under the effective control of the Government of the Republic of Cyprus.
Source: OECD, TALIS 2013 Database
Australia presented one of the highest percentages of teachers in lower secondary schools who reported that they had undertaken some sort of professional development in the 12-month period prior to the survey. Table 4.4 also shows the percentage of teachers who paid for none, some or all of their own professional development. Australia recorded better results than above the international average in this respect. Australian teachers reported that 75 per cent of professional development activities undertaken were not self-funded, compared with only two thirds for the TALIS average.
In an analysis of the characteristics of teachers engaging in professional development activities in the twelve months prior to the survey, the comparison of Australia and the specified groups reveals an homogenous set of figures across gender, experience, work status and weekly number of hours worked. All comparative groups, except OECD, demonstrated percentages above the TALIS international averages for every characteristic, as seen in Table 4.5.
Table 4.4: Teachers’ recent professional development and personal cost involved: Participation rates and reported personal financial cost of professional development activities undertaken by lower secondary education teachers in the twelve months prior to the survey (continued)
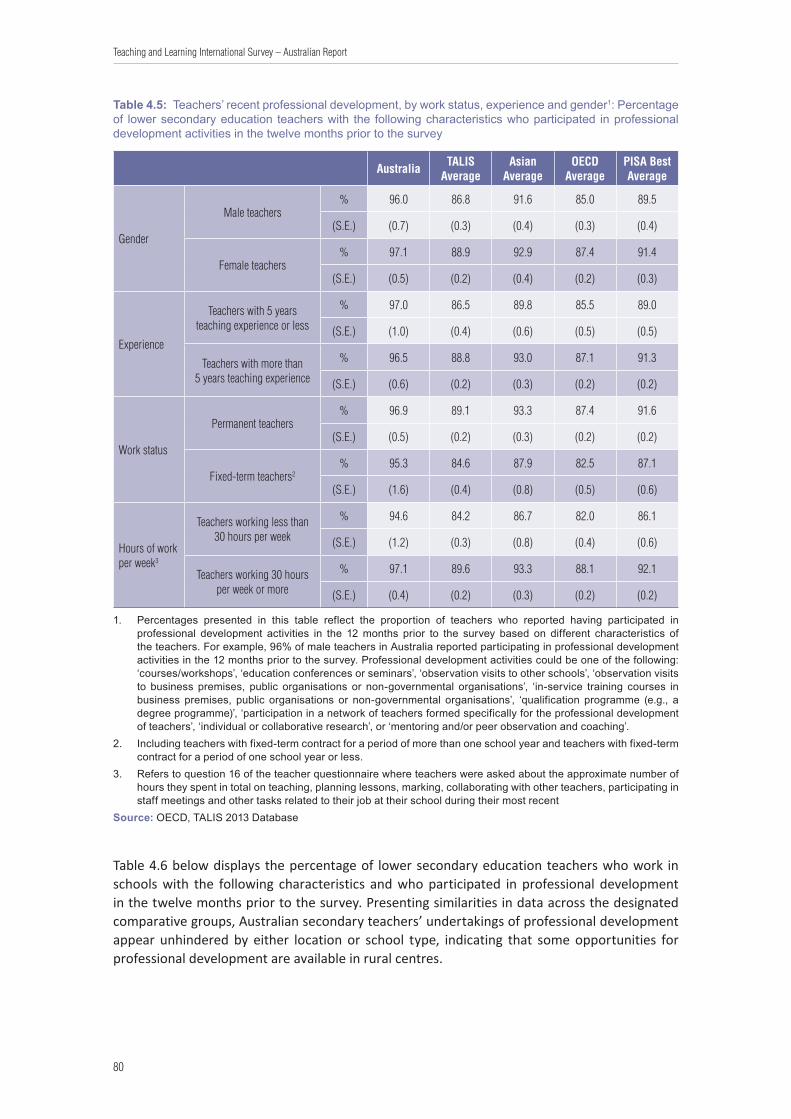
80
Teaching and Learning International Survey – Australian Report
Table 4.5: Teachers’ recent professional development, by work status, experience and gender1: Percentage of lower secondary education teachers with the following characteristics who participated in professional development activities in the twelve months prior to the survey
Australia TALIS Average
Asian Average
OECD Average
PISA Best Average
Gender
Male teachers% 96.0 86.8 91.6 85.0 89.5
(S.E.) (0.7) (0.3) (0.4) (0.3) (0.4)
Female teachers% 97.1 88.9 92.9 87.4 91.4
(S.E.) (0.5) (0.2) (0.4) (0.2) (0.3)
Experience
Teachers with 5 years teaching experience or less
% 97.0 86.5 89.8 85.5 89.0
(S.E.) (1.0) (0.4) (0.6) (0.5) (0.5)
Teachers with more than 5 years teaching experience
% 96.5 88.8 93.0 87.1 91.3
(S.E.) (0.6) (0.2) (0.3) (0.2) (0.2)
Work status
Permanent teachers % 96.9 89.1 93.3 87.4 91.6
(S.E.) (0.5) (0.2) (0.3) (0.2) (0.2)
Fixed-term teachers2% 95.3 84.6 87.9 82.5 87.1
(S.E.) (1.6) (0.4) (0.8) (0.5) (0.6)
Hours of work per week3
Teachers working less than 30 hours per week
% 94.6 84.2 86.7 82.0 86.1
(S.E.) (1.2) (0.3) (0.8) (0.4) (0.6)
Teachers working 30 hours per week or more
% 97.1 89.6 93.3 88.1 92.1
(S.E.) (0.4) (0.2) (0.3) (0.2) (0.2)
1. Percentages presented in this table reflect the proportion of teachers who reported having participated in professional development activities in the 12 months prior to the survey based on different characteristics of the teachers. For example, 96% of male teachers in Australia reported participating in professional development activities in the 12 months prior to the survey. Professional development activities could be one of the following: ‘courses/workshops’, ‘education conferences or seminars’, ‘observation visits to other schools’, ‘observation visits to business premises, public organisations or non-governmental organisations’, ‘in-service training courses in business premises, public organisations or non-governmental organisations’, ‘qualification programme (e.g., a degree programme)’, ‘participation in a network of teachers formed specifically for the professional development of teachers’, ‘individual or collaborative research’, or ‘mentoring and/or peer observation and coaching’.
2. Including teachers with fixed-term contract for a period of more than one school year and teachers with fixed-term contract for a period of one school year or less.
3. Refers to question 16 of the teacher questionnaire where teachers were asked about the approximate number of hours they spent in total on teaching, planning lessons, marking, collaborating with other teachers, participating in staff meetings and other tasks related to their job at their school during their most recent
Source: OECD, TALIS 2013 Database
Table 4.6 below displays the percentage of lower secondary education teachers who work in schools with the following characteristics and who participated in professional development in the twelve months prior to the survey. Presenting similarities in data across the designated comparative groups, Australian secondary teachers’ undertakings of professional development appear unhindered by either location or school type, indicating that some opportunities for professional development are available in rural centres.
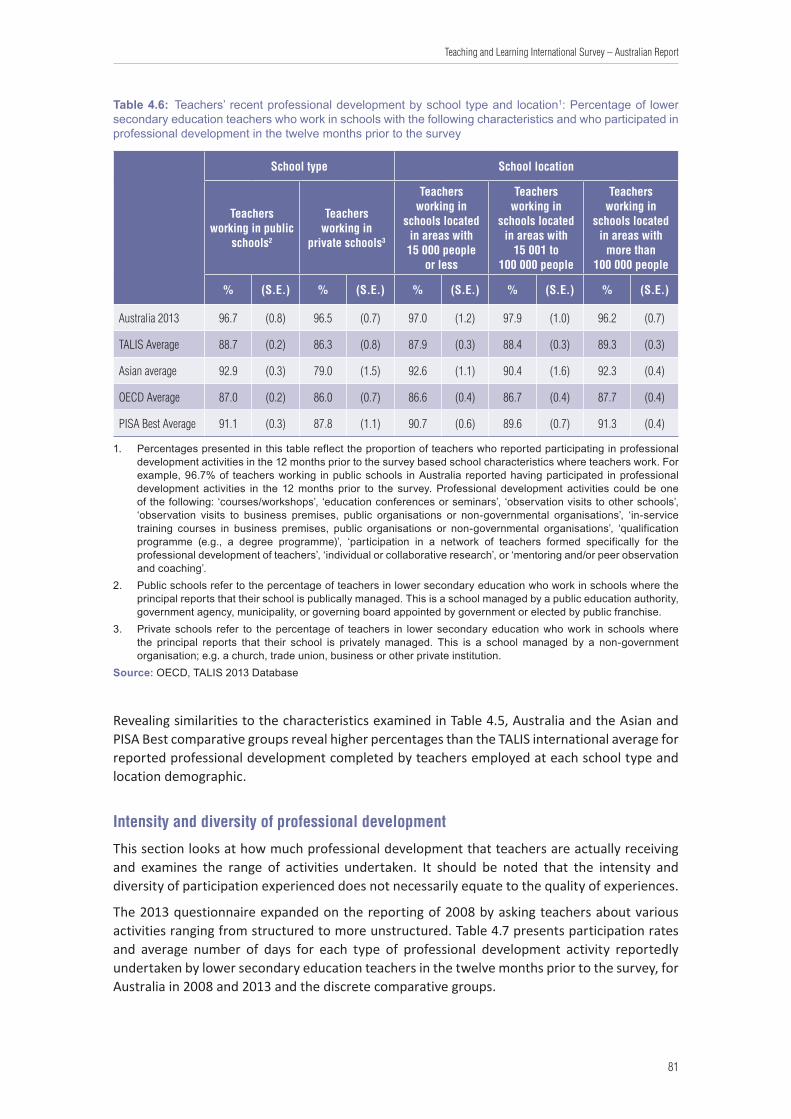
81
Teaching and Learning International Survey – Australian Report
Table 4.6: Teachers’ recent professional development by school type and location1: Percentage of lower secondary education teachers who work in schools with the following characteristics and who participated in professional development in the twelve months prior to the survey
School type School location
Teachers working in public
schools2
Teachers working in
private schools3
Teachers working in
schools located in areas with 15 000 people
or less
Teachers working in
schools located in areas with
15 001 to 100 000 people
Teachers working in
schools located in areas with
more than 100 000 people
% (S.E.) % (S.E.) % (S.E.) % (S.E.) % (S.E.)
Australia 2013 96.7 (0.8) 96.5 (0.7) 97.0 (1.2) 97.9 (1.0) 96.2 (0.7)
TALIS Average 88.7 (0.2) 86.3 (0.8) 87.9 (0.3) 88.4 (0.3) 89.3 (0.3)
Asian average 92.9 (0.3) 79.0 (1.5) 92.6 (1.1) 90.4 (1.6) 92.3 (0.4)
OECD Average 87.0 (0.2) 86.0 (0.7) 86.6 (0.4) 86.7 (0.4) 87.7 (0.4)
PISA Best Average 91.1 (0.3) 87.8 (1.1) 90.7 (0.6) 89.6 (0.7) 91.3 (0.4)
1. Percentages presented in this table reflect the proportion of teachers who reported participating in professional development activities in the 12 months prior to the survey based school characteristics where teachers work. For example, 96.7% of teachers working in public schools in Australia reported having participated in professional development activities in the 12 months prior to the survey. Professional development activities could be one of the following: ‘courses/workshops’, ‘education conferences or seminars’, ‘observation visits to other schools’, ‘observation visits to business premises, public organisations or non-governmental organisations’, ‘in-service training courses in business premises, public organisations or non-governmental organisations’, ‘qualification programme (e.g., a degree programme)’, ‘participation in a network of teachers formed specifically for the professional development of teachers’, ‘individual or collaborative research’, or ‘mentoring and/or peer observation and coaching’.
2. Public schools refer to the percentage of teachers in lower secondary education who work in schools where the principal reports that their school is publically managed. This is a school managed by a public education authority, government agency, municipality, or governing board appointed by government or elected by public franchise.
3. Private schools refer to the percentage of teachers in lower secondary education who work in schools where the principal reports that their school is privately managed. This is a school managed by a non-government organisation; e.g. a church, trade union, business or other private institution.
Source: OECD, TALIS 2013 Database
Revealing similarities to the characteristics examined in Table 4.5, Australia and the Asian and PISA Best comparative groups reveal higher percentages than the TALIS international average for reported professional development completed by teachers employed at each school type and location demographic.
Intensity and diversity of professional development
This section looks at how much professional development that teachers are actually receiving and examines the range of activities undertaken. It should be noted that the intensity and diversity of participation experienced does not necessarily equate to the quality of experiences.
The 2013 questionnaire expanded on the reporting of 2008 by asking teachers about various activities ranging from structured to more unstructured. Table 4.7 presents participation rates and average number of days for each type of professional development activity reportedly undertaken by lower secondary education teachers in the twelve months prior to the survey, for Australia in 2008 and 2013 and the discrete comparative groups.
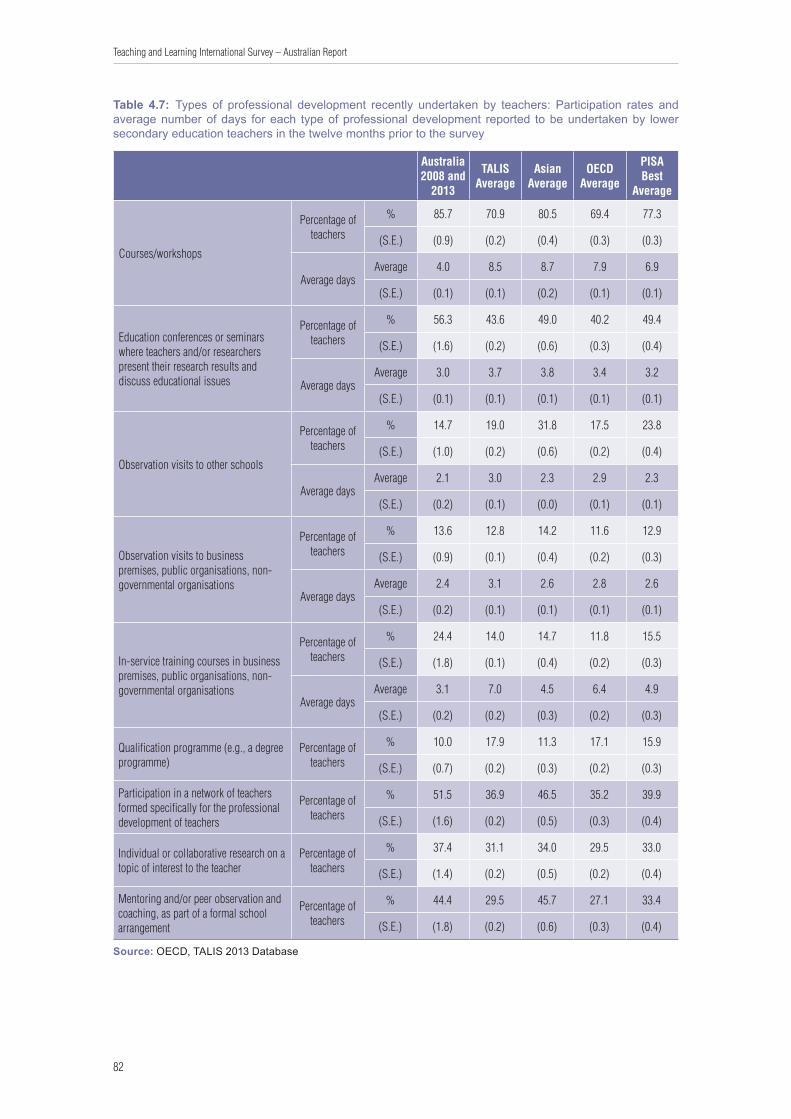
82
Teaching and Learning International Survey – Australian Report
Table 4.7: Types of professional development recently undertaken by teachers: Participation rates and average number of days for each type of professional development reported to be undertaken by lower secondary education teachers in the twelve months prior to the survey
Australia 2008 and
2013
TALIS Average
Asian Average
OECD Average
PISA Best
Average
Courses/workshops
Percentage of teachers
% 85.7 70.9 80.5 69.4 77.3
(S.E.) (0.9) (0.2) (0.4) (0.3) (0.3)
Average daysAverage 4.0 8.5 8.7 7.9 6.9
(S.E.) (0.1) (0.1) (0.2) (0.1) (0.1)
Education conferences or seminars where teachers and/or researchers present their research results and discuss educational issues
Percentage of teachers
% 56.3 43.6 49.0 40.2 49.4
(S.E.) (1.6) (0.2) (0.6) (0.3) (0.4)
Average daysAverage 3.0 3.7 3.8 3.4 3.2
(S.E.) (0.1) (0.1) (0.1) (0.1) (0.1)
Observation visits to other schools
Percentage of teachers
% 14.7 19.0 31.8 17.5 23.8
(S.E.) (1.0) (0.2) (0.6) (0.2) (0.4)
Average daysAverage 2.1 3.0 2.3 2.9 2.3
(S.E.) (0.2) (0.1) (0.0) (0.1) (0.1)
Observation visits to business premises, public organisations, non-governmental organisations
Percentage of teachers
% 13.6 12.8 14.2 11.6 12.9
(S.E.) (0.9) (0.1) (0.4) (0.2) (0.3)
Average daysAverage 2.4 3.1 2.6 2.8 2.6
(S.E.) (0.2) (0.1) (0.1) (0.1) (0.1)
In-service training courses in business premises, public organisations, non-governmental organisations
Percentage of teachers
% 24.4 14.0 14.7 11.8 15.5
(S.E.) (1.8) (0.1) (0.4) (0.2) (0.3)
Average daysAverage 3.1 7.0 4.5 6.4 4.9
(S.E.) (0.2) (0.2) (0.3) (0.2) (0.3)
Qualification programme (e.g., a degree programme)
Percentage of teachers
% 10.0 17.9 11.3 17.1 15.9
(S.E.) (0.7) (0.2) (0.3) (0.2) (0.3)
Participation in a network of teachers formed specifically for the professional development of teachers
Percentage of teachers
% 51.5 36.9 46.5 35.2 39.9
(S.E.) (1.6) (0.2) (0.5) (0.3) (0.4)
Individual or collaborative research on a topic of interest to the teacher
Percentage of teachers
% 37.4 31.1 34.0 29.5 33.0
(S.E.) (1.4) (0.2) (0.5) (0.2) (0.4)
Mentoring and/or peer observation and coaching, as part of a formal school arrangement
Percentage of teachers
% 44.4 29.5 45.7 27.1 33.4
(S.E.) (1.8) (0.2) (0.6) (0.3) (0.4)
Source: OECD, TALIS 2013 Database
83
Teaching and Learning International Survey – Australian Report
According to the international data, attendance at courses or workshops was the most popular means of experiencing professional development activities, with 71 per cent of TALIS teachers on average reporting that they participated in this activity in the past twelve months. Furthermore, at a country-specific level, courses and workshops exhibited a participation rate of around 80 per cent in several countries, including Australia, with a rate higher than 90 per cent in Malaysia, Mexico and Singapore. This type of professional development activity was also the most frequently reported for the listed comparative groups.
Interestingly, the OECD group showed the lowest percentage of participation compared to the other groups, being equal to or below the TALIS average for all listed professional development activities.
The results in Table 4.7 indicate that Australian teachers are more likely to attend workshops and conferences and participate in networks for their professional development but less likely to visit other schools or undertake formal qualifications than their international counterparts.
The TALIS questionnaires also enquired about the number of days that teachers committed to professional development. Whilst attendance at workshops or courses is the most likely type of professional development undertaken by Australian teachers, the number of days attributed by Australian teachers to this learning opportunity is less than half the TALIS average and perhaps exemplifies the trend for Australian teachers in other professional development activities.
As evidenced in Table 4.7, Australia’s average indicates that less time is spent on formal professional development experienced by teachers, with fewer days than each of the comparative groups for every activity. In contrast, Australian teachers report higher percentages for the less structured professional development activities of participation in a professional development network, or individual or collaborative research than their TALIS counterparts. Participation in mentoring was reportedly experienced by 44 per cent of Australian teachers as part of their ongoing professional development, again higher than the TALIS, OECD and PISA averages, and similar to the Asian comparative group average.
Figure 4.2 below compares the percentage of teachers participating in courses and workshops, the professional development activity with the highest participation, and the number of reported days of attendance.
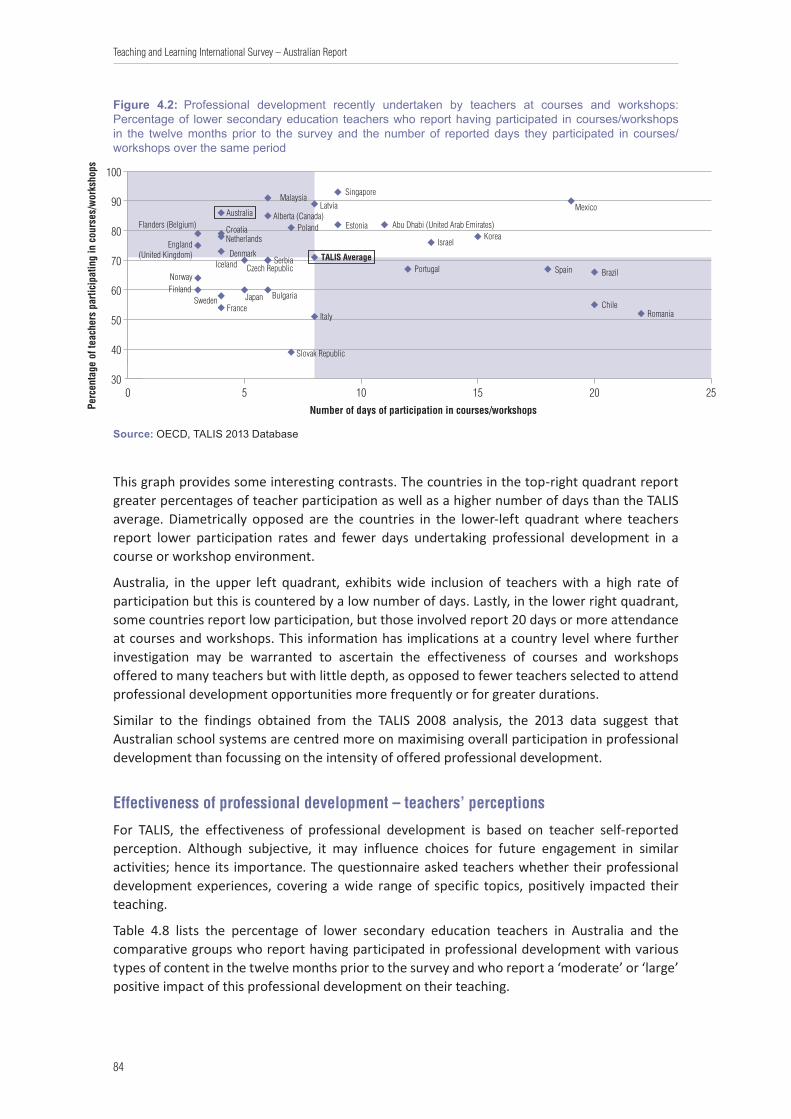
84
Teaching and Learning International Survey – Australian Report
Figure 4.2: Professional development recently undertaken by teachers at courses and workshops: Percentage of lower secondary education teachers who report having participated in courses/workshops in the twelve months prior to the survey and the number of reported days they participated in courses/workshops over the same period
0 5 10 15 20 2530
40
50
60
70
80
90
100
Slovak Republic
Number of days of participation in courses/workshopsPerc
enta
ge o
f tea
cher
s pa
rtici
patin
g in
cou
rses
/wor
ksho
ps
SingaporeMalaysia
MexicoLatviaAustralia Alberta (Canada)
Estonia Abu Dhabi (United Arab Emirates)PolandCroatiaFlanders (Belgium)
Netherlands KoreaIsraelEngland
(United Kingdom) Denmark TALIS AverageIceland Serbia
Czech Republic SpainPortugal BrazilNorway
BulgariaFinland
JapanSweden ChileFrance
Source: OECD, TALIS 2013 Database, Table 4.9.Web
RomaniaItaly
Source: OECD, TALIS 2013 Database
This graph provides some interesting contrasts. The countries in the top-right quadrant report greater percentages of teacher participation as well as a higher number of days than the TALIS average. Diametrically opposed are the countries in the lower-left quadrant where teachers report lower participation rates and fewer days undertaking professional development in a course or workshop environment.
Australia, in the upper left quadrant, exhibits wide inclusion of teachers with a high rate of participation but this is countered by a low number of days. Lastly, in the lower right quadrant, some countries report low participation, but those involved report 20 days or more attendance at courses and workshops. This information has implications at a country level where further investigation may be warranted to ascertain the effectiveness of courses and workshops offered to many teachers but with little depth, as opposed to fewer teachers selected to attend professional development opportunities more frequently or for greater durations.
Similar to the findings obtained from the TALIS 2008 analysis, the 2013 data suggest that Australian school systems are centred more on maximising overall participation in professional development than focussing on the intensity of offered professional development.
Effectiveness of professional development – teachers’ perceptions
For TALIS, the effectiveness of professional development is based on teacher self-reported perception. Although subjective, it may influence choices for future engagement in similar activities; hence its importance. The questionnaire asked teachers whether their professional development experiences, covering a wide range of specific topics, positively impacted their teaching.
Table 4.8 lists the percentage of lower secondary education teachers in Australia and the comparative groups who report having participated in professional development with various types of content in the twelve months prior to the survey and who report a ‘moderate’ or ‘large’ positive impact of this professional development on their teaching.

85
Teaching and Learning International Survey – Australian Report
Table 4.8: Content and positive impact of professional development activities: Percentage of lower secondary education teachers who report having participated in professional development with the following content in the twelve months prior to the survey and who report a ‘moderate’ or ‘large’ positive impact of this professional development on their teaching
Australia 2013
TALISAverage
Asian Average
OECD Average
PISA Best Average
Knowledge and understanding of subject field(s)
Percentage of teachers
% 77.9 72.7 87.8 69.4 78.7
(S.E.) (1.3) (0.2) (0.3) (0.3) (0.4)
Moderate or large positive impact
% 84.2 90.8 93.0 90.2 89.1
(S.E.) (1.0) (0.1) (0.3) (0.2) (0.3)
Pedagogical competencies in teaching subject field(s)
Percentage of teachers
% 65.5 67.9 84.2 63.7 70.2
(S.E.) (1.2) (0.2) (0.4) (0.3) (0.4)
Moderate or large positive impact
% 75.0 87.2 91.5 86.2 84.8
(S.E.) (1.6) (0.2) (0.3) (0.2) (0.3)
Knowledge of the curriculum
Percentage of teachers
% 71.7 56.3 72.7 51.9 57.8
(S.E.) (1.7) (0.2) (0.5) (0.3) (0.4)
Moderate or large positive impact
% 77.6 84.3 87.1 82.4 81.2
(S.E.) (1.1) (0.2) (0.5) (0.3) (0.5)
Student evaluation and assessment practices
Percentage of teachers
% 58.6 57.2 67.2 51.1 54.0
(S.E.) (1.3) (0.2) (0.5) (0.3) (0.4)
Moderate or large positive impact
% 71.9 82.9 87.1 80.7 79.1
(S.E.) (2.0) (0.2) (0.4) (0.3) (0.5)
ICT skills for teaching
Percentage of teachers
% 71.7 54.2 57.2 51.4 51.0
(S.E.) (1.7) (0.3) (0.6) (0.3) (0.5)
Moderate or large positive impact
% 70.5 80.3 79.9 79.1 76.7
(S.E.) (1.8) (0.3) (0.6) (0.3) (0.5)
Student behaviour and classroom management
Percentage of teachers
% 35.0 43.7 57.1 38.5 43.8
(S.E.) (1.9) (0.3) (0.5) (0.3) (0.5)
Moderate or large positive impact
% 65.2 80.9 87.1 79.4 78.1
(S.E.) (2.3) (0.3) (0.5) (0.4) (0.5)
School management and administration
Percentage of teachers
% 25.8 18.4 38.9 15.4 17.7
(S.E.) (1.2) (0.2) (0.5) (0.2) (0.3)
Moderate or large positive impact
% 63.9 76.4 80.5 75.2 72.9
(S.E.) (2.8) (0.5) (0.7) (0.7) (1.0)
Approaches to individual learning
Percentage of teachers
% 52.4 40.7 52.4 36.8 44.1
(S.E.) (1.5) (0.2) (0.6) (0.3) (0.4)
Moderate or large positive impact
% 63.5 80.4 84.0 78.8 77.3
(S.E.) (2.3) (0.3) (0.5) (0.4) (0.5)
Teaching students with special needs1
Percentage of teachers
% 32.3 31.7 35.6 32.3 39.2
(S.E.) (1.6) (0.3) (0.6) (0.3) (0.5)
Moderate or large positive impact
% 60.0 77.3 79.1 77.7 77.4
(S.E.) (2.4) (0.3) (0.8) (0.4) (0.6)
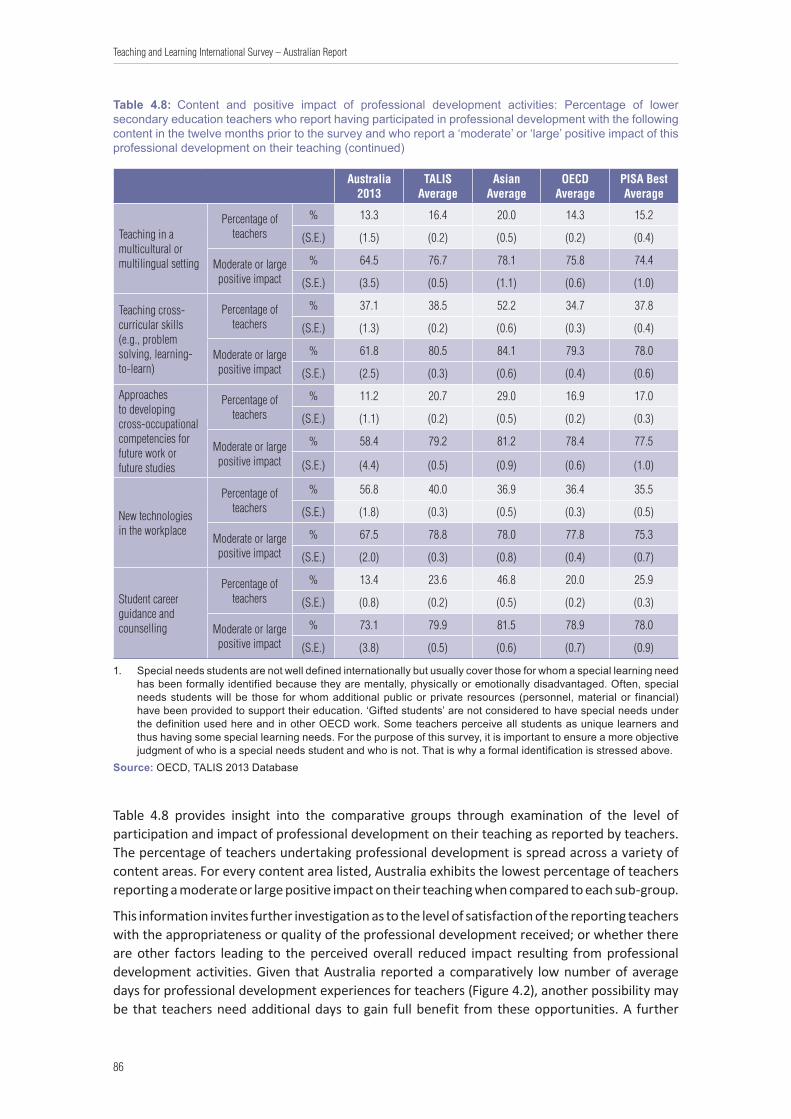
86
Teaching and Learning International Survey – Australian Report
Australia 2013
TALISAverage
Asian Average
OECD Average
PISA Best Average
Teaching in a multicultural or multilingual setting
Percentage of teachers
% 13.3 16.4 20.0 14.3 15.2
(S.E.) (1.5) (0.2) (0.5) (0.2) (0.4)
Moderate or large positive impact
% 64.5 76.7 78.1 75.8 74.4
(S.E.) (3.5) (0.5) (1.1) (0.6) (1.0)
Teaching cross-curricular skills (e.g., problem solving, learning-to-learn)
Percentage of teachers
% 37.1 38.5 52.2 34.7 37.8
(S.E.) (1.3) (0.2) (0.6) (0.3) (0.4)
Moderate or large positive impact
% 61.8 80.5 84.1 79.3 78.0
(S.E.) (2.5) (0.3) (0.6) (0.4) (0.6)
Approaches to developing cross-occupational competencies for future work or future studies
Percentage of teachers
% 11.2 20.7 29.0 16.9 17.0
(S.E.) (1.1) (0.2) (0.5) (0.2) (0.3)
Moderate or large positive impact
% 58.4 79.2 81.2 78.4 77.5
(S.E.) (4.4) (0.5) (0.9) (0.6) (1.0)
New technologies in the workplace
Percentage of teachers
% 56.8 40.0 36.9 36.4 35.5
(S.E.) (1.8) (0.3) (0.5) (0.3) (0.5)
Moderate or large positive impact
% 67.5 78.8 78.0 77.8 75.3
(S.E.) (2.0) (0.3) (0.8) (0.4) (0.7)
Student career guidance and counselling
Percentage of teachers
% 13.4 23.6 46.8 20.0 25.9
(S.E.) (0.8) (0.2) (0.5) (0.2) (0.3)
Moderate or large positive impact
% 73.1 79.9 81.5 78.9 78.0
(S.E.) (3.8) (0.5) (0.6) (0.7) (0.9)
1. Special needs students are not well defined internationally but usually cover those for whom a special learning need has been formally identified because they are mentally, physically or emotionally disadvantaged. Often, special needs students will be those for whom additional public or private resources (personnel, material or financial) have been provided to support their education. ‘Gifted students’ are not considered to have special needs under the definition used here and in other OECD work. Some teachers perceive all students as unique learners and thus having some special learning needs. For the purpose of this survey, it is important to ensure a more objective judgment of who is a special needs student and who is not. That is why a formal identification is stressed above.
Source: OECD, TALIS 2013 Database
Table 4.8 provides insight into the comparative groups through examination of the level of participation and impact of professional development on their teaching as reported by teachers. The percentage of teachers undertaking professional development is spread across a variety of content areas. For every content area listed, Australia exhibits the lowest percentage of teachers reporting a moderate or large positive impact on their teaching when compared to each sub-group.
This information invites further investigation as to the level of satisfaction of the reporting teachers with the appropriateness or quality of the professional development received; or whether there are other factors leading to the perceived overall reduced impact resulting from professional development activities. Given that Australia reported a comparatively low number of average days for professional development experiences for teachers (Figure 4.2), another possibility may be that teachers need additional days to gain full benefit from these opportunities. A further
Table 4.8: Content and positive impact of professional development activities: Percentage of lower secondary education teachers who report having participated in professional development with the following content in the twelve months prior to the survey and who report a ‘moderate’ or ‘large’ positive impact of this professional development on their teaching (continued)
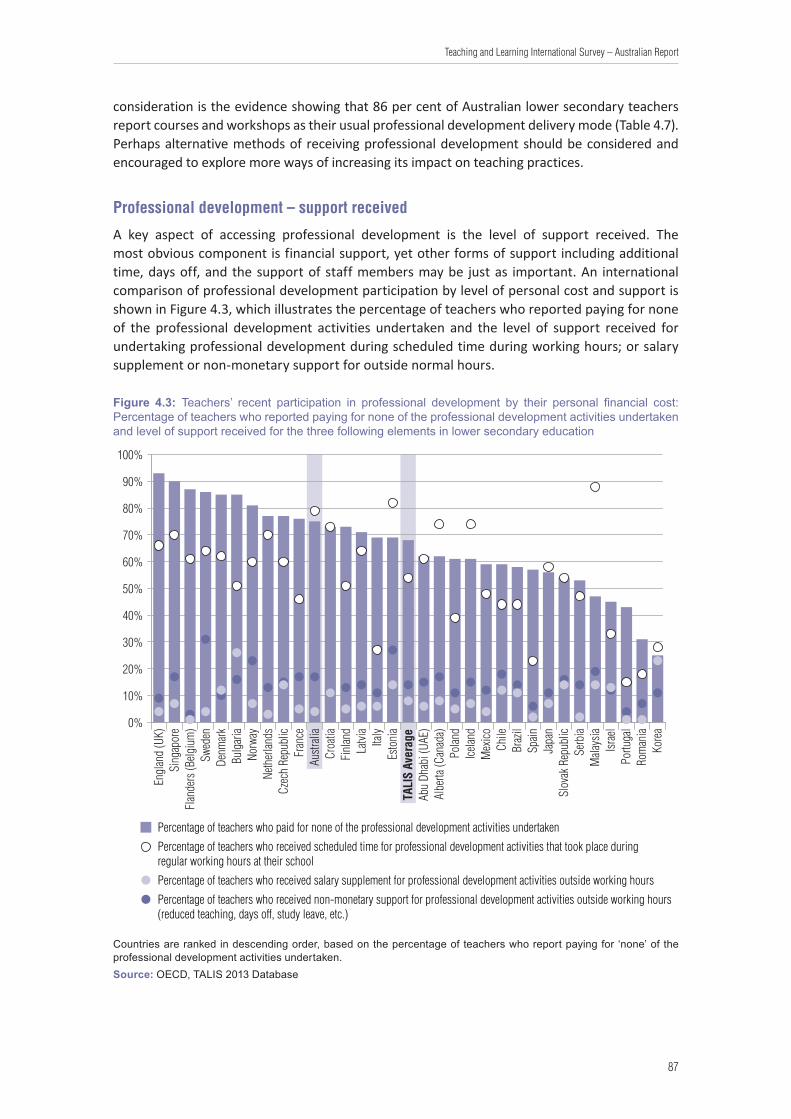
87
Teaching and Learning International Survey – Australian Report
consideration is the evidence showing that 86 per cent of Australian lower secondary teachers report courses and workshops as their usual professional development delivery mode (Table 4.7). Perhaps alternative methods of receiving professional development should be considered and encouraged to explore more ways of increasing its impact on teaching practices.
Professional development – support received
A key aspect of accessing professional development is the level of support received. The most obvious component is financial support, yet other forms of support including additional time, days off, and the support of staff members may be just as important. An international comparison of professional development participation by level of personal cost and support is shown in Figure 4.3, which illustrates the percentage of teachers who reported paying for none of the professional development activities undertaken and the level of support received for undertaking professional development during scheduled time during working hours; or salary supplement or non-monetary support for outside normal hours.
Figure 4.3: Teachers’ recent participation in professional development by their personal financial cost: Percentage of teachers who reported paying for none of the professional development activities undertaken and level of support received for the three following elements in lower secondary education
Engl
and
(UK)
Sing
apor
eFl
ande
rs (B
elgiu
m)
Swed
enDe
nmar
kBu
lgar
iaNo
rway
Neth
erlan
dsCz
ech
Repu
blic
Fran
ceAu
strali
aCr
oatia
Finl
and
Latvi
aIta
lyEs
toni
aTA
LIS
Aver
age
Abu
Dhab
i (UA
E)Al
berta
(Can
ada)
Polan
dIce
land
Mex
icoCh
ileBr
azil
Spain
Japa
nSl
ovak
Rep
ublic
Serb
iaM
alays
iaIsr
ael
Portu
gal
Rom
ania
Kore
a
Percentage of teachers who paid for none of the professional development activities undertaken
Percentage of teachers who received scheduled time for professional development activities that took place during regular working hours at their school
Percentage of teachers who received salary supplement for professional development activities outside working hours
Percentage of teachers who received non-monetary support for professional development activities outside working hours (reduced teaching, days off, study leave, etc.)
0%
10%
20%
30%
40%
50%
60%
70%
80%
90%
100%
Countries are ranked in descending order, based on the percentage of teachers who report paying for ‘none’ of the professional development activities undertaken.Source: OECD, TALIS 2013 Database
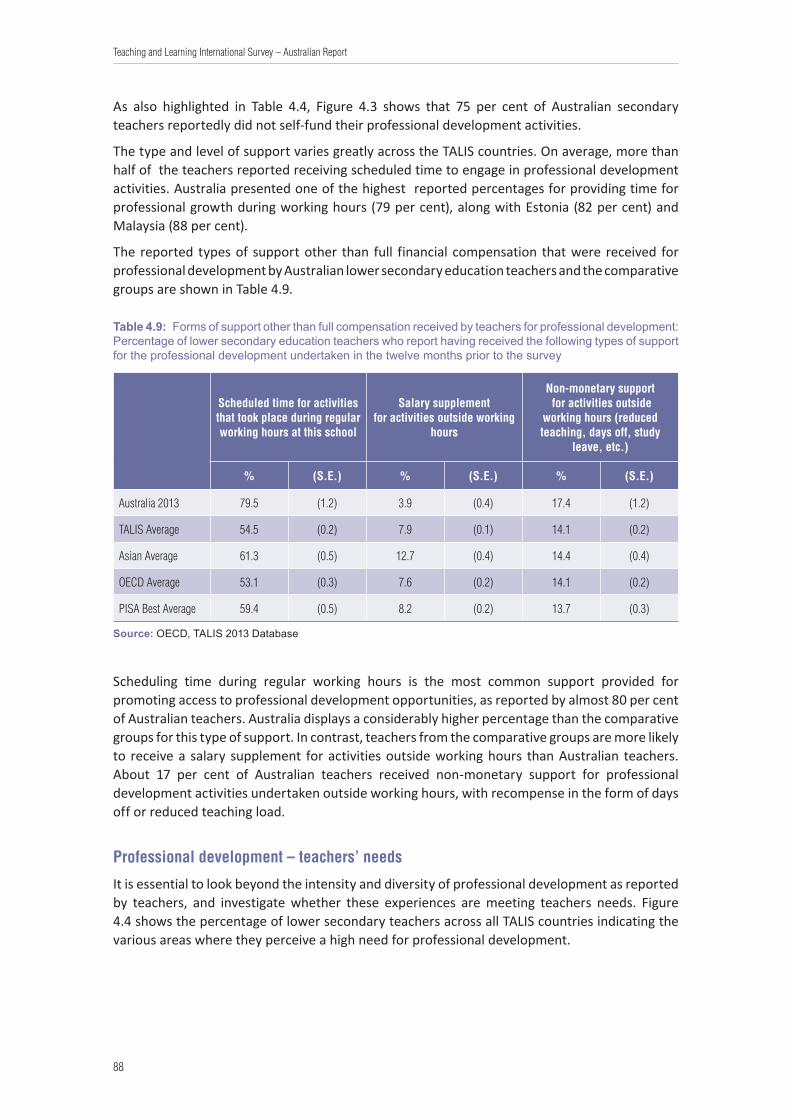
88
Teaching and Learning International Survey – Australian Report
As also highlighted in Table 4.4, Figure 4.3 shows that 75 per cent of Australian secondary teachers reportedly did not self-fund their professional development activities.
The type and level of support varies greatly across the TALIS countries. On average, more than half of the teachers reported receiving scheduled time to engage in professional development activities. Australia presented one of the highest reported percentages for providing time for professional growth during working hours (79 per cent), along with Estonia (82 per cent) and Malaysia (88 per cent).
The reported types of support other than full financial compensation that were received for professional development by Australian lower secondary education teachers and the comparative groups are shown in Table 4.9.
Table 4.9: Forms of support other than full compensation received by teachers for professional development: Percentage of lower secondary education teachers who report having received the following types of support for the professional development undertaken in the twelve months prior to the survey
Scheduled time for activities that took place during regular working hours at this school
Salary supplement for activities outside working
hours
Non-monetary support for activities outside
working hours (reduced teaching, days off, study
leave, etc.)
% (S.E.) % (S.E.) % (S.E.)
Australia 2013 79.5 (1.2) 3.9 (0.4) 17.4 (1.2)
TALIS Average 54.5 (0.2) 7.9 (0.1) 14.1 (0.2)
Asian Average 61.3 (0.5) 12.7 (0.4) 14.4 (0.4)
OECD Average 53.1 (0.3) 7.6 (0.2) 14.1 (0.2)
PISA Best Average 59.4 (0.5) 8.2 (0.2) 13.7 (0.3)
Source: OECD, TALIS 2013 Database
Scheduling time during regular working hours is the most common support provided for promoting access to professional development opportunities, as reported by almost 80 per cent of Australian teachers. Australia displays a considerably higher percentage than the comparative groups for this type of support. In contrast, teachers from the comparative groups are more likely to receive a salary supplement for activities outside working hours than Australian teachers. About 17 per cent of Australian teachers received non-monetary support for professional development activities undertaken outside working hours, with recompense in the form of days off or reduced teaching load.
Professional development – teachers’ needs
It is essential to look beyond the intensity and diversity of professional development as reported by teachers, and investigate whether these experiences are meeting teachers needs. Figure 4.4 shows the percentage of lower secondary teachers across all TALIS countries indicating the various areas where they perceive a high need for professional development.
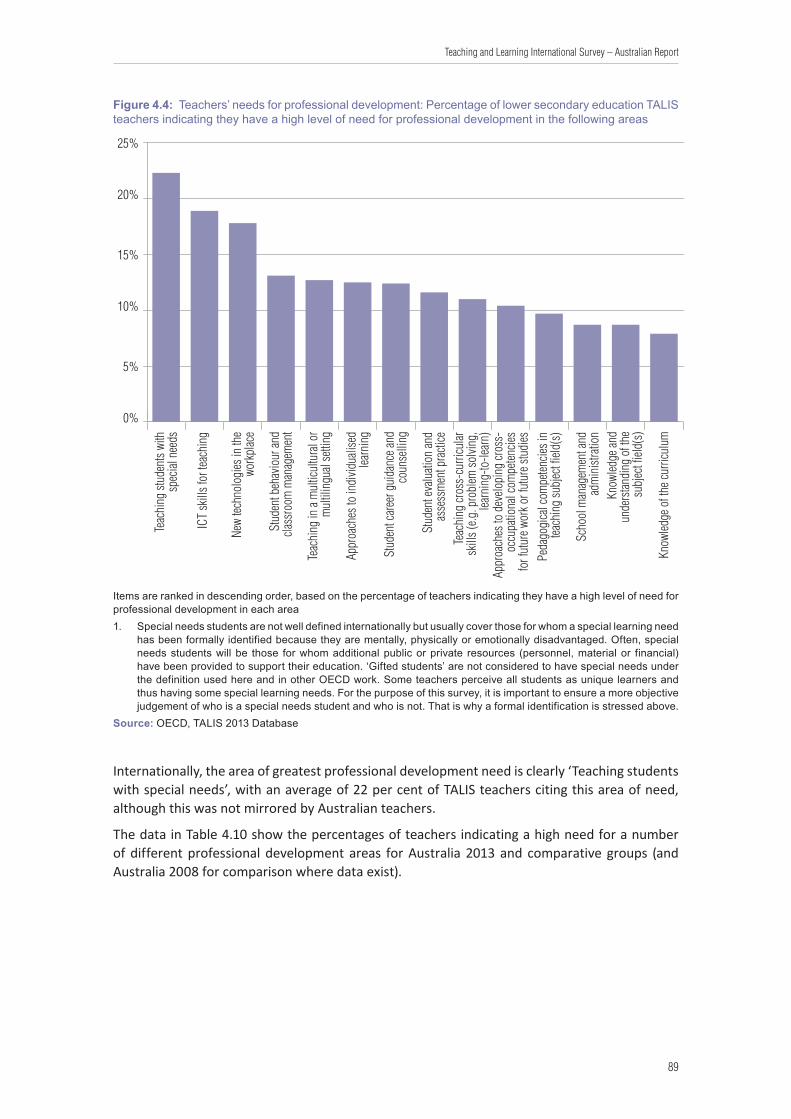
89
Teaching and Learning International Survey – Australian Report
Figure 4.4: Teachers’ needs for professional development: Percentage of lower secondary education TALIS teachers indicating they have a high level of need for professional development in the following areas
0%
5%
10%
15%
20%
25%
Know
ledge
of t
he cu
rricu
lum
Know
ledge
and
und
ersta
ndin
g of
the
subj
ect f
ield(
s)
Scho
ol m
anag
emen
t and
adm
inist
ratio
n
Peda
gogi
cal c
ompe
tencie
s in
teac
hing
subj
ect f
ield(
s)
Appr
oach
es to
dev
elopi
ng cr
oss-
occu
patio
nal c
ompe
tencie
s fo
r fut
ure w
ork o
r fut
ure s
tudi
es
Teac
hing
cros
s-cu
rricu
lar sk
ills (
e.g. p
robl
em so
lving
, le
arni
ng-to
-lear
n)
Stud
ent e
valu
ation
and
asse
ssm
ent p
racti
ce
Stud
ent c
aree
r gui
danc
e and
coun
selli
ng
Appr
oach
es to
indi
vidua
lised
lear
ning
Teac
hing
in a
mul
ticul
tura
l or
mul
tilin
gual
setti
ng
Stud
ent b
ehav
iour
and
clas
sroo
m m
anag
emen
t
New
techn
olog
ies in
the
wor
kplac
e
ICT
skill
s for
teac
hing
Teac
hing
stud
ents
with
spec
ial n
eeds
Items are ranked in descending order, based on the percentage of teachers indicating they have a high level of need for professional development in each area1. Special needs students are not well defined internationally but usually cover those for whom a special learning need
has been formally identified because they are mentally, physically or emotionally disadvantaged. Often, special needs students will be those for whom additional public or private resources (personnel, material or financial) have been provided to support their education. ‘Gifted students’ are not considered to have special needs under the definition used here and in other OECD work. Some teachers perceive all students as unique learners and thus having some special learning needs. For the purpose of this survey, it is important to ensure a more objective judgement of who is a special needs student and who is not. That is why a formal identification is stressed above.
Source: OECD, TALIS 2013 Database
Internationally, the area of greatest professional development need is clearly ‘Teaching students with special needs’, with an average of 22 per cent of TALIS teachers citing this area of need, although this was not mirrored by Australian teachers.
The data in Table 4.10 show the percentages of teachers indicating a high need for a number of different professional development areas for Australia 2013 and comparative groups (and Australia 2008 for comparison where data exist).

90
Teaching and Learning International Survey – Australian Report
Table 4.10: Teachers’ needs for professional development: Percentage of lower secondary education teachers indicating they have a high level of need for professional development in the following areas
Australia 2008
Australia 2013
TALIS Average
Asian average
OECD Average
PISA Best
Average
Knowledge and understanding of the subject field(s)
% 5.0 2.4 8.7 27.8 9.0 12.4
(S.E.) (0.5) (0.5) (0.1) (0.4) (0.1) (0.2)
Pedagogical competencies in teaching subject field(s)
% 2.8 9.7 30.8 10.1 14.0
(S.E.) (0.5) (0.1) (0.5) (0.1) (0.2)
Knowledge of the curriculum% 3.7 7.9 18.7 7.7 8.7
(S.E.) (0.5) (0.1) (0.4) (0.1) (0.2)
Student evaluation and assessment practice
% 3.3 11.6 29.1 11.4 12.9
(S.E.) (0.4) (0.1) (0.5) (0.2) (0.2)
ICT skills for teaching% 17.8 13.6 18.9 25.1 18.5 16.6
(S.E.) (0.9) (0.9) (0.2) (0.5) (0.2) (0.3)
Student behaviour and classroom management
% 3.8 13.1 26.0 12.5 15.4
(S.E.) (0.6) (0.1) (0.5) (0.2) (0.3)
School management and administration% 5.9 4.9 8.7 14.3 7.3 6.8
(S.E.) (0.5) (0.7) (0.1) (0.4) (0.1) (0.2)
Approaches to individualised learning% 6.2 12.5 24.5 12.1 14.3
(S.E.) (0.8) (0.1) (0.4) (0.2) (0.2)
Teaching students with special needs1% 15.1 8.2 22.3 25.4 20.4 18.1
(S.E.) (1.0) (0.8) (0.2) (0.4) (0.2) (0.3)
Teaching in a multicultural or multilingual setting
% 4.0 4.4 12.7 11.2 11.5 7.2
(S.E.) (0.4) (0.7) (0.1) (0.3) (0.2) (0.2)
Teaching cross-curricular skills (e.g., problem solving, learning-to-learn)
% 3.1 11.0 23.5 10.4 12.2
(S.E.) (0.4) (0.1) (0.5) (0.1) (0.2)
Approaches to developing cross-occupational competencies for future work or future studies
% 4.2 10.4 19.3 9.0 8.8
(S.E.) (0.5) (0.1) (0.4) (0.1) (0.2)
New technologies in the workplace% 12.5 17.8 18.9 15.5 13.4
(S.E.) (0.8) (0.2) (0.4) (0.2) (0.3)
Student career guidance and counselling% 5.9 12.4 27.6 11.3 13.6
(S.E.) (1.0) (0.1) (0.5) (0.1) (0.2)
1. Special needs students are not well defined internationally but usually cover those for whom a special learning need has been formally identified because they are mentally, physically or emotionally disadvantaged. Often, special needs students will be those for whom additional public or private resources (personnel, material or financial) have been provided to support their education. ‘Gifted students’ are not considered to have special needs under the definition used here and in other OECD work. Some teachers perceive all students as unique learners and thus having some special learning needs. For the purpose of this survey, it is important to ensure a more objective judgment of who is a special needs student and who is not. That is why a formal identification is stressed above.
Australian data from the 2008 cycle is provided for comparison. These data are not used in the calculation of any of the 2013 averages. The grey shading indicates that this question or part of the question was not administered in the 2008 questionnaire.Source: OECD, TALIS 2013 Database

91
Teaching and Learning International Survey – Australian Report
By examining the comparative group data for Table 4.10, a pattern of figures emerges that is similar to the trends highlighted in Table 4.8, which presents the findings for the reported impact of professional development. Table 4.10 reveals that where a comparison with 2008 data is available, fewer Australian teachers indicated a high professional development need in 2013, with the exception of teaching in a multicultural setting. The two areas of greatest need as reported by Australian teachers are ‘ICT skills for teaching’ and ‘New technologies in the workplace’. There is obvious overlap in these two areas. These data indicate that further professional development targeting the introduction and use of new technology to enhance current instructional practices would be well-targeted to Australian teachers.
Interestingly, the Asian group indicates a much higher need for professional development than any of the other groups; the percentage of Asian teachers indicating the need for further developmental opportunities is at least twice the TALIS average in several areas of professional development need. The only area below the TALIS average for the Asian group is that of ‘Teaching in a multicultural or multilingual setting’.
Professional development – barriers
To gain a better understanding of the extent of engagement and impact of professional development, TALIS asked teachers about the perceived barriers to their inclusion and participation. Figure 4.5 depicts the reasons for teachers’ non-participation in professional activities, showing the percentage of lower secondary education teachers across all TALIS countries who ‘strongly disagree’, ‘disagree’, ‘agree’ or ‘strongly agree’ to the elements listed.
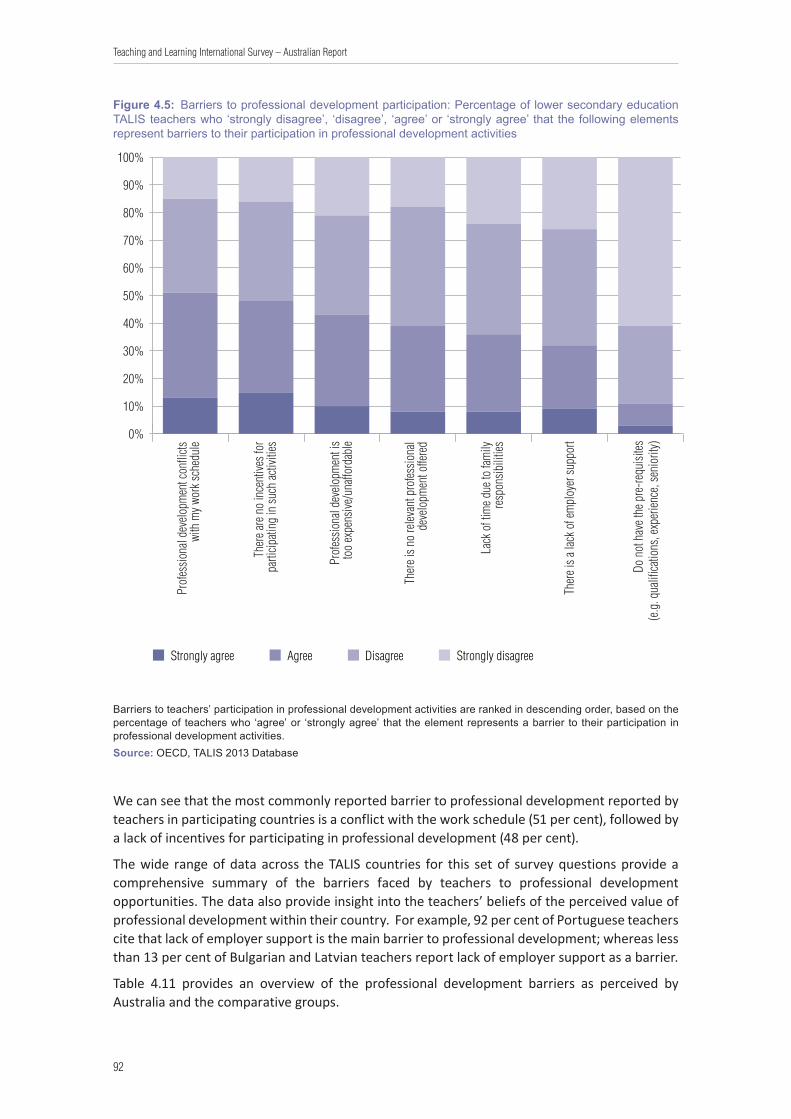
92
Teaching and Learning International Survey – Australian Report
Figure 4.5: Barriers to professional development participation: Percentage of lower secondary education TALIS teachers who ‘strongly disagree’, ‘disagree’, ‘agree’ or ‘strongly agree’ that the following elements represent barriers to their participation in professional development activities
0%
10%
20%
30%
40%
50%
60%
70%
80%
90%
100%
Do n
ot h
ave t
he p
re-re
quisi
tes(e
.g. q
ualif
icatio
ns, e
xper
ience
, sen
iorit
y)
Ther
e is a
lack
of e
mpl
oyer
supp
ort
Lack
of t
ime d
ue to
fam
ily re
spon
sibili
ties
Ther
e is n
o re
levan
t pro
fessio
nal
dev
elopm
ent o
ffere
d
Prof
essio
nal d
evelo
pmen
t is
too
expe
nsive
/una
fford
able
Ther
e are
no
ince
ntive
s for
par
ticip
ating
in su
ch ac
tiviti
es
Prof
essio
nal d
evelo
pmen
t con
flicts
with
my w
ork s
ched
ule
Strongly agree Agree Disagree Strongly disagree
Barriers to teachers’ participation in professional development activities are ranked in descending order, based on the percentage of teachers who ‘agree’ or ‘strongly agree’ that the element represents a barrier to their participation in professional development activities.Source: OECD, TALIS 2013 Database
We can see that the most commonly reported barrier to professional development reported by teachers in participating countries is a conflict with the work schedule (51 per cent), followed by a lack of incentives for participating in professional development (48 per cent).
The wide range of data across the TALIS countries for this set of survey questions provide a comprehensive summary of the barriers faced by teachers to professional development opportunities. The data also provide insight into the teachers’ beliefs of the perceived value of professional development within their country. For example, 92 per cent of Portuguese teachers cite that lack of employer support is the main barrier to professional development; whereas less than 13 per cent of Bulgarian and Latvian teachers report lack of employer support as a barrier.
Table 4.11 provides an overview of the professional development barriers as perceived by Australia and the comparative groups.

93
Teaching and Learning International Survey – Australian Report
Table 4.11: Barriers to professional development participation: Percentage of lower secondary education teachers indicating that they ‘agree’ or ‘strongly agree’ that the following reasons represent barriers to their participation in professional development
Australia 2013
TALIS Average
Asian average
OECD Average
PISA Best Average
Do not have the pre-requisites (e.g., qualifications, experience, seniority)
% 6.5 11.1 20.3 11.9 13.1
(S.E.) (0.5) (0.1) (0.4) (0.2) (0.2)
Professional development is too expensive/unaffordable
% 38.8 43.8 37.9 44.5 36.5
(S.E.) (1.6) (0.2) (0.5) (0.3) (0.4)
There is a lack of employer support% 23.9 31.6 42.1 33.3 30.4
(S.E.) (1.4) (0.2) (0.5) (0.3) (0.4)
Professional development conflicts with my work schedule
% 58.0 50.6 71.8 53.8 54.8
(S.E.) (1.4) (0.2) (0.4) (0.3) (0.4)
Lack of time due to family responsibilities
% 32.7 35.7 42.9 37.9 39.5
(S.E.) (1.8) (0.2) (0.5) (0.2) (0.4)
There is no relevant professional development offered
% 24.6 39.0 31.6 41.1 35.4
(S.E.) (1.1) (0.2) (0.5) (0.3) (0.4)
There are no incentives for participating in such activities
% 39.6 48.0 42.3 47.8 37.5
(S.E.) (1.5) (0.2) (0.5) (0.3) (0.4)
Source: OECD, TALIS 2013 Database
In contrast to other barriers, conflict with work schedule appears to be a bigger barrier to Australian teachers than for most other comparative groups. However, the data show that Australian teachers report less frequently than the international average a lack of pre-requisites and employer support as barriers to engagement in activities promoting professional growth. For Australian teachers, the second most commonly reported barrier is a lack of incentive for participation in professional activities; although this figure is lower than the other comparative groups, except for PISA Best. Closely behind lack of incentive is the barrier of expense. Given that Australian teachers in general do not pay for their own professional development, the data presented in Table 4.11 raise the question of whether the barrier of expense exists because teachers feel obligated to fund their own professional development, or alternatively whether the barrier of expense is found at system level; or perhaps both. Interestingly, only a quarter of Australian teachers report that the type of professional development offered is not relevant. Nearly all of the specified barriers have a greater significance for Asian teachers than Australian teachers.
The findings indicate that Australian teachers daily assimilate unstructured professional development activities. Australian teachers reported a lower average number of days than other TALIS countries expended on formal professional development, and conflict with work schedule was cited as the biggest barrier. This indicates that Australian teachers are challenged in accommodating more structured activities and appear to embrace and utilise less formal avenues of professional development.

94
Teaching and Learning International Survey – Australian Report
4.4 International Summary: Highlights from the International Report• In the participating countries and economies, an average of 88 per cent
of teachers in lower secondary education report engaging in professional development in the past year. Slightly lower participation rates are found among males and especially among non-permanent teachers. Having taken part in formal induction programmes in the past appears to be an important predictor of teachers’ participation in professional development in later years.
• Although school principals report that induction programmes are currently available at their schools, on average, not even half of teachers report taking part in some induction practice in their first regular employment.
• The level and intensity of participation in professional development activities are influenced by the types of support that teachers receive to undertake them. In general, teachers report higher participation rates in professional development activities in countries where they also report higher levels of financial support. However, in some cases participation rates in professional development activities is high even though monetary support is not offered. In these cases, non-monetary support for teacher development is provided through scheduled time for activities that take place during regular working hours at the school.
• Teachers report that the areas of most critical need for professional development are in teaching students with special needs and developing information and communication technology (ICT) skills for teaching. One in five lower secondary teachers identified the former to be especially important for them, which implies that teachers do not feel fully prepared to cope with this challenge.
• Across the participating countries and economies, teachers’ most commonly reported reasons for not participating in professional development activities are conflicts with work schedules and the absence of incentives for participation.
95
Teaching and Learning International Survey – Australian Report
5. Teacher appraisal and feedback
5.1 OverviewThis chapter explores the importance of teacher appraisal and feedback in further understanding the elements of improving teaching practices. Following the same structure as the International Report, this chapter begins by examining teacher access to formal appraisal. It then explores the focus, content and source of the appraisal and feedback that individual teachers receive, and the mechanisms for capturing and delivering this information. The next section examines the effects of teacher appraisal on teachers, and its influence and impact on teaching practices, as perceived by teachers at the school level. The chapter then explores the possible connection between teacher appraisal practices within schools and other factors, including the level of school autonomy. The highlights from the International Report are included at the conclusion of this chapter.
Student learning outcomes should be an essential component of teacher appraisal. However, using student test results simplistically for high-stakes decisions can be counterproductive and lead to cases where teachers are ‘teaching to test’. Rather, teacher appraisals should consider the use of a variety of types of evidence of student progress (OECD 2014).
Student assessments are an important tool to diagnose how well students are learning. Appraisal and feedback should make direct links between diagnosing students’ performance and better teaching to improve their performance (Jensen and Reichl 2011).
As stated in the TALIS International Report, ‘teacher appraisal and feedback have been shown to have a positive effect on teachers’ level of job satisfaction, making it a vital element of effective educational environments’ (Michaelowa 2002). TALIS data reinforce this, indicating that teacher appraisal and feedback are related not only to job satisfaction but also to teachers’ feelings of self-efficacy. Increased collaboration among teachers is important. Teachers who exchange ideas and coordinate practices report higher levels of job satisfaction and self-efficacy (OECD 2014).
Defining teacher appraisal and feedback
The TALIS survey asked teachers about the various types of teacher appraisal and feedback, distinguishing between formal and informal. The International Report provides definitions for ‘formal teacher appraisal’, ‘teacher feedback’, and ‘teacher appraisal and feedback provided in the school more generally’ as shown below:
• Formal teacher appraisal: This occurs when a teacher’s work is reviewed by the principal, an external inspector or by the teacher’s colleagues. Formal teacher appraisal is part of a formalised performance-management system, often involving set procedures and criteria, rather than a more informal approach (e.g., through informal discussions). In TALIS, information about formal teacher appraisal was provided by principals.
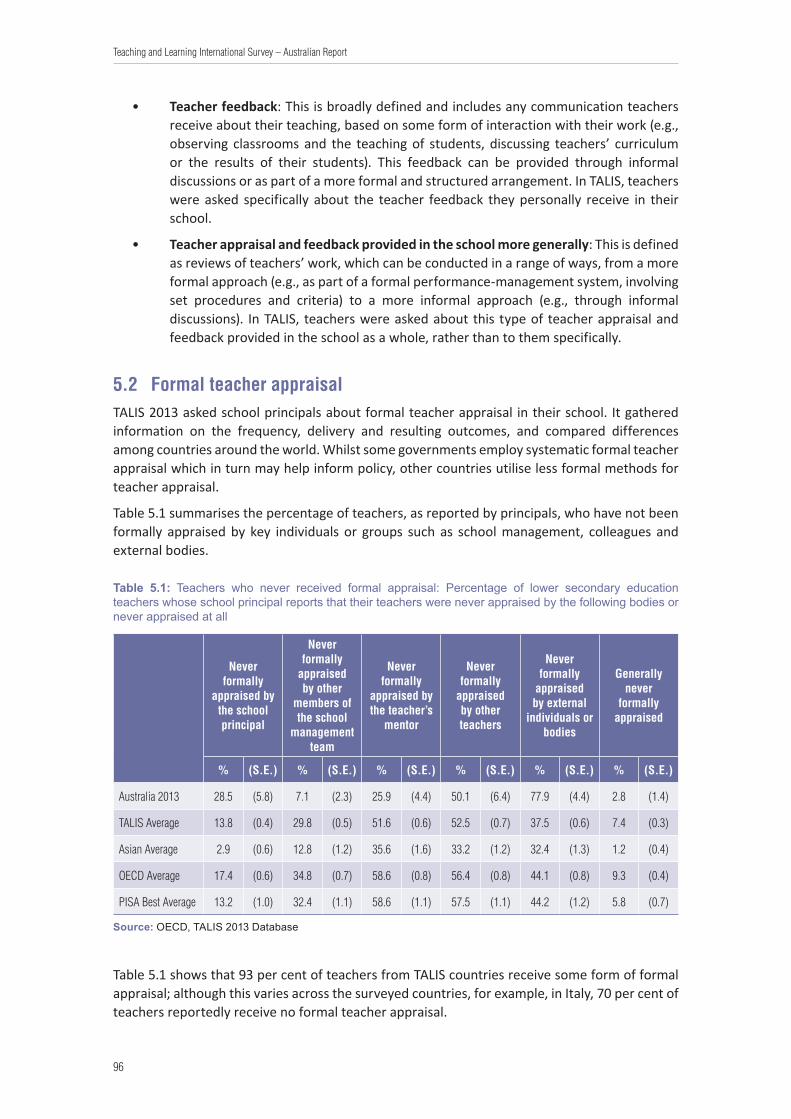
96
Teaching and Learning International Survey – Australian Report
• Teacher feedback: This is broadly defined and includes any communication teachers receive about their teaching, based on some form of interaction with their work (e.g., observing classrooms and the teaching of students, discussing teachers’ curriculum or the results of their students). This feedback can be provided through informal discussions or as part of a more formal and structured arrangement. In TALIS, teachers were asked specifically about the teacher feedback they personally receive in their school.
• Teacher appraisal and feedback provided in the school more generally: This is defined as reviews of teachers’ work, which can be conducted in a range of ways, from a more formal approach (e.g., as part of a formal performance-management system, involving set procedures and criteria) to a more informal approach (e.g., through informal discussions). In TALIS, teachers were asked about this type of teacher appraisal and feedback provided in the school as a whole, rather than to them specifically.
5.2 Formal teacher appraisalTALIS 2013 asked school principals about formal teacher appraisal in their school. It gathered information on the frequency, delivery and resulting outcomes, and compared differences among countries around the world. Whilst some governments employ systematic formal teacher appraisal which in turn may help inform policy, other countries utilise less formal methods for teacher appraisal.
Table 5.1 summarises the percentage of teachers, as reported by principals, who have not been formally appraised by key individuals or groups such as school management, colleagues and external bodies.
Table 5.1: Teachers who never received formal appraisal: Percentage of lower secondary education teachers whose school principal reports that their teachers were never appraised by the following bodies or never appraised at all
Never formally
appraised by the school principal
Never formally
appraised by other
members of the school
management team
Never formally
appraised by the teacher’s
mentor
Never formally
appraised by other teachers
Never formally
appraised by external
individuals or bodies
Generally never
formally appraised
% (S.E.) % (S.E.) % (S.E.) % (S.E.) % (S.E.) % (S.E.)
Australia 2013 28.5 (5.8) 7.1 (2.3) 25.9 (4.4) 50.1 (6.4) 77.9 (4.4) 2.8 (1.4)
TALIS Average 13.8 (0.4) 29.8 (0.5) 51.6 (0.6) 52.5 (0.7) 37.5 (0.6) 7.4 (0.3)
Asian Average 2.9 (0.6) 12.8 (1.2) 35.6 (1.6) 33.2 (1.2) 32.4 (1.3) 1.2 (0.4)
OECD Average 17.4 (0.6) 34.8 (0.7) 58.6 (0.8) 56.4 (0.8) 44.1 (0.8) 9.3 (0.4)
PISA Best Average 13.2 (1.0) 32.4 (1.1) 58.6 (1.1) 57.5 (1.1) 44.2 (1.2) 5.8 (0.7)
Source: OECD, TALIS 2013 Database
Table 5.1 shows that 93 per cent of teachers from TALIS countries receive some form of formal appraisal; although this varies across the surveyed countries, for example, in Italy, 70 per cent of teachers reportedly receive no formal teacher appraisal.
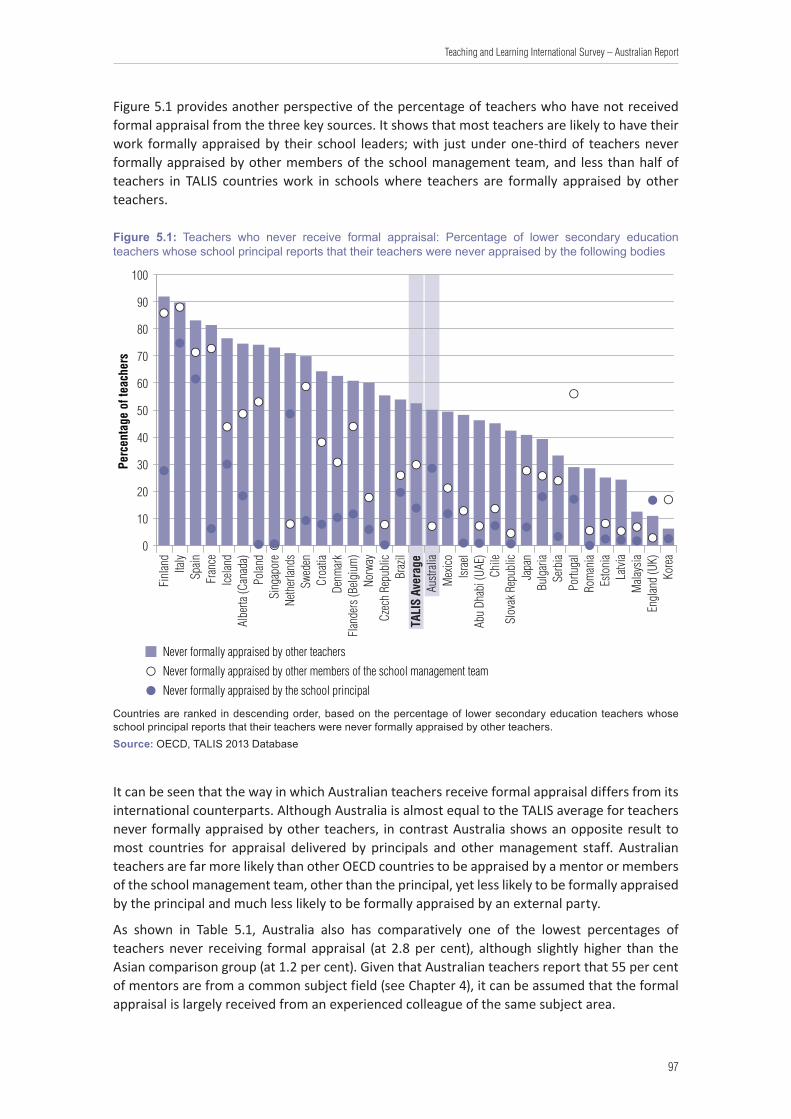
97
Teaching and Learning International Survey – Australian Report
Figure 5.1 provides another perspective of the percentage of teachers who have not received formal appraisal from the three key sources. It shows that most teachers are likely to have their work formally appraised by their school leaders; with just under one-third of teachers never formally appraised by other members of the school management team, and less than half of teachers in TALIS countries work in schools where teachers are formally appraised by other teachers.
Figure 5.1: Teachers who never receive formal appraisal: Percentage of lower secondary education teachers whose school principal reports that their teachers were never appraised by the following bodies
Never formally appraised by other teachers
Never formally appraised by other members of the school management team
Never formally appraised by the school principal
Perc
enta
ge o
f tea
cher
s
0
10
20
30
40
50
60
70
80
90
100
Kore
aEn
glan
d (U
K)M
alays
iaLa
tvia
Esto
nia
Rom
ania
Portu
gal
Serb
iaBu
lgar
iaJa
pan
Slov
ak R
epub
licCh
ileAb
u Dh
abi (
UAE)
Israe
lM
exico
Austr
alia
TALI
S Av
erag
eBr
azil
Czec
h Re
publ
icNo
rway
Flan
ders
(Belg
ium
)De
nmar
kCr
oatia
Swed
enNe
ther
lands
Sing
apor
ePo
land
Albe
rta (C
anad
a)Ice
land
Fran
ceSp
ainItaly
Finl
and
Countries are ranked in descending order, based on the percentage of lower secondary education teachers whose school principal reports that their teachers were never formally appraised by other teachers.Source: OECD, TALIS 2013 Database
It can be seen that the way in which Australian teachers receive formal appraisal differs from its international counterparts. Although Australia is almost equal to the TALIS average for teachers never formally appraised by other teachers, in contrast Australia shows an opposite result to most countries for appraisal delivered by principals and other management staff. Australian teachers are far more likely than other OECD countries to be appraised by a mentor or members of the school management team, other than the principal, yet less likely to be formally appraised by the principal and much less likely to be formally appraised by an external party.
As shown in Table 5.1, Australia also has comparatively one of the lowest percentages of teachers never receiving formal appraisal (at 2.8 per cent), although slightly higher than the Asian comparison group (at 1.2 per cent). Given that Australian teachers report that 55 per cent of mentors are from a common subject field (see Chapter 4), it can be assumed that the formal appraisal is largely received from an experienced colleague of the same subject area.
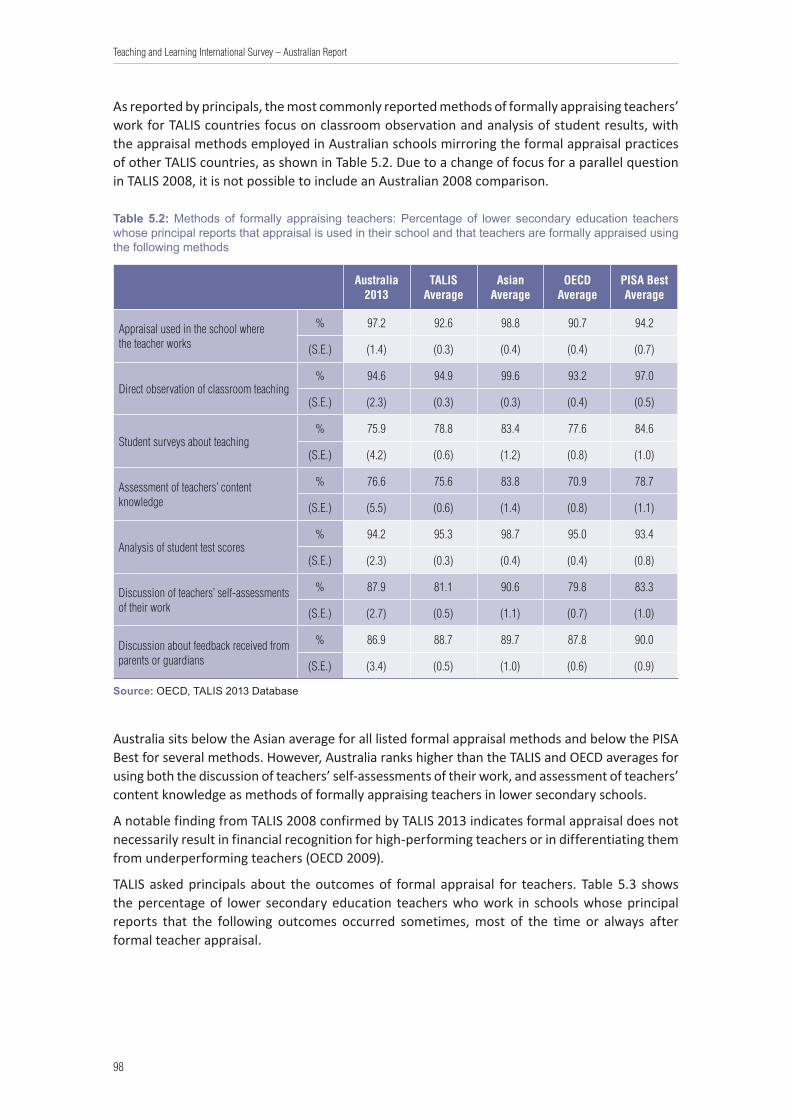
98
Teaching and Learning International Survey – Australian Report
As reported by principals, the most commonly reported methods of formally appraising teachers’ work for TALIS countries focus on classroom observation and analysis of student results, with the appraisal methods employed in Australian schools mirroring the formal appraisal practices of other TALIS countries, as shown in Table 5.2. Due to a change of focus for a parallel question in TALIS 2008, it is not possible to include an Australian 2008 comparison.
Table 5.2: Methods of formally appraising teachers: Percentage of lower secondary education teachers whose principal reports that appraisal is used in their school and that teachers are formally appraised using the following methods
Australia 2013
TALIS Average
Asian Average
OECD Average
PISA Best Average
Appraisal used in the school where the teacher works
% 97.2 92.6 98.8 90.7 94.2
(S.E.) (1.4) (0.3) (0.4) (0.4) (0.7)
Direct observation of classroom teaching% 94.6 94.9 99.6 93.2 97.0
(S.E.) (2.3) (0.3) (0.3) (0.4) (0.5)
Student surveys about teaching% 75.9 78.8 83.4 77.6 84.6
(S.E.) (4.2) (0.6) (1.2) (0.8) (1.0)
Assessment of teachers’ content knowledge
% 76.6 75.6 83.8 70.9 78.7
(S.E.) (5.5) (0.6) (1.4) (0.8) (1.1)
Analysis of student test scores% 94.2 95.3 98.7 95.0 93.4
(S.E.) (2.3) (0.3) (0.4) (0.4) (0.8)
Discussion of teachers’ self-assessments of their work
% 87.9 81.1 90.6 79.8 83.3
(S.E.) (2.7) (0.5) (1.1) (0.7) (1.0)
Discussion about feedback received from parents or guardians
% 86.9 88.7 89.7 87.8 90.0
(S.E.) (3.4) (0.5) (1.0) (0.6) (0.9)
Source: OECD, TALIS 2013 Database
Australia sits below the Asian average for all listed formal appraisal methods and below the PISA Best for several methods. However, Australia ranks higher than the TALIS and OECD averages for using both the discussion of teachers’ self-assessments of their work, and assessment of teachers’ content knowledge as methods of formally appraising teachers in lower secondary schools.
A notable finding from TALIS 2008 confirmed by TALIS 2013 indicates formal appraisal does not necessarily result in financial recognition for high-performing teachers or in differentiating them from underperforming teachers (OECD 2009).
TALIS asked principals about the outcomes of formal appraisal for teachers. Table 5.3 shows the percentage of lower secondary education teachers who work in schools whose principal reports that the following outcomes occurred sometimes, most of the time or always after formal teacher appraisal.
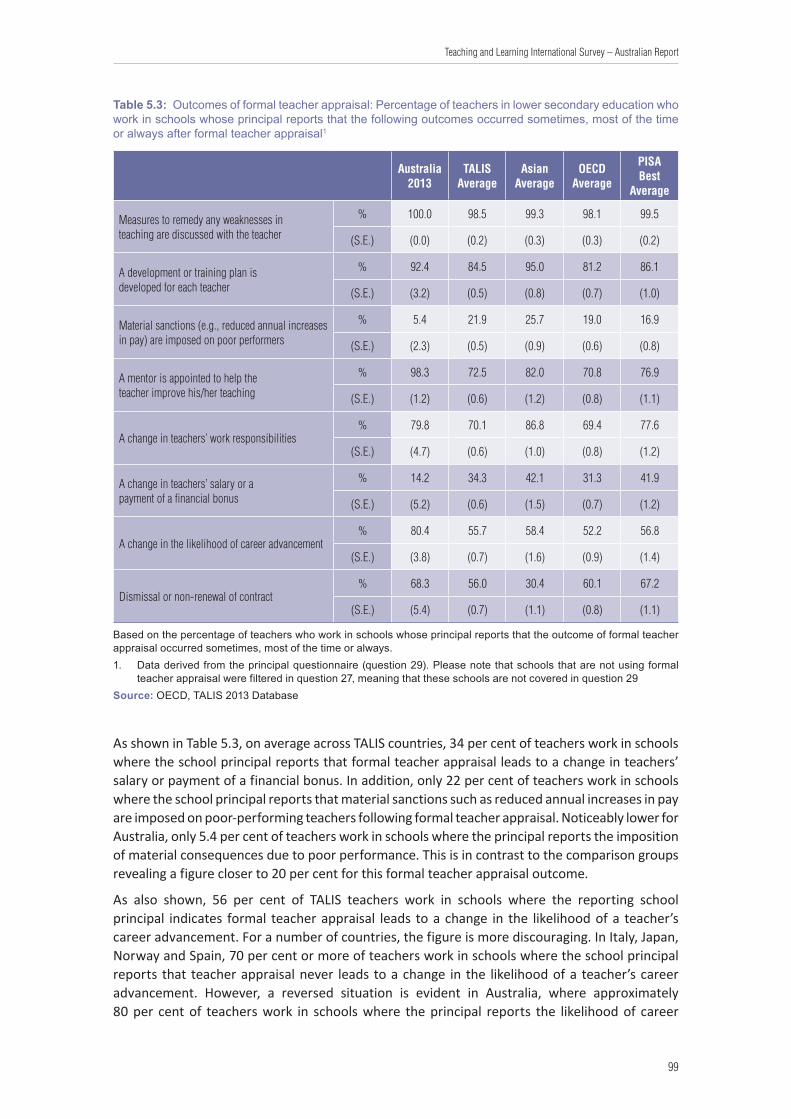
99
Teaching and Learning International Survey – Australian Report
Table 5.3: Outcomes of formal teacher appraisal: Percentage of teachers in lower secondary education who work in schools whose principal reports that the following outcomes occurred sometimes, most of the time or always after formal teacher appraisal1
Australia 2013
TALIS Average
Asian Average
OECD Average
PISA Best
Average
Measures to remedy any weaknesses in teaching are discussed with the teacher
% 100.0 98.5 99.3 98.1 99.5
(S.E.) (0.0) (0.2) (0.3) (0.3) (0.2)
A development or training plan is developed for each teacher
% 92.4 84.5 95.0 81.2 86.1
(S.E.) (3.2) (0.5) (0.8) (0.7) (1.0)
Material sanctions (e.g., reduced annual increases in pay) are imposed on poor performers
% 5.4 21.9 25.7 19.0 16.9
(S.E.) (2.3) (0.5) (0.9) (0.6) (0.8)
A mentor is appointed to help the teacher improve his/her teaching
% 98.3 72.5 82.0 70.8 76.9
(S.E.) (1.2) (0.6) (1.2) (0.8) (1.1)
A change in teachers’ work responsibilities% 79.8 70.1 86.8 69.4 77.6
(S.E.) (4.7) (0.6) (1.0) (0.8) (1.2)
A change in teachers’ salary or a payment of a financial bonus
% 14.2 34.3 42.1 31.3 41.9
(S.E.) (5.2) (0.6) (1.5) (0.7) (1.2)
A change in the likelihood of career advancement% 80.4 55.7 58.4 52.2 56.8
(S.E.) (3.8) (0.7) (1.6) (0.9) (1.4)
Dismissal or non-renewal of contract% 68.3 56.0 30.4 60.1 67.2
(S.E.) (5.4) (0.7) (1.1) (0.8) (1.1)
Based on the percentage of teachers who work in schools whose principal reports that the outcome of formal teacher appraisal occurred sometimes, most of the time or always. 1. Data derived from the principal questionnaire (question 29). Please note that schools that are not using formal
teacher appraisal were filtered in question 27, meaning that these schools are not covered in question 29Source: OECD, TALIS 2013 Database
As shown in Table 5.3, on average across TALIS countries, 34 per cent of teachers work in schools where the school principal reports that formal teacher appraisal leads to a change in teachers’ salary or payment of a financial bonus. In addition, only 22 per cent of teachers work in schools where the school principal reports that material sanctions such as reduced annual increases in pay are imposed on poor-performing teachers following formal teacher appraisal. Noticeably lower for Australia, only 5.4 per cent of teachers work in schools where the principal reports the imposition of material consequences due to poor performance. This is in contrast to the comparison groups revealing a figure closer to 20 per cent for this formal teacher appraisal outcome.
As also shown, 56 per cent of TALIS teachers work in schools where the reporting school principal indicates formal teacher appraisal leads to a change in the likelihood of a teacher’s career advancement. For a number of countries, the figure is more discouraging. In Italy, Japan, Norway and Spain, 70 per cent or more of teachers work in schools where the school principal reports that teacher appraisal never leads to a change in the likelihood of a teacher’s career advancement. However, a reversed situation is evident in Australia, where approximately 80 per cent of teachers work in schools where the principal reports the likelihood of career
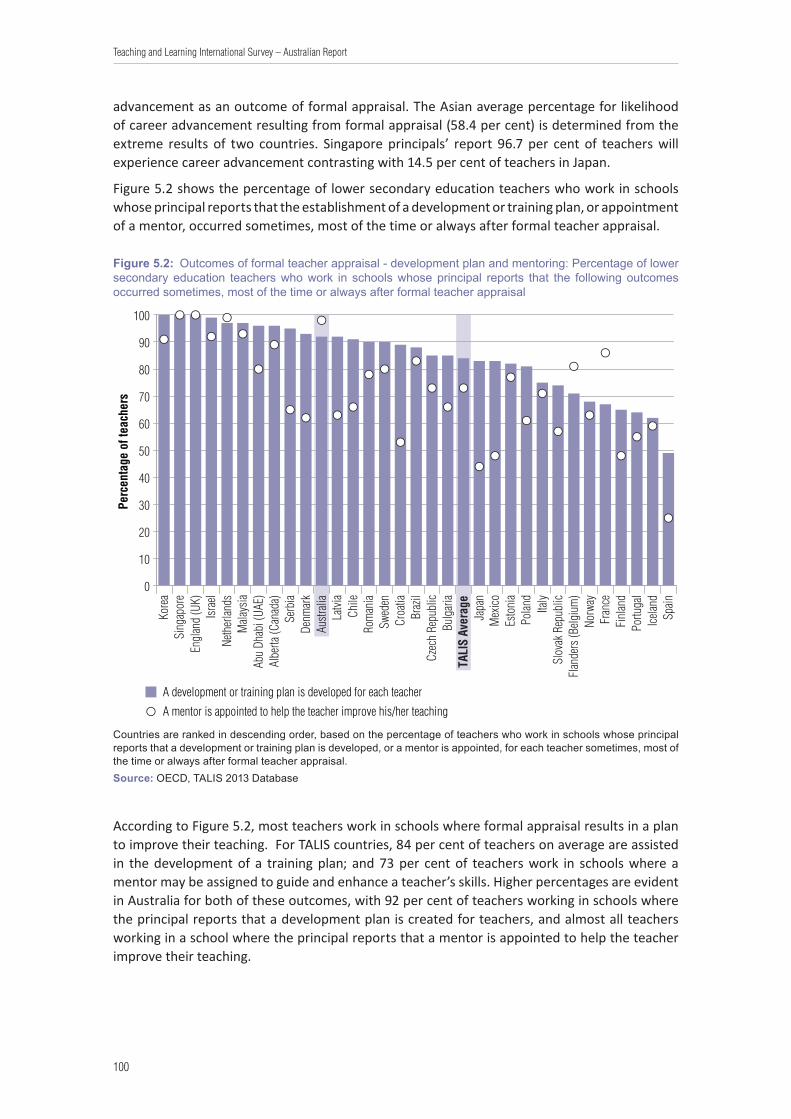
100
Teaching and Learning International Survey – Australian Report
advancement as an outcome of formal appraisal. The Asian average percentage for likelihood of career advancement resulting from formal appraisal (58.4 per cent) is determined from the extreme results of two countries. Singapore principals’ report 96.7 per cent of teachers will experience career advancement contrasting with 14.5 per cent of teachers in Japan.
Figure 5.2 shows the percentage of lower secondary education teachers who work in schools whose principal reports that the establishment of a development or training plan, or appointment of a mentor, occurred sometimes, most of the time or always after formal teacher appraisal.
Figure 5.2: Outcomes of formal teacher appraisal - development plan and mentoring: Percentage of lower secondary education teachers who work in schools whose principal reports that the following outcomes occurred sometimes, most of the time or always after formal teacher appraisal
A development or training plan is developed for each teacher
A mentor is appointed to help the teacher improve his/her teaching
Perc
enta
ge o
f tea
cher
s
0
10
20
30
40
50
60
70
80
90
100
Spain
Icelan
dPo
rtuga
lFi
nlan
dFr
ance
Norw
ayFl
ande
rs (B
elgiu
m)
Slov
ak R
epub
licItaly
Polan
dEs
toni
aM
exico
Japa
nTA
LIS
Aver
age
Bulg
aria
Czec
h Re
publ
icBr
azil
Croa
tiaSw
eden
Rom
ania
Chile
Latvi
aAu
strali
aDe
nmar
kSe
rbia
Albe
rta (C
anad
a)Ab
u Dh
abi (
UAE)
Mala
ysia
Neth
erlan
dsIsr
ael
Engl
and
(UK)
Sing
apor
eKo
rea
Countries are ranked in descending order, based on the percentage of teachers who work in schools whose principal reports that a development or training plan is developed, or a mentor is appointed, for each teacher sometimes, most of the time or always after formal teacher appraisal.Source: OECD, TALIS 2013 Database
According to Figure 5.2, most teachers work in schools where formal appraisal results in a plan to improve their teaching. For TALIS countries, 84 per cent of teachers on average are assisted in the development of a training plan; and 73 per cent of teachers work in schools where a mentor may be assigned to guide and enhance a teacher’s skills. Higher percentages are evident in Australia for both of these outcomes, with 92 per cent of teachers working in schools where the principal reports that a development plan is created for teachers, and almost all teachers working in a school where the principal reports that a mentor is appointed to help the teacher improve their teaching.

101
Teaching and Learning International Survey – Australian Report
5.3 Teacher feedback
Sources of feedback
TALIS 2013 asked teachers about the feedback they directly receive regarding their work in their school. This can be from a variety of formal or informal sources. Although feedback to teachers should be distinguished from the previous discussion on formal appraisal, it is important to recognise that teacher appraisal is likely to have a greater impact if it is accompanied by teacher feedback.
Table 5.4 shows the percentage of lower secondary education teachers who report receiving feedback from various sources and teachers who report never having received feedback in their school.
Table 5.4: Teachers’ feedback by source of feedback: Percentage of lower secondary education teachers who report receiving feedback from various sources and teachers who report never having received feedback in their school1
Australia 2013
TALIS Average
Asian Average
OECD Average
PISA Best Average
Have received feedback from2
External individuals or bodies
% 14.8 28.9 20.1 25.7 23.8
(S.E.) (1.0) (0.2) (0.5) (0.2) (0.4)
School principal% 27.2 54.3 50.4 49.1 57.9
(S.E.) (1.6) (0.3) (0.6) (0.3) (0.5)
Members of school management team
% 57.0 49.3 66.7 44.3 49.0
(S.E.) (2.0) (0.2) (0.5) (0.3) (0.4)
Assigned mentors% 24.1 19.2 28.9 15.9 18.5
(S.E.) (1.5) (0.2) (0.5) (0.2) (0.3)
Other teachers% 50.6 41.9 51.9 43.6 47.4
(S.E.) (2.0) (0.2) (0.5) (0.3) (0.4)
Have never received feedback in their current school3
% 14.1 12.5 3.6 15.8 9.6
(S.E.) (1.5) (0.1) (0.2) (0.2) (0.2)
1. Feedback is defined broadly as any communication of the results of a review of an individual’s work, often with the purpose of noting good performance or identifying areas for development. The feedback may be provided formally or informally.
2. Referring to the percentage of teachers receiving feedback from respective bodies for at least one item from question 28 of the teacher questionnaire. The same teacher can receive feedback from different bodies via different methods.
3. Referring to the percentage of teachers reporting never having received feedback in their school for any of the items surveyed in question 28 from the teacher questionnaire.
Source: OECD, TALIS 2013 Database
For all TALIS countries, the majority of teachers report receiving feedback on their teaching, with an average of 87 per cent of teachers indicating feedback received at school level. With 86 per cent of teachers reporting feedback received, Australia is slightly below the TALIS average, but well below the Asian comparison group where 96 per cent of teachers receive feedback on their teaching.
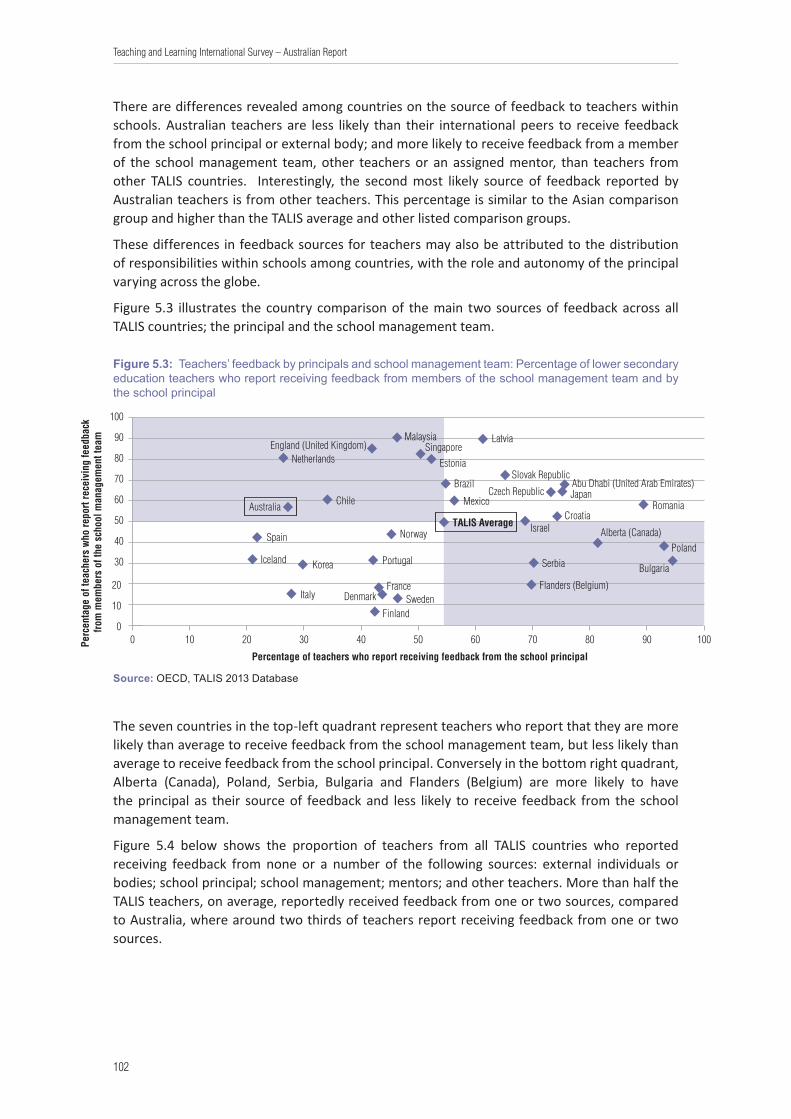
102
Teaching and Learning International Survey – Australian Report
There are differences revealed among countries on the source of feedback to teachers within schools. Australian teachers are less likely than their international peers to receive feedback from the school principal or external body; and more likely to receive feedback from a member of the school management team, other teachers or an assigned mentor, than teachers from other TALIS countries. Interestingly, the second most likely source of feedback reported by Australian teachers is from other teachers. This percentage is similar to the Asian comparison group and higher than the TALIS average and other listed comparison groups.
These differences in feedback sources for teachers may also be attributed to the distribution of responsibilities within schools among countries, with the role and autonomy of the principal varying across the globe.
Figure 5.3 illustrates the country comparison of the main two sources of feedback across all TALIS countries; the principal and the school management team.
Figure 5.3: Teachers’ feedback by principals and school management team: Percentage of lower secondary education teachers who report receiving feedback from members of the school management team and by the school principal
0 10 20 30 40 50 60 70 80 90 1000
10
20
30
40
50
60
70
80
90
100
Percentage of teachers who report receiving feedback from the school principal
Perc
enta
ge o
f tea
cher
s w
ho re
port
rece
ivin
g fe
edba
ck
from
mem
bers
of t
he s
choo
l man
agem
ent t
eam
Slovak Republic
SingaporeMalaysia
Mexico
Latvia
Australia
Alberta (Canada)
Estonia
Abu Dhabi (United Arab Emirates)
Poland
Croatia
Flanders (Belgium)
Netherlands
Korea
Israel
England (United Kingdom)
Denmark
TALIS Average
Iceland Serbia
Czech Republic
Spain
Portugal
Brazil
Norway
Bulgaria
Finland
Japan
Sweden
Chile
France
Romania
Italy
Source: OECD, TALIS 2013 Database
The seven countries in the top-left quadrant represent teachers who report that they are more likely than average to receive feedback from the school management team, but less likely than average to receive feedback from the school principal. Conversely in the bottom right quadrant, Alberta (Canada), Poland, Serbia, Bulgaria and Flanders (Belgium) are more likely to have the principal as their source of feedback and less likely to receive feedback from the school management team.
Figure 5.4 below shows the proportion of teachers from all TALIS countries who reported receiving feedback from none or a number of the following sources: external individuals or bodies; school principal; school management; mentors; and other teachers. More than half the TALIS teachers, on average, reportedly received feedback from one or two sources, compared to Australia, where around two thirds of teachers report receiving feedback from one or two sources.
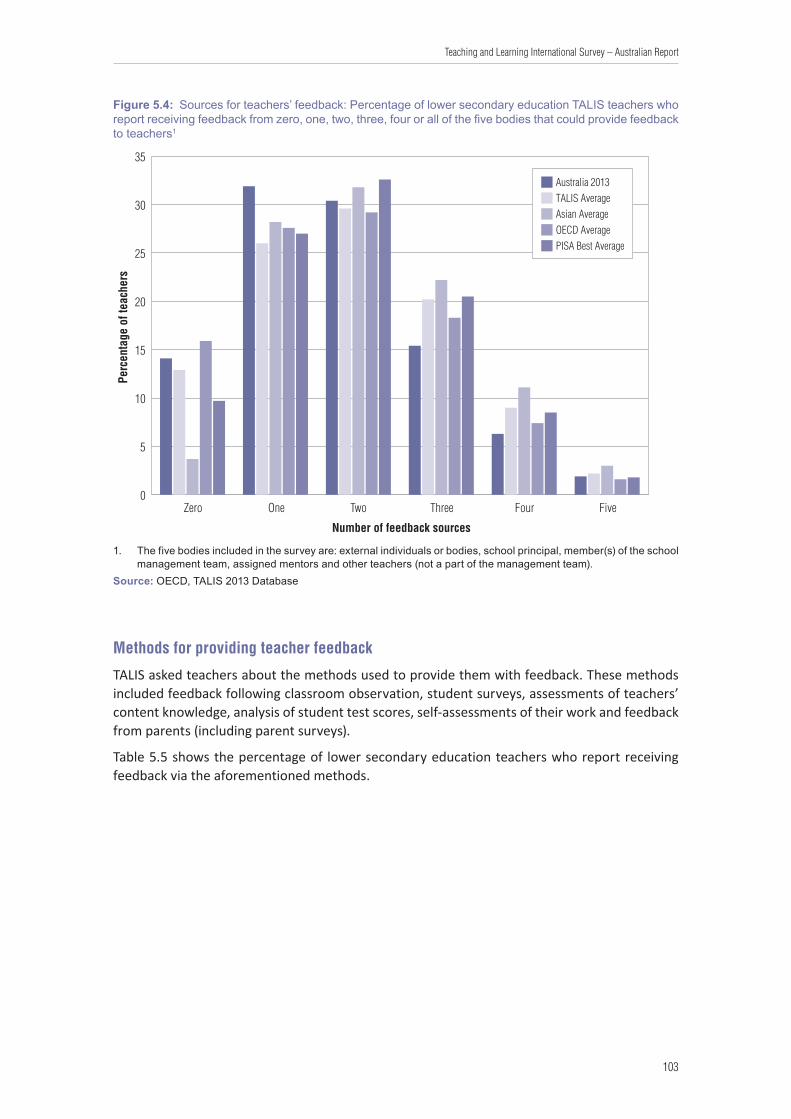
103
Teaching and Learning International Survey – Australian Report
Figure 5.4: Sources for teachers’ feedback: Percentage of lower secondary education TALIS teachers who report receiving feedback from zero, one, two, three, four or all of the five bodies that could provide feedback to teachers1
0
5
10
15
20
25
30
35
Perc
enta
ge o
f tea
cher
s
Number of feedback sources
Zero One Two Three Four Five
Australia 2013TALIS AverageAsian AverageOECD AveragePISA Best Average
1. The five bodies included in the survey are: external individuals or bodies, school principal, member(s) of the school management team, assigned mentors and other teachers (not a part of the management team).
Source: OECD, TALIS 2013 Database
Methods for providing teacher feedback
TALIS asked teachers about the methods used to provide them with feedback. These methods included feedback following classroom observation, student surveys, assessments of teachers’ content knowledge, analysis of student test scores, self-assessments of their work and feedback from parents (including parent surveys).
Table 5.5 shows the percentage of lower secondary education teachers who report receiving feedback via the aforementioned methods.

104
Teaching and Learning International Survey – Australian Report
Table 5.5: Methods for providing feedback to teachers: Percentage of lower secondary education teachers who report receiving feedback via the following methods1
Feedback following classroom
observation
Feedback from student
surveys
Feedback following
assessment of teachers’
content knowledge
Feedback following
analysis of student test
scores
Feedback following
self-assessment of teachers’
work
Feedback from surveys or discussion with parents
% (S.E.) % (S.E.) % (S.E.) % (S.E.) % (S.E.) % (S.E.)
Australia 2013 69.6 (2.0) 39.8 (2.3) 33.0 (1.6) 56.0 (1.9) 44.6 (2.2) 39.8 (1.3)
TALIS Average 78.8 (0.2) 53.3 (0.2) 54.8 (0.2) 63.6 (0.2) 52.7 (0.2) 53.4 (0.2)
Asian Average 93.1 (0.3) 70.7 (0.5) 76.3 (0.5) 80.4 (0.4) 79.7 (0.5) 66.4 (0.5)
OECD Average 74.1 (0.3) 48.8 (0.3) 47.5 (0.3) 58.4 (0.3) 46.8 (0.3) 48.5 (0.3)
PISA Best Average 84.3 (0.3) 56.6 (0.5) 57.8 (0.4) 63.0 (0.4) 57.8 (0.4) 54.0 (0.4)
1. Percentage of teachers that reported receiving feedback via the following methods by at least one body, including: external individuals or bodies, principal, member(s) of school management team, assigned mentors or other teachers.
Source: OECD, TALIS 2013 Database
For every method of feedback, Australia exhibits a lower percentage of teachers who report that they receive feedback via this method than the TALIS average. Furthermore, the Australian teachers’ percentages are substantially lower than the Asian comparison group for each feedback delivery method. Feedback following classroom observation is reportedly the most popular method for Australian teachers to receive feedback on their teaching, with feedback following assessment of teachers’ content knowledge the least likely of the six methods listed. Internationally, feedback following classroom observation was consistently the most popular method for teachers to receive feedback across TALIS countries and all the comparison groups. In contrast, on a country-specific level less than half of teachers in Finland, Iceland, Italy and Spain report receiving feedback following a classroom observation. Feedback following analysis of student test scores was the second most common method of providing teacher feedback and again this was common across the listed comparison groups.
For all comparison groups, the reported percentage of teachers who received feedback from student surveys and from parent surveys/discussions are virtually equal. On average across TALIS countries, 53 per cent of teachers report that the feedback they received is based on student surveys; however this varies widely across countries.
Teachers reported the number of different listed methods by which they received feedback on their teaching. Figure 5.5 provides the percentage of lower secondary education teachers who report receiving feedback from zero, one, two, three, four, five or all of the six methods surveyed for teacher feedback. It shows the comparison groups with differences obvious in the instances of ‘zero’ and ‘six’, which are the TALIS, Asian and PISA Best countries. This indicates that other countries employ a more diverse combination of feedback methods when providing feedback to teachers on their teaching.
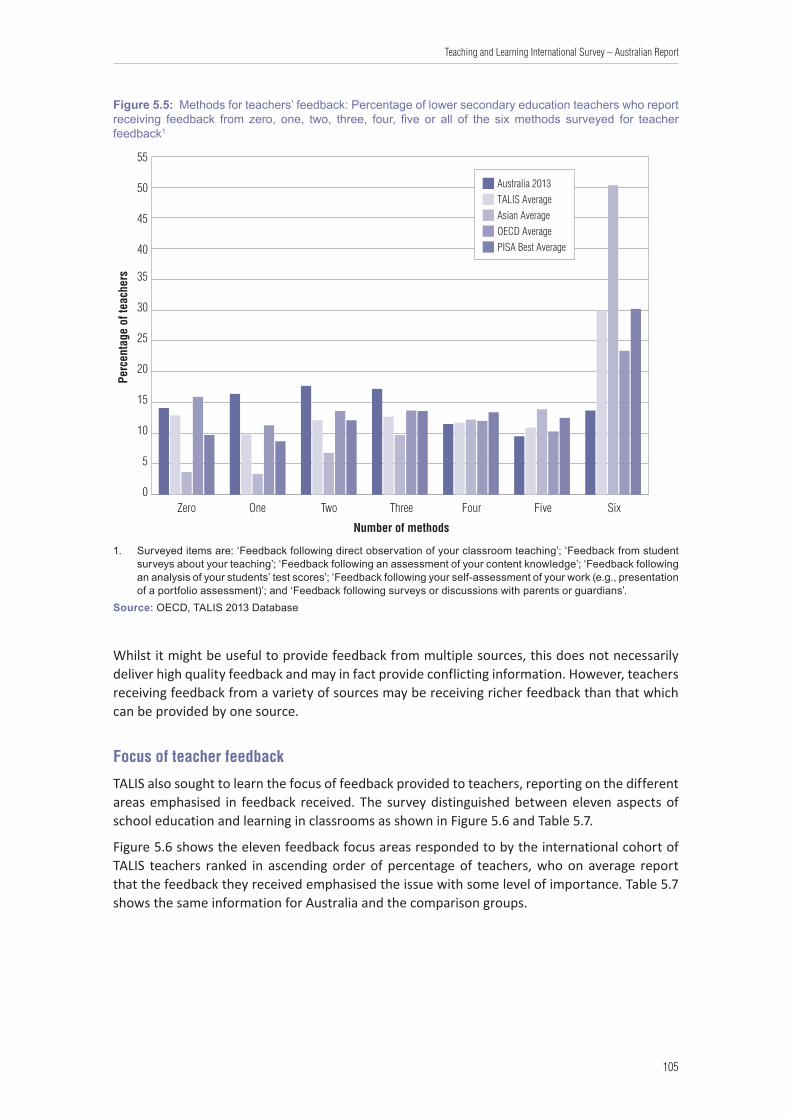
105
Teaching and Learning International Survey – Australian Report
Figure 5.5: Methods for teachers’ feedback: Percentage of lower secondary education teachers who report receiving feedback from zero, one, two, three, four, five or all of the six methods surveyed for teacher feedback1
0
5
10
15
20
25
30
35
40
45
50
55
Perc
enta
ge o
f tea
cher
s
Number of methods
Zero One Two Three Four Five Six
Australia 2013TALIS AverageAsian AverageOECD AveragePISA Best Average
1. Surveyed items are: ‘Feedback following direct observation of your classroom teaching’; ‘Feedback from student surveys about your teaching’; ‘Feedback following an assessment of your content knowledge’; ‘Feedback following an analysis of your students’ test scores’; ‘Feedback following your self-assessment of your work (e.g., presentation of a portfolio assessment)’; and ‘Feedback following surveys or discussions with parents or guardians’.
Source: OECD, TALIS 2013 Database
Whilst it might be useful to provide feedback from multiple sources, this does not necessarily deliver high quality feedback and may in fact provide conflicting information. However, teachers receiving feedback from a variety of sources may be receiving richer feedback than that which can be provided by one source.
Focus of teacher feedback
TALIS also sought to learn the focus of feedback provided to teachers, reporting on the different areas emphasised in feedback received. The survey distinguished between eleven aspects of school education and learning in classrooms as shown in Figure 5.6 and Table 5.7.
Figure 5.6 shows the eleven feedback focus areas responded to by the international cohort of TALIS teachers ranked in ascending order of percentage of teachers, who on average report that the feedback they received emphasised the issue with some level of importance. Table 5.7 shows the same information for Australia and the comparison groups.
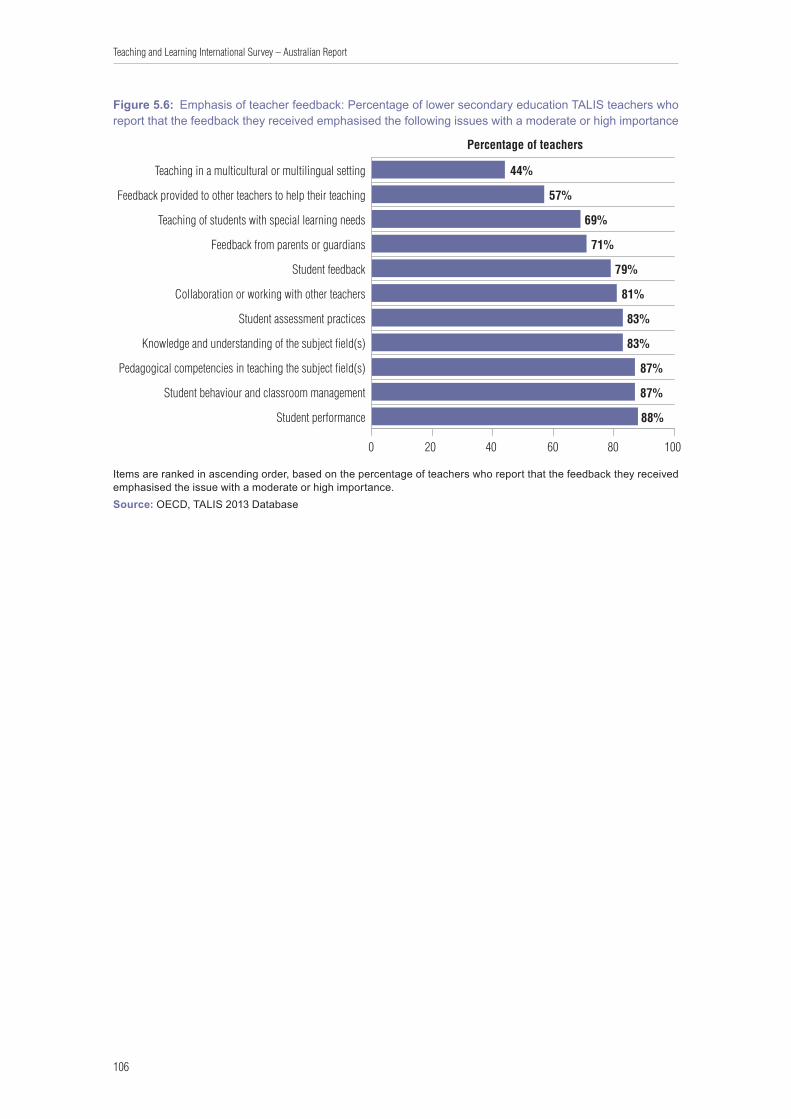
106
Teaching and Learning International Survey – Australian Report
Figure 5.6: Emphasis of teacher feedback: Percentage of lower secondary education TALIS teachers who report that the feedback they received emphasised the following issues with a moderate or high importance
0 20 40 60 80 100
Student performance
Student behaviour and classroom management
Pedagogical competencies in teaching the subject field(s)
Knowledge and understanding of the subject field(s)
Student assessment practices
Collaboration or working with other teachers
Student feedback
Feedback from parents or guardians
Teaching of students with special learning needs
Feedback provided to other teachers to help their teaching
Teaching in a multicultural or multilingual setting
Percentage of teachers
Items are ranked in ascending order, based on the percentage of teachers who report that the feedback they received emphasised the issue with a moderate or high importance.
Source: OECD, TALIS 2013 Database, Table 5.6.
44%
57%
69%
71%
79%
81%
83%
83%
87%
87%
88%
Items are ranked in ascending order, based on the percentage of teachers who report that the feedback they received emphasised the issue with a moderate or high importance. Source: OECD, TALIS 2013 Database

107
Teaching and Learning International Survey – Australian Report
Table 5.7: Emphasis of teacher feedback: Percentage of lower secondary education teachers who report the feedback they received emphasised the following issues with a moderate or high importance
Australia 20081, 2
Australia 2013
TALIS Average
Asian Average
OECD Average
PISA Best Average
Student performance% 51.4 87.5 87.5 88.5 84.5 83.5
(S.E.) (1.6) (1.4) (0.2) (0.3) (0.2) (0.3)
Knowledge and understanding of the subject field(s)
% 72.4 69.1 83.5 89.6 80.2 81.4
(S.E.) (1.2) (1.5) (0.2) (0.3) (0.2) (0.3)
Pedagogical competencies in teaching the subject field(s)
% 74.9 86.8 92.8 84.4 87.0
(S.E.) (1.2) (0.2) (0.3) (0.2) (0.3)
Student assessment practices% 76.5 83.0 88.5 79.6 80.1
(S.E.) (1.5) (0.2) (0.3) (0.2) (0.4)
Student behaviour and classroom management
% 70.0 86.9 89.0 85.5 84.9
(S.E.) (1.6) (0.2) (0.3) (0.2) (0.3)
Teaching of students with special learning needs
% 41.2 50.8 68.7 67.9 68.3 65.4
(S.E.) (1.9) (1.8) (0.2) (0.5) (0.3) (0.5)
Teaching in a multicultural or multilingual setting
% 29.1 30.1 43.7 49.6 38.4 32.9
(S.E.) (1.6) (1.9) (0.3) (0.5) (0.3) (0.5)
Feedback provided to other teachers to help their teaching
% 46.6 57.4 70.6 51.3 48.3
(S.E.) (1.4) (0.2) (0.5) (0.3) (0.4)
Feedback from parents or guardians% 55.1 70.8 75.1 66.6 65.3
(S.E.) (2.0) (0.2) (0.4) (0.3) (0.4)
Student feedback% 58.4 62.9 79.1 83.9 76.0 75.5
(S.E.) (1.9) (2.2) (0.2) (0.4) (0.3) (0.4)
Collaboration or working with other teachers
% 71.3 80.7 83.6 78.0 77.4
(S.E.) (1.4) (0.2) (0.4) (0.2) (0.4)
1. For 2008, the comparable item reported on the Percentage of teachers who report that the following aspects were considered with high or moderate importance in the appraisal and/or feedback they received. A comparison can be made for five categories. The other listed emphases from TALIS 2013 are not able to be compared to the TALIS 2008 data.
2. The teacher population coverage was slightly different between 2008 and 2013. In order to have comparable populations for the tables comparing results from 2008 and 2013, teachers who teach exclusively to students with special needs were excluded from the 2013 data in these tables.
Source: OECD, TALIS 2013 Database
The comparison groups indicate a higher level of emphasis on the specific focus areas when providing feedback to teachers than those reported by Australian teachers in TALIS 2013. With the exception of feedback provided to teachers with an emphasis on student performance, which is equal to the TALIS average, the Australia average is systematically lower than the TALIS average for the other ten focus areas. For this item, a limited comparison for six of the focus areas may be made with the TALIS 2008 data. It is interesting to observe that whilst the feedback from

108
Teaching and Learning International Survey – Australian Report
students and parents and to other teachers draws less emphasis, there are greater percentages of teachers who report receiving feedback that emphasises student performance, student behaviour and classroom management, and teaching students with special needs.
Table 5.8 shows the percentage of teachers in a selection of countries who reported a moderate or high emphasis placed on student performance in the feedback they received in TALIS 2008 compared with TALIS 2013.
Table 5.8: Emphasis on student performance in teacher feedback: Percentage of teachers who report a moderate or high emphasis placed on student performance in the feedback - TALIS 2008 and TALIS 2013
Percentage of teachers who reported moderate or high emphasis
placed on student performance in feedback received in 2008
Percentage of teachers who reported moderate or high emphasis
placed on student performance in feedback received in 2013
Country % (S.E.) % (S.E.)
Australia 51.4 (1.6) 87.7 (1.4)
Denmark 28.6 (1.7) 72.0 (1.9)
Iceland 44.9 (2.0) 77.6 (1.8)
Italy 62.5 (1.8) 95.0 (0.7)
Norway 47.3 (1.6) 73.0 (1.2)
Portugal 64.4 (1.5) 94.8 (0.5)
Average 66.9 (0.4) 87.2 (0.3)
Source: OECD, TALIS 2013 Database
Clearly the emphasis on student performance in the feedback teachers reportedly received has increased since 2008. On average across TALIS countries that participated in both TALIS cycles, 67 per cent of teachers reported a strong emphasis on student performance in TALIS 2008. This percentage increases significantly to 87 per cent in TALIS 2013. In Australia, this figure also increased but by an even larger amount (over 30 per cent), from 51 per cent in 2008 to 88 per cent in 2013.
This increase may reflect the greater emphasis placed on student performance by governments and departments in many countries over this period. In Australia, the National Assessment Program Literacy and Numeracy (NAPLAN) programme was introduced across Australia in 2008 for all Year 3, 5, 7 and 9 students, with the purpose of improving student outcomes and providing stakeholders with data to inform and direct policy. These national assessments maintain a high profile with school results published on the My School website for public access, enabling simple comparisons between statistically similar schools. As NAPLAN data are only one source of data collected about a school, it would be misleading to make judgments about school performance based only on this data. The program has played a significant role in education reform and school improvement debates across the country (Zanderigo, Dowd and Turner, 2012). Since the introduction of the NAPLAN assessments, teacher feedback is likely to be impacted as schools focus on improvements in teaching that enhance student performance.
The percentage of teachers reporting emphasis on teaching students with special needs has increased in Australia by 20 per cent from 2008 to 2013. This change is reflected in other TALIS countries, with the TALIS average increase of 10 per cent of teachers, from 58 per cent in 2008 to 68 per cent in 2013, reportedly obtaining feedback emphasising the teaching of students with special needs.
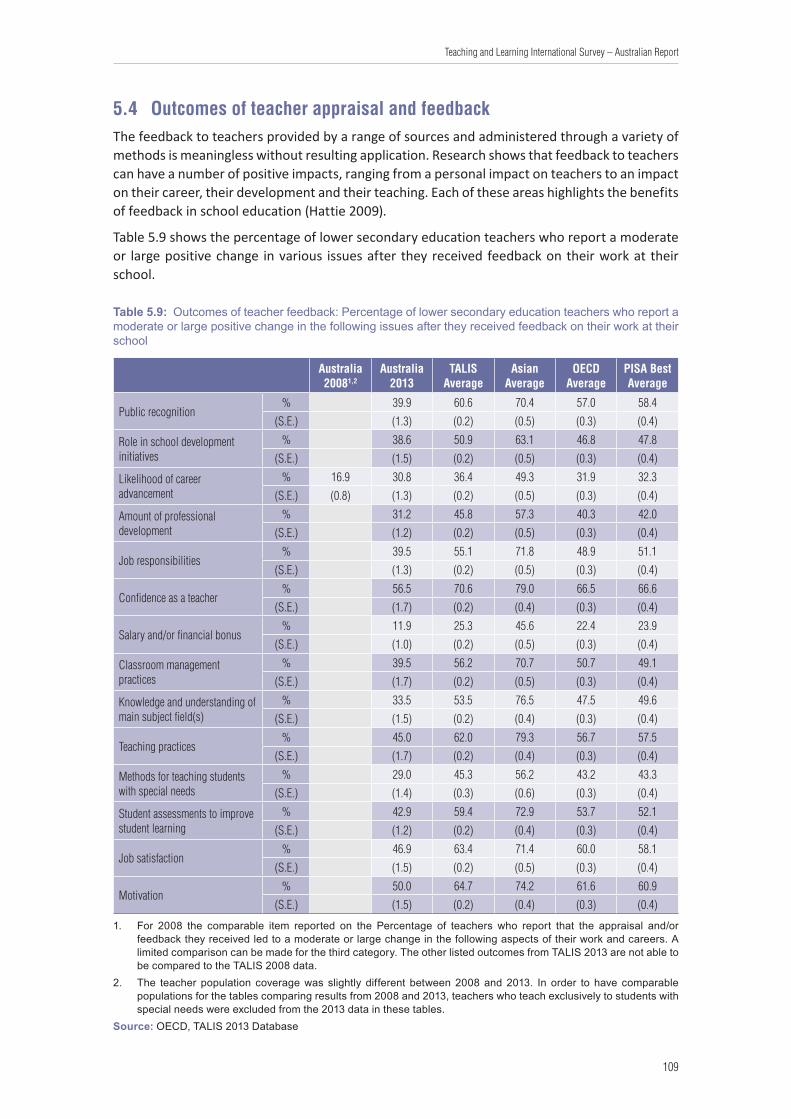
109
Teaching and Learning International Survey – Australian Report
5.4 Outcomes of teacher appraisal and feedback The feedback to teachers provided by a range of sources and administered through a variety of methods is meaningless without resulting application. Research shows that feedback to teachers can have a number of positive impacts, ranging from a personal impact on teachers to an impact on their career, their development and their teaching. Each of these areas highlights the benefits of feedback in school education (Hattie 2009).
Table 5.9 shows the percentage of lower secondary education teachers who report a moderate or large positive change in various issues after they received feedback on their work at their school.
Table 5.9: Outcomes of teacher feedback: Percentage of lower secondary education teachers who report a moderate or large positive change in the following issues after they received feedback on their work at their school
Australia 20081,2
Australia 2013
TALIS Average
Asian Average
OECD Average
PISA Best Average
Public recognition% 39.9 60.6 70.4 57.0 58.4
(S.E.) (1.3) (0.2) (0.5) (0.3) (0.4)
Role in school development initiatives
% 38.6 50.9 63.1 46.8 47.8
(S.E.) (1.5) (0.2) (0.5) (0.3) (0.4)
Likelihood of career advancement
% 16.9 30.8 36.4 49.3 31.9 32.3
(S.E.) (0.8) (1.3) (0.2) (0.5) (0.3) (0.4)
Amount of professional development
% 31.2 45.8 57.3 40.3 42.0
(S.E.) (1.2) (0.2) (0.5) (0.3) (0.4)
Job responsibilities% 39.5 55.1 71.8 48.9 51.1
(S.E.) (1.3) (0.2) (0.5) (0.3) (0.4)
Confidence as a teacher% 56.5 70.6 79.0 66.5 66.6
(S.E.) (1.7) (0.2) (0.4) (0.3) (0.4)
Salary and/or financial bonus% 11.9 25.3 45.6 22.4 23.9
(S.E.) (1.0) (0.2) (0.5) (0.3) (0.4)
Classroom management practices
% 39.5 56.2 70.7 50.7 49.1
(S.E.) (1.7) (0.2) (0.5) (0.3) (0.4)
Knowledge and understanding of main subject field(s)
% 33.5 53.5 76.5 47.5 49.6
(S.E.) (1.5) (0.2) (0.4) (0.3) (0.4)
Teaching practices% 45.0 62.0 79.3 56.7 57.5
(S.E.) (1.7) (0.2) (0.4) (0.3) (0.4)
Methods for teaching students with special needs
% 29.0 45.3 56.2 43.2 43.3
(S.E.) (1.4) (0.3) (0.6) (0.3) (0.4)
Student assessments to improve student learning
% 42.9 59.4 72.9 53.7 52.1
(S.E.) (1.2) (0.2) (0.4) (0.3) (0.4)
Job satisfaction% 46.9 63.4 71.4 60.0 58.1
(S.E.) (1.5) (0.2) (0.5) (0.3) (0.4)
Motivation% 50.0 64.7 74.2 61.6 60.9
(S.E.) (1.5) (0.2) (0.4) (0.3) (0.4)
1. For 2008 the comparable item reported on the Percentage of teachers who report that the appraisal and/or feedback they received led to a moderate or large change in the following aspects of their work and careers. A limited comparison can be made for the third category. The other listed outcomes from TALIS 2013 are not able to be compared to the TALIS 2008 data.
2. The teacher population coverage was slightly different between 2008 and 2013. In order to have comparable populations for the tables comparing results from 2008 and 2013, teachers who teach exclusively to students with special needs were excluded from the 2013 data in these tables.
Source: OECD, TALIS 2013 Database
110
Teaching and Learning International Survey – Australian Report
TALIS revealed that overall there are some positive benefits for teachers resulting from feedback received. For all listed positive outcomes from received feedback, the comparison group averages rate higher than those representing Australian teachers. Just under half of Australia’s teachers report increased job satisfaction or increased motivation after receiving feedback compared to almost two thirds of TALIS teachers. In addition, on average across TALIS countries, 71 per cent of teachers report that the confidence they have in their teaching abilities increases after receiving feedback on their work in their school. Again, this is higher than the reported Australian average of 56.5 per cent. Similarly, the data from Iceland, the Netherlands, Portugal, Spain and England (United Kingdom) also reveal that less than 60 per cent of teachers report an increase in confidence following feedback on their work.
Table 5.9 also reveals less than one third of Australian teachers report the positive outcome of increased professional development following feedback; 15 per cent below the TALIS average and 26 per cent below the Asian comparison group average. Australian teachers report similarly on the positive outcome of likelihood of career advancement, with 31 per cent indicating a change resulting from feedback received.
As discussed in Chapter 4, Australian teachers participate in fewer professional development days annually as compared to the TALIS average and cite conflict with work schedule as the greatest barrier. The recognition of the importance of teacher appraisal in identifying professional development and advancement opportunities for teachers, together with the aim of improving teaching skills, needs to be fully understood by school leadership and guide both the appraisal process and feedback methods to ensure meaningful and productive outcomes for teachers.
Almost 40 per cent of Australian teachers within schools report a positive change to their roles and responsibilities as a result of feedback, indicative of decisive steps taken by school leadership to respond, adapt and utilise the available skills of teachers, matching them appropriately to roles.
With an average of a quarter of teachers from TALIS countries receiving an increase in salary or financial bonus following the receipt of feedback, Australia compares less favourably with only 12 per cent of teachers receiving financial gain as an outcome of feedback on their work. In contrast, the Asian comparison group indicates that, on average, 46 per cent of teachers from these countries gain financial recognition following feedback. This figure is largely influenced by Malaysia, where 78 per cent of teachers report an increase in salary or financial bonus following feedback on their work in schools.
Arguably the key statistic listed in Table 5.9, 62 per cent of teachers from TALIS countries report a positive influence on their classroom teaching practices after receiving feedback. This positive outcome is less pronounced in Australia with 45 per cent of secondary teachers in schools indicating improvement in teaching skills as an outcome from feedback. As stated in the TALIS International Report, ‘these findings emphasise the developmental nature of feedback and how it can have a direct impact on classroom teaching’. As teacher improvement is unquestionably a key outcome of all appraisal and feedback, further investigation into refining the foci of appraisal and emphases of feedback for Australian teachers is warranted.
From TALIS 2008 to TALIS 2013, outcomes of feedback have improved with Australian teachers reporting an increased positive change to the likelihood of career advancement, with 16.9 per cent of Australian teachers reporting this change as an outcome of feedback in 2008, increasing to 30.8 per cent in 2013, almost rivalling the TALIS averages of 16.7 per cent in 2008 increasing to 36.4 per cent in 2013. Whilst not yet a trend, it is encouraging to see the link between feedback and career advancement strengthen.
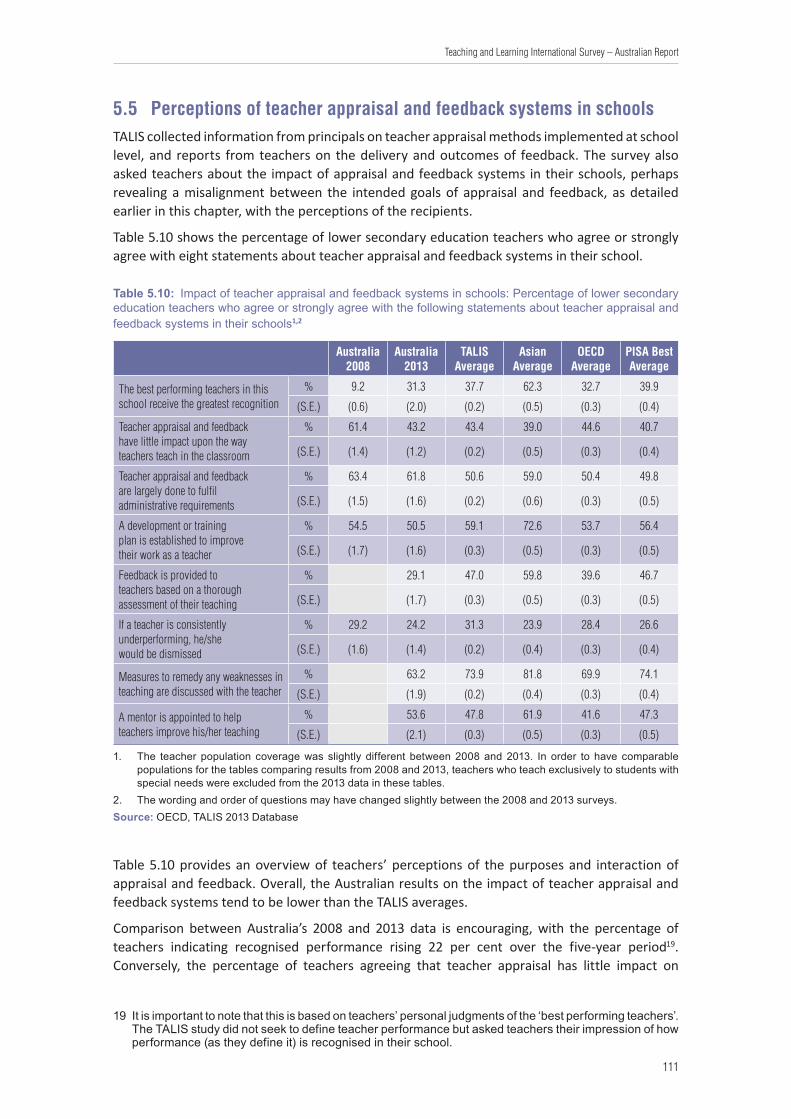
111
Teaching and Learning International Survey – Australian Report
5.5 Perceptions of teacher appraisal and feedback systems in schools TALIS collected information from principals on teacher appraisal methods implemented at school level, and reports from teachers on the delivery and outcomes of feedback. The survey also asked teachers about the impact of appraisal and feedback systems in their schools, perhaps revealing a misalignment between the intended goals of appraisal and feedback, as detailed earlier in this chapter, with the perceptions of the recipients.
Table 5.10 shows the percentage of lower secondary education teachers who agree or strongly agree with eight statements about teacher appraisal and feedback systems in their school.
Table 5.10: Impact of teacher appraisal and feedback systems in schools: Percentage of lower secondary education teachers who agree or strongly agree with the following statements about teacher appraisal and feedback systems in their schools1,2
Australia 2008
Australia 2013
TALIS Average
Asian Average
OECD Average
PISA Best Average
The best performing teachers in this school receive the greatest recognition
% 9.2 31.3 37.7 62.3 32.7 39.9
(S.E.) (0.6) (2.0) (0.2) (0.5) (0.3) (0.4)
Teacher appraisal and feedback have little impact upon the way teachers teach in the classroom
% 61.4 43.2 43.4 39.0 44.6 40.7
(S.E.) (1.4) (1.2) (0.2) (0.5) (0.3) (0.4)
Teacher appraisal and feedback are largely done to fulfil administrative requirements
% 63.4 61.8 50.6 59.0 50.4 49.8
(S.E.) (1.5) (1.6) (0.2) (0.6) (0.3) (0.5)
A development or training plan is established to improve their work as a teacher
% 54.5 50.5 59.1 72.6 53.7 56.4
(S.E.) (1.7) (1.6) (0.3) (0.5) (0.3) (0.5)
Feedback is provided to teachers based on a thorough assessment of their teaching
% 29.1 47.0 59.8 39.6 46.7
(S.E.) (1.7) (0.3) (0.5) (0.3) (0.5)
If a teacher is consistently underperforming, he/she would be dismissed
% 29.2 24.2 31.3 23.9 28.4 26.6
(S.E.) (1.6) (1.4) (0.2) (0.4) (0.3) (0.4)
Measures to remedy any weaknesses in teaching are discussed with the teacher
% 63.2 73.9 81.8 69.9 74.1
(S.E.) (1.9) (0.2) (0.4) (0.3) (0.4)
A mentor is appointed to help teachers improve his/her teaching
% 53.6 47.8 61.9 41.6 47.3
(S.E.) (2.1) (0.3) (0.5) (0.3) (0.5)
1. The teacher population coverage was slightly different between 2008 and 2013. In order to have comparable populations for the tables comparing results from 2008 and 2013, teachers who teach exclusively to students with special needs were excluded from the 2013 data in these tables.
2. The wording and order of questions may have changed slightly between the 2008 and 2013 surveys.Source: OECD, TALIS 2013 Database
Table 5.10 provides an overview of teachers’ perceptions of the purposes and interaction of appraisal and feedback. Overall, the Australian results on the impact of teacher appraisal and feedback systems tend to be lower than the TALIS averages.
Comparison between Australia’s 2008 and 2013 data is encouraging, with the percentage of teachers indicating recognised performance rising 22 per cent over the five-year period19. Conversely, the percentage of teachers agreeing that teacher appraisal has little impact on
19 It is important to note that this is based on teachers’ personal judgments of the ‘best performing teachers’. The TALIS study did not seek to define teacher performance but asked teachers their impression of how performance (as they define it) is recognised in their school.

112
Teaching and Learning International Survey – Australian Report
teaching practices has dropped by 18 per cent. These positively changed statistics may signify an improvement in the administration of appraisal and feedback systems resulting in greater effectiveness, or in addition, these processes have gained greater status within Australian schools.
More concerning is the percentage of Australian teachers who hold the belief that teacher appraisal and feedback are largely undertaken to adhere to administrative expectations. At 61.8 per cent in 2013, this figure has virtually remained unchanged over five years. A further negative change is the drop in percentage of Australian teachers indicating that a colleague’s ongoing underperformance would lead to dismissal; dropping 5 per cent from 29.2 per cent in 2008 to 24.2 per cent in 2013.
Half of the Australian teachers report that a development or training plan is established to improve their teaching practices as an impact of appraisal systems in their schools. Again this mirrors the responses of Australian teachers five years ago.
TALIS 2013 also asked teachers if they felt the feedback they received was based on a thorough assessment of their teaching; with just under half of TALIS teachers agreeing that the feedback received was based on a careful review of their teaching practices. The percentage of Australian teachers who agreed with this statement was somewhat lower at 29.1 per cent. This perception may indicate a level of dissatisfaction with the current appraisal methods and resulting outcomes; or signify a need for the development of greater skill in those responsible for the administration of appraisal and feedback. For teachers to support initiatives or decisions resulting from appraisal, confidence that a comprehensive and accurate appraisal has been undertaken by the appropriate persons or team is essential.
Does school autonomy make a difference to teacher appraisal and feedback?
As purported by the International Report, schools with greater autonomy and decision making-authority should be able to develop their own effective systems of teacher appraisal and feedback. With greater flexibility and adaptability to immediate knowledge and need, autonomous schools are also more accountable and possess a greater sense of ownership (OECD 2014).
According to the PISA 2009 findings, in countries where schools have greater autonomy over what is taught and how students are assessed, students tend to perform better (OECD 2012).
The International Report also discusses the complexity of school autonomy, highlighting the diversity of its forms. Schools have different levels of autonomy over varying aspects (see Chapters 2 and 3 for the TALIS 2013 data in this area).
In Australia the debate over the effectiveness of autonomous schools continues. A school autonomy pilot undertaken in New South Wales found that participating principals accepted accountability and felt that greater responsibility, authority and decision making were valued and utilised. They reported improvements in literacy and numeracy for targeted students together with increased support and opportunities for staff, and enhanced quality of teaching and learning (Department of Education and Communities NSW 2011).
A Western Australian initiative, beginning with 34 schools in 2010, has gradually expanded to include one-third of Western Australian schools operating with a level of autonomy as ‘independent public schools’ (Department of Education, Western Australia 2013). Given these successes, Australia’s Federal Government has indicated a goal of ‘independence’ for 25 per cent of public schools by 2017.
Given this directive it is pertinent to provide consideration to the teacher-reported perceptions of appraisal and feedback coupled with different levels of autonomy in terms of salary control. Table 5.11 provides an overview of the percentage of lower secondary education teachers working in schools with different levels of responsibility for determining teachers’ salary increases and

113
Teaching and Learning International Survey – Australian Report
the percentage of lower secondary education teachers who agree or strongly agree with various statements about teacher appraisal and feedback systems in their school.
Table 5.11: Impact of teacher appraisal and feedback in schools by salary control: Percentage of lower secondary education teachers working in schools with different levels of responsibility for determining teachers’ salary increases and the percentage of lower secondary education teachers who agree or strongly agree with the following statements about teacher appraisal and feedback systems in their school1
Australia 2013
TALIS Average
Asian Average
OECD Average
PISA Best Average
Significant responsibility for determining teachers’ salary increases
School level2% 26.0 28.9 7.0 31.3 21.2
(S.E.) (3.4) (0.5) (0.8) (0.6) (0.9)
Shared (school and higher levels)3
% 3.5 8.2 6.6 8.2 10.9
(S.E.) (1.5) (0.4) (0.8) (0.5) (0.8)
Higher level(s) (school has no responsibility)4
% 70.5 62.4 86.4 60.4 67.8
(S.E.) (3.8) (0.5) (1.1) (0.6) (0.9)
None of the proposed options5
% 0.0 0.5 0.0 0.1 0.0
(S.E.) (0.0) (0.1) (0.0) (0.0) (0.0)
The best performing teachers in this school receive the greatest recognition
School level2% 29.6 37.6 60.5 33.0 36.4
(S.E.) (2.7) (0.7) (1.9) (1.0) (1.9)
Higher level(s) (school has no responsibility)4
% 32.1 36.8 62.3 31.2 39.4
(S.E.) (2.8) (0.6) (0.6) (0.8) (0.7)
Teacher appraisal and feedback have little impact upon the way teachers teach in the classroom
School level2% 46.4 40.0 37.3 41.2 38.6
(S.E.) (1.7) (0.8) (3.6) (0.8) (1.5)
Higher level(s) (school has no responsibility)4
% 42.9 43.3 39.3 44.7 39.6
(S.E.) (1.7) (0.5) (0.6) (0.6) (0.9)
Teacher appraisal and feedback are largely done to fulfil administrative requirements
School level2% 56.9 47.0 58.9 44.8 46.5
(S.E.) (2.3) (0.9) (2.6) (1.0) (2.1)
Higher level(s) (school has no responsibility)4
% 63.4 51.5 59.3 51.6 49.2
(S.E.) (2.1) (0.7) (0.6) (0.9) (0.8)
A development or training plan is established to improve their work as a teacher
School level2% 48.3 59.5 70.1 54.7 55.3
(S.E.) (2.0) (0.8) (1.6) (1.0) (1.8)
Higher level(s) (school has no responsibility)4
% 51.2 58.5 73.0 52.7 56.6
(S.E.) (2.5) (0.7) (0.5) (1.0) (0.8)
Feedback is provided to teachers based on a thorough assessment of their teaching
School level2% 30.6 48.4 55.6 40.5 45.2
(S.E.) (3.1) (0.7) (2.3) (0.9) (1.4)
Higher level(s) (school has no responsibility)4
% 28.6 45.8 60.3 38.1 48.1
(S.E.) (2.5) (0.7) (0.6) (0.9) (0.9)
If a teacher is consistently underperforming, he/she would be dismissed
School level2% 36.2 39.6 30.5 36.9 36.9
(S.E.) (4.4) (0.8) (2.0) (1.1) (2.1)
Higher level(s) (school has no responsibility)4
% 19.9 29.5 23.3 27.2 26.4
(S.E.) (1.7) (0.7) (0.5) (0.9) (1.0)
1. The first four rows present the proportion of teachers working in schools where the principal reported that significant responsibility for determining teachers’ salary increases was either held at the school level, shared among the school and higher level(s), at higher level(s) or that none of the proposed options correspond to the level of authority responsible for determining teachers’ salary increases. The remaining rows present the percentage of teachers who agree or strongly agree with different statements about teacher appraisal and feedback systems

114
Teaching and Learning International Survey – Australian Report
in their school. These percentages are presented for teachers working in schools where the principal reported that significant responsibility for determining teachers’ salary increases was held at the school level and for teachers working in schools where the principal reported that significant responsibility for determining teachers’ salary increases was held at higher level(s). For example, in Australia, 26% of teachers work in schools where the principal reported that significant responsibility for determining teachers’ salary increases was held at the school level and 74% of teachers work in schools where the principal reported that significant responsibility for determining teachers’ salary increases was held at a higher level(s) (where schools have no responsibility). Among Australian teachers working in schools having responsibility for determining teachers’ salary increases, 30% agree or strongly agree that the best performing teachers in their school receive the greatest recognition. In comparison, among Australian teachers working in schools that do not have responsibility for determining teachers’ salary increases, 32% agree or strongly agree that the best performing teachers in their school receive the greatest recognition.
2. School level is defined by cases where the principal reported that significant responsibility for determining teachers’ salary increases was held at the school level only, including the principal, other members of the school management team, teachers (not as a part of the school management team) or the school governing board.
3. A shared responsibility is defined by cases where the principal reports that significant responsibility for determining teachers’ salary increases was held at the school level (either the principal, other members of the school management team, teachers (not as a part of the school management team) or the school governing board) and at higher level(s) (including local, municipality/regional, state, or national/federal authority).
4. Higher level(s) is defined by cases where the principal reports that significant responsibility for determining teachers’ salary increases was held at higher level(s) only, including local, municipality/regional, state, or national/federal authority.
5. These are cases where the principal selected some of the proposed options in question 18 but did not select any response option for the specific question on who has significant responsibility for determining teachers’ salary increases. The proposed options were: ‘You, as principal’, ‘Other members of the school management team’, ‘Teachers (not as a part of the school management team)’, ‘School governing board’ or ‘Local, municipality/regional, state, or national/federal authority’.
Source: OECD, TALIS 2013 Database
As reported by Australian principals, just over a quarter of schools maintain significant responsibility for teacher salary levels, indicating a greater level of autonomy, similar to the TALIS average. But there is wide variation across the 34 countries, with principals from five OECD countries, the Czech Republic, England (UK), the Netherlands, Slovak Republic and Sweden, reporting over 80 per cent of schools with significant responsibility for determining teachers’ salary increases.
As revealed by Table 5.11, teachers’ perceptions for the resulting effects of appraisal show little difference between schools with greater responsibility for teacher salaries, and schools where the responsibility lies at a higher level. The notable exception is the teachers’ perception that termination will ensue for underperforming peers. Brazil exhibits the greatest difference between teachers in high autonomy schools (79 per cent) and teachers in low autonomy schools (27 per cent) on this aspect. In Australia, teachers of purportedly high autonomy schools (36 per cent) as opposed to teachers in schools with lower autonomy (20 per cent) rank tenth in the TALIS countries for greatest difference. The Asian comparison group demonstrates the least homogeneity next to the other comparison groups for the percentage of principals indicating control of teacher salaries as an indicator of autonomy.
115
Teaching and Learning International Survey – Australian Report
5.6 Summary and main policy implicationsAs stated, the goal of teacher appraisal and feedback is to focus on the improvement of teaching practices and thereby improve student outcomes. The TALIS data provides a lens into schools and provides insight into the intended aims of appraisal and the actual resulting outcomes and impact of teacher feedback. The TALIS International Report summative points, as follows, bear relevance to the Australian context:
• Ensure that multiple avenues are in place for teachers to receive feedback on their work
• Promote the use of comprehensive sources of data for teacher appraisals
• Ensure that formal teacher appraisal feeds into professional development
• Establish a comprehensive and coherent framework for teacher appraisal
• View teacher appraisal as a tool to improve student learning.
Australian teachers’ perceived level of importance of appraisal and feedback has risen over the past five years for some aspects, with an increased impact on teaching practices and the wider belief that excellence in teaching is recognised. With the introduction of NAPLAN, a consequence has been greater emphasis on student performance as a component of teacher feedback.
However, the opinion held by many teachers is that appraisal systems are in place to fulfil administrative requirements and identified that underperforming colleagues will remain untouched. The majority of teachers also question the appraisal process, deeming it an inaccurate assessment of their skills and practice. The interaction of appraisal and feedback is further complicated by the changing levels of school autonomy. Further investigation is needed to equip leaders in developing more effective and purposeful appraisal systems using appropriate local methods, with a goal of delivering meaningful, practical feedback to teachers at both ends of the performance spectrum.
5.7 International Summary: Highlights from the International Report• Teachers receive feedback from multiple sources. On average across countries and
economies participating in the OECD Teaching and Learning International Survey (TALIS), nearly 80 per cent of teachers report getting feedback following classroom observation, and nearly two-thirds report receiving feedback following analysis of student test scores. These are encouraging reports given that classroom observation and data-based feedback and decision making have been shown to be important levers for improving teaching.
• Teachers report that the feedback they receive in their schools focuses on several aspects of their teaching. Nearly nine in ten teachers on average report that student performance, teachers’ pedagogical competency in their subject field and classroom management are strongly emphasised in the feedback they receive. Feedback from students and parents is somewhat less frequently reported to be considered with moderate or high importance.
• Teachers feel that the appraisals they receive lead to positive changes in their work. More than six in ten teachers report that appraisals lead to positive changes in their teaching practices, and more than half report that appraisals lead to positive changes in both their use of student assessments and their classroom-management practices.
• The formal appraisal of teachers has little to do with giving financial recognition to high-performing teachers or advancing the careers of high performers over low performers.

116
Teaching and Learning International Survey – Australian Report
Annual increments in teacher pay are awarded regardless of the outcome of the formal teacher appraisal in all but about one-fifth of teachers’ schools. Moreover, 44 per cent of teachers work in schools where the school principal reports that formal teacher appraisal never results in a change in a teacher’s likelihood of career advancement.
• Formal teacher appraisal does appear to have a developmental focus in most schools where teachers work. More than eight in ten teachers work in schools where formal appraisals at least sometimes lead to teacher development or training plans or the appointment of a mentor.
• While most teachers receive various forms of feedback (many of which are connected to classroom teaching), comprehensive systems of teacher appraisal and feedback that are effectively connected to improving teaching practices and student learning in schools are much less common. Indeed, on average across TALIS countries, nearly half of teachers report that teacher appraisal and feedback systems in their school are largely undertaken simply to fulfil administrative requirements.

117
Teaching and Learning International Survey – Australian Report
6 Teacher practices and beliefs
6.1 Introduction At a conceptual level, there is a dichotomy between the active, constructivist beliefs and the more traditional beliefs about teaching and learning. The more traditional ‘direct transmission’ approach is one which sees the teachers’ role as being responsible for the ‘communication of knowledge in a clear and structured way, to explain correct solutions, to confront students with clear and resolvable problems and to ensure calmness and discipline in the classroom’ (Peterson et al. 1989, 2).
Conversely, the constructivist approach provides a more dynamic conceptualisation of teaching and learning. Rather than being seen as passive recipients into whom information is transmitted, students are viewed as active participants, or agents, in the process of acquiring knowledge. Teachers with views aligned with constructivist notions of teaching and learning are generally more inclined to see their role as involving the facilitation of active learning, rather than solely being responsible for transmitting information to, and providing correct solutions for, their students (Peterson et al. 1989).
Analysing the classroom practices of teachers and understanding the beliefs that underpin these practices is crucial to any subsequent improvement of educational processes in schools. Teacher practices and beliefs undoubtedly shape and inform the environment in which student learning takes place, and they are arguably responsible for influencing student motivation and achievement, as well as teachers’ coping strategies and overall job satisfaction. For these reasons, TALIS examined the type and prevalence of teacher practices and beliefs across and between teachers, schools and countries.
6.2 Teaching practicesIn the TALIS survey instrument, teachers were asked to report their teaching practices for a particular class that they teach in one of their main subject fields. In order to randomise the choice of class, teachers were asked to answer the questions with reference to a ‘target class’, which for the purposes of this study, was defined as the first Year 7 – 10 class that they would typically teach in their school ‘after 11am last Tuesday’20. Classroom teaching practices were measured on a four-point scale which ranged from 1 = ‘never or almost never’ to 4 = ‘in all or nearly all lessons’. The following statements were put forward for teacher response:
1. I present a summary of recently learned content.
2. Students work in small groups to come up with a joint solution to a problem or task.
20 If teachers did not teach a class from Years 7-10 on Tuesday, they were asked to choose a class taught on a day following the last Tuesday.

118
Teaching and Learning International Survey – Australian Report
3. I give different work to the students who have difficulties learning and/or to those who can advance faster.
4. I refer to a problem from everyday life or work to demonstrate why new knowledge is useful.
5. I let students practice similar tasks until I know that every student has understood the subject matter.
6. I check my students’ exercise books or homework.
7. Students work on projects that require at least one week to complete.
8. Students use ICT (information and communication technology) for projects or class work.
Figure 6.1 presents the teacher responses for using the above teaching practices in ‘all or nearly all lessons’ and ‘frequently’ in the randomly chosen class that they teach. The first relates to the practice of teachers checking students’ exercise books or homework. Internationally, more than 25 per cent of teachers report doing this in all, or nearly all, lessons. Only 12 per cent of Australian teachers, however, report doing this in every lesson, though most do report doing this ‘frequently’ (52.7 per cent).
When examining the results, two noteworthy differences between Australian teacher response and those of their international colleagues. Two other noteworthy differences between Australian teacher responses and those from teachers in other TALIS countries pertain to the active teaching practices of ‘students working on a project requiring at least one week to complete’, and ‘students using ICT for projects or class work’. For both of these practices, Australian teachers report their students engaging in them far more frequently than teachers in the majority of other TALIS countries. With regard to students working on a longer term project, more than 50 per cent of Australian teachers report doing this ‘frequently’ or ‘in all or almost all lessons’. This is considerably higher than all the other comparative groups, each of which recorded an average of less than 30 per cent for students working on longer term projects frequently or all the time.
The difference between Australia and other TALIS participants with regard to students’ ICT use is even larger. Two-thirds of Australian teachers report students using ICT for projects and class work ‘frequently’ or ‘in all or nearly all lessons’. This is more than double the PISA Best average (29.2 per cent) and Asian country average (21.7 per cent), and still considerably higher than the TALIS and OECD averages of 37.5 per cent and 39 per cent respectively.

119
Teaching and Learning International Survey – Australian Report
Figure 6.1: Teaching practices: Percentage of lower secondary education teachers who report using the following teaching practices in ‘all or nearly all lessons’ or ‘frequently’
0% 10% 20% 30% 40% 50% 60% 70% 80% 90% 100%
Present a summary of recently learned
content
Students work in small groups to come up
with a joint solution to a problem or task
Give different work to the students who have
difficulties learning and/or to those who can
advance faster
Refer to a problem from everyday life or work to demonstrate why new knowledge is useful
Let students practice similar tasks until teacher knows that every student has
understood the subject matter
Check students' exercise books or
homework
Students work on projects that require at
least one week to complete
Students use ICT for projects or class work
PISA Best Average
OECD Average
Asian Average
TALIS Average
Australia 2013
PISA Best Average
OECD Average
Asian Average
TALIS Average
Australia 2013
PISA Best Average
OECD Average
Asian Average
TALIS Average
Australia 2013
PISA Best Average
OECD Average
Asian Average
TALIS Average
Australia 2013
PISA Best Average
OECD Average
Asian Average
TALIS Average
Australia 2013
PISA Best Average
OECD Average
Asian Average
TALIS Average
Australia 2013
PISA Best Average
OECD Average
Asian Average
TALIS Average
Australia 2013
PISA Best Average
OECD Average
Asian Average
TALIS Average
Australia 2013
These data are reported by teachers and refer to a randomly chosen class they currently teach from their weekly timetable.Inclusion of 2008 Australian data for these items was not possible due to significant word and category changes between the 2008 and 2013 teacher questionnaires.Source: OECD, TALIS 2013 Database
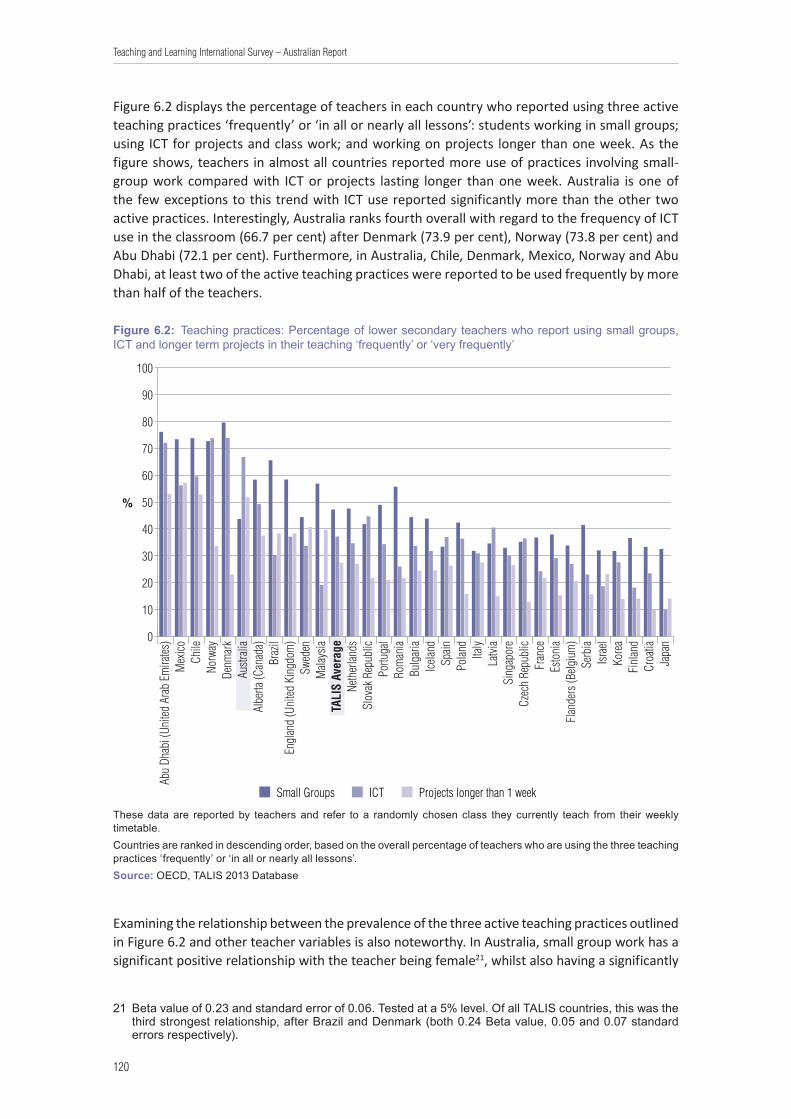
120
Teaching and Learning International Survey – Australian Report
Figure 6.2 displays the percentage of teachers in each country who reported using three active teaching practices ‘frequently’ or ‘in all or nearly all lessons’: students working in small groups; using ICT for projects and class work; and working on projects longer than one week. As the figure shows, teachers in almost all countries reported more use of practices involving small-group work compared with ICT or projects lasting longer than one week. Australia is one of the few exceptions to this trend with ICT use reported significantly more than the other two active practices. Interestingly, Australia ranks fourth overall with regard to the frequency of ICT use in the classroom (66.7 per cent) after Denmark (73.9 per cent), Norway (73.8 per cent) and Abu Dhabi (72.1 per cent). Furthermore, in Australia, Chile, Denmark, Mexico, Norway and Abu Dhabi, at least two of the active teaching practices were reported to be used frequently by more than half of the teachers.
Figure 6.2: Teaching practices: Percentage of lower secondary teachers who report using small groups, ICT and longer term projects in their teaching ‘frequently’ or ‘very frequently’
1. These data are reported by teachers and refer to a randomly chosen class they currently teach from their weekly timetable.
Countries are ranked in descending order, based on the overall percentage of teachers who are using the three teaching practices "frequently" or "in all or nearly all lessons".
Source: OECD, TALIS 2013 Database, Table 6.1.
Small Groups
%
ICT Projects longer than 1 week
0
10
20
30
40
50
60
70
80
90
100
Japa
nCr
oatia
Finl
and
Kore
aIsr
ael
Serb
iaFl
ande
rs (B
elgiu
m)
Esto
nia
Fran
ceCz
ech
Repu
blic
Sing
apor
eLa
tvia
Italy
Polan
dSp
ainIce
land
Bulg
aria
Rom
ania
Portu
gal
Slov
ak R
epub
licNe
ther
lands
TALI
S Av
erag
eM
alays
iaSw
eden
Engl
and
(Uni
ted K
ingd
om)
Braz
ilAl
berta
(Can
ada)
Austr
alia
Denm
ark
Norw
ayCh
ileM
exico
Abu
Dhab
i (Un
ited
Arab
Em
irates
)
These data are reported by teachers and refer to a randomly chosen class they currently teach from their weekly timetable.Countries are ranked in descending order, based on the overall percentage of teachers who are using the three teaching practices ‘frequently’ or ‘in all or nearly all lessons’.Source: OECD, TALIS 2013 Database
Examining the relationship between the prevalence of the three active teaching practices outlined in Figure 6.2 and other teacher variables is also noteworthy. In Australia, small group work has a significant positive relationship with the teacher being female21, whilst also having a significantly
21 Beta value of 0.23 and standard error of 0.06. Tested at a 5% level. Of all TALIS countries, this was the third strongest relationship, after Brazil and Denmark (both 0.24 Beta value, 0.05 and 0.07 standard errors respectively).

121
Teaching and Learning International Survey – Australian Report
negative relationship with being a teacher of mathematics or science22. This means that, in Australia, students are more likely to engage in small group work if their teacher is female and are less likely to engage in small group work if their teacher is a mathematics or science teacher.
With regard to students working on projects that require at least one week to complete, TALIS data show that this practice has a significant and negative relationship with being a teacher of mathematics or science23. This is true for all TALIS countries including Australia. As suggested in the International Report, further finer-grained research into this area would be useful in better understanding the barriers that seem to exist for teachers of mathematics and science with regard to widespread use of this active teaching practice.
Similarly, the use of ICT in the classroom does not appear to be taking place as frequently in mathematics and science classes than in other subject domains. Only in Denmark and Norway are mathematics or science teachers more likely than their colleagues in other subject areas to report frequent use of ICT in the classroom. In 19 other countries, including Australia, mathematics and science teachers are significantly less likely to report frequent use of ICT in their classrooms. Australia is also one of only a few countries where teachers of humanities are more likely than other teachers to report frequent use of ICT by students (Australia, Denmark, Iceland, Norway, Sweden and Alberta [Canada]). This frequent use of ICT by humanities teachers aligns with Australia’s reported frequent ICT use overall, as shown in Figure 6.1.
6.3 Assessment practicesAs outlined in the International Report, a comprehensive analysis of student assessment practices and their outcomes is beyond the scope of this cycle of TALIS. That said, a fundamental understanding of the assessment practices used by teachers worldwide can be gleaned by examining teacher responses to a number of TALIS items. In the TALIS questionnaire, teachers were asked about the frequency with which they use different types of student assessment practices in a specific target class.
The types of assessment practices adopted by teachers ‘frequently’ or ‘in all or nearly all lessons’ are presented in Table 6.1. TALIS data show that the reported use of assessment practices varies widely among countries. The overall pattern of reported assessment practices show that while both formative and summative types of assessment are widely used, larger proportions of teachers are employing forms of assessment that would likely be formative in nature (e.g., observing students and providing immediate feedback) than primarily summative (e.g., administering a standardised test). This is particularly true for Australian teachers, with 90 per cent reporting that they observe students and provide immediate feedback ‘frequently’ or ‘in all or nearly all lessons’, as compared to those who report frequently administering a standardised test (31.8 per cent).
Table 6.1 also shows that Australian teachers are also more likely to provide written feedback on student work in addition to a mark or grade (74.8 per cent) than their international counterparts, and are also more likely to develop and administer their own assessment (71.8 per cent) than in the majority of other TALIS countries.
22 Beta value of -0.33 and standard error of 0.07. Tested at a 5% level. The majority of TALIS countries exhibited a negative relationship between these variables, and Australia was placed 9th overall with respect to the strength of the relationship.
23 Beta value of -0.97 and standard error of 0.07. Tested at a 5% level. All TALIS countries displayed a significant, negative relationship between these variables.

122
Teaching and Learning International Survey – Australian Report
Analysis of Australian teacher responses suggests that many teachers are using multiple assessment approaches and opportunities, which is more likely to gather a complete picture of student learning (OECD, 2013a).
Table 6.1: Assessment practices: Percentage of lower secondary education teachers who report using the following methods of assessing student learning ‘frequently’ or ‘in all or nearly all lessons’
Develop and administer
own assessment
Administer a standardised
test
Individual students answer
questions in front of the
class
Provide written feedback on student work in addition to a mark, i.e.,
numeric score or letter grade
Let students evaluate their own progress
Observe students when
working on particular tasks and provide
immediate feedback
% (S.E.) % (S.E.) % (S.E.) % (S.E.) % (S.E.) % (S.E.)
Australia 2013 71.8 (1.7) 31.8 (1.4) 47.6 (2.1) 74.8 (1.7) 31.7 (1.5) 90.0 (0.9)
TALIS Average 67.9 (0.2) 38.2 (0.2) 48.9 (0.2) 54.5 (0.2) 38.1 (0.2) 79.7 (0.2)
Asian Average 47.6 (0.5) 54.4 (0.5) 52.7 (0.5) 45.8 (0.5) 36.5 (0.6) 65.0 (0.5)
OECD Average 66.4 (0.2) 32.2 (0.3) 46.7 (0.3) 54.2 (0.3) 35.1 (0.3) 77.4 (0.2)
PISA Best Average 61.1 (0.4) 37.7 (0.4) 34.5 (0.4) 42.8 (0.4) 29.1 (0.4) 72.8 (0.3)
These data are reported by teachers and refer to a randomly chosen class they currently teach from their weekly timetable.Source: OECD, TALIS 2013 Database
6.4 Teacher working hoursTeachers were also asked to detail the number of hours they spent on various activities in the most recent complete calendar week they worked as a teacher. Table 6.2 presents the average results reported by Australian teachers as compared to all other participating TALIS countries.
On average, Australian teachers report working for a total of 42.7 hours per week. This places Australia seventh internationally with respect to the length of a teacher’s working week after Japan, Alberta [Canada], Singapore, England, Malaysia and Portugal. With regard to the breakdown of teachers’ working hours, Australian teachers report that they spend 18.6 hours on actual teaching, 7.1 hours on lesson planning, 5.1 hours on marking, 4.3 hours on administrative work, 3.5 hours on team work and meetings with colleagues, 3.1 hours on school management activities, 2.3 hours on student supervision, counselling and delinquency guidance, 2.3 hours on sports and cultural activities outside of school hours, 1.3 hours on contact with parents of their students, and 2.2 hours on all other tasks.
Comparing the number of hours Australian teachers report spending on certain tasks with the international figures show that Australian teachers spend a comparatively large amount of their time on paperwork and general administrative work, and also a higher than average number of hours spent in meetings with colleagues within the school.
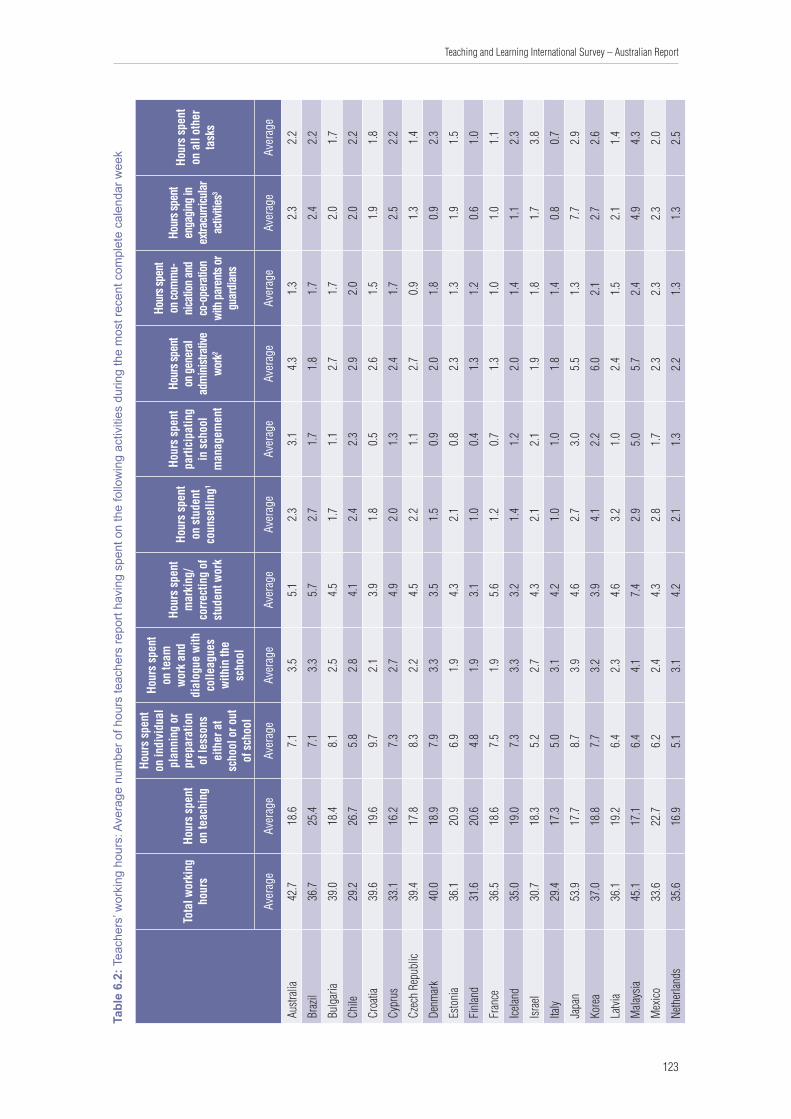
123
Teaching and Learning International Survey – Australian Report
Tabl
e 6.
2: T
each
ers’
wor
king
hou
rs: A
vera
ge n
umbe
r of h
ours
teac
hers
repo
rt ha
ving
spe
nt o
n th
e fo
llow
ing
activ
ities
dur
ing
the
mos
t rec
ent c
ompl
ete
cale
ndar
wee
k
Tota
l wor
king
ho
urs
Hour
s sp
ent
on te
achi
ng
Hour
s sp
ent
on in
divi
dual
pl
anni
ng o
r pr
epar
atio
n of
less
ons
eith
er a
t sc
hool
or o
ut
of s
choo
l
Hour
s sp
ent
on te
am
wor
k an
d di
alog
ue w
ith
colle
ague
s w
ithin
the
scho
ol
Hour
s sp
ent
mar
king
/co
rrec
ting
of
stud
ent w
ork
Hour
s sp
ent
on s
tude
nt
coun
selli
ng1
Hour
s sp
ent
parti
cipa
ting
in s
choo
l m
anag
emen
t
Hour
s spe
nt
on g
ener
al
adm
inis
trativ
e wo
rk2
Hour
s spe
nt
on co
mm
u-ni
catio
n an
d co
-ope
ratio
n wi
th p
aren
ts o
r gu
ardi
ans
Hour
s spe
nt
enga
ging
in
extra
curri
cula
r ac
tiviti
es3
Hour
s sp
ent
on a
ll ot
her
task
s
Aver
age
Aver
age
Aver
age
Aver
age
Aver
age
Aver
age
Aver
age
Aver
age
Aver
age
Aver
age
Aver
age
Austr
alia
42.7
18.6
7.1
3.5
5.1
2.3
3.1
4.3
1.3
2.3
2.2
Braz
il36
.725
.47.
13.
35.
72.
71.
71.
81.
72.
42.
2
Bulg
aria
39.0
18.4
8.1
2.5
4.5
1.7
1.1
2.7
1.7
2.0
1.7
Chile
29.2
26.7
5.8
2.8
4.1
2.4
2.3
2.9
2.0
2.0
2.2
Croa
tia39
.619
.69.
72.
13.
91.
80.
52.
61.
51.
91.
8
Cypr
us33
.116
.27.
32.
74.
92.
01.
32.
41.
72.
52.
2
Czec
h Re
publ
ic39
.417
.88.
32.
24.
52.
21.
12.
70.
91.
31.
4
Denm
ark
40.0
18.9
7.9
3.3
3.5
1.5
0.9
2.0
1.8
0.9
2.3
Esto
nia
36.1
20.9
6.9
1.9
4.3
2.1
0.8
2.3
1.3
1.9
1.5
Finl
and
31.6
20.6
4.8
1.9
3.1
1.0
0.4
1.3
1.2
0.6
1.0
Fran
ce36
.518
.67.
51.
95.
61.
20.
71.
31.
01.
01.
1
Icelan
d35
.019
.07.
33.
33.
21.
41.
22.
01.
41.
12.
3
Israe
l30
.718
.35.
22.
74.
32.
12.
11.
91.
81.
73.
8
Italy
29.4
17.3
5.0
3.1
4.2
1.0
1.0
1.8
1.4
0.8
0.7
Japa
n53
.917
.78.
73.
94.
62.
73.
05.
51.
37.
72.
9
Kore
a37
.018
.87.
73.
23.
94.
12.
26.
02.
12.
72.
6
Latvi
a36
.119
.26.
42.
34.
63.
21.
02.
41.
52.
11.
4
Mala
ysia
45.1
17.1
6.4
4.1
7.4
2.9
5.0
5.7
2.4
4.9
4.3
Mex
ico33
.622
.76.
22.
44.
32.
81.
72.
32.
32.
32.
0
Neth
erlan
ds35
.616
.95.
13.
14.
22.
11.
32.
21.
31.
32.
5
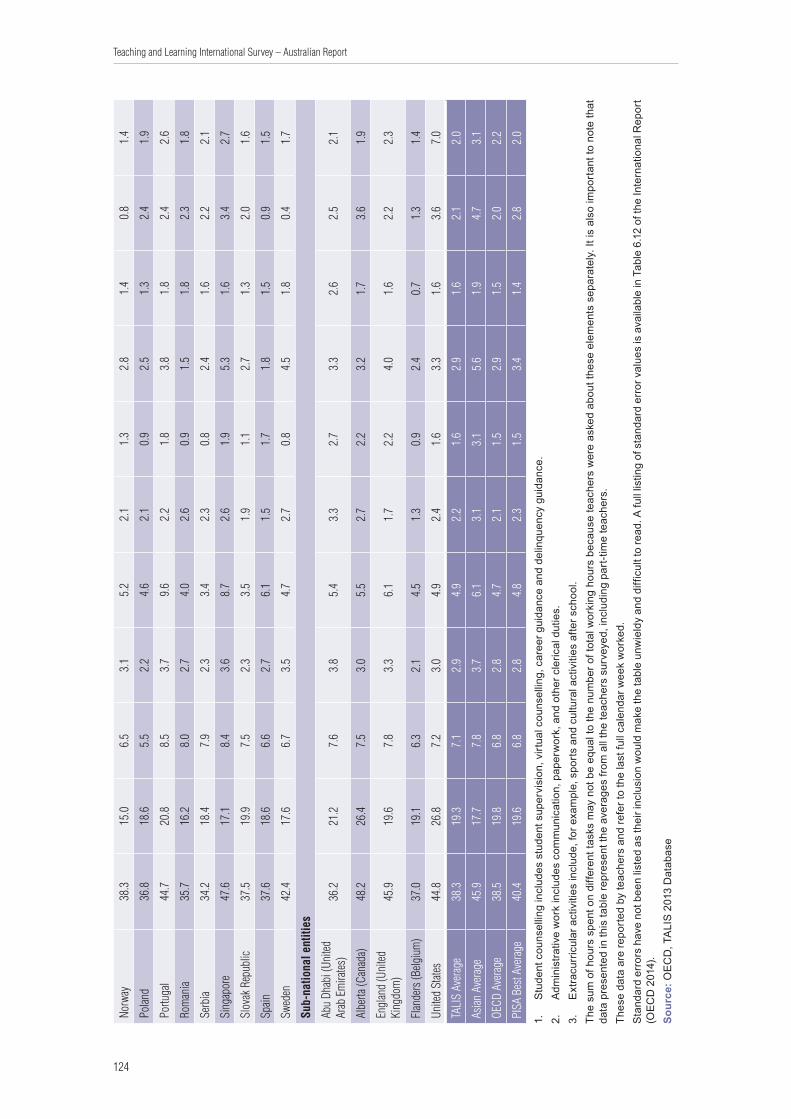
124
Teaching and Learning International Survey – Australian Report
Norw
ay38
.315
.06.
53.
15.
22.
11.
32.
81.
40.
81.
4
Polan
d36
.818
.65.
52.
24.
62.
10.
92.
51.
32.
41.
9
Portu
gal
44.7
20.8
8.5
3.7
9.6
2.2
1.8
3.8
1.8
2.4
2.6
Rom
ania
35.7
16.2
8.0
2.7
4.0
2.6
0.9
1.5
1.8
2.3
1.8
Serb
ia34
.218
.47.
92.
33.
42.
30.
82.
41.
62.
22.
1
Sing
apor
e47
.617
.18.
43.
68.
72.
61.
95.
31.
63.
42.
7
Slov
ak R
epub
lic37
.519
.97.
52.
33.
51.
91.
12.
71.
32.
01.
6
Spain
37.6
18.6
6.6
2.7
6.1
1.5
1.7
1.8
1.5
0.9
1.5
Swed
en42
.417
.66.
73.
54.
72.
70.
84.
51.
80.
41.
7
Sub-
natio
nal e
ntiti
es
Abu
Dhab
i (Un
ited
Arab
Em
irates
)36
.221
.27.
63.
85.
43.
32.
73.
32.
62.
52.
1
Albe
rta (C
anad
a)48
.226
.47.
53.
05.
52.
72.
23.
21.
73.
61.
9
Engl
and
(Uni
ted
King
dom
)45
.919
.67.
83.
36.
11.
72.
24.
01.
62.
22.
3
Flan
ders
(Belg
ium
)37
.019
.16.
32.
14.
51.
30.
92.
40.
71.
31.
4
Unite
d St
ates
44.8
26.8
7.2
3.0
4.9
2.4
1.6
3.3
1.6
3.6
7.0
TALI
S Av
erag
e38
.319
.37.
12.
94.
92.
21.
62.
91.
62.
12.
0
Asian
Ave
rage
45.9
17.7
7.8
3.7
6.1
3.1
3.1
5.6
1.9
4.7
3.1
OECD
Ave
rage
38.5
19.8
6.8
2.8
4.7
2.1
1.5
2.9
1.5
2.0
2.2
PISA
Bes
t Ave
rage
40.4
19.6
6.8
2.8
4.8
2.3
1.5
3.4
1.4
2.8
2.0
1.
Stu
dent
cou
nsel
ling
incl
udes
stu
dent
sup
ervi
sion
, virt
ual c
ouns
ellin
g, c
aree
r gui
danc
e an
d de
linqu
ency
gui
danc
e.2.
A
dmin
istra
tive
wor
k in
clud
es c
omm
unic
atio
n, p
aper
wor
k, a
nd o
ther
cle
rical
dut
ies.
3.
Ext
racu
rric
ular
act
iviti
es in
clud
e, fo
r exa
mpl
e, s
port
s an
d cu
ltura
l act
iviti
es a
fter s
choo
l.Th
e su
m o
f hou
rs s
pent
on
diffe
rent
task
s m
ay n
ot b
e eq
ual t
o th
e nu
mbe
r of t
otal
wor
king
hou
rs b
ecau
se te
ache
rs w
ere
aske
d ab
out t
hese
ele
men
ts s
epar
atel
y. It
is a
lso
impo
rtan
t to
note
that
da
ta p
rese
nted
in th
is ta
ble
repr
esen
t the
ave
rage
s fro
m a
ll th
e te
ache
rs s
urve
yed,
incl
udin
g pa
rt-ti
me
teac
hers
.Th
ese
data
are
repo
rted
by te
ache
rs a
nd re
fer t
o th
e la
st fu
ll ca
lend
ar w
eek
wor
ked.
Sta
ndar
d er
rors
hav
e no
t bee
n lis
ted
as th
eir i
nclu
sion
wou
ld m
ake
the
tabl
e un
wie
ldy
and
diffi
cult
to re
ad. A
full
listin
g of
sta
ndar
d er
ror v
alue
s is
ava
ilabl
e in
Tab
le 6
.12
of th
e In
tern
atio
nal R
epor
t (O
ECD
201
4).
Sour
ce: O
ECD
, TA
LIS
201
3 D
atab
ase

125
Teaching and Learning International Survey – Australian Report
6.5 Teacher beliefsIn the TALIS survey instrument, beliefs about instruction were measured on a four-point Likert scale, which ranged from 1 = ‘strongly disagree’ to 4 = ‘strongly agree’. TALIS data show that in almost all countries, there is strong agreement with the more constructivist facilitation of active learning, as opposed to solely transmitting knowledge to students. The four constructivist statements appearing in the TALIS teacher questionnaire are as follows:
1. My role as a teacher is to facilitate students’ own inquiry.
2. Students learn best by finding solutions to problems on their own.
3. Students should be allowed to think of solutions to practical problems themselves before the teacher shows them how they are solved.
4. Thinking and reasoning are more important than specific curriculum content.
These constructivist beliefs are presented in Table 6.3 along with the Australian results from both 2008 and 2013, and the comparative group averages.
Interestingly, Australian teachers’ preference for constructivist teaching beliefs seems to be weaker than the majority of other TALIS countries. As shown in Table 6.3, the proportion of Australian teachers in 2013 who agree or strongly agree with these four statements is lower than all comparative group averages. This difference is minimal in the first statement regarding the role of a teacher facilitating students’ own inquiry, with the difference between the Australian and TALIS averages a mere 1.4 percentage points. However, the difference increases to 12 percentage points for the second statement regarding students learning best when finding solutions to problems on their own.
This is particularly interesting when juxtaposed with Australia’s 2008 results. In 2008, Australian teacher preferences for constructivist approaches to teaching were particularly pronounced when compared with other countries. Indeed, in 2008, Australian teachers were third overall (after Iceland and Austria) in the strength of their agreement with more constructivist principles. Yet when examining the percentages of teachers who agree or strongly agree with these principles, the only meaningful drop that can be observed in Australian teacher agreement from 2008 to 2013 relates to the statement ‘students learn best by finding solutions to problems on their own’, from almost 77 to 71 per cent. Temporal fluctuations in the other categories are negligible. This would suggest that rather than Australian teachers actively moving away from constructivist beliefs, Australian teacher sentiment has remained relatively constant, and we are actually witnessing a stronger proclivity towards constructivist beliefs in other participating TALIS countries24, which sees Australia’s ranking move down the international scale.
24 It is important to note that this stronger international proclivity may be due to the inclusion of more constructivist-leaning countries in the 2013 TALIS sample, rather than an actual move by all countries towards a constructivist belief system. It is undoubtedly an area that warrants finer-grained research.
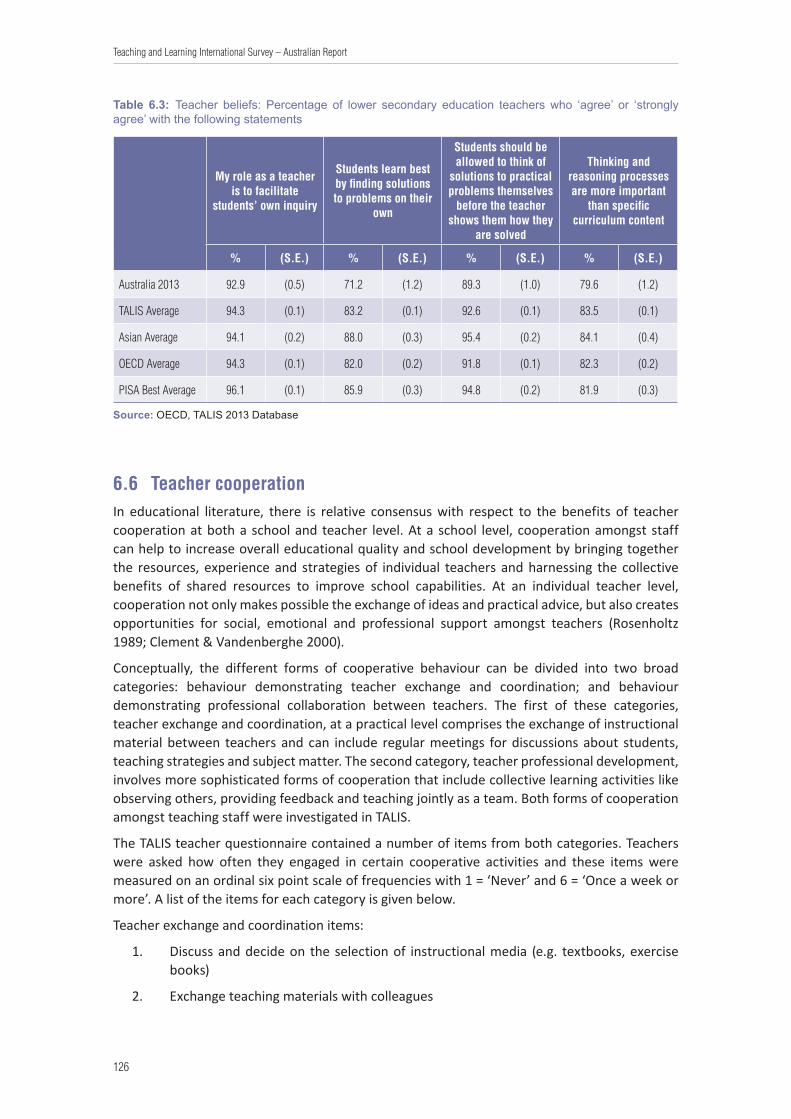
126
Teaching and Learning International Survey – Australian Report
Table 6.3: Teacher beliefs: Percentage of lower secondary education teachers who ‘agree’ or ‘strongly agree’ with the following statements
My role as a teacher is to facilitate
students’ own inquiry
Students learn best by finding solutions to problems on their
own
Students should be allowed to think of
solutions to practical problems themselves
before the teacher shows them how they
are solved
Thinking and reasoning processes are more important
than specific curriculum content
% (S.E.) % (S.E.) % (S.E.) % (S.E.)
Australia 2013 92.9 (0.5) 71.2 (1.2) 89.3 (1.0) 79.6 (1.2)
TALIS Average 94.3 (0.1) 83.2 (0.1) 92.6 (0.1) 83.5 (0.1)
Asian Average 94.1 (0.2) 88.0 (0.3) 95.4 (0.2) 84.1 (0.4)
OECD Average 94.3 (0.1) 82.0 (0.2) 91.8 (0.1) 82.3 (0.2)
PISA Best Average 96.1 (0.1) 85.9 (0.3) 94.8 (0.2) 81.9 (0.3)
Source: OECD, TALIS 2013 Database
6.6 Teacher cooperationIn educational literature, there is relative consensus with respect to the benefits of teacher cooperation at both a school and teacher level. At a school level, cooperation amongst staff can help to increase overall educational quality and school development by bringing together the resources, experience and strategies of individual teachers and harnessing the collective benefits of shared resources to improve school capabilities. At an individual teacher level, cooperation not only makes possible the exchange of ideas and practical advice, but also creates opportunities for social, emotional and professional support amongst teachers (Rosenholtz 1989; Clement & Vandenberghe 2000).
Conceptually, the different forms of cooperative behaviour can be divided into two broad categories: behaviour demonstrating teacher exchange and coordination; and behaviour demonstrating professional collaboration between teachers. The first of these categories, teacher exchange and coordination, at a practical level comprises the exchange of instructional material between teachers and can include regular meetings for discussions about students, teaching strategies and subject matter. The second category, teacher professional development, involves more sophisticated forms of cooperation that include collective learning activities like observing others, providing feedback and teaching jointly as a team. Both forms of cooperation amongst teaching staff were investigated in TALIS.
The TALIS teacher questionnaire contained a number of items from both categories. Teachers were asked how often they engaged in certain cooperative activities and these items were measured on an ordinal six point scale of frequencies with 1 = ‘Never’ and 6 = ‘Once a week or more’. A list of the items for each category is given below.
Teacher exchange and coordination items:
1. Discuss and decide on the selection of instructional media (e.g. textbooks, exercise books)
2. Exchange teaching materials with colleagues
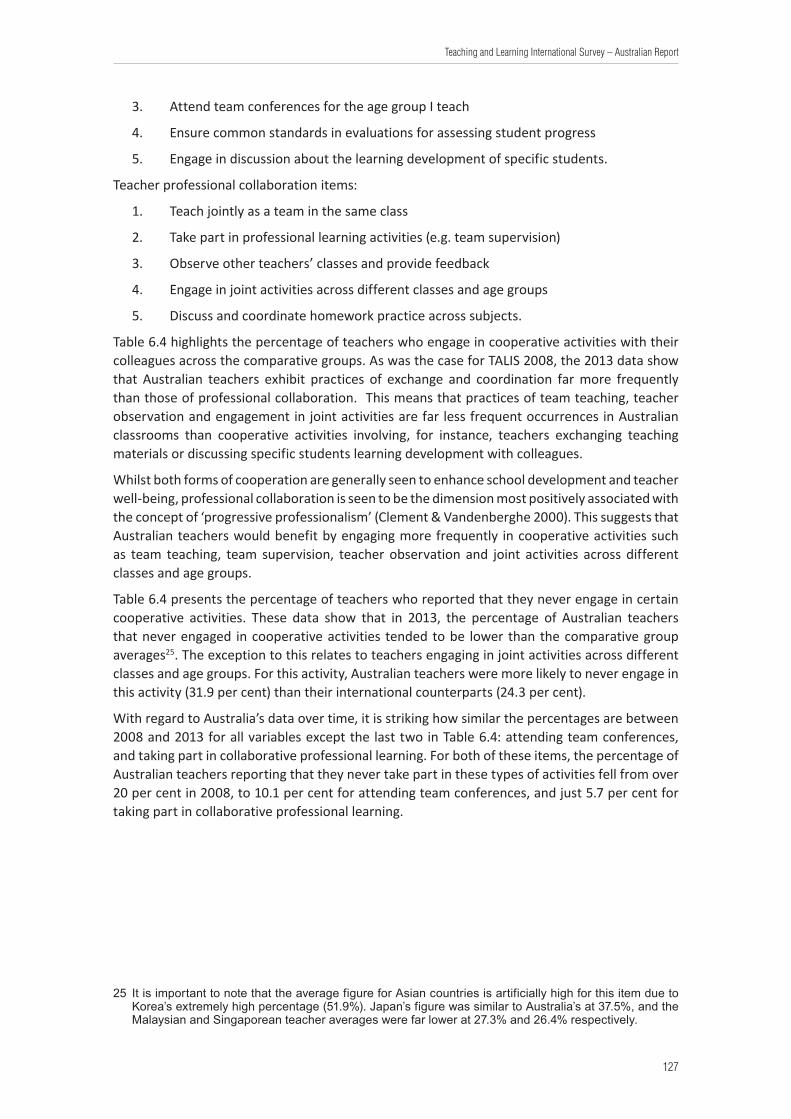
127
Teaching and Learning International Survey – Australian Report
3. Attend team conferences for the age group I teach
4. Ensure common standards in evaluations for assessing student progress
5. Engage in discussion about the learning development of specific students.
Teacher professional collaboration items:
1. Teach jointly as a team in the same class
2. Take part in professional learning activities (e.g. team supervision)
3. Observe other teachers’ classes and provide feedback
4. Engage in joint activities across different classes and age groups
5. Discuss and coordinate homework practice across subjects.
Table 6.4 highlights the percentage of teachers who engage in cooperative activities with their colleagues across the comparative groups. As was the case for TALIS 2008, the 2013 data show that Australian teachers exhibit practices of exchange and coordination far more frequently than those of professional collaboration. This means that practices of team teaching, teacher observation and engagement in joint activities are far less frequent occurrences in Australian classrooms than cooperative activities involving, for instance, teachers exchanging teaching materials or discussing specific students learning development with colleagues.
Whilst both forms of cooperation are generally seen to enhance school development and teacher well-being, professional collaboration is seen to be the dimension most positively associated with the concept of ‘progressive professionalism’ (Clement & Vandenberghe 2000). This suggests that Australian teachers would benefit by engaging more frequently in cooperative activities such as team teaching, team supervision, teacher observation and joint activities across different classes and age groups.
Table 6.4 presents the percentage of teachers who reported that they never engage in certain cooperative activities. These data show that in 2013, the percentage of Australian teachers that never engaged in cooperative activities tended to be lower than the comparative group averages25. The exception to this relates to teachers engaging in joint activities across different classes and age groups. For this activity, Australian teachers were more likely to never engage in this activity (31.9 per cent) than their international counterparts (24.3 per cent).
With regard to Australia’s data over time, it is striking how similar the percentages are between 2008 and 2013 for all variables except the last two in Table 6.4: attending team conferences, and taking part in collaborative professional learning. For both of these items, the percentage of Australian teachers reporting that they never take part in these types of activities fell from over 20 per cent in 2008, to 10.1 per cent for attending team conferences, and just 5.7 per cent for taking part in collaborative professional learning.
25 It is important to note that the average figure for Asian countries is artificially high for this item due to Korea’s extremely high percentage (51.9%). Japan’s figure was similar to Australia’s at 37.5%, and the Malaysian and Singaporean teacher averages were far lower at 27.3% and 26.4% respectively.
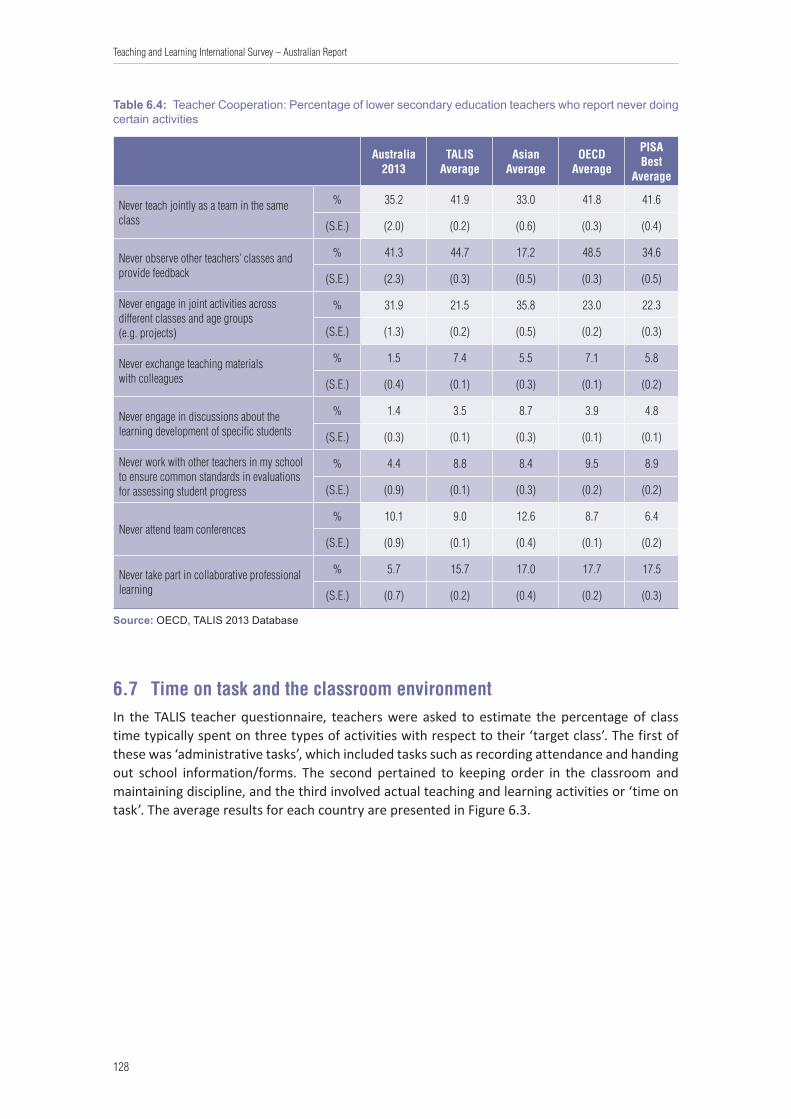
128
Teaching and Learning International Survey – Australian Report
Table 6.4: Teacher Cooperation: Percentage of lower secondary education teachers who report never doing certain activities
Australia 2013
TALIS Average
Asian Average
OECD Average
PISA Best
Average
Never teach jointly as a team in the same class
% 35.2 41.9 33.0 41.8 41.6
(S.E.) (2.0) (0.2) (0.6) (0.3) (0.4)
Never observe other teachers’ classes and provide feedback
% 41.3 44.7 17.2 48.5 34.6
(S.E.) (2.3) (0.3) (0.5) (0.3) (0.5)
Never engage in joint activities across different classes and age groups (e.g. projects)
% 31.9 21.5 35.8 23.0 22.3
(S.E.) (1.3) (0.2) (0.5) (0.2) (0.3)
Never exchange teaching materials with colleagues
% 1.5 7.4 5.5 7.1 5.8
(S.E.) (0.4) (0.1) (0.3) (0.1) (0.2)
Never engage in discussions about the learning development of specific students
% 1.4 3.5 8.7 3.9 4.8
(S.E.) (0.3) (0.1) (0.3) (0.1) (0.1)
Never work with other teachers in my school to ensure common standards in evaluations for assessing student progress
% 4.4 8.8 8.4 9.5 8.9
(S.E.) (0.9) (0.1) (0.3) (0.2) (0.2)
Never attend team conferences% 10.1 9.0 12.6 8.7 6.4
(S.E.) (0.9) (0.1) (0.4) (0.1) (0.2)
Never take part in collaborative professional learning
% 5.7 15.7 17.0 17.7 17.5
(S.E.) (0.7) (0.2) (0.4) (0.2) (0.3)
Source: OECD, TALIS 2013 Database
6.7 Time on task and the classroom environmentIn the TALIS teacher questionnaire, teachers were asked to estimate the percentage of class time typically spent on three types of activities with respect to their ‘target class’. The first of these was ‘administrative tasks’, which included tasks such as recording attendance and handing out school information/forms. The second pertained to keeping order in the classroom and maintaining discipline, and the third involved actual teaching and learning activities or ‘time on task’. The average results for each country are presented in Figure 6.3.
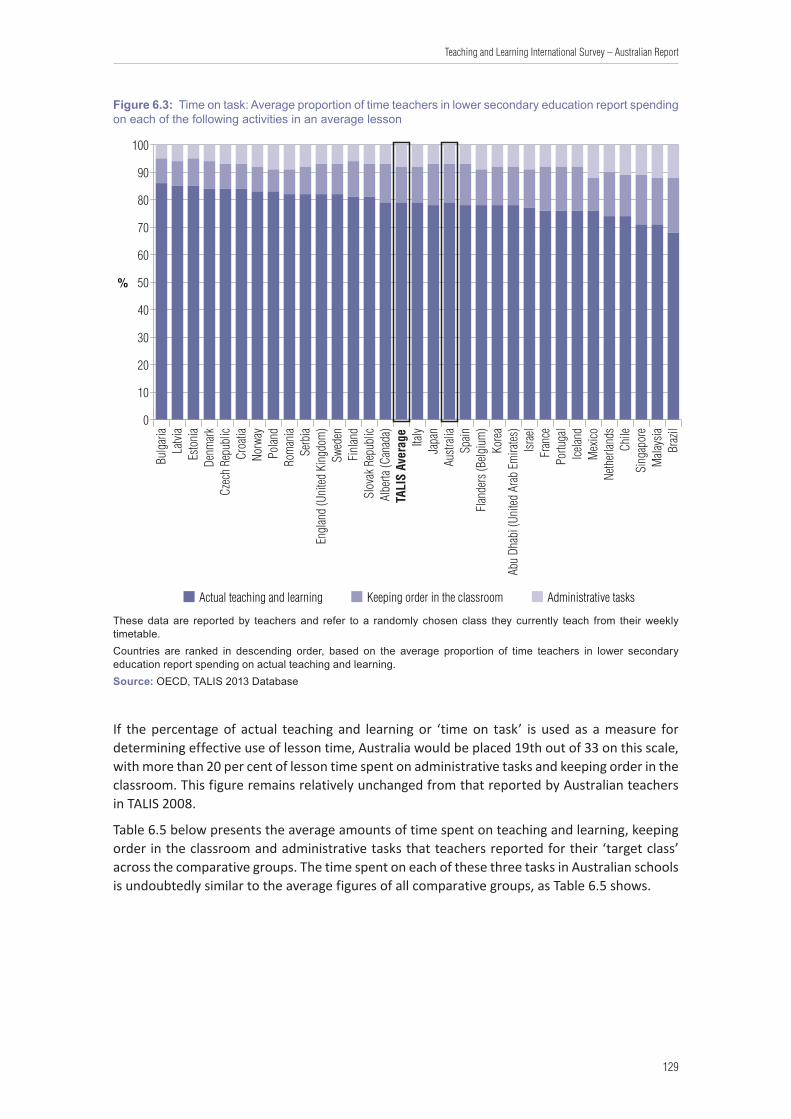
129
Teaching and Learning International Survey – Australian Report
Figure 6.3: Time on task: Average proportion of time teachers in lower secondary education report spending on each of the following activities in an average lesson
Administrative tasks
%
Keeping order in the classroomActual teaching and learning
0
10
20
30
40
50
60
70
80
90
100
Braz
ilM
alays
iaSi
ngap
ore
Chile
Neth
erlan
dsM
exico
Icelan
dPo
rtuga
lFr
ance
Israe
lAb
u Dh
abi (
Unite
d Ar
ab E
mira
tes)
Kore
aFl
ande
rs (B
elgiu
m)
Spain
Austr
alia
Japa
nIta
lyTA
LIS
Aver
age
Albe
rta (C
anad
a)Sl
ovak
Rep
ublic
Finl
and
Swed
enEn
glan
d (U
nited
Kin
gdom
)Se
rbia
Rom
ania
Polan
dNo
rway
Croa
tiaCz
ech
Repu
blic
Denm
ark
Esto
nia
Latvi
aBu
lgar
ia
These data are reported by teachers and refer to a randomly chosen class they currently teach from their weekly timetable.Countries are ranked in descending order, based on the average proportion of time teachers in lower secondary education report spending on actual teaching and learning.Source: OECD, TALIS 2013 Database
If the percentage of actual teaching and learning or ‘time on task’ is used as a measure for determining effective use of lesson time, Australia would be placed 19th out of 33 on this scale, with more than 20 per cent of lesson time spent on administrative tasks and keeping order in the classroom. This figure remains relatively unchanged from that reported by Australian teachers in TALIS 2008.
Table 6.5 below presents the average amounts of time spent on teaching and learning, keeping order in the classroom and administrative tasks that teachers reported for their ‘target class’ across the comparative groups. The time spent on each of these three tasks in Australian schools is undoubtedly similar to the average figures of all comparative groups, as Table 6.5 shows.
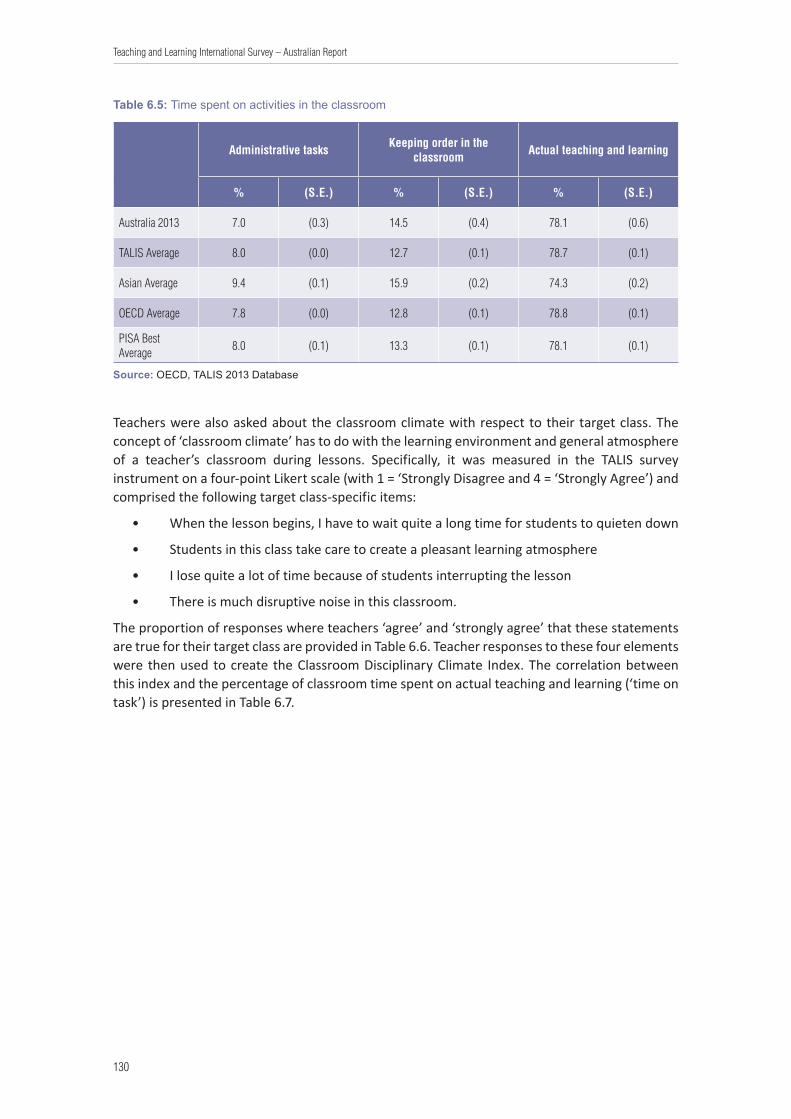
130
Teaching and Learning International Survey – Australian Report
Table 6.5: Time spent on activities in the classroom
Administrative tasks Keeping order in the
classroom Actual teaching and learning
% (S.E.) % (S.E.) % (S.E.)
Australia 2013 7.0 (0.3) 14.5 (0.4) 78.1 (0.6)
TALIS Average 8.0 (0.0) 12.7 (0.1) 78.7 (0.1)
Asian Average 9.4 (0.1) 15.9 (0.2) 74.3 (0.2)
OECD Average 7.8 (0.0) 12.8 (0.1) 78.8 (0.1)
PISA Best Average 8.0 (0.1) 13.3 (0.1) 78.1 (0.1)
Source: OECD, TALIS 2013 Database
Teachers were also asked about the classroom climate with respect to their target class. The concept of ‘classroom climate’ has to do with the learning environment and general atmosphere of a teacher’s classroom during lessons. Specifically, it was measured in the TALIS survey instrument on a four-point Likert scale (with 1 = ‘Strongly Disagree and 4 = ‘Strongly Agree’) and comprised the following target class-specific items:
• When the lesson begins, I have to wait quite a long time for students to quieten down
• Students in this class take care to create a pleasant learning atmosphere
• I lose quite a lot of time because of students interrupting the lesson
• There is much disruptive noise in this classroom.
The proportion of responses where teachers ‘agree’ and ‘strongly agree’ that these statements are true for their target class are provided in Table 6.6. Teacher responses to these four elements were then used to create the Classroom Disciplinary Climate Index. The correlation between this index and the percentage of classroom time spent on actual teaching and learning (‘time on task’) is presented in Table 6.7.

131
Teaching and Learning International Survey – Australian Report
Tabl
e 6.
6: C
lass
room
dis
cipl
ine:
Per
cent
age
of lo
wer
sec
onda
ry e
duca
tion
teac
hers
who
‘agr
ee’ o
r ‘st
rong
ly a
gree
’ with
the
follo
win
g st
atem
ents
abo
ut th
eir t
arge
t cla
ss
Whe
n th
e le
sson
beg
ins,
I ha
ve to
wai
t qu
ite a
long
tim
e fo
r stu
dent
s to
qui
et
dow
n
Stud
ents
in th
is c
lass
take
car
e to
cr
eate
a p
leas
ant a
tmos
pher
eI l
ose
quite
a lo
t of t
ime
beca
use
of
stud
ents
inte
rrup
ting
the
less
onTh
ere
is m
uch
disr
uptiv
e no
ise
in th
is
clas
sroo
m
%(S
.E.)
%(S
.E.)
%(S
.E.)
%(S
.E.)
Austr
alia
26.8
(1.6
)66
.3(1
.8)
31.5
(1.8
)25
.3(1
.5)
Braz
il53
.3(1
.0)
52.6
(1.0
)50
.0(1
.1)
54.5
(1.0
)
Bulg
aria
17.3
(1.2
)74
.7(1
.3)
26.3
(1.5
)18
.4(1
.2)
Chile
49.0
(2.1
)67
.8(1
.9)
42.2
(2.1
)43
.2(1
.9)
Croa
tia14
.3(0
.8)
74.9
(1.0
)18
.6(0
.9)
18.1
(0.9
)
Cypr
us23
.1(1
.2)
68.3
(1.2
)31
.8(1
.3)
24.0
(1.3
)
Czec
h Re
publ
ic20
.2(1
.0)
71.4
(1.2
)21
.3(1
.0)
21.9
(1.0
)
Denm
ark
21.3
(1.4
)83
.4(1
.1)
23.0
(1.3
)19
.3(1
.2)
Esto
nia
23.9
(1.2
)62
.9(1
.3)
21.5
(1.2
)22
.4(1
.2)
Finl
and
30.7
(1.2
)58
.5(1
.2)
31.6
(1.2
)32
.1(1
.1)
Fran
ce37
.6(1
.2)
66.8
(1.2
)39
.7(1
.3)
29.9
(1.2
)
Icelan
d46
.9(1
.7)
65.5
(1.7
)42
.2(1
.7)
27.8
(1.6
)
Israe
l35
.7(1
.2)
75.2
(1.2
)29
.7(1
.1)
22.7
(1.2
)
Italy
21.8
(1.0
)72
.0(0
.9)
24.5
(0.9
)13
.2(0
.8)
Japa
n14
.7(1
.1)
80.6
(1.1
)9.
3(0
.8)
13.3
(0.9
)
Kore
a30
.5(1
.3)
76.1
(1.0
)34
.9(1
.3)
25.2
(1.1
)
Latvi
a26
.8(1
.4)
65.2
(1.8
)24
.9(1
.5)
28.6
(1.5
)
Mala
ysia
25.0
(1.4
)72
.4(1
.6)
30.4
(1.4
)22
.8(1
.5)
Mex
ico19
.7(1
.0)
78.1
(1.0
)21
.1(1
.1)
20.8
(1.0
)
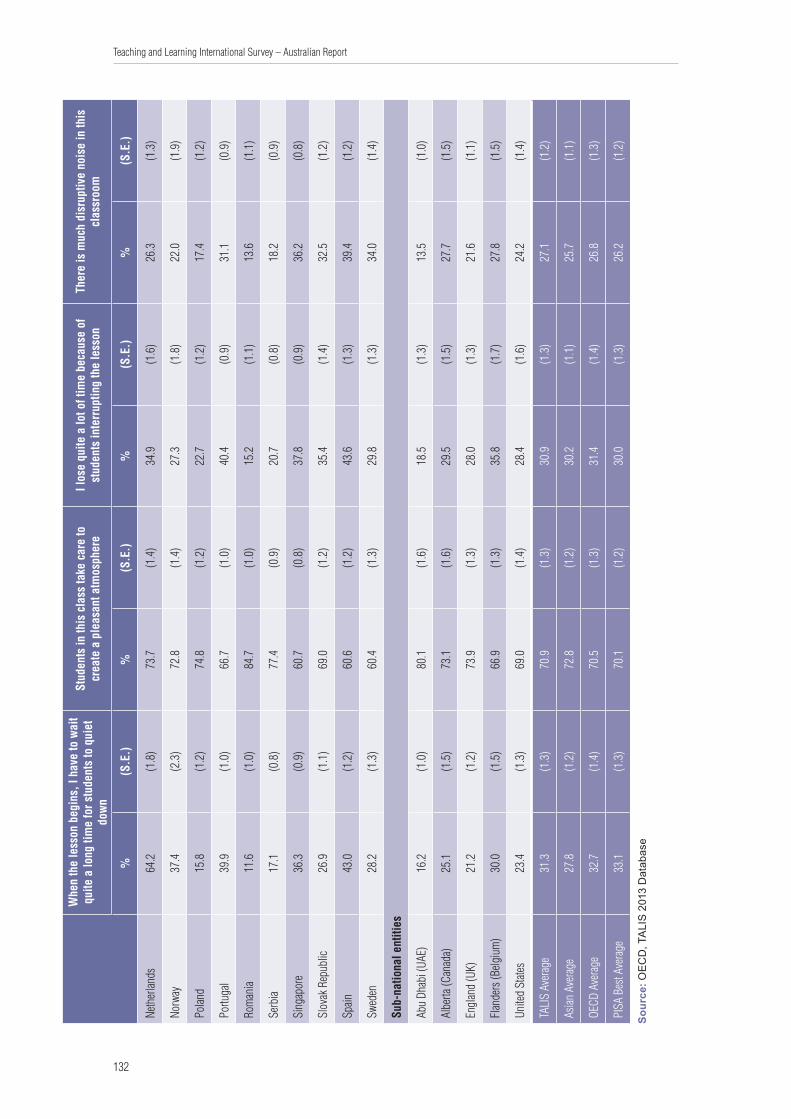
132
Teaching and Learning International Survey – Australian Report
Whe
n th
e le
sson
beg
ins,
I ha
ve to
wai
t qu
ite a
long
tim
e fo
r stu
dent
s to
qui
et
dow
n
Stud
ents
in th
is c
lass
take
car
e to
cr
eate
a p
leas
ant a
tmos
pher
eI l
ose
quite
a lo
t of t
ime
beca
use
of
stud
ents
inte
rrup
ting
the
less
onTh
ere
is m
uch
disr
uptiv
e no
ise
in th
is
clas
sroo
m
%(S
.E.)
%(S
.E.)
%(S
.E.)
%(S
.E.)
Neth
erlan
ds64
.2(1
.8)
73.7
(1.4
)34
.9(1
.6)
26.3
(1.3
)
Norw
ay37
.4(2
.3)
72.8
(1.4
)27
.3(1
.8)
22.0
(1.9
)
Polan
d15
.8(1
.2)
74.8
(1.2
)22
.7(1
.2)
17.4
(1.2
)
Portu
gal
39.9
(1.0
)66
.7(1
.0)
40.4
(0.9
)31
.1(0
.9)
Rom
ania
11.6
(1.0
)84
.7(1
.0)
15.2
(1.1
)13
.6(1
.1)
Serb
ia17
.1(0
.8)
77.4
(0.9
)20
.7(0
.8)
18.2
(0.9
)
Sing
apor
e36
.3(0
.9)
60.7
(0.8
)37
.8(0
.9)
36.2
(0.8
)
Slov
ak R
epub
lic26
.9(1
.1)
69.0
(1.2
)35
.4(1
.4)
32.5
(1.2
)
Spain
43.0
(1.2
)60
.6(1
.2)
43.6
(1.3
)39
.4(1
.2)
Swed
en28
.2(1
.3)
60.4
(1.3
)29
.8(1
.3)
34.0
(1.4
)
Sub-
natio
nal e
ntiti
es
Abu
Dhab
i (UA
E)16
.2(1
.0)
80.1
(1.6
)18
.5(1
.3)
13.5
(1.0
)
Albe
rta (C
anad
a)25
.1(1
.5)
73.1
(1.6
)29
.5(1
.5)
27.7
(1.5
)
Engl
and
(UK)
21.2
(1.2
)73
.9(1
.3)
28.0
(1.3
)21
.6(1
.1)
Flan
ders
(Belg
ium
)30
.0(1
.5)
66.9
(1.3
)35
.8(1
.7)
27.8
(1.5
)
Unite
d St
ates
23.4
(1.3
)69
.0(1
.4)
28.4
(1.6
)24
.2(1
.4)
TALI
S Av
erag
e31
.3(1
.3)
70.9
(1.3
)30
.9(1
.3)
27.1
(1.2
)
Asian
Ave
rage
27.8
(1.2
)72
.8(1
.2)
30.2
(1.1
)25
.7(1
.1)
OECD
Ave
rage
32.7
(1.4
)70
.5(1
.3)
31.4
(1.4
)26
.8(1
.3)
PISA
Bes
t Ave
rage
33.1
(1.3
)70
.1(1
.2)
30.0
(1.3
)26
.2(1
.2)
Sour
ce: O
ECD
, TA
LIS
201
3 D
atab
ase

133
Teaching and Learning International Survey – Australian Report
Table 6.7: Correlation between time on task (actual teaching and learning) and the classroom disciplinary climate
Classroom disciplinary climate1
Correlated with: Percentage of class time dedicated to time on task
Correlation coefficient (rxy) (S.E.)
Australia 0.65 0.02
Brazil 0.45 0.01
Bulgaria 0.52 0.03
Chile 0.24 0.05
Croatia 0.50 0.02
Czech Republic 0.45 0.02
Denmark 0.57 0.02
Estonia 0.47 0.02
Finland 0.63 0.02
France 0.64 0.01
Iceland 0.61 0.02
Israel 0.52 0.02
Italy 0.49 0.02
Japan 0.21 0.02
Korea 0.29 0.02
Latvia 0.50 0.02
Malaysia 0.40 0.03
Mexico 0.26 0.03
Netherlands 0.54 0.03
Norway 0.49 0.02
Poland 0.44 0.02
Portugal 0.59 0.02
Romania 0.31 0.03
Serbia 0.46 0.02
Singapore 0.52 0.02
Slovak Republic 0.52 0.02
Spain 0.61 0.01
Sweden 0.62 0.01
Sub-national entities
Abu Dhabi (United Arab Emirates) 0.32 0.04
Alberta (Canada) 0.52 0.03
England (United Kingdom) 0.59 0.02
Flanders (Belgium) 0.58 0.01
1. Classroom disciplinary climate is an index created from the four class climate elements outlined in Table 6.6. All correlations are significant at the 5% level. Standardised coefficients are reported in the table.Time on task is defined as the percentage of classroom time spent on teaching and learning.Source: OECD, TALIS 2013 Database
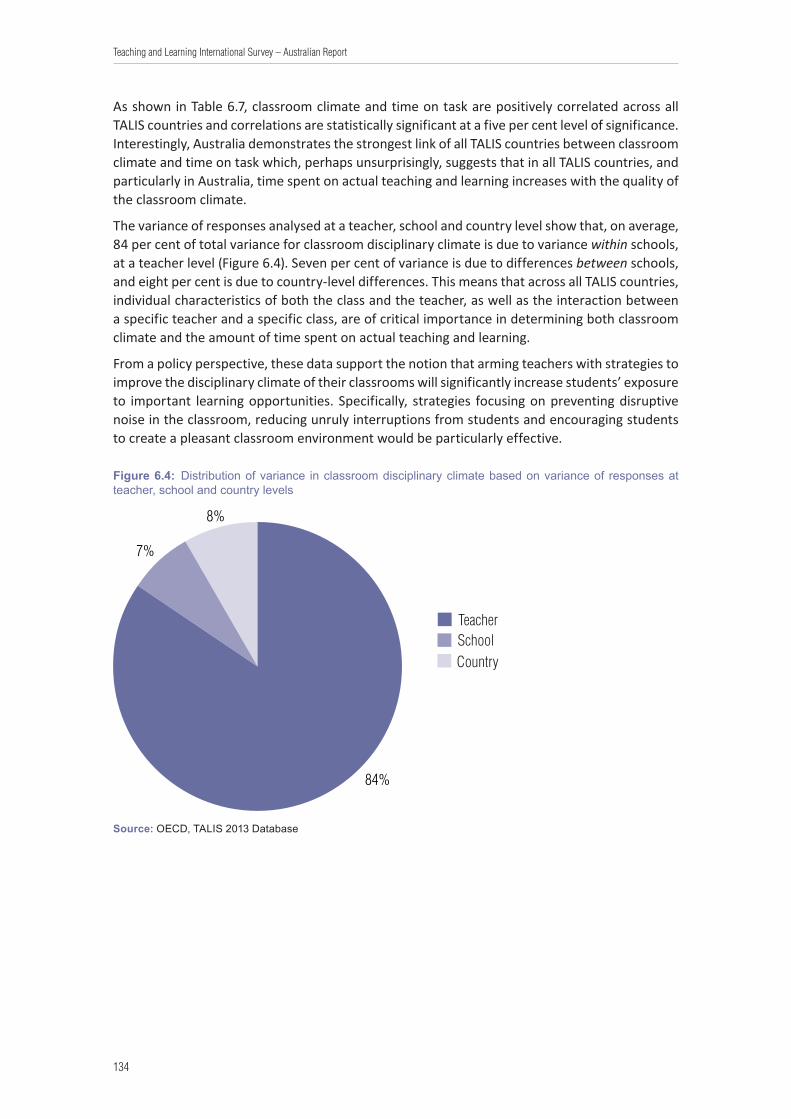
134
Teaching and Learning International Survey – Australian Report
As shown in Table 6.7, classroom climate and time on task are positively correlated across all TALIS countries and correlations are statistically significant at a five per cent level of significance. Interestingly, Australia demonstrates the strongest link of all TALIS countries between classroom climate and time on task which, perhaps unsurprisingly, suggests that in all TALIS countries, and particularly in Australia, time spent on actual teaching and learning increases with the quality of the classroom climate.
The variance of responses analysed at a teacher, school and country level show that, on average, 84 per cent of total variance for classroom disciplinary climate is due to variance within schools, at a teacher level (Figure 6.4). Seven per cent of variance is due to differences between schools, and eight per cent is due to country-level differences. This means that across all TALIS countries, individual characteristics of both the class and the teacher, as well as the interaction between a specific teacher and a specific class, are of critical importance in determining both classroom climate and the amount of time spent on actual teaching and learning.
From a policy perspective, these data support the notion that arming teachers with strategies to improve the disciplinary climate of their classrooms will significantly increase students’ exposure to important learning opportunities. Specifically, strategies focusing on preventing disruptive noise in the classroom, reducing unruly interruptions from students and encouraging students to create a pleasant classroom environment would be particularly effective.
Figure 6.4: Distribution of variance in classroom disciplinary climate based on variance of responses at teacher, school and country levels
8%
7%
84%
CountrySchoolTeacher
Source: OECD, TALIS 2013 Database
135
Teaching and Learning International Survey – Australian Report
6.8 International Summary: Highlights from the International Report• Teachers who report participation in professional development activities involving
individual and collaborative research, observation visits to other schools or a network of teachers are more likely to report using active teaching practices that involve small groups, projects requiring more than a week for students to complete and information and computer technology (ICT).
• Roughly two-thirds of teachers report a positive classroom climate, which corresponds to a greater likelihood of using active teaching practices involving small groups, projects requiring more than a week and ICT. Thus, the majority of teachers perceive that they experience a good learning environment in which to engage students in learning.
• Regarding student assessment practices, teachers generally report frequent observation of student work accompanied by immediate feedback, as well as development and administration of their own assessments. However, wide variations across countries were reported on these and other assessment practices.
• Teachers’ beliefs about teaching and learning are mostly a function of differences in the teachers themselves. School environment variables are not a major factor in explaining teachers’ beliefs about teaching and learning.
• Overall, teachers spend about 80 per cent of their time on actual teaching and learning. However, approximately one in four teachers in more than half of the participating countries report losing at least 30 per cent of their time to classroom disruptions and administrative tasks. These findings indicate that teachers in several countries could benefit from help with respect to managing classroom disruptions.
136
Teaching and Learning International Survey – Australian Report
7 Teacher self-efficacy and job satisfaction
7.1 Introduction Teacher self-efficacy and teacher job satisfaction were two concepts that were also examined in TALIS.
The notion of self-efficacy can be understood as a ‘judgement of one’s capability to accomplish a given level of performance’ (Bandura 1986, 391) and is a one which is generally seen to increase with a teacher’s ability to cope with student interactions, workload and stress (Bandura 1997; Ross 1998). There is also a considerable body of research to show that teacher self-efficacy is significant in influencing student outcomes, as well as increasing teachers’ job satisfaction (Caprara et al. 2006, Klassen and Chiu 2010).
The concept of job satisfaction is one which refers to a sense of fulfilment and gratification from working in an occupation (Locke 1969). Specifically, teacher job satisfaction relates to both satisfaction with the teaching profession as well as satisfaction with the current working environment. At a general level, research shows that teachers are often satisfied with the elements of their jobs that specifically pertain to actual teaching work, but that they tend to be less enamoured with issues relating to working conditions, interpersonal relations and salary, for instance (Butt et al. 2005, Crossman and Harris 2006, Dinham and Scott 1998). In turn, job satisfaction is also seen to have an influence on work-related behaviours such as absenteeism and performance (Dormann and Zapf 2001).
Exploring the relationship between teachers’ self-efficacy, job satisfaction and other teacher- and school-level variables may well have implications for teachers’ retention and commitment to the school, job performance and, by extension, the academic achievement of students (Klassen et al., 2009; Price and Collett, 2012; Somech and Bogler, 2002; Brief and Weiss, 2002).
For this reason, the TALIS questionnaire contained a series of items related to both teacher self-efficacy and job satisfaction. With regard to teacher self-efficacy, three indices were created: efficacy in classroom management, efficacy in instruction and efficacy in student engagement. The following items were included in each of the three indices:
1. Efficacy in classroom management
• Control disruptive behaviour in the classroom• Make my expectations about student behaviour clear• Get students to follow classroom rules• Calm a student who is disruptive or noisy
2. Efficacy in instruction
• Craft good questions for my students• Use a variety of assessment strategies• Provide an alternative explanation, for example, when students are confused

137
Teaching and Learning International Survey – Australian Report
• Implement alternative instructional strategies in my classroom3. Efficacy in student engagement
• Get students to believe they can do well in school work• Help my students value learning• Motivate students who show low interest in school work• Help students think critically
In the TALIS teacher questionnaire, teachers were asked to respond to each of the above items by nominating a response category on a four-point Likert scale26.
With respect to teacher job satisfaction, two indices were created. These were ‘satisfaction with current work environment’ and ‘satisfaction with profession’. These indices comprised the following items:
1. Satisfaction with current work environment
• I would like to change to another school if that were possible• I enjoy working at this school• I would recommend my school as a good place to work• All in all, I am satisfied with my job
2. Satisfaction with profession
• The advantages of being a teacher clearly outweigh the disadvantages• If I could decide again, I would still choose to work as a teacher• I regret that I decided to become a teacher• I wonder whether it would have been better to choose another profession
Again, teachers were asked to respond to each of the job satisfaction items by nominating a response category from a four-point Likert scale27.
This chapter examines the responses of lower secondary teachers to these self-efficacy and job satisfaction items. The first section will examine at how Australian teachers of Years 7 to 10 responded to these items as compared to their international counterparts. The following three sections will analyse the relationships between these responses and the variables that have been presented in previous chapters, namely: teacher background characteristics, school leadership variables, teacher professional development, systems of feedback and appraisal, and teacher practices and beliefs. A brief summary of highlights from the International Report will be provided at the end of the chapter.
7.2 Teacher self-efficacy and job satisfaction in TALIS countries
Self-efficacy
Table 7.1 presents lower secondary education teachers’ responses to each of the self-efficacy items. The figures denote the percentage of teachers who feel they can achieve certain goals ‘quite a bit’ or ‘a lot’ and compare the Australian results to those of each of the comparison groups. What is perhaps most evident from these results is that, on average, the majority of
26 Response categories were ‘Not at all’, ‘To some extent’, ‘Quite a bit’ and ‘A lot’. 27 Response categories were ‘Strongly disagree’, ‘Disagree’, ‘Agree’ and ‘Strongly Agree’.

138
Teaching and Learning International Survey – Australian Report
teachers from all of the countries represented here, report feeling that they can achieve each of these goals regularly. Overall, this suggests a relatively high level of self-efficacy amongst lower secondary education teachers28.
Looking specifically at Australian teachers, we notice that for many items, responses are roughly on par with the comparison group averages. One exception to this relates to the implementation of alternative instructional strategies in the classroom, which considerably more Australian teachers report doing regularly (82.7 per cent) than any of the comparison groups. Conversely, only 65.8 per cent of Australian teachers report regularly being able to motivate students who show low interest in school work, which is lower than the TALIS and OECD averages (70 and 67 per cent respectively), yet is still higher than the Asian29 and PISA Best averages (62.3 and 61.1 per cent respectively).
Furthermore, it seems Australian teachers demonstrate a particularly widespread ability to make their expectations about student behaviour clear (93.4 per cent) and to provide an alternative explanation for an example when students are confused. Overall, Australian teachers demonstrate a very high level of self-efficacy in relation to both classroom management and instruction.
28 Upon examination of the individual country results, as presented in Chapter 7 of the International Report, it is evident that the exception to this assertion relates to teachers in Japan. Japanese teachers show lower levels of confidence in their ability across all domains, as compared to the TALIS average, ranging from a low of just 16% (help students think critically), to a high of only 54% (provide alternative explanation for an example when students are confused).
29 It is worth noting that the Asian Average figure is affected by the very low figures reported by Japanese teachers. The inclusion of the Japanese data has brought down the Asian Average considerably. Further details with regard to the Japanese figures can be gleaned from the International Report.

139
Teaching and Learning International Survey – Australian Report
Table 7.1: Teachers’ self-efficacy: Percentage of lower secondary education teachers who feel they can do the following ‘quite a bit’ or ‘a lot’
Item Australia 2013
TALIS Average
Asian Average
OECD Average
PISA Best Average
Get students to believe they can do well in school work
% 86.9 85.8 69.0 83.9 77.3
(S.E.) (1.1) (0.1) (0.4) (0.2) (0.3)
Help my students value learning
% 81.3 80.7 71.0 78.3 72.0
(S.E.) (1.4) (0.2) (0.4) (0.2) (0.3)
Craft good questions for my students
% 86.0 87.4 74.3 85.4 79.2
(S.E.) (0.8) (0.1) (0.4) (0.2) (0.3)
Control disruptive behaviour in the classroom
% 86.7 87.0 76.2 86.0 81.4
(S.E.) (0.7) (0.1) (0.4) (0.2) (0.3)
Motivate students who show low interest in school work
% 65.8 70.0 62.3 67.0 61.1
(S.E.) (1.3) (0.2) (0.4) (0.2) (0.4)
Make my expectations about student behaviour clear
% 93.4 91.3 76.2 89.9 86.1
(S.E.) (0.8) (0.1) (0.4) (0.1) (0.2)
Help students think critically% 78.4 80.3 61.5 77.4 69.6
(S.E.) (1.3) (0.2) (0.4) (0.2) (0.3)
Get students to follow classroom rules
% 89.4 89.4 77.7 88.0 83.6
(S.E.) (0.9) (0.1) (0.4) (0.2) (0.3)
Calm a student who is disruptive or noisy
% 83.6 84.8 73.8 83.4 78.2
(S.E.) (1.1) (0.1) (0.4) (0.2) (0.3)
Use a variety of assessment strategies
% 86.3 81.9 63.4 79.3 69.1
(S.E.) (1.1) (0.2) (0.4) (0.2) (0.3)
Provide an alternative explanation for an example when students are confused
% 94.0 92.0 80.0 90.5 83.5
(S.E.) (0.7) (0.1) (0.4) (0.1) (0.2)
Implement alternative instructional strategies in my classroom
% 82.7 77.4 67.1 75.1 65.8
(S.E.) (1.0) (0.2) (0.4) (0.2) (0.3)
Source: OECD, TALIS 2013 Database
140
Teaching and Learning International Survey – Australian Report
Job satisfaction
Table 7.2 shows the extent to which teachers in Australia and the comparison group countries agree or strongly agree with various statements relating to job satisfaction. Overall, 90 per cent of Australian teachers report being satisfied with their job. This is similar to the percentages recorded for teachers in all comparison groups, and interestingly, is eight percentage points higher than the figure reported in the 2008 TALIS cycle (82 per cent)30.
Australian teachers also report positively on most of the other job satisfaction items, with more Australian teachers than the average of any of the comparison groups believing that:
1. the advantages of being a teacher outweigh the disadvantages;
2. if they could decide again, they would still choose to work as a teacher;
3. they enjoy working at their school;
4. they would recommend their school as a good place to work; and
5. they are satisfied with their performance at their school.
It is noteworthy that only 38.5 per cent of Australian lower secondary education teachers believe that the teaching profession is valued in society. The percentage is similarly low among the comparative group countries, with the exception of the Asian countries. Interestingly, the majority of teachers in three of the four countries in the Asian group, Korea, Malaysia and Singapore, believe that their profession is indeed valued, bringing the Asian Average figure to 61.5 per cent. This average would have been higher had it not been for Japan’s very low level of agreement with this item (28.1 per cent).
As outlined in the International Report, the perception amongst teachers that their profession is one that is not valued in society can have negative implications for the recruitment and retention of high quality teachers. Whilst many countries, including Australia, have enacted policies to increase the prestige of the teaching profession (Schleicher 2011), further investigation is warranted into what it is that engenders these negative perceptions of the teaching profession.
30 Caution should be exercised when making inferences about the differences between this cycle and the 2008 cycle of TALIS with respect to job satisfaction. This is because in 2008, there was only one job satisfaction item which appeared in the teacher questionnaire (All in all, I am satisfied with my job), whilst in the 2013 cycle, there were 10. This means that in 2013 teachers were able to report their beliefs via an instrument which enabled distinction between job satisfaction elements. In 2008, however, they were only able to channel their positive or negative sentiment towards job satisfaction into agreeing or disagreeing with a single element. Any inferences regarding change over time should therefore be made with caution.
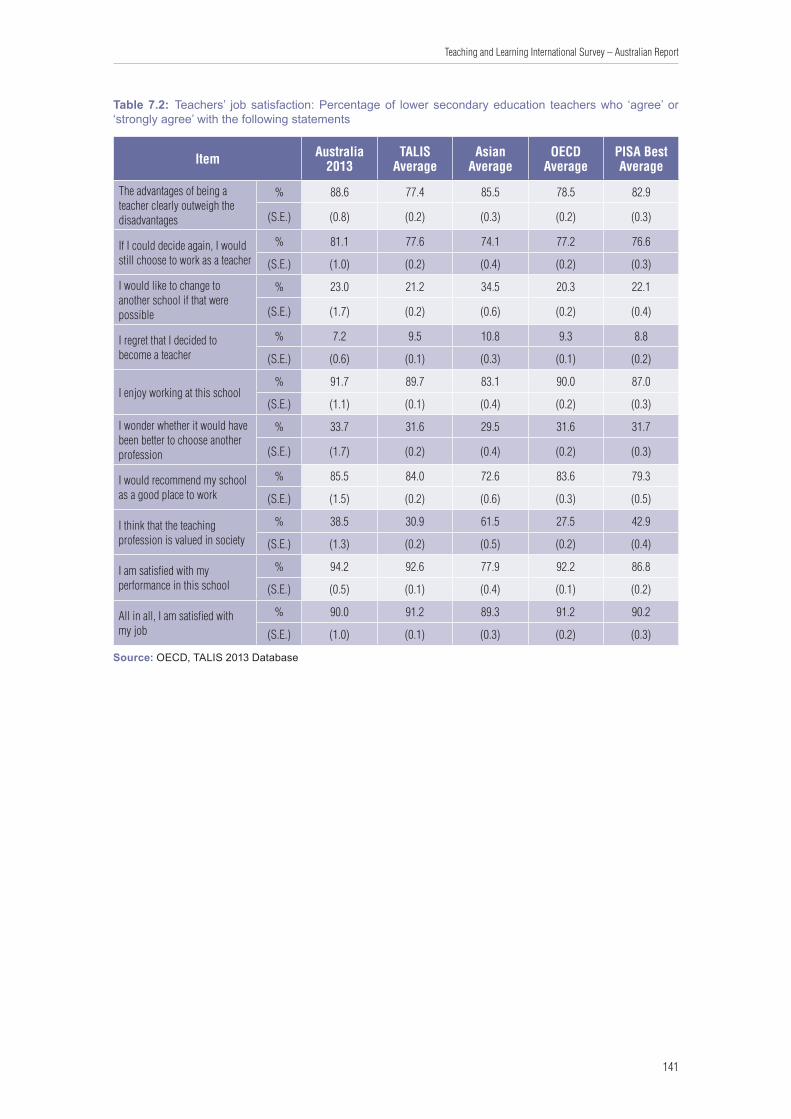
141
Teaching and Learning International Survey – Australian Report
Table 7.2: Teachers’ job satisfaction: Percentage of lower secondary education teachers who ‘agree’ or ‘strongly agree’ with the following statements
Item Australia 2013
TALIS Average
Asian Average
OECD Average
PISA Best Average
The advantages of being a teacher clearly outweigh the disadvantages
% 88.6 77.4 85.5 78.5 82.9
(S.E.) (0.8) (0.2) (0.3) (0.2) (0.3)
If I could decide again, I would still choose to work as a teacher
% 81.1 77.6 74.1 77.2 76.6
(S.E.) (1.0) (0.2) (0.4) (0.2) (0.3)
I would like to change to another school if that were possible
% 23.0 21.2 34.5 20.3 22.1
(S.E.) (1.7) (0.2) (0.6) (0.2) (0.4)
I regret that I decided to become a teacher
% 7.2 9.5 10.8 9.3 8.8
(S.E.) (0.6) (0.1) (0.3) (0.1) (0.2)
I enjoy working at this school% 91.7 89.7 83.1 90.0 87.0
(S.E.) (1.1) (0.1) (0.4) (0.2) (0.3)
I wonder whether it would have been better to choose another profession
% 33.7 31.6 29.5 31.6 31.7
(S.E.) (1.7) (0.2) (0.4) (0.2) (0.3)
I would recommend my school as a good place to work
% 85.5 84.0 72.6 83.6 79.3
(S.E.) (1.5) (0.2) (0.6) (0.3) (0.5)
I think that the teaching profession is valued in society
% 38.5 30.9 61.5 27.5 42.9
(S.E.) (1.3) (0.2) (0.5) (0.2) (0.4)
I am satisfied with my performance in this school
% 94.2 92.6 77.9 92.2 86.8
(S.E.) (0.5) (0.1) (0.4) (0.1) (0.2)
All in all, I am satisfied with my job
% 90.0 91.2 89.3 91.2 90.2
(S.E.) (1.0) (0.1) (0.3) (0.2) (0.3)
Source: OECD, TALIS 2013 Database
142
Teaching and Learning International Survey – Australian Report
7.3 The relationship between demographic variables and teacher self-efficacy, job satisfaction
TALIS data show that certain demographic variables influence teachers’ level of reported self-efficacy and job satisfaction. In Australia, the variables of gender, years of work experience as a teacher31 and any training received in the content, pedagogy and classroom practice of the subjects teachers teach were all found to have a significant relationship with reported levels of self-efficacy32.
Being male has a negative and moderately strong relationship with self-efficacy in Australia, meaning male teachers in Australia display lower self-efficacy than their female counterparts. The strength of this relationship in Australia is higher than it is in almost all other TALIS countries, with the exception of Denmark and Estonia.
With regard to job satisfaction, however, there is no significant relationship between gender and satisfaction in Australia, though there is a significant and negative relationship for male teachers reported in 13 other TALIS countries, most notably Croatia and Iceland.
With respect to work experience, TALIS data show that in Australia, having more than five years of experience as a teacher has a significant, positive and moderately strong relationship with self-efficacy. This suggests that more experienced teachers report higher levels of self-efficacy, and is a trend seen in the majority of TALIS countries. Again, there was no significant relationship found with respect to job satisfaction in Australia, as is the case with the majority of other TALIS countries.
An analysis of the relationship between self-efficacy, job satisfaction and whether teachers received training in the content, pedagogy and classroom practice of the subjects they teach shows a weak but significant relationship in the Australian context. In Australia, as for almost all other TALIS countries, the less teachers report the inclusion of these three elements in their formal training, the lower their reported levels of both job satisfaction and self-efficacy. As highlighted in the International Report, these findings highlight the importance of ensuring teachers receive directly relevant, subject specific training with respect to subject content, subject pedagogy and classroom practice for the subjects they teach.
With regards to classroom characteristics, statistical regression analysis shows that, in Australia, a teacher’s reported level of self-efficacy has no significant relationship with the size of their class or the presence of large groups (i.e. more than 10 per cent) of low academic achievers in their classroom. What does appear to have a significant relationship with self-efficacy in the Australian context, however, is when there is a large presence (i.e. more than 10 per cent) of
31 Defined for the purposes of this analysis as more than five years as opposed to five years or less.32 To facilitate interpretation of the relationships examined in this chapter, the text discusses weak,
moderate, and strong relationships instead of referring to the numerical values of the regression coefficients. Thresholds for these three categories were 0.2 and 0.3 standard deviation unit changes, where less than 0.2 is weak, 0.2-0.299 is moderate and 0.3 or higher is strong. These standard deviation unit changes are obtained by dividing the regression coefficient of the relation between the independent variable and dependent variable by the standard deviation of the dependent variable. This means that for every country, the distribution of self-efficacy and job satisfaction scores were taken into account when deciding on the classification of their regression coefficients. For dichotomous independent variables, these 0.2 and 0.3 standard deviation unit changes approximate regression coefficients of 0.3 and 0.5 respectively. For continuous variables, a change in one unit is not comparable to a dichotomous change. For variables such as class size, hours or proportions, we define the size of the relationship as weak, moderate, and strong at the threshold of 10 times the unit (β1*10 more students, 10 more hours, 10% more time spent). For index scores, we define the cut-off points in relation to a one standard deviation increase on that measure. This means that the coefficient on the non-dichotomous independent variables is first translated into standard deviation units by (β1*σx1). We then discuss a weak, moderate and strong relationship from this threshold.

143
Teaching and Learning International Survey – Australian Report
students with behavioural problems in the classroom. That is, teachers with large numbers of students with behavioural problems report lower levels of self-efficacy in Australia. This is true for about half of all TALIS countries, but is particularly apparent in Denmark and Romania. Conversely, Australian teachers will report higher levels of self-efficacy when there are large numbers (i.e. more than 10 per cent) of academically gifted students in their classroom.
Furthermore, the presence of a large number (i.e. more than 10 per cent) of students who are low academic achievers, or the presence of students with behavioural problems, have statistically significant relationships with a teacher’s reported level of job satisfaction in Australia. This means that, as with perceived self-efficacy, job satisfaction decreases when there are large numbers of these types of students in a teacher’s classroom. On the other hand, job satisfaction increases for Australian teachers when there is a large number of academically gifted students in the class. Interestingly, there is no significant relationship between job satisfaction and class size in Australia, nor is there one for the majority of other TALIS countries, with the exception of England, Latvia, Estonia and Malaysia.
TALIS data also show that the proportion of time spent on administrative tasks and keeping order in the classroom have a statistically significant and moderately strong relationship with teacher self-efficacy in Australia. This means that the more time teachers spend on tasks other than actual teaching, the lower the level of self-efficacy. The same is true for job satisfaction but interestingly, only in relation to time spent keeping order in the classroom. The time a teacher spends on administrative tasks has no significant relationship to job satisfaction in Australia.
Finally, with regard to the school environment more generally, TALIS data show that in Australia there is a weak but significant relationship between teacher-student relations and self-efficacy. This indicates that self-efficacy rises with the positive nature of the relationship between students and teachers at the school. The same is true for the level of teacher cooperation at the school, in that self-efficacy will increase with an increased level of collaboration between teachers in a collegial sense. Both of these findings are true for all participating TALIS countries.
A particularly strong relationship is apparent between teacher-student relations and job satisfaction in Australia, and a weak but significant association between job satisfaction and teacher cooperation is also evident. Again, these relationships are found throughout TALIS countries.
Another strong relationship can be found with respect to job satisfaction and the opportunity given to teachers to participate in decision making at a school level. This is true for Australian teachers as well as teachers from all other participating countries. Interestingly, this variable has a moderate to strong, significant relationship with teacher self efficacy in most TALIS countries except for Australia, where no significant relationship exists.
Table 7.3 provides a summary of the nature and strength of these relationships in Australia.
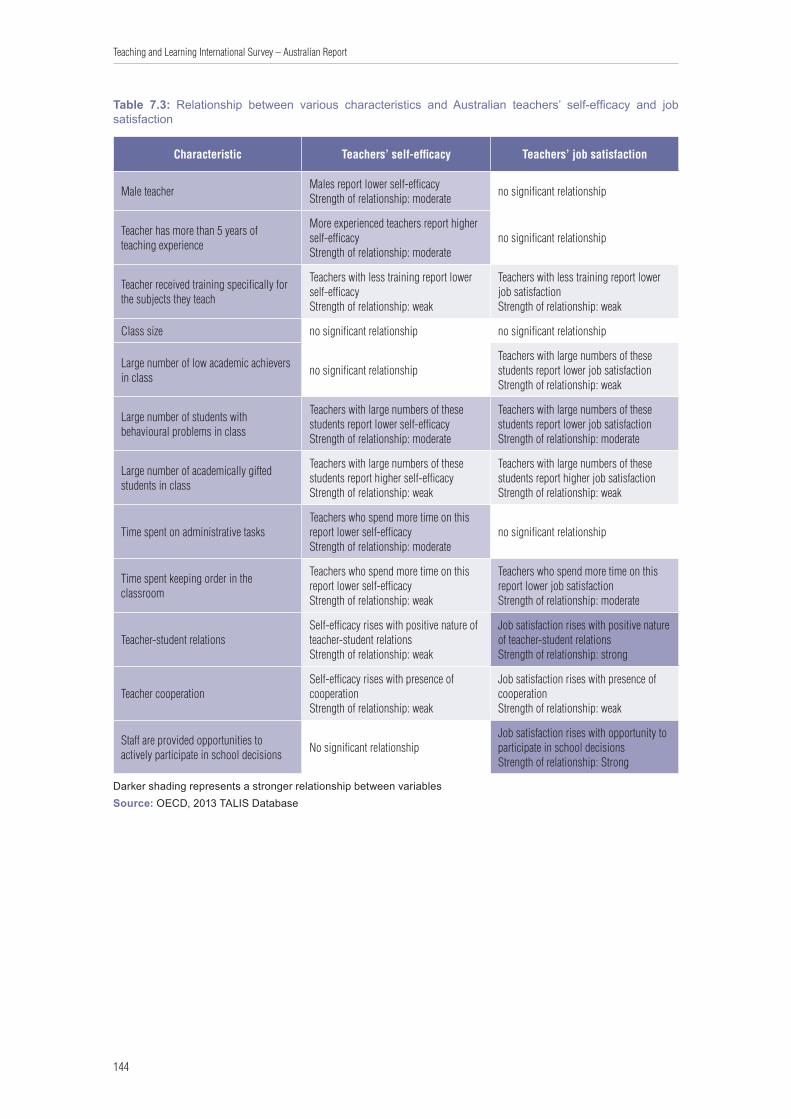
144
Teaching and Learning International Survey – Australian Report
Table 7.3: Relationship between various characteristics and Australian teachers’ self-efficacy and job satisfaction
Characteristic Teachers’ self-efficacy Teachers’ job satisfaction
Male teacher Males report lower self-efficacyStrength of relationship: moderate no significant relationship
Teacher has more than 5 years of teaching experience
More experienced teachers report higher self-efficacyStrength of relationship: moderate
no significant relationship
Teacher received training specifically for the subjects they teach
Teachers with less training report lower self-efficacyStrength of relationship: weak
Teachers with less training report lower job satisfactionStrength of relationship: weak
Class size no significant relationship no significant relationship
Large number of low academic achievers in class no significant relationship
Teachers with large numbers of these students report lower job satisfactionStrength of relationship: weak
Large number of students with behavioural problems in class
Teachers with large numbers of these students report lower self-efficacyStrength of relationship: moderate
Teachers with large numbers of these students report lower job satisfactionStrength of relationship: moderate
Large number of academically gifted students in class
Teachers with large numbers of these students report higher self-efficacyStrength of relationship: weak
Teachers with large numbers of these students report higher job satisfactionStrength of relationship: weak
Time spent on administrative tasksTeachers who spend more time on this report lower self-efficacy Strength of relationship: moderate
no significant relationship
Time spent keeping order in the classroom
Teachers who spend more time on this report lower self-efficacy Strength of relationship: weak
Teachers who spend more time on this report lower job satisfaction Strength of relationship: moderate
Teacher-student relationsSelf-efficacy rises with positive nature of teacher-student relationsStrength of relationship: weak
Job satisfaction rises with positive nature of teacher-student relationsStrength of relationship: strong
Teacher cooperationSelf-efficacy rises with presence of cooperationStrength of relationship: weak
Job satisfaction rises with presence of cooperationStrength of relationship: weak
Staff are provided opportunities to actively participate in school decisions No significant relationship
Job satisfaction rises with opportunity to participate in school decisionsStrength of relationship: Strong
Darker shading represents a stronger relationship between variablesSource: OECD, 2013 TALIS Database
145
Teaching and Learning International Survey – Australian Report
7.4 The relationship between teacher professional development and teacher self-efficacy, job satisfaction
As outlined in Chapter 4, there are different dimensions to teacher professional development. The relationship between teacher participation in professional development activities and self-efficacy and job satisfaction varies between countries and is influenced by the type and formality of the activities undertaken.
The strength of relationships was examined for self-efficacy and job satisfaction in connection with the following professional development variables:
• Participation in formal induction programme;
• Participation in informal induction activities;
• Teachers having a mentor;
• Teachers serving as mentor;
• Participation in mentoring and/or peer observation and coaching, as part of a formal school arrangement; and
• Participation in courses/workshops, education conferences or seminars.
Analyses of the data found that teacher involvement in mentoring can relate to greater job satisfaction, however a less consistent association with teacher self-efficacy was observed across countries. For Australian teachers, the strongest connection to self-efficacy exists for those acting as a mentor, a relatively less structured form of professional development. Interestingly, a stronger relationship with job satisfaction is evident for mentees, rather than for mentors.
According to the International Report, teachers who have participated in courses, workshops and/or conferences show higher levels of self-efficacy and job satisfaction in only very few countries (OECD 2013). Australian teachers who indicate participation in courses, workshops or seminars tended to report moderately higher levels of job satisfaction, but exhibited no significant connection to self-efficacy.
Neither formal nor informal induction related specifically to Australian teacher’s self-efficacy or job satisfaction. Internationally, the findings indicate that for most countries informal induction matters more for teachers’ job satisfaction, while formal induction matters more for teachers’ feelings of self-efficacy (OECD 2013).
146
Teaching and Learning International Survey – Australian Report
7.5 The relationship between teacher appraisal and teacher self-efficacy, job satisfaction
Appraisal and feedback can have a significant impact on teaching practices and therefore student outcomes. Reported self-efficacy and job satisfaction exhibit an important relationship with appraisal and feedback, and may also be influenced by the many different methods by which these are administered; with appraisal methods and types of feedback varying greatly across countries.
Teachers who receive feedback about student test scores report higher levels of self-efficacy in 24 countries, including Australia where a moderate connection was observed. No further significant relationships for any of the listed TALIS teacher appraisal and feedback variables and self-efficacy were apparent for Australian teachers.
The perception that appraisal and feedback influences teaching practices also positively relates to job satisfaction in nearly all TALIS countries (OECD 2013). The job satisfaction of Australian teachers shows some relationship to feedback:
• from direct classroom observation from at least two evaluators;
• emphasising student behaviour and classroom management; and
• where classroom teaching is impacted.
As noted in the International Report, there is a distinct drop in self-efficacy and job satisfaction for teachers who perceive that appraisal and feedback are only undertaken to fulfil administrative requirements (OECD 2013). Whilst appraisal and feedback are useful tools for improving teachers’ practices, the benefits need to be evaluated in conjunction with possible negative perceptions.

147
Teaching and Learning International Survey – Australian Report
7.6 International Summary: Highlights from the International Report• Less than a third of all teachers across TALIS countries believe that teaching is a valued
profession in society. In all but one TALIS country, the extent to which teachers can participate in decision making has a strong positive association with the likelihood of reporting that teaching is a valued profession in society.
• Furthermore, teachers who report that they are provided with opportunities to participate in decision making at a school level have higher reported levels of job satisfaction in all TALIS countries and higher feelings of self-efficacy in most countries. The relationship between job satisfaction and teacher participation in school decision making is particularly strong for all countries.
• With more teaching experience comes higher levels of self-efficacy, but in some cases lower levels of job satisfaction. Teachers with more than five years of work experience report higher levels of self-efficacy than their less-experienced colleagues in 26 countries, however lower levels of job satisfaction in 12 TALIS countries.
• Challenging classroom circumstances can affect teachers’ self-efficacy and job satisfaction. In particular, an increase in the percentage of students with behavioural problems is associated with a strong decrease in teachers’ reported levels of job satisfaction in almost all countries.
• Teachers’ perception that appraisal and feedback lead to changes in their teaching practice is related to higher job satisfaction in nearly all countries, whereas the perception that appraisal and feedback is performed merely for administrative purposes relates to lower levels of job satisfaction in all TALIS countries.
• The relationships that teachers develop with their school leader, other teachers or with students in their schools are valuable. Positive interpersonal relationships can negate the otherwise detrimental effects that challenging classrooms of students might have on a teacher’s job satisfaction or feelings of self-efficacy. Relationships between teachers and students have an exceptionally powerful relation with teachers’ job satisfaction.
• Collaboration among teachers, whether through professional learning or collaborative practices, is also influential. Collaborative practices are related to both higher levels of self-efficacy and job satisfaction. In particular, teachers who report participating in collaborative professional learning five times a year or more also report significantly enhanced levels of self-efficacy in almost all countries and higher job satisfaction in two-thirds of the countries.
148
Teaching and Learning International Survey – Australian Report
ReferencesAustralian Institute for Teaching and School Leadership (2011), National Professional Standard
for Principals, Education Services Australia.
Aydin, A., Y. Sarier and S. Uysal (2013), ‘The effect of school principals’ leadership styles on teachers’ organizational commitment and job satisfaction’, Educational Sciences: Theory & Practice, Vol. 13/2, pp. 806-811.
Bandura, A. (1986), Social Foundations of Thought and Action: A Social Cognitive Theory, Prentice Hall, Englewood Cliffs, NJ.
Branch, G.F., E.A. Hanushek and S.G. Rivkin (2013), ‘School leaders matter: Measuring the impact of effective principals’, Education Next, Vol. 13/1, pp. 63-69.
Brief, A.P. and H.M. Weiss (2002), ‘Organizational behavior: Affect in the workplace’, Annual Review of Psychology, Vol. 53, pp. 279-307.
Butt, G. et al. (2005), ‘Teacher job satisfaction: Lessons from the TSW pathfinder project’, School Leadership and Management, Vol. 25, pp. 455-471.
Caprara, G.V. et al. (2006), ‘Teachers’ self-efficacy beliefs as determinants of job satisfaction and students’ academic achievement: A study at the school level’, Journal of School Psychology, Vol. 44/6, pp. 473-490.
Chin, J.M. (2007), ‘Meta-analysis of transformational school leadership effects on school outcomes in Taiwan and the USA’, Asia Pacific Education Review, Vol. 8/2, pp. 166-177.
Clement, M. and Vandenberghe, R. (2000) ‘Teachers’ professional development: a solitary or collegial (ad)venture?’, Teaching and Teacher Education, Vol. 16 pp.81–101.
Crossman, A. and P. Harris (2006), ‘Job satisfaction of secondary school teachers’, Educational Management Administration and Leadership, Vol. 34, pp. 29-46.
Darling-Hammond, L., et al. (2007), Preparing School Leaders for a Changing World: Lessons from Exemplary Leadership Development Programs, Stanford Educational Leadership Institute, Stanford University, Stanford, CA.
Department of Education and Communities (NSW) (2011), ‘Independent review of the school based management pilot’, www.det.nsw.edu.au/media/downloads/about-us/statistics-andresearch/key-statistics-and-reports/irsb-management-pilot.pdf.
Department of Education, Training and Employment and the Australian Council for Educational Research (2012), National School Improvement Tool, ACER.
Department of Education, Western Australia (2013), ‘Evaluation of the Independent Public Schools initiative’ Final Report, May 2013.
Dinham, S., and C. Scott (1998), ‘A three-domain model of teacher and school executive career satisfaction’, Journal of Educational Administration, Vol. 36, pp. 362-378.
Dormann, C. and Zapf, D. (2001) ‘Job satisfaction - A meta-analysis of stabilities’ Journal of Organizational Behavior, 22, 483-504.

149
Teaching and Learning International Survey – Australian Report
Grissom, J.A., S. Loeb and B. Master (2013), ‘Effective instructional time use for school leaders: Longitudinal evidence from observations of principals’, Educational Researcher, Vol. 42/8, pp. 433–444.
Harris, A. (2008), Distributed Leadership: Developing Tomorrow’s Leaders, Routledge, London.
Harris, A. (2012), ‘Distributed leadership: Implications for the role of the principal’, Journal of Management Development, Vol. 31/1, pp. 7-17.
Hattie, J. (2009), Visible Learning. A Synthesis of Over 800 Meta-Analyses Relating to Achievement, Routledge, Milton Park, UK.
Jensen, B. and J. Reichl (2011), Better Teacher Appraisal and Feedback: Improving Performance, Grattan Institute.
Jeynes, W.H. (2011), Parental Involvement and Academic Success, Routledge, New York.
Klassen, R.M. et al. (2009), ‘Exploring the validity of a teachers’ self-efficacy scale in five countries’, Contemporary Educational Psychology, Vol. 34/1, pp. 67-76.
Klassen, R.M. and M.M. Chiu (2010), ‘Effect on teachers’ self-efficacy and job satisfaction: Teacher gender, years of experience, and job stress’, Journal of Educational Psychology, Vol. 102/3, pp. 741-756.
Leithwood, K., B. Mascall and T. Strauss (2009), Distributed Leadership According to the Evidence, Routledge, London.
Locke, E. (1969), ‘What is job satisfaction?’ Organizational Behavior and Human Performance, Vol. 4, pp. 309-336.
Lucas, O., et al. (2012), ‘School principal’s leadership style: A factor affecting staff absenteeism in secondary schools’, Journal of Emerging Trends in Educational Research and Policy Studies, Vol. 3/4, pp. 444-446.
MacNeil, A.J. and D. Prater (1999), ‘Teachers and principals differ on the seriousness of school discipline: A national perspective’, National Forum of Applied Educational Research Journal, Vol. 12/3, pp. 1-7.
Marzano, R.J., T. Waters and Brian A. McNulty (2005), School Leadership That Works: From Research To Results. Association for Supervision and Curriculum Development, Alexandria, VA.
Masters, G.N. (2012). National School Improvement Tool. Melbourne: ACER. Masters, G.N. (2012). National School Improvement Tool. Melbourne: ACER.
Michaelowa, K. (2002), Teacher Job Satisfaction, Student Achievement, and the Cost of Primary Education in Francophone Sub-Saharan Africa, Hamburg Institute of International Economics.
OECD (2009), Creating Effective Teaching and Learning Environments: First Results from TALIS, OECD Publishing, Paris.
OECD (2013a), PISA 2012 Results in Focus: What 15-Year-Olds Know and What They Can Do With What They Know, OECD-PISA.
OECD (2013b), OECD Reviews of Evaluation and Assessment in Education. Synergies for Better Learning: An International Perspective on Evaluation and Assessment, OECD Publishing, Paris, http://dx.doi.org/10.1787.9789264190658-en.
OECD (2014), TALIS 2013 Results: An International Perspective on Teaching and Learning, TALIS, OECD Publishing.
Peterson, P. L., Fennema, E., Carpenter, T. P., and Loef, M. (1989) ‘Teachers’ Pedagogical Content Beliefs in Mathematics’ Cognition and Instruction, 6(1): 1-40.
150
Teaching and Learning International Survey – Australian Report
Pont, B., D. Nusche and H. Moorman (2008), Improving School Leadership, Volume1: Policy and Practice, OECD Publishing, Paris, http://dx.doi.org/10.1787/9789264044715-en.
Price, H. and J. Collett (2012), ‘The role of exchange and emotion on commitment: A study using teachers‘, Social Science Research, Vol. 41, pp. 1469-1479.
Robinson, V., Hohepa, M., & Lloyd, C. (2009) ‘School Leadership and Student Outcomes: Identifying what works and why’ Best Evidence Synthesis Iteration (BES). Wellington: Ministry of Education.
Rockoff, J.E. (2008), ‘Does mentoring reduce turnover and improve skills of new employees: Evidence from teachers in New York City’, NBER Working Paper, No. 13868.
Rosenholtz (1989) Teachers’ Workplace: The Social Organization of Schools. New York: Longman.
Ross, J. A. (1998) ‘The antecedents and consequences of teacher efficacy’ in J. Brophy (Ed.) Advances in Research on Teaching. Vol. 7 (pp. 49-74). Greenwich, CT: JAI Press.
Schleicher, A. (2011), Building a High-Quality Teaching Profession: Lessons from around the World, OECD Publishing, http://dx.doi.org/10.1787/9789264113046-en.
Schleicher, A., (ed.) (2012), Preparing Teachers and Developing School Leaders for the 21st Century: Lessons from around the World, OECD Publishing, Paris, http://dx.doi.org/10.1787/9789264174559-en.
Somech, A. and R. Bogler (2002), ‘Antecedents and consequences of teacher organizational and professional commitment’, Educational Administration Quarterly, Vol. 38, pp. 555-577.
Smylie, M.A., et al. (2007), ‘Trust and the development of distributed leadership’, Journal of School Leadership, Vol. 17/4, pp. 469-503.
United Nations, (2013) Human Development Report 2013, United Nations Development Programme.
Veenman, S., Y. Visser and N. Wijkamp (1998), ‘Implementation effects of a program for the training of coaching skills with school principals’, School Effectiveness and School Improvement: An International Journal of Research, Policy and Practice, Vol. 9/2, pp. 135-156.
World Bank Group (2014), Land Mass Data; GDP per Capita: School enrolment, secondary, World Bank Open Data.
Zanderigo, T., E. Dowd and S. Turner (2012), Delivering School Transparency in Australia: National Reporting through My School, Strong Performers and Successful Reformers in Education, OECD Publishing, Paris, http://dx.doi.org/10.1787/9789264175884-en.
151
Teaching and Learning International Survey – Australian Report
Appendix A:Research Design and Data Collection MethodsTALIS 2013 comprised three distinct phases: the pilot phase, the field trial phase and the main study phase. Each of these phases is outlined below.
The Pilot PhaseThe TALIS pilot phase was conducted in Australia in August 2011. It involved running two focus group sessions, one which aimed to collect feedback relating to the principal questionnaire, and one for feedback relating to the teacher questionnaire. Both sessions were run on 1st August for a duration of four hours, and were conducted in the ACER Sydney offices. The principal group comprised six practicing or former principals, and the teacher group comprised a total of eight practicing or former teachers. Each group was given the relevant questionnaire in paper format, and was asked to read and answer the items and then provide feedback to their group leader during a discussion session. The focus groups were semi-structured in nature and the following list of questions was supplied to the group leaders so as to inform and guide the group discussion:
• Were there any terms or questions that were confusing?
• Were the topics and items organised and sequenced in a reasonable/logical way?
• Were the skip instructions (i.e. “Go to Question x.”) appropriate and clear?
• Were there any questions that were difficult or very time-consuming to answer?
• Were there any questions with inappropriate response categories (i.e. not mutually exclusive, not applicable, or not covering all relevant situations)?
• Were there any items that seem irrelevant to you, your work, your school, or your educational system?
• Were there any questions that made you feel uncomfortable/uneasy in answering them (e.g. because they touch on sensitive issues or you had concerns about the confidentiality/privacy of the information you provide)?
• For any particular issues ….. Do you have suggestions for ways to reword any items to make them clearer?
Group leaders summarised their group’s discussion and submitted their report to ACER, which in turn was submitted to the Data Processing Centre (DPC) for their consideration. The DPC received similar feedback from all participating countries and revised the principal and teacher instruments in line with this feedback.

152
Teaching and Learning International Survey – Australian Report
The Field Trial PhaseThe objective of the TALIS field trial was to test both the survey instruments and the operational procedures in preparation for the main study. The field trial was conducted in Australia in March 2012 and necessitated schools and teachers to be sampled and undertake the survey as they would for the main study. For the Australian ISCED 2 (lower secondary) option, eight schools took part in the field trial nationally. In total, 122 teachers from these eight schools completed the questionnaire online. National data sets were then submitted to the DPC for data processing and additional quality checks. Careful analysis of the field data by the Instrument Development Expert Group and consultation with the TALIS Board of Participating Countries led to improvements in the main survey instruments.
The Main Study PhaseThe TALIS Main Study was conducted in Australia between September and December 2012. The survey window was the same for all Southern Hemisphere TALIS countries, while Northern Hemisphere countries conducted their data collection from February to June 2013. In Australia, a total of 2059 lower secondary teachers and 116 principals from 123 schools across the country participated in the study. The predominant mode of delivery was online, though a small number (fewer than 100) of teachers were mailed paper questionnaires on request.
Populations and sampling
Reliability and validity of the survey estimates and international comparability of the survey findings can only be achieved at the cost of painstaking fieldwork, thorough systems testing, rigorous instrument design and validation, and sound methodological and sampling methods. Because of this, stringent standards with respect to these elements were created by the IEA DPC, and participating countries were required to uphold these standards in their national survey administration in order to ensure their inclusion in the TALIS International Report.
For the Main Study phase of the Australian component of TALIS 2013, IEA DPC sampling procedures were followed closely. In Australia, centralised lists of teachers by ISCED level are not readily available. Therefore, sampling of teachers, much like sampling of students, requires a stratified two-stage approach. The first stage involves drawing a sample of schools which is then used to inform the second stage of sampling, that of teachers. The procedures undertaken in each of these two stages are outlined below.
1. Sampling Stage One: School Sample Selection
The school population for the Australian component of TALIS 2013 was defined as all schools in Australia which employ ISCED Level 2 teachers. A list of all eligible Australian schools from which the sample could be drawn was then obtained from Statistics Canada. As per IEA DPC sampling procedure, schools in Australia were selected with probability proportional to their size. In this instance, the number of teachers of ISCED Level 2 employed by the school was integral to measure of size (MOS) calculations. In this way, bigger schools with greater numbers of ISCED Level 2 teachers had a greater probability of being selected (and were consequently assigned a lower school weight), and smaller schools with fewer ISCED Level 2 teachers had a smaller probability of selection (with a greater school weight assigned). Weighting adjustments were made within each explicit stratum after participation figures were finalised. Other stratification variables used in Australia when selecting the school sample were State (NSW, Vic, Qld, WA, SA, Tas, NT and ACT), sector (Government, Catholic and Independent), and geographic location (metropolitan, rural, remote). In total, 154 schools, or primary sampling units (PSU) were sampled in Australia.
153
Teaching and Learning International Survey – Australian Report
2. Sampling Stage Two: Teacher Sample Selection
Within each selected school, ISCED Level 2 teachers (secondary sampling units –SSU) were selected with equal probability. A teacher of ISCED Level 2 is one who, as part of their regular duties in the target school, provides instruction in programmes at the ISCED Level 2. Teachers who teach a mixture of programmes at different levels including ISCED 2 programmes in the target school are included in the target population. There was no minimum cut-off for how much ISCED Level 2 teaching they need to be engaged in. However, teachers were excluded from selection if they met any one of the following criteria:
• Teacher is a substitute, emergency or occasional teacher;
• Teacher teaches exclusively to adults;
• Teacher is on long-term leave;
• Teacher is also the school principal; or
• Teacher participated in the field trial.
An important point of difference between the target populations in TALIS 2013 as compared to the previous cycle in 2008 is that teachers teaching special needs students exclusively were included in the 2013 sample. This difference is accounted for when comparisons between the 2008 and 2013 data are made (i.e. special needs teachers are excluded from the 2013 dataset when comparisons are made).
From the resulting list of eligible teachers from each school, a fixed number of teachers (20) were randomly selected and were invited to complete the questionnaire. This minimum number was set at 20 to allow for reliable estimation and modelling, whilst also allowing for some amount of non-response. If a school had less than 20 teachers, all of the teachers in the school were invited to participate. If a school had between 21 and 30 teachers, again, all of the teachers were invited to participate. This strategy was advisable for both practicality and efficiency reasons.
Final teacher weight was later calculated by multiplying the weight and adjustment factors for both school and teachers.
If individual units (teachers) could be sampled directly from a complete and current list of the units (all ISCED Level 2 teachers in Australia), a far smaller sample size would be needed to meet validity and reliability requirements. However, actual survey conditions dictated that the teachers be sampled in rather homogeneous groups, namely a school, thereby clustering the survey responses. It is also the case that during the survey administration period, some selected teachers will be absent, or will refuse to participate, resulting in non-response. These two factors: non-response and clustering, required that the sample size be adjusted upwards.
Further details on weighting and sample design can be gleaned from the TALIS Technical Report (OECD 2014).
3. Replacement Schools
In order to maintain the sample size and help reduce response and non-response bias, a sample of replacement schools was also selected at the same time as the primary sample of schools. For each sampled school, up to two replacement schools were identified. These were the schools just above and just below the selected school on the sampling frame sorted by the MOS. In the event of a school not responding or refusing to participate in the survey, their first replacement school was then asked to take part. If the first replacement declined to participate or did not respond to the request, the second replacement school was approached. In the case of a second
154
Teaching and Learning International Survey – Australian Report
replacement school declining to participate or not responding to the invitation, no further schools were approached to participate in this explicit stratum.
As the number of replacement schools increases, the sample loses its probabilistic features and becomes increasingly ‘purposive’. This effectively undermines the reliability, validity and interpretability of the country’s results which is why great lengths were taken to revert to replacement schools only after non-participation by the originally sampled school was confirmed and unavoidable.
Pre-Data Collection Processes
Once the school sample was selected, permission to conduct this research in these schools was sought and obtained from all the relevant jurisdictions. Principals of the selected schools were then sent an information package which provided details about the study and which contained a letter requesting permission for their school to participate.
Principals who agreed to participate were asked to nominate a staff member as the contact person (referred to as a School Coordinator) to support the coordination of the survey within the school. All correspondence was then addressed (either via email or surface mail) to the nominated School Coordinator for each school.
School Coordinators were then asked to return a form listing the names (or other identifying information deemed appropriate by the school principal) of all ISCED 2 teachers in their school. This form was referred to as the Teacher Listing Form (TLF) and the gender, age, teaching domain and exclusion status of all listed teachers was required information.
Twenty teachers from each school were then randomly selected to take part in the survey. All sampled teachers and their school principals were sent an information package inviting them to take part, and provided them with information about how to do so.
Instrumentation and Data Collection
Two questionnaire instruments were used in the conduct of TALIS 2013. The first of these, the Teacher Questionnaire, consisted of 50 questions about a range of issues including professional development, teacher appraisal and feedback, teaching practices, beliefs and attitudes and questions specifically relating to teaching of a particular class. Based on calculations from the IEA DPC, this survey took between 45 and 60 minutes to complete.
The second instrument, the Principal Questionnaire, comprised 40 questions on the topics of school management, teacher appraisal, school resources and school background information. This questionnaire was estimated to take between 30 and 45 minutes to complete.
A copy of both instruments is provided in Appendices B and C.
TALIS applied online data collection (ODC) methods for the school (principal) and teacher questionnaires. The online data collection technology developed by the DPC uses a thin client technology that requires minimal resources and is designed to look like the paper version of the questionnaire. It was estimated that most teachers and principals would nominate to complete the survey online, and this assumption proved to be correct. Fewer than 100 teachers in Australia requested a paper version of the questionnaire.
Completion and return of the survey was taken as implied consent, though participants were also informed that they could withdraw from the survey at any time without penalty. Data were collected, entered (where necessary) and stored on a central location at the ACER offices in Sydney. A bespoke software package, Windows Data Entry Manager (WinDEM), was provided by

155
Teaching and Learning International Survey – Australian Report
the DPC and utilised for data entry and verification in the Sydney ACER offices. This computer program ensured the streamlining of data entry and verification across all participating countries and helped to maintain the quality of the data as it was being entered. Data were then sent to the IEA DPC where basic scaling and weighting were performed.
Participation Rates
In order to maintain a uniform level of data quality across countries, the IEA DPC set minimum requirements in terms of both teacher and school participation (or response) rates. These requirements state that at least 75 per cent of schools (after replacement) and at least 75 per cent of teachers within the selected schools must participate in the survey. Participating schools that fail to yield at least 50 per cent of participating teachers will be considered as non-participating. Reaching these levels of participation does not preclude some amount of error being present in the results, but it should at least minimise the negative impact of non-response bias.
As Table 1 below shows, the final Australian participation rate for schools was 82.6 per cent after replacement which was above the necessary 75 per cent required for inclusion in the TALIS International Report. Australia also exceeded the required 75 per cent teacher response rate with a teacher participation rate of 86.8 percent.
Table 1: Australian School and Teacher Participation Rates
School Participation
Element Value Description
Total School Sample 154 Size of School Sample (this does not include replacement schools)
Schools as Frame Errors 5 No. of school records marked as not participating with reasons other than “Refusal”
Eligible Schools 149 ‘Total School Sample’ – ‘Schools as Frame Errors’
Original Sample 96 No. of schools which were in original selection (not replacements)
1st Replacement 19 No. of first replacement schools
2nd Replacement 16 No. of second replacement schools
School Refusals 18 No. of schools marked as “Refusal”, with no replacement school
Non-participating schools 8 No. of schools with teacher response rate <50%
Participating schools 123 No. of schools with teacher response rate >=50%
Overall School Participation BEFORE replacement (%) 59.1% Participating schools (original sample schools only) / ‘Eligible Schools’
Overall School Participation AFTER replacement (%) 82.6% Participating schools (original and replacement) / ‘Eligible Schools’
Teacher Participation
Element Value Description
Eligible teachers 2371 No. of sampled, eligible teachers from participating schools
Responding teachers 2059 No. of teachers who submitted a questionnaire from participating schools
Teacher response rate 86.8% ‘Responding’/’Eligible’ from the above 2 figures.

156
Teaching and Learning International Survey – Australian Report
Strategies to increase participation
It is well documented that a major challenge exists in achieving acceptable response rates in voluntary teacher surveys. One of the main problems pertains to the fact that there are too many surveys ‘jostling for attention’ (Owen et al. 2008), and that there is not a regular, predictable cycle of data collection producing results that are seen as important across the whole teaching profession. In light of the fact that participation in the TALIS study was purely voluntary for sampled teachers and principals, and that a considerable amount of ‘survey fatigue’ is being experienced in Australian schools, the achieved TALIS responses rates are impressive.
In order to maximise Australian participation rates at a school level, ACER implemented a number of strategies designed to increase participation at both a school and teacher level. Firstly, an advisory group comprising members from each educational department jurisdiction (including national Catholic and independent school representatives) was formed. Members from the TALIS Australian Advisory Group were asked to make contact with each school in their jurisdiction in order to inform the principals to expect communications from ACER and to strongly recommend that sampled schools participate in the survey.
ACER also employed a small group of former school principals and teachers to make contact with the principals of sampled schools by phone. The purpose of these phone calls was to provide an overview of the TALIS study to school leaders, and to highlight the importance of their school’s participation in the study.
In order to maximise participation at a teacher level, ACER also instigated the following:
• Posted TALIS information in teacher bulletins;
• Included TALIS information in teacher journals, online sites, intranets and newsletters;
• Established a dedicated TALIS Hotline to field questions about the study;
• Incentives to participants: USB memory sticks were provided to all School Coordinators and catered morning teas for participating teachers were sponsored by ACER.
Data Quality
Quality assurance in TALIS was vital in order to streamline the approach to survey administration across participating countries and to thereby make international comparisons of teacher and principal survey results possible. For this reason, a number of quality control measures were put into place for the conduct of the TALIS project in Australia.
1. Field Trial
The Field Trial provided the opportunity to test the processes designed by the IEA in an Australian context. The same quality control measures for data entry, as detailed below, were also employed for the Field Study.
2. Quality Control with WinDEM
The Windows Data Entry Manager (WinDEM) software program was used for all data entry, editing, validation, and data verification tasks. This software aided quality assurance processes in three ways, namely:
• Double Punching Check (File Comparison): The ‘Double Punching Check’ facility in the WinDEM program was used for all paper (hard copy) surveys received and subsequently
157
Teaching and Learning International Survey – Australian Report
data entered. Every double-entered data file was compared against an original data file as a reliability check on the data entry. Whilst the desired margin of error for the agreement of the two files was zero percent, an error quota of one percent or less was accepted.
• Unique ID Check: Duplication of records was prevented with the aid of the ‘Unique-ID’ facility in the WinDEM program.
• Validation Check: Data values were verified with the aid of the ‘Validation Check’ facility in the WinDEM program. Values were checked against the valid data ranges for all items and out-of-range values were prevented.
3. Quality Control Monitor
An International Quality Control Monitor, trained by the IEA DPC, visited a total of 10 participating ISCED 2 schools in Australia. These 10 schools were randomly selected from the list of participating schools within a reasonable driving distance from a state or territory’s capital city.
The main responsibilities of the Quality Control Monitor were to firstly interview the School Coordinators of the selected schools about the TALIS survey administration, and to then record their observations and the interview responses. These responses were then analysed by the IEA DPC. Whilst there were concerns raised by some School Coordinators about the timing of the data collection process (i.e. the end of the school year being a busy time for schools), there were no serious issues reported.
ACER recognised the poor timing of the study. The questionnaire was conducted towards the end of Term 4: a notoriously busy time of year with exam preparation, report writing and end of year functions (school plays, graduation ceremonies and award presentations) taking up much of the time of high school teaching staff. The allocated data collection period, however, was put in place by the IEA, and ACER was ultimately constrained by this timeline.

158
Teaching and Learning International Survey – Australian Report
Appendix B:TALIS Teacher Questionnaire
Placeholder for idenitication label
Organisation for Economic Co-operation and Development (OECD)Teaching and Learning International Survey (TALIS) 2013
Teacher QuestionnaireYears 7 – 10Main Study VersionInternational English, Australian Spelling
National Study Centre:Australian Council for Educational Research (ACER)
1/140 Bourke Road Alexandria NSW 2015, Australia
International Project Consortium:International Association for the Evaluation of Educational Achievement (IEA), The Netherlands
IEA Data Processing and Research Center (IEA DPC), GermanyStatistics Canada, Canada
159
Teaching and Learning International Survey – Australian Report
About TALIS 2013The second Teaching and Learning International Survey (TALIS 2013) is an international survey that offers the opportunity for teachers and principals to provide input into education analysis and policy development. TALIS is being conducted by the Organisation for Economic Co-operation and Development (OECD), and Australia, along with more than 30 other countries, is taking part in the survey.
Cross-country analysis of this data will allow countries to identify other countries facing similar challenges and to learn from other policy approaches. School principals and teachers will provide information about issues such as the professional development they have received; their teaching beliefs and practices; the review of teachers’ work and the feedback and recognition they receive about their work; and various other school leadership, management and workplace issues.
In the TALIS study, it is our intention to draw a picture of the different educational practices in all the participating countries. Countries and individuals may differ in their educational approaches. We rely on your expertise to describe to us your work and opinion as accurately as possible.
Being an international survey, it is possible that some questions do not fit very well within your national context. In these cases, please answer as best as you can.
ConfidentialityAll information that is collected in this study will be treated confidentially. While results will be made available by country and by type of school within a country, you are guaranteed that neither you, this school, nor any school personnel will be identified in any report of the results of the study.
About the Questionnaire• This questionnaire should take approximately 45 to 60 minutes to complete.
• Guidelines for answering the questions are typed in italics. Most questions can be answered by marking the one most appropriate answer.
• When you have completed this questionnaire, please mail it to ACER using the enclosed prepaid envelope by 30 November 2012.
• When in doubt about any aspect of the questionnaire, or if you would like more information about the questionnaire or the study, you can reach us by using the following contact details:
• Australian Council for Educational Research (ACER), 1800 762 022 or [email protected]
Thank you very much for your participation.

160
Teaching and Learning International Survey – Australian Report
Background InformationThese questions are about you, your education and the time you have spent in teaching. In responding to the questions, please mark the appropriate choice(s) or provide figures where necessary.
1. Are you female or male?1 Female
2 Male
2. How old are you?Please write a number.
Years
3. Do you identify as being of Aboriginal or Torres Strait Islander origin?Please mark one choice.1 No
2 Yes, Aboriginal
3 Yes, Torres Strait Islander
4 Yes, both Aboriginal and Torres Strait Islander
4. What is your current employment status as a teacher?Please consider your employment status for all of your current teaching jobs combined.Please mark one choice.1 Full-time (more than 90% of full-time hours) Please go to Question 6.2 Part-time (71-90% of full-time hours)
3 Part-time (50-70% of full-time hours)
4 Part-time (less than 50% of full-time hours)
5. Why do you work part-time?Please mark one choice.1 I chose to work part-time.
2 A full-time position was not available.
6. How many years of work experience do you have? Please round up to whole years.a) Year(s) working as a teacher at this schoolb) Year(s) working as a teacher in totalc) Year(s) working in other education roles (do not include years working as a
teacher)d) Year(s) working in other jobs

161
Teaching and Learning International Survey – Australian Report
7. What is your employment status as a teacher at this school?Please mark one choice.1 Permanent employment (an on-going contract with no fixed end-point before the
age of retirement)2 Fixed-term contract for a period of more than 1 school year
3 Fixed-term contract for a period of 1 school year or less
8. Do you currently work as a teacher of Year 7 – 10 students at another school?Please mark one choice.1 Yes
2 No Please go to Question 10.
9. If ‘Yes’ in the previous question, please indicate in how many other schools you currently work as a Year 7 – 10 teacher.Please write a number.
School(s)
10. Across all your Year 7 – 10 classes at this school, how many are special needs students?Special needs students cover those for whom a special learning need has been formally identified because they are mentally or physically disadvantaged. Often they will be those for whom additional public or private resources (personnel, material or financial) have been provided to support their education.Please mark one choice.1 None
2 Some
3 Most
4 All
11. What is the highest level of formal education you have completed?Please mark one choice.1 Secondary education / post-secondary, non-tertiary education or less (e.g. Year 10
or Year 12 exit qualification) or below2 First stage of tertiary education not leading to an advanced research qualification
including programmes that are generally more practical/technical/occupation specific (e.g. Vocational Training Certificate, TAFE, Trade Certificate)
3 Undergraduate Diploma
4 Bachelor Degree
5 Graduate Diploma/Graduate Certificate
6 Master’s Degree
7 Doctorate
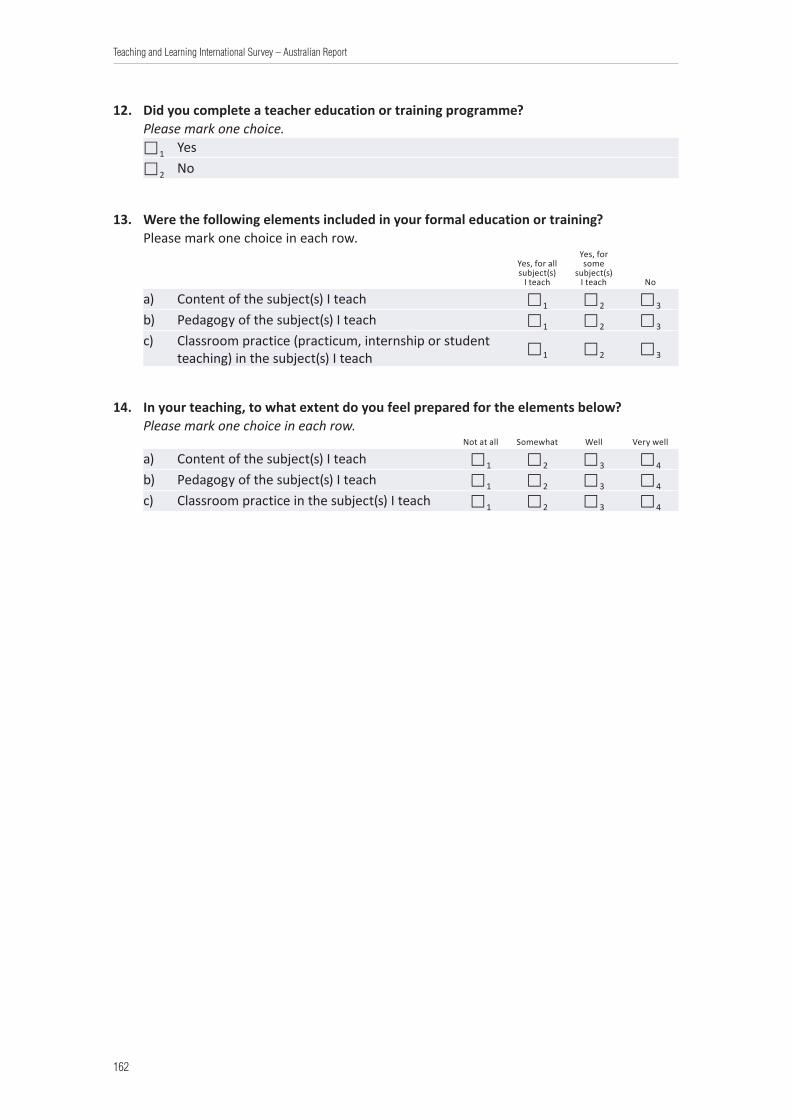
162
Teaching and Learning International Survey – Australian Report
12. Did you complete a teacher education or training programme?Please mark one choice.1 Yes
2 No
13. Were the following elements included in your formal education or training? Please mark one choice in each row.
Yes, for all subject(s)
I teach
Yes, for some
subject(s) I teach No
a) Content of the subject(s) I teach 1 2 3
b) Pedagogy of the subject(s) I teach 1 2 3
c) Classroom practice (practicum, internship or student teaching) in the subject(s) I teach 1 2 3
14. In your teaching, to what extent do you feel prepared for the elements below?Please mark one choice in each row.
Not at all Somewhat Well Very well
a) Content of the subject(s) I teach 1 2 3 4
b) Pedagogy of the subject(s) I teach 1 2 3 4
c) Classroom practice in the subject(s) I teach 1 2 3 4
163
Teaching and Learning International Survey – Australian Report
15. Were any of the subject categories listed below included in your formal education or training?Please mark as many choices as appropriate in each row.
Because this is an international survey, we had to categorise many of the actual subjects taught in schools into broad categories. Please refer to the subject examples below. If the exact name of one of your subjects is not listed, please mark the category you think best fits the subject.
Reading, writing and literature: reading and writing (and literature) in the mother tongue, in the language of instruction, or in the tongue of the country (region) as a second language (for non-natives); language studies, public speaking, literature
Mathematics: mathematics, mathematics with statistics, geometry, algebra, etc.
Science: science, physics, physical science, chemistry, biology, human biology, environmental science, agriculture/horticulture/forestry
Social studies: social studies, community studies, contemporary studies, economics, environmental studies, geography, history, humanities, legal studies, studies of the own country, social sciences, ethical thinking, philosophy
Modern foreign languages: languages different from the language of instruction
Ancient Greek and/or Latin
Technology: orientation in technology, construction/surveying, electronics, graphics and design, workshop technology/design technology
Information and Communication Technology (ICT) and/or Computer Studies: information technology, computer studies, keyboard skills, word processing
Arts: arts, music, visual arts, practical art, drama, performance music, photography, drawing, creative handicraft, creative needlework
Physical education: physical education, gymnastics, dance, health
Religion and/or ethics: religion, history of religions, religion culture, ethics
Practical and vocational skills: vocational skills (preparation for a specific occupation), technics, domestic science, accountancy, business studies, career education, clothing and textiles, driving, home economics, polytechnic courses, secretarial studies, tourism and hospitality, handicraft
Interdisciplinary subject: integration of content and perspective of several traditional school subjects

164
Teaching and Learning International Survey – Australian Report
In secondary education
/ post-secondary,
non-tertiary education or less OR
Voc. Training Certificate, TAFE, Trade Certificate
In undergraduate
Diploma, Bachelor
Degree, Grad. Diploma/
Certificate, Master’s Degree,
Doctorate or above
In subject specialisation
as part of the teacher
training
At the in-service or
professional development
stage
a) Reading, writing and literature 1 1 1 1
b) Mathematics 1 1 1 1
c) Science 1 1 1 1
d) Social studies 1 1 1 1
e) Modern foreign languages 1 1 1 1
f) Ancient Greek and/or Latin 1 1 1 1
g) Technology 1 1 1 1
h) ICT and/or Computer Studies 1 1 1 1
i) Arts 1 1 1 1
j) Physical education 1 1 1 1
k) Religion and/or ethics 1 1 1 1
l) Practical and vocational skills 1 1 1 1
m) Interdisciplinary subject 1 1 1 1
n) Other (please specify below) 1 1 1 1
16. During this current school year, do you teach the subjects below to any Year 7 – 10 students in this school?Please mark one choice in each row. Yes No
a) Reading, writing and literature 1 2
b) Mathematics 1 2
c) Science 1 2
d) Social studies 1 2
e) Modern foreign languages 1 2
f) Ancient Greek and/or Latin 1 2
g) Technology 1 2
h) ICT and/or Computer Studies 1 2
i) Arts 1 2
j) Physical education 1 2
k) Religion and/or ethics 1 2
l) Practical and vocational skills 1 2
m) Other 1 2

165
Teaching and Learning International Survey – Australian Report
17. During your most recent complete calendar week, approximately how many 60-minute hours did you spend in total on teaching, planning lessons, marking, collaborating with other teachers, participating in staff meetings and on other tasks related to your job at this school?A ‘complete’ calendar week is one that was not shortened by breaks, public holidays, sick leave, etc. Also include tasks that took place during weekends, evenings or other off classroom hours. Round to the nearest whole hour.
Hours
18. Of this total, how many 60-minute hours did you spend on teaching during your most recent complete calendar week?Please only count actual teaching time.Time spent on preparation, marking, etc. will be recorded in Question 19.
Hours
19. As a teacher of this school, during your most recent complete calendar week, how many 60-minute hours did you spend on the following tasks? Also include tasks that took place during weekends, evenings or other off classroom hours. Please exclude all time spent teaching as this was recorded in the previous question.Rough estimates are sufficient.If you did not perform the task during the most recent complete calendar week, write 0 (zero).a) Individual planning or preparation of lessons either at school or out of schoolb) Team work and dialogue with colleagues within this schoolc) Marking/correcting of student workd) Students counselling (including student supervision, virtual counselling, career
guidance and delinquency guidance)e) Participation in school managementf) General administrative work (including communication, paperwork and other
clerical duties you undertake in your job as a teacher)g) Communication and co-operation with parents or guardiansh) Engaging in extracurricular activities (e.g. sports and cultural activities after
school)i) Other tasks
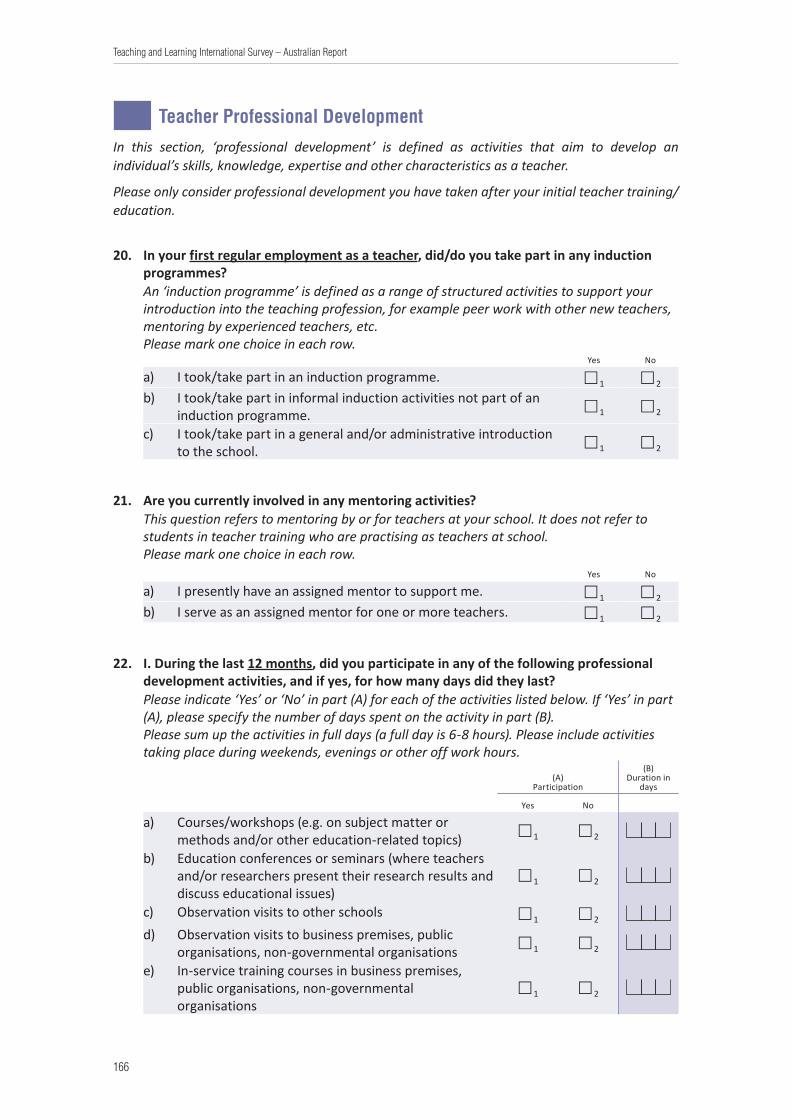
166
Teaching and Learning International Survey – Australian Report
Teacher Professional DevelopmentIn this section, ‘professional development’ is defined as activities that aim to develop an individual’s skills, knowledge, expertise and other characteristics as a teacher.
Please only consider professional development you have taken after your initial teacher training/education.
20. In your first regular employment as a teacher, did/do you take part in any induction programmes?An ‘induction programme’ is defined as a range of structured activities to support your introduction into the teaching profession, for example peer work with other new teachers, mentoring by experienced teachers, etc.Please mark one choice in each row.
Yes No
a) I took/take part in an induction programme. 1 2
b) I took/take part in informal induction activities not part of an induction programme. 1 2
c) I took/take part in a general and/or administrative introduction to the school. 1 2
21. Are you currently involved in any mentoring activities?This question refers to mentoring by or for teachers at your school. It does not refer to students in teacher training who are practising as teachers at school.Please mark one choice in each row.
Yes No
a) I presently have an assigned mentor to support me. 1 2
b) I serve as an assigned mentor for one or more teachers. 1 2
22. I. During the last 12 months, did you participate in any of the following professional development activities, and if yes, for how many days did they last?Please indicate ‘Yes’ or ‘No’ in part (A) for each of the activities listed below. If ‘Yes’ in part (A), please specify the number of days spent on the activity in part (B).Please sum up the activities in full days (a full day is 6-8 hours). Please include activities taking place during weekends, evenings or other off work hours.
(A)Participation
(B)Duration in
days
Yes No
a) Courses/workshops (e.g. on subject matter or methods and/or other education-related topics) 1 2
b) Education conferences or seminars (where teachers and/or researchers present their research results and discuss educational issues)
1 2
c) Observation visits to other schools 1 2
d) Observation visits to business premises, public organisations, non-governmental organisations 1 2
e) In-service training courses in business premises, public organisations, non-governmental organisations
1 2
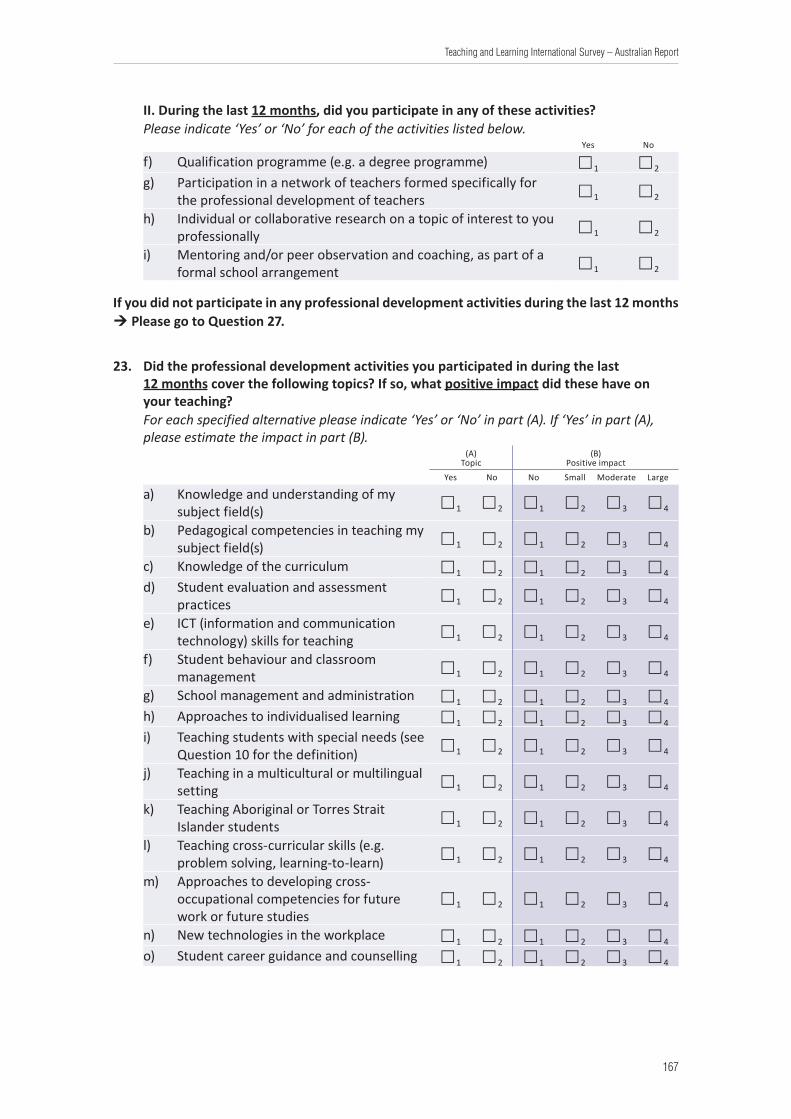
167
Teaching and Learning International Survey – Australian Report
II. During the last 12 months, did you participate in any of these activities?Please indicate ‘Yes’ or ‘No’ for each of the activities listed below.
Yes No
f) Qualification programme (e.g. a degree programme) 1 2
g) Participation in a network of teachers formed specifically for the professional development of teachers 1 2
h) Individual or collaborative research on a topic of interest to you professionally 1 2
i) Mentoring and/or peer observation and coaching, as part of a formal school arrangement 1 2
If you did not participate in any professional development activities during the last 12 months Please go to Question 27.
23. Did the professional development activities you participated in during the last 12 months cover the following topics? If so, what positive impact did these have on your teaching?For each specified alternative please indicate ‘Yes’ or ‘No’ in part (A). If ‘Yes’ in part (A), please estimate the impact in part (B).
(A)Topic
(B)Positive impact
Yes No No Small Moderate Large
a) Knowledge and understanding of my subject field(s) 1 2 1 2 3 4
b) Pedagogical competencies in teaching my subject field(s) 1 2 1 2 3 4
c) Knowledge of the curriculum 1 2 1 2 3 4
d) Student evaluation and assessment practices 1 2 1 2 3 4
e) ICT (information and communication technology) skills for teaching 1 2 1 2 3 4
f) Student behaviour and classroom management 1 2 1 2 3 4
g) School management and administration 1 2 1 2 3 4
h) Approaches to individualised learning 1 2 1 2 3 4
i) Teaching students with special needs (see Question 10 for the definition) 1 2 1 2 3 4
j) Teaching in a multicultural or multilingual setting 1 2 1 2 3 4
k) Teaching Aboriginal or Torres Strait Islander students 1 2 1 2 3 4
l) Teaching cross-curricular skills (e.g. problem solving, learning-to-learn) 1 2 1 2 3 4
m) Approaches to developing cross-occupational competencies for future work or future studies
1 2 1 2 3 4
n) New technologies in the workplace 1 2 1 2 3 4
o) Student career guidance and counselling 1 2 1 2 3 4

168
Teaching and Learning International Survey – Australian Report
24. For the professional development in which you participated in the last 12 months, how much did you personally have to pay for?Please mark one choice.1 None
2 Some
3 All
25. For the professional development in which you participated in the last 12 months, did you receive any of the following support?Please mark one choice in each row.
Yes No
a) I received scheduled time for activities that took place during regular working hours at this school. 1 2
b) I received a salary supplement for activities outside working hours. 1 2
c) I received non-monetary support for activities outside working hours (reduced teaching, days off, study leave, etc.). 1 2
26. Considering the professional development activities you took part in during the last 12 months, to what extent have they included the following?Please mark one choice in each row.
Not in any activities
Yes, in some activities
Yes, in most activities
Yes, in all activities
a) A group of colleagues from my school or subject group 1 2 3 4
b) Opportunities for active learning methods (not only listening to a lecturer) 1 2 3 4
c) Collaborative learning activities or research with other teachers 1 2 3 4
d) An extended time-period (several occasions spread out over several weeks or months) 1 2 3 4

169
Teaching and Learning International Survey – Australian Report
27. For each of the areas listed below, please indicate the degree to which you currently need professional development.Please mark one choice in each row.
No need at present
Low level of need
Moderate level of
needHigh level of
need
a) Knowledge and understanding of my subject field(s) 1 2 3 4
b) Pedagogical competencies in teaching my subject field(s) 1 2 3 4
c) Knowledge of the curriculum 1 2 3 4
d) Student evaluation and assessment practice 1 2 3 4
e) ICT (information and communication technology) skills for teaching 1 2 3 4
f) Student behaviour and classroom management 1 2 3 4
g) School management and administration 1 2 3 4
h) Approaches to individualised learning 1 2 3 4
i) Teaching students with special needs (see Question 10 for the definition) 1 2 3 4
j) Teaching in a multicultural or multilingual setting 1 2 3 4
k) Teaching Aboriginal or Torres Strait Islander students 1 2 3 4
l) Teaching cross-curricular skills (e.g. problem solving, learning-to-learn) 1 2 3 4
m) Approaches to developing cross-occupational competencies for future work or future studies
1 2 3 4
n) New technologies in the workplace 1 2 3 4
o) Student career guidance and counselling 1 2 3 4
28. How strongly do you agree or disagree that the following present barriers to your participation in professional development?Please mark one choice in each row.
Strongly disagree Disagree Agree
Strongly agree
a) I do not have the pre-requisites (e.g. qualifications, experience, seniority). 1 2 3 4
b) Professional development is too expensive/unaffordable. 1 2 3 4
c) There is a lack of employer support. 1 2 3 4
d) Professional development conflicts with my work schedule. 1 2 3 4
e) I do not have time because of family responsibilities. 1 2 3 4
f) There is no relevant professional development offered. 1 2 3 4
g) There are no incentives for participating in such activities. 1 2 3 4
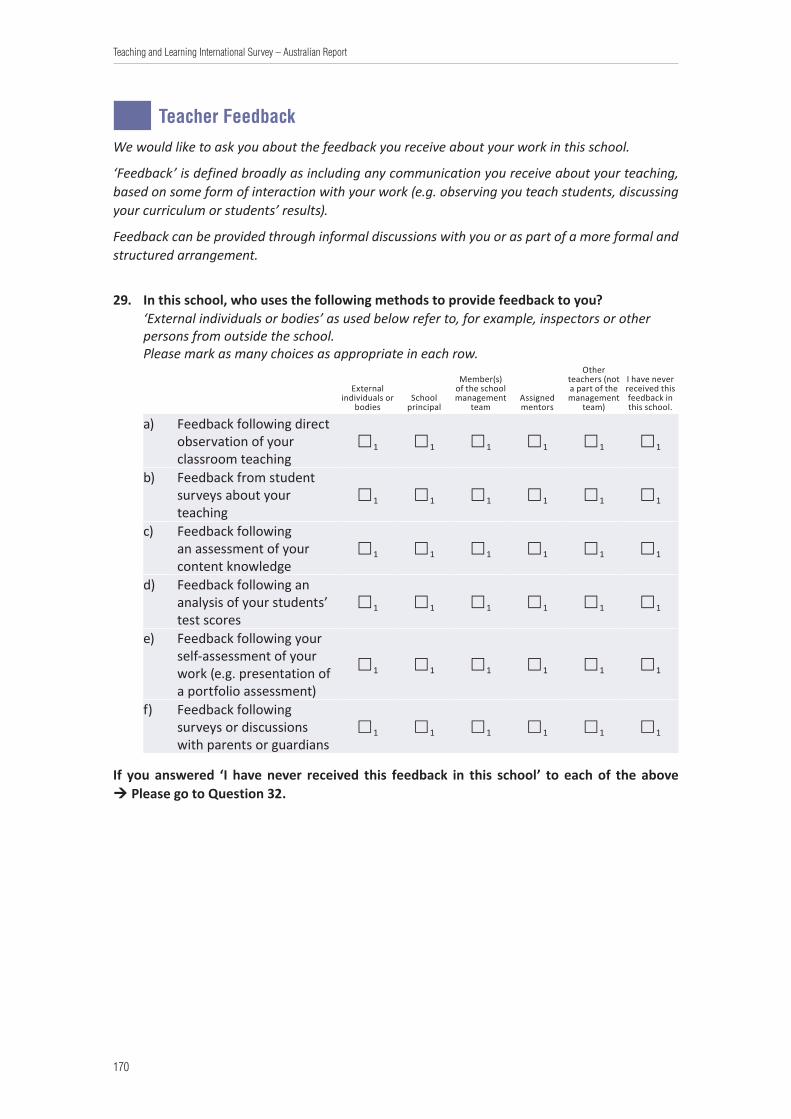
170
Teaching and Learning International Survey – Australian Report
Teacher FeedbackWe would like to ask you about the feedback you receive about your work in this school.
‘Feedback’ is defined broadly as including any communication you receive about your teaching, based on some form of interaction with your work (e.g. observing you teach students, discussing your curriculum or students’ results).
Feedback can be provided through informal discussions with you or as part of a more formal and structured arrangement.
29. In this school, who uses the following methods to provide feedback to you?‘External individuals or bodies’ as used below refer to, for example, inspectors or other persons from outside the school.Please mark as many choices as appropriate in each row.
External individuals or
bodies School
principal
Member(s) of the school management
team Assigned mentors
Other teachers (not a part of the management
team)
I have never received this feedback in this school.
a) Feedback following direct observation of your classroom teaching
1 1 1 1 1 1
b) Feedback from student surveys about your teaching
1 1 1 1 1 1
c) Feedback following an assessment of your content knowledge
1 1 1 1 1 1
d) Feedback following an analysis of your students’ test scores
1 1 1 1 1 1
e) Feedback following your self-assessment of your work (e.g. presentation of a portfolio assessment)
1 1 1 1 1 1
f) Feedback following surveys or discussions with parents or guardians
1 1 1 1 1 1
If you answered ‘I have never received this feedback in this school’ to each of the above Please go to Question 32.
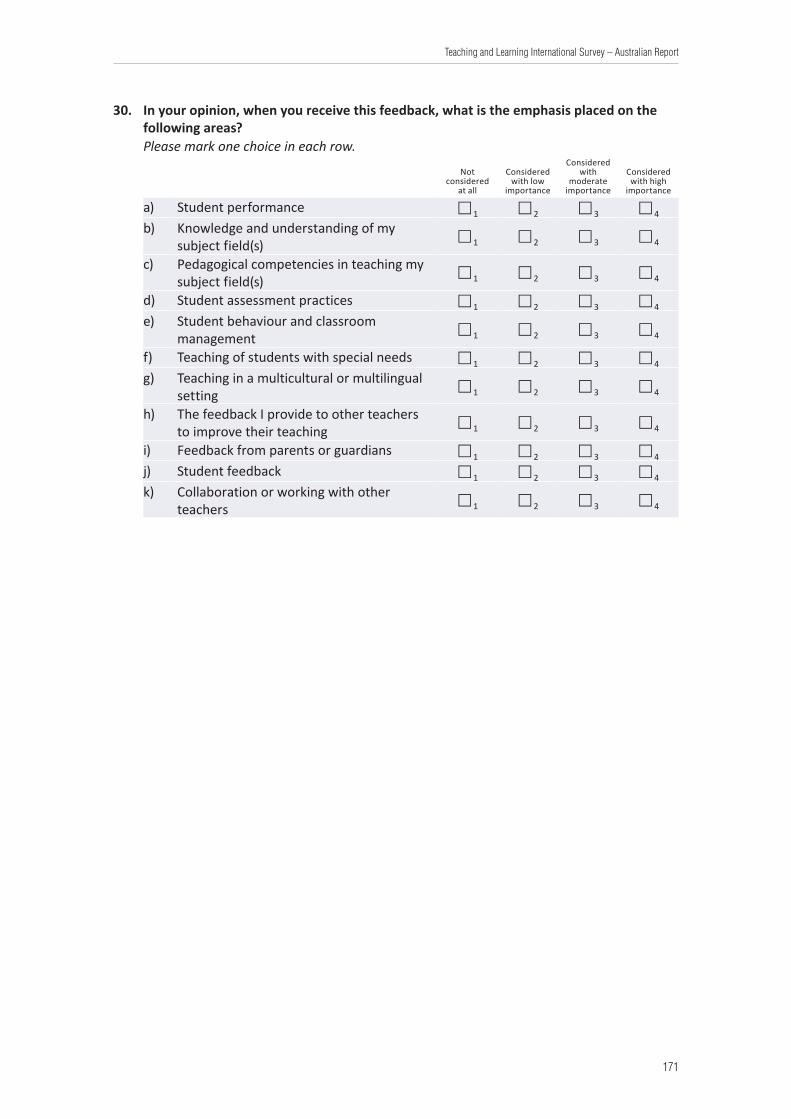
171
Teaching and Learning International Survey – Australian Report
30. In your opinion, when you receive this feedback, what is the emphasis placed on the following areas?Please mark one choice in each row.
Not considered
at all
Considered with low
importance
Considered with
moderate importance
Considered with high
importance
a) Student performance 1 2 3 4
b) Knowledge and understanding of my subject field(s) 1 2 3 4
c) Pedagogical competencies in teaching my subject field(s) 1 2 3 4
d) Student assessment practices 1 2 3 4
e) Student behaviour and classroom management 1 2 3 4
f) Teaching of students with special needs 1 2 3 4
g) Teaching in a multicultural or multilingual setting 1 2 3 4
h) The feedback I provide to other teachers to improve their teaching 1 2 3 4
i) Feedback from parents or guardians 1 2 3 4
j) Student feedback 1 2 3 4
k) Collaboration or working with other teachers 1 2 3 4
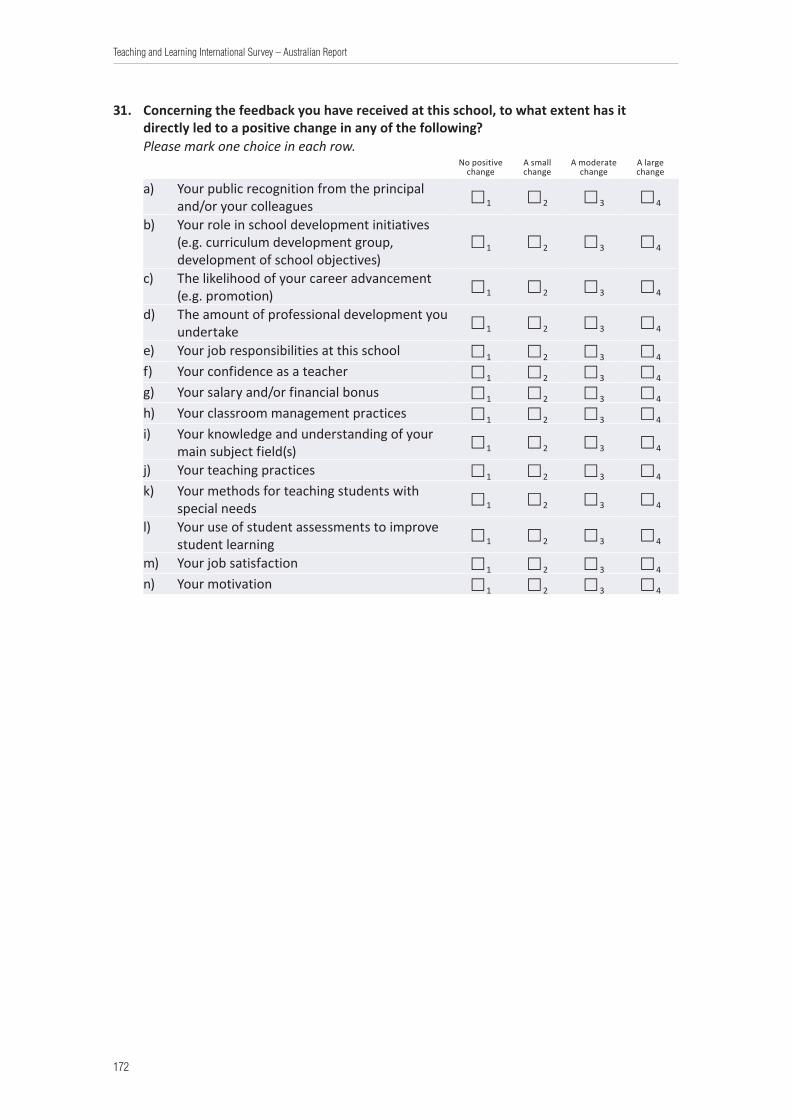
172
Teaching and Learning International Survey – Australian Report
31. Concerning the feedback you have received at this school, to what extent has it directly led to a positive change in any of the following?Please mark one choice in each row.
No positive change
A small change
A moderate change
A large change
a) Your public recognition from the principal and/or your colleagues 1 2 3 4
b) Your role in school development initiatives (e.g. curriculum development group, development of school objectives)
1 2 3 4
c) The likelihood of your career advancement (e.g. promotion) 1 2 3 4
d) The amount of professional development you undertake 1 2 3 4
e) Your job responsibilities at this school 1 2 3 4
f) Your confidence as a teacher 1 2 3 4
g) Your salary and/or financial bonus 1 2 3 4
h) Your classroom management practices 1 2 3 4
i) Your knowledge and understanding of your main subject field(s) 1 2 3 4
j) Your teaching practices 1 2 3 4
k) Your methods for teaching students with special needs 1 2 3 4
l) Your use of student assessments to improve student learning 1 2 3 4
m) Your job satisfaction 1 2 3 4
n) Your motivation 1 2 3 4

173
Teaching and Learning International Survey – Australian Report
32. We would now like to ask you about teacher appraisal and feedback in this school more generally. How strongly do you agree or disagree with the following statements about this school?Here, ‘appraisal’ is defined as review of teachers’ work. This appraisal can be conducted in a range of ways from a more formal approach (e.g. as part of a formal performance management system, involving set procedures and criteria) to a more informal approach (e.g. through informal discussions).When a statement does not apply in your context, please omit the item.Please mark one choice in each row.
Strongly disagree Disagree Agree
Strongly agree
a) The best performing teachers in this school receive the greatest recognition (e.g. rewards, additional training or responsibilities).
1 2 3 4
b) Teacher appraisal and feedback have little impact upon the way teachers teach in the classroom.
1 2 3 4
c) Teacher appraisal and feedback are largely done to fulfil administrative requirements. 1 2 3 4
d) A development or training plan is established for teachers to improve their work as a teacher.
1 2 3 4
e) Feedback is provided to teachers based on a thorough assessment of their teaching. 1 2 3 4
f) If a teacher is consistently under-performing, he/she would be dismissed. 1 2 3 4
g) Measures to remedy any weaknesses in teaching are discussed with the teacher. 1 2 3 4
h) A mentor is appointed to help the teacher improve his/her teaching. 1 2 3 4

174
Teaching and Learning International Survey – Australian Report
Your Teaching in General
33. We would like to ask about your personal beliefs on teaching and learning. Please indicate how strongly you agree or disagree with each of the following statements.Please mark one choice in each row.
Strongly disagree Disagree Agree
Strongly agree
a) My role as a teacher is to facilitate students’ own inquiry. 1 2 3 4
b) Students learn best by finding solutions to problems on their own. 1 2 3 4
c) Students should be allowed to think of solutions to practical problems themselves before the teacher shows them how they are solved.
1 2 3 4
d) Thinking and reasoning processes are more important than specific curriculum content. 1 2 3 4
34. On average, how often do you do the following in this school?Please mark one choice in each row.
Never
Once a year or
less2-4 times
a year
5-10 times a
year1-3 times a month
Once a week or
more
a) Teach jointly as a team in the same class 1 2 3 4 5 6
b) Observe other teachers’ classes and provide feedback 1 2 3 4 5 6
c) Engage in joint activities across different classes and age groups (e.g. projects)
1 2 3 4 5 6
d) Exchange teaching materials with colleagues 1 2 3 4 5 6
e) Engage in discussions about the learning development of specific students
1 2 3 4 5 6
f) Work with other teachers in my school to ensure common standards in evaluations for assessing student progress
1 2 3 4 5 6
g) Attend team conferences 1 2 3 4 5 6
h) Take part in collaborative professional learning 1 2 3 4 5 6
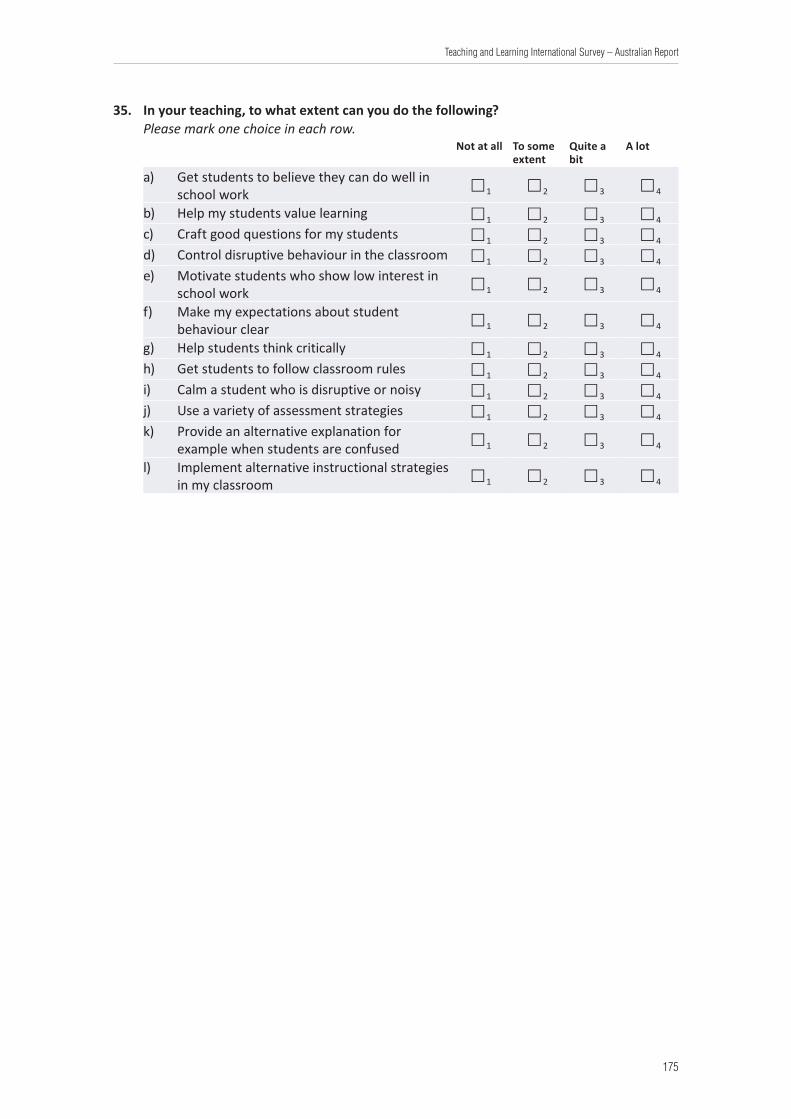
175
Teaching and Learning International Survey – Australian Report
35. In your teaching, to what extent can you do the following?Please mark one choice in each row.
Not at all To some extent
Quite a bit
A lot
a) Get students to believe they can do well in school work 1 2 3 4
b) Help my students value learning 1 2 3 4
c) Craft good questions for my students 1 2 3 4
d) Control disruptive behaviour in the classroom 1 2 3 4
e) Motivate students who show low interest in school work 1 2 3 4
f) Make my expectations about student behaviour clear 1 2 3 4
g) Help students think critically 1 2 3 4
h) Get students to follow classroom rules 1 2 3 4
i) Calm a student who is disruptive or noisy 1 2 3 4
j) Use a variety of assessment strategies 1 2 3 4
k) Provide an alternative explanation for example when students are confused 1 2 3 4
l) Implement alternative instructional strategies in my classroom 1 2 3 4
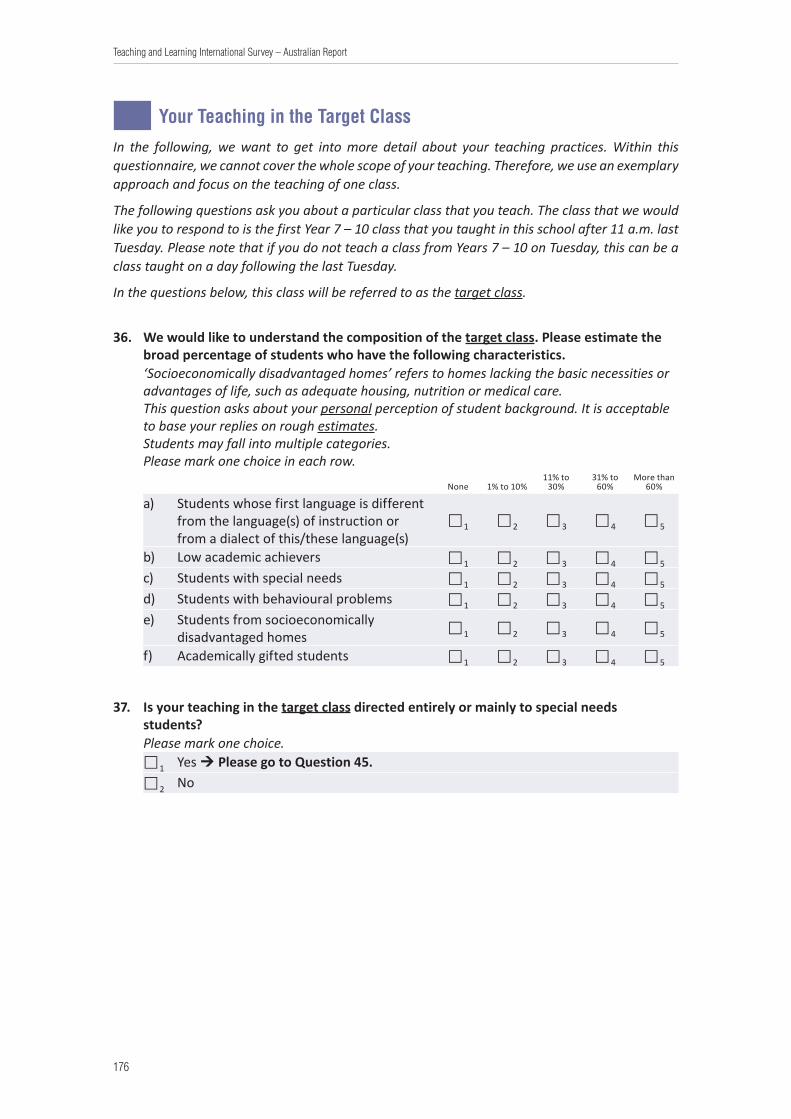
176
Teaching and Learning International Survey – Australian Report
Your Teaching in the Target ClassIn the following, we want to get into more detail about your teaching practices. Within this questionnaire, we cannot cover the whole scope of your teaching. Therefore, we use an exemplary approach and focus on the teaching of one class.
The following questions ask you about a particular class that you teach. The class that we would like you to respond to is the first Year 7 – 10 class that you taught in this school after 11 a.m. last Tuesday. Please note that if you do not teach a class from Years 7 – 10 on Tuesday, this can be a class taught on a day following the last Tuesday.
In the questions below, this class will be referred to as the target class.
36. We would like to understand the composition of the target class. Please estimate the broad percentage of students who have the following characteristics.‘Socioeconomically disadvantaged homes’ refers to homes lacking the basic necessities or advantages of life, such as adequate housing, nutrition or medical care.This question asks about your personal perception of student background. It is acceptable to base your replies on rough estimates.Students may fall into multiple categories.Please mark one choice in each row.
None 1% to 10%11% to
30%31% to
60%More than
60%
a) Students whose first language is different from the language(s) of instruction or from a dialect of this/these language(s)
1 2 3 4 5
b) Low academic achievers 1 2 3 4 5
c) Students with special needs 1 2 3 4 5
d) Students with behavioural problems 1 2 3 4 5
e) Students from socioeconomically disadvantaged homes 1 2 3 4 5
f) Academically gifted students 1 2 3 4 5
37. Is your teaching in the target class directed entirely or mainly to special needs students?Please mark one choice.1 Yes Please go to Question 45.2 No
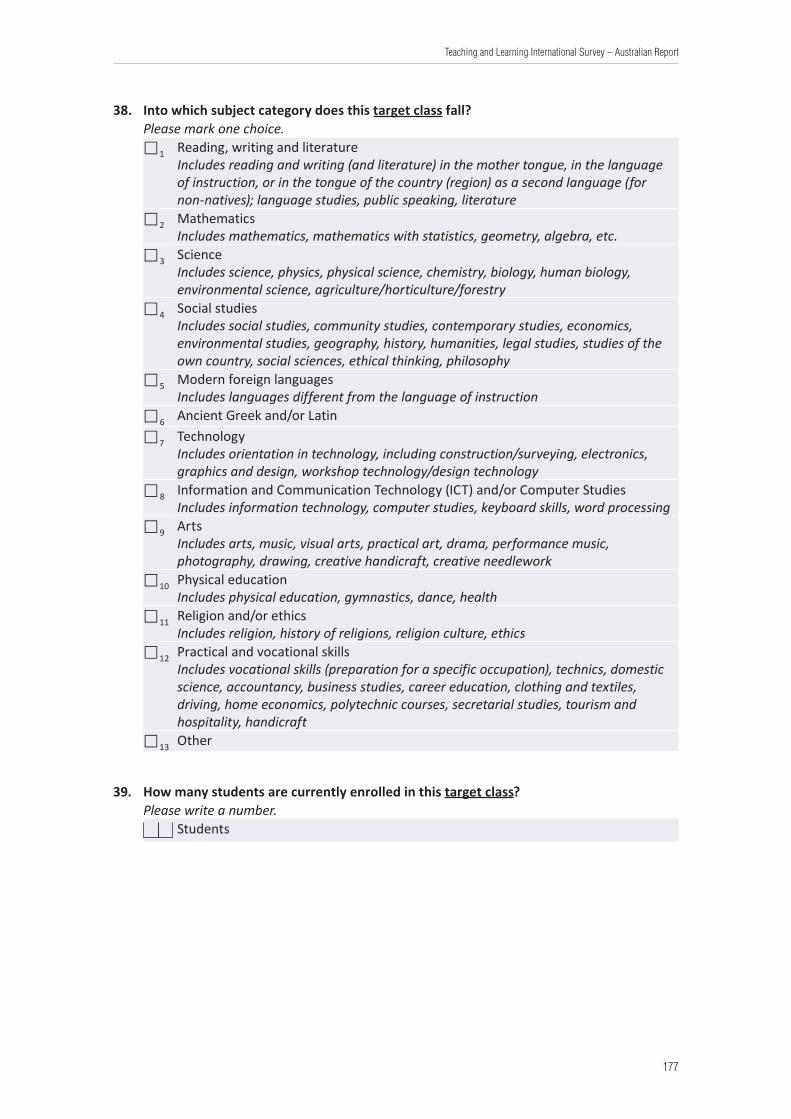
177
Teaching and Learning International Survey – Australian Report
38. Into which subject category does this target class fall?Please mark one choice.1 Reading, writing and literature
Includes reading and writing (and literature) in the mother tongue, in the language of instruction, or in the tongue of the country (region) as a second language (for non-natives); language studies, public speaking, literature
2 MathematicsIncludes mathematics, mathematics with statistics, geometry, algebra, etc.
3 ScienceIncludes science, physics, physical science, chemistry, biology, human biology, environmental science, agriculture/horticulture/forestry
4 Social studiesIncludes social studies, community studies, contemporary studies, economics, environmental studies, geography, history, humanities, legal studies, studies of the own country, social sciences, ethical thinking, philosophy
5 Modern foreign languagesIncludes languages different from the language of instruction
6 Ancient Greek and/or Latin
7 TechnologyIncludes orientation in technology, including construction/surveying, electronics, graphics and design, workshop technology/design technology
8 Information and Communication Technology (ICT) and/or Computer StudiesIncludes information technology, computer studies, keyboard skills, word processing
9 ArtsIncludes arts, music, visual arts, practical art, drama, performance music, photography, drawing, creative handicraft, creative needlework
10 Physical educationIncludes physical education, gymnastics, dance, health
11 Religion and/or ethicsIncludes religion, history of religions, religion culture, ethics
12 Practical and vocational skillsIncludes vocational skills (preparation for a specific occupation), technics, domestic science, accountancy, business studies, career education, clothing and textiles, driving, home economics, polytechnic courses, secretarial studies, tourism and hospitality, handicraft
13 Other
39. How many students are currently enrolled in this target class?Please write a number.
Students
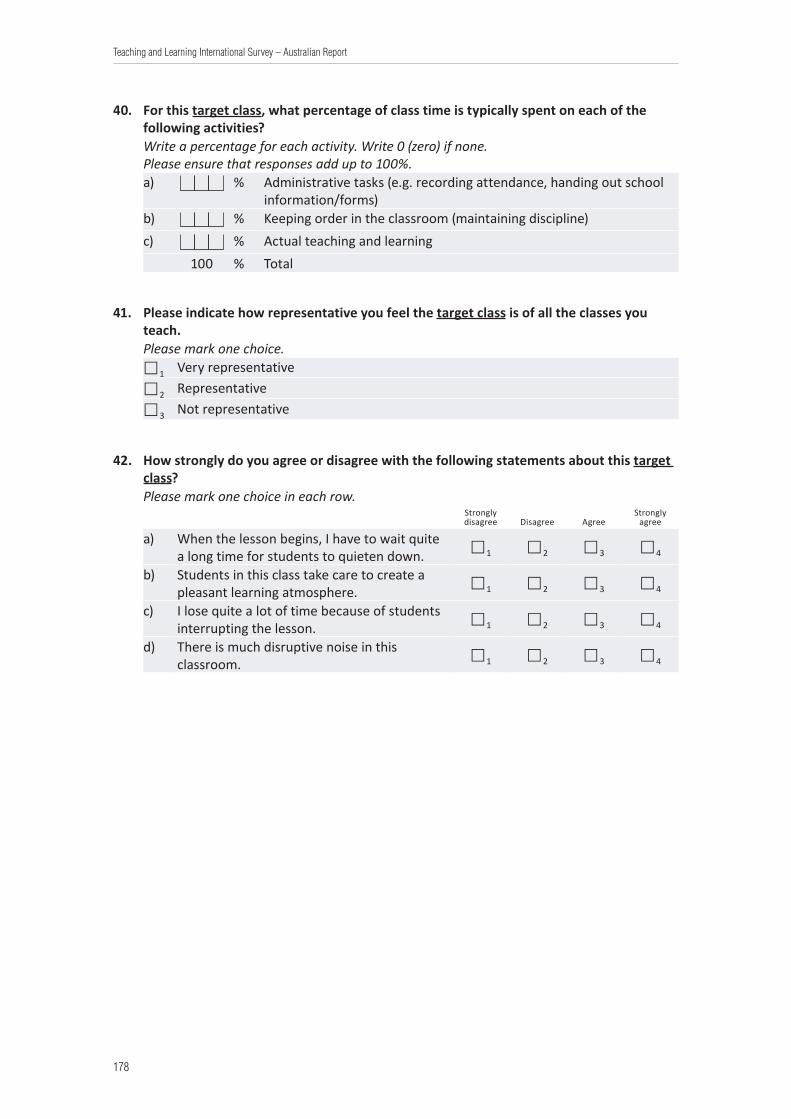
178
Teaching and Learning International Survey – Australian Report
40. For this target class, what percentage of class time is typically spent on each of the following activities? Write a percentage for each activity. Write 0 (zero) if none.Please ensure that responses add up to 100%.a) % Administrative tasks (e.g. recording attendance, handing out school
information/forms)b) % Keeping order in the classroom (maintaining discipline)c) % Actual teaching and learning
100 % Total
41. Please indicate how representative you feel the target class is of all the classes you teach.Please mark one choice.1 Very representative
2 Representative
3 Not representative
42. How strongly do you agree or disagree with the following statements about this target class?Please mark one choice in each row.
Strongly disagree Disagree Agree
Strongly agree
a) When the lesson begins, I have to wait quite a long time for students to quieten down. 1 2 3 4
b) Students in this class take care to create a pleasant learning atmosphere. 1 2 3 4
c) I lose quite a lot of time because of students interrupting the lesson. 1 2 3 4
d) There is much disruptive noise in this classroom. 1 2 3 4

179
Teaching and Learning International Survey – Australian Report
43. How often does each of the following happen in the target class throughout the school year?Please mark one choice in each row.
Never or almost never Occasionally Frequently
In all or nearly all lessons
a) I present a summary of recently learned content. 1 2 3 4
b) Students work in small groups to come up with a joint solution to a problem or task. 1 2 3 4
c) I give different work to the students who have difficulties learning and/or to those who can advance faster.
1 2 3 4
d) I refer to a problem from everyday life or work to demonstrate why new knowledge is useful.
1 2 3 4
e) I let students practice similar tasks until I know that every student has understood the subject matter.
1 2 3 4
f) I check my students’ exercise books or homework. 1 2 3 4
g) Students work on projects that require at least one week to complete. 1 2 3 4
h) Students use ICT (information and communication technology) for projects or class work.
1 2 3 4
44. How often do you use the following methods of assessing student learning in the target class?Please mark one choice in each row.
Never or almost never Occasionally Frequently
In all or nearly all lessons
a) I develop and administer my own assessment. 1 2 3 4
b) I administer a standardised test. 1 2 3 4
c) I have individual students answer questions in front of the class. 1 2 3 4
d) I provide written feedback on student work in addition to a mark, i.e. numeric score or letter grade.
1 2 3 4
e) I let students evaluate their own progress. 1 2 3 4
f) I observe students when working on particular tasks and provide immediate feedback.
1 2 3 4
180
Teaching and Learning International Survey – Australian Report
School Climate and Job Satisfaction
45. How strongly do you agree or disagree with these statements as applied to this school?Please mark one choice in each row.
Strongly disagree Disagree Agree
Strongly agree
a) This school provides staff with opportunities to actively participate in school decisions. 1 2 3 4
b) This school provides parents or guardians with opportunities to actively participate in school decisions.
1 2 3 4
c) This school provides students with opportunities to actively participate in school decisions.
1 2 3 4
d) This school has a culture of shared responsibility for school issues. 1 2 3 4
e) There is a collaborative school culture which is characterised by mutual support. 1 2 3 4
46. How strongly do you agree or disagree with the following statements about what happens in this school?Please mark one choice in each row.
Strongly disagree Disagree Agree
Strongly agree
a) In this school, teachers and students usually get on well with each other. 1 2 3 4
b) Most teachers in this school believe that the students’ well-being is important. 1 2 3 4
c) Most teachers in this school are interested in what students have to say. 1 2 3 4
d) If a student from this school needs extra assistance, the school provides it. 1 2 3 4
181
Teaching and Learning International Survey – Australian Report
47. We would like to know how you generally feel about your job. How strongly do you agree or disagree with the following statements?Please mark one choice in each row.
Strongly disagree Disagree Agree
Strongly agree
a) The advantages of being a teacher clearly outweigh the disadvantages. 1 2 3 4
b) If I could decide again, I would still choose to work as a teacher. 1 2 3 4
c) I would like to change to another school if that were possible. 1 2 3 4
d) I regret that I decided to become a teacher. 1 2 3 4
e) I enjoy working at this school. 1 2 3 4
f) I wonder whether it would have been better to choose another profession. 1 2 3 4
g) I would recommend my school as a good place to work. 1 2 3 4
h) I think that the teaching profession is valued in society. 1 2 3 4
i) I am satisfied with my performance in this school. 1 2 3 4
j) All in all, I am satisfied with my job. 1 2 3 4
182
Teaching and Learning International Survey – Australian Report
Teacher MobilityWe would like to know if you have travelled abroad for professional purposes.
Please consider only travel for a week or more at educational institutions or schools. Do not consider conferences or workshops.
48. Have you ever been abroad for professional purposes in your career as a teacher or during your teacher education/training?Please mark as many choices as appropriate.1 No Please go to the end of the questionnaire.1 Yes, as a student as part of my teacher education
1 Yes, as a teacher in a regional or national programme
1 Yes, as a teacher as arranged by my school or school district
1 Yes, as a teacher by my own initiative
49. If yes in the previous question, what were the purpose(s) of your visit(s) abroad?Please mark as many choices as appropriate.1 Studying, as part of your teacher education
1 Language learning
1 Learning of other subject areas
1 Accompanying visiting students
1 Establishing contact with schools abroad
1 Teaching
1 Other
50. If yes to Question 48, to which country/countries did you travel abroad for professional purposes in your career as a teacher or during your teacher education/training?Please mark as many choices as appropriate.1 New Zealand
1 India
1 South Africa
1 United Kingdom
1 United States
1 Canada
1 Other (please specify) ___________________________________
This is the end of the questionnaire.
Thank you very much for your participation.Please mail this questionnaire to ACER using the enclosed prepaid envelope
by 30 November 2012.
183
Teaching and Learning International Survey – Australian Report
Appendix C:TALIS Principal Questionnaire
Placeholder for idenitication label
Organisation for Economic Co-operation and Development (OECD)Teaching and Learning International Survey (TALIS) 2013
Principal QuestionnaireYears 7 – 10Main Study VersionInternational English, Australian Spelling
National Study Centre:Australian Council for Educational Research (ACER)
1/140 Bourke Road Alexandria NSW 2015, Australia
International Project Consortium:International Association for the Evaluation of Educational Achievement (IEA), The Netherlands
IEA Data Processing and Research Center (IEA DPC), GermanyStatistics Canada, Canada
184
Teaching and Learning International Survey – Australian Report
About TALIS 2013The second Teaching and Learning International Survey (TALIS 2013) is an international survey that offers the opportunity for teachers and principals to provide input into education analysis and policy development. TALIS is being conducted by the Organisation for Economic Co-operation and Development (OECD), and Australia, along with more than 30 other countries, is taking part in the survey.
Cross-country analysis of this data will allow countries to identify other countries facing similar challenges and to learn from other policy approaches. School principals and teachers will provide information about issues such as the professional development they have received; their teaching beliefs and practices; the review of teachers’ work and the feedback and recognition they receive about their work; and various other workplace issues such as school leadership and school climate.
Being an international survey, it is possible that some questions do not fit very well within your national context. In these cases, please answer as best as you can.
ConfidentialityAll information that is collected in this study will be treated confidentially. While results will be made available by country and by type of school within a country, you are guaranteed that neither you, this school, nor any school personnel will be identified in any report of the results of the study.
About the Questionnaire• This questionnaire asks for information about school education and policy matters.
• The person who completes this questionnaire should be the principal of this school. If you do not have the information to answer particular questions, please consult other persons in this school.
• This questionnaire should take approximately 30 to 45 minutes to complete.
• Guidelines for answering the questions are typed in italics. Most questions can be answered by marking the one most appropriate answer.
• When you have completed this questionnaire, please mail it to ACER using the enclosed prepaid envelope by 30 November 2012.
• When in doubt about any aspect of the questionnaire, or if you would like more information about the questionnaire or the study, you can reach us by using the following contact details: Australian Council for Educational Research (ACER), 1800 762 022 or [email protected]
Thank you very much for your participation.
185
Teaching and Learning International Survey – Australian Report
Personal Background InformationThese questions are about you, your education and your position as school principal. In responding to the questions, please mark the appropriate choice(s) or provide figures where necessary.
1. Are you female or male?1 Female
2 Male
2. How old are you?Please write a number.
Years
3. Do you identify as being of Aboriginal or Torres Strait Islander origin?1 No
2 Yes, Aboriginal
3 Yes, Torres Strait Islander
4 Yes, both Aboriginal and Torres Strait Islander
4. What is the highest level of formal education you have completed?Please mark one choice.1 Secondary education / post-secondary, non-tertiary education or less (e.g. Year 10
or Year 12 exit qualification) or below2 First stage of tertiary education not leading to an advanced research qualification
including programmes that are generally more practical/technical/occupation specific (e.g. Vocational Training Certificate, TAFE, Trade Certificate)
3 Undergraduate Diploma
4 Bachelor Degree
5 Graduate Diploma/Graduate Certificate
6 Master’s Degree
7 Doctorate
5. How many years of work experience do you have? Please write a number in each row. Write 0 (zero) if none.Count part of a year as 1 year.a) Year(s) working as a principal at this schoolb) Year(s) working as a principal in totalc) Year(s) working in other school management roles (do not include years
working as a principal)d) Year(s) working as a teacher in total (include any years of teaching) e) Year(s) working in other jobs
186
Teaching and Learning International Survey – Australian Report
6. What is your current employment status as a principal?Please mark one choice.1 Full-time (90% or more of full-time hours) without teaching obligation
2 Full-time (90% or more of full-time hours) with teaching obligation
3 Part-time (less than 90% of full-time hours) without teaching obligation
4 Part-time (less than 90% of full-time hours) with teaching obligation
7. Did the formal education you completed include the following and, if yes, was this before or after you took up a position as principal?Please mark one choice in each row.
Before AfterBefore and
after Never
a) School administration or principal training programme or course 1 2 3 4
b) Teacher training/education programme or course 1 2 3 4
c) Instructional leadership training or course 1 2 3 4
8. During the last 12 months, did you participate in any of the following professional development activities aimed at you as a principal, and if yes, for how many days?Professional development is defined as activities that aim to develop an individual’s professional skills and knowledge.Please indicate ‘Yes’ or ‘No’ in part (A) for each of the activities listed below. If ‘Yes’ in part (A), please specify the number of days spent on the activity in part (B).Please sum up activities in full days (a full day is 6-8 hours). Please include activities taking place during weekends, evenings or other off work hours.
(A)Participation
(B)Duration in
days
Yes No
a) In a professional network, mentoring or research activity 1 2
b) In courses, conferences or observational visits 1 2
c) Other 1 2
187
Teaching and Learning International Survey – Australian Report
9. How strongly do you agree or disagree that the following present barriers to your participation in professional development?Please mark one choice in each row.
Strongly disagree Disagree Agree
Strongly agree
a) I do not have the pre-requisites (e.g. qualifications, experience, seniority). 1 2 3 4
b) Professional development is too expensive/unaffordable. 1 2 3 4
c) There is a lack of employer support. 1 2 3 4
d) Professional development conflicts with my work schedule. 1 2 3 4
e) I do not have time because of family responsibilities. 1 2 3 4
f) There is no relevant professional development offered. 1 2 3 4
g) There are no incentives for participating in such activities. 1 2 3 4
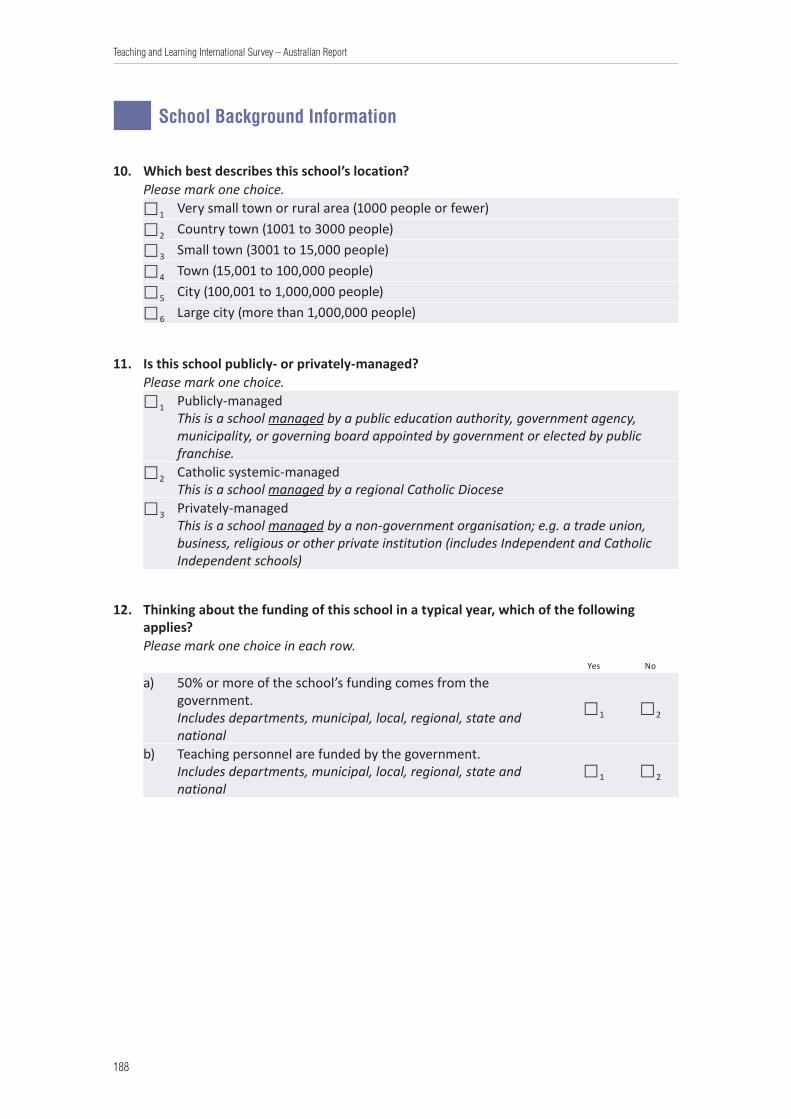
188
Teaching and Learning International Survey – Australian Report
School Background Information
10. Which best describes this school’s location?Please mark one choice.1 Very small town or rural area (1000 people or fewer)
2 Country town (1001 to 3000 people)
3 Small town (3001 to 15,000 people)
4 Town (15,001 to 100,000 people)
5 City (100,001 to 1,000,000 people)
6 Large city (more than 1,000,000 people)
11. Is this school publicly- or privately-managed?Please mark one choice.1 Publicly-managed
This is a school managed by a public education authority, government agency, municipality, or governing board appointed by government or elected by public franchise.
2 Catholic systemic-managedThis is a school managed by a regional Catholic Diocese
3 Privately-managedThis is a school managed by a non-government organisation; e.g. a trade union, business, religious or other private institution (includes Independent and Catholic Independent schools)
12. Thinking about the funding of this school in a typical year, which of the following applies?Please mark one choice in each row.
Yes No
a) 50% or more of the school’s funding comes from the government.Includes departments, municipal, local, regional, state and national
1 2
b) Teaching personnel are funded by the government.Includes departments, municipal, local, regional, state and national
1 2
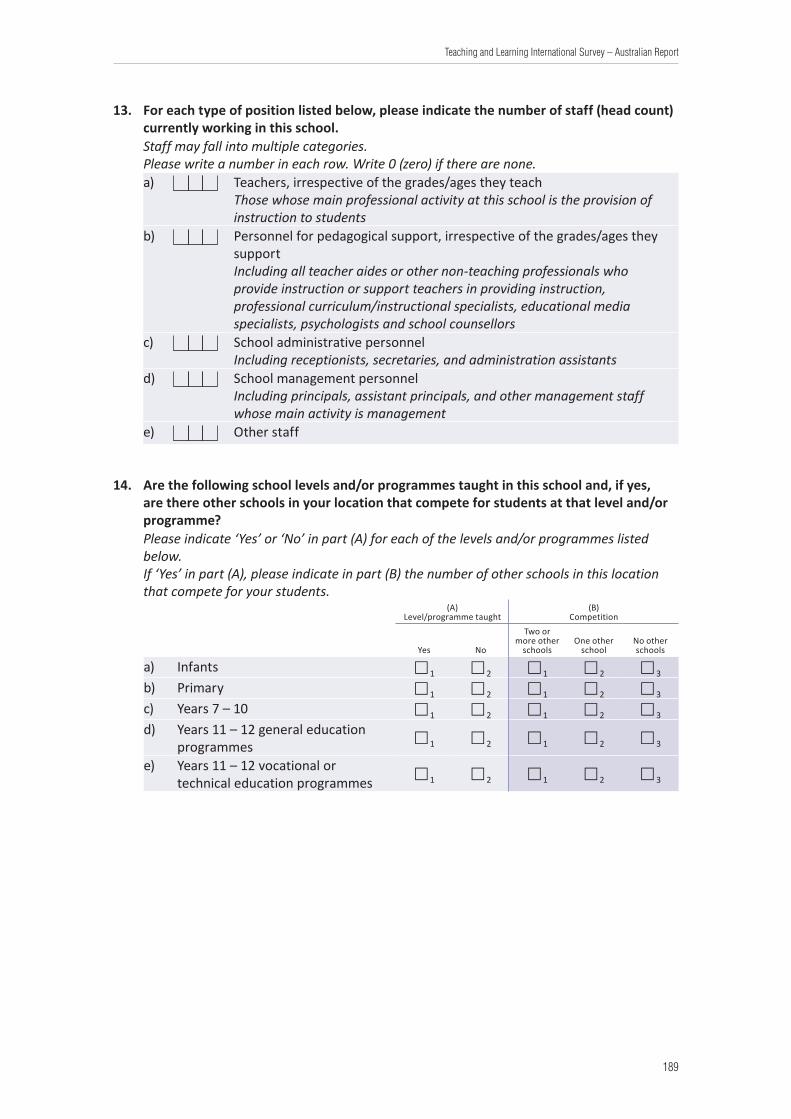
189
Teaching and Learning International Survey – Australian Report
13. For each type of position listed below, please indicate the number of staff (head count) currently working in this school.Staff may fall into multiple categories.Please write a number in each row. Write 0 (zero) if there are none.a) Teachers, irrespective of the grades/ages they teach
Those whose main professional activity at this school is the provision of instruction to students
b) Personnel for pedagogical support, irrespective of the grades/ages they supportIncluding all teacher aides or other non-teaching professionals who provide instruction or support teachers in providing instruction, professional curriculum/instructional specialists, educational media specialists, psychologists and school counsellors
c) School administrative personnelIncluding receptionists, secretaries, and administration assistants
d) School management personnelIncluding principals, assistant principals, and other management staff whose main activity is management
e) Other staff
14. Are the following school levels and/or programmes taught in this school and, if yes, are there other schools in your location that compete for students at that level and/or programme?Please indicate ‘Yes’ or ‘No’ in part (A) for each of the levels and/or programmes listed below.If ‘Yes’ in part (A), please indicate in part (B) the number of other schools in this location that compete for your students.
(A)Level/programme taught
(B)Competition
Yes No
Two or more other
schoolsOne other
schoolNo other schools
a) Infants 1 2 1 2 3
b) Primary 1 2 1 2 3
c) Years 7 – 10 1 2 1 2 3
d) Years 11 – 12 general education programmes 1 2 1 2 3
e) Years 11 – 12 vocational or technical education programmes 1 2 1 2 3

190
Teaching and Learning International Survey – Australian Report
15. What is the current school enrolment, i.e. the number of students of all grades/ages in this school?Please write a number.
Students
16. Please estimate the broad percentage of Year 7 – 10 students in this school who have the following characteristics.Special need students cover those for whom a special learning need has been formally identified because they are mentally or physically disadvantaged. Often they will be those for whom additional public or private resources (personnel, material or financial) have been provided to support their education.‘Socioeconomically disadvantaged homes’ refers to homes lacking the basic necessities or advantages of life, such as adequate housing, nutrition or medical care.Students may fall into multiple categories. Please mark one choice in each row.
None 1% to 10% 11% to 30% 31% to 60%More than
60%
a) Students whose first language is different from the language(s) of instruction or from a dialect of this/these languages(s)
1 2 3 4 5
b) Students with special needs 1 2 3 4 5
c) Students from socioeconomically disadvantaged homes 1 2 3 4 5
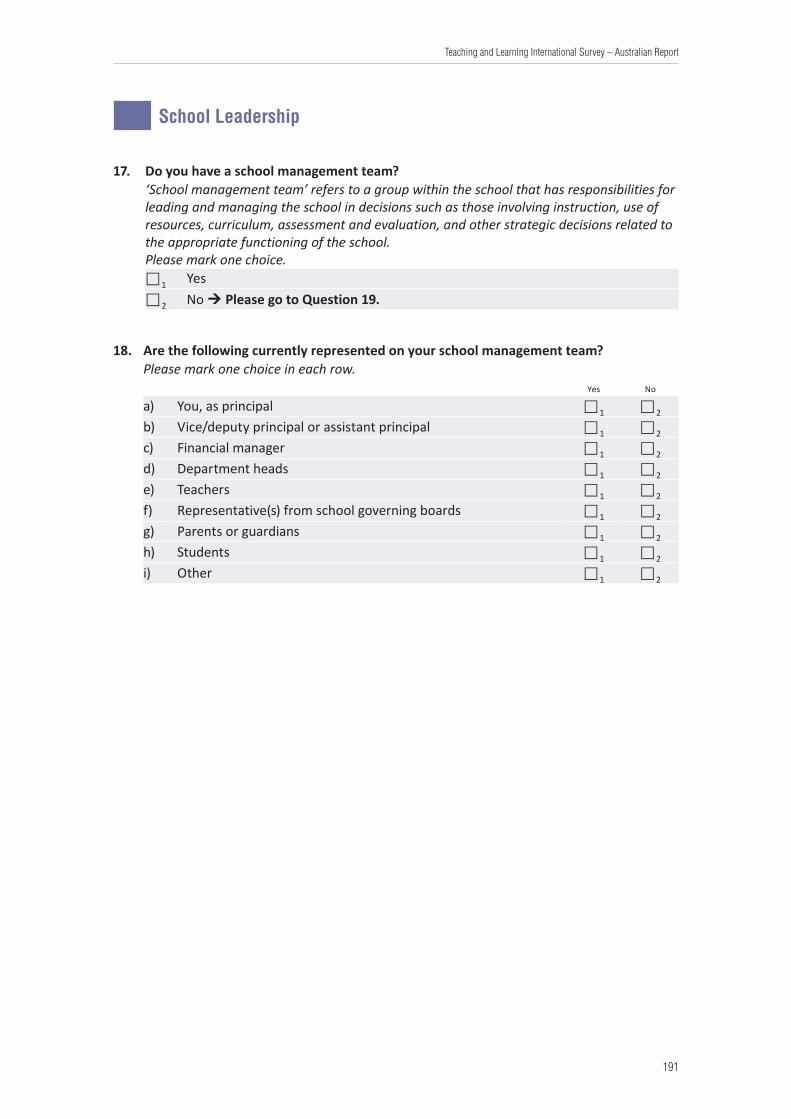
191
Teaching and Learning International Survey – Australian Report
School Leadership
17. Do you have a school management team?‘School management team’ refers to a group within the school that has responsibilities for leading and managing the school in decisions such as those involving instruction, use of resources, curriculum, assessment and evaluation, and other strategic decisions related to the appropriate functioning of the school.Please mark one choice.1 Yes
2 No Please go to Question 19.
18. Are the following currently represented on your school management team?Please mark one choice in each row.
Yes No
a) You, as principal 1 2
b) Vice/deputy principal or assistant principal 1 2
c) Financial manager 1 2
d) Department heads 1 2
e) Teachers 1 2
f) Representative(s) from school governing boards 1 2
g) Parents or guardians 1 2
h) Students 1 2
i) Other 1 2
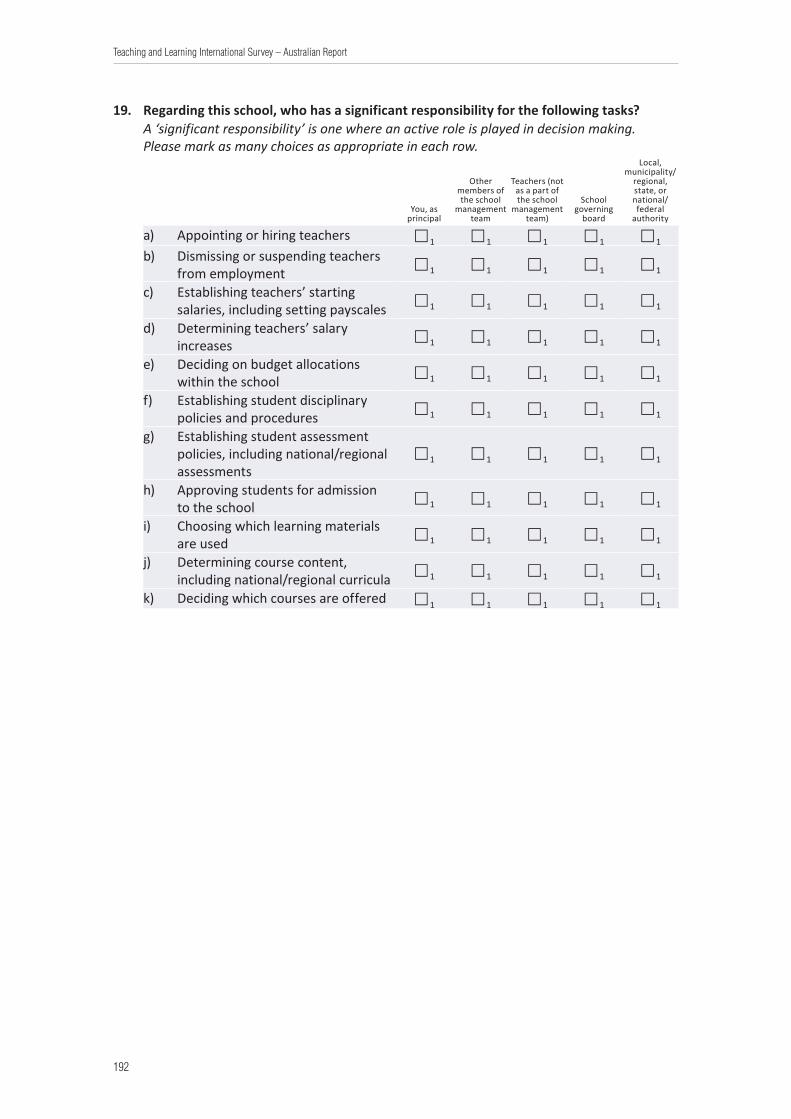
192
Teaching and Learning International Survey – Australian Report
19. Regarding this school, who has a significant responsibility for the following tasks?A ‘significant responsibility’ is one where an active role is played in decision making.Please mark as many choices as appropriate in each row.
You, as principal
Other members of the school
management team
Teachers (not as a part of the school
management team)
School governing
board
Local, municipality/
regional, state, or national/ federal
authority
a) Appointing or hiring teachers 1 1 1 1 1
b) Dismissing or suspending teachers from employment 1 1 1 1 1
c) Establishing teachers’ starting salaries, including setting payscales 1 1 1 1 1
d) Determining teachers’ salary increases 1 1 1 1 1
e) Deciding on budget allocations within the school 1 1 1 1 1
f) Establishing student disciplinary policies and procedures 1 1 1 1 1
g) Establishing student assessment policies, including national/regional assessments
1 1 1 1 1
h) Approving students for admission to the school 1 1 1 1 1
i) Choosing which learning materials are used 1 1 1 1 1
j) Determining course content, including national/regional curricula 1 1 1 1 1
k) Deciding which courses are offered 1 1 1 1 1
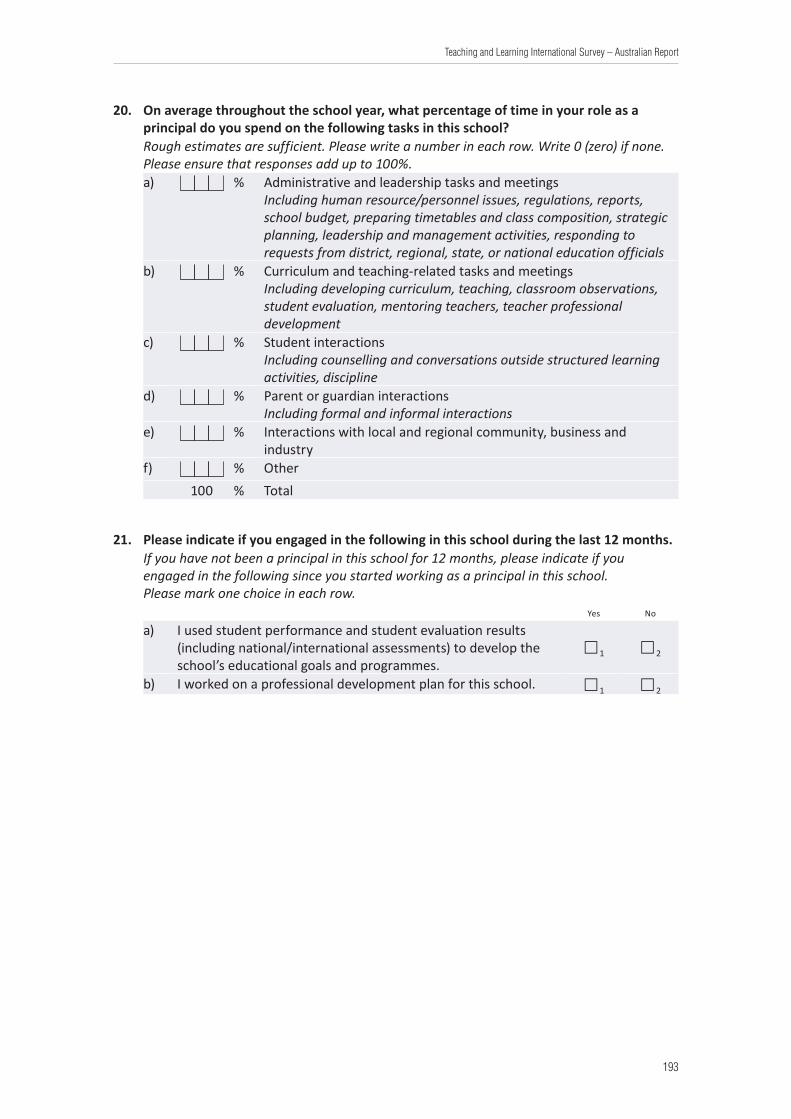
193
Teaching and Learning International Survey – Australian Report
20. On average throughout the school year, what percentage of time in your role as a principal do you spend on the following tasks in this school?Rough estimates are sufficient. Please write a number in each row. Write 0 (zero) if none.Please ensure that responses add up to 100%.a) % Administrative and leadership tasks and meetings
Including human resource/personnel issues, regulations, reports, school budget, preparing timetables and class composition, strategic planning, leadership and management activities, responding to requests from district, regional, state, or national education officials
b) % Curriculum and teaching-related tasks and meetingsIncluding developing curriculum, teaching, classroom observations, student evaluation, mentoring teachers, teacher professional development
c) % Student interactionsIncluding counselling and conversations outside structured learning activities, discipline
d) % Parent or guardian interactionsIncluding formal and informal interactions
e) % Interactions with local and regional community, business and industry
f) % Other 100 % Total
21. Please indicate if you engaged in the following in this school during the last 12 months.If you have not been a principal in this school for 12 months, please indicate if you engaged in the following since you started working as a principal in this school.Please mark one choice in each row.
Yes No
a) I used student performance and student evaluation results (including national/international assessments) to develop the school’s educational goals and programmes.
1 2
b) I worked on a professional development plan for this school. 1 2

194
Teaching and Learning International Survey – Australian Report
22. Please indicate how frequently you engaged in the following in this school during the last 12 months.Please mark one choice in each row.
Never or rarely Sometimes Often Very often
a) I collaborated with teachers to solve classroom discipline problems. 1 2 3 4
b) I observed instruction in the classroom. 1 2 3 4
c) I took actions to support co-operation among teachers to develop new teaching practices. 1 2 3 4
d) I took actions to ensure that teachers take responsibility for improving their teaching skills.
1 2 3 4
e) I took actions to ensure that teachers feel responsible for their students’ learning outcomes.
1 2 3 4
f) I provided parents or guardians with information on the school and student performance.
1 2 3 4
g) I checked for mistakes and errors in school administrative procedures and reports. 1 2 3 4
h) I resolved problems with the lesson timetable in this school. 1 2 3 4
i) I collaborated with principals from other schools. 1 2 3 4
23. How strongly do you agree or disagree with these statements as applied to this school?Please mark one choice in each row.
Strongly disagree Disagree Agree
Strongly agree
a) This school provides staff with opportunities to actively participate in school decisions. 1 2 3 4
b) This school provides parents or guardians with opportunities to actively participate in school decisions.
1 2 3 4
c) This school provides students with opportunities to actively participate in school decisions.
1 2 3 4
d) I make the important decisions on my own. 1 2 3 4
e) There is a collaborative school culture which is characterised by mutual support. 1 2 3 4

195
Teaching and Learning International Survey – Australian Report
24. Do you have a school governing board?Please mark one choice.1 Yes
2 No Please go to Question 26.
25. Are the following currently represented on this school’s governing board?Please mark one choice in each row.
Yes No
a) Representatives of a local, municipality/regional, state, or national/federal authority 1 2
b) Members of the school management team 1 2
c) School administrative personnel 1 2
d) Teachers 1 2
e) Parents or guardians 1 2
f) Students 1 2
g) Trade unions 1 2
h) Representatives of business labour market institutions, religious institutions or other private institutions 1 2
i) Others 1 2
26. During this school year, does this school provide any of the following to parents or guardians?Please mark one choice in each row.
Yes No
a) Workshops or courses for parents or guardians 1 2
b) Services to support parents’ or guardians’ participation, such as providing child care 1 2
c) Support for parental association(s) 1 2
d) Parental meeting(s) 1 2

196
Teaching and Learning International Survey – Australian Report
27. To what extent do the following limit your effectiveness as a principal in this school? ‘A career-based wage system’ is used when an employee’s salary is determined mainly by his or her educational level and age or seniority rather than by his or her performance on the job.Please mark one choice in each row.
Not at all Very littleTo some extent A lot
a) Inadequate school budget and resources 1 2 3 4
b) Government regulation and policy 1 2 3 4
c) Teachers’ absences 1 2 3 4
d) Lack of parent or guardian involvement and support 1 2 3 4
e) Teachers’ career-based wage system 1 2 3 4
f) Lack of opportunities and support for my own professional development 1 2 3 4
g) Lack of opportunities and support for teachers’ professional development 1 2 3 4
h) High workload and level of responsibilities in my job 1 2 3 4
i) Lack of shared leadership with other school staff members 1 2 3 4
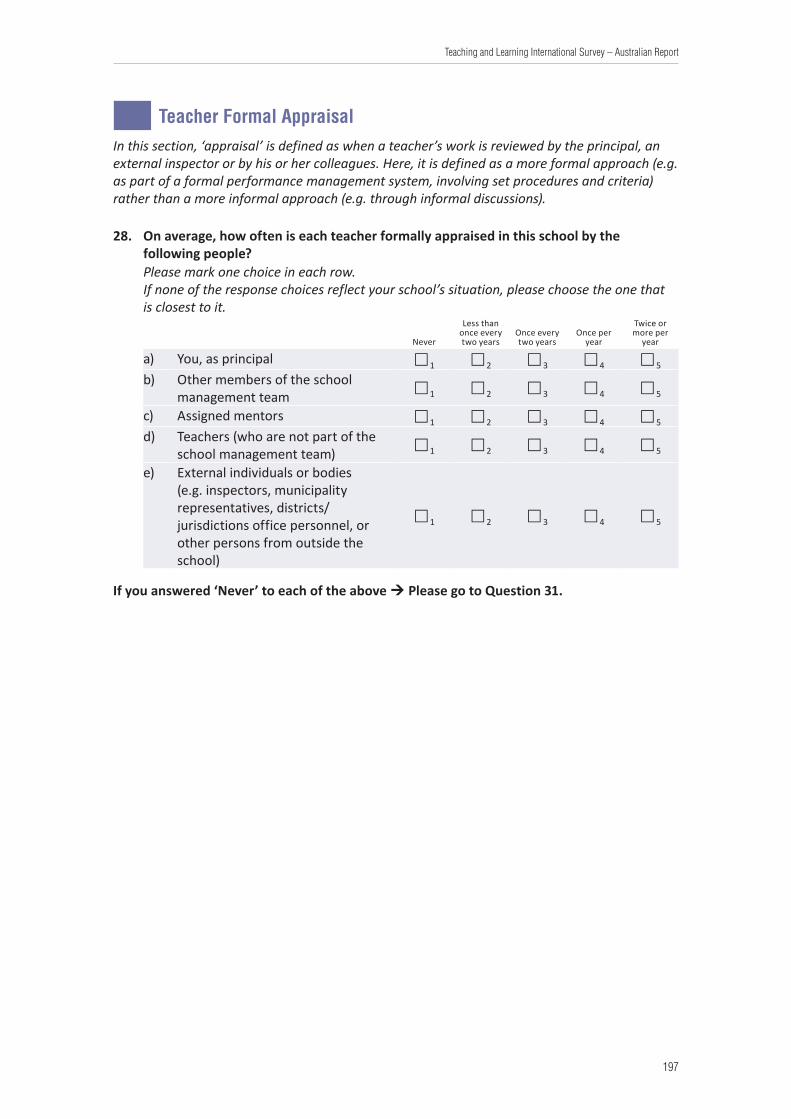
197
Teaching and Learning International Survey – Australian Report
Teacher Formal AppraisalIn this section, ‘appraisal’ is defined as when a teacher’s work is reviewed by the principal, an external inspector or by his or her colleagues. Here, it is defined as a more formal approach (e.g. as part of a formal performance management system, involving set procedures and criteria) rather than a more informal approach (e.g. through informal discussions).
28. On average, how often is each teacher formally appraised in this school by the following people?Please mark one choice in each row.If none of the response choices reflect your school’s situation, please choose the one that is closest to it.
Never
Less than once every two years
Once every two years
Once per year
Twice or more per
year
a) You, as principal 1 2 3 4 5
b) Other members of the school management team 1 2 3 4 5
c) Assigned mentors 1 2 3 4 5
d) Teachers (who are not part of the school management team) 1 2 3 4 5
e) External individuals or bodies (e.g. inspectors, municipality representatives, districts/jurisdictions office personnel, or other persons from outside the school)
1 2 3 4 5
If you answered ‘Never’ to each of the above Please go to Question 31.
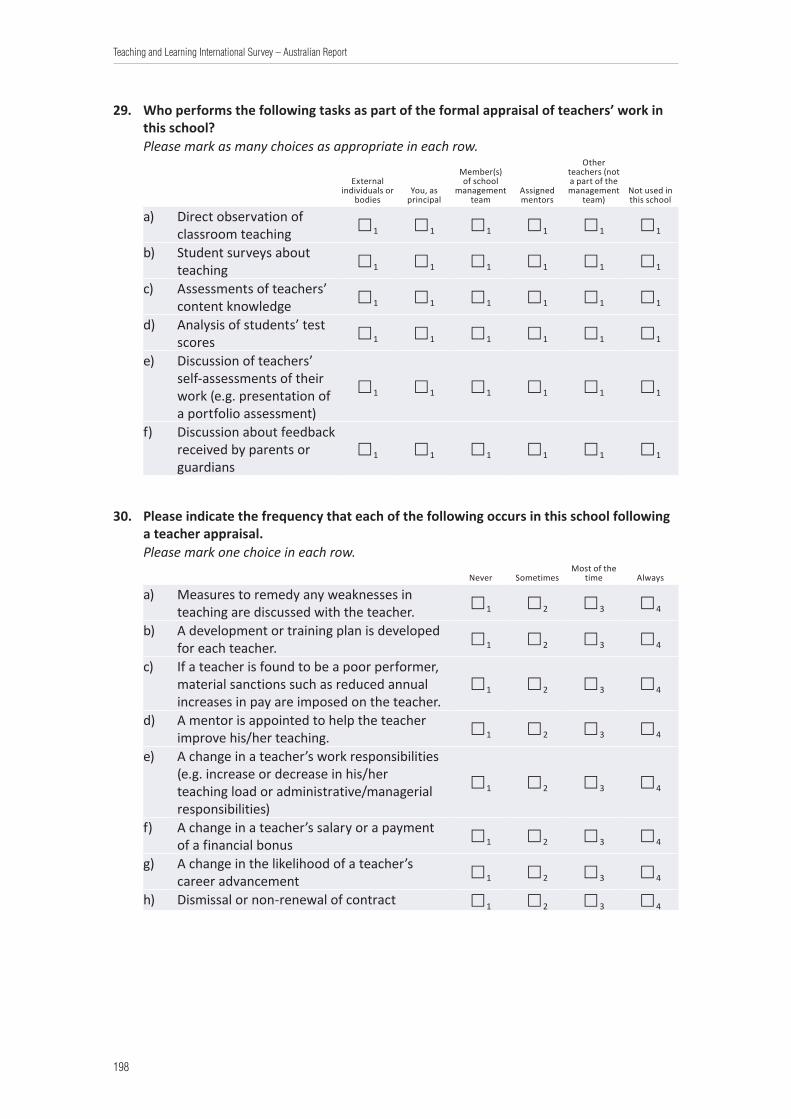
198
Teaching and Learning International Survey – Australian Report
29. Who performs the following tasks as part of the formal appraisal of teachers’ work in this school?Please mark as many choices as appropriate in each row.
External individuals or
bodies You, as
principal
Member(s) of school
management team
Assigned mentors
Other teachers (not a part of the management
team)Not used in this school
a) Direct observation of classroom teaching 1 1 1 1 1 1
b) Student surveys about teaching 1 1 1 1 1 1
c) Assessments of teachers’ content knowledge 1 1 1 1 1 1
d) Analysis of students’ test scores 1 1 1 1 1 1
e) Discussion of teachers’ self-assessments of their work (e.g. presentation of a portfolio assessment)
1 1 1 1 1 1
f) Discussion about feedback received by parents or guardians
1 1 1 1 1 1
30. Please indicate the frequency that each of the following occurs in this school following a teacher appraisal.Please mark one choice in each row.
Never SometimesMost of the
time Always
a) Measures to remedy any weaknesses in teaching are discussed with the teacher. 1 2 3 4
b) A development or training plan is developed for each teacher. 1 2 3 4
c) If a teacher is found to be a poor performer, material sanctions such as reduced annual increases in pay are imposed on the teacher.
1 2 3 4
d) A mentor is appointed to help the teacher improve his/her teaching. 1 2 3 4
e) A change in a teacher’s work responsibilities (e.g. increase or decrease in his/her teaching load or administrative/managerial responsibilities)
1 2 3 4
f) A change in a teacher’s salary or a payment of a financial bonus 1 2 3 4
g) A change in the likelihood of a teacher’s career advancement 1 2 3 4
h) Dismissal or non-renewal of contract 1 2 3 4
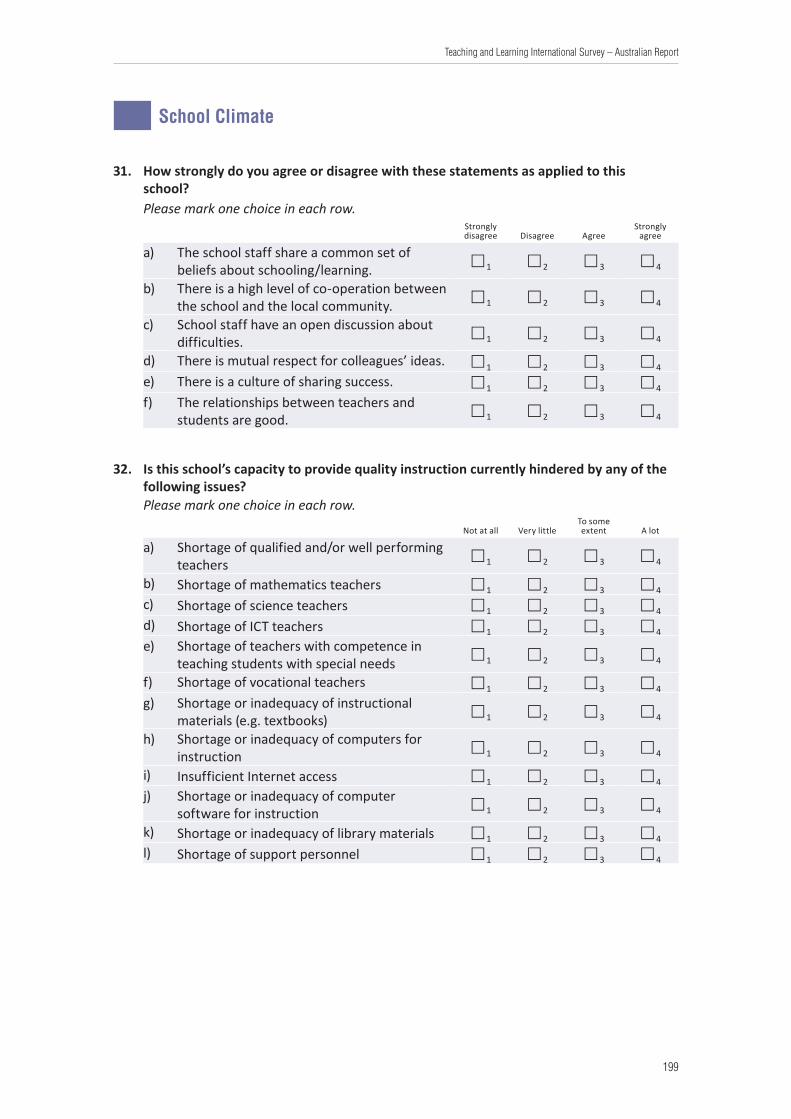
199
Teaching and Learning International Survey – Australian Report
School Climate
31. How strongly do you agree or disagree with these statements as applied to this school?Please mark one choice in each row.
Strongly disagree Disagree Agree
Strongly agree
a) The school staff share a common set of beliefs about schooling/learning. 1 2 3 4
b) There is a high level of co-operation between the school and the local community. 1 2 3 4
c) School staff have an open discussion about difficulties. 1 2 3 4
d) There is mutual respect for colleagues’ ideas. 1 2 3 4
e) There is a culture of sharing success. 1 2 3 4
f) The relationships between teachers and students are good. 1 2 3 4
32. Is this school’s capacity to provide quality instruction currently hindered by any of the following issues?Please mark one choice in each row.
Not at all Very littleTo some extent A lot
a) Shortage of qualified and/or well performing teachers 1 2 3 4
b) Shortage of mathematics teachers 1 2 3 4
c) Shortage of science teachers 1 2 3 4
d) Shortage of ICT teachers 1 2 3 4
e) Shortage of teachers with competence in teaching students with special needs 1 2 3 4
f) Shortage of vocational teachers 1 2 3 4
g) Shortage or inadequacy of instructional materials (e.g. textbooks) 1 2 3 4
h) Shortage or inadequacy of computers for instruction 1 2 3 4
i) Insufficient Internet access 1 2 3 4
j) Shortage or inadequacy of computer software for instruction 1 2 3 4
k) Shortage or inadequacy of library materials 1 2 3 4
l) Shortage of support personnel 1 2 3 4

200
Teaching and Learning International Survey – Australian Report
33. In this school, how often do the following occur?Please mark one choice in each row.
By students in this school: Never Rarely Monthly Weekly Daily
a) Arriving late at school 1 2 3 4 5
b) Absenteeism (i.e. unjustified absences) 1 2 3 4 5
c) Cheating 1 2 3 4 5
d) Vandalism and theft 1 2 3 4 5
e) Intimidation or verbal abuse among students (or other forms of non-physical bullying)
1 2 3 4 5
f) Physical injury caused by violence among students 1 2 3 4 5
g) Intimidation or verbal abuse of teachers or staff 1 2 3 4 5
h) Use/possession of drugs and/or alcohol 1 2 3 4 5
By teachers in this school: Never Rarely Monthly Weekly Daily
i) Arriving late at school 1 2 3 4 5
j) Absenteeism (i.e. unjustified absences) 1 2 3 4 5
k) Discrimination (e.g. based on gender, ethnicity, religion, or disability, etc.)
1 2 3 4 5

201
Teaching and Learning International Survey – Australian Report
Teacher Induction and MentoringThe following section includes questions on induction and mentoring.
An ‘induction programme’ is defined as a structured range of activities at school to support new teachers’ introduction into the teaching profession/school. Student teachers still within the teacher education programme are not included. An induction programme could include peer work with other new teachers, mentoring by experienced teachers, etc. The formal arrangement could be defined by your school, or in relation to other schools, or by educational authorities/external agencies.
‘Mentoring’ is defined as a support structure at schools where more experienced teachers support less experienced teachers. This structure might involve all teachers in the school or only new teachers.
34. Do new teachers at this school have access to an induction programme?Please mark one choice in each row.
Yes No
a) There is an induction programme for new teachers. 1 2
b) There are informal induction activities for new teachers not part of an induction programme. 1 2
c) There is a general and/or administrative introduction to the school for new teachers. 1 2
If you answered ‘No’ to a) Please go to Question 37.
35. Which teachers at this school are offered an induction programme?Please mark one choice.1 All teachers who are new to this school2 Only teachers new to teaching
36. What structures and activities are included in this induction programme?Please mark as many choices as appropriate.1 Mentoring by experienced teachers
1 Courses/seminars
1 Scheduled meetings with principal and/or colleague teachers
1 A system of peer review
1 Networking/virtual communities
1 Collaboration with other schools
1 Team teaching (together with more experienced teachers)
1 A system of diaries/journals, portfolios, etc. to facilitate learning and reflection
1 None of the above

202
Teaching and Learning International Survey – Australian Report
37. Do teachers at your school have access to a mentoring system?Please mark one choice.1 Yes, but only teachers who are new to teaching, i.e. in their first job as teachers,
have access.2 Yes, all teachers who are new to this school have access.
3 Yes, all teachers at this school have access.
4 No, at present there is no access to a mentoring system for teachers in this school. Please go to Question 39.
38. Is the mentor’s main subject field(s) the same as that of the teacher being mentored?Please mark one choice. 1 Yes, most of the time2 Yes, sometimes3 No, rarely or never
39. How would you generally rate the importance of mentoring for teachers and schools?Please mark one choice in each row.
Not important
at allOf low
importance
Of moderate
importanceOf high
importance
a) To improve teachers’ pedagogical competence 1 2 3 4
b) To strengthen teachers’ professional identity 1 2 3 4
c) To improve teachers’ collaboration with colleagues 1 2 3 4
d) To support less experienced teachers in their teaching 1 2 3 4
e) To expand teachers’ main subject(s) knowledge 1 2 3 4
f) To improve students’ general performance 1 2 3 4
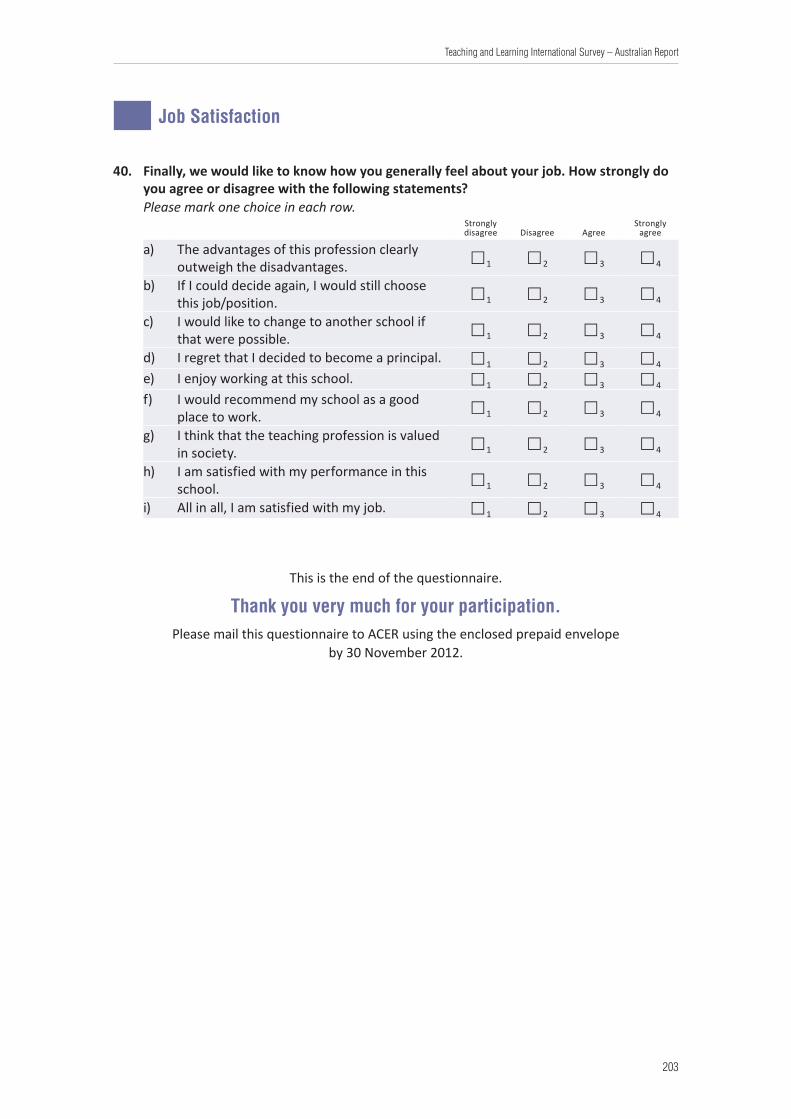
203
Teaching and Learning International Survey – Australian Report
Job Satisfaction
40. Finally, we would like to know how you generally feel about your job. How strongly do you agree or disagree with the following statements?Please mark one choice in each row.
Strongly disagree Disagree Agree
Strongly agree
a) The advantages of this profession clearly outweigh the disadvantages. 1 2 3 4
b) If I could decide again, I would still choose this job/position. 1 2 3 4
c) I would like to change to another school if that were possible. 1 2 3 4
d) I regret that I decided to become a principal. 1 2 3 4
e) I enjoy working at this school. 1 2 3 4
f) I would recommend my school as a good place to work. 1 2 3 4
g) I think that the teaching profession is valued in society. 1 2 3 4
h) I am satisfied with my performance in this school. 1 2 3 4
i) All in all, I am satisfied with my job. 1 2 3 4
This is the end of the questionnaire.
Thank you very much for your participation.Please mail this questionnaire to ACER using the enclosed prepaid envelope
by 30 November 2012.
Australian Council for Educational Research