Talis teachers-guide
32
A TEACHERS’ GUIDE TO TALIS 2013 TEACHING AND LEARNING INTERNATIONAL SURVEY
-
Upload
fran-garland -
Category
Education
-
view
320 -
download
0
Transcript of Talis teachers-guide
A TeAchers’ Guide To TALIs 2013
TEACHING AND LEARNING INTERNATIONAL SURVEY

A TeAchers’ Guide
To TALIs 2013TEACHING AND LEARNING INTERNATIONAL SURVEY
This work is published on the responsibility of the Secretary-General of the OECD. The
opinions expressed and arguments employed herein do not necessarily reflect the official
views of the OECD member countries.
This document and any map included herein are without prejudice to the status of or
sovereignty over any territory, to the delimitation of international frontiers and boundaries
and to the name of any territory, city or area.
Please cite this publication as:OECD (2014), A Teachers’ Guide to TALIS 2013: Teaching and Learning International Survey, TALIS, OECD Publishing.
http://dx.doi.org/10.1787/9789264216075-en
ISBN 978-92-64-21608-2 (print)ISBN 978-92-64-21607-5 (PDF)
TALIS ISSN: 2312-962X (print)ISSN: 2312-9638 (online)
Note by Turkey: The information in this document with reference to “Cyprus” relates to the southern part of the Island. There is no single authority representing both Turkish and Greek Cypriot people on the Island. Turkey recognises the Turkish Republic of Northern Cyprus (TRNC). Until a lasting and equitable solution is found within the context of the United Nations, Turkey shall preserve its position concerning the “Cyprus issue”.
Note by all the European Union Member States of the OECD and the European Union: The Republic of Cyprus is recognised by all members of the United Nations with the exception of Turkey. The information in this document relates to the area under the effective control of the Government of the Republic of Cyprus.
The statistical data for Israel are supplied by and under the responsibility of the relevant Israeli authorities. The use of such data by the OECD is without prejudice to the status of the Golan Heights, East Jerusalem and Israeli settlements in the West Bank under the terms of international law.
Photo credits:© Hero Images/Corbis© Monkey Busines/Fotolia© Tyler Olson/Shutterstock
Corrigenda to OECD publications may be found on line at: www.oecd.org/publishing/corrigenda.
© OECD 2014
You can copy, download or print OECD content for your own use, and you can include excerpts from OECD publications, databases and multimedia products in your own documents, presentations, blogs, websites and teaching materials, provided that suitable acknowledgement of OECD as source and copyright owner is given. All requests for public or commercial use and translation rights should be submitted to [email protected]. Requests for permission to photocopy portions of this material for public or commercial use shall be addressed directly to the Copyright Clearance Center (CCC) at [email protected] or the Centre français d’exploitation du droit de copie (CFC) at [email protected].
© OECD 2014 A TeAchers’ guide TO TALis 3
Angel GurríaOECD Secretary-General
The skills that students need to contribute effectively to
society are in constant change. Yet, our education systems are
not keeping up with the fast pace of the world around us. Most
schools look much the same today as they did a generation ago,
and teachers themselves are often not developing the practices
and skills necessary to meet the diverse needs of today’s learners…
Recognising that education is the great equaliser in society, the
challenge for all of us is to equip all teachers with the skills and
tools they need to provide effective learning opportunities for
their students.
© OECD 2014 A TeAchers’ guide TO TALis4
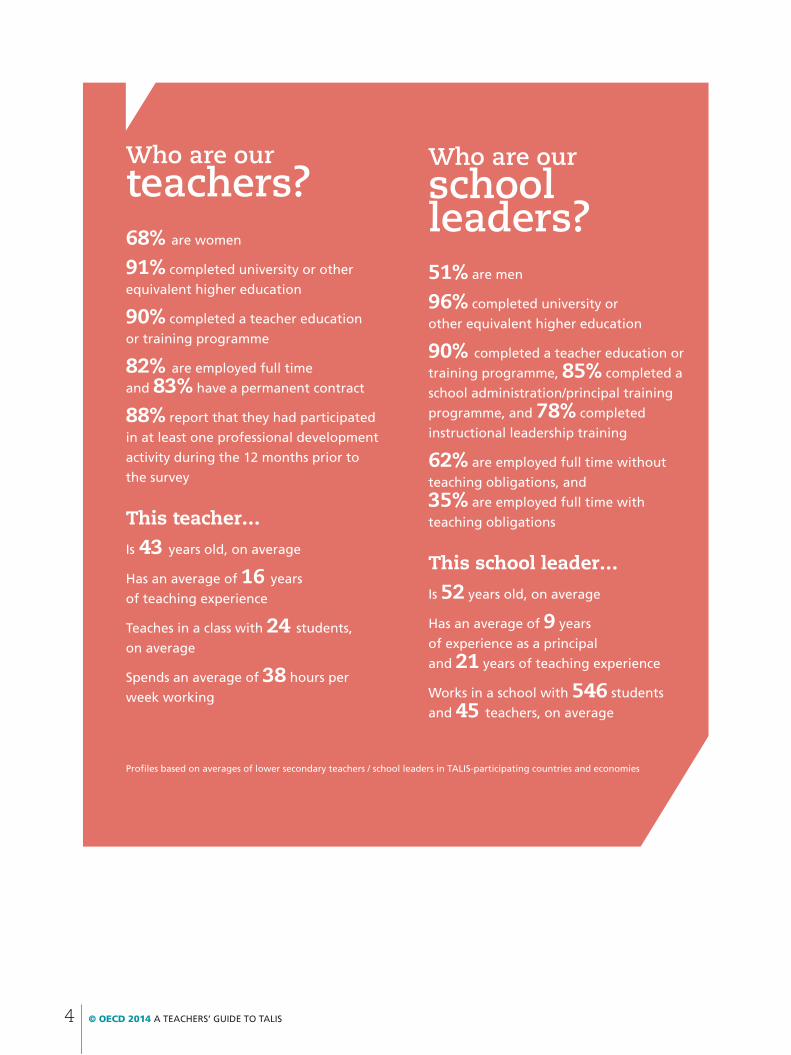
68% are women
91% completed university or other
equivalent higher education
90% completed a teacher education
or training programme
82% are employed full time
and 83% have a permanent contract
88% report that they had participated
in at least one professional development
activity during the 12 months prior to
the survey
This teacher…
Is 43 years old, on average
Has an average of 16 years
of teaching experience
Teaches in a class with 24 students,
on average
Spends an average of 38 hours per
week working
51% are men
96% completed university or
other equivalent higher education
90% completed a teacher education or
training programme, 85% completed a
school administration/principal training
programme, and 78% completed
instructional leadership training
62% are employed full time without
teaching obligations, and
35% are employed full time with
teaching obligations
This school leader…
Is 52 years old, on average
Has an average of 9 years
of experience as a principal
and 21 years of teaching experience
Works in a school with 546 students
and 45 teachers, on average
Profiles based on averages of lower secondary teachers / school leaders in TALIS-participating countries and economies
Who are our teachers?
Who are our school leaders?
© OECD 2014 A TeAchers’ guide TO TALis 5
The OECD Teaching and Learning International Survey (TALIS) is a large-scale international survey that focuses on the working conditions of teachers and the learning environment in schools. TALIS, a collaboration among participating countries and economies, the OECD, an international research consortium, social partners and the European Commission, aims to provide valid, timely and comparable information to help countries review and define policies for developing a high-quality teaching workforce.
TALIS examines the ways in which teachers’ work is recognised, appraised and rewarded, and assesses teachers’ participation in professional devel-opment activities. The study provides insights into teachers’ beliefs about and attitudes towards teaching, the pedagogical practices that they adopt, and the factors related to teachers’ sense of self-efficacy and job satisfaction. TALIS also examines the roles of school leaders and the support they give their teachers.
The first cycle of TALIS was conducted in 2008 and surveyed teachers and school leaders of lower secondary education in 24 countries. In 2013, 34 countries and economies participated in TALIS.
What is TALIs?
© OECD 2014 A TeAchers’ guide TO TALis6
Participating countries and economiesOECD countries: Alberta (Canada), Australia, Chile, the Czech Republic, Denmark, England (United Kingdom), Estonia, Finland, Flanders (Belgium), France, Iceland, Israel*, Italy, Japan, Korea, Mexico, the Netherlands, Norway, Poland, Portugal, the Slovak Republic, Spain, Sweden and the United States**.
Partner countries and economies: Abu Dhabi (United Arab Emirates), Brazil, Bulgaria, Croatia, Cyprus***, Latvia, Malaysia, Romania, Serbia and Singapore.
ParticipantsLower secondary teachers and leaders of schools in 200 schools per country/economy were randomly selected (20 teachers and 1 school leader per school). Some 107 000 lower secondary teachers responded to the survey, representing more than 4 million teachers in more than 30 participating countries and economies.
The surveyThe survey was conducted between September and December 2012 for countries in the southern hemisphere and between February and June 2013 for countries in the northern hemisphere.
The questionnaire, which took between 45 and 60 minutes to complete, either on paper or on line, covered the following issues:
•Schoolleadership,includingdistributedorteamleadership
• Teacher training, including professional development and initial teachereducation
• Appraisalofandfeedbacktoteachers
• Teachers’pedagogicalbeliefs,attitudesandteachingpractices, includingstudent-assessment practices
• Teachers’reportedfeelingsofself-efficacy,jobsatisfactionandtheclimatein the schools and classrooms in which they work
Key features of TALIs 2013
* The statistical data for Israel are supplied by and under the responsibility of the relevant Israeli authorities. The use of such data by theOECDiswithoutprejudicetothestatusof the Golan Heights, East Jerusalem and Israeli settlements in the West Bank under the terms of international law.
** Data from the United States are only included in selected charts in this publication and are not included in the calculations for the international average. This is because the United States did not meet the international standards for participation rates. However, U.S.participationratesweresufficientlyhighto report the U.S. data independently.
*** Note by Turkey: The information in this document with reference to “Cyprus” relates to the southern part of the Island. There is no single authority representing both Turkish and Greek Cypriot people on the Island. Turkey recognises the Turkish Republic of Northern Cyprus (TRNC). Until a lasting and equitable solution is found within the context of the United Nations, Turkey shall preserve its position concerning the “Cyprus issue”.
Note by all the European Union Member States of the OECD and the European Union: The Republic of Cyprus is recognised by all members of the United Nations with the exception of Turkey. The information in this document relates to the area under the effective control of the Government of the Republic of Cyprus.
© OECD 2014 A TeAchers’ guide TO TALis 7
Teachers are at the heart of TALIS. While the survey offers a wealth of information to education policy makers, it can also be seen as a global “selfie” by teachers: a snapshot, taken by teachers themselves, of what they believe, how they work, and how they feel about the work they do. Even more, through
TALIS results, teachers in one country can gain an understanding of what their peers elsewhere in their own country and in other countries are doing, and maybe even be inspired by them.
This publication not only presents the main results of TALIS 2013, it also takes those findings and, backed by the research literature on education and the large body of OECD work on education, offers insights and advice to teachers and school leaders on how they can improve teaching and learning in their schools. It is both a guide through TALIS and a handbook for building excellence into teaching.
What do teachers believe about student learning?
Teachers walk into a classroom with an established set of beliefs on how students learn. These beliefs, developed inteachertrainingprogrammesand/orthroughteachers’own classroom experience, shape how teachers teach. For example, if teachers are convinced that students learn better when they are encouraged to think through and solve a problem on their own, before a teacher intervenes, then they are likely to use more active, student-centred approaches to teaching and learning, such as having students work in small groups, or requiringstudentstoworkonaprojectthattakesmorethan a week to complete.
Some 93% of teachers report that they believe that
students should be allowed to think of solutions to a
problem themselves before teachers show them the
solution. In Italy, Norway, and Sweden, however, only
between 45% and 59% of teachers agree that students
learn best by trying to solve problems on their own.
TALIS also finds that teachers who report that they
encourage their students to work in small groups
frequently or in all their lessons are more likely to report
that they believe strongly in student-centred learning than
those who never or only occasionally have their students
work in small groups. Nearly half (47%) of the teachers
surveyed, on average, report that they frequently have their
students work in small groups.
© OECD 2014 A TeAchers’ guide TO TALis8
What do teachers do in the classroom?
Howteachers’workinghoursareregulatedbyeducationauthorities varies among countries; it also has an impact on their actual working hours.
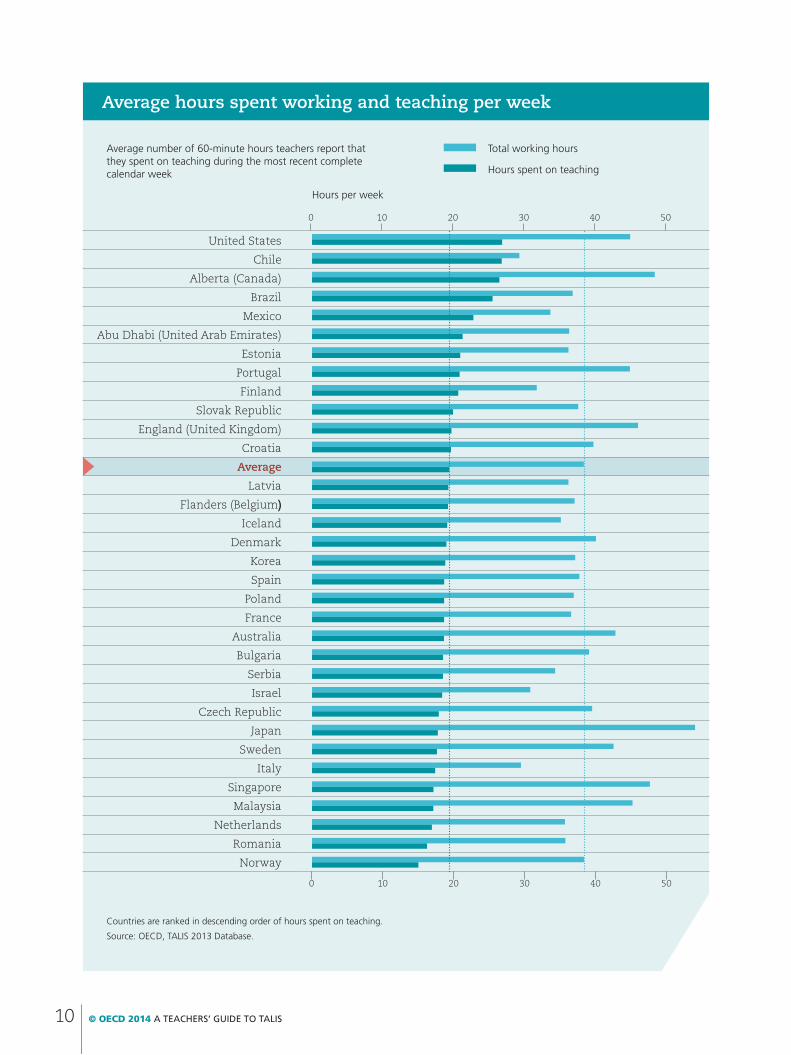
Across the countries and economies that participated
in TALIS, teachers report that they spend an average of
38 hours per week working, ranging from 29 hours
in Chile and Italy to 54 hours in Japan.
> Chart page 10
Ideally, teachers should spend most of their working time with students.
Teachers surveyed by TALIS report that they spend most
of their working hours (an average of 19 hours per
week) teaching. This ranges from 15 hours in Norway
to 27 hours in Chile. In most participating countries/
economies, half of the teachers report that they spend
80% or more of their lesson time on teaching and
learning.
Japanese teachers report spending only 18 hours per
week teaching, which means that they spend considerably
more time than their counterparts in other countries on
tasks other than teaching. By contrast, teachers in Alberta
(Canada) report that they spend an average of 26 hours
per week teaching, teachers in Brazil, an average of
25 hours per week teaching, and teachers in Chile and
the United States, an average of 27 hours per week
teaching – which may mean that they have little time for
other tasks, such as lesson planning, marking students’
work, or meeting with students and parents. In addition,
according to their reports, teachers in the United States
and Alberta (Canada) work longer hours, overall, than their
peers in other countries.
Butasevery teacherknows, there’smore involved inaworkweek than actual teaching.
Teachers report that they spend an average of 7 hours
per week planning or preparing lessons (from 5 hours
in Finland, Israel, Italy, the Netherlands and Poland, to
10 hours in Croatia), an average of 5 hours per
week marking students’ work (10 hours in Portugal and
9 hours in Singapore), and an average of 2 hours per
week each on school management, working with parents,
and extracurricular activities.
© OECD 2014 A TeAchers’ guide TO TALis 9
• Expandtheirknowledgeof
pedagogy in the subjects they
teach; that may free them
to explore the use of active,
student-centred teaching
practices, such as having
students work in small groups
or having them work on projects
that take longer than a week to
complete.
• Engageinsomekindof
professional development
activity – whether attending
workshops and conferences,
observing other teachers,
individual or collaborative
research, or mentoring – as
TALIS results show that teachers
who do engage in these types
of activities are more likely to
use student-centred teaching
practices.
• Participateinmentoringsystems
to enhance co-operation
among colleagues, build trust
and promote a positive school
climate. Co-operation is not only
a way of sharing and comparing
teaching practices, it can also
lead to the development of more
effective responses to student
misbehaviour and disruptions in
class.
• Reporttotheschoolleaderon
daily or weekly inefficiencies,
such as administrative tasks that
might be performed by support
staff or automated, so that more
time can be devoted to teaching.
Whatteacherscan do
Administrative tasks and disciplining disruptive students also take time away from teaching.
In about half of the TALIS-participating countries/
economies, one in four teachers reports spending at
least 30% of lesson time handling classroom disruptions
and administrative tasks. In Brazil, Chile, Malaysia and
Singapore, one in four teachers reports spending at
least 40% of lesson time on these tasks.
One in two teachers in Brazil, Malaysia and Singapore
reports spending 15% or more of lesson time on keeping
order in the classroom. In contrast, one in two teachers
in Bulgaria, Croatia, the Czech Republic, Estonia, Latvia,
Poland and Romania reports spending 5% or less of lesson
time on keeping order. Nearly one in three teachers,
on average, reports losing “quite a lot of time” due to
behavioural problems or waiting for students to settle
down. Just over one in four teachers (26%) report
that there is a lot of disruptive noise in their classrooms.
The climate in the classroom has a strong impact on how confidentteachersfeelabouttheirownabilitytoteachandontheiroveralljobsatisfaction.
TALIS finds that teachers who report that they teach classes
where more than one in ten students are low academic
achievers or have behavioural problems report significantly
less confidence in their teaching abilities (lower self-
efficacy) and report less job satisfaction.
© OECD 2014 A TeAchers’ guide TO TALis10
Average hours spent working and teaching per week
united States
Chile
Alberta (Canada)
Brazil
Mexico
Abu dhabi (united Arab emirates)
estonia
Portugal
Finland
Slovak Republic
england (united Kingdom)
Croatia
Average
Latvia
Flanders (Belgium)
iceland
denmark
Korea
Spain
Poland
France
Australia
Bulgaria
Serbia
israel
Czech Republic
Japan
Sweden
italy
Singapore
Malaysia
Netherlands
Romania
Norway
0 10 20 30 40 50
0 10 20 30 40 50
Countries are ranked in descending order of hours spent on teaching.
Source: OECD, TALIS 2013 Database.
Total working hours
Hours spent on teaching
Average number of 60-minute hours teachers report that they spent on teaching during the most recent complete calendar week
Hours per week
© OECD 2014 A TeAchers’ guide TO TALis 11
• Participateininstructional
leadership training. More than
one in five (22%) principals report
that they had never participated
in instructional training, and 31%
report that they had, but only
after becoming a principal.
• Giveteacherstheopportunity
to participate in professional
development activities, both
those related to improving their
practice and those that focus
on using class time effectively.
These activities can – and
should – include collaboration
and mentoring activities within
the school itself. They build
trust, encourage co-operation
and promote a positive school
climate.
What
school leaders can do
how do school leaders support their teachers?
School principals are the link between teachers, students and their parents or guardians, the education system and the wider community. Many also see principals as contributing to student achievement through their impact on how the school is organised, on the climate in the school and, especially, on teachers and teaching. School leaders can set the tone for teachers by encouraging teachers to co-operate with each other to develop new teaching practices and take responsibility for improving their teaching skills, and by ensuring that teachers feel responsiblefortheirstudents’learningoutcomes.Thesepractices are part of what is known as instructional leadership, which is considered by many educators to be themostimportantofallprincipals’tasks.
By encouraging teachers to learn from one another, principals help teachers to keep their teaching methods up-to-date and may also help to develop more collaboration among teachers in their schools.
TALIS finds that an average of 64% of principals report
that they frequently take action to support co-operation
among teachers to develop new teaching practices.
In Chile, Malaysia, Romania, Serbia, the Slovak Republic
and Abu Dhabi (United Arab Emirates), between 80% and
98% of principals report that they frequently support
co-operation among their teachers to develop new
practices, while in Denmark, Estonia, Japan, the Netherlands
and Flanders (Belgium), more than 50% of principals
report that they never, rarely or only sometimes do this.
TALIS also finds that when principals exhibit greater
instructional leadership, they are also more likely to
develop a professional development plan for their school
(this relationship was observed in 13 countries), sit in
on classes and observe them as part of a formal teacher
appraisal system (20 countries), and report there is
a high level of mutual respect among colleagues at the
school (19 countries). These principals also tend to
spend more time on curriculum and teaching-related tasks.
© OECD 2014 A TeAchers’ guide TO TALis12
Teacher co-operation
Spain
iceland
France
Brazil
Flanders (Belgium)
Portugal
Finland
Croatia
italy
israel
Sweden
Mexico
Chile
Alberta (Canada)
united States
Norway
denmark
Average
Australia
Malaysia
Czech Republic
Bulgaria
estonia
Netherlands
Serbia
Slovak Republic
Abu dhabi (united Arab emirates)
Singapore
england (united Kingdom)
Poland
Romania
Latvia
Japan
Korea
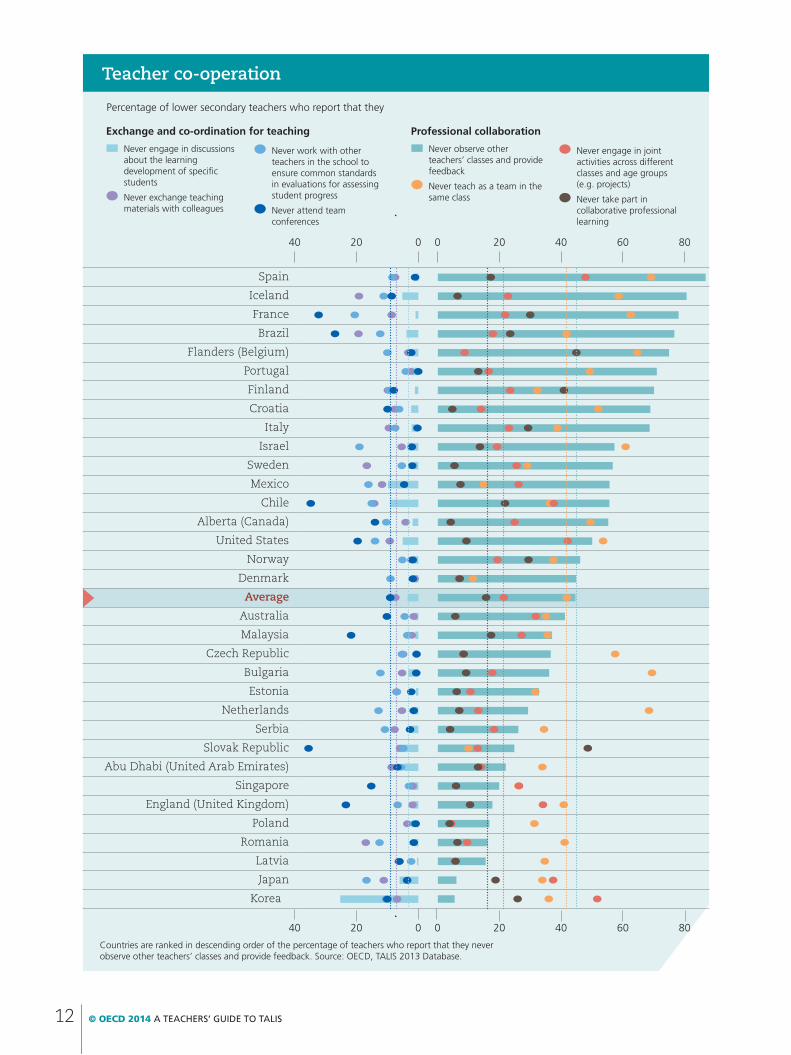
Countries are ranked in descending order of the percentage of teachers who report that they never observeotherteachers’classesandprovidefeedback.Source:OECD,TALIS2013Database.
0 20 40 60 8040 20 0
0 20 40 60 8040 20 0
Percentage of lower secondary teachers who report that they
Exchange and co-ordination for teaching Professional collaboration
Never engage in discussions about the learning developmentofspecificstudents
Never exchange teaching materials with colleagues
Never work with other teachers in the school to ensure common standards in evaluations for assessing student progress
Never attend team conferences
Never observe other teachers’classesandprovidefeedback
Never teach as a team in the same class
Neverengageinjointactivities across different classes and age groups (e.g.projects)
Never take part in collaborative professional learning
© OECD 2014 A TeAchers’ guide TO TALis 13
To what extent do teachers participate in professional development activities?
No matter how good initial teacher education is, it cannot be expected to prepare teachers for all the challenges theywillfaceduringtheirfirstjobasateacher.Inductionand mentoring programmes can provide teachers new to a school or new to teaching with invaluable assistance as theyfacetheirfirststudents.
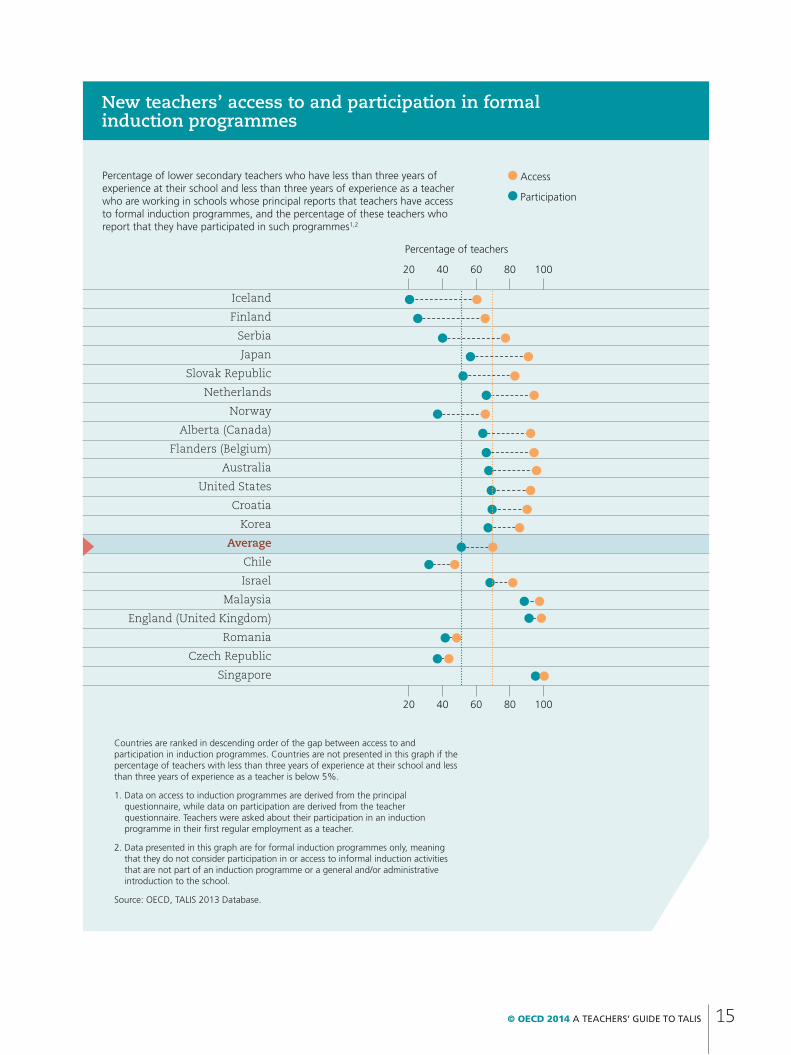
TALIS results find that around 75% of teachers work in
schools whose principals report that informal induction
programmes are offered, and the same proportion
work in schools whose principals report that mentoring
programmes are available. In Australia, Malaysia, the
Netherlands, Singapore, England (United Kingdom) and
Flanders (Belgium), formal induction programmes are
virtually universal for all teachers new to a school. While
at least nine out of ten teachers in Australia, Finland,
Iceland, Malaysia, Singapore and Flanders (Belgium) are
in schools that offer informal induction activities for new
teachers, fewer than 40% teachers in Japan and Mexico
work in schools that offer these activities.
But only around one in two teachers reports that he
or she had participated in a formal induction programme.
This indicates a significant difference between the
reported availability of these programmes and teachers’
participation in them.
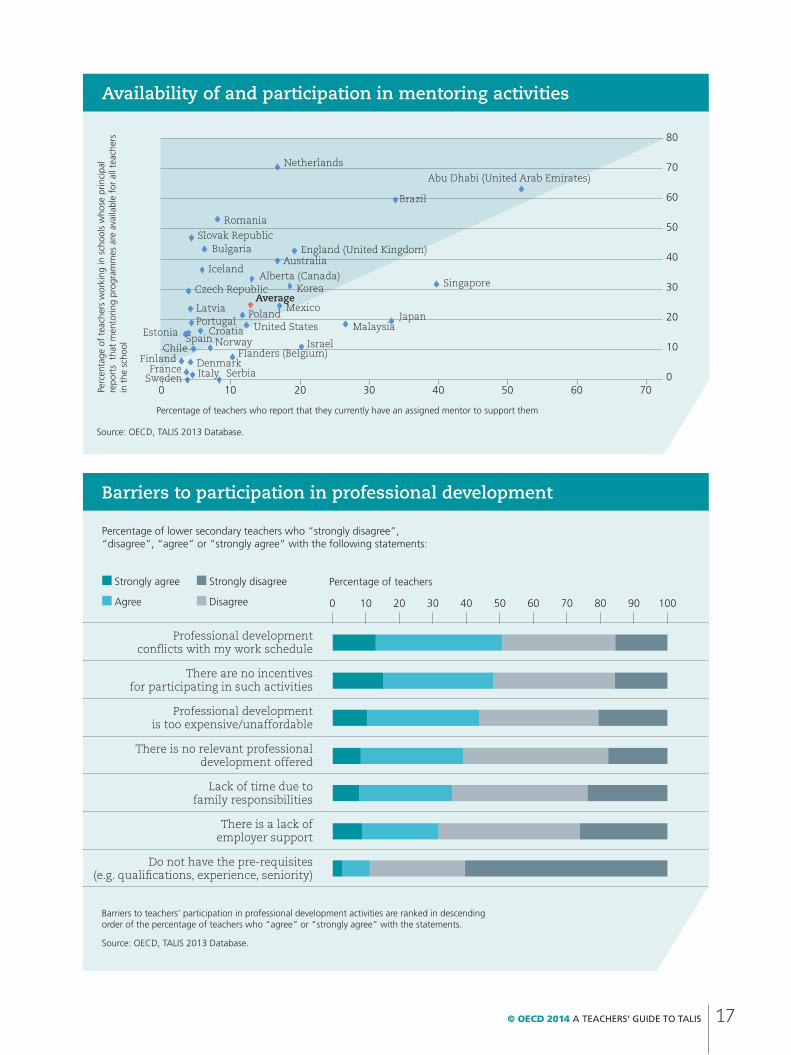
Some 14% of teachers, on average, report that they
currently serve as mentors for other teachers; but in
19 participating countries and economies, fewer than
one in ten teachers reports that he or she currently
enjoys the support of a mentor.
> Charts pages 15 and 17
But for teachers, learning doesn’t stop once teachingbegins. Professional development, at all points in a teacher’s career, is necessary to keep upwith changingresearch,tools,practicesandstudents’needs.Andthereisno better way to communicate to students the importance of lifelong learning than by teachers, themselves, setting the example of being lifelong learners.
Nearly nine in ten (88%) teachers report that they had
participated in at least one professional development
activity during the 12 months prior to the survey. Some
71% report that they had participated in at least one
course or workshop, 44% report that they had attended
an education conference or seminar, and 37% report that
they had participated in a teacher network.
• Participateininduction
programmes, mentoring
programmes and other
professional development
activities when they’re offered.
• Iftheseprogrammesarenot
offered in the school, encourage
school leaders to make them
available. These activities do
not have to be costly or involve
external experts. For example,
collaboration among teachers
within a school can result in
effective mentoring systems.
Teachers should participate,
both as mentors and as mentees,
regardless of their level of work
experience. They could also
form or join already established
collaborative research groups
and teacher networks, and/or
simply observe their colleagues
as they teach.
Whatteacherscan do
© OECD 2014 A TeAchers’ guide TO TALis14
• Offerformalinduction
programmes to all new teachers.
• Encourageteacherstoparticipate
in mentoring programmes.
School leaders should give
teachers the time to participate
in these programmes and
arrange pairings of mentors/
mentees who teach the same
subject.
• Giveteachersthesupport
they need to participate in
professional development
activities. Such support can
include paying fees, scheduling
time for training during the
school day, modifying the school
schedule to allow for team-
teaching or peer observation
and feedback, and recognising
teachers’ participation in
these activities in front of the
teachers’ colleagues. Creating
opportunities for professional
development activities within
the school or among nearby
schools can be a relatively
inexpensive way of promoting
lifelong learning and fostering
co-operation among teachers.
What
school leaders can do
Large proportions of teachers report that they had
participated in professional development activities that
focused on their knowledge and understanding of their
subject (73%) or that focused on their pedagogical skills
in teaching their subject (68%). And in almost all TALIS-
participating countries and economies, around nine in ten teachers report that the professional development
activity that focused on their knowledge and understanding
of their subject and on their pedagogical skills had a
moderate or large positive impact on their teaching.
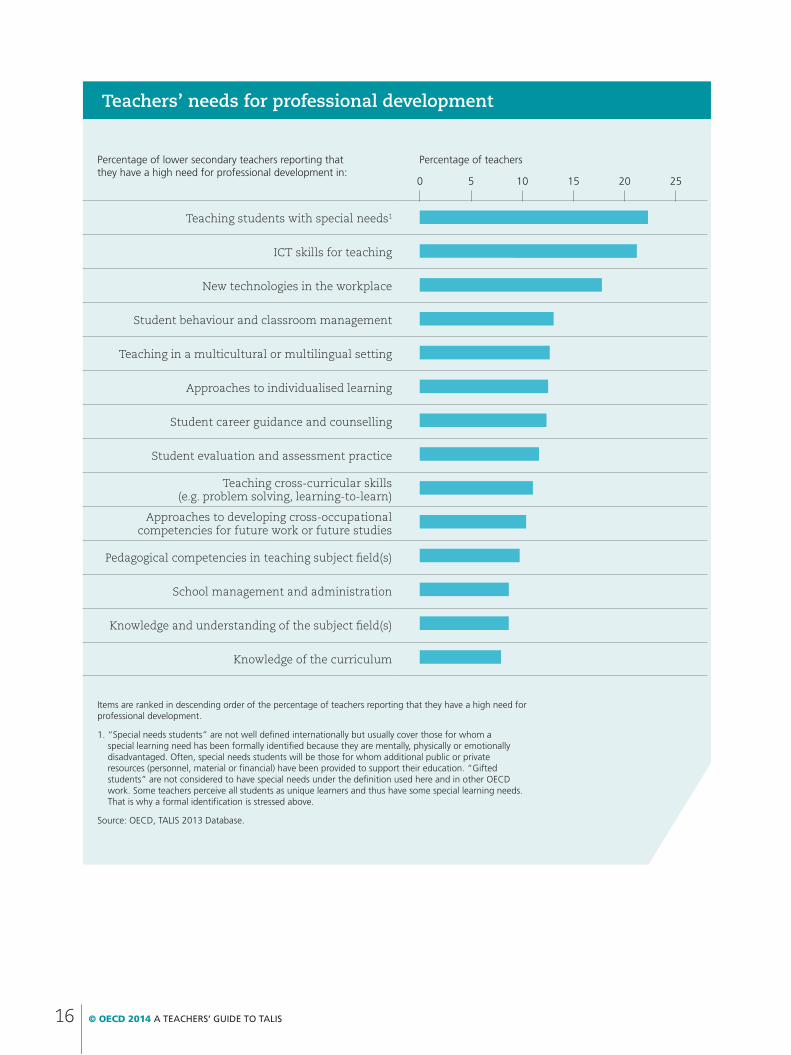
Some 22% of teachers report that they would like more
professional development activities related to teaching
students with special needs (in Brazil, 60% of teachers
report so, and in Mexico, 47% of teachers do). Yet only
32% of teachers report that they had participated in such
activities. The second and third most often cited areas for
further learning are related to teaching with information
and communication technologies (ICT) (19% of teachers
so report) and to using new technologies in the workplace
(18% of teachers).
> Chart page 16
But what accounts for the discrepancy between the availability of professional development activities and teachers’participationinthem?
TALIS finds that, across participating countries and
economies, teachers most often cite conflicts with their
work schedule (51% of teachers) and a lack of incentives
(48%) as barriers to participating in professional
development activities.
At least three out of four teachers in Japan (86%), Korea
(83%) and Portugal (75%) cite conflicts with their
work schedule, while large proportions of teachers in Italy
(83%), Portugal (85%) and Spain (80%) report a lack
of incentives for participating. Some 44% of teachers, on
average, consider professional development activities to be
too expensive.
> Chart page 17
© OECD 2014 A TeAchers’ guide TO TALis 15
New teachers’ access to and participation in formal induction programmes
iceland
Finland
Serbia
Japan
Slovak Republic
Netherlands
Norway
Alberta (Canada)
Flanders (Belgium)
Australia
united States
Croatia
Korea
Average
Chile
israel
Malaysia
england (united Kingdom)
Romania
Czech Republic
Singapore
Countries are ranked in descending order of the gap between access to and participation in induction programmes. Countries are not presented in this graph if the percentage of teachers with less than three years of experience at their school and less than three years of experience as a teacher is below 5%.
1. Data on access to induction programmes are derived from the principal questionnaire, while data on participation are derived from the teacher questionnaire. Teachers were asked about their participation in an induction programmeintheirfirstregularemploymentasateacher.
2. Data presented in this graph are for formal induction programmes only, meaning that they do not consider participation in or access to informal induction activities that are not part of an induction programme or a general and/or administrative introduction to the school.
Source: OECD, TALIS 2013 Database.
Percentage of lower secondary teachers who have less than three years of experience at their school and less than three years of experience as a teacher who are working in schools whose principal reports that teachers have access to formal induction programmes, and the percentage of these teachers who report that they have participated in such programmes1,2
Access
Participation
20 40 60 80 100
20 40 60 80 100
Percentage of teachers
© OECD 2014 A TeAchers’ guide TO TALis16
Teachers’ needs for professional development
Items are ranked in descending order of the percentage of teachers reporting that they have a high need for professional development.
1.“Specialneedsstudents”arenotwelldefinedinternationallybutusuallycoverthoseforwhomaspeciallearningneedhasbeenformallyidentifiedbecausetheyarementally,physicallyoremotionallydisadvantaged. Often, special needs students will be those for whom additional public or private resources(personnel,materialorfinancial)havebeenprovidedtosupporttheireducation.“Giftedstudents”arenotconsideredtohavespecialneedsunderthedefinitionusedhereandinotherOECDwork. Some teachers perceive all students as unique learners and thus have some special learning needs. Thatiswhyaformalidentificationisstressedabove.
Source: OECD, TALIS 2013 Database.
Teaching students with special needs1
iCT skills for teaching
New technologies in the workplace
Student behaviour and classroom management
Teaching in a multicultural or multilingual setting
Approaches to individualised learning
Student career guidance and counselling
Student evaluation and assessment practice
Teaching cross-curricular skills (e.g. problem solving, learning-to-learn)
Approaches to developing cross-occupational competencies for future work or future studies
Pedagogical competencies in teaching subject field(s)
School management and administration
Knowledge and understanding of the subject field(s)
Knowledge of the curriculum
Percentage of teachers
0 5 10 15 20 25
Percentage of lower secondary teachers reporting that they have a high need for professional development in:
© OECD 2014 A TeAchers’ guide TO TALis 17
Availability of and participation in mentoring activities
Source: OECD, TALIS 2013 Database.
Barriers to participation in professional development
Professional development conflicts with my work schedule
There are no incentives for participating in such activities
Professional development is too expensive/unaffordable
There is no relevant professional development offered
Lack of time due to family responsibilities
There is a lack of employer support
do not have the pre-requisites (e.g. qualifications, experience, seniority)
80
70
60
50
40
30
20
10
10 20 30 40 50 60 700
0
iceland
Latvia PolandPortugal
estonia
denmarkFlanders (Belgium)
Mexico
Finland
Sweden
Spain
italyFrance Serbia
Japan
Slovak RepublicBulgaria
Abu dhabi (united Arab emirates)
Netherlands
Brazil
Norway
Alberta (Canada)
Australia
united StatesCroatia
Korea
Chile israel
Romania
Czech RepublicSingapore
Malaysia
england (united Kingdom)
Average
Perc
enta
ge o
f te
ache
rs w
orki
ng in
sch
ools
who
se p
rinci
pal
repo
rts
tha
t m
ento
ring
prog
ram
mes
are
ava
ilabl
e fo
r al
l tea
cher
s in
the
sch
ool
Percentage of teachers who report that they currently have an assigned mentor to support them
Percentage of lower secondary teachers who “strongly disagree”, “disagree”, “agree” or “strongly agree” with the following statements:
Barrierstoteachers’participationinprofessionaldevelopmentactivitiesarerankedindescendingorder of the percentage of teachers who “agree” or “strongly agree” with the statements.
Source: OECD, TALIS 2013 Database.
Percentage of teachers
100 3020 5040 7060 9080 100
Strongly disagree
Disagree
Strongly agree
Agree
© OECD 2014 A TeAchers’ guide TO TALis18
To what extent do schools use teacher appraisals?
Appraising teachers and providing them with feedback about their practices recognises and celebrates great teaching even as it challenges teachers to confront and address their weaknesses. Constructive and fair teacher appraisal and feedback have been shown to have a positiveeffectonteachers’jobsatisfactionandontheirfeelingsofself-efficacy.
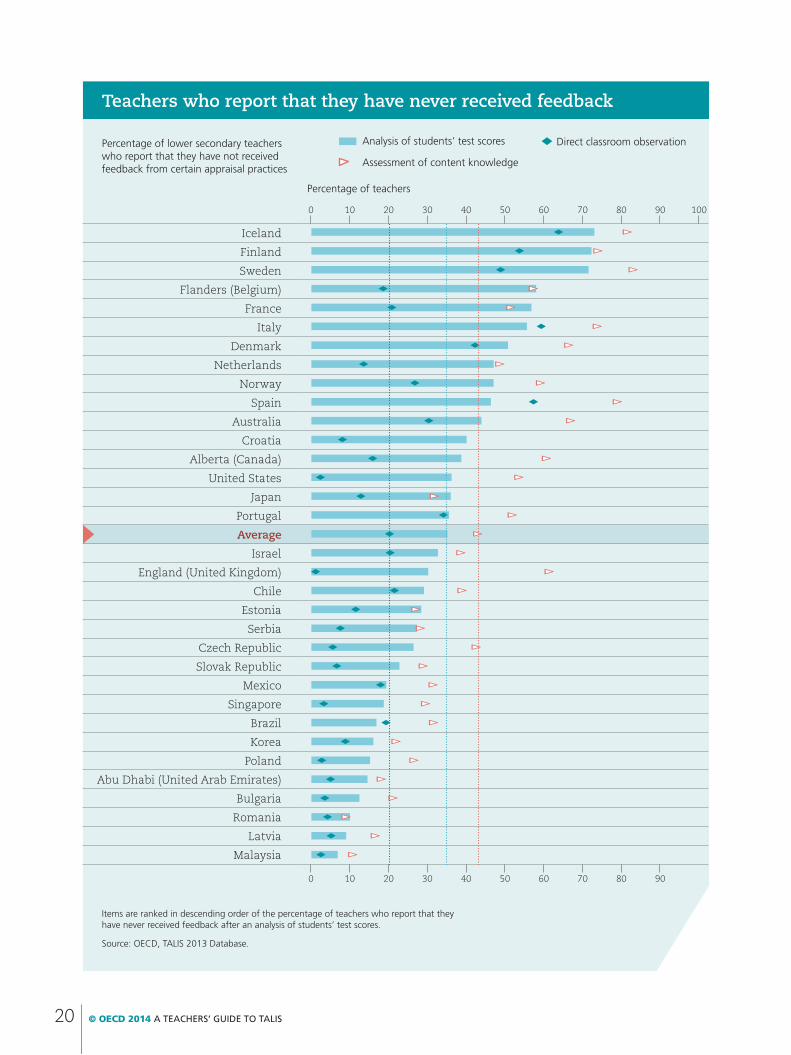
Some 88% of teachers, on average, report that they
receive feedback in their school. But in Denmark, Finland,
Iceland, Italy, Spain and Sweden between 22% and 45%
of teachers report that they have never received feedback
in their current school.
More than one in two teachers (54%, on average) report
receiving feedback from their school principal; slightly
fewer (49%) report that they receive feedback from
members of the school management team. Meanwhile,
fewer than one in two teachers (42%) reports that he
or she receives feedback from other teachers, and only
29% of teachers report that they receive feedback from
individuals or bodies external to their schools.
Nearly 80% of teachers, on average, report that they
receive feedback following some sort of classroom
observation; but fewer than one in two teachers in
Finland, Iceland, Italy and Spain reports receiving feedback
following a classroom observation. In these countries,
comparatively small proportions of teachers report that
they receive any feedback in their school.
> Chart page 20
• Regardappraisalsandfeedback
as tools to improve teaching
practices to, in turn, improve
student learning.
• Workwithotherteachers
to develop a system of peer
feedback on all aspects of
teaching, from lesson planning
and classroom practice to
student evaluation.
Whatteacherscan do
© OECD 2014 A TeAchers’ guide TO TALis 19
• Fosteraclimateinwhichpeer
appraisal, in addition to direct
feedback from the school leader
or school management team,
can take place. Collaborative
exchanges among teachers offer
good opportunities for teachers
to learn about their own practice
and find support for professional
development.
• Helpteachersidentifytheir
individual professional
development needs and
incorporate these into the
school’s priorities.
What
school leaders can do
Appraising teachers and offering them feedback on theirworkisessentialforimprovingindividualteachers’performance in class; but these practices are only effective if they are tied to real and meaningful consequences.
TALIS results find that while teacher feedback is related
to changes in job responsibilities for most teachers,
and career advancement for just over one in three
teachers, on average, fewer teachers report that it is linked
to their salary. On average, only one in four teachers
reports that the feedback that he or she receives has had
a moderate or large positive impact on his or her salary or
that he or she has received a financial bonus as a result of
feedback.
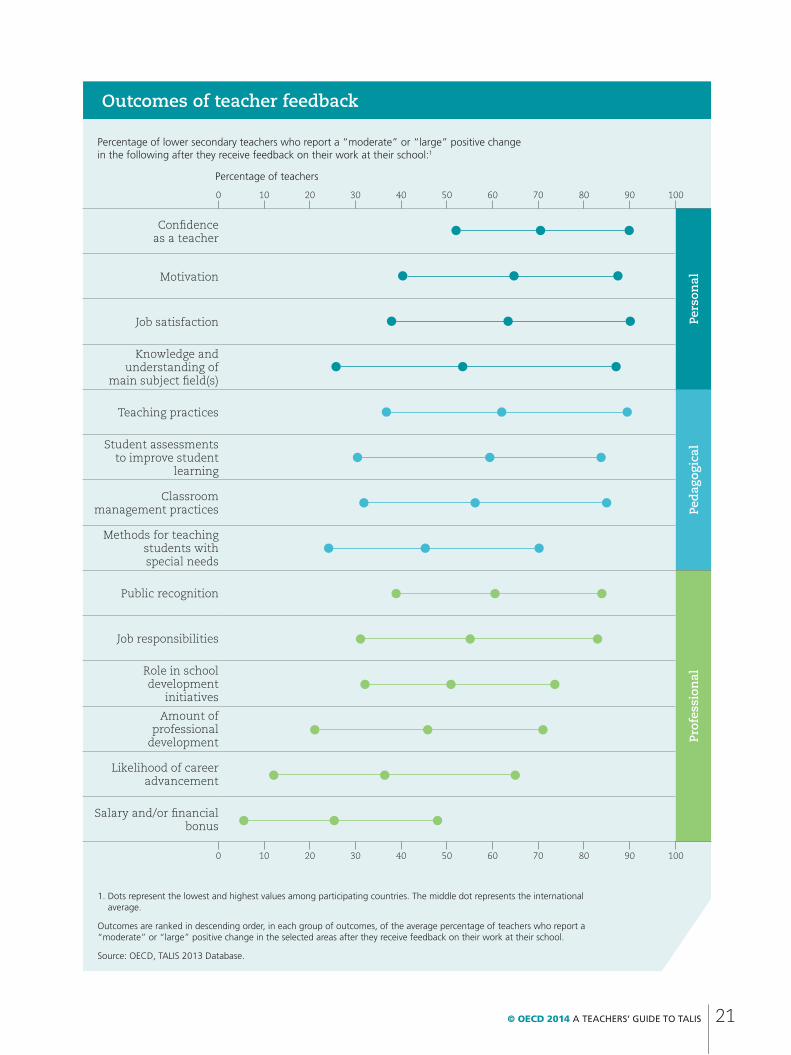
On average across TALIS-participating countries and
economies, 62% of teachers report that the feedback
they receive in their school leads to moderate or large
positive changes in their teaching practices: more than one
in two teachers report moderate to large improvements in
their use of student assessments (59%) and in classroom
management practices (56%), and 45% of teachers
report moderate or large improvements in the methods
they use for teaching students with special needs.
However, 43% of teachers, on average across TALIS-
participating countries and economies, report that the
teacher appraisal and feedback system in their school has
little impact on classroom teaching. Slightly more than one
in two teachers report that teacher appraisal and feedback
is largely undertaken to fulfil administrative requirements.
> Chart page 21
© OECD 2014 A TeAchers’ guide TO TALis20
Teachers who report that they have never received feedback
iceland
Finland
Sweden
Flanders (Belgium)
France
italy
denmark
Netherlands
Norway
Spain
Australia
Croatia
Alberta (Canada)
united States
Japan
Portugal
Average
israel
england (united Kingdom)
Chile
estonia
Serbia
Czech Republic
Slovak Republic
Mexico
Singapore
Brazil
Korea
Poland
Abu dhabi (united Arab emirates)
Bulgaria
Romania
Latvia
Malaysia
0 20 40 60 80 10010 30 50 70 90
Items are ranked in descending order of the percentage of teachers who report that they haveneverreceivedfeedbackafterananalysisofstudents’testscores.
Source: OECD, TALIS 2013 Database.
Assessment of content knowledge
Direct classroom observationAnalysisofstudents’testscores
0 20 40 60 8010 30 50 70 90
Percentage of lower secondary teachers who report that they have not received feedback from certain appraisal practices
Percentage of teachers
© OECD 2014 A TeAchers’ guide TO TALis 21
outcomes of teacher feedback
Percentage of teachers
Confidence as a teacher
Pers
onalMotivation
Job satisfaction
Knowledge and understanding of
main subject field(s)
Teaching practices
Ped
agog
ical
Student assessments to improve student
learning
Classroom management practices
Methods for teaching students with special needs
Public recognition
Prof
essi
onal
Job responsibilities
Role in school development
initiatives
Amount of professional
development
Likelihood of career advancement
Salary and/or financial bonus
0 20 40 60 80 10010 30 50 70 90
1. Dots represent the lowest and highest values among participating countries. The middle dot represents the international average.
Outcomes are ranked in descending order, in each group of outcomes, of the average percentage of teachers who report a “moderate” or “large” positive change in the selected areas after they receive feedback on their work at their school.
Source: OECD, TALIS 2013 Database.
0 20 40 60 8010 30 50 70 90 100
Percentage of lower secondary teachers who report a “moderate” or “large” positive change in the following after they receive feedback on their work at their school:1
© OECD 2014 A TeAchers’ guide TO TALis22
Do our teachers feel confident in their ability to teach?
In general, the more years of teaching experience, the greaterthesenseofself-efficacy.
In most countries, more experienced teachers tend
to report greater self-efficacy: in Denmark, France,
Italy, Japan, Latvia, Singapore, Sweden, Abu Dhabi
(United Arab Emirates), Alberta (Canada) and Flanders
(Belgium), teachers’ sense of self-efficacy is much higher
among those with more than five years of teaching
experience compared to their less-experienced colleagues.
With debate about the ideal class size still raging in many countries,TALISfinds that,when it comes to teachers’self-efficacy, it’s not the number of students but thekinds of students in their classes that has the strongest impactonteachers’feelingsofself-confidence.
Class size seems to have only a minimal impact on teaching
efficacy in just a few countries. But in many TALIS-
participating countries and economies, teachers who report
that they teach classes where more than one in ten
students are low academic achievers or have behavioural
problems also report significantly lower levels of self-
efficacy.
TALIS results also show that, in many countries, the lower
levels of self-efficacy that teachers report when they teach
classes with larger proportions of low achievers or students
with behavioural problems stem largely from the fact that
they have to spend more time keeping order in the class –
and thus, necessarily, less time actually teaching.
While TALIS doesn’t – and can’t – measure teachers’effectiveness in the classroom, it does ask teachers to describe their ability to manage their classes, provide instruction, and engage their students in learning. Research has shown that when teachers are more confidentabouttheirownabilitiestoteach(greaterself-efficacy)theirstudentstendtodobetterinschoolandaremore motivated to learn, and the teachers, themselves, tend to use more effective instructional practices, have greater enthusiasm for, and are more committed to, teaching, and report greater job satisfaction. Equally,lower levelsofself-efficacyamongteachersare relatedto more problems with student misbehaviour, pessimism about student learning, greater job-related stress, andlessjobsatisfaction.
In the majority of TALIS-participating countries and
economies, between 80% and 92% of teachers, on
average, answer survey questions in a way that suggests
that they have high levels of self-efficacy. Teachers in
the Czech Republic, Japan, Korea, Norway and Spain,
however, report less self-efficacy than average in several
areas of their practice.
© OECD 2014 A TeAchers’ guide TO TALis 23
The quality of the relationships teachers have with their colleagues and their students also affects their self-confidence.
In all TALIS-participating countries, when teachers report
more positive relationships with students and collaborative
relationships with other teachers, they also report
significantly higher levels of self-efficacy. In fact, in many
countries, the association with self-efficacy is stronger
with teacher-teacher relations than with teacher-student
relations.
Indeed, TALIS results show that good interpersonal relations in school can at least partly offset the negative impact on teachers’ sense of self-efficacy of teachingclasseswith significantproportionsof low-achievers orstudents with behavioural problems.
In Brazil, France, Italy, Mexico, Portugal, Romania, Serbia,
Spain and Abu Dhabi (United Arab Emirates), the strength
of the association between self-efficacy and teaching
more low-achievers is weaker or no longer significant
when teachers have good working relationships with their
colleagues and students. In Australia, Croatia, the Czech
Republic, Denmark, Israel, Poland, Portugal, Romania, Spain,
Abu Dhabi (United Arab Emirates) and England (United
Kingdom), the association between self-efficacy and
teaching more students with behavioural problems is also
weaker when teachers have good working relationships in
school.
When teachers have a say in how their school functions, theyalsotendtoexpresshigherlevelsofself-efficacy.
In 20 countries, teachers who agree that staff at their
school are given opportunities to participate in decision
making report greater self-efficacy.
Being well-prepared for teaching by participating in professional development activities, particularly those that focus on classroom management, instruction, and student engagement with learning, also has a positive impactonteachers’self-efficacy.
In 14 of the TALIS-participating countries, teachers who
report that they had participated in a formal induction
programme also report higher levels of self-efficacy; but
in France, teachers who report that they had participated
in such programmes report lower levels of self-efficacy.
In Chile, the Czech Republic, Latvia and Norway, the
relationship between self-efficacy and participation in a
formal induction programme is moderately strong, while it
is particularly strong in Poland.
While participating in a mentoring system does not seem to
be consistently related to greater self-efficacy, acting as a
mentor tends to be related to higher levels of self-efficacy
than being mentored. This relationship is particularly strong
in France, Japan and Korea, where teachers who report
that they are mentors to their colleagues also report much
higher levels of self-efficacy.
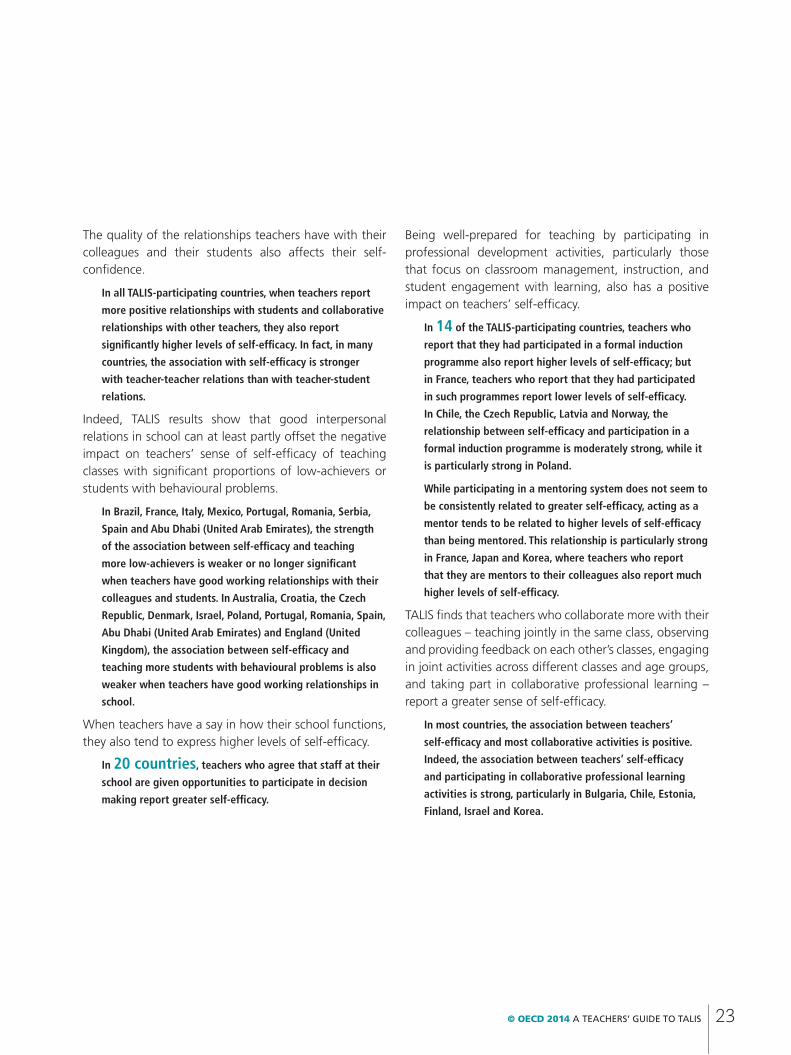
TALISfindsthatteacherswhocollaboratemorewiththeircolleagues–teachingjointlyinthesameclass,observingandprovidingfeedbackoneachother’sclasses,engaginginjointactivitiesacrossdifferentclassesandagegroups,and takingpart in collaborativeprofessional learning–reportagreatersenseofself-efficacy.
In most countries, the association between teachers’
self-efficacy and most collaborative activities is positive.
Indeed, the association between teachers’ self-efficacy
and participating in collaborative professional learning
activities is strong, particularly in Bulgaria, Chile, Estonia,
Finland, Israel and Korea.
© OECD 2014 A TeAchers’ guide TO TALis24
Teachers’ self-efficacy and professional collaboration
Source: OECD, TALIS 2013 Database.
Never
Once a year or less
2-4 times a year
5-10 times a year
1-3 times a month
Once a week or more
Teach as a team in the same class
Observeotherteachers’classes and provide feedback
Engageinjointactivitiesacrossdifferent classes and age groups
Take part in collaborative professional learning
Low self-efficacy
High self-efficacy
© OECD 2014 A TeAchers’ guide TO TALis 25
Do our teachers derive satisfaction from their daily work, and from being teachers?
While more than nine out of ten (91%) teachers across TALIS-participating countries and economies report that, overall,theyaresatisfiedwiththeirjobs,andnearlyeightin ten (78%) report that, if they had to make the decision again,they’dstillchoosetobecometeachers,fewerthanone in three teachers believes that teaching is a valued profession in society. This perception can have a chilling effect on recruiting and retaining high-quality candidates for the teaching profession; but it is not immutable: in all but one TALIS country, teachers who participate more in decision making in their school are also more likely to report that society values the teaching profession.
In Croatia, France, the Slovak Republic, Spain and Sweden,
fewer than one in ten teachers believes that teaching
is a valued profession. By contrast, in Korea, Malaysia,
Singapore and Abu Dhabi (United Arab Emirates), at least
two out of three teachers report that they believe
their society values teaching as a profession.
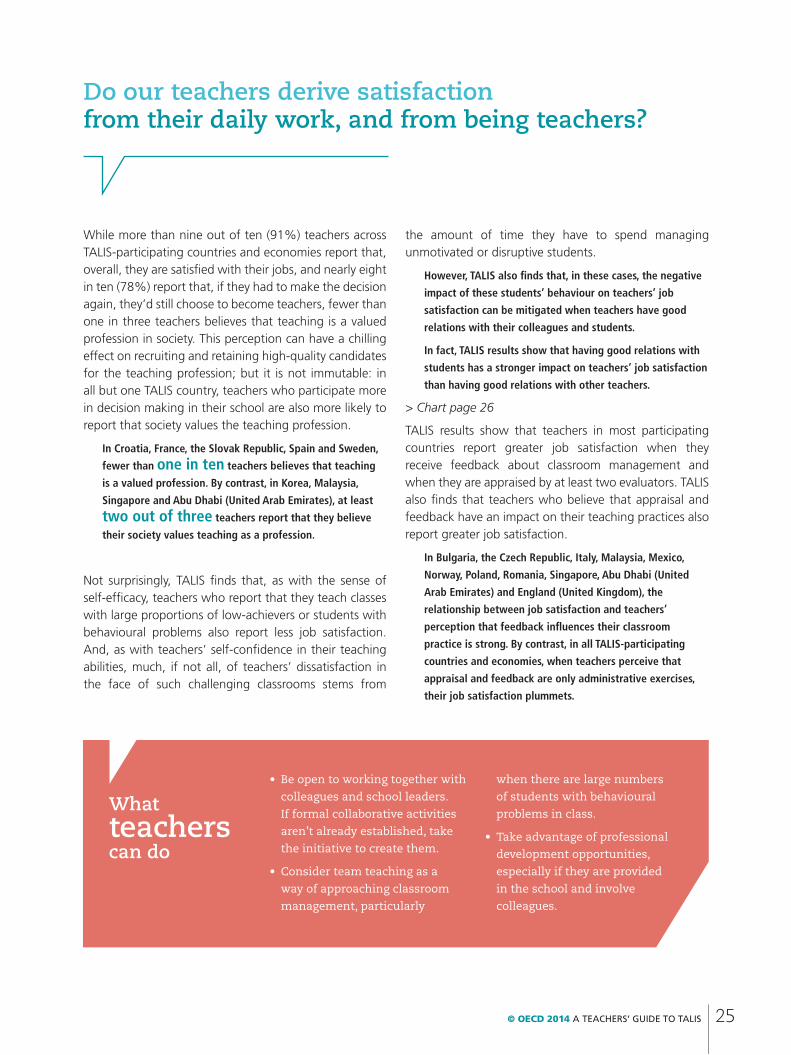
Not surprisingly, TALIS finds that, aswith the senseofself-efficacy,teacherswhoreportthattheyteachclasseswith large proportions of low-achievers or students with behavioural problems also report less job satisfaction.And,aswithteachers’self-confidenceintheirteachingabilities,much, ifnotall,of teachers’dissatisfaction inthe face of such challenging classrooms stems from
the amount of time they have to spend managing unmotivated or disruptive students.
However, TALIS also finds that, in these cases, the negative
impact of these students’ behaviour on teachers’ job
satisfaction can be mitigated when teachers have good
relations with their colleagues and students.
In fact, TALIS results show that having good relations with
students has a stronger impact on teachers’ job satisfaction
than having good relations with other teachers.
> Chart page 26
TALIS results show that teachers in most participating countries report greater job satisfaction when theyreceive feedback about classroom management and when they are appraised by at least two evaluators. TALIS alsofinds that teacherswhobelieve thatappraisalandfeedback have an impact on their teaching practices also reportgreaterjobsatisfaction.
In Bulgaria, the Czech Republic, Italy, Malaysia, Mexico,
Norway, Poland, Romania, Singapore, Abu Dhabi (United
Arab Emirates) and England (United Kingdom), the
relationship between job satisfaction and teachers’
perception that feedback influences their classroom
practice is strong. By contrast, in all TALIS-participating
countries and economies, when teachers perceive that
appraisal and feedback are only administrative exercises,
their job satisfaction plummets.
• Beopentoworkingtogetherwith
colleagues and school leaders.
If formal collaborative activities
aren’t already established, take
the initiative to create them.
• Considerteamteachingasa
way of approaching classroom
management, particularly
when there are large numbers
of students with behavioural
problems in class.
• Takeadvantageofprofessional
development opportunities,
especially if they are provided
in the school and involve
colleagues.
Whatteacherscan do
© OECD 2014 A TeAchers’ guide TO TALis26
Teachers’ job satisfaction and class composition
Lowjobsatisfaction
Highjobsatisfaction
Lowjobsatisfaction
Highjobsatisfaction
Note: Data on class size and students with behavioural problems are reported by teachers and refer to a randomly chosen class they currently teach.
Source: OECD, TALIS 2013 Database.
15 or fewer
16-20
21-25
26-30
31-35
36 or more
None
1% to 10%
11% to 30%
31% or more
Students with behavioural problems
Class size (number of students)
© OECD 2014 A TeAchers’ guide TO TALis 27
• Developmeaningfulappraisal
and feedback systems that are
linked to teachers’ practice and,
ultimately, to improving teaching
and learning.
• Giveteachersasayinhowthe
school is managed. Teachers
who report that they are given
opportunities to participate
in decision making at school
also report higher levels of
job satisfaction in all TALIS-
participating countries and, in
most countries, a greater sense
of self-efficacy. Teachers are
on the “front lines” of learning,
and so may have a better idea
than school leaders of how the
curriculum is actually translated
in class and how students are
performing.
• Provideopportunitiesand
support to build relationships
within the school. This support
could be in the form of a physical
space where teachers can meet
or by setting aside time away
from class or administrative
work to allow teachers to meet
and develop relationships with
students or colleagues.
• Encouragecollaborationamong
teachers. TALIS data show that
teachers benefit from collaboration
with their colleagues, whether
in professional development
activities or team teaching.
While collaboration may require
adjustments to teachers’
schedules, the benefits to teachers’
practices – and to teachers’
morale – are likely to outweigh any
administrative inconveniences.
What
school leaders can do
As for most professionals, teachers derive the most satisfaction from their work when they feel that they are treated as professionals, when their opinions are sought and valued, and when they feel they have a say in how they work.
TALIS finds that, across all participating countries, when
teachers report that they are given opportunities to
participate in decision making at school they also report
higher job satisfaction.
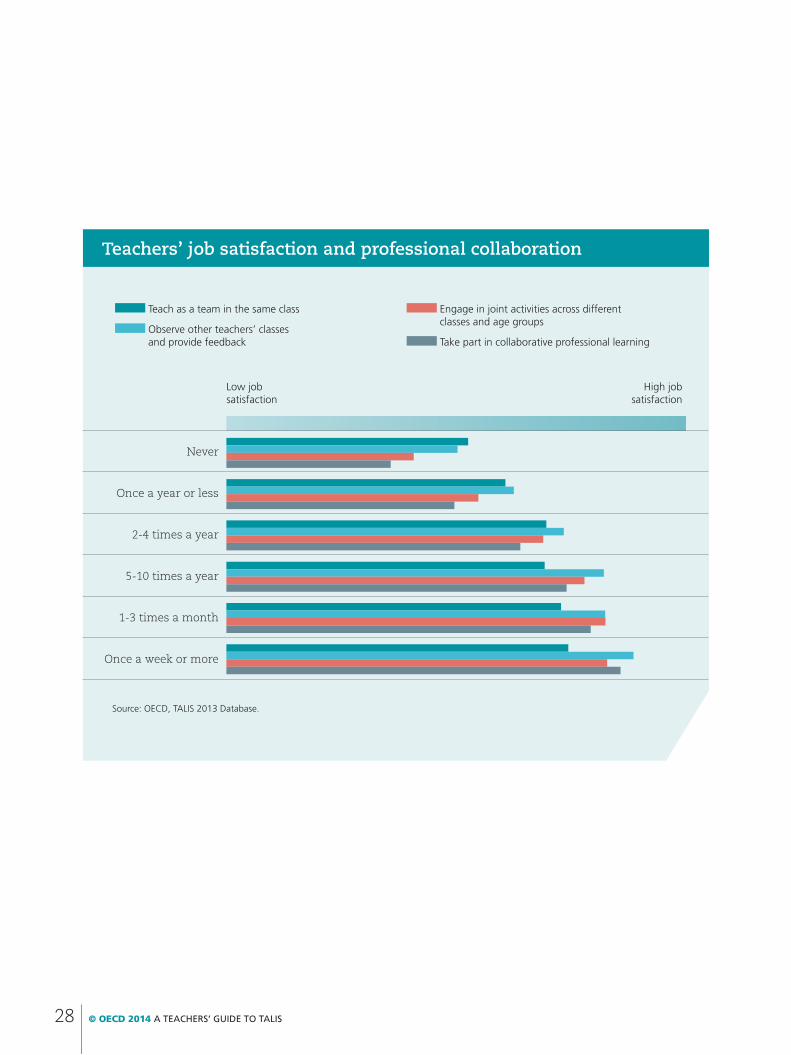
Similarly, when teachers work closely with their colleagues,whether teaching or learning together, jobsatisfaction increases substantially.
As with teacher self-efficacy, the strongest association
between job satisfaction and collaboration with colleagues
involves participating in collaborative professional learning
activities. This relationship is observed in 2 out of 3
participating countries/economies. In Brazil and Chile, this
association appears to be exceptionally strong.
> Chart page 28
© OECD 2014 A TeAchers’ guide TO TALis28
Teachers’ job satisfaction and professional collaboration
Never
Once a year or less
2-4 times a year
5-10 times a year
1-3 times a month
Once a week or more
Teach as a team in the same class
Observeotherteachers’classes and provide feedback
Engageinjointactivitiesacrossdifferent classes and age groups
Take part in collaborative professional learning
Source: OECD, TALIS 2013 Database.
Lowjobsatisfaction
Highjobsatisfaction
ORGANISATION FOR ECONOMIC CO-OPERATION AND DEVELOPMENT
The OECD is a unique forum where governments work together to address the economic, social
and environmental challenges of globalisation. The OECD is also at the forefront of efforts to understand
and to help governments respond to new developments and concerns, such as corporate governance, the
information economy and the challenges of an ageing population. The Organisation provides a setting
where governments can compare policy experiences, seek answers to common problems, identify good
practice and work to co-ordinate domestic and international policies.
The OECD member countries are: Australia, Austria, Belgium, Canada, Chile, the Czech Republic,
Denmark, Estonia, Finland, France, Germany, Greece, Hungary, Iceland, Ireland, Israel, Italy, Japan, Korea,
Luxembourg, Mexico, the Netherlands, New Zealand, Norway, Poland, Portugal, the Slovak Republic, Slovenia,
Spain, Sweden, Switzerland, Turkey, the United Kingdom and the United States. The European Union takes
part in the work of the OECD.
OECD Publishing disseminates widely the results of the Organisation’s statistics gathering and research
on economic, social and environmental issues, as well as the conventions, guidelines and standards agreed
by its members.
OECD PUBLISHING, 2, rue André-Pascal, 75775 PARIS CEDEX 16
(87 2014 02 1P) ISBN 978-92-64-21608-2 – 2014-06
For further information please visit our website: www.oecd.org/talis
or contact us at: [email protected]