TALIS 2018: SUPPORTING THE TEACHING PROFESSION IN A ... · TALIS 2013 150,000 teachers in 9,500...
46
TALIS 2018: SUPPORTING THE TEACHING PROFESSION IN A CHANGING WORLD FIRST RESULTS AND KEY MESSAGES FOR KAZAKHSTAN IN AN INTERNATIONAL PERSPECTIVE Karine Tremblay, OECD, TALIS Senior Analyst and Team Leader NIS XI annual International Research-to-Practice Conference Teachers changing the world of schooling Nur-Sultan, 24-25 October 2019
Transcript of TALIS 2018: SUPPORTING THE TEACHING PROFESSION IN A ... · TALIS 2013 150,000 teachers in 9,500...

TALIS 2018: SUPPORTING THE TEACHING
PROFESSION IN A CHANGING WORLD FIRST RESULTS AND KEY MESSAGES FOR
KAZAKHSTAN IN AN INTERNATIONAL PERSPECTIVE
Karine Tremblay, OECD, TALIS Senior Analyst and Team Leader
NIS XI annual International Research-to-Practice Conference
Teachers changing the world of schooling
Nur-Sultan, 24-25 October 2019

THE IMPERATIVE FOR TEACHERS AS LIFELONG LEARNERS IN A CHANGING WORLD
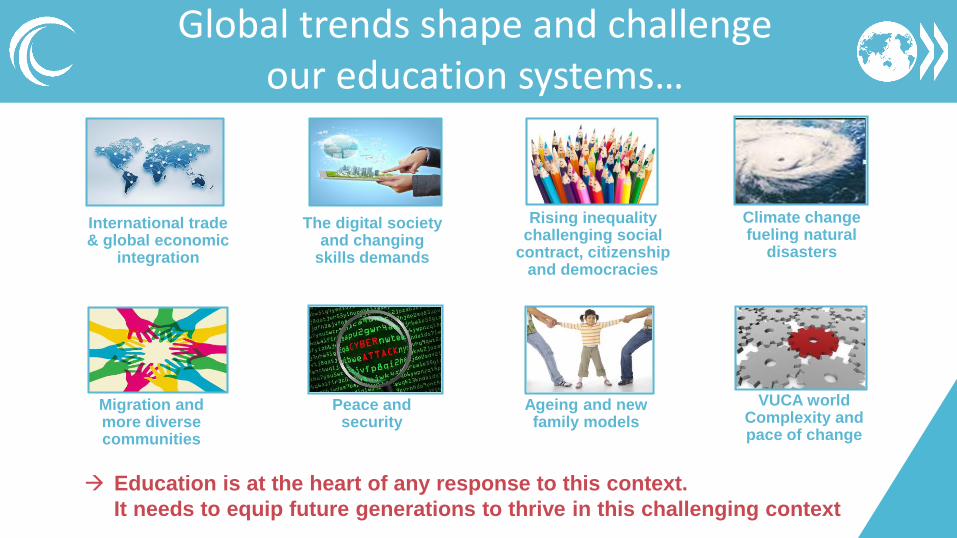
Global trends shape and challenge our education systems…
International trade & global economic
integration
The digital society and changing
skills demands
Rising inequality challenging social
contract, citizenship and democracies
Migration and more diverse communities
Climate change fueling natural
disasters
Peace and security
Ageing and new family models
VUCA world Complexity and pace of change
→ Education is at the heart of any response to this context.
It needs to equip future generations to thrive in this challenging context
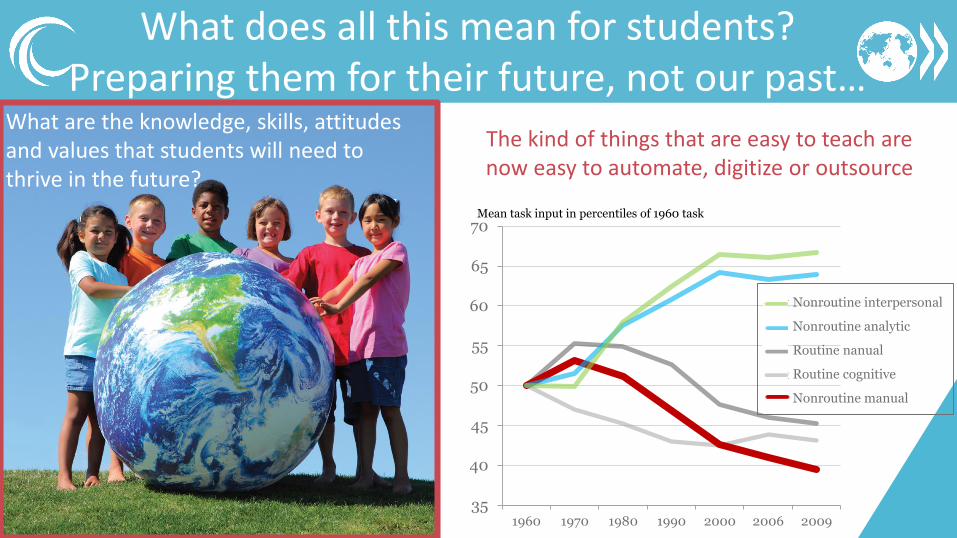
What does all this mean for students?Preparing them for their future, not our past…
The kind of things that are easy to teach are now easy to automate, digitize or outsource
35
40
45
50
55
60
65
70
1960 1970 1980 1990 2000 2006 2009
Mean task input in percentiles of 1960 task
Nonroutine interpersonal
Nonroutine analytic
Routine nanual
Routine cognitive
Nonroutine manual
What are the knowledge, skills, attitudes and values that students will need to thrive in the future?
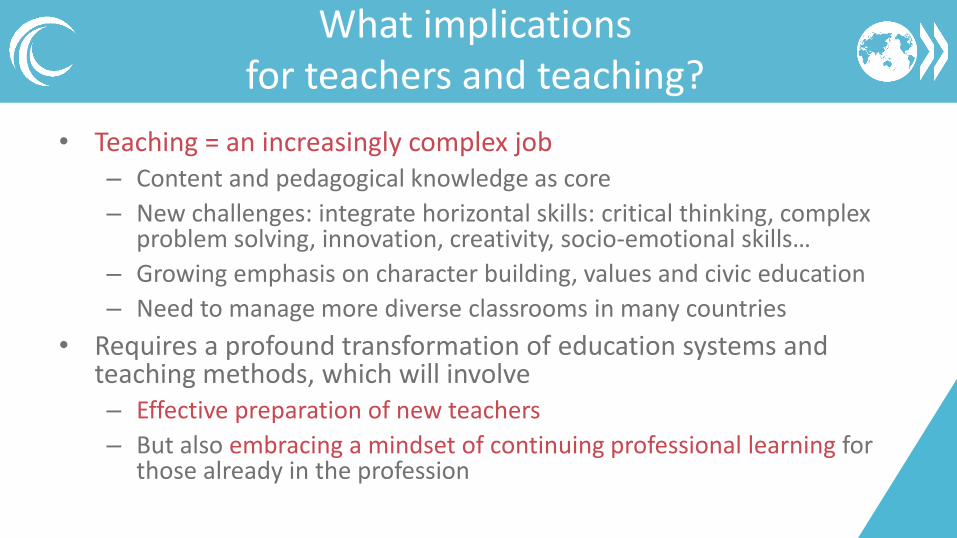
• Teaching = an increasingly complex job– Content and pedagogical knowledge as core
– New challenges: integrate horizontal skills: critical thinking, complex problem solving, innovation, creativity, socio-emotional skills…
– Growing emphasis on character building, values and civic education
– Need to manage more diverse classrooms in many countries
• Requires a profound transformation of education systems and teaching methods, which will involve – Effective preparation of new teachers
– But also embracing a mindset of continuing professional learning for those already in the profession
What implications for teachers and teaching?
• Education research/learning science bring new insights on pedagogies
• Technology is changing fast…
And these are only some of the trends impacting teachers…
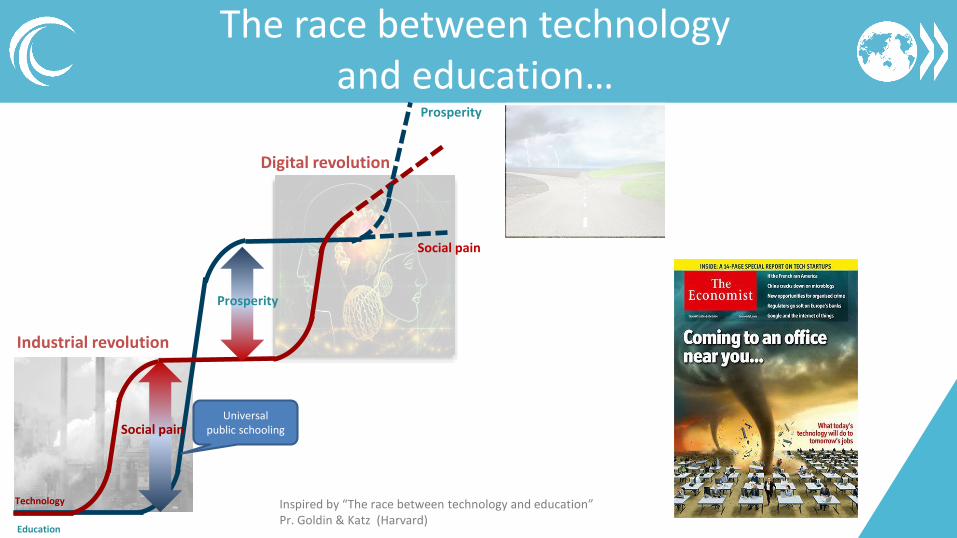
The race between technology and education…
Industrial revolution
Technology
Education
Social painUniversal
public schooling
Digital revolution
Social pain
Prosperity
Prosperity
Inspired by “The race between technology and education” Pr. Goldin & Katz (Harvard)
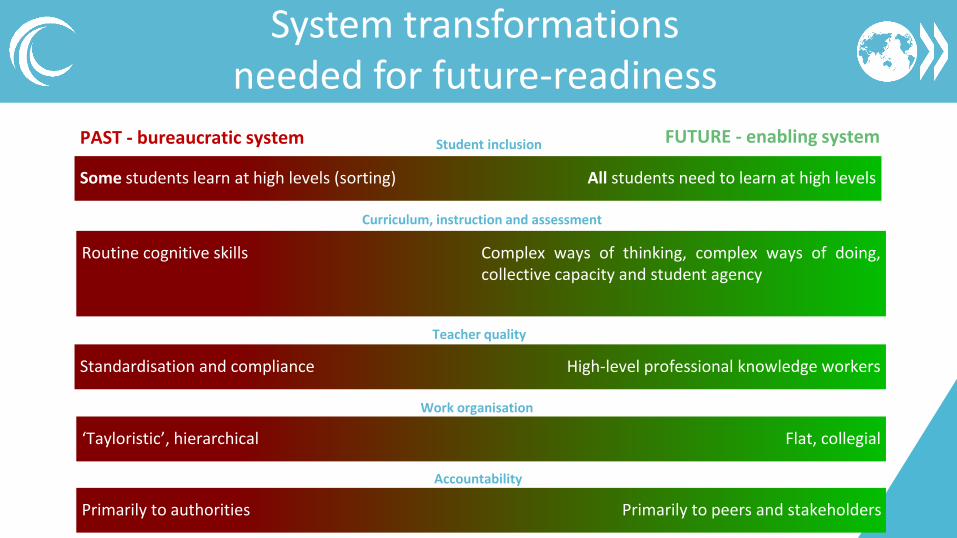
System transformations needed for future-readiness
Routine cognitive skills Complex ways of thinking, complex ways of doing,collective capacity and student agency
Some students learn at high levels (sorting) All students need to learn at high levels
Student inclusion
Curriculum, instruction and assessment
Standardisation and compliance High-level professional knowledge workers
Teacher quality
‘Tayloristic’, hierarchical Flat, collegial
Work organisation
Primarily to authorities Primarily to peers and stakeholders
Accountability
PAST - bureaucratic system FUTURE - enabling system
KEY RESULTS FOR KAZAKHSTAN IN INTERNATIONAL PERSPECTIVE
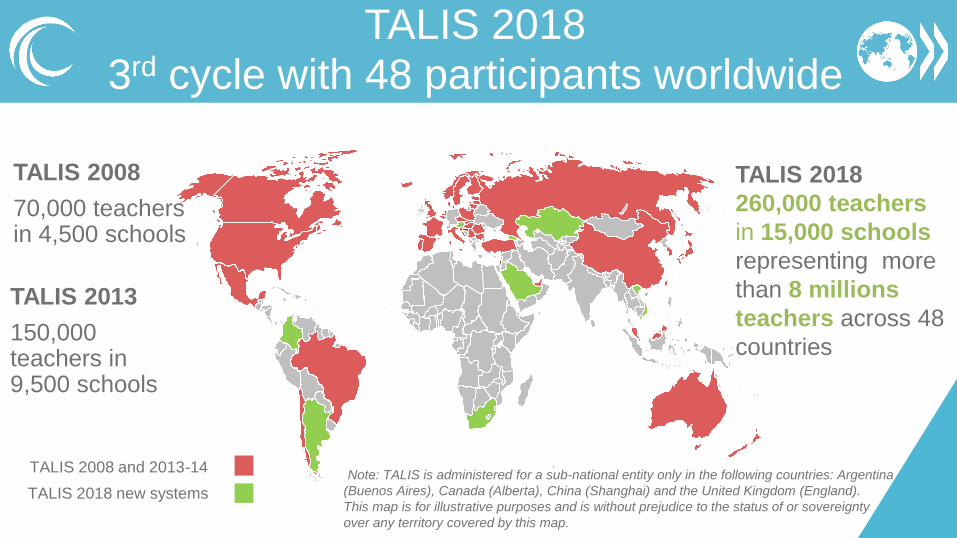
TALIS 2018 3rd cycle with 48 participants worldwide
*Note: TALIS is administered for a sub-national entity only in the following countries: Argentina
(Buenos Aires), Canada (Alberta), China (Shanghai) and the United Kingdom (England).
This map is for illustrative purposes and is without prejudice to the status of or sovereignty
over any territory covered by this map.
TALIS 2008 and 2013-14
TALIS 2018 new systems
TALIS 2008
70,000 teachers in 4,500 schools
TALIS 2013
150,000 teachers in 9,500 schools
TALIS 2018
260,000 teachers
in 15,000 schools
representing more
than 8 millions
teachers across 48
countries
Teacher professionalism as the
overarching framework for TALIS 2018
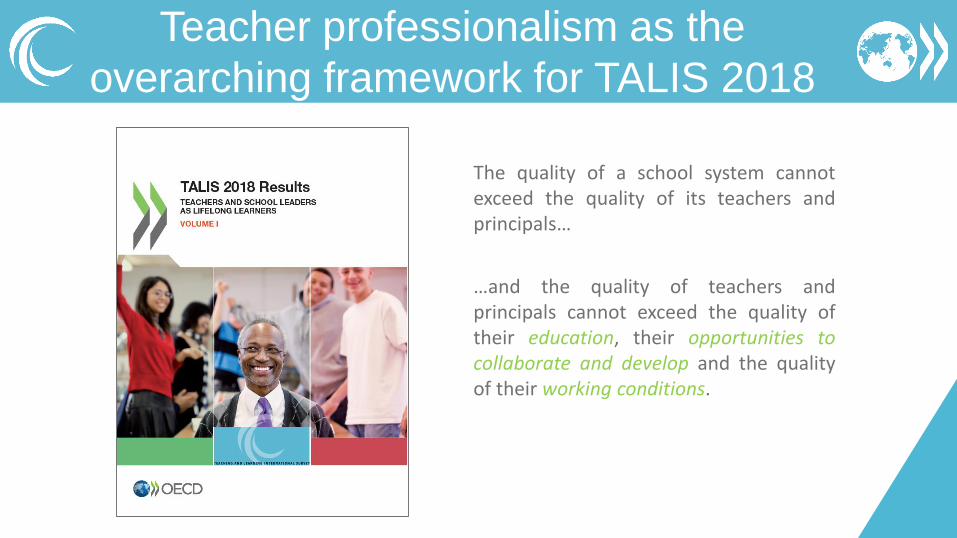
The quality of a school system cannotexceed the quality of its teachers andprincipals…
…and the quality of teachers andprincipals cannot exceed the quality oftheir education, their opportunities tocollaborate and develop and the qualityof their working conditions.
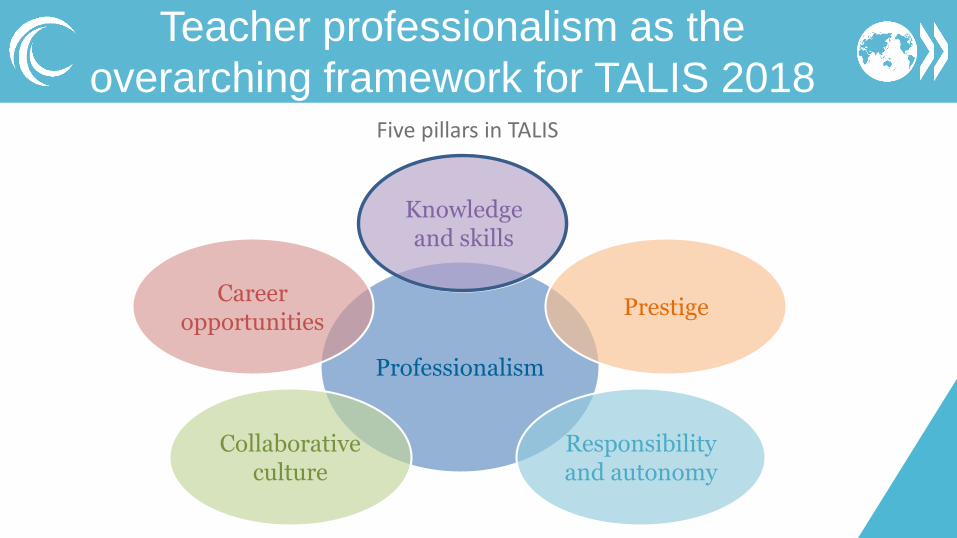
Teacher professionalism as the
overarching framework for TALIS 2018Five pillars in TALIS
Professionalism
Knowledgeand skills
Career opportunities
Collaborativeculture
Responsibility and autonomy
Prestige

WHAT IS THE PROFILE OF TEACHERS AND SCHOOL LEADERS?
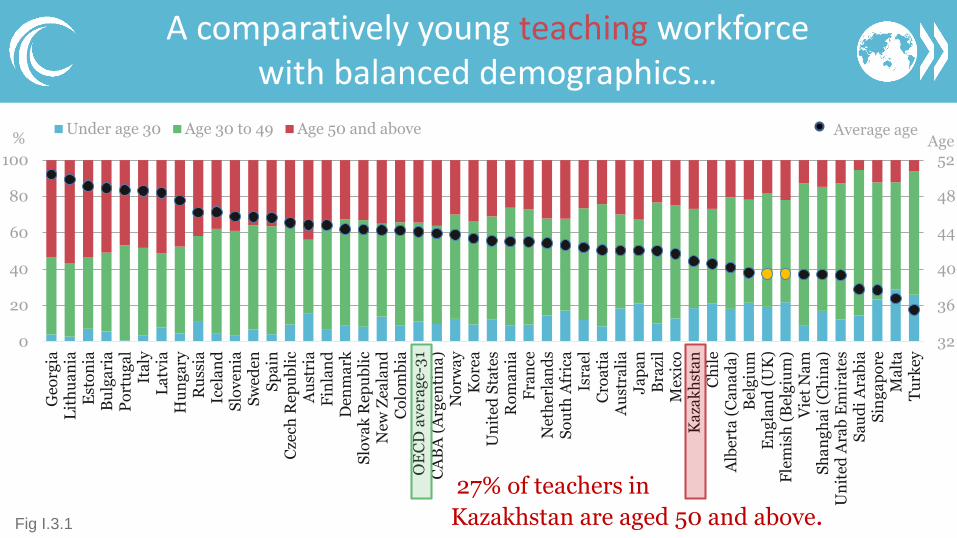
A comparatively young teaching workforcewith balanced demographics…
32
36
40
44
48
52
0
20
40
60
80
100
Geo
rgia
Lit
hu
an
iaE
sto
nia
Bu
lga
ria
Po
rtu
ga
lIt
aly
La
tvia
Hu
ng
ary
Ru
ssia
Ice
lan
dS
lov
en
iaS
wed
enS
pa
inC
zech
Rep
ub
lic
Au
stri
aF
inla
nd
Den
ma
rkS
lov
ak
Rep
ub
lic
New
Zea
lan
dC
olo
mb
iaO
EC
D a
ver
ag
e-3
1C
AB
A (
Arg
en
tin
a)
No
rwa
yK
ore
aU
nit
ed S
tate
sR
om
an
iaF
ran
ceN
eth
erla
nd
sS
ou
th A
fric
aIs
rael
Cro
ati
aA
ust
rali
aJ
ap
an
Bra
zil
Mex
ico
Ka
zak
hst
an
Ch
ile
Alb
erta
(C
an
ad
a)
Be
lgiu
mE
ng
lan
d (
UK
)F
lem
ish
(B
elg
ium
)V
iet
Na
mS
ha
ng
ha
i (C
hin
a)
Un
ited
Ara
b E
mir
ate
sS
au
di
Ara
bia
Sin
ga
po
reM
alt
aT
urk
ey
Under age 30 Age 30 to 49 Age 50 and above% Age
Average age
Fig I.3.1
27% of teachers in
Kazakhstan are aged 50 and above.
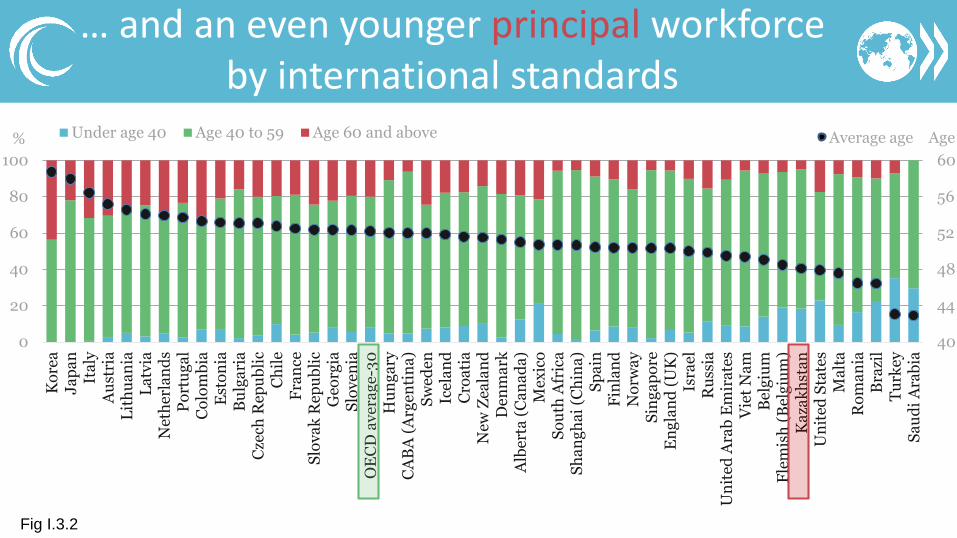
… and an even younger principal workforce by international standards
40
44
48
52
56
60
0
20
40
60
80
100
Ko
rea
Ja
pa
nIt
aly
Au
stri
aL
ith
ua
nia
La
tvia
Net
her
lan
ds
Po
rtu
ga
lC
olo
mb
iaE
sto
nia
Bu
lga
ria
Cze
ch R
epu
bli
cC
hil
eF
ran
ceS
lov
ak
Rep
ub
lic
Geo
rgia
Slo
ve
nia
OE
CD
av
era
ge-
30
Hu
ng
ary
CA
BA
(A
rge
nti
na
)S
wed
enIc
ela
nd
Cro
ati
aN
ew Z
eala
nd
Den
ma
rkA
lber
ta (
Ca
na
da
)M
exic
oS
ou
th A
fric
aS
ha
ng
ha
i (C
hin
a)
Sp
ain
Fin
lan
dN
orw
ay
Sin
ga
po
reE
ng
lan
d (
UK
)Is
rael
Ru
ssia
Un
ited
Ara
b E
mir
ate
sV
iet
Na
mB
elg
ium
Fle
mis
h (
Bel
giu
m)
Ka
zak
hst
an
Un
ited
Sta
tes
Ma
lta
Ro
ma
nia
Bra
zil
Tu
rkey
Sa
ud
i A
rab
ia
Under age 40 Age 40 to 59 Age 60 and above% AgeAverage age
Fig I.3.2
0
10
20
30
40
50
60
70
80
90
0 10 20 30 40 50 60 70 80 90
Pe
rcen
tag
e o
f fe
ma
le p
rin
cip
als
Percentage of female teachers
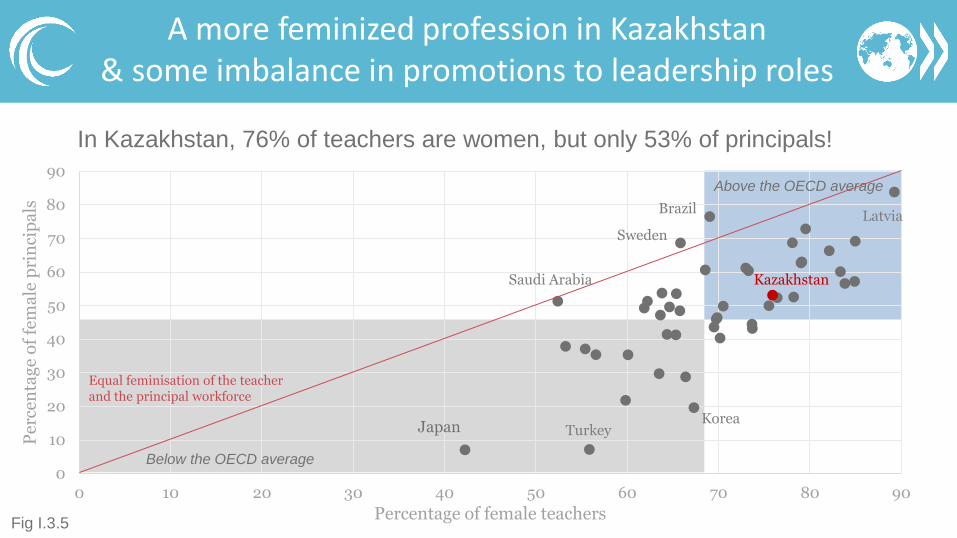
A more feminized profession in Kazakhstan& some imbalance in promotions to leadership roles
Below the OECD average
Above the OECD average
Equal feminisation of the teacher and the principal workforce
Turkey
Latvia
Saudi Arabia
Sweden
Brazil
Korea
Fig I.3.5
Japan
Kazakhstan
In Kazakhstan, 76% of teachers are women, but only 53% of principals!
0
20
40
60
80
100
Vie
t N
am
Geo
rgia
Sh
an
gh
ai
(Ch
ina
)P
ort
ug
al
Sa
ud
i A
rab
iaS
lov
en
iaJ
ap
an
Ko
rea
Lit
hu
an
iaH
un
ga
ryU
nit
ed A
rab
Em
ira
tes
Ka
zak
hst
an
Ro
ma
nia
La
tvia
Fle
mis
h (
Bel
giu
m)
Ru
ssia
Bu
lga
ria
Sin
ga
po
reM
alt
aF
ran
ceB
elg
ium
Cze
ch R
epu
bli
cA
lber
ta (
Ca
na
da
)C
olo
mb
iaC
roa
tia
OE
CD
av
era
ge-
31
Ch
ile
Au
stri
aB
razi
lIt
aly
Tu
rkey
Est
on
iaS
lov
ak
Rep
ub
lic
Ice
lan
dD
enm
ark
Sp
ain
Isra
elN
orw
ay
Mex
ico
Fin
lan
dS
wed
enU
nit
ed S
tate
sE
ng
lan
d (
UK
)A
ust
rali
aN
ew Z
eala
nd
Net
her
lan
ds
CA
BA
(A
rge
nti
na
)S
ou
th A
fric
a
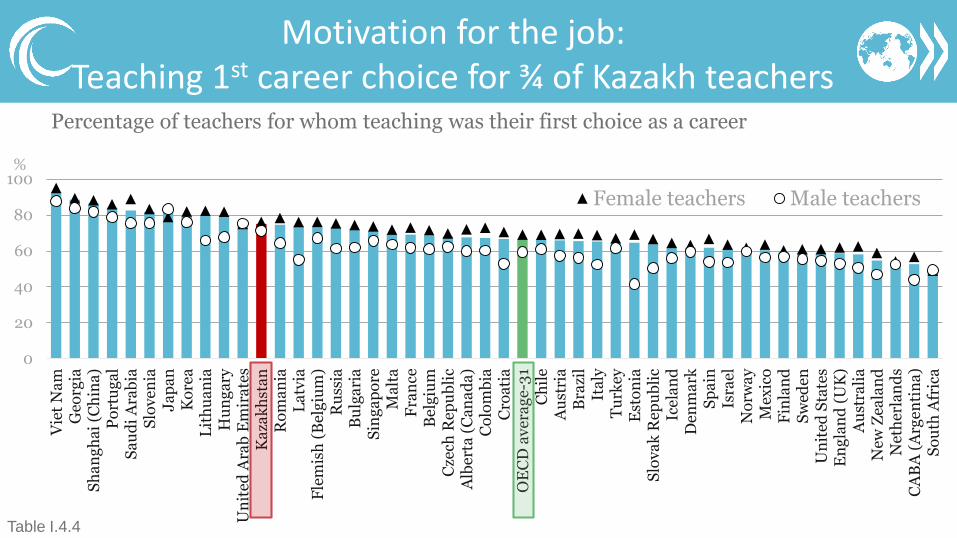
Female teachers Male teachers
Percentage of teachers for whom teaching was their first choice as a career
%
Table I.4.4
Motivation for the job: Teaching 1st career choice for ¾ of Kazakh teachers
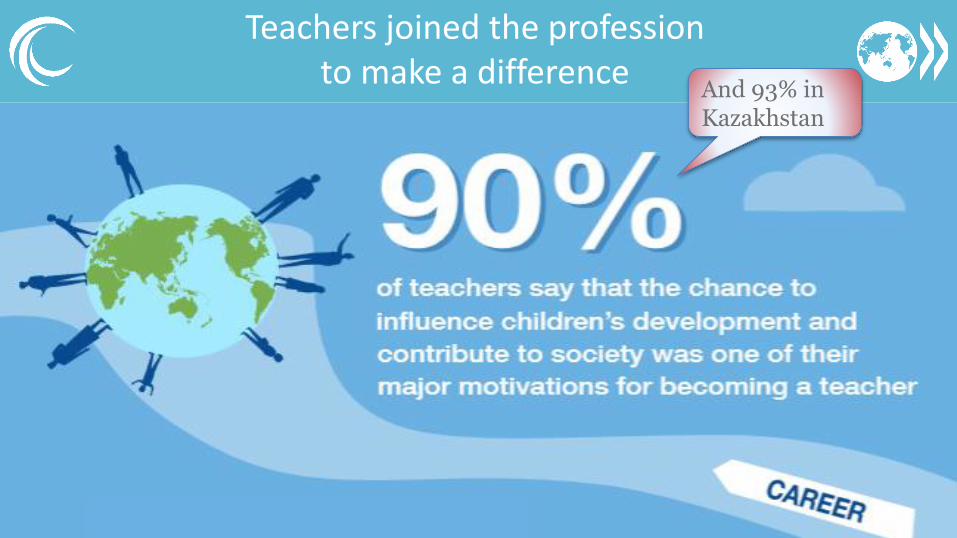
Teachers joined the profession to make a difference
And 93% in Kazakhstan
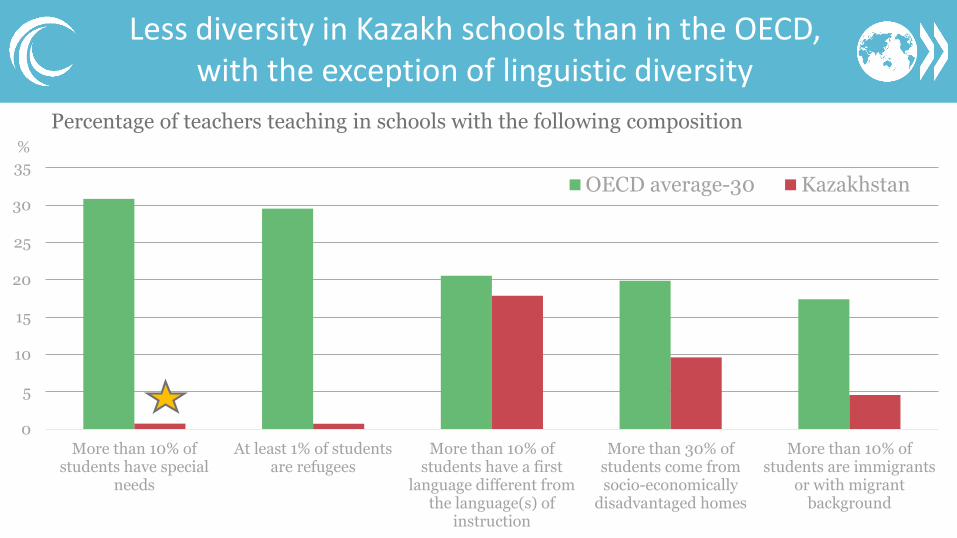
Less diversity in Kazakh schools than in the OECD, with the exception of linguistic diversity
0
5
10
15
20
25
30
35
More than 10% ofstudents have special
needs
At least 1% of studentsare refugees
More than 10% ofstudents have a first
language different fromthe language(s) of
instruction
More than 30% ofstudents come fromsocio-economically
disadvantaged homes
More than 10% ofstudents are immigrants
or with migrantbackground
OECD average-30 Kazakhstan
Percentage of teachers teaching in schools with the following composition%
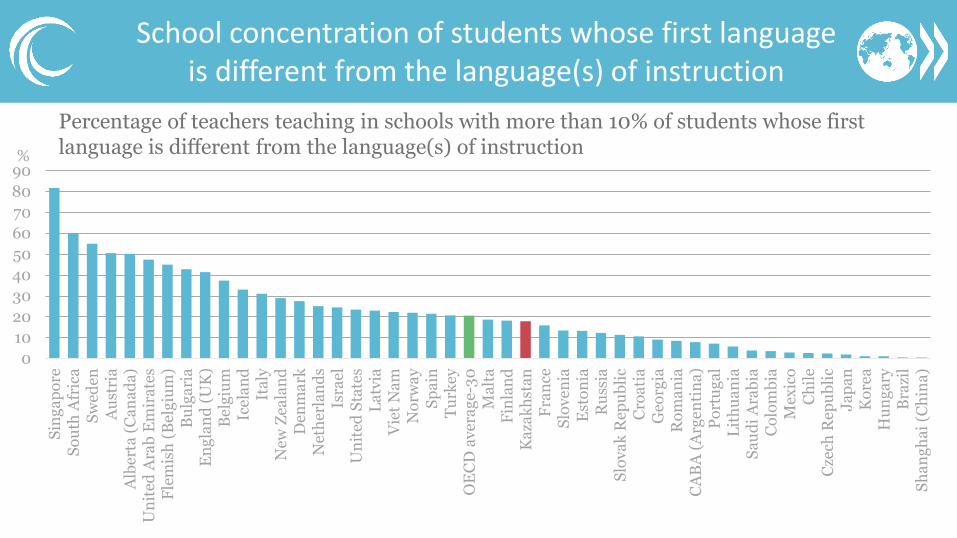
School concentration of students whose first language is different from the language(s) of instruction
0
10
20
30
40
50
60
70
80
90
Sin
ga
po
reS
ou
th A
fric
aS
wed
enA
ust
ria
Alb
erta
(C
an
ad
a)
Un
ited
Ara
b E
mir
ate
sF
lem
ish
(B
elg
ium
)B
ulg
ari
aE
ng
lan
d (
UK
)B
elg
ium
Ice
lan
dIt
aly
New
Zea
lan
dD
enm
ark
Net
her
lan
ds
Isra
elU
nit
ed S
tate
sL
atv
iaV
iet
Na
mN
orw
ay
Sp
ain
Tu
rkey
OE
CD
av
era
ge-
30
Ma
lta
Fin
lan
dK
aza
kh
sta
nF
ran
ceS
lov
en
iaE
sto
nia
Ru
ssia
Slo
va
k R
epu
bli
cC
roa
tia
Geo
rgia
Ro
ma
nia
CA
BA
(A
rge
nti
na
)P
ort
ug
al
Lit
hu
an
iaS
au
di
Ara
bia
Co
lom
bia
Mex
ico
Ch
ile
Cze
ch R
epu
bli
cJ
ap
an
Ko
rea
Hu
ng
ary
Bra
zil
Sh
an
gh
ai
(Ch
ina
)
Percentage of teachers teaching in schools with more than 10% of students whose first language is different from the language(s) of instruction%
HOW ARE TEACHERS AND SCHOOL LEADERS
PREPARED?
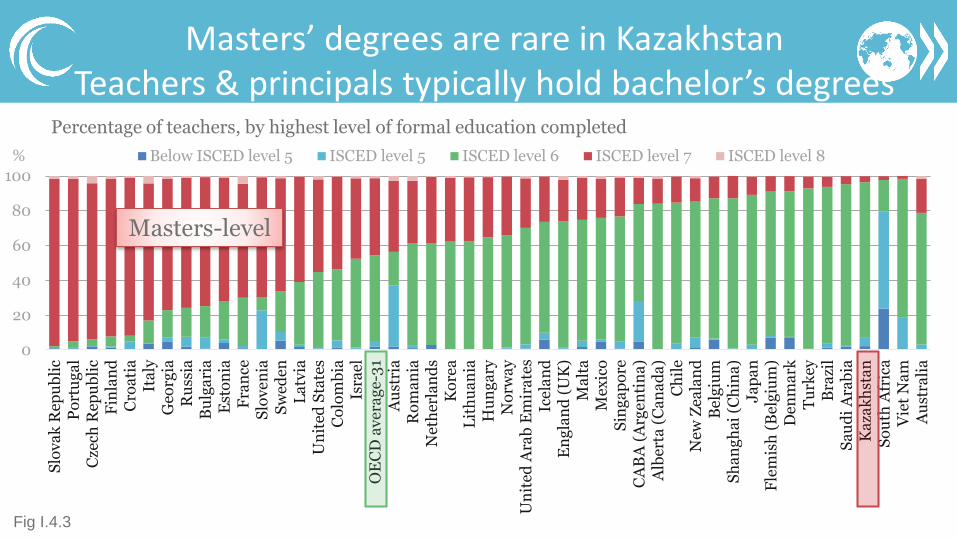
Masters’ degrees are rare in KazakhstanTeachers & principals typically hold bachelor’s degrees
0
20
40
60
80
100
Slo
va
k R
epu
bli
cP
ort
ug
al
Cze
ch R
epu
bli
cF
inla
nd
Cro
ati
aIt
aly
Geo
rgia
Ru
ssia
Bu
lga
ria
Est
on
iaF
ran
ceS
lov
en
iaS
wed
enL
atv
iaU
nit
ed S
tate
sC
olo
mb
iaIs
rael
OE
CD
av
era
ge-
31
Au
stri
aR
om
an
iaN
eth
erla
nd
sK
ore
aL
ith
ua
nia
Hu
ng
ary
No
rwa
yU
nit
ed A
rab
Em
ira
tes
Ice
lan
dE
ng
lan
d (
UK
)M
alt
aM
exic
oS
ing
ap
ore
CA
BA
(A
rge
nti
na
)A
lber
ta (
Ca
na
da
)C
hil
eN
ew Z
eala
nd
Be
lgiu
mS
ha
ng
ha
i (C
hin
a)
Ja
pa
nF
lem
ish
(B
elg
ium
)D
enm
ark
Tu
rkey
Bra
zil
Sa
ud
i A
rab
iaK
aza
kh
sta
nS
ou
th A
fric
aV
iet
Na
mA
ust
rali
a
Below ISCED level 5 ISCED level 5 ISCED level 6 ISCED level 7 ISCED level 8%
Fig I.4.3
Percentage of teachers, by highest level of formal education completed
Masters-level
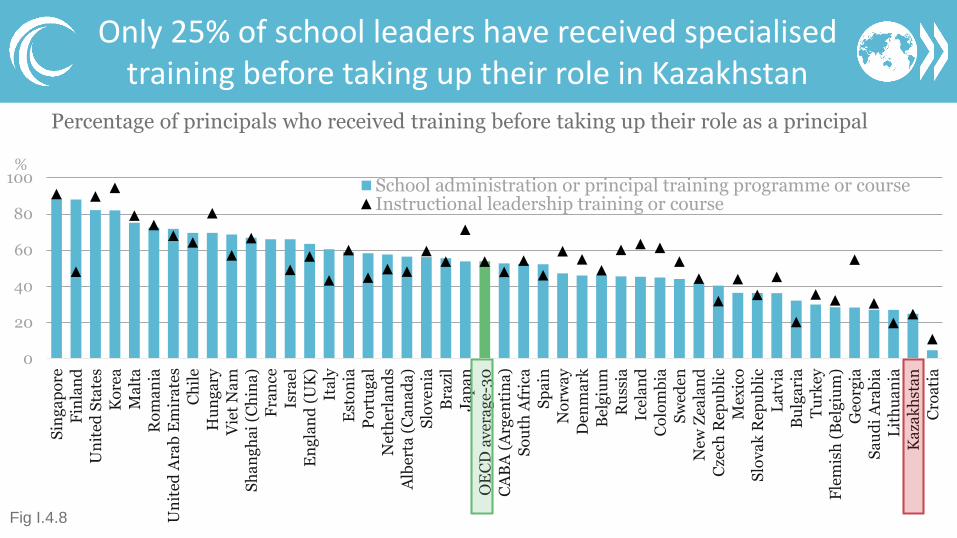
Only 25% of school leaders have received specialisedtraining before taking up their role in Kazakhstan
0
20
40
60
80
100
Sin
ga
po
re
Fin
lan
d
Un
ited
Sta
tes
Ko
rea
Ma
lta
Ro
ma
nia
Un
ited
Ara
b E
mir
ate
s
Ch
ile
Hu
ng
ary
Vie
t N
am
Sh
an
gh
ai
(Ch
ina
)
Fra
nce
Isra
el
En
gla
nd
(U
K)
Ita
ly
Est
on
ia
Po
rtu
ga
l
Net
her
lan
ds
Alb
erta
(C
an
ad
a)
Slo
ve
nia
Bra
zil
Ja
pa
n
OE
CD
av
era
ge-
30
CA
BA
(A
rge
nti
na
)
So
uth
Afr
ica
Sp
ain
No
rwa
y
Den
ma
rk
Be
lgiu
m
Ru
ssia
Ice
lan
d
Co
lom
bia
Sw
eden
New
Zea
lan
d
Cze
ch R
epu
bli
c
Mex
ico
Slo
va
k R
epu
bli
c
La
tvia
Bu
lga
ria
Tu
rkey
Fle
mis
h (
Bel
giu
m)
Geo
rgia
Sa
ud
i A
rab
ia
Lit
hu
an
ia
Ka
zak
hst
an
Cro
ati
a
School administration or principal training programme or courseInstructional leadership training or course
Percentage of principals who received training before taking up their role as a principal
%
Fig I.4.8
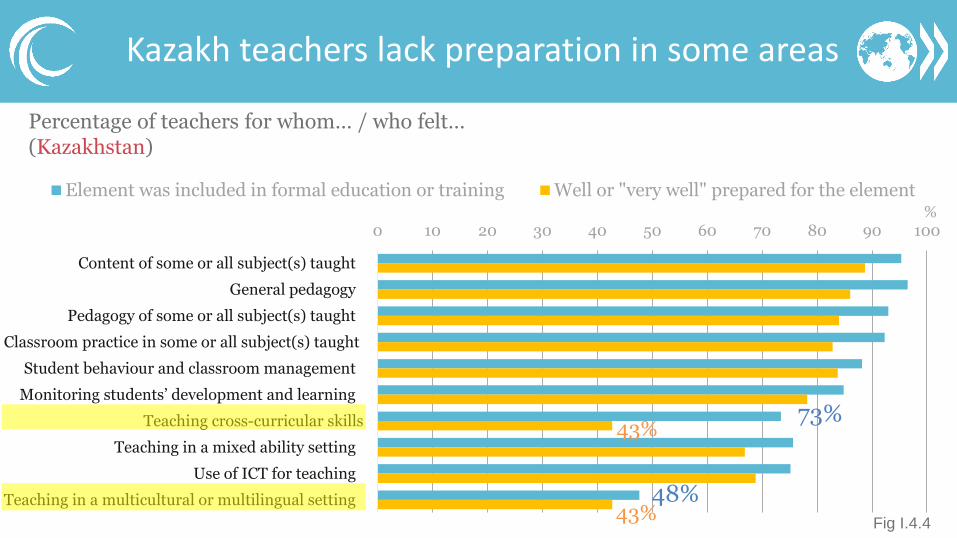
Kazakh teachers lack preparation in some areas
0 10 20 30 40 50 60 70 80 90 100
Content of some or all subject(s) taught
General pedagogy
Pedagogy of some or all subject(s) taught
Classroom practice in some or all subject(s) taught
Student behaviour and classroom management
Monitoring students’ development and learning
Teaching cross-curricular skills
Teaching in a mixed ability setting
Use of ICT for teaching
Teaching in a multicultural or multilingual setting
Element was included in formal education or training Well or "very well" prepared for the element%
Percentage of teachers for whom… / who felt…(Kazakhstan)
Fig I.4.4
73%43%
43%48%
0
20
40
60
80
100
Geo
rgia
CA
BA
(A
rge
nti
na
)E
sto
nia
Hu
ng
ary
Lit
hu
an
iaL
atv
iaB
razi
lP
ort
ug
al
No
rwa
yC
hil
eIc
ela
nd
Be
lgiu
mS
pa
inD
enm
ark
Mex
ico
Sw
eden
Slo
ve
nia
Fin
lan
dB
ulg
ari
aN
eth
erla
nd
sA
ust
ria
Ka
zak
hst
an
Fle
mis
h (
Bel
giu
m)
Ru
ssia
Vie
t N
am
Cro
ati
aO
EC
D a
ver
ag
e-3
1C
zech
Rep
ub
lic
Slo
va
k R
epu
bli
cIt
aly
Isra
elM
alt
aK
ore
aC
olo
mb
iaR
om
an
iaS
au
di
Ara
bia
Fra
nce
So
uth
Afr
ica
Alb
erta
(C
an
ad
a)
Un
ited
Ara
b E
mir
ate
sU
nit
ed S
tate
sA
ust
rali
aT
urk
eyS
ing
ap
ore
New
Zea
lan
dE
ng
lan
d (
UK
)J
ap
an
Sh
an
gh
ai
(Ch
ina
)
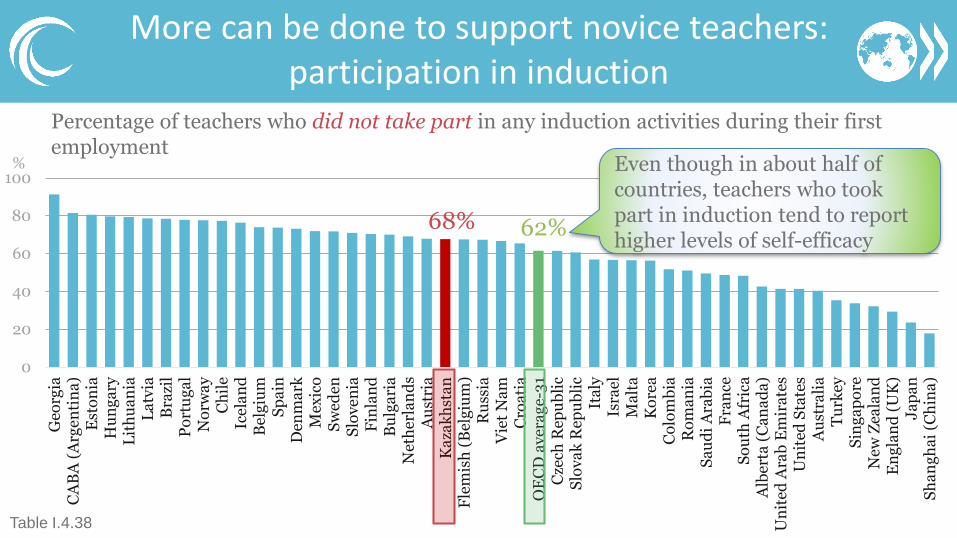
More can be done to support novice teachers: participation in induction
Percentage of teachers who did not take part in any induction activities during their first employment
%
Table I.4.38
62%68%
Even though in about half of countries, teachers who took part in induction tend to report higher levels of self-efficacy
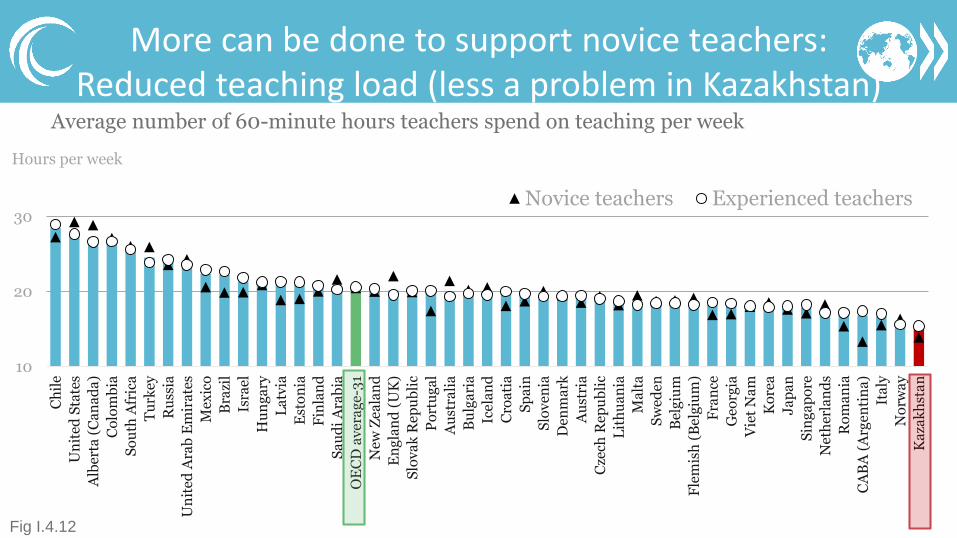
More can be done to support novice teachers: Reduced teaching load (less a problem in Kazakhstan)
10
20
30
Ch
ile
Un
ited
Sta
tes
Alb
erta
(C
an
ad
a)
Co
lom
bia
So
uth
Afr
ica
Tu
rkey
Ru
ssia
Un
ited
Ara
b E
mir
ate
s
Mex
ico
Bra
zil
Isra
el
Hu
ng
ary
La
tvia
Est
on
ia
Fin
lan
d
Sa
ud
i A
rab
ia
OE
CD
av
era
ge-
31
Ne
w Z
ea
lan
d
En
gla
nd
(U
K)
Slo
va
k R
ep
ub
lic
Po
rtu
ga
l
Au
stra
lia
Bu
lga
ria
Ice
lan
d
Cro
ati
a
Sp
ain
Slo
ven
ia
Den
ma
rk
Au
stri
a
Cze
ch R
ep
ub
lic
Lit
hu
an
ia
Ma
lta
Sw
eden
Bel
giu
m
Fle
mis
h (
Be
lgiu
m)
Fra
nce
Ge
org
ia
Vie
t N
am
Ko
rea
Ja
pa
n
Sin
ga
po
re
Ne
ther
lan
ds
Ro
ma
nia
CA
BA
(A
rgen
tin
a)
Ita
ly
No
rwa
y
Ka
zak
hst
an
Novice teachers Experienced teachers
Average number of 60-minute hours teachers spend on teaching per week
Hours per week
Fig I.4.12
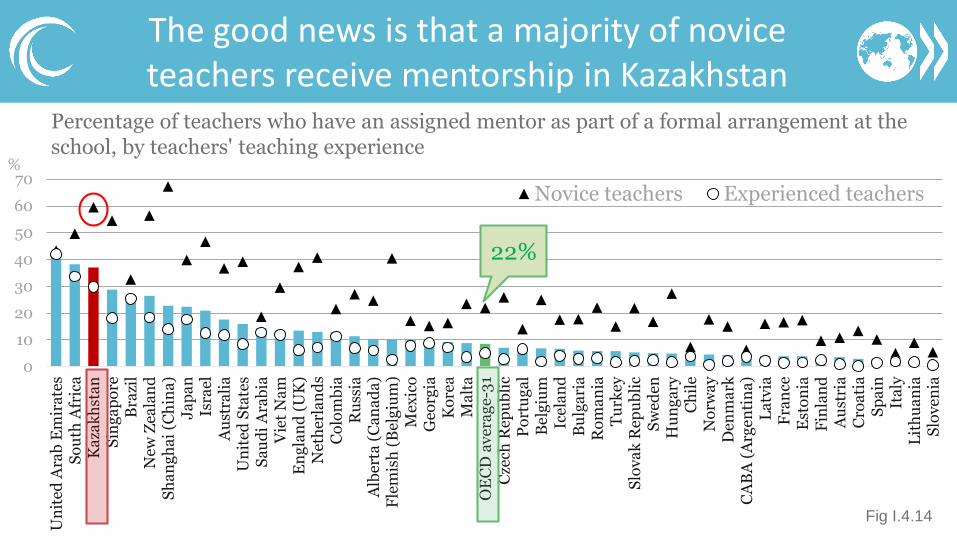
The good news is that a majority of novice teachers receive mentorship in Kazakhstan
0
10
20
30
40
50
60
70
Un
ited
Ara
b E
mir
ate
sS
ou
th A
fric
aK
aza
kh
sta
nS
ing
ap
ore
Bra
zil
New
Zea
lan
dS
ha
ng
ha
i (C
hin
a)
Ja
pa
nIs
rael
Au
stra
lia
Un
ited
Sta
tes
Sa
ud
i A
rab
iaV
iet
Na
mE
ng
lan
d (
UK
)N
eth
erla
nd
sC
olo
mb
iaR
uss
iaA
lber
ta (
Ca
na
da
)F
lem
ish
(B
elg
ium
)M
exic
oG
eorg
iaK
ore
aM
alt
aO
EC
D a
ver
ag
e-3
1C
zech
Rep
ub
lic
Po
rtu
ga
lB
elg
ium
Ice
lan
dB
ulg
ari
aR
om
an
iaT
urk
eyS
lov
ak
Rep
ub
lic
Sw
eden
Hu
ng
ary
Ch
ile
No
rwa
yD
enm
ark
CA
BA
(A
rge
nti
na
)L
atv
iaF
ran
ceE
sto
nia
Fin
lan
dA
ust
ria
Cro
ati
aS
pa
inIt
aly
Lit
hu
an
iaS
lov
en
ia
Novice teachers Experienced teachers
Percentage of teachers who have an assigned mentor as part of a formal arrangement at the school, by teachers' teaching experience
%
Fig I.4.14
22%
WHAT IS THEIR WORKLOAD AND TEACHING LOAD?
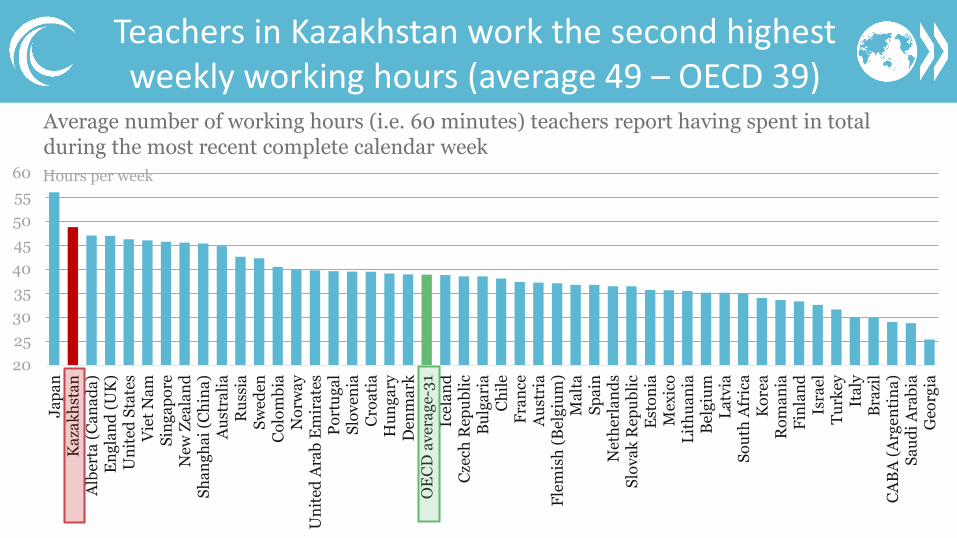
Teachers in Kazakhstan work the second highest weekly working hours (average 49 – OECD 39)
Average number of working hours (i.e. 60 minutes) teachers report having spent in total during the most recent complete calendar week
20
25
30
35
40
45
50
55
60
Ja
pa
nK
aza
kh
sta
nA
lber
ta (
Ca
na
da
)E
ng
lan
d (
UK
)U
nit
ed S
tate
sV
iet
Na
mS
ing
ap
ore
New
Zea
lan
dS
ha
ng
ha
i (C
hin
a)
Au
stra
lia
Ru
ssia
Sw
eden
Co
lom
bia
No
rwa
yU
nit
ed A
rab
Em
ira
tes
Po
rtu
ga
lS
lov
en
iaC
roa
tia
Hu
ng
ary
Den
ma
rkO
EC
D a
ver
ag
e-3
1Ic
ela
nd
Cze
ch R
epu
bli
cB
ulg
ari
aC
hil
eF
ran
ceA
ust
ria
Fle
mis
h (
Bel
giu
m)
Ma
lta
Sp
ain
Net
her
lan
ds
Slo
va
k R
epu
bli
cE
sto
nia
Mex
ico
Lit
hu
an
iaB
elg
ium
La
tvia
So
uth
Afr
ica
Ko
rea
Ro
ma
nia
Fin
lan
dIs
rael
Tu
rkey
Ita
lyB
razi
lC
AB
A (
Arg
en
tin
a)
Sa
ud
i A
rab
iaG
eorg
ia
Hours per week
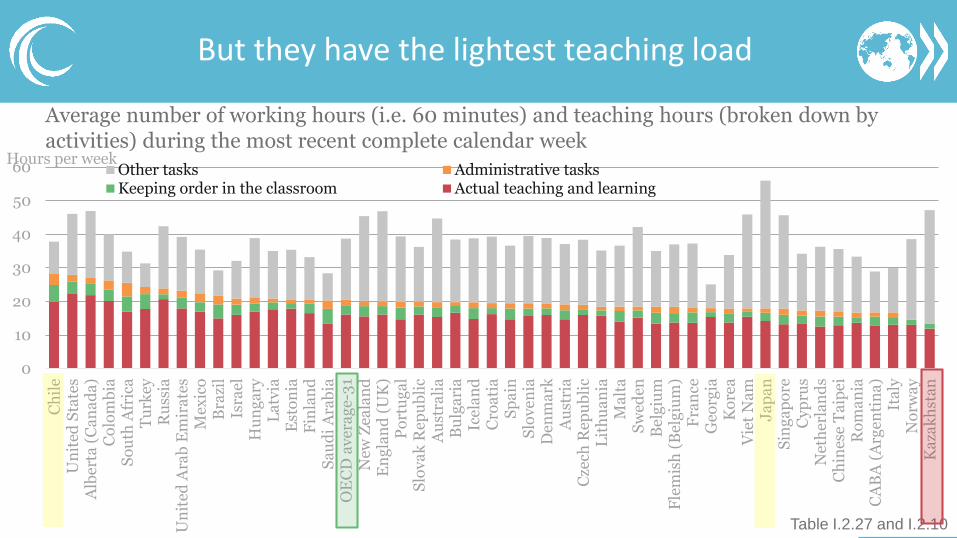
But they have the lightest teaching load
Average number of working hours (i.e. 60 minutes) and teaching hours (broken down by activities) during the most recent complete calendar week
0
10
20
30
40
50
60
Ch
ile
Un
ited
Sta
tes
Alb
erta
(C
an
ad
a)
Co
lom
bia
So
uth
Afr
ica
Tu
rkey
Ru
ssia
Un
ited
Ara
b E
mir
ate
sM
exic
oB
razi
lIs
rael
Hu
ng
ary
La
tvia
Est
on
iaF
inla
nd
Sa
ud
i A
rab
iaO
EC
D a
ver
ag
e-3
1N
ew Z
eala
nd
En
gla
nd
(U
K)
Po
rtu
ga
lS
lov
ak
Rep
ub
lic
Au
stra
lia
Bu
lga
ria
Ice
lan
dC
roa
tia
Sp
ain
Slo
ve
nia
Den
ma
rkA
ust
ria
Cze
ch R
epu
bli
cL
ith
ua
nia
Ma
lta
Sw
eden
Be
lgiu
mF
lem
ish
(B
elg
ium
)F
ran
ceG
eorg
iaK
ore
aV
iet
Na
mJ
ap
an
Sin
ga
po
reC
yp
rus
Net
her
lan
ds
Ch
ines
e T
aip
eiR
om
an
iaC
AB
A (
Arg
en
tin
a)
Ita
lyN
orw
ay
Ka
zak
hst
an
Other tasks Administrative tasksKeeping order in the classroom Actual teaching and learning
Hours per week
Table I.2.27 and I.2.10
WHAT IS THE CLIMATE IN THEIR SCHOOLS?
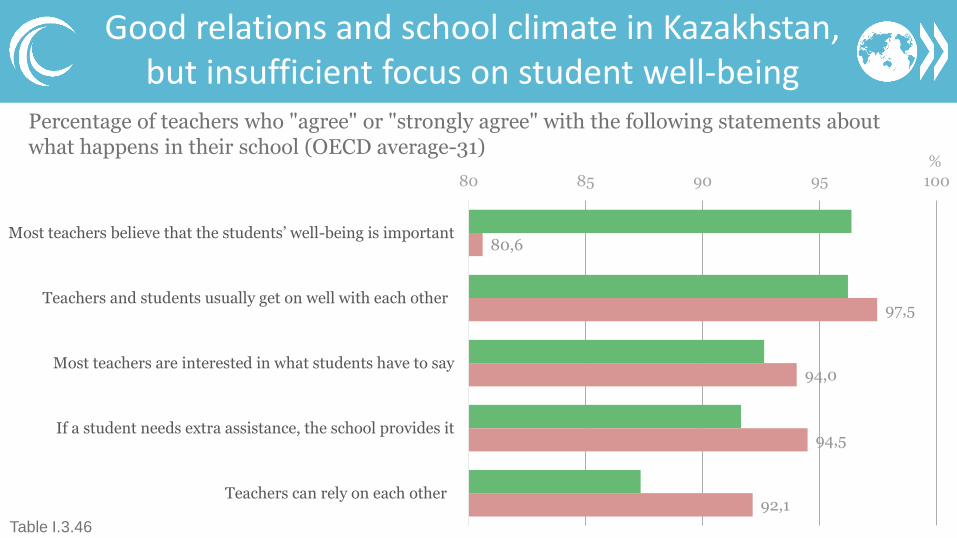
80,6
97,5
94,0
94,5
92,1
80 85 90 95 100
Most teachers believe that the students’ well-being is important
Teachers and students usually get on well with each other
Most teachers are interested in what students have to say
If a student needs extra assistance, the school provides it
Teachers can rely on each other
Percentage of teachers who "agree" or "strongly agree" with the following statements about what happens in their school (OECD average-31)
%
Table I.3.46
Good relations and school climate in Kazakhstan, but insufficient focus on student well-being

Fig I.3.12
0
2
4
6
8
10
12
14
16
Intimidation orbullying among
students
A student orparent/guardian
reports unwantedelectronic contactamong students
Intimidation orverbal abuse ofteachers or staff
Vandalism andtheft
A student orparent/guardian
reports postings ofhurtful information
on the Internetabout students
Physical injurycaused by violence
among students
Use/possession ofdrugs and/or
alcohol
OECD average-30 Kazakhstan
Percentage of principals reporting that the following incidents occurred at least weekly in their school
%
Most Kazakh schools are immune from
school safety incidents… or lack awareness!

HOW TO THEY KEEPUP TO DATE?
80
85
90
95
100
Lit
hu
an
iaS
ha
ng
ha
i (C
hin
a)
Au
stra
lia
Au
stri
aA
lber
ta (
Ca
na
da
)L
atv
iaN
ew Z
eala
nd
Sin
ga
po
reS
lov
en
iaK
aza
kh
sta
nN
eth
erla
nd
sR
uss
iaC
roa
tia
Un
ited
Sta
tes
Ko
rea
Est
on
iaU
nit
ed A
rab
Em
ira
tes
Cze
ch R
epu
bli
cF
lem
ish
(B
elg
ium
)E
ng
lan
d (
UK
)V
iet
Na
mIs
rael
Bu
lga
ria
Ice
lan
dS
wed
enH
un
ga
ryO
EC
D a
ver
ag
e-3
1B
elg
ium
No
rwa
yT
urk
eyG
eorg
iaIt
aly
Fin
lan
dC
AB
A (
Arg
en
tin
a)
Den
ma
rkS
lov
ak
Rep
ub
lic
Sp
ain
Ma
lta
Co
lom
bia
So
uth
Afr
ica
Mex
ico
Ja
pa
nR
om
an
iaP
ort
ug
al
Bra
zil
Ch
ile
Sa
ud
i A
rab
iaF
ran
ce
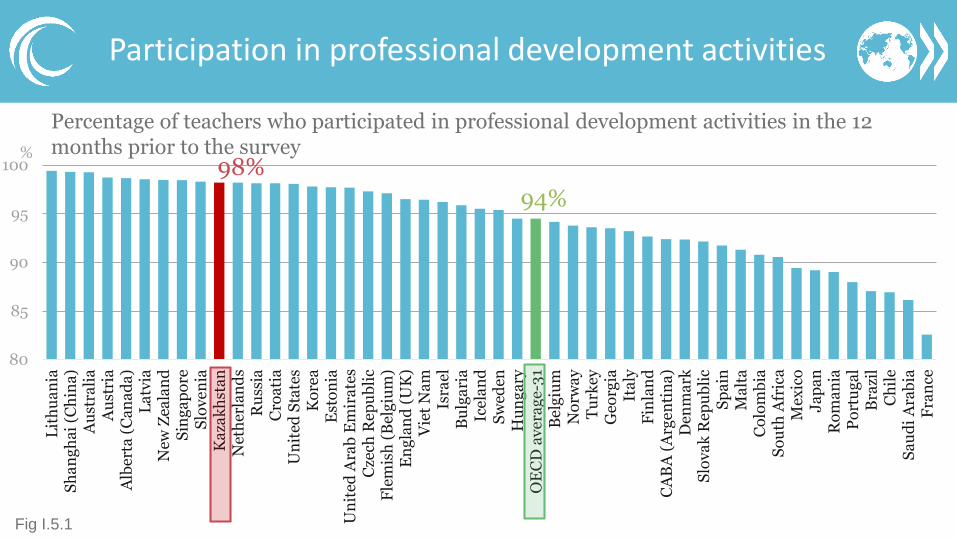
Fig I.5.1
Participation in professional development activities
Percentage of teachers who participated in professional development activities in the 12 months prior to the survey%
94%
98%
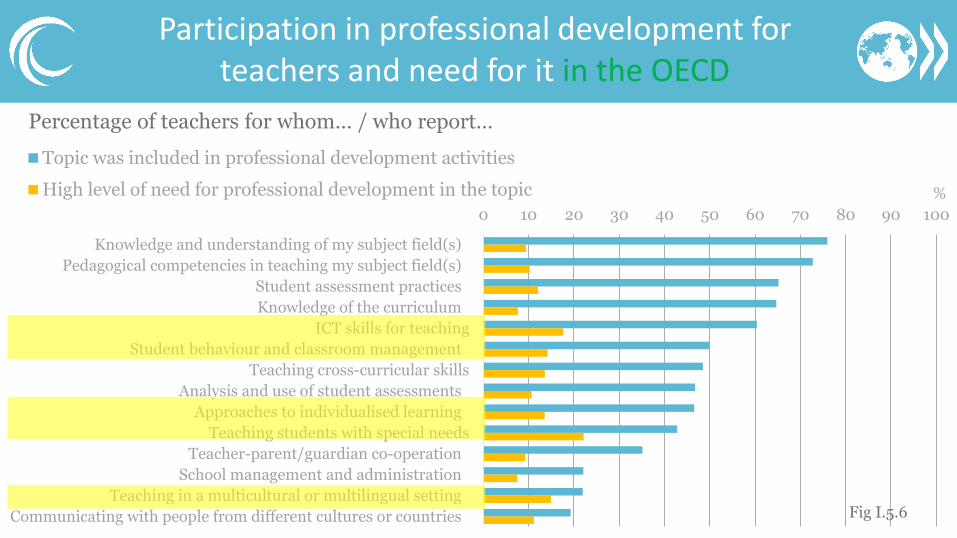
Participation in professional development for teachers and need for it in the OECD
0 10 20 30 40 50 60 70 80 90 100
Knowledge and understanding of my subject field(s)
Pedagogical competencies in teaching my subject field(s)
Student assessment practices
Knowledge of the curriculum
ICT skills for teaching
Student behaviour and classroom management
Teaching cross-curricular skills
Analysis and use of student assessments
Approaches to individualised learning
Teaching students with special needs
Teacher-parent/guardian co-operation
School management and administration
Teaching in a multicultural or multilingual setting
Communicating with people from different cultures or countries
Topic was included in professional development activities
High level of need for professional development in the topic %
Percentage of teachers for whom… / who report…
Fig I.5.6
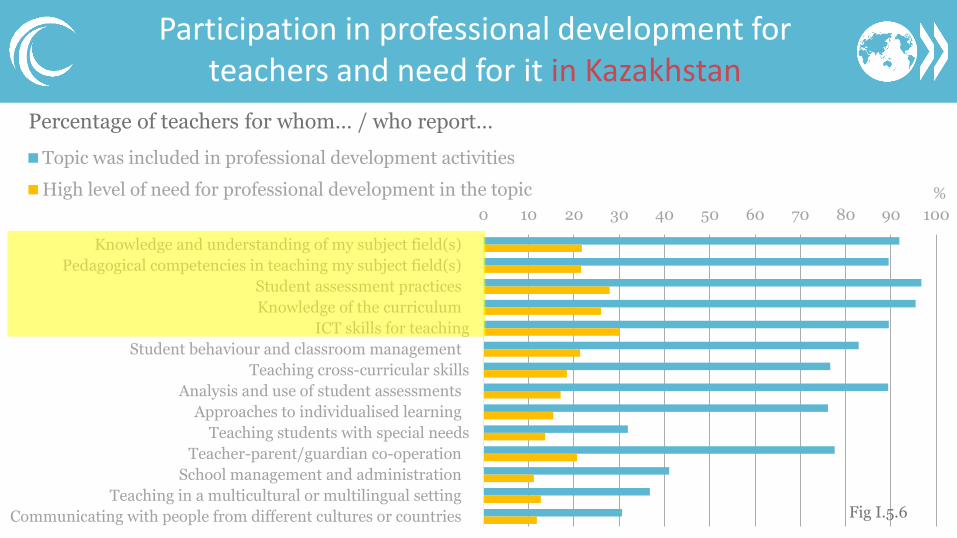
Participation in professional development for teachers and need for it in Kazakhstan
0 10 20 30 40 50 60 70 80 90 100
Knowledge and understanding of my subject field(s)
Pedagogical competencies in teaching my subject field(s)
Student assessment practices
Knowledge of the curriculum
ICT skills for teaching
Student behaviour and classroom management
Teaching cross-curricular skills
Analysis and use of student assessments
Approaches to individualised learning
Teaching students with special needs
Teacher-parent/guardian co-operation
School management and administration
Teaching in a multicultural or multilingual setting
Communicating with people from different cultures or countries
Topic was included in professional development activities
High level of need for professional development in the topic %
Percentage of teachers for whom… / who report…
Fig I.5.6

Fig I.5.14
0 10 20 30 40 50
Professional development conflicts with the teacher's workschedule
There are no incentives for participating in professionaldevelopment
Professional development is too expensive
There is no relevant professional development offered
Do not have time because of family responsibilities
There is a lack of employer support
Do not have the pre-requisites
Kazakhstan: Teachers
Kazakhstan: Principals
Percentage of teachers and principals reporting the following barriers to their participation in professional development
%
Barriers to participation in
professional development

WHAT CHALLENGES AND PRIORITIES DO THEY SEE?
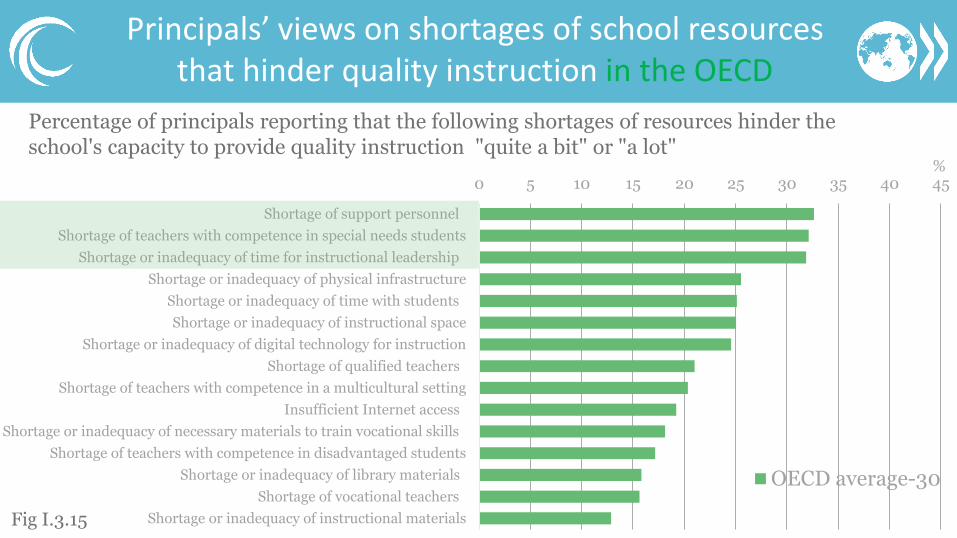
Principals’ views on shortages of school resources that hinder quality instruction in the OECD
0 5 10 15 20 25 30 35 40 45
Shortage of support personnel
Shortage of teachers with competence in special needs students
Shortage or inadequacy of time for instructional leadership
Shortage or inadequacy of physical infrastructure
Shortage or inadequacy of time with students
Shortage or inadequacy of instructional space
Shortage or inadequacy of digital technology for instruction
Shortage of qualified teachers
Shortage of teachers with competence in a multicultural setting
Insufficient Internet access
Shortage or inadequacy of necessary materials to train vocational skills
Shortage of teachers with competence in disadvantaged students
Shortage or inadequacy of library materials
Shortage of vocational teachers
Shortage or inadequacy of instructional materials
OECD average-30
Percentage of principals reporting that the following shortages of resources hinder the school's capacity to provide quality instruction "quite a bit" or "a lot"
%
Fig I.3.15
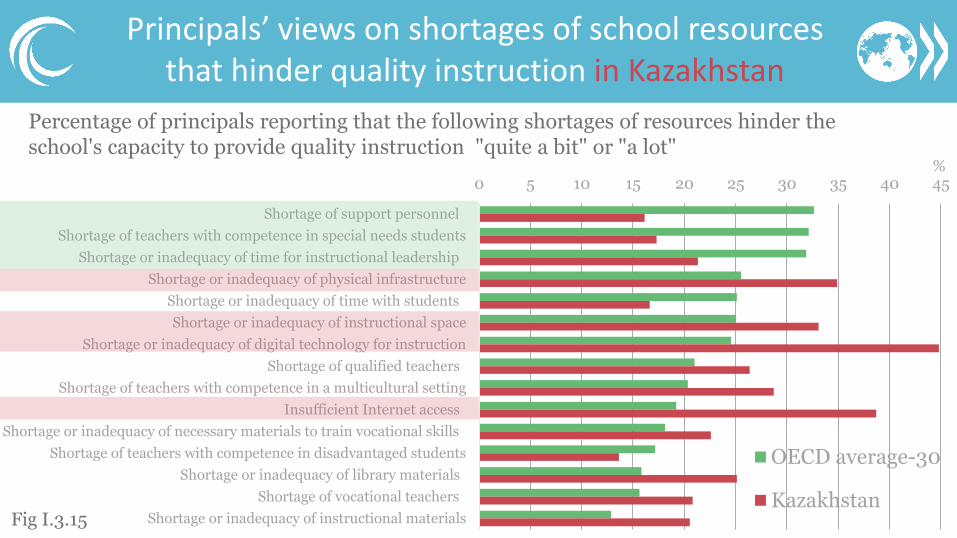
Principals’ views on shortages of school resources that hinder quality instruction in Kazakhstan
0 5 10 15 20 25 30 35 40 45
Shortage of support personnel
Shortage of teachers with competence in special needs students
Shortage or inadequacy of time for instructional leadership
Shortage or inadequacy of physical infrastructure
Shortage or inadequacy of time with students
Shortage or inadequacy of instructional space
Shortage or inadequacy of digital technology for instruction
Shortage of qualified teachers
Shortage of teachers with competence in a multicultural setting
Insufficient Internet access
Shortage or inadequacy of necessary materials to train vocational skills
Shortage of teachers with competence in disadvantaged students
Shortage or inadequacy of library materials
Shortage of vocational teachers
Shortage or inadequacy of instructional materials
OECD average-30
Kazakhstan
Percentage of principals reporting that the following shortages of resources hinder the school's capacity to provide quality instruction "quite a bit" or "a lot"
%
Fig I.3.15
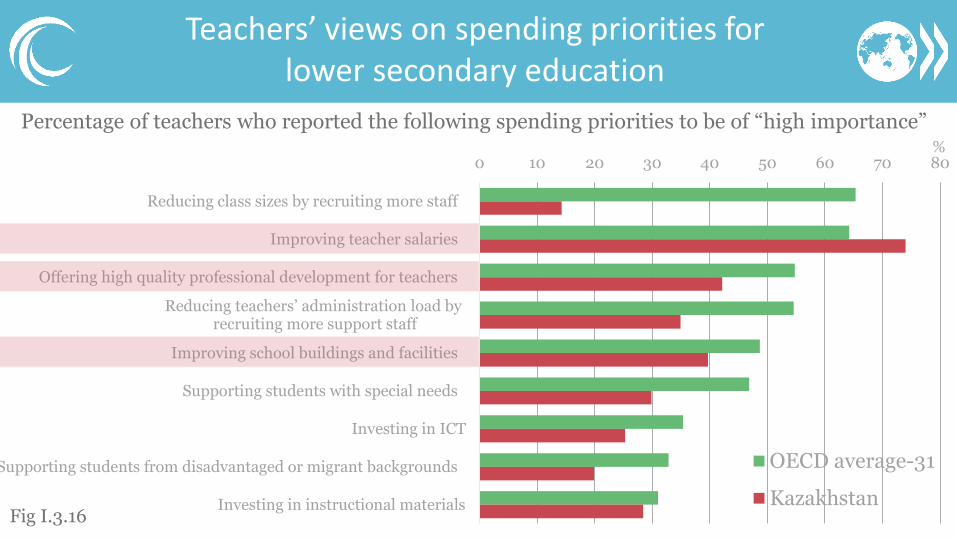
Teachers’ views on spending priorities for lower secondary education
0 10 20 30 40 50 60 70 80
Reducing class sizes by recruiting more staff
Improving teacher salaries
Offering high quality professional development for teachers
Reducing teachers’ administration load byrecruiting more support staff
Improving school buildings and facilities
Supporting students with special needs
Investing in ICT
Supporting students from disadvantaged or migrant backgrounds
Investing in instructional materials
OECD average-31
Kazakhstan
Percentage of teachers who reported the following spending priorities to be of “high importance”%
Fig I.3.16
POLICY IMPLICATIONS OF TALIS 2018 RESULTS FOR KAZAKHSTAN
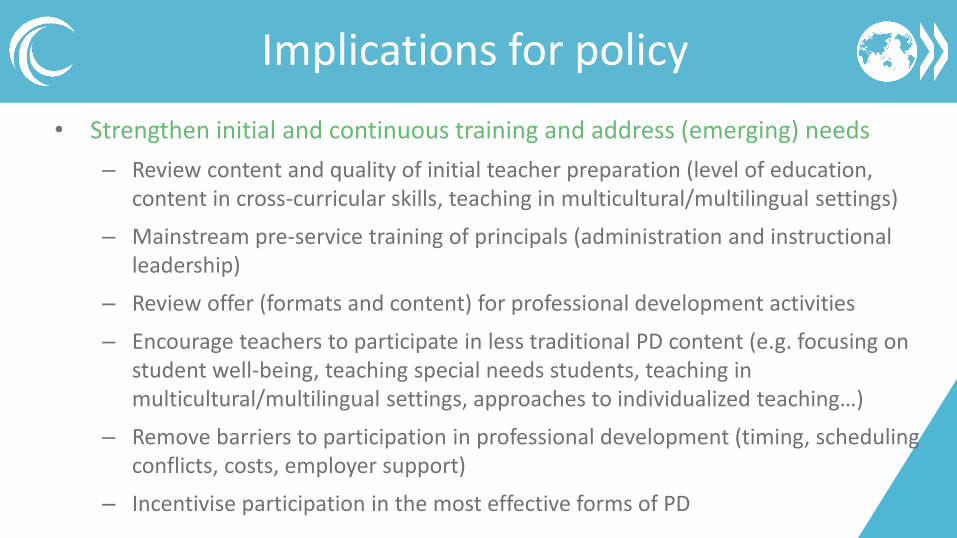
• Strengthen initial and continuous training and address (emerging) needs
– Review content and quality of initial teacher preparation (level of education, content in cross-curricular skills, teaching in multicultural/multilingual settings)
– Mainstream pre-service training of principals (administration and instructional leadership)
– Review offer (formats and content) for professional development activities
– Encourage teachers to participate in less traditional PD content (e.g. focusing on student well-being, teaching special needs students, teaching in multicultural/multilingual settings, approaches to individualized teaching…)
– Remove barriers to participation in professional development (timing, scheduling conflicts, costs, employer support)
– Incentivise participation in the most effective forms of PD
Implications for policy
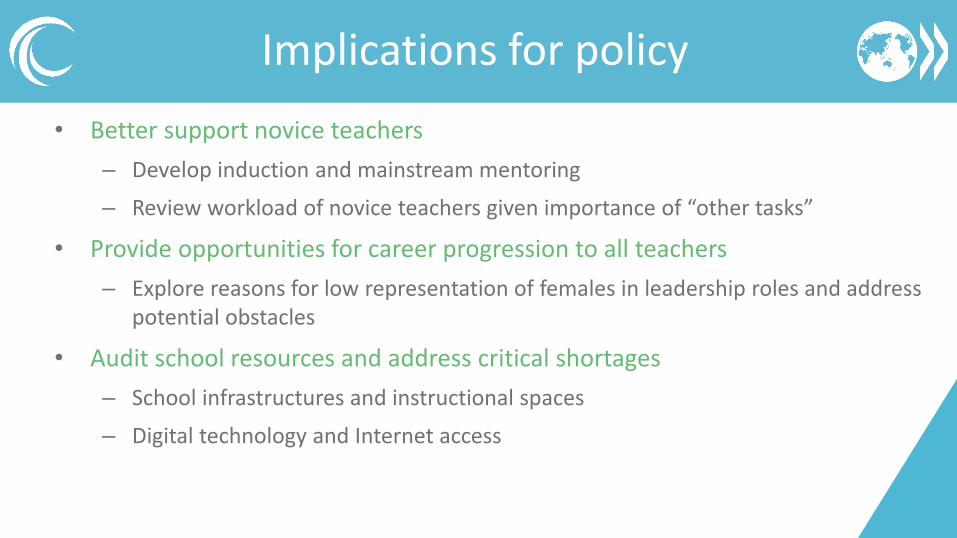
• Better support novice teachers
– Develop induction and mainstream mentoring
– Review workload of novice teachers given importance of “other tasks”
• Provide opportunities for career progression to all teachers
– Explore reasons for low representation of females in leadership roles and address potential obstacles
• Audit school resources and address critical shortages
– School infrastructures and instructional spaces
– Digital technology and Internet access
Implications for policy
Find out more about our work at www.oecd.org/education/TALIS– All publications
– Country notes
– Videos
– The complete micro-level database
Emails: [email protected] and [email protected]
Twitter: #OECDTALIS
Thank you