Australian Media Consumption Trends 2015
17
Australian Media Consumption & Advertising Report - 2015
-
Upload
ryan-m-northover -
Category
Marketing
-
view
389 -
download
2
Transcript of Australian Media Consumption Trends 2015

Australian Media Consumption &
Advertising Report - 2015
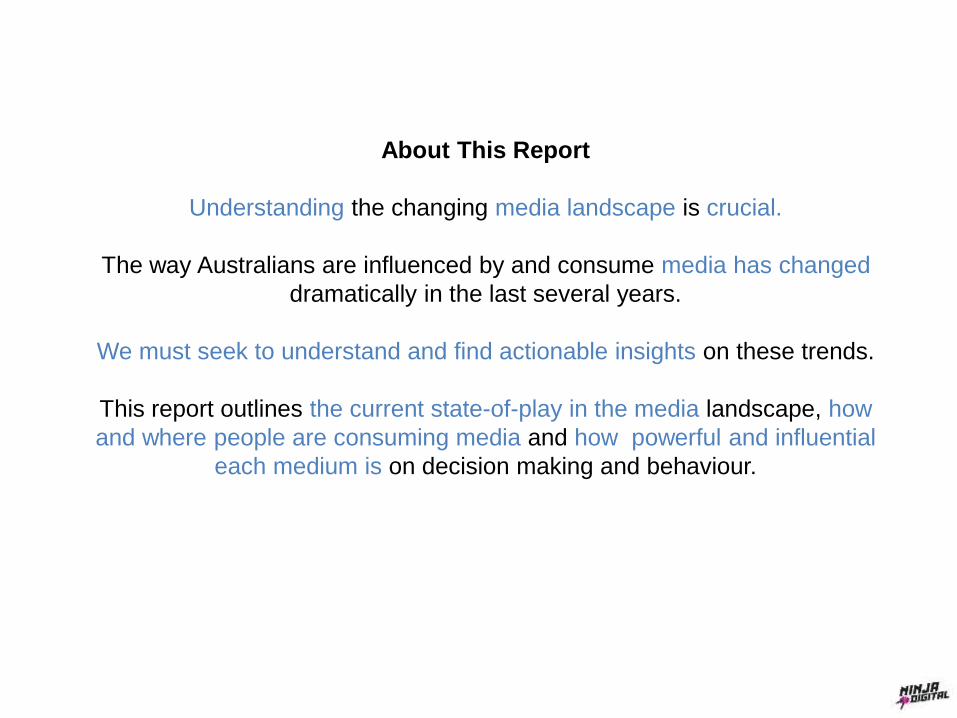
About This Report
Understanding the changing media landscape is crucial.
The way Australians are influenced by and consume media has changed
dramatically in the last several years.
We must seek to understand and find actionable insights on these trends.
This report outlines the current state-of-play in the media landscape, how
and where people are consuming media and how powerful and influential
each medium is on decision making and behaviour.
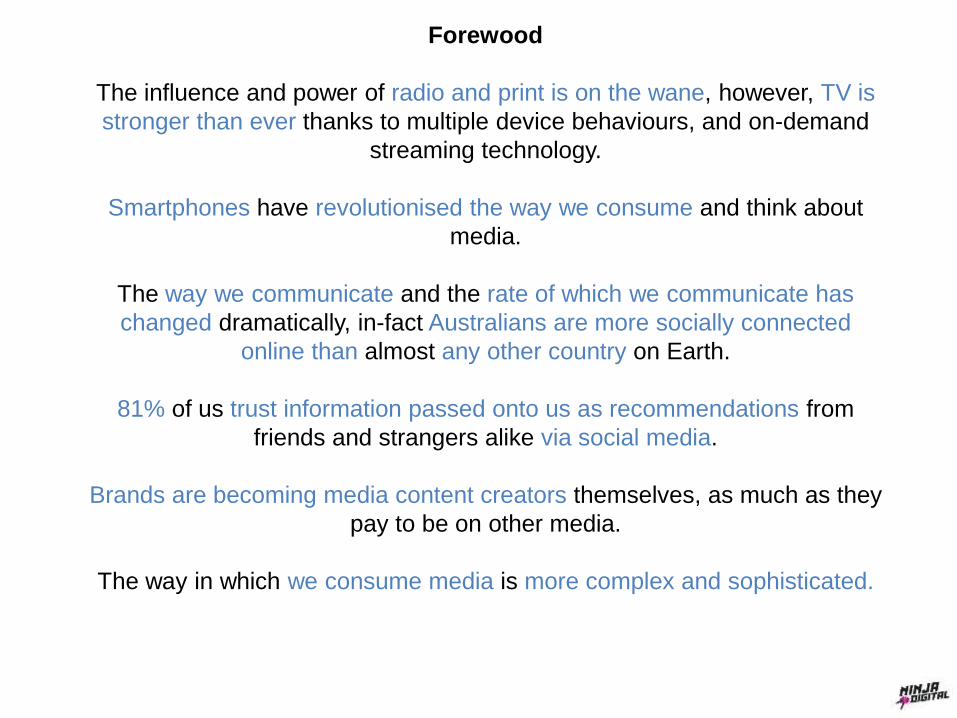
Forewood
The influence and power of radio and print is on the wane, however, TV is
stronger than ever thanks to multiple device behaviours, and on-demand
streaming technology.
Smartphones have revolutionised the way we consume and think about
media.
The way we communicate and the rate of which we communicate has
changed dramatically, in-fact Australians are more socially connected
online than almost any other country on Earth.
81% of us trust information passed onto us as recommendations from
friends and strangers alike via social media.
Brands are becoming media content creators themselves, as much as they
pay to be on other media.
The way in which we consume media is more complex and sophisticated.
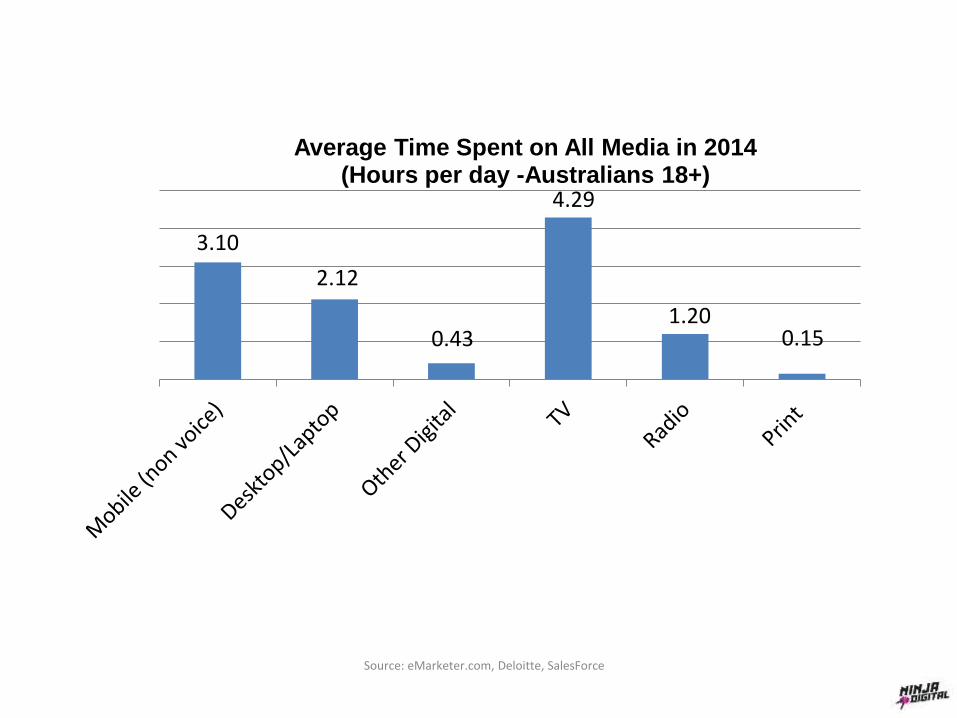
Source: eMarketer.com, Deloitte, SalesForce
3.10
2.12
0.43
4.29
1.200.15
Average Time Spent on All Media in 2014 (Hours per day -Australians 18+)
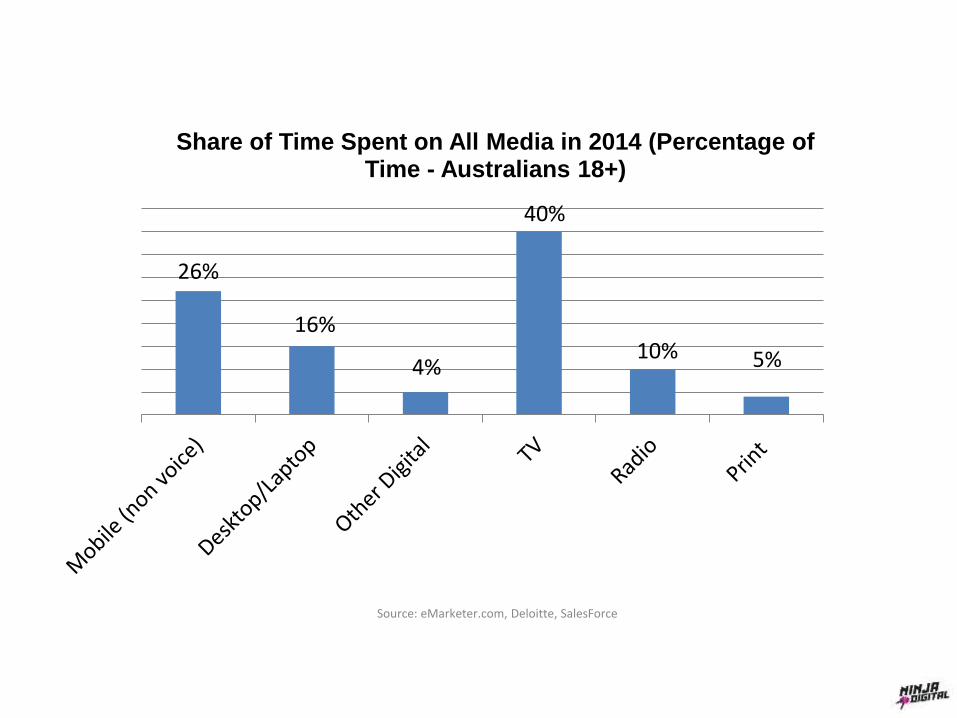
26%
16%
4%
40%
10% 5%
Share of Time Spent on All Media in 2014 (Percentage of Time - Australians 18+)
Source: eMarketer.com, Deloitte, SalesForce
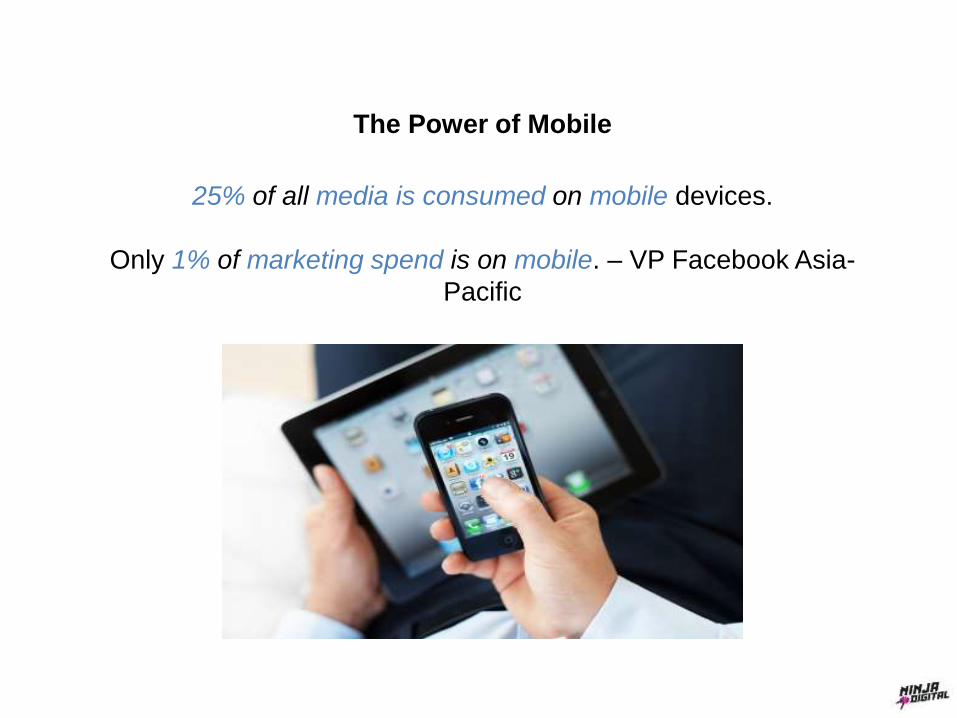
The Power of Mobile
25% of all media is consumed on mobile devices.
Only 1% of marketing spend is on mobile. – VP Facebook Asia-
Pacific
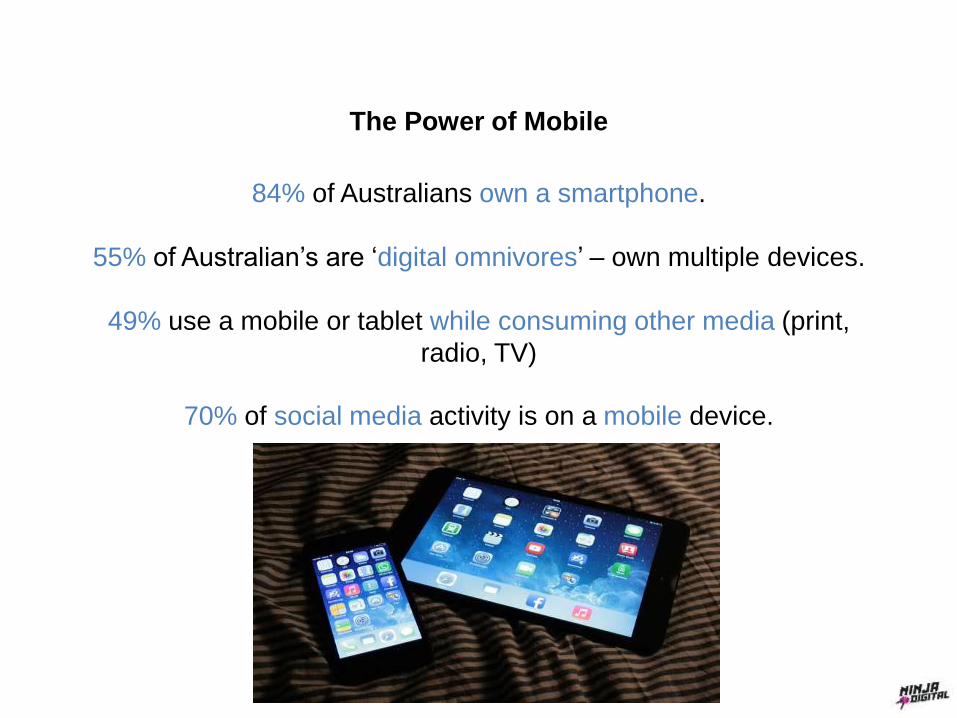
The Power of Mobile
84% of Australians own a smartphone.
55% of Australian’s are ‘digital omnivores’ – own multiple devices.
49% use a mobile or tablet while consuming other media (print,
radio, TV)
70% of social media activity is on a mobile device.
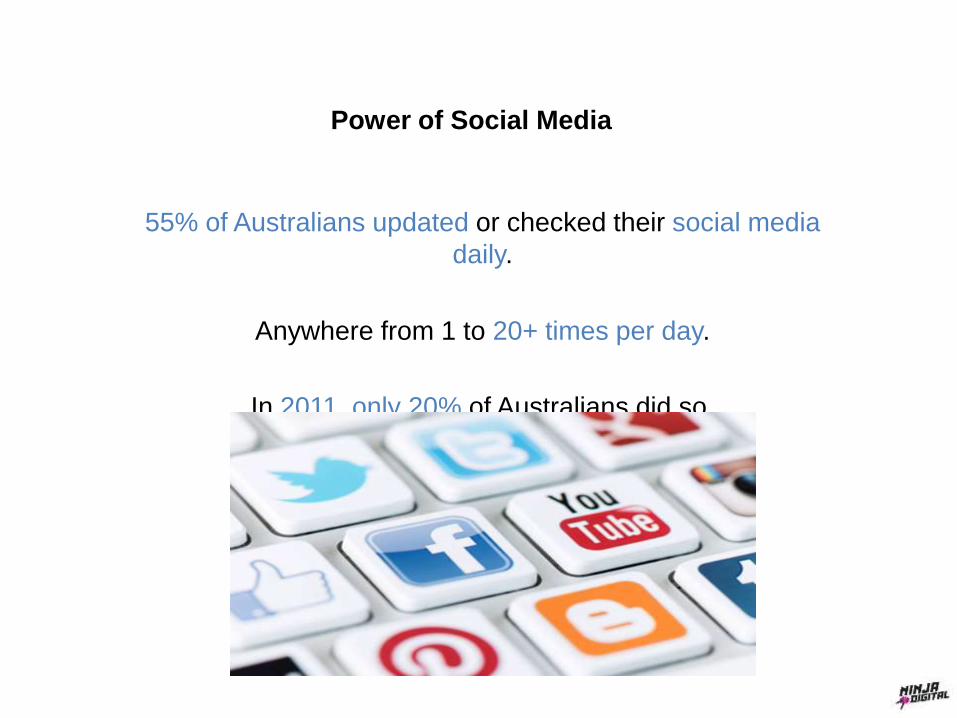
Power of Social Media
55% of Australians updated or checked their social media
daily.
Anywhere from 1 to 20+ times per day.
In 2011, only 20% of Australians did so.

Power of Social Media
in Western Australia
Social networks like Facebook, Instagram and LinkedIn
are now play an important part in the daily lives of
Western Australians.
Most brands in WA are not taking advantage of the
social media revolution.
2 in 3 Western Australians actively use social media.
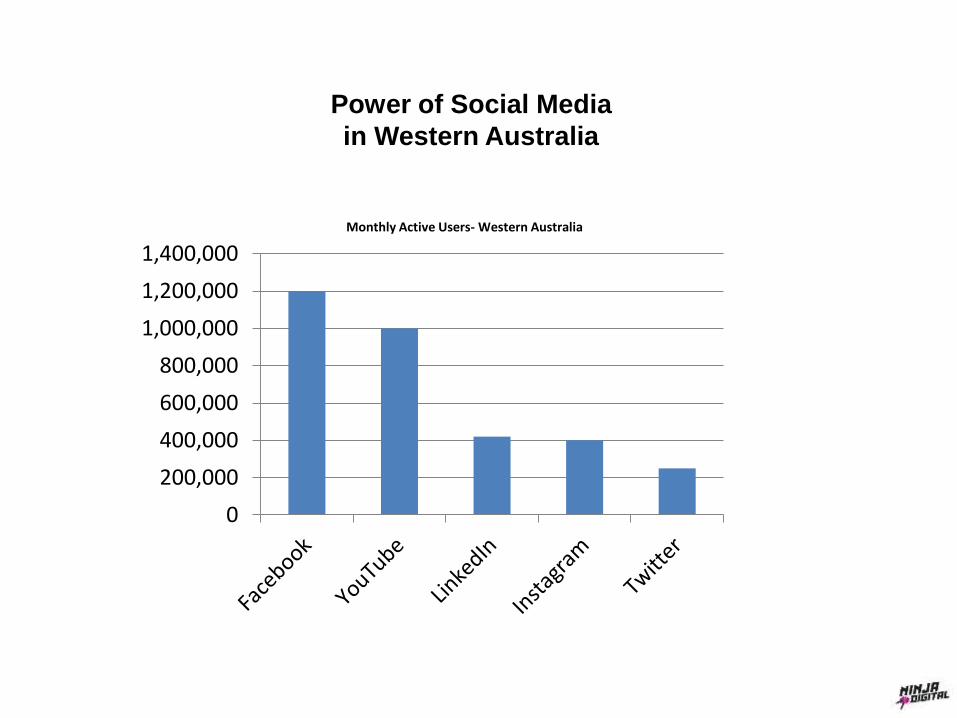
Power of Social Media
in Western Australia
0
200,000
400,000
600,000
800,000
1,000,000
1,200,000
1,400,000Monthly Active Users- Western Australia
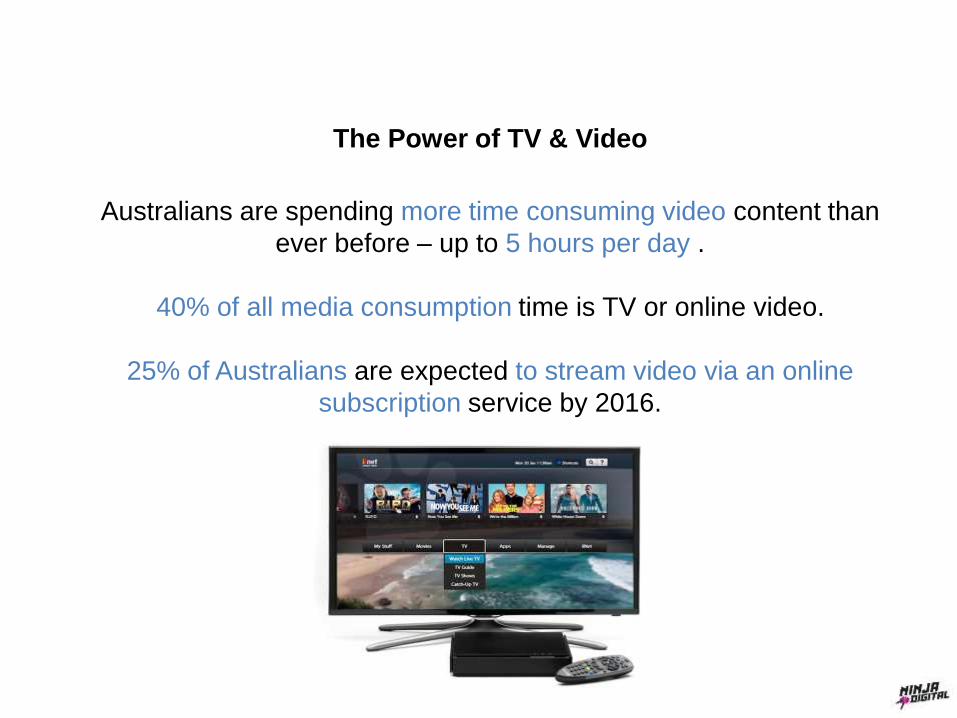
The Power of TV & Video
Australians are spending more time consuming video content than
ever before – up to 5 hours per day .
40% of all media consumption time is TV or online video.
25% of Australians are expected to stream video via an online
subscription service by 2016.
Produced by Ryan Northover. Source: eMarketer.com, Deloitte, SalesForce
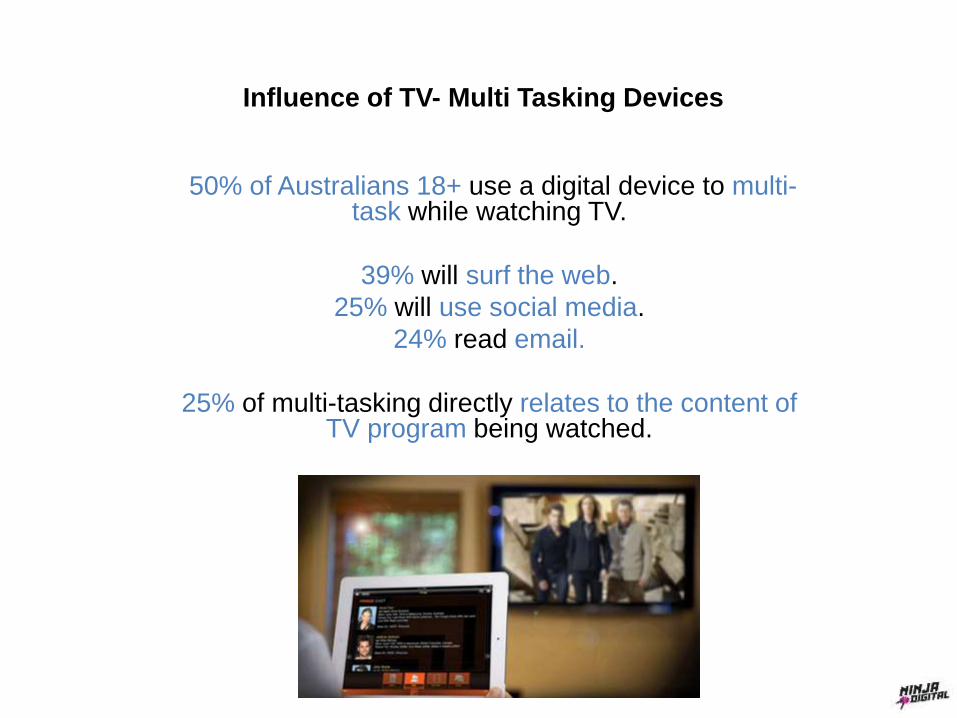
Influence of TV- Multi Tasking Devices
50% of Australians 18+ use a digital device to multi-task while watching TV.
39% will surf the web.
25% will use social media.
24% read email.
25% of multi-tasking directly relates to the content of TV program being watched.
The Power of Influence
“If you tell the story, that's advertising.
If a customer tells the story, it's the truth to anyone who hears it.”
– Bill Quiseng, Chief Experience Officer (Marketing Commentator)
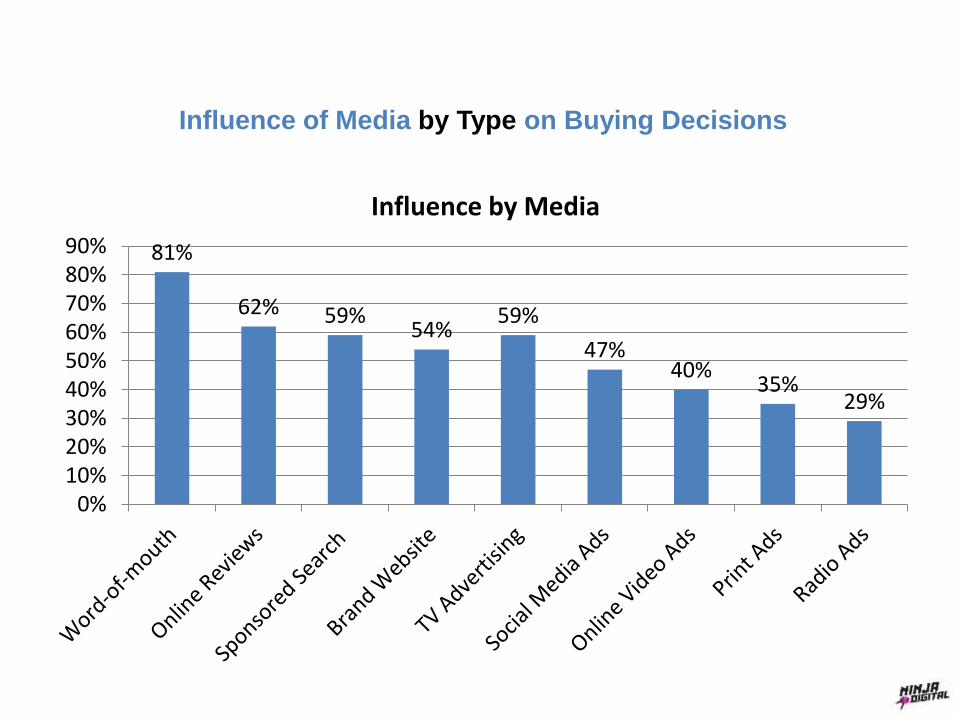
Influence of Media by Type on Buying Decisions
81%
62% 59%54%
59%
47%40%
35%29%
0%10%20%30%40%50%60%70%80%90%
Influence by Media
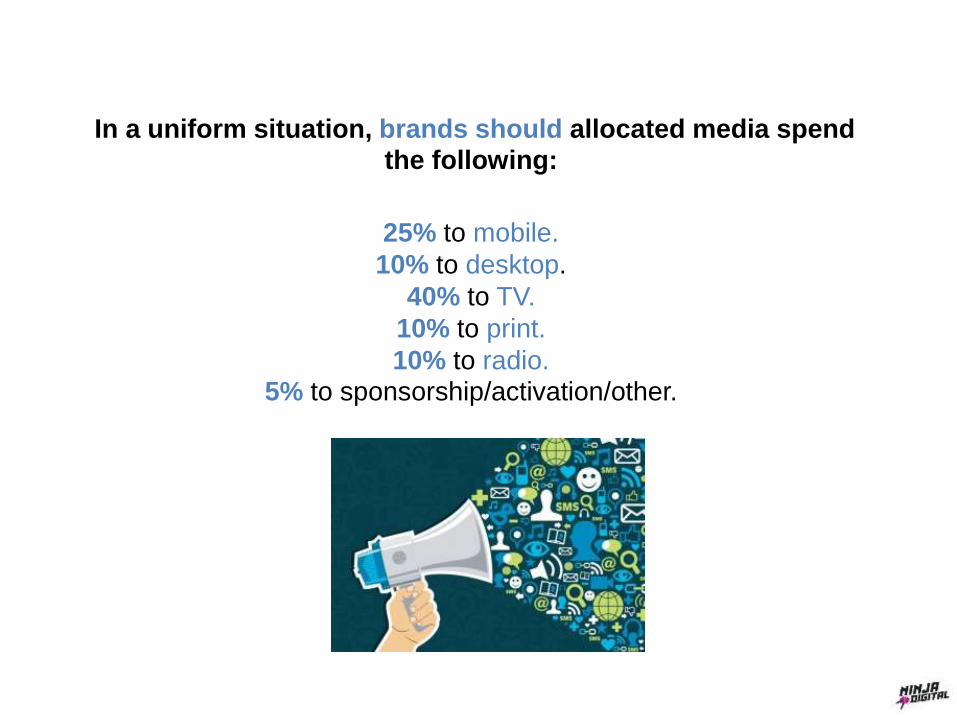
In a uniform situation, brands should allocated media spend the following:
25% to mobile.
10% to desktop.
40% to TV.
10% to print.
10% to radio.5% to sponsorship/activation/other.
To stay relevant to consumers and ahead of
competitors by engaging in the right media at the right
time, working with media and developing
sophisticated strategies to understand and act rapidly
on evolving technology, values and behaviours.
References
1. Deloitte Technology, Media & Telecommunications Trends 2014.
2. Deloitte Media Consumer Survey 2014.
3. Australian Advertising Market Forecast Annual Update 2014.
4. Sales Force, Mobile Behaviour Report 2014.
5. Australian Social Media Statistics, SocialMediaToday.com.au January 2015.
Produced by Ryan Northover, Marketing Strategist, February 2015