TRENDS IN WORLD OLIVE OIL CONSUMPTION
8
MARKET NEWSLETTER No 102 – February 2016 Source: International Olive Council page 1 TRENDS IN WORLD OLIVE OIL CONSUMPTION World consumption of olive oil increased 1.8 fold in volume between 1990/00 and 2015/16. As can be seen from Chart 1, this upward movement has been located primarily in non-IOC member countries whose share of world consumption climbed from 11 pc to 24 pc between the start and end years of the reporting period. In 2015/16, the volume of olive oil consumed at world level looks set to be around 4.6 pc higher than in 2014/15. Chart 1: Trend of olive oil consumption (000 t) (1990/91–2014/15). Olive oil consumption in the European Union countries moved in an upward direction until 2004/05, when it topped 2 000 000 t, then dropping gradually to 1996/97 levels (approximately 1 600 000 t). Inside the EU, olive oil is consumed above all in the producer countries (Chart 2). Italy continues to be the biggest EU consumer in volume terms, although its level of consumption started to decline heavily in 2006/07 until it fell to 520 000 t in 2014/15, the lowest level of the reporting period (however, this has to be viewed in the context of a past major debate on the representativity of its data). Spain, where consumption has always oscillated, has also seen a decrease since 2005/06 and the volume of consumption has never reverted to earlier levels. Greece, like Italy, has also seen its consumption drop (to 160 000 t). This decrease has coincided with the years of economic crisis and represents a fall of 22 pc compared with 20 years ago. Although consumption is concentrated in the producer countries, olive oil is starting to be consumed increasingly more in the group of Other non- producer countries where consumption is in excess of 200 000 t. The reduction in olive oil consumption in the EU producer countries is directly linked to the sharp decreases in their levels of production and the resultant price hikes, as is now explained. Chart 2: Trend of olive oil consumption in EU countries (000 t). Chart 3 plots average production and consumption in EU producer countries relative to prices and shows sharp price growth in 2005/06 and 2014/15. In the latter season, EU production fell to an all-time low because of a combination of factors – the large fall in Spanish production induced by the severe drought and the poor volume of production in Italy, which felt the effects of the Xyllela fastidiosa infestation – all of which led to general price rises and a fall in consumption. Chart 3: Average production, consumption and producer prices in the EU producer countries. 1000 1500 2000 2500 3000 3500 2004/05 2005/06 2006/07 2007/08 2008/09 2009/10 2010/11 2011/12 2012/13 2013/14 2014/15 2015/16(est.) 0 50 100 150 200 250 300 350 400 450 500 Production EU Consumption EU Average EU producer prices € PRODUCTION AND CONSUMPTION - EU EU PRODUCER PRICES * 1999/00 - 2015/16 Crop year average for 3 markets (Greece, Italy and Spain) 1.000 t €/100kg 0 1000 1500 2000 2500 3000 3500 1999/00 2000/01 2001/02 2002/03 2003/04 2004/05 2005/06 2006/07 2007/08 2008/09 2009/10 2010/11 2011/12 2012/13 2013/14 2014/15 2015/16(est.) 0 50 100 150 200 250 300 350 400 450 500 Production EU Consumption EU Average EU producer prices € PRODUCTION AND CONSUMPTION - EU EU PRODUCER PRICES * 1999/00 - 2015/16 Crop year average for 3 markets (Greece, Italy and Spain) 1.000 t €/100kg
Transcript of TRENDS IN WORLD OLIVE OIL CONSUMPTION
MARKET NEWSLETTER No 102 – February 2016
Source: International Olive Council page 1
TRENDS IN WORLD OLIVE OIL CONSUMPTION
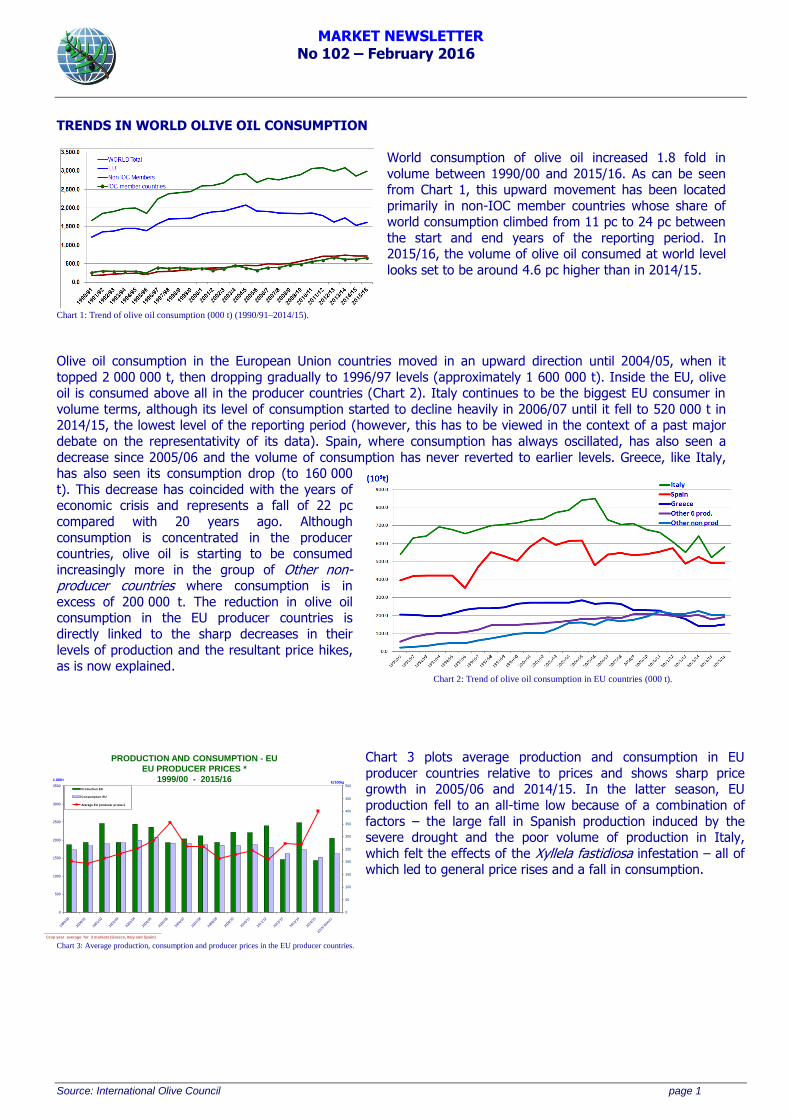
World consumption of olive oil increased 1.8 fold in
volume between 1990/00 and 2015/16. As can be seen from Chart 1, this upward movement has been located
primarily in non-IOC member countries whose share of world consumption climbed from 11 pc to 24 pc between
the start and end years of the reporting period. In 2015/16, the volume of olive oil consumed at world level
looks set to be around 4.6 pc higher than in 2014/15.
Chart 1: Trend of olive oil consumption (000 t) (1990/91–2014/15).
Olive oil consumption in the European Union countries moved in an upward direction until 2004/05, when it
topped 2 000 000 t, then dropping gradually to 1996/97 levels (approximately 1 600 000 t). Inside the EU, olive oil is consumed above all in the producer countries (Chart 2). Italy continues to be the biggest EU consumer in
volume terms, although its level of consumption started to decline heavily in 2006/07 until it fell to 520 000 t in 2014/15, the lowest level of the reporting period (however, this has to be viewed in the context of a past major
debate on the representativity of its data). Spain, where consumption has always oscillated, has also seen a
decrease since 2005/06 and the volume of consumption has never reverted to earlier levels. Greece, like Italy, has also seen its consumption drop (to 160 000
t). This decrease has coincided with the years of economic crisis and represents a fall of 22 pc
compared with 20 years ago. Although
consumption is concentrated in the producer countries, olive oil is starting to be consumed
increasingly more in the group of Other non-producer countries where consumption is in
excess of 200 000 t. The reduction in olive oil consumption in the EU producer countries is
directly linked to the sharp decreases in their
levels of production and the resultant price hikes, as is now explained. Chart 2: Trend of olive oil consumption in EU countries (000 t).
Chart 3 plots average production and consumption in EU
producer countries relative to prices and shows sharp price growth in 2005/06 and 2014/15. In the latter season, EU
production fell to an all-time low because of a combination of
factors – the large fall in Spanish production induced by the severe drought and the poor volume of production in Italy,
which felt the effects of the Xyllela fastidiosa infestation – all of which led to general price rises and a fall in consumption.
Chart 3: Average production, consumption and producer prices in the EU producer countries.
0
500
1000
1500
2000
2500
3000
3500
1999/
00
2000/
01
2001/
02
2002/
03
2003/
04
2004/
05
2005/
06
2006/
07
2007/
08
2008/
09
2009/
10
2010/
11
2011/
12
2012/
13
2013/
14
2014/
15
2015/
16(e
st.)
0
50
100
150
200
250
300
350
400
450
500Production EU
Consumption EU
Average EU producer prices €
PRODUCTION AND CONSUMPTION - EU
EU PRODUCER PRICES *
1999/00 - 2015/16
Crop year average for 3 markets (Greece, Italy and Spain)
1.000 t€/100kg
0
500
1000
1500
2000
2500
3000
3500
1999/
00
2000/
01
2001/
02
2002/
03
2003/
04
2004/
05
2005/
06
2006/
07
2007/
08
2008/
09
2009/
10
2010/
11
2011/
12
2012/
13
2013/
14
2014/
15
2015/
16(e
st.)
0
50
100
150
200
250
300
350
400
450
500Production EU
Consumption EU
Average EU producer prices €
PRODUCTION AND CONSUMPTION - EU
EU PRODUCER PRICES *
1999/00 - 2015/16
Crop year average for 3 markets (Greece, Italy and Spain)
1.000 t€/100kg
MARKET NEWSLETTER No 102 – February 2016
Source: International Olive Council page 2
Chart 4 shows world resources against producer prices for
extra virgin olive oil in three representative markets of the
EU – Italy (Bari), Greece (Chania) and Spain (Jaén) – where some 74 pc of the world’s olive oil is produced.
Consequently, their market performance has an impact on prices in other regions of the EU as well as in other producer
countries, especially on export prices. Chart 4: World resources (t) and average EU prices (€/100kg) by crop year.
Annual per capita consumption of olive oil in the EU countries in 2013 and 2014can be observed in Chart 5. Despite
the decrease in total Greek consumption, Greece continues to lead the ranking with 12.8 kg, although this is lower than the previous crop year. It is followed by Spain (11.3 kg), Italy (10.5 kg) and Portugal (7.2 kg). Next come
Cyprus (5.5 kg), Luxembourg (3.2 kg because of
supermarket purchases by consumers from neighbouring countries), Malta (3 kg), France and Croatia (1.7 kg),
Ireland and Belgium (1.4 kg) and Denmark (1.2 kg). In the rest of the EU members per capita consumption is
split between the countries that consume between 1 kg
and 0.5 kg per year (in descending order: Estonia, Czech Republic, Finland Latvia, Germany, Netherlands, Sweden,
Slovenia, Austria and the United Kingdom) and those where it is below 0.4 kg (Romania, Poland, Hungary,
Bulgaria, Slovakia and Lithuania). Chart 5: Per capita olive oil consumption (2014) in EU countries (kg).
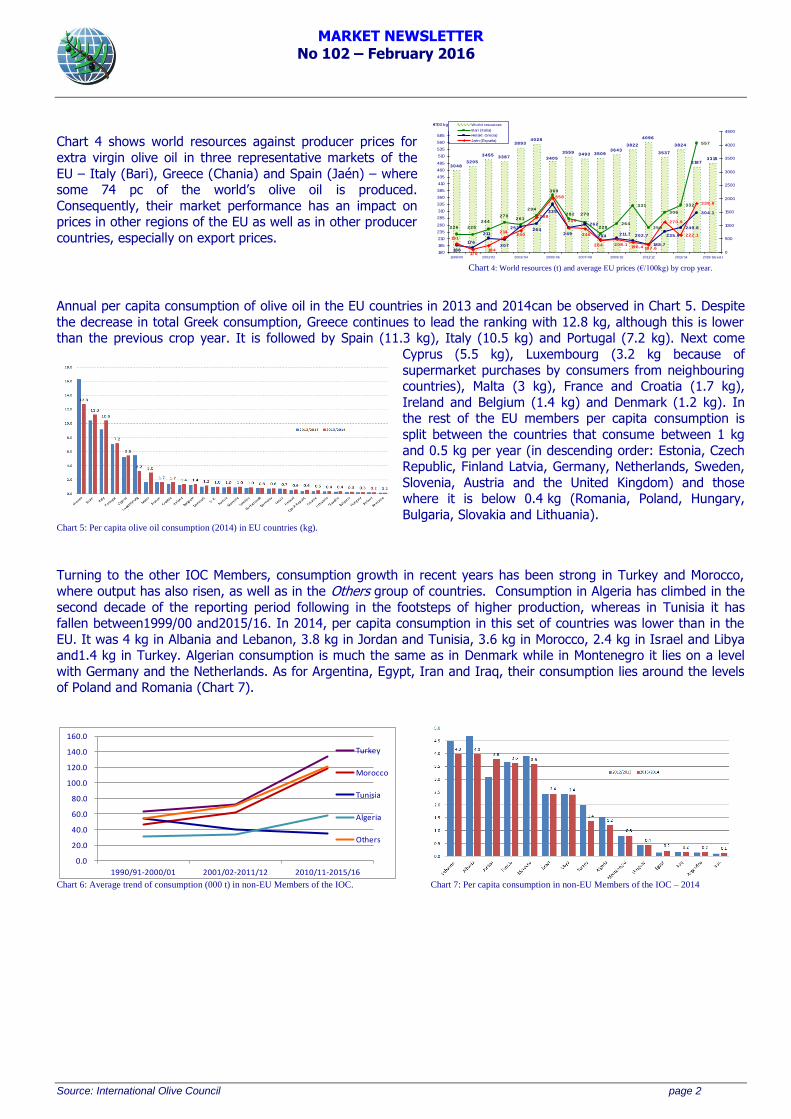
Turning to the other IOC Members, consumption growth in recent years has been strong in Turkey and Morocco,
where output has also risen, as well as in the Others group of countries. Consumption in Algeria has climbed in the
second decade of the reporting period following in the footsteps of higher production, whereas in Tunisia it has fallen between1999/00 and2015/16. In 2014, per capita consumption in this set of countries was lower than in the
EU. It was 4 kg in Albania and Lebanon, 3.8 kg in Jordan and Tunisia, 3.6 kg in Morocco, 2.4 kg in Israel and Libya and1.4 kg in Turkey. Algerian consumption is much the same as in Denmark while in Montenegro it lies on a level
with Germany and the Netherlands. As for Argentina, Egypt, Iran and Iraq, their consumption lies around the levels of Poland and Romania (Chart 7).
Chart 6: Average trend of consumption (000 t) in non-EU Members of the IOC. Chart 7: Per capita consumption in non-EU Members of the IOC – 2014
0.0
20.0
40.0
60.0
80.0
100.0
120.0
140.0
160.0
1990/91-2000/01 2001/02-2011/12 2010/11-2015/16
Turkey
Morocco
Tunisia
Algeria
Others
30483205
3455 3387
38934028
3559 3493 35093643
3822
4096
3537
3824
318733153405
264
331
250
306
332
557
262
188.7
249.8
304.1
270.9
222.1
338.8
228
270
369
226 225
244
270261
282
294
235.9202.7211.7204
335
249264253
207
211
176
186
246
196.4208.1
187.6204
358
250288
240214
184170
191
160
185
210
235
260
285
310
335
360
385
410
435
460
485
510
535
560
585
1999/ 00 2001/ 02 2003/ 04 2005/ 06 2007/ 08 2009/ 10 2011/ 12 2013/ 14 2015/ 16(est )
€/100 kg
0
500
1000
1500
2000
2500
3000
3500
4000
4500
World resources
Bari (Italia)
Herakl. Grecia)
Jaén (España)
MOVEMENTS IN PRODUCER PRICESExtra virgin olive oil
Average prices by crop year
MARKET NEWSLETTER No 102 – February 2016
Source: International Olive Council page 3
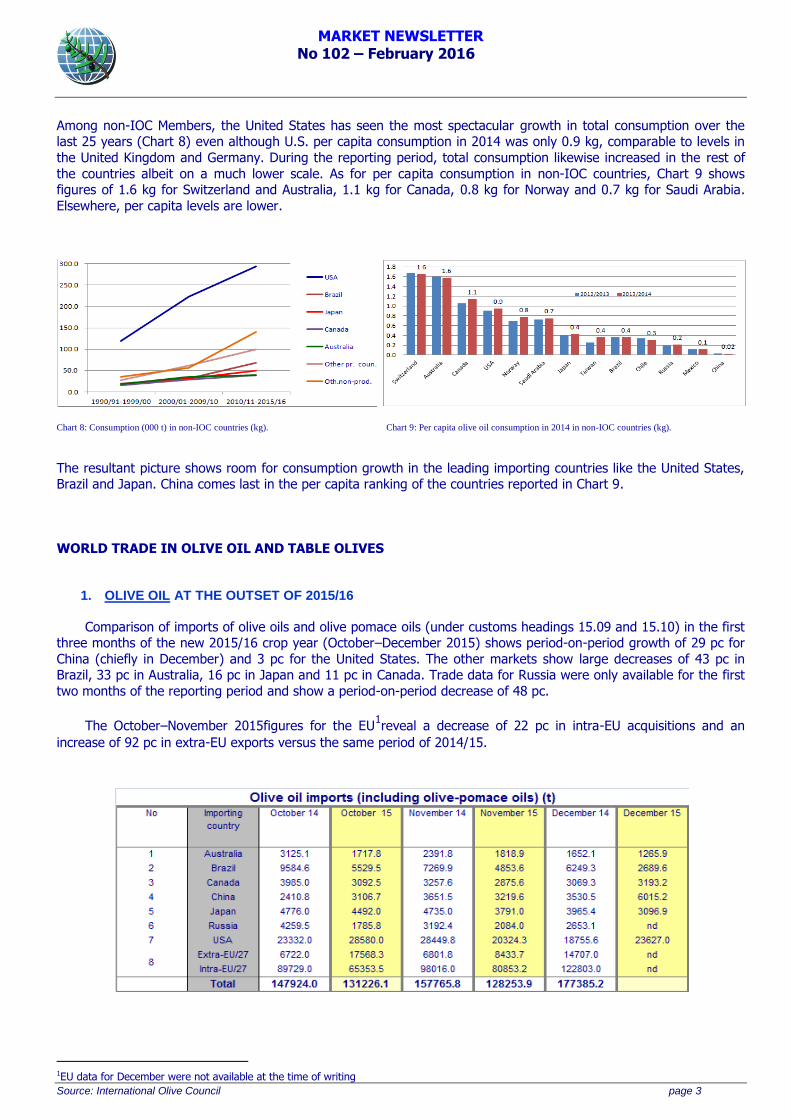
Among non-IOC Members, the United States has seen the most spectacular growth in total consumption over the last 25 years (Chart 8) even although U.S. per capita consumption in 2014 was only 0.9 kg, comparable to levels in
the United Kingdom and Germany. During the reporting period, total consumption likewise increased in the rest of
the countries albeit on a much lower scale. As for per capita consumption in non-IOC countries, Chart 9 shows figures of 1.6 kg for Switzerland and Australia, 1.1 kg for Canada, 0.8 kg for Norway and 0.7 kg for Saudi Arabia.
Elsewhere, per capita levels are lower.
Chart 8: Consumption (000 t) in non-IOC countries (kg). Chart 9: Per capita olive oil consumption in 2014 in non-IOC countries (kg).
The resultant picture shows room for consumption growth in the leading importing countries like the United States, Brazil and Japan. China comes last in the per capita ranking of the countries reported in Chart 9.
WORLD TRADE IN OLIVE OIL AND TABLE OLIVES
1. OLIVE OIL AT THE OUTSET OF 2015/16
Comparison of imports of olive oils and olive pomace oils (under customs headings 15.09 and 15.10) in the first three months of the new 2015/16 crop year (October–December 2015) shows period-on-period growth of 29 pc for
China (chiefly in December) and 3 pc for the United States. The other markets show large decreases of 43 pc in Brazil, 33 pc in Australia, 16 pc in Japan and 11 pc in Canada. Trade data for Russia were only available for the first
two months of the reporting period and show a period-on-period decrease of 48 pc.
The October–November 2015figures for the EU1reveal a decrease of 22 pc in intra-EU acquisitions and an
increase of 92 pc in extra-EU exports versus the same period of 2014/15.
1EU data for December were not available at the time of writing
MARKET NEWSLETTER No 102 – February 2016
Source: International Olive Council page 4
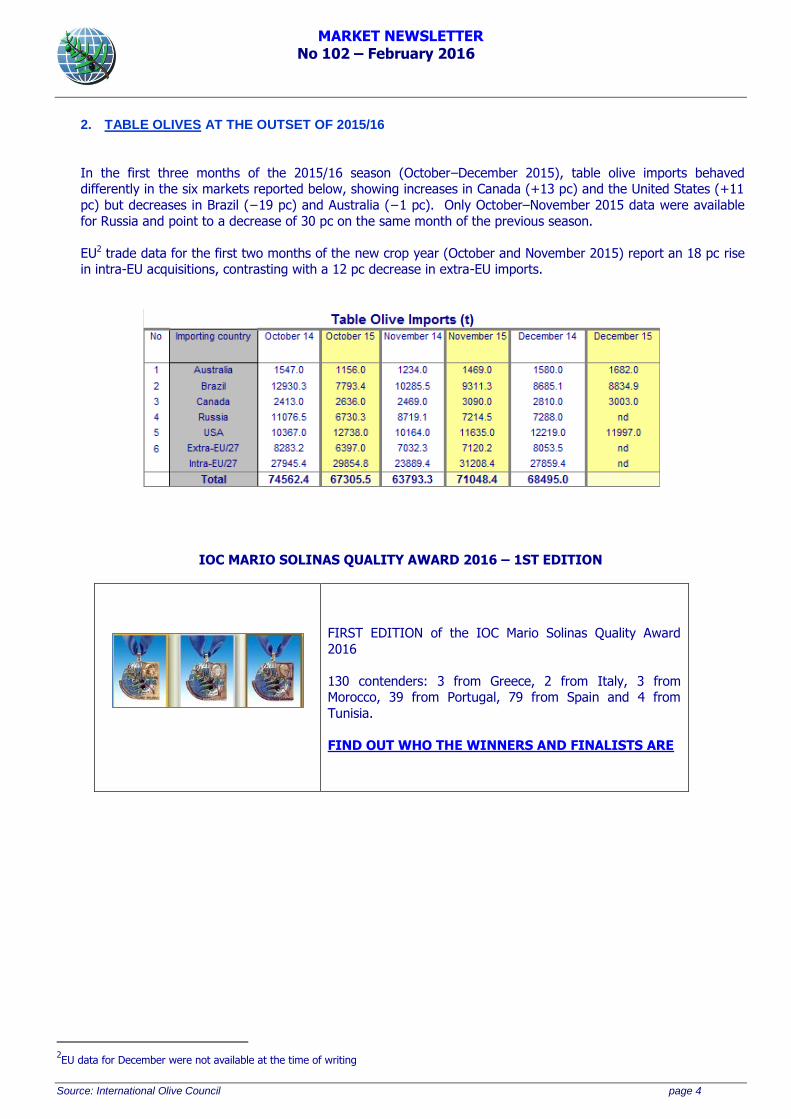
2. TABLE OLIVES AT THE OUTSET OF 2015/16
In the first three months of the 2015/16 season (October–December 2015), table olive imports behaved differently in the six markets reported below, showing increases in Canada (+13 pc) and the United States (+11
pc) but decreases in Brazil (−19 pc) and Australia (−1 pc). Only October–November 2015 data were available
for Russia and point to a decrease of 30 pc on the same month of the previous season.
EU2 trade data for the first two months of the new crop year (October and November 2015) report an 18 pc rise in intra-EU acquisitions, contrasting with a 12 pc decrease in extra-EU imports.
IOC MARIO SOLINAS QUALITY AWARD 2016 – 1ST EDITION
FIRST EDITION of the IOC Mario Solinas Quality Award
2016
130 contenders: 3 from Greece, 2 from Italy, 3 from Morocco, 39 from Portugal, 79 from Spain and 4 from
Tunisia.
FIND OUT WHO THE WINNERS AND FINALISTS ARE
2EU data for December were not available at the time of writing
MARKET NEWSLETTER No 102 – February 2016
Source: International Olive Council page 5
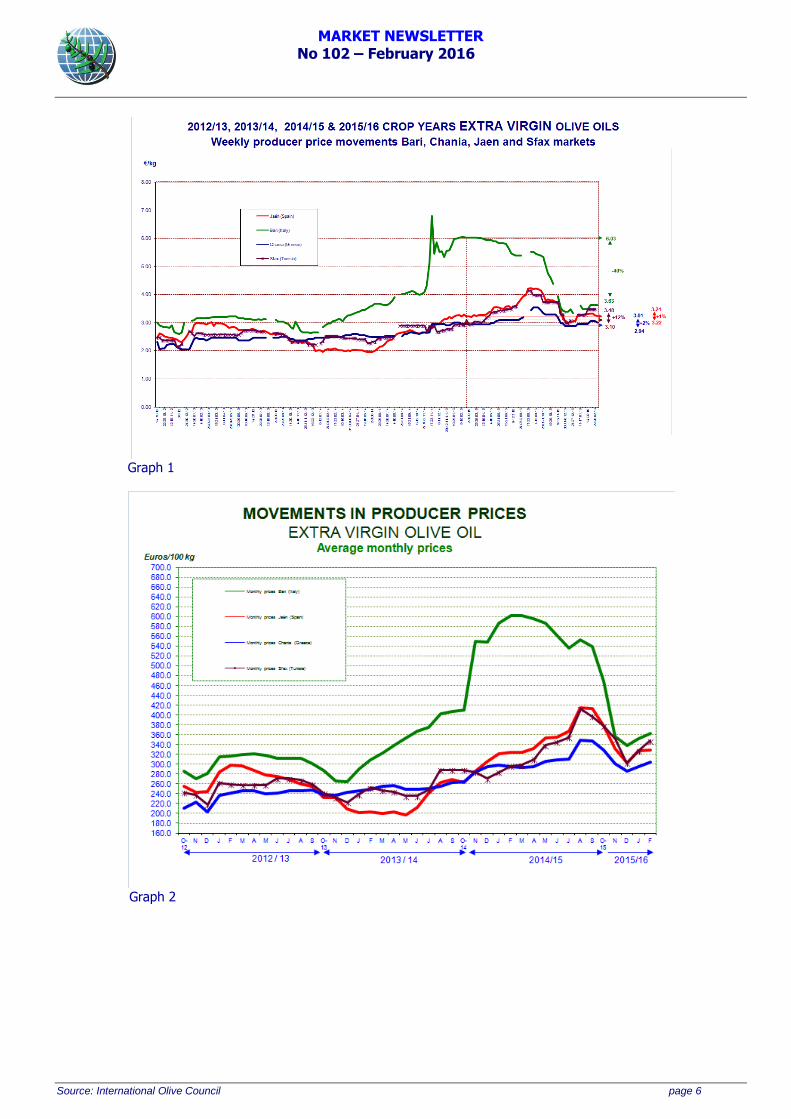
II. PRODUCER PRICES
Graph 1 tracks the weekly movements in the prices paid to producers for extra virgin olive oil in the three top EU
producing countries plus Tunisia while Graph 3 shows the weekly changes in the producer prices for refined olive oil in the three main EU producers. Monthly price movements for the same two grades of oil are given in Graphs 2 and
4.
Extra virgin olive oil: After peaking at €4.23/kg in the third week of August 2015, producer prices in Spain switched direction and began to drop, gathering momentum from the last week of September (Graph 1). In recent
weeks, prices have dipped and were lying at €3.24/kg in the last week of February 2016. This is 1 pc higher
than a year earlier and 65 pc higher than the low recorded in the third week of May 2014 (€1.96/kg), but 21 pc below the maximum (€4.23/kg).
Italy: In the week from 10 to 16 November 2014, producer prices in Italy hit their highest level of both the last
decade and the reporting period, reaching €6.79/kg. After some fluctuations, they started to fall sharply, only then to pick up and to steady at around €3.63/kg by the end of February 2016. This level was still 40 pc lower than
a year earlier. Graph 2 shows how the monthly prices of extra virgin olive oil have behaved in recent crop years.
Greece: In the last weeks of August and first week of September 2015, prices rose to period highs (€3.54/kg). After holding steady, they dipped only to inch up again. At the close of February2016, they had dropped slightly to
3.01/kg, 2 pc down on the same period a season earlier.
Tunisia: Producer prices peaked in the last weeks of August 2015 (€4.13/kg). Then, like elsewhere, they started to drop, but later switched back upwards. At the end of February 2016, they were lying at €3.48/kg, showing
period-on-period growth of +12 pc.
MARKET NEWSLETTER No 102 – February 2016
Source: International Olive Council page 6
Graph 1
Graph 2
MARKET NEWSLETTER No 102 – February 2016
Source: International Olive Council page 7
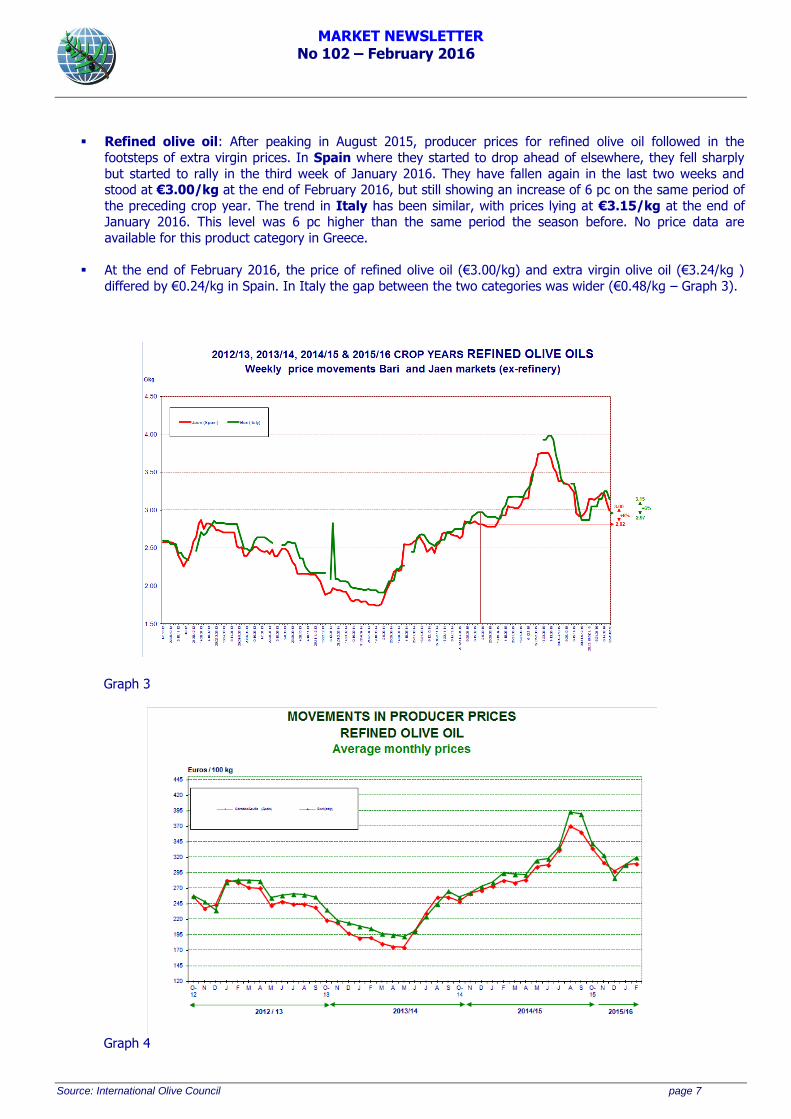
Refined olive oil: After peaking in August 2015, producer prices for refined olive oil followed in the
footsteps of extra virgin prices. In Spain where they started to drop ahead of elsewhere, they fell sharply
but started to rally in the third week of January 2016. They have fallen again in the last two weeks and stood at €3.00/kg at the end of February 2016, but still showing an increase of 6 pc on the same period of
the preceding crop year. The trend in Italy has been similar, with prices lying at €3.15/kg at the end of January 2016. This level was 6 pc higher than the same period the season before. No price data are
available for this product category in Greece.
At the end of February 2016, the price of refined olive oil (€3.00/kg) and extra virgin olive oil (€3.24/kg )
differed by €0.24/kg in Spain. In Italy the gap between the two categories was wider (€0.48/kg – Graph 3).
Graph 3
Graph 4

MARKET NEWSLETTER No 102 – February 2016
Source: International Olive Council page 8
STAY TUNED
Keep track of what’s going on in the industry: http://www.scoop.it/t/olive-news
Find out what’s happening at the IOC: http://www.linkedin.com/company/international-olive-council
Read our scientific journal OLIVAE: http://www.internationaloliveoil.org/store/index/48-olivae-publications