Auditory Temporal Order Discrimination and Backward
15
1352 Journal of Speech, Language, and Hearing Research • Vol. 46 • 1352–1366 • December 2003 • ©American Speech-Language-Hearing Association 1092-4388/03/4606-1352 Yvonne M. Griffiths Nicholas I. Hill University of Essex, Colchester, Essex, United Kingdom Peter J. Bailey Margaret J. Snowling University of York, Heslington, York, United Kingdom Auditory Temporal Order Discrimination and Backward Recognition Masking in Adults With Dyslexia The ability of 20 adult dyslexic readers to extract frequency information from successive tone pairs was compared with that of IQ-matched controls using temporal order discrimination and auditory backward recognition masking (ABRM) tasks. In both paradigms, the interstimulus interval (ISI) between tones in a pair was either short (20 ms) or long (200 ms). Temporal order discrimination was better for both groups of listeners at long than at short ISIs, but no group differences in performance were observed at either ISI. Performance on the ABRM task was also better at long than at short ISIs and was influenced by variability in masker frequency and by the spectral proximity of target and masker. The only significant group difference was found in one condition of the ABRM task when the target–masker interval was 200 ms, but this difference was not reliable when the measure was of optimal performance. Moderate correlations were observed between auditory thresholds and phonological skill for the sample as a whole and within the dyslexic and control groups. However, although a small subgroup of dyslexic listeners with poor phonology was characterized by elevated thresholds across the auditory tasks, evidence for an association between auditory and phonological processing skills was weakened by the finding of a subgroup of control listeners with poor auditory processing and normal phonological process- ing skills. KEY WORDS: dyslexia, adults, phonological processing, rapid auditory processing, frequency discrimination I n recent years, there has been renewed interest in the possibility that a fundamental perceptual limitation in the auditory domain com- promises phonological representations that are critical to oral and written language development (Tallal, Allard, Miller, & Curtiss, 1997). This proposal followed from a series of experiments, conducted by Tallal and colleagues with children with specific language impairment (SLI), that made extensive use of an auditory repetition task. In this task, children were first taught to label differentially a pair of complex tones differing in fundamental frequency. Next, children were presented with sequences of the tones and had to indicate the order in which the tones had been presented. In the test phase, the interstimulus interval (ISI) for the tone pairs was varied from short to long durations. Performance on this temporal order task was impaired for children in the SLI group when the ISI was relatively short (below 150 ms; Tallal
Transcript of Auditory Temporal Order Discrimination and Backward

1352 Journal of Speech, Language, and Hearing Research • Vol. 46 • 1352–1366 • December 2003Journal of Speech, Language, and Hearing Research • Vol. 46 • 1352–1366 • December 2003 • ©American Speech-Language-Hearing Association1092-4388/03/4606-1352
Yvonne M. GriffithsNicholas I. Hill
University of Essex,Colchester, Essex,United Kingdom
Peter J. BaileyMargaret J. Snowling
University of York,Heslington, York,United Kingdom
Auditory Temporal OrderDiscrimination and BackwardRecognition Masking in AdultsWith Dyslexia
The ability of 20 adult dyslexic readers to extract frequency information fromsuccessive tone pairs was compared with that of IQ-matched controls usingtemporal order discrimination and auditory backward recognition masking(ABRM) tasks. In both paradigms, the interstimulus interval (ISI) between tones ina pair was either short (20 ms) or long (200 ms). Temporal order discriminationwas better for both groups of listeners at long than at short ISIs, but no groupdifferences in performance were observed at either ISI. Performance on the ABRMtask was also better at long than at short ISIs and was influenced by variability inmasker frequency and by the spectral proximity of target and masker. The onlysignificant group difference was found in one condition of the ABRM task whenthe target–masker interval was 200 ms, but this difference was not reliable whenthe measure was of optimal performance. Moderate correlations were observedbetween auditory thresholds and phonological skill for the sample as a whole andwithin the dyslexic and control groups. However, although a small subgroup ofdyslexic listeners with poor phonology was characterized by elevated thresholdsacross the auditory tasks, evidence for an association between auditory andphonological processing skills was weakened by the finding of a subgroup ofcontrol listeners with poor auditory processing and normal phonological process-ing skills.
KEY WORDS: dyslexia, adults, phonological processing, rapid auditoryprocessing, frequency discrimination
In recent years, there has been renewed interest in the possibilitythat a fundamental perceptual limitation in the auditory domain com-promises phonological representations that are critical to oral and
written language development (Tallal, Allard, Miller, & Curtiss, 1997).This proposal followed from a series of experiments, conducted by Tallaland colleagues with children with specific language impairment (SLI),that made extensive use of an auditory repetition task. In this task,children were first taught to label differentially a pair of complex tonesdiffering in fundamental frequency. Next, children were presented withsequences of the tones and had to indicate the order in which the toneshad been presented. In the test phase, the interstimulus interval (ISI)for the tone pairs was varied from short to long durations.
Performance on this temporal order task was impaired for childrenin the SLI group when the ISI was relatively short (below 150 ms; Tallal

Griffiths et al.: Auditory Deficits in Dyslexia 1353
& Piercy, 1973a) and also when tones were short (75ms) rather than long (250 ms) in duration (Tallal &Piercy, 1973b). Furthermore, the groups did not differon a visual version of the task. The results were takento indicate a deficit, specific to the auditory domain, inprocessing brief, rapidly presented auditory signalsamong children with SLI.1 Similar findings were re-ported for a group of 20 children with reading disability,who were also given a discrimination and a repetitionversion of the auditory task, using mixed presentationof pairs of stimuli at different ISIs (Tallal, 1980). It isimportant to note that only 40% (8 out of 20) of the poorreaders showed a clear deficit on the repetition task.
Attempts to replicate Tallal’s (1980) finding of rapidauditory processing deficits in samples of dyslexic chil-dren and adults have been equivocal (e.g., Heath, Hogben,& Clark, 1999). In line with Tallal, Reed (1989) demon-strated group differences in performance on the repeti-tion task for short (10 ms), but not for long (400 ms)ISIs (cf. Cacace, McFarland, Ouimet, Schrieber, & Marro,2000). Further studies have reported weaker levels ofperformance on the auditory repetition task for groupsof dyslexic children, for both long and short ISIs(Marshall, Snowling, & Bailey, 2001; Nittrouer, 1999;Reed, 1989; Waber et al., 2001).
A second experimental procedure used to investi-gate processing of rapidly presented auditory signals hasinvolved auditory backward recognition masking (ABRM;McArthur & Hogben, 2001). In this task individuals arerequired to discriminate and identify intensity or pitchdifferences between suprathreshold test signals that arefollowed by an auditory mask (Kallman & Massaro,1979; Massaro, 1972; Massaro & Burke, 1991); recogni-tion masking differs from energetic masking, which ismanifest typically as elevated thresholds for signal de-tection. The effect of the masker on test recognition isgreatest when the ISI between test and masker stimuliis relatively short (250 ms) and is reduced at longer ISIsbecause more time is available for perceptual process-ing of the signal before the arrival of the masker. Thistask can therefore be considered an index of rapid audi-tory perceptual processing on the assumption that morerapid processing of the signal will reduce the effects ofthe masker.
McArthur and Hogben (2001) used ABRM to exam-ine the ability of reading-disabled children to make in-tensity discriminations between pairs of tones that werefollowed by an auditory mask. Overall, there were nodifferences in performance between poor readers andcontrols. However, a subgroup of the reading-disabledchildren showed elevated thresholds on the ABRM task;
these poor readers tended to show concomitant oral lan-guage difficulties (cf. Heath et al., 1999). It should benoted, however, that at least some of the individuals withoral language difficulties in the study had ABRM thresh-olds within the normal range.
The question of what underlies deficits in perfor-mance on tests of rapid auditory processing remains un-resolved. The finding that individuals with reading dif-ficulties perform within the normal range on taskstypically taken to measure temporal resolution, such asthe ability to detect a brief silent interval in ongoingnoise (McAnally & Stein, 1996; Schulte-Korne, Deimel,Bartling, & Remschmidt, 1998), suggests that the impair-ment does not involve simply poor temporal resolution.
Several recent studies have reported that dyslexiclisteners show deficits on tests tapping the discrimina-tion of basic acoustic dimensions, including frequencydiscrimination, detection of frequency modulated tones,and binaural release from masking (Hari, Saaskilahti,Helenius, & Uutela, 1999; McAnally & Stein 1996). In asimilar vein, Baldeweg, Richardson, and Gruzelier(1999) measured electroencephalic responses in groupsof dyslexic and normal reading adults. They reportedabnormal mismatch negativity in the dyslexia group inresponse to changes in tone frequency (but not to changesin tone duration) when performing a visual distractortask. In contrast, Hill, Bailey, Griffiths, and Snowling(1999) found no significant differences between adultswith dyslexia and normal reading adults (matched forage and IQ) in mean frequency difference thresholds thatwere measured at relatively low (1 kHz) or high (6 kHz)frequencies. However, a subgroup of dyslexic listenerswas noted to have high thresholds outside the range ofperformance for the control group at both frequencies.Conflicting findings have also been reported for samplesof adults with dyslexia given tasks involving detectionof frequency modulation (FM; Hill et al., 1999; Wittonet al., 1998).
A plausible reason for at least some of the conflict-ing findings in studies investigating low-level auditoryprocesses in dyslexia is that the dyslexic samples aredrawn from different populations and may differ in se-verity. It is widely acknowledged that there are indi-vidual differences in dyslexic children’s reading (Castles& Coltheart, 1993) and related variations in the sever-ity of their phonological processing deficits (Griffiths &Snowling, 2002). Indeed, according to Tallal (1980), onlythose individuals demonstrating more severe phonologi-cal processing impairments would be expected to dem-onstrate deficits in rapid auditory processing.
In line with this view, correlations of moderate sizehave been reported for poor and normal readers betweennonword reading (i.e., phonological decoding skill) andFM detection thresholds (Witton et al., 1998) and between
1 Tallal changed her position in later work (Tallal, 1980; Tallal et al.,1997), arguing for temporal order deficit; see Studdert-Kennedy andMody (1995) for a discussion regarding the term temporal processing.

1354 Journal of Speech, Language, and Hearing Research • Vol. 46 • 1352–1366 • December 2003
nonword reading and performance on an auditory tem-poral order judgment task (Heath et al., 1999). McAnally,Castles, and Stuart (2000) concluded that frequencydiscrimination skill is associated specifically withnonword rather than word reading skill. Correlationsbetween auditory performance and nonword readinghave also been reported in unselected samples of nor-mal readers, after controlling for the effects of age andIQ (Ahissar, Protopapas, Reid, & Merzenich, 2000; Au& Lovegrove, 2001; Talcott et al., 1999). However,Bishop, Carlyon, Deeks, and Bishop (1999) failed to finda significant correlation between nonword reading andauditory processing performance in a sample of chil-dren with SLI.
A more stringent test of the strength of the associa-tion between auditory processing and phonological pro-cessing skill is provided by its relation with measures oforal phonological processing rather than nonword read-ing. Marshall et al. (2001) reported a significant partialcorrelation after controlling for age and nonverbal abil-ity between performance on the auditory repetition taskand scores on tests of phoneme deletion, rhyme oddity,and nonword repetition for a group of dyslexic and nor-mal readers. However, the relatively small samples ofparticipants in these studies indicate a need for cautionwhen interpreting significant correlations between au-ditory and phonological skills.
The present article was concerned principally withthe hypothesis that people with dyslexia have a deficitthat impairs their ability to process auditory stimulipresented in rapid succession (e.g., Tallal, 1980). A sec-ondary objective was to examine whether our previousfinding of unimpaired pure-tone frequency discrimina-tion in adults with dyslexia (Hill et al., 1999) could bereplicated using a larger sample and tones of muchshorter duration. In line with Hill et al., our sample ofadults with dyslexia consisted of high-functioning indi-viduals selected from the student population. Althoughsuch samples of adults with dyslexia are not represen-tative of the dyslexia population at large, our aim was toreduce the likelihood of introducing the unwanted con-found of another comorbid disorder (e.g., SLI or atten-tion deficit hyperactivity disorder [ADHD]; cf. McArthur,Hogben, Edwards, Heath, & Mengler, 2001; Ramus etal., 2003).
In two experiments, we assessed the performanceof dyslexic and normally reading adults on tasks involv-ing “oddity” judgements about sequences of auditorystimuli presented at slow (200-ms ISI) and fast (20-msISI) rates of presentation. The aim was to extend thekinds of methods that have been used with children toadults. In each case, evidence was also sought for a re-lation between auditory processing and phonologicalprocessing skills. The first experiment used a temporal
order discrimination (TOD) procedure in which listen-ers were presented with a sequence of four pairs of brieftones. There was a frequency difference (∆F) betweenthe two tones in each pair that was manipulated duringthe experiment. In three of the pairs within the sequence,the standard within-pair tone order was low–high, andin the target pair the order was high–low. The hypoth-esis that dyslexic listeners have an impairment in audi-tory processing of rapidly presented auditory eventspredicts that any differences between the dyslexic lis-teners and the normal-reading control listeners in theobserved threshold should be greater in the short thanin the long ISI condition.
The second experiment used an ABRM procedureto examine the degree to which dyslexic and control lis-teners could extract frequency information from the lead-ing tone of a pair of brief tones. Listeners were requiredto detect the “odd-one-out” from a sequence of four testtones. Three of the four tones were at a standard fre-quency (1 kHz) and the target tone was at a higherfrequency (by ∆F Hz). In a baseline condition there wasno masking tone. In the other conditions in the experi-ment, each test tone was followed by a masking tonethat was irrelevant to the task. There were two inde-pendent variables: (a) the duration of the interval be-tween the test and masker tones (20 ms or 200 ms) and(b) the frequency of the masking tone. The latter vari-able was fixed at the standard frequency, selected ran-domly from a range around the standard frequency, orselected randomly from a range an octave above the stan-dard frequency.
On the basis of our previous results (Hill et al.,1999), we did not expect to find differences betweendyslexic and control listeners on the frequency discrimi-nation baseline condition, although, as noted above,some other studies have reported elevated frequencydifference thresholds for dyslexic listeners. In themasker conditions, a masking tone would be expectedto have an effect on the dependent variable providedthat it (a) interferes with perceptual processing of a testtone and (b) arrives before the listener has extractedsufficient perceptual information for the task from theauditory representation of the test tone. Because theseprerequisites should be met in masking conditions whentest and masking tones are separated by the short ISI(Massaro, 1970; Sparks, 1976), it was predicted thatrecognition of the test tone frequency should be ad-versely affected in the short ISI condition relative tothe long ISI condition. Furthermore, if dyslexic listen-ers are impaired in their ability to process rapidly pre-sented auditory events then they should be more sus-ceptible to the effects of the masker. This susceptibilityshould be greater at the short ISI and should manifestas greater threshold elevation (larger ∆F relative to

Griffiths et al.: Auditory Deficits in Dyslexia 1355
the no-masker baseline condition) for dyslexic listenersthan for control listeners.2
Different patterns of data may be expected for thedifferent masker conditions. In the fixed-frequencymasker condition (which has some similarities to thesame–different discrimination test used by Tallal,1980), masking effects may be at least partially offsetby strategic use of within-pair test–masker compari-sons to facilitate identification of the interval contain-ing the target tone. When the frequency of the maskertone is varied randomly around the standard tone fre-quency—the 1-kHz random-frequency masker condi-tion—the potential benefits of strategic test–maskercomparisons are eliminated. Instead, there is now apotential cost associated with the risk of confusing testand masking tones. The risk of this confusion is re-duced when the masker frequency varies randomlyaround 2 kHz. These considerations predict magnitudesof masking effects in the following order: fixed-fre-quency masker < 2-kHz random-frequency masker <1-kHz random-frequency masker.
There are also grounds for expecting a difference inperformance between dyslexic and control listeners acrossthe two random-frequency masker conditions. Rosen andManganari (2001) reported that people with dyslexia hadhigher detection thresholds than control listeners in abackward-masking task when the masker was a bandpassnoise centered on the signal frequency. However, therewas no significant difference in threshold when themasker energy was spectrally remote from the signal.Although the reason underlying the poorer performanceof the people with dyslexia in the on-frequency masker
condition is unclear, this result provides some basis forpredicting that the relative performance of dyslexic lis-teners will be poorer when the random frequency maskeris varied around 1 kHz. The same prediction is suggestedby Helenius, Uutela, and Hari’s (1999) report that adultswith dyslexia were more likely than control listeners tosegregate a sequence of different-frequency tones intoseparate perceptual streams.
Thus, in all masker conditions for which the dura-tion of the interval between test and masking tones isshort, the hypothesis that people with dyslexia are im-paired in processing rapidly occurring auditory eventspredicts poorer performance (manifest as elevated thresh-olds) for dyslexic listeners compared to control listeners.
MethodParticipants
Twenty adults with dyslexia (8 men, 12 women),sampled from the student population at the Universityof York, participated in the study; all had a documentedhistory of reading and spelling difficulties. Participantscame from different academic departments and werestudying a variety of subjects. The control group of 20participants (8 men, 12 women) was also selected froma range of academic departments and subject disciplinesand had no known history of difficulties with literacyacquisition. All participants had audiometric pure-tonethresholds not exceeding 20 dB HL in the range of 250–8000 Hz.
Screening VariablesConfirmation of participant status was based on
data summarized in Table 1. The ages of the dyslexic
2 Note that in using these masking-like effects as a performance metric,we made no assumptions about the mechanism by which masking toneshave their effects.
Table 1. Performance of dyslexic readers and controls on screening tests and additional tests of reading fluency and phonological skill
Reading NonsenseLiteracy fluency passage Digit
IQ (WAIS-R) (WRAT-III) (TOWRE) reading Spoonerisms RAN span
BlockVocab Design Read Spell Time Total Time Correct/ Digit Object Scaled
Group Age (Sc) (Sc) (SS) (SS) Word Nonword (s) errors (s/item) 24 (ms) (ms) score
Dyslexic (n = 20)M 21 13 14 104 96 86 87 79 10 2.3 19 42 69 9SD 2 2 3 8 9 12 8 38 4 1.0 6 10 10 2
Control (n = 20)M 22 15 14 111 113 108 107 45 3 1.1 23 28 56 12SD 5 2 2 5 7 9 9 10 3 0.5 1 7 10 3
Note. WAIS-R = Wechsler Adult Intelligence Scale–Revised; WRAT-III = Wide Range Achievement Test–Third Edition; TOWRE = Test of WordReading Efficiency; RAN = rapid automatized naming; Sc = scaled scores; SS = standard scores.

1356 Journal of Speech, Language, and Hearing Research • Vol. 46 • 1352–1366 • December 2003
and the control readers ranged from 18.5 to 28.8 yearsand from 18.5 to 36.9 years, respectively. Matching forIQ was on the basis of the Block Design and Vocabu-lary subtests of the Wechsler Adult Intelligence Scale–Revised (WAIS-R; Wechsler, 1994). The two groups didnot differ in age or IQ: F(1, 38) = 2.9, ns, for Vocabu-lary; F < 1 for Block Design.
Attainments in reading and spelling accuracy wereobtained from all participants by administration of theWide Range Achievement Test–Third Edition (WRAT-III; Jastak & Wilkinson, 1993). The reading attainmentsof the dyslexia group were age-appropriate; however,given their relatively high level of intelligence, theirreading level was below expectation (see Table 1). Read-ing and spelling raw scores for the dyslexia group werepoorer statistically than those of the control group: F(1,38) = 14.0, p < .001, for reading; F(1, 38) = 40.7, p < .001,for spelling.
Literacy and PhonologicalProcessing Measures
Additional measures of reading and phonologicalskill were administered to all participants to confirmgroup status (Hatcher, Snowling, & Griffiths, 2002).
Test of Word Reading Efficiency(TOWRE)
The TOWRE (Torgeson et al., 1999) was used tomeasure reading rate and accuracy. Participants wereshown a list of either words or nonwords and instructedto read aloud as many items as possible within 45 s.
Nonsense Passage ReadingNonsense passage reading was chosen to assess
decoding skill. Each participant read two passagestaken from Finucci et al. (1976, cited in Gross-Glenn,Jallad, Novoa, Helgren-Lempesis, & Lubs, 1990). Thefirst passage contained 17 nonwords embedded in acontext of 52 words (e.g., “Once upon a time a tawndyrapsig named Gub found a tix of pertollic asquees.”).The second passage contained 13 nonwords embeddedin a context of 44 words. Reading time and accuracywere recorded.
SpoonerismsThis task assessed participants’ abilities to segment
and manipulate phonemes by asking them to exchangethe beginning sounds of two words. The words werethe first and last names of famous individuals. Follow-ing training and practice items, 12 test items were ad-ministered; accuracy and response time measures wererecorded.
Rapid NamingRapid automatized naming (RAN) was assessed us-
ing two tasks from the Phonological Assessment Bat-tery (Frederickson, Frith, & Reason, 1997): Digit Nam-ing and Object Naming. Participants were required toname, respectively, 50 digits and 50 pictures of five ob-jects presented on two cards in random order. Perfor-mance was recorded as the time taken to name the items,to the nearest second.
Verbal Short-Term MemoryThe Digit-Span subtest from the WAIS-R (Wechsler,
1994) was used to assess short-term memory, adminis-tered according to the test manual.
Auditory TasksStimuli and Equipment
The stimuli were pure tones having a total dura-tion of 75 ms, including 5-ms linear onset and offsetramps. All tones were presented at a level of 65 dB SPL.Stimulus waveforms were computed in software using24-bit amplitude quantization and a sampling frequencyof 44.1 kHz. The waveforms were converted into volt-ages by means of a LynxOne 24-bit audio card (Lynx Stu-dio Technology, Inc., Costa Mesa, CA). The resulting ana-log signals were routed to a pair of Sennheiser HD580headphones situated inside an IAC 1201-A double-walledsound-attenuating booth. A flat panel LCD monitor in-side the booth provided listeners with information aboutthe status of the experiment. Responses were made viaa standard computer keyboard. The experiments werecontrolled using custom software running on an IBM-compatible PC. The level and duration of the tones wasthe same for the TOD and ABRM tasks.
Temporal Order Discrimination(TOD)
Each trial began with the presentation of a visualalerting stimulus for 400 ms. Listeners then were pre-sented with four pairs of tones 400 ms after the offset ofthe alerting stimulus. The time interval between theonsets of the leading tone in successive pairs was fixedat 775 ms, while the silent interval between membersof a pair was either 20 or 200 ms. The two conditionswere tested in separate blocks, with order of testing ran-domized across participants. Three of the tone pairs werepresented with a standard frequency tone leading a toneof higher frequency, with the remaining target pair hav-ing the reverse order. The target pair was always pre-sented in the second or third interval with equal a prioriprobability, and the task of the listener was to identifythe interval containing the target. Listeners were givenan unlimited time in which to make a response, after

Griffiths et al.: Auditory Deficits in Dyslexia 1357
which they were provided with visual feedback for 400ms. An interval of 1 s separated the offset of the feed-back signal and the start of the next trial.
The standard frequency tone in each pair was fixedat 1 kHz. The frequency of the other tone was variedadaptively over a 60-trial run according to a two-down,one-up rule that converged on the frequency differencecorresponding to 71% correct discrimination (Levitt,1971). At the beginning of a run, the frequency differ-ence between the two tones in each pair (relative to thestandard frequency of 1 kHz) was 8%. This differencewas adjusted using an initial multiplier of 0.5 (i.e., twocorrect responses resulted in a halving of the frequencydifference, whereas an incorrect response resulted in thedifference being doubled). The multiplier was increasedto 0.7 following the first four reversals to improve theresolution of the procedure near threshold. Errors onthe first trial were discarded and did not count as a re-versal. The threshold for a single run was defined asthe geometric mean of the frequency difference at eachreversal after the first four reversals (three if the totalnumber of reversals was odd). Each listener completedfour runs per condition, and the threshold for each con-dition was taken as the geometric mean of the four runs.
Auditory Backward RecognitionMasking (ABRM)
Frequency difference limens (DLFs) were estimatedfor each listener for test tones presented alone withouta masking tone (the baseline condition). The task waspresented using a four-interval, two-alternative, forced-choice (oddity) procedure, with the target signal presentedwith equal a priori probability in either the second orthird interval. The frequency of the tones in three of thefour intervals was fixed at the 1-kHz standard, and thefrequency of the target tone was adjusted adaptivelyusing the same parameters as for the TOD task.
In the remaining conditions, DLFs were estimatedfor backward-masked tones. On each trial, the test tonewas the leading tone in each pair, followed by a maskertone that listeners were instructed to ignore. For threeof the four tone pairs, the frequency of the leading tonewas fixed at 1 kHz. For the remaining pair, the leading(target) tone was higher in frequency. The task of thelistener was to identify the interval in which the lead-ing tone had a frequency greater than 1 kHz, which wasalways the second or third interval with equal a prioriprobability. On each presentation, the frequency of themasker tone in each pair was (a) fixed at 1 kHz, (b) rovedin frequency over the range of 1.8–2.2 kHz, or (c) rovedin frequency over the range of 0.9–1.1 kHz. In the lattertwo conditions, roved in frequency implies that a newmasker frequency was selected randomly from the speci-fied range for each masker presentation. The three
masker conditions were tested in separate blocks of four60-trial runs. Listeners were first tested using an ISI of200 ms (between members of a pair) before being testedon a condition in which the ISI was 20 ms. The adaptiveprocedure used to estimate threshold was the same asthat described above. Again, each listener completed fourruns per condition and the threshold for each conditionwas taken as the geometric mean of the four runs.
ProcedureIn the first session, participants received the cogni-
tive test battery and were screened for hearing loss us-ing standard pure-tone audiometry. Participants com-pleted the TOD task and baseline ABRM condition inthe same 2-hr session, with a 15-min break between thetwo tasks. The remaining ABRM conditions were com-pleted in two separate 2-hr sessions: in the first of thesesessions the ISI was 200 ms (three masker conditions,in separate blocks), and in the final session the ISI was20 ms (three masker conditions, in separate blocks). Thethree-masker conditions were presented in a fixed orderfor each ISI: fixed masker, random-frequency masker cen-tered around 2 kHz, random-frequency masker centeredaround 1 kHz. For an individual participant, no more thanone session was completed per day, all four sessions be-ing completed within a maximum period of 1 month.
ResultsReading and Phonological Skills
The performance of the dyslexic and control groupson the measures of reading and phonological process-ing skills is summarized in Table 1. Multivariate analy-ses of variance revealed that the dyslexia group per-formed significantly less well than the control groupon the reading measures, ∆(6, 28) = 9.8, p < .001, andon the phonological processing tasks, ∆(8, 35) = 4.32, p< .001. Univariate tests confirmed significant group dif-ferences on each of the reading and phonological mea-sures (p < .01).
TODMean TOD thresholds for each group of listeners
and individual thresholds for each listener are shownin Figure 1. Reported thresholds are expressed as a per-centage of the standard frequency. Both groups hadhigher thresholds in the 20-ms ISI condition than in the200-ms ISI condition (standard deviations were similarfor each group). TOD thresholds for the dyslexia groupwere slightly higher than those for the control group inboth ISI conditions (20-ms ISI: dyslexia group = 0.86%,control group = 0.76%; 200-ms ISI: dyslexia group =0.73%, control group = 0.64%).

1358 Journal of Speech, Language, and Hearing Research • Vol. 46 • 1352–1366 • December 2003
An analysis of variance (ANOVA) was performed us-ing a logarithmic transformation of these data, with group(dyslexia, control) as a between-subjects factor and ISI(200 ms, 20 ms) as a within-subjects factor. There was nomain effect of group (F < 1), but there was a significantmain effect of ISI, F(1, 38) = 4.9, p < .05. There was nosignificant Group × ISI interaction (F < 1).
Inspection of the individual thresholds in each con-dition of this experiment revealed some noteworthy pat-terns of individual variation within the sample. A sub-group of 5 individuals with dyslexia and 4 controlsshowed elevated thresholds on this task at both ISIsrelative to the group mean. Thresholds ranged from1.17% to 4.86% for the adults in the dyslexia subgroupand from 1.27% to 4.68% for adults in the control sub-group. Otherwise, there was almost complete overlap ofthe TOD thresholds between the group with dyslexiaand the control group.
ABRMThe results of the dyslexic and normal reader groups
on the ABRM task are shown in Figure 2. Analyseswere performed using a logarithmic transformation ofthese data.
Baseline ConditionThe baseline condition yielded an estimate of the
DLF for 1-kHz 75-ms pure tones. Mean DLFs were simi-lar in magnitude for the two groups of listeners (dyslexia
group = 0.42%; control group = 0.52%), but were nu-merically larger for dyslexic listeners than for the con-trols, with standard deviations of similar magnitude forboth groups. A one-way ANOVA showed that the DLFsfor the two groups did not differ reliably (F < 1). No out-liers were identified in the dyslexia group (using a cri-terion of ±1 SD from the mean), but 1 individual wasidentified as an outlier in the control group.
Masker ConditionsTo examine the effects of masker type and target–
masker ISI on threshold estimates, we performed a 2 ×2 × 3 mixed-design ANOVA, with group (dyslexia, con-trol) as a between-subjects factor and masker type(fixed, 2 kHz, 1 kHz) and ISI (200 ms, 20 ms) as within-subjects factors. The difference between the two groupsdid not reach statistical significance, F(1, 38) = 3.6, p =.06, but there were significant main effects of bothmasker type, F(2, 76) = 171.55, p < .001, and ISI, F(1,38) = 68.1, p < .001. Both groups of listeners had higherthresholds in the short ISI condition than in the longerISI condition. Tests of simple contrasts were used to showthat mean thresholds differed significantly for each ofthe following contrasts: fixed < random 2-kHz masker <random 1-kHz masker.
The Group × ISI interaction was not significant (F< 1), but the Group × Masker interaction was signifi-cant, F(2, 76) = 3.7, p < .05. Tests of simple main effectsindicated that dyslexic listeners had higher thresholds
Figure 1. Dyslexic and normal readers’ performance on the TOD task for interstimulus intervals (ISIs) of 200 ms (circles) and 20 ms (dia-monds). Thresholds are expressed as a percentage of standard frequency. Individual listener thresholds for each group are shown by thesmaller symbols; the enlarged points for each stimulus condition represent the geometric mean threshold for each group.

Griffiths et al.: Auditory Deficits in Dyslexia 1359
than controls in the 2-kHz random-masker condition(group with dyslexia = 3.00%; control group = 1.60%),but the groups did not differ in the fixed-masker or inthe 1-kHz random-masker conditions. For dyslexic lis-teners, thresholds in the fixed-masker condition werereliably lower than those in the two random-maskerconditions, which did not differ (fixed = 0.61%, 2 kHz =3.00%, 1 kHz = 4.17%). For control listeners, thresh-olds also were reliably lower in the fixed-masker con-dition than in the random-masker conditions (fixed =0.50%, 2 kHz = 1.49%, 1 kHz = 3.36%), and, unlike dys-lexic listeners, control listeners’ thresholds in the 2-kHzrandom-masker conditions were reliably lower thanthose in the 1-kHz random-masker condition (p < .001).
Neither the Masker × ISI interaction, F(2, 76) = 2.0,ns, nor the Group × ISI × Masker interaction (F < 1) wassignificant. Thus, the effect of the different masker typeson performance was similar at both short and long ISIs.We note, however, that thresholds were slightly elevatedfor both groups in the fixed-masker condition relativeto the baseline condition for short, F(1, 38) = 2.6, p <.001, but not long ISIs (F < 1).
When the distribution of scores was examined foroutliers, the same subgroups of individuals in both thedyslexic and the control group who were identified forthe TOD task were also outliers in some (but not all) ofthe masker conditions. A small number of dyslexic (6out of 20) and control listeners (5 out of 20) who had not
been identified previously as outliers also had elevatedthresholds relative to the rest of the sample in some(but not all) of the masker conditions.
Optimal ThresholdsFor all of the above analyses, thresholds for indi-
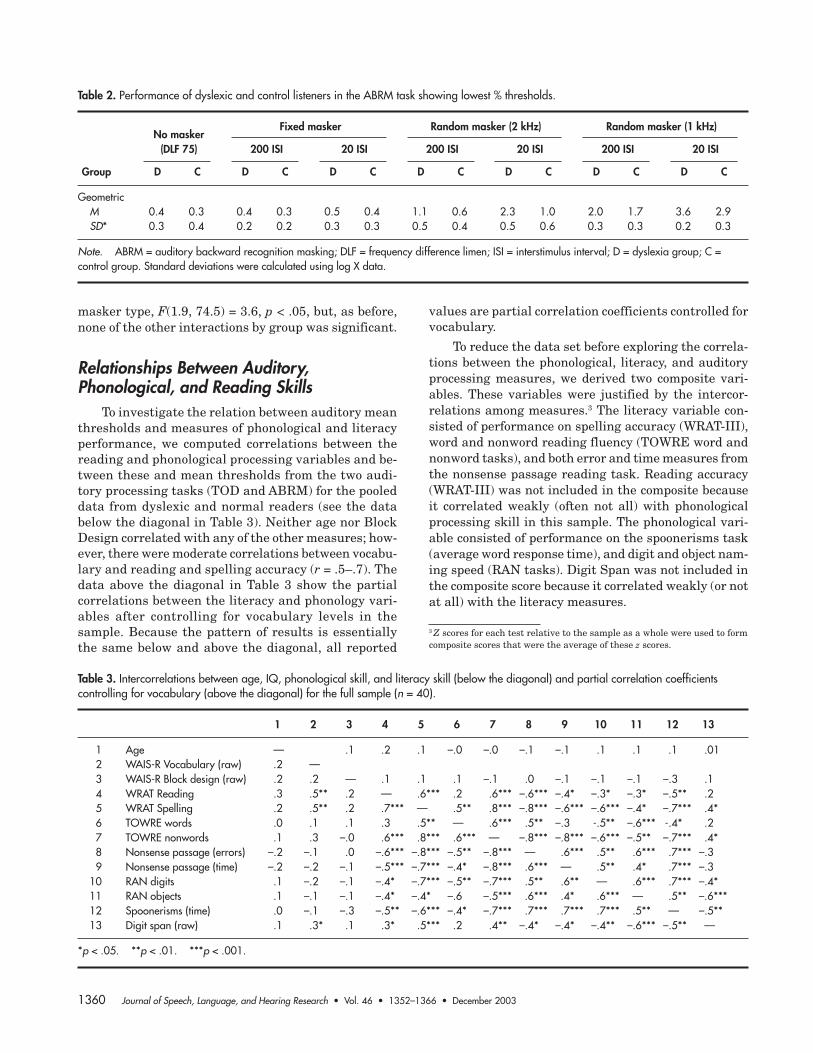
vidual participants had been calculated by averagingacross the thresholds obtained for the four runs in eachcondition. Inspection of these thresholds for participantsin both groups revealed considerable within-conditionvariation, raising the possibility that threshold estimatesbased on an average of the thresholds for individual runsmight have obscured subtle differences in performancebetween the two groups of listeners. To assess this pos-sibility, we reanalyzed these data taking as the mea-sure of performance the lowest threshold estimate foreach listener from the four runs in each condition. Meanperformance based on these best thresholds is summa-rized for both groups of listeners in Table 2.
In an ANOVA based on best thresholds, the maineffect of group was not significant, F(1, 38) = 3.75, p =.06, although as before there was a tendency for thedyslexia group to have higher thresholds than normalreaders (group geometric means [collapsed across con-ditions]: dyslexia = 0.77%, control = 0.52%). Significantmain effects were found for both ISI, F(1, 38) = 57.5, p <.001, and masker type, F(1.54, 58.3) = 117.71, p < .001.There was a significant interaction between ISI and
Figure 2. Dyslexic and normal readers’ performance on the ABRM task (Experiment 2) for ISIs of 200 ms (left panel) and 20 ms (right panel).Thresholds are expressed as a percentage of the standard frequency. The error bars denote standard deviations of the mean. DLF = fre-quency difference limen.
1360 Journal of Speech, Language, and Hearing Research • Vol. 46 • 1352–1366 • December 2003
masker type, F(1.9, 74.5) = 3.6, p < .05, but, as before,none of the other interactions by group was significant.
Relationships Between Auditory,Phonological, and Reading Skills
To investigate the relation between auditory meanthresholds and measures of phonological and literacyperformance, we computed correlations between thereading and phonological processing variables and be-tween these and mean thresholds from the two audi-tory processing tasks (TOD and ABRM) for the pooleddata from dyslexic and normal readers (see the databelow the diagonal in Table 3). Neither age nor BlockDesign correlated with any of the other measures; how-ever, there were moderate correlations between vocabu-lary and reading and spelling accuracy (r = .5–.7). Thedata above the diagonal in Table 3 show the partialcorrelations between the literacy and phonology vari-ables after controlling for vocabulary levels in thesample. Because the pattern of results is essentiallythe same below and above the diagonal, all reported
values are partial correlation coefficients controlled forvocabulary.
To reduce the data set before exploring the correla-tions between the phonological, literacy, and auditoryprocessing measures, we derived two composite vari-ables. These variables were justified by the intercor-relations among measures.3 The literacy variable con-sisted of performance on spelling accuracy (WRAT-III),word and nonword reading fluency (TOWRE word andnonword tasks), and both error and time measures fromthe nonsense passage reading task. Reading accuracy(WRAT-III) was not included in the composite becauseit correlated weakly (often not all) with phonologicalprocessing skill in this sample. The phonological vari-able consisted of performance on the spoonerisms task(average word response time), and digit and object nam-ing speed (RAN tasks). Digit Span was not included inthe composite score because it correlated weakly (or notat all) with the literacy measures.
Table 2. Performance of dyslexic and control listeners in the ABRM task showing lowest % thresholds.
Fixed masker Random masker (2 kHz) Random masker (1 kHz)No masker
(DLF 75) 200 ISI 20 ISI 200 ISI 20 ISI 200 ISI 20 ISI
Group D C D C D C D C D C D C D C
GeometricM 0.4 0.3 0.4 0.3 0.5 0.4 1.1 0.6 2.3 1.0 2.0 1.7 3.6 2.9SD* 0.3 0.4 0.2 0.2 0.3 0.3 0.5 0.4 0.5 0.6 0.3 0.3 0.2 0.3
Note. ABRM = auditory backward recognition masking; DLF = frequency difference limen; ISI = interstimulus interval; D = dyslexia group; C =control group. Standard deviations were calculated using log X data.
Table 3. Intercorrelations between age, IQ, phonological skill, and literacy skill (below the diagonal) and partial correlation coefficientscontrolling for vocabulary (above the diagonal) for the full sample (n = 40).
1 2 3 4 5 6 7 8 9 10 11 12 13
1 Age — .1 .2 .1 –.0 –.0 –.1 –.1 .1 .1 .1 .012 WAIS-R Vocabulary (raw) .2 —3 WAIS-R Block design (raw) .2 .2 — .1 .1 .1 –.1 .0 –.1 –.1 –.1 –.3 .14 WRAT Reading .3 .5** .2 — .6*** .2 .6*** –.6*** –.4* –.3* –.3* –.5** .25 WRAT Spelling .2 .5** .2 .7*** — .5** .8*** –.8*** –.6*** –.6*** –.4* –.7*** .4*6 TOWRE words .0 .1 .1 .3 .5** — .6*** .5** –.3 -.5** –.6*** -.4* .27 TOWRE nonwords .1 .3 –.0 .6*** .8*** .6*** — –.8*** –.8*** –.6*** –.5** –.7*** .4*8 Nonsense passage (errors) –.2 –.1 .0 –.6*** –.8*** –.5** –.8*** — .6*** .5** .6*** .7*** –.39 Nonsense passage (time) –.2 –.2 –.1 –.5*** –.7*** –.4* –.8*** .6*** — .5** .4* .7*** –.3
10 RAN digits .1 –.2 –.1 –.4* –.7*** –.5** –.7*** .5** .6** — .6*** .7*** –.4*11 RAN objects .1 –.1 –.1 –.4* –.4* –.6 –.5*** .6*** .4* .6*** — .5** –.6***12 Spoonerisms (time) .0 –.1 –.3 –.5** –.6*** –.4* –.7*** .7*** .7*** .7*** .5** — –.5**13 Digit span (raw) .1 .3* .1 .3* .5*** .2 .4** –.4* –.4* –.4** –.6*** –.5** —
*p < .05. **p < .01. ***p < .001.
3 Z scores for each test relative to the sample as a whole were used to formcomposite scores that were the average of these z scores.

Griffiths et al.: Auditory Deficits in Dyslexia 1361
Table 4 summarizes the partial correlation coeffi-cients (controlling for vocabulary) between the literacy,phonology, and auditory measures for the dyslexia group(below the diagonal) and for the control group (abovethe diagonal). These results must be interpreted withcaution due to the small sample size for each group (n =20). For dyslexic readers, weak correlations were ob-served between the phonology variable and thresholdsobtained in the TOD task, but the relation was only sta-tistically significant for the short ISI. The phonologyvariable also correlated moderately with thresholds fromthe ABRM baseline condition (r = –.5, p < .05). For thecontrol group, moderate correlations were observed be-tween the phonology variable and both conditions of theTOD task (20-ms ISI: r = –.5, p < .05; 200-ms ISI: r = –.5,p < .05), but phonology did not correlate with performancein the baseline ABRM condition, r(20) = –.18. The pho-nology variable correlated with thresholds from the ran-dom 1-kHz masker (collapsed across ISI; r = –.6, p < .05)in the control listener group only, but with and in noneof the other masker conditions. Finally, moderate corre-lations between phonology and literacy were observedfor both groups, with the coefficient for the dyslexiagroup (r = .5) being smaller, but not significantly so, thanthat for the control group (r = .7) (zobt = –0.6, ns).
The relations between phonology composite scores(z scores) and estimated log thresholds for TOD andABRM tasks (the latter collapsed across ISI) are shownin Figure 3. These scatterplots reveal that a subgroupof dyslexic individuals falls in the lower right quadrantof these plots, with weak phonological and auditory pro-cessing ability relative to the rest of the individuals inthe sample. If we adopt a criterion of thresholds morethan 1 SD from the mean, then 3 dyslexic individualswere consistently classified as outliers on both TOD andABRM tasks. However, there was also in each case asubgroup of control participants who had relatively high
thresholds but good phonological processing ability rela-tive to the sample as a whole (see the upper right quad-rant of the plots). Using the same outlier criterion, 4control participants were classified as outliers acrossboth tasks.
DiscussionIn this study we set out to evaluate the proposal that
phonological processing impairments in dyslexia can betraced to more basic auditory processing deficits. Theadults with dyslexia who participated in the study showedpoor levels of literacy and phonological processing whencompared to a group of age- and IQ-matched studentswithout dyslexia. Both groups of adult listeners completedtwo tasks examining the rapid auditory processing of se-quential stimuli. The first, the TOD task, addressed dys-lexic listeners’ ability to discriminate the temporal orderof tones differing in pitch at varying rates of presenta-tion. The second, the ABRM task, addressed the dyslexiclisteners’ abilities to discriminate tone frequency underconditions when individual tones were followed by mask-ing tones at short target–masker intervals.
In the TOD task, both groups of listeners found itmore difficult to make temporal order discriminationsof pitch in the 20-ms ISI condition than in the 200-msISI condition. Although mean thresholds for dyslexiclisteners were numerically higher than those for controllisteners in both conditions, thresholds for the two groupsdid not differ significantly. Furthermore, although asubgroup of listeners with elevated thresholds in bothconditions was identified, both dyslexic and control lis-teners were members of this subgroup. The positiontaken by Tallal and colleagues (1997) predicts that indi-viduals with TOD deficits should have the most impairedlevels of phonological processing in the sample. Ourdata are not consistent with this position; specifically,
Table 4. Partial correlations between literacy, phonology, and auditory measures, controlling for vocabu-lary for the dyslexic (below the diagonal) and the control group (above the diagonal).
1 2 3 4 5 6 7 8
1 Literacya — .7** –.4 –.5 –.1 –.4 –.4 –.5*2 Phonologyb .5* — –.5* –.5* –.2 –.3 –.3 –.6*3 TOD 20 –.3 –.5* — .9*** .8*** .8*** .8*** .9***4 TOD 200 –.2 –.4 .9*** — .8*** .8*** .8*** .9***5 DLF 75 –.4 –.5* .7*** .8*** — .9*** .8*** .8***6 ABRM fixedc –.4 –.3 .6** .8*** .8*** — .9*** .7***7 ABRM random 2c –.1 –.2 .7** .8*** .7** .7*** — .8***8 ABRM random 1c –.3 –.3 .5* .7** .5* .6*** .7** —
Note. TOD = temporal order discrimination.aLiteracy composite. bPhonology composite. cThresholds collapsed across ISI.*p < .05. **p < .01. ***p < .001.

1362 Journal of Speech, Language, and Hearing Research • Vol. 46 • 1352–1366 • December 2003
a subgroup of control listeners who showed impairedlevels of performance on the TOD task demonstratednormal levels of phonological processing skill, and therewere other adults with dyslexia in the sample with se-vere phonological impairments whose thresholds on theTOD task fell within the normal range.
An alternative hypothesis, based on the findings ofHeath et al. (1999) and McArthur and Hogben (2001),predicts that the subgroup of dyslexic individuals withelevated thresholds would demonstrate concomitantoral language difficulties. For practical reasons, it wasnot possible to administer similar tests to those usedwith children in this study. However, the individualsclassified as outliers all obtained either average or
above average vocabulary scores, ruling this out as aplausible explanation.
Taken together, our findings with adult listenerscontrast with those of studies reporting significantreader-group differences on TOD tasks in children atboth short and long ISIs (Heath et al., 1999; Marshallet al., 2001; Nittrouer, 1999; Waber et al., 2001). More-over, the results provide no support for the hypothesisthat dyslexic readers have a specific deficit in the TODof rapidly presented tones at short ISIs (Ahissar et al.,2000; Cacace et al., 2000; Heath et al., 1999; Reed, 1989;Tallal, 1980; Tallal & Stark, 1982).
The second experimental task used the ABRM para-digm to assess rapid auditory processing. Specifically,
Figure 3. These scatter plots summarize the relations between phonological skills and auditory processing measures (collapsed across ISI).Upper left panel: phonology composite score (z scores) plotted against log thresholds from the TOD task; upper right panel: phonologycomposite score plotted against DLFs (log thresholds) from the ABRM task; lower left panel: phonology composite score plotted against logthresholds from random 2-kHz masker condition; lower right panel: phonology composite score plotted against log thresholds from random1-kHz masker conditions. Linear fits to the whole sample are shown in each case.

Griffiths et al.: Auditory Deficits in Dyslexia 1363
we used the ABRM paradigm to explore the effects ofmanipulating target–masker intervals on frequencydiscrimination. As in the TOD task, thresholds for alllisteners were significantly influenced by the durationof the ISI, with a significant elevation in overall thresh-olds in the 20-ms ISI condition relative to the 200-msISI condition. However, the nonsignificant interactionbetween group and ISI again failed to support the claimthat dyslexic individuals have a specific rapid auditoryprocessing deficit. The similarity in magnitude of esti-mates of DLFs for dyslexic and control listeners in thebaseline condition is consistent with our previous resultsshowing no group differences in frequency discrimina-tion performance for longer duration tones and a differ-ent sample of dyslexic and control listeners (Hill et al.,1999).4 As noted above, these results are inconsistent withother reports of frequency discrimination deficits insamples of adults with dyslexia (Baldeweg et al., 1999;Hari et al., 1999; McAnally & Stein, 1996). It is possiblethat procedural differences between studies may havecontributed to the difference in outcome. For example,we used four-interval trials in our experiments, whereasMcAnally and Stein and Hari et al. used three-intervaland two-interval trials, respectively (cf. France et al.,2002). We also used a minimal-uncertainty procedure inwhich the standard frequency was constant throughoutthe experiments, whereas in McAnally and Stein’s proce-dure (but not in that of Hari et al., 1999) there was atrial-by-trial rove in the standard frequency. Whether andwhy these and other procedural differences might havedifferent consequences for dyslexic and control listenerswill require further experimentation, but the differencesin outcome suggest a role for nonsensory factors in ac-counting for group differences in this type of experiment.
As expected, frequency discrimination performancewas affected by the addition of a masker for both groupsof listeners, with an elevation in thresholds in the fixed-masker condition relative to those in the baselinenonmasker condition. There was an overall effect ofmasker type, with both masker variability (fixed vs. ran-dom) and spectral proximity of target and masker (dif-ferent or same target–masker frequencies) affectingperformance on this task for both the dyslexic and con-trol listener groups. Threshold elevation relative to thebaseline condition was smallest in the fixed-masker con-dition, consistent with a potential role for the maskeras an additional cue to the target interval. However, theslightly greater threshold elevation in the short ISI con-dition suggests that the fixed masker may also haveexerted a small masking effect working against the ben-efits afforded by a fixed-frequency referent. Thresholdelevation was greater for random-frequency maskers
than for fixed maskers, consistent with the lack of afixed-frequency referent in the random-masker condi-tions. Thresholds also were greater for the 1-kHz ran-dom-masker condition than for the 2-kHz random-masker condition, as predicted by Sparks (1976; but notby Bland & Perrot, 1978).
A significant interaction between masker type andgroup was observed for the 2-kHz random-frequencymasker condition at 200-ms ISI, but the effect was notsignificant for the 20-ms ISI condition. These resultssuggest that, relative to control listeners, the frequencydiscrimination performance of the dyslexic participantswas more adversely affected by the addition of a ran-dom-frequency masker. This pattern of performance wasonly observed reliably for mean thresholds when thetarget and masker were in different frequency regions,and was not specific to the short ISI condition. One pos-sible interpretation of this finding is that the dyslexiclisteners were less able to exploit the relative unmask-ing afforded when target and masker occupied differentfrequency regions. Consistent with this interpretation,post hoc tests revealed that the difference in thresholdsbetween the two random-masker conditions was signifi-cant for the control group, but not for the dyslexia group.Moreover, the thresholds for the two groups did not dif-fer in the 1-kHz random-masker condition when targetand masker were in the same frequency region. We notethat this result contrasts with Rosen and Manganari’s(2001) finding that backward-masked detection thresh-olds for dyslexic listeners were significantly higher thanthose of controls only when the masker spectrally over-lapped the signal. The greater similarity of mean thresh-olds in the 1-kHz and 2-kHz random-masker conditionsfor dyslexic listeners than for control listeners providesno support for the proposal that dyslexic listeners havean increased tendency to segregate tones of differentfrequency (Helenius et al., 1999). If this had been thecase, then the difference between the 1-kHz and 2-kHzrandom-masker conditions should have been larger fordyslexic listeners than for control listeners.
Nonetheless, the absence of any reliable differencesbetween dyslexic and control listeners in an analysisusing the lowest of the four threshold estimates in eachcondition suggests that the single group differenceshould be interpreted cautiously. Inspection of the vari-ance in thresholds across the four runs for individualsin both groups did not reveal the variability indexedlearning or improvement in performance across runs(i.e., some individuals produced their “best” thresholdson the first run, others on the second or third).
When the distributions of frequency discriminationthresholds were examined, no statistical outliers wereidentified in the dyslexia group. This contrasts withthe results reported by Hill et al. (1999), who noted a
4 Note that Hill et al. (1999) used 400-ms tones. Experiment 2 of thepresent study used 75-ms tones.

1364 Journal of Speech, Language, and Hearing Research • Vol. 46 • 1352–1366 • December 2003
small subgroup of dyslexic listeners showing elevatedfrequency discrimination thresholds for relatively low-frequency (1 kHz) and high-frequency (6 kHz) tones. Inthe present experiment, 1 outlier was identified in thecontrol group. This individual was also an outlier in theTOD task, suggesting that his poor performance couldhave been due to poor frequency discrimination. A smallnumber of listeners from both groups were classified asoutliers in the masker conditions of the ABRM task. Theindividuals observed with impairments in the TOD taskalso were classified as outliers in the masker conditionsof the ABRM task. In addition, a few listeners who hadnot experienced any difficulties on the TOD task haddifficulties in the ABRM task. It is clear, therefore, thatsome individuals (both dyslexic and normal readers)experienced difficulty with these auditory tasks, but itis not clear that their difficulties indicate a genuineimpairment in auditory processing. An alternative pos-sibility is that, for reasons that might include limita-tions of memory or attention, some individuals may sim-ply be poor at doing psychoacoustical tasks.
Relation Between Auditory andPhonological Processing Skills
The findings reported above indicate that, as a group,the dyslexic listeners did not differ significantly from con-trol listeners on two measures of rapid auditory process-ing. However, our data appear consistent with Tallal’s(1980) prediction that dyslexic individuals with the mostsevere phonological processing deficits are impaired onmeasures of rapid auditory processing. Moderate corre-lations were observed between the phonology and audi-tory measures using the data from the full sample, andcorrelational analyses performed using the separate datasets for the dyslexic and control groups provided someevidence for a weak association between phonologicalprocessing skill and performance on the TOD task us-ing a short ISI. There was also an association betweenperformance on the simple frequency discrimination task(ABRM-baseline) and phonological processing skill. Incontrast, no evidence was found for an association be-tween an individual’s phonological processing skill andhis or her ability to discriminate tone frequency whentarget tones were followed by masking tones.
Within the dyslexia group, those individuals whoseperformance levels were observed to fall consistentlyoutside the normal range across the majority of the au-ditory tasks were also among those with the most se-vere phonological deficits, indexed by the phonology com-posite score. However, contrary to the hypothesizedassociation, there were also participants with dyslexiawho had weak phonological processing skills but rela-tively good levels of auditory processing abilities. In a
similar vein, a subgroup of individuals from the con-trol sample who were unimpaired in their literacy orphonological processing skills performed poorly on theauditory tasks. Such findings add to the accumulatingevidence that auditory deficits are neither necessarynor sufficient to cause phonological difficulties (Bishopet al., 1999; Rosen & Manganari, 2001). Furthermore,the observed associations between auditory processingand phonological processing skills do not speak to thedirection of causality or to possible mediating factors.For example, common to both the auditory and phono-logical processing tasks is the need to allocate auditoryattention.
Recent reviews have considered methodological fac-tors that may explain the contradictory findings in theliterature of studies examining auditory processing defi-cits in dyslexia (Bailey & Snowling, 2002; Hirsh &Watson, 1996; McArthur & Bishop, 2001). The focus inthe present study on high-achieving adults with dys-lexia may have been a factor in our ability to find groupdifferences in auditory processing. An aim of this studywas to reduce the likelihood of including individuals withcomorbid deficits such as SLI or ADHD, avoiding theintroduction of an undesirable confound into the study(Ramus et al., 2003). However, we acknowledge the needfor caution when generalizing these results to the widerdyslexia population.
In summary, we found no strong evidence in thepresent study to indicate that adults with dyslexia aresubject to a rapid auditory processing deficit. Neitherwas there evidence for problems with the extraction offrequency information from sequences of nonverbal au-ditory tones separated by short ISIs. Moreover, the ob-servation that a subgroup of participants, includingboth normal and dyslexic readers, had weak auditoryprocessing skills weakens the argument for a causalrelationship between auditory processing deficits andliteracy impairments. Two possibilities remain open.First, auditory deficits may act as moderating variables(Holmbeck, 1977) and only have an impact on literacydevelopment (when associated with a primary risk fac-tor, such as genetic risk; Bishop et al., 1999). Second,auditory processing impairments may affect the cre-ation of phonological representations early on in de-velopment (perhaps during the preschool years whenthey become segmentally organized). As developmentproceeds, auditory deficits may resolve sufficiently tobe no longer detectable.
AcknowledgmentsThe work reported in this article was funded by
Wellcome Trust Project Grant No. 55671. We thank thereaders with dyslexia and the normal readers who tookpart.

Griffiths et al.: Auditory Deficits in Dyslexia 1365
ReferencesAhissar, M., Protopapas, A., Reid, M., & Merzenich, M.
(2000). Auditory processing parallels reading abilities inadults. Proceedings of the National Academy of SciencesUSA, 97, 6832–6837.
Au, A., & Lovegrove, B. (2001). The role of visual andauditory temporal processing in reading irregular andnonsense words. Perception, 30, 1127–1142.
Bailey, P. J., & Snowling, M. J. (2002). Auditory process-ing and the development of language and literacy. BritishMedical Bulletin, 63, 135–146.
Baldeweg, T., Richardson, A., & Gruzelier, J. (1999).Impaired auditory frequency discrimination in dyslexiadetected with mismatch evoked potentials. Annals ofNeurology, 45, 495–503.
Bishop, D. V. M., Carlyon, R. P., Deeks, J. M., & Bishop,S. J. (1999). Auditory temporal processing impairment:Neither necessary nor sufficient for causing languageimpairment in children. Journal of Speech, Language, andHearing Research, 42, 1295–1310.
Bland, D. E., & Perrot, D. R. (1978). Backward masking:Detection versus recognition. Journal of the AcousticalSociety of America, 63, 1215–1217.
Cacace, A. T., McFarland, D. J., Ouimet, J. R., Schrieber,E. J., & Marro, P. (2000). Temporal processing deficits inremediation-resistant reading-impaired children. Audiol-ogy and Neuro-Otology, 5(2), 83–97.
Castles, A., & Coltheart, M. (1993). Varieties of develop-mental dyslexia. Cognition, 47, 149–180.
France, S. J., Rosner, B. S., Hansen, P. C., Calvin, C.,Talcott, J. B., Richardson, A. J., & Stein, J. F. (2002).Auditory frequency discrimination in adult developmentaldyslexics. Perception & Psychophysics, 64, 169–179.
Frederickson, N., Frith, U., & Reason, R. (1997).Phonological Assessment Battery. Windsor, Berkshire,U.K.: NFER-Nelson.
Griffiths, Y. M., & Snowling, M. J. (2002). Predictors ofexception word and nonword reading in dyslexic children:The severity hypothesis. Journal of Educational Psychol-ogy, 94, 34–43.
Gross-Glenn, K., Jallad, B., Novoa, L., Helgren-Lempesis, V., & Lubs, H. A. (1990). Nonsense passagereading as a diagnostic aid in the study of adult familialdyslexia. Reading and Writing: An InterdisciplinaryJournal, 2, 161–173.
Hari, R., Saaskilahti, A., Helenius, P., & Uutela, K.(1999). Non-impaired auditory phase locking in dyslexicadults. Neuroreport, 10, 2347–2348.
Hatcher, J., Snowling, M. J., & Griffiths, Y. M. (2002).Cognitive assessment of dyslexic students in highereducation. British Journal of Educational Psychology, 72,119–133.
Heath, S. M., Hogben, J. H., & Clark, C. D. (1999).Auditory temporal processing in disabled readers with andwithout oral language delay. Journal of Child Psychologyand Psychiatry, 40, 637–647.
Helenius, P., Uutela, K., & Hari, R. (1999). Auditorystream segregation in dyslexic adults. Brain, 122,907–913.
Hill, N. I., Bailey, P. J., Griffiths, Y. M., & Snowling, M.J. (1999). Frequency acuity and binaural masking releasein dyslexic listeners. Journal of the Acoustical Society ofAmerica, 106, L53–L58.
Hirsh, I. J., & Watson, C. S. (1996). Auditory psycho-physics and perception. Annual Review of Psychology, 47,461–484.
Holmbeck, G. N. (1977). Toward terminological, conceptualand statistical clarity in the study of mediators andmoderators: Examples from the child-clinical and paediat-ric psychology literatures. Journal of Consulting andClinical Psychology, 65, 599–610.
Jastak, J., & Wilkinson, G. J. (1993). Wide Range Achieve-ment Test–Third Edition. Wilmington, DE: Jastak.
Kallman, H. J., & Massaro, D. W. (1979). Similarity effectsin backward recognition masking. Journal of Experimen-tal Psychology: Human Perception and Performance, 5,110–128.
Levitt, H. (1971). Transformed up-down methods inpsychoacoustics. Journal of Acoustical Society of America,49, 167–177.
Marshall, C. M., Snowling, M. J., & Bailey, P. J. (2001).Rapid auditory processing and phonological ability innormal readers and readers with dyslexia. Journal ofSpeech, Language, and Hearing Research, 44, 925–940.
Massaro, D. W. (1970). Perceptual processes and forgettingin memory tasks. Psychological Review, 79, 124–145.
Massaro, D. W. (1972). Perceptual images, processing timeand perceptual units in auditory perception. PsychologicalReview, 79, 124–145.
Massaro, D. W., & Burke, D. (1991). Perceptual develop-ment and auditory backward recognition masking.Developmental Psychology, 27, 85–96.
McAnally, K. I., Castles, A., & Stuart, G. W. (2000). Visualand auditory processing impairments in subtypes ofdevelopmental dyslexia: A discussion. Journal of Develop-mental and Physical Disabilities, 12(2), 145–156.
McAnally, K. I., & Stein, J. F. (1996). Auditory temporalcoding in dyslexia. Proceedings of the Royal Society ofLondon, Series B, 263, 961–965.
McArthur, G. M., & Bishop, D. V. M. (2001). Auditoryperceptual processing in people with reading and orallanguage impairments: Current issues and recommenda-tions. Dyslexia, 7, 150–170.
McArthur, G. M., & Hogben, J. H. (2001). Auditorybackward recognition masking in children with a specificlanguage impairment and children with a specific readingdisability. Journal of the Acoustical Society of America,109, 1092–1100.
McArthur, G. M., Hogben, J. H., Edwards, V. T., Heath,S. M., & Mengler, E. D. (2001). On the “specifics” ofspecific reading disability and specific language impair-ment. Journal of Child Psychology and Psychiatry, 41,869–874.
Nittrouer, S. (1999). Do temporal processing deficits causephonological processing problems? Journal of Speech,Language, and Hearing Research, 42, 925–942.
Ramus, F., Rosen, S., Dakin, S. C., Day, B. L.,Castellote, J. M., White, S., & Frith, U. (2003). Theories

1366 Journal of Speech, Language, and Hearing Research • Vol. 46 • 1352–1366 • December 2003
of developmental dyslexia: Insights from a multiple casestudy of dyslexic adults. Brain, 126, 1–25.
Reed, C. (1989). Speech perception and the discriminationof brief auditory cues in reading disabled children.Journal of Experimental Child Psychology, 48, 270–292.
Rosen, S., & Manganari, E. (2001). Is there a relationshipbetween speech and nonspeech auditory processing inchildren with dyslexia? Journal of Speech, Language, andHearing Research, 44, 720–736.
Schulte-Korne, G., Deimel, W., Bartling, J., &Remschmidt, H. (1998). Auditory processing anddyslexia: Evidence for a specific speech processing deficit.Neuroreport, 9, 337–340.
Sparks, D. W. (1976). Temporal recognition masking—orinterference? Journal of the Acoustical Society of America,60, 1347–1353.
Studdert-Kennedy, M., & Mody, M. (1995). Auditorytemporal perception deficits in the reading-impaired: Acritical review of the evidence. Psychonomic Bulletin &Review, 2, 508–514.
Talcott, J. B., Witton, C., McClean, M., Hansen, P. C.,Rees, A., Green, G. G. R., & Stein, J. F. (1999). Cansensitivity to auditory frequency modulation predictchildren’s phonological and reading skills? NeuroReport,10, 2045–2050.
Tallal, P. (1980). Auditory temporal perception, phonics, andreading disabilities in children. Brain and Language, 9,182–198.
Tallal, P., Allard, L., Miller, S., & Curtiss, S. (1997).Academic outcomes of language impaired children. In C.Hulme & M. Snowling (Eds.), Dyslexia: Biology, cognition& intervention (pp. 167–181). London: Whurr.
Tallal, P., & Piercy, M. (1973a). Deficits of nonverbalauditory processing in children with developmentalaphasia. Nature, 241, 468–489.
Tallal, P., & Piercy, M. (1973b). Developmental aphasia:Impaired rate of non-verbal processing as a function ofsensory modality. Neuropsychologia, 11, 389–398.
Tallal, P., & Stark, R. E. (1982). Perceptual/motor profilesof reading impaired children with or without concomitantoral language deficits. Annals of Dyslexia, 32, 163–176.
Torgeson, J. K., Wagner, R., & Rashotte, C. (1999). Testof Word Reading Efficiency. Circle Pines, MN: AmericanGuidance Service.
Waber, D. P., Weiler, M. D., Wolff, P. H., Bellinger, D.,Marcus, D. J., Ariel, R., et al. (2001). Processing of rapidauditory stimuli in school-age children referred forevaluation of learning disorders. Child Development,72(1), 37–49.
Wechsler, D. (1994). Wechsler Adult Intelligence Scale–Revised. San Antonio, TX: The Psychological Corporation.
Witton, C., Talcott, J. B., Hansen, P. C., Richardson, A.J., Griffiths, T. D., Rees, A., et al. (1998). Sensitivity todynamic auditory and visual stimuli predicts nonwordreading ability in both dyslexic and normal readers.Current Biology, 8, 791–797.
Received July 23, 2002
Accepted April 16, 2003
DOI: 10.1044/1092-4388(2003/105)
Contact author: Yvonne M. Griffiths, PhD, Department ofPsychology, University of Essex, Colchester CO4 3SQ,United Kingdom. E-mail: [email protected]


![Index [link.springer.com]978-0-387-22585-2/1.pdf · 428 Index Auditory discrimination, training after implant, 87-88 Auditory experience, impact on cochlea implant, 252ff role in](https://static.fdocuments.us/doc/165x107/5e0433c054b88278be66016d/index-link-978-0-387-22585-21pdf-428-index-auditory-discrimination-training.jpg)