Attachment G Design Analysis: Processing Facilities · Phase 1 Intermediate Design Report Hudson...
156
Phase 1 Intermediate Design Report Hudson River PCBs Superfund Site Attachment G – Design Analysis: Processing Facilities General Electric Company Albany, New York August 22, 2005
Transcript of Attachment G Design Analysis: Processing Facilities · Phase 1 Intermediate Design Report Hudson...

Phase 1 Intermediate Design Report Hudson River PCBs Superfund Site
Attachment G – Design Analysis:
Processing Facilities
General Electric CompanyAlbany, New York
August 22, 2005

BLASLAND, BOUCK & LEE, INC. engineers, scientists, economists G-1
Attachment G – Design Analysis: Processing Facilities
1. General
This attachment and the associated tables and calculations (Exhibits G-1.1 through G-8.1) present the rationale
for the selection and sizing of the various pieces of equipment and individual facilities that will collectively
comprise the sediment and water processing facilities at the Energy Park site. It presents the basis and results of
calculations used in the design, and incorporates the results of treatability studies, where appropriate.
The overall process flow diagram for the processing facility is presented in Sections 3.6.4.1 and 3.6.4.2 and
shown on Contract Drawings P-2002 and P-2003. This attachment presents the assumptions and calculations
used to size those components in the general order they are discussed in Section 3.6, but the reader is referred to
that section for a complete narrative of how the components interact with each other.
The Phase 1 Intermediate Design and treatability studies were both developed using examples of four dredged
sediment types, illustrating a range of conditions encountered horizontally and vertically in the river. Particle
size distributions were determined for samples or sample segments during the Year 1 and Year 2 SSAP
programs. The sample results were sorted by percent fines (% passing 0.074 millimeter [mm]) and the data set
was separated into four equal quadrants. The analyses within each quadrant were averaged and reported as
sediment types S1, S2, S3, and S4 (see Exhibit G-1.1). The particle size distributions for the Year 1 and Year 2
SSAP data are combined and presented in Exhibit G-1.1, while separate particle size distributions for the Year 1
and Year 2 data sets are displayed in Exhibit G-1.2.
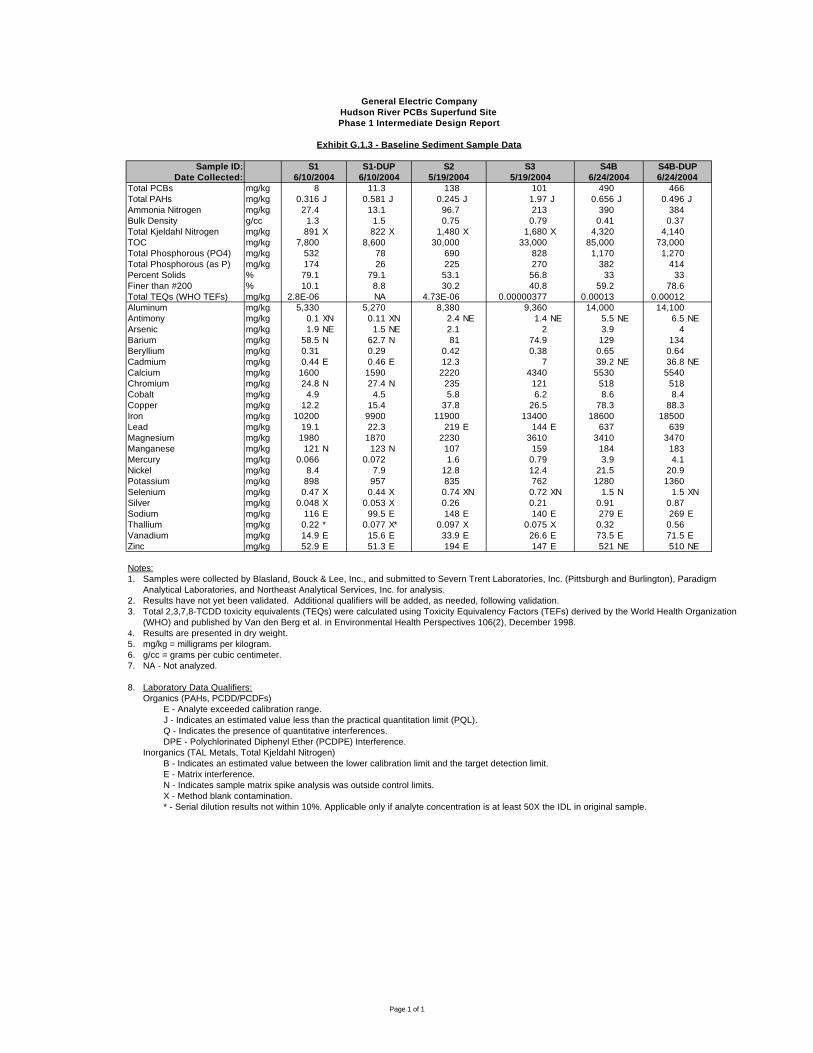
During the treatability studies (see Treatability Study Appendix), samples of Hudson River sediments were
collected from areas where PSDs and PCB concentrations were representative of sediment types S1, S2, S3, and
S4. Summary analyses of these baseline sediment samples are shown in Exhibits G-1.3 and G-1.4.
The four different sediment types represent the range of properties that the processing facilities must be capable
of handling. It is not expected that equal quantities of each sediment type will be dredged. Estimated quantities
of each sediment type that will need to be processed will be developed during Phase 1 Final Design.

BLASLAND, BOUCK & LEE, INC. engineers, scientists, economists G-2
2. Size Separation
Mechanical Unloader (Clam Shell)
Barge unloader configurations are presented in Attachment F (Design Analysis: Unloading and Waterfront
Facilities), along with unloading calculations and discussion of unloader sizes.
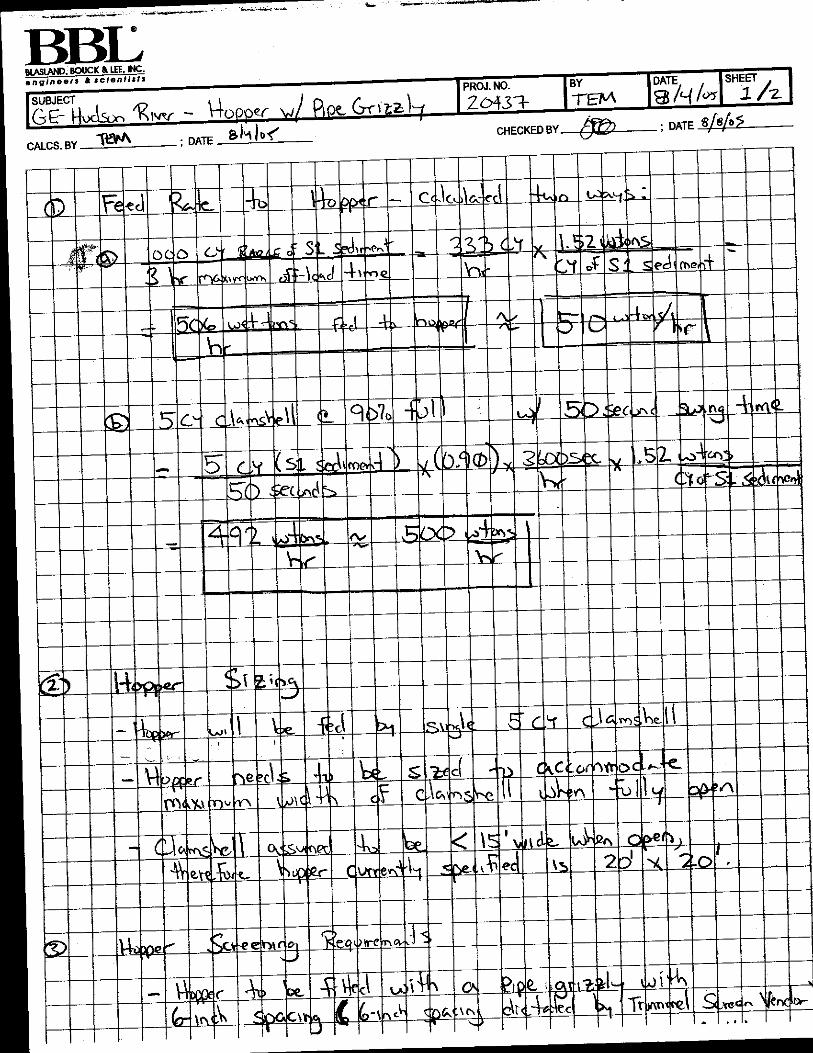
Hopper with Pipe Grizzly
Details pertaining to selection of bar screen (pipe grizzly), belt feeder, and inclined conveyor are presented in
Exhibit G-2.1.
Trommel Screen
Loading calculations, trommel component sizing, and selection of a fixed stack conveyor are presented in
Exhibit G-2.1. A screen opening size of 3/8 inch is the smallest size recommended by equipment suppliers.
Sediment Slurry Tank
The sediment slurry tank will be used to adjust the solids content of the trommel screenings to within the range
of 20 to 30% (w/w) solids. This will form the feed to the hydrocyclones, as discussed below. Recycle water
will be applied to both the trommel spray bars and the sediment slurry tank. The portion of recycle water added
to the slurry tank will be added in response to a mass analyzer signal from within the slurry tank. The trommel
sprays will add half or more of the required dilution water, so the recycle water added to the slurry tank will be a
final trim. The slurry tank hydraulic residence time of 5 to 8 minutes is a compromise between the need for
tankage large enough to equalize large short-term fluctuations in concentrations and a desire to minimize
settling of coarse material within the slurry tank. A residence time of 5 to 8 minutes will represent a mixture of
the contents of four to six clamshell swings.
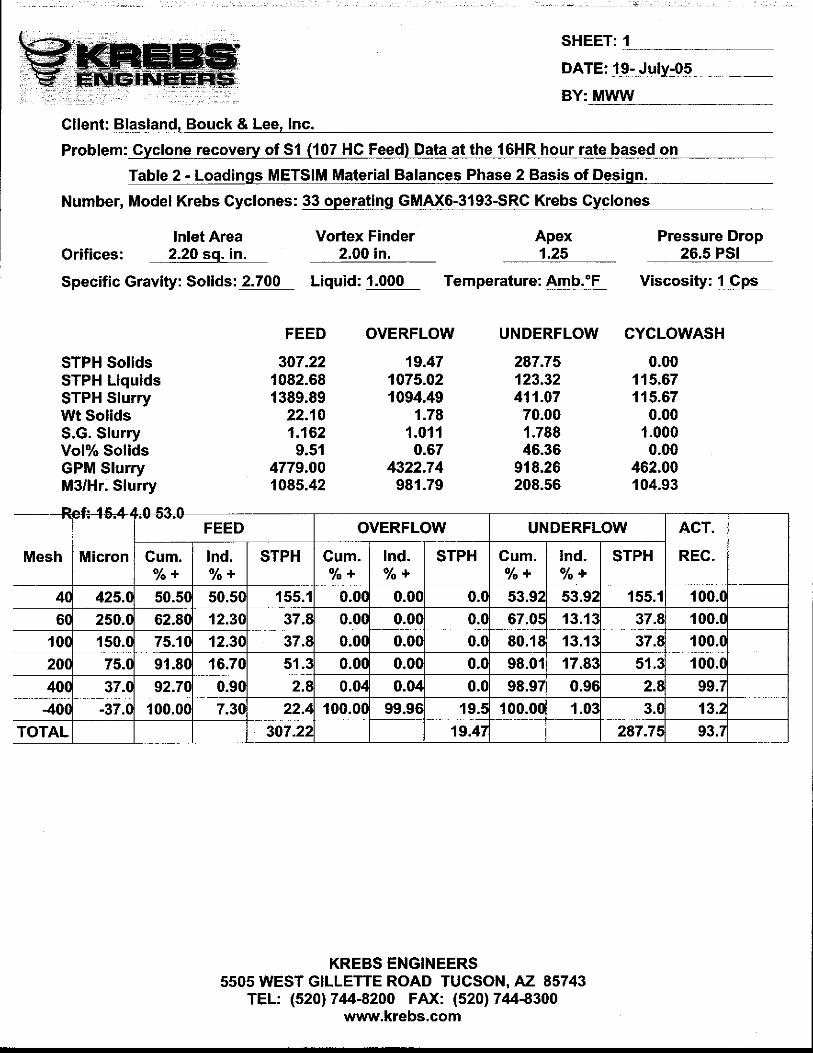
Hydrocyclone System
The hydrocyclone system is sized to treat a continuous flow of sediment slurry. Type S1 sediments will create
the highest solids loadings to the system, as shown in Table 3-35 (Material Balances). Sizing calculations were
prepared by Krebs Engineers (Tucson, AZ), and are included in Exhibit G-2.1.
Treatability testing was performed to evaluate size separation technologies and the chemical properties of the
separated solid fractions. Samples of four sediment types were wet screened in sufficient quantity to analyze the
screened fractions for a number of parameters, including PCB, TOC, solids, pH, and specific gravity. Results

BLASLAND, BOUCK & LEE, INC. engineers, scientists, economists G-3
are presented in Exhibit G-2.2. Other properties of the separated size fractions are presented on pages 227 to
238 of the appended Treatability Studies Report. These results show how solids and PCBs separate differently
by particle size for different sediment types. The amount of PCB in coarse fractions was likely associated with
the woody material observed in these samples.
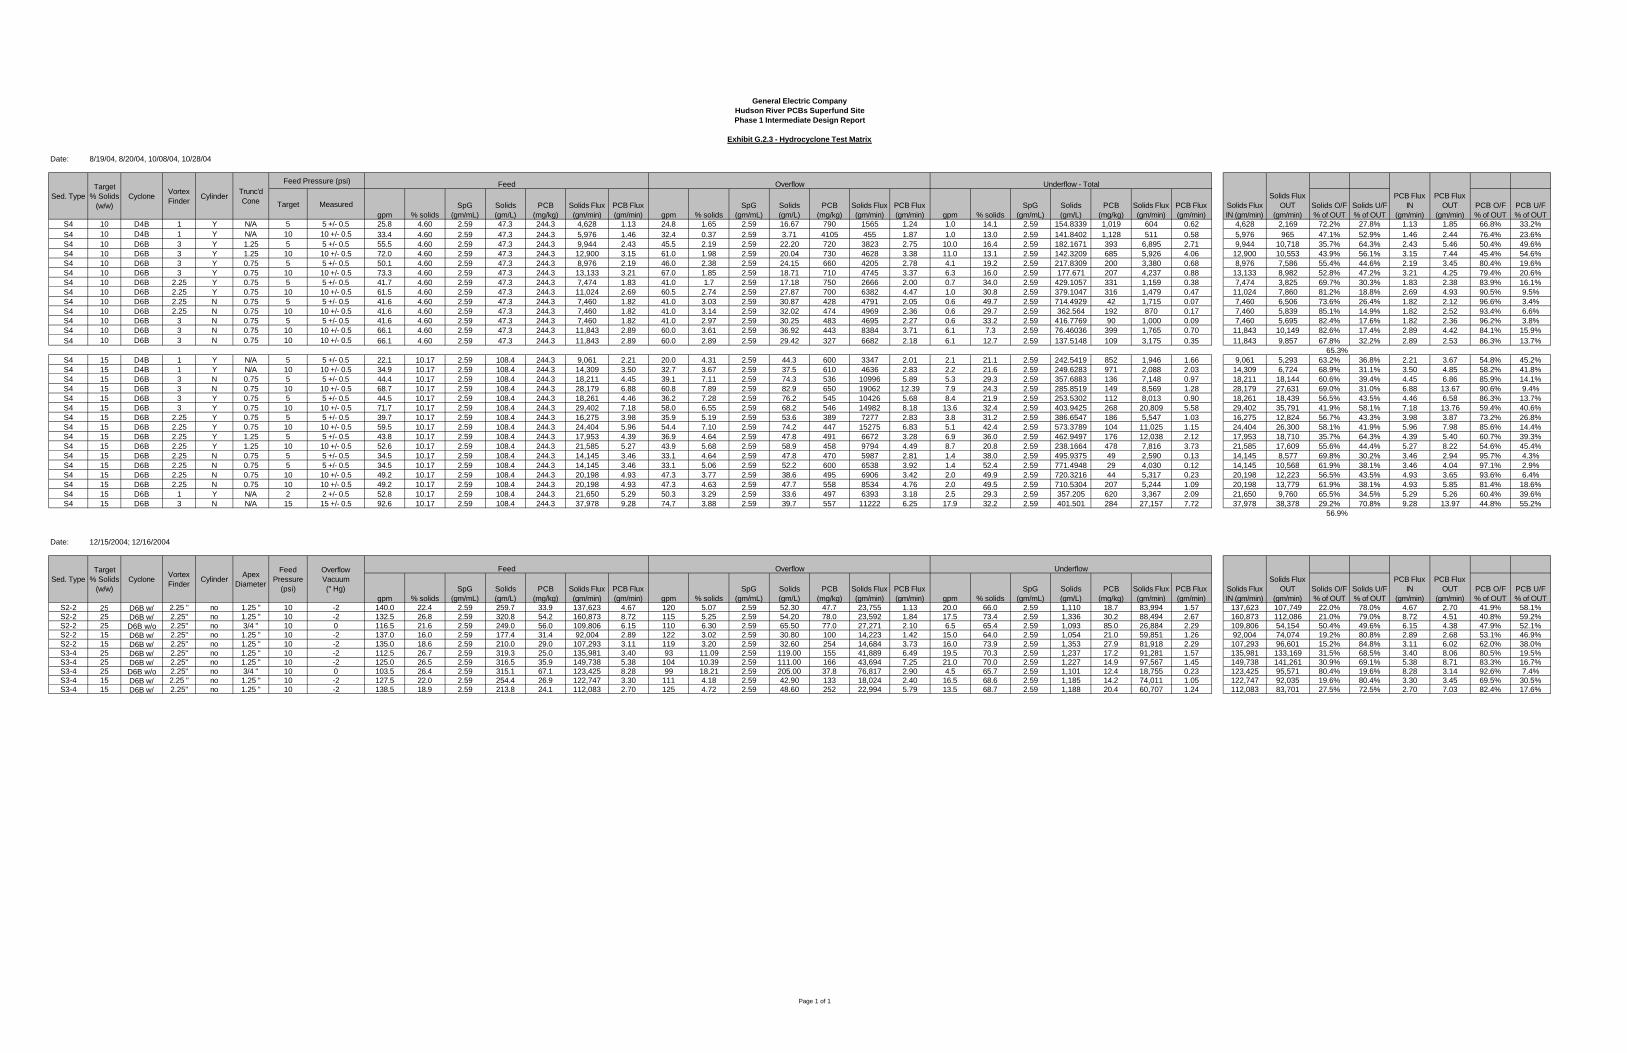
Two hydrocyclone treatability testing campaigns were performed in August 2004 and December 2004. The
August 2004 tests applied sediment S4 (28% fines) at feed concentrations of 10 and 15% (w/w), while the
December 2004 tests applied sediments S2-2 (17% fines) and S3-4 (36% fines) at feed concentrations of 15 and
25% (w/w), respectively. Hydrocyclone testing in the December 2004 tests used a cyclostack and higher solid
feed concentration. In general, these runs achieved better performance than observed in the August 2004
hydrocyclone testing. Hydrocyclone testing results and material balances are shown in Exhibit G-2.3.
Based on the results of these tests and advice from Joseph Keene of KD Engineering (Tucson, AZ) and Krebs
Engineers, a hydrocyclone feed solids content in the neighborhood of 25% (w/w) was established as a target,
with a range of 20 to 30% considered acceptable.
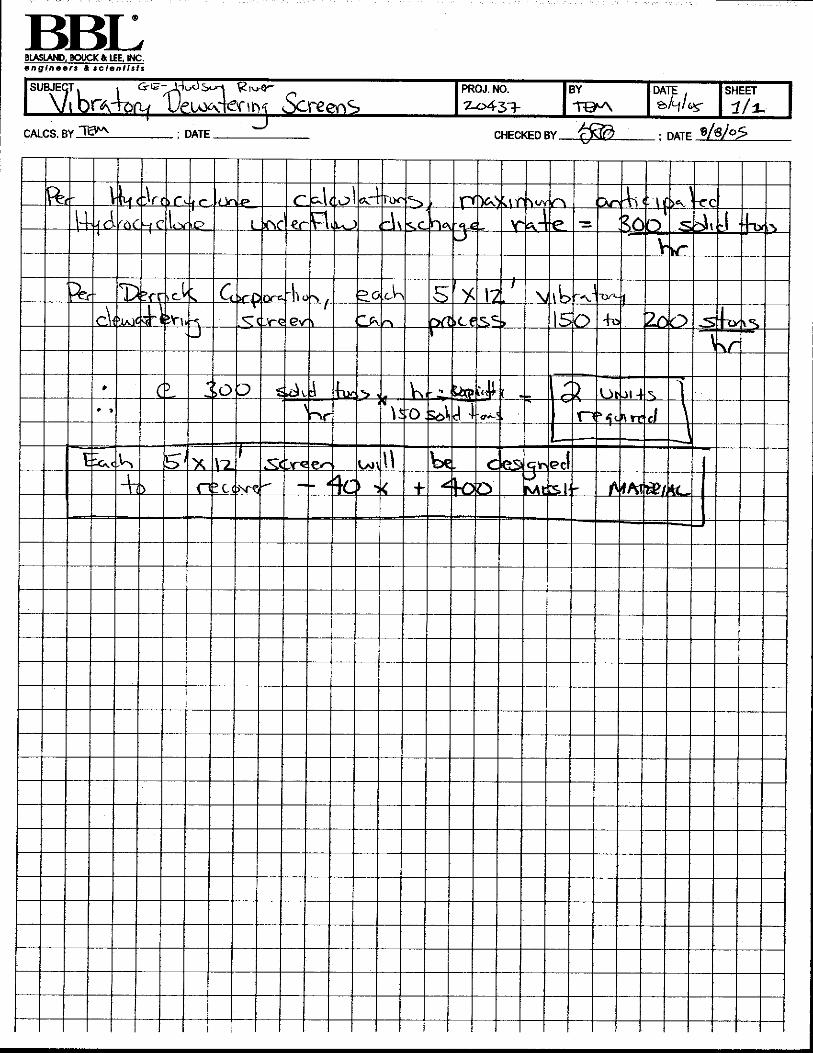
Vibratory Dewatering Screens
For purposes of Phase 1 Intermediate Design, 120 square feet (ft2) of vibratory dewatering screens (to recover -
40 mesh x +400 mesh) was recommended by Derrick Corporation for dewatering the estimated 300 tons of
solids per day of hydrocyclone underflow resulting from the treatment of sediments generated from dredging
4,300 cy/day of type S1 material.
Treatability studies evaluated the drainage characteristics of the coarse fraction. Coarse settled solids (79%
solids) from S1 sediment gravity drained to 86% after 24 hours, while coarse solids (71% solids) from S2
sediment drained to 73% after 24 hours. Coarse solids (42% solids) from hydrocyclone underflow testing of
sediment S4 drained to 77% solids after 24 hours. Drainage results are summarized in Exhibit G-2.5. Some of
the water loss was likely due to evaporation. While this testing showed that separated coarse solids will release
additional water, the test was not representative of dryness that may be attained by vibratory dewatering screens.
For purposes of completing the Intermediate Design, it was assumed that hydrocyclone underflow will dewater
on a vibratory screen to a solids content of 85% by weight. This will be refined after further consultation with
the equipment vendors.

BLASLAND, BOUCK & LEE, INC. engineers, scientists, economists G-4
Process Water Storage Tanks
The size separation process water storage tank will receive and store recycle water from solids processing for
use in trommel screen washing and addition to the sediment slurry tank. This tank, located at the waterfront,
will provide 1-hour residence time when type S1 sediment is processed, as presented in Exhibit G-2.1.
The treated water storage tank, also located at the waterfront, will provide treated water (from process filtration
and GAC treatment) for use as decontamination wash water, as presented in Exhibit G-2.1.
3. Thickening and Dewatering
Hydrocyclone overflow will be directed to the hydrocyclone wet well, where it will be pumped to the solids
thickening and dewatering system. The slurry pumps and piping from the hydrocyclone wet well are sized in
Exhibit G-3.1.
Dredge Slurry Holding Tanks
The dredge slurry holding tanks serve as flow equalization prior to thickening of the hydrocyclone underflow.
As developed in Exhibit G-3.1, two tanks with a storage volume of 700,000 gallons each will provide a storage
capacity for 8 hours of hydrocyclone underflow generated by processing type S1 sediment. Eight hours of
storage would also provide a buffer period of offloaded storage in the event a portion of the thickening or
dewatering facilities was under repair or maintenance. More importantly, these tanks are required to cope with
water imbalances that will likely occur when changes in sediment types are delivered for processing, and
especially when processing needs change as a result of intermixing inventory barge loads followed by residuals
barge loads (or vice versa).
Mixing energy studies were performed to determine the mixing energy needed to keep slurries in suspension.
Results of mixer studies in 5-gallon and 55-gallon containers are presented on pages 331 to 337 of the
Treatability Studies Appendix. The range of velocity gradients (G) from 200 to 800 sec-1 all kept solids in
suspension for gravity-decanted fines from slurry types S1 to S4B. Vendors have recommended five 75-hp
mixers for each 700,000-gallon tank. These mixers can provide a velocity gradient of 205 sec-1 when the tank is
at full capacity.
The sizing of dredge slurry holding tank transfer pumps is included in Exhibit G-3.1.

BLASLAND, BOUCK & LEE, INC. engineers, scientists, economists G-5
Thickener Conditioning Tanks
Chemical screening tests were performed on 100 milliliter (mL) samples to evaluate the effects of polymer
treatment on thickening fine solids (<#200 sieve) from sediment S2-2-07. Coagulant polymer (GE Betz
Developmental E) doses of 9.7 pounds per dry ton (lbs/dry T solids) achieved the fastest settling rates. See
Exhibit G-3.2a.
Additional settling tests with polymer screening were performed using 2 liter (L) samples of hydrocyclone
overflows from treatment of sediment type S2-2. The screening used combinations of cationic polymer
coagulants with cationic and anionic polymer flocculants. The results, shown in Exhibit G-3.2b, led to the
tentative selection of cationic coagulant GE Betz Developmental E at a dose of 6 lb/dry T combined with
anionic flocculant GE Betz AE1115 at a dose of 3 lb/dry T.
Polymer preparation and addition systems will be developed to permit chemical-enhanced thickening, as
described above, for cationic and anionic polymer treatment. These details will be developed during Phase 1
Final Design, or in accordance with performance specifications.
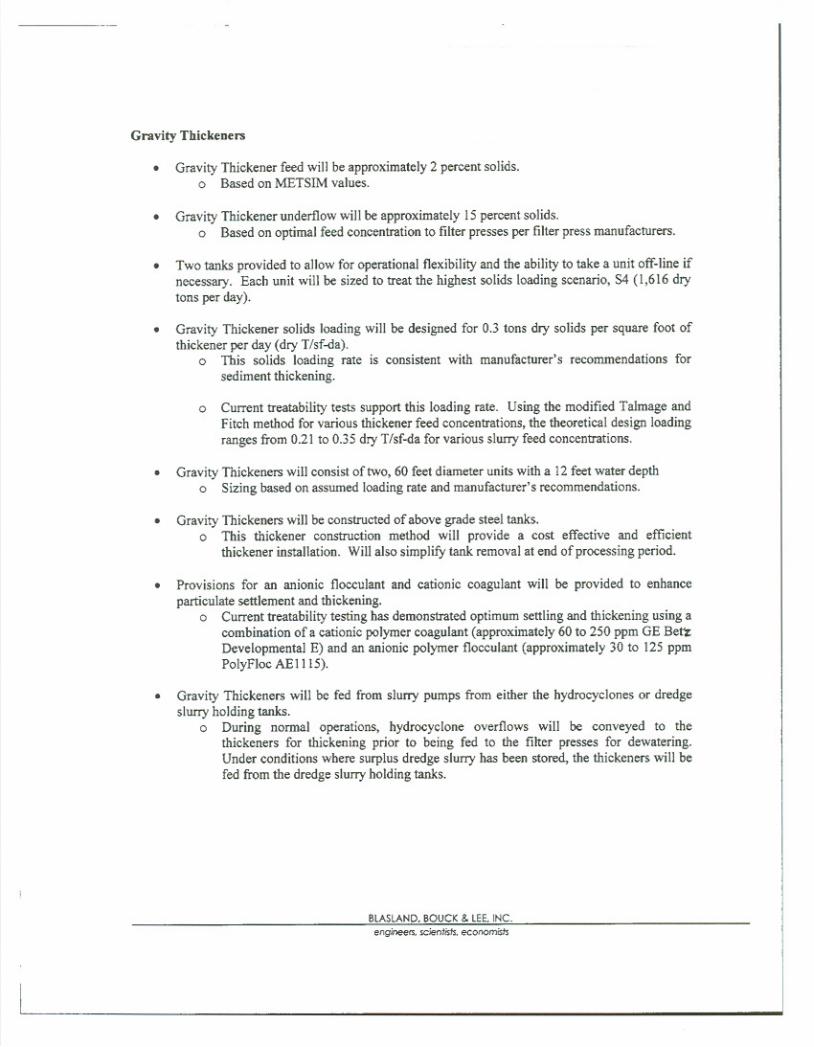
Gravity Thickener System
Gravity thickener sizing calculations are presented in Exhibit G-3.1, using results of the 2-L cationic and anionic
polymer treatments with hydrocyclone overflow from treating S2-2-07 <#200 samples. These calculations
indicate the need for two 60-foot diameter thickeners. A water depth of 12 feet is recommended by vendors.
Dewatering Conditioning Tanks
Dewatering polymer screening and confirmation tests were performed to select polymers for use in filter press
testing. Screening test results are shown in Exhibits G-3.4 and G-3.5. These results indicated that various
cationic coagulant products performed similarly within dosage ranges of 2 to 13 lbs/dry T for gravity-desanded
slurries. Optimum cake solids ranged between 60 to 70% at 4 to 9 lbs/dry T polymer doses, with no strong trend
from S1 to S4.
Comparison of thickened vs. unthickened filter press feeds and feed solids of 3 to 25% suggests some
improvement of cake solids concentrations with increasing feed solids concentrations. Polymer coagulant doses
of 6 to 10 lbs/dry T solids were required for thickening.

BLASLAND, BOUCK & LEE, INC. engineers, scientists, economists G-6
A mixing sub-study was performed to evaluate mixing needs and floc sensitivity to mixing or shear (see page
451 of the appended Treatability Studies Report. The results indicated that 3 minutes of over-mixing at 100
revolutions per minute (rpm) resulted in a loss of 10 to 12 % cake solids. This is typical of performance losses
that might be expected from excessive floc shear.
The polymer conditioning facilities at the processing facility should be designed with variable mixing speed
capability to allow the operator to avoid excessive mixing conditions.
Based on the results of polymer screening and the pilot scale tests described below, a cationic coagulant such as
GE Betz Developmental E will be used for Phase 1 dewatering within a dosage range of 7 to 19 lbs/dry T. This
dosage range may be modified if polymer treatment will be used in the gravity thickeners. Additional testing of
thickened sediments will continue during Phase 1 Final Design.
Polymer preparation and addition systems will be developed to permit chemical-enhanced dewatering, as
described above, for cationic polymer treatment. These details will be developed during Phase 1 Final Design
or in accordance with performance specifications.
Recessed Chamber Filter Press Dewatering System
Dewatering treatability studies included bench-scale filter press simulations (BFPs or “hockey pucks”) using a
test apparatus from US Filter. These bench-scale tests were used to evaluate the effects of several variables.
The program also included tests using a 1 ft2 pilot-scale plate and frame filter press (PFP). The PFP tests were
conducted to generate water for water treatment pilot tests. The main variable that changed for the PFP tests
was the feed sediment types. Exhibit G-3.6 is a listing of all the bench-scale and pilot-scale tests.
Exhibit G-3.7a lists results of treatments with GE Betz Developmental E polymer, 100 psi and 30- 60-minute
runs. The data were then divided into BFP and PFP for each matrix. For the BFP runs, the results were selected
for the dosage that produced highest cake solids when a series of dosages was performed. For PFP, it was
assumed that all dosages were close to optimal. The pilot-scale results did not significantly differ from similar
bench-scale tests. In general, it is expected that sediments can be dewatered to 55 to 65% solids (see
comparisons in Exhibit G-3.7b).
The filter press tests used "simulated" hydrocyclone overflow as feed. This simulated feed was produced by
settling the sediment slurry for 1 to 2 minutes to simulate the coarse solids removal expected during

BLASLAND, BOUCK & LEE, INC. engineers, scientists, economists G-7
hydrocyclone separation. Bench-scale filter press tests were also run on actual hydrocyclone overflow from
pilot tests (Exhibit G-3.8). The actual hydrocyclone overflows appear to require polymer doses higher than the
simulated feeds and produce cake solids of 45 to 55%, as compared to 55 to 65% for the simulated feeds. When
freshly-diluted sediment samples were passed across a #400 screen, the resulting fines required high polymer
doses and produced BFP cakes in the 45 to 55% range, similar to the hydrocyclone overflows.
Several BFP runs evaluated cake release screening for alternative fabric porosities. See Exhibit G-3.9. The tests
included fabrics with porosities ranging from 0.5 to 15 cubic feet per minute (cfm). All of the tested fabrics had
good release and clear filtrate; cake solids and filtrate volumes were similar within each of the two sediments
tested. Specific filter press vendors may need to perform similar testing for other media.
Most BFP runs and all PFP runs were conducted at filter feed pressures of 100 psi. Within tests BFP-82 to BFP-
92, several feed pressures of 125 and 225 psi were performed. Improvements of cake solids at the higher
pressures were inconsistent. Run BFP-84 at 125 psi had cake solids of 71.5% vs 67.1% for BFP-83 at 100 psi.
However, curiously, BFP-88 at 100 psi produced cake solids of 59.2%, compared to BFP-90 at 125 psi, which
had cake solids of 58.9% and BFP-91at 225 psi, which had cake solids of 54.6%.
Cake solids vs. time were evaluated in runs BFP-144, BFP-133, and BFP-145. Cake solids improved around
10% solids points from 45 to 60 minutes, with little further cake dryness achieved by increasing the time to 60
to 90 min. Similar time trends can be observed by plotting filtrate volumes from individual BFP and PFP tests
(no BFP tests went beyond 90 minutes, but some PFP tests went to 120 to 150 minutes).
The pooled data in Exhibit G-3.6 were evaluated by multiple regression, with results presented and discussed in
Exhibit G-3.10. Cake solids were best predicted by the fines content in the matrix, next by filter press feed %
solids, and then by scale of the test (bench vs. pilot). Curiously, polymer dose was not statistically significant –
see discussion in Exhibit G-3.10.
For several of the PFP runs, filtrate samples were analyzed. These analyses are summarized in Exhibit G-3.11.
Suspended solids ranged 2 to 42 milligrams per liter (mg/L), with an average of 13.4 mg/L. TOC and dissolved
organic carbon (DOC) ranged 3 to 14 mg/L, with an average of 7.8 mg/L. Total PCB ranged 430 nanograms per
liter (ng/L) to 46 micrograms per liter (µg/L), with an average of 17.6 µg/L.

BLASLAND, BOUCK & LEE, INC. engineers, scientists, economists G-8
Alternatives to dewatering by plate and frame filter press include belt presses and centrifuges. Some screening
tests were performed to estimate polymer consumption and cake solids achievable by these processes. Test
results are shown in Exhibit G-3.12. The belt press screening tests achieved average 52% solids, only slightly
lower than the 55 to 65% solids produced by PFP tests. Centrifugation achieved average 49% cake solids. It is
notable that the centrate suspended solids and PCB concentrations were approximately 100 times that of PFP
filtrate.
Filter press sizing calculations are presented in Exhibit G-3.1. Phase 1 processing will require 12 plate and
frame filter presses, each with a capacity of 600 cubic feet. Press cake (55 to 65% solids) will discharge to roll-
off boxes located below each press.
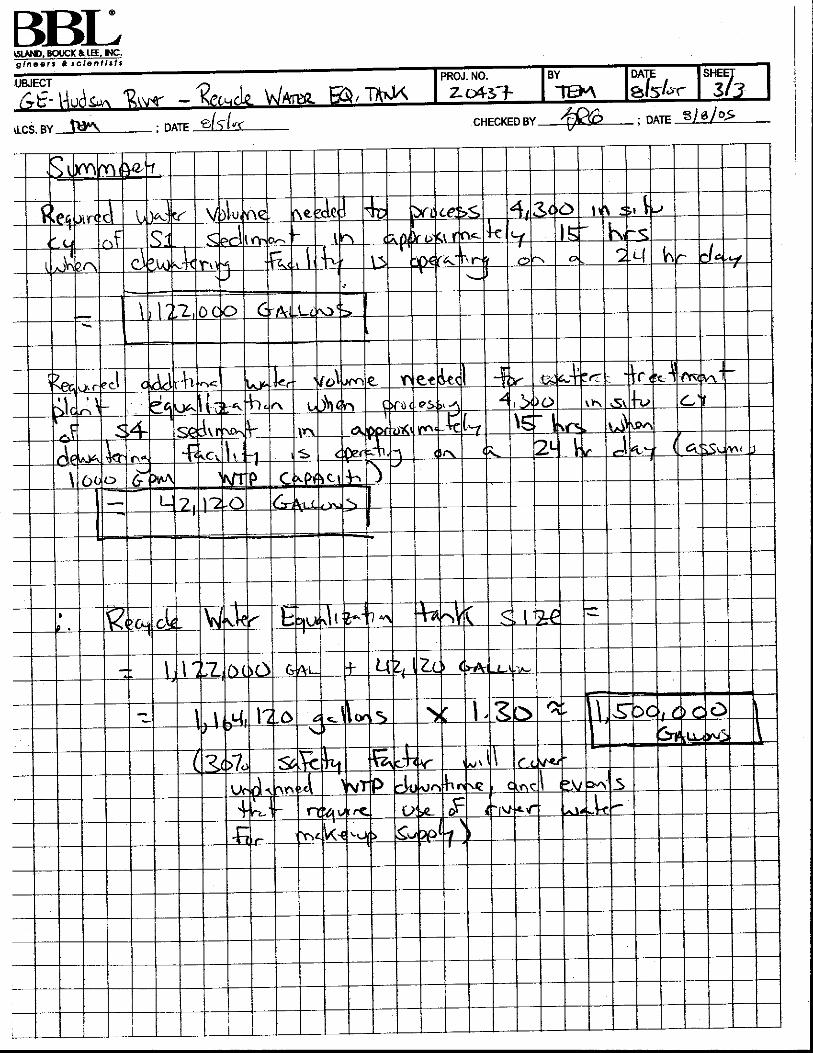
Press filtrate will discharge to the recycle water equalization tank, where it will mix with overflow from the
thickeners. Sizing of the recycle water equalization tank is included in Exhibit G-3.1. Water from this tank is
used to supply the size separation process water storage tank located at the waterfront.
4. Solidification and Stabilization
Stabilization/solidification treatability testing was performed to evaluate the effectiveness of various dosages of
solidification agents on raw slurries and filter cake. The test data and observations are summarized on pages
759 to 760 in the Treatability Studies Appendix. Generally, it is noted that quicklime performed better at lower
doses than other reagents tested. Dosages of 15 to 25+% were required, with very high dosages for S4
sediments. Typically, stabilization/solidification is performed at dosages of 7 to 10%. Filter press cakes all
passed the paint filter test and did not require stabilization/solidification. Based on treatability testing,
quicklime would be the material of choice for stabilizing off-spec batches of filter press cake.
Storage/transport stability tests were performed to ascertain the potential for water to be released from processed
material during transport. A shaker test was used to simulate motion during transport that might result in water
release from dewatered or solidified sediments. Results are presented in the appended Treatability Studies
Report. All mixes were stable, and only three samples had a detectable amount of free water released.

BLASLAND, BOUCK & LEE, INC. engineers, scientists, economists G-9
5. Process Water Treatment
Process water treatment was tested during treatability studies. The treatment train included settling, filtration,
and carbon adsorption. The processes were tested at a range of commonly applied hydraulic loading rates using
filtrates produced during pilot tests by dewatering each of the sediment types (S1, S2, S3, and S4B) with PFPs.
Results of the testing are included in Tables 23 and 24 of the appended Treatability Studies Report. These
results are also summarized in Exhibits G-4.2 (Settled Filtrate) and G-4.3 (Process Water Filtration and
Granular-Activated Carbon Adsorption). The tests were not designed to follow the processes through full cycles
of headloss development or carbon exhaustion. Rather, the tests were intended to represent a snapshot of the
process removal capabilities when treating waters from various sediments over a range of hydraulic loadings.
The column tests were equilibrated for at least 10 bed volumes of flow before sampling.
After settling for 2 hours, the supernatants were used to feed the process filter and two GAC columns in series.
Settled dewatering process effluents from the four sediment types were applied to the process filter (4-inch
diameter x 4-foot bed height) at hydraulic loadings of 2, 6, and 10 gallons per minute per square foot (gpm/ft2).
The process filter was connected in series to a train of two GAC columns (4-inch diameter x 5-foot bed height
each), also in series. Sampling between the GAC columns and after the lag column allowed evaluation of two
hydraulic loadings during each run. The three applied flow rates achieved carbon loading rates of 19 and 38
minutes, 6 and 13 minutes, and 4 and 8 minutes empty-bed contact times (EBCTs).
Exhibit G-3.11 shows PFP filtrate suspended solids ranging from 2 to 42 mg/L (13.4 mg/L average) and PCBs
ranging from 0.43 to 46 µg/L (17.6 µg/L average). Exhibit G-4.2 shows settled PFP filtrates with suspended
solids undetectable (at a detection limit of about 2 mg/L) in four of the five tests, and 13 mg/L for settled H1S4B
filtrate. The settled filtrates had PCBs ranging from 40 to 1,100 ng/L. Heavy metals in the settled PFP filtrates
were all well below the WQC Substantive Requirements.
Exhibit G-4.3 shows removals across the process filter and GAC columns. The feed PCBs were low for all
sediment types, ranging from 22 to 56 ng/L. The process filter showed consistent further removals of PCBs,
with filter effluents ranging from 12 to 46 ng/L (discounting a 76 ng/L outlier). The lead and lag GAC effluents
were undetectable for PCBs at a detection limit of 9.3 to 9.8 ng/L (except for H1S4B with 17 ng/L from the lead
column and undetectable from the lag column).

BLASLAND, BOUCK & LEE, INC. engineers, scientists, economists G-10
Even though feed heavy metals were all below WQC Substantive Requirements, there were consistent
reductions of chromium, copper, and lead across the GAC, and to a lesser extent across the process filter.
Cadmium and mercury were below detection levels in feeds and effluents. In other tests, effluent from RSSCT
carbon columns was tested for mercury using EPA Method 1631. Mercury was not present at detection levels of
0.00051 µg/L. When present in feed streams, there were also expected reductions in COD, 5-day BOD5, TOC,
DOC, TKN, and nitrate, typically to non-detectable levels from the lag GAC.
There were no outstanding differences in removals owing to the three hydraulic loadings tested.
The DRET tests provide some additional perspective on the potential solubilization of heavy metals from
Hudson River sediments within the processing facilities, although that is not the intent of the DRET test. See
Exhibit G-4.4. Settled (unfiltered) DRET water was observed to contain cadmium, chromium, lead, and
mercury concentrations exceeding WQC Substantive Requirements; however, none of the filtered waters
contained heavy metals above the WQC Substantive Requirements. Note that the DRET test uses a 1%
sediment slurry, mixed, then settled. The sediment concentrations in the processing facility will be on the order
of 25%. The metals in the PFP filtrates (Exhibit G-4.2) and the filter/GAC tests (Exhibit G-4.3) were not
significantly different from the DRET test filtrates, indicating that dissolved metal concentrations are not
sensitive to original slurry concentrations.
Process Water Equalization Tanks
The METSIM material balances (presented in Table 3-35) indicate that processing of inventory dredging barges
during the 1-month Phase 2 demonstration period (conducted during Phase 1) will produce 300 to 409 gpm
(0.43 to 0.59 [mgd]) of water to be treated, depending on the sediment type being processed. The material
balances further indicate that processing of residuals dredging barges will generate 780 to 860 gpm (1.1 to 1.2
mgd) of water. Based on these expected flow rates, two water treatment trains of 500 gpm each will be
constructed for Phase 1.
Excess water will be directed from the recycle water equalization tank (T-21001) to the process water
equalization tank (T-30101). The 60,000-gallon process water equalization tank will provide a 60-minute
retention/equalization time at the design flow rate of 1,000 gpm (Exhibit G-4.1). Either one or both process
water treatment trains will draw from this tank.

BLASLAND, BOUCK & LEE, INC. engineers, scientists, economists G-11
Rapid/Mix and Flocculation Tanks
During the pilot studies, solids present in the PFP filtrate settled readily without further chemical treatment.
However, to provide flexibility, chemical feed, rapid mix, and flocculation tanks will be provided with each 500
gpm train. These will be available for polymer addition and/or metal coagulant.
As presented in Exhibit G-4.1, a 1,500-gallon rapid mix basin (3 minutes) and a 2,500-gallon flocculation basin
(5 minutes) will be provided along with appropriate mixers, to be specified during Phase 1 Final Design.
Clarifiers
The flocculation basins will each lead to a high-rate clarifier. A number of clarifiers are available that operate at
hydraulic loading rates of 0.23 to 0.25 gpm/sf. Clarifiers are often supplied with integral rapid mix and
flocculation facilities. Other clarifier systems (e.g., Krofta) may be integrated with filter media.
Process Filter Systems
Process filter systems are discussed in Exhibit G-4.1. A design hydraulic loading of 3.9 gpm/ft2 is suggested.
This rate is consistent with the screening tests done during treatability studies. Two filter units per process train
are suggested.
Backwash water will be provided for an upflow rate of 15 gpm/ft2 (1,000 gpm) and a backwash time of 15
minutes per filter once per day, for a total backwash requirement of 60,000 gallons per day. This is 4% of the
forward flow at design loading.
Granular Activated Carbon Systems
As described in Exhibit G-4.1, four GAC vessels are recommended for each 500 gpm process water treatment
train. Each GAC vessel will be designed for a recommended EBCT of 20 minutes, with two trains of two GAC
vessels in series. Each vessel will contain 20,000 pounds of GAC, with a bed volume of 700 cubic feet. Piping
will allow reversal of lead and lag columns in each train.
RSSCTs have been conducted to allow prediction of GAC bed life and breakthrough profiles. The results are
currently being compiled and will be reported during Phase 1 Final Design. Available test results indicate that
at typical loadings, the bed life is likely to last well beyond a single dredging season. Bag filters or cartridge
filters will be provided at the end of each GAC train. Bag filter media will likely be 5 or 10 microns.

BLASLAND, BOUCK & LEE, INC. engineers, scientists, economists G-12
Backwash Holding Tank
A single 200,000-gallon backwash holding tank (T-30901) will serve the backwash needs of all filter columns
and GAC columns. In addition, this tank will provide holding for decontamination and plant wash waters at all
process areas, including rail yard decontamination needs. A listing of plant water needs is included in Exhibit
G-4.1.
6. Stormwater Treatment
Design Storms
Three types of stormwater runoff are described in Section 3.6 of the Phase 1 IDR. These include Type I
stormwater, which has the potential to contact PCB-containing materials; Type II stormwater, which has the
potential to collect non-PCB sediments as a result of peripheral site activities; and Type III stormwater, which
runs across areas of the site which are undisturbed and/or not involved in site activities.
Exhibit G-8.1 presents a tally of the Type I runoff areas and presents runoff volume calculations associated with
10-, 25-, and 100-year return interval storms. Type I stormwaters will be collected, stored, and treated as
described below. Type II stormwaters will be gravity-drained to four stormwater sediment basins. These grass-
surfaced basins will allow sedimentation and recharge, but will overflow to surface waters during higher-flow
periods. Type III stormwaters will follow current recharge or discharge patterns.
Stormwater Treatment Systems
Type I stormwaters will be collected and routed as described in Section 3.6 of the Phase 1 IDR. Three types of
storage systems will be used. Above-ground tanks will contain runoff (3.5 MG) from a 10-year 24-hour storm.
Curbing and piping will contain additional storm volume (0.6 MG) generated from a 25-year 24-hour storm (4.1
MG), while curbing will contain additional storm volume (1.0 MG) generated from a 100-year 24-hour storm
(5.1 MG).
A third water treatment train (in addition to the two described in Section G.5 [Process Water Equalization
Tanks]) will be used to treat Type I stormwaters. This will be an additional 500 gpm train identical to the two
500 gpm process water treatment trains. Stormwater treatment will use available capacity, as needed, from the
two process trains. If dredging is discontinued for any period, the process water treatment trains can be fully

BLASLAND, BOUCK & LEE, INC. engineers, scientists, economists G-13
utilized for stormwater treatment. Similarly, when not needed to treat stormwater, the stormwater train can be
available to address non-routine process treatment needs.
7. Processed Material Staging and Load-out Facilities
Waterfront Staging
Four types of materials will be staged and managed at the waterfront facility. These include:
• Large debris removed separately by grapple or sling. This may include logs and rocks, as well as large
cultural debris, such as tires, appliances, or shopping carts;
• Debris greater than 6 inches in diameter rejected from the pipe grizzly;
• Debris greater than 3/8 inch in diameter rejected from the trommel screen; and
• Coarse solids from hydrocyclone underflow and dewatering screen.
Estimated quantities and temporary staging areas are presented in Exhibit G-5.1. Calculations of transport
vehicles and trip cycles are also included. In the calculations a 16-hour work day is intended to represent a 67%
utilization rate over a 24-hour day. Downtime is anticipated for truck maintenance, fueling, shift changes, and
potential waiting time if loading or unloading operations experience delays.
Filter Cake Staging
At peak Phase 1 production, 12 filter presses will each produce a drop of 22 cy of 55% solids filter cake every 3
hours, for a total of 105 drops per day. These solids will drop into 30 cy roll-off containers. Two roll-off trucks
will each need to transport two containers per hour from the filter press building to the fine sediment staging
area.
Railside Staging
Exhibit G-5.1 presents five Phase 1 train scenarios. These scenarios list the weekly barged and processed
sediment amounts, and calculate load-out volumes in accordance with assumed numbers of unit trains shipped
each week. The net difference between each week’s input and output becomes the additional cumulative storage
volume. Each scenario reaches a maximum peak storage volume that declines as dredging production is
reduced or as rail service is increased. The two principal scenarios were:

BLASLAND, BOUCK & LEE, INC. engineers, scientists, economists G-14
• Three trains per week (Scenarios 4 and 5) require 22,000 to 34,000 cy storage.
• Two trains per week (Scenario 1) require 83,000 cy storage.
The scenario utilizing two trains per week was selected as the basis for storage sizing because it minimizes the
potential effects of rail service unreliability on processing facility operations. The 83,000-cy storage scenario
can be accommodated in the four to five storage cells/structures shown on the Contract Drawings. This scenario
will require the use of stackers to attain 20-foot high storage cells. The storage cells would include two for fine
sediment cake, two for coarse sediments, and one for debris.
Exhibit G-5.1 also includes calculations for loading staged materials into rail cars. Four 8.7 cy wheel loaders
(two loading coarse materials from the north staging cells and two loading fine sediments from the south staging
cells) can load one 81-car unit train in 8 hours, not including train movement times.
8. Site Work, Roads, Utilities, and Administrative Areas
Stormwater
Stormwater handling was discussed in Section G.6 in connection with treatment requirements. The sizing of the
Type II Stormwater Sediment Basins is being finalized in conjunction with the site grading plan. These basins
will be modified during Phase 1 Final Design. Similarly, the curbed Type I stormwater impounded areas and
piping systems are being finalized along with the site grading plan, and will be presented in the Phase 1 FDR.
Site Grading
The site grading plan will continue during Phase 1 Final Design. Approximate earthwork and fill quantities
developed to date are presented in Exhibit G-8.1. These preliminary calculations indicate a need for an
estimated 100,000 cy of net differential to be supplied by imported fill during the beginning of the Phase 1
construction period.

Exhibit G.1

SolidsD50 % Fines Sp. Grav. Solids PCB TOC
0.005 0.074 0.425 2.0 4.75 76.2 (mm) <74um (g/mL) % (w/w) mg/kg mg/kgYr 1 S-1 Coarsest quartile 1.0 4.6 42.5 72.7 84.4 100.0 0.81 4.6 2.68 77.6 33.9 5,200Yr 1 S-2 Coarse-fine 2.5 11.9 52.8 76.9 86.2 100.0 0.40 11.9 2.60 71.9 49.3 12,800Yr 1 S-3 Fine-coarse 9.7 32.8 80.4 92.4 95.6 100.0 0.20 32.8 2.48 59.7 159 26,700Yr 1 S-4 Finest quartile 34.5 76.4 96.1 98.8 99.3 100.0 0.03 76.4 2.39 50.1 196 39,000Yr 1 Overall Average 11.8 31.1 67.7 85.1 91.3 100.0 0.26 31.1 2.54 64.9 106.9 20,800
0Yr 2 S-1 Coarsest quartile 2.1 5.2 43.4 79.3 86.9 99.3 0.71 5.2 2.70 79.0 9.4 5,500Yr 2 S-2 Coarse-fine 8.4 28.3 82.7 93.5 95.9 100.0 0.21 28.3 2.56 63.2 58.9 24,400Yr 2 S-3 Fine-coarse 16.0 55.0 94.1 98.5 99.1 100.0 0.07 55.0 2.47 54.6 117 34,400Yr 2 S-4 Finest quartile 26.4 81.0 98.1 99.9 99.9 100.0 0.03 81.0 2.42 48.2 124 38,900Yr 2 Overall Average 13.2 42.3 79.5 92.8 95.5 99.8 0.15 42.3 2.54 61.3 84.9 25,800
0Yr 1+2 S-1 Coarsest quartile 1.6 4.8 41.7 76.7 85.7 99.5 0.80 4.8 2.70 79.1 15.1 4,900Yr 1+2 S-2 Coarse-fine 7.0 23.3 75.6 90.2 94.0 100.0 0.25 23.3 2.56 64.9 77.2 21,400Yr 1+2 S-3 Fine-coarse 15.1 51.2 93.2 98.1 98.8 100.0 0.07 51.2 2.48 55.6 110 33,500Yr 1+2 S-4 Finest quartile 28.1 80.7 97.9 99.8 99.9 100.0 0.03 80.7 2.42 48.5 138 39,200Yr 1+2 Overall Average 12.9 40.0 77.0 91.1 94.6 99.9 0.17 40.0 2.54 62.0 90.0 24,700
Cum. % passing size (mm) - Quartile Average
General Electric CompanyHudson River PCBs Superfund SitePhase 1 Intermediate Design Report
Attachment G.1.1 - SSAP Sediment Characteristics - Years 1 + 2
Years 1 + 2 SSAP
0
10
20
30
40
50
60
70
80
90
100
0.001 0.01 0.1 1 10 100
Size (mm)
% F
iner
S1
S2
S3
S4
Page 1 of 1

SolidsD50 % Fines Sp. Grav. Solids PCB TOC
0.005 0.074 0.425 2.0 4.75 76.2 (mm) <74um (g/mL) % (w/w) mg/kg mg/kgYr 1 S-1 Coarsest quartile 1.0 4.6 42.5 72.7 84.4 100.0 0.81 4.6 2.68 77.6 33.9 5,200Yr 1 S-2 Coarse-fine 2.5 11.9 52.8 76.9 86.2 100.0 0.40 11.9 2.60 71.9 49.3 12,800Yr 1 S-3 Fine-coarse 9.7 32.8 80.4 92.4 95.6 100.0 0.20 32.8 2.48 59.7 159 26,700Yr 1 S-4 Finest quartile 34.5 76.4 96.1 98.8 99.3 100.0 0.03 76.4 2.39 50.1 196 39,000Yr 1 Overall Average 11.8 31.1 67.7 85.1 91.3 100.0 0.26 31.1 2.54 64.9 106.9 20,800
0Yr 2 S-1 Coarsest quartile 2.1 5.2 43.4 79.3 86.9 99.3 0.71 5.2 2.70 79.0 9.4 5,500Yr 2 S-2 Coarse-fine 8.4 28.3 82.7 93.5 95.9 100.0 0.21 28.3 2.56 63.2 58.9 24,400Yr 2 S-3 Fine-coarse 16.0 55.0 94.1 98.5 99.1 100.0 0.07 55.0 2.47 54.6 117 34,400Yr 2 S-4 Finest quartile 26.4 81.0 98.1 99.9 99.9 100.0 0.03 81.0 2.42 48.2 124 38,900Yr 2 Overall Average 13.2 42.3 79.5 92.8 95.5 99.8 0.15 42.3 2.54 61.3 84.9 25,800
0Yr 1+2 S-1 Coarsest quartile 1.6 4.8 41.7 76.7 85.7 99.5 0.80 4.8 2.70 79.1 15.1 4,900Yr 1+2 S-2 Coarse-fine 7.0 23.3 75.6 90.2 94.0 100.0 0.25 23.3 2.56 64.9 77.2 21,400Yr 1+2 S-3 Fine-coarse 15.1 51.2 93.2 98.1 98.8 100.0 0.07 51.2 2.48 55.6 110 33,500Yr 1+2 S-4 Finest quartile 28.1 80.7 97.9 99.8 99.9 100.0 0.03 80.7 2.42 48.5 138 39,200
Yr 1+2 Overall Average 12.9 40.0 77.0 91.1 94.6 99.9 0.17 40.0 2.54 62.0 90.0 24,700
Cum. % passing size (mm) - Quartile Average
General Electric CompanyHudson River PCBs Superfund Site
Phase 1 Intermediate Design Report
Exhibit G.1.1 - SSAP Sediment Characteristics - Years 1 + 2
Years 1 + 2 SSAP
0
10
20
30
40
50
60
70
80
90
100
0.001 0.01 0.1 1 10 100
Size (mm)
% F
iner
S1S2S3S4
Page 1 of 1

General Electric CompanyHudson River PCBs Superfund SitePhase 1 Intermediate Design Report
Exhibit G.1.2 - SSAP Sediment Characteristics - Year 1 & Year 2
Year 1 SSAP
0
10
20
30
40
50
60
70
80
90
100
0.001 0.01 0.1 1 10 100
Size (mm)
% F
iner
S1
S2
S3
S4
Year 2 SSAP
0
10
20
30
40
50
60
70
80
90
100
0.001 0.01 0.1 1 10 100
Size (mm)
% F
iner
S1
S2
S3
S4
Page 1 of 1
General Electric CompanyHudson River PCBs Superfund SitePhase 1 Intermediate Design Report
Exhibit G.1.3 - Baseline Sediment Sample Data
Sample ID: S1 S1-DUP S2 S3 S4B S4B-DUPDate Collected: 6/10/2004 6/10/2004 5/19/2004 5/19/2004 6/24/2004 6/24/2004
Total PCBs mg/kg 8 11.3 138 101 490 466Total PAHs mg/kg 0.316 J 0.581 J 0.245 J 1.97 J 0.656 J 0.496 JAmmonia Nitrogen mg/kg 27.4 13.1 96.7 213 390 384Bulk Density g/cc 1.3 1.5 0.75 0.79 0.41 0.37Total Kjeldahl Nitrogen mg/kg 891 X 822 X 1,480 X 1,680 X 4,320 4,140TOC mg/kg 7,800 8,600 30,000 33,000 85,000 73,000Total Phosphorous (PO4) mg/kg 532 78 690 828 1,170 1,270Total Phosphorous (as P) mg/kg 174 26 225 270 382 414Percent Solids % 79.1 79.1 53.1 56.8 33 33Finer than #200 % 10.1 8.8 30.2 40.8 59.2 78.6Total TEQs (WHO TEFs) mg/kg 2.8E-06 NA 4.73E-06 0.00000377 0.00013 0.00012Aluminum mg/kg 5,330 5,270 8,380 9,360 14,000 14,100Antimony mg/kg 0.1 XN 0.11 XN 2.4 NE 1.4 NE 5.5 NE 6.5 NEArsenic mg/kg 1.9 NE 1.5 NE 2.1 2 3.9 4Barium mg/kg 58.5 N 62.7 N 81 74.9 129 134Beryllium mg/kg 0.31 0.29 0.42 0.38 0.65 0.64Cadmium mg/kg 0.44 E 0.46 E 12.3 7 39.2 NE 36.8 NECalcium mg/kg 1600 1590 2220 4340 5530 5540Chromium mg/kg 24.8 N 27.4 N 235 121 518 518Cobalt mg/kg 4.9 4.5 5.8 6.2 8.6 8.4Copper mg/kg 12.2 15.4 37.8 26.5 78.3 88.3Iron mg/kg 10200 9900 11900 13400 18600 18500Lead mg/kg 19.1 22.3 219 E 144 E 637 639Magnesium mg/kg 1980 1870 2230 3610 3410 3470Manganese mg/kg 121 N 123 N 107 159 184 183Mercury mg/kg 0.066 0.072 1.6 0.79 3.9 4.1Nickel mg/kg 8.4 7.9 12.8 12.4 21.5 20.9Potassium mg/kg 898 957 835 762 1280 1360Selenium mg/kg 0.47 X 0.44 X 0.74 XN 0.72 XN 1.5 N 1.5 XNSilver mg/kg 0.048 X 0.053 X 0.26 0.21 0.91 0.87Sodium mg/kg 116 E 99.5 E 148 E 140 E 279 E 269 EThallium mg/kg 0.22 * 0.077 X* 0.097 X 0.075 X 0.32 0.56Vanadium mg/kg 14.9 E 15.6 E 33.9 E 26.6 E 73.5 E 71.5 EZinc mg/kg 52.9 E 51.3 E 194 E 147 E 521 NE 510 NE
Notes:1.
2.3.
4.5.6.7.
8.
Samples were collected by Blasland, Bouck & Lee, Inc., and submitted to Severn Trent Laboratories, Inc. (Pittsburgh and Burlington), Paradigm Analytical Laboratories, and Northeast Analytical Services, Inc. for analysis. Results have not yet been validated. Additional qualifiers will be added, as needed, following validation.Total 2,3,7,8-TCDD toxicity equivalents (TEQs) were calculated using Toxicity Equivalency Factors (TEFs) derived by the World Health Organization (WHO) and published by Van den Berg et al. in Environmental Health Perspectives 106(2), December 1998.Results are presented in dry weight.mg/kg = milligrams per kilogram.g/cc = grams per cubic centimeter.NA - Not analyzed.
Laboratory Data Qualifiers:Organics (PAHs, PCDD/PCDFs) E - Analyte exceeded calibration range. J - Indicates an estimated value less than the practical quantitation limit (PQL). Q - Indicates the presence of quantitative interferences. DPE - Polychlorinated Diphenyl Ether (PCDPE) Interference.Inorganics (TAL Metals, Total Kjeldahl Nitrogen) B - Indicates an estimated value between the lower calibration limit and the target detection limit. E - Matrix interference. N - Indicates sample matrix spike analysis was outside control limits. X - Method blank contamination. * - Serial dilution results not within 10%. Applicable only if analyte concentration is at least 50X the IDL in original sample.
Page 1 of 1
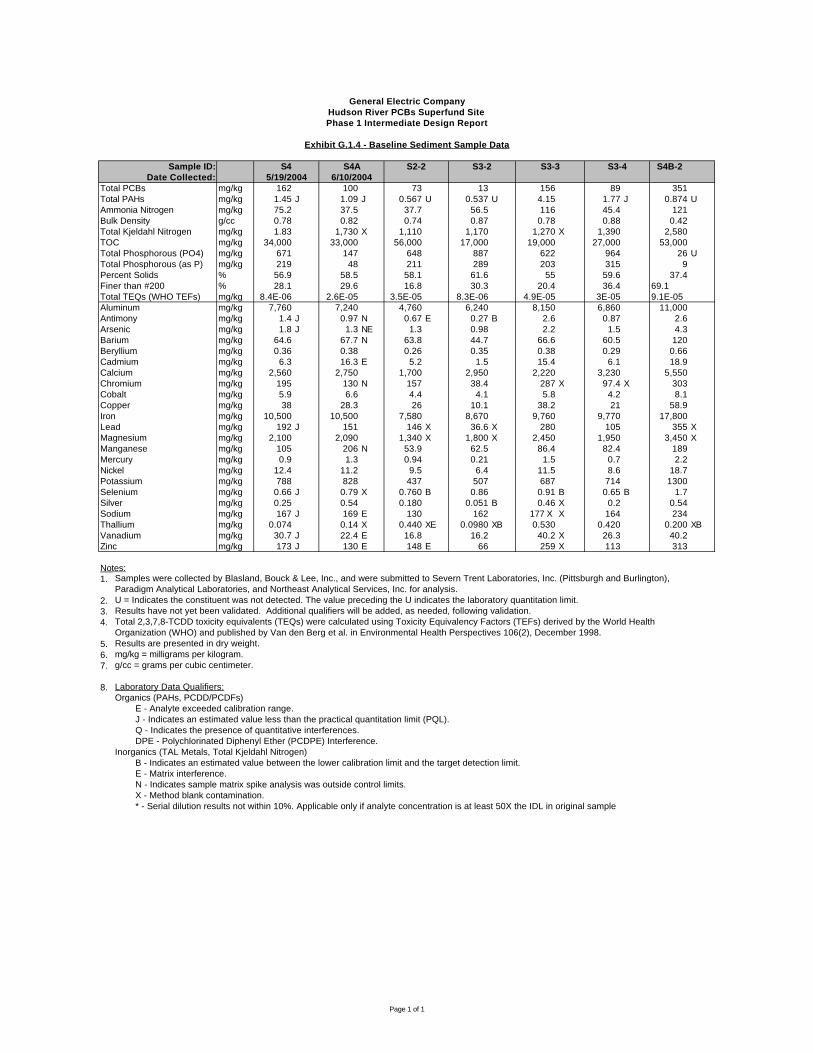
General Electric CompanyHudson River PCBs Superfund SitePhase 1 Intermediate Design Report
Exhibit G.1.4 - Baseline Sediment Sample Data
Sample ID: S4 S4B-2Date Collected: 5/19/2004
Total PCBs mg/kg 162 100 73 13 156 89 351Total PAHs mg/kg 1.45 J 1.09 J 0.567 U 0.537 U 4.15 1.77 J 0.874 UAmmonia Nitrogen mg/kg 75.2 37.5 37.7 56.5 116 45.4 121Bulk Density g/cc 0.78 0.82 0.74 0.87 0.78 0.88 0.42Total Kjeldahl Nitrogen mg/kg 1.83 1,730 X 1,110 1,170 1,270 X 1,390 2,580TOC mg/kg 34,000 33,000 56,000 17,000 19,000 27,000 53,000Total Phosphorous (PO4) mg/kg 671 147 648 887 622 964 26 UTotal Phosphorous (as P) mg/kg 219 48 211 289 203 315 9Percent Solids % 56.9 58.5 58.1 61.6 55 59.6 37.4Finer than #200 % 28.1 29.6 16.8 30.3 20.4 36.4 69.1Total TEQs (WHO TEFs) mg/kg 8.4E-06 2.6E-05 3.5E-05 8.3E-06 4.9E-05 3E-05 9.1E-05Aluminum mg/kg 7,760 7,240 4,760 6,240 8,150 6,860 11,000Antimony mg/kg 1.4 J 0.97 N 0.67 E 0.27 B 2.6 0.87 2.6Arsenic mg/kg 1.8 J 1.3 NE 1.3 0.98 2.2 1.5 4.3Barium mg/kg 64.6 67.7 N 63.8 44.7 66.6 60.5 120Beryllium mg/kg 0.36 0.38 0.26 0.35 0.38 0.29 0.66Cadmium mg/kg 6.3 16.3 E 5.2 1.5 15.4 6.1 18.9Calcium mg/kg 2,560 2,750 1,700 2,950 2,220 3,230 5,550Chromium mg/kg 195 130 N 157 38.4 287 X 97.4 X 303Cobalt mg/kg 5.9 6.6 4.4 4.1 5.8 4.2 8.1Copper mg/kg 38 28.3 26 10.1 38.2 21 58.9Iron mg/kg 10,500 10,500 7,580 8,670 9,760 9,770 17,800Lead mg/kg 192 J 151 146 X 36.6 X 280 105 355 XMagnesium mg/kg 2,100 2,090 1,340 X 1,800 X 2,450 1,950 3,450 XManganese mg/kg 105 206 N 53.9 62.5 86.4 82.4 189Mercury mg/kg 0.9 1.3 0.94 0.21 1.5 0.7 2.2Nickel mg/kg 12.4 11.2 9.5 6.4 11.5 8.6 18.7Potassium mg/kg 788 828 437 507 687 714 1300Selenium mg/kg 0.66 J 0.79 X 0.760 B 0.86 0.91 B 0.65 B 1.7Silver mg/kg 0.25 0.54 0.180 0.051 B 0.46 X 0.2 0.54Sodium mg/kg 167 J 169 E 130 162 177 X X 164 234Thallium mg/kg 0.074 0.14 X 0.440 XE 0.0980 XB 0.530 0.420 0.200 XBVanadium mg/kg 30.7 J 22.4 E 16.8 16.2 40.2 X 26.3 40.2Zinc mg/kg 173 J 130 E 148 E 66 259 X 113 313
Notes:1.
2.3.4.
5.6.7.
8.
S3-4S3-3S4A6/10/2004
S2-2 S3-2
Samples were collected by Blasland, Bouck & Lee, Inc., and were submitted to Severn Trent Laboratories, Inc. (Pittsburgh and Burlington), Paradigm Analytical Laboratories, and Northeast Analytical Services, Inc. for analysis. U = Indicates the constituent was not detected. The value preceding the U indicates the laboratory quantitation limit.Results have not yet been validated. Additional qualifiers will be added, as needed, following validation.Total 2,3,7,8-TCDD toxicity equivalents (TEQs) were calculated using Toxicity Equivalency Factors (TEFs) derived by the World Health Organization (WHO) and published by Van den Berg et al. in Environmental Health Perspectives 106(2), December 1998.Results are presented in dry weight.mg/kg = milligrams per kilogram.g/cc = grams per cubic centimeter.
Laboratory Data Qualifiers:Organics (PAHs, PCDD/PCDFs) E - Analyte exceeded calibration range. J - Indicates an estimated value less than the practical quantitation limit (PQL). Q - Indicates the presence of quantitative interferences. DPE - Polychlorinated Diphenyl Ether (PCDPE) Interference.Inorganics (TAL Metals, Total Kjeldahl Nitrogen) B - Indicates an estimated value between the lower calibration limit and the target detection limit. E - Matrix interference. N - Indicates sample matrix spike analysis was outside control limits. X - Method blank contamination. * - Serial dilution results not within 10%. Applicable only if analyte concentration is at least 50X the IDL in original sample
Page 1 of 1

Exhibit G.2
Size Separation Design Calculations

Exhibit G.2.1
Size Separation Design Calculations

Hopper with Pipe Grizzly


Rotary Trommel Screen


Sediment Slurry Tank


Hydrocyclone System


Vibratory Dewatering Screens

Process Water Storage Tanks


Solids% Retain
PCBs (ppm) % Solids
TOC (mg/kg)
Specific Gravity pH
-- -- (S1) 8.0 79.1% 7,800 -- --10 2,000 26.2% 9.6 92.6% 2.52 8.0120 850 6.2% 6.3 76.8% 2.64 7.4740 425 9.3% 4.6 77.8% 2.82 7.1960 250 14.4% 5.1 74.9% 2.82 7.1880 180 12.5% 3.3 76.0% 2.94 6.94
100 150 6.2% 3.7 76.2% 3.02 6.91200 75 11.2% 7.2 74.9% 2.97 7.08<200 <75 14.0% 24 47.7% -- 2.54 6.22
-- 8.9 76.3% -- -- --
Solids% Retain
PCBs (ppm) % Solids
TOC (mg/kg)
Specific Gravity pH
-- -- (S2) 138 54.3% 30,000 -- --10 2,000 3.8% 36 73.0% 1.99 6.2920 850 3.9% 60 55.8% 2.38 6.4840 425 7.4% 82 58.2% 2.63 6.6660 250 11.1% 37 66.4% 2.60 6.7480 180 15.3% 17 69.3% 2.66 6.84
100 150 7.5% 24 68.5% 2.75 6.62200 75 15.6% 24 65.9% 2.85 6.65<200 <75 35.4% 320 35.0% -- 2.41 5.81
-- 135 55.0% -- -- --
Solids% Retain
PCBs (ppm) % Solids
TOC (mg/kg)
Specific Gravity pH
-- -- -- 101 57.4% 33,000 -- --10 2,000 3.1% 62 51.9% 6.7320 850 1.4% 128 61.2% 6.0040 425 2.5% 55 42.8% 2.47 6.1860 250 3.3% 18.1 32.0% 2.66 6.1280 180 7.6% 21.9 31.9% 2.65 6.44
100 150 5.8% 7.9 28.9% 2.70 6.57200 75 26.3% 9.5 28.2% 2.69 6.67<200 <75 50.0% 166 58.9% -- 5.80
-- 93 45.6% -- -- --
Solids% Retain
PCBs (ppm) % Solids
TOC (mg/kg)
Specific Gravity pH
-- -- -- 490 33.0% 85,000 -- --10 2,000 0.1% 1,460 86.3% -- 5.2620 850 0.4% 1,720 86.8% -- 5.1740 425 1.3% 1,600 81.9% 5.2060 250 2.1% 1,399 81.4% 5.3180 180 2.0% 843 73.3% 5.30
100 150 1.4% 505 65.7% 5.41200 75 9.9% 306 52.8% 2.52 5.60<200 <75 82.8% 465 59.5% -- 2.39 5.73
-- 498 60.1% -- -- --
General Electric Company
Phase 1 Intermediate Design Report
Exhibit G.2.2 - Size Separation Summary
Hudson River PCBs Superfund Site
S4B
160,0001.78
2.16
H1S2
20,000
S3
20,000
2.35
Weighted Avg.
Sieve Number
Particle Size (µm)
Weighted Avg.
Sieve Number
Particle Size (µm)
Weighted Avg.
Sieve Number
Particle Size (µm)
5,300
Weighted Avg.
H1S1Sieve
NumberParticle
Size (µm)
Page 1 of 1
Date: 8/19/04, 8/20/04, 10/08/04, 10/28/04
Target Measuredgpm % solids
SpG (gm/mL)
Solids (gm/L)
PCB (mg/kg)
Solids Flux (gm/min)
PCB Flux (gm/min) gpm % solids
SpG (gm/mL)
Solids (gm/L)
PCB (mg/kg)
Solids Flux (gm/min)
PCB Flux (gm/min) gpm % solids
SpG (gm/mL)
Solids (gm/L)
PCB (mg/kg)
Solids Flux (gm/min)
PCB Flux (gm/min)
Solids O/F % of OUT
Solids U/F % of OUT
PCB O/F % of OUT
PCB U/F % of OUT
S4 10 D4B 1 Y N/A 5 5 +/- 0.5 25.8 4.60 2.59 47.3 244.3 4,628 1.13 24.8 1.65 2.59 16.67 790 1565 1.24 1.0 14.1 2.59 154.8339 1,019 604 0.62 4,628 2,169 72.2% 27.8% 1.13 1.85 66.8% 33.2%S4 10 D4B 1 Y N/A 10 10 +/- 0.5 33.4 4.60 2.59 47.3 244.3 5,976 1.46 32.4 0.37 2.59 3.71 4105 455 1.87 1.0 13.0 2.59 141.8402 1,128 511 0.58 5,976 965 47.1% 52.9% 1.46 2.44 76.4% 23.6%S4 10 D6B 3 Y 1.25 5 5 +/- 0.5 55.5 4.60 2.59 47.3 244.3 9,944 2.43 45.5 2.19 2.59 22.20 720 3823 2.75 10.0 16.4 2.59 182.1671 393 6,895 2.71 9,944 10,718 35.7% 64.3% 2.43 5.46 50.4% 49.6%S4 10 D6B 3 Y 1.25 10 10 +/- 0.5 72.0 4.60 2.59 47.3 244.3 12,900 3.15 61.0 1.98 2.59 20.04 730 4628 3.38 11.0 13.1 2.59 142.3209 685 5,926 4.06 12,900 10,553 43.9% 56.1% 3.15 7.44 45.4% 54.6%S4 10 D6B 3 Y 0.75 5 5 +/- 0.5 50.1 4.60 2.59 47.3 244.3 8,976 2.19 46.0 2.38 2.59 24.15 660 4205 2.78 4.1 19.2 2.59 217.8309 200 3,380 0.68 8,976 7,586 55.4% 44.6% 2.19 3.45 80.4% 19.6%S4 10 D6B 3 Y 0.75 10 10 +/- 0.5 73.3 4.60 2.59 47.3 244.3 13,133 3.21 67.0 1.85 2.59 18.71 710 4745 3.37 6.3 16.0 2.59 177.671 207 4,237 0.88 13,133 8,982 52.8% 47.2% 3.21 4.25 79.4% 20.6%S4 10 D6B 2.25 Y 0.75 5 5 +/- 0.5 41.7 4.60 2.59 47.3 244.3 7,474 1.83 41.0 1.7 2.59 17.18 750 2666 2.00 0.7 34.0 2.59 429.1057 331 1,159 0.38 7,474 3,825 69.7% 30.3% 1.83 2.38 83.9% 16.1%S4 10 D6B 2.25 Y 0.75 10 10 +/- 0.5 61.5 4.60 2.59 47.3 244.3 11,024 2.69 60.5 2.74 2.59 27.87 700 6382 4.47 1.0 30.8 2.59 379.1047 316 1,479 0.47 11,024 7,860 81.2% 18.8% 2.69 4.93 90.5% 9.5%S4 10 D6B 2.25 N 0.75 5 5 +/- 0.5 41.6 4.60 2.59 47.3 244.3 7,460 1.82 41.0 3.03 2.59 30.87 428 4791 2.05 0.6 49.7 2.59 714.4929 42 1,715 0.07 7,460 6,506 73.6% 26.4% 1.82 2.12 96.6% 3.4%S4 10 D6B 2.25 N 0.75 10 10 +/- 0.5 41.6 4.60 2.59 47.3 244.3 7,460 1.82 41.0 3.14 2.59 32.02 474 4969 2.36 0.6 29.7 2.59 362.564 192 870 0.17 7,460 5,839 85.1% 14.9% 1.82 2.52 93.4% 6.6%S4 10 D6B 3 N 0.75 5 5 +/- 0.5 41.6 4.60 2.59 47.3 244.3 7,460 1.82 41.0 2.97 2.59 30.25 483 4695 2.27 0.6 33.2 2.59 416.7769 90 1,000 0.09 7,460 5,695 82.4% 17.6% 1.82 2.36 96.2% 3.8%S4 10 D6B 3 N 0.75 10 10 +/- 0.5 66.1 4.60 2.59 47.3 244.3 11,843 2.89 60.0 3.61 2.59 36.92 443 8384 3.71 6.1 7.3 2.59 76.46036 399 1,765 0.70 11,843 10,149 82.6% 17.4% 2.89 4.42 84.1% 15.9%S4 10 D6B 3 N 0.75 10 10 +/- 0.5 66.1 4.60 2.59 47.3 244.3 11,843 2.89 60.0 2.89 2.59 29.42 327 6682 2.18 6.1 12.7 2.59 137.5148 109 3,175 0.35 11,843 9,857 67.8% 32.2% 2.89 2.53 86.3% 13.7%
65.3%S4 15 D4B 1 Y N/A 5 5 +/- 0.5 22.1 10.17 2.59 108.4 244.3 9,061 2.21 20.0 4.31 2.59 44.3 600 3347 2.01 2.1 21.1 2.59 242.5419 852 1,946 1.66 9,061 5,293 63.2% 36.8% 2.21 3.67 54.8% 45.2%S4 15 D4B 1 Y N/A 10 10 +/- 0.5 34.9 10.17 2.59 108.4 244.3 14,309 3.50 32.7 3.67 2.59 37.5 610 4636 2.83 2.2 21.6 2.59 249.6283 971 2,088 2.03 14,309 6,724 68.9% 31.1% 3.50 4.85 58.2% 41.8%S4 15 D6B 3 N 0.75 5 5 +/- 0.5 44.4 10.17 2.59 108.4 244.3 18,211 4.45 39.1 7.11 2.59 74.3 536 10996 5.89 5.3 29.3 2.59 357.6883 136 7,148 0.97 18,211 18,144 60.6% 39.4% 4.45 6.86 85.9% 14.1%S4 15 D6B 3 N 0.75 10 10 +/- 0.5 68.7 10.17 2.59 108.4 244.3 28,179 6.88 60.8 7.89 2.59 82.9 650 19062 12.39 7.9 24.3 2.59 285.8519 149 8,569 1.28 28,179 27,631 69.0% 31.0% 6.88 13.67 90.6% 9.4%S4 15 D6B 3 Y 0.75 5 5 +/- 0.5 44.5 10.17 2.59 108.4 244.3 18,261 4.46 36.2 7.28 2.59 76.2 545 10426 5.68 8.4 21.9 2.59 253.5302 112 8,013 0.90 18,261 18,439 56.5% 43.5% 4.46 6.58 86.3% 13.7%S4 15 D6B 3 Y 0.75 10 10 +/- 0.5 71.7 10.17 2.59 108.4 244.3 29,402 7.18 58.0 6.55 2.59 68.2 546 14982 8.18 13.6 32.4 2.59 403.9425 268 20,809 5.58 29,402 35,791 41.9% 58.1% 7.18 13.76 59.4% 40.6%S4 15 D6B 2.25 Y 0.75 5 5 +/- 0.5 39.7 10.17 2.59 108.4 244.3 16,275 3.98 35.9 5.19 2.59 53.6 389 7277 2.83 3.8 31.2 2.59 386.6547 186 5,547 1.03 16,275 12,824 56.7% 43.3% 3.98 3.87 73.2% 26.8%S4 15 D6B 2.25 Y 0.75 10 10 +/- 0.5 59.5 10.17 2.59 108.4 244.3 24,404 5.96 54.4 7.10 2.59 74.2 447 15275 6.83 5.1 42.4 2.59 573.3789 104 11,025 1.15 24,404 26,300 58.1% 41.9% 5.96 7.98 85.6% 14.4%S4 15 D6B 2.25 Y 1.25 5 5 +/- 0.5 43.8 10.17 2.59 108.4 244.3 17,953 4.39 36.9 4.64 2.59 47.8 491 6672 3.28 6.9 36.0 2.59 462.9497 176 12,038 2.12 17,953 18,710 35.7% 64.3% 4.39 5.40 60.7% 39.3%S4 15 D6B 2.25 Y 1.25 10 10 +/- 0.5 52.6 10.17 2.59 108.4 244.3 21,585 5.27 43.9 5.68 2.59 58.9 458 9794 4.49 8.7 20.8 2.59 238.1664 478 7,816 3.73 21,585 17,609 55.6% 44.4% 5.27 8.22 54.6% 45.4%S4 15 D6B 2.25 N 0.75 5 5 +/- 0.5 34.5 10.17 2.59 108.4 244.3 14,145 3.46 33.1 4.64 2.59 47.8 470 5987 2.81 1.4 38.0 2.59 495.9375 49 2,590 0.13 14,145 8,577 69.8% 30.2% 3.46 2.94 95.7% 4.3%S4 15 D6B 2.25 N 0.75 5 5 +/- 0.5 34.5 10.17 2.59 108.4 244.3 14,145 3.46 33.1 5.06 2.59 52.2 600 6538 3.92 1.4 52.4 2.59 771.4948 29 4,030 0.12 14,145 10,568 61.9% 38.1% 3.46 4.04 97.1% 2.9%S4 15 D6B 2.25 N 0.75 10 10 +/- 0.5 49.2 10.17 2.59 108.4 244.3 20,198 4.93 47.3 3.77 2.59 38.6 495 6906 3.42 2.0 49.9 2.59 720.3216 44 5,317 0.23 20,198 12,223 56.5% 43.5% 4.93 3.65 93.6% 6.4%S4 15 D6B 2.25 N 0.75 10 10 +/- 0.5 49.2 10.17 2.59 108.4 244.3 20,198 4.93 47.3 4.63 2.59 47.7 558 8534 4.76 2.0 49.5 2.59 710.5304 207 5,244 1.09 20,198 13,779 61.9% 38.1% 4.93 5.85 81.4% 18.6%S4 15 D6B 1 Y N/A 2 2 +/- 0.5 52.8 10.17 2.59 108.4 244.3 21,650 5.29 50.3 3.29 2.59 33.6 497 6393 3.18 2.5 29.3 2.59 357.205 620 3,367 2.09 21,650 9,760 65.5% 34.5% 5.29 5.26 60.4% 39.6%S4 15 D6B 3 N N/A 15 15 +/- 0.5 92.6 10.17 2.59 108.4 244.3 37,978 9.28 74.7 3.88 2.59 39.7 557 11222 6.25 17.9 32.2 2.59 401.501 284 27,157 7.72 37,978 38,378 29.2% 70.8% 9.28 13.97 44.8% 55.2%
56.9%
Date: 12/15/2004; 12/16/2004
gpm % solidsSpG
(gm/mL)Solids (gm/L)
PCB (mg/kg)
Solids Flux (gm/min)
PCB Flux (gm/min) gpm % solids
SpG (gm/mL)
Solids (gm/L)
PCB (mg/kg)
Solids Flux (gm/min)
PCB Flux (gm/min) gpm % solids
SpG (gm/mL)
Solids (gm/L)
PCB (mg/kg)
Solids Flux (gm/min)
PCB Flux (gm/min)
Solids O/F % of OUT
Solids U/F % of OUT
PCB O/F % of OUT
PCB U/F % of OUT
S2-2 25 D6B w/ 2.25 " no 1.25 " 10 -2 140.0 22.4 2.59 259.7 33.9 137,623 4.67 120 5.07 2.59 52.30 47.7 23,755 1.13 20.0 66.0 2.59 1,110 18.7 83,994 1.57 137,623 107,749 22.0% 78.0% 4.67 2.70 41.9% 58.1%S2-2 25 D6B w/ 2.25" no 1.25 " 10 -2 132.5 26.8 2.59 320.8 54.2 160,873 8.72 115 5.25 2.59 54.20 78.0 23,592 1.84 17.5 73.4 2.59 1,336 30.2 88,494 2.67 160,873 112,086 21.0% 79.0% 8.72 4.51 40.8% 59.2%S2-2 25 D6B w/o 2.25" no 3/4 " 10 0 116.5 21.6 2.59 249.0 56.0 109,806 6.15 110 6.30 2.59 65.50 77.0 27,271 2.10 6.5 65.4 2.59 1,093 85.0 26,884 2.29 109,806 54,154 50.4% 49.6% 6.15 4.38 47.9% 52.1%S2-2 15 D6B w/ 2.25" no 1.25 " 10 -2 137.0 16.0 2.59 177.4 31.4 92,004 2.89 122 3.02 2.59 30.80 100 14,223 1.42 15.0 64.0 2.59 1,054 21.0 59,851 1.26 92,004 74,074 19.2% 80.8% 2.89 2.68 53.1% 46.9%S2-2 15 D6B w/ 2.25" no 1.25 " 10 -2 135.0 18.6 2.59 210.0 29.0 107,293 3.11 119 3.20 2.59 32.60 254 14,684 3.73 16.0 73.9 2.59 1,353 27.9 81,918 2.29 107,293 96,601 15.2% 84.8% 3.11 6.02 62.0% 38.0%S3-4 25 D6B w/ 2.25" no 1.25 " 10 -2 112.5 26.7 2.59 319.3 25.0 135,981 3.40 93 11.09 2.59 119.00 155 41,889 6.49 19.5 70.3 2.59 1,237 17.2 91,281 1.57 135,981 133,169 31.5% 68.5% 3.40 8.06 80.5% 19.5%S3-4 25 D6B w/ 2.25" no 1.25 " 10 -2 125.0 26.5 2.59 316.5 35.9 149,738 5.38 104 10.39 2.59 111.00 166 43,694 7.25 21.0 70.0 2.59 1,227 14.9 97,567 1.45 149,738 141,261 30.9% 69.1% 5.38 8.71 83.3% 16.7%S3-4 25 D6B w/o 2.25" no 3/4 " 10 0 103.5 26.4 2.59 315.1 67.1 123,425 8.28 99 18.21 2.59 205.00 37.8 76,817 2.90 4.5 65.7 2.59 1,101 12.4 18,755 0.23 123,425 95,571 80.4% 19.6% 8.28 3.14 92.6% 7.4%S3-4 15 D6B w/ 2.25 " no 1.25 " 10 -2 127.5 22.0 2.59 254.4 26.9 122,747 3.30 111 4.18 2.59 42.90 133 18,024 2.40 16.5 68.6 2.59 1,185 14.2 74,011 1.05 122,747 92,035 19.6% 80.4% 3.30 3.45 69.5% 30.5%S3-4 15 D6B w/ 2.25" no 1.25 " 10 -2 138.5 18.9 2.59 213.8 24.1 112,083 2.70 125 4.72 2.59 48.60 252 22,994 5.79 13.5 68.7 2.59 1,188 20.4 60,707 1.24 112,083 83,701 27.5% 72.5% 2.70 7.03 82.4% 17.6%
General Electric CompanyHudson River PCBs Superfund SitePhase 1 Intermediate Design Report
Exhibit G.2.3 - Hydrocyclone Test Matrix
PCB Flux OUT
(gm/min)
Overflow Vacuum (" Hg)
Solids Flux IN (gm/min)
Solids Flux OUT
(gm/min)
PCB Flux IN
(gm/min)
Feed Pressure (psi)
PCB Flux IN
(gm/min)
PCB Flux OUT
(gm/min)
Solids Flux OUT
(gm/min)
Feed Pressure
(psi) Solids Flux IN (gm/min)
Sed. TypeTarget
% Solids (w/w)
CycloneVortex Finder
Overflow Underflow
Underflow - TotalOverflowTrunc'd Cone
CycloneSed. Type
Feed
FeedTarget % Solids
(w/w)
Vortex Finder
Cylinder
CylinderApex
Diameter
Page 1 of 1

Stream Number 103 402 501 106 305 391 490 590
Description Dredge Slurry
Decon Water
Storm Water Oversize
Cake Load-out
Coarse Load-out
Process Effl Storm Effl
Tot. mass (wet T/d) 6,620 150 6,685 321 2,139 2,617 2,088 6,290Solids mass (dry T/d) 3,656 0.752 33.4 289 1,176 2,224 0.0063 0.0189 3,690 3,689Solids (%) 55.2 0.50 0.50 90.0 55.0 85.0 0.0003 0.0003Uptime (%) 100 100 100 67 100 100 100 100Operating flow (gpm) 724 25 1,111 35 234 205 348 1,049PCB mass (dry T/d) 0.329 0.00007 0.0030 0.010 0.285 0.037 0.0000001 0.0000004 0.332 0.332PCB conc (mg/kg S) 90 90 90 35 242 17 222 213PCB conc (mg/L) 76 0.45 0.45 48 203 30 0.00007 0.00006Solids (mg/L) 5,011 5,012 3.0 3.0
Note: Dredging at 4,300 cy/d; S2/S3 sediment type.
General Electric CompanyHudson River PCBs Superfund SitePhase 1 Intermediate Design Report
Exhibit G.2.4 - PCB and Solids Balance
INPUTS OUTPUTS
Mass In (dry T/d)
Mass Out (dry T/d)
Page 1 of 1

Initial 24 hr 48 hr 72 hr 24 hr 48 hr 72 hr
H1S1-01 Coarse
1.0 kg7/13/04
0930 JL
78.70 85.82 86.22 86.79 0 0 0
H1S2-01 Coarse
1.0 kg7/13/04
0935 JL
70.60 73.62 72.91 73.63 6.3 0 0
S4-HC-15-UF
1.0 kg8/30/04
1400SC
41.83 77.36 77.06 73.5 345 9 4
General Electric CompanyHudson River PCBs Superfund SitePhase 1 Intermediate Design Report
Exhibit G.2.5 - Coarse Fraction Drainage Data Sheet
Collected Water Volume (mL)% Solids Concentration (w/w)Slurry ID
SampleWeight
Date/Time/Initials
Page 1 of 1

Exhibit G.3
Includes: Slurry Pumps from Hydrocyclones
Dredge Slurry Holding Tanks Gravity Thickeners
Dredge Slurry Holding Tank Transfer Pump Dewatering Conditioning Tanks
Thickener Sludge Pumps Polymer Addition to Thickeners
Polymer Addition to Filter Presses Filter Press Feed Pumps
Filter Presses Recycle Water Equalization Tank

Exhibit G.3.1
Thickening and Dewatering Design Calculations

Slurry Pumps from Hydrocyclones


Dredge Slurry Holding Tanks


Gravity Thickeners


Dredge Slurry Holding Tank Transfer Pumps


Dewatering Conditioning Tanks


Thickener Sludge Pumps


Polymer Addition to Thickeners


Polymer Addition to Filter Presses


Filter Press Feed Pumps


Filter Presses


Recycle Water Equalization Tank


General Electric CompanyHudson River PCBs Superfund SitePhase 1 Intermediate Design Report
Exhibit G.3.2a - Thickening with Polymer Coagulant
S2-2-07 <#200 (15%), 3.24% wt. solids, Dev E
Time, minutes
0 5 10 15 20 1440
Mud
line
heig
ht, c
m
0
5
10
15
20
50 ppm100 ppm150 ppm200 ppm400 ppm600 ppm
Page 1 of 1

General Electric CompanyHudson River PCBs Superfund SitePhase 1 Intermediate Design Report
Exhibit G.3.2b - Thickening with Polymer Treatment
2.51% wt. solids initial
Time, minutes
0 2 4 6 8 10 12 14 1440
Mud
line
heig
ht, c
m
0
10
20
30
40
50
61 ppm Dev E, 15.2 AE111561 ppm Dev E, 30.4 AE1115121 ppm Dev E, 15.2 AE1115121 ppm Dev E, 30.4 AE1115
4.01% wt. solids initial
Time, minutes
0 10 20 30 40 50 1440M
udlin
e he
ight
, cm
0
10
20
30
40
50
123 ppm Dev E, 30.8 AE1115123 ppm Dev E, 61.5 AE1115246 ppm Dev E, 30.8 AE1115246 ppm Dev E, 30.8 AE1115
6.20% wt. solids initial
Time, minutes
0 15 30 45 60 75 90 105 1440
Mud
line
heig
ht, c
m
0
10
20
30
40
50
187 ppm Dev E, 46.7 AE1115187 ppm Dev E, 93.4 AE1115374 ppm Dev E, 46.7 AE1115374 ppm Dev E, 93.4 AE1115
8.56% wt. solids initial
Time, minutes
0 30 60 90 120 1440
Mud
line
heig
ht, c
m
0
10
20
30
40
50
252 ppm Dev E, 63.1AE1115252 ppm Dev E, 126 AE1115505 ppm Dev E, 63.1 AE1115505 ppm Dev E, 126 AE1115
Page 1 of 1

Sample initial % wt. initial density Time Interface height Settled volume Settled density % wt.solids s.g. h in. in.3 s.g. solids
H2S4B 4.33 1.03 0.0 77.3 8737 1.03 4.34.33 1.03 0.5 64.0 7238 1.03 5.24.33 1.03 1.0 55.0 6220 1.04 6.04.33 1.03 2.0 40.5 4580 1.05 8.14.33 1.03 8.0 22.3 2516 1.10 14.14.33 1.03 24.0 17.3 1951 1.12 17.7
H2S3 1.8 1.01 No interface observed
H2S2 1.16 1.01 No interface observed
H1S3 10.41 1.07 0.0 79.0 8935 1.07 10.410.41 1.07 1.0 79.0 8935 1.07 10.410.41 1.07 2.0 79.0 8935 1.07 10.410.41 1.07 5.2 45.8 5174 1.12 17.210.41 1.07 8.0 41.8 4722 1.13 18.610.41 1.07 24.0 36.0 4072 1.15 21.2
H1S2 9.66 1.06 0.0 79.0 8935 1.06 9.79.66 1.06 0.8 75.3 8511 1.07 10.19.66 1.06 1.0 74.0 8369 1.07 10.39.66 1.06 1.7 69.5 7860 1.07 10.99.66 1.06 2.0 67.3 7606 1.08 11.29.66 1.06 2.7 64.5 7295 1.08 11.79.66 1.06 4.1 58.3 6588 1.09 12.89.66 1.06 8.0 46.5 5259 1.11 15.79.66 1.06 24.0 36.8 4156 1.14 19.4
H1S1 3.24 1.02 0.0 78.8 8906 1.02 3.23.24 1.02 0.5 15.0 1696 1.11 15.73.24 1.02 1.0 10.0 1131 1.16 22.43.24 1.02 2.0 8.0 905 1.20 27.13.24 1.02 8.0 6.5 735 1.25 32.13.24 1.02 24.0 5.5 622 1.29 36.6
2.65 solids s.g. 12 in. dia 113 in.2Note: No polymers were used in these tests.
Exhibit G.3.3 - Primary Settling Column Results
General Electric CompanyHudson River PCBs Superfund SitePhase 1 Intermediate Design Report
0.0
10.0
20.0
30.0
40.0
50.0
60.0
70.0
80.0
90.0
0.0 5.0 10.0 15.0 20.0 25.0 30.0
Time (hrs)
Set
tled
Hei
gh
t (i
n.)
H2S4BH1S3H1S2H1S1
Page 1 of 1

Exhibit G.3.4 - Filter Press Polymer Screening Results
General Electric CompanyHudson River PCBs Superfund SitePhase 1 Intermediate Design Report
Bench Press - H1S1
40
45
50
55
60
65
70
0 1 2 3 4 5 6
Dosage (#/dry T)
Cak
e so
lids
(% w
/w)
62675712244050Dev. E
Bench Press - H1S4B
40
45
50
55
60
65
70
0 1 2 3 4 5 6 7 8
Dosage (#/dry T)
Cak
e so
lids
(% w
/w)
Dev. E12246267576244050
Bench Press - H1S3 Settled
40
45
50
55
60
65
70
0 2 4 6 8
Dosage (#/dry T)
Cak
e so
lids
(% w
/w)
1198Dev. E6267571198
Bench Press - H1S3
40
45
50
55
60
65
70
0 1 2 3 4 5 6 7 8
Dosage (#/dry T)
Cak
e so
lids
(% w
/w)
Dev. E12246247574275
Bench Press - H1S1
0
0.041666667
0.083333333
0.125
0.166666667
0.208333333
0 1 2 3 4 5 6
Dosage (#/dry T)
Buc
hner
Fun
nel T
ime
to F
ilter
50%
(m
in)
62675712244050Dev. E
Bench Press - H1S3 Settled
0:00
2:00
4:00
6:00
8:00
10:00
12:00
14:00
16:00
18:00
20:00
0 2 4 6 8
Dosage (#/dry T)
Buc
hner
Fun
nel T
ime
to F
ilter
50%
(m
in)
1198Dev. E6267571198
Bench Press - H1S3
0:00
2:00
4:00
6:00
8:00
10:00
12:00
14:00
16:00
18:00
20:00
0 1 2 3 4 5 6 7 8
Dosage (#/dry T)
Buc
hner
Fun
nel T
ime
to F
ilter
50%
(m
in)
Dev. E12246247574275
Bench Press - H1S4B
0:00
2:00
4:00
6:00
8:00
10:00
12:00
14:00
16:00
18:00
20:00
0 1 2 3 4 5 6 7 8
Dosage (#/dry T)
Buc
hner
Fun
nel T
ime
to F
ilter
50%
(m
in)
Dev. E12246267576244050
Bench Press - H1S1
300
400
500
600
700
800
900
0 1 2 3 4 5 6
Dosage (#/dry T)
Filte
r P
ress
Tot
al F
iltra
te V
olum
e (m
L)
62675712244050Dev. E
Bench Press - H1S3 Settled
100
110
120
130
140
150
160
170
180
190
200
0 2 4 6 8
Dosage (#/dry T)
Filte
r P
ress
Tot
al F
iltra
te V
olum
e (m
L)
1198Dev. E6267571198
Bench Press - H1S3
200
220
240
260
280
300
320
340
360
380
400
0 1 2 3 4 5 6 7 8
Dosage (#/dry T)
Filte
r P
ress
Tot
al F
iltra
te V
olum
e (m
L)
Dev. E12246247574275
Bench Press - H1S4B
100
110
120
130
140
150
160
170
180
190
200
0 1 2 3 4 5 6 7 8
Dosage (#/dry T)
Filte
r P
ress
Tot
al F
iltra
te V
olum
e (m
L)
Dev. E12246267576244050
Page 1 of 1
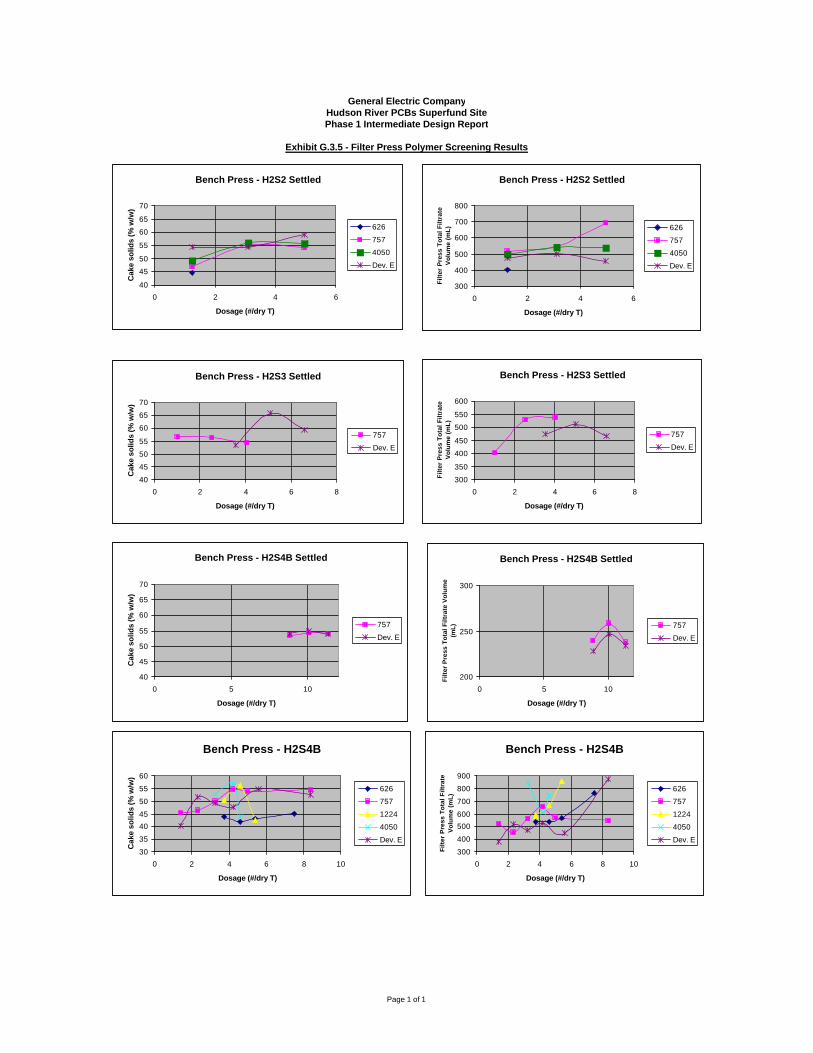
Exhibit G.3.5 - Filter Press Polymer Screening Results
General Electric CompanyHudson River PCBs Superfund SitePhase 1 Intermediate Design Report
Bench Press - H2S2 Settled
40
45
50
55
60
65
70
0 2 4 6
Dosage (#/dry T)
Cak
e so
lids
(% w
/w)
626
757
4050
Dev. E
Bench Press - H2S2 Settled
300
400
500
600
700
800
0 2 4 6
Dosage (#/dry T)
Filt
er P
ress
To
tal F
iltra
te
Vo
lum
e (m
L) 626
757
4050
Dev. E
Bench Press - H2S3 Settled
40
45
50
55
60
65
70
0 2 4 6 8
Dosage (#/dry T)
Cak
e so
lids
(% w
/w)
757
Dev. E
Bench Press - H2S4B
30
35
40
45
50
55
60
0 2 4 6 8 10
Dosage (#/dry T)
Cak
e so
lids
(% w
/w)
626
757
1224
4050
Dev. E
Bench Press - H2S3 Settled
300
350
400
450
500
550
600
0 2 4 6 8
Dosage (#/dry T)
Filt
er P
ress
To
tal F
iltra
te
Vo
lum
e (m
L)
757
Dev. E
Bench Press - H2S4B
300
400
500
600
700
800
900
0 2 4 6 8 10
Dosage (#/dry T)
Filt
er P
ress
To
tal F
iltra
te
Vo
lum
e (m
L)
626
757
1224
4050
Dev. E
Bench Press - H2S4B Settled
40
45
50
55
60
65
70
0 5 10
Dosage (#/dry T)
Cak
e so
lids
(% w
/w)
757
Dev. E
Bench Press - H2S4B Settled
200
250
300
0 5 10
Dosage (#/dry T)
Filt
er P
ress
To
tal F
iltra
te V
olu
me
(mL) 757
Dev. E
Page 1 of 1

Feed Polymer Polymer Polymer Cake Total Press Time Pressure
%Solids IDDose (ppm) (lb/dryT) %Solids (min) (psi) Cake Quality
1 BFP-9 H1S3 Set. Solids S3 23.07 1198 400 2.98 59.38 45 100 Fair1 BFP-10 H1S3 Set. Solids S3 23.07 1198 500 3.73 60.03 60 100 Good 1 BFP-11 H1S3 Set. Solids S3 23.07 1198 600 4.47 59.12 60 100 Good 1 BFP-12 H1S3 Set. Solids S3 23.07 Dev. E 400 2.98 60.73 60 100 Good 1 BFP-13 H1S3 Set. Solids S3 23.07 Dev. E 500 3.73 59.72 60 100 Very good, no blinding 1 BFP-14 H1S3 Set. Solids S3 23.07 Dev. E 600 4.47 59.16 60 100 good, no blinding1 BFP-15 H1S3 Set. Solids S3 23.07 626 400 2.98 62.08 60 100 Very good1 BFP-16 H1S3 Set. Solids S3 23.07 626 500 3.73 60.11 60 100 Good, no blinding1 BFP-17 H1S3 Set. Solids S3 23.07 626 600 4.47 60.21 60 100 fair1 BFP-18 H1S3 Set. Solids S3 23.07 757 400 2.98 61.24 60 100 very good, no blinding1 BFP-19 H1S3 Set. Solids S3 23.07 757 500 3.73 60.87 60 100 very good, no blinding1 BFP-20 H1S3 Set. Solids S3 23.07 757 600 4.47 59.79 60 100 good, no blinding1 BFP-21 H1S4B-01 S4 24.97 Dev. E 700 4.76 57.59 60 100 good, no blinding1 BFP-22 H1S4B-02 S4 24.97 Dev. E 800 5.44 58.84 60 100 very good, very slight blinding1 BFP-23 H1S4B-03 S4 24.97 Dev. E 900 6.12 57.4 60 100 very good, very slight blinding1 BFP-24 H1S4B-02 S4 25.29 1224 700 4.69 57.57 60 100 good, no blinding1 BFP-25 H1S4B-02 S4 25.29 1224 800 5.36 56.94 60 100 good, slight blinding1 BFP-26 H1S4B-02 S4 25.29 1224 900 6.03 57.94 60 100 very good, no blinding1 BFP-27 H1S4B-02 S4 25.29 626 700 4.69 58.23 60 100 very good, very slight blinding1 BFP-28 H1S4B-02 S4 25.29 626 800 5.36 57.95 60 100 very good, slight blinding1 BFP-29 H1S4B-02 S4 25.29 626 900 6.03 56.91 60 100 good, no blinding1 BFP-30 H1S4B-02 S4 25.29 757 700 4.69 58.27 60 100 very good, very slight blinding1 BFP-31 H1S4B-02 S4 25.29 757 800 5.36 56.74 60 100 very good, very slight blinding1 BFP-32 H1S4B-02 S4 25.29 757 900 6.03 57.05 60 100 very good, very slight blinding1 BFP-33 H1S4B-02 S4 25.29 624 800 5.36 58.26 60 100 OK, stained, no blinding1 BFP-34 H1S4B-02 S4 25.29 4050 600 4.02 58.67 60 100 very good, no blinding1 BFP-35 H1S4B-02 S4 25.29 4050 700 4.69 58.08 60 100 very good, no blinding1 BFP-36 H1S4B-02 S4 25.29 4050 800 5.36 57.59 60 100 very good, slight blinding1 BFP-37 H1S3-04 S3 13.42 Dev. E 300 4.11 54.06 60 100 fair, OK - slight blinding1 BFP-38 H1S3-04 S3 13.42 Dev. E 400 5.48 64.56 60 100 very good, very slight blinding1 BFP-39 H1S3-04 S3 13.42 Dev. E 500 6.85 61.25 60 100 very good, very slight blinding1 BFP-40 H1S3-04 S3 13.42 1224 300 4.11 59.13 60 100 good, slight blinding in lower half1 BFP-41 H1S3-04 S3 13.42 1224 400 5.48 63.11 60 100 good, very slight blinding1 BFP-42 H1S3-04 S3 13.42 1224 500 6.85 64.23 60 100 very good, no blinding1 BFP-43 H1S3-04 S3 13.42 624 300 4.11 59.27 60 100 very good, slight blinding1 BFP-44 H1S3-04 S3 13.42 624 400 5.48 45.05 60 100 OK, slight blinding on bottom half1 BFP-45 H1S3-04 S3 13.42 624 500 6.85 60.18 60 100 excellent, no blinding1 BFP-46 H1S3-04 S3 13.42 757 300 4.11 67.45 60 100 very good, slight blinding1 BFP-47 H1S3-04 S3 13.42 757 400 5.48 68.69 60 100 good, slight sticking, slight blinding1 BFP-48 H1S3-04 S3 13.42 757 500 6.85 61.96 60 100 very good, slight blinding1 BFP-49 H1S3-04 S3 13.42 4275 300 4.11 69.64 60 100 good, some sticking, slight blinding1 BFP-50 H1S3-04 S3 13.42 4275 400 5.48 68 60 100 very good, no blinding1 BFP-51 H1S3-04 S3 13.42 4275 500 6.85 68.73 60 100 good, just slight blinding on bottom1 BFP-52 H1S1-08 S1 4.09 1224 60 2.86 67.89 60 100 very good, 30% blinded1 BFP-53 H1S1-08 S1 4.09 1224 80 3.81 64.8 60 100 good release, 50% blinded1 BFP-54 H1S1-08 S1 4.09 1224 100 4.77 65.97 60 100 good, 30% blinded1 BFP-55 H1S1-08 S1 4.09 757 60 2.86 67.92 60 100 good, moderate blinding1 BFP-56 H1S1-08 S1 4.09 757 80 3.81 65.06 60 100 good, 40% blinding1 BFP-57 H1S1-08 S1 4.09 757 100 4.77 64.5 60 100 very good, 40% blinding1 BFP-58 H1S1-08 S1 4.09 Dev. E 60 2.86 64.92 60 100 good, 30% blinding1 BFP-59 H1S1-09 S1 4.64 Dev. E 80 3.35 62.9 60 100 good, blinding1 BFP-60 H1S1-10 S1 4.83 Dev. E 100 4.02 62.31 60 100 good, some blinding1 BFP-61 H1S1-10 S1 4.83 626 60 2.41 66.98 60 100 very good, very slight blinding1 BFP-62 H1S1-10 S1 4.83 626 80 3.22 66.83 60 100 good, some blinding1 BFP-63 H1S1-10 S1 4.83 626 100 4.02 64.09 60 100 good, slight blinding1 BFP-64 H1S1-10 S1 4.83 4050 60 2.41 65.96 60 100 good, slight blinding1 BFP-65 H1S1-10 S1 4.83 4050 80 3.22 65.96 60 100 good, very slight blinding1 BFP-66 H1S1-10 S1 4.83 4050 100 4.02 66.77 60 100 good, very slight blinding1 BFP-67 H1S2-05 S2 8.46 624 300 6.73 37.92 60 100 good, some blinding1 BFP-68 H1S2-05 S2 8.46 627 300 6.73 47.57 60 100 good, slight blinding1 BFP-69 H1S2-05 S2 8.46 Dev. E 300 6.73 46.74 60 100 good, some blinding1 BFP-70 H1S2-05 S2 8.46 1224 300 6.73 55.33 60 100 very good1 BFP-71 H1S2-05 S2 8.46 757 300 6.73 57.64 60 100 very good, no blinding1 BFP-72 H1S2-05 S2 8.46 4050 300 6.73 58.45 60 100 very good, no blinding1 BFP-73 H1S2-05 S2 8.46 1198 300 6.73 57.2 60 100 very good, no blinding1 BFP-74 H1S2-06 S2 8.38 627 EX 300 6.80 60.4 60 100 very good, very slight blinding1 BFP-75 H1S2-06 S2 8.38 626 300 6.80 52.88 60 100 very good, no blinding1 BFP-76 H1S2-06 S2 8.38 758 300 6.80 50.91 60 100 good, slight blinding1 BFP-77 H1S3-06 S3 12.97 644 6000 85.25 64.29 60 100 firm1 BFP-78 H1S3-06 S3 12.97 644+4884 4,000 of each 62.98 50 100 Fair, somewhat soft
Scale Test ID Slurry ID Matrix
Exhibit G.3.6 - Bench and Pilot Filter Press Results
Phase 1 Intermediate Design ReportHudson River PCBs Superfund Site
General Electric Company
Page 1 of 4

Feed Polymer Polymer Polymer Cake Total Press Time Pressure
%Solids IDDose (ppm) (lb/dryT) %Solids (min) (psi) Cake QualityScale Test ID Slurry ID Matrix
Exhibit G.3.6 - Bench and Pilot Filter Press Results
Phase 1 Intermediate Design ReportHudson River PCBs Superfund Site
General Electric Company
1 BFP-79 H1S3-06 S3 12.97 Dev. E 400 5.68 70.44 60 100 good, soft top1 BFP-79 Dup H1S3-06 S3 12.97 Dev. E 400 5.68 72.82, 71.68 60 100 v. good, v. sl. soft top, sandy1 BFP-80 H1S3-06 S3 12.97 Dev. E 400 5.68 72.75 60 100 v. good/excellent
1 BFP-81 H1S3-06 S3 12.97 Dev. E 400 5.68 72.73 60 100good, very sandy, not esp. solid in all spots
1 BFP-82 H1S3-06 S3 12.97 Dev. E 400 5.68 69.16 60 100 v. good, 1 BFP-83 H1S3-06 S3 12.97 Dev. E 400 5.68 67.06 60 100 excellent1 BFP-84 H1S3-06 S3 12.97 Dev. E 400 5.68 71.46 60 125 excellent1 BFP-85 H1S2-07 S2 8.53 757 300 6.67 55.6 60 100 good, small soft spot on top1 BFP-86 H1S2-07 S2 8.53 757 300 6.67 57.26 60 100 v. good, sl. soft top1 BFP-87 H1S2-07 S2 8.53 757 300 6.67 54.7 60 100 good, small soft spot on top1 BFP-88 H1S2-07 S2 8.53 757 300 6.67 59.24 60 100 very good, v.sl. Soft top
1 BFP-89 H1S2-07 S2 8.53 Dev. E 300 6.67NA - incomplete
cake60 125 Poor, incomplete
1 BFP-90 H1S2-07 S2 8.53 757 300 6.67 58.94 60 125 good, sl. soft top1 BFP-91 H1S2-08 S2 7.98 757 300 7.16 54.63 60 225 good, soft at top otherwise v. solid1 BFP-92 H1S2-08 S2 7.98 Dev. E 300 7.16 48.29 60 225 fair, soft top1 BFP-93 H1S2-08 S2 7.98 Dev. E 500 11.93 57.69 60 100 v. good, some blinding1 BFP-94 H1S2-08 S2 7.98 757 300 7.16 49.19 60 100 good, no blinding1 BFP-95 H1S2-08 S2 7.98 757 300 7.16 42.35 60 100 good, some blinding (~40%)1 BFP-96 H1S2-08 S2 7.98 757 300 7.16 43 60 100 good, some blinding (~40%)1 BFP-97 H1S2-08 S2 7.98 Dev. E 500 11.93 55.67 60 100 very good, some blinding1 BFP-98 H1S2-08 S2 7.98 Dev. E 500 11.93 52.25 60 100 good, some blinding (same as BFP-97)
1 BFP-99 H1S2-08 S2 7.98 Dev. E 500 11.93 51.8 60 100good, some blinding (same as BFP-97,98)
1 BFP-100 H2S2 Settled Solids S2 3.22 4050 20 1.22 49.16 60 100 good, no blinding1 BFP-101 H2S2 Settled Solids S2 3.22 4050 50 3.04 55.95 60 100 good, no blinding1 BFP-102 H2S2 Settled Solids S2 3.22 4050 80 4.87 55.75 60 100 good, no blinding, slight sticking1 BFP-103 H2S2 Settled Solids S2 3.22 757 20 1.22 46.9 60 100 good, no blinding1 BFP-104 H2S2 Settled Solids S2 3.22 757 50 3.04 55.35 60 100 good, no blinding1 BFP-105 H2S2 Settled Solids S2 3.22 757 80 4.87 54.13 60 100 good, very slight sticking, no blinding1 BFP-106 H2S2 Settled Solids S2 3.22 626 20 1.22 44.61 60 100 good, very slight blinding1 BFP-107 H2S2 Settled Solids S2 3.22 Dev. E 20 1.22 54.25 60 100 good, no blinding1 BFP-108 H2S2 Settled Solids S2 3.22 Dev. E 50 3.04 54.36 60 100 good, no blinding1 BFP-109 H2S2 Settled Solids S2 3.22 Dev. E 80 4.87 59.11 60 100 slight sticking, no blinding1 BFP-111 H2S3 Settled Solids S3 3.94 Dev. E 70 3.47 53.38 60 100 good, no blinding1 BFP-110 H2S3 Settled Solids S3 3.94 Dev. E 100 4.95 65.77 60 100 very good, no blinding1 BFP-112 H2S3 Settled Solids S3 3.94 Dev. E 130 6.44 59.35 60 100 very good, no blinding1 BFP-113 H2S3 Settled Solids S3 3.94 757 20 0.99 56.52 60 100 good, no blinding1 BFP-114 H2S3 Settled Solids S3 3.94 757 50 2.48 56.3 60 100 good, no blinding1 BFP-115 H2S3 Settled Solids S3 3.94 757 80 3.96 54.42 60 100 good, no blinding1 BFP-116 H2S4B Settled Solids S4 15.87 Dev. E 700 7.97 54.16 60 100 slight sticking, no blinding1 BFP-117 H2S4B Settled Solids S4 15.87 Dev. E 800 9.11 54.96 60 100 very good, no blinding1 BFP-118 H2S4B Settled Solids S4 15.87 Dev. E 900 10.25 53.82 60 100 good, very slight sticking, no blinding1 BFP-119 H2S4B Settled Solids S4 15.87 757 700 7.97 53.4 60 100 very good, no blinding1 BFP-120 H2S4B Settled Solids S4 15.87 757 800 9.11 54.22 60 100 very good, no blinding1 BFP-121 H2S4B Settled Solids S4 15.87 757 900 10.25 54.02 60 100 good release, no blinding1 BFP-122 H2S4B-05 S4 4.29 Dev. E 30 1.36 40.41 60 100 very good release, no blinding1 BFP-123 H2S4B-05 S4 4.29 Dev. E 50 2.27 51.63 60 100 very good, slight blinding1 BFP-124 H2S4B-05 S4 4.29 Dev. E 70 3.18 49.12 60 100 very good release, no blinding1 BFP-125 H2S4B-05 S4 4.29 Dev. E 90 4.09 47.58 60 100 very good release, no blinding1 BFP-133 H2S4B-05 S4 4.29 Dev. E 120 5.45 54.59 60 100 very good, no blinding1 BFP-130 H2S4B-05 S4 4.29 Dev. E 180 8.17 52.75 60 100 good release, no blinding1 BFP-126 H2S4B-05 S4 4.29 757 30 1.36 45.4 60 100 good release, no blinding1 BFP-127 H2S4B-05 S4 4.29 757 50 2.27 46.29 60 100 very good release, very slight blinding1 BFP-128 H2S4B-05 S4 4.29 757 70 3.18 49.99 60 100 very good release, very slight blinding1 BFP-129 H2S4B-05 S4 4.29 757 90 4.09 54.59 60 100 good release, no blinding1 BFP-135 H2S4B-07 S4 4.81 757 120 4.84 54.01 60 100 very good, no blinding1 BFP-131 H2S4B-05 S4 4.29 757 180 8.17 54.43 60 100 very good, no blinding1 BFP-134 H2S4B-05 S4 4.29 4050 70 3.18 52.72 60 100 very good, very slight sticking1 BFP-132 H2S4B-05 S4 4.29 4050 90 4.09 56.93 60 100 good release, no blinding1 BFP-136 H2S4B-07 S4 4.81 4050 110 4.44 43.51 60 100 poor, stuck, no blinding1 BFP-137 H2S4B-07 S4 4.81 1224 90 3.63 50.34 60 100 very good, very slight blinding1 BFP-138 H2S4B-07 S4 4.81 1224 110 4.44 56.11 60 100 very good, very slight blinding1 BFP-142 H2S4B-07 S4 4.81 1224 130 5.25 42.57 60 100 fair, sticking1 BFP-139 H2S4B-07 S4 4.81 626 90 3.63 43.87 60 100 very good, no blinding1 BFP-140 H2S4B-07 S4 4.81 626 110 4.44 41.95 60 100 good release, very slightly blinded1 BFP-141 H2S4B-07 S4 4.81 626 130 5.25 42.99 60 100 very good, no blind1 BFP-143 H2S4B-07 S4 4.81 626 180 7.27 45.02 60 100 very good, no blind
Page 2 of 4

Feed Polymer Polymer Polymer Cake Total Press Time Pressure
%Solids IDDose (ppm) (lb/dryT) %Solids (min) (psi) Cake QualityScale Test ID Slurry ID Matrix
Exhibit G.3.6 - Bench and Pilot Filter Press Results
Phase 1 Intermediate Design ReportHudson River PCBs Superfund Site
General Electric Company
1 BFP-144 H2S4B-07 S4 4.81 Dev. E 120 4.84 45.27 45 100 very good, no blinding1 BFP-145 H2S4B-07 S4 4.81 Dev. E 120 4.84 55.95 90 100 good, very slight sticking, no blind1 BFP-146 H2S4B-07 S4 4.81 Dev. E 120 4.84 45.59 60 100 fair, soft top and center1 BFP-147 H2S4B-07 S4 4.81 Dev. E 120 4.84 58.07 60 100 very good, no blind1 BFP-148 S4-HC-10-OF S4 4.011 Dev. E 100 4.87 n/a 60 100 good, no blinding1 BFP-149 S4-HC-10-OF S4 4.011 Dev. E 130 6.32 n/a 60 100 good, no blinding1 BFP-150 S4-HC-10-OF S4 4.011 Dev. E 220 10.70 36.61 60 100 v. good, no blinding1 BFP-151 S4-HC-10-OF S4 4.011 Dev. E 280 13.62 37.41 60 100 v. good, no blinding1 BFP-152 S4-HC-10-OF S4 4.011 Dev. E 380 18.49 48.69 60 100 v. good, no blind1 BFP-153 S4-HC-10-OF S4 4.011 Dev. E 450 21.89 50.26 60 100 v. good, no blinding1 BFP-154 S4-HC-10-OF S4 4.011 Dev. E 480 23.35 54.39 60 100 v. good, no blinding1 BFP-155 S4-HC-10-OF S4 4.011 Dev. E 550 26.76 54.38 60 100 v. good, no blinding1 BFP-156 S4-HC-15-OF S4 6.31 Dev. E 400 12.19 35 60 100 v. good, no blinding1 BFP-157 S4-HC-15-OF S4 6.31 Dev. E 500 15.24 40.5 60 100 v. good, no blinding1 BFP-158 S4-HC-15-OF S4 6.31 Dev. E 600 18.29 46.36 60 100 v. good, no blinding1 BFP-159 S4-HC-15-OF S4 6.31 Dev. E 700 21.34 46.02 60 100 v. good, no blinding1 BFP-160 S4-HC-15-OF S4 6.31 Dev. E 800 24.39 47.65 60 100 v. good, no blinding1 BFP-161 S4-HC-15-OF S4 6.31 Dev. E 900 27.43 50.19 60 100 v. good, no blinding1 BFP-162 S4-HC-10-OF S4 4.01 757 480 23.36 52.92 60 100 v. good, no blind1 BFP-163 S4-HC-15-OF S4 6.31 757 800 24.39 50.91 60 100 v. good, no blinding1 BFP-164 H1S4A-01 S4 9.03 Dev. E 500 10.47 57.94 60 100 v. good, no blinding1 BFP-165 H1S4A-01 S4 9.03 Dev. E 600 12.56 57.19 60 100 v. good, no blinding1 BFP-166 H1S4A-01 S4 9.03 Dev. E 400 8.37 58.95 60 100 v. good, no sticking or blinding1 BFP-167 H1S4A-01 S4 9.03 Dev. E 300 6.28 55.79 60 100 v. good, no sticking or blinding1 BFP OF SS 01 S2-2-HC-15-2 OF SS S2 10.94 Dev. E 100 1.71 NA 60 125 Incomplete1 BFP OF SS 02 S2-2-HC-15-2 OF SS S2 10.94 Dev. E 300 5.12 35.42 60 125 Poor1 BFP OF SS 03 S2-2-HC-15-2 OF SS S2 10.94 Dev. E 500 8.53 38.42 60 125 Poor1 BFP OF SS 08 S2-2-HC-15-2 OF SS S2 10.94 Dev. E 900 15.36 38.33 60 125 Poor1 BFP OF SS 11 S2-2-HC-15-2 OF SS S2 10.94 Dev. E 1500 25.60 47.47 60 125 Good1 BFP OF SS 12 S2-2-HC-15-2 OF SS S2 10.94 Dev. E 900 15.36 48.14 120 125 Good1 BFP OF SS 04 S3-4-HC-15-1 OF SS S3 14.45 Dev. E 1000 12.63 46.89 60 125 OK1 BFP OF SS 05 S3-4-HC-15-1 OF SS S3 14.45 Dev. E 1400 17.68 52.8 60 125 Very good1 BFP OF SS 09 S3-4-HC-15-1 OF SS S3 14.45 Dev. E 2000 25.26 52.65 60 125 Excellent1 BFP OF SS 13 S3-4-HC-15-1 OF SS S3 14.45 Dev. E 1000 12.63 54.59 120 125 Very Good1 BFP OF SS 06 S3-4-HC-25-2 OF SS S3 21.15 Dev. E 1400 11.54 46.33 60 125 Poor1 BFP OF SS 07 S3-4-HC-25-2 OF SS S3 21.15 Dev. E 1800 14.84 47.66 60 125 Poor1 BFP OF SS 10 S3-4-HC-25-2 OF SS S3 21.15 Dev. E 2500 20.61 51.97 60 125 Good1 BFP OF SS 14 S3-4-HC-25-2 OF SS S3 21.15 Dev. E 1800 14.84 54.39 120 125 Fair2 PFP-1 H1S3-07 S3 14.62 Dev. E 600 7.48 65.75 60 100 Excellent, hard, solid cake. 2 PFP-2 H1S3-07 S3 14.62 Dev. E 600 7.48 61.23 30 100 Very good, less solid towards center2 PFP-3 H1S3-07 S3 14.62 Dev. E 600 7.48 64.23 45 100 Excellent, hard, solids cake.2 PFP-4 H1S2-09 S2 10.11 Dev. E 500 9.28 58.59 90 100 Excellent cake2 PFP-5 H1S3-07 S3 14.62 Dev. E 600 7.48 62.18 45 100 solid
2 PFP-6 H1S2-09 S2 10.11 Dev. E 500 9.28Terminated at 26:30 (insufficient feed)
100 N/A
2 PFP-7 H1S3-08 S3 12.33 Dev. E 600 9.00 62.76 45 100 solid2 PFP-8 H1S2-10 S2 8.31 Dev. E 500 11.43 58.11 60 100 very good, slightly soft center2 PFP-9 H1S3-08 S3 12.33 Dev. E 600 9.00 59.91 45 100 excellent, firm throughout
2 PFP-10 H1S2-10 S2 8.31 Dev. E 500 11.43Terminated at 45 min (insufficient
100N/A incomplete cake
2 PFP-11 H1S3-09 S3 9.88 Dev. E 600 11.42 67.16 45 100 excellent2 PFP-12 H1S2-11 S2 8.94 Dev. E 500 10.58 61.22 90 100 excellent cake, firm2 PFP-13 H1S2-11 S2 8.94 Dev. E 500 10.58 63.95 75 100 excellent2 PFP-14 H1S3-09 S3 9.88 Dev. E 600 11.42 63.73 45 100 excellent2 PFP-15 H1S3-09 S3 9.88 Dev. E 600 11.42 67.37 45 100 excellent2 PFP-16 H1S2-12 S2 12.07 Dev. E 500 7.68 62.06 75 100 excellent2 PFP-17 H1S3-11 S3 14.25 Dev. E 600 7.69 65.29 45 100 very good, slightly soft on top2 PFP-18 H1S3-11 S3 14.25 Dev. E 600 7.69 63.61 45 100 excellent2 PFP-19 H1S3-13 S3 14.5 Dev. E 600 7.55 67.8 45 100 excellent2 PFP-20 H1S3-13 S3 14.5 Dev. E 600 7.55 65.09 45 100 excellent2 PFP-21 H1S3-13 S3 14.5 Dev. E 600 7.55 63.07 45 100 excellent2 PFP-22 H1S1-10 S1 3.15 Dev. E 60 3.74 120 100 incomplete2 PFP-23 H1S1-11 S1 3.08 Dev. E 60 3.82 120 100 poor2 PFP-24 H2S4B-03 S4 5.2 Dev. E 75 2.79 75 100 incomplete2 PFP-25 H1S1-12 S1 2.56 Dev. E 60 4.61 150 100 incomplete2 PFP-26 H2S4B-03 S4 3.62 Dev. E 75 4.05 60 100 incomplete2 PFP-27 H2S4B-03 S4 Dev. E 75 39.1 180 100 fair, soft, incomplete top2 PFP-28 H1S1-12 S1 2.56 Dev. E 60 4.61 68.6 300 100 fair, soft, incomplete top2 PFP-29 H1S4B-05 S4 24.88 Dev. E 800 5.46 53.3 30 100 fair/good
Page 3 of 4

Feed Polymer Polymer Polymer Cake Total Press Time Pressure
%Solids IDDose (ppm) (lb/dryT) %Solids (min) (psi) Cake QualityScale Test ID Slurry ID Matrix
Exhibit G.3.6 - Bench and Pilot Filter Press Results
Phase 1 Intermediate Design ReportHudson River PCBs Superfund Site
General Electric Company
2 PFP-30 H1S1-14 S1 3.46 Dev. E 60 3.40 60.7 126 100 incomplete, soft/wet tops2 PFP-31 H1S4B-05 S4 24.88 Dev. E 800 5.46 52.72 30 100 fair/good2 PFP-32 H1S4B-06 S4 24.1 Dev. E 800 5.67 58.56 60 100 very good, excellent2 PFP-33 H1S1-15 S1 5.23 Dev. E 60 2.22 65.38 105 100 incomplete, soft/wet top2 PFP-34 H1S4B-06 S4 24.1 Dev. E 800 5.67 58.33 45 100 excellent2 PFP-35 H1S4B-06 S4 24.1 Dev. E 800 5.67 59.74 60 100 excellent2 PFP-36 H1S4B-06 S4 24.1 Dev. E 800 5.67 59.62 60 100 excellent2 PFP-37 H1S1-16 S1 2.86 Dev. E 60 4.12 120 100 incomplete2 PFP-38 H1S4B-06 S4 24.1 Dev. E 800 5.67 59.35 60 100 excellent2 PFP-39 H2S4B-06 S4 4.35 Dev. E 75 3.36 42.42 240 100 Fair2 PFP-40 H2S4B-06 S4 4.35 Dev. E 75 3.36 51.45 180 100 good, soft, slightly wet top2 PFP-41 H2S4B-08 S4 4.92 Dev. E 120 4.73 45.02 150 100 good, soft top2 PFP-42 H2S4B-08 S4 4.92 Dev. E 120 4.73 48.28 180 100 good/fair, soft top2 PFP-43 H2S4B-08 S4 4.92 Dev. E 120 4.73 130 100 poor, N/A, incomplete2 PFP-44 H1S3-15 S3 13.48 Dev. E 600 8.17 62 60 100 excellent, dry2 PFP-45 H1S2-13 S2 11.87 Dev. E 500 7.82 57.02 75 100 excellent2 PFP-46 H1S3-15 S3 13.48 Dev. E 600 8.17 58.9 60 100 excellent, dry2 PFP-47 H1S2-13 S2 11.87 Dev. E 500 7.82 59.24 75 100 excellent
2 PFP-48 H1S3-16 S3 15.89 Dev. E 600 6.82 68.1455 min - terminated / equipment
100excellent, dry, solid
2 PFP-49 H1S3-16 S3 15.89 Dev. E 600 6.82 66.55 45 100 excellent, solid2 PFP-50 H1S3-16 S3 15.89 Dev. E 600 6.82 68.35 45 100 excellent2 PFP-51 H1S2-14 S2 7.23 Dev. E 500 13.22 55.08 60 100 very good / excellent2 PFP-52 H1S4B-07 S4 23.83 Dev. E 800 5.74 59.32 45 100 excellent2 PFP-53 H1S4B-07 S4 23.83 Dev. E 800 5.74 59.08 45 100 excellent2 PFP-54 H1S4B-07 S4 23.83 Dev. E 800 5.74 58.02 45 100 excellent2 PFP-55 H1S4B-07 S4 23.83 Dev. E 800 5.74 57.35 45 100 excellent2 PFP-56 H1S3-17 S3 18.04 Dev. E 600 5.92 69.14 60 100 excellent, crumbly2 PFP-57 H1S4-03 S4 16.57 Dev. E 500 5.43 63.6 60 100 excellent, dry, sandy2 PFP-58 H2S4B-08 S4 4.22 Dev. E 120 5.54 53.18 120 100 good, soft top and center2 PFP-59 H1S4-03 S4 11.81 Dev. E 500 7.86 62.88 60 100 excellent2 PFP-60 H1S4B-09 S4 23.94 Dev. E 800 5.71 60.56 45 100 excellent2 PFP-61 H2S4B-08 S4 4.22 Dev. E 120 5.54 19 100 N/A2 PFP-62 H1S4B-09 S4 23.94 Dev. E 800 5.71 57.69 45 100 excellent
Notes:Scale "1" = Bench (Hockey pucks)Scale "2" = Plate & Frame pilot2.54 = Solids SpG.
Page 4 of 4

Slurry IDTest
NumberFeed Solids
(%)Polymer
Type
Polymer Dosage (ppm)
Press Time (Minutes)
Polymer Dosage
(lb/dry T)Cake Solids
(%)
H1S1-12 PFP-28 2.56 Dev E 60 300 4.94 68.60H1S1-14 PFP-30 3.46 Dev E 60 126 3.63 60.70H1S1-15 PFP-33 5.23 Dev E 60 105 2.38 65.38
3.65 64.89H1S2-09 PFP-4 10.11 Dev E 500 90 9.93 58.59H1S2-10 PFP-8 8.31 Dev E 500 60 12.23 58.11H1S2-11 PFP-12 8.94 Dev E 500 90 11.32 61.22H1S2-11 PFP-13 8.94 Dev E 500 75 11.32 63.95H1S2-12 PFP-16 12.07 Dev E 500 75 8.22 62.06H1S2-13 PFP-45 11.87 Dev E 500 75 8.37 57.02H1S2-13 PFP-47 11.87 Dev E 500 75 8.37 59.24H1S2-14 PFP-51 7.23 Dev E 500 60 14.15 55.08
10.49 59.41H1S3-07 PFP-1 14.62 Dev E 600 60 8.00 65.75H1S3-07 PPF-2 14.62 Dev E 600 30 8.00 61.23H1S3-07 PFP-3 14.62 Dev E 600 45 8.00 64.23H1S3-07 PFP-5 14.62 Dev E 600 45 8.00 62.18H1S3-08 PFP-7 12.33 Dev E 600 45 9.64 62.76H1S3-08 PFP-9 12.33 Dev E 600 45 9.64 59.91H1S3-09 PFP-11 9.88 Dev E 600 45 12.22 67.16H1S3-09 PFP-14 9.88 Dev E 600 45 12.22 63.73H1S3-09 PFP-15 9.88 Dev E 600 45 12.22 67.37H1S3-11 PFP-17 14.25 Dev E 600 45 8.23 65.29H1S3-11 PFP-18 14.25 Dev E 600 45 8.23 63.61H1S3-13 PFP-19 14.50 Dev E 600 45 8.08 67.80H1S3-13 PFP-21 14.50 Dev E 600 45 8.08 63.07H1S3-13 PFP-20 14.50 Dev E 600 45 8.08 65.09H1S3-15 PFP-44 13.48 Dev E 600 60 8.75 62.00H1S3-15 PFP-46 13.48 Dev E 600 60 8.75 58.90H1S3-16 PFP-48 15.89 Dev E 600 55 7.30 68.14H1S3-16 PFP-49 15.89 Dev E 600 45 7.30 66.55H1S3-16 PFP-50 15.89 Dev E 600 45 7.30 68.35H1S3-17 PFP-56 18.04 Dev E 600 60 6.34 69.14
8.72 64.61H1S4-03 PFP-57 16.57 Dev E 500 60 5.81 63.60H1S4-03 PFP-59 11.81 Dev E 500 60 8.41 62.88
7.11 63.24
Plate and Filter Press Summary
H1S3 Avg.
H1S4 Avg.
H1S1 Avg.
H1S2 Avg.
General Electric CompanyHudson River PCBs Superfund SitePhase 1 Intermediate Design Report
Exhibit G.3.7a - Plate and Frame Filter Press Summary
Page 1 of 2

General Electric CompanyHudson River PCBs Superfund SitePhase 1 Intermediate Design Report
Exhibit G.3.7a - Plate and Frame Filter Press Summary
Slurry IDTest
NumberFeed Solids
(%)Polymer
Type
Polymer Dosage (ppm)
Press Time (Minutes)
Polymer Dosage
(lb/dry T)Cake Solids
(%)
H1S4B-05 PFP-29 24.88 Dev E 800 30 5.84 53.30H1S4B-05 PFP-31 24.88 Dev E 800 30 5.84 52.72H1S4B-06 PFP-32 24.10 Dev E 800 60 6.07 58.56H1S4B-06 PFP-34 24.10 Dev E 800 45 6.07 58.33H1S4B-06 PFP-35 24.10 Dev E 800 60 6.07 59.74H1S4B-06 PFP-36 24.10 Dev E 800 60 6.07 59.62H1S4B-06 PFP-38 24.10 Dev E 800 60 6.07 59.35H1S4B-07 PFP-52 23.83 Dev E 800 45 6.15 59.32H1S4B-07 PFP-53 23.83 Dev E 800 45 6.15 59.08H1S4B-07 PFP-54 23.83 Dev E 800 45 6.15 58.02H1S4B-07 PFP-55 23.83 Dev E 800 45 6.15 57.35H1S4B-09 PFP-60 23.94 Dev E 800 45 6.11 60.56H1S4B-09 PFP-62 23.94 Dev E 800 45 6.11 57.69
6.06 57.97H2S4B-03 PFP-27 3.62 Dev E 75 180 4.34 39.10H2S4B-06 PFP-39 4.35 Dev E 75 240 3.59 42.42H2S4B-06 PFP-40 4.35 Dev E 75 180 3.59 51.45H2S4B-08 PFP-41 4.92 Dev E 120 150 5.06 45.02H2S4B-08 PFP-42 4.92 Dev E 120 180 5.06 48.28H2S4B-08 PFP-58 4.22 Dev E 120 120 5.93 53.18
4.60 46.58H1S4A-09 PFP-63 14.12 Dev E 600 60 8.31 69.33H1S4A-03 PFP-64 12.15 Dev E 600 45 9.79 64.32H1S4A-03 PFP-65 12.15 Dev E 600 60 9.79 66.52H1S4A-05 PFP-67 16.30 Dev E 600 45 7.10 77.15H1S4A-04 PFP-68 15.48 Dev E 600 60 7.52 69.71H1S4A-05 PFP-69 16.30 Dev E 600 60 7.10 76.84H1S4A-04 PFP-70 15.48 Dev E 600 60 7.52 70.90H1S4A-05 PFP-71 16.30 Dev E 600 60 7.10 78.69H1S4A-04 PFP-72 15.48 Dev E 600 60 7.52 76.15H1S4A-05 PFP-73 16.30 Dev E 600 60 7.10 73.47H1S4A-04 PFP-74 15.48 Dev E 600 60 7.52 76.96H1S4A-05 PFP-75 16.30 Dev E 600 60 7.10 74.57H1S4A-04 PFP-76 15.48 Dev E 600 30 7.52 77.56H1S4A-06 PFP-77 18.31 Dev E 600 60 6.23 77.34H1S4A-06 PFP-78 18.31 Dev E 600 60 6.23 74.47H1S4A-06 PFP-79 18.31 Dev E 600 60 6.23 75.37H1S4A-06 PFP-80 18.31 Dev E 600 60 6.23 69.88
7.41 73.487.47 63.35
Notes:2.54 =SpG (gm/mL) solids1.07 =SpG (gm/mL) polymer1. Dev E is Developmental E polymer from GE Water.
Plate and Filter Press Summary (Cont'd)
OVERALL AVG.
H1S4B Avg.
H2S4B Avg.
H1S4A Avg.
Page 2 of 2

Feed Polymer Polymer Cake CakeScale Test ID Matrix %Solids ID (lb/dryT) %Solids PFP/BFP
1 BFP S1 BFP 4.1 Dev. E 2.9 64.9 --
1 BFP S2 BFP 7.0 Dev. E 11.0 55.32 PFP S2 PFP 7.8 Dev. E 12.9 56.6 1.02
1 BFP S3 BFP 13.2 Dev. E 5.7 68.52 PFP S3 PFP 13.8 Dev. E 8.9 64.6 0.94
1 BFP S4 BFP 10.6 Dev. E 6.8 55.12 PFP S4 PFP 22.6 Dev. E 6.7 58.7 1.07
Notes:Scale "1" = Bench (Hockey pucks)Scale "2" = Plate & Frame pilotData collection includes Dev E polymer, 100 psi, and 30-60 min runs.
General Electric CompanyHudson River PCBs Superfund SitePhase 1 Intermediate Design Report
Exhibit G.3.7b - Comparison of Bench-Scale and Pilot-Scale Filter Press Optimal Results
0
10
20
30
40
50
60
70
80
S1 BFP S2 BFP S2 PFP S3 BFP S3 PFP S4 BFP S4 PFP
Matrix & Test Type
Op
tim
al C
ake
So
lids
(%)
Page 1 of 1

Test ID Slurry IDFeed % Solids Polymer
Dose (ppm) Time / Pressure
w/w Dose (#/dryT)
Cake % Solids
Cake Quality
BFP OF SS 01 S2-2-HC-15-2 OF SS 10.94 Dev "E" 100 60 min / 125 psi 1.83 N/A IncompleteBFP OF SS 02 S2-2-HC-15-2 OF SS 10.94 Dev "E" 300 60 min / 125 psi 5.48 35.42 PoorBFP OF SS 03 S2-2-HC-15-2 OF SS 10.94 Dev "E" 500 60 min / 125 psi 9.13 38.42 PoorBFP OF SS 08 S2-2-HC-15-2 OF SS 10.94 Dev "E" 900 60 min / 125 psi 16.44 38.33 PoorBFP OF SS 11 S2-2-HC-15-2 OF SS 10.94 Dev "E" 1500 60 min / 125 psi 27.40 47.47 GoodBFP OF SS 12 S2-2-HC-15-2 OF SS 10.94 Dev "E" 900 120 min / 125 psi 16.44 48.14 GoodBFP OF SS 04 S3-4-HC-15-1 OF SS 14.45 Dev "E" 1000 60 min / 125 psi 13.51 46.89 OKBFP OF SS 05 S3-4-HC-15-1 OF SS 14.45 Dev "E" 1400 60 min / 125 psi 18.92 52.80 Very goodBFP OF SS 09 S3-4-HC-15-1 OF SS 14.45 Dev "E" 2000 60 min / 125 psi 27.02 52.65 ExcellentBFP OF SS 13 S3-4-HC-15-1 OF SS 14.45 Dev "E" 1000 120 min / 125 psi 13.51 54.59 Very GoodBFP OF SS 06 S3-4-HC-25-2 OF SS 21.15 Dev "E" 1400 60 min / 125 psi 12.35 46.33 PoorBFP OF SS 07 S3-4-HC-25-2 OF SS 21.15 Dev "E" 1800 60 min / 125 psi 15.88 47.66 PoorBFP OF SS 10 S3-4-HC-25-2 OF SS 21.15 Dev "E" 2500 60 min / 125 psi 22.05 51.97 GoodBFP OF SS 14 S3-4-HC-25-2 OF SS 21.15 Dev "E" 1800 120 min / 125 psi 15.88 54.39 Fair
BFP-148 S4-HC-10-OF 4.011 Dev "E" 100 60 5.21 N/A N/ABFP-149 S4-HC-10-OF 4.011 Dev "E" 130 60 6.77 N/A N/ABFP-150 S4-HC-10-OF 4.011 Dev "E" 220 60 11.45 36.61 N/ABFP-151 S4-HC-10-OF 4.011 Dev "E" 280 60 14.58 37.41 N/ABFP-152 S4-HC-10-OF 4.011 Dev "E" 380 60 19.78 48.69 N/ABFP-153 S4-HC-10-OF 4.011 Dev "E" 450 60 23.43 50.26 N/ABFP-154 S4-HC-10-OF 4.011 Dev "E" 480 60 24.99 54.39 N/ABFP-155 S4-HC-10-OF 4.011 Dev "E" 550 60 28.63 54.38 N/ABFP-156 S4-HC-15-OF 6.31 Dev "E" 400 60 13.05 35 N/ABFP-157 S4-HC-15-OF 6.31 Dev "E" 500 60 16.31 40.5 N/ABFP-158 S4-HC-15-OF 6.31 Dev "E" 600 60 19.57 46.36 N/ABFP-159 S4-HC-15-OF 6.31 Dev "E" 700 60 22.83 46.02 N/A
Notes:2.54 =SpG (gm/mL) solids1.07 =SpG (gm/mL) polymer1. Dev E is Developmental E polymer from GE Water.
Filter Press of Hydrocyclone Overflows
General Electric CompanyHudson River PCBs Superfund SitePhase 1 Intermediate Design Report
Exhibit G.3.8 - Bench-Scale Filter Press of Hydrocyclone Overflows
Page 1 of 1

Time (min)
Total Filtrate Volume
(mL)
% Solids (w/w)
BFP-80 H1S3-06 Dev E 400 85X 0.5-1 CFM 60 253 72.75
BFP-79 H1S3-06 Dev E 400 85X/5 4-6 CFM 60 273 70.44
BFP-81 H1S3-06 Dev E 400 855X/10 8-12 CFM 60 163 72.73
BFP-82 H1S3-06 Dev E 400 85X/15 15 CFM 60 299 69.16
BFP-85 H1S2-07 757 300 85X 0.5-1 CFM 60 362 55.60
BFP-87 H1S2-07 757 300 85X/5 4-6 CFM 60 330 54.70
BFP-86 H1S2-07 757 300 855X/10 8-12 CFM 60 361 57.26
BFP-88 H1S2-07 757 300 85X/15 15 CFM 60 317 59.24
good cake, sl. soft top, v. good release, no blinding; Initial filtrate had sediment, then sl. cloudy and lt. brown, then sl. yellow and clear.
v. good cake, sl. soft top, excellent release, no blinding; Initial filtrate was dirty and brown with sediment, then sl. yellow and cloudy with sl. sediment.
v.good cake, v.sl.soft top, good release, no blinding; Initial filtrate had sediment, then sl. cloudy and yellow, then got clearer and less yellow.
good cake, good release, no blinding; initial filtrate was dirty with sediment, very cloudy, then clear.
v. good cake, good release, no blinding; initial filtrate dirty with sediment, remained somewhat cloudy with a lt. brown tinge.
Observations
good cake, sl. soft top, v. good release, no blinding; Filtrate sl. yellow and clear.
Filter ClothFilter Cloth
Porosity
good cake w/ sl.soft top, good release, no blinding, initial filtrate discharge was dirty with sediment, then clear and sl. yellow.
Filter Press
v. good/exc. cake, v. good release, no blinding; no sediment in filtrate, but sl. Cloudy at first, then clear. Sl. lt. brown in color.
BFP Test #
Slurry IDPolymer
IDDosage (ppm)
General Electric CompanyHudson River PCBs Superfund SitePhase 1 Intermediate Design Report
Exhibit G.3.9 - Cake Release Screening Data
Page 1 of 1

General Electric CompanyHudson River PCBs Superfund SitePhase 1 Intermediate Design Report
Exhibit G.3.10 - Multiple Regression of Pooled Filter Press Test Data
203 data sets Cake = Percent solids Feed = Initial slurry Percent solids Dose = Polymer dose in Pounds per dry ton of solids Fines = 1, 2, 3, or 4 representing S1, S2, S3, or S4 sediment types Scale = 1 (bench scale hockey pucks) or 2 (Plate & frame tests) Regression Analysis: Cake versus Fines, Feed, Dose, Scale The regression equation is Cake = 60.7 - 4.34 Fines + 0.488 Feed + 0.0408 Dose + 2.86 Scale Predictor Coef SE Coef T P Constant 60.705 1.850 32.82 0.000 Fines -4.3446 0.4810 -9.03 0.000 Feed 0.48789 0.06365 7.67 0.000 Dose 0.04085 0.05843 0.70 0.485 Scale 2.864 1.024 2.80 0.006 S = 6.22183 R-Sq = 38.0% R-Sq(adj) = 36.7% Analysis of Variance Source DF SS MS F P Regression 4 4694.2 1173.6 30.32 0.000 Residual Error 198 7664.8 38.7 Total 202 12359.1 Comments: Overall R-sq of 38% is not a strong relationship. However, analysis of individual predictors is of interest. The “Fines” factor was the strongest predictor (highest T). The regression equation suggests that S2 sediments produce about 4.3%-points lower cake solids than corresponding S1 sediments, with similar drops for S3 from S2 and S4 from S3. The Feed solids was the next strongest predictor. The regression equation suggests that a 1% increase in feed solids should produce a 0.5%-point increase in cake solids. The Dose factor was not statistically significant. The data set includes a variety of different polymers, although most were Poly-DADMACs. Most dosages attempted to seek the optimum, with dosages slightly below and above optimum. The dose/performance relationship increases to the optimum, with falling performance at dosages above the optimum. Therefore, the dose factor would not be expected to follow a linear regression relationship. It was interesting that the “Scale” factor was statistically significant. The regression equation would suggest that Plate & Frame tests produce cake solids 2.9%-points higher than corresponding hockey puck tests.
Page 1 of 1

Sample ID Date Collected Total PCBs
(mg/L) PCB
Qualifier
Total Organic Carbon (mg/L)
Dissolved Organic Carbon (mg/L)
Total Suspended
Solids (mg/L) pH (pH Units) PFP-01-5 TO 30 7/27/2004 0.01 J NA NA 37.6 NA PFP-01-5 TO 30-DUP 7/27/2004 NA NA NA 40.8 NA PFP-01-30 7/27/2004 0.014 NA NA 7.8 NA PFP-01-30 TO 60 7/27/2004 0.0038 NA NA 4.6 NA PFP-04-5 TO 30 7/28/2004 0.038 NA NA 4.8 NA PFP-04-30 7/28/2004 0.031 NA NA 2 NA PFP-04-30 TO 60 7/28/2004 0.036 NA NA 2 NA PFP-04-60 7/28/2004 0.046 NA NA 2 NA PFP-04-60 TO 90 7/28/2004 0.037 NA NA 2 NA PFP-17-FILTRATE 8/3/2004 0.0048 5.51 NA 5.31 7.01PFP-17-FILTRATE-DUP 8/3/2004 0.0051 7.14 NA 7.07 7.02PFP-28-FILTRATE 8/9/2004 0.00052 3.7 3.63 2 NA PFP-28-FILTRATE-DUP 8/9/2004 0.00043 3.59 3.65 2 NA PFP-35-FILTRATE 8/10/2004 0.011 12.9 11.6 38.6 NA PFP-35-FILTRATE-DUP 8/10/2004 0.0087 13.8 12.2 42.4 NA
Min: 0.00043 3.59 3.63 2Average: 0.0176 7.77 7.77 13.40
Max: 0.0460 13.80 12.20 42.40
Notes: 1. Samples were collected by Blasland, Bouck & Lee, Inc. (BBL), and were submitted to Northeast Analytical Services, Inc. for analysis.2. U = Indicates the constituent was not detected. The value preceding the U indicates the laboratory quantitation limit.
analytical data set. 4. NA - Not analyzed. 5. mg/L = milligrams per liter. 6. Laboratory Data Qualifiers: Organics (PCBs) J - Indicates an estimated value.
General Electric Company
3. As specified in the Treatability Studies Work Plan (BBL, 2004), data validation was performed on approximately 10% of the
Exhibit G.3.11 - Plate and Frame Filter Press Filtrate Sample Data
Phase 1 Intermediate Design ReportHudson River PCBs Superfund Site
Page 1 of 1

Slurry IDTest
NumberFeed Solids
(%)Polymer
Type
Polymer Dosage (ppm)
Test Conditions
(Cycles at 25 psi for 15 Seconds)
Polymer Dosage
(lb/dry T)Cake Solids
(%)
H1S3-12 BP-4 14.61 2651 800 4 10.68 53.47H1S3-12 BP-5 14.61 2651 850 4 11.35 56.78H1S3-12 BP-6 14.61 2651 900 4 12.02 59.53H1S3-14 BP-13 14.36 4440 1,300 4 17.69 53.21H1S3-14 BP-14 14.36 4440 1,350 4 18.37 53.61H1S3-14 BP-15 14.36 4440 1,400 4 19.05 54.28H1S3-14 BP-16 14.36 4808 1,200 4 16.33 60.61H1S3-14 BP-17 14.36 4808 1,250 4 17.01 60.72H1S3-14 BP-18 14.36 4808 1,300 4 17.69 61.17H1S3-14 BP-20 14.36 4808 1,250 8 17.01 59.68
15.7 57.3H1S4B-03 BP-1 24.84 4808 2,350 4 17.20 50.27H1S4B-03 BP-2 24.84 4808 2,400 4 17.56 48.59H1S4B-03 BP-3 24.84 4808 2,450 4 17.93 49.42H1S4B-04 BP-7 24.90 4440 1,950 4 14.23 43.72H1S4B-04 BP-8 24.90 4440 2,000 4 14.59 45.91H1S4B-04 BP-9 24.90 4440 2,050 4 14.96 45.66H1S4B-04 BP-10 24.90 2651 1,950 4 14.23 51.19H1S4B-04 BP-11 24.90 2651 2,000 4 14.59 49.61H1S4B-04 BP-12 24.90 2651 2,050 4 14.96 50.02H1S4B-04 BP-19 24.90 2651 1,950 8 14.23 49.20H1S4B-04 BP-21 24.90 4440 2,700 4 19.70 48.46H1S4B-04 BP-22 24.90 4440 2,800 4 20.43 47.77H1S4B-04 BP-23 24.90 4440 2,900 4 21.16 48.10
16.6 48.316.2 52.2
General Electric CompanyHudson River PCBs Superfund SitePhase 1 Intermediate Design Report
Exhibit G.3.12 - Belt Filter Press and Centrifuge Summary
Belt Filter Press Summary
H1S3 Avg.
H1S4B Avg.OVERALL AVG.
Page 1 of 2

General Electric CompanyHudson River PCBs Superfund SitePhase 1 Intermediate Design Report
Exhibit G.3.12 - Belt Filter Press and Centrifuge Summary
Slurry IDTest
NumberFeed Solids
(%)Polymer
Type
Polymer Dosage (ppm)
Spin RPM/Time (Minutes)
Polymer Dosage
(lb/dry T)Cake Solids
(%)
H1S3-08 CF-13 12.33 none 0 3,500/3 0.00 41.33H1S3-08 CF-16 12.33 none 0 3,500/5 0.00 48.61H1S3-12 CF-19 14.61 4440 650 3,500/5 8.68 53.05H1S3-12 CF-20 14.61 4440 700 3,500/5 9.35 50.29H1S3-12 CF-21 14.61 4440 750 3,500/5 10.01 52.35H1S3-12 CF-22 14.61 2651 750 3,500/5 10.01 59.30H1S3-12 CF-23 14.61 2651 800 3,500/5 10.68 61.20H1S3-12 CF-24 14.61 2651 850 3,500/5 11.35 59.04H1S3-12 CF-25 14.61 4808 1,200 3,500/5 16.02 53.20H1S3-12 CF-26 14.61 4808 1,250 3,500/5 16.69 55.94H1S3-12 CF-27 14.61 4808 1,300 3,500/5 17.36 59.05
10.0 53.9H1S4B-03 CF-01 24.84 4808 2,350 3,500/5 17.20 47.78H1S4B-03 CF-02 24.84 4808 2,400 3,500/5 17.56 47.95H1S4B-03 CF-03 24.84 4808 2,450 3,500/5 17.93 47.42H1S4B-03 CF-04 24.84 4440 1,950 3,500/5 14.27 46.13H1S4B-03 CF-05 24.84 4440 2,000 3,500/5 14.64 46.54H1S4B-03 CF-06 24.84 4440 2,050 3,500/5 15.00 46.75H1S4B-03 CF-07 24.84 2651 1,950 3,500/5 14.27 49.31H1S4B-03 CF-08 24.84 2651 2,000 3,500/5 14.64 51.97H1S4B-03 CF-09 24.84 2651 2,050 3,500/5 15.00 53.24H1S4B-03 CF-10 24.84 4808 2,400 3,500/3 17.56 46.97H1S4B-03 CF-11 24.84 4440 2,000 3,500/3 14.64 45.83H1S4B-03 CF-12 24.84 2651 2,000 3,500/3 14.64 47.70H1S4B-03 CF-14 24.84 none 0 3,500/3 0.00 36.48H1S4B-03 CF-17 24.84 none 0 3,500/5 0.00 38.65
13.4 46.6H2S4B-01 CF-15 3.37 none 0 3,500/3 0.00 34.43H2S4B-01 CF-18 3.37 none 0 3,500/5 0.00 37.89
0.0 36.211.0 48.8
Notes:2.54 =SpG (gm/mL) solids1.07 =SpG (gm/mL) polymer1. Dev E is Developmental E polymer from GE Water.2. 2651 is Novus CE2651 polymer from GE Water.3. 4440 and 4808 are polymers from Kemira (formerly Vulcan Chemicals).
H2S4B Avg.OVERALL AVG.
Centrifuge Summary
H1S4B Avg.
H1S3 Avg.
Page 2 of 2

Exhibit G.4
Water Treatment System Calculations Includes:
Equalization Tank Rapid Mix and Flocculation Tank Clarifier
Multi-Media Filter System Granular Activated Carbon System

Exhibit G.4.1
Process and Storm Water Treatment, Design Calculations

Equalization Tank


Rapid Mix and Flocculation Tank


Clarifier


Multimedia Filter System


Granular Activated Carbon System

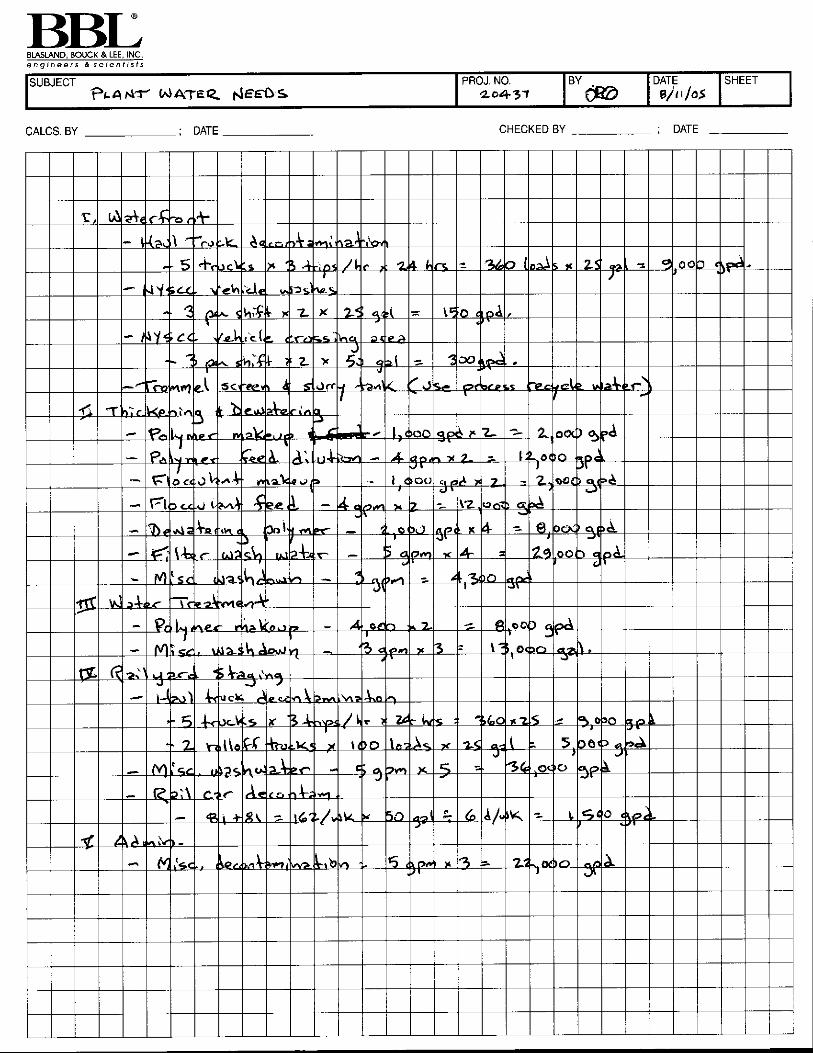

Sample ID:
H1S1SETTLED FILTRATETOP
H1S2SETTLED FILTRATETOP
H1S3SETTLED FILTRATETOP
H1S4BSETTLED FILTRATETOP
H2S4BSETTLED FILTRATETOP
Date Collected: 9/2/2004 9/2/2004 9/2/2004 9/2/2004 9/2/2004 Total PCBs 0.000080 J 0.00098 0.000040 J 0.0011 0.00033 Total Suspended Solids 1.96 U 2.25 U 1.96 U 13.1 1.96 U Total TEQs (WHO TEFs) 0.0000000625 0.0000000615 0.0000000266 0.0000000616 0.0000000497 Cadmium 0.00100 U 0.000230 B 0.00100 U 0.000300 B 0.00100 U Chromium 0.00180 B 0.00240 0.00240 0.00560 0.00200 Copper 0.00190 B 0.00250 0.00240 0.00220 0.00110 B Lead 0.000180 B 0.000320 B 0.000260 B 0.00250 0.000370 B Mercury 0.000200 U 0.000200 U 0.000200 U 0.000200 U 0.000200 U
Notes:1. All results as milligrams per liter (mg/L).2. This table is condensed from Table 23 of IDR Attachment 4 (Treatability Studies Report).3. Samples were collected by Blasland, Bouck & Lee, Inc. (BBL), and were submitted to Severn Trent Laboratories, Inc., Pittsburgh; Paradigm Analytical Laboratories; and Northeast Analytical Services, Inc. for analysis. 4. U = Indicates the constituent was not detected. The value preceding the U indicates the laboratory quantitation limit. 5. As specified in the Treatability Studies Work Plan (BBL, 2004), data validation was performed on approximately 10% of the analytical data set. 6. NA - Not analyzed. 7. Laboratory Data Qualifiers: Organics (PCBs, PCDD/PCDFs) J - Indicates an estimated value. Inorganics (TAL Metals) B - Indicates an estimated value between the lower calibration limit and the target detection limit.
General Electric CompanyHudson River PCBs Superfund SitePhase 1 Intermediate Design Report
Exhibit G.4.2 - Settled Filtrate from Pilot Plate & Frame Filter Press
Page 1 of 1

Sample ID: WQC H1S1
MMFIN H1S1
MMFOUT2 H1S1
BETGAC2 H1S1
GAC2OUT2 Date Collected: 9/7/2004 9/7/2004 9/7/2004 9/7/2004 Total PCB 0.0003 0.0000220 J 0.0000125 J NA NA Total PAHs 0.00943 U 0.00926 U 0.00980 U 0.00962 U Ammonia Nitrogen 0.510 0.410 0.370 0.300 BOD (five day) 2 U 2 U 2 U 2 U COD 8 8 5U 5U Nitrate 1.1 0.80 0.20 0.20 U Nitrite 0.020 0.010 0.010 0.010 Total Organic Carbon 0.966 U 0.966 U 0.966 U 0.966 U Dissolved Organic Carbon 0.97 U 2.6 0.97 U 0.97 U Total Kjeldahl Nitrogen 0.680 0.650 0.370 0.330 Total Phosphorous (PO4) 0.0500 U 0.0500 U 0.0500 U 0.0500 U Total Suspended Solids 50 2.20 0.952 U 1.24 0.952 U Total TEQs (WHO TEFs) 0.0000000448 0.0000000611 0.0000000625 0.0000000625 Cadmium 0.04 0.00100 U 0.00100 U 0.00100 U 0.00100 U Chromium 0.21 0.00210 0.00220 0.00140 B 0.00150 B Copper 0.136 0.0141 0.00590 0.000760 B 0.00190 B Lead 0.038 0.0181 0.00230 0.000920 B 0.000490 B Mercury 0.0002 0.0002 U 0.0002 U 0.0002 U 0.0002 U
Sample ID: WQC H1S1
MMFOUT6 H1S1
BETGAC6 H1S1
GAC2OUT6 Date Collected: 9/7/2004 9/7/2004 9/7/2004 Total PCB 0.0003 0.0000156 J 0.00000934 U 0.00000934 U Total PAHs 0.0100 U 0.00926 U 0.00926 U Ammonia Nitrogen 0.430 0.390 0.410 BOD (five day) 2 U 2 U 2 U COD 11 5U 5U Nitrate 0.90 0.20 U 0.20 U Nitrite 0.010 0.010 0.010 U Total Organic Carbon 2.62 0.966 U 0.966 U Dissolved Organic Carbon 2.6 0.97 U 0.97 U Total Kjeldahl Nitrogen 0.690 0.440 0.330 Total Phosphorous (PO4) 0.0500 U 0.110 0.0500 Total Suspended Solids 50 0.952 U 0.952 U 0.952 U Total TEQs (WHO TEFs) 0.0000000620 0.0000000509 0.0000000615 Cadmium 0.04 0.00100 U 0.00100 U 0.00100 U Chromium 0.21 0.00180 B 0.00100 B 0.000950 B Copper 0.136 0.00650 0.000500 B 0.000680 B Lead 0.038 0.00180 0.000800 B 0.000550 B Mercury 0.0002 0.0002 U 0.0002 U 0.0002 U
Sample ID: WQC H1S1
MMFOUT10 H1S1
BETGAC10 H1S1
GAC2OUT10 Date Collected: 9/7/2004 9/7/2004 9/7/2004 Total PCB 0.0003 0.0000766 NA NA Total PAHs 0.00926 U 0.00980 U 0.00926 U Ammonia Nitrogen 0.400 0.430 0.380 BOD (five day) 2 U 2 U 2 U COD 7 5U 5U Nitrate 0.90 0.20 U 0.20 U Nitrite 0.010 0.010 0.010 Total Organic Carbon 2.60 0.966 U 0.966 U Dissolved Organic Carbon 2.6 0.97 U 0.97 U Total Kjeldahl Nitrogen 0.610 0.360 0.340 Total Phosphorous (PO4) 0.0500 U 0.100 0.0900 Total Suspended Solids 50 0.952 U 0.952 U 0.952 U Total TEQs (WHO TEFs) 0.0000000624 0.0000000625 0.0000000502 Cadmium 0.04 0.00100 U 0.00100 U 0.00100 U Chromium 0.21 0.00130 B 0.00110 B 0.00100 B Copper 0.136 0.00780 0.000630 B 0.000480 B Lead 0.038 0.00190 0.000900 B 0.000670 B Mercury 0.0002 0.0002 U 0.0002 U 0.0002 U
General Electric CompanyHudson River PCBs Superfund SitePhase 1 Intermediate Design Report
Exhibit G.4.3 - Process Water Filtration & Carbon Adsorption
Page 1 of 5

General Electric CompanyHudson River PCBs Superfund SitePhase 1 Intermediate Design Report
Exhibit G.4.3 - Process Water Filtration & Carbon Adsorption
Sample ID: WQC H1S2
MMFIN H1S2
MMFOUT2 H1S2
BETGAC2 H1S2
GAC2OUT2 Date Collected: 9/14/2004 9/14/2004 9/14/2004 9/14/2004 Total PCB 0.0003 0.0000562 NA NA NA Total PAHs 0.00926 U 0.00926 U 0.00926 U 0.00943 U Ammonia Nitrogen 5.75 5.62 5.52 5.03 BOD (five day) 2 2 U 2 U 2 U COD 14 17 5U 5U Nitrate 0.20 U 0.20 U 0.20 U 0.20 U Nitrite 0.020 0.010 0.010 U 0.010 U Total Organic Carbon 4.13 3.85 0.966 U 0.966 U Dissolved Organic Carbon 3.8 4.2 0.97 U 0.97 U Total Kjeldahl Nitrogen 6.23 5.83 5.54 5.07 Total Phosphorous (PO4) 0.0500 U 0.0500 U 0.120 0.0800 Total Suspended Solids 50 5.97 1.00 1.00 U 1.00 U Total TEQs (WHO TEFs) 0.0000000248 NA NA NA Cadmium 0.04 0.0000900 B 0.00100 U 0.00100 U 0.00100 U Chromium 0.21 0.00170 B 0.00110 B 0.00160 B 0.00160 B Copper 0.136 0.0475 0.0152 0.00210 0.00230 Lead 0.038 0.0136 0.00280 0.00140 0.000750 B Mercury 0.0002 0.0002 U 0.0002 U 0.0002 U 0.0002 U
Sample ID: WQC H1S2
MMFOUT6 H1S2
BETGAC6 H1S2
GAC2OUT6 Date Collected: 9/14/2004 9/14/2004 9/14/2004 Total PCB 0.0003 0.0000461 0.00000934 U 0.00000934 U Total PAHs 0.00926 U 0.00926 U 0.00926 U Ammonia Nitrogen 5.75 5.55 5.25 BOD (five day) 2 U 2 U 2 U COD 5U 5U 5U Nitrate 0.20 U 0.20 U 0.20 U Nitrite 0.010 0.010 U 0.010 U Total Organic Carbon 3.89 0.966 U 0.966 U Dissolved Organic Carbon 3.6 0.97 U 0.97 U Total Kjeldahl Nitrogen 6.12 5.67 5.38 Total Phosphorous (PO4) 0.0500 U 0.0500 0.110 Total Suspended Solids 50 1.10 1.00 U 1.00 U Total TEQs (WHO TEFs) 0.0000000466 0.0000000616 0.0000000567 Cadmium 0.04 0.00100 U 0.00100 U 0.00100 U Chromium 0.21 0.00180 B 0.00150 B 0.00160 B Copper 0.136 0.0156 0.00260 0.00190 B Lead 0.038 0.00360 0.00230 0.00170 Mercury 0.0002 0.0002 U 0.0002 U 0.0002 U
Sample ID: WQC H1S2
MMFOUT10 H1S2
BETGAC10 H1S2
GAC2OUT10 Date Collected: 9/14/2004 9/14/2004 9/14/2004 Total PCB 0.0003 NA NA NA Total PAHs 0.00926 U 0.00926 U 0.00926 U Ammonia Nitrogen 5.66 5.51 5.36 BOD (five day) 2 U 2 U 2 U COD 17 5U 5U Nitrate 0.20 U 0.20 U 0.20 U Nitrite 0.010 0.010 U 0.010 U Total Organic Carbon 4.03 0.966 U 0.966 U Dissolved Organic Carbon 3.5 0.97 U 0.97 U Total Kjeldahl Nitrogen 6.07 5.78 5.58 Total Phosphorous (PO4) 0.0500 U 0.0700 0.130 Total Suspended Solids 50 1.20 1.20 1.00 U Total TEQs (WHO TEFs) NA NA NA Cadmium 0.04 0.00100 U 0.00100 U 0.00100 U Chromium 0.21 0.00260 0.00110 B 0.00140 B Copper 0.136 0.0191 0.00380 0.00250 Lead 0.038 0.00560 0.00280 0.00200 Mercury 0.0002 0.0002 U 0.0002 U 0.0002 U
Page 2 of 5

General Electric CompanyHudson River PCBs Superfund SitePhase 1 Intermediate Design Report
Exhibit G.4.3 - Process Water Filtration & Carbon Adsorption
Sample ID: WQC H1S3
MMFIN H1S3
MMFOUT2 H1S3
BETGAC2 H1S3
GAC2OUT2 Date Collected: 9/9/2004 9/9/2004 9/9/2004 9/9/2004 Total PCB 0.0003 0.0000443 0.0000254 J NA NA Total PAHs 0.00926 U 0.00926 U 0.00926 U 0.00943 U Ammonia Nitrogen 12.7 12.9 12.6 11.8 BOD (five day) 16 5 2 U 3 COD 19 16 5U 5 U Nitrate 3.3 3.3 0.30 0.20 Nitrite 2.0 2.1 0.10 0.020 Total Organic Carbon 5.30 5.32 0.966 U 0.966 U Dissolved Organic Carbon 5.8 5.2 0.97 U 0.97 U Total Kjeldahl Nitrogen 12.8 12.7 12.0 10.9 Total Phosphorous (PO4) 0.0500 U 0.0500 U 0.130 0.130 Total Suspended Solids 50 3.69 1.37 1.19 1.00 U Total TEQs (WHO TEFs) 0.0000000625 0.0000000619 0.0000000618 0.0000000620 Cadmium 0.04 0.000110 B 0.00100 U 0.00100 U 0.00100 U Chromium 0.21 0.00150 B 0.00150 B 0.00110 B 0.00130 B Copper 0.136 0.0118 0.0347 0.00190 B 0.00110 B Lead 0.038 0.00630 0.00560 0.00170 0.000510 B Mercury 0.0002 0.0002 U 0.0002 U 0.0002 U 0.0002 U
Sample ID: WQC H1S3
MMFOUT6 H1S3
BETGAC6 H1S3
GAC2OUT6 Date Collected: 9/9/2004 9/9/2004 9/9/2004 Total PCB 0.0003 0.0000199 J 0.00000934 U 0.00000934 U Total PAHs 0.00926 U 0.00926 U 0.00926 U Ammonia Nitrogen 13.2 12.8 12.8 BOD (five day) 3 7 3 COD 20 5U 5 U Nitrate 3.1 0.50 0.20 U Nitrite 2.0 0.38 0.030 Total Organic Carbon 5.13 0.966 U 0.966 U Dissolved Organic Carbon 4.7 0.97 U 0.97 U Total Kjeldahl Nitrogen 12.6 11.9 11.7 Total Phosphorous (PO4) 0.0500 U 0.0800 0.130 Total Suspended Solids 50 1.05 U 1.05 U 1.03 U Total TEQs (WHO TEFs) 0.0000000621 0.0000000616 0.0000000619 Cadmium 0.04 0.0000770 B 0.00100 U 0.00100 U Chromium 0.21 0.00160 B 0.00140 B 0.00140 B Copper 0.136 0.0208 0.00390 0.00130 B Lead 0.038 0.00460 0.00290 0.00170 Mercury 0.0002 0.0002 U 0.0002 U 0.0002 U
Sample ID: WQC H1S3
MMFOUT10 H1S3
BETGAC10 H1S3
GAC2OUT10 Date Collected: 0.0003 9/9/2004 9/9/2004 9/9/2004 Total PCB 0.0000191 J NA NA Total PAHs 0.00926 U 0.00926 U 0.00926 U Ammonia Nitrogen 13.1 13.5 12.4 BOD (five day) 6 2 U 6 COD 17 5U 5 U Nitrate 3.2 0.80 0.20 U Nitrite 2.1 0.67 0.050 Total Organic Carbon 5.21 0.966 U 0.966 U Dissolved Organic Carbon 5.1 0.97 U 0.97 U Total Kjeldahl Nitrogen 12.8 11.9 11.6 Total Phosphorous (PO4) 50 0.0500 U 0.0600 0.100 Total Suspended Solids 1.11 1.60 1.03 U Total TEQs (WHO TEFs) 0.04 0.0000000625 0.0000000506 0.0000000621 Cadmium 0.21 0.000140 B 0.00100 U 0.00100 U Chromium 0.136 0.00180 B 0.00160 B 0.00130 B Copper 0.038 0.0266 0.00190 B 0.00140 B Lead 0.038 0.00500 0.00530 0.00230 Mercury 0.0002 0.0002 U 0.0002 U 0.0002 U
Page 3 of 5

General Electric CompanyHudson River PCBs Superfund SitePhase 1 Intermediate Design Report
Exhibit G.4.3 - Process Water Filtration & Carbon Adsorption
Sample ID: WQC H1S4BMMFIN
H1S4BMMFOUT6
H1S4BBETGAC6
H1S4BGAC2OUT6
Date Collected: 9/15/2004 9/15/2004 9/15/2004 9/15/2004 Total PCB 0.0003 0.0000419 0.0000326 0.0000174 J 0.00000934 U Total PAHs 0.00926 U 0.00926 U 0.00926 U 0.00943 U Ammonia Nitrogen 19.9 19.1 16.6 19.2 BOD (five day) 2 2 U 2 U 2 U COD 31 29 7 6 Nitrate 0.20 U 0.20 U 0.20 U 0.20 U Nitrite 0.010 0.010 0.010 U 0.010 U Total Organic Carbon 9.35 9.13 1.11 0.966 U Dissolved Organic Carbon 8.2 7.4 0.97 U 0.97 U Total Kjeldahl Nitrogen 20.8 20.0 18.8 18.3 Total Phosphorous (PO4) 0.0500 U 0.0700 0.110 0.190 Total Suspended Solids 50 13.5 8.30 5.10 2.50 Total TEQs (WHO TEFs) 0.0000000623 0.0000000509 0.0000000512 0.0000000499 Cadmium 0.04 0.000290 B 0.000260 B 0.000120 B 0.0000760 B Chromium 0.21 0.00440 0.00400 0.00260 0.00230 Copper 0.136 0.0377 0.0605 0.0126 0.00730 Lead 0.038 0.00920 0.0177 0.00860 0.00510 Mercury 0.0002 0.0002 U 0.0002 U 0.0002 U 0.0002 U
Sample ID: WQC
H1S4BGAC2OUT6-
DUP Date Collected: 9/15/2004 Total PCB 0.0003 0.0000122 J Total PAHs 0.00943 U Ammonia Nitrogen NA BOD (five day) NA COD NA Nitrate NA Nitrite NA Total Organic Carbon 0.966 U Dissolved Organic Carbon 0.97 U Total Kjeldahl Nitrogen NA Total Phosphorous (PO4) NA Total Suspended Solids 50 2.40 Total TEQs (WHO TEFs) 0.0000000615 Cadmium 0.04 0.00100 U Chromium 0.21 0.00220 Copper 0.136 0.00890 Lead 0.038 0.00520 Mercury 0.0002 0.0002 U
Page 4 of 5

General Electric CompanyHudson River PCBs Superfund SitePhase 1 Intermediate Design Report
Exhibit G.4.3 - Process Water Filtration & Carbon Adsorption
Sample ID: WQC H2S4BMMFIN
H2S4BMMFOUT2
H2S4BBETGAC2
H2S4BGAC2OUT2
Date Collected: 9/13/2004 9/13/2004 9/13/2004 9/13/2004 Total PCB 0.0003 0.0000322 J NA NA NA Total PAHs 0.00926 U 0.00926 U 0.00926 U 0.00943 U Ammonia Nitrogen 3.83 3.71 3.49 3.49 BOD (five day) 15 11 6 10 COD 7 8 5 U 5 U Nitrate 2.0 1.9 0.20 U 0.20 U Nitrite 0.29 0.37 0.070 0.040 Total Organic Carbon 2.83 2.96 0.966 U 0.966 U Dissolved Organic Carbon 2.8 2.6 0.97 U 0.97 U Total Kjeldahl Nitrogen 4.47 4.25 4.03 3.56 Total Phosphorous (PO4) 0.0500 U 0.0500 U 0.0120 0.0500 U Total Suspended Solids 50 3.00 1.20 1.00 U 1.00 U Total TEQs (WHO TEFs) 0.0000000288 NA NA NA Cadmium 0.04 0.0000730 B 0.00100 U 0.00100 U 0.00100 U Chromium 0.21 0.00210 0.00220 0.00120 B 0.00110 B Copper 0.136 0.0616 0.0157 0.00170 B 0.000980 B Lead 0.038 0.0197 0.00640 0.00280 0.000880 B Mercury 0.0002 0.0002 U 0.0002 U 0.0002 U 0.0002 U
Sample ID: WQC H2S4B
MMFOUT6 H2S4B
BETGAC6 H2S4B
GAC2OUT6 Date Collected: 9/13/2004 9/13/2004 9/13/2004 Total PCB 0.0003 0.0000252 J 0.00000934 U 0.00000934 U Total PAHs 0.00926 U 0.00926 U 0.00926 U Ammonia Nitrogen 3.70 3.57 3.53 BOD (five day) 16 15 12 COD 8 5 U 6 U Nitrate 2.2 0.30 0.20 U Nitrite 0.38 0.22 0.060 Total Organic Carbon 3.20 0.966 U 0.966 U Dissolved Organic Carbon 2.8 0.97 U 0.97 U Total Kjeldahl Nitrogen 4.19 3.67 3.54 Total Phosphorous (PO4) 0.0500 U 0.0500 0.140 Total Suspended Solids 50 1.00 U 1.10 1.00 U Total TEQs (WHO TEFs) 0.0000000624 0.0000000625 0.0000000482 Cadmium 0.04 0.00100 U 0.00100 U 0.00100 U Chromium 0.21 0.00180 B 0.00240 0.00150 B Copper 0.136 0.0192 0.00320 0.00210 Lead 0.038 0.00820 0.00440 0.00340 Mercury 0.0002 0.0002 U 0.0002 U 0.0002 U
Sample ID: WQC H2S4B
BETGAC6-DUP Date Collected: 9/13/2004 Total PCB 0.0003 0.00000934 U Total PAHs 0.00926 U Ammonia Nitrogen NA BOD (five day) NA COD NA Nitrate NA Nitrite NA Total Organic Carbon 0.966 U Dissolved Organic Carbon 0.97 U Total Kjeldahl Nitrogen NA Total Phosphorous (PO4) NA Total Suspended Solids 50 1.20 Total TEQs (WHO TEFs) NA Cadmium 0.04 0.00100 U Chromium 0.21 0.00140 B Copper 0.136 0.00350 Lead 0.038 0.00470 Mercury 0.0002 0.0002 U
Notes:All results as mg/LThis table is condensed from Table 24 of IDR Attachment 4 (Treatability Studies Report).
Page 5 of 5

Max Conc:#/Day Limit:
(MGD)0.10.20.5
0.6610.978
1.01.862.0
DRET Test ResultsSediment Cadmium Cadmium Chromium Chromium Copper Copper Lead Lead Mercury Mercury
Type Unfiltered Filtered Unfiltered Filtered Unfiltered Filtered Unfiltered Filtered Unfiltered Filtered
S1 0.0021 0.001 U 0.0737 0.00227 0.0422 0.00243 0.0731 0.00063 B 0.000343 0.0002 U
S2 0.0413 0.000343 XB 0.633 0.0054 0.103 0.0035 0.766 0.0165 0.00517 0.0002 U
S3 0.025 0.000297 B 0.347 X 0.00533 0.0726 X 0.00287 0.45 0.0077 0.00263 0.0002 U
S4B 0.0669 0.00025 B 0.719 X 0.00563 0.107 X 0.00237 B 0.997 0.0104 0.00757 0.0002 U
S1 0.0014 0.001 U 0.0556 0.0038 X 0.0329 0.0033 X 0.0551 0.0030 0.00024 0.0002 U
S2 0.0238 0.0002 B 0.3563 0.0075 X 0.0549 0.0025 X 0.4103 0.0165 0.00303 0.0002 U
S3 0.0256 X 0.0013 B 0.361 X 0.0250 X 0.0701 0.0086 0.4653 0.0315 0.00293 0.000206 UB
S4B 0.0557 0.0009 B 0.633 X 0.0155 X 0.0880 0.0039 0.8473 0.0247 0.00670 0.00022 U
Notes:
1. Concentrations are as mg/L.
2. DRET1 test results are estimated due to temperature as received. Tests were redone as DRET2.
3. DRET test results are average of three replicates.
4. Shading:
Indicates DRET concentrations were below Water Quality Certification Substantive Requirements (at maximum concentration,
which decreases as flow rate increases).
Indicates flow rate at which concentration limit applies (not mass limit).
5. Laboratory qualifiers: U=not detected at Laboratory Quantitation Limit, B=estimated value and X=method blank contamination.
Concentration Limit at Max. Mass Flow Rate
General Electric CompanyHudson River PCBs Superfund SitePhase 1 Intermediate Design Report
Exhibit G.4.4 - Comparison of DRET Test Results and WQC Substantive Requirements
Pb0.0380.31
HgCd
0.00020.00020.00020.00020.0002
0.00020.00020.0002
0.019
0.0380.0380.0380.0380.0380.0370.020
0.090
0.0450.048
Cu0.1360.75
0.136
0.1360.092
0.1360.136
0.040.62
Cr0.2118.9
0.2100.2100.2100.210
0.0400.0400.0400.040
DRET 1
DRET 2
0.0400.0400.0400.037
0.2100.2100.2100.210
Page 1 of 1

Exhibit G.5
Processed Material Staging and Load-Out Facilities
Includes: Waterfront Staging and Load-Out Calculations
Load-out Facility Storage Volume Requirements
Staging/Storage Area Capacities Rail Car Loading Calculations

Exhibit G.5.1
Processed Material Staging and Load-Out Facilities Design Calculations

Waterfront Staging and Load-Out Calculations


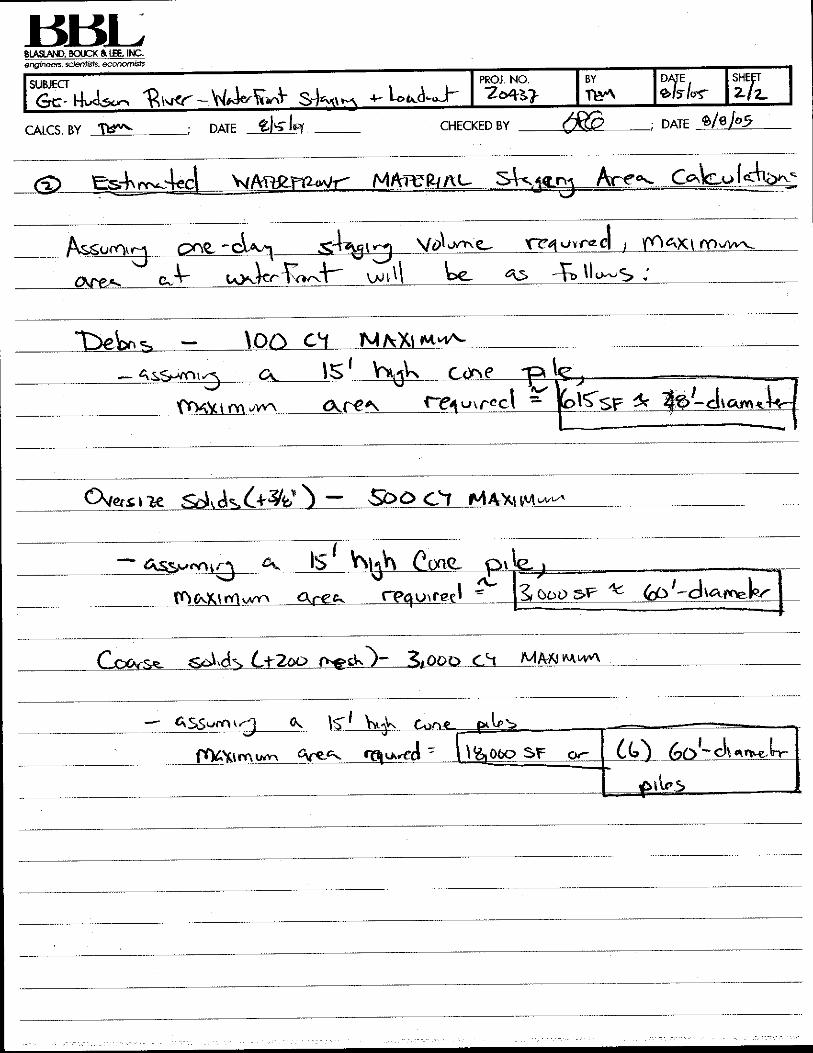

Load-Out Facility Storage Volume Requirements


Phase 1 Train Scenario 1Tons Cum Tons Unit Trains Tons Cum Tons Storage Storage Delta
Week Processed Processed Shipped Shipped Shipped (tons) (cy) Storage (cy)May 1 5174 5174 0 0 0 5174 3449 3449
2 2807 7980 0 0 0 7980 5320 18713 11718 19698 1 8505 8505 11193 7462 21424 12611 32309 1 8505 17010 15299 10199 2737
June 5 20646 52954 1 8505 25515 27439 18293 80946 22217 75172 2 17010 42525 32647 21764 34717 18406 93578 2 17010 59535 34043 22695 9318 23336 116914 2 17010 76545 40369 26912 42179 26403 143316 2 17010 93555 49761 33174 6262
July 10 30852 174168 2 17010 110565 63603 42402 922811 31929 206097 2 17010 127575 78522 52348 994612 33934 240031 2 17010 144585 95446 63630 1128313 31504 271535 2 17010 161595 109940 73293 9663
August 14 21320 292855 2 17010 178605 114250 76166 287315 19033 311888 2 17010 195615 116273 77515 134916 16843 328731 2 17010 212625 116106 77404 -11117 20905 349636 2 17010 229635 120001 80001 259718 21535 371171 2 17010 246645 124526 83017 3017
September 19 10610 381781 2 17010 263655 118126 78751 -426720 4320 386101 2 17010 280665 105436 70291 -846021 4754 390855 2 17010 297675 93180 62120 -817122 4307 395162 2 17010 314685 80477 53651 -8469
October 23 3038 398200 2 17010 331695 66505 44337 -931524 0 398200 2 17010 348705 49495 32997 -1134025 0 398200 2 17010 365715 32485 21657 -1134026 0 398200 2 17010 382725 15475 10317 -1134027 0 398200 2 17010 399735 -1535 -1023 -11340
November 28 0 398200 0 399735 102329 0 398200 0 399735 030 0 398200 0 399735 031 0 398200 0 399735 0
December 32 0 398200 0 399735 033 0 398200 0 399735 034 0 398200 0 399735 035 0 398200 0 399735 0
Note - assumes 81-car trains, 105 tons per car (8,505 tons per train).

Phase 1 Train Scenario 2Tons Cum Tons Unit Trains Tons Cum Tons Storage Storage Delta
Week Processed Processed Shipped Shipped Shipped (tons) (cy) Storage (cy)May 1 5174 5174 0 0 0 5174 3449 3449
2 2807 7980 0 0 0 7980 5320 18713 11718 19698 1 8505 8505 11193 7462 21424 12611 32309 1 8505 17010 15299 10199 2737
June 5 20646 52954 1 8505 25515 27439 18293 80946 22217 75172 1 8505 34020 41152 27434 91417 18406 93578 2 17010 51030 42548 28365 9318 23336 116914 2 17010 68040 48874 32582 42179 26403 143316 2 17010 85050 58266 38844 6262
July 10 30852 174168 2 17010 102060 72108 48072 922811 31929 206097 2 17010 119070 87027 58018 994612 33934 240031 3 25515 144585 95446 63630 561313 31504 271535 3 25515 170100 101435 67623 3993
August 14 21320 292855 3 25515 195615 97240 64826 -279715 19033 311888 3 25515 221130 90758 60505 -432116 16843 328731 3 25515 246645 82086 54724 -578117 20905 349636 3 25515 272160 77476 51651 -307318 21535 371171 2 17010 289170 82001 54667 3017
September 19 10610 381781 2 17010 306180 75601 50401 -426720 4320 386101 2 17010 323190 62911 41941 -846021 4754 390855 2 17010 340200 50655 33770 -817122 4307 395162 2 17010 357210 37952 25301 -8469
October 23 3038 398200 2 17010 374220 23980 15987 -931524 0 398200 1 8505 382725 15475 10317 -567025 0 398200 1 8505 391230 6970 4647 -567026 0 398200 1 8505 399735 -1535 -1023 -567027 0 398200 0 399735 1023
November 28 0 398200 0 399735 029 0 398200 0 399735 030 0 398200 0 399735 031 0 398200 0 399735 0
December 32 0 398200 0 399735 033 0 398200 0 399735 034 0 398200 0 399735 035 0 398200 0 399735 0
Note - assumes 81-car trains, 105 tons per car (8,505 tons per train).
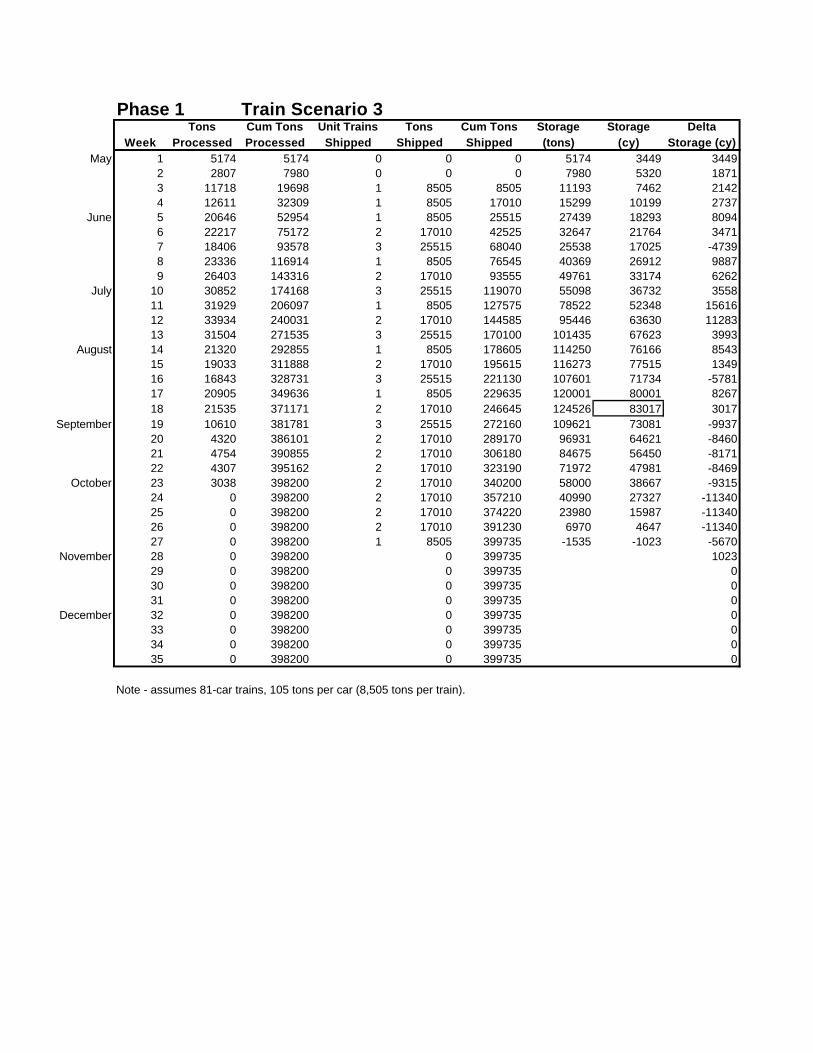
Phase 1 Train Scenario 3Tons Cum Tons Unit Trains Tons Cum Tons Storage Storage Delta
Week Processed Processed Shipped Shipped Shipped (tons) (cy) Storage (cy)May 1 5174 5174 0 0 0 5174 3449 3449
2 2807 7980 0 0 0 7980 5320 18713 11718 19698 1 8505 8505 11193 7462 21424 12611 32309 1 8505 17010 15299 10199 2737
June 5 20646 52954 1 8505 25515 27439 18293 80946 22217 75172 2 17010 42525 32647 21764 34717 18406 93578 3 25515 68040 25538 17025 -47398 23336 116914 1 8505 76545 40369 26912 98879 26403 143316 2 17010 93555 49761 33174 6262
July 10 30852 174168 3 25515 119070 55098 36732 355811 31929 206097 1 8505 127575 78522 52348 1561612 33934 240031 2 17010 144585 95446 63630 1128313 31504 271535 3 25515 170100 101435 67623 3993
August 14 21320 292855 1 8505 178605 114250 76166 854315 19033 311888 2 17010 195615 116273 77515 134916 16843 328731 3 25515 221130 107601 71734 -578117 20905 349636 1 8505 229635 120001 80001 826718 21535 371171 2 17010 246645 124526 83017 3017
September 19 10610 381781 3 25515 272160 109621 73081 -993720 4320 386101 2 17010 289170 96931 64621 -846021 4754 390855 2 17010 306180 84675 56450 -817122 4307 395162 2 17010 323190 71972 47981 -8469
October 23 3038 398200 2 17010 340200 58000 38667 -931524 0 398200 2 17010 357210 40990 27327 -1134025 0 398200 2 17010 374220 23980 15987 -1134026 0 398200 2 17010 391230 6970 4647 -1134027 0 398200 1 8505 399735 -1535 -1023 -5670
November 28 0 398200 0 399735 102329 0 398200 0 399735 030 0 398200 0 399735 031 0 398200 0 399735 0
December 32 0 398200 0 399735 033 0 398200 0 399735 034 0 398200 0 399735 035 0 398200 0 399735 0
Note - assumes 81-car trains, 105 tons per car (8,505 tons per train).

Phase 1 Train Scenario 4Tons Cum Tons Unit Trains Tons Cum Tons Storage Storage Delta
Week Processed Processed Shipped Shipped Shipped (tons) (cy) Storage (cy)May 1 5174 5174 0 0 0 5174 3449 3449
2 2807 7980 0 0 0 7980 5320 18713 11718 19698 1 8505 8505 11193 7462 21424 12611 32309 2 17010 25515 6794 4529 -2933
June 5 20646 52954 2 17010 42525 10429 6953 24246 22217 75172 2 17010 59535 15637 10424 34717 18406 93578 3 25515 85050 8528 5685 -47398 23336 116914 3 25515 110565 6349 4232 -14539 26403 143316 3 25515 136080 7236 4824 592
July 10 30852 174168 3 25515 161595 12573 8382 355811 31929 206097 3 25515 187110 18987 12658 427612 33934 240031 3 25515 212625 27406 18270 561313 31504 271535 3 25515 238140 33395 22263 3993
August 14 21320 292855 3 25515 263655 29200 19466 -279715 19033 311888 3 25515 289170 22718 15145 -432116 16843 328731 3 25515 314685 14046 9364 -578117 20905 349636 3 25515 340200 9436 6291 -307318 21535 371171 2 17010 357210 13961 9307 3017
September 19 10610 381781 2 17010 374220 7561 5041 -426720 4320 386101 1 8505 382725 3376 2251 -279021 4754 390855 1 8505 391230 -375 -250 -250122 4307 395162 0 391230 3932 2621 2871
October 23 3038 398200 0 391230 6970 4647 202524 0 398200 0 391230 -464725 0 398200 0 391230 026 0 398200 0 391230 027 0 398200 0 391230 0
November 28 0 398200 0 391230 029 0 398200 0 391230 030 0 398200 0 391230 031 0 398200 0 391230 0
December 32 0 398200 0 391230 033 0 398200 0 391230 034 0 398200 0 391230 035 0 398200 0 391230 0
Note - assumes 81-car trains, 105 tons per car (8,505 tons per train).
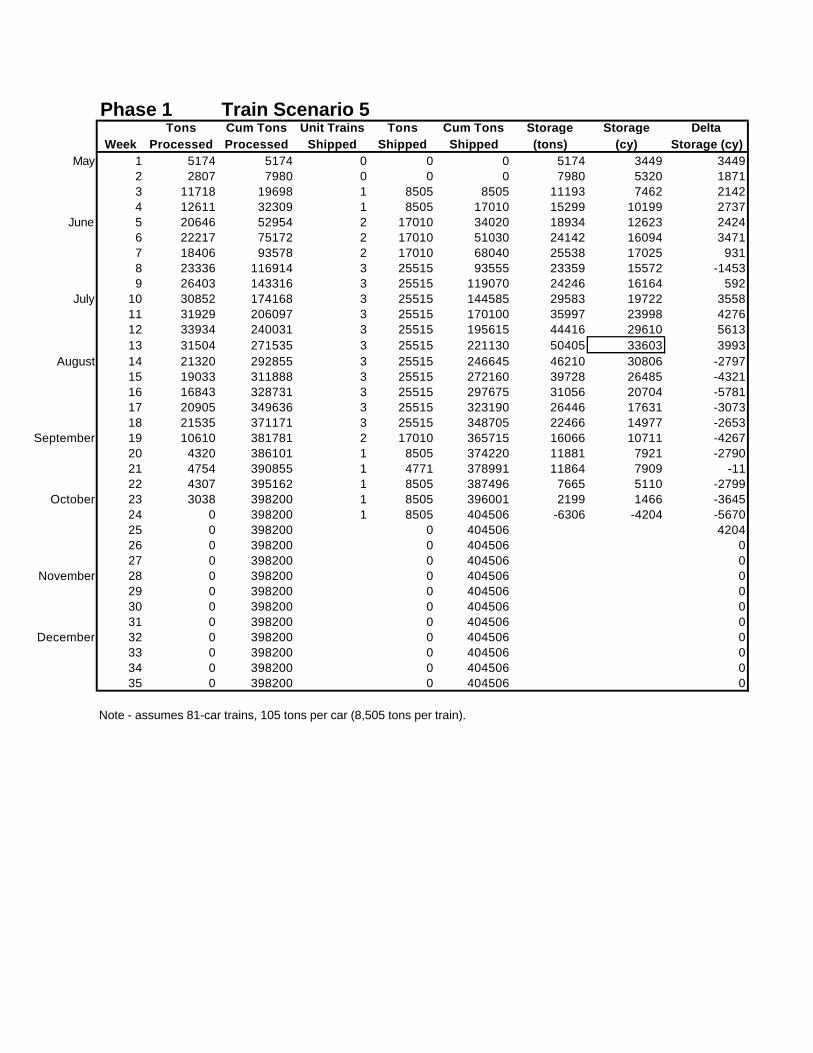
Phase 1 Train Scenario 5Tons Cum Tons Unit Trains Tons Cum Tons Storage Storage Delta
Week Processed Processed Shipped Shipped Shipped (tons) (cy) Storage (cy)May 1 5174 5174 0 0 0 5174 3449 3449
2 2807 7980 0 0 0 7980 5320 18713 11718 19698 1 8505 8505 11193 7462 21424 12611 32309 1 8505 17010 15299 10199 2737
June 5 20646 52954 2 17010 34020 18934 12623 24246 22217 75172 2 17010 51030 24142 16094 34717 18406 93578 2 17010 68040 25538 17025 9318 23336 116914 3 25515 93555 23359 15572 -14539 26403 143316 3 25515 119070 24246 16164 592
July 10 30852 174168 3 25515 144585 29583 19722 355811 31929 206097 3 25515 170100 35997 23998 427612 33934 240031 3 25515 195615 44416 29610 561313 31504 271535 3 25515 221130 50405 33603 3993
August 14 21320 292855 3 25515 246645 46210 30806 -279715 19033 311888 3 25515 272160 39728 26485 -432116 16843 328731 3 25515 297675 31056 20704 -578117 20905 349636 3 25515 323190 26446 17631 -307318 21535 371171 3 25515 348705 22466 14977 -2653
September 19 10610 381781 2 17010 365715 16066 10711 -426720 4320 386101 1 8505 374220 11881 7921 -279021 4754 390855 1 4771 378991 11864 7909 -1122 4307 395162 1 8505 387496 7665 5110 -2799
October 23 3038 398200 1 8505 396001 2199 1466 -364524 0 398200 1 8505 404506 -6306 -4204 -567025 0 398200 0 404506 420426 0 398200 0 404506 027 0 398200 0 404506 0
November 28 0 398200 0 404506 029 0 398200 0 404506 030 0 398200 0 404506 031 0 398200 0 404506 0
December 32 0 398200 0 404506 033 0 398200 0 404506 034 0 398200 0 404506 035 0 398200 0 404506 0
Note - assumes 81-car trains, 105 tons per car (8,505 tons per train).

Rail Car Loading Calculations


Exhibit G.8
Site Work, Roads, Utilities, and Administrative Areas
Includes: TR-55 Curve Number and
Run-Off Depth Calculations Processing Facility Estimated Stormwater
Storage Volumes Processing Facility Earthwork and Select
Fill Summary Table

Exhibit G.8.1
Site Work, Roads, Utilities, and Administrative Areas Design Calculations