ATM S 212 Air Pollution: From Urban Smog to the … · ATM S 212 Air Pollution: From Urban Smog to...
19
1 ATM S 212 Air Pollution: From Urban Smog to the Ozone Hole Instructor: Professor Becky Alexander Office hours: M and Th 11:30-12:30 in 306 ATG Required textbook: “Earth Under Siege” by Richard Turco Course description: This course is an introduction to air pollution on local, regional and global scales. We will focus on the sources, transformation, and dispersion of pollutants responsible for urban smog, acid rain, climate change and the stratospheric ozone hole. We will examine the health and environmental impacts of air pollutants, as well as current (or potential) technological solutions and policy regulations. Student learning goals • Understand how emissions, transport, chemistry and deposition impact air pollution. • Explain the chemical and physical mechanisms behind ozone depletion, air pollution and acid rain • Develop skills to critically evaluate discussions of air pollution and climate change based on scientific evidence and organized knowledge
Transcript of ATM S 212 Air Pollution: From Urban Smog to the … · ATM S 212 Air Pollution: From Urban Smog to...

1
ATM S 212Air Pollution: From Urban Smog
to the Ozone Hole
Instructor: Professor Becky AlexanderOffice hours: M and Th 11:30-12:30 in 306 ATG
Required textbook: “Earth Under Siege” by Richard Turco
Course description:
This course is an introduction to air pollution on local, regional and global scales. We will focus on the sources,
transformation, and dispersion of pollutants responsible for urban smog, acid rain, climate change and the stratospheric ozone hole. We will examine the health and environmental
impacts of air pollutants, as well as current (or potential) technological solutions and policy regulations.
Student learning goals
• Understand how emissions, transport, chemistry and deposition impact air pollution.
• Explain the chemical and physical mechanisms behind ozone depletion, air pollution and acid rain
• Develop skills to critically evaluate discussions of air pollution and climate change based on scientific evidence and organized knowledge

2
The Natural World Credit (from the UW website)
“Courses in this Area focus on the disciplined, scientific study of the natural world. The Area can be divided into three broad categories: the mathematical sciences, the physical sciences, and the biological sciences.”
This course will utilize applications of basic math/physical science concepts to Earth science problems. Thus, there
will be some math (basic algebra) and science (basic chemistry) involved. I assume you have all had algebra in high school but may need a review, and you may not have
taken chemistry. Thus, Friday classes are important!
Grading policy:Exams (4) 60%Class participation (15%)Papers (15%)Poster presentation (10%)
How to do well in this class:• Attend lectures and ask questions. Read the textbook for supplemental information.
• Attempt practice problems in advance and come to practice problem solving sessions on Fridays.
• Get started early on your final project.
• Discuss project topic with the instructor before beginning yourfinal project.
Class Web Site:
http://www.atmos.washington.edu/academics/classes/2011Q1/212/

3
Class Policies
• Late assignments (papers and posters) or exams are accepted only with at least 24 hours advanced OK from the instructor (me).
• If you miss class, copy notes from a classmate. Lecture slides are available on the class web site.
• If you feel your exam was graded incorrectly, you must submit your complaint to the instructor in writing, along with your graded exam, no earlier than 24 hours, but no later than one week, after your graded exam is returned to you. Your entire exam will be re-graded.
• Questions about lectures, homework or exams should be directed to the on-line message board. Only email me for personal reasons.
• Bring a calculator to class!
Important dates
• In class exams: Fridays Jan. 14, Jan. 28, Feb. 11, and Mar. 4
• Final project papers are due on Monday, March 7.• “W” papers: First draft due on Friday, March 4, final draft
due on Friday, March 11.• There is no class on Monday, Jan. 17 or Monday, Feb.
21 (UW holidays)
4
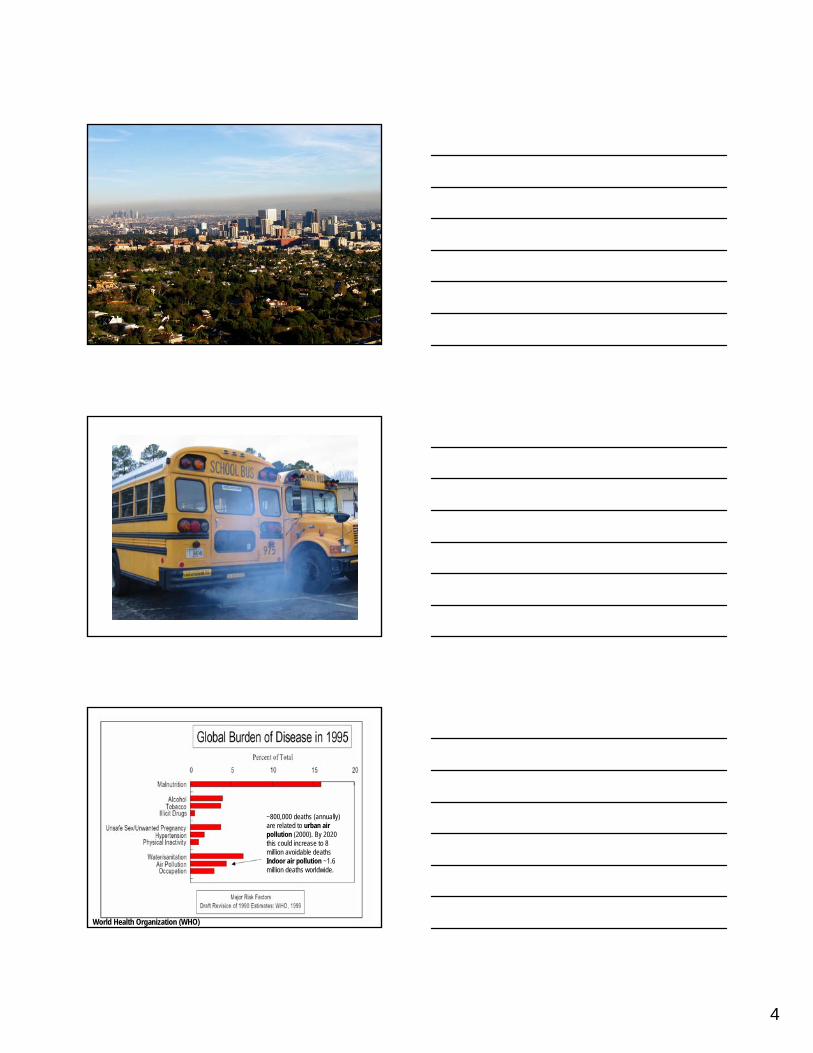
~800,000 deaths (annually) are related to urban air pollution (2000). By 2020 this could increase to 8 million avoidable deathsIndoor air pollution ~1.6 million deaths worldwide.
World Health Organization (WHO)

5
for California
http://www.arb.ca.gov/research/health/fs/pm-03fs.pdf
How close are you willing to live to a freeway?
Figure from: The East Bay Children's Respiratory Health Study of Traffic-Related Air Pollution Near Busy Roads
http://www.arb.ca.gov/research/eb-kids/bc-dist.jpg
Turco, Figure 7.1

6
Physiological response of carbon monoxide (CO)
O2 in air attaches to hemoglobin in the red blood cells.
CO can also attach to hemoglobin formingcarboxyhemoglobin (CO-hb)
→ reduces the availability of O2 to thebody
1001 100.1Exposure (hr)
105
1
100
50
Per
cent
car
boxy
hem
oglo
bin
DeathComaVomiting, collapseThrobbing, headacheHeadache,reduced mental acuity
No symptoms
600 ppmv CO
300 ppmv CO
100 ppmv CO
30 ppmv CO15 ppmv CO
Physiological effects of human exposure to CO
Turco, Table 7.1

7
Turco, Table 7.2
Health effects of air pollutants
World Health Organization, Health aspects of air pollution, 2004.
Non-smoker lung - from a 47 year oldcity-dweller. The black spots are caused by carbon particles from air pollution
Blackened lung of a smoker.Whitish area is the developingarea of lung cancer
Healthy vs. Smoker Lung

8
~800,000 deaths (annually) are related to urban air pollution (2000). By 2020 this could increase to 8 million avoidable deathsIndoor air pollution ~1.6 million deaths worldwide.
World Health Organization (WHO)
for California
http://www.arb.ca.gov/research/health/fs/pm-03fs.pdf
Killer Smog in London
Turco Figure 6.1
9
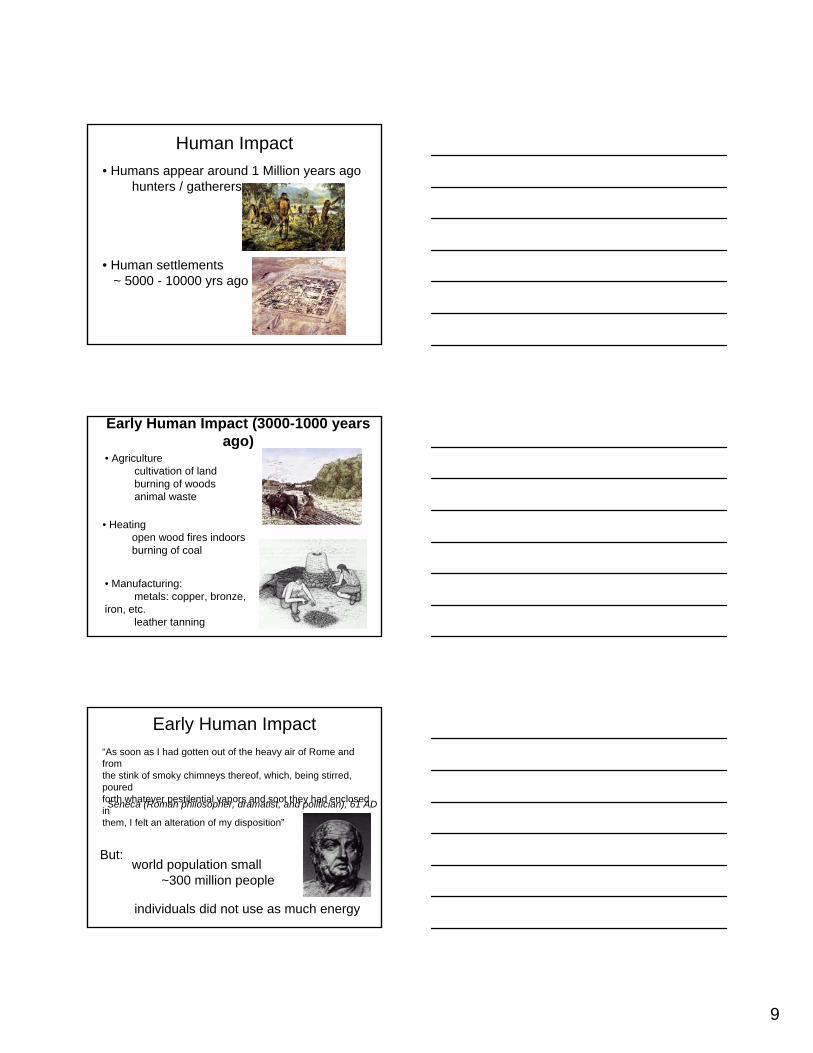
Human Impact• Humans appear around 1 Million years ago
hunters / gatherers
• Human settlements ~ 5000 - 10000 yrs ago
Early Human Impact (3000-1000 years ago)
• Agriculture cultivation of landburning of woodsanimal waste
• Heating open wood fires indoorsburning of coal
• Manufacturing:metals: copper, bronze,
iron, etc.leather tanning
Early Human Impact
But: world population small
~300 million people
individuals did not use as much energy
“As soon as I had gotten out of the heavy air of Rome and from the stink of smoky chimneys thereof, which, being stirred, pouredforth whatever pestilential vapors and soot they had enclosed in them, I felt an alteration of my disposition”
Seneca (Roman philosopher, dramatist, and politician), 61 AD

10
Industrialization1784 Watt invents the steam engine
fired by coal
James Watt (1736-1819)
Edgar Fahs Smith Collection, University of Pennsylvania Library
Used to pump water out of mines; Energy for mills (paper, iron, flour, cotton, steel), distilleries, locomotives…
Hundred-fold global increase in coal combustion between 1800 and 1900.
Examples
1876 AD
Reading, Pennsylvania (c. 1909)Coal combustion in U.S. ~ 1900s…
…for steel manufacturing, iron manufacturing, railway transportation
Youngstown, Ohio (c. 1910)
Gary, Indiana (c. 1912)

11
London Smog, 1900s
Claude Monet: “Waterloo Bridge, Fog Effect” (1903)
Claude Monet: “Houses of Parliament, Effects of Sunlight in the Fog” (1904)
…London, 1900s
James Tissot: “The Thames” (1876)
London Smog of 1952
Fog + smoke from coal burning Worst single pollution episode in the UK. December 5-8 1952: 4,000 people died, another 8,000 died in the weeks-months that followed
BBC Newshttp://news.bbc.co.uk/1/hi/england/2543875.stm
Turco Figure 6.1

12
Noontime, Donora, Pennsylvania, October 29, 1948
Copyright Photo Archive/Pittsburgh Post-Gazette, 2001. All rights reserved
Pollution from steel mills and zinc smeltersDeadly episode: Oct 26-31 1948 – 20 people died, 7,000 people with respiratory illness “killer smog”
Smog Bothers Pedestrians, Los Angeles (1950s)
Hollywood Citizens News Collection, Los Angeles Public Library
Factories + cars
Urban smog
Tropospheric ozone column: Jun-Aug
Build-up of gases+particles in citiesCauses: Combustion products (cars, smokestacks…)+industryEffects: Human+animal health; vegetation; structuresScale: 10s-100s of kilometersTime: 1850s-present
EPA’s ozone report, 2003 (http://www.epa.gov/airtrends/ozone.html)
159 million people
Nonattainment areas (2000-2003) for surface ozone
13
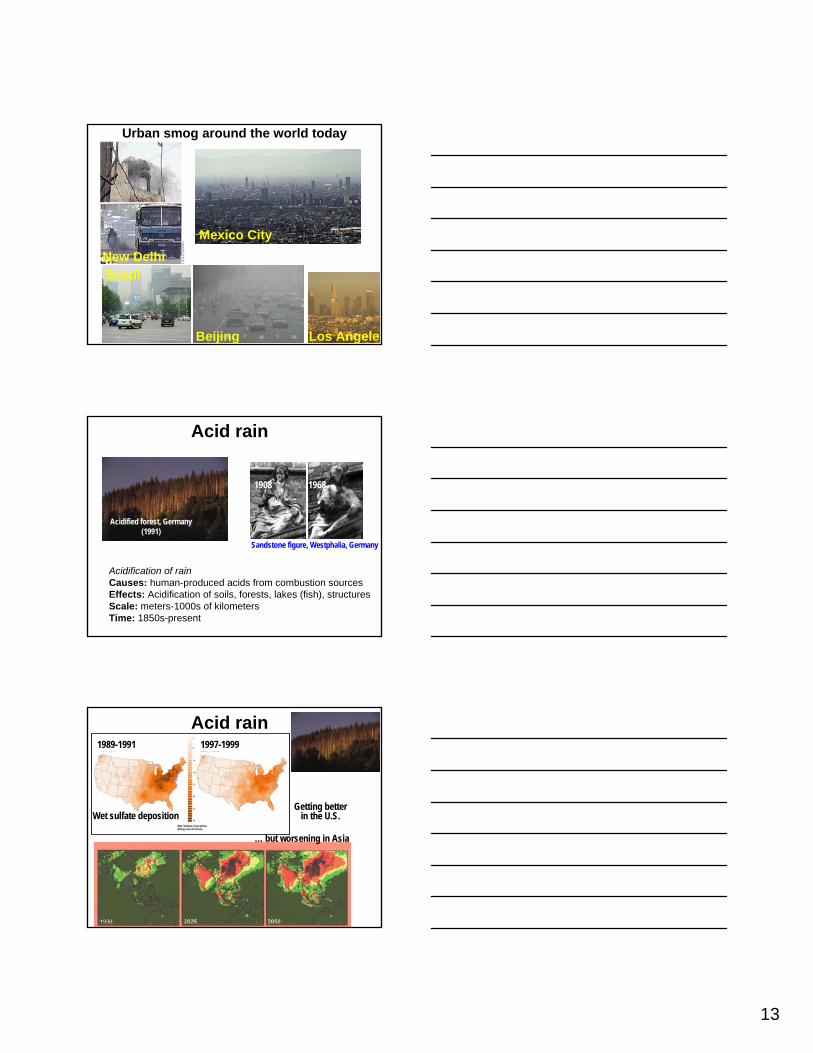
Urban smog around the world today
New DelhiMexico City
Los Angeles
Seoul
Beijing
Acid rain
Tropospheric ozone column: Jun-Aug
Acidification of rainCauses: human-produced acids from combustion sources Effects: Acidification of soils, forests, lakes (fish), structuresScale: meters-1000s of kilometersTime: 1850s-present
Acidified forest, Germany (1991)
Sandstone figure, Westphalia, Germany
1908 1968
Acid rain
Tropospheric ozone column: Jun-Aug
1989-1991 1997-1999
Wet sulfate depositionGetting better
in the U.S.
… but worsening in Asia
14
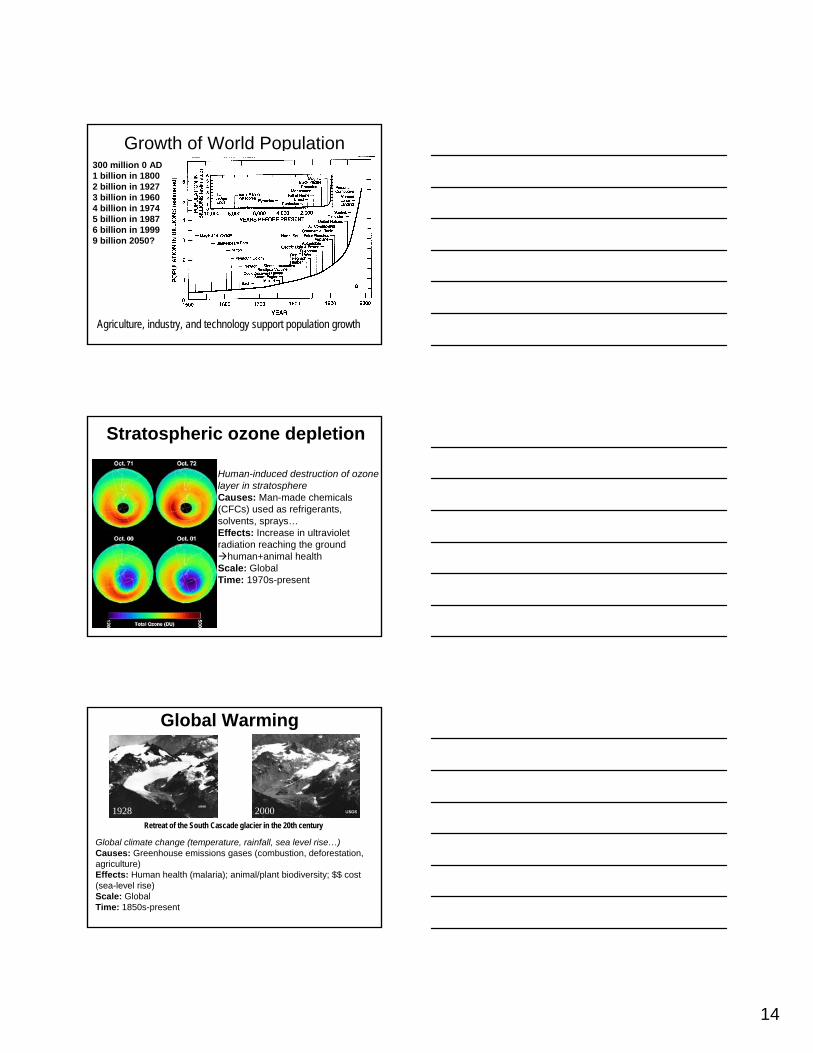
Growth of World Population300 million 0 AD1 billion in 1800 2 billion in 1927 3 billion in 1960 4 billion in 1974 5 billion in 1987 6 billion in 19999 billion 2050?
Agriculture, industry, and technology support population growth
Stratospheric ozone depletion
Human-induced destruction of ozone layer in stratosphere Causes: Man-made chemicals (CFCs) used as refrigerants, solvents, sprays…Effects: Increase in ultraviolet radiation reaching the ground
human+animal healthScale: GlobalTime: 1970s-present
1928 2000Retreat of the South Cascade glacier in the 20th century
Global Warming
Global climate change (temperature, rainfall, sea level rise…)Causes: Greenhouse emissions gases (combustion, deforestation, agriculture) Effects: Human health (malaria); animal/plant biodiversity; $$ cost (sea-level rise) Scale: GlobalTime: 1850s-present

15
Past and future surface temperature
The Future• Developed Countries:
high living standard → high per-capita resource consumption→ more pollution per person
small population (~ 1 billion)• Less developed Countries:
low living standard → low per-capita resource consumption→ less pollution per person
large population (~ 5 billion)
What is going to happen when/if poorer countries reach our lifestyle?
Future population

16
What is an atom?
electron neutron
proton
The kind of atom is determined by the number of protons and neutrons.
Nomenclature:symbol protons neutrons nameH 1 0 hydrogenHe 2 2 heliumN 7 7 nitrogenC 6 6 carbonO 8 8 oxygen
Periodic table of elements
Atomic number = # of protons
Two or more atoms that are bound together formingone unit.
Nomenclature:
water H2O
What is a molecule?
H OH
hydrogen
number of H atomsin molecule
oxygen

17
Other Examples
O O
O O
Oxygen molecule: O2
O Ozone molecule: O3
O C O Carbon dioxide molecule: CO2
Chemical Reactions
O3 + NO → NO2 + O2
What happens: (not every collision leads to a reaction)
O N
O OO
O NO
O O
we say: O3 (ozone) reacts with NO (nitric oxide) to form NO2(nitrogen dioxide) and O2(oxygen)
Nomenclature of Chemical Reactions
O3 + NO → NO2 + O2
reactants products
Rules:• the number of specific atoms, for example O, N,
etc. are always the same on both sides.• in air reaction only occur with 2 reactants• whether a reaction occurs depends on many things, that we will not discuss in this class
4 O atoms + 1 N atom = 4 O atoms and 1 N atom
direction of reaction

18
Concentration
1 m
1 m
1 m
20 Tennis Balls in the cube
VolumesubstanceofAmountC =
33 mballs20
1mballs 20C ==
Gas: molecules in Volume⇒ unit:
3cmmolec.
31111Volume mmmm =××=
1 m
1 m
1 m
Mixing Ratio (M.R.)
substancesallofAmountsubstanceoneofAmountM.R. =
20 tennis balls in the cube2 of those red balls
0.1balls 20balls red 2M.R. ==
no unit
Mixing Ratiosname symbol ratio
One percent 1% 10-2 one out of each 100One part per million 1ppm 10-6 one out of each millionOne part per billion 1ppb 10-9 one out of each billionOne part per trillion 1ppt 10-12 one out of each trillion
Volume / Number Mass
substancesallofAmountsubstanceoneofAmountM.R. =
substancesallofMasssubstanceoneofMassM.R. =
ppmvppbv
ppmmppbm

19
Concentration vs. Mixing Ratio
1 m
1 m
1 m
10 cm
10 c
m10
cmexpand
33 mballs20000
0.001mballs 20C == 33 m
balls201m
balls 20C ==
0.10.001m / balls 200.001m / balls red 2M.R. 3
3
== 0.11m / balls 201m / balls red 2M.R. 3
3
==
Concentration changes, M.R. not!
How can we quantify the amount of a pollutant that comes out of a smoke stack?
How do we quantify the amount of pollutanta person breaths in?
QuestionOne car emits 1012 molecules of carbon
monoxide (CO) in 1 hour, another car emits 1012 molecules CO in 30 minutes.
Which car is the worse polluter?
A third car emits 1013 molecules per day. Is it better or worse than the other
two?