
AOSC 200 Lesson 14. Photochemical SMOG SMOG Chemistry.
44
AOSC 200 Lesson 14
-
Upload
angelica-parks -
Category
Documents
-
view
229 -
download
2
Transcript of AOSC 200 Lesson 14. Photochemical SMOG SMOG Chemistry.
AOSC 200
Lesson 14

Photochemical SMOG
Radical Hydroxyl theasknown is
2
:vapor
er with watreacts atomoxygen excited Then the
:oxygen of atom
excitedan give osunlight t with reacts Ozone
2*
2*
3
OH
OHOHO
OOhO

SMOG Chemistry
MOMOO
ONOhNO
NOOHCNOOHC
OHCOHC
HC
OHHCOHHC
32
2
252252
252252
52
252 62
:by followed
sunlightby apart broken then is dioxidenitrogen The
DIOXIDE; NITROGEN
form toOXIDE NITRIC with reactsen oxidant th This
:OXIDANTan produce
toOXYGEN MOLECULAR with combines then
(Ethane)
nshydrocarbo from ATOM HYDROGEN a stripcan OH

Schematic of ozone production from a Volatile Organic Compound (VOC)

SMOG• NEEDS
• Hydrocarbons and nitrogen oxides
• Strong sunlight to start reactions
• Warm temperatures to maintain reactions – the higher the temperature the faster the rate.
• Peak ozone will be when temperature is highest – in the afternoon.

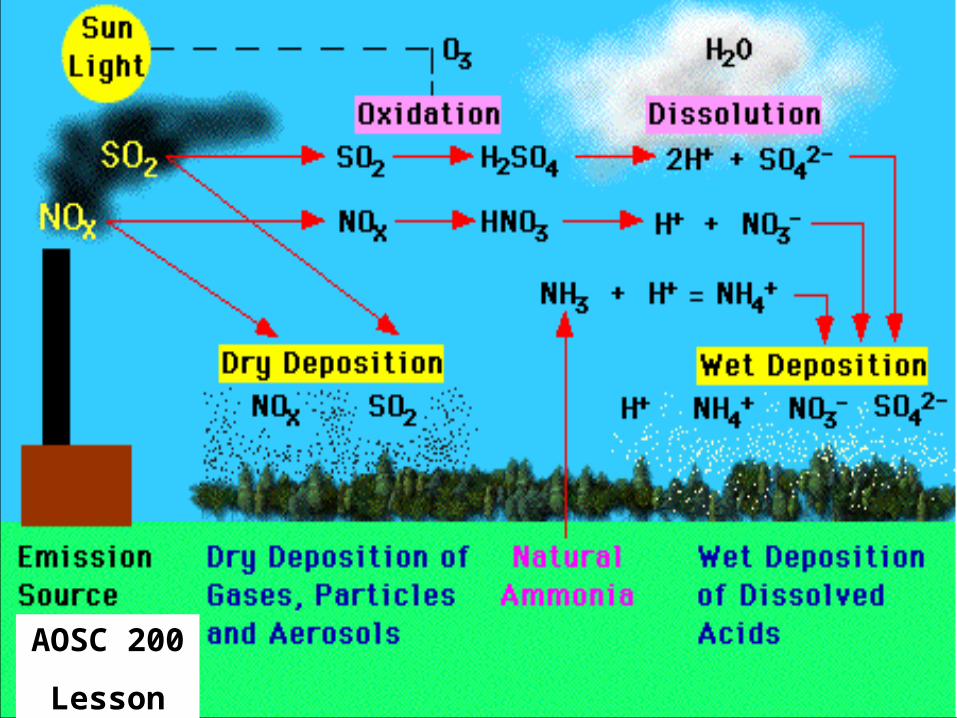
Overall scheme for air pollution

Haze
Haze is a subset of PM and is primarily composed of sulfur and nitrogen compounds.
Particles of a certain size can reflect or refract light, causing a reduction in visibility. This reduction in visibility is known as haze.
Hazy conditions occur frequently in conjunction with
severe O3 events.

An Example of the Effects of Hazein the Mid-Atlantic
The Great Smoky Mountains National Park
A Clear Day A Hazy Day
Photos from www.epa.gov

Robert Angus Smith (1817-1884) was a 19th-century Scottish chemist who investigated numerous environmental issues.
Smith did innovative studies of air and water pollution and was one of the few at the time to realize the importance of findingsolutions to the environmental problems caused by urban growth.He is most famous for his 1852 research on air pollution, in the course of which he discovered acid rain.
Acid Precipitation

• Rain is naturally weakly acidic because CO2 from the atmosphere dissolves in water. • Unperturbed rainwater has a pH of 5.6 • Precipitation near urban areas has a much lower pH. This rain or snow is called acid precipitation.
Acid Precipitation

The burning of fossil fuels (coal and petroleum products),releases about 43 millions tons of sulfur and nitrogen oxides into the atmosphere over the United States every year.
Acid precipitation

pH of precipitation over the US

pH of precipitation over the US
• The previous slide shows the pH of precipitation over the United States.
• The shaded areas show the regions where granite outcrops occur, in contrast to the remainder where the outcrops are mainly calcium carbonate based rocks/soil
• In the areas of the calcium carbonate rocks the acid rain is neutralized, and the water that flows into the streams and lakes is near neutral.
• But where the granite outcrops occur the acid rain is not neutralized, and the acid rain tends to leach out heavy metals (e.g. Aluminum).
• This water when it flows into the streams and lakes can be harmful to fish and other aquatic animals.

Standards
• The clean air act requires EPA to adopt the following air quality standards
• Ozone: 1-hour 125 ppbv*, 8-hour 85 ppbv– The 8-hour standard is much more stringent, and
encompasses many areas where transport is the only issue (e.g Shenandoah National Park)
• PM2.5: daily 65 g/m3, yearly 15 g/m3
– Most areas will have trouble only with the annual standard
• Visibility: a 60+ year glide path back to “natural conditions”
*parts per billion by volume

Color-Coded Air Quality Forecasts
Purple – 1-hr Avg. of over 150 ppb (Rare)
Yellow – 1-hr Avg. of between 80 and 104 ppb
Orange – 1-hr Avg. of between 105 and 124 ppb
Red – 1-hr Avg. of between 125 and 150 ppb
Green – 1-hr Avg. of 79 ppb or lower

Number of ozone violation days between 1973 and 1992

Number of days with temperature above 90 F vs the number of days for which an ozone violation occurred

Ozone violation days• The first figure shows the number of days in
each year when the ozone standard was exceeded.
• It appears to show a gradual decrease with time.• However if we compare the number of ozone
violations per year with the number of days when the temperature exceeded 90 F then we get an almost constant ratio.
• But the pollution per person and per car had gone down. So why is the ration constant?
• Because the population had increased, and the number of cars had increased.

VOC Emissions
33%
7%
29%
13%
18% SolventUtilization
Storage &Transport
On-RoadVehicles
Non-RoadVehicles
All Other

NOx emission inventory
28%
13%
5%30%
19%
5%Fuel Combustion- Electric Utility
Fuel Combustion- Industrial
Fuel Combustion- Other
On-RoadVehicles
Non-RoadVehicles
All Other
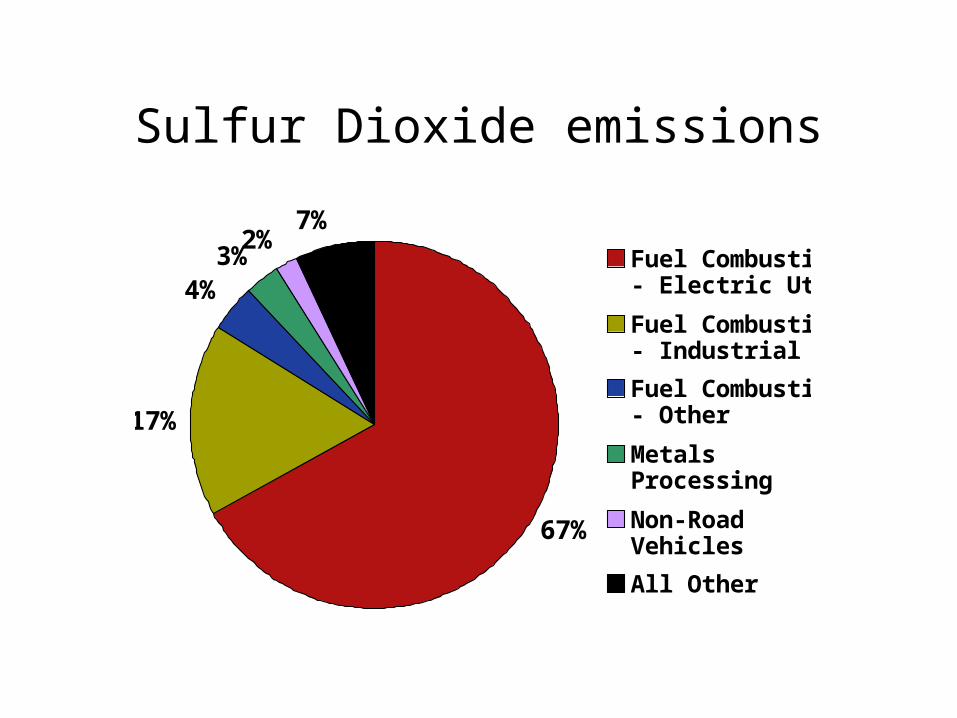
Sulfur Dioxide emissions
67%
17%
4%3%
2%7%
Fuel Combustion- Electric Utility
Fuel Combustion- Industrial
Fuel Combustion- Other
MetalsProcessing
Non-RoadVehicles
All Other


A Typical Day in a Pollution Episode
•A common severe pollution weather pattern occurs when high pressure is centered just west of the Mid Atlantic region.
•Circulation around the high pressure center moves pollution from points west into the mid-Atlantic.
H

Temperature inversions produce very stable atmospheric conditions in which mixing is greatly reduced. There are two general types of inversions: nocturnal (radiative) inversions at the ground and subsidence inversions aloft.
Nocturnal inversions are the result of differential radiative properties of the Earth’s surface and the air above. The Earthis a much better absorber and radiator of energy than air; thus,in the late morning and afternoon hours the lower atmosphere isunstable. The opposite is true in the evening; a stable atmosphere with little vertical mixing prevails.
Role of atmospheric stability

Temperature Inversion
Temperature
Temperature Inversion
Alt
itu
de
Pollution trapped below
inversion

The Nocturnal Inversion
• On clear nights, a temperature inversion develops near the surface.
- Air temperature usually decreases with height. An inversion is a layer of air where temperature increases with height.- Because the layer of air in the inversion is warmer
than the air below it, the cooler air below the inversion cannot rise above it. Pollutants near the surface are therefore trapped below the inversion in the overnight hours.
Inversions aloft (subsidence inversions) are associated with prolonged, severe pollution episodes.
These types of inversions are caused by the sinking airassociated with the center of high pressure systems (subsidence).
As the air sinks it is warmed adiabatically. Turbulence at the very lowest part of the atmosphere prevents subsidence from warming that portion of the atmosphere.
Los Angles pollution episodes as well as those over the Mid-Atlantic region are the result of inversions aloft associated with strong high pressure systems.
Role of Atmospheric Stability

Fort Meade profile 6/19/2001

Westerly transport is often present when the highest ozone is observed in the mid-Atlantic.
24 hr. Back-trajectories on days of 1-hr. ozone exceedances from 1997 through 2002, Baltimore area

Aircraft measurements of ozone

Aircraft measurements of Sulfur Dioxide

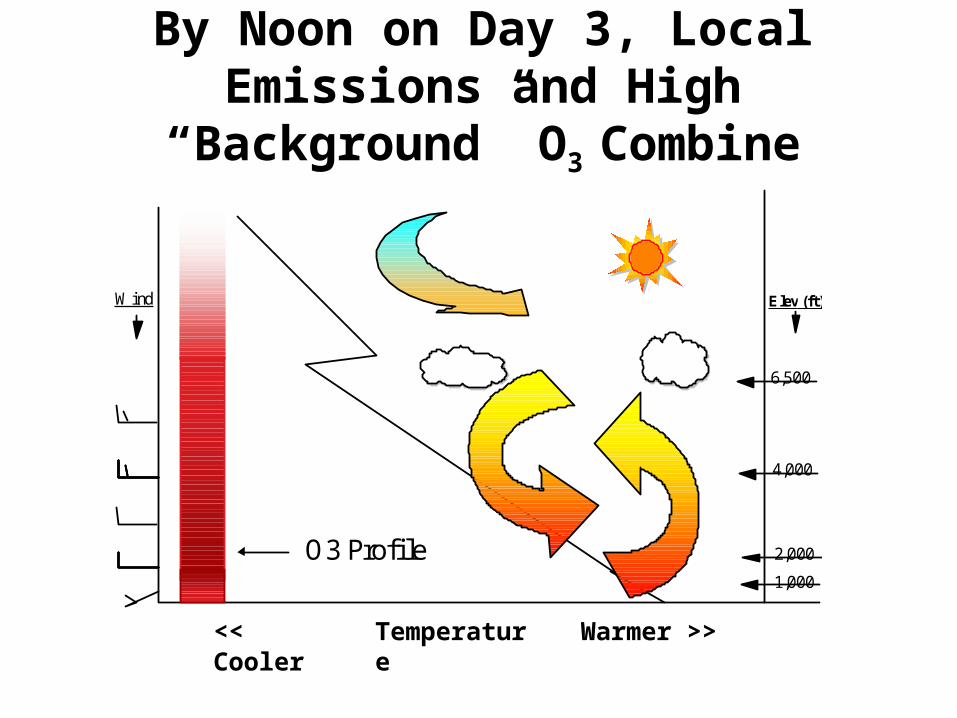
O3 Profile
Elev (ft)
1,000
2,000
4,000
6,500
Wind
Warmer >><< Cooler Temperature
Assume we start at noon on “Day 1” with a relatively clean air mass

O3 Profile
Elev (ft)
1,000
2,000
4,000
6,500
Wind
Warmer >><< Cooler Temperature
As the sun sets, the surface begins to cool and a transition
takes place

O3 Profile
Elev (ft)
1,000
2,000
4,000
6,500
Wind
Warmer >><< Cooler Temperature
The surface cooling continues overnight

O3 Profile
Elev (ft)
1,000
2,000
4,000
6,500
Wind
Warmer >><< Cooler Temperature
On Day 2, the sun rises and the nocturnal inversion begins to
erode
O3 Profile
Elev (ft)
1,000
2,000
4,000
6,500
Wind
Warmer >><< Cooler Temperature
By Noon on Day 3, Local Emissions and High “Background” O3 Combine

0
20
40
60
80
100
120
0 1 2 3 4 5 6 7 8 9 10 11 12 13 14 15 16 17 18 19 20 21 22 23
Time (EDT)
This hourly O3 graph for a summer day near Frederick,Maryland shows O3 concentrations reaching a minimumin the early morning hours.
O3 Times Series

The End of a High Ozone Episode
• An ozone episode usually ends with the arrival of a ‘clean’ air mass:– This can occur with a cold front or other
low-pressure system like a tropical storm.
• An episode may also end prior to the passage of a cold front if widespread thunderstorms develop ahead of the front.
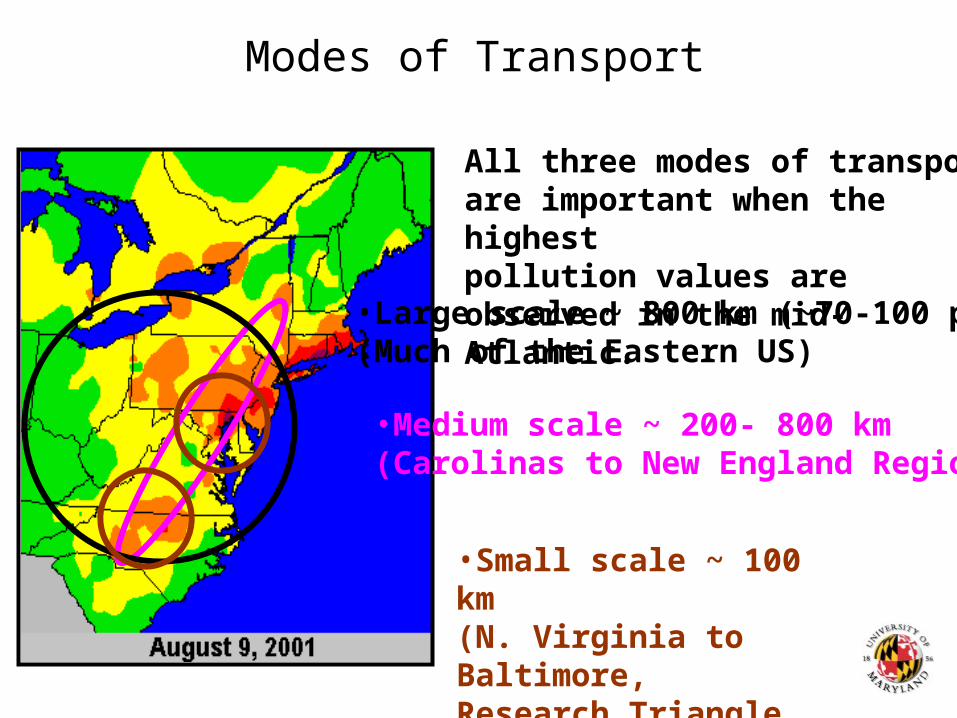
All three modes of transport are important when the highest pollution values are observed in the mid-Atlantic.
•Large scale ~ 800 km (~70-100 ppbv)(Much of the Eastern US)
•Medium scale ~ 200- 800 km(Carolinas to New England Region)
•Small scale ~ 100 km(N. Virginia to Baltimore,Research Triangle to NC/VA border)
Modes of Transport

Sources
• Different types of transport imply different types of sources– Local transport Cars, industry, and other
sources in the local area– Long distance transport Primarily power plants to
W, though plumes from cities certainly contribute.
– Low level jet Primarily cars and other
low level sources; moves from SW to NE
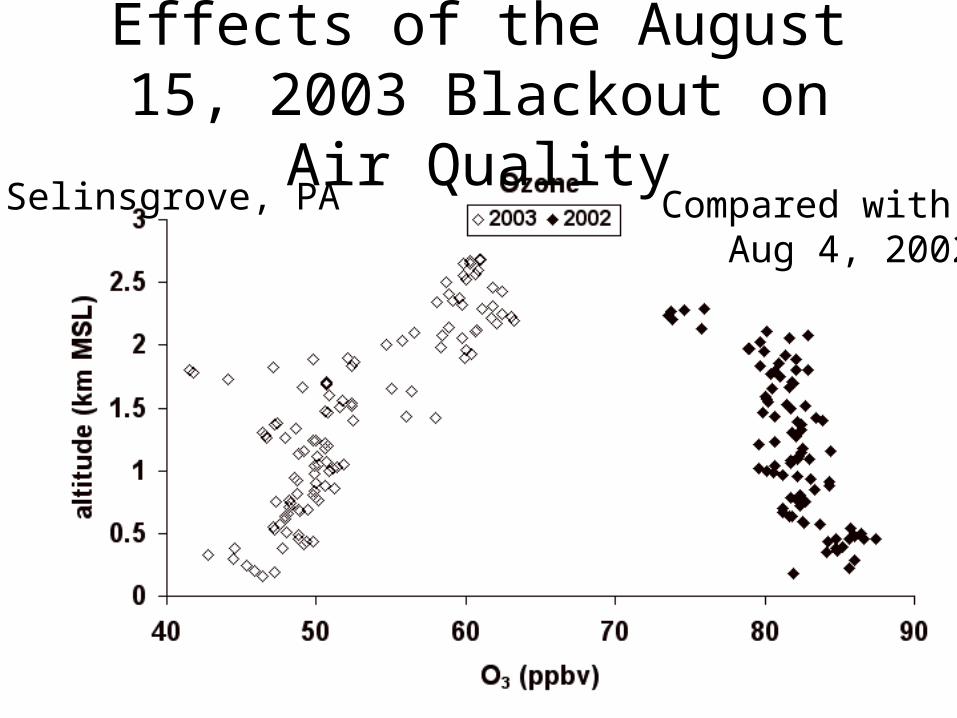
Effects of the August 15, 2003 Blackout on Air Quality
Compared with Aug 4, 2002
Selinsgrove, PA

Effects of the 2003 Blackout on Air Quality
CEM data indicatereductions of 60-80%

Effects of the 2003 Blackout on Air Quality

In summary
• It isn’t all transport…• It isn’t all local…• It isn’t all power plants…• It isn’t all automobiles…• The problem will not be solved by addressing
any one of these problems individually. ALL of these will have to show significant reductions for us to breathe clean air.


![Chapter 4 · photochemical smog and, on a global scale, to a radiative forcing of climate [IPCC, 1994; WMO, 1998]. CO is formed by photochemical breakdown of methane and higher hydrocarbons,](https://static.fdocuments.us/doc/165x107/608ce6a910760c5c395a9e8e/chapter-4-photochemical-smog-and-on-a-global-scale-to-a-radiative-forcing-of-climate.jpg)


