ASSESSMENT OF EFFECT OF FLOOD MITIGATION …
24
ASSESSMENT OF EFFECT OF FLOOD MITIGATION CONSTRUCTION AT PERKAMPUNGAN SUNGAI ISAP, KUANTAN AHMAD SYAHMI AZRI BIN MOHMAD ANUA Thesis submitted in fulfillment of the requirements for the award of the degree of B.Eng (Hons) Civil Engineering Faculty of Civil Engineering & Earth Resources UNIVERSITI MALAYSIA PAHANG JAN 2015
Transcript of ASSESSMENT OF EFFECT OF FLOOD MITIGATION …
ASSESSMENT OF EFFECT OF FLOOD MITIGATION CONSTRUCTION AT
PERKAMPUNGAN SUNGAI ISAP, KUANTAN
AHMAD SYAHMI AZRI BIN MOHMAD ANUA
Thesis submitted in fulfillment of the requirements for the award of the degree of
B.Eng (Hons) Civil Engineering
Faculty of Civil Engineering & Earth Resources
UNIVERSITI MALAYSIA PAHANG
JAN 2015
Abstract
Throughout the last century flooding has been one of the most costly disasters in
terms of both property damage and human casualties. The flooding in 2001/2002 at the basin
Sungai Kuantan, the government has built Chereh Dam at upstream of Sungai Kuantan in
2008 and a bund along the Sungai Kuantan at Perkampungan Sungai Isap and surrounding
villages. The flood-inducing rains incident in December 2013 at this area, raised concern in
effectiveness of those mitigation infrastructures. The main objective of this study was to
assess of effect of flood mitigation construction at Perkampungan Sungai Isap, Kuantan. The
specific objective were; to analysis rainfall characteristics of study area during the flood-
inducing rains, and to assess changes of flood prone of study area, pre and post of existing
river bund. Rainfall for five months (Oct. Nov, Dec, Jan, Feb) for each year (2000-2001,
2001-2002, 2007-2008 pre-bund year; 2010-2011, 2013-2014 post-bund) data collected from
the satellite were tabulated based on daily rainfall. Water balance model was used to
calculate the possible retention depth water. The analysed of satellite-based rainfall data were
compare to JPS flood report relating to flooding incident.
Abstrak
Sepanjang abad abad yang lalu banjir telah menjadi salah satu bencana yang paling
besar kerugian dari segi kerosakan harta benda dan kematian. Banjir pada 2001/2002 di
lembangan Sungai Kuantan, kerajaan telah membina Empangan Chereh di hulu Sungai
Kuantan pada tahun 2008 dan ban di sepanjang Sungai Kuantan di Perkampungan Sungai
Isap dan kampung-kampung sekitar. Hujan yang menjurus kepada kejadian banjir pada
Disember 2013 di kawasan mi, menimbulkan kebimbangan dalam keberkesanan infrastruktur
tersebut. Objektif utama kajian mi adalah untuk menilai kesan pembinaan tebatan banjir di
Perkampungan Sungai Isap, Kuantan. Objektif khusus ialah; analisis kepada ciri-ciri hujan
kawasan kajian semasa kejadian banjir yang menjurus kepada hujan, dan untuk menilai
perubahan banjir yang terdedah kepada kawasan kajian, sebelum dan selepas ban sungai yang
sedia ada terbina. Data hujan selama lima bulan (Oktober, November, Disember, Januani,
Februari) bagi setiap tahun (2000-2001, 2001-2002, 2007-2008 tahun pra-ban; 2010-2011,
2013-2014 selepas-ban) yang diperoleh daripada satelit telah dijadualkan berdasarkan hujan
hanian. Model keseimbangan air telah digunakan untuk mengira kedalaman kemungkinan air
tertahan. Data hujan yang berasaskan satelit yang dianalisis telah dihubungkaitkan dengan
laporan banjir JPS berhubung dengan kejadian banjir.
TABLE OF CONTENT
SUPERVISOR'S DECLARATION iii
STUDENT'S DECLARATION iv
DEDICATION v
ACKNOWLEDGEMENT vi
ABSTRACT vii
ABSTRAK viii
TABLE OF CONTENT ix
CHAPTER 1 1
INTRODUCTION 1
1.1 INTRODUCTION 1
1.2 PROBLEM STATEMENT 2
1.3 OBJECTIVE OF STUDY 2
1.4 SCOPE OF STUDY 2
1.5 THESIS STRUCTURE 3
CHAPTER 2 4
LITERATURE REVIEW 4
2.1 INTRODUCTION 4
2.2 HYDROLOGY CYCLE 5
2.3 HISTORY OF FLOODING IN PAHANG 6
2.4 FLOODING RISK 6
2.5 FLOOD MITIGATION AND PREVENTION 7
CHAPTER 3 8
RESEARCH METHODOLOGY 8
3.1 INTRODUCTION 8
3.2 DATA COLLECTING 10
3.3 DATA PRE-PROCESSING 11
3.4 DATA PROCESSING 13
3.5 RESULTS SUMMARY 16
CHAPTER 4 17
RESULT AND DISCUSSION 17
4.1 INTRODUCTION 17
4.2 RESULT AND DISCUSSION 17
4.2.1 Rainfall Depth 17
4.2.2 Flood Prone 24
4.3 SUMMARY 25
CHAPTER 5 26
CONCLUSION AND RECOMMENDATION 26
5.1 INTRODUCTION 26
5.2 CONCLUSION 27
5.3 RECOMMENDATION 27
REFERENCES 28
LIST OF FIGURES
Figure 2.1: Hydrology Cycle Process 2
Figure 3.1: Methodology flow chart 9
Figure 3.2: Garmin GPS 76CSx 10
Figure 3.3: Basemap and TRMM overlaid 11
Figure 3.4: Basemap and Reduce Level (X, Y & Z) 12
Figure 3.5: Water Balance diagram 13
Figure 3.6: Line cross section 15
Figure 4.1: Rainfall on 2000-2001 18
Figure 4.2: Rainfall on 2001-2002 18
Figure 43: Rainfall on 2007-2008 19
Figure 4.4: Rainfall on 2010-2011 19
Figure 4.5: Rainfall on 2013-2014 20
Figure 4.6: Possible retention depth for October 20
Figure 4.7: Possible retention depth for November 21
Figure 4.8: Possible retention depth for December 21
Figure 4.9: Possible retention depth for January 22
Figure 4.10: Possible retention depth for February 22
Figure 4.11: Average daily possible retention depth 23
Figure 4 12: Long Section 1 24
Figure 4 13: Cross Section 2 24
Figure 4 14: Cross Section 3 25
LIST OF TABLES
Table 3.1: Daily rainfall data with water balance calculation 14
CHAPTER 1
INTRODUCTION
1.1 INTRODUCTION
Throughout the last century flooding has been one of the most costly disasters in
terms of both property damage and human casualties. According to the UN Office for Disaster
Risk Reduction (UNISDR), some 250 million people have been affected annually by floods over
the last 10 years, and floods are the single most widespread and increasing disaster risk to urban
settlements of all sizes (UNISDR, 2014).
According to Illøybye (2009), there are three identified main sources of flooding in any e
basin, heavy local rainfall, and extreme increase in river discharge and sea wave. The last fifteen
years, parts of the Sungai Kuantan basin experienced severe floods, especially mid of North-east
monsoon period (December-January). The remarkable year, 2001, 2007 and 2013, high intensity
rainfall episodes in the few days, eventually are causing flooding (Au, M.I., 2014).
The flood-inducing rains give impacts to many people, that were dislocated from their place, and
government and private properties have been damaged causing huge impact on the country's
economy. The major concern for communities and government agencies in areas with high risks
of flood-inducing rains disasters is to reduce the vulnerability of the people and infrastructures
by providing structure for mitigation (i.e. dam and levee at river bank) that seen as the most
effective way to reduce the property damage and life loss.
I
1.2 PROBLEM STATEMENT
Since the flooding in 2001/2002 at the Sungai Kuantan basin, the government had built
Chereh Dam at upstream of Sungi Kuantan in 2008 and a levee along the Sungai Kuantan at
perkampungan Sungai Isap villages. Floods are regular natural disaster that frequently occurs in
Peninsular Malaysia, everyyear during the monsoon season. Especially second inter monsoon to
early North-east Monsoon (October to December). However, the flood-inducing rains incident in
December 2013 at Perkampungan Sungai Isap, located at downstream of the Sungai Kuantan
basin, raised concern in effectives of those mitigation infrastructures.
1.3 OBJECTIVE OF STUDY
The study main objective was to assess of effect of flood mitigation construction
at Perkampungan Sungai Isap, Kuantan. The specific objectives this study were as follows:
i. to analysis rainfall characteristics of study area during the flood-inducing rains,
ii. to assess changes of flood prone of study area, pre and post of the levee structure.
1.4 SCOPE OF STUDY
This study was limited for the period between 2000-2013 which are mid of North-
East monsoon period on December to January. The area of study was located in the watershed of
Sungai Kuantan at E1032° and N3.8°. The residential area involves:
1) Perkampungan Sungai Isap
2) Taman Bukit Rangin
3) Taman Sepakat
4) Kampung Permatang Badak
5) Taman Permatang Badak
6) Kampong Batu Tujuh
7) Taman Tas
8) Taman Pandan Damai
1.5 THESIS STRUCTURE
This research consists of five chapters. Chapter one comprises the introduction section. It
states the study background, problem statement, objectives of study and lastly scope of study.
For chapter two, describe the key term in- purpose of these research and comprises the literature
review that related and suitable for these research. Chapter three explains the research
methodology that used for planning research type of data collected and the method of data
analysis to be employed. For chapter four present the result that obtained from the study area and
year of study and discussed the result from analysis. Finally, chapter five comprises the
conclusion from the overall chapter and relates some recommendation for future work on
research field.
3
CHAPTER 2
LITERATURE REVIEW
2.1 INTRODUCTION
Situation where lower ground level that can induce water increases during a rainy season
is known as flooding. Several types of floods are described in this chapter, including river floods,
flash floods, dam-break floods, ice-jam floods, glacial-lake floods, urban floods, coastal floods,
and hurricane-related floods. Certain location where lower ground level occur water increases
during a rainy season is known as flooding. In Malaysia, floods often occur mostly when the
northeast monsoon, which in this situation malaysia receive cool air that brings cloud to the
peninsula malaysia especially the eastern coast of the peninsula, namely Pahang, Terengganu and
Kelantan. floods in Kuantan, Pahang, namely the most significant is heard, especially on the
season. flood events always occur in connection with heavy rains and river water level rise
sharply causing adjacent lower area affected. flood events that have taken place almost every
Year, which between 2000 and 2013 in december 2001, has accepted the great flood in Kuantan,
which saw its season rate is quite high while the flood situation in the next year not so much as in
2001. In 2013, floods in Kuantan once again displays the events that are more severe than in
2001, which involved more victims and more areas affected. rainfall during the show Maggi of
rainfall intensity over the years that no great influx of more than 200 mm of rain per day. The
local government agreed to build flood mitigation along the river near the village of suction river
flooding is frequent.
4
5
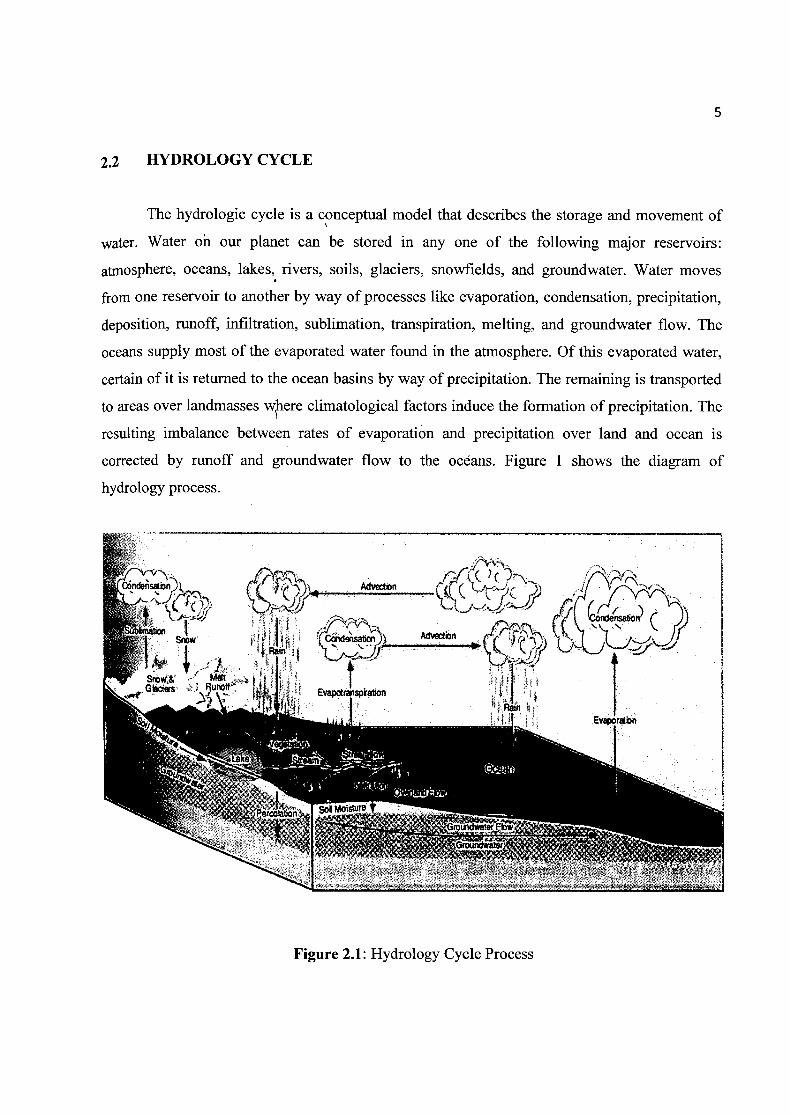
2.2 HYDROLOGY CYCLE
The hydrologic cycle is a conceptual model that describes the storage and movement of
water. Water on our planet can be stored in any one of the following major reservoirs:
atmosphere, oceans, lakes, rivers, soils, glaciers, snowfields, and groundwater. Water moves
from one reservoir to another by way of processes like evaporation, condensation, precipitation,
deposition, runoff, infiltration, sublimation, transpiration, melting, and groundwater flow. The
oceans supply most of the evaporated water found in the atmosphere. Of this evaporated water,
certain of it is returned to the ocean basins by way of precipitation. The remaining is transported
to areas over landmasses where climatological factors induce the formation of precipitation. The
resulting imbalance between rates of evaporation and precipitation over land and ocean is
corrected by runoff and groundwater flow to the oceans. Figure 1 shows the diagram of
hydrology process.
Figure 2.1: Hydrology Cycle Process
6
2.3 HISTORY OF FLOODING IN PAHANG
Flood occur during year 2000 to 2013 was has reminded us that major floods have
occurred in a few years ago. Major flood events occurred in many countries Malaysia in certain
years. Excerpts from the archives of the delegation Malaysia. Floods that occurred during the
month of January 1971 it led the then Prime Minister, the late Tun Abdul Razak Hussein had
declared an emergency and established two Cabinet committees whose role is to provide support
and implement flood recovery. The worst-hit state is mainly in the area Pekan Pahang, the
constituency represented Tun Razak (ARCHIVES: 15/01/2007). This shows that the situation
when this involves rivers in the country, including in the area of Kuantan, Pahang.
2.4 FLOODING RISK
Floods can be caused by runoff which exceeds the capacity of the drainage channels
rivers and creeks in the rural environment, and storm water channels in the urban environment.
The risk of flooding is measured by the probability with which a given flood height (or river
flow) will be exceeded in any year. This is usually expressed as an Average Recurrence Interval
(ART) or an Annual Exceedance Probability (AEP). A flood event criterion commonly used in
flood risk assessments is the 100 year AR! or the 1% AEP, This criterion is based upon the
acceptance of a 1% chance of that event being exceeded within any one year. Statistics can be
used to estimate the risk associated with occurrence of floods within the design life of a
structures. The risk of flooding may also change over time due to changing development
conditions within the catchment. Of potential changes to a catchment, one of the most dramatic
is urbanization of part, or all, of a catchment. Urbanization generally increases the volume of
runoff, flood peaks and flow velocities while decreasing the delay between the storm event and
the flood. On the other hand, measures such as farm dam construction and soil conservation
measures may reduce the flood risk by reducing the flood flows. The flood risk at a location is,
therefore, not a constant risk but rather a risk which will change with time as development within
a catcent changes.
7
2.5 FLOOD MITIGATION AND PREVENTION
Flood mitigation refers to any structural or non-structural measures undertaken to limit
the adverse impact of disaster. Flobd mitigation can be divided into three main purposes areas
such as river control, land control and others. The river control area include construction of dams
or retention basins or reservoir on mainstreams to store excessive water and release it gradually
after the threat has passed. River bund or floodwalls can be constructed to confine flood water to
a floodway, thereby reducing flood damage. The other side is can improve channel which is
straightening to remove undesirable bends also deepening and widening to increase size of
waterways. Flood mitigation also action as seepage control and raising the anchorage.
CHAPTER 3
RESEARCH METHODOLOGY
3.1 INTRODUCTION
This chapter describes the phases involved in achieving the study objectives.
There were FOUR (4) phases, namely:
i) Collecting Data
ii) Pre-processing
iii) Processing
iv) Results and analysis
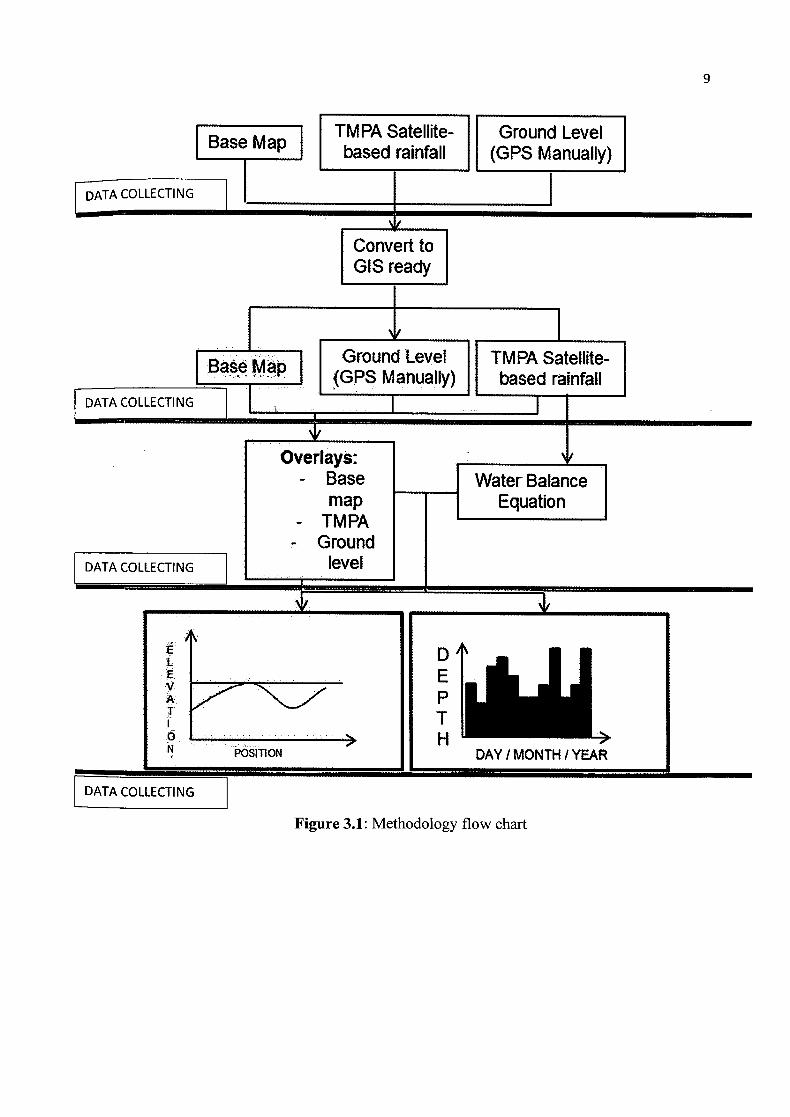
Figure 3.1 shows the flow of the methodology for this research. Data
collecting, pre-processing and the processing will be explained in the following
sections in this chapter. While the results and analysis is described in Chapter 4.
8
DAY I MONTH I YEAR
E. V A
19 N
D E P T H
POSITION
I I TMPA Satellite- I I Ground Level Base Map based rainfall I I (GPS Manually)
DATA COLLECTING
Convert to GI S ready
• .:• Ground Level TM PA Satellite- !&aP (GPS Manually) based rainfall
DATA COLLECTING I I I I
9
DATA COLLECTING
Overlays: - Base
map - TMPA - Ground
level
Water Balance Equation
DATA COLLECTING
Figure 3.1: Methodology flow chart
10
3.2 COLLECTING DATA
The research will be starting with collecting rainfall data which is Tropical
Rainfall Measuring Mission (TRMM). Multi-satellite Precipitation Analysis (TMPA)
version 7 satellite-based daily rainfall data obtained from public domain. The rainfall
data was obtained from the public domain for within the period of study in the month
of October, November, December, January, and February. The rainfall data obtained
in accordance with the daily rainfall per month. Rainfall data characteristics were
obtained through the data according to a monthly average.
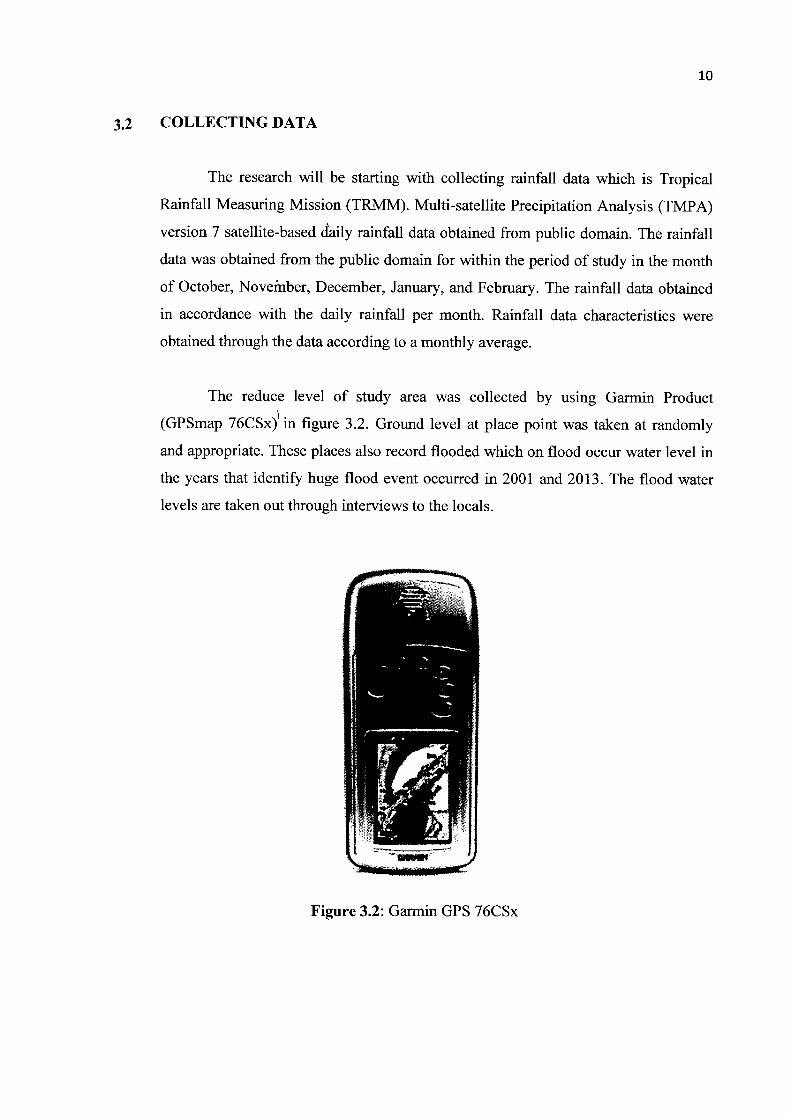
The reduce level of study area was collected by using Garmin Product
(GPSmap 76CSx)t in figure 3.2. Ground level at place point was taken at randomly
and appropriate. These places also record flooded which on flood occur water level in
the years that identify huge flood event occurred in 2001 and 2013. The flood water
levels are taken out through interviews to the locals.
Figure 3.2: Garmin GPS 76CSx
11
DATA PRE-PROCESSING
All the data was converted to GIS ready. TRMM data have been overlaid with
basemap layers (Google Earth) in Arcmap. Each layer has the project according to
WGS 1984 in figure 3.3. This coordinate is for accuracy on a real location on earth.
Figure 3.3: Basemap and TRMM overlaid
12
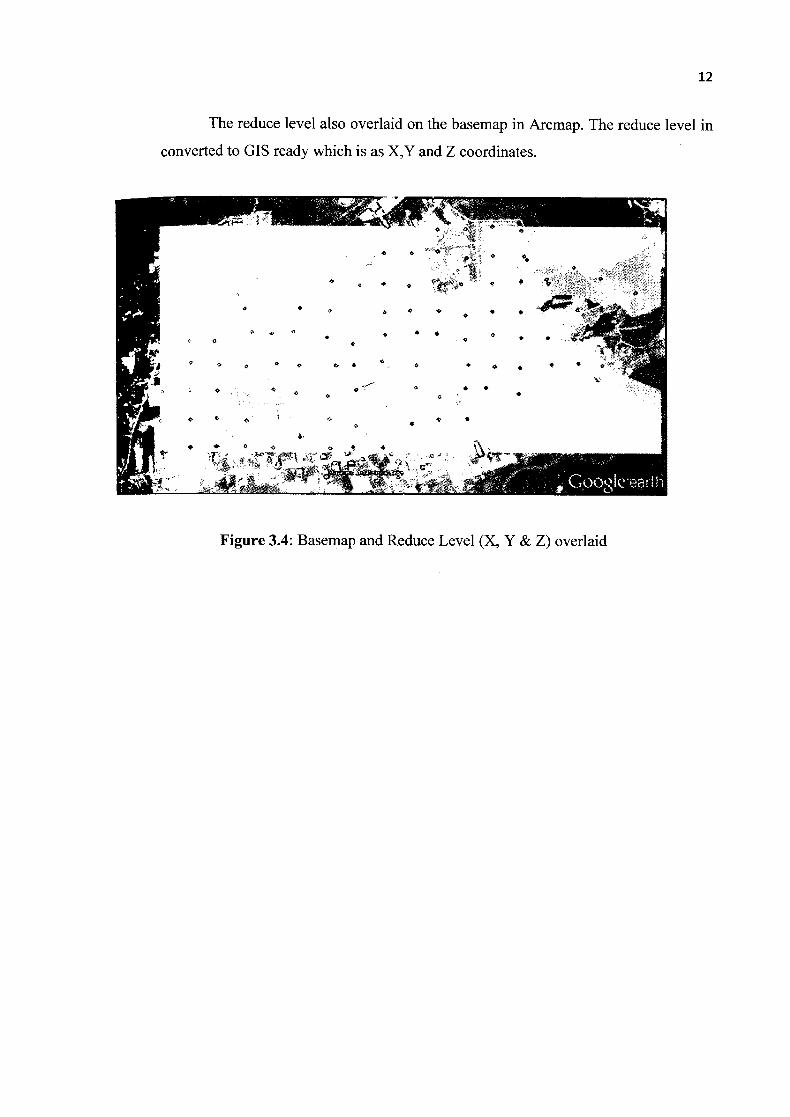
The reduce level also overlaid on the basemap in Arcmap. The reduce level in
converted to GIS ready which is as X,Y and Z coordinates.
Figure 3.4: Basernap and Reduce Level (X, Y & Z) overlaid
Rainfall, P (TRMM)
/0*0 ̂ ,Evaporation, AFT
(TRMM) per Month
13
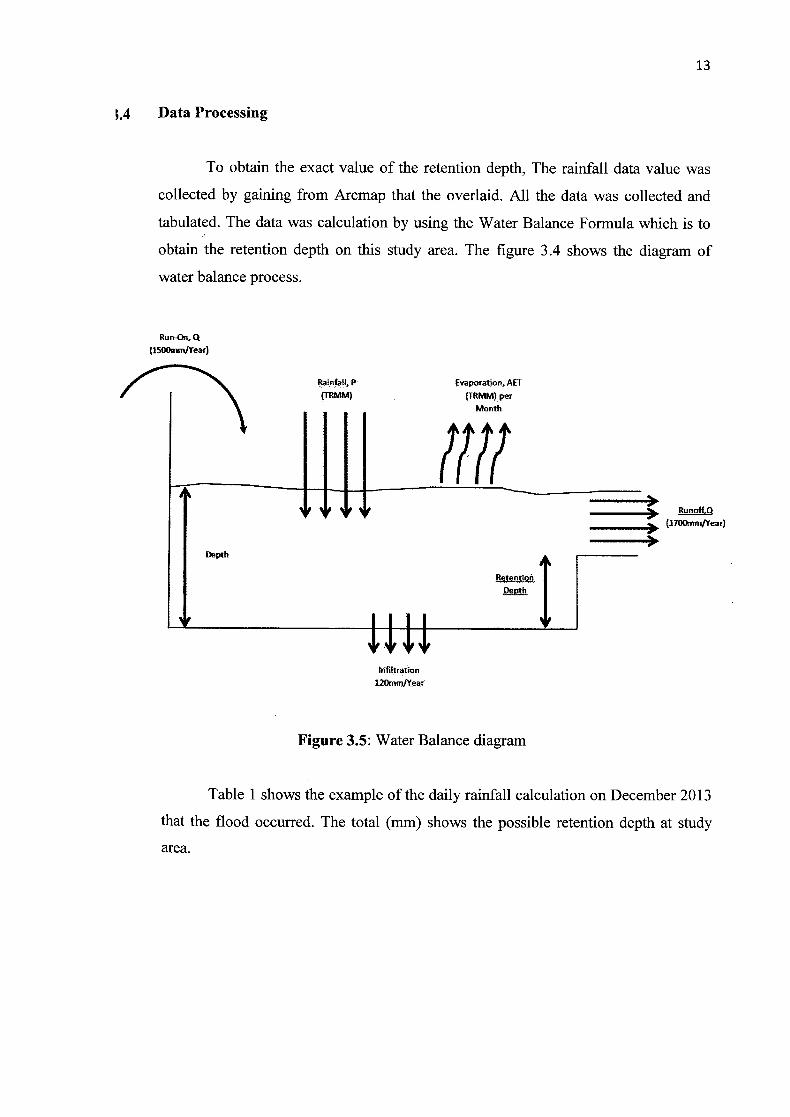
;.4 Data Processing
To obtain the exact value of the retention depth, The rainfall data value was
collected by gaining from Arcmap that the overlaid. All the data was collected and
tabulated. The data was calculation by using the Water Balance Formula which is to
obtain the retention depth on this study area. The figure 3.4 shows the diagram of
water balance process.
Run-On, (
(lSOOnvWYear)
) )
Runoff,Q
(ilOOrnmfYear)
-
Infiltration 120mm/Year
Figure 3.5: Water Balance diagram
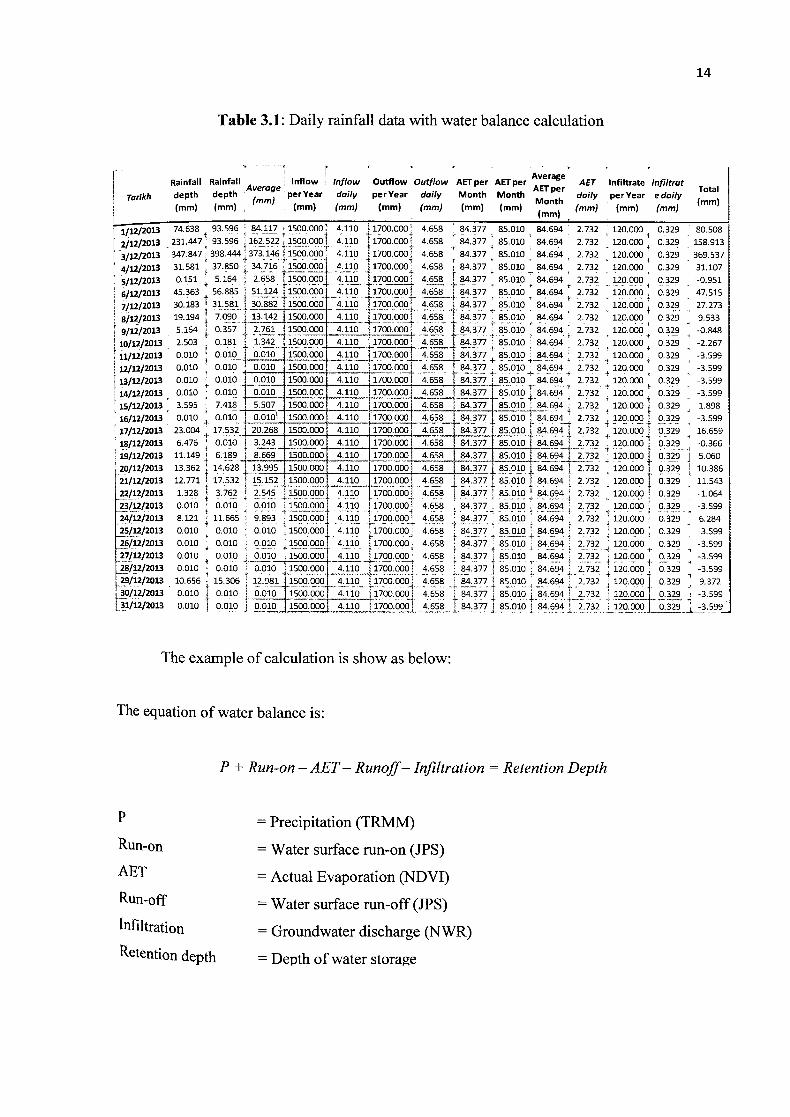
Table 1 shows the example of the daily rainfall calculation on December 2013
that the flood occurred. The total (mm) shows the possible retention depth at study
area.
1/12/2013 2/12/2013 - 3/12/2013 4/12/2013 5/12/2013 5/12/2013 7/12/2013 8/12/2013 9/12/2013
10/12/2013 11/12/2013 12/12/2013 13/12/2013 14/12/2013 15/12/2013 15/12/2013 17/12/2013 18/12/2013 19/12/2013 20/12/2013
[21/12/2013
14
Table 3.1: Daily rainfall data with water balance calculation
Average Rainfall Rainfall Inflow Inflow Outflow Outflow AET per AET per AET Infiltrate lnfiltrat
Tarlkh depth depth Average
perYear daily per YearMonth
daily Month MonthAET per
daily per Year edailyTotal (mm)
(mm) (mm) 'mm)
(mm) (mm) (mm) (mm) (mm) (mm) (mm) (mm) (mm) (mm)
74.638 93.596 84.117 231.447 93.596 162.522 .
1500.000x 1500.000
347.847 398.444 373.1461 31.581 37.850 34.716 0.151 5.164 2.658
1
1500.000 1500.000 1500.000
45.363 56.885 51.124 11500.000 30.183 31.581 1 30.882 19.194 7.090 1 13.14J
1500.000 1500.000
5.164 0.357 1 2.76141500000 2.503 0.181 1.342 1500.000 0.010 0.010 0.010 0.010 0.010
oo.000 1500.000
0.010 0.010 j_0.010 0.010 : 0.010 0.010
1500.000 1500.000 1500.000 3.595 7.418 5.507
0.010 0.01 jO.oio 1500.000 23.004 1T532_ 1500.000
1500.000 6.476 0.010 3.2431500.000 11.149 6.189 1 8.669
13.362 j 14.628 13.995 12.771 t 17.532 t 15.152 1.328 3.762 2.545 0.010 0.010 0.010
1500.000 1500.000 1500.000 1500.000
8.121 4 11.665 9.893 0.010 0.010 0.010
5500.0oo 1500.000
0.010 0.010 0, 010 1500 000 0.010 0.010 0.010 0.010 0.010 0.01010.656 - 15.306 12.98.1500.000 1J 0.010 0.010 0.010J599900
1500.000 11500.000
1500.000 0.010 0.010 0.010
4.110 1700.000 4.658 84.377 85.010 84.694 2.732 120.000 0.329 : 80.508 4.110 1700.0001 4.658 84.377 85.010 84.694 2.732 120.000 0.329 158.913 4.110 1700.0004 4.658 84.377 85.010 84.694 2.732 120.000 0.329 - 369.537 4.11P1700.000 4.658 84.377 85.010 84.694 2.732 120.000 0.329 31.107
170000 4.658 [84.377 85.010 84.694 2.732 120.000 0.329 -0.951 4.110 1700.0001 4.658 84.377 85.010 84.694 2.732 120.000 0.329 47.515 4.1101700.000 4.658
. F- J 84.377 85.010 84.694 2.732 120.0006 0.329 27.273
4.110 1700.0001 4.658 34.377 85.010 84.694 2.732 1700.0001 4.658 84.377 85.010 84.694 2.732 1700 000 4.658 84.377 85.010 84.694 2.732 Z9°9P j 9aJ.Y2? + ....!4:4 2.732
1700.0001 4.658 L 8 7.? 85.010 84.694 2.732 1700.0001f.37785.010 84.694 2.732 1700.0001 4.658 84.377 85.010 84.694 2.732 1700.0001 4.658 84.377 85.010 84.694 . 2.732 1
1700.0001 4.658L.377 85.010 84.694 2.732 1700.0001 4.658 84.377 85.010 84.6941 2.732 . 1700.0001 84.377 85.010 84.694 2.732 1700.000 4.658 84.377 85.010 84.694 2.732 1700.000 4.658 84.377 85.010 84.694 12.732 1700.000 i 4.658 84.377 85.010 84.694 2.732
120.000 120.000 120.000 4 120.000 120.000 120.000 - 120.000 120.000 120.000 l2O.000 t 120.0001 120.000 1 120.000 120.000
- 0.329 0.329 0.329 0.329 0.329 0.329 0.329 0.329 0.329 9:329 0.329 0.329 J 0.329 0.329
9.533 -0.848 2267
-3.599
-3.599 -3.599 1.898 -3.599 16.659 -0.366 5.060 10.386 11.543
4.110 4.110 4.110 4.110 4.110 4.110 4.110 4.110 4.110 4.110 4.110 4.110 4.110 4.110 1700.0001 4.658 84.377 85.010 84.694 2.732 120.000 0.329 -1.064 4.1101700.000! 4.658 84.377 85.010 84.694 2.732 120.000 0.329 -3.599
99.000 4.658 84.377 85.010 84.694 2.732 120.000 0.329 6.284 4.110 i 1700.000 4.658 84.377 85.010 84.694 2.732 120.000 0.329 -3.599 4.110 11700.000 4.658 84.377 85.010 84.694 2.732 120.000 0.329 -3.599 4.110 700.000 :
1700.000.4.658 4. 658
t 84.377 85.010 84.694 2.732 84.377 1 85.010 84.694 2 : 732
120.000 120.000
a329 0.329
-3.599 -3.599 4.110
4.110t1700.000! 4.658 84377 85010 84.694 2.732 4 120.000 0.329 9.372 4119J1700000J
_9J1700.00014.658 4.6581
1 94.377 85.010 84.694 2.732 84.377 I 8S.010.t4: 94 i. : 2 i120.000j_0.329J.599
120.000 0.329 3599
The example of calculation is show as below:
The equation of water balance is:
P + Run-on - AET- Runoff- Infiltration = Retention Depth
P = Precipitation (TRMM)
Run-on = Water surface run-on (JPS) AET Actual Evaporation (NDVI) Run-off = Water surface run-off (JPS)
Inhiltration = Groundwater discharge (NWR) Retention depth = Depth of water storage
Example for 1/12/2013:
P =84.117nmi
Run-on 4.110 mm
AET 2.732 mm
Run-off =4658rnm
Infiltration = 0.329 mm
Retention depth = 80.508 mm
84.117mm + 4.110mm - 2.732mm - 4.658mm - 0.329mm = 80.508mm
*80. 508mm is referred to the retention depth on that day.
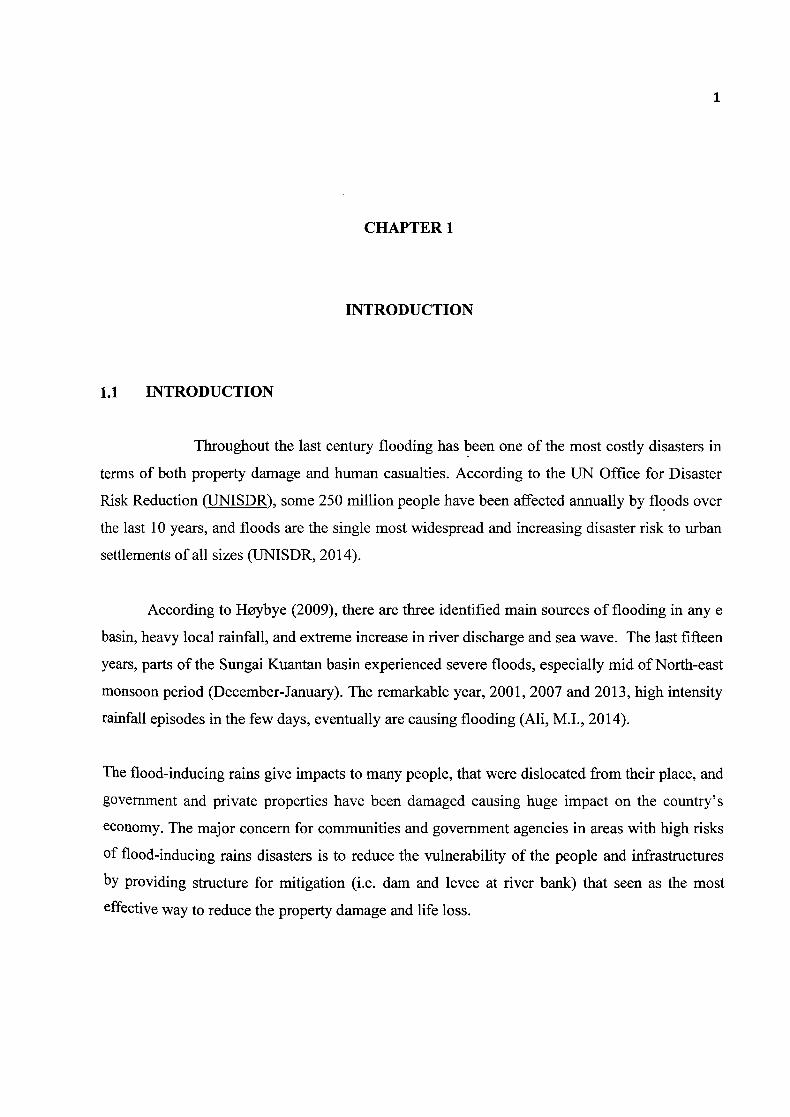
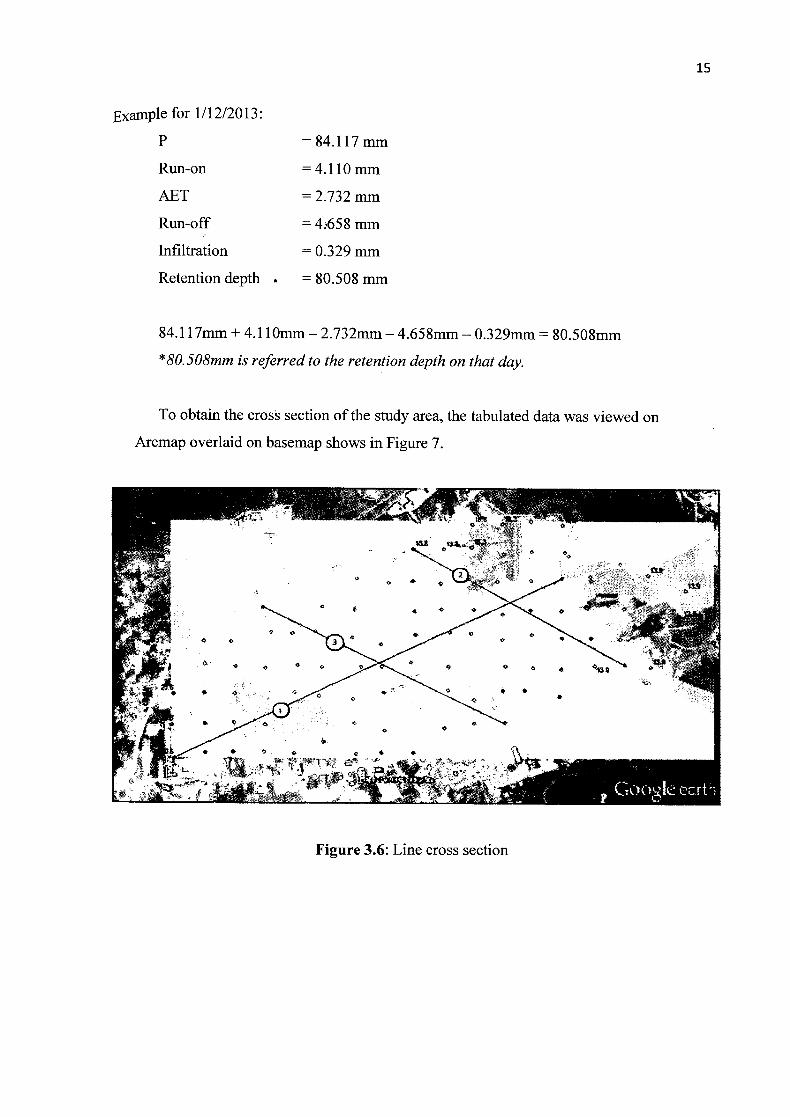
To obtain the cross section of the study area, the tabulated data was viewed on
Arcmap overlaid on basemap shows in Figure 7.
1- 310
- 0 %
15
0
0 0 ,
0 - e 0
I3.
• •
0
_• ._ '. -
-
Figure 3.6: Line cross section

16
3.5 RESULTS SUMMARY
The result to answer the objective that will be calculated with the same method to
example show in processing. The average of monthly rainfall was obtained from each month
of the possible depth each table of rainfall calculation. The cross section graph also views in
the next chapter.
CHAPTER 4
RESULT AND DISCUSSION
4.1 INTRODUCTION
In this chapter, the findings of which were obtained from Chapter 3, is shown in Table
form. Further analysis will be conduct in this chapter.
4.2 RESULT AND DISCUSSION
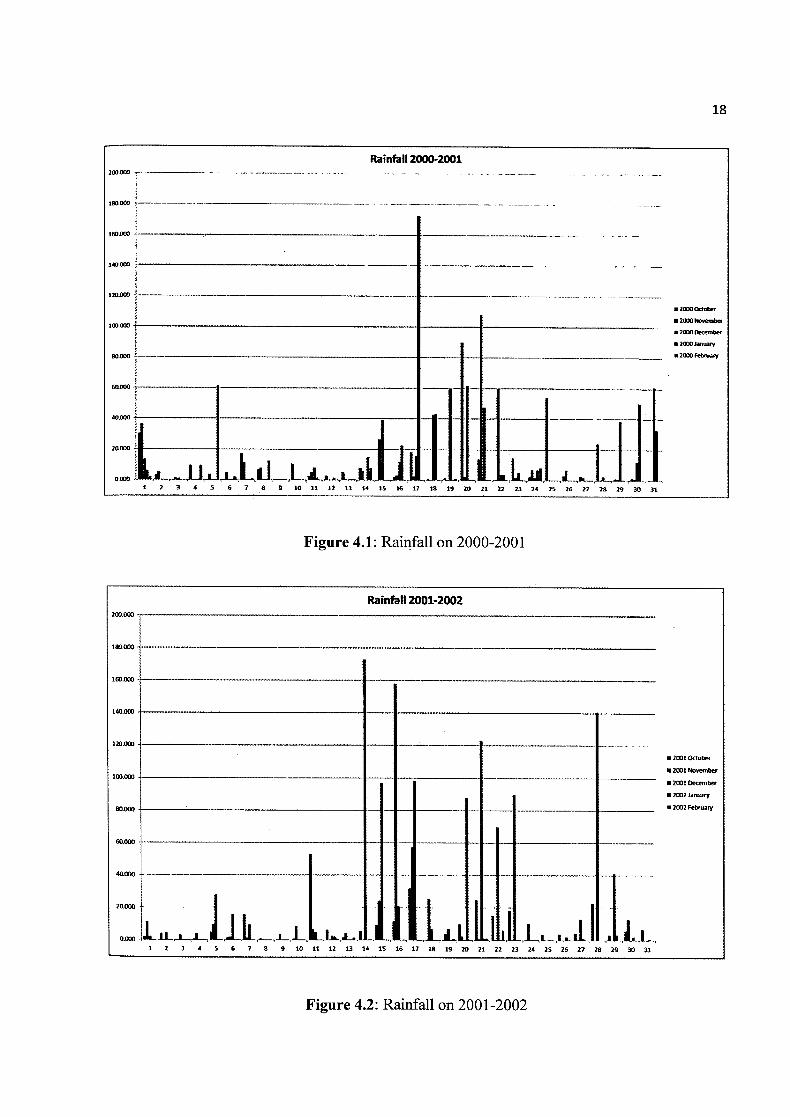
4.2.1 Rainfall Depth
Based on the calculation of the rainfall into water balance equation, the possible depth
was obtained and the graph to show the characteristic of the rainfall on the area and time period
of study area. This following graph shows on flooding incident at 2001-2002 and 2013-2014.
17
18
Figure 4.1: Rainfall on 2000-2001
Rainfall 2001-2002
• itOh Octo6
• 2021 November
• 2001 Ovcembee
• 21112 I4044ey
• 21122 beoy Fe
2 3 4 5 6 7 8 9 10 11 12 13 14 15 16 17 18 19 20 21 22 23 24 25 26 27 28 29 30 31
1800W ----.---------------------. _____
140.000
120.000
1(01.000
80000 _________ ___________
611000
40.0
UDO
00--- --.- ----- -..
L I i.r L1[l IlL..Figure 4.2: Rainfall on 2001-2002


![Flood Mitigation Planning for the Upper Wapsipinicon River ......Regulation Checklist that are important for flood mitigation planning [1]. There is a section for each flood mitigation](https://static.fdocuments.us/doc/165x107/5f23df6e5f50b45b8f2214fc/flood-mitigation-planning-for-the-upper-wapsipinicon-river-regulation-checklist.jpg)