Assessing the Social Performance of Products: Developing a...
70
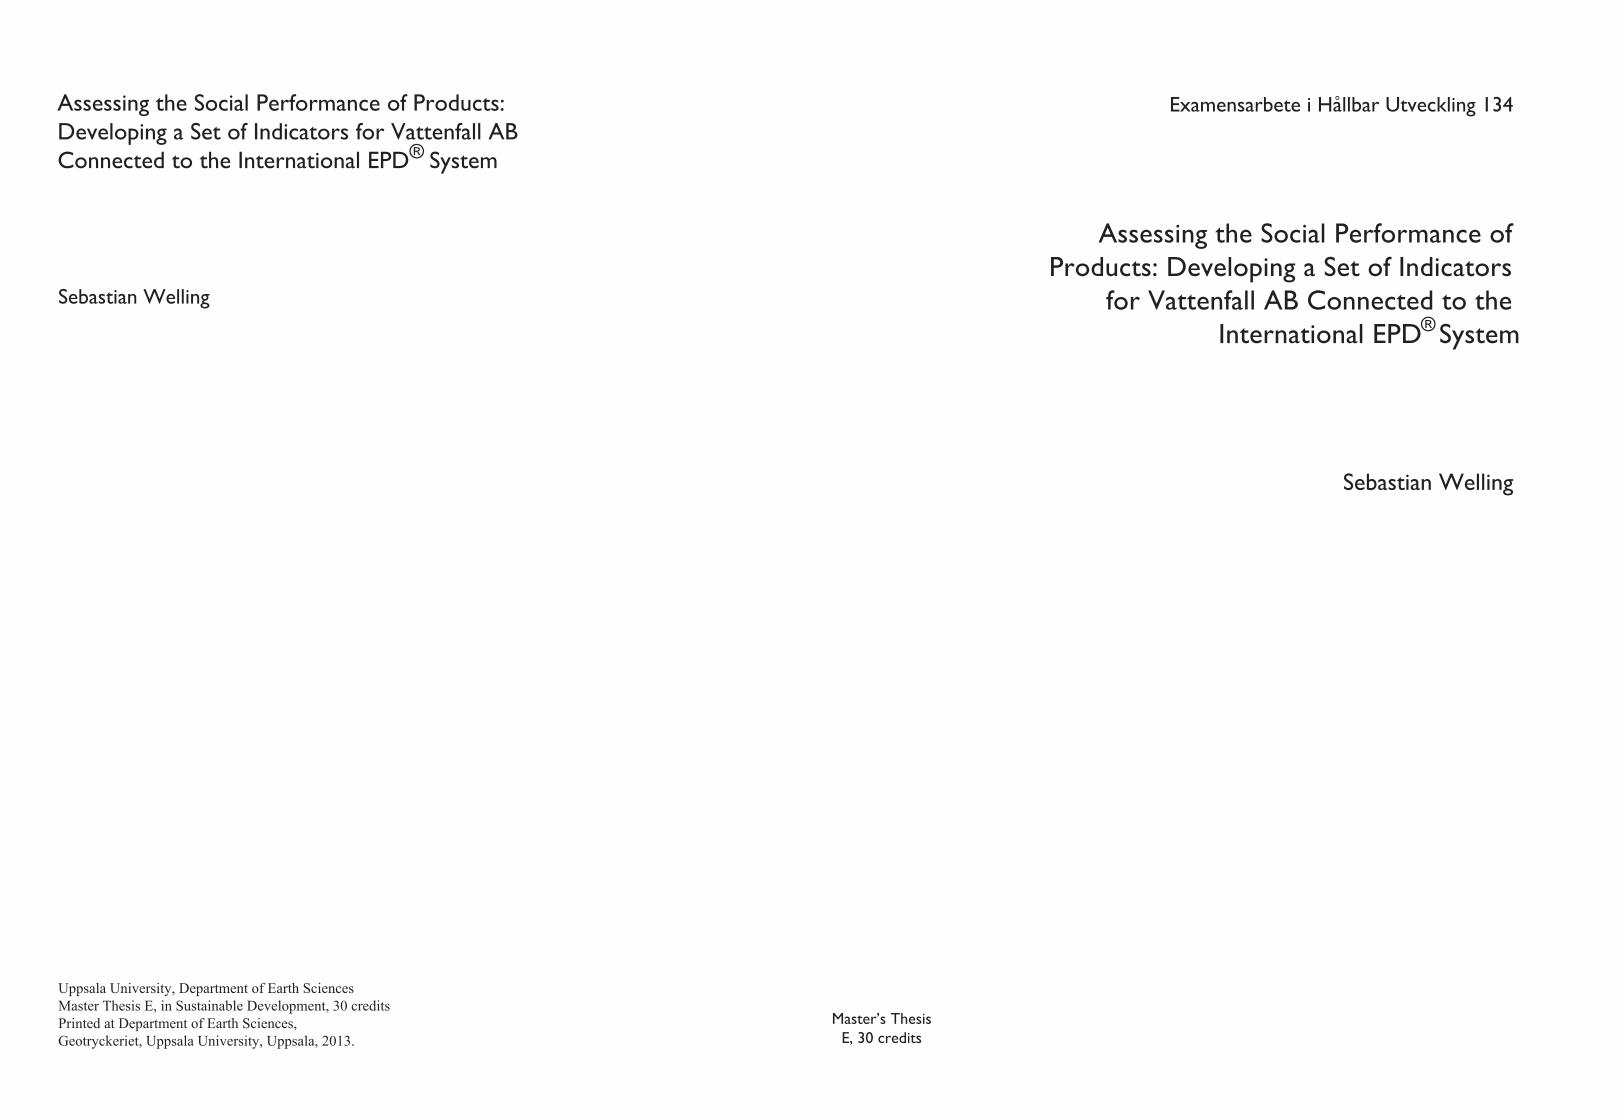
Examensarbete i Hållbar Utveckling 134 Assessing the Social Performance of Products: Developing a Set of Indicators for Vattenfall AB Connected to the International EPD System Sebastian Welling Sebastian Welling Uppsala University, Department of Earth Sciences Master Thesis E, in Sustainable Development, 30 credits Printed at Department of Earth Sciences, Geotryckeriet, Uppsala University, Uppsala, 2013. Master’s Thesis E, 30 credits Assessing the Social Performance of Products: Developing a Set of Indicators for Vattenfall AB Connected to the International EPD System ® ®
Transcript of Assessing the Social Performance of Products: Developing a...
Examensarbete i Hållbar Utveckling 134 Assessing the Social Performance of Products: Developing a Set of Indicators for Vattenfall AB Connected to the International EPD System
Sebastian Welling
Sebastian Welling
Uppsala University, Department of Earth SciencesMaster Thesis E, in Sustainable Development, 30 creditsPrinted at Department of Earth Sciences,Geotryckeriet, Uppsala University, Uppsala, 2013.
Master’s ThesisE, 30 credits
Assessing the Social Performance of Products: Developing a Set of Indicators
for Vattenfall AB Connected to the International EPD System®
®

Supervisor: Mikael Ekhagen Evaluator: Eva Friman
Examensarbete i Hållbar Utveckling 134
Sebastian Welling
Assessing the Social Performance of Products: Developing a Set of Indicators
for Vattenfall AB Connected to the International EPD System®


I
Assessing the Social Performance of Products: Developing a Set of Indicators for Vattenfall AB Connected to the International EPD® System
SEBASTIAN WELLING
Welling, S., 2013: Assessing the Social Performance of Products: Developing a Set of Indicators for Vattenfall AB Connected to the International EPD® System. Master thesis in Sustainable Development at Uppsala University, No. 134, 61 pp, 30 ECTS/hp
Abstract:
A set of indicators has been developed by the author of this work to assess the social performance of Vattenfall’s products (electricity & heat). This set of indicators has been adapted to the requirements of the International EPD® system. The aim has been to create a set of indicators that can be applied to all processes within the life cycle. The indicators are supposed to make a best possible statement of the social performance of a companies’ product, including the most relevant issues and topics within the pillar of social science and social sustainability.
The method used for the development of the indicators is the Delphi method. The Delphi process includes several rounds of reviewing. A group of experts usually carries out the reviewing. In this study five rounds of reviewing has been conducted with the help of nine experts. The first round has been an extensive literature review. The 390 indicators found in the literature have been classified according to the system and the instruction of S-LCA, which are described in the Guidelines for Social Life Cycle Assessment of Products. The fifth round of reviewing has been the last one and consensus on the list of indicators could be reached.
The outcome of the development process has been a set of 30 indicators. Not all subcategories proposed in UNEP/SETAC’s Guidelines for Social Life Cycle Assessment of Products have been covered. The indicators have been distinguished into two categories: core and additional. Some important social issues could not be expressed in the form of an indicator. They have been added in the final outcome of the paper, the ‘socioprofile’, as additional information.
The measurement and impact assessment of qualitative indicators have been a major challenge of this study. Data availability can be seen as another critical field of the study and the application of the indicators. Other studies that have been conducted focused on a lower amount of indicators.
The study has shown the possibility to quantify and measure social impacts to a certain degree. The proposed indicators are aiming at a globally focused assessment of social sustainability. The inclusion of experts and the group discussions with those experts have shown the importance of these indicators. The next step in the development of social sustainability indicators is the implementation of these indicators in a practical application and the study of the outcome. To be applicable within the International EPD® system, the Product Category Rules also have to be updated to allow for a Sustainable Product Declaration.
Keywords: S-LCA, social life cycle assessment, EPD, social indicators, Vattenfall, sustainable development
Sebastian Welling, Department of Earth Sciences, Uppsala University, Villavägen 16, SE- 752 36 Uppsala, Sweden

II
Assessing the Social Performance of Products: Developing a Set of Indicators for Vattenfall AB Connected to the International EPD® System
SEBASTIAN WELLING
Welling, S., 2013: Assessing the Social Performance of Products: Developing a Set of Indicators for Vattenfall AB Connected to the International EPD® System. Master thesis in Sustainable Development at Uppsala University, No. 134, 61 pp, 30 ECTS/hp
Summary: Not only environmental aspects have become more and more important in the discussion about sustainability. Consumers have raised their awareness and other factors play a role when it comes to consumption decisions. One of those factors is social aspects. This study had the goal to develop criteria, in form of indicators, to evaluate and measure the social performance of a product.
This study focuses on Vattenfall and the relevant product is electricity. The production of electricity does not only take place in Vattenfall’s electricity generation plants. In most of the cases fuels have to be produced. The production of fuels includes mining, enrichment, but also agricultural processes. Because of this complexity all processes that can be linked to the production of energy have to be considered. This holistic approach is also termed as life cycle assessment and assesses the performance of a product from the ‘cradle to the grave’. One way to carry out a life cycle assessment is to follow the requirements and rules of the International EPD® system.
Whereas the development of the environmental life cycle assessment has come far, the idea of social life cycle assessment is still in its infancy.
The development of the social indicators included a comprehensive literature review. Based on this literature review a method, called Delphi method, has been used to develop the set of indicators. The Delphi method makes use of the knowledge of experts within different fields (Audit, Sustainability & Strategy, Human Rights, GRI, the International EPD® system). They helped in the development and selection stage of the indicators. The outcome of this study is a set of 30 indicators, which has been developed in accordance to the requirements of the International EPD® system.
Discussions with experts revealed strength and weaknesses of the indicators. One of the strength of the indicators is that they can be applied on a global level and cover a wide range of topics on social issues. The availability of relevant data and the misinterpretation of the results can be seen as weaknesses for some of the indicators. Data collection for the indicators has not been part of the study. The collection of data and the adaption of some of the rules of the International EPD® system, the Product Category Rules, will be further steps in order to implement and test the eligibility of the set of indicators.
Keywords: S-LCA, social life cycle assessment, EPD, social indicators, Vattenfall, sustainable development
Sebastian Welling, Department of Earth Sciences, Uppsala University, Villavägen 16, SE- 752 36 Uppsala, Sweden

III
Acknowledgements
The development of a set of indicators within a newly explored field has been a challenging task. The outcome of this work would not have been achieved without the help of several people. There are some special persons I would like to give special regard to:
Mikael Ekhagen (Vattenfall AB Strategy & Sustainability), my main supervisor, supported me throughout the whole work, spent a vast amount of his time on this study and has always been available for questions, discussions, and feedback. He has shown a great interest in my work and helped me a lot with his guidance and expertise. He has been a highly valuable source for establishing contacts and helped me with all organizational procedures.
Miranda Jensen (Vattenfall AB Strategy & Sustainability), my second supervisor, helped me with her expertise and knowledge within the social sector. She has been one of the most important persons for discussions, feedback and comments. She helped me a lot with organizational procedures in the beginning as well as establishing contacts.
Eva Friman (Programme Director of Centre for Environment and Development Studies, CEMUS), my evaluator, helped me in the reviewing process of my thesis and provided me with highly valuable comments and feedback.
Monica Bowen-Schrire and Magnus Enell (both Vattenfall AB Strategy & Sustainability) helped me as important advisors and experts, gave me feedback, contributed in discussions and provided me with relevant information material. My work has to a high degree profited from their knowledge and expertise within the field of social sustainability and GRI. They helped me a lot with establishing further contacts to other experts within this field of the study.
Agneta Höjdestrand (Vattenfall AB Heat) has helped me in the reviewing process of my indicators and gave me important insights in the fields of workplace-security and the health and safety of workers.
Sven-Olof Ryding, Joakim Thornéus (both Miljöstyrningsrådet) and Lars Pettersson (Vattenfall AB Projects & Services) have helped in the reviewing process of my indicators and provided me with highly valuable feedback and experience reports.
Fredrik Brandberg (Vattenfall AB Heat) helped me in the beginning of my work to establish contacts. Without the establishment of these contacts the master thesis would not have been executed in the same way.
Timothée Parrique reviewed my thesis and gave me highly valuable and appreciated feedback on a very detailed level.
There have been many more persons that helped me, motivated me, and made my time at Vattenfall as pleasant as it was. Special thanks to all employees within the environmental and sustainability department of Vattenfall. You made me feel home at Vattenfall from the very beginning and ease the work on my thesis a lot. Thank you very much.

IV
Content
1 Introduction .................................................................................................................................................. 1
2 Background ................................................................................................................................................... 2
2.1 Sustainability ............................................................................................................................................. 2
2.2 International standards ............................................................................................................................... 3
2.3 Global Reporting Initiative ........................................................................................................................ 4
2.4 Corporate Social Responsibility ................................................................................................................. 4
2.5 Life Cycle Sustainability Assessment ........................................................................................................ 4
2.6 The International EPD® system ................................................................................................................. 5 2.6.1 General Programme Instructions ........................................................................................................... 5 2.6.2 Product Category Rules ......................................................................................................................... 7
2.7 Vattenfall ................................................................................................................................................... 8 2.7.1 Sustainability Strategy ........................................................................................................................... 9 2.7.2 Social Performance ................................................................................................................................ 9
3 Theory ......................................................................................................................................................... 11
3.1 Life Cycle Assessment ............................................................................................................................. 11 3.1.1 Goal and Scope Definition .................................................................................................................. 12 3.1.2 Life Cycle Inventory ............................................................................................................................ 13 3.1.3 Life Cycle Impact Assessment ............................................................................................................ 13 3.1.4 Life Cycle Interpretation ..................................................................................................................... 16
4 Methods ....................................................................................................................................................... 17
4.1 The Delphi process .................................................................................................................................. 17
4.2 Application of the Delphi process ............................................................................................................ 18
4.3 Delimitations ............................................................................................................................................ 19
5 Results ......................................................................................................................................................... 19
5.1 Indicators ................................................................................................................................................. 19 5.1.1 Local Community ................................................................................................................................ 20 5.1.2 Society ................................................................................................................................................. 21 5.1.3 Value Chain Actors ............................................................................................................................. 21 5.1.4 Workers ............................................................................................................................................... 21
5.2 Application of indicators .......................................................................................................................... 24

V
5.2.1 Socioprofile ......................................................................................................................................... 24 5.2.2 Evaluation of the socioprofile .............................................................................................................. 25 5.2.3 Case Study: Nuclear power plant ........................................................................................................ 25
6 Discussion .................................................................................................................................................... 27
6.1 Indicators ................................................................................................................................................. 28
6.2 Impact assessment .................................................................................................................................... 30
6.3 Comparison and outlook .......................................................................................................................... 30
7 Conclusion ................................................................................................................................................... 32
8 References ................................................................................................................................................... 33
Annex 1a – Human Rights .................................................................................................................................. 40
Annex 1b - Guiding Principles on Business and Human Rights ..................................................................... 41
Annex 2 – Relevant GRI performance indicators ............................................................................................ 43
Annex 3 – Data quality for different processes in the life cycle ...................................................................... 45
Annex 4 – Mandatory information for an EPD ................................................................................................ 46
Annex 5a – Code of Conduct .............................................................................................................................. 46
Annex 5b – Code of Conduct for Suppliers ...................................................................................................... 46
Annex 6 – Definition of subcategories ............................................................................................................... 47
Annex 7a – Survey for the evaluation of the indicators ................................................................................... 53
Annex 7b – Results of the survey ....................................................................................................................... 54
Annex 8 – Socioprofile ........................................................................................................................................ 55
Annex 9 – Upstream & core processes for the nuclear power plant ............................................................... 58
Annex 10a – Socioprofile with (fictive) inventory data .................................................................................... 59
Annex 10b – Socioprofile for nuclear electricity generation ........................................................................... 60

VI
Acronyms and abbreviations
AB Aktiebolag (Corporation) CPC Central Product Classification CSR Corporate Social Responsibility e.g. exempli gratia (for the sake of example) EC Economic EDF EDF Group E-LCA Environmental Life Cycle Assessment EPD Environmental Product Declaration ERA Energy Resources of Australia FTE Full Time Equivalent GPI General Programme Instructions GRI Global Reporting Initiative HIV/AIDS Human Immunodeficiency Virus / Acquired Immune Deficiency Syndrome HR Human Rights i.e. id est (that is) ILO International Labour Organization ISO International Organization for Standardization kV kiloVolts kWh kiloWatt hour LA Labour Practices and Decent Work LCA Life Cycle Assessment LCC Life Cycle Costing LCI Life Cycle Inventory LCIA Life Cycle Impact Assessment LCSA Life Cycle Sustainability Assessment LTIF Lost Time Injury Frequency MSR Miljöstyrningsrådet (SEMCo - Swedish Environmental Management Council) NGO Non-Governmental Organization OECD Organisation for Economic Co-operation and Development PCR Product Category Rules SEK Swedish krona S-LCA Social Life Cycle Assessment SO Society TWh Terawatt hour UF6 Uranium hexafluoride UK United Kingdom UN United Nations UNDSD United Nations Division of Sustainable Development UNEP/SETAC United Nations Environmental Programme / Society of Environmental Toxicology and
Chemistry US United States USEC United States Enrichment Corporation

1
1 Introduction
The perception towards the economy is changing. When comparing the traditional understanding of our economy by Friedman (1962) as cited by Birkin & Polesie (2012, p.187), there has only been “one and only one social responsibility for business, that of gaining more money and increasing profits”. According to Friedman (1962) it is “the workings of an invisible hand that will distribute wealth more widely in society”. One may criticize those assumptions Friedman (1962) connected with the free market economy.
Corporations are one of the major actors within the economy. From the very beginning, the business world was focusing on the goals proposed by Friedman. But as Birkin & Polesie (2012, p.238) put it, “the business world does not somehow exist separately from social and ecological worlds”. Businesses act in a system, which is highly interdependent on the involvement of social, environmental and economic aspects.
The actors that are directly or indirectly influenced and affected by a company are often referred to as the business’s stakeholders. Society reflects a very important stakeholder in the environment of every company. Members of society have several expectations how businesses should behave, act and what they should take responsibility for (Hutchins & Sutherland, 2008). Impacts on society are of particular interest; those may emerge throughout the whole product chain and can differ from corruption over discrimination to child labour. Working conditions as well as the right for organization between workers are other issues of concern (Hauschild et al., 2008).
As these examples of social impacts show, stakeholders get more aware of the impacts businesses have on the world (Hutchins & Sutherland, 2008). This awareness does not only involve general concerns – it has been more and more developed into a holistic approach by the help of life cycle thinking. The focus of consumers on the whole life cycle has therefore increased. It is not only the final product that is assessed, but the “whole chain of a product’s life cycle, from cradle to grave” (de Leeuw, 2005). This includes all processes from the beginning (e.g. resource extraction) to the end of a products life cycle (i.e. waste disposal). All external effects that seem to be relevant have to be taken into account. These externalities are included within all cycle stages of a product (de Leeuw, 2005). Supply chain’s complexity has increased a lot through effects such as outsourcing enabled by the globalisation (Hutchins & Sutherland, 2008). As Töpfer in UNEP/SETAC (2005, p.5) requires: “the impacts of all life cycle stages need to be considered comprehensively when taking informed decisions on
production and consumption patterns, policies and management strategies”.
Businesses need to satisfy these expectations and there is a growing insight of businesses to “conduct business in a socially responsible manner” (Foolmaun & Ramjeeawon, 2013, p.156). Many businesses still follow the goals mentioned by Friedman (1962). One may think that the realization of profits may not go hand in hand with the requirements of conducting business more socially responsible. Both approaches connote challenges as well as opportunities and businesses might be able to achieve both goals at the same time.
Even though suppliers influence the social performance of a business, they have not been in the main focus of considerations. Larger companies can pressure the market (incl. suppliers) in order to initiate environmental and social improvements. Supplier requirements and new initiatives can be examples for such an improvement process (Hutchins & Sutherland, 2008; Zbicinski et al., 2006). The goal of these actions is to make business transactions more transparent, which is needed to increase the social and environmental responsibility of corporations (Hoskins, 2005 as cited by Blom & Solmar, 2009). Common instruments to show transparency are certifications and results of certification audits. They have the ability to communicate a company’s performance to the market. This information is highly valuable for consumers, governments and other stakeholders of the corporation (Norris, 2006).
However, the practical implementation of those instruments lacks guidance and sufficient tools. Even though there is an obvious relation between cause and effect in our lives (Birkin & Polesie, 2012), businesses have trouble to interpret the relationships of their activities and the resulting social impacts (Hutchins & Sutherland, 2008). Many companies strive for a tool that can show those relationships and can give advice how certain causes affect the social, environmental or economic sphere (Dreyer et al., 2006). Especially when it comes to social assessment there is a lack of practical tools (Sandin et al., 2011). Efforts to minimize social impacts within a company have to be prioritized and a tool for this prioritization is needed. One of the most important requirements of such a tool is its applicability throughout the whole life cycle of a product (Hauschild et al., 2008). A distinction between sustainable and less sustainable developments has to be made; not only on the economic and environmental level, but also the social (Klöpffer, 2003).
Indicators are the key instrument for most of the social assessments. As the UN Conference on Environment and Development in 1992 pointed out, indicators are the basic module in making “informed decisions concerning sustainable development” (UNDSD, 2007, p.3). Indicators have the ability to

2
measure, count and value various social aspects within a given framework.
The goal of this thesis is to develop a set of indicators to assess the performance of a company or product within the social pillar of sustainability. The indicators are developed and specialized for the company Vattenfall and its products. The indicators have to be in line with the specific requirements of the International EPD® system and its product-specific category rules (PCR). At the best, the indicators are in line with the general reporting initiative guidelines (GRI).
The final set of indicators is presented in the result section of this work. The categorization of the indicators into stakeholder- and subcategories has been made in accordance with the general framework of a social life cycle assessment (S-LCA). This framework, as well as other basic concepts will be explained in the following parts of the thesis. For visualisation, a fictive application of the indicators on the life cycle of a nuclear power plant has been included. The thesis ends up with a critical discussion on the results and a general conclusion and outlook.
2 Background
The development of social sustainability indicators is highly connected to the field of sustainability. The concept of sustainability is described below. International standards, such as the human rights, serve as basic principles when developing aspects within the field of social science. From an organizational point of view the general reporting initiative and the concept of corporate social responsibility (CSR) are of high relevance. These concepts are described in the background part of this thesis. The indicators have been developed and adapted according to a system called S-LCA, which is embedded in the general framework of life cycle sustainability assessment (LCSA). The International EPD® system has been another system used for the allocation of the indicators. These systems and frameworks are presented in this chapter, as well as general information about the considered company, Vattenfall.
2.1 Sustainability
Sustainability is one of the key concepts of this thesis. All ideas, concepts and frameworks that have been used are connected to sustainability. The most common definition of sustainability and sustainable development was set up by the Brundtland Committee (1987, p.43). It defines sustainable development as a development “that meets the needs
of the present without compromising the ability of future generations to meet their own needs”.
The definition laid the foundation for a wide variety of concepts building up upon these thoughts. One of the most important concepts connected to sustainable development is the three pillar concept of sustainability, also mentioned as the “triple bottom line” (Elkinton, 2004). These three pillars consist of the environment, society and the economy. The need for balancing these pillars is described by several authors (Lehtonen, 2004; Zbicinski et al., 2006). As recognized by Zbicinski et al. (2006) and the UNEP/SETAC Life Cycle Initiative (200) the economic pillar can be seen as the most prominent one. Focusing on just one pillar does not lead to sustainability and decisions that are not based on all dimensions of sustainability lack important information and considerations.
The social dimension is considered to be the weakest one due to a lack of clear definitions and sufficient analytical and theoretical tools and indicators (Hutchings & Sutherland, 2008; Lehtonen, 2004 as cited by Brent & Labuschagne, 2006). Empacher (2002) as mentioned in Lehtonen (2004) defines the social dimension as a dimension with three different attributes. The authors declare it as bipolar (collective level and individual), reflexive (behaviour is changed by perceptions and interpretations) and immaterial. As the authors and Weingaertner & Moberg (2011) conclude, the social dimension is highly complex and analysis of it seems to be very difficult.
Ballet et al. (2003, p.6) as found in Lehtonen (2004, p.204) define social sustainable development “as one that guarantees for both present and future generations an improvement of the capabilities of well-being (social, economic or environmental) for all, through the aspiration of equity on the one hand – as intragenerational distribution of these capabilities – and their transmission across generations on the other hand”. Littig & Griessler (2005, p.72) as found in Weingaertner & Moberg (2011, p.1) see social sustainability as fulfilled “if work within a society and the related institutional arrangements satisfy an extended set of human needs [and] are shaped in a way that nature and its reproductive capabilities are preserved over a long period of time and the normative claims of social justice, human dignity and participation are fulfilled”.
The impacts within the social dimension are of special interest in this work. According to the Interorganizational Committee on Guidelines and Principles (1994) as found in Blom & Solmar (2009, p.21) social impacts are defined as “all social and cultural consequences to human populations of any public or private actions that alter the ways in which people live, work, play, relate to one another, organize to meet their needs and generally cope as members of society”. Impacts can be regarded as interaction or social relations between stakeholders

3
that have positive or negative effects within one or more processes in a products’ life cycle (UNEP/SETAC, 2009; Mazijn, 2008 as cited by Blom & Solmar, 2009). Similar to the social dimension, social impacts are regarded to be rather complex (UNEP/SETAC, 2009).
Guidelines, initiatives and concepts have been developed to give guidance for the management and minimization of social issues. This thesis will give a short summary of some of the most important frameworks within this field. Not all frameworks are listed and there are more guidelines and frameworks for social sustainability. The ISO 26000 is one of the guidelines for social responsibility and has been developed by the International Organization for Standardization (Moberg et al., 2009). The guidelines have been developed by different participants. The aim of the election of participants has been to present developing and developed countries equally (ISO 26000, 2010 as cited by Ekener-Petersen & Moberg, 2013). The guidelines give background information in the field of social responsibility for developing indicators in the context of a company (Benoît-Norris et al., 2011).
Another framework within social sustainability is the ‘Millennium Development Goals’. The goals are to combat malaria and HIV/AIDS, improve maternal health, reduce child mortality, promote empowerment of women and gender equality, achieve universal primary education, end hunger and extreme poverty and to global partnership for development, environmental sustainability. These topics reflect basic needs and human rights that should be available for every human being (The UN Millennium Goals Website, 2010 as cited by Weingaertner & Moberg, 2011). The OECD (n.d.) sets guidelines for multinational enterprises; they set standards and voluntary principles in various areas (e.g. human rights, consumer interests, combating bribery, competition and environment). Since humanity is facing various problems that exceed the environmental and economic sphere a single framework for the assessment of these problems might not be suitable. What is needed is a combination of frameworks that suits different temporal and geographical scales and that can be used in the context of different situations (Lehtonen, 2004). One example is the combination of life cycle based assessments for economic, environmental and social products.
2.2 International standards
The Human Rights and the International Labour Standards belong to the most important standards worldwide. The Universal Declaration of Human Rights laid the foundation for the assessment of
many social issues. They have been published in December 1948. More than 50 countries have been involved in the creation and writing process (UN, 1948). The Universal Declaration of Human Rights consists of 30 articles that describe, define and regulate how human beings should be treated. All articles are presented in Annex 1a. The core values within these articles and a corner stone in the development process are “freedom, justice and peace in the world” (UN, 1948). Within this study the articles 23 and 24 are of particular importance. Those articles relate to the actions of corporations.
The Department of Human Rights of the UN (2011) created the “Guiding Principles on Business and Human rights”. The principles build upon three different actors and their obligations: “states’ existing obligations to respect, protect and fulfil human rights and fundamental freedoms; the role of business enterprises as specialized organs of society performing specialized functions, required to comply with all applicable laws and to respect human rights; the need for rights and obligations to be matched to appropriate and effective remedies when breached” (UN, 2011, p.1). Almost half of the proposed guidelines (14 of 31) clarify the companies’ responsibility towards humanity. These guidelines serve as guidance for organizations to follow up human rights in an organizational context (UN, 2011). The principles, developed by John Ruggie (2011), have been of special importance for this study and laid the foundation for the development of the indicators. The UN framework “Protect, Respect and Remedy”, which has been proposed in 2008, has been an essential cornerstone for other international initiatives (e.g. ISO 26000). The Guiding Principles give an outline how the implementation of the UN framework should be conducted by states and businesses (Ruggie, 2011). The 14 guidelines about the responsibility of corporations to respect human rights are classified into the categories ‘foundational principles’ and ‘operational principles’ (see Annex 1b).
The International Labour Standards have been established in 1919. The aim of the standards is to ensure that working conditions – irrespective of gender – are productive and decent. Core values are dignity, security, equity and freedom. Since 1919, 189 conventions and 201 recommendations have been developed and published. They serve as a guidance to help distribute the benefits generated by the increasing global economy equally. Eight conventions have been identified as fundamental (ILO, n.d.):
• Freedom of Association and Protection of the Right to Organise (C087)
• Right to Organise and Collective Bargaining (C098)
• Forced Labour (C029) • Abolition of Forced Labour (C105)

4
• Minimum Age Convention (C138) • Worst Forms of Child Labour Convention
(C182) • Equal Remuneration (C100) • Discrimination (Employment and
Occupation ) (C111)
A list over all the conventions and recommendations can be found on the homepage of the International Labour Organization (ILO, n.d.).
2.3 Global Reporting Initiative
The Global Reporting Initiative (GRI) gives a framework to report on environmental, economic and social aspects. The framework also provides performance indicators and guidelines for their use (UNEP/SETAC, 2009). The aim of the GRI is to create an internationally accepted reporting framework that gives credible and comparable information about the company’s sustainability performance. The framework can be used by companies from different sectors, of different sizes and from different areas or countries. The GRI have been accepted by a large number of stakeholders because of its general applicability to report on the sustainable performance of an organization. The framework sets boundaries and guides the reporting process (Global Reporting Initiative, 2011).
Performance indicators present comparable data of an organization. The indicators within the GRI framework are divided into social, environmental and economic aspects. Each area of performance indicators consists of core and additional indicators. The area of the social performance indicators has been most important for this study. This area is divided into labour practices and decent work, society, human rights, and product responsibility. Even some indicators of the economic area have been of interest (Global Reporting Initiative, 2011). Relevant indicators for this study are presented in Annex 2.
A new version of the GRI guidelines is currently being developed; the expected publishing date is May 2013. Focus lays on “strengthened technical definitions and improved clarity, helping reporters, information users and assurance providers” (Global Reporting Initiative, 2013).
2.4 Corporate Social Responsibility
When talking about sustainability and companies there is one concept that cannot be excluded: Corporate Social Responsibility (CSR). The
European Commission (2002) as cited by Dahlsrud (2008) and Dobers (2009, p.4) defines CSR as “a concept whereby companies integrate social and environmental concerns in their business operations and in their interaction with their stakeholders on a voluntary basis”.
The reason why companies started to take responsibility for these aspects is that businesses undoubtedly are in relation to other stakeholders and their interests (e.g. cultural, environmental, economic or social systems) (Dobers, 2009). The framework guides the companies in managing their efforts and resources when it comes to social aspects (UNEP/SETAC, 2009). For many companies CSR lays the basic foundation of understanding aspects of social sustainability (Weingaertner & Moberg, 2011).
The outcome of CSR activities can work as a useful tool for the comparison of companies regarding their social performance (Jørgensen et al., 2009). This might be one of the reasons why the importance of CSR was increasing throughout the last two decades (Porter & Kramer, 2006 as cited by Weingaertner & Moberg, 2011). But there are also critics and concerns about CSR. One of the critics is that the concept of CSR does not add any new insights (Van Oosterhout & Heugens, 2006 as cited by Birkin & Polesie, 2012)). The concept of CSR covers mainly the social aspects of a company’s effort towards sustainability. Sustainability as a more comprehensive concept has therefore been introduced within Vattenfall and many other companies to replace CSR. As a consequence, life cycle assessment techniques (LCA) have emerged. One special form of LCA, which focuses on social aspects, addresses ethical and social issues. This can be seen as a relation between LCA and CSR (Jørgensen et al., 2009). LCA takes a more thorough look upon the supply chain of a product and its impacts (Evans et al., 2009). The technique is further explained in the following section.
2.5 Life Cycle Sustainability Assessment
A new framework for the assessment of products has emerged throughout the last decade: life cycle sustainability assessment (LCSA). It combines assessment methods for the economic, environmental and social dimensions of sustainability (Klöpffer & Ciroth, 2011; Klöpffer, 2003, 2008 as cited by Wood & Hertwich 2012). These frameworks assess every dimension separately and focus upon the whole life cycle of a product. The advantage of all methods is the holistic analysis of a product (Kruse et al., 2009).
Each method is independent from the other ones and there is no weighting between the different tools (Venturini et al., 2010 as cited by Vinyes et al.,

5
2013). The framework for assessing the economic impact of a product is called life-cycle costing (LCC). LCC will not be explained in detail, because it is not the focus of this thesis. The tool for assessing the social impact is called social life cycle assessment (social-LCA or S-LCA) and builds to a very high degree upon the tool for the environmental assessment, the environmental life cycle assessment (E-LCA or LCA). Those two frameworks will be explained more in detail in the next section.
When naming life cycle sustainability assessment, two institutions are of particular importance: the United Nations Environmental Programme and the Society of Environmental Toxicology and Chemistry. Those institutions build up the UNEP/SETAC Life Cycle Initiative. The initiative supports UNEP’s efforts to achieve a sustainable production and consumption (Valdivia et al., 2011). Three main objectives are followed up by the UNEP/SETC Life Cycle Initiative (Valdivia et al., 2011):
1. Improvement of emerging and existing life cycle approaches and methodologies in terms of relevance and global consensus.
2. Promoting life cycle thinking in the making of decisions for consumers, public authorities and enterprises
3. Promoting life cycle approaches by the application on a global level
In 2004 the initiative started the work on the integration of social criteria into the existing LCA (Blom & Solmar, 2009). One of the outcomes is the work on the Guidelines for Social Life Cycle Assessment of Products (UNEP/SETAC, 2009). This work also included the creation of methodological sheets for practical use. The work on these sheets started in 2005 (UNEP/SETAC, 2010a). Those guidelines give an overview of the application of a S-LCA (UNEP/SETAC, 2009 as cited by Valdivia et al., 2011). The methodological sheets serve as a pool of indicators for assessing the social performance of a product and have main importance for this work. Definitions for subcategories, used to classify the indicators, are also presented in those sheets (UNEP/SETAC, 2010a).
2.6 The International EPD® system
The International EPD® system is a system which sets rules and gives guidance how to carry out and report the results of a LCA. According to Grahl and Schmincke (2007) an “Environmental Product Declaration (EPD) [...] is a standardized (ISO 14025) and LCA-based tool to communicate the environmental performance of a product”. This
definition already states the goal, the requirements and the structure of the system. The goal is to give a transparent, uniform and quantified reporting system of data on the environmental performance for a wide range of products (EPD, n.d., 2012). The reports are developed by producing organizations, reviewed by independent verifiers and used by other business partners to compare product-related information (Strand, 2008; EPD, 2012). The documentation process is highly structured and standardized; it follows the internationally accepted standards ISO 9001 (Quality management systems), 14001 (Environmental management systems), 14040 (LCA – Principles and procedures), 14044 (LCA – Requirements and guidelines) and 14025 (Type III environmental declarations) standards. The accordance to commonly recognized rules within LCA and the process of external reviewing and verifying gives the system a high credibility (Strand, 2008; Schmincke et al., 2011; Vattenfall AB, 2012a; EPD, 2012). In addition to the standard reporting methods, the system also allows for reporting of additional information (EPD, n.d. as cited by Strand, 2008).
The Swedish Environmental Management Council founded the system in 1998 (Zbicinski et al., 2006; Vattenfall AB, 2012a). The main reason for its establishment was the need for a communication and information tool for businesses to set standards for the comparison of life cycle related information of products (Vattenfall AB, 2012a). When creating an EPD some requirements have to be fulfilled. Those requirements are described in the General Programme Instructions (GPI) and in the Product Category Rules (PCR) (EPD, 2012; Del Borghi, 2013).
2.6.1 General Programme Instructions
The GPI set the general frameworks of the International EPD® system and lay the foundation for the development of PCRs (EPD, 2012). Within these instructions the organizational structure is described, which lays the basic foundation of the International EPD® system. The International EPD Consortium is the main actor in the development and verification of the EPDs and PCRs. Other actors within the International EPD® system are the PCR moderator, LCA and EPD experts, the Product Category Stakeholder Consultation Group, Certification bodies, individual verifiers and organizations. Figure 1 illustrates the organizational structure and the connections between those actors.
The development of an EPD can be divided into five steps. When the need of environmental information from market actors is recognized, the development of a new PCR starts. After the development of the PCR, the LCA for this special

6
product can be conducted. The next step is the development of an EPD document. After the verification, the last step of the EPD development is the launching of the EPD to the market (EPD, 2012).
Fig. 1. Organization EPD system (adapted EPD, 2012)
The International EPD® system published the GPI in 2008. The GPI will be updated in 2013 and one of the outlines of this updates is the inclusion of economic and social aspects. As the International EPD® system (2012, p.19) states, “it is suggested that the EPD also could include other relevant sustainability indicators as additional and voluntary information”.
The most important information in the GPI is the structure of an EPD. According to the GPI the EPD should include programme-related, product-related, environmental performance-related and additional environmental information. In addition to that the mandatory statements can also be seen as obligatory. Those five parts shall be included in the EPD (EPD, 2012). The programme-related information part gives basic information about the EPD programme. Specifications of the programme are the division of the life cycle into three different life cycle stages. The first life cycle stage consists of the upstream processes and includes all processes from the cradle to the gate. The manufacturing process, often referred as the core process, includes the processes from gate to gate. The degree of specific data should be the highest for the core module. The last part of the life cycle is the downstream processes, which comprise everything from the gate to the grave (EPD, 2012).
The system boundaries are another important part of the programme-related information. They define the unit processes to be considered in the study and determine which of the upstream and downstream processes can be excluded. The International EPD® system categorizes and specifies system boundaries in time, towards nature and geography, in the life cycle and towards other technical systems (EPD, 2012).
Categorization of data represents the last important part of the programme-related information. Data is divided into specific, selected and other
generic data. Specific data within the International EPD® system conforms to the definition of primary data, mentioned in part 2.1.2. The definition of selected and other generic data is identical with the one described in part 2.1.2 (EPD, 2012).
The product-related part includes information on eight different topics. The trade name of the product is supposed to be named together with the CPC code of the CPC classification system. The organization should be shortly described and relevant work (e.g. SA 18000) as well as management- or product related certifications should be named. The intended use has to be stated and a technical description is supposed to be added, including functional characteristics. If an LCA has been carried out, a short description should be included. Relevant substances and materials shall be listed. One of the most important parts of the product-related information is the statement of the functional unit. To calculate and show the performance of a product all data (inputs & outputs) has to be referred to this functional unit (EPD, 2012).
The environmental performance-related and additional environmental information are supposed to be collected by the organization that is preparing the EPD. The environmental performance-related information needs not be reported separately (EPD, 2012). The last part of the EPD is mandatory statements.
The next step after the creation of an EPD is the verification process. According to the ISO 14044 the reviewing should secure the technical and scientific validity of the method used within the LCA, the appropriateness and reasonability of the data in respect to the goal of the study, transparency and consistence of the report and the integration of the limitations and the goal of the study into the interpretations of the study (UNEP/SETAC, 2009). This verification process is divided into two parts: EPD verification and EPD process certification. The EPD verification ensures the quality and compliance to the International EPD® system and the rules in the PCR of the used data, calculation methods, environmental performance presentation and additional environmental information. The verification has to be carried out by a certification body, which has been accredited, or a recognized individual verifier. The EPD process certification phase assures that the organization that carries out the EPD has an internal process for the development of EPDs which is conformed to the GPI. The verification can only be done by accredited certification bodies. The organization needs to ensure that all the data for the verification is presented and that procedures for internal follow-up of the EPD have been established (EPD, 2012).
The International
EPD Consortium
(IEC)
SteeringCommittee
Technical Committee
Secreteriat
EPD
LCA/EPD Experts
PCR
Mod
erat
or
PCR
ProductCategory
Stake-holder
Consul-tationGroup
Individual Verifier
Certifi-cationbodies
Org
aniz
atio
ns

7
2.6.2 Product Category Rules
The requirements for different products are stated in the product category rules. The PCR assign products to a specific product category, set parameters for the EPDs and define quality requirements for the data and calculation and collection rules (EPD, 2012). The definitions and requirements guarantee the comparability of the EPDs for different products (Del Borghi, 2013). Calculation rules for the impact assessment have to be harmonised to achieve this goal (EPD, 2012).
According to the International EPD® system (2012), the following things shall be included in the PCR document:
• Central Product Classification (CPC) code • Product category description and definition • Goal and scope • Product content declaration including
substances and materials • Results of the inventory analysis • Parameters for LCA data reporting that are
pre-determined • Selection of impact categories and
calculation rules • Type of information that is included within
the downstream processes and a description of it
• “Rules for provision of additional environmental information”
• Converting instructions for the background data to the EPD format
• Instructions for the format and content of the EPD
• Information about unconsidered life cycle stages in the EPD
• Document’s validity
The first part in the list is the CPC code. The CPC system of the UN is used within the International EPD® system (2012). The considered PCR for this study has the code 171 and is valid for electrical energy. The PCR for the UN CPC 171 is bounded to the information for the CPC 173 for steam and hot water. It has been developed in 2007. The last update has been done in 2011 (Schmincke et al., 2011).
The PCR for CPC 171 and 173 include the following technologies for the steam, hot water and electricity production: nuclear technologies, wind power technologies, solar technologies, ocean technologies, electrochemical processes, hydropower technologies and waste heat or ambient heat from other processes (Schmincke et al., 2011).
One of the most important parts of the PCR is the goal and scope definition of the PCR. It includes the description of system boundaries, data and data quality, units to be used, cut-off rules and the functional unit (EPD, 2012). For the CPC 171 the
functional unit is defined as “1 kWh net of electricity generated and thereafter distributed [...] to the consumer” (Schmincke et al., 2011, p.10). The impacts should be allocated to the functional unit and related to the technical service life of the plant (Schmincke et al., 2011).
The inventory analysis is carried out within the system boundaries. Figure 2 gives an overview of the considered and excluded system boundaries. Each step of the life cycle consists of three different process units: the construction and decommissioning of infrastructure and the main processes of the three lines (upstream, core, downstream).
Fig. 2. System boundaries for the inventory analysis (adapted from Schmincke et al., 2011)
The upstream processes can be divided into three different process groups: fuel production, auxiliary input production for the energy conversion plant and upstream infrastructure. The processes decommissioning and construction of infrastructure can be excluded in the upstream phase of the life cycle. Their impact is typically lower than 1 per cent can therefore be excluded in accordance with CPC 171 and 173. If infrastructure is included, suppliers’ factory buildings and machines are considered. The auxiliary inputs production consists of transportation from the extraction to the processing and to the energy conversion plant, its storage at the energy conversion plant, the fuel and electricity production that is used for the production and the extraction of natural resources. The fuel production includes the processing and preparation of fuels, the process of fuel storage, the natural energy resources extraction and the transportation from the extraction or cultivation to the refinery and conversion plant (Schmincke et al., 2011).
For the core process the system boundary is defined as the gate, which means the fence of the conversion plant. The core processes include all processes that are related to the energy production. The processes of infrastructure in the core processes are also included (Schmincke et al., 2011). Because this study is giving a practical example how to use indicators within the generation of nuclear energy, the processes for this technology are presented below
Upstreammodule
Downstream module
Core module
Constructioninfrastructure
Decommiss. infrastructure
Upstreamprocesses
Core processes
Downstream processes
Constructioninfrastructure
Constructioninfrastructure
Decommiss. infrastructure
Decommiss. infrastructure

8
(see table 1). The processes are divided into core processes and core infrastructure processes.
Table 1. Overview of core processes within the life cycle of nuclear technologies (Schmincke et al., 2011)
The downstream processes are the least comprehensive ones in the generation of electricity. As stated in Schmincke (2011, p.12) “the use stage of electricity, steam and hot water fulfils various functions in different functions”. The use stage and the end-of-life of the products are excluded from the downstream processes (Schmincke et al., 2011). Because of that the most important downstream process is the distribution of the electricity to the consumer. It includes the construction, reinvestment and dismantling of power poles and power lines, cables, transformer stations and switch yards and ground work (Schmincke et al., 2011).
Geographical and time boundaries are also mentioned in the PCR. The requirements of the PCR are that data is site specific, representative as long as the EPD remains valid and that it reflects a reference year (Schmincke, 2011).
Rules for the quality and the choice of data are of particular importance for the comparability and transparency of different EPDs. The PCR gives therefore detailed information on which data to use.
Data must be separated and shall be able to allocate to the upstream modules, core processes, construction and decommissioning of the core infrastructure and downstream module. The second criterion is the quality of the data. As described before, the data can be distinguished into specific and generic data. A main rule is that specific data should always be prioritized if available. The data for the core processes should be specific. For the main fuel production and the transportation distances, including the type of vehicles and the distances within the production chain of fuels and to the energy conversion plant, specific data is required. If specific data is not available, generic data may be used (Schmincke et al., 2011). All other upstream and downstream processes can make use of (selected) generic data. An overview of process categories and the type of data that is supposed to be used can be found in Annex 3. It is important that selected and other generic data is maximal ten years old. Impacts described by this type of data should not exceed 10 per cent of the total product impact (Schmincke et al., 2011).
The PCR sets rules for data collection. Data for the main fuel production should come from the subcontractors. The validity of the data should be in accordance with the defined reference period for the core module. Data of the downstream infrastructure is related to the infrastructure’s technical service life. The impact is calculated by the aggregated impact of the whole infrastructure, divided by the amount of kWh that are expected to be distributed throughout the whole life time, based on an annual average. The final data is supposed to be presented in a profile form (e.g. ecoprofile), which separates the impacts for the upstream, core and downstream modules (Schmincke et al., 2011).
The PCR document informs about other product related information that must be reported. An overview of all parts which should be included in the EPD is included in Annex 4.
2.7 Vattenfall
Vattenfall is a leading energy utility in Europe. Within the production of heat it is the largest one in Europe. Besides the production, Vattenfall takes care of the distribution and sales of those products. Apart from these two products, Vattenfall sells gas and trades energy. Approximately 33,000 people are employed by Vattenfall in the following countries: the Netherlands, Germany, the United Kingdom (UK), France and the Nordic countries. Vattenfall AB is the parent company and is owned by the Swedish state (Vattenfall AB, 2013a).
Electricity is produced by technologies using the following energy sources: nuclear, hydro, coal,
Process level Process
Core processes Energy conversion process of plant(s)
Maintenance (for example lubrication but not reinvestment of components)
Reserve power and reserve heat including test operation
Transportation of waste
Handling/treatment/deposition of spent nuclear fuel and other radioactive wasteHandling/treatment/deposition of other operational waste
Core infrastructure Reactor building and other infrastructure including digging, foundations, roads etc within the site, and respective construction processes
Reactor, machinery, cables, tubes and other equipment for the conversion process and reserve power
Power plant transformer
Connection to the power network
Transportation of inputs and outputs
Facilities for handling of radioactive waste (on site and elsewhere) and facilities on site for handling of waste, residues and wastewater
Reinvestments of material and components during the estimated technical service life

9
wind, biomass and natural gas. The generation of electricity includes and requires management of the whole life cycle, from the production of the fuel, to the management of the waste. The energy is delivered by national grids to the consumers (Vattenfall AB, 2012a). In 2012 Vattenfall accounted for 178.9 TWh electricity productions. This corresponds to an increase by 7.3 per cent to the year before (Vattenfall AB, 2013a). More information and trends, presented by country, are given in table 2. More detailed information about Vattenfall’s sustainability strategy, social performance, their code of conducts and the EPDs performed by Vattenfall, follows in the next parts of this chapter.
Table 2. General Information about Vattenfall's business in 2012 (Vattenfall AB, 2013a)
2.7.1 Sustainability Strategy
Vattenfall has set three sustainability targets in October 2012. Renewable energy generation is one of those targets. The growth rate of the installed energy capacity from renewable energy sources is aimed to be higher than the average growth rate for ten countries in central and northern Europe. Investments in those energy sources can be seen as highly related to the growth rate of those technologies. The total investments for the period 2013 – 2017 account for SEK 123 billion. The investments in renewable energy sources (wind SEK 20 billion, hydro SEK 8 billion and biomass SEK 6 billion) amount to approximately SEK 35 billion. This corresponds approximately 28 per cent of the total investment volume. The investments in wind power are one of the main focuses of Vattenfall’s investments plans and represent the second biggest
investment after lignite and hard coal (SEK 23 billion). The generation of electricity by wind and biomass in 2012 accounted for 5.6 TWh (approx. 3,2 % of total generation). The total electricity generation in 2012 has been 176.1 TWh (Vattenfall AB, 2013a, 2013b).
The other two targets are the lowering of CO2 emissions and improvements within the field of energy efficiency Vattenfall puts special focus on the replacement of coal as a fuel by biomass and emission intensity. By 2020 the CO2-emissions should be lowered to 65 megatons (Vattenfall AB, 2013a). This can be seen as a rival goal to another commitment of the company: energy supply. This supply is supposed to be done at the lowest possible costs for the consumers. From a present day perspective coal-fired power plants fulfil these requirements of cost efficiency to a higher degree than renewable energy sources. The long-term goal is to decrease the use of coal as a fuel.
Apart from those sustainability targets Vattenfall has set up seven areas with a special focus on sustainability: Human rights, anti-corruption, business ethics, gender equality, diversity, working conditions and the environment. One way to fulfil these social sustainability goals is the implementation and application of international accepted and important standards for all suppliers. Vattenfall has been part of the creation of Bettercoal, an important initiative, which promotes and provides best practices within the supply chain of coal. In 2008 Vattenfall started to sign the ten principles of the UN Global Compact (Vattenfall AB, 2013a). Other goals within the field of social sustainability are: equal rate of female employees to female managers, equal rights and opportunities for the employees and no tolerance of acts of discrimination (Vattenfall AB, 2013b).
Vattenfall has recognized the importance of a life cycle perspective on products. This led to the implementation and use of E-LCA. These E-LCAs have been standardised and are conform to the International EPD® system. Since the 1990s Vattenfall has conducted E-LCAs in order to get more information about the environmental impact of their activities within electricity generation (Vattenfall AB, 2010a, 2012a). The EPD of Vattenfall’s hydro power plants in Sweden, Lule älv, obtained in 1999, has been the first EPD worldwide in this field (Vattenfall AB, 2013b).
2.7.2 Social Performance
Information about social performance is presented in Vattenfall’s annual report. Vattenfall reports according the GRI standards (described in 1.4); they started to report according to GRI in 2003 (Vattenfall AB, 2013b). The following information about Vattenfall’s social performance covers the fields of
Sweden Germany Netherlands
88,8 68.3 13.3
Fossil based 46%
Nuclear 27%
Hydro 24%
Wind 2%
Biomass, waste 1%
Sweden Germany Netherlands
Electricity (TWh) 42.1 36.6 17.5
Electricity (Number of customers) 947,000 2,788,000 2,147,000
Heat (TWh) 4.1 16.1 4.3
Gas (TWh) 73.3 26.5 51.1
Gas (Number of customers) 927,000 3,401,000 1,854,700
Germany
Sweden
Netherlands
Denmark
UK
Other
161
180
Electricity generation (in TWh)
Number of employees per country (FTE)
17,729
8,930
677
5,117
Sales

10
gender distribution in the workforce, collective bargaining agreements and trade unions, health and safety, composition of governance bodies and human rights issues.
Vattenfall has statistics on the distribution of their workforce in the different countries. The majority of the workforce (76%) is men. The achievement of gender equality has been defined as a balanced gender ration (50%) with a maximum variation of 10 per cent. In two of nine countries gender equality could be reached. Table 3 presents the numbers for each country (Vattenfall AB, 2013b).
Table 3. Distribution of Vattenfall's workforce in 2012 by gender and country (Vattenfall AB, 2013b)
When it comes to the coverage of employees with collective bargaining agreements, Sweden, Germany, Finland and the Netherlands reach at least 95% of coverage. The lowest coverage exists in Denmark (44%). The highest representation of employees by trade unions exists in Sweden and Finland (85%). Table 4 illustrates the figures for all countries (Vattenfall AB, 2013b).
Table 4. Share of collective bargaining agreements and employees represented by trade unions within Vattenfall by country (Vattenfall AB, 2013b)
Vattenfall tries to improve their performance within the field of health and safety through different actions. Contractors that work at Vattenfall’s facilities or plants receive necessary information on health and safety. Vattenfall has internal committees for formal joint management and workers health and safety. Three quarters of the workforce is represented
in those committees. Vattenfall offers health check-ups and takes preventive measures (e.g. health promotion activities, back exercise courses or vaccination programmes). Other offers are assistance and counselling by professional psychologists or counsellors, programmes on first aid training for all employees or the establishment of disability management programmes.
Table 5. LTIF, sick leave and work-related fatalities within Vattenfall (Vattenfall AB, 2013b)
All these programmes aim to increase the health and safety of all workers and to minimize the amount of injuries, occupational illness and process safety incidents. As shown in table 5 the sick leave was increasing in the last years. The LTIF-index and the amount of fatalities for 2012 are the lowest ones in the last four years (Vattenfall AB, 2013b).
The composition of governance bodies is presented in table 6. More than 80% of the governance bodies are represented by men. The achievement of gender equality follows the same definition as described for the workforce. Vattenfall reached gender equality in Finland and Poland (Vattenfall AB, 2013b).
Vattenfall is member in several initiatives and developed principles to follow up and assure the accordance of Human Rights. The Bettercoal initiative, which Vattenfall is member of, strives towards continuous CSR improvements in the field of coal sourcing. Vattenfall signed the UN Global Compact in 2007 and set up a Human Resources Policy. The Vattenfall Group has its own Code of Conduct and even a specialised version for their suppliers (see Annex 5a & 5b). In 2012 one case of discrimination has been reported (Vattenfall AB, 2013b).
Table 6. Composition of governance bodies by gender in total amount and in percentage (Vattenfall AB, 2013b)
Workforce 2012 Men Women Total
Sweden 6,634 (74%) 2,297 (26%) 8,931
Denmark 573 (85%) 104 (15%) 677
Finland 24 (46%) 28 (54%) 52
Poland 71 (78%) 20 (22%) 91
Germany 13,635 (77%) 4,094 (23%) 17,728
Netherlands 3,872 (76%) 1,245 (24%) 5,117
Belgium 1 (33%) 2 (67%) 3
UK 101 (63%) 60 (37%) 161
France 12 (55%) 10 (45%) 22
Serbia 8 (67%) 4 (33%) 12
Total 24,930 7,864 32,794
Collective bargaining agreements
Employees represented by trade unions
Sweden 98% 85%
Denmark 44% 70%
Finland 95% 85%
Poland 76% 0%
Germany 98% 70%
Netherlands 98% n.a.
UK n.a. n.a.
2012 2011 2010 2009
2.3 3.3 4.5 4.3
Sick leave 4.2 3.9 3.8 3.2
Work-related fatalities 1 2 2 3
LTIF Reported accidents at work (per 1,000,000 hours worked)
Governance bodies Women Men Total
Sweden 223 (26%) 638 (74%) 861
Denmark 8 (17%) 40 (83%) 48
Finland 2 (50%) 2 (50%) 4
Poland 4 (44%) 5 (56%) 9
Germany 160 (12%) 1,173 (88%) 1,334
Netherlands 113 (26%) 320 (74%) 433
UK 2 (22%) 7 (78%) 9
France 0 (0%) 2 (100%) 2
Total 512 (19%) 2,187 (81%) 2,699

11
In the field of corruption Vattenfall has signed ‘Partnering against Corruption – Principles for Countering Bribery’ and initiated the Vattenfall Antitrust Programme in 2005, which offers training in anti-corruption and competition law. In 2012 no cases of anti-corruption have been reported (Vattenfall AB, 2013b).
Vattenfall has initiated several mitigation programmes with indigenous people. The constructions of crossing routes for reindeers, the sponsorship of a museum in Jokkmokk and other cultural preservation projects on a smaller scale have been realised. The amount of resettled estates in 2012 has been seven (Vattenfall AB, 2013b).
3 Theory
As named before, the life cycle sustainable assessment has become more important. For the development of a set of indicators, this assessment has laid the foundation for the use of the indicators. The systems of E-LCA and S-LCA have been of particular importance. The theory of those systems will be described in this chapter of the study.
3.1 Life Cycle Assessment
The origins of LCA reach back to the end of the 1960’s. Most of its first development has been done in the beginning of the 1970’s. One of the first approaches was the comparison of the environmental impact of different packages (UNEP/SETAC, 2009). Consoli et al. (1993) as found in Menna et al. (2013, p.506) define LCA as “a technique for quantifying the environmental aspects associated with a product over its entire life cycle, in other words, “from the cradle to the grave”. This encompasses the extraction and processing of raw materials, manufacturing, transportation and distribution, use, reuse, maintenance, recycling, and final disposal”. The definition already states the idea of life cycle thinking; the inclusion of all life cycle stages, including manufacturing centres, suppliers, retail outlets and distribution centres (Zhou et al., 2000; Simchi-Levi et al., 2003 as cited by Hutchings & Sutherland, 2008). Results should be presented for all processes of the life cycle. The goal is to trace and assess the products’ impacts on the entire life cycle (Bauman & Tilman, 2004 as cited by Blom & Solmar, 2009).
To make the life cycle assessment comparable and to be able to compare products with each other it is necessary that all flows within the different processes refer to a functional unit (Kruse et al., 2009). The quantification of a product’s impacts
requires extensive data collection. This data has to be gathered in a comprehensible way to make the whole assessment transparent. Responsibilities of the different actors involved in the life cycle assessment have to be defined clearly (Heiskanen, 2002 as cited by Moberg et al., 2009). Only the achievement of these requirements enables to gain acceptance of the framework. LCA is recognized as one of the only internationally standardized methods for the assessment of environmental impacts of different products over the whole life cycle (Klöpffer, 2008; UNEP/SETAC, 2009).
The use of ISO standards within LCAs contributes to this acceptance. The ISOs 14040 and 14044 – which have been updated in 2006 – determine the requirements and necessary elements that need to be included in an environmental LCA (UNEP/SETAC, 2009). ISO 14040 describes principles and the framework of a life cycle assessment. ISO 14044 gives guidance on requirements and guidelines (Menna et al., 2013). The functional unit is defined in the ISO 14040, 3.20. As cited by Benoît et al. (2010, p.159) the ISO 14040, 3.20 describes the functional unit as the “quantified performance of a product system of use as a reference unit”.
The LCA is divided into four different steps. The first step in a LCA is the definition and scoping of the goal. The inventory analysis and impact assessment follow as the second and third step. The interpretation is the last part within a LCA (Bauman & Tilman, 2004 as cited by Blom & Solmar, 2009; Menna et al., 2013).
As stated in the introduction there has been a lack of assessment tools for the social pillar of sustainability (Reitinger et al., 2011). The system of the E-LCA has therefore been adapted to assess social impacts (Norris, 2006). Information on the whole product life cycle is used to inform about the social impact of a product. Information to conduct the S-LCA is gathered at different levels (management or enterprise, facility or plant and processes) (Benoît et al., 2010).
S-LCA follows the same structure as E-LCA; the focus is on the product life cycle and the same principles are followed. One consequence of that is the inclusion of a product’s social aspects into the life cycle assessment method (Jørgensen et al., 2009; Benoît et al., 2010). Some parts of the two systems do not coincide (e.g. different consequences of the same activities (UNEP/SETAC, 2009)) and therefore the methods and frameworks need to be modified (Hutchins & Sutherland, 2008).
The modification of the framework began 19 years ago, when SETAC (1993) published its workshop report ‘A Conceptual Framework for Life Cycle Impact Assessment’. Thenceforward the framework has been under development and it still is (Jørgensen et al., 2009; UNEP/SETAC, 2009), as Jørgensen (2013, p.296) states it: “SLCA is still in its

12
infancy”. The interest has been increasing since then and especially after 2004 a rapid development could be recognized (Jørgensen, 2013). In 2009, the ‘Guidelines for Social Life Cycle Assessment of Products’ (UNEP/SETAC, 2009) introduced one of the first guidelines for standardized social life cycle assessment.
In these guidelines S-LCA has been defined as “a social impact (and potential impact) assessment technique that aims to assess the social and socio-economic aspects of products and their potential positive and negative impacts along their life cycle encompassing extraction and processing of raw materials; manufacturing; distribution; use; re-use; maintenance; recycling; and final disposal” (UNEP/SETAC, 2009, p.37). When comparing other definitions in literature, the most important components are the assessment of social impacts throughout the whole life cycle of a product (Jørgensen et al., 2009; Jørgensen, 2013). Reitinger et al. (2011, p.381) point out the importance of “a comparative analysis at the level of sectors/industry”. Benoît et al. (2010) stress the aspect of the presence of negative and positive impacts.
The product-orientated approach of the S-LCA puts the focus of the study on impacts; which can be influenced by the companies along the life cycle of a product (Jørgensen et al., 2009; Dreyer et al., 2010). A major focus lies therefore on the affected stakeholders (Dreyer et al., 2006, 2010a). The focus on services, products and the whole life cycle as the scope of the study makes S-LCA a unique assessment method (UNEP/SETAC, 2009). The adaption to specific products, sectors and companies (Hauschild et al., 2008) as well as the holistic consideration of the entire life cycle can be seen as an advantage (Jørgensen, 2013).
3.1.1 Goal and Scope Definition
In the first phase of the LCA, the goal and scope definition, basic elements of the LCA are set. Basic elements that should be included in the formulation of the goal and scope definition defined by the ISO 14044 (2006) are:
• the specification of the product • the definition of the purpose and application
of the LCA • system boundaries • the functional unit • the activity variable • type of data • type of impact, stakeholder and
subcategories included in the study • inventory indicators • impact assessment methods • allocation procedures
• assumptions • planned interpretations • limitations • optional elements and value choices • requirements for the data quality • type of review • format and type of the report
A special attribute when it comes to the goal and scope definition of the S-LCA is the relevance of geographical location of the organizations which fulfil the relevant processes and the division into different stakeholders that are affected and/or affect these processes (e.g. workers, local communities, consumers) (Grießhammer et al., 2005, 2006; Hauschild et al., 2008; UNEP/SETAC, 2009). Instead of single processes, suppliers of services and commodities, product manufacturers, distributors, consumers and waste management, companies are the centre of the reviewing process (Dreyer et al., 2006). The importance of geographical locations and specific products specifications give the system boundary setting phase a special importance. The system boundaries cannot be generalized and decided on a standardized set, but have to be evaluated for each product (Dreyer et al., 2006).
Fig. 3. Allocation of impacts within E-LCA and S-LCA (adapted from Dreyer et al., 2006; Hauschild et al., 2008)
This affects the inventory analysis. Social impacts occur on the organizational level of a company. In contrast to environmental impacts, some social
E - L C A
S - L C A
Upstream
Upstream
Core
Core Downstream
Downstream
Process
Company

13
impacts cannot be allocated to a single process in the production system (Dreyer et al., 2006, 2010; Spillemaeckers et al., 2004 as cited by Jørgensen et al., 2008; Mazijn, 2008 as cited by Blom & Solmar, 2009). It is important to separate social impacts in a company and to allocate them to the considered product per functional unit (Valdivia et al., 2011). Figure 3 illustrates the differences between E-LCA and S-LCA; in this special case it shows that the environmental impact can be allocated to a single process, whereas the social impact occurs on a more aggregated level (three processes, which can be matched to one company).
For companies producing more than one product in the same or different processes (e.g. combined power and heating plant) the impacts have to be broken down to the relevant product and functional unit (UNEP/SETAC, 2009).
3.1.2 Life Cycle Inventory
The second step of the LCA is the Life Cycle Inventory (LCI). In this step the main data collection takes place (i.e. description of the different processes and the elementary flows). Elementary flows consist of two parts: outputs (e.g. emissions to water, air and soil) and inputs (land used, extracted raw materials). All flows are given per functional unit, which has been defined in the goal and scope definition of the LCA (UNEP/SETAC, 2009; Menna et al., 2013).
As defined in the goal and scope definition there might be a variation in S-LCA in the choice of indicators and their units for different products and processes due to location-specific requirements. Before starting the inventory analysis, the relevant indicators and units have to be chosen and defined (UNEP/SETAC, 2009; Swarr, 2009 as cited by Foolmaun & Ramjeeawon, 2013).
In the ‘Guidelines for Social Life Cycle Assessment of Products’ (UNEP/SETAC, 2009) a detailed procedure to follow within the LCI has been developed; this procedure is described below.
The first step before the main data collection is its preparation. After the first collection process, the data which is needed for the impact assessment is characterized. The following step is the validation of data. One of the last and also one of the most important steps is to relate the data to the functional unit and the different unit processes. After that the system boundaries might be refined (UNEP/SETAC, 2009).
The collection of the data is usually most time consuming. Before data can be gathered, information about the organizations as well as information about the location of these organizations and their processes has to be collected (UNEP/SETAC, 2009). The reason for this is that data is not only assigned to facilities or processes, but also to the whole
organizational level, including administrative offices and other production sites. Sometimes data even has to be collected on the global or national level (Valdivia et al., 2011).
The data can be classified into site specific data and generic data. Whereas site specific data gives detailed information about the specific process for a specific location and company, generic data mostly generates information about aggregate levels or coming from similar products (e.g. common values for a standardized process or data for a similar product from a competitor). Generic data and even site-specific data can be gathered by a literature review or research on the web. If generic or site-specific data is not available, new – or primary – data has to be collected. Common ways to gather data is the audit of documentation of the enterprise or authorities and NGOs, surveys and questionnaires, interviews (directed and semi-directed), participative methodologies and involvement of focus groups. Primary data collection is expensive and time consuming (UNEP/SETAC, 2009).
The UNEP/SETAC Life Cycle Initiative (2009) has set up a check-list of indicators for assessing the quality of the data. This list consists of six areas: validity, relevance, measurement methods, completeness, accessibility & documentation and uncertainty.
The data needs to provide relevant information for the intended measurement (the right data measured for the right indicators). The measurement methods that have been used to acquire the data have to be suitable and scientifically accepted. The final data needs to be complete and cover the relevant and necessary fields of the study. Furthermore the data has to be accessible and documented in an understandable and comprehensible way. And finally the data has to be reliable and certain.
3.1.3 Life Cycle Impact Assessment
In the third phase of the LCA, the Life Cycle Impact Assessment (LCIA), the results of the inventory analysis are used, categorized and linked to certain category indicators and impact categories. The whole impact of a product is quantified and related to major categories. The LCIA consists of the selection of category indicators and impact categories. In the classification process the different results of the LCI are connected to impact categories. The characterization process defines the calculation rules of the category indicator results. Grouping, normalization and weighting are optional elements and can be done in the end of the LCIA (UNEP/SETAC, 2009; Menna et al., 2013).
S-LCA follows in general the same structure of LCIA; the selection of impact categories and

14
subcategories is followed by the allocation of the inventory data to those subcategories. Whereas E-LCA allows for connection of different subcategories and calculation of a comprising impact, S-LCA lacks those calculation methods. The formulation and use of impact and stakeholder categories underwent some development in the last years and consensus has not yet been reached how to implement those (Reitinger et al., 2011). Even within the ‘Guidelines for Social Life Cycle Assessment of Products’ (UNEP/SETAC, 2009) no impact assessment methods have been proposed (Valdivia et al., 2011).
In addition to that, S-LCA differs from E-LCA by the type of impacts. Impacts in E-LCA are mostly negative (e.g. emission of hazardous substances). Positive impacts (e.g. charitable contributions or investments in research and development) exist within S-LCA and are important in the social dimension of a life cycle assessment (UNEP/SETAC, 2009; Blom & Solmar, 2009). Instead of combining different indicators and subcategories to calculate a single impact category, S-LCA focuses on the use of additional information. This information (e.g. internationally accepted levels) helps to classify the outcome of the data collection (UNEP/SETAC, 2009).
The structure of the classification process is divided into five different levels. At the highest level the overall goal ‘social sustainability’ is set. Respective social themes of interest (e.g. work conditions, human rights, poverty, cultural heritage, indigenous rights or political conflicts) represent this goal. The goal contains of different impact or stakeholder categories. Data from the life cycle inventory is linked to inventory indicators, which are clustered into different subcategories. These subcategories are then grouped and linked to one of the impact of stakeholder categories (Benoît et al., 2010). An overview of this classification system is given in figure 4.
Fig. 4. Categorization scheme for the life cycle assessment (adapted from UNEP/SETAC, 2009)
The development of these concept and the different parts of it has been done in accordance to international instruments, best practices, initiatives and legal frameworks.
The life cycle inventory data represents socio-economic and social mechanisms and performances. These mechanisms and performances are measured by the inventory indicators. The results are aggregated into subcategories and stakeholder or impact categories. Whereas impact or stakeholder categories group the results of the S-LCA logically and relate it to the interests of the decision makers and stakeholders, subcategories are a more detailed classification that represents impacts within a stakeholder or impact category (UNEP/SETAC, 2009).
Within S-LCA the aggregated results can either be presented under impact or stakeholder categories. Stakeholders are actors that are indirectly or directly affected by the activities of an organization (Dreyer et al., 2006). The UNEP/SETAC Life Cycle Initiative (2009, p.70) defines the impact categories as “logical groupings of S-LCA results, related to social issues of interest to stakeholders and decision makers”. Table 7 gives examples of impact categories.
Table 7. Impact categories for the impact assessment
Those impact categories are closely connected to different stakeholder groups. Some of the impact categories can be assigned to all stakeholder groups, while others are not relevant for all groups (Reitinger et al., 2011). This is one of the reasons for the development and definition of stakeholder categories. A stakeholder category is defined as “a cluster of
S u b c a t e g o r i e s
I n v e n t o r y i n d i c a t o r s
L i f e C y c l e I n v e n t o r y D a t a
I m p a c t / S t a k e h o l d e rc a t e g o r i e s
S o c i a lS u s t a i n a b i l i t y
Impact Category Sources
Equal opportunitiesGrießhammer et al., 2006; Mazjin, 2008 as cited by Blom & Solmar,
2009
Workers rights & working conditions
Grießhammer et al., 2006; Dreyer et al., 2006 as cited by Hauschild et al., 2008; Mazjin, 2008 as cited
by Blom & Solmar, 2009Respect of national and international lawsConsumer protection
Human rightsGrießhammer et al., 2006; Mazjin, 2008 as cited by Blom & Solmar,
2009Discrimination
Child labour
Forced labour
Freedom of association Minimum wage and benefitsTraining and education of employeesDevelopment support towards local societyHealth and safety
Socio-economic effects
Cultural heritage
Participation and influence
Security
Corruption
Dreyer et al., 2006 as cited by Hauschild et al., 2008
Mazjin, 2008 as cited by Blom & Solmar, 2009
Grießhammer et al., 2006

15
stakeholders that are expected to have shared interests due to their similar relationship to the investigated product systems” (UNEP/SETAC, 2009, p.46). As summarized in Benoît et al. (2010) five main stakeholder categories have been identified:
• employees and workers • local community • consumers • society • value chain actors
Within those stakeholder categories subcategories can be identified. Subcategories cluster one or more inventory indicators within a specific field and represent impacts (UNEP/SETAC, 2009). In the ‘Guidelines for Social Life Cycle Assessment of Products’ (UNEP/SETAC, 2009) 31 subcategories have been identified (see Table 8). A description of each subcategory can be found in Annex 6.
Table 8. Stakeholder categories and subcategories (UNEP/SETAC, 2009)
Indicators are a communication and reporting tool for values, thoughts and ideas (UNDSD, 2007). As defined in the UNEP/SETAC Life cycle initiative (2009, p.6) indicators “are specific definitions of the data sought” and “provide the most direct evidence of the condition or result they are measuring”. They serve as a performance tool within the economic, social and environmental spheres (UNDSD, 2007).
The two most important characteristics of indicators are the unit and the type (UNEP/SETAC, 2009). There are basically three different types of indicators: qualitative, semi-quantitative and quantitative indicators (Jørgensen et al., 2009; UNEP/SETAC, 2009; Sandin et al., 2011). In contrast to quantitative indicators, qualitative indicators are not expressed in numbers, but in words (Grießhammer et al., 2006). If an issue cannot be described in physical units (numbers), a scoring system (scale) or a yes/no form can be introduced. These types of indicators are called semi-quantitative indicators and convert issues that are not measurable in numbers (qualitative) into quantifiable values (UNEP/SETAC, 2009; Jørgensen et al., 2009). Most of the indicators used within E-LCA are quantitative indicators. In the field of S-LCA many issues cannot be quantified and require measurements by qualitative and semi-quantitative indicators. Data collected by qualitative indicators is not as simple to link to the functional unit as data coming from quantitative indicators (UNEP/SETAC, 2009).
When working with indicators in LCA Ekener-Petersen & Moberg (2013) have pointed out three potential problem groups that have to be considered. Indicators that are irrelevant for the impact group belong to the first problem group. If an indicator is relevant for the impact group, but does not measure the whole scope of it, it is ranked to the second problem group. The last problem is when an indicator can be connected to an impact group, but the relation and influence of the indicator is indirect. The correlations are unclear and a final statement about the impact – indicator relationship cannot be made. The three problems are visualized in figure 5.
Fig. 5. Three different problems of indicators (adapted from Ekener-Petersen & Moberg, 2013)
Stakholder categories SubcategoriesWorker Freedom of association and
collective bargaining Child labour Fair salary Working hours Forced labour Equal opportunities/discrimination Health and safety Social benefits/social security
Consumer Health and safety Feedback mechanism Consumer privacy Transparency End of life responsibility
Local community Access to material resources Access to immaterial resources Delocalization and migration Cultural heritage Safe and healthy living conditions Respect of indigenous rights Community engagement Local employment Secure living conditions
Society Public commitments to sustainability issues Contribution to economic development Prevention and mitigation of armed conflicts Technology development Corruption Fair competition Promoting social responsibility Supplier relationships Respect of intellectual property rights
Value chain actors (not including consumers)
Indicator
Indicator Impact Indicator
Step 1
Indicator Impact
Impact
Step 2
≠
Problem 2Problem 1
Problem 3

16
If a company is conducting more than one process, a relation of the impact of the relevant process to the total impact of the same type of processes has to be done. A tool to calculate this is the activity variable. The activity variable gives for each unit process of a product system the relative significance in relation to the whole system (UNEP/SETAC, 2009). Within S-LCA working hours are a common used activity variable to measure the importance of a process within a system (Moberg et al., 2009). This activity variable is connected to the functional unit (Dreyer et al., 2006). Another proposed activity variable is the value added to the product in each unit (UNEP/SETAC, 2009).
The activity variable is used for all indicators. For E-LCA this set of indicators is well developed and there is a high consensus on which indicators to use. The development of indicators can be divided into two different approaches: top-down and bottom-up. The top-down approach takes values in society that are broadly recognized and adapt the indicators to those values. Those indicators are connected to internationally accepted guidelines, agreements and conventions (e.g. the UN Global Compact, Global Reporting Initiative and the International Labour Organization). The bottom-up approach focuses on the needs and interests of the industry or other stakeholders and links the development of indicators to the availability of data (Kruse et al., 2009). In contrast to E-LCA there is no defined set of indicators for S-LCA. The ‘Guidelines for Social Life Cycle Assessment of Products’ (2009) and their methodological sheets propose a set of indicators.
3.1.4 Life Cycle Interpretation
The last part of the LCA is the Life Cycle Interpretation. This part gives recommendations and conclusions by comparing the results of the LCA with the goal and scope definition from the first step of the LCA. The processes and phases in the life cycle that have the most impact in the study can be identified and highlighted (UNEP/SETAC, 2009; Menna et al., 2013).
Significant issues are supposed to be identified and the study is meant to be evaluated in terms of consistency and completeness. All involved stakeholders should be named and their engagement classified. At the best, the interpretation part contains recommendations, reports and conclusions (UNEP/SETAC, 2009).
The recommendations and conclusions are one of the major outcomes of the LCA and define its benefits. There exists consensus about the goals and use functions of a LCA. According to Valdivia et al. (2011, p.3) the information function fulfilled “by providing a more comprehensive picture of the positive and negative impacts along the product life
cycle” is one of the advantages of LCA. The goals and benefits within E-LCA and S-LCA do not differ significantly. One difference is the development of E-LCA; it started earlier and results and improvements are more advanced. As Klöpffer (2003, 2008) as cited by Swarr (2009, p.285) name it, “the goal of SLCA [...] is to provide reliable results that can inform decisions (and facilitate learning) at multiple levels of society”. These two definitions describe the outcome of a LCA satisfactorily. As concluded by other authors the most important functions of S-LCA are:
• to support decisions within a business context (Musters et al., 1998 as cited by Swarr, 2009; Dreyer et al., 2006; Hunkeler, 2006; UNEP/SETAC, 2009; Moberg et al., 2009; Jørgensen, 2013)
• to provide information and results about the impacts of a product and/or life cycle (Jørgensen, 2013; Ekener-Petersen & Finnveden, 2013)
• structure complex process by a strategic analysis (Reitinger et al., 2011)
• compare products/life cycles/processes (Wenzel et al., 1997 as cited by Jørgensen, 2009; UNEP/SETAC, 2009 as cited by Jørgensen, 2013)
• raise the credibility of an organization (Valdivia et al., 2011)
• identifying hotspots/optimization potentials (Wenzel et al., 1997 as cited by Jørgensen, 2009; UNEP/SETAC, 2009 as cited by Jørgensen, 2013; Reitinger et al., 2011; Valdivia et al., 2011)
All these functions aim to improve the social performance of the whole life cycle. The information and tools are mainly developed and addressed to decision and policy makers. Presentation of detailed information about the whole life cycle should encourage improvements of the environmental, economic and social conditions (Moberg et al., 2009). As Dreyer et al. (2006, p.90) name it “harmful impacts on peoples' lives from the activities in the company's product chains” should be minimised. The consideration of all stakeholders within the life cycle can lead to a more developed and detailed understanding of this system (Musters et al., 1998 as cited by Swarr, 2009; UNEP/SETAC, 2009).
The identification of hotspots is one of the major tasks of a LCA. Within S-LCA it is important to define social hotspots. The UNEP/SETAC Life Cycle Initiative (2009, p.60) defines them as “unit processes located in a region where a situation occurs that may be considered a problem, a risk or an opportunity, in relation to a social theme of interest”. Social themes of interest are further defined as a threat for social well-being and contributions to those (UNEP/SETAC, 2009).

17
To conclude the process of life cycle interpretation I would like to mention the classification system of Macombe et al. (2011) as cited by Ekener-Petersen & Moberg (2013). The authors distinguish three different uses of a LCA: management S-LCA, consequential LCA and educative S-LCA. The first use describes the analytic and strategic function of LCA to gather, use and interpret data. The second use goes in line with the decision support function. The last use named by the authors point out the comparative and communicative function of the LCA where results are reported to external stakeholders.
4 Methods
The main focus of this thesis is the compilation of an indicator package for the assessment of social aspects within certain processes. The indicators are embedded in the S-LCA system, which has been described before. The Delphi method has been used for this development. It has been developed in the 1950s at the Rand Corporation mainly by Dalkey and Helmer (1963) as cited by Hsu & Sandford (2007). Studies provided evidence for the advantages of group opinions over those from individuals (Kaplan et al., 1949 as cited by Landeta, 2005). The use of expert opinions within inexact sciences has been justified (Helmer & Rescher, 1959 as cited by Landeta, 2005) and its use has increased rapidly from the beginning of the 1960s (Landeta, 2005).
4.1 The Delphi process
According to Linstone & Turoff (1975, p.3) “Delphi may be characterized as a method for structuring a group communication process so that the process is effective in allowing a group of individuals, as a whole, to deal with a complex problem”. Especially the participation of experts to achieve convergence on topics concerning and requiring real-world knowledge can be seen as a special characteristic of this method (Hsu & Sandford, 2007). Delbecq et al. (1975) as cited by Hsu & Sandford (2007, p.1) have pointed out several objectives for which the Delphi method can function as a useful method:
• “To determine or develop a range of possible program alternatives”
• “To explore or expose underlying assumptions or information leading to different judgments”
• “To seek out information which may generate a consensus on the part of the respondent group”
• “To correlate informed judgments on a topic spanning a wide range of disciplines”
The development of a set of indicators within an unknown field requires real world knowledge. The indicators had to be adapted to the needs and requirements of Vattenfall and the International EPD® system. The four objectives named have to be fulfilled and achieved in order to be able to develop a relevant set of indicators. The Delphi method contains these objectives and has therefore been chosen for this study. Landeta (2005) names four main characteristics of the method:
• the method is a iterative or also repetitive process and includes several consultations of the experts
• the method is anonymous and answers of the experts are kept anonymous to the other members of the group to assure that no information is influenced due to personal preferences or different sets of personalities of the experts
• the method is equipped with a controlled feedback mechanism, which means that the group coordinator decides on which information to share between the different members of the expert group
• the method makes statistical analysis available, which ensures that all opinions are considered in the final outcome
The method is usually carried out in at least three rounds (Cyphert & Gant, 1971; Brooks, 1979; Ludwig, 1994,1997; Custer et al., 1999 as cited by Hsu & Sandford, 2007). Hsu & Sandford (2007) propose four iterations. The first round usually starts with an open-ended questionnaire to receive data for the questionnaire used in the second round. Kerlinger (1973) as cited by Hsu & Sandford (2007) mentions that the use of a structured questionnaire based on an extensive literature review is also possible.
The information gained in the first round is summarized by the investigator and handed in again to the experts for an evaluation. This evaluation can be done by a rank order and might have the possible outcome of items that the experts can agree on or not (Ludwig, 1994 as cited by Hsu & Sandford, 2007). A first form of consensus might be achieved in this round (Jacobs, 1996 as cited by Hsu & Sandford, 2007).
The third round provides the expert group with the results and outcomes of the second round and gives them the opportunity to revise or specify the reasons for their judgements (Pfeiffer, 1968 as cited by Hsu & Sandford, 2007).
The fourth round is often the last round of the process and gives the experts another chance to review the results from the last round and to make changes in their conclusions. Depending on how long

18
it takes to get consensus within the group of experts this process can either be reduced to three or extended to five rounds (Delbecq et al., 1975; Ludwig, 1994 as cited by Hsu & Sandford, 2007).
4.2 Application of the Delphi process
The following experts have been chosen for this study: Mikael Ekhagen (International EPD® system & Vattenfall), Miranda Jensen (GRI & CSR), Monica Bowen-Schrire (Senior Advisor, Strategy & Sustainability; special focus: Human Rights), Magnus Enell (Senior Advisor, Strategy & Sustainability; special focus: GRI), Agneta Höjdestrand (Environment, Health and Safety), Claes Lundström (Audit & Environmental Quality Management), Sven-Olof Ryding (EPD & Miljöstyrningsrådet [MSR]), Joakim Thornéus (EPD & MSR), Lars Pettersson (Environmental Risk Advisor). These experts have been chosen because of their background and their experience within the relevant fields for this study.
In this study the first round of the Delphi process has been carried out by an extensive review of the literature in the field of social sustainability to get an overview of all published indicators. This literature research was mainly focusing on peer-reviewed articles and guidelines from non-governmental organizations. One of the most important sources was the methodological sheets, published in UNEP/SETAC’s (2009) Guidelines of
Social Life Cycle Assessment of Products. These guidelines and the proposed S-LCA, have been used as the framework to categorize the indicators. S-LCA is the most popular methodology when it comes to the assessment of social impacts in a corporate background (Grießhammer et al., 2006; Ekener-Petersen & Moberg, 2013). Every indicator has been in need of a specific unit. Information for the definition of the units has been found in the reviewed literature. The outcome of this has been a list of 390 indicators, which has been used in the following rounds of the Delphi process. The indicators have been categorized according to the proposed stakeholder and subcategories in UNEP/SETAC’s (2009) Guidelines of Social Life Cycle Assessment of Products.
In the second round the first set of indicators has been reviewed by Mikael, Miranda and Monica. The reviewing has been done in form of personal interviews and discussions with the experts. The aim of the reviewing in this and the following rounds has been to narrow down the amount of indicators in the list, but to keep the indicators that measure the most important social issues. Selection criteria have been the applicability, relevance and feasibility of the indicators in practice, as well as conformity to the International EPD® system. At the end of the second round the list has been narrowed down and consensus could be reached to keep 80 of the 390 indicators. Figure 6 shows the documentation of the selection process in a spreadsheet.
These indicators have been sent out again to the same experts in the third round of reviewing. Magnus and Agneta joined the reviewing proves for
Fig. 6. Spreadsheet for the election process of the set of indicators

19
this round. The aim of this round has been to narrow down the list to approximately 30 indicators. At the end of this round the experts have agreed to keep 29 indicators in the list. This list has then converted by the author of this thesis into a ‘socioprofile’ (see 5.2.1).
The fourth round of reviewing focused on the socioprofile. All the experts involved in the last round have reviewed this socioprofile. In addition to that, Claes, Sven-Olof and Joakim have been reviewing the profile as well. The final consensus of all experts has been a socioprofile including 30 indicators and additional information.
The fifth and last round of the Delphi process involved a survey (see Annex 7a) to measure the importance of the elected indicators. A scoring system from 1 (not at all important) to 5 (extremely important) has been chosen for the survey. The survey was published and filled out with the help of Google Docs. The arithmetical average of the rankings has been calculated for all indicators. The conducted expert survey has been answered by five of the experts.
4.3 Delimitations
The Delphi method and the theory of S-LCA have been chosen for this study. In the following limitations of the conducted method and the theory will be described.
The Delphi method has two main weaknesses (Gordon & Helmer, 1964; Weaver, 1971; Sackman, 1974; Linstone & Turoff, 1975 as cited by Landeta, 2005): the choice of experts and the use of consensus to achieve an outcome in the study. The author of this work has chosen the experts with the aim to cover all relevant fields of the study. The experts have been chosen in the particular field of interest for this study (Vattenfall, EPD, social sustainability). A different choice of experts might lead to another outcome for this study. The use of consensus as the main technique of the study can also be seen as a weakness of the method. Since not all experts have been consulted in every reviewing round, the outcome might be biased. The first reviewing round has been time consuming; due to that only three of the experts have been consulted and involved in this reviewing round.
The literature review has been used as a base for all the following reviewing rounds. The reliability of this literature review can be seen as a weakness. Not all requirements of the method could be fulfilled. Instead of questionnaires personal interviews have been conducted. Some consultations have been done with more than one expert at the same time and space, which implies that these reviewing rounds have not been anonymous. The amount of experts (9)
and especially the amount of answers for the final survey (5) can be regarded as too low. The outcome of the survey can therefore not be seen as representative.
The S-LCA framework proposes the categorization of subcategories into impact categories and stakeholder categories. The indicators have not been allocated to impact categories. One reason for that is the problem of overlaps between the impact categories and subcategories (Grießhammer et al., 2006). The stakeholder categories present a suitable system to classify all relevant subcategories and indicators without the risk of overlapping categories. Furthermore, stakeholder categories seemed to be more applicable, since the system boundaries and processes of the EPD could be converted more easily to stakeholder than impact categories.
The study focuses on the International EPD® system and on the life cycles and needs of Vattenfall. Due to that, the study will not be generalizable and usable for other products categories. For products within the energy sector the results should be comparable.
5 Results
The presentation of the results of this study is divided into two parts. In the first part the indicators will be listed and further explained. The indicators are categorized and sorted according to the classification scheme of the ‘Guidelines of Social Life Cycle Assessment of Products’ (UNEP/SETAC, 2009). The relevant stakeholder categories for this work are: local community, society, value chain actors and workers. The second part of the description of the results refers to the practical application of the indicators. This part consists of the socioprofile, which is supposed to be used within the International EPD® system and instruction for the use of the socioprofile and its consisting indicators. The instruction is based upon a practical example, the generation of electricity in a nuclear power plant.
5.1 Indicators
As described in the methodology part, the indicators need to fulfil certain requirements. These requirements are:
• applicability for all process within the life cycle
• indicators must be able to allocate to the functional unit, which has been set in accordance to the PCR (1 kWh net)

20
• data for the indicators must be measurable and should reflect one reference year or a representative year
The 30 indicators have been adapted to the needs and requirements described before. Sources for all indicators can be found in the following tables. Generally, two types of indicators can be distinguished: discrete and continuous indicators. The discrete indicators measure countable amounts, e.g. amounts of discrimination. Continuous indicators do not have to be countable in whole numbers. Indicators that measure a ratio or a percentage are continuous indicators, e.g. percentage of turnover spent on employee training.
5.1.1 Local Community
Seven indicators have been proposed for the stakeholder category ‘local community’. The indicators can be allocated to the subcategories ‘delocalization and migration’, ‘local employment’, ‘respect of indigenous rights’ and ‘secure living conditions’. Table 9 gives an overview of all the indicators of this stakeholder category.
The indicator ‘resettling of individuals’ is measured by the number of individuals that resettle due to organizational activities. The indicator reflects the requirements of SO9 in the GRI. The subcategory allocated for this indicator is ‘delocalization and migration’.
Within the subcategory ‘local employment’ two indicators have been developed. The first indicator is ‘local recruitment’ and measures according to the GRI EC7 the share of local recruited employee hours divided by employee category. The second indicator ‘spending on locally-based suppliers’ follows the requirements of GRI EC6 and
gives the share of local products that a company uses for its production. The share is calculated by the amount spend on locally based suppliers in relation to the whole amount of money spend on suppliers. When it comes to the definition of local employment and local suppliers the following definition has been used: “local [...] area means the geographic area that usually constitutes one area for employment purposes as determined by the agency. It includes any population centre (or two or more neighbouring ones) and the surrounding localities in which people live and can reasonably be expected to travel back and forth daily to their usual employment” (US Legal, 2013).
The subcategory ‘respect of indigenous rights’ consists of two indicators, which both can be categorized as HR9 of the GRI. When talking about indigenous people, all people that have their origin in that specific area are included as well. The indicators are named ‘human rights issues faced by (indigenous) people’ and ‘(indigenous) land right conflicts & land claims’. Both indicators are measured by the amount of issues brought to the court. Human right issues can be reported at four different levels: local, national, regional and global. Land right conflicts and land claims can be distinguished into customary and legal rights.
The indicators of the subcategory ‘secure living conditions’ are similar to the ones named before. Both indicators can be classified to the GRI SO9. The reason why the indicators have been split up into legal complaints with regard to safety or security concerns is that those concerns may differ significantly in practical applications. As used for the indicators in the subcategory before, the amount of legal complaints brought to the court measure the outcome of this indicator.
Table 9. Indicators of the stakeholder category ‘Local Community’
Indicator Subcategory GRI Unit Source
Resettling of individuals Delocalization and Migration SO9
Number of individuals that resettle due to organizational activities UNEP/SETAC, 2010c
Local recruitment Local Employment
EC7 Share of local recruited employee hours (by employee category)
ILO, 2001, 2002; Brent & Labuschagne, 2006; Dreyer et al., 2006; UNEP/SETAC, 2010c; Lagarde & Macombe, 2013
Spending on locally-based suppliers
Local Employment
EC6 Share of local products (by value/amount) Brent & Labuschagne, 2006; Kruse et al., 2009; UNEP/SETAC, 2010c
Human rights issues faced by (indigenous) people
Respect of Indigenous Rights
HR9Amount of human rights issues faced by (indigenous) peoples brought to the court (by local, national, regional, global level)
UNEP/SETAC, 2010c
(Indigenous) land right conflicts & land claims
Respect of Indigenous Rights
HR9Amount of (indigenous) land rights conflicts / land claims brought to the court (by customary rights, legal rights)
UNEP/SETAC, 2010c
Legal complaints with regard to safety concerns
Secure Living Conditions SO9
Amount of legal complaints per year against the organization with regard to safety concerns brought to the court
UNEP/SETAC, 2010c
Legal complaints with regard to security concerns
Secure Living Conditions
SO9Amount of legal complaints per year against the organization with regard to security concerns brought to the court
UNEP/SETAC, 2010c

21
5.1.2 Society
Three of the proposed subcategories have been covered with indicators in this study: ‘contribution to economic development’, ‘corruption’ and ‘technology development’. In total four indicators reflect the social performance for the stakeholder category ‘society’. All these indicators are listed in table 10.
The indicators for the subcategory ‘contribution to economic development’ are ‘financial return to the society’ and ‘community spending and charitable contributions’. The first indicator can be allocated to GRI EC1 and is measured by the total amount of tax a company paid per year. The second indicator is according to the GRI EC8. The unit of the indicator is the percentage of the turnover that is spent on charitable contributions.
In the discussions and reviewing rounds with the experts corruption has been of particular importance. The selected indicator is ‘education within anti-corruption’ and is convergent with the GRI SO3. It is measured by the amount of people who received an education within the field of anti-corruption.
The last subcategory betrayed in the stakeholder category ‘society’ is termed ‘technology development’. The indicator in this subcategory is named ‘research and development efforts’ and its unit is defined as the percentage of turnover spent on research and development. The indicator reflects the GRI EC9.
5.1.3 Value Chain Actors
In the stakeholder category ‘value chain actors’ two indicators have been selected, which each represent one subcategory. The subcategories ‘promoting social responsibility’ and ‘supplier relationships’ are relevant for this work. More information about these indicators is given in table 11.
The indicator in the subcategory ‘promoting social responsibility’ is named ‘audit of suppliers with regard to social responsibility and/or code of conducts’. The indicator is measured by the percentage of suppliers that have been audited in form of a site visit and it is conforming to several standards of GRI (G4 8, G4 12, HR2 and HR10).
The indicator ‘payments on time to suppliers’ follows GRI G4 3 and can be allocated to the subcategory ‘supplier relationships’. The product of the value and the amount of days of delayed payments has been defined as the unit to measure the performance for this indicator.
5.1.4 Workers
The stakeholder category worker is the one with the most subcategories and the most indicators. 17 indicators have been developed in the following eight subcategories: ‘child labour’, ‘equal opportunities/discrimination’, ‘fair salary’, ‘forced labour’, ‘health and safety’, ‘social benefit/social security’, ‘working hours’ and ‘freedom of association and collective bargaining’. Table 12 illustrates those indicators.
As described before, the International Labour Organisation is one of the most important organizations for worker rights. The high acceptance
Table 11. Indicators of the stakeholder category ‘Value Chain Actors’ Indicator Subcategory GRI Unit SourceAudit of suppliers with regard to social responsibility and/or code of conducts
Promoting Social Responsibility
G4 8/12 & HR2/10
Percentage of suppliers that have been audited
UNEP/SETAC, 2010e
Payments on time to suppliers Supplier Relationships G4 3
Product of the value and the amount of days of delayed payments UNEP/SETAC, 2010e
Indicator Subcategory GRI Unit Source
Financial return to societyContribution to Economic Development
EC1 Amount of tax paid per year Lundström, 2013
Community spending and charitable contributions
Contribution to Economic Development
EC8 Percentage of turnover spent on charitable contributions
Veleva & Ellenbecker, 2001; Krajnc & Glavic, 2003; Spillemaeckers et al., 2004; Blackburn, 2007; Hutchins & Sutherland, 2008; Sandin et al., 2011
Education within anti-corruption Corruption SO3 Amount of people educated within the field of
anti-corruptionLundström, 2013
Research and development efforts
Technology Development EC9
Percentage of turnover spent on research and development UNEP/SETAC, 2010d
Table 10. Indicators of the stakeholder category ‘Society’

22
of those conventions and recommendations is the reason why some of them have also been used for the development of indicators. The conventions C138 and C182 have been the foundation for the indicator ‘children performing work unauthorized by the ILO conventions C138 and C182’. It belongs to the subcategory ‘child labour’ and it is in accordance with the GRI HR6 and the core conventions C138 and C182. The ILO conventions differentiate between light, normal and hazardous work. Under normal circumstances light work might not be carried out by children under the age of 13. Normal work is not allowed for children under the age of 15 and hazardous work requires that the persons doing the work are at least 18 years old (Grießhammer et al., 2006). The amounts of child labour minutes that do not comply with one of the described categories are supposed to be reported.
The subcategory ‘equal opportunities & discrimination’ consists of four different indicators: ‘differences in working hours between man and woman’, ‘incidents of discrimination’, ‘wage differences between man and woman’ and ‘wage differences between migrants and non-migrants’. The first indicator can be classified according to GRI LA1 and is supposed to be measured by the ratio of working hours on different employee levels (top management, middle management, lower management and workers).
The quotient of the ratio is calculated as described below:
𝑟𝑎𝑡𝑖𝑜 =𝑤𝑜𝑟𝑘𝑖𝑛𝑔 ℎ𝑜𝑢𝑟𝑠 𝑚𝑒𝑛
𝑤𝑜𝑟𝑘𝑖𝑛𝑔 ℎ𝑜𝑢𝑟𝑠 𝑤𝑜𝑚𝑒𝑛
The second indicator quantifies the amount of incidents of discrimination that have been brought to the court. This indicator follows GRI HR4 as well as the core convention C111 of the ILO. The last two indicators in this subcategory measure the ratio of average salary between different groups according to their employee category (top management, middle management, lower management, workers). The quotient of the ratio is calculated as described below:
𝑟𝑎𝑡𝑖𝑜 =𝑎𝑣𝑒𝑟𝑎𝑔𝑒 𝑠𝑎𝑙𝑎𝑟𝑦 𝑚𝑒𝑛/𝑛𝑜𝑛 −𝑚𝑖𝑔𝑟𝑎𝑛𝑡𝑠𝑎𝑣𝑒𝑟𝑎𝑔𝑒 𝑠𝑎𝑙𝑎𝑟𝑦 𝑤𝑜𝑚𝑒𝑛/𝑚𝑖𝑔𝑟𝑎𝑛𝑡𝑠
Whereas the first indicator can be allocated to GRI LA14, GRI does not mention wage differences between migrants and non-migrants. The indicator could therefore not be classified to the GRI. Both indicators fulfil the requirements of the core convention C100 of the ILO.
The indicators of the subcategory ‘fair salary’ are ‘fair living wage’ and ‘payment ratio’. ‘Fair living wage’ is in line with the GPI EC5 and is measured by the amount of workers below minimum wage and or living wage. Whereas the minimum wage is set for most countries, the definition of a fair
living wage is not fully developed and there is no consensus about what can be defined as such a wage. Anker (2011) calculates a living wage for a worker by the costs “of basic quality life per person”, which is the sum of costs for:
• a “nutritious low-cost diet” • “basic acceptable housing” • “clothing and footwear” • “other costs for a decent life” • “margin for discretionary expenditures,
savings, or funds for sustainability for unseen events and emergencies”
A four person household is taken as a base for the calculation and it is supposed that one to two members of the household are full-time equivalent workers (Anker, 2011). The indicator ‘payment ratio’ takes the average labour cost, including benefits and taxes, and compares it to compensation package of the highest paid employee in the company. This indicator is in line with GRI 4.5. In the subcategory ‘forced labour’ the ILO conventions are used again. The indicator ‘workers performing work unauthorized by the ILO conventions C029 and C105’ measures the amount of forced labour minutes. The indicator is in line with the GRI HR7 and the core conventions C029 and C105.
The subcategory health and safety consists of two indicators. The first indicator ‘injuries/fatal accidents/diseases’ follows GRI LA7 and measures the LTIF. The measurement is divided into accidents, sick leave and fatalities. ‘Personal protective equipment’ is the second indicator measuring the amount of people, with a focus on the mining industry, equipped with protective equipment. This indicator can be allocated to the GRI LA8.
Five indicators can be categorized under the subcategory ‘social benefit/social security’. Three of them can be classified to the GRI LA3: ‘annually paid vacation’, ‘healthcare & medical insurance expenditures’ and ‘social security expenditures’. The first of those three indicators counts the amount of average paid vacation days in the workforce. The other two indicators measure the percentage of either healthcare & medical and workplace injury insurance or pension and maternity expenses paid by the company per employee to the market capitalization per employee. ‘Employee training’ can be classified as GRI LA8 and 10 and measures the percentage of the company’s turnover spent on employee training. The indicator ‘employment stability’ cannot be allocated to the GRI. Its unit is defined as the percentage of workers on permanent employment contracts.
The indicator ‘excessive work’ is listed under the subcategory ‘working hours’ and linked to the first ILO convention C001. This convention regulates the amount of working hours in a week to 48 hours and sets a limit on twelve overtime hours per week

23
(Kruse et al., 2009; Dreyer et al., 2010). The amount of hours exceeding this framework should be registered and documented by this indicator, which is
classified as GRI HR7. The last indicator is named ‘possibility to
associate and bargain’ and is allocated to the
Indicator Subcategory GRI Unit SourceChildren performing work unauthorized by the ILO conventions C138 and C182
Child labor HR6Amount child labour minutes (by age category <15, <18 and light, normal and hazardous work)
UNEP/SETAC, 2010f
Differences in working hours between man and woman
Equal Opportunities/Discrimination
LA1Ratio of working hours (by top management, middle management, lower management, workers)
UNDSD, 2007; Kruse et al., 2009; UNEP/SETAC, 2010f
Incidents of discrimination Equal Opportunities/Discrimination
HR4 Amount of incidents brought to the court UNEP/SETAC, 2010f
Wage differences between man and woman
Equal Opportunities/Discrimination
LA14Ratio of average salary (by top management, middle management, lower management, workers)
Kruse et al., 2009; UNEP/SETAC, 2010f; Global Reporting Initiative, 2011; Sandin et al., 2011
Wage differences between migrants and non-migrants
Equal Opportunities/Discrimination
Ratio of average salary (by top management, middle management, lower management, workers)
Kruse et al., 2009
Fair living wage Fair Salary EC5Amount of workers below minimum wage and/or living wage
Norris, 2006; Blom & Solmar, 2009; Evans et al., 2009; UNEP/SETAC, 2010f
Payment ratio Fair Salary 4.5Ratio of average labour cost (+ benefits and taxes) to the total compensation package for the company’s highest paid employee
Grießhammer et al., 2006; Hutchins & Sutherland, 2008; Sandin et al., 2011
Workers performing work unauthorized by the ILO conventions C029 and C105
Forced Labor HR7 Amount of forced labour minutes UNEP/SETAC, 2010f
Injuries/fatal accidents/diseases
Health and safety
LA7 Lost Time Incident Frequency (by accidents, sick leave, fatalities)
Veleva & Ellenbecker, 2001; Krajnc & Glavic, 2003; Brent & Labuschagne, 2006; Norris, 2006; Weidema, 2006b; Blackburn, 2007; Hutchins & Sutherland, 2008; Evans et al., 2009; Kruse et al., 2009; UNEP/SETAC, 2010f; Global Reporting Initiative, 2011; Sandin et al., 2011
Personal Protective Equipment Health and Safety
LA8 Amount of people (especially in mines) equipped with protective equipment
Lundström, 2013
Annually paid vacationSocial Benefit/Social Security
LA3Average length of annually paid vacation in days per FU
Grießhammer et al., 2006; Sandin et al., 2011
Employee trainingSocial Benefit/Social Security
LA8/10
Average number of hours employee training per FU (all kind of training)
Veleva & Ellenbecker, 2001; Krajnc & Glavic, 2003; Blackburn, 2007; Global Reporting Initiative, 2011; Sandin et al., 2011
Employment stabilitySocial Benefit/Social Security
-Amount of workers on permanent employment contracts Brent & Labuschagne, 2006
Healthcare & medical insurance expenditures
Social Benefit/Social Security
LA3
Ratio of company paid healthcare & medical and workplace injury insurance expences per employee to the market capitalization per employee [the higher the indicator, the higher the social sustainability] excluding direct sickness costs; mean value for the last three years
Hutchins & Sutherland, 2008
Social security expendituresSocial Benefit/Social Security
LA3
Ratio of company paid pension/maternity expences per employee by country and branches to the market capitalization per employee [the higher the indicator, the higher the social sustainability] / Number of workers without adequate pension scheme and/or social security access; mean value for the last three years
Weidema, 2006a; Hutchins & Sutherland, 2008; UNEP/SETAC, 2010f; Global Reporting Initiative, 2011; Sandin et al., 2011; Ekener-Petersen & Finnveden, 2013
Excessive work Working hours HR7 Number of work-hours in excess of 48/person/week per FU
Weidema, 2006a; UNEP/SETAC, 2010f
Possibility to associate and bargain
Freedom of Association and Collective Bargaining
LA4 Percentage of employees covered by collective bargaining agreements
Vattenfall AB, 2013b
Table 12. Indicators of the stakeholder category ‘Workers’

24
subcategory ‘freedom of association and collective bargaining’. This indicator can be classified as GRI LA4 and it measures the percentage of employees in a company that are covered by collective bargaining agreements. This indicator matches the core conventions C098 and C087 of the ILO.
5.2 Application of indicators
The application of indicators is supposed to be in line with the International EPD® system. The tools developed in the following part are therefore adjusted to this system. In the first part the socioprofile will be presented. This is the presentation of the social indicators and the additional information, which is in accordance to the rules of the International EPD® system. In the second part the results of the conducted survey about the relevance and importance of the indicators will be presented. In the last part instructions will be given for the application of the socioprofile. To clarify these instructions a case
study of the generation of electricity in a nuclear power plant has been used. These instructions focus mainly on the calculation and allocation of the gathered data to the functional unit.
5.2.1 Socioprofile
A common tool in the International EPD® system is called ‘ecoprofile’. This profile has the advantage that it combines all the important data in one table and separates the information for the different processes in the life cycle (upstream, core, downstream). The social indicators are supposed to be inserted into the same system. A ‘socioprofile’ has been developed in accordance to the structure of the corresponding ecoprofile (see Annex 8). It contains the suggested indicators for the use within Vattenfall’s electricity generation. More areas of interest have been important in the study. These aspects have been investigated and discussed in the development phase of the indicators, but could not be
Stakeholder Category Subcategory Information GRI SourceConsumer Transparency Certifications/labels achieved for the product/site PR3 UNEP/SETAC, 2010bLocal Community Access to
Material Resources
Improvements of the infrastructure in the fields of education, health, energy & water services, improved sanitation facilities, public transport services (e.g. school buildings [education]; doctors employed [health]; bus lines set up [public transport services])
EC8 Brent & Labuschagne, 2006; UNDSD, 2007; Blom & Solmar, 2009
Cultural Heritage
Organizational programs to include cultural heritage in urgent need of safeguarding
SO1 UNEP/SETAC, 2010c
Respect of Indigenous Rights
Pro-active initiatives to strengthen the rights of (indigenous) people (e.g. integration efforts, meetings)
SO1 UNEP/SETAC, 2010c
Community Engagement
Long-term plans and programs for securing of the wellfare of communities located close to mines
SO1 UNEP/SETAC, 2010c
Society Corruption Organizational anti-corruption programs SO3 UNEP/SETAC, 2010dCorruption Ranking of countries that are involved in the product
life cycle on the Transparency International Corruption Perceptions Index
SO2 Bowen-Schrire, 2013
Public Commitment to Sustainability Issues
Implementation and/or signing of principles or codes of conducts (e.g. Sullivan Principles, Caux Round Table; Global Compact Principles; ISO Standards 18000, 14001, 26000; SA 8000; EITI; Voluntary Principles on Security and Human Rights)
4.8/ 4.12
UNEP/SETAC, 2010d
Value Chain Actors Promoting Social Responsibility
Memberships in initiatives that promote social responsibility along the supply chain
4.13 UNEP/SETAC, 2010e
Promoting Social Responsibility
Existence of anonymous whistleblowing processes DI57 Lundström, 2013
Workers Health and Safety
Existence of safety officers and/or work environment committees
LA6 Lundström, 2013
Social Benefit/Social Security
Information of countries that are involved in the product life cycle about annually paid vacation days regulated by law
LA3 Bowen-Schrire, 2013
Freedom of Association and Collective Bargaining
Share of employee/union representatives in the board of directors with/without the right to vote
4.7 Enell, 2013
Table 13. Additional information for the socioprofile

25
included into the socioprofile because they were either not quantifiable, able to obtain data or could not be related to the functional unit. The requirement has been that the social information is relevant for the EPD and must be clearly describable. This information is called additional information and can be quantitative, qualitative or semi-quantitative (see table 13).
5.2.2 Evaluation of the socioprofile
In practice the use and application of 30 indicators might still be challenging for some organizations. Therefore an expert survey has been conducted. The detailed results of the survey can be found in Annex 7b.
The indicator ‘Children performing work unauthorized by the ILO conventions C138 and C182’ turned out to be considered as the most important one in this survey. ‘Community spending and charitable contributions’ has been rated to be least important. In total 20 of the 30 indicators have gained a higher rating (arithmetical average) than 3, which has been defined, according to the ranking scale, as more important than unimportant. Tables 14 and 15 present the arithmetical averages of the indicators.
Table 14. Arithmetical average of the results of the survey for the indicators 1 – 15
10 of 30 indicators achieved an arithmetical average higher than four. These indicators have been classified as core indicators. The remaining 20 indicators seem to be less important and have been assigned to the additional indicators. Seven of the eight indicators that represent the core conventions of the ILO (see 2.2) have been evaluated as important in the survey. This underlines the importance of the core conventions.
Table 15. Arithmetical average of the results of the survey for the indicators 16 – 30
5.2.3 Case Study: Nuclear power plant
The following part focuses on the practical application of the selected indicators. Vattenfall’s nuclear power plant in Sweden, Forsmark has been chosen as the case study for this thesis. The Uranium supply has had the most significant impact in the previous conducted EPD for the nuclear power plant in 2010 (Vattenfall AB, 2010a). The application of the social sustainability indicators is focused on the upstream parts of the life cycle that are related to the Uranium supply.
Table 16. Suppliers of Uranium (Vattenfall, 2010a)
The PCR of CPC171 lays the foundation and set rules for the application of the life cycle within the International EPD® system. The functional unit is defined as “1kWh net electricity generated and thereafter distributed to a customer connected to 70/130 kV” (Vattenfall AB, 2010a).
The supply chain for the production of Uranium as a fuel is divided into four main steps: Mining & milling, refining & conversion, enrichment and fuel fabrication. More information about the nuclear power plant including a detailed description
Indicator Arithm. av. Classification
Resettling of individuals 3,75 AdditionalLocal recruitment 3,40 AdditionalLocal suppliers 3,20 AdditionalHuman rights issues 4,40 CoreLand right conflicts 4,40 CoreLegal complaints (safety) 3,60 AdditionalLegal complaints (security) 3,40 AdditionalFinancial return 3,00 AdditionalCommunity spending 2,60 AdditionalAnti-Corruption 4,00 AdditionalR&D efforts 3,00 AdditionalAudit of suppliers 4,25 CorePayments on time 2,80 AdditionalChild labour 5,00 CoreDifferences working hours m/w 3,80 Additional
Indicator Arithm. av. Classification
Discrimination 4,40 CoreWage differences m/w 4,20 CoreWage differences migrants 4,00 AdditionalFair living wage 4,80 CorePayment ratio 3,00 AdditionalForced labour 4,60 CoreInjuries/fatal accidents 4,60 CoreProtective Equipment 4,20 CorePaid Vacation 3,00 AdditionalEmployee training 3,00 AdditionalEmployment stability 3,60 AdditionalHealthcare expenditures 2,80 AdditionalSocial security expenditues 2,80 AdditionalExcessive work 3,60 AdditionalAssociate and bargain 3,60 Additional
p y pProcess Company Location Operation
Mining & milling Rössing Uranium Ltd Namibia Open pit mine
BHP Billiton Australia Underground mineEnergy Resources of Australia (ERA)
Australia Open pit mine
Refining & Conversion Cameco Canada Refining and
Conversion
Enrichment USEC Inc. Kentucky, USA
Enrichment, diffusion
Urencon Ltd. (UCL)
Great Britain Enrichment, centrifugation
TENEX, UEIP, ECP
Russia Enrichment, centrifugation
Fuel Fabrication Areva ANP Germany Fuel fabricationWestinghouse Sweden Fuel fabrication
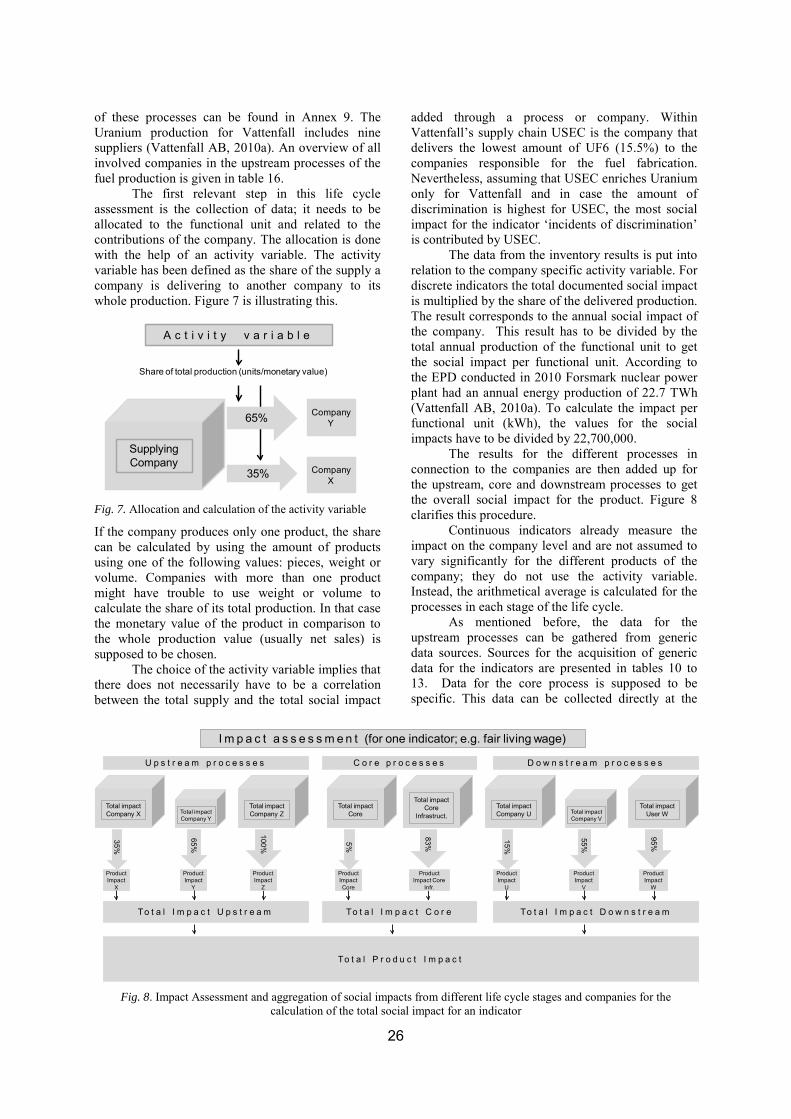
26
of these processes can be found in Annex 9. The Uranium production for Vattenfall includes nine suppliers (Vattenfall AB, 2010a). An overview of all involved companies in the upstream processes of the fuel production is given in table 16.
The first relevant step in this life cycle assessment is the collection of data; it needs to be allocated to the functional unit and related to the contributions of the company. The allocation is done with the help of an activity variable. The activity variable has been defined as the share of the supply a company is delivering to another company to its whole production. Figure 7 is illustrating this.
Fig. 7. Allocation and calculation of the activity variable
If the company produces only one product, the share can be calculated by using the amount of products using one of the following values: pieces, weight or volume. Companies with more than one product might have trouble to use weight or volume to calculate the share of its total production. In that case the monetary value of the product in comparison to the whole production value (usually net sales) is supposed to be chosen.
The choice of the activity variable implies that there does not necessarily have to be a correlation between the total supply and the total social impact
added through a process or company. Within Vattenfall’s supply chain USEC is the company that delivers the lowest amount of UF6 (15.5%) to the companies responsible for the fuel fabrication. Nevertheless, assuming that USEC enriches Uranium only for Vattenfall and in case the amount of discrimination is highest for USEC, the most social impact for the indicator ‘incidents of discrimination’ is contributed by USEC.
The data from the inventory results is put into relation to the company specific activity variable. For discrete indicators the total documented social impact is multiplied by the share of the delivered production. The result corresponds to the annual social impact of the company. This result has to be divided by the total annual production of the functional unit to get the social impact per functional unit. According to the EPD conducted in 2010 Forsmark nuclear power plant had an annual energy production of 22.7 TWh (Vattenfall AB, 2010a). To calculate the impact per functional unit (kWh), the values for the social impacts have to be divided by 22,700,000.
The results for the different processes in connection to the companies are then added up for the upstream, core and downstream processes to get the overall social impact for the product. Figure 8 clarifies this procedure.
Continuous indicators already measure the impact on the company level and are not assumed to vary significantly for the different products of the company; they do not use the activity variable. Instead, the arithmetical average is calculated for the processes in each stage of the life cycle.
As mentioned before, the data for the upstream processes can be gathered from generic data sources. Sources for the acquisition of generic data for the indicators are presented in tables 10 to 13. Data for the core process is supposed to be specific. This data can be collected directly at the
Share of total production (units/monetary value)
SupplyingCompany
35%
65% CompanyY
CompanyX
A c t i v i t y v a r i a b l e
Total impactCompany X
35%
65%
ProductImpact
X
ProductImpact
Y
I m p a c t a s s e s s m e n t (for one indicator; e.g. fair living wage)
Total impactCompany Y
Total impactCompany Z
ProductImpact
Z
100%
To t a l I m p a c t U p s t r e a m
U p s t r e a m p r o c e s s e s
Total impactCore
5%
ProductImpact Core
Total impactCore
Infrastruct.
ProductImpact Core
Infr.
83%
To t a l I m p a c t C o r e
C o r e p r o c e s s e s
Total impactCompany U
15%
55%
ProductImpact
U
ProductImpact
V
Total impactCompany V
Total impactUser W
ProductImpact
W
95%
To t a l I m p a c t D o w n s t r e a m
D o w n s t r e a m p r o c e s s e s
To t a l P r o d u c t I m p a c t
Fig. 8. Impact Assessment and aggregation of social impacts from different life cycle stages and companies for the calculation of the total social impact for an indicator

27
company. For this case study fictive values have been used due to the fact that the goal of the case study is to show the calculation rules and not give an exact view of the social performance along the life cycle of the nuclear power plant (see Annex 10a).
Based on the inventory analysis the social impacts for each process stage can be calculated according to the system proposed before. The final social impact on the indicators is then aggregated for all companies involved in the life cycle. The socioprofile presents those result (see Annex 10b).
6 Discussion
The development phase of the indicators has been characterized by several review rounds. The reviewing process has been elementary for the selection of the indicators. It revealed strength and weaknesses of the indicators and the system of S-LCA.
The publication of the ‘Guidelines for Social Life Cycle Assessment of Products’ (UNEP/SETAC, 2009) took the development of a general framework of S-LCA a step forward. The level of experience with practical applications of that framework is still low (Reitinger et al., 2011). In the field of impact assessment (e.g. classification, characterization and other aggregation methods of the results of the inventory) more research has to be done (Ekener-Petersen & Moberg, 2013). Apart from the impact assessment other topics need to be considered and critically reviewed. The discussion will start with minor critiques on system boundaries and the connection to E-LCA, the use stage, national differences and practical limitations. Critique in the fields of impact assessment and indicators in general as well as specific critique on the chosen indicators is given after that. The last part of the discussion will be a comparison of the indicators with other sets of indicators that have been developed for two other PCRs. The discussion finishes with an outlook.
As mentioned by Kruse et al. (2009) system boundaries between E-LCA and S-LCA are often congruent. From a practical point of view this might be easier for conducting the S-LCA, but impacts throughout the systems often do not appear on the same levels. Some processes which may have a high impact on the environment can be less important for the assessment of social impacts and vice versa (Kruse et al., 2009; Valdivia, 2011). Franze & Ciroth (2011) has carried out a life cycle assessment on the production of roses. While focusing on both, environmental and social impacts, Franze & Ciroth (2011) found out that good environmental performances are often not related to a good social performance. System boundaries have to be carefully defined. Otherwise processes that might have a big
impact on either the environmental or social sphere could be excluded. The definition of system boundaries varies between the two systems. Whereas E-LCA is mostly focusing on processes and their impacts on the environment, social impacts often occur on a more global level (e.g. company or region). Kruse et al. (2009) proposes to set different system boundaries for E-LCA and S-LCA. The literature review revealed that no consensus on the decision on congruence of system boundaries of the different system exists (Klöpffer, 2008; Valdivia et al., 2011). Jørgensen et al. (2009) states the importance to differ between impacts that can be related to the product and those who are not. Only product-related impacts should be considered and added to the total impact of a product. Impacts occurring at the company level might be hard to allocate to certain products or processes.
Downstream processes (including the use stage) have not been included in this study and impacts on the consumers of the product have not been taken into consideration. The reasons for the exclusion of the downstream processes have been the complexity of the processes. At the same time, processes in the downstream processes of energy generation tend to be similar and impacts are primarily positive (Dreyer et al., 2006 as cited by Jørgensen et al., 2008). Including the use phase would not extend the outcome and information quality of the EPD. Those results of the use phase would most probably be the same for different producing companies. Nevertheless, impacts can occur on the use stage and need to be considered. Those impact categories are not fully developed and knowledge in this area is very low (Jørgensen et al., 2008, 2009).
The current development of S-LCA and its components reveals a lack of knowledge. The most challenging parts in the development of globally accepted rules to carry out a S-LCA are differences within cultures, nations and regions (Dreyer et al., 2006; Hauschild et al., 2008). An example for that are labour right issues. Those issues are highly influenced by the sector of the company and its geographical location. The geographical location can be referred to as a city, state, national macro-region, country or region (Dreyer et al., 2010). Every community might have different perceptions of social issues and different priorities (Tukker et al., 2006 as cited by Brent & Labuschagne, 2006; Swarr, 2009) Different stages of developments require focusing on different social aspects (Dreyer et al., 2006). Those aspects are highly connected to the regional circumstances and are difficult to develop on a global basis. The development of such rules requires the flexibility to include regional and national standards. At the same time, the system has to be comparable and adaptable on a global level. Finding the balance between those two extremes is an ambitious task. Brent & Labuschagne (2006, p.15) propose to

28
“undertake such a task at national level”. Aggregation of those national indicators can lay the foundation of an indicator set on an international level.
6.1 Indicators
The critiques on the indicators discuss the following topics: measurability of indicators including the interpretation of indicators; availability of data for indicators, from a theoretical and practical point of view; advantages and disadvantages of direct and indirect indicators; definition of indicators including some more specialized critique on some of the indicators and general critique on the indicator package.
Most of the indicators that have been chosen were quantitative. The causes have been feasibility reasons and considerations of the economic viability of the S-LCA. Indicators try to measure the social performance of certain aspects. Within social science most of the issues cannot be expressed or documented in numbers (Dubois & Mahieu, 2002; Empacher, 2002; Lehtonen, 2004; Swarr, 2009; UNEP/SEATC, 2009; Franze & Ciroth, 2011). This means that quantitative indicators cannot be used to measure the outcome of such an issue; those issues are often referred to as ‘intangibles’ and are in contrast to ‘tangibles’ difficult to measure. Qualitative data is needed to assess the performance (Swarr, 2009). The use of semi-quantitative data might lead to a loss of information due to the conversion of qualitative data with the help of a scoring system.
Considering a life cycle assessment sets another problem: qualitative and semi-quantitative data does not measure the performance per functional unit (UNEP/SETAC, 2009). This would imply that the results are not as relevant as they could (Moberg et al., 2009). As stated by Benoît et al. (2010) and the UNEP/SETAC Life Cycle Initiative (2009) subjective data (e.g. information from workers) can be of special importance for social life cycle assessment. It can give greater insight into some social issues than any objective data could offer.
Using one indicator to measure highly complex and interrelated systems can engender the gathering of misleading information and the drawing of unrealistic and incorrect conclusions (Grießhammer et al., 2006; Kruse et al., 2009). The violation of labour rights is an example for such a complex social issue (Kruse et al., 2009; Dreyer et al., 2010a). Statistics on forced labour are unlikely to be kept and surveys might not be answered truthfully. One solution for that kind of issues is observations, which separate from the character of an indicator (Kruse et al., 2009). Another example where one
indicator fails in measuring the social performance is the absentee rates of workers from their workplace. In a labour market with a high level of competition, workers might still go to work instead of staying at home to secure their workplace. The interpretation that a low absentee rate implies a low disease rate would in that case be misleading (Grießhammer et al., 2006). The same applies for indicators which require company-intern measurement tools. If the measurement tools (e.g. registration of working accidents) miss, the outcome of the indicator will not represent the real social condition in the company (Dreyer et al., 2010).
Measuring indicators and the availability of data for most indicators can be seen as a problem. A wide range of actors are involved in a life cycle assessment and data is collected from different stakeholders, countries and regions. Data availability differs between developing and developed countries (Brent & Labuschagne, 2006). It is therefore necessary that companies conducting a S-LCA make data available (Jørgensen, 2013). Because of the high costs and time consumption for data collection (UNEP/SETAC, 2009; Jørgensen, 2009), most companies assess and collect only data for the first tier of their suppliers (Jørgensen et al., 2009). The same impression could be received from the discussions with the interviewed experts. Data availability on social issues is a problem and there is a need for company-specific and current data (Evans et al., 2009). Indicators that distinguish between different employee categories require data on an even more detailed level. The availability of that kind of data is supposed to be low. The same applies for indicators such as excessive work, forced labour or child labour. Even though these indicators refer to standard and conventions of the International Labour Organization, data is not available. Information on those indicators can be given in form of a yes/no answer (companies either answer that no child labour exist, which implies that they are sure about the absence of child labour, or they do not answer at all, which implies that they cannot deny the appearance of child labour). The described procedure would not fulfil the goal to break down the performance on these indicators to the functional unit, but it would give a tendency and information on the management of these indicators.
Working hours are hard to assess and all indicators measuring the amount of working hours will have an ambitious task to gather data. For the purpose of this study, these indicators might be classified as additional indicators or even reported as voluntary additional information. In the long term, reporting tools should be implemented to facilitate the measurement and data collection of such indicators.
According to Claes Lundström (2013) some data is easier to access within Vattenfall’s life cycle (e.g. protective equipment in the Uranium ore mine

29
in Namibia). Financial aspects are well documented and follow internationally rules and standards on reporting. Data for these indicators exists as well. Within Vattenfall’s life cycle for the fuel production of Uranium data should be available for the following indicators: wage differences between man and women, employment training. Data on child labour might be difficult to collect, but several experts estimate the risk of child labour within the same life cycle as significantly low or even non-existent.
Most of those indicators that have been chosen can be classified as direct indicators. Those measure the social impacts that have been occurred at a process or in a company. Indirect indicators measure preventive management efforts that have been set up in a company (Jørgensen et al., 2008 as cited by Aparcana & Salhofer, 2013). They have the advantage that they actively prevent social impacts to occur by improving the awareness level by implemented management efforts (Dreyer et al., 2010). Examples of those indicators are ‘education within anti-corruption’, ‘audit of suppliers with regard to social responsibility and/or code of conducts’ and ‘personal protective equipment’. All these indicators that represent management efforts need to be communicated, implemented and followed up by all involved actors. The implementation has to be controlled. If those actions are not taken, the management effort might not result in the desirable outcome (Dreyer et al., 2010).
The clear definition of indicators is of high importance. Social aspects are changing constantly (Aparcana & Salhofer, 2013) and indicators need to be clearly defined to measure the necessary information. When talking about a living wage, it is important to define this wage. In this study the definition by Anker (2011) has been used. Other definitions exist and the outcome varies according to which definition is used (Evans et al., 2009). The definition of the word ‘local’ for the indicator ‘local employment’ has a great effect of the outcome of the indicator. Therefore the boundaries have to be clearly defined. Some of those definitions vary significantly between different stakeholders or regions. The choice of definitions reflects one subjective variable in the assessment of the social performance of products. One has to be careful when using international accepted standards for the definition of indicators (e.g. ILO C001). These standards are often not questioned and might not be suitable for the use within a set of indicators.
The same applies for the additional information ‘access to material resources’. It is important to define what kind of investments can be counted as improvements of material resources. Especially for the mining industry, the infrastructure is mostly improved in the close surrounding of the mine. After closing a mine, the infrastructure is often not longer usable and has no function for the local
community (Lundström, 2013). The same logic goes for employment training and community spending and charitable contributions. Some training and contributions might be regarded as more important and beneficial (e.g. health and safety education, investments in a new school) than others (e.g. specialized training for company tools, that cannot be used after the finishing of the job, sponsoring a golf club). In all cases information and data should be given on a detailed level, so that the reader of the S-LCA can make a fair judgement.
Table 17 lists some special critique for some of the indicators. It is important to communicate this information clearly, so that misinterpretation of the indicators does not occur.
Table 17. Specific critique on some types of indicators
The critique before mentioned some of the indicators of the final outcome of this work. The choice of indicators excluded some of the subcategories, proposed by the ‘Guidelines of Social Life Cycle Assessment of Products’ (UNEP/SETAC, 2009). This choice has been done due to feasibility reasons of the planned S-LCA. One may question the completeness of the set of indicators. Coverage of all social impacts with a set of 30 indicators will be almost impossible and some social issues might not be assessed by the indicator package. From a corporate perspective the set of indicators should ensure to measure the most important social issues and to be feasible. Feasibility is mainly defined by the amount of time that is needed to conduct a S-LCA; the higher the amount of indicators, the higher the amount of time needed to get data for them and the lower the feasibility. In this study, the amount of ten indicators has been considered to be feasible from a corporate perspective. In part 5.2.2. of this study, these ten indicators have been classified as core indicators; they achieved an arithmetical average higher than four.
In this study more than half of the indicators (17 of 30) have been chosen for the stakeholder category ‘workers’. The set of indicators has not an equal amount of measurement tools for each stakeholder category. One stakeholder category (‘consumer’) is even excluded from the study. The
Indicator CritiqueSpending on locally-based suppliers
Not all product might be available in all regions of the world
Audit of suppliers with regard to social responsibility and/or code of conducts
Sustainable suppliers might not need to be audited and would lower the outcome of this indicator
Possibility to associate and bargain
Indicator gives missleading information for China, where only one labour union exists and employees are forced to join that union; cultural differences and preferences might also affect the outcome of the indicator
Indicators that measure the amount of issues/cases that went to the court
Not all issues go to the court and are solved before
All indicators Social issues can change rapidly and annual average values might be missleading

30
aim has been to cover the most important social issues with the selected set of indicators. This aim might be achieved, but the unequal distribution of indicators to the stakeholder categories can still be seen critical. One may discuss the importance of the different stakeholder categories. Assuming that the amount of indicators per stakeholder category reflects the importance of the categories, the stakeholder category ‘workers’ has been most important and ‘consumer’ least important for this study.
The core conventions of the ILO (n.d.) represent important fields of human and labour rights. The final outcome of this work should ensure to cover all of these core conventions. The final set of indicators covers all of these eight core conventions and the survey about the importance of the indicators confirms this as well. Almost all of the indicators (seven of eight), covering the core conventions, have been evaluated as particularly important.
6.2 Impact assessment
The impact assessment is closely related to the application of the indicators. The indicators are embedded in the life cycle impact assessment and lay the foundation to measure the total social impact of a product. The calculation of those impacts has been done with the help of an activity variable. The activity variable used for the case of the nuclear power plant is the share of a company’s total production. It has been introduced, since most impacts occur on the company level and are not directly linked to the functional unit. The activity variable is applicable for a company with one output. For companies with more than one output, the share of the total production value has been used. This aggregation might not be adequate and representative in case a positive correlation of amount of work spent on a product and generated value by a product is lacking. Hunkeler (2006) as cited by Klöpffer (2008) proposes to take the amount of working hours per functional unit as the activity variable. The collection of working hours spend on the different processes is difficult to conduct. For continuous indicators the arithmetical averages have been used to assess the social impacts. Relative numbers cannot be aggregated in that way and absolute values for the relations are required to be able to aggregate those numbers. This entails even more data collection and might be difficult to conduct in practice.
Assuming that a feasible activity variable has been found, an accepted set of indicators could be developed and that reliable data for all the indicators could be gathered, the main task of the impact assessment is to aggregate the results of the indicators and to convey it to impact categories. The
analyzed social-environmental systems and indicators are highly correlated (Musters et al., 1998). An example is the indicator in the subcategory ‘corruption’. Corruption is one of the major causes of negative social impacts and can be related to health and safety aspects, child labour and many other aspects.
A major problem within S-LCA is the weighting process. In E-LCA the weighting of different emissions is based on natural laws. Knowing the contribution of different gases to climate change makes it simple to calculate a total impact on global warming. These natural laws do not exist within social science. There are no clear correlations between social impact categories and the indicators (Hutchins & Sutherland, 2008). Weighing of social impacts differs a lot within different stakeholders, regions or countries (Grießhammer et al., 2009; Hutchins & Sutherland, 2008). Setting weights for the impact categories will be based on subjective decisions (Weingaertner & Moberg, 2011; Franze & Ciroth, 2011). National or international accepted standards can be used to gain a higher credibility of the impact assessment, but at the very end, even those standards are mostly based on the perceptions and preferences of single individuals (Franze & Ciroth, 2011).
6.3 Comparison and outlook
So far no international accepted standard or set of indicators for S-LCA has been agreed upon. Existing indicator packages have to be adapted to the system of life cycle assessment and to the requirements of the industry to make them feasible (Grießhammer et al., 2006).
When looking upon other practical applications of S-LCA the indicators vary considerably. The EDF Group (2012) published their report on Sustainable Development Indicators. The dominant parts of the sustainability reports are information about gender equality (percentage of woman at managerial level), recruiting (hired people), training (percentage of employees having benefited from training), absenteeism, disabilities (number of employees), safety (injury frequency rate and degree of seriousness), radioprotection indicators (average collective dose), list of social responsibility actions (e.g. tackling fuel poverty) and CSR performance ratings (e.g. Vigeo). The list seems to be highly detailed, but social indicators within other important subcategories, e.g. local community, are not mentioned in their list.
In the beginning of April 2013, the first indicators to integrate social sustainability assessment have been proposed for two PCRs. The PCRs for uncooked pasta (CPC 2371) and meat of

31
Indicator Description Calculation approach
Product origin and territoriality labels (DOP, DOC, IGP, STG)
The indicator shows if the product is labeled with some product origin and territoriality labels such as DOP (Protected Designation of Origin) or DOC (Controlled Designation of Origin), IGP (protected geographical indication) , STG (guaranteed traditional)
Company declare product origin and territoriality labels (DOP, DOC, IGP, STG) for the interested product
HACCP Description of food safety hot spot and related control systems
Hot spot shall be individuated and reported by the company. For each of these hot spot the company provide document or data that can demonstrate their attention or care.
Improvementprojects
Operations substantially benefit local value creation through employment at all levels of qualification, investment, marketing , tax payments. Social and environmental project are take into account.
The company declare their improvement projects
% of the production whichinvolved in the supply chainsome GMO products
The indicator shows the percentage of the production which involved in the supply chain GMO products
The part of the production which involved in the supply chain GMO products is divided by the total production
Product origin andterritoriality labels(DOP,DOC, IGP,STG)
The indicator shows if the product is labelled with some labels such as DOP (Protected Designation of Origin) or DOC (Controlled Designation of Origin), IGP (protected geographical indication) , STG (guaranteed traditional specialty)
Company declare product origin and territoriality labels (DOP, DOC, IGP, STG) for the interested product
Average life of the animal oraverage number of births
The indicator shows the average life of the animal or the average number of births
Average data of life cycle duration of the animal evaluated on the basis of the registration at farm level.
Animal WelfareAverage surface available perhead (by type: open andstable)
The indicator show the average available surface per head including distinction from open surface and stable surface.
The indicator show, taking into consideration 1000 heads, the number of them interested by disease in one years.
Animal welfareDisease/(1000 heads * year )
The indicator show, taking into consideration 1000 heads, the number of them interested by disease in one years.
Data calculated considering the average number of managed head and data about disease in one year (the specific meaning of "disease" shall be defined case-by-case).
Animal welfare - Mutilation Mutilation (eg castration, tail cutting, incisive reduction in the case of pigs)
Company declares eventual mutilation techniques applied during the farming phase. (the specific meaning of "mutilation" shall be defined case-by-case).
Animal welfare - Mortality Mortality rate on annual basis Data calculated considering the annual number of heads died compared to the total breeded.
HACCP Description of food safety hot spot and related control systems
Hot spot related to the Food Safety Management System applied in order to control the risk for health.
Indicators from the PCR CPC 2111 - Meat of Mammals
Indicators from the PCR CPC 2371 - Uncooked pasta
mammals (CPC 2111 and 2113) define three respectively eight social indicators (Barilla & Life Cycle Engineering, 2013; Life Cycle Engineering et al., 2013). Table 18 shows the indicators and a description of both PCRs.
The indicators of the PCR for uncooked pasta focus mainly on indicators that are linked to labelling systems or other predefined principles and projects. The proposed system does not seem to cover all aspects of social issues. The PCR for meat of mammals propose more indicators than the other, but it still lacks social issues, e.g. for the stakeholder category workers. Five of the indicators link to animals and four of them to animal welfare. Two of the remaining indicators are identical with the ones proposed in the other PCR and the last remaining indicator focuses on genetically modified organism
products. The system seems to be product specific and the proposed indicators do not allow for a global assessment of the social issues (e.g. local community, workers, society or the consumers). The development of the indicators in those PCRs shows that there is some progress and effort in the development of social indicators. Since this work has been performed voluntarily by the private sector, it can be implied that there is a willingness to improve the system of S-LCA.
The developed set of indicators covers global social issues and can be seen as a more complete set of indicators. On the other hand the amount of indicators is ten or at least four times as large as the ones proposed in the PCR. The developed indicators are not that product specified as the ones proposed in the PCRs. The reason for this can be seen in the less
Table 18. Social sustainability indicators from the PCR CPC 2371 & 2111 (Barilla & Life Cycle Engineering, 2013; Life Cycle Engineering et al., 2013)

32
detailed PCR for electricity, which implies that the indicators must be able to apply to a wider range of production techniques (e.g. mining, agriculture or chemical processes). As proposed in 4.2.3 the indicators can be classified as core and additional indicators. The amount of core indicators is lower than the total package and more feasible for practical applications. An expert survey is the base for the division of indicators. This survey is a subjective classification. It shows a tendency that some indicators seem to be more important than other ones. The level of detail for this study has been low and a more representative and extensive study needs to be done.
When it comes to future work and further research it is proposed to work on the standards of S-LCA and an international accepted set of core indicators to assess social issues. According to those indicators information has to be followed up and the necessary infrastructure and reporting tools must be implemented at the company, regional, national and also international level. As Dreyer et al. (2010) describes it, those measurements have to be integrated into the daily work. Not only the documentation, also the process of following up the quality of the data and verifying the data needs to be ensured (Dreyer et al., 2010).
Another promising improvement is research in the field of health and safety of workers. Stress is a very common phenomenon at the work place. The development of new technologies could bring new knowledge and insights about how stress influences the health of workers.
The implementation of a structure for adding social indicators into the International EPD® system has been estimated by the experts within this system to be feasible and realistic. There are no fundamental obstacles for the inclusion of social sustainability indicators in the International EPD® system. The system is characterized by a high degree of flexibility and the adaption seems to be simple. One of the most important steps in that development is the creation of a new PCR, which includes the social indicators and gives advice on the calculation rules.
7 Conclusion
In this paper a set of indicators to assess the social performance of Vattenfall’s products has been developed. The result is the socioprofile, which contains 30 indicators that are classified into core and additional indicators. Further additional information has been added to the socioprofile to cover a wider range of social aspects. The practical application of the indicators on Vattenfall’s nuclear power plant in Forsmark gives instruction for the use and calculation of the socioprofile. The activity variable for the
calculation and allocation of the inventory results to the functional unit can be considered as relatively simple. All information and indicators have been developed in line with the requirements of the International EPD® system.
The foundation of the study has been laid through an in-depth literature research on the most relevant literature published in the field of social life cycle assessment. The literature review revealed the existence of already defined social indicators. The development of indicators has gained popularity from the beginning of the 21th century. Still, a lot of work has to be done to gain international acceptance on a set of indicators.
The cooperation with Vattenfall and experts in the field of social sustainability and the International EPD® system has brought new insights and existing indicators could be adapted to Vattenfall needs. However, data has not been gathered and the implementation of social sustainability assessments on the market is still in its infancy. The framework of S-LCA and the set of indicators are able to acquire useful, comparable and important information about the social conditions along the life cycle of a product. More experience in data gathering needs to be gained. Acceptance of S-LCA has to be increased and clear rules for the life cycle impact assessment have to be defined.
S-LCA is not only named in the same way as the traditional and more developed E-LCA. Both assessment methods share the same scope: the whole life cycle of a product. Whereas the aggregation of inventory results in E-LCA is easily defined and preset by natural laws, S-LCA lacks those non discussable laws. The social pillar of sustainability is even more complex than the environmental one. We still know very little about the interactions of different ecosystem. We do know even less about the interactions of social systems. S-LCA will always be a process where subjective opinions and gradings occur. Nevertheless, assessment methods such as S-LCA are required to identify hotspots. The social pillar of sustainability is of particular importance and the improvement of S-LCA can lead to significant and important enhancements in this field.
The fundamental question will be if this kind of impact assessment necessarily has to be done for S-LCA. One of the main goals of S-LCA is to reveal and highlight social hotspots within a product’s life cycle. Impact assessments ease the interpretation of the life cycle assessment, but results will also be available on the level of the indicators. Internationally recognized standards and methods can help to raise the credibility of newly emerging systems and ideas. The International EPD® system and the development of Product Category Rules are vital components in the development and introduction of S-LCA and a worldwide accepted set of indicators.

33
8 References
Anker, R., 2011. Estimating a living wage: A methodological review. Geneva, Switzerland: International Labour Office.
Aparcana, S., Salhofer, S., 2013. Development of a
social impact assessment methodology for recycling systems in low-income countries. In Curran, M.A., Klöpffer, W. (eds.): Int J Life Cycle Assess (in press).
Ballet, J., Dubois, J.L., Mahieu, F.R., 2003. Le
développement socialement durable: un moyen d’intégrer capacités et durabilite. Paper Presented at the Third Conference on the Capability Approach, University of Pavia, 6– 9 September, 2003.
Barilla & Life Cycle Engineering, 2013. Product
Category Rules - CPC 2371: Uncooked Pasta, Not Stuffed or Otherwise Prepared. The International EPD® System.
Bauman, H., Tilman, A.M., 2004. The Hitch Hiker's
Guide to LCA. Lund: Studentlitteratur. Benoît, C., Norris, G.A., Valdivia, S., Ciroth, A.,
Moberg, Å., Bos, U., Prakash, S., Ugaya, C., Beck, T., 2010. The guidelines for social life cycle assessment of products: just in time! In Curran, M.A., Klöpffer, W. (eds.): Int J Life Cycle Assess 15(2), 156-163.
Benoît-Norris, C., Vickery-Niederman, G., Valdivia
S., Franze, J., Traverso, M., Ciroth, A., Mazijn, B., 2011. Introducing the UNEP/SETAC methodological sheets for subcategories of social LCA. In Curran, M.A., Klöpffer, W. (eds.): Int J Life Cycle Assess 16(7), 682-690.
Birkin, F., Polesie, T., 2012. Intrinsic sustainable
development: epistemes, science, business and sustainability. Singapore: World Scientific Publishing.
Blackburn, W.R., 2007. The sustainability handbook:
the complete management guide to achieving social, economic and environmental responsibility. Oxford: Earthscan.
Blom, M., Solmar, C., 2009. How to socially assess
biofuels, a case study of the UNEP/SETAC code of practice for socialeconomical LCA. Master’s thesis in cooperation with the Division of Quality and Environmental Management at Luleå University of Technology, commissioned by Enact Sustainable Strategies in Stockholm, Sweden.
Brent, A., Labuschagne, C., 2006. Social indicators for sustainable project and technology life cycle management in the process industry. In Curran, M.A., Klöpffer, W. (eds.): Int J Life Cycle Assess 11(1), 3-15.
Brooks, K.W., 1979. Delphi technique: Expanding
applications. North Central Association Quarterly, 54(3), 377-385.
Consoli, F., Allen, D., Boustead, I., Fava, J.,
Franklin, W., Jensen, A.A., De Oude, N., Parrish, R., Postlethwaite, D., Quay, B., Siéguin, J., Vigon, B. (eds.), 1993. Guidelines for life cycle assessment. A code of practice. Brussels: Society of Environmental Toxicology and Chemistry (SETAC).
Custer, R.L., Scarcella, J.A., Stewart, B.R., 1999.
The modified Delphi technique: A rotational modification. In Swortzel, K. (ed.): Journal of Vocational and Technical Education, 15(2), 1-10.
Cyphert, F.R., & Gant, W. L. (1971). The Delphi
technique: A case study. Phi Delta Kappan, 52, 272-273.
Dahlsrud, A., 2008. How corporate social
responsibility is defined: an analysis of 37 definitions. In Welford, R. (ed.): Corporate Social Responsibility and Environmental Management 15(1), 1-13.
Dalkey, N.C., Helmer, O., 1963. An experimental
application of the Delphi method to the use of experts. In Cachon, G.P. (ed.): Management Science 9(3), 458-467.
de Leeuw, B., 2005. The World Behind the Product.
In Lifset, R. (ed.): Journal of Industrial Ecology 9(1).
Delbecq, A.L., Van de Ven, A.H., Gustafson, D.H.,
1975. Group techniques for program planning. Glenview, IL: Scott, Foresman, and Co.
Del Borghi, A., 2013. LCA and communication:
Environmental Product Declaration. In Curran, M.A., Klöpffer, W. (eds.): Int J Life Cycle Assess 18(2), 293-295.
Dobers, P., 2009. Corporate Social Responsibility:
Management and Methods. In Welford, R. (eds.): Corporate Social Responsibility and Environmental Management 16(4), 185-191.

34
Dreyer, L.C., Hauschild, M., Schierbeck, J., 2006. A framework for social life cycle impact assessment. In Curran, M.A., Klöpffer, W. (eds.): Int J Life Cycle Assess 11(2), 88-97.
Dreyer, L.C., Hauschild, M., Schierbeck, J., 2010a.
Characterisation of social impacts in LCA - Part 1: Development of indicators for labour rights. In Curran, M.A., Klöpffer, W. (eds.): Int J Life Cycle Assess 15(3), 247-259.
Dubois, J.L., Mahieu, F.R., 2002. La dimension
sociale du développement durable: reduction de la pauvreté ou durabilité sociale?. In Martin, J.Y., Guillaume, L. (eds.): Paris IRD Editions, Développement Durable: Doctrines, Pratiques, Evaluations, 73-94.
EDF Group, 2012. Sustainable Development
Indicators. [online] Available at: <http://www.edf.com/html/RA2011/en/pdf/EDF2011_cahierDD_va.pdf> [Accessed 19 March 2013].
Ekener-Petersen, E., Finnveden, G., 2013. Potential
hotspots identified by social LCA—part 1: a case study of a laptop computer. In Curran, M.A., Klöpffer, W. (eds.): Int J Life Cycle Assess 18(1), 127-143.
Ekener-Petersen. E., Moberg, Å., 2013. Potential
hotspots identified by social LCA–Part 2: Reflections on a study of a complex product . In Curran, M.A., Klöpffer, W. (eds.): Int J Life Cycle Assess 18(1), 144-154.
Elkinton, J., 2004. Enter the triple bottom line. In
Henriques, A., Richardson, J. (eds.): London: Earthscan, The triple bottom line Does it all add up? Assessing the sustainability of business and CSR, 1-17.
Empacher, C., 2002. Die Sozialen Dimensionen der
Nachhaltigkeit- Vorschläge zur Konkretisierung und Operationalisierung. Köln: Institut für sozial-ökologische Forschung. Vortrag auf der ordentlichen Mitgliederversammlung des Doktoranden-Netzwerk Nachhaltiges Wirtschaften, 26 April. Köln [online] Available at: <http://www.isoe.de/ftp/kerpen.pdf> [Accessed 17 March 2013].
European Commission, 2002. Communication:
Corporate Social Responsibility: A Business Contribution to Sustainable Development. Brussels: Commission of the European Communities.
Evans, A., Lesage, P., Benoît, C., Parent, J., Norris, G., Revéret, J.P., 2009. Life cycle attribute assessment - case study of Quebec greenhouse tomatoes. In Lifset, R. (ed.): Ind Ecol 13(4), 565-578.
Foolmaun, R.K., Ramjeeawon, T., 2013.
Comparative life cycle assessment and social life cycle assessment of used polyethylene terephthalate (PET) bottles in Mauritius . In Curran, M.A., Klöpffer, W. (eds.): Int J Life Cycle Assess 18(1), 155-171.
Franze, J., Ciroth, A., 2011. A comparison of cut
roses from Ecuador and the Netherlands. In Curran, M.A., Klöpffer, W. (eds.): Int J Life Cycle Assess 16(4), 366-379.
Friedman, M., 1962. Capitalism and Freedom.
Chicago: University of Chicago Press. Global Reporting Initiative, 2011. Sustainability
Reporting Guidelines. Amsterdam, Netherlands.
Global Reporting Initiative, 2013. G4 Developments. [online] Available at: <https://www.globalreporting.org/reporting/latest-guidelines/g4-developments/Pages/default.aspx> [Accessed 04 March 2013].
Gordon, T.J., Helmer, O., 1964. Report on a long-
range forecasting study. Rand Corporation. Grießhammer, R., Benoît, C., Dreyer, L.C., Flysjö,
A., Manhart, A., Mazijn, B., Méthot, A.L., Weidema, B., 2006. Feasibility study: integration of social aspects into LCA. Freiburg: Öko-Institut.
Grießhammer, R., Manhart, A., Dreyer, L., Flysjö,
A., 2005. Developing a set of indicators for a Social LCA.
Hauschild, M.Z., Dreyer, L.C., Jørgensen, A., 2008.
Assessing social impacts in a life cycle perspective - lessons learned. In CIRP (ed.): CIRP Annals - Manufacturing Technology 57, 21-24.
Heiskanen, E., 2002. The institutional logic of life
cycle thinking. In Huisingh, D. (ed.): Journal of Cleaner Production 10, 427-437.
Helmer, O., Rescher, N., 1959. On epistemology of
inexact sciences. In Cachon, G.P. (ed.): Management Science 6(1), 25-52.

35
Hoskins, T., 2005. The ICSA Corporate Social Responsibility Handbook: Making CSR Work for Business.
Hsu, C.C., Sandford, B.A., 2007. The Delphi
Technique: Making Sense of Consensus. In Lawrence, M.R., William, D.S. (eds.): Practical Assessment, Research & Evaluation 12(10).
Hunkeler, D., 2006. Societal LCA methodology and
case study. In Curran, M.A., Klöpffer, W. (eds.): Int J Life Cycle Assess 11(6), 371-382 .
Hutchins, M.J., Sutherland, J.W., 2008. An
exploration of measures of social sustainability and their application to supply chain decisions. In Huisingh, D. (ed.): J Clean Prod 16, 1688-1698.
International Labour Organisation (ILO), 2001.
Tripartite Declaration of Principles Concerning Multinational Enterprises and Social Policy. Geneva, Switzerland: International Labour Office, Third edition.
International Labour Organisation (ILO), 2002. A
guide to the Tripartite Declaration of Principles Concerning Multinational Enterprises and Social Policy - Knowing and using universal guidelines for social responsibility. Geneva, Switzerland: International Labour Office - Multinational Enterprises Programme.
International Labour Organisation (ILO), n.d..
Conventions and Recommendations, ILOLOEX. [online] Available at: <www.ilo.org> [Accessed 08 March 2013].
Interorganizational Committee on Guidelines and
Principles (ICGP), 1994. Guidelines and Principles for Social Impact Assessment. Impact Assessment 12(2), 107-152.
ISO 26000, 2010. Guidance on social responsibility.
Geneva, Switzerland: International Organization for Standardization.
Jacobs, J.M., 1996. Essential assessment criteria for
physical education teacher education programs: A Delphi study. Unpublished doctoral dissertation, West Virginia University, Morgantown.
Jørgensen, A., 2013. Social LCA—a way ahead?. In
Curran, M.A., Klöpffer, W. (eds.): Int J Life Cycle Assess 18(2), 296-299.
Jørgensen, A., Dreyer, L.C., Wangel, A., 2012. Addressing the effect of social life cycle assessments. In Curran, M.A., Klöpffer, W. (eds.): Int J Life Cycle Assess 17(6), 828-839.
Jørgensen, A., Hauschild, M., Jørgensen, M.,
Wangel, A., 2009. Relevance and feasibility of social life cycle assessment from a company perspective. In Curran, M.A., Klöpffer, W. (eds.): Int J Life Cycle Assess 14(3), 204-214.
Jørgensen, A., Le Bocq, A., Nazarkina, L.,
Hauschild, M.Z., 2008. Methodologies for social life cycle assessment. In Curran, M.A., Klöpffer, W. (eds.): Int J Life Cycle Assess 13(2), 96-103.
Kaplan, A., Skogstad, A.L., Girshick, M., 1949. The
prediction of social technological events. Rand Corporation.
Kerlinger, F.N., 1973. Foundations of behavioral
research. New York: Holt, Rinehart, and Winston, Inc.
Klöpffer, W., 2003. Life-Cycle Based Methods for
Sustainable Product Development. In Curran, M.A., Klöpffer, W. (eds.): Int J Life Cycle Assess 8, 157-159.
Klöpffer, W., 2008. Life cycle sustainability
assessment of products (with comments by Helias A. Udo De Haes). In Curran, M.A., Klöpffer, W. (eds.): Int J Life Cycle Assess 13(2), 89-95.
Klöpffer, W., Ciroth, A., 2011. Is LCC relevant in a
sustainability assessment?. In Curran, M.A., Klöpffer, W. (eds.): Int J Life Cycle Assess 16(2), 99-101.
Krajnc, D., Glavic, P., 2003. Indicators of sustainable
production. In Jain, R., Skidar, S.K.. (eds.): Clean Technol Environ Policy 9, 279-288.
Kruse, S.A., Flysjö, A., Kasperczyk, N., Scholz, A.J.,
2009. Socioeconomic indicators as a complement to life cycle assessment—an application to salmon production systems. In Curran, M.A., Klöpffer, W. (eds.): Int J Life Cycle Assess 14(1), 8-18.
Lagarde, V., Macombe, C., 2013. Designing the
social life cycle of products from the systematic competitive model. In Curran, M.A., Klöpffer, W. (eds.): Int J Life Cycle Assess 18(1), 172-184.
Landeta, J., 2005. Current validity of the Delphi
method in social sciences. In Phillips, F. (ed.): Technological Forecasting & Social Change 73, 467-482.

36
Lehtonen, M., 2004. The environmental-social interface of sustainable development: Capabilities, social capital, institutions. In Howarth, R.B. (ed.): Ecol Econ 49, 199-214.
Life Cycle Engineering, COOP Italia, Assocarni,
2013. Product Category Rules - CPC 2111: Meat of Mammals, Fresh or Chilled, CPC 2113: Meat of Mammals, Frozen. The International EPD® System.
Linstone, H.A., Turoff, M., 1975. The Delphi
method: Techniques and applications. Reading, MA: Addison-Wesley Publishing Company.
Littig, B., Griessler, E., 2005. Social sustainability: a
catchword between political pragmatism and social theory. In Welford, R. (ed.): International Journal of Sustainable Development 8(1/2), 65-79.
Ludwig, B.G., 1994. Internationalizing Extension:
An exploration of the characteristics evident in a state university Extension system that achieves internationalization. Unpublished doctoral dissertation, The Ohio State University, Columbus.
Ludwig, B., 1997. Predicting the future: Have you
considered using the Delphi methodology? Journal of Extension, 35(5), 1-4. [Retrieved 6 November 2005] from http://www.joe.org/joe/1997october/tt2.html.
Lundström, C., 2013. Interview on Social
Sustainability Performance Indicators by Sebastian Welling, [Conducted 23 April 2013].
Macombe, C., Feschet, P., Garrabé, M., Loeillet, D.,
2011. 2nd International Seminar in social life cycle assessment - recent developments in assessing the social impacts of product life cycles. In Curran, M.A., Klöpffer, W. (eds.): Int J Life Cycle Asses 16(9), 940-943.
Mazijn, B., 2008. Code of Practice for a social-
economical LCA (seLCA) for product assessment. Fourth Draft.
Menna, C., Asprone, D., Jalayer, F., Prota, A.,
Manfredi, G., 2013. Assessment of ecological sustainability of a building subjected to potential seismic events during its lifetime. In Curran, M.A., Klöpffer, W. (eds.): Int J Life Cycle Assess 18(2), 504-515.
Moberg, Å., Picha, M., Erlandsson-Segerström, B., Karagianni, C., Malmodin, J., Wiklund, L., 2009. Using a life cycle perspective to assess potential social impacts of ICT services. Stockholm: Report from the KTH Centre for Sustainable Communications.
Musters, C.J.M., de Graaf, H.J., ter Keurs, W.J.,
1998. Defining socio-environmental systems for sustainable development. In Howarth, R.B. (ed.): Ecol Econ 26, 243-258.
Norris, G., 2006. Social impacts in product life
cycles: towards life cycle attribute assessments. In Curran, M.A., Klöpffer, W. (eds.): Int J Life Cycle Assess 11(1), 97-104.
Organisation for Economic Co-operation and
Development (OECD), n.d.. Guidelines for multinational enterprises. [online] Available at: <http://www.oecd.org/daf/inv/mne/> [Accessed 13 May 2013].
Pfeiffer, J., 1968. New look at education.
Poughkeepsie, NY: Odyssey Press. Porter, M.E., Kramer, M.R., 2006. Strategy and
society: the link between competitive advantage and corporate social responsibility. "Harvard Business Review" [online] Available at: <http://www.salesforcefoundation.org/files/HBR-CompetiveAdvAndCSR.pdf> [Accessed 13 March 2013].
Reitinger, C., Dumke, M., Barosevcic, M.,
Hillerbrand, R., 2011. A conceptual framework for impact assessment within SLCA. In Curran, M.A., Klöpffer, W. (eds.): Int J Life Cycle Assess 16(4), 380-388.
Ruggie, J., 2011. Respecting Human Rights Through
Due Diligence. [online] Available at: <http://www.fcpablog.com/blog/2011/4/25/respecting-human-rights-through-due-diligence.html#> [Accessed 20 May 2013].
Sackman, H., 1974. Delphi assessment: expert
opinion, forecasting and group process. Rand Corporation.
Sandin, G., Peters, G., Pilgård, A., Svanström, M.,
Westin, M., 2011. Integrating Sustainability Considerations into Product Development: A Practical Tool for Prioritising Social Sustainability Indicators and Experiences from Real Case Application. In Finkbeiner, M. (eds.): Towards Life Cycle Sustainability Management, Dordrecht, Netherlands: Springer.

37
Schmincke, E., Capello, C., Homlquist, L., Le-Boulch, D., Frischknecht, R., Raadal, H., 2011. Product Category Rules - CPC 171 & 173: Electricity, Steam, and Hot and Cold Water. The International EPD® System.
Society for Environmental Toxicology and
Chemistry (SETAC), 1993. A Conceptual Framework for Life-Cycle Impact Assessment. Pensacola, FL: Workshop Report, Society for Environmental Toxicology and Chemistry and SEATC Foundation for Environmental Education, Inc.
Simchi-Levi, D., Kaminsky, P., Simchi-Levi, E.,
2003. Designing and managing the supply chain: concepts, strategies and case studies. New York: McGraw-Hill, Second edition.
Spillemaeckers, S., Vanhoutte, G., Taverniers, L.,
Lavrysen, L., van Braeckel, D., Mazijn, B., Rivera, J.D., 2004. Ecological, Social and Economical Aspects of Integrated Product Policy. Integrated Product Assessment - The Development of the Label 'Sustainable Development' for Products. Belgium: Belgian Science Policy.
Strand, M., 2008. Monetary evaluation method for
lifecycle data: A study of Vattenfall AB's EPD system. Uppsala: Master’s thesis in cooperation with the Division of Applied Nuclear Physics at Uppsala University, commissioned by Vattenfall AB Generation Nordic in Sweden.
Swarr, T., 2009. Societal life cycle assessment—
could you repeat the question?. In Curran, M.A., Klöpffer, W. (eds.): Int J Life Cycle Assess 14(4), 285-289.
The International EPD® system (EPD), 2012.
General Programme Instructions. The International EPD® system.
The International EPD® system (EPD), n.d., What is an EPD®?. [online] Available at: <http://www.environdec.com/en/What-is-an-EPD/#.UUGO0RzENcw> [Accessed 14 March 2013].
The UN Millennium Goals Website, 2010. n.t..
[online] Available at: <http://www.un.org/millenniumgoals> [Accessed 13 March 2013].
Tukker, A., Eder, P., Suh, S., 2006 . Environmental
impacts of products: policy relevant information and data challenges. In Lifset, R. (ed.): J Ind Ecol 10(3), 183-198.
UNDSD, 2007. Indicators of sustainable development: guidelines and methodologies. New York: United Nations, Third edition. [online] Available at: <http://sustainabledevelopment.un.org/content/documents/guidelines.pdf> [Accessed 08 March 2013].
UNEP/SETAC Life Cycle Initiative, 2005. Life Cycle
Approached – The road from analysis to practice. France, Paris: UNEP/SETAC Life Cycle Initiative.
UNEP/SETAC Life Cycle Initiative - Social LCA
Project Group, Benoît, C. & Mazijn, B. (eds.), 2009. Guidelines for Social Life Cycle Assessment of Products.
UNEP-SETAC Life Cycle Initiative - Social LCA Project Group, 2010a. Methodological sheets for 31 subcategories of impact. Guide to Social LCA: Methodological Sheets. [online] Available at: <http://www.estis.net/sites/lcinit/default.asp?site=lcinit&page_id=A8992620-AAAD-4B81-9BAC-A72AEA281CB9> [Accessed 11 March 2013].
UNEP-SETAC Life Cycle Initiative - Social LCA
Project Group, 2010b. Methodological sheets for 31 subcategories of impact. Stakeholder: Consumer. [online] Available at: <http://www.estis.net/sites/lcinit/default.asp?site=lcinit&page_id=A8992620-AAAD-4B81-9BAC-A72AEA281CB9> [Accessed 11 March 2013].
UNEP-SETAC Life Cycle Initiative - Social LCA
Project Group, 2010c. Methodological sheets for 31 subcategories of impact. Stakeholder: Local Community. [online] Available at: <http://www.estis.net/sites/lcinit/default.asp?site=lcinit&page_id=A8992620-AAAD-4B81-9BAC-A72AEA281CB9> [Accessed 11 March 2013].
UNEP-SETAC Life cycle initiative - Social LCA
Project Group, 2010d. Methodological sheets for 31 subcategories of impact. Stakeholder: Society. [online] Available at: <http://www.estis.net/sites/lcinit/default.asp?site=lcinit&page_id=A8992620-AAAD-4B81-9BAC-A72AEA281CB9> [Accessed 11 March 2013].

38
UNEP-SETAC Life cycle initiative - Social LCA Project Group, 2010e. Methodological sheets for 31 subcategories of impact. Stakeholder: Value Chain Actors. [online] Available at: <http://www.estis.net/sites/lcinit/default.asp?site=lcinit&page_id=A8992620-AAAD-4B81-9BAC-A72AEA281CB9> [Accessed 11 March 2013].
UNEP-SETAC Life cycle initiative - Social LCA
Project Group, 2010f. Methodological sheets for 31 subcategories of impact. Stakeholder: Workers. [online] Available at: <http://www.estis.net/sites/lcinit/default.asp?site=lcinit&page_id=A8992620-AAAD-4B81-9BAC-A72AEA281CB9> [Accessed 11 March 2013].
United Nations, 1948. Universal Declaration of
Human Rights. Adopted and proclaimed by the General Assembly of the United Nations, December 10, 1948. [online] Available at: <http://www.un.org/en/documents/udhr/index.shtml> [Accessed 11 March 2013].
United Nations, 2011. Guiding Principles on
Business and Human Rights - Implementing the United Nations "Protect, Respect and Remedy" Framework. New York and Geneva: United Nations.
US Legal, 2013. Local Employment Commuting Area
Law & Legal Definition. [online] Available at: <http://definitions.uslegal.com/l/local-employment-commuting-area/> [Accessed 02 May 2013].
Valdivia, S., Ugaya, C.M.L., Sonnemann, G.,
Hildenbrand, J., (eds.), 2011. Towards a Life Cycle Sustainability Assessment: Making informed choices on products.
Van Oosterhout, J., Heugens, P.M.A.R., 2006. Much Ado About Nothing: a conceptual critique of CSR. Rotterdam: Erasmus Research Institute of Management. Report reference ERS-2006-040-ORG.
Vattenfall AB, 2010a. Certified Environmental
Product Declaration - EPD® of Electricity from Forsmark Nuclear Power Plant. Stockholm: Lasse Kyläkorpi.
Vattenfall AB, 2010b. The Nuclear Fuel Cycle –
Reference to Vattenfall AB. Vattenfall AB. Vattenfall AB, 2012a. Life Cycle Assessment -
Vattenfall's electricity generation in the Nordic countries. Vattenfall AB.
Vattenfall AB, 2012b. Towards sustainable energy - Corporate Social Responsibility Report 2011. Vattenfall AB.
Vattenfall AB, 2013a. Annual Report 2012 including
Sustainability Report. Vattenfall AB. [online] Available at: <http://www.vattenfall.com/en/annual-reports.htm?WT.ac=redirect_annualreport> [Accessed 26 March 2013].
Vattenfall AB, 2013b. Energy market in change -
Sustainability Performance Report 2012 according to GRI. Vattenfall AB. [online] Available at: <http://www.vattenfall.com/en/annual-reports.htm?WT.ac=redirect_annualreport> [Accessed 26 March 2013].
Vattenfall AB, n.d.. Vattenfall's Code of Conduct for
suppliers. Vattenfall AB. Veleva, V., Ellenbecker, M., 2001. Indicators of
sustainable production: framework and methodology. In Huisingh, D. (ed.): J Cleaner Prod 9, 519-549.
Venturini, O.J., Silva Lora, E.E., Almazán del Olmo,
O., Grillo Renó, M.L., Escobar Palacios, J.C., 2010. Issues to consider, existing tools and constraints in biofuels sustainability assessments. In Lund, H. (ed.): J Energy 36, 2097-2110.
Vinyes, E., Oliver-Solà, J., Ugaya, C., Rieradevall, J.,
Gasol, C.M., 2013. Application of LCSA to used cooking oil waste management. In Curran, M.A., Klöpffer, W. (eds.): Int J Life Cycle Assess 18(2), 445-455.
Weaver, T.W., 1971. Delphi, a Critical Review.
Educational Policy Research Center, Report, Vol. RR-7, Syracuse University Research Corporation, Syracuse, NY.
Weidema, B.P., 2006a. Social impact categories,
indicators, characterisation and damage modelling. Presentation for the 29th Swiss LCA Discussion Forum.
Weidema, B.P., 2006b. The Integration of Economic
and Social Aspects in Life Cycle Impact Assessment. In Curran, M.A., Klöpffer, W. (eds.): Int J Life Cycle Assess 11(Special Issue 1), 89-96.
Weingaertner, C., Moberg, Å., 2011. Exploring
Social Sustainability: Learning from Perspectives on Urban Development and Companies and Products. Sust. Dev. doi: 10.1002/sd.536.

39
Wenzel, H., Hauschild, M., Alting, L., 1997. Environmental assessment of products: Volume 1: Methodology, Tools and Case Studies in Product Development. Hingham: Kluwer Academic. First edition.
Wood, R., Hertwich, E.G., 2012. Economic
modelling and indicators in life cycle sustainability assessment. In Curran, M.A., Klöpffer, W. (eds.): Int J Life Cycle Assess (in press).
World Commission on Environment and
Development (WCED), 1987. Our Common Future. Oxford: WCED, Oxford University Press.
Zbicinski, I., Stavenuiter, J., Kozlowska, B., van de
Coevering, H., 2006. Product Design and Life Cycle Assessment. Uppsala: The Baltic University Press. Book 3 in a series on Environmental Management.
Zhou, Z., Chen, S., Hua, B., 2000. Supply chain
optimization for continuous process industries with sustainability considerations. In Gani, R. (ed.): Computers and Chemical Engineering 24(2), 1151-1158.

40
Annex 1a – Human Rights
Table 19. Articles 1 - 22 of the Declaration of Human Rights (United Nations, 1948)
Article 1. All human beings are born free and equal in dignity and rights.They are endowed with reason and conscience and should act towards one another in a spirit of brotherhood.
Article 2. Everyone is entitled to all the rights and freedoms set forth in this Declaration, without distinction of any kind, such as race, colour, sex, language, religion, political or other opinion, national or social origin, property, birth or other status. Furthermore, no distinction shall be made on the basis of the political, jurisdictional or international status of the country or territory to which a person belongs, whether it be independent, trust, non-self-governing or under any other limitation of sovereignty.
Article 3. Everyone has the right to life, liberty and security of person.
Article 4. No one shall be held in slavery or servitude; slavery and the slave trade shall be prohibited in all their forms.
Article 5. No one shall be subjected to torture or to cruel, inhuman or degrading treatment or punishment.
Article 6. Everyone has the right to recognition everywhere as a person before the law.
Article 7. All are equal before the law and are entitled without any discrimination to equal protection of the law. All are entitled to equal protection against any discrimination in violation of this Declaration and against any incitement to such discrimination.
Article 8. Everyone has the right to an effective remedy by the competent national tribunals for acts violating the fundamental rights granted him by the constitution or by law.
Article 9. No one shall be subjected to arbitrary arrest, detention or exile.
Article 10. Everyone is entitled in full equality to a fair and public hearing by an independent and impartial tribunal, in the determination of his rights and obligations and of any criminal charge against him.
Article 11. (1) Everyone charged with a penal offence has the right to be presumed innocent until proved guilty according to law in a public trial at which he has had all the guarantees necessary for his defence. (2) No one shall be held guilty of any penal offence on account of any act or omission which did not constitute a penal offence, under national or international law, at the time when it was committed. Nor shall a heavier penalty be imposed than the one that was applicable at the time the penal offence was committed.
Article 12. No one shall be subjected to arbitrary interference with his privacy, family, home or correspondence, nor to attacks upon his honour and reputation. Everyone has the right to the protection of the law against such interference or attacks.
Article 13. (1) Everyone has the right to freedom of movement and residence within the borders of each state. (2) Everyone has the right to leave any country, including his own, and to return to his country.
Article 14. (1) Everyone has the right to seek and to enjoy in other countries asylum from persecution. (2) This right may not be invoked in the case of prosecutions genuinely arising from non-political crimes or from acts contrary to the purposes and principles of the United Nations.
Article 15. (1) Everyone has the right to a nationality. (2) No one shall be arbitrarily deprived of his nationality nor denied the right to change his nationality.
Article 16. (1) Men and women of full age, without any limitation due to race, nationality or religion, have the right to marry and to found a family. They are entitled to equal rights as to marriage, during marriage and at its dissolution. (2) Marriage shall be entered into only with the free and full consent of the intending spouses. (3) The family is the natural and fundamental group unit of society and is entitled to protection by society and the State.
Article 17. (1) Everyone has the right to own property alone as well as in association with others. (2) No one shall be arbitrarily deprived of his property.
Article 18. Everyone has the right to freedom of thought, conscience and religion; this right includes freedom to change his religion or belief, and freedom, either alone or in community with others and in public or private, to manifest his religion or belief in teaching, practice, worship and observance.
Article 19. Everyone has the right to freedom of opinion and expression; this right includes freedom to hold opinions without interference and to seek, receive and impart information and ideas through any media and regardless of frontiers.
Article 20. (1) Everyone has the right to freedom of peaceful assembly and association. (2) No one may be compelled to belong to an association.
Article 21. (1) Everyone has the right to take part in the government of his country, directly or through freely chosen representatives. (2) Everyone has the right of equal access to public service in his country. (3) The will of the people shall be the basis of the authority of government; this will shall be expressed in periodic and genuine elections which shall be by universal and equal suffrage and shall be held by secret vote or by equivalent free voting procedures.
Article 22. Everyone, as a member of society, has the right to social security and is entitled to realization, through national effort and international co-operation and in accordance with the organization and resources of each State, of the economic, social and cultural rights indispensable for his dignity and the free development of his personality.
Human Rights

41
Table 20. Articles 23 - 30 of the Declaration of Human Rights (UN, 1948)
Annex 1b - Guiding Principles on Business and Human Rights
Table 21. Articles 11 - 15 of the Guiding Principles on Business and Human Rights (UN, 2011
Article 23. (1) Everyone has the right to work, to free choice of employment, to just and favourable conditions of work and to protection against unemployment.(2) Everyone, without any discrimination, has the right to equal pay for equal work.(3) Everyone who works has the right to just and favourable remuneration ensuring for himself and his family an existence worthy of human dignity, and supplemented, if necessary, by other means of social protection.(4) Everyone has the right to form and to join trade unions for the protection of his interests.
Article 24. Everyone has the right to rest and leisure, including reasonable limitation of working hours and periodic holidays with pay.
Article 25. (1) Everyone has the right to a standard of living adequate for the health and well-being of himself and of his family, including food, clothing, housing and medical care and necessary social services, and the right to security in the event of unemployment, sickness, disability, widowhood, old age or other lack of livelihood in circumstances beyond his control.(2) Motherhood and childhood are entitled to special care and assistance. All children, whether born in or out of wedlock, shall enjoy the same social protection.
Article 26. (1) Everyone has the right to education. Education shall be free, at least in the elementary and fundamental stages. Elementary education shall be compulsory. Technical and professional education shall be made generally available and higher education shall be equally accessible to all on the basis of merit. (2) Education shall be directed to the full development of the human personality and to the strengthening of respect for human rights and fundamental freedoms. It shall promote understanding, tolerance and friendship among all nations, racial or religious groups, and shall further the activities of the United Nations for the maintenance of peace. (3) Parents have a prior right to choose the kind of education that shall be given to their children.
Article 27. (1) Everyone has the right freely to participate in the cultural life of the community, to enjoy the arts and to share in scientific advancement and its benefits.(2) Everyone has the right to the protection of the moral and material interests resulting from any scientific, literary or artistic production of which he is the author.
Article 28. Everyone is entitled to a social and international order in which the rights and freedoms set forth in this Declaration can be fully realized.
Article 29. (1) Everyone has duties to the community in which alone the free and full development of his personality is possible. (2) In the exercise of his rights and freedoms, everyone shall be subject only to such limitations as are determined by law solely for the purpose of securing due recognition and respect for the rights and freedoms of others and of meeting the just requirements of morality, public order and the general welfare in a democratic society. (3) These rights and freedoms may in no case be exercised contrary to the purposes and principles of the United Nations.
Article 30. Nothing in this Declaration may be interpreted as implying for any State, group or person any right to engage in any activity or to perform any act aimed at the destruction of any of the rights and freedoms set forth herein.
Article 11. Business enterprises should respect human rights. This means that they should avoid infringing on the human rights of others and should address adverse human rights impacts with which they are involved.
Article 12. The responsibility of business enterprises to respect human rights refers to internationally recognized human rights – understood, at a minimum, as those expressed in the International Bill of Human Rights and the principles concerning fundamental rights set out in the International Labour Organization’s Declaration on Fundamental Principles and Rights at Work.
Article 13. The responsibility to respect human rights requires that business enterprises:(a) Avoid causing or contributing to adverse human rights impacts through their own activities, and address such impacts when they occur;(b) Seek to prevent or mitigate adverse human rights impacts that are directly linked to their operations, products or services by their business relationships, even if they have not contributed to those impacts.
Article 14. The responsibility of business enterprises to respect human rights applies to all enterprises regardless of their size, sector, operational context, ownership and structure. Nevertheless, the scale and complexity of the means through which enterprises meet that responsibility may vary according to these factors and with the severity of the enterprise’s adverse human rights impacts.
Article 15. In order to meet their responsibility to respect human rights, business enterprises should have in place policies and processes appropriate to their size and circumstances, including:(a) A policy commitment to meet their responsibility to respect human rights;(b) A human rights due diligence process to identify, prevent, mitigate and account for how they address their impacts on human rights;(c) Processes to enable the remediation of any adverse human rights impacts they cause or to which they contribute.
Foundational Principles

42
Table 22. Articles 16 - 24 of the Guiding Principles on Business and Human Rights (UN, 2011)
Article 16. As the basis for embedding their responsibility to respect human rights, business enterprises should express their commitment to meet this responsibility through a statement of policy that:(a) Is approved at the most senior level of the business enterprise;(b) Is informed by relevant internal and/or external expertise;(c) Stipulates the enterprise’s human rights expectations of personnel, business partners and other parties directly linked to its operations, products or services;(d) Is publicly available and communicated internally and externally to all personnel, business partners and other relevant parties;(e) Is reflected in operational policies and procedures necessary to embed it throughout the business enterprise.
Article 17. In order to identify, prevent, mitigate and account for how they address their adverse human rights impacts, business enterprises should carry out human rights due diligence. The process should include assessing actual and potential human rights impacts, integrating and acting upon the findings, tracking responses, and communicating how impacts are addressed. Human rights due diligence:(a) Should cover adverse human rights impacts that the business enterprise may cause or contribute to through its own activities, or which may be directly linked to its operations, products or services by its business relationships;(b) Will vary in complexity with the size of the business enterprise, the risk of severe human rights impacts, and the nature and context of its operations;(c) Should be ongoing, recognizing that the human rights risks may change over time as the business enterprise’s operations and operating context evolve.
Article 18. In order to gauge human rights risks, business enterprises should identify and assess any actual or potential adverse human rights impacts with which they may be involved either through their own activities or as a result of their business relationships. This process should:(a) Draw on internal and/or independent external human rights expertise;(b) Involve meaningful consultation with potentially affected groups and other relevant stakeholders, as appropriate to the size of the business enterprise and the nature and context of the operation.
Article 19. In order to prevent and mitigate adverse human rights impacts, business enterprises should integrate the findings from their impact assessments across relevant internal functions and processes, and take appropriate action.(a) Effective integration requires that:(i) Responsibility for addressing such impacts is assigned to the appropriate level and function within the business enterprise;(ii) Internal decision-making, budget allocations and oversight processes enable effective responses to such impacts.(b) Appropriate action will vary according to:(i) Whether the business enterprise causes or contributes to an adverse impact, or whether it is involved solely because the impact is directly linked to its operations, products or services by a business relationship;(ii) The extent of its leverage in addressing the adverse impact.
Article 20. In order to verify whether adverse human rights impacts are being addressed, business enterprises should track the effectiveness of their response. Tracking should:(a) Be based on appropriate qualitative and quantitative indicators;(b) Draw on feedback from both internal and external sources, including affected stakeholders.
Article 21. In order to account for how they address their human rights impacts, business enterprises should be prepared to communicate this externally, particularly when concerns are raised by or on behalf of affected stakeholders. Business enterprises whose operations or operating contexts pose risks of severe human rights impacts should reportformally on how they address them. In all instances, communications should:(a) Be of a form and frequency that reflect an enterprise’s human rights impacts and that are accessible to its intended audiences;(b) Provide information that is sufficient to evaluate the adequacy of an enterprise’s response to the particular human rights impactinvolved;(c) In turn not pose risks to affected stakeholders, personnel or to legitimate requirements of commercial confidentiality.
Article 22. Where business enterprises identify that they have caused or contributed to adverse impacts, they should provide for or cooperate in their remediation through legitimate processes.
Article 23. In all contexts, business enterprises should:(a) Comply with all applicable laws and respect internationally recognized human rights, wherever they operate;(b) Seek ways to honour the principles of internationally recognized human rights when faced with conflicting requirements;(c) Treat the risk of causing or contributing to gross human rights abuses as a legal compliance issue wherever they operate.
Article 24. Where it is necessary to prioritize actions to address actual and potential adverse human rights impacts, business enterprises should first seek to prevent and mitigate those that are most severe or where delayed response would make them irremediable.
Operational Principles

43
Annex 2 – Relevant GRI performance indicators
Table 23. Relevant GRI performance indicators for the study – part I (Global Reporting Initiative, 2011)
Area Aspect IndicatorEconomic Economic
PerformanceEC 1 Core Direct economic value generated and distributed, including revenues, operating
costs, employee compensation, donations and other community investments, retained earnings, and payments to capital providers and governments.
Economic Market Presence EC 5 Add Range of ratios of standard entry level wage compared to local minimum wage at significant locations of operation
Economic Market Presence EC 6 Core Policy, practices, and proportion of spending on locally-based suppliers at significant locations of operation.
Economic Market Presence EC 7 Core Procedures for local hiring and proportion of senior management hired from the local community at locations of significant operation.
Economic Indirect Economic Impacts
EC 8 Core Development and impact of infrastructure investments and services provided primarily for public benefit through commercial, inkind, or pro bono engagement
Economic Indirect Economic Impacts
EC 9 Add Understanding and describing significant indirect economic impacts, including the extent of impacts.
Social Labor Practices and Decent Work
LA 1 Core Total workforce by employment type, employment contract, and region, broken down by gender
Social Labor Practices and Decent Work
LA 2 Core Total number and rate of employee turnover by age group, gender, and region
Social Labor Practices and Decent Work
LA 3 Add Benefits provided to full-time employees that are not provided to temporary or part-time employees, by major operations.
Social Labor Practices and Decent Work
LA 4 Core Percentage of employees covered by collective bargaining agreements
Social Labor Practices and Decent Work
LA 5 Core Minimum notice period(s) regarding operational changes, including whether it is specified in collective agreements
Social Labor Practices and Decent Work
LA 6 Add Percentage of total workforce represented in formal joint management–worker health and safety committees that help monitor and advise on occupational health and safety programs.
Social Labor Practices and Decent Work
LA 7 Core Rates of injury, occupational diseases, lost days, and absenteeism, and number of workrelated fatalities by region.
Social Labor Practices and Decent Work
LA 8 Core Education, training, counseling, prevention, and risk-control programs in place to assist workforce members, their families, or community members regarding serious diseases
Social Labor Practices and Decent Work
LA 9 Add Health and safety topics covered in formal agreements with trade unions.
Social Labor Practices and Decent Work
LA 10 Core Average hours of training per year per employee by employee category.
Social Labor Practices and Decent Work
LA 11 Add Programs for skills management and lifelong learning that support the continued employability of employees and assist them in managing career endings.
Social Labor Practices and Decent Work
LA 12 Add 2 Percentage of employees receiving regular performance and career development reviews
Social Labor Practices and Decent Work
LA 13 Core Composition of governance bodies and breakdown of employees per category according to gender, age group, minority group membership, and other indicators of diversity.
Social Labor Practices and Decent Work
LA 14 Core Ratio of basic salary of men to women by employee category.
Social Labor Practices and Decent Work
LA 15 Core Return to work and retention rates after parental leave, by gender
Type

44
Table 24. Relevant GRI performance indicators for the study – part II (Global Reporting Initiative, 2011)
Social Human Rights HR 1 Core Percentage and total number of significant investment agreements and contracts that include clauses incorporating human rights concerns, or that have undergone human rights screening
Social Human Rights HR 2 Core Percentage of significant suppliers,contractors, and other business partners that have undergone human rights screening, and actions taken.
Social Human Rights HR 3 Core Total hours of employee training on policies and procedures concerning aspects of human rights that are relevant to operations, including the percentage of employees rained.
Social Human Rights HR 4 Core Total number of incidents of discrimination and corrective actions taken.
Social Human Rights HR 5 Core Operations and significant suppliers identified in which the right to exercise freedom of association and collective bargaining may be violated or at significant risk, and actions taken to support these rights
Social Human Rights HR 6 Core Operations and significant suppliers identified as having significant risk for incidents of child labor, and measures taken to contribute to the effective abolition of child labor
Social Human Rights HR 7 Core Operations and significant suppliers identified as having significant risk for incidents of forced or compulsory labor, and measures to contribute to the elimination of all forms of forced or compulsory labor.
Social Human Rights HR 8 Add Percentage of security personnel trained in the organization’s policies or procedures concerning aspects of human rights that are relevant to operations.
Social Human Rights HR 9 Add Total number of incidents of violations involving rights of indigenous people and actions taken.
Social Human Rights HR 10 Core Percentage and total number of operations that have been subject to human rights reviews and/or impact assessments.
Social Human Rights HR 11 Core Number of grievances related to human rights filed, addressed and resolved through formal grievance mechanisms.
Social Society SO 1 Core Percentage of operations with implemented local community engagement, impact assessments, and development programs.
Social Society SO 2 Core Percentage and total number of business units analyzed for risks related to corruption
Social Society SO 3 Core Percentage of employees trained in organization’s anti-corruption policies and procedures.
Social Society SO 4 Core Actions taken in response to incidents of corruptionSocial Society SO 5 Core Public policy positions and participation in public policy development and lobbying
Social Society SO 6 Add Total value of financial and in-kind contributions to political parties, politicians, and related institutions by country
Social Society SO 7 Add Total number of legal actions for anticompetitive behavior, anti-trust, and monopoly practices and their outcomes
Social Society SO 8 Core Monetary value of significant fines and total number of non-monetary sanctions for noncompliance with laws and regulations.
Social Society SO 9 Core Operations with significant potential or actual negative impacts on local communities.
Social Society SO 10 Core Prevention and mitigation measures implemented in operations with significant potential or actual negative impacts on local communities.

45
Annex 3 – Data quality for different processes in the life cycle
Table 25. Requirements for data quality of different processes in the life cycle according to the International EPD system
Type of data Process
Specific data production of main fuelsdistances for the transportation within the fuel production chain and to the energy conversion plant and type of vehicles
Selected generic data production of fuels bought on the spot market
transportation services (fuel use and emissions in conjunction with transportation)resource use and emissions in conjunction with electricity used in suppliers’ processesnational or regional mixes for electricity generationresource use and emissions in conjunction with production of auxiliary materials and chemicals used in suppliers’ processesresource use and emissions in conjunction with treatment of operational waste from suppliers’ processessuppliers’ infrastructure
Specific data operation of energy conversion plant (system of energy conversion plants)amounts of fuel and other auxiliary operational inputsfuel preparation processes at energy conversion site e.g. drying and grindingmaintenance activities e.g. inspection trips, lubricationoperation (also test operation) of reserve power and reserve heatdistances for the transportation of fuel related waste and type of vehicleshandling/treatment/storage of fuel related wasteamounts and type of treatment of other waste
Specific data material composition of energy conversion plantmaterial composition of fuel preparation equipment /e.g. mill, dryer) and storagesmaterial composition of facilities for handling of fuel-related wastereinvestment rates
Selected generic data manufacture of construction materials and chemicals
transportation distancestransportation services (fuel use and emissions in conjunction with transportation)construction servicesdismantling serviceswaste treatment processesnational or regional mixes for electricity generationresource use and emissions in conjunction with electricity and fuels used during the construction/reinvestment/dismantling processes
Specific data distribution losses in steam and hot water distribution systemstypical transmission and distribution losses in the power networks used for delivery of electricity to different customers, defined with respect to connection voltages
Generic data average national transmission and distribution losses in the power networks representative for the delivery of electricity to a customer, defined with respect to connection voltageoperation and maintenance of the distribution systemstransportation
Generic data material composition of distribution systemreinvestment rates normally appliedmanufacture of construction materials and chemicalstransportation distancestransportation services (fuel use and emissions in conjunction with transportation)construction servicesdismantling serviceswaste treatment processesnational or regional mixes for electricity generationresource use and emissions in conjunction with electricity used during the construction/reinvestment/dismantling processes
Upstream - fuel production
Core module
Core infrastructure
Downstream processes
Downstream infrastructure

46
Annex 4 – Mandatory information for an EPD
Table 26. Mandatory information for an EPD (Schmincke et al., 2011, p.38)
Annex 5a – Code of Conduct
Table 27. Vattenfall's Code of Conduct
Annex 5b – Code of Conduct for Suppliers
Table 28. Vattenfall's Code of Conduct for Suppliers
Module InformationUpstream main upstream flows
main fuel suppliersfuel suppliers' regional locationfuel suppliers' type of processes
Core energy conversion technologytechnical characterisation (with reference to base load, peak load, etc.)installation yeartechnical specification (incl. installed capacity, input fuel, annual generation during defined reference period, conversion efficiency, full load hours, technical sevice lifemain suppliers
Downstream design of the transmission & distribution systemtechnical service lifetransmission and distribution losses for electricity at different voltages and in different regions
Category Principle InformationHealth and Safety 1 "We operate our plants and facilities safely in order to protect the health of our employees as well as the
general public” (Vattenfall AB, 2013b, p.20)People 2 "We empower our employees to develop to their full potential with equal opportunities for all" (Vattenfall
AB, 2013b, p.20)Customers and Suppliers
3 "We take responsibility along the whole value chain with regard to setting standards for suppliers, taking into account customer needs and fair competition" (Vattenfall AB, 2013b, p.20)
Business Ethics 4 "We comply with all laws and regulations that apply to our work, have a zero tolerance policy against bribes and avoid conflicts of interest" (Vattenfall AB, 2013b, p.20)
Communication 5 "We should at all times take action when it comes to potential reputational impact, to co-ordinate messages so that the communication is coherent and correct. Whenever we communicate – as an employee or as a private person – we are aware of the effect our words or behaviour may have on the reputation of Vattenfall” (Vattenfall AB, 2013b, p.20)
Information Security 6 "We are aware that information is an important asset for Vattenfall. We secure essential and sensitive information, to ensure its integrity, availability and confidentiality” (Vattenfall AB, 2013b, p.20)
Company Resources 7 "We take into consideration sustainability and cost effectiveness whenever we use company resources" (Vattenfall AB, 2013b, p.20)
Environment 8 "We consider our impact on people, the environment and society when choosing between alternative solutions. We use all resources efficiently and minimise impacts wherever possible" (Vattenfall AB, 2013b, p.20)
Category Principle InformationHuman rights 1 "Businesses should support and respect the protection of internationally proclaimed human rights”
(Vattenfall AB, n.d., p.3)2 "Businesses should make sure they are not complicit in human rights abuses" (Vattenfall AB, n.d., p.3)
Labour standards 3 "Businesses should uphold the freedom of association and the effective recognition of the right to collective bargaining" (Vattenfall AB, n.d., p.3)
4 "Businesses should uphold the elimination of all forms of forced and compulsory labour" (Vattenfall AB, n.d., p.3)
5 "Businesses should uphold the effective abolition of child labour” (Vattenfall AB, n.d., p.3)6 "Businesses should uphold the elimination of discrimination in respect of employment and occupation”
(Vattenfall AB, n.d., p.3)Environment 7 "Businesses should support a precautionary approach to environmental" (Vattenfall AB, n.d., p.4)
8 "Businesses should undertake initiatives to promote greater environmental" (Vattenfall AB, n.d., p.4)9 "Businesses should encourage the development and diffusion of environmentally friendly technologies"
(Vattenfall AB, n.d., p.4)Bribery & corruption 10 "Businesses should work against corruption in all its forms, including extortion and bribery" (Vattenfall
AB, n.d., p.4)

47
Annex 6 – Definition of subcategories
Table 29. Definition of subcategories - part I
Stakeholder Category Subcategory Definition
Worker Freedom of association and collective bargaining
"All workers and employers have the right to establish and to join organizations of their choice, without prior authorization, to promote and defend their respective interests, and to negotiate collectively with other parties. They should be able to do this freely, without interference by other parties or the state, and should not be discriminated as a result of union membership. Freedom of association is a fundamental human right and, together with collective bargaining, a core dimension of the International Labor Organization‟s work. The freedom to associate involves employers, unions and workers representatives freely discussing issues in order to reach agreements that are jointly acceptable. The right to organize includes the right of workers to strike, the rights of organizations to draw up their constitutions and rules, to elect their representatives in full freedom, to organize their activity freely and to formulate their programmes. Freedom of association, the Right to Organize and Collective Bargaining are assessed and monitored via this subcategory." (UNEP-SETAC Life Cycle Initiative - Social LCA Project Group, 2010f, p.1)
Child labour "The term “child labour” is often defined as work that deprives children of their childhood, their potential and their dignity, and that is harmful to physical and mental development. It refers to work that: is mentally, physically, socially or morally dangerous and harmful to children; and interferes with their schooling by: depriving them of the opportunity to attend school; obliging them to leave school prematurely; or requiring them to attempt to combine school attendance with excessively long and heavy work. In its most extreme forms, child labour involves children being enslaved, separated from their families, exposed to serious hazards and illnesses and/or left to fend for themselves on the streets of large cities – often at a very early age. Child labour are child working while being below: the national minimum age for employment; or the age of completion of compulsory education; or any otherwise specified exceptions; any person under the age of 15, whichever is higher. If however, local minimum age law is set at 14 years of age in accordance with developing country exceptions under ILO Convention 138, this lower age may apply. The assessment aims to verify if the organization might or is employing children (as defined in the ILO conventions). It will be looked upon if the conditions are favourable for the occurrence of child labour, if prevention measures are being taken and if schooling, childcare or parental cares for early childhood are being provided and if adequate transitional economic assistance and appropriate educational opportunities are being provided to any former child employees." (UNEP-SETAC Life Cycle Initiative - Social LCA Project Group, 2010f, p.8)
Fair salary "Fair wages means a wage fairly and reasonably commensurate with the value of a particular service or class of service rendered, and, in establishing a minimum fair wage for such service or class of service. Codes of conduct which deal with wages and benefits have focused on three standards when assessing level of wages:the minimum wage required by law; the local "prevailing industry wage"; a "living wage" also sometimes designated as a “floor wage” or “non-poverty wage”.This subcategory aims to assess whether practices concerning wages are in compliance with established standards and if the wage provided is meeting legal requirements, whether it is above, meeting or below industry average and whether it can be considered as a living wage." (UNEP-SETAC Life Cycle Initiative - Social LCA Project Group, 2010f, p.15)
Working hours
"The hours of work comply with applicable laws and industry standards. Workers are not on a regular basis required to work in excess of 48 hours per week and have at least one day off for every 7-day period. Overtime is voluntary, does not exceed 12 hours per week, is not demanded on a regular basis and is compensated at a premium rate. The needs and expectations of the workers are taken into account in the organisation of working hours. There are also higher restrictions if the hours of work are made during the night. Hours of work are also in function of different time arrangement (from part time to full time) and work places (eg.from home workers to field workers and manufacture)." (UNEP-SETAC Life Cycle Initiative - Social LCA Project Group, 2010f, p.22)
Forced labour "Forced or compulsory labour is any work or service that is exacted from any person under the menace of any penalty, and for which that person has not offered himself or herself voluntarily. Providing wages or other compensation to a worker does not necessarily indicate that the labour is not forced or compulsory. By right, labour should be freely given and workers should be free to leave in accordance with established rules. The assessment aims to verify that there is no use of forced or compulsory labour.". (UNEP-SETAC Life Cycle Initiative - Social LCA Project Group, 2010f, p.27)

48
Table 30. Definition of subcategories - part II
Equal opportunities/discrimination
"Everybody deserves a "fair chance". It doesn't matter what sex, race or age you are, if you have a disability, your marital status, whether you are pregnant, your family status or your family responsibilities, the religious or political beliefs you might hold and your sexual orientation. Everybody has the right to be treated fairly and access to equal opportunities. The subcategory aims to assess equal opportunity management practices and the presence of discrimination in the opportunities offer to the workers by the organizations and in the working conditions." (UNEP-SETAC Life Cycle Initiative - Social LCA Project Group, 2010f, p.34)
Health and safety
"Since 1950, the International Labour Organization (ILO) and the World Health Organization (WHO) have shared a common definition of occupational health. The definition reads: "Occupational health should aim at: the promotion and maintenance of the highest degree of physical, mental and social well-being of workers in all occupations; the prevention amongst workers of departures from health caused by their working conditions; the protection of workers in their employment from risks resulting from factors adverse to health; the placing and maintenance of the worker in an occupational environment adapted to his physiological and psychological capabilities; and, to summarize, the adaptation of work to man and of each man to his job." All workers have the right to a safe and healthy workplace. Another possible definition of safe workplace, provided by the OSHA, is a workplace that is free of serious recognized hazards and in compliance with OSHA standards. Where the workplace term covers all places where workers need to be or to go by reason of their work and which are under the direct or indirect control of the employer; The term health, in relation to work, indicates not merely the absence of disease or infirmity; it also includes the physical and mental elements affecting health, which are directly related to safety and hygiene at work. This subcategory assesses both the rate of incidents and the status of prevention measure and management practices." (UNEP-SETAC Life Cycle Initiative - Social LCA Project Group, 2010f, p.41)
Social benefits/social security
"Social benefits refer to non-monetary employment compensation. Four basic categories of Social Security benefits are often included and are paid based upon the record of worker‟s earnings: retirement, disability, dependents, and survivors benefits. Other social benefits that may be provided include: Medical insurance, Dental insurance, Paramedical insurance including preventive medicine, Medicine insurance, Wage insurance, Paid maternity and paternity leave (parental leave), Paid sick leave, Education and training, Social benefits are typically offered to full-time workers but may not be provided to other class of workers (eg., part-time, home workers, contractual) Countries have different laws and policies regarding social security and social benefits and that entails that some benefits may already be taken care for by the national government. For example, some countries have a public medical system accessible by all citizen while other countries have a private medical system calling for citizen/worker to be covered by a medical insurance. This subcategory assesses whether an organization provides for social benefits and social security of workers and to what extent." (UNEP-SETAC Life Cycle Initiative - Social LCA Project Group, 2010f, p.48)
Consumer Health and safety
"This subcategory addresses the consumers’ rights to be protected against products and services that may be hazardous to health or life (ISO 26000, 2008). It helps to identify the existence and scope of systematic efforts to address health and safety across the organizations involved in the life cycle of a product and/or service. Customers (end users) expect products and services to perform their intended functions satisfactorily and not pose a risk to their health and safety." (UNEP-SETAC Life Cycle Initiative - Social LCA Project Group, 2010b, p.1)
Feedback mechanism
"This subcategory assesses if the management measures are sufficient to ensure that important consumer feedback is being communicated to the end producer/ brand. Feedback mechanisms are tightly related to the consumer satisfaction related to the consumption and use of the product or service. Consumer satisfaction is indirectly assessed by evaluating the mechanisms provided by the enterprise to achieve this goal. Management measures refer to mechanisms such as: surveys, return policies, quality assurance, guarantees, warranties, etc. In addition, management practices that deal with feedback from the customer to ensure customer satisfaction will be assessed. This includes the responsiveness of the enterprise regarding feedback from the customer." (UNEP-SETAC Life Cycle Initiative - Social LCA Project Group, 2010b, p.6)
Consumer privacy
"This subcategory examines whether organizational management systems work to respect and protect consumer privacy. This includes protecting the confidentiality of consumer data, limiting personal information gathered, restricting use of data to its original or agreed-upon purposes and protecting data from external theft and/or misuse. Organizations may provide products or services that -- through their use -- aid invasions of privacy (e.g. computing and communication technologies). In cases where organizations share personal information, procedures should exist for individuals to dispute, remove or correct inaccurate information." (UNEP-SETAC Life Cycle Initiative - Social LCA Project Group, 2010b, p.10)

49
Table 31. Definition of subcategories - part III
Transparency "This subcategory assess if the organization communicates on all issues regarding its product and social responsibility in a transparent way. The organization´s communication shall enable an informed choice for the consumer without intent to mislead or conceal. There are certification standards, labels, and special indices that may be used to provide information about the performance regarding social responsibility. These approaches reduce the information content and simplify the communication between organization and consumer. Other strategies may also be used to communicate with consumers." (UNEP-SETAC Life Cycle Initiative - Social LCA Project Group, 2010b, p.15)
End of life responsibility
"This subcategory examines management efforts to address the social impacts of product or service end-of-life. In a product life cycle, end-of-life refers to product disposal, reuse or recycling. In an environmental context, this concept is commonly referred to as Extended Producer Responsibility. Product disposal can lead to significant environmental and social concerns, such as environmental and public health impacts that stem from the accumulation of hazardous material in electronic waste. When countries transport waste to less developed countries, it is common for the poor to sift through landfills in search of waste with economic value. Organizations should provide accurate, complete and clear information to consumers regarding appropriate end-of-life options. In some cases, producers should buy back and recycle or safely dispose of waste." (UNEP-SETAC Life Cycle Initiative - Social LCA Project Group, 2010b, p.20)
Local community
Access to material resources
"This subcategory assesses the extent to which organizations respect, work to protect, to provide or to improve community access to local material resources (i.e. water, land, mineral and biological resources) and infrastructure (i.e. roads, sanitation facilities, schools, etc.). Communities and organizations may share the use of material resources (natural and man-made) and have a mutual interest in protecting and enhancing the quantity and quality of local resources and infrastructure. Expanding operations carry the potential for conflict over natural material resources (e.g. water, forest land, home lands), especially in emerging or unstable countries. Organizations should conduct risk assessments with attention to potential conflict over material resources and engage with the local community over sustainable methods for sharing resources. Organizations should institute risk management plans for preventing, mitigating and controlling environmental damage. This includes management attention to the sustainable use of natural resources, pollution prevention and waste recycling. Environment Management Systems are certifiable systems that help organizations improve material resource conservation. Similarly, Social and Environmental Impact Assessments are encouraged for business operations that are likely to have significant adverse impacts on material resources. Organizations and communities may also benefit from improving the quality of local infrastructure. Assessment should consider the extent to which project-related infrastructure, such as roadways and waste disposal systems, have positive long-term effects on local economic development." (UNEP-SETAC Life Cycle Initiative - Social LCA Project Group, 2010c, p.41)
Access to immaterial resources
"This subcategory assesses the extent to which organizations respect, work to protect, to provide or to improve community access to immaterial resources. Immaterial resources include community services, intellectual property rights, freedom of expression and access to information. Organizations may build community relations and improve access to immaterial resources by promoting community services, such as health care, education and lending programs. Organizations also build access to immaterial resources by sharing information and knowledge and transferring technology and skills to the community. With regard to intellectual property, organizations should respect and safeguard the moral and economic rights of the creators of intellectual property. Organizations limit access to immaterial resources by restricting freedom of expression among employees or community members. (This does not include actions that prevent employees from sharing confidential commercial information.) Organizations may be complicit in suppressing local opinion if community members are arrested for protesting corruption within the organization. Similarly, organizations may be complicit in limiting freedom of expression if journalists are arrested for reporting on organization corruption." (UNEP-SETAC Life Cycle Initiative - Social LCA Project Group, 2010c, p.34)

50
Table 32. Definition of subcategories - part IV
Delocalization and migration
"This subcategory assesses whether organizations contribute to delocalization, migration or “involuntary resettlement” within communities. This may occur if organizations directly or indirectly dispossess individuals or groups of individuals of their land or resources. This also may occur if economic development leads to the large-scale migration of individuals seeking employment. If operations require human relocation, organizations should engage in due diligence and procedural safeguards. These safeguards include comprehensive impact assessments, prior consultation and notification, provision of legal remedies, fair and just compensation and adequate relocation (UN Global Compact, Access to Adequate Housing). Resettlement is considered involuntary when groups are not offered the right to refuse acquisition that leads to displacement. Involuntary resettlement may occur even when the dispossessed do not have legal claim to the land or resources. In the case of migrant workers entering a community, the organization should consider how well workers will integrate with more permanent residents. Organizations should provide opportunities for communication and education between migrant workers and permanent residents to minimize risks, such as violence and prostitution." (UNEP-SETAC Life Cycle Initiative - Social LCA Project Group, 2010c, p.1)
Cultural heritage
"This subcategory assesses whether an organization respects local cultural heritage and recognizes that all community members have a right to pursue their cultural development. Cultural heritage includes language, social and religious practices, knowledge and traditional craftsmanship, as well as cultural spaces and objects (e.g. burial grounds). International human rights conventions secure the rights of individuals to preserve their cultural heritage. This includes practicing and revitalizing cultural traditions and religious beliefs that are respectful of human rights. Organizations can more actively promote the preservation of cultural heritage by encouraging the sustainable use of traditional products and craftsmanship in their product design and production methods. This is especially relevant to agricultural production methods and clothing/craft design." (UNEP-SETAC Life Cycle Initiative - Social LCA Project Group, 2010c, p.14)
Safe and healthy living conditions
"This subcategory assesses how organizations impact community safety and health. This includes the general safety conditions of operations and their public health impacts. With regard to general safety, operations can impact community safety through equipment accidents or structural failures. Project-related land use changes can also lead to natural disasters, such as landslides. Disease may spread as a result of business-related land use changes, for example when poor water drainage contributes to the spread of malaria. Influx of workers can also encourage the spread of communicable disease. The generation and/or use of hazardous material and pollution emissions may also lead to adverse health impacts. Organizations should institute environmental risk management systems for preventing, mitigating and controlling health damage from their operations. Finally, organizations may contribute to the health of local communities, for example by shared access to employee health services. Organizations should also communicate potential health and safety impacts of their operations to surrounding communities. Organizations culpable for negative health effects should engage in remediation or compensation efforts." (UNEP-SETAC Life Cycle Initiative - Social LCA Project Group, 2010c, p.49)
Respect of indigenous rights
"This subcategory assesses organizational respect for the rights of indigenous peoples, as a group or as individuals. These rights relate to all human rights and fundamental freedoms as recognized in the Charter of the United Nations, the Universal Declaration of Human Rights and other national and international human rights laws. Indigenous peoples have “a historical continuity with pre-invasion and pre-colonial societies that developed on their territories and consider themselves distinct from other sectors of the societies now prevailing in those territories, or parts of them” (UN Global Compact, Indigenous Peoples). Respect of indigenous rights includes the right to lands, resources, cultural integrity, self-determination and self-government. Historically, states have denied many indigenous populations these rights. Organizations should engage with indigenous peoples to obtain consent for actions that may affect their rights. Through these interactions, organizations have important opportunities to learn from the traditional knowledge of indigenous peoples. Organizations should take care not to restrict the movement of indigenous peoples when operating on or around their land. Organizations should also safeguard indigenous lands by minimizing pollution and environmental degradation. Finally, organizations must ensure that employment policies do not discriminate against indigenous individuals seeking employment or working for the organization." (UNEP-SETAC Life Cycle Initiative - Social LCA Project Group, 2010c, p.21)

51
Table 33. Definition of subcategories - part V
Community engagement
"This subcategory assesses whether an organization includes community stakeholders in relevant decision-making processes. It also considers the extent to which the organization engages with the community, in general. Community stakeholders include individuals or community groups that may be affected by the actions or products of an organization. Organizations should consider these stakeholders in the development and implementation of business policies, particularly those that affect local environment, health and well-being. An organization should attempt to engage with a broad range of stakeholders that represent balanced community interests. Community engagement should provide community members and leaders with a venue to voice concerns. Organizations should respond to these concerns with a strategic plan of action. Representatives at all levels of the organization should engage in this continuous process. Organizations also foster community engagement through direct involvement in community initiatives and/or through financial support of community projects (e.g. Earth Day activities, recycling initiatives and visits to local schools)." (UNEP-SETAC Life Cycle Initiative - Social LCA Project Group, 2010c, p.7)
Local employment
"This subcategory assesses the role of an organization in directly or indirectly affecting local employment. Local hiring preferences provide important income and training opportunities to community members. Organizations that develop relationships with locally-based suppliers will further encourage local employment and development. Organizations also may encourage local community development by training local employees in technical and transferable skills. Organizations can have a particularly strong effect on local community development when they hire local employees for senior management positions. This is likely to encourage open communication and trust with the community." (UNEP-SETAC Life Cycle Initiative - Social LCA Project Group, 2010c, p.28)
Secure living conditions
"This subcategory assesses how organizations impact the security of local communities with respect to the conduct of private security personnel and how the organization interacts with state-led forces. Organizations with weak security oversight may contribute to insecure living conditions, community tensions and regional conflicts. At the same time, organizations that enter relatively insecure regions may improve living conditions through responsible actions of private security personnel. While states have the primary responsibility to protect human rights, organizations are also obligated to respect and protect these rights. Organizations may employ security forces to protect their employees and assets. This security should extend to the protection of human rights in surrounding communities. In some countries, state-led forces, such as police and military personnel, have a history of committing human rights violations. In many cases, organizations have been complicit in these abuses (UN Global Compact, Security Forces & Human Rights). It is necessary therefore to investigate whether an organization has benefited in any form from human rights violations. In addition, inaction in the face of human rights abuses is a form of silent complicity. Organizations should train and monitor security personnel on international law enforcement principles such as the UN Code of Conduct for Law Enforcement Principles and the UN Basic Principles on the Use of Force and Firearms by Law Enforcement Officials. Organizations also should engage with host governments and communities with respect to best security practices." (UNEP-SETAC Life Cycle Initiative - Social LCA Project Group, 2010c, p.56)
Society Public commitments to sustainability issues
"A public commitment is a promise or agreement made by an organization, or a group of organizations, to its customers, employees, shareholders, local community or the general public whose fulfilment can be evidenced in a transparent and open way. The promise or agreement is disseminated through the organization's website, promotional materials or other means. These commitments relate to the contribution of an organization, or a group of organizations to the sustainable development of the community or society as impacts from the activities along one stage or more of the life cycle of a product or service system." (UNEP-SETAC Life Cycle Initiative - Social LCA Project Group, 2010d, p.1)
Contribution to economic development
"This subcategory assesses to what extent the organisation/product or service contributes to the economic development of the country. Organizations can foster economic development in many ways. They generate revenue, create jobs, provide education and training, make investments, or forward research." (UNEP-SETAC Life Cycle Initiative - Social LCA Project Group, 2010d, p.14)
Prevention and mitigation of armed conflicts
"This subcategory assesses the organization´s role in armed conflicts or situations that might in the future develop into armed conflicts. Thereby both, positive and negative impacts on conflict developments are taken into account. Armed conflicts can be defined as a tense situation in which at least one of the parties uses violent force in sporadic incidents at the minimum. There are special regions in the world that are known for enduring disturbances – so-called conflict zones. This subcategory shall also consider if the organization acts in conflict zones." (UNEP-SETAC Life Cycle Initiative - Social LCA Project Group, 2010d, p.7)

52
Table 34. Definition of subcategories - part VI
Technology development
"This subcategory assesses whether the organization participates in joint research and development for efficient and environmental sound technologies. The development and transfer of technology is an umbrella concept in which the different key elements (technology needs, technology information, enabling environments, capacity-building, financial and institutional mechanisms) are playing an important role. Technology transfer is the process of using technology, expertise, know-how or facilities for a purpose not originally intended by the developing organization. It is also defined as a process for converting research into economic development. Technology transfer may implies that a technology developed for one sector is then used in a totally different area. Transferring such technologies and know-how relies heavily on personal networking. Technology transfer between more advanced economies and developing economies is key for the improvement of social conditions and to prevent further environmental damage related to old technology use and it is formally part of many international instruments (eg. UNFCCC, Agenda 21)." (UNEP-SETAC Life Cycle Initiative - Social LCA Project Group, 2010d, p.26)
Corruption "This subcategory assesses whether an organization has implemented appropriate measures to prevent corruption and if there is evidence that it has engaged or has been engaged in corruption. Corruption is the misuse of power for personal advantages. There are different types of corruption, including bribery, embezzlement, theft and fraud, extortion, abuse of discretion, favoritism, nepotism and clientelism, conduct creating or exploiting interests, and improper political contributions." (UNEP-SETAC Life Cycle Initiative - Social LCA Project Group, 2010d, p.19)
Value chain actors (not including consumers)
Fair competition
"This subcategory assesses if the organization’s competitive activities are conducted in a fair way and in compliance with legislations preventing anti-competitive behavior, anti-trust, or monopoly practices. Anti-competitive behavior: Actions of the reporting organization and/or employees that may result in collusion with potential competitors to fix prices, coordinate bids, create market or output restrictions, impose geographic quotas, or allocate customers, suppliers, geographic areas, and product lines with the purpose of limiting the effects of market competition. Some examples are: price fixing, where parties collude to sell the same product or service at the same price; bid rigging, where parties collude to manipulate a competitive bid; and predatory pricing, which is selling a product at very low price with the intent of driving competitors out of the market. Anti-trust and monopoly practices: Actions of the reporting organization that may result in collusion to erect barriers to entry to the sector, unfair business practices, abuse of market position, cartels, anti-competitive mergers, price-fixing, and other collusive actions which prevent competition." (UNEP-SETAC Life Cycle Initiative - Social LCA Project Group, 2010e, p.1)
Promoting social responsibility
"This subcategory seeks to assess whether the enterprise promotes social responsibility among its suppliers and through its own actions. This measure considers whether the enterprise manages its suppliers in a socially responsible way, including monitoring, auditing and training efforts. This subcategory also examines whether enterprises take corrective action towards suppliers when warranted. As a starting point, an enterprise should consider human rights records when selecting suppliers. With existing suppliers, an enterprise may develop a supplier code of conduct or a contractual agreement that covers social and environmental responsibilities. Other actions towards suppliers, such as tight purchasing deadlines and low pricing policies, may discourage opportunities for social responsibility. Enterprises also can promote social responsibility by encouraging suppliers to join foundations and initiatives with a related focus. Promoting the use of social responsibility certifications and/or product labels is another positive indicator." (UNEP-SETAC Life Cycle Initiative - Social LCA Project Group, 2010e, p.17)
Supplier relationships
"Supplier relationships are defined as affiliations with organizations that supply another organization with goods and services. The supplier relationships also concern all mutual activities, co-operations, agreements that regulate the exchanges, trade and relation among organizations, bearing in mind that every organization in the value chain is responsible for complying with applicable laws and regulations. Organization’s suppliers can be any business or individual, including subcontractors, agents, manufacturers, distributors and consultants that provide goods and services. Procurement practices have strong effect in the supply chains, driving behaviors. An organization should consider the potential impacts or unintended consequences of its procurement and purchasing decisions on other organizations, and take due care to avoid or minimize any negative impact (ISO 26000)." (UNEP-SETAC Life Cycle Initiative - Social LCA Project Group, 2010e, p.13)
Respect of intellectual property rights
"This subcategory assesses whether organization´s actions safeguard and value the creators and other producers of intellectual goods and services. The legal rights dealing with the intellectual property entail intellectual activities in the industrial, scientific, literary, and artistic fields." (UNEP-SETAC Life Cycle Initiative - Social LCA Project Group, 2010e, p.7)

53
Annex 7a – Survey for the evaluation of the indicators
Fig. 9. Survey for the evaluation of the indicators – part I

54
Fig. 10. Survey for the evaluation of the indicators – part II
The survey can be accessed under the following web address: https://docs.google.com/forms/d/1DAXaXGg4Gk6uZ0SX6zdlbWOpAtfWXuZO5ISO_89dA-I/viewform
Annex 7b – Results of the survey
Table 35. Results of the survey for the indicators 1 - 15
Table 36. Results of the survey for the indicators 16 - 30
Expert Time 1. 2. 3. 4. 5. 6. 7. 8. 9. 10. 11. 12. 13. 14. 15.1 23.04.2013 16:11 4 3 3 5 4 3 3 3 2 2 2 4 2 5 42 23.04.2013 16:29 5 4 5 5 4 3 4 4 5 3 3 5 33 24.04.2013 10:03 4 3 3 5 5 3 3 3 2 4 4 4 4 5 44 29.04.2013 11:38 5 2 2 3 4 3 3 2 2 4 3 5 2 5 45 03.05.2013 09:44 2 4 4 4 4 5 5 3 3 5 3 4 3 5 4
Expert Time 16. 17. 18. 19. 20. 21. 22. 23. 24. 25. 26. 27. 28. 29. 30.1 23.04.2013 16:11 4 4 4 5 3 5 4 4 3 3 3 3 2 4 32 23.04.2013 16:29 4 3 3 4 3 4 4 3 2 2 3 2 2 3 33 24.04.2013 10:03 5 4 4 5 3 5 5 5 3 3 4 3 4 4 54 29.04.2013 11:38 5 5 4 5 2 4 5 4 3 2 4 2 2 3 45 03.05.2013 09:44 4 5 5 5 4 5 5 5 4 5 4 4 4 4 3

55
Annex 8 – Socioprofile
Table 37. Socioprofile - part I (Stakeholder category: local community, society, value chain actors)
Socioprofile
Local Community Unit/kWh Upstream Core Core - infrastructure
Total - generated
Down-stream
Downstream - infrastructure
Total - distributed
Resettling of individuals [SO9]Number of individuals that resettle
due to organizational activities
Local recruitment [EC7]Share of local recruited employee
hours (by employee category)
Spending on locally-based suppliers [EC6]
Share of local products (by value/amount)
Human rights issues faced by (indigenous) people [HR9]
Amount of human rights issues faced by (indigenous) people brought to the court (by local,
national, regional, global level)
(Indigenous) land right conflicts & land claims [HR9]
Amount of (indigenous) land rights conflicts / land claims brought to the
court (by customary rights, legal rights)
Legal complaints with regard to safety concerns [SO9]
Amount of legal complaints per year against the organization with regard
to safety concerns brought to the court
Legal complaints with regard to security concerns [SO9]
Amount of legal complaints per year against the organization with regard to security concerns brought to the
court
Financial return to the society [EC1] Amount of tax paid per year
Community spending and charitable contributions [EC8]
Percentage of turnover spend on charitable contributions
Education within anti-corruption [SO3]Percentage of people educated within the field of anti-corruption
Research and development efforts [EC9]
Percentage of turnover spend on research and development
Audit of suppliers with regard to social responsibility and/or code of conducts [G4 8] [G4 12] [HR2] [HR10]
Percentage of suppliers that have been audited
Payments on time to suppliers [G4 3]Product of the value and the amount
of days of delayed payments
Corruption
Output
Society
Value Chain Actors
Delocalization and Migration
Local Employment
Respect of Indigenous Rights
Secure Living Conditions
Contribution to Economic Development
Technology Development
Promoting Social Responsib ility
Supplier Relationships

56
Table 38. Socioprofile - part II (Stakeholder category: workers)
Children performing work unauthorized by the ILO conventions C138 and C182 [HR6]
Amount child labour minutes (by age category <15, <18 and light, normal
and hazardous work)
Differences in working hours between man and woman [LA1]
Ratio of working hours (by top management, middle management,
lower management, workers)
Incidents of discrimination [HR4]Amount of incidents brought to the
court
Wage differences between man and woman [LA14]
Ratio of average salary (by top management, middle management,
lower management, workers)
Wage differences between migrants and non-migrants
Ratio of average salary (by top management, middle management,
lower management, workers)
Fair living wage [EC5]Amount of workers below minimum
wage and/or living wage
Payment ratio [4.5]
Ratio of average labour cost (+benefits and taxes) to the total compensation package for the
company's highest paid employee
Workers performing work unauthorized by the ILO conventions C029 and C105 [HR7]
Amount of forced labour minutes
Injuries/fatal accidents/diseases [LA7]Lost Time Incident Frequency (by
accidents, sick leave, fatalities)
Personal Protective Equipment [LA8]Amount of people (especially in mines) equipped with protective
equipment
Annually paid vacation [LA3]Amount of average paid vacation
days
Employee training [LA8/10]Percentage of turnover spent on
employee training
Employment stabilityPercentage of workers on
permanent employment contracts
Healthcare & medical insurance expenditures [LA3]
Percentage of healthcare & medical and workplace injury insurance expenses per employee to the
market capitalization per employee
Social security expenditures [LA3]Percentage of pension/maternity expenses per employee to the
market capitalization per employee
Excessive Work [HR7]Amount of working hours in excess
of 48+12/person/week
Possibility to associate and bargain [LA4]
Percentage of employees covered by collective bargaining agreements
Forced Labour
Workers
Child Labour
Equal Opportunities/Discrimination
Fair Salary
Health and Safety
Social Benefit/Social Security
Working Hours
Freedom of Association and Collective Bargaining

57
Table 39. Socioprofile - part III (Additional information)
Consumer: Transparency [PR3]Certifications/labels achieved for the
product/site
Local Community: Access to Material Resources [EC8]
Improvements of the infrastructure in the fields of education, health,
energy & water services, improved sanitation facilities, public transport
services (e.g. school buildings [education]; doctors employed
[health]; bus lines set up [public transport services])
Local Community: Cultural Heritage [SO1]
Organizational programs to include cultural heritage in urgent need of
safeguarding
Local Community: Respect of Indigenous Rights [SO1]
Pro-active initiatives to strengthen the rights of (indigenous) people (e.g. integration efforts, meetings)
Local Community: Community Engagement [SO1]
Long-term plans and programs for securing of the wellfare of
communities located close to mines
Society: Corruption [SO3]Organizational anti-corruption
programs
Society: Corruption [SO2]
Ranking of countries that are involved in the product life cycle on
the Transparency International Corruption Perceptions Index
Society: Public Commitment to Sustainability Issues [4.8] / [4.12]
Implementation and/or signing of principles or codes of conducts (e.g.
Sullivan Principles, Caux Round Table; Global Compact Principles;
ISO Standards 18000, 14001, 26000; SA 8000; EITI; Voluntary
Principles on Security and Human Rights)
Value Chain Actors: Promoting Social Responsibility [4.13]
Memberships in initiatives that promote social responsibility along
the supply chain
Value Chain Actors: Promoting Social Responsibility (DI57)
Existence of anonymous whistleblowing processes
Workers: Health and Safety [LA6]Existence of safety officers and/or
work environment committees
Workers: Social Benefit/Social Security [LA3]
Information of countries that are involved in the product life cycle
about annually paid vacation days regulated by law
Workers: Freedom of Association and Collective Bargaining [4.7]
Share of employee/union representatives in the board of
directors with/without the right to vote
Additional Information

58
Annex 9 – Upstream & core processes for the nuclear power plant
Table 40. Description of the upstream and core processes within a nuclear power plant
Process InformationMining & milling "Uranium is extracted from the Earth’s crust in different ways, Open Pit Mining, Under-ground
Mining and In-Situ Leaching. The mining method for uranium does not differ appreciably from those of iron or copper mining. The choice of mining method basically depends on relative costs and factors such as size, shape, depth, and concentration of the ore deposits. Several substances are often extracted from the same mine in order to achieve a profitable operation. Environmental, health, and safety aspects are similar irrespective of the type of ore being mined.” (Vattenfall AB, 2010b, p.3)
Refining "The uranium concentrate, must be further refined before it can be used as fuel for nu- clear reactors. Neutron absorbents must be removed, as they would otherwise block the chain reaction in the reactor thus stopping the fission process. The feed for a refinery is uranium concentrate, and the output is pure UO3. The r e f ine r y process consists of the following steps: • Nitric acid is added, yielding a uranyl nitrate solution• Solids are extracted from the uranyl nitrate solution in three steps• Water is vaporized, yielding a concentrated uranyl nitrate hexahydrate solution• Concentrated uranyl nitrate hexahydrate is heated to yield uranium trioxide (UO3)Most of the nitric acid added in the first step is separated in the last step and recirculated.” (Vattenfall AB, 2010b, p.4)
Conversion "Conversion is performed in two steps. First, hydrofluoric acid is added to uranium trioxide (UO3) to yield uranium tetrafluoride (UF4). Then UF4 reacts with fluorine gas to yield hexa fluoride gas (UF6). UF6 changes states readily within a small temperature range. The UF6 gas is passed through several filters and finally through cold traps, and collected as crystalline UF6. The UF6 is liquefied by heating and drained into specially designed steel cylinders for shipment, and it solidifies when pressurized." (Vattenfall AB, 2010b, p.5)
Enrichment "Most nuclear reactors require fuel with a U-235 content of 3–5%. At room temperature UF6 is a solid, similar to paraffin. At 65°C and warmer UF6 is a gas and can be enriched either by gaseous diffusion or by gas centrifugation. Both processes enrich UF6 from 0,7% U-235 to the required level (the rest of the uranium is U-238). The uranium is kept as UF6 and cooled to solid form before shipment to fuel fabrication facilities.” (Vattenfall AB, 2010b, p.5)
Fuel Fabrication "The uranium arrives as enriched, solid UF6 at the fuel fabrication facility, where it is heated into gaseous state. Ammonia, gaseous oxygen, and gaseous hydrogen are added to yield uranium dioxide powder. The UO2 powder is compressed into cylindrical pellets weighing 6–7 grams.The pellets are sintered to a structure resembling ceramics and are ground to final dimension, after which 300–370 of them are placed in zirconium alloy (zircaloy) tubes approximately 3,7 meters in length.The tubes are pressurized with helium and sealed to form fuel rods, which are then bundled into fuel assemblies in which the number of rods depends on the design of the reactor. A boiling water reactor (BWR) holds between 400 and 700 fuel assemblies comprising a maximum of 70 000 fuel rods. A pressurized water reactor (PWR) holds some 160 fuel assemblies with a maximum of 42 000 fuel rods. Zircaloy is an alloy of zirconium (98%), tin (1,5%), and small amounts of iron, nickel, and chromium. It does not absorb neutrons, is very resistant to corrosion, and it withstands high temperatures, all of which makes it particularly suited for deployment in nuclear reactors. The fuel factory also fabricates control rods, mainly made from stainless steel. Control rods for BWRs have small cavities filled with boron carbide and hafnium oxide. PWRs use control rods with an alloy of indium, cadmium, and silver encapsulated in the stainless steel.” (Vattenfall AB, 2010b, p.7f)
Electricity Generation "In a nuclear reactor neutrons are used to split uranium nuclei (fission). The fission releases energy in the form of kinetic energy of the fission particles, as well as in the form of radiation. The energy is transformed to heat, which in turn is used to heat the water in the reactor. The steam drives a turbine connected to a generator, which converts the energy to electricity. After passing through the turbine the steam is condensed to water in a condenser through heat exchange with a cooling agent (seawater), and after filtering the water is recirculated into the reactor." (Vattenfall AB, 2010b, p.9)

59
Annex 10a – Socioprofile with (fictive) inventory data
Table 41. Inventory results of the social performance indicators for the upstream processes of Forsmark nuclear power
Total
Conver- sion
Sum/ Average
Local Community Unit Rössing BHP ERA Cameco USEC UCL TENEX Areva Westing-house
35% 10% 5% 55% 25% 100% 2% 25% 15%
Delocalization and Migration
Resettling of individuals [SO9] Discrete 120 2 25 0 0 1 2 0 0 44,49
Local recruitment [EC7] Continuous 75,00% 33,00% 60,00% 20,00% 10,00% 5,00% 100,00% 15,00% 40,00% 39,78%
Spending on locally-based suppliers [EC6] Continuous 5,00% 15,00% 20,00% 20,00% 2,00% 15,00% 15,00% 20,00% 35,00% 16,33%
Human rights issues faced by (indigenous) people [HR9] Discrete 1 0 0 0 0 0 1 0 0 0,37
(Indigenous) land right conflicts & land claims [HR9] Discrete 1 1 0 1 0 0 0 0 0 1,00
Legal complaints with regard to safety concerns [SO9] Discrete 0 1 0 0 1 0 0 1 0 0,60
Legal complaints with regard to security concerns [SO9] Discrete 0 0 0 0 0 0 0 0 0 0,00
Financial return to the society [EC1]Discrete
(SEK)3E+08 4E+08 5E+07 2,5E+08 1,3E+08 1,5E+08 1E+08 4E+08 5E+08 6,4E+08
Community spending and charitable contributions [EC8] Continuous 0,50% 2,00% 0,00% 2,50% 0,00% 3,00% 0,75% 4,00% 1,50% 1,58%
Education within anti-corruption [SO3] Continuous 55,00% 20,00% 0,00% 100,00% 90,00% 87,00% 34,00% 100,00% 100,00% 65,11%
Research and development efforts [EC9] Continuous 4,50% 15,00% 0,50% 7,30% 18,00% 25,00% 40,00% 33,00% 38,00% 20,14%
Audit of suppliers with regard to social responsibility and/or code of conducts [G4 8] [G4 12] [HR2] [HR10]
Continuous 5,00% 55,00% 0,00% 100,00% 40,00% 2,00% 10,00% 100,00% 5,00% 35,22%
Payments on time to suppliers [G4 3]Discrete (SEK*d)
0 1000 30000 150000 0 1500 50000 0 25000 90350
Children performing work unauthorized by the ILO conventions C138 and C182 [HR6]
Discrete 10 0 0 0 0 0 0 3,50
Differences in working hours between man and woman [LA1]
Continuous 0,91 1,13 1,41 0,82 1,44 0,83 1,43 0,91 1,45 1,15
Incidents of discrimination [HR4] Discrete 1 0 2 4 0 0 1 2 0 3,17
Wage differences between man and woman [LA14] Continuous 0,84 0,75 0,76 1,61 1,52 1,67 1,54 1,10 1,01 1,20
Wage differences between migrants and non-migrants Continuous 0,88 1,36 1,19 0,75 1,65 0,80 0,94 1,33 1,26 1,13
Fair living wage [EC5] Discrete 4 12 13 19 19 9 12 18 13 34,14
Payment ratio [4.5] Continuous 0,0656 0,0619 0,0896 0,0979 0,0335 0,0542 0,0010 0,0783 0,0214 0,0559
Workers performing work unauthorized by the ILO conventions C029 and C105 [HR7]
Discrete 3 5 11 6 2 4 5 16 2 14,30
Injuries/fatal accidents/diseases [LA7] Continuous 1,28 5,95 5,01 3,49 4,90 1,67 7,18 7,67 6,98 9,21739
Personal Protective Equipment [LA8] Continuous 85% 90% 35% 38% 65% 77% 80% 100% 56% 70%
Annually paid vacation [LA3] Discrete 25 23 15 26 27 33 20 28 25 24,67
Employee training [LA8/10] Continuous 0,50% 4,50% 3% 2,57% 1,45% 0,20% 5,80% 2,30% 3,66% 2,66%
Employment stability Continuous 65% 70% 65% 88% 23% 15% 95% 49% 74% 60,44%
Healthcare & medical insurance expenditures [LA3] Continuous 0,45% 1,90% 2,30% 0,50% 1,67% 3,22% 1,04% 0,98% 5,44% 1,94%
Social security expenditures [LA3] Continuous 1,96% 0,97% 1,03% 0,02% 5,37% 0,31% 4,43% 2,69% 0,30% 1,90%
Excessive Work [HR7] Discrete 3 2 1 4 3 0 0 2 1 4,90
Possibility to associate and bargain [LA4] Continuous 85% 90% 35% 75% 55% 98% 95% 88% 91% 79,11%
Fuel FabricationEnrichmentMining & milling
Upstream processesSocioprofile - Inventory Results
Activity Variable
Freedom of Association and Collective Bargaining
Working Hours
Respect of Indigenous Rights
Local Employment
Secure Living Conditions
Society
Contribution to Economic Development
Corruption
Technology Development
Promoting Social Responsib ility
Supplier Relationships
Child Labour
Equal Opportunities/Discrimination
Fair Salary
Forced Labour
Health and Safety
Social Benefit/Social Security
Value Chain Actors
Workers

60
Annex 10b – Socioprofile for nuclear electricity generation
Table 42. Aggregated results of the social performance indicators for the upstream processes of Forsmark nuclear power (I)
Socioprofile
Local Community Unit/kWh Upstream 2004
Upstream 2007
Upstream 2010
Upstream 2013
Resettling of individuals [SO9]Number of individuals that resettle
due to organizational activities1,96E-06 1,96E-06 1,96E-06 1,96E-06
Local recruitment [EC7]Share of local recruited employee
hours (by employee category)39,78% 42,78% 31,88% 34,99%
Spending on locally-based suppliers [EC6]
Share of local products (by value/amount)
16,33% 22,48% 23,40% 25,66%
Human rights issues faced by (indigenous) people [HR9]
Amount of human rights issues faced by (indigenous) people brought
to the court (by local, national, regional, global level)
1,63E-08 1,375E-08 1,246E-08 1,623E-08
(Indigenous) land right conflicts & land claims [HR9]
Amount of (indigenous) land rights conflicts / land claims brought to the
court (by customary rights, legal rights)
4,405E-08 4,371E-08 3,891E-08 4,219E-08
Legal complaints with regard to safety concerns [SO9]
Amount of legal complaints per year against the organization with regard
to safety concerns brought to the court
2,643E-08 2,556E-09 2,622E-09 2,632E-10
Legal complaints with regard to security concerns [SO9]
Amount of legal complaints per year against the organization with regard to security concerns brought to the
court
0,00 0,22 0,00 0,24
Financial return to the society [EC1] Amount of tax paid per year (SEK) 28,34 29,45 30,11 32,72
Community spending and charitable contributions [EC8]
Percentage of turnover spend on charitable contributions
1,58% 1,04% 2,55% 1,30%
Education within anti-corruption [SO3]Percentage of people educated within the field of anti-corruption
65,11% 71,43% 75,69% 82,34%
Research and development efforts [EC9]
Percentage of turnover spend on research and development
20,14% 12,31% 8,02% 21,83%
Audit of suppliers with regard to social responsibility and/or code of conducts [G4 8] [G4 12] [HR2] [HR10]
Percentage of suppliers that have been audited
35,22% 44,72% 47,91% 50,38%
Payments on time to suppliers [G4 3]Product of the value and the amount of days of delayed payments (SEK)
0,0040 0,0005 0,0081 0,0001
Technology Development
Value Chain Actors
Promoting Social Responsib ility
Supplier Relationships
Respect of Indigenous Rights
Secure Living Conditions
Society
Contribution to Economic Development
Corruption
Output
Delocalization and Migration
Local Employment

61
Table 43. Aggregated results of the social performance indicators for the upstream processes of Forsmark nuclear power (II)
Children performing work unauthorized by the ILO conventions C138 and C182 [HR6]
Amount child labour minutes (by age category <15, <18 and light, normal
and hazardous work)1,542E-07 1,259E-07 1,537E-07 1,104E-07
Differences in working hours between man and woman [LA1]
Ratio of working hours (by top management, middle management,
lower management, workers)1,1484 1,0475 1,4733 1,2844
Incidents of discrimination [HR4]Amount of incidents brought to the
court1,396E-07 1,442E-08 1,441E-08 1,4E-09
Wage differences between man and woman [LA14]
Ratio of average salary (by top management, middle management,
lower management, workers)1,2005 1,0200 1,0200 1,0002
Wage differences between migrants and non-migrants
Ratio of average salary (by top management, middle management,
lower management, workers)1,1301 1,1324 1,1482 1,2832
Fair living wage [EC5]Amount of workers below minimum
wage and/or living wage34,14 38,13 21,44 15,22
Payment ratio [4.5]
Ratio of average labour cost (+benefits and taxes) to the total compensation package for the
company's highest paid employee
0,0559 0,0203 0,0403 0,0030
Workers performing work unauthorized by the ILO conventions C029 and C105 [HR7]
Amount of forced labour minutes 6,3E-07 6,3E-07 6,3E-07 6,3E-07
Injuries/fatal accidents/diseases [LA7]Lost Time Incident Frequency (by accidents, sick leave, fatalities)
4,061E-07 4,044E-07 3,732E-07 3,103E-07
Personal Protective Equipment [LA8]Amount of people (especially in mines) equipped with protective
equipment3,064E-08 3,36E-08 3,36E-08 3,478E-08
Annually paid vacation [LA3]Amount of average paid vacation
days24,67 25,67 27,38 27,38
Employee training [LA8/10]Percentage of turnover spent on
employee training2,66% 3,49% 1,38% 4,38%
Employment stabilityPercentage of workers on permanent
employment contracts60,44% 50,33% 48,33% 49,22%
Healthcare & medical insurance expenditures [LA3]
Percentage of healthcare & medical and workplace injury insurance expenses per employee to the
market capitalization per employee
1,94% 2,03% 3,19% 2,57%
Social security expenditures [LA3]Percentage of pension/maternity expenses per employee to the
market capitalization per employee1,90% 1,03% 2,56% 4,57%
Excessive Work [HR7]Amount of working hours in excess of
48+12/person/week2,159E-07 2,131E-08 2,158E-08 2,227E-07
Possibility to associate and bargain [LA4]
Percentage of employees covered by collective bargaining agreements
79,11% 73,48% 81,48% 83,45%
Working Hours
Freedom of Association and Collective Bargaining
Workers
Child Labour
Equal Opportunities/Discrimination
Fair Salary
Forced Labour
Health and Safety
Social Benefit/Social Security