Asian Development Bank · Asian Development Bank LOCAL WATER UTILITIES ADMINISTRATION ... FMAQ...
305
TA No. 7122-PHI: Water District Development Sector Project PPTA – Final Report – Vol. 10 FINAL REPORT VOLUME 10: SUPPLEMENTARY APPENDICES H TO J (SOCIAL ASPECTS) Asian Development Bank LOCAL WATER UTILITIES ADMINISTRATION WATER DISTRICT DEVELOPMENT SECTOR PROJECT Project Preparatory Technical Assistance (PPTA) TA No: 7122 - PHI PÖYRY IDP CONSULT, INC., PHILIPPINES in association with TEST Consultants Inc., Philippines PÖYRY Environment GmbH, Germany APRIL 2010 PÖYRY IDP CONSULT, INC.
Transcript of Asian Development Bank · Asian Development Bank LOCAL WATER UTILITIES ADMINISTRATION ... FMAQ...
TA No. 7122-PHI: Water District Development Sector Project PPTA – Final Report – Vol. 10
FINAL REPORT
VOLUME 10: SUPPLEMENTARY APPENDICES H TO J (SOCIAL ASPECTS)
Asian Development Bank
LOCAL WATER UTILITIES ADMINISTRATION
WATER DISTRICT DEVELOPMENT SECTOR PROJECT
Project Preparatory Technical Assistance ( PPTA) TA No: 7 122 - PHI PÖYRY IDP CONSULT, INC., PHILIPPINES in association with TEST Consultants Inc., Philippines PÖYRY Environment GmbH, Germany
APRIL 2010
PÖ
YR
Y ID
P C
ON
SU
LT, I
NC
.

TA No. 7122-PHI: Water District Development Sector Project PPTA – Final Report – Vol. 10
This report consists of 12 volumes:
Volume 1 Main Report
Volume 2 Institutional and Financial Assessment of LWUA
Volume 3 Subproject Appraisal Report: Metro La Union Water District
Volume 4 Subproject Appraisal Report: Quezon Metro Water District
Volume 5 Subproject Appraisal Report: Legazpi City Water District
Volume 6 Subproject Appraisal Report: Leyte Metro Water District
Volume 7 Subproject Appraisal Report: City of Koronadal Water District
Volume 8 Report and Recommendation of the President (RRP)
Volume 9 Supplementary Appendices A to G (Technical Aspects)
A Review and Assessment of Water Supply and Sanitation Sector Outside Metro Manila B Water Sector Laws and Policies C Assessment of Existing Water Supply Systems in Pilot Water Districts D Proposed Water Supply Component for Pilot Water Districts E Non Revenue Water Contract Mechanisms F Sanitation G Health
Volume 10 Supplementary Appendices H to J (Social Aspects)
H Socio-economic Survey I Stakeholder Consultation and Participation J Indigenous Peoples
Volume 11 Supplementary Appendices K to S (Financial, Implementation Aspects)
K Financial Management Assessment L Detailed Project Cost and Financing Plans for Water Districts M Financial Analysis N Financial History of Water Districts O Economic Analysis P Institutional Strengthening and Capacity Building Q Indicators for Measuring Development Objectives and Performance R Terms of Reference for Consultants (Project Implementation Support
Services) S Profiles of Priority Water Districts from Long-list
Volume 12 Supplementary Appendices T to V (Safeguard Aspects)
T Initial Environmental Examinations U Resettlement Framework V Resettlement Plans

TA No. 7122-PHI: Water District Development Sector Project PPTA – Final Report – Vol. 10
WATER DISTRICT DEVELOPMENT SECTOR PROJECT — PPTA TA NO. 7122-PHI
FINAL REPORT
SUPPLEMENTARY APPENDICES H - J
H Socio-economic Survey
I Stakeholder Consultation and Participation
J Indigenous Peoples

TA No. 7122-PHI: Water District Development Sector Project PPTA – Final Report – Vol. 10
i
GLOSSARY AND ACRONYMS
ABD Asian Development Bank ACP asbestos cement pipe AIFC average incremental financial cost A/R accounts receivable AP affected person APIS annual poverty indicator survey ARI acute respiratory infection AusAID Australian Aid barangay village BNA basic needs approach BOT build-operate-transfer BSP basic sanitation package BWSA Barangay Water and Sanitation Association CAP community action plan CBO community-based organization CCF community consultation forum CCI cement-line cast iron (pipe) CDA Cooperatives Development Agency CDD community-driven development CFR case fatality rate CFT community facilitator team CI cast iron (pipe) CKWD City of Koronadal Water District CLTS community-led total sanitation COA Commission on Audit C&P consultation and participation CPC certificate of public convenience CSC community sanitation center CSS city sanitation strategy CY calendar year DBL design-build-lease DBO design-build-operate DBM Department of Budget and Management BDP Development Bank of The Philippines DED detailed engineering design DENR Department of Environment and Natural Resources DFR draft final report DHF dengue hemorrhage fever DILG Department of Interior and Local Government DMA district metering area DOF Department of Finance DOH Department of Health DPWH Department of Public Works and Highways DRA demand responsive approach DSA delineated service area DSCR debt service coverage ratio EA executing agency (LWUA) EARF environmental assessment review framework EIA environmental impact analysis EIRR economic internal rate of return EMP environmental management plan EO executive order EOCC economic opportunity cost of capital
TA No. 7122-PHI: Water District Development Sector Project PPTA – Final Report – Vol. 10
ii
FGD focus group discussion FMAQ financial management assessment questionnaire forex foreign exchange FS feasibility study FY fiscal year (1 January – 31 December) GFI government financial institution GI galvanized iron (pipe) GIS geographic information system GOCC government owned and controlled corporation GOP Government of the Republic of the Philippines GR (i) government regulation, (ii) general record (in legal cases) HDI Human Development Index HH household HRD human resources development IA implementing agency IBRD International Bank for Reconstruction and Development (World Bank) ICC Investment Coordinating Council (NEDA) ICG internal cash generation IDAP institutional development action plan IDC interest during construction IDCB institutional development and capacity building IEC information-education-communication IEE initial environmental examination IFS Investment and Financial Services (LWUA) IOL inventory of losses IPDP indigenous peoples’ development plan IRA internal revenue allotment IRR implementing rules and regulations IT information technology IWA International Water Association JICA Japan International Cooperation Agency KABP knowledge-attitudes-behavior-practices KFP an adaptation of KAP (knowledge, attitudes and practices) LCWD Legazpi City Water District LG local government LGC local government code LGU local government unit LIDAP local institutional development action plan LIHH low income household LLI local level institutions LMWD Leyte Metro Water District LOI letter of intent lps liters per second LWUA Local Water Utilities Administration MDFO Municipal Development Fund Office MDG Millennium Development Goals M&E monitoring and evaluation MFF Multitranche Financing Facility (ADB) MIS management information system MLUWD Metro La Union Water District MOU memorandum of understanding MPA Methodology for Participatory Assessments MTPDP Medium Term Philippine Development Plan

TA No. 7122-PHI: Water District Development Sector Project PPTA – Final Report – Vol. 10
iii
MTPIP Medium-Term Public Investment Program MWSS Metropolitan Waterworks and Sewerage System (Metro Manila) NAMRIA National Mapping and Resources Inventory Authority NAPC National Anti Poverty Commission NCIP National Commission on Indigenous Peoples NEDA National Economic Development Authority NGA national government agency NGO non-government organization NPV net present value NRW non-revenue water NSCB National Statistical Coordination Board NSO National Statistics Office NSSMP National Sewerage and Septage Management Program NWRB National Water Resources Board OCR Ordinary Capital Resources (ADB) ODA official development assistance OGCC Office of the Government Corporate Counsel OJT on-the-job training O&M operation and maintenance PB polybutylene (pipe) PD presidential decree PFI private funding institution PHAST Participatory Hygiene and Sanitation Transformation Php, PhP Philippine peso PIU project implementation unit PMO project management office PMU project management unit PNSDW Philippine National Standards on Drinking Water PPMS project performance monitoring system PPTA project preparation technical assistance PRV pressure reducing valve PSA poverty and social assessment psi pounds per square inch PSP private sector participation PWSSR Philippine Water Supply Sector Roadmap QC quality control QM quality management QMWD Quezon Metro Water District RA republic act RIAP revenue improvement action plan RRP report and recommendation of the president (ADB) RWSA Rural Waterworks and Sanitation Association SES socioeconomic survey SCSS simplified community sewerage system SCU schools, colleges, universities SHBC sanitation and health behavioral change SLA sub-loan agreement SPAR subproject appraisal report SSC school sanitation centre SWG sanitation working group SWM solid waste management TA technical assistance TB tubercolosis

TA No. 7122-PHI: Water District Development Sector Project PPTA – Final Report – Vol. 10
iv
TOR terms of reference TOT training-of-trainers UFW unaccounted-for water UNICEF USAID
United Nations Children Fund United States Agency for International Development
V variation (contract) VIP ventilated improved pit (latrine) WASCO Water Supply Coordination Office (NAPC) WD water district WHO World Health Organization WPEP Water Supply and Sanitation Performance Enhancement Project WQ water quality WS water supply WSP water service provider WSP-EAP Water and Sanitation Program – East Asia Pacific WSS water and sanitation WTP willingness-to-pay WWTP wastewater treatment plant

TA No. 7122-PHI: Water District Development Sector Project PPTA – Final Report – Vol. 10
v
Location Map
Metro La Union WD
Quezon Metro WD Legazpi
City WD
Leyte Metro WD
City of Koronadal WD

Supplementary Appendix H
TA No. 7122-PHI: Water District Development Sector Project PPTA – Final Report – Vol. 10
SOCIO-ECONOMIC, WATER AND SANITATION
HOUSEHOLD SURVEY RESULTS
July 2009
Prepared by Pöyry IDP Consult, Inc.
Ms. Corazon Jose, Survey Manager

Supplementary Appendix H
TA No. 7122-PHI: Water District Development Sector Project PPTA – Final Report – Vol. 10
Table Of Contents
Pages I. Socio-Economic Profile of Households Classified by
Water District/ Geographic Area
1 - 25
II. Socio-Economic Profile of Households Classified by Type of Household (WD-Connected/Non-Connected)
26 - 85
III. Water Consumption and Preferences of WD-Connected Households
86 - 101
IV. Water Consumption and Preferences of Non-Connected Households
102 -123
V. Water Supply and Sanitation Preferences by Socio-Economic Status of Households in 5 Water Districts
124 -134
ANNEXES 1 Gender Tables 2 Distribution of Sample Households for the WDDPS Household Survey 3 Questionnaire in English

Supplementary Appendix H
TA No. 7122-PHI: Water District Development Sector Project PPTA – Final Report – Vol. 10
i
SOCIAL, ECONOMIC, HEALTH AND SANITATION HOUSEHOLD SURVEY
INTRODUCTION
1. The Social, Economic, Health and Sanitation Survey (generally referred to as the Socio-economic Survey – SES) was conducted in May 2009 as part of the formulation of a sector investment plan for urban water and sanitation under the Water District Development Sector Project PPTA (Project Preparation Technical Assistance). The Project’s objective is to (i) formulate a sector investment project (WDDSP) in the urban water supply and sanitation sector with funding from ADB and other investment sources, and, (ii) prepare implementation support and institutional development programs addressing sector reform, governance and public awareness.
2. A key task of the PPTA is the preparation of a Subproject Appraisal Report (SPAR) for five (5) pilot water districts that participated in the PPTA; these are:
1. Metro La Union Water District, La Union Province, Luzon. 2. Quezon Metro Water District, Quezon Province, Luzon. 3. Legazpi City Water District, Albay Province, Luzon. 4. Leyte Metro Water District, Leyte Province, Visayas. 5. Koronadal City Water District, South Citabato Province, Mindanao.
3. The SPARs’ subproject scope, cost estimates, financing plan and feasibility were prepared based on an analysis of the existing situation, local development plans and priorities and findings from field surveys. The SES household survey generated empirical data on the target participants.
4. At least 384 respondents were interviewed to reach a 95% level of confidence at 0.1standard deviation. Stratified random sampling was used to determine the survey sample—with three levels of stratification: (i) municipality/city, (ii) serviced/expansion areas, and (iii) barangays in both service/expansion sites.
5. The survey result is here summarized. The tables also serve as baseline data against which future project impacts can be assessed and as input in the design of information and education materials and of interventions for identified areas for improvement.
6. Some variables that were covered were:
• Demographic characteristics. • Gender roles and preferences. • Profile on health and hygiene practices. • Poverty groups, indicators and responses. • Identification of community organizations. • Sources of vulnerability and responses. • Water and sanitation situation, attitudes, perceptions and preferences.
o access to facility and sanitation maintenance practices, o attitude towards water and sanitation services, o demand by service type (water and sanitation), o sources and levels of water supply accessed, o perceptions on sanitation and water and service quality, o affordability and willingness to pay.
7. Certain data sets were disaggregated by water district connection (connected or non-connected households) or cross-tabulated by gender and poverty characteristics,

Supplementary Appendix H
TA No. 7122-PHI: Water District Development Sector Project PPTA – Final Report – Vol. 10
ii
corresponding to the different sections of this report. Section 1 is a profile of respondents. Section 2 contains comparisons for connected and non-connected households. Sections 3 and 4 are profiles on water and sanitation by WD-connected or non-connected households. Section 5 covers characteristics and preferences of poor and non-poor respondents.
8. An additional section covers gender disaggregated data by female or male-headed households on such variables as roles and access to resources, or by male or female respondents on attitudes and preferences. The sections are follows:
1 Socio-economic profile of households. 2 Socio-economic profile of households classified by type of household. 3 Water consumption and preferences of wd-connected households. 4 Water consumption and preferences of wd-connected households. 5 Water supply and sanitation preferences by socio-economic status of
households.
9. Annexes:
Annex 1 Gender Disaggregated Data Annex 2 Survey Sample Annex 3 Survey Questionnaire (English version)

1 Supplementary Appendix H
TA No. 7122-PHI: Water District Development Sector Project PPTA – Final Report – Vol. 10
I. Socio-Economic Profile of Households Classified by Water District/ Geographic Area
Table 1. Percentage of Households by Total Number of Household Members
Total number of HH members
Water District
Total LEGASPI LA UNION LEYTE QUEZON KORONADAL
1-2 7.5% 9.1% 8.1% 11.1% 5.6% 8.3%
3-4 27.0% 34.6% 32.8% 31.8% 36.1% 32.5%
5-6 32.2% 34.6% 26.8% 37.0% 33.6% 32.9%
7-8 21.8% 15.1% 16.4% 13.7% 17.0% 16.8%
9-10 7.8% 2.3% 10.9% 3.4% 4.3% 5.7%
More than 10 3.6% 4.2% 4.9% 3.1% 3.3% 3.8%
Average Household Size 5.68 5.11 5.66 5.04 5.34 5.37
N Cases 385 384 384 387 393 1,933
Household size of the five districts is predominantly at 3 to 6 members where 65.4% of the households (32.5% +32.9%) are within that range. With 15.8% of the total households (10.9% + 4.9%), Leyte has more large households (9 to over 10 members as against the 9.5% overall percentage in the five water districts (5.7% + 3.8 %) and relative to the even smaller 6.5 percentages of La Union and Quezon. Average size of household is highest in Legazpi and lowest in Quezon. Table 2. Percentage of Households by Total Number of Household Members who
are 14 Years Old and Below by Water District/Geographic Area Total number of HH members 14 years
old and below
Water District
Total LEGASPI LA UNION LEYTE QUEZON KORONADAL
None 27.3% 29.9% 29.4% 35.6% 30.1% 30.5%
1-2 42.9% 48.4% 38.3% 45.9% 51.3% 45.4%
3-4 21.3% 18.5% 22.9% 16.0% 16.8% 19.1%
5-6 7.8% 2.3% 7.8% 1.5% 1.3% 4.1%
7-8 0.8% 0.5% 1.6% 0.8% 0.3% 0.8%
9-10 0.0% 0.3% 0.0% 0.3% 0.3% 0.2%
Average number of HH members 14
years old and below 1.79 1.47 1.84 1.34 1.39 1.57
N Cases 385 384 384 388 392 1,933 Most of the households in the five water districts have few members who are 14 years old and below (45.4% households with 1 to 2 members) while 30.5% do not have members at all within that age group. Particularly, Koronadal and La Union with 30.1% and 51.3% and 29.9% and 48.4%, respectively, have the most number of households with 1 to 2 or none at all who are 14 years old and below. Average number of young household members is highest in Leyte and lowest in Quezon.

2 Supplementary Appendix H
TA No. 7122-PHI: Water District Development Sector Project PPTA – Final Report – Vol. 10
Table 3. Percentage of Households by Total Number of Household Members who
are 65 Years Old or Over by Water District/Geographic Area
Total number of HH members
Water District
Total LEGASPI LA UNION LEYTE QUEZON KORONADAL
None 78.2% 76.8% 75.0% 71.4% 80.7% 76.4%
1-2 21.3% 22.4% 24.5% 28.6% 19.1% 23.2%
3-4 0.5% 0.3% 0.5% 0.0% 0.0% 0.3%
5 or more 0.0% 0.5% 0.0% 0.0% 0.3% 0.2%
N Cases 385 384 384 388 393 1,934
Household members are predominantly young where more than three fourths of the households in the five water districts, (76.4%), do not have members who are 65 years old or older, and only 23.2% have 1 to 2 members who are within the age bracket. Further indicating the relatively young age composition of households, only 0.5% of the households have 3 to 5 or more members who are of the senior age (0.3% with 3-4 members and, 0.2%, 5 or more members). Table 4. Percentage of Households by Number of Households Living in the Dwelling
Unit by Water District/Geographic Area
Number of HHs in the dwelling unit
Water District Total
LEGASPI LA UNION LEYTE QUEZON KORONADAL
1 86.9% 77.3% 94.5% 94.6% 79.6% 86.6%
2 8.4% 18.8% 3.9% 3.4% 12.2% 9.3%
3 2.6% 2.6% 1.3% 0.5% 5.1% 2.4%
4 or more 2.1% 1.3% 0.3% 1.6% 3.1% 1.7%
N Cases 383 384 383 387 393 1,930
Sole occupancy of dwelling unit is accounted for by 86.6% of the households in the five districts indicating that dwelling unit sharing is only among 13.4% of the households (9.3% shared by 2 households, 2.4% by 3 households and 1.7% by 4 or more households, Sole occupancy of dwelling unit is predominant in Quezon and Leyte water districts. Twin sharing is particularly high in La Union at 18.8% which is twice higher than the 9.3% overall picture.

3 Supplementary Appendix H
TA No. 7122-PHI: Water District Development Sector Project PPTA – Final Report – Vol. 10
Table 5. Percentage of Households by Length of Stay in the Barangay by Water District/Geographic Area
Number of years in the barangay
Water District Total
LEGASPI LA UNION LEYTE QUEZON KORONADAL
Less than 10 years 14.4% 25.3% 22.9% 22.7% 24.3% 21.9%
10-19 years 27.0% 20.0% 26.8% 21.9% 25.1% 24.2%
20-29 years 18.1% 16.8% 19.8% 22.7% 20.7% 19.6%
30-39 years 16.8% 13.2% 12.0% 12.4% 16.1% 14.1%
40-49 years 10.5% 11.8% 6.5% 10.6% 9.0% 9.7%
50 years or over 13.4% 12.9% 12.0% 9.8% 4.9% 10.5%
Average length of stay in the barangay
(in years) 27 years 25 years 24 years 24 years 22 years 25 years
N Cases 382 380 384 388 391 1,925
Most households in the five water districts were in the barangay for less than 30 years where long stay (50 years and over) is reported by only 10.5% of the households. Households in Koronadal have been already there in the more recent years as only 4.9% of the households have been in the barangay for 50 years or over, On the other hand, Legaspi, La Union and Leyte, with 13.4%, 12.9% and 12% respectively of the households who have been in the barangay for 40 to over 50 years, have more long staying households. On the average, households in Legazpi have stayed the longest (27 years) and those in Koronadal the shortest (22 years) in their barangay of current residence.
4 Supplementary Appendix H
TA No. 7122-PHI: Water District Development Sector Project PPTA – Final Report – Vol. 10
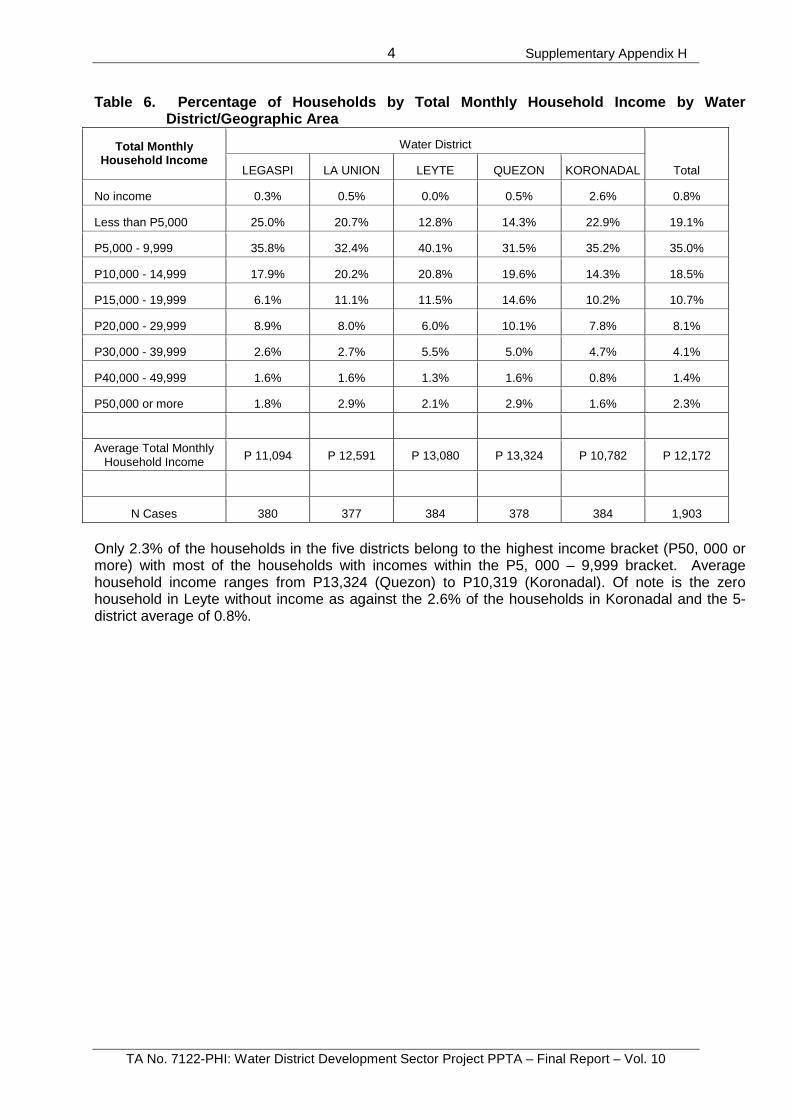
Table 6. Percentage of Households by Total Monthly Household Income by Water District/Geographic Area
Total Monthly Household Income
Water District
Total LEGASPI LA UNION LEYTE QUEZON KORONADAL
No income 0.3% 0.5% 0.0% 0.5% 2.6% 0.8%
Less than P5,000 25.0% 20.7% 12.8% 14.3% 22.9% 19.1%
P5,000 - 9,999 35.8% 32.4% 40.1% 31.5% 35.2% 35.0%
P10,000 - 14,999 17.9% 20.2% 20.8% 19.6% 14.3% 18.5%
P15,000 - 19,999 6.1% 11.1% 11.5% 14.6% 10.2% 10.7%
P20,000 - 29,999 8.9% 8.0% 6.0% 10.1% 7.8% 8.1%
P30,000 - 39,999 2.6% 2.7% 5.5% 5.0% 4.7% 4.1%
P40,000 - 49,999 1.6% 1.6% 1.3% 1.6% 0.8% 1.4%
P50,000 or more 1.8% 2.9% 2.1% 2.9% 1.6% 2.3%
Average Total Monthly Household Income P 11,094 P 12,591 P 13,080 P 13,324 P 10,782 P 12,172
N Cases 380 377 384 378 384 1,903
Only 2.3% of the households in the five districts belong to the highest income bracket (P50, 000 or more) with most of the households with incomes within the P5, 000 – 9,999 bracket. Average household income ranges from P13,324 (Quezon) to P10,319 (Koronadal). Of note is the zero household in Leyte without income as against the 2.6% of the households in Koronadal and the 5-district average of 0.8%.

5 Supplementary Appendix H
TA No. 7122-PHI: Water District Development Sector Project PPTA – Final Report – Vol. 10
Table 7. Percentage of Households by Total Monthly Household Expenditure by Water District/Geographic Area
Total Monthly Household Expenditure
Water District
Total LEGASPI LA UNION LEYTE QUEZON KORONADAL
Less than P3,000 7.7% 8.6% 7.7% 5.4% 6.3% 7.1%
P3,000 - 4,999 17.5% 20.0% 11.9% 11.2% 15.7% 15.2%
P5,000 - 9,999 36.8% 38.6% 43.1% 34.6% 42.4% 39.1%
P10,000 - 14,999 22.2% 15.8% 19.0% 22.6% 21.5% 20.3%
P15,000 - 19,999 5.6% 8.9% 7.9% 12.3% 8.9% 8.7%
P20,000 - 29,999 7.4% 3.9% 6.6% 8.2% 3.7% 6.0%
P30,000 - 49,999 1.6% 3.6% 2.9% 3.5% 1.6% 2.6%
P50,000 or over 1.3% 0.6% 0.8% 2.2% 0.0% 1.0%
Average Total Monthly Household Expenditure P 10,570 P 10,704 P 10,608 P 12,592 P 9,432 P 10,768
N Cases 378 360 378 367 382 1,865
Household spending in the five districts generally follows the skewed household income distribution. At P12,171 average household income and P10,768 average household expenditure, the overall picture reveals the absence of deficit spending. Restrained expenditure in Koronadal where no household spends P50,000 or over as against 2.2% of households in Quezon concurs with the household income structure in the 2 districts. Restrained expenditure corresponding to income is also the overall pattern in the five districts.

6 Supplementary Appendix H
TA No. 7122-PHI: Water District Development Sector Project PPTA – Final Report – Vol. 10
Table 8. Percentage of Households by Average Total Monthly Household Savings by
Water District/Geographic Area
Average Total Monthly Household Savings
Water District
Total LEGASPI LA UNION LEYTE QUEZON KORONADAL
None 65.6% 73.5% 55.2% 71.6% 58.7% 64.9%
Less than P1,000 20.5% 11.9% 24.0% 12.4% 28.1% 19.4%
P1,000 - 1,999 5.6% 6.1% 8.9% 5.7% 4.6% 6.2%
P2,000 - 2,999 3.2% 2.7% 6.3% 3.6% 2.8% 3.7%
P3,000 - 3,999 0.5% 0.8% 1.8% 2.6% 0.8% 1.3%
P4,000 – 4,999 0.3% 0.8% 1.3% 0.5% 0.5% 0.7%
P5,000 or over 4.3% 4.2% 2.6% 3.6% 4.6% 3.9%
N Cases 375 377 384 388 392 1,916
Given the skewed household income distribution which converges at the low income levels, abruptly tapering at the higher income levels and where half of the households are in the bottom income group (P 0 – P9, 999), high incidence of zero savings (64.9% households) is expected. It is important to note, however, that despite the more pronounced skewed income distribution in Koronadal and its low average income, there are less households with zero savings and more households with high savings (P5,000 or over savings) compared to the better off districts of Leyte, Quezon and La Union.

7 Supplementary Appendix H
TA No. 7122-PHI: Water District Development Sector Project PPTA – Final Report – Vol. 10
Table 9. Ownership of Valuable Items by Households by Water District/ Geographic
Area
Valuable items Water District
Total
LEGASPI LA UNION LEYTE QUEZON KORONADAL
Transport (car, motorcycle, tricycle) 26.8% 25.8% 19.6% 30.7% 34.7% 27.6%
Truck 1.0% 0.8% 1.3% 1.3% 1.3% 1.1%
Television 85.2% 86.2% 84.8% 95.1% 88.5% 88.0%
Refrigerator 49.1% 58.9% 47.6% 77.8% 61.1% 59.0%
Telephone/Cellular phone 73.2% 81.0% 68.5% 86.3% 88.0% 79.5%
Washing machine 26.2% 44.5% 22.0% 57.2% 25.7% 35.1%
Air Conditioner 7.0% 7.6% 2.6% 16.2% 7.4% 8.2%
Personal computer 11.7% 17.0% 7.1% 23.5% 13.5% 14.6%
Electric water pump/ overhead tank 3.9% 15.2% 2.1% 2.8% 10.2% 6.9%
Others items: e.g., DVD player, fan, videoke, etc. 13.8% 46.6% 46.1% 36.3% 24.9% 33.5%
N Cases 385 383 382 388 393 1,931
Predominant ownership of television and telephone/cellular phone in all the five districts augurs well for mass communication access and external contacts of the households. Differences in ownership of “convenience gadgets”, e.g., washing machine are pronounced where ownership is high in the relatively higher income households of Quezon and La Union. Capital assets, e.g., trucks are at only 1.1% ownership of the households which corroborates the low savings/investment rate of the households as observed in Table 8. Table 10. Percentage of Households by Gender of the Household Head by Water
District/Geographic Area
Gender of the Household Head
Water District
Total LEGASPI LA UNION LEYTE QUEZON KORONADAL
Male 74.3% 71.1% 83.4% 66.5% 81.4% 75.3%
Female 25.7% 28.9% 16.6% 33.5% 18.6% 24.7%
N Cases 385 384 384 388 393 1,935
Headship by a male household member is predominant in the five districts at 75% of the households. This is more pronounced in Leyte and Koronadal where 83% and 81% of households respectively, are headed by a male member as against households in Quezon at a low of 66.5% of the district’s households.

8 Supplementary Appendix H
TA No. 7122-PHI: Water District Development Sector Project PPTA – Final Report – Vol. 10
Table 11. Percentage of Households by Ethnic Affiliation of the Household Head by Water District/Geographic Area
WD/Ethnic Affiliation of Household Head Percentage (%)
LEGAZPI Bicolano 92.7% Tagalog 0.5% Bisaya 0.3% Pampangeño 0.3% Marinduque 0.3% Pangasinan 0.3% Mindanao (no specific ethnicity 0.3% No Info 5.5%
N Cases 385
LA UNION Ilocano 80.7% Tagalog 6.8% Bisaya (Cebuano) 3.2% Bicolano 1.9% Ifugao-Non 0.3% Davaoeno 0.3% Pampangeño 0.6% Pangasinan 0.6% Waray 0.5% Igorot 0.3% Itneg 0.3% Masbateno 0.3% Karkamaeg 0.3% No Info 5.0%
N Cases 384
LEYTE Waray 82.9% Bisaya (Cebuano) 4.0% Tagalog 1.0% Bicolano 0.3% Ilonggo 0.3% Pampangeño 0.3% No Info 11.4%
N Cases 384
QUEZON Tagalog 84.6% Bicolano 2.9% Ilocano 1.0% Bisaya (Cebuano) 1.8% Filipino-Chinese 0.8% Ilonggo 0.5% No Info 8.8%
N Cases 387

9 Supplementary Appendix H
TA No. 7122-PHI: Water District Development Sector Project PPTA – Final Report – Vol. 10
Table 11. Percentage of Households by Ethnic Affiliation of the Household Head by Water
District/Geographic Area (CONTINUATION) WD/Ethnic Affiliation of Household
Head Percentage (%)
KORONADAL Ilonggo 67.9% Bisaya (Cebuano) 10.5% Ilocano 9.5% Tagalog 3.6% Pangasinan 1.1% Bicolano 1.0% Boholanon 0.9% Waray 0.8% Chavacano 0.5% Aklanon 0.3% Batangueño 0.3% B'laan 0.3% Hiligaynon 0.3% Pampangeño 0.3% Muslim 0.3% No Info 3.3%
N Cases 393
By ethnic affiliation, household heads are mostly Bicolano in Legazpi (92.7%), Ilocano in La Union (80.7%), Waray in Leyte (82.9%), Tagalog in Quezon (84.6%) and Ilonggo in Koronadal (67.9%). Mixed ethnicity is evident in Koronadal compared to the other water district areas, with significant proportions of household heads whose roots come from as far as the northernmost regions of Luzon. Table 12. Percentage of Households by Highest Grade Completed by the Household
Head by Water District/Geographic Area Highest Grade Completed
by the Household Head
Water District
Total LEGASPI LA UNION LEYTE QUEZON KORONADAL
No schooling 0.8% 0.8% 2.1% 1.0% 1.6% 1.3%
Elementary 31.2% 17.1% 33.0% 19.0% 14.6% 22.9%
High School 32.8% 41.8% 41.2% 38.3% 37.9% 38.4%
Vocational training 5.3% 14.5% 1.8% 5.2% 6.0% 6.6%
College and over 29.9% 25.8% 21.9% 36.5% 39.9% 30.8%
N Cases 375 380 379 384 383 1,901
More than a third of the household heads went beyond secondary schooling in both collegiate and vocational courses with 30.8% with college-and-over education and 6.6% with vocational training. Greater number of household heads in Koronadal are in this category (39.9% and 6%) while Leyte, the least at 21.9% and 1.8%. Correspondingly, Leyte also accounts for the greater number of household head with no schooling and elementary level education.

10 Supplementary Appendix H
TA No. 7122-PHI: Water District Development Sector Project PPTA – Final Report – Vol. 10
Table 13. Percentage of Households by Current Occupation of the Household Head
by Water District/Geographic Area
Current Occupation of the Household Head
Water District
Total LEGASPI LA UNION LEYTE QUEZON KORONADAL
Farming or fishing 11.2% 15.1% 18.4% 5.2% 11.7% 12.3%
Own business 18.8% 10.4% 17.7% 23.7% 16.0% 17.3%
Government employee 9.1% 4.4% 8.8% 8.8% 10.4% 8.3%
Private employee 10.9% 7.8% 13.0% 14.4% 13.2% 11.9%
Temporary labourer 14.1% 5.5% 5.5% 8.8% 8.9% 8.5%
Street vendor 2.3% 1.6% 2.1% 0.8% 2.3% 1.8%
Retired/Pensioner 7.0% 7.6% 6.2% 11.3% 3.6% 7.1%
Unemployed 13.3% 16.2% 4.9% 15.5% 3.8% 10.7%
Others 13.3% 31.3% 23.4% 11.6% 30.0% 21.9%
N Cases 384 383 385 388 393 1,933
On the average, 9 out of 10 household heads in the five districts are employed. On unemployment, this is more pronounced in La Union and Quezon at 16.2% and 15.5% respectively while at low 3.8% in Koronadal. Temporary employment as laborer is at 8.5% on the average but at greatest percentage of the household heads in Legaspi at 14.1% and least in La Union and Leyte, both at 5.5%. Self-employment in business is accounted by 17.3% but these are pronounced in Quezon at 23.7% while least in La Union at 10.4%. Salaried household heads either in the private sector or in government account for 11.9% and 8.3%, respectively. Occupation in farming and fishing is 12.3% on the average of the household heads. Quezon with only 5.2% of household heads in farming and fishing, accounts for less than the average percentage. Other household head incomes are from pensions (7.1%) and other occupations that include mostly work in the transport sector, e.g., tricycle, trisikad, and public utility jeepney drivers (21.9%).

11 Supplementary Appendix H
TA No. 7122-PHI: Water District Development Sector Project PPTA – Final Report – Vol. 10
Table 14. Percentage of Households by Ownership Status of the House Occupied
by Water District/Geographic Area
Ownership Status of the House
Water District
Total LEGASPI LA UNION LEYTE QUEZON KORONADAL
House owner 91.7% 82.8% 89.1% 82.7% 85.5% 86.4%
Caretaker 2.1% 3.6% 0.8% 5.4% 2.5% 2.9%
Rent-free occupant 2.3% 7.0% 3.4% 3.4% 6.4% 4.5%
Renter 3.6% 4.9% 5.7% 8.2% 5.3% 5.6%
Others: relatives, etc 0.3% 1.6% 1.0% 0.3% 0.3% 0.7%
N Cases 385 384 385 388 393 1,935
On the average, 86.4% of the households own their houses. House ownership is particularly marked in Legaspi at 91.7%, while least in Quezon at 82.7%. Rented houses are at 5.6% average in the five districts but at higher percentage in Quezon at 8.2% and least in Legaspi at 3.6%. The rest of the households are in houses as caretakers, rent-free occupants or given access to stay as pro bono by relatives. Table 15. Percentage of Households by Ownership Status of the Lot on which
House is Built by Water District/Geographic Area
Ownership Status of the Lot
Water District
Total LEGASPI LA UNION LEYTE QUEZON KORONADAL
Owned 40.9% 41.1% 41.6% 66.0% 58.8% 49.7%
Caretaker 3.9% 4.4% 5.5% 8.2% 6.1% 5.6%
Rented/Leased 9.1% 5.7% 18.2% 11.3% 10.7% 11.0%
Common property with other family members or relatives 13.9% 25.3% 16.1% 8.3% 20.3% 16.8%
Government land 32.3% 23.4% 18.7% 6.2% 4.1% 16.9%
Others 7.6% 2.6% 8.6% 1.3% 2.5% 4.5%
N Cases 384 384 385 388 393 1,934
Half of the total households built their houses on owned lots (49.7%) but at higher percentage in Quezon and Koronadal (66% and 58.8%) and at less percentage in the 3 other water districts. Communal ownership of the lot with relatives is reported by 16.8% of the households. Just as many of the households’ houses in communally owned lots are those in government land (16.9%). This is particularly the case in La union at 25.3% (communally owned) and 23.4% (government-owned), respectively.

12 Supplementary Appendix H
TA No. 7122-PHI: Water District Development Sector Project PPTA – Final Report – Vol. 10
Table 16. Percentage of Households by Type of Building/House by Water District/Geographic Area
Type of building/house Water District
Total
LEGASPI LA UNION LEYTE QUEZON KORONADAL
Single 94.3% 88.5% 94.3% 91.8% 92.9% 92.3%
Duplex 3.1% 8.9% 5.5% 4.4% 2.6% 4.9% Apartment/condominium/townhouse 1.0% 1.3% 0.3% 3.1% 3.8% 1.9% Commercial/industrial/ agricultural bldg 0.0% 0.8% 0.0% 0.3% 0.3% 0.3%
Others 1.6% 0.5% 0.0% 0.5% 0.5% 0.6%
N Cases 385 383 385 388 392 1,933 At 92.3%, single detached house is the predominant dwelling unit among the households in the five water districts. Comparing the 5 water districts, there is no significant deviation from this overall picture as the percentage ranges from 94.3% to 88.5%. Duplex units are also reported in 4.9% of the households; significantly higher at 8.9% in La Union, but not as marked in Koronadal with only 2.6% of the households. Table 17. Percentage of Households by Materials that Predominantly Make Up the
Dwelling Unit by Water District/Geographic Area
Observed materials that make up the dwelling unit
Water District
Total LEGASPI LA UNION LEYTE QUEZON KORONADAL
Strong materials 36.9% 56.5% 15.6% 56.8% 29.3% 39.0%
Light materials 15.3% 14.1% 18.2% 11.6% 19.4% 15.7% Mixed but predominantly strong materials 26.8% 16.7% 34.0% 26.4% 31.6% 27.1% Mixed but predominantly light materials 19.2% 7.6% 30.4% 4.9% 16.8% 15.8%
Salvaged/makeshift
materials 1.3% 5.2% 1.6% 0.3% 2.8% 2.2% Mixed but predominantly salvaged materials 0.5% 0.0% 0.3% 0.0% 0.0% 0.2%
N Cases 385 384 385 387 392 1,933
High vulnerability of 33.9% of the households in the five water districts to the seasonal typhoons in the country is indicated by their dwelling units which are of light materials, mixed but predominantly light materials, salvaged/makeshift materials and mixed but predominantly salvaged materials. This is particularly true in Leyte households with 50.5% of their dwelling units made of light, predominantly light and salvaged materials and with only 15.6% of households living in dwelling units with strong materials.

13 Supplementary Appendix H
TA No. 7122-PHI: Water District Development Sector Project PPTA – Final Report – Vol. 10
Table 18. Percentage of Households by Type of Toilet Facility by Water District/Geographic Area
Type of Toilet Facility Water District
Total LEGASPI LA UNION LEYTE QUEZON KORONADAL
Water-sealed (flush or pourflush) connected to sewerage system 0.0% 0.0% 0.0% 0.5% 1.0% 0.3% Water-sealed (flush or pourflush) connected to septic tank 74.8% 79.6% 70.4% 88.1% 79.6% 78.5% Water-sealed (flush or pourflush) connected to pit 2.6% 8.1% 14.8% 0.5% 9.2% 7.0% Water-sealed (flush or pourflush) connected to drainage 8.3% 0.0% 1.3% 9.5% 0.5% 3.9% Non-water sealed (ventilated improved pit, sanitary pit privy, closed pit) 1.6% 1.0% 6.8% 0.0% 0.5% 2.0% Non-water sealed (open pit privy, overhang) 1.3% 0.0% 0.3% 0.0% 0.0% 0.3% Shared toilet 7.8% 9.9% 4.2% 0.3% 8.9% 6.2% Public toilet 0.5% 0.3% 0.3% 0.3% 0.3% 0.3% No toilet (wrap and throw, arinola, bush, sea/marshland , river 3.1% 1.0% 2.1% 0.8 0.0 1.4%
N Cases 385 383 385 388 393 1,934
On a positive note, sanitation practices is quite satisfactory in the five water districts as 89.7% of households have water-sealed toilets of different sewerage types (sewerage system, septic tank, drainage or pit). This is, however, negated by the fact that 3.7% of total households use non-water sealed toilets (sanitary pit and open pit) and have no toilets at all (2%, 0.3% and 1.4% respectively).

14 Supplementary Appendix H
TA No. 7122-PHI: Water District Development Sector Project PPTA – Final Report – Vol. 10
Table 19. Satisfaction/Dissatisfaction of Households and Reasons Cited for
Dissatisfaction (Multiple Responses) with Current Toilet System by Water District/Geographic Area
Water District
Total LEGASPI LA UNION LEYTE QUEZON KORONADAL
Percent of households satisfied with current toilet system 83.6% 91.6% 88.9% 96.4% 79.9% 88.1%
Percent of households dissatisfied with current toilet system 16.4% 8.4% 11.1% 3.6% 20.1% 11.9%
N Cases 384 383 378 388 393 1,926
Reasons for dissatisfaction
Backflow 36.8% 43.8% 26.2% 36.4% 10.5% 26.6%
Foul odor 17.5% 37.5% 9.5% 18.2% 15.8% 18.3%
Combination of backflow resulting to foul odor and inconvenience 42.1% 15.6% 59.5% 45.5% 61.8% 48.6%
Rodent infestation 0.0% 0.0% 0.0% 0.0% 10.5% 3.7%
Flies/Insects 3.5% 3.1% 4.8% 0.0% 1.3% 2.8%
N Cases 57 32 42 11 76 218
Satisfaction over their current toilet system is generally high in all the water districts, ranging from 80 to 96 percent of the total households. However, among the dissatisfied households, the most dominant reasons are backflow of water most often resulting to foul odor, and inconvenience.

15 Supplementary Appendix H
TA No. 7122-PHI: Water District Development Sector Project PPTA – Final Report – Vol. 10
Table 20. Percentage of Households by Estimated Distance of Septic Tank from
Source of Water by Water District/Geographic Area Distance of septic
tank to nearest water source
Water District
Total LEGASPI LA UNION LEYTE QUEZON KORONADAL
0-4 meters 12.3% 1.7% 6.5% 45.2% 5.6% 14.9%
5-9 meters 15.2% 16.9% 16.1% 37.6% 29.0% 23.4%
10-14 meters 18.8% 29.0% 26.0% 13.0% 26.3% 22.5%
15-19 meters 11.0% 18.8% 10.2% 1.9% 18.0% 11.9%
20-29 meters 17.5% 20.4% 15.8% 1.9% 12.7% 13.4%
30-39 meters 7.8% 4.7% 7.7% 0.3% 3.6% 4.6%
40-49 meters 0.3% 0.8% 1.2% 0.0% 0.0% 0.5%
50 meters or over 17.2% 7.7% 16.4% 0.3% 4.7% 8.8%
Average Distance (in meters) 42.0 meters 20.0 meters 22.9 meters 5.5 meters 15.1 meters 20.4 meters
N Cases 309 362 323 378 338 1,710
The 25-meter minimum distance of septic tank to source of water per National Sanitation Code is not met by most households in the five districts where 72.7% of the households’ septic tanks are located 19 meters and less from the nearest water source. The problem is not as pronounced in La Union which at 57.3% of households is less than the overall average and which has a high average distance of 42 meters. Quezon, at an average of 5.5 meters, has the shortest septic tank distance to drinking water source.

16 Supplementary Appendix H
TA No. 7122-PHI: Water District Development Sector Project PPTA – Final Report – Vol. 10
Table 21. Percentage of Households Willing to Improve Septage System and Type of
Improvement by Water District/Geographic Area
Water District
Total LEGASPI LA UNION LEYTE QUEZON KORONADAL
Percent of HHs that would like to improve septage system
27.5% 23.2% 36.9% 4.9% 27.7% 24.0%
N Cases 385 384 385 388 393 1,935
Type of improvement preferred
Installation of septic tank 22.6% 45.6% 36.6% 26.3% 26.6% 32.4%
Improvement/ rehabilitation of existing septic tank
39.6% 32.2% 57.7% 55.0% 43.1% 45.2%
De-sludging of septic tank 45.3% 26.7% 43.7% 26.3% 27.5% 36.3%
N Cases 106 90 142 20 109 467 Except in Quezon where only 4.9% of households intend to improve septage tank, a good number of households would like to make improvements – 36.9% in Leyte and about one-fourth of households in Koronadal (27.7%), Legaspi (27.5%) and La Union (23.2%). Nature of intended improvements is mostly in the rehabilitation of existing tank (45.2%). Other preferred improvement is in de-sludging of septic tank (36.3%) and in septic tank installation (32.4%)

17 Supplementary Appendix H
TA No. 7122-PHI: Water District Development Sector Project PPTA – Final Report – Vol. 10
Table 22. Percentage of Households who are Willing to Pay for Improvement of Septage System and Amount Willing to Pay (In Pesos) by Water District/Geographic Area
Water District
Total LEGASPI LA UNION LEYTE QUEZON KORONADAL
Percent of households willing to pay for installation of septic tank
15.1% 38.9% 31.7% 21.1% 22.0% 26.6%
N Cases 106 90 142 20 109 467
Amount willing to pay
Less than P10,000 56.3% 33.3% 71.1% 75.0% 41.7% 52.8%
P10,000 - 14,999 25.0% 38.9% 13.3% 25.0% 45.8% 28.8%
P15,000 - 19,999 0.0% 11.1% 8.9% 0.0% 0.0% 6.4%
P20,000 – 25,000 12.5% 5.6% 6.7% 0.0% 0.0% 5.6%
More than P25,000 6.3% 11.1% 0.0% 0.0% 12.5% 6.4%
N Cases 16 36 45 4 24 125
Percent of households willing to pay for improvement/ rehabilitation of existing septic tank
30.2% 23.3% 43.7% 45.0% 34.9% 34.7%
N Cases 106 90 142 20 109 467
Amount willing to pay
Less than P5,000 19.4% 55.0% 42.6% 66.7% 47.4% 42.1%
P5,000 - 9,999 6.5% 15.0% 13.1% 0.0% 0.0% 8.2%
P10,000 - 14,999 51.6% 20.0% 34.4% 33.3% 47.4% 39.0%
P15,000 or over 22.6% 10.0% 9.9% 0.0% 5.3% 10.7%
N Cases 31 20 61 9 38 159
Percent of households willing to pay for de-sludging of septic tank
45.3% 26.7% 43.7% 26.3% 27.5% 36.3%
N Cases 106 90 142 19 109 466
Amount willing to pay

18 Supplementary Appendix H
TA No. 7122-PHI: Water District Development Sector Project PPTA – Final Report – Vol. 10
Less than P1,000 17.6% 12.5% 8.8% 20.0% 50.0% 19.1%
P1,000 - 1,999 11.8% 0.0% 15.8% 20.0% 8.3% 11.8%
P2,000 - 2,999 11.8% 37.5% 14.0% 20.0% 16.7% 16.9%
P3,000 - 3,999 41.2% 0.0% 61.4% 0.0% 16.7% 39.0%
P4,000 - 4,999 0.0% 6.3% 0.0% 0.0% 0.0% 0.7%
P5,000 - 5,999 11.8% 18.8% 0.0% 20.0% 4.2% 6.6%
P7,000 - 7,999 0.0% 18.8% 0.0% 0.0% 0.0% 2.2%
P9,000 - 9,999 0.0% 0.0% 0.0% 0.0% 4.2% 0.7%
P10,000 or more 5.9% 6.3% 0.0% 20.0% 0.0% 2.9%
N Cases 34 16 57 5 24 136
There are three types of septage system improvement signified by the households – septic tank installation, rehabilitation of existing septic tank and de-sludging. The intent of households in the five water districts to install septic tank and to rehabilitate existing septic tank does not match with their willingness to pay for the improvement of septage system: 32.4% intent as against 26.6% willingness to pay septic tank installation, and 45.2% intent versus 34.7% willingness to pay septic tank rehabilitation. This is not so in the case of de-sludging where the households’ 36.3% intent exactly matches their willingness to pay for such upgrading works. Clearly, this indicates the priority that households place on septic tank de-sludging. This overall pattern is true as well in each of the water districts. The cost level of septage system improvement that the households are willing to defray is within the range of less than P10,000 to P14, 999 for septic tank installation (cumulative 79.6% of households), range of less than P5, 000 to P14, 999 for septic tank rehabilitation (cumulatively at 89.3%) and within less than P1,000 to P3,999 for septic tank de-sludging (cumulatively at 86.8%).

19 Supplementary Appendix H
TA No. 7122-PHI: Water District Development Sector Project PPTA – Final Report – Vol. 10
Table 23. Percentage of Households by Primary Source(s) of Water by Water District/Geographic Area (Multiple Responses)
Primary Source(s) of Water
Water District
Total LEGASPI LA UNION LEYTE QUEZON KORONADAL
Piped connection 69.9% 18.2% 75.1% 86.6% 21.4% 54.2%
Shallow well 44.4% 83.6% 46.8% 8.2% 45.3% 45.6%
Water vendors 11.2% 38.0% 5.7% 13.4% 7.4% 15.1%
Deep well 1.8% 9.4% 0.8% 0.3% 32.3% 9.0%
Public/Street faucet 0.8% 0.8% 11.9% 4.4% 1.3% 3.8%
Spring/River/Pond/Stream 4.9% 0.5% 0.5% 7.0% 5.3% 3.7%
Rain 1.6% 0.5% 0.0% 0.3% 8.1% 2.1%
N Cases 385 384 385 388 393 1,935
While a good proportion of households in the five districts get their water from safe sources namely, piped connection and deep well (54.2% and 9% respectively, a total of 63.2%), households still obtain their water from doubtful sources, namely, shallow wells and spring/river/pond/stream (45.5% and 3.7% respectively, a total of 49%). Comparing the five water districts, La Union and Koronadal are not as safely provided with water as the overall situation shows where water sourced from piped connection and deep well is placed at only 18.2% and 9% respectively and where water from shallow well is sourced by 83.6% in La Union. In Koronadal, only 21.4% of households are supplied with water from piped connection.
Table 24. Percentage of Households which are WD-Connected and Non-connected by
Water District/Geographic Area
Water District
Total LEGASPI LA UNION LEYTE QUEZON KORONADAL
WD-connected Households 55.6% 10.7% 31.7% 70.6% 18.3% 37.4%
Non-connected Households 44.4% 89.3% 68.3% 29.4% 81.7% 62.6%
N Cases 385 384 385 388 393 1,935
There is wide disparity among the five water districts with respect to access to piped water, as shown by the data where Quezon and Legaspi households have greater access to water district connection (70.6% and 55% respectively) as against 10.7% in La Union, 18.3% in Koronadal and 31.7% in Leyte.
20 Supplementary Appendix H
TA No. 7122-PHI: Water District Development Sector Project PPTA – Final Report – Vol. 10
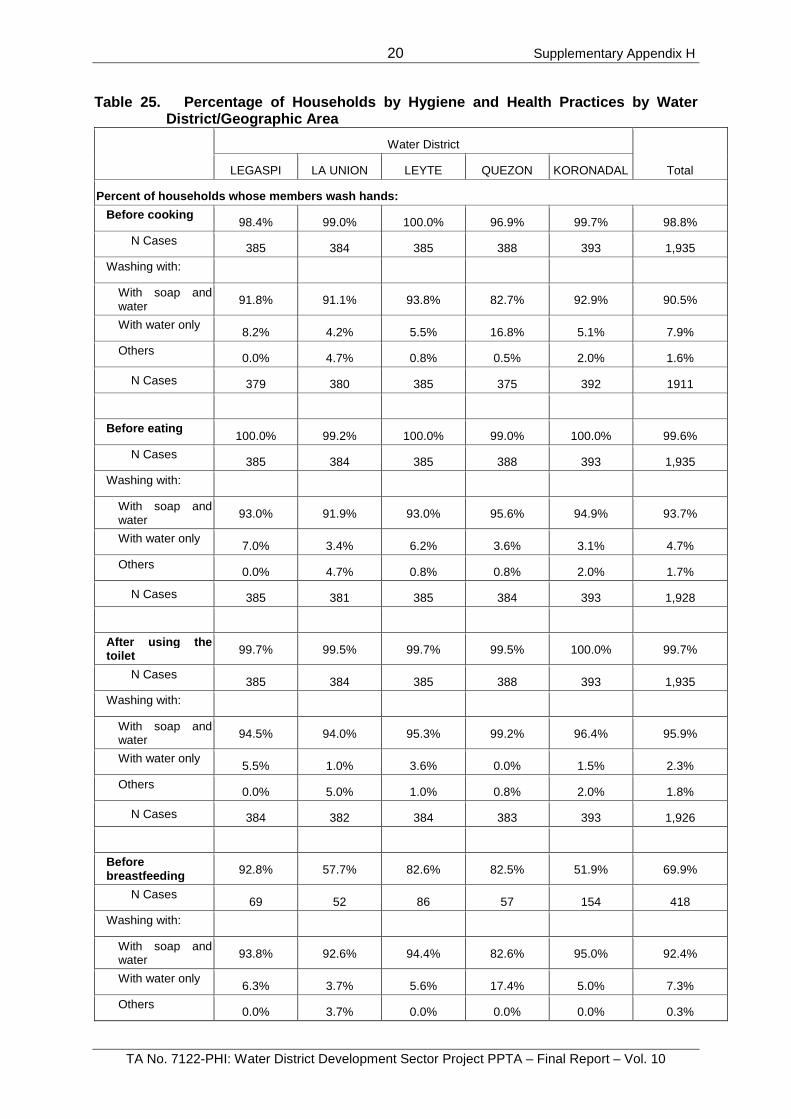
Table 25. Percentage of Households by Hygiene and Health Practices by Water District/Geographic Area
Water District
Total LEGASPI LA UNION LEYTE QUEZON KORONADAL
Percent of households whose members wash hands:
Before cooking 98.4% 99.0% 100.0% 96.9% 99.7% 98.8%
N Cases 385 384 385 388 393 1,935
Washing with:
With soap and water 91.8% 91.1% 93.8% 82.7% 92.9% 90.5%
With water only 8.2% 4.2% 5.5% 16.8% 5.1% 7.9%
Others 0.0% 4.7% 0.8% 0.5% 2.0% 1.6%
N Cases 379 380 385 375 392 1911
Before eating 100.0% 99.2% 100.0% 99.0% 100.0% 99.6%
N Cases 385 384 385 388 393 1,935
Washing with:
With soap and water 93.0% 91.9% 93.0% 95.6% 94.9% 93.7%
With water only 7.0% 3.4% 6.2% 3.6% 3.1% 4.7%
Others 0.0% 4.7% 0.8% 0.8% 2.0% 1.7%
N Cases 385 381 385 384 393 1,928
After using the toilet 99.7% 99.5% 99.7% 99.5% 100.0% 99.7%
N Cases 385 384 385 388 393 1,935
Washing with:
With soap and water 94.5% 94.0% 95.3% 99.2% 96.4% 95.9%
With water only 5.5% 1.0% 3.6% 0.0% 1.5% 2.3%
Others 0.0% 5.0% 1.0% 0.8% 2.0% 1.8%
N Cases 384 382 384 383 393 1,926
Before breastfeeding 92.8% 57.7% 82.6% 82.5% 51.9% 69.9%
N Cases 69 52 86 57 154 418
Washing with:
With soap and water 93.8% 92.6% 94.4% 82.6% 95.0% 92.4%
With water only 6.3% 3.7% 5.6% 17.4% 5.0% 7.3%
Others 0.0% 3.7% 0.0% 0.0% 0.0% 0.3%
21 Supplementary Appendix H
TA No. 7122-PHI: Water District Development Sector Project PPTA – Final Report – Vol. 10
N Cases 64 27 71 46 80 288
Before feeding children 98.2% 83.0% 94.3% 95.3% 64.1% 87.1%
N Cases 163 94 140 170 167 734
Washing with:
With soap and water 93.1% 87.2% 89.4% 93.2% 93.5% 91.7%
With water only 6.9% 3.8% 8.3% 5.6% 5.6% 6.3%
Others 0.0% 9.0% 2.3% 1.2% 0.9% 2.1%
N Cases 160 78 132 161 107 638
After changing diapers 91.7% 69.8% 84.7% 87.6% 52.9% 74.3%
N Cases 84 63 98 89 157 491
Washing with:
With soap and water 89.5% 93.0% 95.2% 92.2% 92.8% 92.5%
With water only 10.5% 4.7% 3.6% 5.2% 7.2% 6.4%
Others 0.0% 2.3% 1.2% 2.6% 0.0% 1.2%
N Cases 76 43 83 77 83 362
After washing the children after toilet
98.8% 89.8% 94.6% 96.8% 81.7% 92.0%
N Cases 164 127 148 188 202 829
Washing with:
With soap and water 93.2% 92.0% 91.4% 97.8% 97.6% 94.7%
With water only 6.8% 1.8% 6.4% 1.1% 1.8% 3.5%
Others 0.0% 6.2% 2.1% 1.1% 0.6% 1.7%
N Cases 162 113 140 181 165 761
Place where children/infants go for toilet purposes
Toilet 91.8% 93.5% 88.9% 99.2% 95.7% 94.0%
Gutter/water canals 2.0% 0.0% 0.7% 0.5% 0.3% 0.7%
River 0.6% 0.0% 0.3% 0.0% 0.0% 0.2%
Garden/backyard 2.3% 2.2% 2.3% 0.0% 1.1% 1.5%
Urinals/urinola 1.4% 0.9% 1.3% 0.0% 1.6% 1.0%
Disposable diapers 2.0% 3.4% 6.5% 0.3% 1.4% 2.6%

22 Supplementary Appendix H
TA No. 7122-PHI: Water District Development Sector Project PPTA – Final Report – Vol. 10
N Cases 353 322 306 365 370 1,716
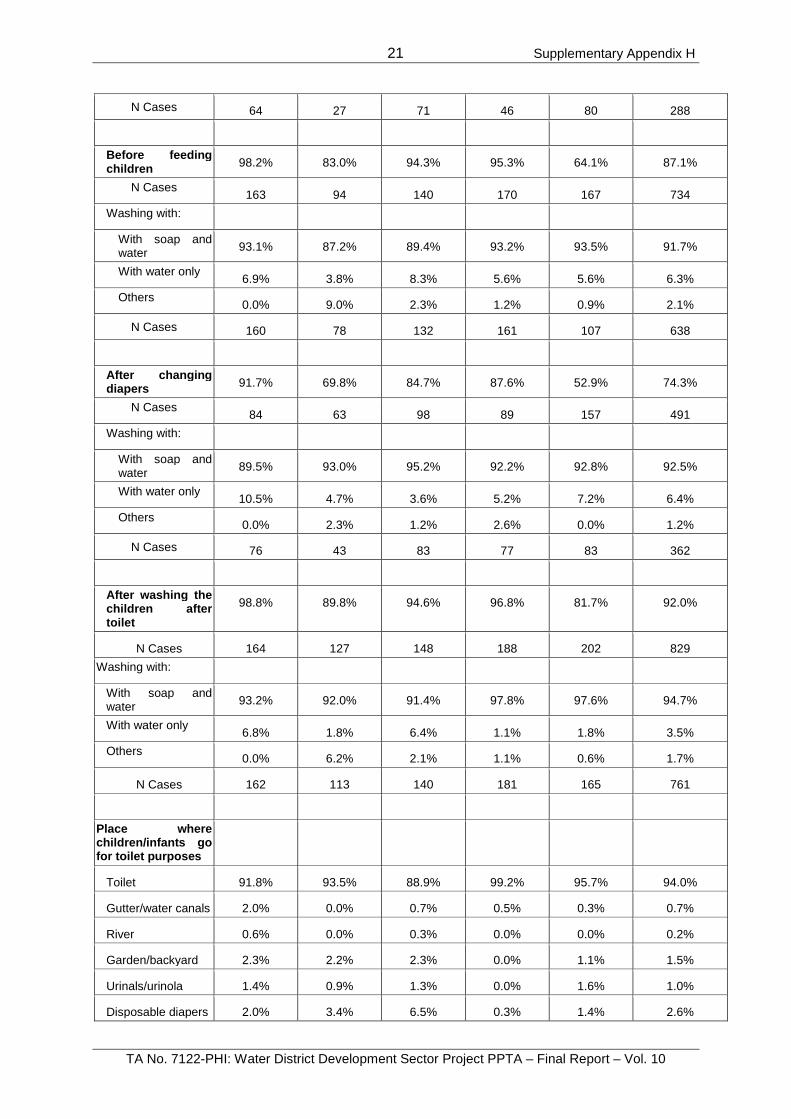
Hand washing, as personal hygiene and health practice, is observed by almost 100% of households in the five water districts after using the toilet, before eating and before cooking, 99.7%, 99.6% and 98.8% respectively but not as widely practiced before breast feeding, after changing diapers, before feeding children and after washing children after toilet: 69.9%, 74.3%, 87.1% and 92% respectively. Proper hand washing, (i.e., with soap and water) in the different occasions that call for such practice is less than the total households who say they practice hand washing. For instance, while almost 100% of households wash hands after using the toilet, before eating and before cooking, there are lesser proportions that do it properly, as hand washing is casually done with just water or other washing material. The variance is 3.8%, 5.9% and 8.3% respectively. Even as hand washing is less practiced by households before breast feeding, after changing diapers and before feeding children, those who practice it do not necessarily do it properly with soap and water. Of those who hand wash in these three occasions only 92.4%, 74.3% and 91.7%, respectively, do hand washing properly. Hand washing practice before breast feeding and after changing diapers is particularly low in Koronadal (51.9% and 52.9 respectively) and La Union (57.7% and 69.8% respectively). Places where children/infants go for toilet are negligibly in unusual latrines (gutter/water canals, river, garden/backyard, urinola) as 94% of households use conventional toilets for the purpose. The proportion ranges from 99.2% (Quezon) to 88.9% (Leyte). The low toilet use in Leyte is accounted for by the popular use of disposable diapers (6.5%). The use of garden/backyard, water canals and disposable diapers (total of 8.2% of households) explains the toilet use of only 91.8% by children/infants in Legaspi.

23 Supplementary Appendix H
TA No. 7122-PHI: Water District Development Sector Project PPTA – Final Report – Vol. 10
Table 26. Percentage of Households by Various Health and Food Security Indicators
by Water District/Geographic Area
Water District
Total LEGASPI LA UNION LEYTE QUEZON KORONADAL
Number of times household eats in a day
1-2 times a day 0.0% 3.1% 1.6% 1.0% 2.0% 1.6%
3 times a day 29.6% 91.4% 82.1% 35.6% 91.6% 66.1%
4 times or more 69.9% 3.9% 15.8% 62.9% 6.4% 31.7%
No information 0.5% 1.6% 0.5% 0.5% 0.0% 0.6%
% of households who have children who died before reaching the age of 6 years
7.0% 9.4% 4.4% 1.5% 3.1% 5.1%
% of households who have at least one member who died during pregnancy or childbirth
1.6% 4.9% 3.9% 0.5% 1.8% 2.5%
N cases 385 384 385 388 393 1,935
Households in the five water districts generally eat three times a day. A relatively high proportion of 31.7% of households are reportedly eating 4 times or more a day, which is likely explained by the daily serving of snacks (merienda). This is particularly the case in Legaspi and Quezon where 69.9% and 62.9% of households respectively eat 4 times or more in a day. Compared to the other water districts, eating less than 3 times a day is relatively high in La Union and Koronadal, with 3.1% and 2% of households, respectively. Child mortality is an incidence in 5.1% of the households in the five water districts, with high prevalence in La Union and Legaspi at 9.4% and 7% respectively. There is death of at least one household member during pregnancy or during childbirth in 2.5% of the households with highest incidence in La Union (9.4%) followed by Legaspi at 7%.

24 Supplementary Appendix H
TA No. 7122-PHI: Water District Development Sector Project PPTA – Final Report – Vol. 10
Table 27. Access to Loans and Borrowings of Households by Water District/Geographic Area
Water District
Total LEGASPI LA UNION LEYTE QUEZON KORONADAL
% of households with member(s) who ever borrowed money
76.9% 62.0% 75.1% 78.9% 69.7% 72.5%
N Cases 385 384 385 388 393 1,935
Number of times household member(s) borrowed during the past year
0 6.9% 9.5% 0.8% 11.8% 2.3% 6.3%
1 23.8% 30.6% 27.1% 17.6% 21.2% 23.8%
2 28.2% 30.2% 32.9% 35.1% 26.2% 30.5%
3 14.1% 10.3% 9.0% 15.1% 22.7% 14.4%
4 5.8% 4.7% 7.5% 4.3% 8.8% 6.2%
5 6.1% 2.6% 2.4% 3.9% 5.8% 4.2%
6 3.2% 0.9% 2.7% 0.7% 4.2% 2.4%
7 1.1% 0.4% 0.8% 0.7% 0.8% 0.8%
8 0.4% 2.2% 0.4% 1.8% 1.2% 1.2%
9 0.4% 0.0% 0.0% 0.0% 0.0% 0.1%
10 1.8% 0.9% 4.3% 3.2% 1.9% 2.5%
More than 10 times 8.3% 7.8% 12.2% 5.7% 5.0% 7.8%
N Cases 277 232 255 279 260 1,303
Sources of credit
Relative/Friend 44.9% 46.2% 37.0% 51.3% 51.8% 46.3%
Five-Six 12.2% 17.2% 18.0% 19.3% 32.5% 19.7%
Micro-finance institution 36.1% 29.0% 7.3% 13.1% 13.1% 19.5%
Cooperative 4.4% 6.3% 21.5% 24.2% 9.9% 13.6%
Bank 7.1% 7.1% 12.8% 8.5% 10.6% 9.3%
Employer 3.7% 2.1% 3.5% 1.6% 6.2% 3.4%
GSIS/SSS 5.4% 1.7% 2.4% 1.6% 2.2% 2.7%
Store 2.0% 0.8% 0.6% 1.0% 6.9% 2.3%
Credit card 1.7% 2.1% 2.4% 1.6% 0.0% 1.6%
Palay/Copra buyer 0.0% 0.0% 2.4% 0.0% 0.0% 0.5%
Pawnshop 0.3% 0.0% 0.0% 0.0% 0.0% 0.1%

25 Supplementary Appendix H
TA No. 7122-PHI: Water District Development Sector Project PPTA – Final Report – Vol. 10
N Cases 296 238 289 306 274 1,403
Purpose for borrowing
Household expenses 45.3% 35.7% 32.9% 43.1% 65.0% 44.5%
Business/Farm inputs 36.5% 36.1% 44.6% 32.7% 20.8% 34.2%
Food 28.7% 31.1% 38.1% 26.1% 44.2% 33.5%
Education 27.7% 20.2% 24.2% 25.8% 43.1% 28.3%
Medical expenses 9.8% 8.8% 12.5% 7.8% 26.6% 13.0%
Pay off debt 3.0% 3.4% 7.3% 1.3% 4.4% 3.8%
Build/Renovate house 4.7% 8.8% 4.5% 0.3% 0.7% 3.6%
Purchase/Repair of furniture/appliances 1.0% 2.9% 3.1% 2.3% 1.8% 2.2%
Fiesta/Entertainment 0.7% 0.4% 5.2% 0.7% 0.7% 1.6%
N Cases 296 238 289 306 274 1,403
Borrowing by a household member(s) is accessed by 72.5% of the households on the average. A year before the survey of the households, 30.5% of the households borrowed twice, 23.8%, only once, 14.4%, thrice. Borrowing at increasing frequencies thereafter is invariably at less than 10% of the households. Informal credit sources (relative/friend and five-six) are accessed by more households, 46.3% and 19.7% respectively. Formal sources are predominantly micro-finance institutions, cooperatives and banks (19.5%, 13.6% and 9.3% respectively). Less than 5% of households avail themselves of credit from employers, GSIS/SSS, stores, credit card palay/copra traders and pawnshops. At 44.5%, household expenses lead as the purpose for borrowing by the households. Listed as a separate household expense, food is cited by 33.5% of the households as their purpose for borrowing. Production/business oriented borrowing is mentioned by 34.2% of households as the reason for borrowing. Other important purposes of household borrowing are education and medical expenses, at 28.3% and 13% respectively. Rational borrowing is indicated by low use of borrowed money for fiesta/entertainment (1.6%) and purchase/repair of furniture/appliances (2.2%), although Leyte accounts for a high 5.2% of households citing fiesta as purpose for borrowing.

Supplementary Appendix H
TA No. 7122-PHI: Water District Development Sector Project PPTA – Final Report – Vol. 10
26
II. Socio-Economic Profile of Households Classified by Type of Household (WD-Connected/Non-Connected)
A. LEGAZPI CITY WATER DISTRICT Table 1. Percentage of Households by Number of Households Living in the Dwelling
Unit: LEGAZPI CITY WATER DISTRICT
Number of HHs in the dwelling unit
Type of Household
Total
WD-connected
HHs
Non-connected
HHs
1 85.0% 89.4% 86.9%
2 10.8% 5.3% 8.4%
3 1.9% 3.5% 2.6%
4 or more 2.3% 1.8% 2.1%
N Cases 213 170 383
Eighty-five percent of WD-connected households and 89.4% of the non-connected households are sole occupants of their dwelling units. On the whole, there are more WD-connected households that live together with other households (10.6%) in one dwelling unit compared to the WD-connected households (15%).

Supplementary Appendix H
TA No. 7122-PHI: Water District Development Sector Project PPTA – Final Report – Vol. 10
27
Table 2. Percentage of Households by Total Number of Household Members:
LEGAZPI CITY WATER DISTRICT
Total number of HH members
Type of Household
Total
WD-connected
HHs
Non-connected
HHs
All members
1-2 5.6% 9.9% 7.5%
3-4 27.2% 26.7% 27.0%
5-6 32.9% 31.4% 32.2%
7-8 21.1% 22.7% 21.8%
9-10 8.0% 7.6% 7.8%
10 or more 5.2% 1.7% 3.6%
Average Household Size 5.8 5.5 5.68
N Cases 213 172 385
Members 14 years old and below
None 30.5% 23.3% 27.3%
1-2 45.5% 39.5% 42.9%
3-4 19.7% 23.3% 21.3%
5-6 3.3% 13.4% 7.8%
7-8 0.9% 0.6% 0.8%
Average Number of HH members
14 years old & below 1.5 2.1 1.8
N Cases 213 172 385
Members 65 years old or over
None 77.5% 79.1% 78.2%
1-2 21.6% 20.9% 21.3%
3-4 0.9% 0.0% 0.5%
5 or more 0.0% 0.0% 0.0%
N Cases 213 172 385 Average household size is slightly higher among the WD-connected households compared to non-connected households, 5.8 versus 5.5. Meanwhile, the proportion of households with more than 6 members is higher among the WD-connected households (34.3%) than among the non-connected households (32.0%).

Supplementary Appendix H
TA No. 7122-PHI: Water District Development Sector Project PPTA – Final Report – Vol. 10
28
The proportion of households with members aged 14 years and below members is higher among the non-connected households (76.7%) than among the WD-connected households (69.5%). Consequently, the average number of young household members is higher among the non-connected households (2.1) compared to the WD-connected households (1.5). With regards to the elderly household members, 22.5% of WD-connected households and 20.9% of non-connected households have members aged 65 and over. Table 3. Percentage of Households by Length of Stay in the Barangay: LEGAZPI
CITY WATER DISTRICT
Number of years in the barangay
Type of Household
Total
WD-connected
HHs
Non-connected
HHs
Less than 10 years 14.2% 14.6% 14.4%
10-19 years 23.2% 31.6% 27.0%
20-29 years 20.9% 14.6% 18.1%
30-39 years 18.0% 15.2% 16.8%
40-49 years 11.8% 8.8% 10.5%
50 years or over 11.8% 15.2% 13.4%
Average length of stay in the barangay 27 years 27 years 27 years
N Cases 211 171 382 The average length of stay of households in the barangay of current residence is 27 years, and the figure does not vary between the WD-connected households and the non-connected households. The percentage of households that have stayed for 10-19 years in their barangay of current residence is significantly higher among the non-connected (31.6%) than among the WD-connected households (23.2%). On the contrary, the percentage of households that have stayed for 20-29 years in their current barangay of residence is significantly higher among the WD-connected (20.9%) than among the non-connected households (14.6%).

Supplementary Appendix H
TA No. 7122-PHI: Water District Development Sector Project PPTA – Final Report – Vol. 10
29
Table 4. Percentage of Households by Average Total Monthly Household Income (in
Pesos) : LEGAZPI CITY WATER DISTRICT
Total monthly income of the HH
Type of Household
Total
WD-connected
HHs
Non-connected
HHs
No income 0.5% 0.0% 0.3%
Less than P 5,000 14.4% 38.0% 25.0%
P 5,000 - 9,999 34.9% 36.8% 35.8%
P 10,000 - 14,999 22.0% 12.9% 17.9%
P 15,000 - 19,999 7.2% 4.7% 6.1%
P 20,000 - 29,999 12.0% 5.3% 8.9%
P 30,000 - 39,999 3.8% 1.2% 2.6%
P 40,000 - 49,999 1.9% 1.2% 1.6%
P 50,000 and over 3.3% 0.0% 1.8%
Average Total Monthly Household Income P 13,488 P 8,169 P 11,094
N Cases 209 171 380 Data generally shows that WD-connected households earn higher income than non-connected households. On the average, a WD-connected household earns P13,488 per month while a non-connected household earns P8,169 per month. Non-connected households mostly earn less than P5,000 (38%) and P5,000 – 9,999 (36.8%).

Supplementary Appendix H
TA No. 7122-PHI: Water District Development Sector Project PPTA – Final Report – Vol. 10
30
Table 5. Percentage of Households by Average Total Monthly Household
Expenditure (in Pesos) : LEGAZPI CITY WATER DISTRICT
Total Monthly Household Expenditure
Type of Household
Total
WD-connected
HHs
Non-connected
HHs
Less than P3,000 2.9% 13.4% 7.7%
P3,000 - 4,999 13.1% 22.7% 17.5%
P5,000 - 9,999 34.0% 40.1% 36.8%
P10,000 - 14,999 26.7% 16.9% 22.2%
P15,000 - 19,999 8.3% 2.3% 5.6%
P20,000 - 29,999 10.7% 3.5% 7.4%
P30,000 - 49,999 2.4% 0.6% 1.6%
P50,000 or over 1.9% 0.6% 1.3%
Average total monthly household expenditure (in Pesos) P 12,845 P 7,845 P 10,570
N Cases 206 172 378 Consistent with the income pattern of households, the average expenditure of WD-connected households (P12,845) is higher than that of the non-connected households (P7,845). Most of the non-connected households (76.2%) spend less than P10,000 per month.

Supplementary Appendix H
TA No. 7122-PHI: Water District Development Sector Project PPTA – Final Report – Vol. 10
31
Table 6. Percentage of Households by Average Total Monthly Household Savings (in
Pesos) : LEGAZPI CITY WATER DISTRICT
Average Total Monthly Savings
Type of Household
Total
WD-connected
HHs
Non-connected
HHs
None 62.7% 69.0% 65.6%
Less than P1,000 16.7% 25.1% 20.5%
P1,000 - 1,999 6.9% 4.1% 5.6%
P2,000 - 2,999 5.4% 0.6% 3.2%
P3,000 - 3,999 1.0% 0.0% 0.5%
P4,000 – 4,999 0.5% 0.0% 0.3%
P5,000 or over 6.9% 1.2% 4.3%
N Cases 204 171 375
Most of the WD-connected (62.7%) and non-connected (69%) households are not able to save. One-fourth of non-connected households and 16.7% of WD-connected are able to save an average of P1,000 per month. Higher amount of monthly savings is achieved by the WD-connected households as shown by the 13.5% of WD-connected versus the 1.8% of non-connected households that are able to save at least P2,000 a month.
Table 7. Percentage of Households by Sex of the Household Head: LEGAZPI CITY
WATER DISTRICT
Sex of the Household Head Type of Household
Total
WD-connected
HHs
Non-connected
HHs
Male 73.2% 75.6% 74.3%
Female 26.8% 24.4% 25.7%
N Cases 213 172 385
Largely, 74.3% of households are male-headed with 73.2% for WD-connected households and 75.6% for non-connected households. Female-headed households are at 26.8% among the WD-connected households and 24.4% of the non-connected households.

Supplementary Appendix H
TA No. 7122-PHI: Water District Development Sector Project PPTA – Final Report – Vol. 10
32
Table 8. Percentage of Households by Highest Grade Completed by the Household
Head: LEGAZPI CITY WATER DISTRICT
Highest Grade Completed by the Household Head
Type of Household
Total
WD-connected
HHs
Non-connected
HHs
No schooling 1.0% 0.6% 0.8%
Elementary 26.0% 37.7% 31.2%
High School 26.9% 40.1% 32.8%
Vocational training 5.3% 5.4% 5.3%
College and over 40.9% 16.2% 29.9%
N Cases 208 167 375
Forty one percent of the heads of WD-connected households have reached at least college level education, indicating the higher educational attainment among the heads of WD-connected households. Majority (77.8%) of the heads of non-connected households have reached either elementary or high school levels.

Supplementary Appendix H
TA No. 7122-PHI: Water District Development Sector Project PPTA – Final Report – Vol. 10
33
Table 9. Percentage of Households by Current Occupation of the Household Head:
LEGAZPI CITY WATER DISTRICT
Current Occupation of the Household Head
Type of Household
Total
WD-connected
HHs
Non-connected
HHs
Farming or fishing 4.7% 19.3% 11.2%
Own business 20.2% 17.0% 18.8%
Government employee 12.7% 4.7% 9.1%
Private employee 13.1% 8.2% 10.9%
Temporary laborer 13.1% 15.2% 14.1%
Street vendor 0.9% 4.1% 2.3%
Retired/Pensioner 10.8% 2.3% 7.0%
Unemployed 10.8% 16.4% 13.3%
Others 13.6% 12.9% 13.3%
N Cases 213 171 384 The percentage of household heads engaged in business, employed in private firms and in government is significantly higher among the WD-connected households (46.0%) compared to those among the non-connected households (29.9%). Consequently, the proportion of those engaged in economic activities in the informal sector (laborer, street vendor, others which drivers and domestic helpers) is higher among the non-connected households. Reliance on pension is more common among the WD-connected households. Moreover, unemployment among the household heads is more prevalent among the non-connected households.

Supplementary Appendix H
TA No. 7122-PHI: Water District Development Sector Project PPTA – Final Report – Vol. 10
34
Table 10. Percentage of Households by Ownership Status of the House Occupied: LEGAZPI CITY WATER DISTRICT
Ownership Status of the House
Type of Household
Total
WD-connected
HHs
Non-connected
HHs
House owner 92.0% 91.3% 91.7%
Caretaker 1.9% 2.3% 2.1%
Rent-free occupant 0.9% 4.1% 2.3%
Renter 4.7% 2.3% 3.6%
Others: relatives, etc 0.5% 0.0% 0.3%
N Cases 213 172 385
Ownership of the occupied housing unit is high as more than 90 percent of the houses are owned by the households dwelling in them. Ninety-two percent of WD-connected households and 91.3% of non-connected households own their houses. Table 11. Percentage of Households by Ownership Status of the Lot on which House
is Built: LEGAZPI CITY WATER DISTRICT
Ownership Status of the Lot
Type of Household
Total
WD-connected
HHs
Non-connected
HHs
Owned 44.8% 36.0% 40.9%
Caretaker 2.4% 5.8% 3.9%
Rented/Leased 9.9% 8.1% 9.1%
Common property with other family members or relatives 3.3% 9.9% 6.3%
Government land 31.6% 33.1% 32.3%
Others 8.0% 7.0% 7.6%
N Cases 212 172 384 Lots on which their houses are built are owned by 44.8% of the WD-connected households and 36% of non-connected households. Almost thirty two percent of the WD-connected households and 33.1% percent of non-connected households occupy houses built on government land. Renting or leasing of land is slightly more prevalent among the WD-connected households (9.9%) than among the non-connected households (8.1%). There are more non-connected households co-owning their home lots with other family members or relatives (9.9%) than the WD-connected households (3.3%).

Supplementary Appendix H
TA No. 7122-PHI: Water District Development Sector Project PPTA – Final Report – Vol. 10
35
Table 12. Percentage of Households by Type of Building/House: LEGAZPI CITY WATER DISTRICT
Type of building/house
Type of Household
Total
WD-connected
HHs
Non-connected
HHs
Single 92.0% 97.1% 94.3%
Duplex 4.2% 1.7% 3.1%
Apartment/condominium/townhouse 1.9% 0.0% 1.0%
Commercial/industrial/ agricultural bldg 0.0% 0.0% 0.0%
Others 1.9% 1.2% 1.6%
N Cases 213 172 385 Most of the households, 92% of WD-connected households and 97.1% of non-connected households, are living in single detached type of dwelling unit. There are more connected households living in duplex and multiple type of houses (6.1%) than non-connected households (1.7%).
Table 13. Percentage of Households by Materials that Predominantly Make Up the
Dwelling Unit: LEGAZPI CITY WATER DISTRICT
Observed materials that make up the dwelling unit
Type of Household
Total
WD-connected
HHs
Non-connected
HHs
Strong materials 52.6% 17.4% 36.9%
Light materials 13.1% 18.0% 15.3%
Mixed but predominantly strong materials 20.7% 34.3% 26.8%
Mixed but predominantly light materials 12.7% 27.3% 19.2%
Salvaged/makeshift materials 0.5% 2.3% 1.3%
Mixed but predominantly salvaged materials 0.5% 0.6% 0.5%
N Cases 213 172 385
More than half (52.6%) of the WD-connected households’ houses are made up of strong materials as compared with 17.4% for non-connected households. However, houses made up of mixed but predominantly strong materials (34.3%) were highest for non-connected household as opposed to 20.7% of WD-connected households. On the whole, data shows that WD-connected households appear to be living in dwelling units made up of stronger materials compared to the non-connected households.

Supplementary Appendix H
TA No. 7122-PHI: Water District Development Sector Project PPTA – Final Report – Vol. 10
36
Table 14. Percentage of Households by Primary Sources of Water (Multiple
Responses): LEGAZPI CITY WATER DISTRICT
Primary Source of Water
Type of Household
Total
WD-connected
HHs
Non-connected
HHs
Piped connection 100.0% 32.6% 69.9%
Public/Street faucet 0.0% 1.7% 0.8%
Deep well 0.0% 4.1% 1.8%
Shallow well 19.2% 75.6% 44.4%
Spring/River/Pond/Stream 2.3% 8.1% 4.9%
Rain 0.5% 2.9% 1.6%
Water vendors 14.6% 7.0% 11.2%
N Cases 213 172 385
About 19 percent of the households with water connection also get water from shallow wells (19.2%), water vendors (14.6%), spring/river/pond/stream (2.3%) and rain (0.5%). Non-connected households obtain their water from combination of various water sources such as shallow wells (75.6%), piped connection (32.6%), spring/river/pond/stream (8.1%), water vendors (7%) and/or deep wells and rain (7%).

Supplementary Appendix H
TA No. 7122-PHI: Water District Development Sector Project PPTA – Final Report – Vol. 10
37
Table 15. Percentage of Households by Type of Toilet Facility: LEGAZPI CITY WATER
DISTRICT
Type of Toilet Facility
Type of Household
Total
WD-connected
HHs
Non-connected
HHs
Water-sealed (flush or pourflush) connected to septic tank 91.5% 54.1% 74.8%
Water-sealed (flush or pourflush) connected to pit 1.4% 4.1% 2.6%
Water-sealed (flush or pourflush) connected to drainage 2.3% 15.7% 8.3%
Non-water sealed (ventilated improved pit, sanitary pit privy, closed pit) 0.5% 2.9% 1.6%
Non-water sealed (open pit privy, overhang) 0.5% 2.3% 1.3%
Shared toilet 3.3% 13.4% 7.8%
Public toilet 0.0% 1.2% 0.5%
No toilet (wrap and throw, arinola, bush, sea/marshland , river 0.5% 6.4% 3.1%
N Cases 213 172 385
Most of the WD-connected households (91.5%) use water-sealed toilets connected to septic tanks. The rest of the WD-connected respondents (8%) use toilets that are shared, public, non-water sealed, water-sealed connected to drainage and water-sealed connected to pit. More than half (54.1%) of the non-connected households use water-sealed toilets connected to septic tanks. Water-sealed toilet connected to drainage is used by 15.7% of the non-connected households. Non-connected households sharing toilet facilities is at 13.4%. Percentage without toilet facilities is at 6.4% among the non-connected households, and a negligible 0.5% among the WD-connected households.

Supplementary Appendix H
TA No. 7122-PHI: Water District Development Sector Project PPTA – Final Report – Vol. 10
38
B. METRO LA UNION WATER DISTRICT Table 1. Percentage of Households by Number of Households Living in the Dwelling
Unit: METRO LA UNION WATER DISTRICT
Number of HHs in the dwelling unit
Type of Household
Total
WD-connected
HHs
Non-connected
HHs
1 81.0% 76.9% 77.3%
2 19.0% 18.7% 18.8%
3 0.0% 2.9% 2.6%
4 or more 0.0% 1.5% 1.3%
N Cases 42 342 384 The proportion of eighty-one percent of connected households with sole household occupants is considerably higher than the 76.9% in non-connected households. Noticeably, connected households have at most households in the dwelling unit while non-connected households have two to four or more. Multiple households in a dwelling unit is higher in non-connected (23.1%) than those in connected households (19%).

Supplementary Appendix H
TA No. 7122-PHI: Water District Development Sector Project PPTA – Final Report – Vol. 10
39
Table 2. Percentage of Households by Total Number of Household Members: METRO
LA UNION WATER DISTRICT
Total number of HH members
Type of Household
Total
WD-connected
HHs
Non-connected
HHs
All members
1-2 9.5% 9.1% 9.1%
3-4 33.3% 34.8% 34.6%
5-6 35.7% 34.5% 34.6%
7-8 16.7% 14.9% 15.1%
9-10 2.4% 2.3% 2.3%
10 or more 2.4% 4.4% 4.2%
Average Household Size 5.02 5.12 5.11
N Cases 42 342 384
Members 14 years old and below
None 31.0% 29.8% 29.9%
1-2 50.0% 48.2% 48.4%
3-4 19.0% 18.4% 18.5%
5-6 0.0% 2.6% 2.3%
7-8 0.0% .6% .5%
9-10 0.0% .3% .3%
Average Number of HH members
14 years old & below 1.33 1.49 1.47
N Cases 42 342 384
Members 65 years or over
None 69.0% 77.8% 76.8%
1-2 31.0% 21.3% 22.4%
3-4 0.0% 0.3% 0.3%
5 or more 0.0% 0.6% 0.5%
N Cases 42 342 384 Average household size for connected households is 5.02 while it is 5.12 in non-connected households. The average number of fourteen years old and below in households is 1.33 in connected households and 1.49 in non-connected households.
Supplementary Appendix H
TA No. 7122-PHI: Water District Development Sector Project PPTA – Final Report – Vol. 10
40
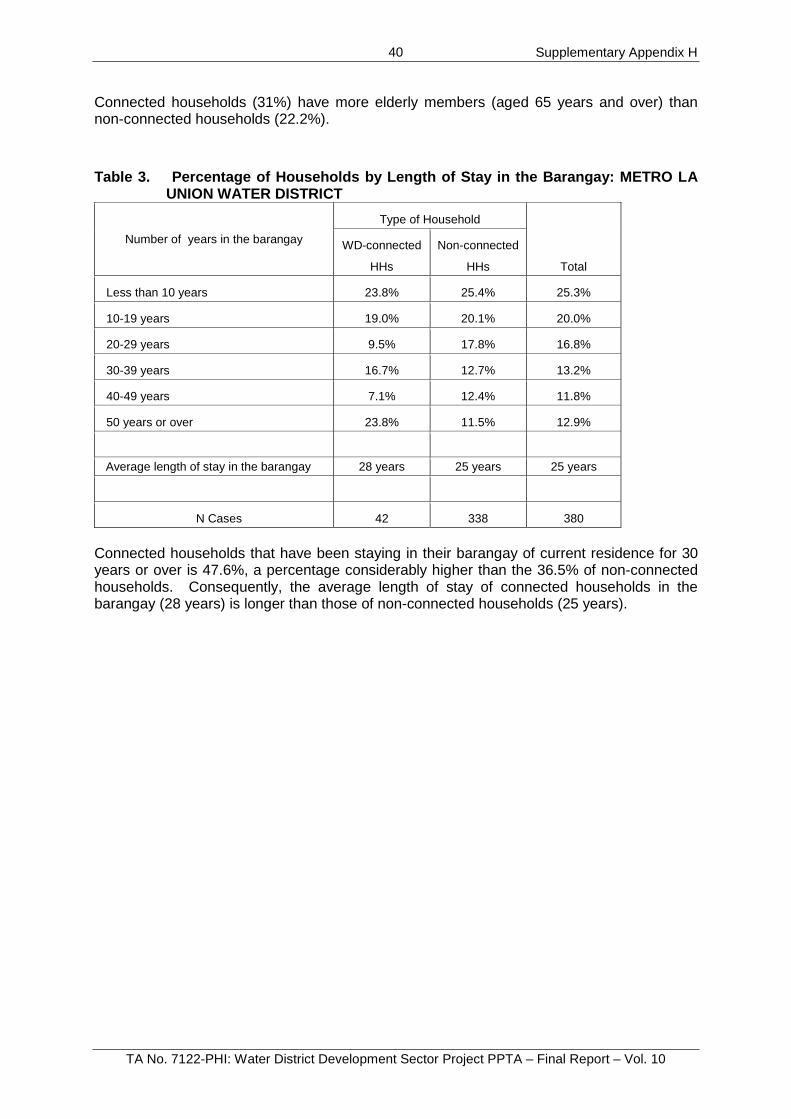
Connected households (31%) have more elderly members (aged 65 years and over) than non-connected households (22.2%). Table 3. Percentage of Households by Length of Stay in the Barangay: METRO LA
UNION WATER DISTRICT
Number of years in the barangay
Type of Household
Total
WD-connected
HHs
Non-connected
HHs
Less than 10 years 23.8% 25.4% 25.3%
10-19 years 19.0% 20.1% 20.0%
20-29 years 9.5% 17.8% 16.8%
30-39 years 16.7% 12.7% 13.2%
40-49 years 7.1% 12.4% 11.8%
50 years or over 23.8% 11.5% 12.9%
Average length of stay in the barangay 28 years 25 years 25 years
N Cases 42 338 380
Connected households that have been staying in their barangay of current residence for 30 years or over is 47.6%, a percentage considerably higher than the 36.5% of non-connected households. Consequently, the average length of stay of connected households in the barangay (28 years) is longer than those of non-connected households (25 years).

Supplementary Appendix H
TA No. 7122-PHI: Water District Development Sector Project PPTA – Final Report – Vol. 10
41
Table 4. Percentage of Households by Average Total Monthly Household Income (in
Pesos): METRO LA UNION WATER DISTRICT
Total monthly household income
Type of Household
Total
WD-connected
HHs
Non-connected
HHs
No income 2.4% 0.3% 0.5%
Less than P 5,000 9.8% 22.0% 20.7%
P 5,000 - 9,999 24.4% 33.3% 32.4%
P 10,000 - 14,999 22.0% 19.9% 20.2%
P 15,000 - 19,999 14.6% 10.7% 11.1%
P 20,000 - 29,999 17.1% 6.8% 8.0%
P 30,000 - 39,999 4.9% 2.4% 2.7%
P 40,000 - 49,999 2.4% 1.5% 1.6%
P 50,000 and over 2.4% 3.0% 2.9%
Average Total Monthly Household Income (in Pesos) P 15,746 P 12,206 P 12,591
N Cases 41 336 377
Non-connected households have lower average monthly income of P12,206 compared to P15,746 monthly earnings of connected households. Households earning less than 14,999 are 75.2% of the non-connected households and 56.2% of the connected households. There are more households without earnings in connected households (2.4%) than those in non-connected households (.3%).

Supplementary Appendix H
TA No. 7122-PHI: Water District Development Sector Project PPTA – Final Report – Vol. 10
42
Table 5. Percentage of Households by Average Total Monthly Household
Expenditure (in Pesos) : METRO LA UNION WATER DISTRICT
Total Monthly Expenditure
Type of Household
Total
WD-connected
HHs
Non-connected
HHs
Less than P3,000 2.5% 9.4% 8.6%
P3,000 - 4,999 5.0% 21.9% 20.0%
P5,000 - 9,999 40.0% 38.4% 38.6%
P10,000 - 14,999 17.5% 15.6% 15.8%
P15,000 - 19,999 20.0% 7.5% 8.9%
P20,000 - 29,999 5.0% 3.8% 3.9%
P30,000 - 49,999 10.0% 2.8% 3.6%
P50,000 or over 0.0% 0.6% 0.6%
Average total monthly household expenditure (in Pesos) P 13,444 P 10,362 P 10,704
N Cases 40 320 360
Consistent with their incomes, the average monthly household expenditure of connected households (P13,444) is higher than in non-connected households (P10,362). Apparently, more connected households (35%) spend from P15,000 or over than non-connected households (14.7%). Conversely, the proportion of non-connected households (69.7%) spending less than P10,000 is higher compared to the connected households with 47.5%.
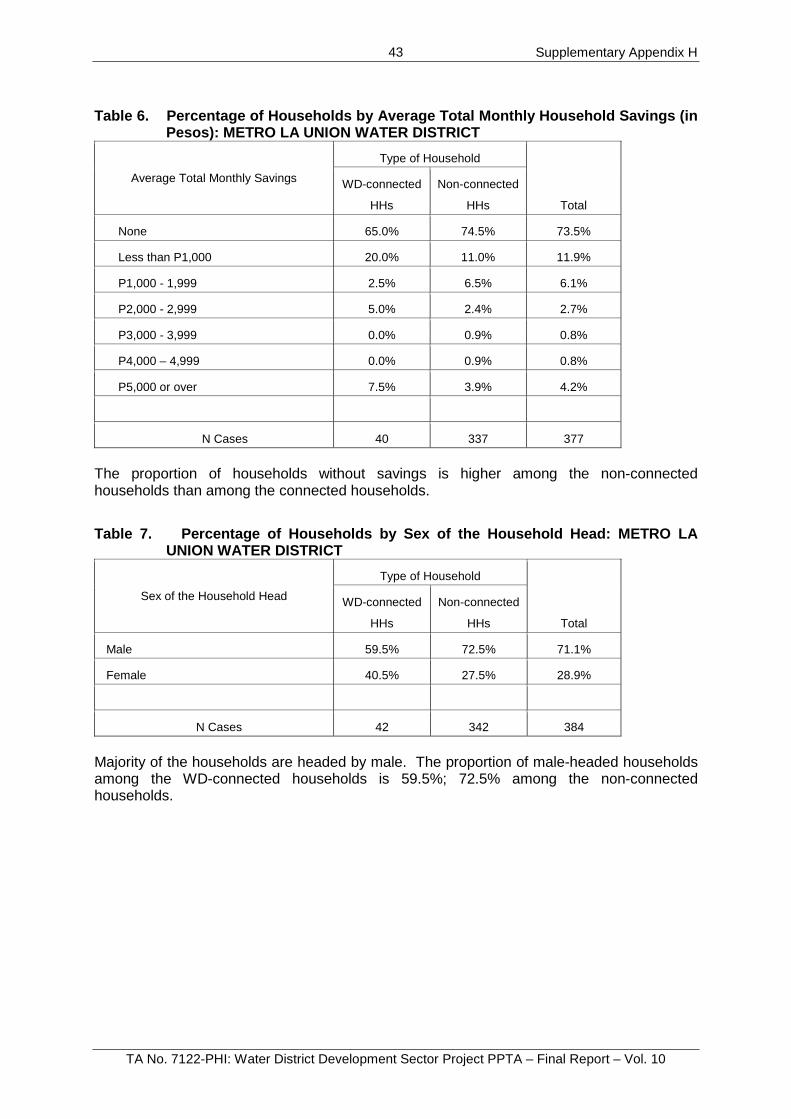
Supplementary Appendix H
TA No. 7122-PHI: Water District Development Sector Project PPTA – Final Report – Vol. 10
43
Table 6. Percentage of Households by Average Total Monthly Household Savings (in
Pesos): METRO LA UNION WATER DISTRICT
Average Total Monthly Savings
Type of Household
Total
WD-connected
HHs
Non-connected
HHs
None 65.0% 74.5% 73.5%
Less than P1,000 20.0% 11.0% 11.9%
P1,000 - 1,999 2.5% 6.5% 6.1%
P2,000 - 2,999 5.0% 2.4% 2.7%
P3,000 - 3,999 0.0% 0.9% 0.8%
P4,000 – 4,999 0.0% 0.9% 0.8%
P5,000 or over 7.5% 3.9% 4.2%
N Cases 40 337 377
The proportion of households without savings is higher among the non-connected households than among the connected households.
Table 7. Percentage of Households by Sex of the Household Head: METRO LA
UNION WATER DISTRICT
Sex of the Household Head Type of Household
Total
WD-connected
HHs
Non-connected
HHs
Male 59.5% 72.5% 71.1%
Female 40.5% 27.5% 28.9%
N Cases 42 342 384
Majority of the households are headed by male. The proportion of male-headed households among the WD-connected households is 59.5%; 72.5% among the non-connected households.

Supplementary Appendix H
TA No. 7122-PHI: Water District Development Sector Project PPTA – Final Report – Vol. 10
44
Table 8. Percentage of Households by Highest Grade Completed by the Household
Head: METRO LA UNION WATER DISTRICT
Highest Grade Completed by the Household Head
Type of Household
Total
WD-connected
HHs
Non-connected
HHs
No schooling 0.0% 0.9% 0.8%
Elementary 9.5% 18.0% 17.1%
High School 33.3% 42.9% 41.8%
Vocational training 14.3% 14.5% 14.5%
College and over 42.9% 23.7% 25.8%
N Cases 42 338 380
There is a higher proportion of highly educated household heads among the connected households (42.9%) compared to the non-connected households). Non-connected households have 42.9% household heads who have reached the high school level compared to the 33.3% of the connected households. Further, more household heads in non-connected households (18%) have elementary education compared to heads of connected households (9.5%). Data shows that household heads in connected households are able to achieve higher education than those in non-connected households.

Supplementary Appendix H
TA No. 7122-PHI: Water District Development Sector Project PPTA – Final Report – Vol. 10
45
Table 9. Percentage of Households by Current Occupation of the Household Head: METRO LA UNION WATER DISTRICT
Current Occupation of the Household Head
Type of Household
Total
WD-connected
HHs
Non-connected
HHs
Farming or fishing 7.1% 16.1% 15.1%
Own business 16.7% 9.7% 10.4%
Government employee 11.9% 3.5% 4.4%
Private employee 9.5% 7.6% 7.8%
Temporary labourer 2.4% 5.9% 5.5%
Street vendor 0.0% 1.8% 1.6%
Retired/Pensioner 16.7% 6.5% 7.6%
Unemployed 23.8% 15.2% 16.2%
Others 11.9% 33.7% 31.3%
N Cases 42 341 383
Unemployment of the household head is more prevalent among the connected households with 23.8% compared to non-connected households with 15.2%. Private and government employees are currently in 21.4% of connected households but less in non-connected households with 11.1%. Business endeavors are undertaken by more households with connection (16.7%) than in non-connected households (9.7%). Likewise, household heads dependent on pension is higher in connected households with 16.7% than in non-connected households with 6.5%. On the other hand, occupation on farming and fishing are engaged in by more in households without connection (16.1%) than those with connection (7.1%).

Supplementary Appendix H
TA No. 7122-PHI: Water District Development Sector Project PPTA – Final Report – Vol. 10
46
Table 10. Percentage of Households by Ownership Status of the House Occupied:
METRO LA UNION WATER DISTRICT
Ownership Status of the House
Type of Household
Total
WD-connected
HHs
Non-connected
HHs
House owner 81.0% 83.0% 82.8%
Caretaker 7.1% 3.2% 3.6%
Rent-free occupant 7.1% 7.0% 7.0%
Renter 2.4% 5.3% 4.9%
Others: relatives, etc 2.4% 1.5% 1.6%
N Cases 42 342 384
More than eighty percent of the households own the houses they occupy. A higher proportion of connected households (19%) do not own the houses they reside in as compared to 17% of the non-connected households. Table 11. Percentage of Households by Ownership Status of the Lot on which House
is Built: METRO LA UNION WATER DISTRICT
Ownership Status of the Lot
Type of Household
Total
WD-connected
HHs
Non-connected
HHs
Owned 66.7% 38.0% 41.1%
Caretaker 4.8% 4.4% 4.4%
Rented/Leased 2.4% 6.1% 5.7%
Common property with other family members or relatives 26.2% 22.2% 22.7%
Government land 0.0% 26.3% 23.4%
Others 0.0% 2.9% 2.6%
N Cases 42 342 384
Ownership of occupied lot is more common among the connected households (66.7%) than among the non-connected households (38%). Shared ownership with relatives is also higher among connected households (26.2%) than in non-connected households (22.2%). A big proportion of non-connected households (26.3%) are residing on houses built on government lands.

Supplementary Appendix H
TA No. 7122-PHI: Water District Development Sector Project PPTA – Final Report – Vol. 10
47
Table 12. Percentage of Households by Type of Building/House: METRO LA UNION WATER DISTRICT
Type of building/house
Type of Household
Total
WD-connected
HHs
Non-connected
HHs
Single 95.2% 87.7% 88.5%
Duplex 2.4% 9.7% 8.9%
Apartment/condominium/townhouse 2.4% 1.2% 1.3%
Commercial/industrial/ agricultural bldg 0.0% 0.9% 0.8%
Others 0.0% 0.6% 0.5%
N Cases 42 341 383
Almost all of the homes of connected households (95.2%) and 87.7% of non-connected households are of the single detached type. There are more duplex type homes among non-connected households (9.7%) than in connected households (2.4%). Likewise, households in apartments/condominiums/townhouses are greater in connected households (2.4%) than in non-connected households (1.2%).
Table 13. Percentage of Households by Materials that Predominantly Make Up the
Dwelling Unit: METRO LA UNION WATER DISTRICT
Observed materials that make up the dwelling unit
Type of Household
Total
WD-connected
HHs
Non-connected
HHs
Strong materials 81.0% 53.5% 56.5%
Light materials 9.5% 14.6% 14.1%
Mixed but predominantly strong materials 7.1% 17.8% 16.7%
Mixed but predominantly light materials 2.4% 8.2% 7.6%
Salvaged/makeshift materials 0.0% 5.8% 5.2%
Mixed but predominantly salvaged materials 0.0% 0.0% 0.0%
N Cases 42 342 384
Dwelling units made up of strong and mixed but predominantly strong materials are observed in 88% of connected households and 71.3% of non-connected households. On the other hand, houses made up of light materials and mixed but predominantly light materials are more common among the non-connected households (22.8%) than in connected households (11.9%).

Supplementary Appendix H
TA No. 7122-PHI: Water District Development Sector Project PPTA – Final Report – Vol. 10
48
Table 14. Percentage of Households by Primary Sources of Water (Multiple Responses): METRO LA UNION WATER DISTRICT
Primary Source of Water
Type of Household
Total
WD-connected
HHs
Non-connected
HHs
Piped connection 100.0% 8.2% 18.2%
Public/Street faucet 0.0% 0.9% 0.8%
Deep well 2.4% 10.2% 9.4%
Shallow well 38.1% 89.2% 83.6%
Spring/River/Pond/Stream 0.0% 0.6% 0.5%
Rain 0.0% 0.6% 0.5%
Water vendors 28.6% 39.2% 38.0%
N Cases 42 342 384
Primary sources of water of most households were from shallow wells (83.6%) and water vendors (38%). Water from piped connection is availed of by 18.2% of the total households. Specifically, 38.1% of households with piped connection still get water from shallow wells, 28.6% purchase water vendors and 2.4% pump water from deep wells. Non-connected households obtain water mostly from shallow wells (89.2%), water vendors (39.2%), deep well (10.2%) and piped connection (8.2%).

Supplementary Appendix H
TA No. 7122-PHI: Water District Development Sector Project PPTA – Final Report – Vol. 10
49
Table 15. Percentage of Households by Type of Toilet Facility: METRO LA UNION
WATER DISTRICT
Type of Toilet Facility
Type of Household
Total
WD-connected
HHs
Non-connected
HHs
Water-sealed (flush or pourflush) connected to septic tank 100.0% 77.1% 79.6%
Water-sealed (flush or pourflush) connected to pit 0.0% 9.1% 8.1%
Non-water sealed (ventilated improved pit, sanitary pit privy, closed pit) 0.0% 1.2% 1.0%
Shared toilet 0.0% 11.1% 9.9%
Public toilet 0.0% 0.3% 0.3%
No toilet (wrap and throw, arinola, bush, sea/marshland , river 0.0% 1.2% 1.0%
N cases 42 341 383
Practically all of the WD-connected households and 77.1% of non-connected households use the water-sealed toilet connected to septic tank. More than one-fifth of the non-connected households use toilet facilities which are either connected to pit, shared/ public. Some 1.2% of the non-connected households have no toilets at all.

Supplementary Appendix H
TA No. 7122-PHI: Water District Development Sector Project PPTA – Final Report – Vol. 10
50
C. LEYTE METRO WATER DISTRICT Table 1. Percentage of Households by Number of Households Living in the Dwelling
Unit: LEYTE METRO WATER DISTRICT
Number of HHs in the dwelling unit
Type of Household
Total
WD-connected
HHs
Non-connected
HHs
1 95.1% 94.3% 94.5%
2 4.1% 3.8% 3.9%
3 0.8% 1.5% 1.3%
4 or more 0.0% 0.4% 0.3%
N Cases 122 261 383
Occupancy of the dwelling unit by a single household is 95.1% among the connected households and 94.3% among non-connected households.

Supplementary Appendix H
TA No. 7122-PHI: Water District Development Sector Project PPTA – Final Report – Vol. 10
51
Table 2. Percentage of Households by Total Number of Household Members: LEYTE
METRO WATER DISTRICT
Total number of HH members
Type of Household
Total
WD-connected
HHs
Non-connected
HHs
All members
1-2 5.0% 9.5% 8.1%
3-4 32.2% 33.1% 32.8%
5-6 26.4% 27.0% 26.8%
7-8 19.0% 15.2% 16.4%
9-10 9.9% 11.4% 10.9%
10 or more 7.4% 3.8% 4.9%
Average Household Size 5.97 5.52 5.66
N Cases 121 263 384
Members 14 years old and below
None 33.9% 27.4% 29.4%
1-2 37.2% 38.8% 38.3%
3-4 19.8% 24.3% 22.9%
5-6 8.3% 7.6% 7.8%
7-8 0.8% 1.9% 1.6%
Average Number of HH members
14 years old & below 1.7 1.9 1.8
N Cases 121 263 384
Members 65 years or over
None 59.5% 82.1% 75.0%
1-2 39.7% 17.5% 24.5%
3-4 0.8% 0.4% 0.5%
5 or more 0.0% 0.0% 0.0%
N Cases 121 263 384
The average size of WD-connected households is about 6, and a lower 5.5 for the non-connected households. There are more non-connected households (72.6%) than connected households (66.1%) with members who are below 15 years old. On the other hand, more

Supplementary Appendix H
TA No. 7122-PHI: Water District Development Sector Project PPTA – Final Report – Vol. 10
52
connected households (40.5%) have at least one elderly member compared to the non-connected households (17.9%). Table 3. Percentage of Households by Length of Stay in the Barangay: LEYTE
METRO WATER DISTRICT
Number of years in the barangay
Type of Household
Total
WD-connected
HHs
Non-connected
HHs
Less than 10 years 18.0% 25.2% 22.9%
10-19 years 24.6% 27.9% 26.8%
20-29 years 26.2% 16.8% 19.8%
30-39 years 12.3% 11.8% 12.0%
40-49 years 4.1% 7.6% 6.5%
50 years or over 14.8% 10.7% 12.0%
Average length of stay in the barangay 27 years 23 years 24 years
N cases 122 262 384 Average length of stay of WD-connected households in the barangays where they currently reside is 27 years -- four years longer than those of the non-connected households (23 years).

Supplementary Appendix H
TA No. 7122-PHI: Water District Development Sector Project PPTA – Final Report – Vol. 10
53
Table 4. Percentage of Households by Average Total Monthly Household Income (in Pesos): LEYTE METRO WATER DISTRICT
Average total monthly income of the HH
Type of Household
Total
WD-connected
HHs
Non-connected
HHs
Less than P 5,000 7.4% 15.3% 12.8%
P 5,000 - 9,999 33.6% 43.1% 40.1%
P 10,000 - 14,999 23.8% 19.5% 20.8%
P 15,000 - 19,999 14.8% 9.9% 11.5%
P 20,000 - 29,999 9.8% 4.2% 6.0%
P 30,000 - 39,999 7.4% 4.6% 5.5%
P 40,000 - 49,999 0.8% 1.5% 1.3%
P 50,000 and over 2.5% 1.9% 2.1%
Average Total Monthly Household Income (in Pesos) P 15,109 P 12,136 P 13,080
N Cases 122 262 384 Higher average income is evident among connected households (P15,109) as compared to non-connected households (P12,136).

Supplementary Appendix H
TA No. 7122-PHI: Water District Development Sector Project PPTA – Final Report – Vol. 10
54
Table 5. Percentage of Households by Average Total Monthly Household
Expenditure (in Pesos): LEYTE METRO WATER DISTRICT
Average Total Monthly Expenditure
Type of Household
Total
WD-connected
HHs
Non-connected
HHs
Less than P3,000 2.5% 10.0% 7.7%
P3,000 - 4,999 8.4% 13.5% 11.9%
P5,000 - 9,999 40.3% 44.4% 43.1%
P10,000 - 14,999 21.8% 17.8% 19.0%
P15,000 - 19,999 16.0% 4.2% 7.9%
P20,000 - 29,999 5.9% 6.9% 6.6%
P30,000 - 49,999 5.0% 1.9% 2.9%
P50,000 or over 0.0% 1.2% 0.8%
Average total monthly household expenditure (in Pesos) P 12,151 P 9,898 P 10,608
N Cases 119 259 378 Consistent with their average incomes, connected households have higher average expenditure of P12,151 per month compared to the non-connected households with just P9,898 per month. Majority of the households spend less than P15,000 a month.

Supplementary Appendix H
TA No. 7122-PHI: Water District Development Sector Project PPTA – Final Report – Vol. 10
55
Table 6. Percentage of Households by Average Total Monthly Household Savings (in
Pesos): LEYTE METRO WATER DISTRICT
Average Total Monthly Savings
Type of Household
Total
WD-connected
HHs
Non-connected
HHs
None 57.9% 54.0% 55.2%
Less than P1,000 20.7% 25.5% 24.0%
P1,000 - 1,999 11.6% 7.6% 8.9%
P2,000 - 2,999 5.8% 6.5% 6.3%
P3,000 - 3,999 0.8% 2.3% 1.8%
P4,000 – 4,999 0.8% 1.5% 1.3%
P5,000 or over 2.5% 2.7% 2.6%
N Cases 121 263 384
More than half, or 57.9% of connected households and 54% of non-connected households, do not have savings. However, a higher percentage of non-connected households (46%) are able to save money compared to the connected households (42.1%).
Table 7. Percentage of Households by Sex of the Household Head: LEYTE METRO
WATER DISTRICT
Sex of the Household Head Type of Household
Total
WD-connected
HHs
Non-connected
HHs
Male 77.0% 86.3% 83.4%
Female 23.0% 13.7% 16.6%
N Cases 122 263 385
Majority of the households are male-headed. There are more non-connected households (86.3%) that are headed by male compared to the connected households (77%). Conversely, the proportion of female-headed households is higher among connected households (23%) than in non connected households (13.7%).

Supplementary Appendix H
TA No. 7122-PHI: Water District Development Sector Project PPTA – Final Report – Vol. 10
56
Table 8. Percentage of Households by Highest Grade Completed by the Household
Head: LEYTE METRO WATER DISTRICT
Highest Grade Completed by the Household Head
Type of Household
Total
WD-connected
HHs
Non-connected
HHs
No schooling 0.8% 2.7% 2.1%
Elementary 23.3% 37.5% 33.0%
High School 42.5% 40.5% 41.2%
Vocational training 1.7% 1.9% 1.8%
College and over 31.7% 17.4% 21.9%
N Cases 120 259 379 High proportion of households, 42.5% of connected households and 40.5% of non-connected households, has household heads with high school education. Significantly, a higher percentage of 31.7% household heads of connected households are highly educated compared to the 19.3% of non-connected households. This implies higher educational attainment among the heads of connected households.

Supplementary Appendix H
TA No. 7122-PHI: Water District Development Sector Project PPTA – Final Report – Vol. 10
57
Table 9. Percentage of Households by Current Occupation of the Household Head:
LEYTE METRO WATER DISTRICT
Current Occupation of the Household Head
Type of Household
Total
WD-connected
HHs
Non-connected
HHs
Farming or fishing 6.6% 24.0% 18.4%
Own business 25.4% 14.1% 17.7%
Government employee 11.5% 7.6% 8.8%
Private employee 14.8% 12.2% 13.0%
Temporary labourer 4.1% 6.1% 5.5%
Street vendor 1.6% 2.3% 2.1%
Retired/Pensioner 15.6% 1.9% 6.2%
Unemployed 5.7% 4.6% 4.9%
Others 14.8% 27.4% 23.4%
N Cases 122 263 385
Apparently, more household heads in non-connected households (24%) are engaged in agriculture-related occupations compared to those of connected households (6.6%). There are also more temporary laborers and street vendor (8.4%) in non-connected household than in connected households (5.7%). In terms of formal employment, 26.3% of the connected household heads and 19.8% of non-connected households have household heads who are employed in the government and private offices. A quarter of the connected households are engaged in business while a lower percentage of 14.1 of non-connected household are in the same occupation. More connected households (15.5%) rely on pensions than non-connected households (1.9%). A higher percentage of 5.7% of household heads in connected households are unemployed as compared to 4.6% in non-connected households.

Supplementary Appendix H
TA No. 7122-PHI: Water District Development Sector Project PPTA – Final Report – Vol. 10
58
Table 10. Percentage of Households by Ownership Status of the House Occupied:
LEYTE METRO WATER DISTRICT
Ownership Status of the House
Type of Household
Total
WD-connected
HHs
Non-connected
HHs
House owner 90.2% 88.6% 89.1%
Caretaker 0.8% 0.8% 0.8%
Rent-free occupant 3.3% 3.4% 3.4%
Renter 4.1% 6.5% 5.7%
Others: relatives, etc 1.6% 0.8% 1.0%
N Cases 122 263 385
Majority of the households own the house they occupy. This is indicated by the percentage of 90.2% in connected households and 88.6% in non-connected households. Lesser proportion of connected households (9.8%) do not own the houses they live in as compared to 11.4% of non-connected households. Table 11. Percentage of Households by Ownership Status of the Lot on which House
is Built: LEYTE METRO WATER DISTRICT
Ownership Status of the Lot
Type of Household
Total
WD-connected
HHs
Non-connected
HHs
Owned 50.8% 37.3% 41.6%
Caretaker 2.5% 6.8% 5.5%
Rented/Leased 13.1% 20.5% 18.2%
Common property with other family members or relatives 8.2% 7.2% 7.5%
Government land 18.9% 18.6% 18.7%
Others 6.6% 9.5% 8.6%
N Cases 122 263 385
Evidently, a higher proportion of the connected households (50.8%) own the lots on which their houses are built, compared to the 37.3% of non-connected households. Almost nineteen percent in both groups are residing on lots owned by the government. There are more non-connected households who are renters and caretakers (27.3%) than those in connected households (15.6%).

Supplementary Appendix H
TA No. 7122-PHI: Water District Development Sector Project PPTA – Final Report – Vol. 10
59
Table 12. Percentage of Households by Type of Building/House: LEYTE METRO WATER DISTRICT
Type of building/house
Type of Household
Total
WD-connected
HHs
Non-connected
HHs
Single 92.6% 95.1% 94.3%
Duplex 6.6% 4.9% 5.5%
Apartment/condominium/townhouse 0.8% 0.0% 0.3%
Commercial/industrial/ agricultural bldg 0.0% 0.0% 0.0%
Others 0.0% 0.0% 0.0%
N Cases 122 263 385
Single detached type of homes describes the more than ninety percent of the dwelling units of connected and non-connected households. A few houses are of the duplex, apartment/condominium/townhouse type of structure.
Table 13. Percentage of Households by Materials that Predominantly Make Up the
Dwelling Unit: LEYTE METRO WATER DISTRICT
Observed materials that make up the dwelling unit
Type of Household
Total
WD-connected
HHs
Non-connected
HHs
Strong materials 25.4% 11.0% 15.6%
Light materials 7.4% 23.2% 18.2%
Mixed but predominantly strong materials 43.4% 29.7% 34.0%
Mixed but predominantly light materials 23.0% 33.8% 30.4%
Salvaged/makeshift materials 0.8% 1.9% 1.6%
Mixed but predominantly salvaged materials 0.0% 0.4% 0.3%
N Cases 122 263 385
More connected households (68.8%) live in dwelling units made up of strong and mixed but predominantly strong materials as opposed to 40.7% of the non-connected households. Houses made up of light and mixed but predominantly light materials are observed more in non-connected households (57%) than in connected households (30.4%).

Supplementary Appendix H
TA No. 7122-PHI: Water District Development Sector Project PPTA – Final Report – Vol. 10
60
Table 14. Percentage of Households by Primary Sources of Water (Multiple
Responses): LEYTE METRO WATER DISTRICT
Primary Source of Water
Type of Household
Total
WD-connected
HHs
Non-connected
HHs
Piped connection 100.0% 63.5% 75.1%
Public/Street faucet 0.0% 17.5% 11.9%
Deep well 0.0% 1.1% 0.8%
Shallow well 8.2% 64.6% 46.8%
Spring/River/Pond/Stream 0.0% 0.8% 0.5%
Rain 0.0% 0.0% 0.0%
Water vendors 2.5% 7.2% 5.7%
N Cases 122 263 385
Aside from sourcing water from their own piped connection, a few connected households obtain additional water from shallow wells (8.2%) and water vendors (2.5%). Non-connected households get water from piped connection of other households (63.5%), shallow wells (64.6%), public faucet (17.5%), water vendors (7.2%), deep well (1.1%) and spring/river/pond/stream (.8%).

Supplementary Appendix H
TA No. 7122-PHI: Water District Development Sector Project PPTA – Final Report – Vol. 10
61
Table 15. Percentage of Households by Type of Toilet Facility: LEYTE METRO
WATER DISTRICT
Type of Toilet Facility
Type of Household
Total
WD-connected
HHs
Non-connected
HHs
Water-sealed (flush or pourflush) connected to septic tank 84.4% 63.9% 70.4%
Water-sealed (flush or pourflush) connected to pit 7.4% 18.3% 14.8%
Water-sealed (flush or pourflush) connected to drainage 1.6% 1.1% 1.3%
Non-water sealed (ventilated improved pit, sanitary pit privy, closed pit) 5.7% 7.2% 6.8%
Non-water sealed (open pit privy, overhang) 0.0% 0.4% 0.3%
Shared toilet 0.0% 6.1% 4.2%
Public toilet 0.0% 0.4% 0.3%
No toilet (wrap and throw, arinola, bush, sea/marshland , river 0.8% 2.7% 2.1%
N Cases 122 263 385
Data indicates more hygienic toilet practice among the connected households, as 84.4% of connected households use water-sealed toilets connected to septic tanks compared to the 63.9% of non-connected household using the same toilet facility. Other types of toilet facilities are used more by non-connected (33.5%) than connected households (14.7%). There are a few households, however, with no toilet (2.7% of non-connected households and 0.8% of connected households)

Supplementary Appendix H
TA No. 7122-PHI: Water District Development Sector Project PPTA – Final Report – Vol. 10
62
D. QUEZON METRO WATER DISTRICT Table 1. Percentage of Households by Number of Households Living in the Dwelling
Unit: QUEZON METRO WATER DISTRICT
Number of HHs in the dwelling unit
Type of Household
Total
WD-connected
HHs
Non-connected
HHs
1 93.4% 97.3% 94.6%
2 4.0% 1.8% 3.4%
3 0.4% 0.9% 0.5%
4 or more 2.2% 0.0% 1.6%
N Cases 274 113 387
More than ninety percent of households, 93.4% of the connected households and 97.3% of the non-connected households, are sole occupant of their dwelling units. More connected households (6.6%) live with two or more other households compared with the WD-connected households (2.7%).

Supplementary Appendix H
TA No. 7122-PHI: Water District Development Sector Project PPTA – Final Report – Vol. 10
63
Table 2. Percentage of Households by Total Number of Household Members:
QUEZON METRO WATER DISTRICT
Total number of HH members
Type of Household
Total
WD-connected
HHs
Non-connected
HHs
All members
1-2 10.5% 12.5% 11.1%
3-4 31.3% 33.0% 31.8%
5-6 36.0% 39.3% 37.0%
7-8 15.6% 8.9% 13.7%
9-10 4.0% 1.8% 3.4%
10 or more 2.5% 4.5% 3.1%
Average Household Size 5.1 4.9 5.04
N Cases 275 112 387
Members 14 years old and below
None 36.4% 33.6% 35.6%
1-2 45.8% 46.0% 45.9%
3-4 15.6% 16.8% 16.0%
5-6 1.1% 2.7% 1.5%
7-8 .7% 0.9% 0.8%
9-10 .4% 0.0% 0.3%
Average Number of HH members
14 years old & below 1.29 1.45 1.34
N Cases 275 113 388
Members 65 years or over
None 68.4% 78.8% 71.4%
1-2 31.6% 21.2% 28.6%
3-4 0.0% 0.0% 0.0%
5 or more 0.0% 0.0% 0.0%
N Cases 275 113 388
Average household size is 5.1 among connected households and 4.9 among non-connected households. Five- member households are highest in both groups with 36% in connected and 39.3% in non-connected households. There are more non-connected households (45.5%) with four or less members than connected households (41.8%).

Supplementary Appendix H
TA No. 7122-PHI: Water District Development Sector Project PPTA – Final Report – Vol. 10
64
On the average, the number of household members fourteen years old or younger is 1.29 in connected households and 1.45 in non-connected households. One to two elderly household members are present in 31.6% of connected and 21.2% in non-connected households.
Table 3. Percentage of Households by Length of Stay in the Barangay: QUEZON METRO WATER DISTRICT
Number of years in the barangay
Type of Household
Total
WD-connected
HHs
Non-connected
HHs
Less than 10 years 25.1% 16.8% 22.7%
10-19 years 20.4% 25.7% 21.9%
20-29 years 22.2% 23.9% 22.7%
30-39 years 13.8% 8.8% 12.4%
40-49 years 11.3% 8.8% 10.6%
50 years or over 7.3% 15.9% 9.8%
Average length of stay in the barangay 23 years 27 years 24 years
N Cases 275 113 388
Non-connected household’s average length of the stay in the barangay where they currently stay is 27 years, four years longer than the 23 years of non-connected households.

Supplementary Appendix H
TA No. 7122-PHI: Water District Development Sector Project PPTA – Final Report – Vol. 10
65
Table 4. Percentage of Households by Average Total Monthly Household Income (in
Pesos): QUEZON METRO WATER DISTRICT
Average total monthly income of the HH
Type of Household
Total
WD-connected
HHs
Non-connected
HHs
No income 0.7% 0.0% 0.5%
Less than P 5,000 10.1% 24.3% 14.3%
P 5,000 - 9,999 28.1% 39.6% 31.5%
P 10,000 - 14,999 20.6% 17.1% 19.6%
P 15,000 - 19,999 16.5% 9.9% 14.6%
P 20,000 - 29,999 12.4% 4.5% 10.1%
P 30,000 - 39,999 6.0% 2.7% 5.0%
P 40,000 - 49,999 1.9% 0.9% 1.6%
P 50,000 and over 3.7% 0.9% 2.9%
Average Total Monthly Household Income (in Pesos) P 14,968 P 9,370 P 13,324
N Cases 267 111 378
On the average, connected households earn more with P14,968 average monthly income, than non-connected households with only P9,370 per month. Though the proportion of connected households is highest at the income range of P5,000–9,999 per month, 61.1% of them earn P10,000 and over. Likewise, 39.6% of non-connected households is at the monthly income range of P5,000–9,999 per month, only 36% of them are earning P10,000 and over. Moreover, a significant proportion of 24.3% of non-connected households earn less than P5,000.

Supplementary Appendix H
TA No. 7122-PHI: Water District Development Sector Project PPTA – Final Report – Vol. 10
66
Table 5. Percentage of Households by Average Total Monthly Household Expenditure (in Pesos): QUEZON METRO WATER DISTRICT
Average Total Monthly Expenditure
Type of Household
Total
WD-connected
HHs
Non-connected
HHs
Less than P3,000 2.3% 12.8% 5.4%
P3,000 - 4,999 9.3% 15.6% 11.2%
P5,000 - 9,999 29.5% 46.8% 34.6%
P10,000 - 14,999 27.1% 11.9% 22.6%
P15,000 - 19,999 15.5% 4.6% 12.3%
P20,000 - 29,999 9.7% 4.6% 8.2%
P30,000 - 49,999 3.9% 2.8% 3.5%
P50,000 or over 2.7% 0.9% 2.2%
Average total monthly household expenditure (in Pesos) P 14,119 P 8,976 P 12,592
N Cases 258 109 367
On the average, connected households spend more, at P14,119 per month, than non-connected households, at P8,976 per month. More non-connected households (46.8%) are spending between P5,000 to P9,999 per month than connected households (29.5%). Furthermore, 31.8% of connected households and only 12.9% of non-connected households have a monthly spending of P15,000 or more.

Supplementary Appendix H
TA No. 7122-PHI: Water District Development Sector Project PPTA – Final Report – Vol. 10
67
Table 6. Percentage of Households by Average Total Monthly Household Savings (in
Pesos): QUEZON METRO WATER DISTRICT
Average Total Monthly Savings
Type of Household
Total
WD-connected
HHs
Non-connected
HHs
None 72.4% 69.9% 71.6%
Less than P1,000 9.1% 20.4% 12.4%
P1,000 - 1,999 6.5% 3.5% 5.7%
P2,000 - 2,999 3.3% 4.4% 3.6%
P3,000 - 3,999 3.6% 0.0% 2.6%
P4,000 – 4,999 0.7% 0.0% 0.5%
P5,000 or over 4.4% 1.8% 3.6%
N Cases 275 113 388
Quite a high proportion of households do not have monthly savings. Savings is nil in 72.4% of connected households and 69.9% of non-connected households. Table 7. Percentage of Households by Sex of the Household Head: QUEZON METRO
WATER DISTRICT
Sex of the Household Head Type of Household
Total
WD-connected
HHs
Non-connected
HHs
Male 64.7% 70.8% 66.5%
Female 35.3% 29.2% 33.5%
N Cases 275 113 388
Male headship of household is prevalent in both connected (64.7%) and non-connected households (70.8%). However, there is a higher percentage of 35.3% of female-headed households among connected households compared to non-connected households (29.2%).
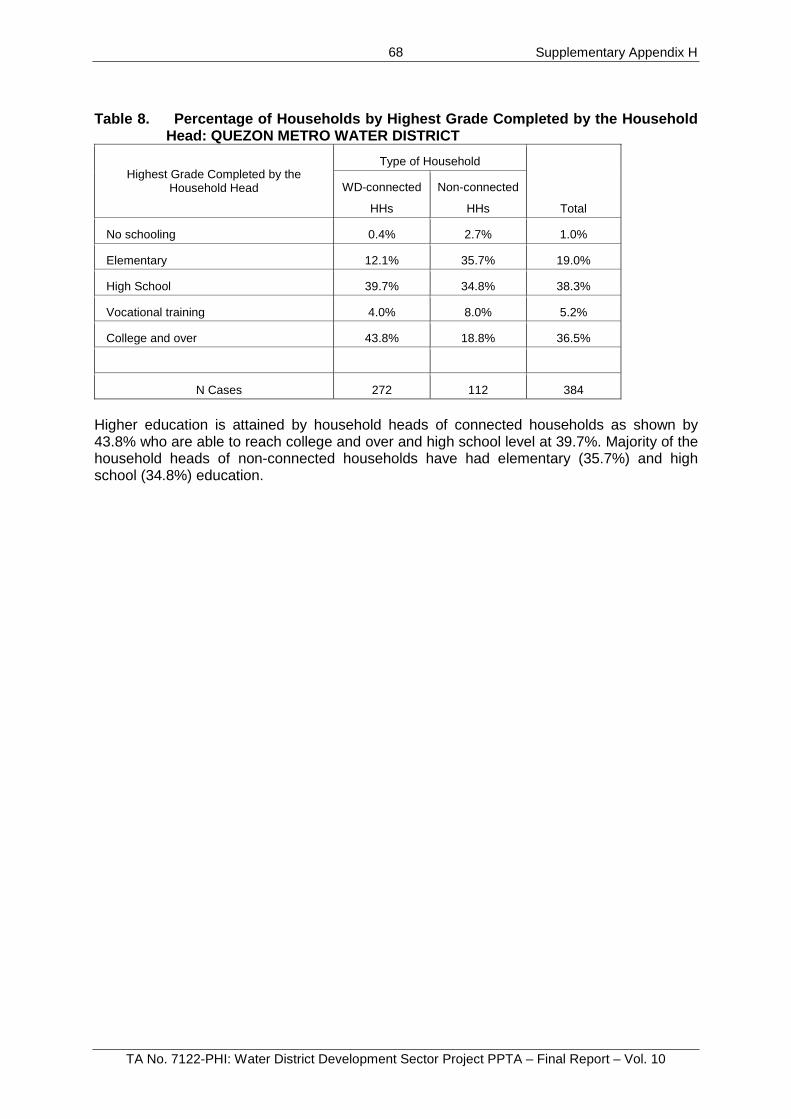
Supplementary Appendix H
TA No. 7122-PHI: Water District Development Sector Project PPTA – Final Report – Vol. 10
68
Table 8. Percentage of Households by Highest Grade Completed by the Household
Head: QUEZON METRO WATER DISTRICT
Highest Grade Completed by the Household Head
Type of Household
Total
WD-connected
HHs
Non-connected
HHs
No schooling 0.4% 2.7% 1.0%
Elementary 12.1% 35.7% 19.0%
High School 39.7% 34.8% 38.3%
Vocational training 4.0% 8.0% 5.2%
College and over 43.8% 18.8% 36.5%
N Cases 272 112 384
Higher education is attained by household heads of connected households as shown by 43.8% who are able to reach college and over and high school level at 39.7%. Majority of the household heads of non-connected households have had elementary (35.7%) and high school (34.8%) education.

Supplementary Appendix H
TA No. 7122-PHI: Water District Development Sector Project PPTA – Final Report – Vol. 10
69
Table 9. Percentage of Households by Current Occupation of the Household Head:
QUEZON METRO WATER DISTRICT
Current Occupation of the Household Head
Type of Household
Total
WD-connected
HHs
Non-connected
HHs
Farming or fishing 1.1% 15.0% 5.2%
Own business 24.4% 22.1% 23.7%
Government employee 9.5% 7.1% 8.8%
Private employee 15.6% 11.5% 14.4%
Temporary labourer 9.1% 8.0% 8.8%
Street vendor 0.4% 1.8% 0.8%
Retired/Pensioner 13.8% 5.3% 11.3%
Unemployed 16.4% 13.3% 15.5%
Others 9.8% 15.9% 11.6%
N Cases 275 113 388
Business (24.4%), private and government employment (25.1%) are apparently the most dominant occupations among household heads of connected households. Among non-connected households, 15% of household heads are farmers and fishermen, and 22.1% are businessmen. More household heads in connected households (16.4%) are unemployed as compared to 13.3% of the non-connected households.

Supplementary Appendix H
TA No. 7122-PHI: Water District Development Sector Project PPTA – Final Report – Vol. 10
70
Table 10. Percentage of Households by Ownership Status of the House Occupied: QUEZON METRO WATER DISTRICT
Ownership Status of the House
Type of Household
Total
WD-connected
HHs
Non-connected
HHs
House owner 80.7% 87.6% 82.7%
Caretaker 5.8% 4.4% 5.4%
Rent-free occupant 4.0% 1.8% 3.4%
Renter 9.1% 6.2% 8.2%
Others: relatives, etc 0.4% 0.0% 0.3%
N Cases 275 113 388
More than eighty percent of the households, 80.7% of the connected households and 87.6% of the non-connected households, own the dwelling structure they are currently occupying. There are more renters and rent-free occupants among the connected households (13.1%) than among the non-connected households (8.0%).
Table 11. Percentage of Households by Ownership Status of the Lot on which House
is Built: QUEZON METRO WATER DISTRICT
Ownership Status of the Lot
Type of Household
Total
WD-connected
HHs
Non-connected
HHs
Owned 66.5% 64.6% 66.0%
Caretaker 8.0% 8.8% 8.2%
Rented/Leased 12.0% 9.7% 11.3%
Common property with other family members or relatives 7.6% 5.3% 7.0%
Government land 4.0% 11.5% 6.2%
Others 1.8% 0.0% 1.3%
N Cases 275 113 388
Almost the same proportions of households, 66.5% in connected households and 64.6% in non-connected households, own the lots on which their homes are built. Homes built on common properties are higher among connected households (7.6%) than in non-connected households (5.3%). A higher proportion of non-connected households (11.5%) than connected households (4%) are occupying government lands.
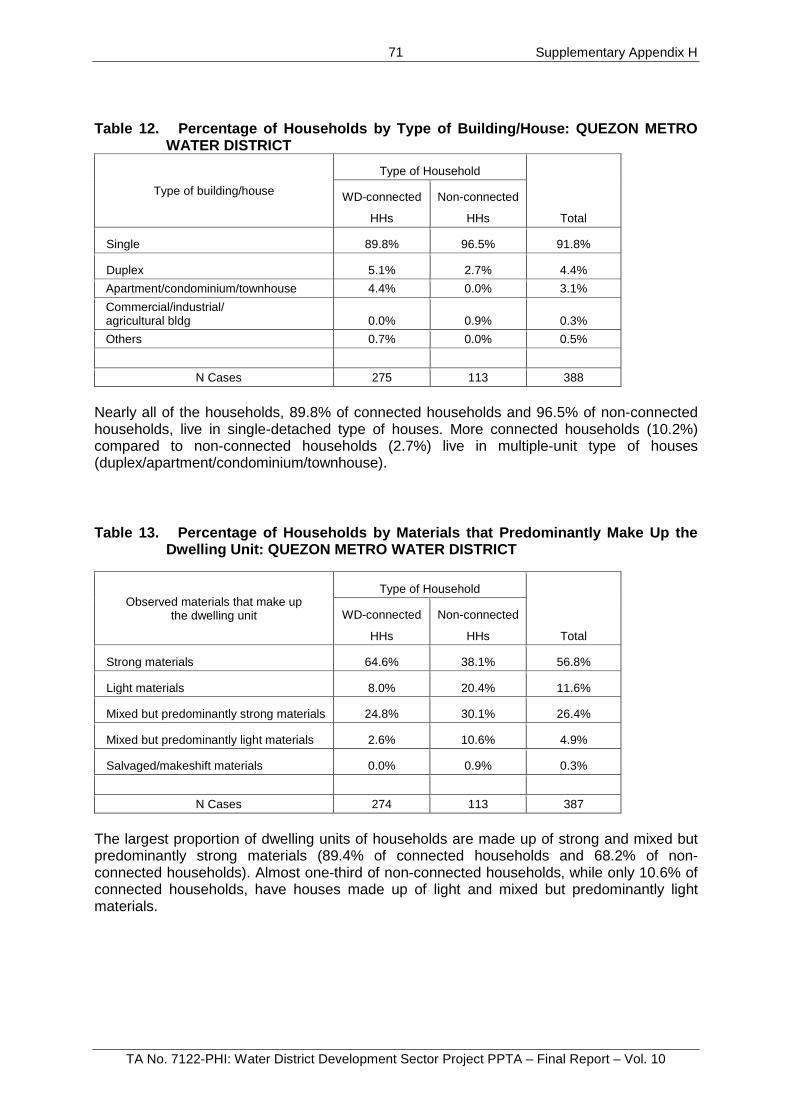
Supplementary Appendix H
TA No. 7122-PHI: Water District Development Sector Project PPTA – Final Report – Vol. 10
71
Table 12. Percentage of Households by Type of Building/House: QUEZON METRO
WATER DISTRICT
Type of building/house
Type of Household
Total
WD-connected
HHs
Non-connected
HHs
Single 89.8% 96.5% 91.8%
Duplex 5.1% 2.7% 4.4%
Apartment/condominium/townhouse 4.4% 0.0% 3.1%
Commercial/industrial/ agricultural bldg 0.0% 0.9% 0.3%
Others 0.7% 0.0% 0.5%
N Cases 275 113 388
Nearly all of the households, 89.8% of connected households and 96.5% of non-connected households, live in single-detached type of houses. More connected households (10.2%) compared to non-connected households (2.7%) live in multiple-unit type of houses (duplex/apartment/condominium/townhouse).
Table 13. Percentage of Households by Materials that Predominantly Make Up the
Dwelling Unit: QUEZON METRO WATER DISTRICT
Observed materials that make up the dwelling unit
Type of Household
Total
WD-connected
HHs
Non-connected
HHs
Strong materials 64.6% 38.1% 56.8%
Light materials 8.0% 20.4% 11.6%
Mixed but predominantly strong materials 24.8% 30.1% 26.4%
Mixed but predominantly light materials 2.6% 10.6% 4.9%
Salvaged/makeshift materials 0.0% 0.9% 0.3%
N Cases 274 113 387
The largest proportion of dwelling units of households are made up of strong and mixed but predominantly strong materials (89.4% of connected households and 68.2% of non-connected households). Almost one-third of non-connected households, while only 10.6% of connected households, have houses made up of light and mixed but predominantly light materials.

Supplementary Appendix H
TA No. 7122-PHI: Water District Development Sector Project PPTA – Final Report – Vol. 10
72
Table 14. Percentage of Households by Primary Sources of Water (Multiple
Responses): QUEZON METRO WATER DISTRICT
Primary Source of Water
Type of Household
Total
WD-connected
HHs
Non-connected
HHs
Piped connection 100.0 54.0% 86.6%
Public/Street faucet 0.0% 15.0% 4.4%
Deep well 0.0% 0.9% 0.3%
Shallow well 0.0% 28.3% 8.2%
Spring/River/Pond/Stream 0.0% 23.9% 7.0%
Rain 0.4% 0.0% 0.3%
Water vendors 12.7% 15.0% 13.4%
N Cases 275 113 388
Around 13% of WD-connected households get additional water from water vendors and rain. Non-connected households get water from piped connection (54%), shallow well (28.3%), spring/river/pond/stream (23.9%), public faucet (15%), water vendors (15%) and deep well (0.9%).

Supplementary Appendix H
TA No. 7122-PHI: Water District Development Sector Project PPTA – Final Report – Vol. 10
73
Table 15. Percentage of Households by Type of Toilet Facility: QUEZON METRO
WATER DISTRICT
Type of Toilet Facility
Type of Household
Total
WD-connected
HHs
Non-connected
HHs
Water-sealed (flush or pourflush) connected to sewerage system 0.4% 0.9% 0.5%
Water-sealed (flush or pourflush) connected to septic tank 88.7% 86.7% 88.1%
Water-sealed (flush or pourflush) connected to pit 0.4% 0.9% 0.5%
Water-sealed (flush or pourflush) connected to drainage 10.5% 7.1% 9.5%
Shared toilet 0.0% 0.9% 0.3%
Public toilet 0.0% 0.9% 0.3%
No toilet (wrap and throw, arinola, bush, sea/marshland , river 0.0% 2.7% 0.8%
N Cases 275 113 388
Most households use water-sealed toilets connected to septic tank -- 88.7% of the connected households, and 86.7% of the non-connected households. Households using water-sealed toilets connected to drainage are 10.5% of connected households and 7.1% of non-connected households. Absence of toilet facility characterizes 2.7% of the non-connected households.

Supplementary Appendix H
TA No. 7122-PHI: Water District Development Sector Project PPTA – Final Report – Vol. 10
74
E. KORONADAL CITY WATER DISTRICT Table 1. Percentage of Households by Number of Households Living in the Dwelling
Unit: KORONADAL CITY WATER DISTRICT
Number of HHs in the dwelling unit
Type of Household
Total
WD-connected
HHs
Non-connected
HHs
1 91.4% 77.1% 79.6%
2 5.7% 13.6% 12.2%
3 2.9% 5.6% 5.1%
4 or more 0.0% 3.7% 3.1%
N Cases 70 323 393
Single household per dwelling unit characterize most of the WD-connected households (91.4%). Dwelling units shared by multiple households is higher in non-connected households (22.9%) than in WD-connected households (8.6%).

Supplementary Appendix H
TA No. 7122-PHI: Water District Development Sector Project PPTA – Final Report – Vol. 10
75
Table 2. Percentage of Households by Total Number of Household Members:
KORONADAL CITY WATER DISTRICT
Total number of HH members
Type of Household
Total
WD-connected
HHs
Non-connected
HHs
All members
1-2 10.0% 4.6% 5.6%
3-4 34.3% 36.5% 36.1%
5-6 28.6% 34.7% 33.6%
7-8 15.7% 17.3% 17.0%
9-10 4.3% 4.3% 4.3%
10 or more 7.1% 2.5% 3.3%
Average Household Size 5.56 5.29 5.34
N Cases 70 323 393
Members 14 years old and below
None 31.9% 29.7% 30.1%
1-2 52.2% 51.1% 51.3%
3-4 14.5% 17.3% 16.8%
5-6 1.4% 1.2% 1.3%
7-8 0.0% 0.3% 0.3%
9-10 0.0% 0.3% 0.3%
Average Number of HH members
14 years old & below 1.28 1.42 1.39
N Cases 69 323 392
Members 65 years or over
None 87.1% 79.3% 80.7%
1-2 12.9% 20.4% 19.1%
3-4 0.0% 0.0% 0.0%
5 or more 0.0% 0.3% 0.3%
N Cases 70 323 393
Average household size of 5.56 in WD-connected households is slightly higher than the 5.29 in non-connected households. Moreover, the proportion of households with less than five

Supplementary Appendix H
TA No. 7122-PHI: Water District Development Sector Project PPTA – Final Report – Vol. 10
76
members is lower in non-connected households (41.1%) than in connected households (44.3%). The average number of household members 14 years old and below is a little higher in non-connected households than in connected households with 1.42 and 1.28, respectively. The proportion of households with at least one elderly household member (65 years old or over) is higher in non-connected households (20.7%) than in connected households (12.9%). Table 3. Percentage of Households by Length of Stay in the Barangay: KORONADAL
CITY WATER DISTRICT
Number of years in the barangay
Type of Household
Total
WD-connected
HHs
Non-connected
HHs
Less than 10 years 24.3% 24.3% 24.3%
10-19 years 31.4% 23.7% 25.1%
20-29 years 21.4% 20.6% 20.7%
30-39 years 15.7% 16.2% 16.1%
40-49 years 7.1% 9.3% 9.0%
50 years or over 0.0% 5.9% 4.9%
Average length of stay in the barangay 20 years 23 years 22 years
N Cases 70 321 391 On the average, non-connected households have stayed longer in their present barangay of residence (23 years) compared to the WD-connected households (20 years). The proportion of households with 30 or more years of residence in their barangay is considerably higher among the non-connected households (31.4%) than in connected households (22.8%). Conversely, shorter habitation of 19 years and less in their current residence is higher among connected households (55.7%) than among non-connected households (48%).

Supplementary Appendix H
TA No. 7122-PHI: Water District Development Sector Project PPTA – Final Report – Vol. 10
77
Table 4. Percentage of Households by Average Total Monthly Household Income (in
Pesos): KORONADAL CITY WATER DISTRICT
Average total monthly income of the HH
Type of Household
Total
WD-connected
HHs
Non-connected
HHs
No income 3.0% 2.5% 2.6%
Less than P 5,000 6.0% 26.5% 22.9%
P 5,000 - 9,999 22.4% 37.9% 35.2%
P 10,000 - 14,999 23.9% 12.3% 14.3%
P 15,000 - 19,999 11.9% 9.8% 10.2%
P 20,000 - 29,999 13.4% 6.6% 7.8%
P 30,000 - 39,999 9.0% 3.8% 4.7%
P 40,000 - 49,999 3.0% 0.3% 0.8%
P 50,000 and over 7.5% 0.3% 1.6%
Average Total Monthly Household Income (in Pesos) P 18,018 P 9,253 P 10,782
N Cases 67 317 384
The average monthly income earned by the non-connected households is just about one-half of the average monthly income of the WD-connected households. On the whole, the proportion of connected households (32.9%) earning P20,000 and over is significantly higher than that of non-connected households (11%).

Supplementary Appendix H
TA No. 7122-PHI: Water District Development Sector Project PPTA – Final Report – Vol. 10
78
Table 5. Percentage of Households by Average Total Monthly Household
Expenditure (in Pesos): KORONADAL CITY WATER DISTRICT
Average Total Monthly Expenditure
Type of Household
Total
WD-connected
HHs
Non-connected
HHs
Less than P3,000 0.0% 7.6% 6.3%
P3,000 - 4,999 8.8% 17.2% 15.7%
P5,000 - 9,999 30.9% 44.9% 42.4%
P10,000 - 14,999 29.4% 19.7% 21.5%
P15,000 - 19,999 19.1% 6.7% 8.9%
P20,000 - 29,999 10.3% 2.2% 3.7%
P30,000 - 49,999 1.5% 1.6% 1.6%
P50,000 or over 0.0% 0.0% 0.0%
Average total monthly household expenditure (in Pesos) P 12,607 P 8,745 P 9,432
N Cases 68 314 382 Connected households’ spending is higher than that of the non-connected households, at P12,607 monthly versus P8,745 monthly. Specifically, more of the non-connected households (44.9%) spend P5,000-9,999 monthly compared to connected households (30.9%). Conversely, more of the connected households (48.5%) tend to spend P10,000 – 19,999 monthly than the non-connected households (26.4%).

Supplementary Appendix H
TA No. 7122-PHI: Water District Development Sector Project PPTA – Final Report – Vol. 10
79
Table 6. Percentage of Households by Average Total Monthly Household Savings (in
Pesos): KORONADAL CITY WATER DISTRICT
Average Total Monthly Savings
Type of Household
Total
WD-connected
HHs
Non-connected
HHs
None 54.3% 59.6% 58.7%
Less than P1,000 18.6% 30.1% 28.1%
P1,000 - 1,999 8.6% 3.7% 4.6%
P2,000 - 2,999 5.7% 2.2% 2.8%
P3,000 - 3,999 2.9% 0.3% 0.8%
P4,000 – 4,999 1.4% 0.3% 0.5%
P5,000 or over 8.6% 3.7% 4.6%
N Cases 70 322 392
More than one-half of the households do not have savings, 54.3% of the connected households and 59.6% of the non-connected households. Comparatively, more WD-connected households (45.7%) are able to save compared to the 40.4% of non-connected households. Less than P1,000 is saved per month by 30.1% of non-connected households and 18.6% of WD-connected households. However, more connected households (8.6%) are able to save at least P5,000 than non-connected households (3.7%).

Supplementary Appendix H
TA No. 7122-PHI: Water District Development Sector Project PPTA – Final Report – Vol. 10
80
Table 7. Percentage of Households by Sex of the Household Head: KORONADAL
CITY WATER DISTRICT
Sex of the Household Head Type of Household
Total
WD-connected
HHs
Non-connected
HHs
Male 72.9% 83.3% 81.4%
Female 27.1% 16.7% 18.6%
N Cases 70 323 393
Majority of the households are headed by male, 72.9% of the WD-connected and 83.3% of the non-connected households. The proportion of female-headed households is higher among the connected households (27.1%) compared to the non-connected households (16.7%). Table 8. Percentage of Households by Highest Grade Completed by the Household
Head: KORONADAL CITY WATER DISTRICT
Highest Grade Completed by the Household Head
Type of Household
Total
WD-connected
HHs
Non-connected
HHs
No schooling 1.5% 1.6% 1.6%
Elementary 3.0% 17.1% 14.6%
High School 17.9% 42.1% 37.9%
Vocational training 11.9% 4.7% 6.0%
College and over 65.7% 34.5% 39.9%
N Cases 67 316 383
Majority or 65.7% of the connected households have household heads who have reached college or over, implying higher educational attainment among heads of connected households than those of non-connected households, 34.5% of whom have college education or over and 42.1% have reached the secondary education level.

Supplementary Appendix H
TA No. 7122-PHI: Water District Development Sector Project PPTA – Final Report – Vol. 10
81
Table 9. Percentage of Households by Current Occupation of the Household Head:
KORONADAL CITY WATER DISTRICT
Current Occupation of the Household Head
Type of Household
Total
WD-connected
HHs
Non-connected
HHs
Farming or fishing 10.0% 12.1% 11.7%
Own business 14.3% 16.4% 16.0%
Government employee 20.0% 8.4% 10.4%
Private employee 21.4% 11.5% 13.2%
Temporary laborer 0.0% 10.8% 8.9%
Street vendor 2.9% 2.2% 2.3%
Retired/Pensioner 5.7% 3.1% 3.6%
Unemployed 1.4% 4.3% 3.8%
Others 24.3% 31.3% 30.0%
N Cases 70 323 393
Variation in the type of occupation of household heads is evident between the connected and the non-connected households. There are more regularly employed household heads (private firm and government employees) among the connected households (41.4%) than among the non-connected households (19.9%). Temporary labor is engaged in by 10.8% of the household heads of non-connected households. Unemployment, however, is more prevalent among heads of non-connected households (4.3%) than among those in connected households (1.4%).

Supplementary Appendix H
TA No. 7122-PHI: Water District Development Sector Project PPTA – Final Report – Vol. 10
82
Table 10. Percentage of Households by Ownership Status of the House Occupied:
KORONADAL CITY WATER DISTRICT
Ownership Status of the House
Type of Household
Total
WD-connected
HHs
Non-connected
HHs
House owner 84.3% 85.8% 85.5%
Caretaker 4.3% 2.2% 2.5%
Rent-free occupant 5.7%% 6.5% 6.4%
Renter 5.7 5.3% 5.3%
Others: relatives, etc 0.0% 0.3% 0.3%
N Cases 70 323 393
House ownership is high both among the connected and non-connected households, 84.3% and 85.5%, respectively.
Table 11. Percentage of Households by Ownership Status of the Lot on which House
is Built: KORONADAL CITY WATER DISTRICT
Ownership Status of the Lot
Type of Household
Total
WD-connected
HHs
Non-connected
HHs
Owned 57.1% 59.1% 58.8%
Caretaker 7.1% 5.9% 6.1%
Rented/Leased 11.4% 10.5% 10.7%
Common property with other family members or relatives 22.9% 16.7% 17.8%
Government land 0.0% 5.0% 4.1%
Others 1.4% 2.8% 2.5%
N Cases 70 323 393
In terms of ownership of the lots where their houses are built on, there are more non-connected households (59.1%) who are owners compared to households with connection (57.1%). Commonly owned lots are seen more among connected households (22.9%) than in non-connected households (16.7%). However, 5% of households with no connection have their houses built on state-owned lots.
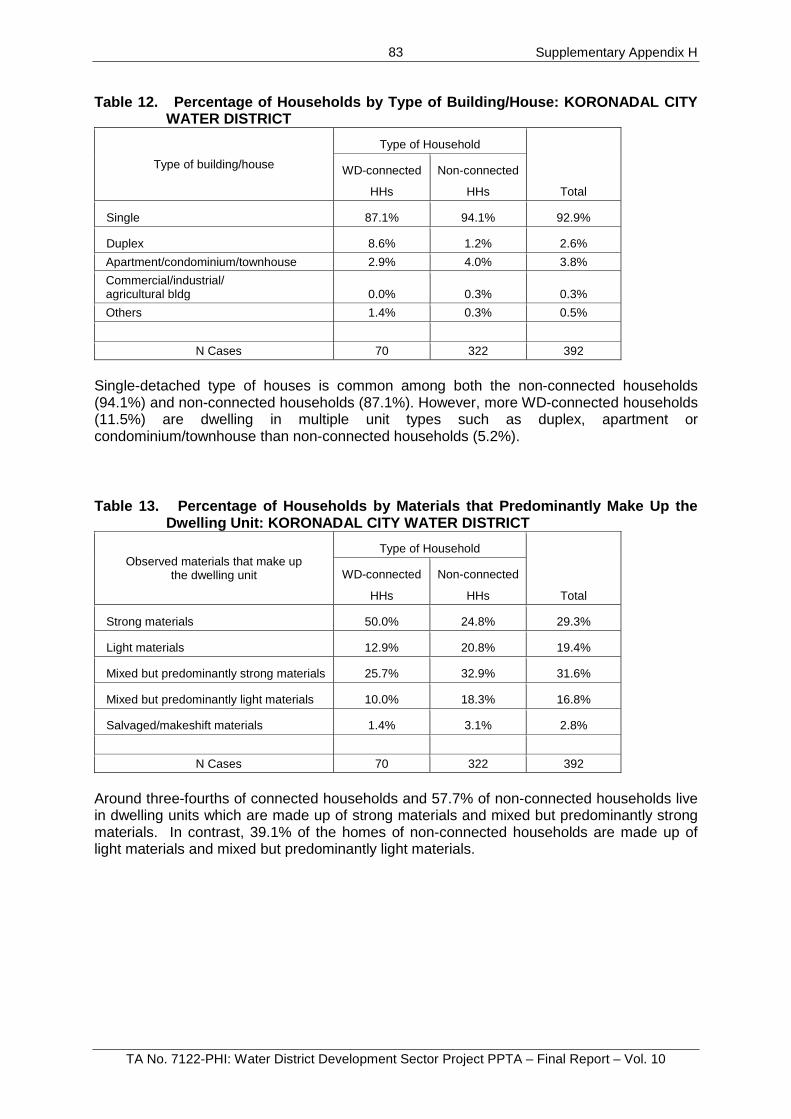
Supplementary Appendix H
TA No. 7122-PHI: Water District Development Sector Project PPTA – Final Report – Vol. 10
83
Table 12. Percentage of Households by Type of Building/House: KORONADAL CITY WATER DISTRICT
Type of building/house
Type of Household
Total
WD-connected
HHs
Non-connected
HHs
Single 87.1% 94.1% 92.9%
Duplex 8.6% 1.2% 2.6%
Apartment/condominium/townhouse 2.9% 4.0% 3.8%
Commercial/industrial/ agricultural bldg 0.0% 0.3% 0.3%
Others 1.4% 0.3% 0.5%
N Cases 70 322 392
Single-detached type of houses is common among both the non-connected households (94.1%) and non-connected households (87.1%). However, more WD-connected households (11.5%) are dwelling in multiple unit types such as duplex, apartment or condominium/townhouse than non-connected households (5.2%).
Table 13. Percentage of Households by Materials that Predominantly Make Up the
Dwelling Unit: KORONADAL CITY WATER DISTRICT
Observed materials that make up the dwelling unit
Type of Household
Total
WD-connected
HHs
Non-connected
HHs
Strong materials 50.0% 24.8% 29.3%
Light materials 12.9% 20.8% 19.4%
Mixed but predominantly strong materials 25.7% 32.9% 31.6%
Mixed but predominantly light materials 10.0% 18.3% 16.8%
Salvaged/makeshift materials 1.4% 3.1% 2.8%
N Cases 70 322 392
Around three-fourths of connected households and 57.7% of non-connected households live in dwelling units which are made up of strong materials and mixed but predominantly strong materials. In contrast, 39.1% of the homes of non-connected households are made up of light materials and mixed but predominantly light materials.

Supplementary Appendix H
TA No. 7122-PHI: Water District Development Sector Project PPTA – Final Report – Vol. 10
84
Table 14. Percentage of Households by Primary Sources of Water (Multiple Responses): KORONADAL CITY WATER DISTRICT
Primary Source of Water
Type of Household
Total
WD-connected
HHs
Non-connected
HHs
Piped connection 100.0% 4.3% 21.4%
Public/Street faucet 0.0% 1.5% 1.3%
Deep well 5.7% 38.1% 32.3%
Shallow well 11.4% 52.6% 45.3%
Spring/River/Pond/Stream 4.3% 5.6% 5.3%
Rain 15.7% 6.5% 8.1%
Water vendors 17.1% 5.3% 7.4%
N Cases 70 323 393
Of the households connected to the water district, 17.1% avail of additional water from water vendors, 15.7% from rain, 11.4% from shallow wells, 5.7% from deep wells and 4.3% from rain/ponds/streams. On the other hand, the primary sources of water of households without connection are the shallow wells (52.6%) and deep wells (38.1%). A little more than four percent of the households obtain water from piped connection of other households.

Supplementary Appendix H
TA No. 7122-PHI: Water District Development Sector Project PPTA – Final Report – Vol. 10
85
Table 15. Percentage of Households by Type of Toilet Facility: KORONADAL CITY
WATER DISTRICT
Type of Toilet Facility
Type of Household
Total
WD-connected
HHs
Non-connected
HHs
Water-sealed (flush or pourflush) connected to sewerage system 0.0% 1.2% 1.0%
Water-sealed (flush or pourflush) connected to septic tank 92.9% 76.8% 79.6%
Water-sealed (flush or pourflush) connected to pit 4.3% 10.2% 9.2%
Water-sealed (flush or pourflush) connected to drainage 0.0% 0.6% 0.5%
Non-water sealed (ventilated improved pit, sanitary pit privy, closed pit) 0.0% 0.6% 0.5%
Non-water sealed (open pit privy, overhang) 0.0% 0.0% 0.0%
Shared toilet 2.9% 10.2% 8.9%
Public toilet 0.0% 0.3% 0.3%
No toilet (wrap and throw, arinola, bush, sea/marshland , river 0.0% 0.0% 0.0%
N Cases 70 323 393
More than ninety percent of connected households and a lower 76.8% of the non-connected households use water-sealed toilets connected to septic tanks. The rest of the 7.1% of the households with water connection use shared toilets and water-sealed toilets connected to a pit. Around 23% of non-connected toilets use various types of toilet facilities: water-sealed connected to pit or drainage, non-water sealed closed pit, shared and public toilet.

Supplementary Appendix H
TA No. 7122-PHI: Water District Development Sector Project PPTA – Final Report – Vol. 10
86
III. Water Consumption and Preferences of WD-Connected Households Table A1. Percentage of Households by Reason for Water Connection
Water District
Total LEGASPI LA UNION LEYTE QUEZON KORONADAL
Convenience 93.0% 82.9% 96.7% 93.4% 88.9% 92.8%
Health safeguard against water-borne diseases
22.9% 24.4% 27.0% 14.2% 26.4% 20.7%
Reliability of water supply 27.1% 19.5% 31.1% 17.5% 8.3% 21.9%
Status symbol (lifestyle) 0.5% 2.4% 1.6% 0.0% 1.4% 0.7%
Inadequacy of other sources 6.5% 19.5% 4.9% 6.9% 0.0% 6.5%
Cheaper 0.9% 4.9% 13.9% 2.6% 2.8% 4.1%
N Cases 214 41 122 274 72 723
At 92.8% of the connected households, convenience is a leading reason for water connection in the five water districts. However, while a significant 96.7% of households in Leyte cite convenience as a reason, only 82.9% in La Union say so. Two other leading reasons are reliability and as safeguard against water borne diseases. There is distinct dissimilarity among the water districts on the mix of reasons for water connection. For instance, while no household in Koronadal cites inadequacy of other sources as a reason, 19.5% households in La Union say so. Also, while 13.9% of households in Leyte claim that water connection is a cheaper option, only 0.9% in Legaspi has mentioned it as a reason for water connection. Still indicating diverse perception on the value of water connection is the status symbol attached by 2.4% of La Union households while it is not at all a reason for water connection in Quezon.

Supplementary Appendix H
TA No. 7122-PHI: Water District Development Sector Project PPTA – Final Report – Vol. 10
87
Table A2. Volume and Cost of Water Consumption of WD-Connected Households WD water consumed by
connected household per month
(In Cu. Meter)
Average monthly water bill that WD-connected
household pays (In Pesos)
LEGASPI
Average 19.7 cu.m. P 426.76
N Cases 208 209
LA UNION
Average 28.8 cu.m. P 413.85
N Cases 38 41
LEYTE
Average 22.0 cu.m. P 468.30
N Cases 120 121
QUEZON
Average 29.0 cu.m. P 440.50
N Cases 271 274
KORONADAL
Average 26.7 cu.m. P 401.28
N Cases 60 68
All Water Districts
Average 24.8 cu.m. P 435.92
N Cases 697 713
On the average, volume of water consumption ranges from 19.7 cubic meters (Legaspi) to 29 cubic meters (Quezon). Given a considerable 9.3 cubic meter difference of average consumption in the 2 districts, the difference of water bill of only P13.74 indicates disparities in water pricing between the five water districts.
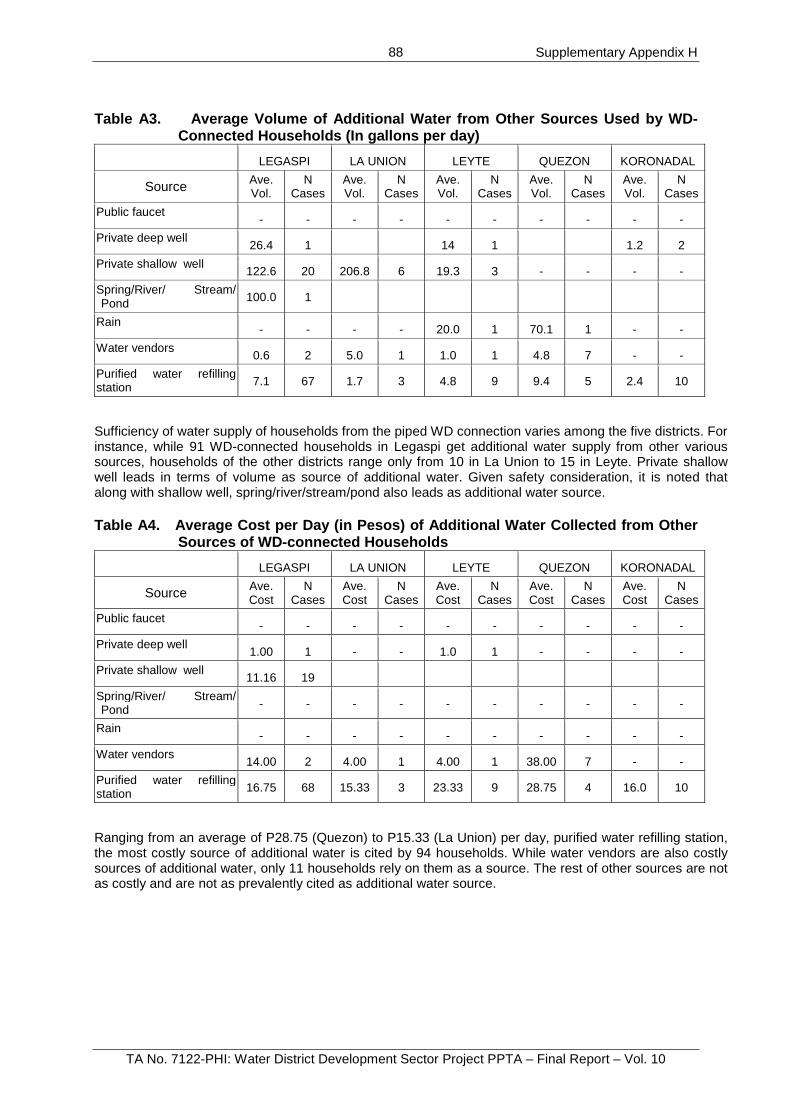
Supplementary Appendix H
TA No. 7122-PHI: Water District Development Sector Project PPTA – Final Report – Vol. 10
88
Table A3. Average Volume of Additional Water from Other Sources Used by WD-
Connected Households (In gallons per day) LEGASPI LA UNION LEYTE QUEZON KORONADAL
Source Ave. Vol.
N Cases
Ave. Vol.
N Cases
Ave. Vol.
N Cases
Ave. Vol.
N Cases
Ave. Vol.
N Cases
Public faucet - - - - - - - - - -
Private deep well 26.4 1 14 1 1.2 2
Private shallow well 122.6 20 206.8 6 19.3 3 - - - -
Spring/River/ Stream/ Pond 100.0 1
Rain - - - - 20.0 1 70.1 1 - -
Water vendors 0.6 2 5.0 1 1.0 1 4.8 7 - -
Purified water refilling station 7.1 67 1.7 3 4.8 9 9.4 5 2.4 10
Sufficiency of water supply of households from the piped WD connection varies among the five districts. For instance, while 91 WD-connected households in Legaspi get additional water supply from other various sources, households of the other districts range only from 10 in La Union to 15 in Leyte. Private shallow well leads in terms of volume as source of additional water. Given safety consideration, it is noted that along with shallow well, spring/river/stream/pond also leads as additional water source. Table A4. Average Cost per Day (in Pesos) of Additional Water Collected from Other
Sources of WD-connected Households
LEGASPI LA UNION LEYTE QUEZON KORONADAL
Source Ave. Cost
N Cases
Ave. Cost
N Cases
Ave. Cost
N Cases
Ave. Cost
N Cases
Ave. Cost
N Cases
Public faucet - - - - - - - - - -
Private deep well 1.00 1 - - 1.0 1 - - - -
Private shallow well 11.16 19
Spring/River/ Stream/ Pond - - - - - - - - - -
Rain - - - - - - - - - -
Water vendors 14.00 2 4.00 1 4.00 1 38.00 7 - -
Purified water refilling station 16.75 68 15.33 3 23.33 9 28.75 4 16.0 10
Ranging from an average of P28.75 (Quezon) to P15.33 (La Union) per day, purified water refilling station, the most costly source of additional water is cited by 94 households. While water vendors are also costly sources of additional water, only 11 households rely on them as a source. The rest of other sources are not as costly and are not as prevalently cited as additional water source.

Supplementary Appendix H
TA No. 7122-PHI: Water District Development Sector Project PPTA – Final Report – Vol. 10
89
Table A5. Average Time Consumed (in minutes per day) to Collect Additional Water from
Other Sources by WD-connected Households LEGASPI LA UNION LEYTE QUEZON KORONADAL
Source Ave. Time
N Cases
Ave. Time
N Cases
Ave. Time
N Cases
Ave. Time
N Cases
Ave. Time
N Cases
Public faucet - - - - - - - - - -
Private deep well 5.0 1 - - 221.0 1 3.0 2
Private shallow well 21.2 20 6.0 6 6.7 3 - - - -
Spring/River/ Stream/ Pond 25.0 1 - - - - - - - -
Rain - - - - 30.0 1 30.0 1 - -
Water vendors 17.5 2 0.0 1 60.0 1 22.1 7 - -
Purified water refilling station 19.3 39 0.0 3 29.6 8 20.0 3 6.1 10
Data on average time consumed to collect additional water do not show any pattern but it is important to note that in Legaspi, not only is purified water refilling station costly but at 19.3 minutes, is time consuming to source as well. In the same water district, private shallow well, an unreliable source of safe water is also time-consuming to source – average of 21.2 minutes per day. Table A6. Average Distance (in meters) of Other Water Sources from the Dwelling Unit
of WD-connected Household LEGASPI LA UNION LEYTE QUEZON KORONADAL
Source Ave. Distance
N Cases
Ave. Distance
N Cases
Ave. Distance
N Cases
Ave. Distance
N Cases
Ave. Distance
N Cases
Public faucet - - - - - - - - - -
Private deep well 4.0 1 - - 6.0 1 - - 10.5 2
Private shallow well 18.4 21 7.7 6 3.7 3 - - - -
Spring/River/ Stream/ Pond 5.0 1 - - - - - - - -
Water vendors 500.0 1 - - 100.0 1 243.0 6 - -
Purified water refilling station 276.5 61 - - 274.3 7 226.7 6 585.7 7
Ranging from 585.7 meters to 226.7 meters from the dwelling units, commercial source of additional water that is safe i.e., purified water refilling station is the least accessible source. On the other hand, non-commercial sources of additional water which is unsafe (private shallow well and spring/river/stream/pond), at 3.5 meters to 18.4 meters from the dwelling units are relatively accessible. It is important to note the health implication of relatively inaccessible alternative source of safe water and the accessibility of unsafe sources.

Supplementary Appendix H
TA No. 7122-PHI: Water District Development Sector Project PPTA – Final Report – Vol. 10
90
Table A7. Percentage of Households by Number of Other Households/Families Using
Water from Their Piped Water Connection
Water District
Total LEGASPI LA UNION LEYTE QUEZON KORONADAL
% of Households providing piped water to neighbors/ relatives
11.7% 22.0% 23.0% 8.8% 13.9% 13.3%
N Cases 214 41 122 274 72 723
Number of other households/families using water from piped water
1 household/family 62.5% 42.9% 28.6% 70.0% 80.0% 53.1%
2 households/families 31.3% 28.6% 10.7% 10.0% 0.0% 14.8%
3 households/families 0.0% 28.6% 17.9% 5.0% 20.0% 12.3%
4 households/families 6.3% 0.0% 7.1% 5.0% 0.0% 4.9%
5 or more households/ families 0.0% 0.0% 35.6% 10.0% 0.0% 14.8%
N Cases 16 7 28 20 10 81
Households in Leyte and La Union, at 23% and 22% respectively have the most number of households sharing their WD connected piped water. Of the households sharing water from water district-connected piped water, more than half of them (53.1%) share water with 1 household/family, 14.8% with 2 households/families, 33.3% with 3 or more households/families. Except for a distinct observation in Leyte where considerable number of households (35.6%) share their piped water with 5 or more households, the households in the 4 other districts show similar distribution pattern on the number of other households/families relying on their piped water connection.

Supplementary Appendix H
TA No. 7122-PHI: Water District Development Sector Project PPTA – Final Report – Vol. 10
91
Table A8. Percentage of Households by Availability of Piped Water during Ordinary
Days (Number of Hours in a Day) Availability of Piped Water
(Number of hours per day)
Water District
Total LEGASPI LA UNION LEYTE QUEZON KORONADAL
Less than 5 hours a day 0.9% 4.9% 1.6% 1.5% 0.0% 1.4%
5-9 hours a day 1.4% 4.9% 5.7% 13.6% 2.8% 7.1%
10-14 hours a day 0.9% 7.3% 5.7% 16.7% 0.0% 8.0%
15-19 hours a day 0.5% 2.4% 2.4% 5.1% 1.4% 2.7%
20-23 hours a day 0.0% 0.0% 0.8% 1.5% 0.0% 0.6%
24 hours a day 96.3% 80.5% 83.6% 61.7% 95.8% 80.1%
N Cases 214 41 122 274 72 723
On the average, a 24-hour piped water supply during ordinary days is available to 80% of households in the five districts. Reliability of WD-connected piped water is particularly high in Legaspi and Koronadal at 96.3% and 95.8%, respectively, and relatively low in Quezon at 61.7% only. Table A9. Percentage of Households by Availability of Piped Water during Ordinary
Days (Number of Days in a Week)
Availability of piped water during ordinary days
Water District
Total LEGASPI LA UNION LEYTE QUEZON KORONADAL
3 days in a week 0.0% 2.4% 0.0% 0.0% 0.0% 0.1%
4 days in a week 0.0% 2.4% 0.0% 0.4% 0.0% 0.3%
5 days in a week 0.0% 0.0% 0.8% 1.5% 0.0% 0.7%
7 days a week 100.0% 95.1% 99.2% 98.2% 100.0% 98.9%
N Cases 214 41 122 274 72 723
In Legaspi and Koronadal where only 3.7% and 4.2% of the households, respectively, have piped water less than 24 hours during ordinary days (Table A8), households are almost at daily 24-hour availability of piped water. Piped water availability 7 days a week is almost true in all the rest of the districts with La Union as an exception where piped water is not available daily to 4.8% of the households.

Supplementary Appendix H
TA No. 7122-PHI: Water District Development Sector Project PPTA – Final Report – Vol. 10
92
Table A10. Percentage of Households by Availability of Piped Water during Summer (Number of Days in a Week)
Availability of piped water during summer
Water District
Total LEGASPI LA UNION LEYTE QUEZON KORONADAL
3 days in a week 0.0% 2.4% 0.0% 0.0% 0.0% 0.1%
4 days in a week 0.0% 2.4% 1.6% 0.4% 0.0% 0.6%
5 days in a week 0.0% 0.0% 0.8% 1.5% 0.0% 0.7%
6 days in a week 0.0% 0.0% 0.8% 0.0% 0.0% 0.1%
7 days a week 100.0% 95.1% 96.7% 98.2% 97.2% 98.2%
No information - - - - 2.8% 0.3%
N Cases 214 41 122 274 72 723
During the dry months of the year, availability of piped water is not at all affected in all the five districts. As in ordinary days during the year, the 7-day 24-hour availability in Legaspi and the worse off situation in La Union where 4.8% of households have piped water supply 3 to 4 days only during the week still hold. This indicates that any improvement in the five districts would be more to expand the coverage of piped water connection to more households. Also, along with the data on hourly availability of piped water, improvements in the five districts would be in ensuring 24-hour piped water availability to households already with piped connection. Table A11. Percentage of Households by Availability of Piped Water during Rainy
Season (Number of Days in a Week) by Water District/Geographic Location
Availability of piped water during rainy season
Water District
Total LEGASPI LA UNION LEYTE QUEZON KORONADAL
2 days in a week 0.0% 0.0% 0.8% 0.0% 0.0% 0.1%
3 days in a week 0.0% 4.9% 0.0% 0.0% 0.0% 0.3%
4 days in a week 0.0% 0.0% 0.0% 0.0% 0.0% 0.0%
5 days in a week 0.0% 2.4% 0.8% 1.8% 0.0% 1.0%
6 days in a week 0.0% 0.0% 0.0% 0.4% 0.0% 0.1%
Everyday of the week 100.0% 92.7% 98.3% 97.8% 100.0% 98.5%
N Cases 213 41 121 274 69 718
There is a very slight improvement in piped water availability during rainy months. The over-all 98.5% availability during rainy months compared to 98.2% in summer is accounted for by the increased availability in Koronadal (from 97.2% of the households in summer (Table A10) to 100.0% during rainy months) and in Leyte (from 96.7% in summer to 98.3% in rainy season). What is uncharacteristic is the reduction in piped water availability in Quezon (from 98.2% in summer to 97.8% in rainy months).

Supplementary Appendix H
TA No. 7122-PHI: Water District Development Sector Project PPTA – Final Report – Vol. 10
93
Table A12. Percentage of Households by Level of Satisfaction on the Quality of Piped Water by
Water District/Geographic Location
Aspects of Water Quality Water District
Total LEGASPI LA UNION LEYTE QUEZON KORONADAL
Taste
Extremely unsatisfied 21.1% 12.5% 0.8% 2.9% 21.7% 10.3%
Moderately unsatisfied 27.7% 27.5% 7.4% 15.8% 29.0% 19.8%
Moderately satisfied 38.0% 42.5% 63.9% 66.3% 34.8% 53.1%
Extremely satisfied 4.7% 15.0% 25.4% 7.0% 14.5% 10.6%
Neither satisfied nor unsatisfied
8.5% 2.5% 2.5% 8.1% 0.0% 6.1%
Smell
Extremely unsatisfied 12.7% 12.2% 1.6% 1.8% 8.7% 6.3%
Moderately unsatisfied 31.9% 22.0% 2.5% 12.8% 26.1% 18.5%
Moderately satisfied 43.7% 56.1% 68.9% 68.9% 49.3% 58.8%
Extremely satisfied 6.1% 9.8% 25.4% 8.8% 15.9% 11.6%
Neither satisfied nor unsatisfied 5.6% 0.0% 1.6% 7.7% 0.0% 4.9%
Color
Extremely unsatisfied 25.8% 12.2% 0.8% 1.1% 24.6% 11.3%
Moderately unsatisfied
37.6% 29.3% 5.7% 15.0% 23.2% 21.7%
Moderately satisfied 26.8% 48.8% 63.1% 67.4% 39.1% 50.8%
Extremely satisfied 4.7% 4.9% 23.8% 9.2% 13.0% 10.4%
Neither satisfied nor unsatisfied 5.2% 4.9% 6.6% 7.3% 0.0% 5.7%
Overall quality of water
Extremely unsatisfied 16.1% 12.5% 1.6% 2.2% 17.4% 8.3%
Moderately unsatisfied 31.3% 25.0% 1.6% 10.0% 24.6% 17.1%
Moderately satisfied 43.1% 52.5% 66.4% 69.7% 42.0% 57.6%
Extremely satisfied 4.7% 10.0% 27.9% 9.2% 14.5% 11.6%
Neither satisfied nor unsatisfied 4.7% 0.0% 2.5% 8.9% 1.4% 5.3%
N Cases 213 41 121 274 69 718
In all the four aspects of water quality, i.e., taste, smell, color and odor, more than half of the households in the five districts are only moderately satisfied (53.1%, 58.8%, 50.8% and 57.6% respectively). In overall water quality, while 8.3% of the households are extremely unsatisfied, 11.6% are extremely satisfied. Given the 69.2% “moderately to extremely satisfied households” and the 25.4% “moderately unsatisfied to extremely unsatisfied households”, there is a positive net satisfaction rate of 43.8% in the overall quality of piped water in the five districts. Leyte water district with a net satisfaction rate of 91.1%
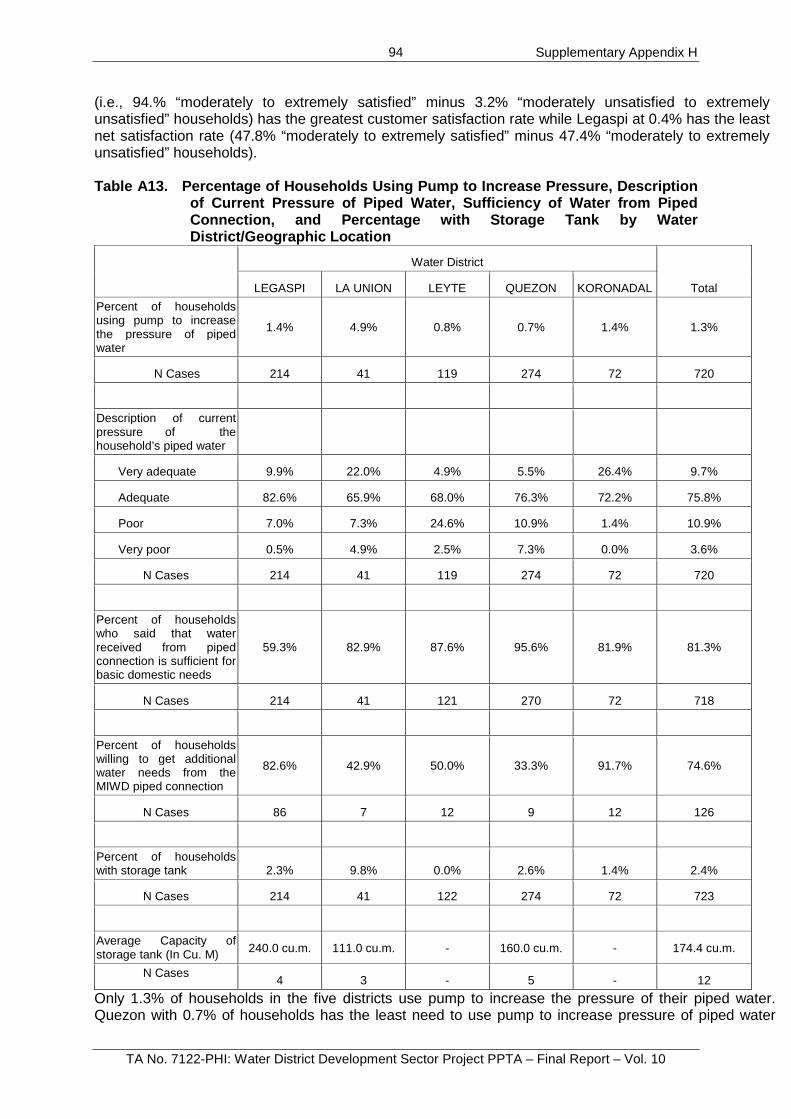
Supplementary Appendix H
TA No. 7122-PHI: Water District Development Sector Project PPTA – Final Report – Vol. 10
94
(i.e., 94.% “moderately to extremely satisfied” minus 3.2% “moderately unsatisfied to extremely unsatisfied” households) has the greatest customer satisfaction rate while Legaspi at 0.4% has the least net satisfaction rate (47.8% “moderately to extremely satisfied” minus 47.4% “moderately to extremely unsatisfied” households). Table A13. Percentage of Households Using Pump to Increase Pressure, Description
of Current Pressure of Piped Water, Sufficiency of Water from Piped Connection, and Percentage with Storage Tank by Water District/Geographic Location
Water District
Total LEGASPI LA UNION LEYTE QUEZON KORONADAL
Percent of households using pump to increase the pressure of piped water
1.4% 4.9% 0.8% 0.7% 1.4% 1.3%
N Cases 214 41 119 274 72 720
Description of current pressure of the household’s piped water
Very adequate 9.9% 22.0% 4.9% 5.5% 26.4% 9.7%
Adequate 82.6% 65.9% 68.0% 76.3% 72.2% 75.8%
Poor 7.0% 7.3% 24.6% 10.9% 1.4% 10.9%
Very poor 0.5% 4.9% 2.5% 7.3% 0.0% 3.6%
N Cases 214 41 119 274 72 720
Percent of households who said that water received from piped connection is sufficient for basic domestic needs
59.3% 82.9% 87.6% 95.6% 81.9% 81.3%
N Cases 214 41 121 270 72 718
Percent of households willing to get additional water needs from the MIWD piped connection
82.6% 42.9% 50.0% 33.3% 91.7% 74.6%
N Cases 86 7 12 9 12 126
Percent of households with storage tank 2.3% 9.8% 0.0% 2.6% 1.4% 2.4%
N Cases 214 41 122 274 72 723
Average Capacity of storage tank (In Cu. M) 240.0 cu.m. 111.0 cu.m. - 160.0 cu.m. - 174.4 cu.m.
N Cases 4 3 - 5 - 12
Only 1.3% of households in the five districts use pump to increase the pressure of their piped water. Quezon with 0.7% of households has the least need to use pump to increase pressure of piped water

Supplementary Appendix H
TA No. 7122-PHI: Water District Development Sector Project PPTA – Final Report – Vol. 10
95
while La Union households at 4.9% has the most households that need to use pump to augment water pressure. The low need to use pump water is confirmed with 85.5% of households in the five districts saying that water pressure is adequate to very adequate. At only 1.4% of households rating water pressure as poor, Koronadal has the least demand for increased pressure of piped water while Leyte has the greatest at 27.1% of households rating water pressure as poor to very poor. Perceived sufficiency of piped water for basic domestic needs ranges from 59.3% in Legaspi to 95.6% in Quezon. While on the average, 81.3% of the households say that piped water is sufficient to meet basic needs, still 74.6% of the households see the need for additional piped water from water district connection. Households with storage tank are relatively more prevalent in La Union (9.8%) while non-existent in Leyte for an average 2.4% of households in the five districts. Capacity of the storage tanks ranges from 111 cu. m. to 240 cu. m., o an average of 174.4 cu. m. Table A14. Percentage of Households with at Least One Member who Suffered from
Water-related Diseases during the Past Year and Percentage of Households Treating Water from the Faucet by Water District/Geographic Location
Water District
Total LEGASPI LA UNION LEYTE QUEZON KORONADAL
Percent of households with at least one member who suffered from water-related diseases during the past year (April 2008-March 2009)
12.6% 9.8% 4.1% 9.7% 7.0% 9.4%
N Cases 214 41 122 267 71 715
Percent of households that treat water from the faucet before drinking
18.3% 7.3% 11.8% 5.9% 2.8% 10.3%
N Cases 213 41 119 272 71 716
At 12.6% of households with at least one member who suffered water-related diseases, Legaspi has the highest prevalence while Leyte, has the lowest at 4.1% of the households. Ranging from 4.1% to 12.6% prevalence, the overall situation in the 5 water districts is at 9.4% of households having at least one member who suffered from water-related diseases. The survey reports that 54% of households primarily source their water from piped connection (Table 23). While 10.3% of them see the need to treat water from the faucet before drinking, it still indicates the absence of confidence among some households of the guaranteed safety of piped water. .

Supplementary Appendix H
TA No. 7122-PHI: Water District Development Sector Project PPTA – Final Report – Vol. 10
96
Table A15A. Volume of Water Treatment per day of WD-connected Households (All Water Districts)
Boiling Boiling+Filtering Filtering Adding chemicals
Number of HHs Percent
Number of HHs Percent
Number of HHs Percent
Number of HHs Percent
Volume treated per day (In gallons)
Less than 1 gallon 23 37.1%
1 - 2 30 48.4%
3 - 4 6 9.7%
5 or more 3 4.8%
Total 62 100.0%
Note: Boiling+Filtering, Filtering, Adding chemicals have fewer than five cases. In the 5 water districts, 86% of the households are treating 2 gallons or less of piped water daily. Table A15B. Cost of Water Treatment per day (Boiling only) and Cost of System
Installation of WD-connected Households (All Water Districts)
Boiling Boiling+Filtering Filtering Adding chemicals
Number of HHs Percent
Number of HHs Percent
Number of HHs Percent
Number of HHs Percent
Cost of treatment per day (in Pesos)
Less than P5 27 45.0%
P5 - 9 15 25.0%
P10 - 19 12 20.0%
P20 or more 6 10.0%
Total 60 100.0%
Note: Boiling+Filtering, Filtering, Adding chemicals have fewer than five cases.
Cost of installation of system/equipment (in Pesos)
Less than P100 44 83.0%
P100 - 199 5 9.4%
P200 – or more 4 7.5%
Total 53 100.0%
Note: Boiling+Filtering, Filtering, Adding chemicals have fewer than five cases.
Seventy percent of the households in the 5 water districts spend less than ten pesos a day for boiling the water they get from the faucet before drinking. The installing the boiling system (e.g., water boiling

Supplementary Appendix H
TA No. 7122-PHI: Water District Development Sector Project PPTA – Final Report – Vol. 10
97
pot, kitchen utensils, etc.) costs less than one hundred pesos to 83% of the households, and more than one hundred pesos to 17% of the households. Table A16. MIWD Service Performance Rating by Connected Households by Water
District/Geographic Location
Performance Rating Water District
Total LEGASPI LA UNION LEYTE QUEZON KORONADAL
Continuity of water supply
Very Poor 0.0% 7.3% 4.1% 12.8% 0.0% 5.9%
Poor 2.3% 12.2% 19.7% 22.3% 1.4% 13.3%
Neutral 0.5% 12.2% 4.9% 23.0% 11.1% 11.5%
Good 68.7% 51.2% 69.7% 38.3% 50.0% 54.5%
Very Good 28.5% 17.1% 1.6% 3.6% 37.5% 14.8%
Performance rating in the five districts along the aspect of continuity of water supply is rated from
good to very good by 69.3% of the households. In Legaspi, 97.2% of the households rated the water
district from good to very good in ensuring the continuity of water supply. In Quezon, on the other
hand, only 3.6% of the households rated the water district as very good, 38.3% as good, or 41.9%
good to very good performance. Reliability of water meter
Very Poor 0.9% 0.0% 0.0% 4.0% 1.4% 1.9%
Poor 7.5% 14.6% 6.6% 10.2% 0.0% 8.0%
Neutral 11.2% 9.8% 11.5% 39.8% 11.1% 22.0%
Good 51.9% 63.4% 78.7% 43.1% 54.2% 53.9%
Very Good 28.5% 12.2% 3.3% 2.9% 33.3% 14.1%
On reliability of water meter, only 14.1% of the households in the five districts rate it as very good,
53.9% as good or an overall rating of 68% good to very good. In Koronadal, 87.5% of households
rated the water district on this aspect of service as good to very good. In Quezon, less than half of
the households rated the water district as good to very good.

Supplementary Appendix H
TA No. 7122-PHI: Water District Development Sector Project PPTA – Final Report – Vol. 10
98
Table A16. MIWD Service Performance Rating by Connected Households by Water District/Geographic Location (CONTINUATION)
Regularity of billing and collection
Very Poor 0.9% 0.0% 3.3% 2.6% 0.0% 1.8%
Poor 1.9% 7.3% 2.5% 5.8% 0.0% 3.6%
Neutral 2.3% 17.1% 3.3% 42.3% 4.2% 18.7%
Good 61.2% 63.4% 82.8% 46.0% 50.7% 58.2%
Very Good 33.6% 12.2% 8.2% 3.3% 45.1% 17.7%
N Cases 212 41 122 274 72 721
The water districts of Koronadal and Legaspi are rated as good to very good in terms of regularity of
billing and collection by 95.8% and 94.8% of households, respectively. Quezon water district has
been rated by fewer households (49.3%) as good to very good. Overall rating of the five water
districts looks satisfactory as 75.9% of households assessing regularity of billing and collection as
good to very good. Response to customer complaints
Very Poor 9.3% 4.9% 6.6% 12.0% 2.8% 9.0%
Poor 7.5% 17.1% 13.9% 21.9% 5.6% 14.4%
Neutral 22.0% 22.0% 20.5% 40.9% 16.9% 28.4%
Good 45.3% 43.9% 55.7% 24.5% 40.8% 38.6%
Very Good 15.9% 12.2% 3.3% 0.7% 33.8% 9.6%
N Cases 212 41 122 274 72 721
Response to customer complaints in the five districts is perceived as not as quick as desired with
only 48.2% of households rating it as good to very good. Koronadal water district is above the rest in
responding to complaints with 74.6% of households rating it as good to very good. Quezon, with only
25.2% of households rating it as good to very good, is likely to be perceived as least responsive to
customer complaints.

Supplementary Appendix H
TA No. 7122-PHI: Water District Development Sector Project PPTA – Final Report – Vol. 10
99
Table A16. MIWD Service Performance Rating by Connected Households by Water District/Geographic Location (CONTINUATION)
Repair time/services
Very Poor 8.5% 4.9% 6.6% 12.1% 1.4% 8.6%
Poor 7.0% 24.4% 13.9% 19.8% 5.7% 13.9%
Neutral 22.5% 22.0% 14.8% 40.7% 17.1% 27.5%
Good 46.0% 36.6% 62.3% 26.7% 48.6% 41.2%
Very Good 16.0% 12.2% 2.5% 0.7% 27.1% 8.8%
N Cases 212 41 122 274 72 721
With only 60%of households in the five districts rating repair time and services as good to very good,
Koronadal at 75.7% of households rating it as good to very good is perceived as the best performer.
Quezon water district, with only 27.4% of households rating it as good to very good and 31.9% of
households rating it as poor to very poor, is shown to be the lowest performer. Overall water supply service
Very Poor 0.9% 9.8% 1.6% 9.1% 5.6% 5.1%
Poor 12.7% 17.1% 9.8% 16.4% 5.6% 13.2%
Neutral 4.2% 12.2% 7.4% 34.3% 6.9% 16.9%
Good 63.7% 53.7% 75.4% 38.7% 48.6% 54.1%
Very Good 18.4% 7.3% 5.7% 1.5% 33.3% 10.7%
N Cases 212 41 122 274 72 721
By and large, 64.8% of households in the five districts rate performance as good to very good, and 18.3% of households rating it as poor to very poor. Koronadal water district is perceived as good to very good by 81.9% households in overall water supply service, while only 11.2% of its household consumers rate it as poor to very poor. In Quezon, 40.2% of households rate the overall water supply service as good to very good and 25.5% as poor to very poor.

Supplementary Appendix H
TA No. 7122-PHI: Water District Development Sector Project PPTA – Final Report – Vol. 10
100
Table A17. Amount of Monthly Water Bill that WD-connected Households are Willing
to Pay to Access Improved Water Supply Services by Water District/Geographic Location
Amount willing to pay: Water District
Total LEGASPI LA UNION LEYTE QUEZON KORONADAL
P1,000/month 4.2% 0.0% 0.0% 5.5% 4.2% 3.9%
P 900/month 0.5% 0.0% 2.2% 1.1% 0.0% 0.9%
P 800/month 1.9% 0.0% 0.0% 2.9% 1.4% 1.9%
P 700/month 1.9% 2.4% 0.0% 1.5% 0.0% 1.3%
P 600/month 1.4% 2.4% 1.1% 5.5% 1.4% 3.0%
P 500/month 6.5% 14.6% 6.5% 9.6% 15.5% 9.1%
P 450/month 0.0% 7.3% 1.1% 0.4% 1.4% 0.9%
P 400/month 4.7% 0.0% 2.2% 6.3% 4.2% 4.6%
P 350/month 1.4% 4.9% 2.2% 3.7% 2.8% 2.8%
P 300/month 15.4% 7.3% 7.6% 11.4% 7.0% 11.4%
P 250/month 9.3% 17.1% 4.3% 10.3% 14.1% 10.0%
P 200/month 24.8% 22.0% 14.0% 15.4% 16.9% 18.7%
P150/month 28.0% 22.0% 58.1% 26.8% 31.0% 31.5%
Average Amount of Monthly Water Bill Willing to Pay
P 301.65 P 295.85 P 229.05 P 350.5 P 308.55 P 311.00
N Cases 214 41 93 272 71 691
Affordability level of WD-connected households in accessing improved water supply services converges at P150/month to P250/month (as preferred by 60.2% of the households). Only 6.7% of households are willing to pay the high end of P800/month to P1, 000/month. Expressed willingness to pay at low end cost of improved water supply services is particularly true in Leyte where 76.4% of households expressed willingness to pay from P150/month to P250/month. Quezon water district at 9.5% of households willing to pay P800/month to P1, 000/month (compared to an average of 5.8% of households in the five districts) and at 52.5% expressing their willingness to pay the low end cost of improved water supply (relative to 60.2% average) has relatively higher affordability for improved water services. On the whole, the average amount of monthly water bill that households are willing to pay is estimated to be at P311 for the five water districts: P302 in Legazpi, P296 in La Union, P229 in Leyte, P351 in Quezon and P309 in Koronadal.

Supplementary Appendix H
TA No. 7122-PHI: Water District Development Sector Project PPTA – Final Report – Vol. 10
101
Table A18. Reason(s) of Households for Staying Connected with Piped Water System
(Multiple Responses) by Water District/Geographic Location
Reason for staying connected
Water District
Total LEGASPI LA UNION LEYTE QUEZON KORONADAL
Convenience 14.5% 7.3% 6.8% 1.3% 16.7% 8.3%
Really want/need the improved water service 65.4% 78.0% 65.0% 71.5% 54.2% 67.1%
Worried about the health risks of the existing water service 16.4% 19.5% 27.4% 13.8% 23.6% 18.3%
Increased water bill is not too high 16.4% 4.9% 10.3% 8.4% 1.4% 10.2%
N Cases 214 41 117 239 72 683
Perceived need for improved existing water supply service (cited by 67% of households) and the health risk of making do with the present system (18.3% of households) lead as the motivation of households in the five districts for staying connected with piped water system. The perceived need for improved water supply service is particularly pervasive in La Union at 78% of its households citing it as their reason for staying connected. Table A19. Aspects of WD Services that Households Want to be Improved (Multiple
Responses) by Water District/Geographic Location
Aspect of WD Services Water District
Total LEGASPI LA UNION LEYTE QUEZON KORONADAL
Water pressure 6.5% 17.1% 44.4% 41.2% 2.8% 26.0%
Complaints handling 9.3% 7.3% 8.5% 10.1% 11.1% 9.6%
Reduced water rates 30.8% 22.0% 19.7% 13.9% 20.8% 21.1%
Repairs 10.3% 0.0% 7.7% 8.2% 2.8% 7.7%
Billing 0.9% 4.9% 2.6% 19.1% 2.8% 8.4%
Quality of water/ clean water
35.0% 4.7% 7.9% 2.3% 15.9% 14.6%
Maintenance of pipes 6.1% 4.2% 2.8% 11.2% 3.7% 7.1%
N Cases 214 41 117 267 72 711
On the average, clean water and improved water pressure (65.9% and 26%, respectively) are cited by the households as the leading aspects for improved WD water services. Looking at individual districts/geographic location, the identified aspects of water service improvement widely vary among the five districts. For instance, while 35% of households in Legaspi cite clean water as the aspect for improvement, only 2.3% and 4.7% in Quezon and La Union, respectively, say so. Moreover, while 44.4% and 41.2% of households in Leyte and Quezon say that improved water pressure is an area for improvement, only 2.8% of households in Koronadal say so.

Supplementary Appendix H
TA No. 7122-PHI: Water District Development Sector Project PPTA – Final Report – Vol. 10
102
IV. Water Consumption and Preferences of Non-Connected Households Table B1. Percentage of Non-connected Households by Source of Water for Various
Uses by Water District/Geographic Location
Water Source Water District
Total LEGASPI LA UNION LEYTE QUEZON KORONADAL
Drinking
Piped water (not own connection) 28.7% 5.3% 62.0% 56.6% 3.4% 25.2%
Public faucet 0.6% 0.9% 16.7% 14.2% 3.8% 6.3%
Private deep well 2.3% 3.5% .4% 0.0% 30.9% 9.6%
Private shallow well 49.7% 45.7% 11.4% 6.2% 40.6% 33.8%
Spring/River/ Stream/ Pond 2.3% 0.3% 0.0% 5.3% 2.5% 1.6%
Water vendors & peddlers 9.9% 44.0% 8.4% 17.7% 18.4% 22.2%
Open dug well 2.3% 0.3% 1.1% 0.0% 0.3% 0.7%
BRAWASA piped connection 4.1% 0.0% 0.0% 0.0% 0.0% 0.6%
N Cases 171 341 263 113 320 1,208
Among non-connected households, 33.8% and 22.2% of households source their drinking water
from shallow well and water vendors/peddlers, respectively. There is a wide variation in the individual
situation of the five districts. For instance, while a considerable percentage of households in Legaspi
(49.7%) source their drinking water from shallow well, only 6.2% of households in Quezon do so. But
then, 5.3% of households in Quezon get their drinking water from spring/river/stream/pond against
the 1.6% of total households and the nil case in Leyte. In another instance, while sourcing of
drinking water from deep wells is done by 30.9% of households in Koronadal, it is only done by 0.4%
to 3.5% of households in the rest of the five districts.

Supplementary Appendix H
TA No. 7122-PHI: Water District Development Sector Project PPTA – Final Report – Vol. 10
103
Table B1. Percentage of Non-connected Households by Source of Water for Various Uses by Water District/Geographic Location (CONTINUATION)
Water Source Water District
Total LEGASPI LA UNION LEYTE QUEZON KORONADAL
Cooking
Piped water (not own connection) 26.9% 6.5% 58.8% 58.4% 3.7% 24.9%
Public faucet 1.2% 1.8% 16.4% 15.0% 3.4% 6.5%
Private deep well 1.8% 6.8% 0.8% 0.9% 34.9% 11.7%
Private shallow well 61.4% 78.8% 19.8% 12.4% 52.0% 50.2%
Spring/River/ Stream/ Pond 2.9% 0.3% 0.0% 6.2% 3.4% 2.0%
Rain 0.0% 0.0% 0.0% 0.0% 0.3% 0.1%
Water vendors & peddlers 0.0% 5.0% 3.1% 7.1% 1.2% 3.1%
Open dug well 1.8% 0.9% 1.1% 0.0% 0.9% 1.0%
BRAWASA piped connection 4.1% 0.0% 0.0% 0.0% 0.0% 0.6%
N Cases 171 340 262 113 321 1,207
Around half of the total non-connected households in the five districts source the water they use for
cooking from shallow wells. Sourcing water for cooking from piped water (not own connection) is a
distinct observation in Leyte and Quezon at 58.8% and 58.4% of non-connected households,
respectively. Another situation uncharacteristic of the general picture in the five districts is the case
of Koronadal where there is high reliance on deep well as source of water for cooking (34.9% of non-
connected households).
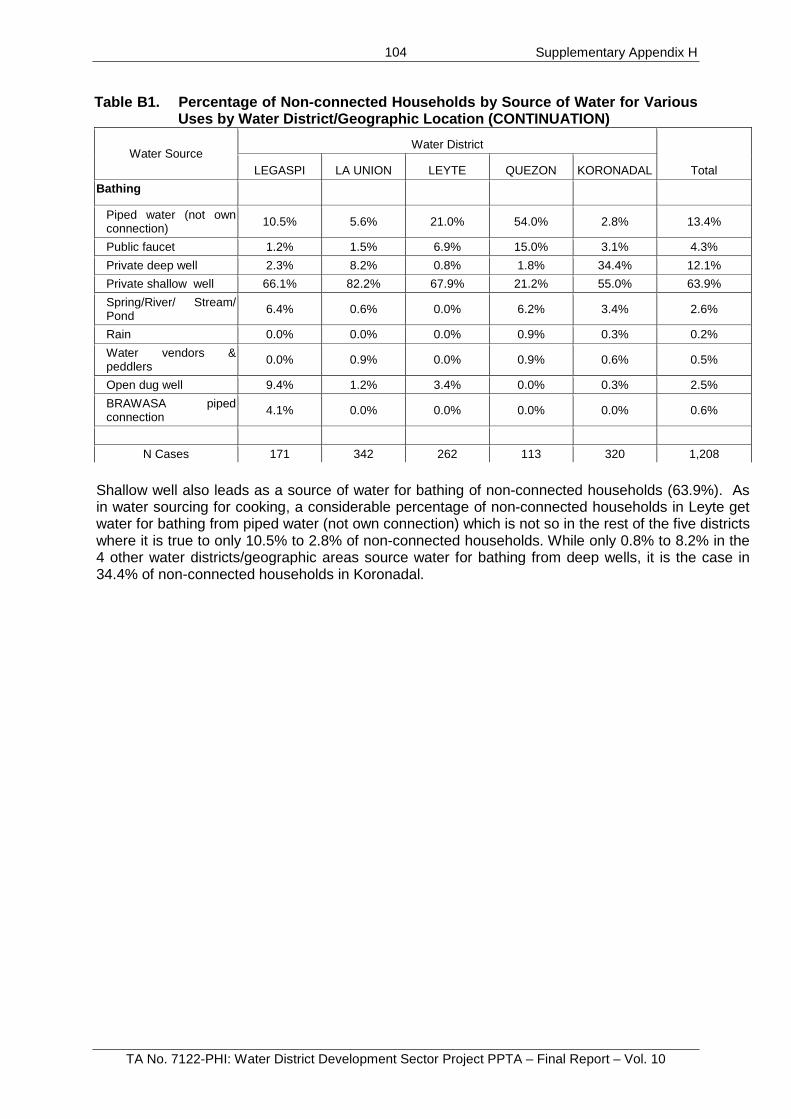
Supplementary Appendix H
TA No. 7122-PHI: Water District Development Sector Project PPTA – Final Report – Vol. 10
104
Table B1. Percentage of Non-connected Households by Source of Water for Various Uses by Water District/Geographic Location (CONTINUATION)
Water Source Water District
Total LEGASPI LA UNION LEYTE QUEZON KORONADAL
Bathing
Piped water (not own connection) 10.5% 5.6% 21.0% 54.0% 2.8% 13.4%
Public faucet 1.2% 1.5% 6.9% 15.0% 3.1% 4.3%
Private deep well 2.3% 8.2% 0.8% 1.8% 34.4% 12.1%
Private shallow well 66.1% 82.2% 67.9% 21.2% 55.0% 63.9%
Spring/River/ Stream/ Pond 6.4% 0.6% 0.0% 6.2% 3.4% 2.6%
Rain 0.0% 0.0% 0.0% 0.9% 0.3% 0.2%
Water vendors & peddlers 0.0% 0.9% 0.0% 0.9% 0.6% 0.5%
Open dug well 9.4% 1.2% 3.4% 0.0% 0.3% 2.5%
BRAWASA piped connection 4.1% 0.0% 0.0% 0.0% 0.0% 0.6%
N Cases 171 342 262 113 320 1,208
Shallow well also leads as a source of water for bathing of non-connected households (63.9%). As in water sourcing for cooking, a considerable percentage of non-connected households in Leyte get water for bathing from piped water (not own connection) which is not so in the rest of the five districts where it is true to only 10.5% to 2.8% of non-connected households. While only 0.8% to 8.2% in the 4 other water districts/geographic areas source water for bathing from deep wells, it is the case in 34.4% of non-connected households in Koronadal.

Supplementary Appendix H
TA No. 7122-PHI: Water District Development Sector Project PPTA – Final Report – Vol. 10
105
Table B1. Percentage of Non-connected Households by Source of Water for Various
Uses by Water District/Geographic Location (CONTINUATION)
Water Source Water District
Total LEGASPI LA UNION LEYTE QUEZON KORONADAL
Gardening
Piped water (not own connection) 9.6% 3.1% 6.1% 58.6% 1.0% 7.3%
Public faucet 0.9% 1.7% 2.7% 13.8% 2.8% 2.9%
Private deep well 3.5% 9.3% 2.0% 1.7% 32.3% 14.2%
Private shallow well 65.2% 83.4% 83.1% 13.8% 57.3% 68.2%
Spring/River/ Stream/ Pond 5.2% 0.7% 1.4% 10.3% 3.5% 2.9%
Rain 1.7% 0.0% 0.0% 1.7% 1.0% 0.7%
Water vendors & peddlers 0.0% 1.0% 0.0% 0.0% 0.3% 0.4%
Open dug well 7.8% 0.7% 4.7% 0.0% 1.7% 2.6%
BRAWASA piped connection 6.1% 0.0% 0.0% 0.0% 0.0% 0.8%
N Cases 115 290 148 58 288 899
Similar pattern of water sourcing holds for gardening among non-connected households in the five
districts where shallow well leads at 68.2% of total households. Also, as in other water uses, using
water from piped water for gardening (not own connection) is a leading practice in Leyte. Sourcing
water for gardening from deep well is also the situation in Koronadal as in the other uses of water.

Supplementary Appendix H
TA No. 7122-PHI: Water District Development Sector Project PPTA – Final Report – Vol. 10
106
Table B1. Percentage of Non-connected Households by Source of Water for Various Uses by Water District/Geographic Location (CONTINUATION)
Water Source Water District
Total LEGASPI LA UNION LEYTE QUEZON KORONADAL
Cleaning
Piped water (not own connection) 10.1% 4.5% 14.1% 54.5% 3.1% 11.6%
Public faucet 0.6% 1.5% 7.6% 15.5% 2.5% 4.3%
Private deep well 2.4% 8.7% 1.5% 0.9% 33.1% 12.1%
Private shallow well 66.3% 82.3% 74.1% 20.0% 54.7% 65.1%
Spring/River/ Stream/ Pond 5.9% 0.6% 0.0% 6.4% 3.8% 2.6%
Rain 1.2% 0.0% 0.0% 0.9% 1.6% 0.7%
Water vendors & peddlers 0.0% 0.9% 0.0% 1.8% 0.3% 0.5%
Open dug well 9.5% 1.5% 2.7% 0.0% 0.9% 2.6%
BRAWASA piped connection 4.1% 0.0% 0.0% 0.0% 0.0% 0.6%
N Cases 169 333 263 110 320 1,195
The mode of water sourcing is the same for cleaning as in other uses (drinking, cooking, bathing and
gardening) among non-connected households in the five districts where shallow well leads at 61.2%
of total households. Also, as in other water uses, using water from piped water for cleaning (not own
connection) is a leading practice of 54.5% of non-connected households in Leyte. Sourcing water for
cleaning from deep well is also the situation in Koronadal as in the other uses of water.

Supplementary Appendix H
TA No. 7122-PHI: Water District Development Sector Project PPTA – Final Report – Vol. 10
107
Table B2. Percentage of Non-connected Households Paying for Supply of Piped
Water from Other Household’s Connection by Water District/ Geographic Location
Water District
Total LEGASPI LA UNION LEYTE QUEZON KORONADAL
Percent of households paying for supply of piped water from other’s connection
90.2% 36.7% 89.0% 75.4% 66.7% 80.8%
N Cases 51 24 173 69 14 331
To whom paying
Neighbor/Relative who has own WD piped connection
100.0% 90.9% 85.4% 42.3% 90.0% 80.0%
Barangay association 0.0% 0.0% 14.6% 57.7% 10.0% 19.6%
N Cases 46 11 151 52 10 270
Of the total non-connected households, 80.8% pay for piped water sourced from other’s piped connection. Of these paying households, 80% pay to either a neighbor or a relative who has water district piped connection. In Legaspi, all non-connected households sourcing water from piped connection not their own pay to a neighbor or relative while in Quezon, a considerable percentage of 57.7% pay to the Barangay association.

Supplementary Appendix H
TA No. 7122-PHI: Water District Development Sector Project PPTA – Final Report – Vol. 10
108
Table B3. Reasons of Non-connected Households for Not Being Connected to the Piped Water System (Multiple Responses) by Water District/ Geographic Location
Reason for not being
connected
Water District
Total LEGASPI LA UNION LEYTE QUEZON KORONADAL
Connection is not available 6.4% 54.7% 36.9% 46.0% 67.1% 46.5%
Connection fee too high 49.1% 18.1% 41.4% 42.5% 9.0% 27.4%
Present water source is adequate & satisfactory 32.7% 14.9% 4.6% 23.0% 11.2% 14.9%
Monthly charges too high 25.1% 10.5% 23.6% 18.6% 5.0% 14.7%
House is being rented 5.8% 2.6% 17.5% 4.4% 5.3% 7.2%
Disconnected 6.4% 7.0% 6.5% 2.7% 0.6% 4.7%
WD piped water not safe/clean 4.7% 4.1% 2.7% 4.4% 1.9% 3.3%
Waiting list for connection 1.8% 1.2% 4.6% 3.5% 4.7% 3.1%
N Cases 171 342 263 113 322 1,211
Non-availability of water connection leads as a reason for not being connected to piped water (46.5% of non-connected households). Also a major reason is on affordability where 27.4% of non-connected households cite “connection fee is too high” as a reason. A deviation from this pattern is in Legaspi where non-availability is not a leading reason (only 6.4% of non-connected households). Instead, “connection fee is too high” and “present source of water is adequate and satisfactory” are the major reasons for staying unconnected at 49.1% and 32.7%, respectively.

Supplementary Appendix H
TA No. 7122-PHI: Water District Development Sector Project PPTA – Final Report – Vol. 10
109
Table B4. Percentage of Non-connected Households by Perceived/Observed
Availability of Water Service in their Household by Water District/ Geographic Location
Water District
Total LEGASPI LA UNION LEYTE QUEZON KORONADAL
Perceived/Observed availability of water service in the household
Sufficient all year round 90.1% 82.7% 62.4% 84.1% 71.4% 76.5%
Insufficient during dry season 1.2% 12.9% 1.5% 3.5% 0.0% 4.5%
Insufficient sometimes 7.6% 3.2% 21.7% 11.5% 22.7% 13.8%
Insufficient mostly 0.0% 0.0% 12.2% 0.0% 4.0% 3.7%
No information 1.2% 1.2% 2.3% 0.9% 1.9% 1.6%
N Cases 171 342 263 113 322 1211
Percent of non-connected households with storage tank
4.7% 12.1% 0.4% 5.4% 9.3% 7.1%
N Cases 170 339 261 112 321 1,203
Most of the non-connected households (76.5%) perceive that availability of water service in the household is sufficient all year round. The urgent need of non-connected households to get connected is gleaned from only 23.5%of the households saying that their present water supply is insufficient either “sometimes”, “during dry season” or “mostly insufficiently”. The urgency in Legaspi is not as pronounced, with a considerable 90.1% saying that present water service is sufficient all year round, but is considerably felt in Leyte where only 62.2% say it as so.

Supplementary Appendix H
TA No. 7122-PHI: Water District Development Sector Project PPTA – Final Report – Vol. 10
110
Table B5. Average Volume of Water Consumption of Non-connected Households by
Type of Use (In gallons per day) by Water District/Geographic Location Type of Use Minimum Maximum Average N Cases
ALL 5 WATER DISTRICTS
Drinking 0.10 112.00 3.41 1,192
Cooking 0.25 79.26 5.83 1,184
Bathing 4.00 180.00 34.84 1,175
Gardening 0.25 264.20 11.85 874
Cleaning 0.25 300.00 15.56 1,175
LEGAZPI
Drinking 0.25 100.00 3.97 169
Cooking 0.26 79.26 7.17 167
Bathing 5.00 170.00 51.61 163
Gardening 0.25 100.0 11.83 113
Cleaning 0.50 300.0 38.06 166
LA UNION
Drinking 0.25 112.00 2.76 337
Cooking 0.25 42.00 4.92 336
Bathing 4.00 169.00 32.19 336
Gardening 0.25 127 7.25 281
Cleaning 0.25 264 6.95 331
LEYTE
Drinking 0.53 30.00 3.28 261
Cooking 0.53 30.00 4.21 259
Bathing 5.00 171.00 27.64 258
Gardening 0.25 80.00 9.25 143
Cleaning 0.50 105.68 13.23 259
QUEZON
Drinking 0.79 40.00 3.15 113
Cooking 0.26 20.00 2.63 113
Bathing 6.00 180.00 34.92 110

Supplementary Appendix H
TA No. 7122-PHI: Water District Development Sector Project PPTA – Final Report – Vol. 10
111
Gardening 1.00 30.00 5.74 57
Cleaning 0.26 40.00 6.67 110
KORONADAL
Drinking 0.26 16.00 4.01 312
Cooking 0.53 52.84 8.61 309
Bathing 5.00 158.52 34.94 308
Gardening 1.00 264.20 19.05 280
Cleaning 0.53 264.20 17.81 309
Bathing is a leading use of water in non-connected households ranging from an average 27.64 cu. m. in Leyte to 51.61 cu. m. in Legaspi. While this a common observation in the five water district areas, variation in water usage is observed in cleaning where a considerable average consumption of 38.06 cu. m. for cleaning is second to bathing in Legazpi as against cleaning as third only to bathing in Koronadal (17.81 cu. m.) and in La Union (6.95 cu. m.). Instead, a more substantial use of water for gardening (19.05 in Koronadal and 7.25 in La Union) places it as second to bathing. Volume-wise, water consumption among non-connected households in the 5 water district areas is variable such that, in Legaspi, the consumption ranges from 3.97 cu. m. to 54.61 cu. m., while in Leyte, consumption ranges from 3.28 cu. m. to 27.64 cu. m. Table B6. Percentage of Non-connected Households by Persons Usually Fetching
Water from the Source by Water District/Geographic Location
Person(s) usually fetching water from source
Water District
Total LEGASPI LA UNION LEYTE QUEZON KORONADAL
Adult male household member(s) 57.2% 42.5% 43.3% 36.6% 32.4% 41.3%
Adult female household member(s) 17.1% 33.5% 11.8% 19.6% 24.8% 23.1%
Children 5.3% 11.1% 24.4% 13.4% 13.0% 13.8%
Anyone available 20.4% 12.9% 20.6% 30.4% 29.8% 21.8%
N Cases 152 334 238 112 315 1,151
Adult male household members in Legaspi account for more than half (57.2%) of usual water fetchers from the water source while they only account for about a third in Koronadal and Quezon (32.3% and 36.6%, respectively). A larger percentage of adult female household members do the water fetching in La Union (33.5%) compared to only 11.8% in Leyte where a larger proportion of children (24.4% as against the overall percentage of only 13.8%) are tasked to the work.

Supplementary Appendix H
TA No. 7122-PHI: Water District Development Sector Project PPTA – Final Report – Vol. 10
112
Table B7. Percentage of Non-connected Households by Means of Transporting
Water by Water District/Geographic Location
Means of transport Water District
Total LEGASPI LA UNION LEYTE QUEZON KORONADAL
Water truck 0.0% 1.5% 0.9% 5.6% 0.6% 1.3%
Tricycle 0.0% 0.9% 7.3% 4.7% 2.2% 2.8%
Carry using pail/open containers 71.4% 86.1% 26.9% 59.8% 53.3% 60.3%
Carry using closed containers 16.2% 3.1% 53.4% 2.8% 19.0% 19.7%
Pipe or water hose connected to neighbor 7.1% 8.0% 1.3% 27.1% 5.7% 7.7%
Carry using both closed & open containers 5.2% 0.0% 9.0% 0.0% 17.1% 7.3%
Bicycle/Motorcycle 0.0% 0.0% 0.4% 0.0% 1.6% 0.5%
Own car/jeepney 0.0% 0.3% 0.4% 0.0% 0.3% 0.3%
Push cart 0.0% 0.0% 0.4% 0.0% 0.0% 0.1%
N Cases 154 323 234 107 315 1,133
Transporting water from its source is largely done by carrying (80%) using open or closed containers (60.3% and 19.7% respectively). A considerable proportion (27.1%) of non-connected households in Quezon use pipe or hose connected to a neighbor.

Supplementary Appendix H
TA No. 7122-PHI: Water District Development Sector Project PPTA – Final Report – Vol. 10
113
Table B8. Percentage of Non-connected Households by Total Spent Collecting Water
per Day (In number of hours) and Schedule of Collecting by Water District/Geographic Location
Water District
Total LEGASPI LA UNION LEYTE QUEZON KORONADAL
Total time spent
0.5 – 1 hour 84.0% 97.5% 80.0% 92.1% 97.8% 91.2%
1.1 – 2 hours 14.1% 1.3% 5.6% 1.1% 1.8% 4.2%
2- 4 hours 1.3% 0.3% 7.2% 0.0% 0.0% 1.9%
5 hours or more 0.6% 0.9% 7.2% 6.7% 0.4% 2.7%
N Cases 156 319 250 89 278 1,092
Schedule of collecting Morning 16.6% 21.6% 15.4% 16.3% 2.6% 13.8%
Evening 0.0% 1.6% 6.7% 0.0% 0.0% 1.9%
Afternoon 0.0% 1.3% 3.8% 6.5% 0.3% 1.8%
Anytime 83.4% 75.6% 74.2% 77.2% 97.1% 82.5%
N Cases 151 320 240 92 310 1,113
Half to an hour per day is spent collecting water by 91.2% of non-connected households in the five water district areas. However, collecting water is more time consuming in Leyte where only 80% of the households spend a half to 1 hour and a considerable 14.4% spend from 2 to more than 5 hours per day in collecting water. Collecting water is least time consuming in Koronadal where only 0.4% of non-connected households do it in 5 hours or more per day as against 7.2% in Koronadal and the overall average of 2.7% in the five water district areas. There is no particular time of the day that water collecting is done in the five water district areas where 82.5% of households do it anytime of the day. A considerable percentage of 21.6% of households do it in the morning in La Union as against the 13.8% average in the five water district areas. Koronadal households are not particularly keen on the time of the day they collect water from source where 97.1% say that they do it anytime of the day.

Supplementary Appendix H
TA No. 7122-PHI: Water District Development Sector Project PPTA – Final Report – Vol. 10
114
Table B9. Percentage of Non-connected Households by Level of Satisfaction on the
Quality of Water from their Current Sources by Water District/ Geographic Location
Aspects of Water Quality
Water District Total
LEGASPI LA UNION LEYTE QUEZON KORONADAL
Taste
Extremely unsatisfied 2.3% 0.9% 0.0% 0.0% 3.7% 1.6%
Moderately unsatisfied 7.0% 7.7% 4.2% 7.1% 8.4% 7.0%
Moderately satisfied 45.6% 69.0% 64.6% 69.6% 65.1% 63.8%
Extremely satisfied 44.4% 21.8% 27.3% 17.9% 22.1% 25.9%
Neither satisfied nor unsatisfied 0.6% 0.6% 3.8% 5.4% 0.6% 1.7%
N Cases 171 339 260 112 321 1,203
Most non-connected households in the five water district areas are satisfied with the taste of water they get from their current sources -- such that 25.9% are extremely satisfied and 63.8% are moderately satisfied, or an overall satisfaction rate of 89.7%. Dissatisfaction is only expressed by 8.6% of the households, 1.6% of whom are extremely unsatisfied and 7% are moderately unsatisfied. Dissatisfaction is least in Leyte where 91.9% are generally satisfied and only 4.2% of the households are moderately unsatisfied.
Smell
Extremely unsatisfied 2.3% 0.0% 0.0% 0.9% 3.7% 1.4%
Moderately unsatisfied 4.7% 4.1% 5.0% 7.1% 7.2% 5.5%
Moderately satisfied 50.9% 73.2% 65.8% 66.1% 64.5% 65.4%
Extremely satisfied 41.5% 22.1% 26.5% 21.4% 24.0% 26.3%
Neither satisfied nor unsatisfied 0.6% 0.6% 2.7% 4.5% 0.6% 1.4%
N Cases 171 339 260 112 321 1,203
Dissatisfaction of non-connected households on the smell of water is particularly high in Koronadal where 10.9% expressed that they are moderately to extremely unsatisfied with the smell of water from their current source. Least dissatisfaction is conveyed in La Union where 95.3% of non-connected households are extremely to moderately satisfied, nil on extreme dissatisfaction and only 4.1% are moderately unsatisfied.
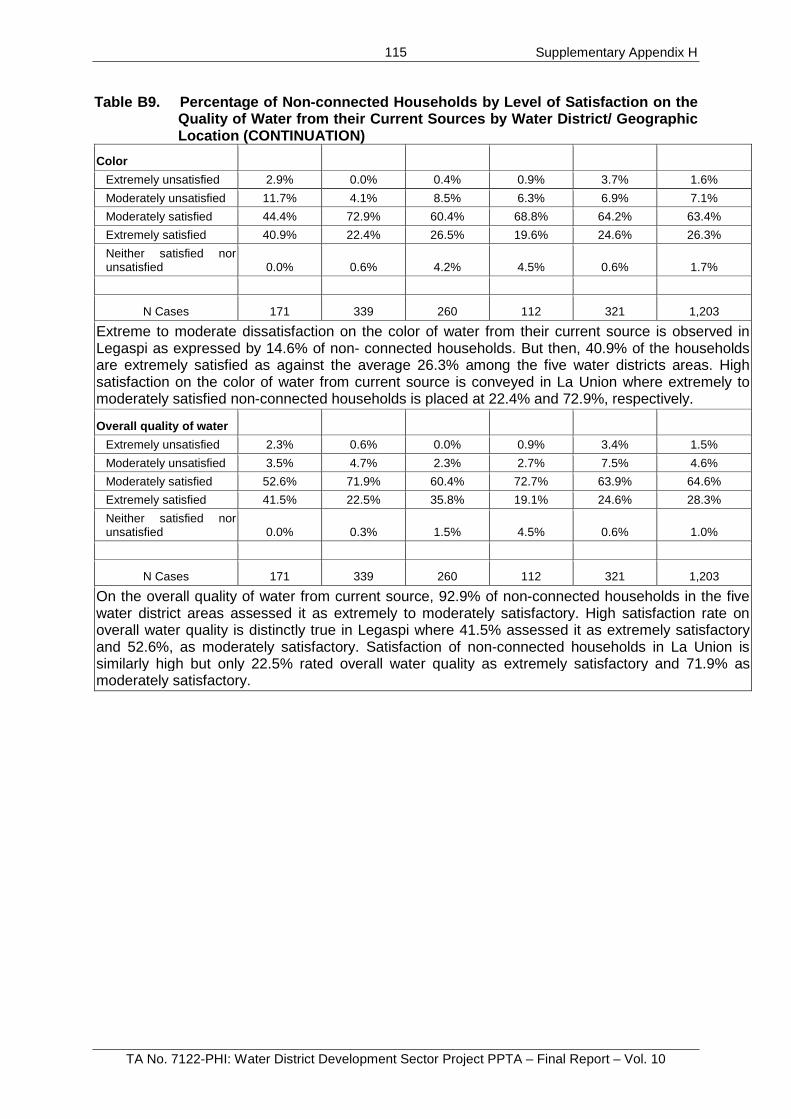
Supplementary Appendix H
TA No. 7122-PHI: Water District Development Sector Project PPTA – Final Report – Vol. 10
115
Table B9. Percentage of Non-connected Households by Level of Satisfaction on the Quality of Water from their Current Sources by Water District/ Geographic Location (CONTINUATION)
Color
Extremely unsatisfied 2.9% 0.0% 0.4% 0.9% 3.7% 1.6%
Moderately unsatisfied 11.7% 4.1% 8.5% 6.3% 6.9% 7.1%
Moderately satisfied 44.4% 72.9% 60.4% 68.8% 64.2% 63.4%
Extremely satisfied 40.9% 22.4% 26.5% 19.6% 24.6% 26.3%
Neither satisfied nor unsatisfied 0.0% 0.6% 4.2% 4.5% 0.6% 1.7%
N Cases 171 339 260 112 321 1,203
Extreme to moderate dissatisfaction on the color of water from their current source is observed in Legaspi as expressed by 14.6% of non- connected households. But then, 40.9% of the households are extremely satisfied as against the average 26.3% among the five water districts areas. High satisfaction on the color of water from current source is conveyed in La Union where extremely to moderately satisfied non-connected households is placed at 22.4% and 72.9%, respectively.
Overall quality of water
Extremely unsatisfied 2.3% 0.6% 0.0% 0.9% 3.4% 1.5%
Moderately unsatisfied 3.5% 4.7% 2.3% 2.7% 7.5% 4.6%
Moderately satisfied 52.6% 71.9% 60.4% 72.7% 63.9% 64.6%
Extremely satisfied 41.5% 22.5% 35.8% 19.1% 24.6% 28.3%
Neither satisfied nor unsatisfied 0.0% 0.3% 1.5% 4.5% 0.6% 1.0%
N Cases 171 339 260 112 321 1,203
On the overall quality of water from current source, 92.9% of non-connected households in the five water district areas assessed it as extremely to moderately satisfactory. High satisfaction rate on overall water quality is distinctly true in Legaspi where 41.5% assessed it as extremely satisfactory and 52.6%, as moderately satisfactory. Satisfaction of non-connected households in La Union is similarly high but only 22.5% rated overall water quality as extremely satisfactory and 71.9% as moderately satisfactory.
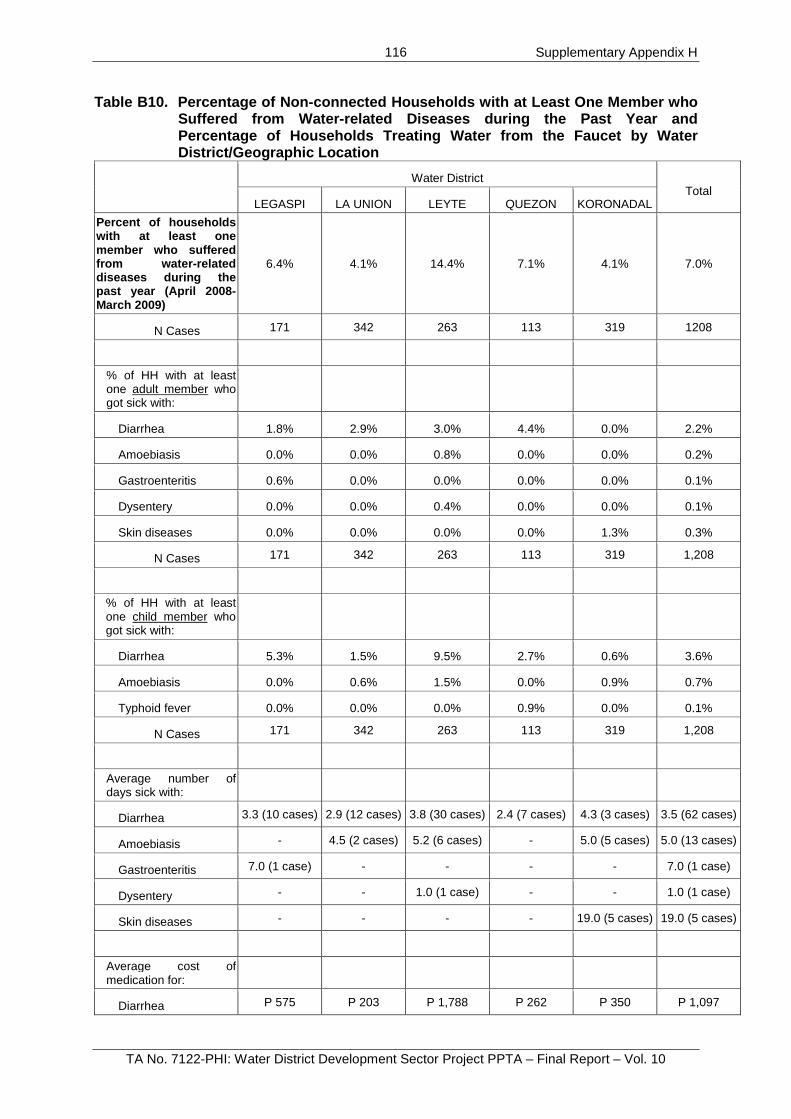
Supplementary Appendix H
TA No. 7122-PHI: Water District Development Sector Project PPTA – Final Report – Vol. 10
116
Table B10. Percentage of Non-connected Households with at Least One Member who Suffered from Water-related Diseases during the Past Year and Percentage of Households Treating Water from the Faucet by Water District/Geographic Location
Water District
Total LEGASPI LA UNION LEYTE QUEZON KORONADAL
Percent of households with at least on e member who suffered from water- related diseases during the past year (April 2008-March 2009)
6.4% 4.1% 14.4% 7.1% 4.1% 7.0%
N Cases 171 342 263 113 319 1208
% of HH with at least one adult member who got sick with:
Diarrhea 1.8% 2.9% 3.0% 4.4% 0.0% 2.2%
Amoebiasis 0.0% 0.0% 0.8% 0.0% 0.0% 0.2%
Gastroenteritis 0.6% 0.0% 0.0% 0.0% 0.0% 0.1%
Dysentery 0.0% 0.0% 0.4% 0.0% 0.0% 0.1%
Skin diseases 0.0% 0.0% 0.0% 0.0% 1.3% 0.3%
N Cases 171 342 263 113 319 1,208
% of HH with at least one child member who got sick with:
Diarrhea 5.3% 1.5% 9.5% 2.7% 0.6% 3.6%
Amoebiasis 0.0% 0.6% 1.5% 0.0% 0.9% 0.7%
Typhoid fever 0.0% 0.0% 0.0% 0.9% 0.0% 0.1%
N Cases 171 342 263 113 319 1,208
Average number of days sick with:
Diarrhea 3.3 (10 cases) 2.9 (12 cases) 3.8 (30 cases) 2.4 (7 cases) 4.3 (3 cases) 3.5 (62 cases)
Amoebiasis - 4.5 (2 cases) 5.2 (6 cases) - 5.0 (5 cases) 5.0 (13 cases)
Gastroenteritis 7.0 (1 case) - - - - 7.0 (1 case)
Dysentery - - 1.0 (1 case) - - 1.0 (1 case)
Skin diseases - - - - 19.0 (5 cases) 19.0 (5 cases)
Average cost of medication for:
Diarrhea P 575 P 203 P 1,788 P 262 P 350 P 1,097
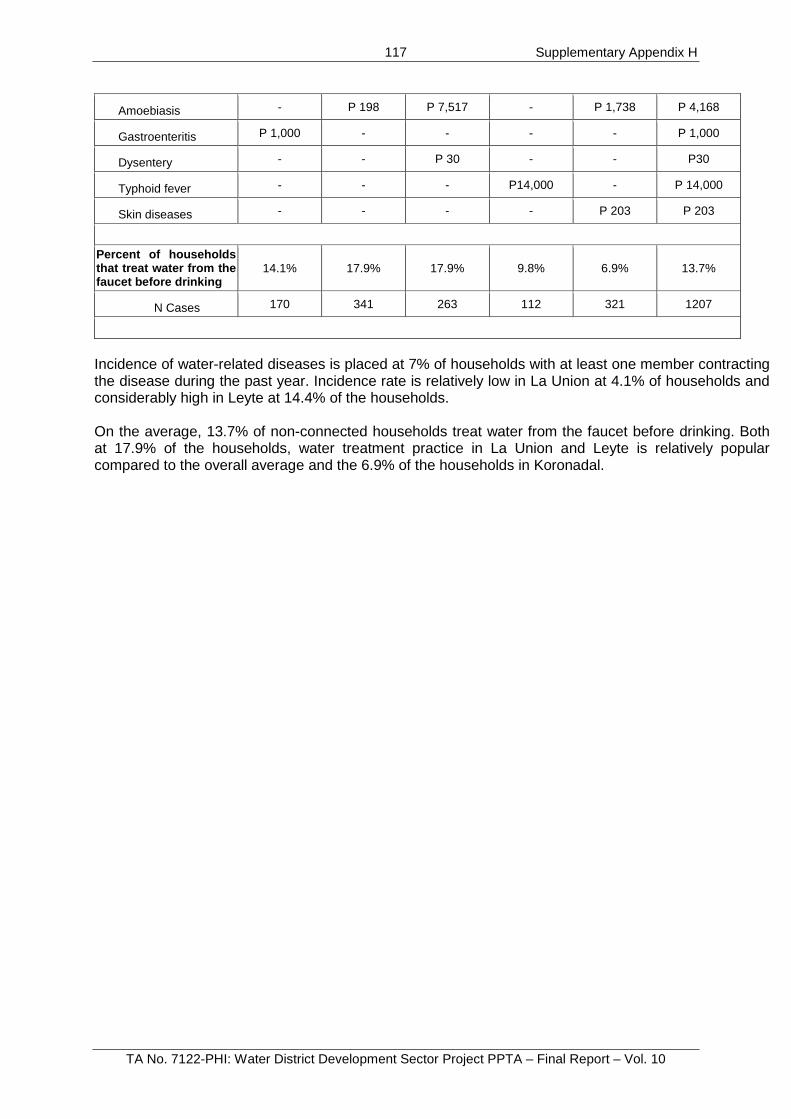
Supplementary Appendix H
TA No. 7122-PHI: Water District Development Sector Project PPTA – Final Report – Vol. 10
117
Amoebiasis - P 198 P 7,517 - P 1,738 P 4,168
Gastroenteritis P 1,000 - - - - P 1,000
Dysentery - - P 30 - - P30
Typhoid fever - - - P14,000 - P 14,000
Skin diseases - - - - P 203 P 203
Percent of households that treat water from the faucet before drinking
14.1% 17.9% 17.9% 9.8% 6.9% 13.7%
N Cases 170 341 263 112 321 1207
Incidence of water-related diseases is placed at 7% of households with at least one member contracting the disease during the past year. Incidence rate is relatively low in La Union at 4.1% of households and considerably high in Leyte at 14.4% of the households. On the average, 13.7% of non-connected households treat water from the faucet before drinking. Both at 17.9% of the households, water treatment practice in La Union and Leyte is relatively popular compared to the overall average and the 6.9% of the households in Koronadal.
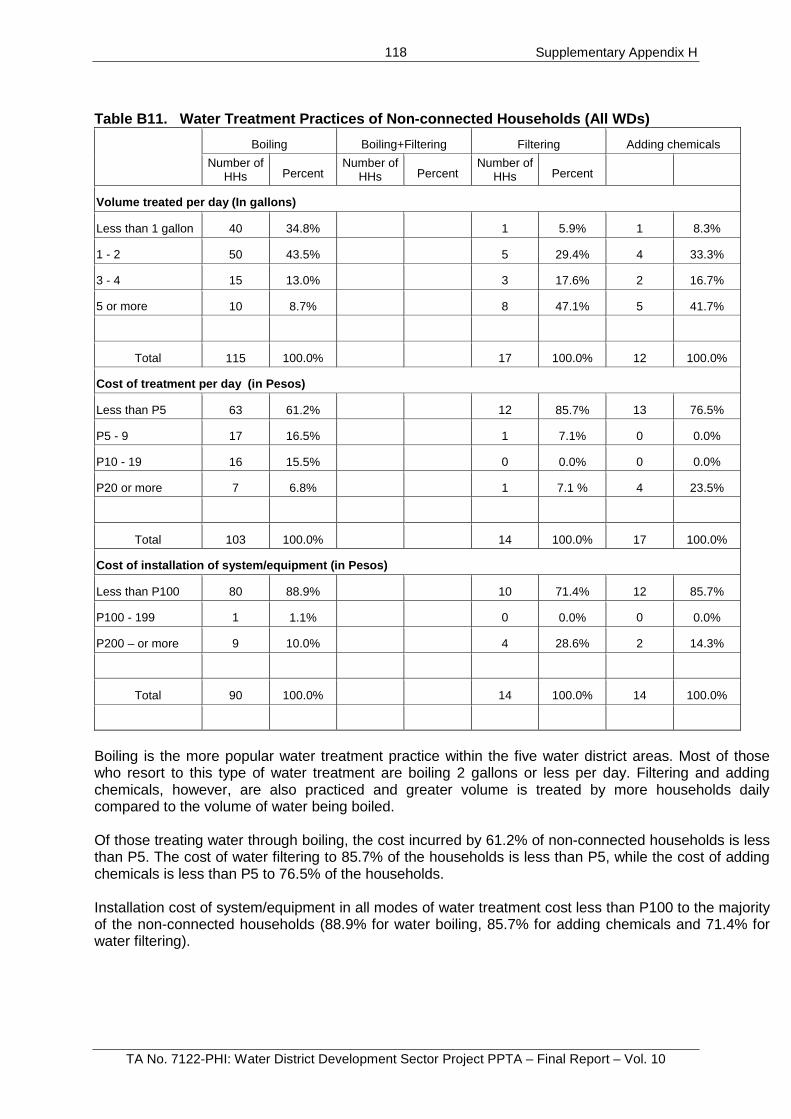
Supplementary Appendix H
TA No. 7122-PHI: Water District Development Sector Project PPTA – Final Report – Vol. 10
118
Table B11. Water Treatment Practices of Non-connected Households (All WDs)
Boiling Boiling+Filtering Filtering Adding chemicals
Number of HHs Percent
Number of HHs Percent
Number of HHs Percent
Volume treated per day (In gallons)
Less than 1 gallon 40 34.8% 1 5.9% 1 8.3%
1 - 2 50 43.5% 5 29.4% 4 33.3%
3 - 4 15 13.0% 3 17.6% 2 16.7%
5 or more 10 8.7% 8 47.1% 5 41.7%
Total 115 100.0% 17 100.0% 12 100.0%
Cost of treatment per day (in Pesos)
Less than P5 63 61.2% 12 85.7% 13 76.5%
P5 - 9 17 16.5% 1 7.1% 0 0.0%
P10 - 19 16 15.5% 0 0.0% 0 0.0%
P20 or more 7 6.8% 1 7.1 % 4 23.5%
Total 103 100.0% 14 100.0% 17 100.0%
Cost of installation of system/equipment (in Pesos)
Less than P100 80 88.9% 10 71.4% 12 85.7%
P100 - 199 1 1.1% 0 0.0% 0 0.0%
P200 – or more 9 10.0% 4 28.6% 2 14.3%
Total 90 100.0% 14 100.0% 14 100.0%
Boiling is the more popular water treatment practice within the five water district areas. Most of those who resort to this type of water treatment are boiling 2 gallons or less per day. Filtering and adding chemicals, however, are also practiced and greater volume is treated by more households daily compared to the volume of water being boiled. Of those treating water through boiling, the cost incurred by 61.2% of non-connected households is less than P5. The cost of water filtering to 85.7% of the households is less than P5, while the cost of adding chemicals is less than P5 to 76.5% of the households. Installation cost of system/equipment in all modes of water treatment cost less than P100 to the majority of the non-connected households (88.9% for water boiling, 85.7% for adding chemicals and 71.4% for water filtering).

Supplementary Appendix H
TA No. 7122-PHI: Water District Development Sector Project PPTA – Final Report – Vol. 10
119
Table B12. Percentage of Non-connected Households Willing to Connect to the WD Water Supply System by Water District/Geographic Location
Water District
Total LEGASPI LA UNION LEYTE QUEZON KORONADAL
Percent of non-connected households willing to connect with the existing water supply system
46.8% 41.8% 70.2% 43.4% 70.8% 56.5%
N Cases 171 342 262 113 322 1,210
Percent of non-connected households willing to connect if existing water supply system will be improved (out of the households who do not want to connect to the existing water supply system)
4.4% 5.1% 5.1% 3.1% 6.5% 5.0%
N Cases 91 195 78 64 92 520
Absolute proportion of non-connected households willing to connect to the water supply system
49.1% 44.7% 71.7% 45.2% 72.7% 58.6%
N Cases 171 342 262 113 322 1,210
Of the non-connected households in the five water district areas, 56.5% are willing to connect with the existing water district system. A considerably larger percentage of (70.2%) of the non-connected households in Leyte expressed such willingness as against 41.8% only of the La Union households. A range of 3.1% to 6.5% of the non-connected households who do not want to connect to the existing water supply system are willing to connect if improvements are made on the existing system. This indicates that changing their present unwillingness to connect to the existing water supply system is contingent on the improvement of the existing system. On the whole, improved or not improved, more than three-fifths of non-connected households are willing to have their own connection with the piped water system in their respective areas.

Supplementary Appendix H
TA No. 7122-PHI: Water District Development Sector Project PPTA – Final Report – Vol. 10
120
Table B13. Reasons of Non-connected Households for Their Willingness/
Unwillingness to Connect to the WD Piped Water System (Multiple Responses) by Water District/Geographic Location
Water District
Total LEGASPI LA UNION LEYTE QUEZON KORONADAL
Reason for willingness to connect
Convenience 59.5% 21.0% 56.4% 13.7% 44.9% 42.2%
Really want/need the improved water service 38.1% 69.4% 54.8% 88.2% 25.4% 48.7%
Worried about the health risks of the water from current source
11.9% 18.5% 23.9% 11.8% 43.2% 26.8%
Water bill is not too high 9.5% 6.4% 17.6% 13.7% 4.7% 9.6%
N Cases 84 157 188 51 236 716
At 48.7% of the non-connected households in the five water districts, “really want/need the improved water service” is a leading reason for the decision to avail of piped water connection. While a very significant 88.2% of households in Quezon citing “really want/need the improved water service” as a reason, only 25.4% households in Koronadal share the same reason. Convenience at 42.2% of non-connected households is another leading reason for their willingness to connect to the existing water system. Dissimilarity among the non-connected households in the five water district areas is apparent on the mix of reasons for willingness to connect to the existing water supply system. For instance, while 17.6% of non-connected households in Leyte cite “water bills is not too high” as reason for willingness to connect, only 4.7% of the households in Koronadal share the same reason. Also, while 43.2% of households in Koronadal claim “worried about health risks of water from current source”, only 11.9% and 11.8% in Legaspi and Quezon, respectively, mention it as a reason.
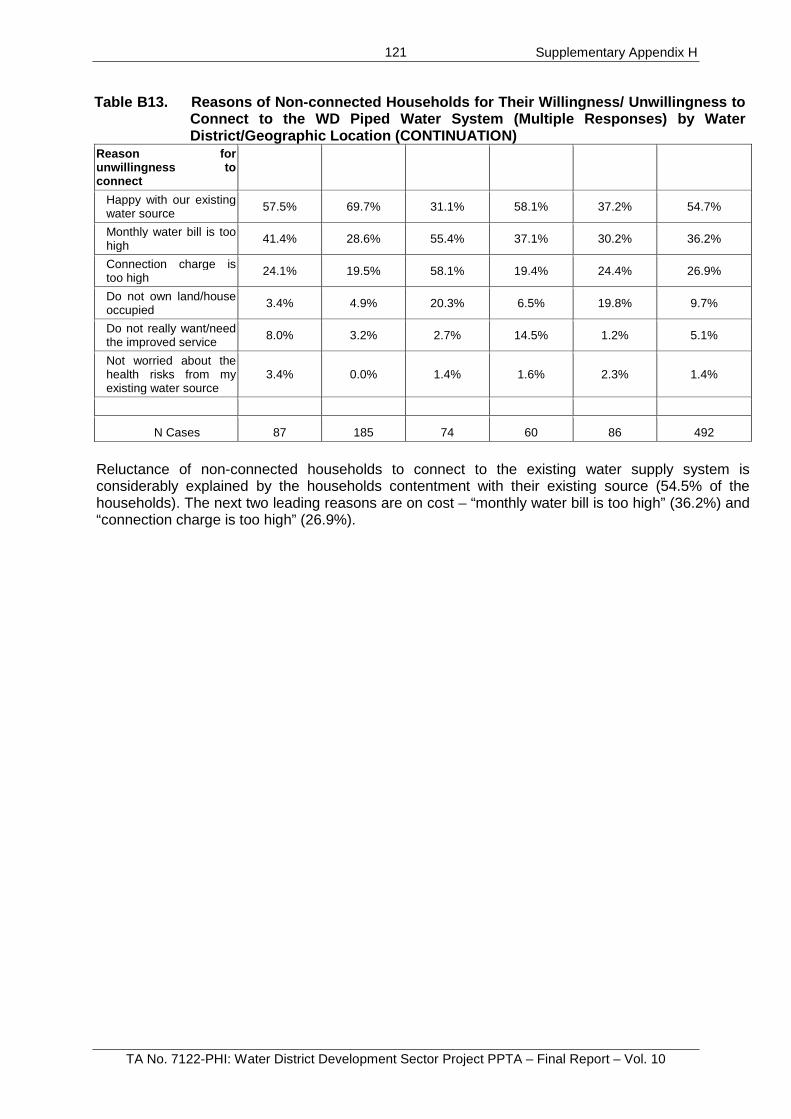
Supplementary Appendix H
TA No. 7122-PHI: Water District Development Sector Project PPTA – Final Report – Vol. 10
121
Table B13. Reasons of Non-connected Households for Their Willingness/ Unwillingness to Connect to the WD Piped Water System (Multiple Responses) by Water District/Geographic Location (CONTINUATION)
Reason for unwillingness to connect
Happy with our existing water source 57.5% 69.7% 31.1% 58.1% 37.2% 54.7%
Monthly water bill is too high
41.4% 28.6% 55.4% 37.1% 30.2% 36.2%
Connection charge is too high 24.1% 19.5% 58.1% 19.4% 24.4% 26.9%
Do not own land/house occupied 3.4% 4.9% 20.3% 6.5% 19.8% 9.7%
Do not really want/need the improved service 8.0% 3.2% 2.7% 14.5% 1.2% 5.1%
Not worried about the health risks from my existing water source
3.4% 0.0% 1.4% 1.6% 2.3% 1.4%
N Cases 87 185 74 60 86 492
Reluctance of non-connected households to connect to the existing water supply system is considerably explained by the households contentment with their existing source (54.5% of the households). The next two leading reasons are on cost – “monthly water bill is too high” (36.2%) and “connection charge is too high” (26.9%).

Supplementary Appendix H
TA No. 7122-PHI: Water District Development Sector Project PPTA – Final Report – Vol. 10
122
Table B14. Amount of Monthly Water Bill that Non-connected Households are Willing
to Pay to Access Improved Water Supply Services by Water District/Geographic Location
Amount willing to pay: Water District
Total LEGASPI LA UNION LEYTE QUEZON KORONADAL
P1,000/month 1.2% 1.3% 2.4% 6.0% 9.8% 4.8%
P 900/month 0.0% 0.0% 1.8% 0.0% 0.0% 0.4%
P 800/month 0.0% 0.0% 4.1% 2.0% 0.0% 1.2%
P 700/month 0.0% 0.0% 0.0% 0.0% 0.0% 0.0%
P 600/month 1.2% 2.0% 1.2% 2.0% 0.4% 1.2%
P 500/month 8.5% 7.2% 7.1% 6.0% 10.2% 8.3%
P 450/month 1.2% 1.3% 1.2% 0.0% 0.4% 0.9%
P 400/month 2.4% 2.0% 1.8% 2.0% 0.0% 1.3%
P 350/month 0.0% 4.6% 1.2% 0.0% 3.4% 2.5%
P 300/month 3.7% 8.5% 7.1% 18.0% 8.9% 8.4%
P 250/month 4.9% 22.2% 7.6% 10.0% 31.1% 18.7%
P 200/month 31.7% 24.2% 18.2% 12.0% 19.1% 21.0%
P150/month 45.1% 26.8% 47.1% 42.0% 16.6% 31.6%
Average Amount of Monthly Water Bill Willing to Pay
P 231.10 P 260.55 P 279.85 P 292.00 P 332.65 P 289.25
N Cases 82 153 170 50 235 690
The amount of monthly water bill that non-connected households are willing to pay if they were to connect to the water district converges at P150/month to P250/month (71.3% of the households). Only 6.4% of the households are willing to pay as high as P800/month to P1, 000/month. Expressed willingness to pay at low end cost of water supply connection is particularly true in La Union where 81.7% of households expressed willingness to pay from P150/month to P250/month. On the whole, the average amount of monthly water bill that non-connected households are willing to pay is estimated to be at P289 for the five water districts: P231 in Legazpi, P261 in La Union, P280 in Leyte, P292 in Quezon and P333 in Koronadal.

Supplementary Appendix H
TA No. 7122-PHI: Water District Development Sector Project PPTA – Final Report – Vol. 10
123
Table B15. Willingness to Connect by Total Household Monthly Income Among Non-
connected Households by Water District/Geographic Location
Percent Willing to Connect with Existing Water Supply System
LEGAZPI LA UNION LEYTE QUEZON KORONADAL
% N cases % N cases % N cases % N cases % N cases
No income - - 100.0% 1 - - - - 87.5% 8
Less than P5,000 44.6% 65 24.3% 74 52.5% 40 25.9% 27 63.1% 84
P5,000 - 9,999 49.2% 63 48.2% 112 64.3% 112 38.6% 44 75.6% 119
P10,000 - 14,999 54.5% 22 43.3% 67 80.4% 51 63.2% 19 74.4% 39
P15,000 - 19,999 50.0% 8 36.1% 36 84.6% 26 72.7% 11 71.0% 31
P20,000 - 29,999 25.0% 8 56.5% 23 81.8% 11 60.0% 5 81.0% 21
P30,000 - 39,999 50.0% 2 37.5% 8 83.3% 12 33.3% 3 58.3% 12
P40,000 - 49,999 50.0% 2 60.0% 5 100.0% 4 0.0% 1 100.0% 1
P50,000 or more - - 50.0% 10 100.0% 5 100.0% 1 0.0% 1
Total 46.8% 171 41.8% 342 70.2% 262 43.4% 113 70.8% 322
Willingness of the non-connected households to connect to existing water supply system as directly related with their income is not clearly indicated by the data in Table B.15. What the income data reveal together with the reasons for willingness and unwillingness to connect to existing water supply system is the households’ rational decision/perception on the value they get from any improvement in their access to water supply as in their satisfaction of existing water source, concern on risks on their health along with anticipated costs of connection and monthly water bills.

Supplementary Appendix H
TA No. 7122-PHI: Water District Development Sector Project PPTA – Final Report – Vol. 10
124
V. Water Supply and Sanitation Preferences by Socio-Economic Status of Households in 5 Water Districts
Table P1. Socio-Economic Status of Households by Water District/Geographic
Location Socio-Economic
Status
Water District Total
LEGAZPI LA UNION LEYTE QUEZON KORONADAL Poor 54.3% 35.7% 22.6% 37.1% 45.5% 39.1% Non-poor 45.7% 64.3% 77.4% 62.9% 54.5% 60.9%
N Cases 385 384 385 388 393 1,935 SE status (poor or non-poor) is based on per capita income vis-à-vis per capita poverty threshold. For this study, classification of households according to socio-economic status was done using the 2007 per capita poverty thresholds – such that those that fall below the poverty threshold are categorized as poor, and conversely, those above the threshold level are considered non-poor. Different threshold levels are used corresponding to the geographic location. Except for Leyte households which applied the average threshold level for all areas (P12,951), household classification of the water districts utilized the urban poverty threshold, as follows: Albay, P18,343; La Union, P17,249; Quezon, P17,570; and Koronadal, P16,136. Poverty is relatively more prevalent among the population of Legazpi and Koronadal water districts. Significant deviation of the poverty levels within the water districts from the provinces’ official estimates may be due to the focused location of the surveyed households (WD-serviced and expansion areas).

Supplementary Appendix H
TA No. 7122-PHI: Water District Development Sector Project PPTA – Final Report – Vol. 10
125
Table P2. Percentage of Households by Household Headship by Socio-Economic
Status by Water District/Geographic Location
Water District
Poverty status Total Poor Non-poor
LEGAZPI Male-headed 76.1% 72.2% 74.3% Female-headed 23.9% 27.8% 25.7%
N Cases 209 176 385
LA UNION Male-headed 76.6% 68.0% 71.1% Female-headed 23.4% 32.0% 28.9%
N Cases 137 247 384
LEYTE Male-headed 87.4% 82.2% 83.4% Female-headed 12.6% 17.8% 16.6%
N Cases 87 298 385
QUEZON Male-headed 64.6% 67.6% 66.5% Female-headed 35.4% 32.4% 33.5%
N Cases 144 244 388
KORONADAL Male-headed 82.7% 80.4% 81.4% Female-headed 17.3% 19.6% 18.6%
N Cases 179 214 393
Regardless of the socio-economic status, households are mostly headed by males. Data, however, suggests that except among the households in Quezon, male-headship is more prevalent among the poor households in the water districts.

Supplementary Appendix H
TA No. 7122-PHI: Water District Development Sector Project PPTA – Final Report – Vol. 10
126
Table P3. Percentage of Households by Water Pipe Connection Status by Socio-
Economic Status by Water District/Geographic Location
Water District
Poverty status Total Poor Non-poor
LEGAZPI WD-Connected 45.5% 67.0% 55.3% Non-connected 54.5% 33.0% 44.7%
N Cases 209 176 385
LA UNION WD-Connected 6.6% 13.4% 10.9% Non-connected 93.4% 86.6% 89.1%
N Cases 137 247 384
LEYTE WD-Connected 21.8% 34.6% 31.7% Non-connected 78.2% 65.4% 68.3%
N Cases 87 298 385
QUEZON WD-Connected 59.7% 77.5% 70.9% Non-connected 40.3% 22.5% 29.1%
N Cases 144 244 388
KORONADAL WD-Connected 8.4% 25.7% 17.8% Non-connected 91.6% 74.3% 82.2%
N Cases 179 214 393
Except in Legazpi where the non-poor households tend to have their own piped water connection, no significant link between water pipe connection and socio-economic status is shown by the data.

Supplementary Appendix H
TA No. 7122-PHI: Water District Development Sector Project PPTA – Final Report – Vol. 10
127
Table P4a. Preference for Septage System Improvement by Socio-economic Status of
Households: LEGAZPI
Water District Household Socio-economic Status
Total Poor Non-poor
Percent of HHs that would like to improve septage system 30.2% 30.8% 30.5%
N Cases 179 169 348
Type of improvement preferred
Installation of septic tank 24.1% 21.2% 22.6%
Improvement/ rehabilitation of existing septic tank 42.6% 36.5% 39.6%
De-sludging of septic tank 33.3% 57.7% 45.3%
N Cases 54 52 106
Percent of households willing to pay for: Installation of septic tank 21.1% 24.2% 22.5%
N cases 38 33 71
Improvement/ rehabilitation of existing septic tank 34.9% 54.8% 43.2%
N cases 43 31 74
De-sludging of septic tank 23.9% 56.8% 40.0%
N Cases 46 44 90
In Legazpi, while poverty does not seem to be a reason for wanting to improve their current septage system, preference for installation of septic tank and improvement/rehabilitation of existing ones is more common among the poor households, while de-sludging of septic tank is preferred more by the non-poor households. However, more of the non-poor households are willing to pay for the improvements they want.

Supplementary Appendix H
TA No. 7122-PHI: Water District Development Sector Project PPTA – Final Report – Vol. 10
128
Table P4b. Preference for Septage System Improvement by Socio-economic Status of
Households: LA UNION
Water District Household Socio-economic Status
Total Poor Non-poor
Percent of HHs that would like to improve septage system 24.0% 26.7% 25.7%
N Cases 121 225 346
Type of improvement preferred
Installation of septic tank 31.0% 52.5% 45.6%
Improvement/ rehabilitation of existing septic tank 37.9% 29.5% 32.2%
De-sludging of septic tank 31.0% 24.6% 26.7%
N Cases 29 61 90
Percent of households willing to pay for: Installation of septic tank 28.0% 49.1% 42.7%
N cases 25 57 82
Improvement/ rehabilitation of existing septic tank 40.0% 22.4% 28.4%
N cases 25 49 74
De-sludging of septic tank 34.6% 28.0% 30.3%
N Cases 26 50 76
In La Union, there is no significant difference in proportion between the poor and non-poor households in wanting an improved septage system. Most of the non-poor households, however, prefer the installation of septic tanks. Consequently, willingness to pay for the installation of septic tank is high among the non-poor households, while willingness to pay for improvement or rehabilitation of existing septic tank is high among the poor households.

Supplementary Appendix H
TA No. 7122-PHI: Water District Development Sector Project PPTA – Final Report – Vol. 10
129
Table P4c. Preference for Septage System Improvement by Socio-economic Status of
Households: LEYTE
Water District Household Socio-economic Status
Total Poor Non-poor
Percent of HHs that would like to improve septage system 24.0% 26.7% 25.7%
N Cases 121 225 346
Type of improvement preferred
Installation of septic tank 40.0% 35.5% 36.6%
Improvement/ rehabilitation of existing septic tank 57.1% 57.9% 57.7%
De-sludging of septic tank 31.4% 47.7% 43.7%
N Cases 35 107 142
Percent of households willing to pay for: Installation of septic tank 36.7% 34.3% 34.9%
N cases 30 99 129
Improvement/ rehabilitation of existing septic tank 44.1% 44.8% 44.6%
N cases 34 105 139
De-sludging of septic tank 30.0% 49.5% 45.0%
N Cases 30 99 129
In Leyte, there is no significant difference in proportion between the poor and non-poor households in wanting an improved septage system. Moreover, regardless of economic status, households in Leyte tend to prefer the improvement or rehabilitation of their existing septic tanks. Willingness to pay for de-sludging of septic tank is higher among the non-poor households.

Supplementary Appendix H
TA No. 7122-PHI: Water District Development Sector Project PPTA – Final Report – Vol. 10
130
Table P4d. Preference for Septage System Improvement by Socio-economic Status of
Households: QUEZON
Water District Household Socio-economic Status
Total Poor Non-poor
Percent of HHs that would like to improve septage system 8.4% 2.9% 4.9%
N Cases 143 242 385
Type of improvement preferred
Installation of septic tank 33.3% 14.3% 26.3%
Improvement/ rehabilitation of existing septic tank 50.0% 62.5% 55.0%
De-sludging of septic tank 16.7% 42.9% 26.3%
N Cases 12 7 19
Percent of households willing to pay for: Installation of septic tank 66.7% .0% 40.0%
N cases 6 4 10
Improvement/ rehabilitation of existing septic tank
75.0% 42.9% 60.0%
N cases 8 7 15
De-sludging of septic tank 50.0% 60.0% 55.6%
N Cases 4 5 9
While preference for improved septage system is very low in Quezon, the proportion of those wanting an improvement is higher among the poor households. Most of these poor households prefer the improvement of their existing septic tanks and installation of new ones. The non-poor households, on the other hand, are likely to prefer rehabilitation and de-sluging of their existing septic tanks. Willingness to pay for their preferred type of septage improvement is high among the poor and non-poor households.

Supplementary Appendix H
TA No. 7122-PHI: Water District Development Sector Project PPTA – Final Report – Vol. 10
131
Table P4e. Preference for Septage System Improvement by Socio-economic Status of
Households: KORONADAL
Water District Household Socio-economic Status
Total Poor Non-poor
Percent of HHs that would like to improve septage system 21.6% 37.6% 30.4%
N Cases 162 197 359
Type of improvement preferred
Installation of septic tank 22.9% 28.4% 26.6%
Improvement/ rehabilitation of existing septic tank 45.7% 41.9% 43.1%
De-sludging of septic tank 31.4% 25.7% 27.5%
N Cases 35 74 109
Percent of households willing to pay for: Installation of septic tank 29.2% 30.9% 30.4%
N cases 24 55 79
Improvement/ rehabilitation of existing septic tank 46.2% 50.0% 48.7%
N cases 26 52 78
De-sludging of septic tank 31.0% 26.3% 27.9%
N Cases 29 57 86
In Koronadal, preference for improved septage system is higher among the non-poor households than the poor households. Regardless of economic status, more households tend to prefer improvement or rehabilitation of their existing septic tanks. Surprisingly, preference for de-sludging of septic tanks and willingness to pay for such type of service is higher among the poor households.

Supplementary Appendix H
TA No. 7122-PHI: Water District Development Sector Project PPTA – Final Report – Vol. 10
132
Table P5. Willingness to Connect to the Existing/Improved Water Supply System by Socio-Economic Status of Households by Water District/Geographic Location
Water District Household Socio-economic Status
Total Poor Non-poor
LEGAZPI
Percent of non-connected households willing to connect to the existing water supply system
48.2% 43.9% 46.8%
N Cases 114 57 171
Percent of non-connected households willing to connect if existing water supply system will be improved (out of the households who do not want to connect to the existing water supply system)
3.4% 6.3% 4.4%
N Cases 59 32 91
Absolute proportion of non-connected households willing to connect to the water supply system
50.0% 47.4% 49.1%
N Cases 114 57 171
LA UNION
Percent of non-connected households willing to connect to the existing water supply system
37.5% 44.4% 41.8%
N Cases 128 214 342
Percent of non-connected households willing to connect if existing water supply system will be improved (out of the households who do not want to connect to the existing water supply system)
6.4% 4.3% 5.1%
N Cases 78 117 195
Absolute proportion of non-connected households willing to connect to the water supply system
41.1% 46.8% 44.7%
N Cases 128 214 342

Supplementary Appendix H
TA No. 7122-PHI: Water District Development Sector Project PPTA – Final Report – Vol. 10
133
Table P5. Willingness to Connect to the Existing/Improved Water Supply System by Socio-Economic Status of Households by Water District/Geographic Location (CONTINUATION)
Water District Household Socio-economic Status
Total Poor Non-poor
LEYTE
Percent of non-connected households willing to connect to the existing water supply system
54.4% 75.8% 70.2%
N Cases 68 194 262
Percent of non-connected households willing to connect if existing water supply system will be improved (out of the households who do not want to connect to the existing water supply system)
6.5% 4.3% 5.1%
N Cases 31 47 78
Absolute proportion of non-connected households willing to connect to the water supply system
57.4% 76.8% 71.7%
N Cases 68 194 262
QUEZON
Percent of non-connected households willing to connect to the existing water supply system
36.2% 50.9% 43.4%
N Cases 58 55 113
Percent of non-connected households willing to connect if existing water supply system will be improved (out of the households who do not want to connect to the existing water supply system)
5.3% 0.0% 3.1%
N Cases 38 27 65
Absolute proportion of non-connected households willing to connect to the water supply system
39.7% 50.9% 45.2%
N Cases 58 55 113

Supplementary Appendix H
TA No. 7122-PHI: Water District Development Sector Project PPTA – Final Report – Vol. 10
134
Table P5. Willingness to Connect to the Existing/Improved Water Supply System by Socio-Economic Status of Households by Water District/Geographic Location (CONTINUATION)
Water District Household Socio-economic Status
Total Poor Non-poor
KORONADAL
Percent of non-connected households willing to connect to the existing water supply system
68.1% 73.6% 70.8%
N Cases 163 159 322
Percent of non-connected households willing to connect if existing water supply system will be improved (out of the households who do not want to connect to the existing water supply system)
3.8% 9.8% 6.5%
N Cases 52 41 93
Absolute proportion of non-connected households willing to connect to the water supply system
69.3% 76.1% 72.7%
N Cases 163 159 322
Except in Legazpi, willingness to connect to the existing piped water system is higher among the non-poor households than poor households. Those who refused to be connected to the existing system were further asked about their willingness to connect if existing water supply system would be improved. In La Union, Leyte and Quezon, more poor households than non-poor households gave positive responses.

Supplementary Appendix H
TA No. 7122-PHI: Water District Development Sector Project PPTA – Final Report – Vol. 10
1
ANNEX 1
Gender Tables

Supplementary Appendix H
TA No. 7122-PHI: Water District Development Sector Project PPTA – Final Report – Vol. 10
2
Table G1. Percentage of Households by Number of Households Occupying the
Dwelling Unit by Household Headship and Water District
Water District/ Number of Households
HH Headship Total Male-headed
HHs Female-
headed HHs LEGAZPI
1 87.8 84.5 86.9 2 8.7 7.2 8.4 3 1.7 5.2 2.6
4 or more 1.7 3.1 2.1
N Cases 286 97 383
LA UNION 1 80.2 70.3 77.3 2 17.9 20.7 18.8 3 1.8 4.5 2.6
4 or more .0 4.5 1.3
N Cases 273 111 384
LEYTE 1 95.0 92.2 94.5 2 4.1 3.1 3.9 3 .6 4.7 1.3
4 or more .3 .0 .3
N Cases 319 64 383 QUEZON
1 95.7 92.3 94.6 2 2.7 4.6 3.4 3 .4 .8 .5
4 or more 1.2 2.3 1.6
N Cases 257 130 387 KORONADAL
1 78.4 84.9 79.6 2 12.8 9.6 12.2 3 5.9 1.4 5.1
4 or more 2.8 4.1 3.1
N Cases 320 73 393

Supplementary Appendix H
TA No. 7122-PHI: Water District Development Sector Project PPTA – Final Report – Vol. 10
3
Table G2. Percentage of Households by Household Size by Household Headship: 5
Selected Water Districts
Water District/ Number of Household Members
HH Headship Total
Male-headed
HHs Female-
headed HHs LEGAZPI
1 - 2 7.0 9.1 7.5 3 - 4 27.3 26.3 27.0 5 - 6 33.6 28.3 32.2 7 - 8 22.0 21.2 21.8
9 - 10 7.3 9.1 7.8 More than 10 2.8 6.1 3.6
N Cases 286 99 385
LA UNION
1 - 2 8.1 11.7 9.1 3 - 4 32.6 39.6 34.6 5 - 6 38.5 25.2 34.6 7 - 8 16.1 12.6 15.1
9 - 10 2.6 1.8 2.3 More than 10 2.2 9.0 4.2
N Cases 273 111 384
LEYTE
1 - 2 6.9 14.1 8.1 3 - 4 31.6 39.1 32.8 5 - 6 29.1 15.6 26.8 7 - 8 17.2 12.5 16.4
9 - 10 11.6 7.8 10.9 More than 10 3.8 10.9 4.9
N Cases 320 64 384
QUEZON
1 - 2 11.3 10.8 11.1 3 - 4 30.4 34.6 31.8 5 - 6 40.9 29.2 37.0 7 - 8 12.5 16.2 13.7
9 - 10 2.7 4.6 3.4 More than 10 2.3 4.6 3.1
N Cases 257 130 387
KORONADAL
1 - 2 4.1 12.3 5.6

Supplementary Appendix H
TA No. 7122-PHI: Water District Development Sector Project PPTA – Final Report – Vol. 10
4
3 - 4 37.5 30.1 36.1 5 - 6 34.7 28.8 33.6 7 - 8 17.2 16.4 17.0
9 - 10 4.1 5.5 4.3 More than 10 2.5 6.8 3.3
N Cases 320 73 393
Table G3. Percentage of Households by Total Number of Household Members 14
Years Old and Below by Household Headship: 5 Selected Water Districts Water District/
Number of Household Members 14 Years Old and Below
HH Headship Total
Male-headed
HHs Female-
headed HHs LEGAZPI
None 24.8 34.3 27.3 1 - 2 44.1 39.4 42.9 3 - 4 22.7 17.2 21.3 5 - 6 8.0 7.1 7.8 7 - 8 .3 2.0 .8
N Cases 286 99 385
LA UNION
None 23.8 45.0 29.9 1 - 2 53.5 36.0 48.4 3 - 4 20.5 13.5 18.5 5 - 6 1.8 3.6 2.3 7 - 8 .0 1.8 .5
9 - 10 .4 .0 .3
N Cases 273 111 384 LEYTE
None 25.3 50.0 29.4 1 - 2 40.3 28.1 38.3 3 - 4 24.4 15.6 22.9 5 - 6 8.4 4.7 7.8 7 - 8 1.6 1.6 1.6
N Cases
QUEZON
None 36.8 33.1 35.6 1 - 2 45.3 46.9 45.9 3 - 4 15.9 16.2 16.0 5 - 6 1.2 2.3 1.5 7 - 8 .8 .8 .8
9 - 10 .0 .8 .3
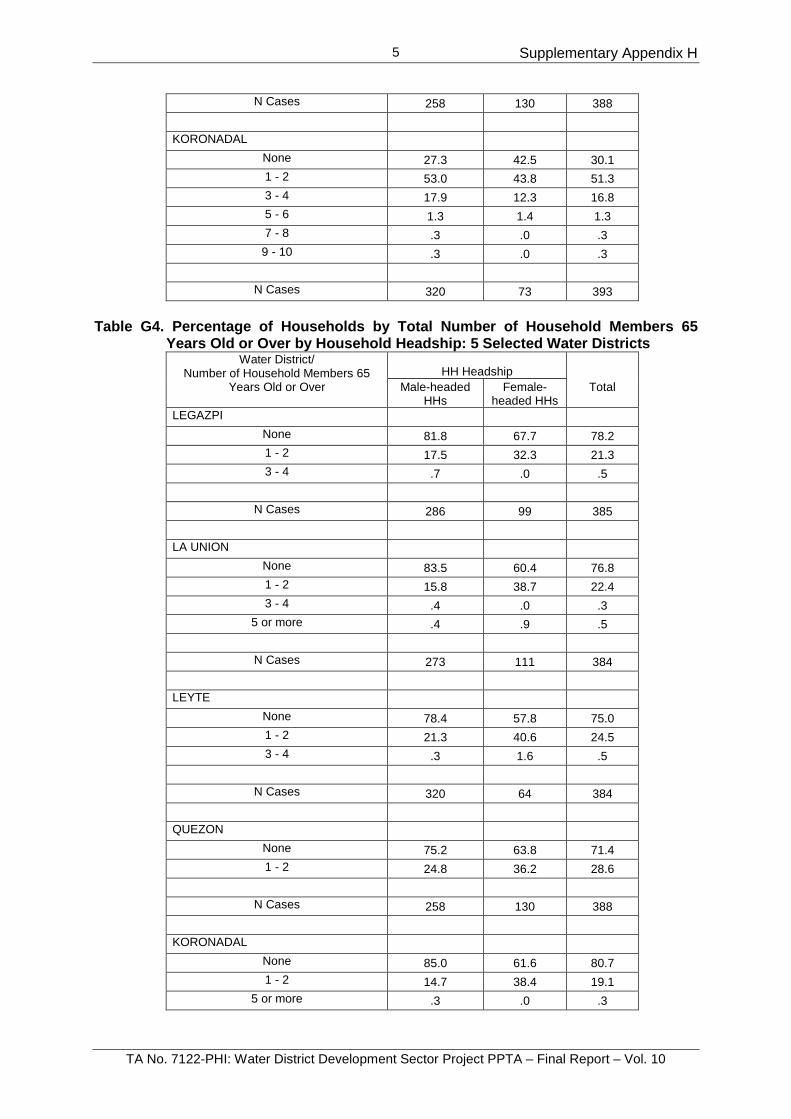
Supplementary Appendix H
TA No. 7122-PHI: Water District Development Sector Project PPTA – Final Report – Vol. 10
5
N Cases 258 130 388 KORONADAL
None 27.3 42.5 30.1 1 - 2 53.0 43.8 51.3 3 - 4 17.9 12.3 16.8 5 - 6 1.3 1.4 1.3 7 - 8 .3 .0 .3
9 - 10 .3 .0 .3
N Cases 320 73 393
Table G4. Percentage of Households by Total Number of Household Members 65
Years Old or Over by Household Headship: 5 Selected Water Districts Water District/
Number of Household Members 65 Years Old or Over
HH Headship Total
Male-headed
HHs Female-
headed HHs LEGAZPI
None 81.8 67.7 78.2 1 - 2 17.5 32.3 21.3 3 - 4 .7 .0 .5
N Cases 286 99 385
LA UNION
None 83.5 60.4 76.8 1 - 2 15.8 38.7 22.4 3 - 4 .4 .0 .3
5 or more .4 .9 .5
N Cases 273 111 384 LEYTE
None 78.4 57.8 75.0 1 - 2 21.3 40.6 24.5 3 - 4 .3 1.6 .5
N Cases 320 64 384
QUEZON
None 75.2 63.8 71.4 1 - 2 24.8 36.2 28.6
N Cases 258 130 388
KORONADAL
None 85.0 61.6 80.7 1 - 2 14.7 38.4 19.1
5 or more .3 .0 .3

Supplementary Appendix H
TA No. 7122-PHI: Water District Development Sector Project PPTA – Final Report – Vol. 10
6
N Cases 320 73 393
Table G5. Percentage of Households by Length of Stay in the Barangay by Household
Headship: 5 Selected Water Districts
Water District/ Length of Stay in the Barangay
HH Headship Total
Male-headed
HHs Female-
headed HHs LEGAZPI
Less than 10 16.3 9.1 14.4 10 – 19 years 31.4 14.1 27.0 20 – 29 years 18.4 17.2 18.1 30 – 39 years 15.9 19.2 16.8 40 – 49 years 7.4 19.2 10.5 More than 50 years 10.6 21.2 13.4
N Cases 283 99 382
LA UNION
Less than 10 28.0 18.3 25.3 10 – 19 years 23.2 11.9 20.0 20 – 29 years 17.3 15.6 16.8 30 – 39 years 9.6 22.0 13.2 40 – 49 years 11.8 11.9 11.8 More than 50 years 10.0 20.2 12.9
N Cases 271 109 380
LEYTE
Less than 10 25.6 9.4 22.9 10 – 19 years 28.8 17.2 26.8 20 – 29 years 19.4 21.9 19.8 30 – 39 years 9.7 23.4 12.0 40 – 49 years 6.3 7.8 6.5 More than 50 years 10.3 20.3 12.0
N Cases 320 64 384
QUEZON
Less than 10 19.8 28.5 22.7 10 – 19 years 21.7 22.3 21.9 20 – 29 years 24.4 19.2 22.7 30 – 39 years 10.5 16.2 12.4 40 – 49 years 13.2 5.4 10.6 More than 50 years 10.5 8.5 9.8
N Cases 258 130 388
KORONADAL

Supplementary Appendix H
TA No. 7122-PHI: Water District Development Sector Project PPTA – Final Report – Vol. 10
7
Less than 10 25.1 20.8 24.3 10 – 19 years 26.3 19.4 25.1 20 – 29 years 22.6 12.5 20.7 30 – 39 years 15.4 19.4 16.1 40 – 49 years 6.6 19.4 9.0 More than 50 years 4.1 8.3 4.9
N Cases 319 72 391
Table G6. Percentage of Households by Total Monthly Household Income by
Household Headship: 5 Selected Water Districts
Water District/Total Monthly Household Income
HH Headship Total
Male-headed
HHs Female-
headed HHs LEGAZPI
No income .4 .0 .3
Less than P5,000 26.2 21.4 25.0
P5,000 - 9,999 36.9 32.7 35.8
P10,000 - 14,999 14.9 26.5 17.9
P15,000 - 19,999 6.4 5.1 6.1
P20,000 - 29,999 9.2 8.2 8.9
P30,000 - 39,999 2.8 2.0 2.6
P40,000 - 49,999 1.1 3.1 1.6
P50,000 or more 2.1 1.0 1.8
N Cases 282 98 380
LA UNION
No income .0 1.9 .5
Less than P5,000 23.0 14.8 20.7
P5,000 - 9,999 33.8 28.7 32.4
P10,000 - 14,999 18.6 24.1 20.2
P15,000 - 19,999 10.4 13.0 11.1
P20,000 - 29,999 7.4 9.3 8.0
P30,000 - 39,999 3.0 1.9 2.7
P40,000 - 49,999 1.5 1.9 1.6
P50,000 or more 2.2 4.6 2.9
N Cases 269 108 377
LEYTE
Less than P5,000 13.4 9.4 12.8
P5,000 - 9,999 41.9 31.3 40.1
P10,000 - 14,999 19.4 28.1 20.8
P15,000 - 19,999 10.3 17.2 11.5
P20,000 - 29,999 5.6 7.8 6.0
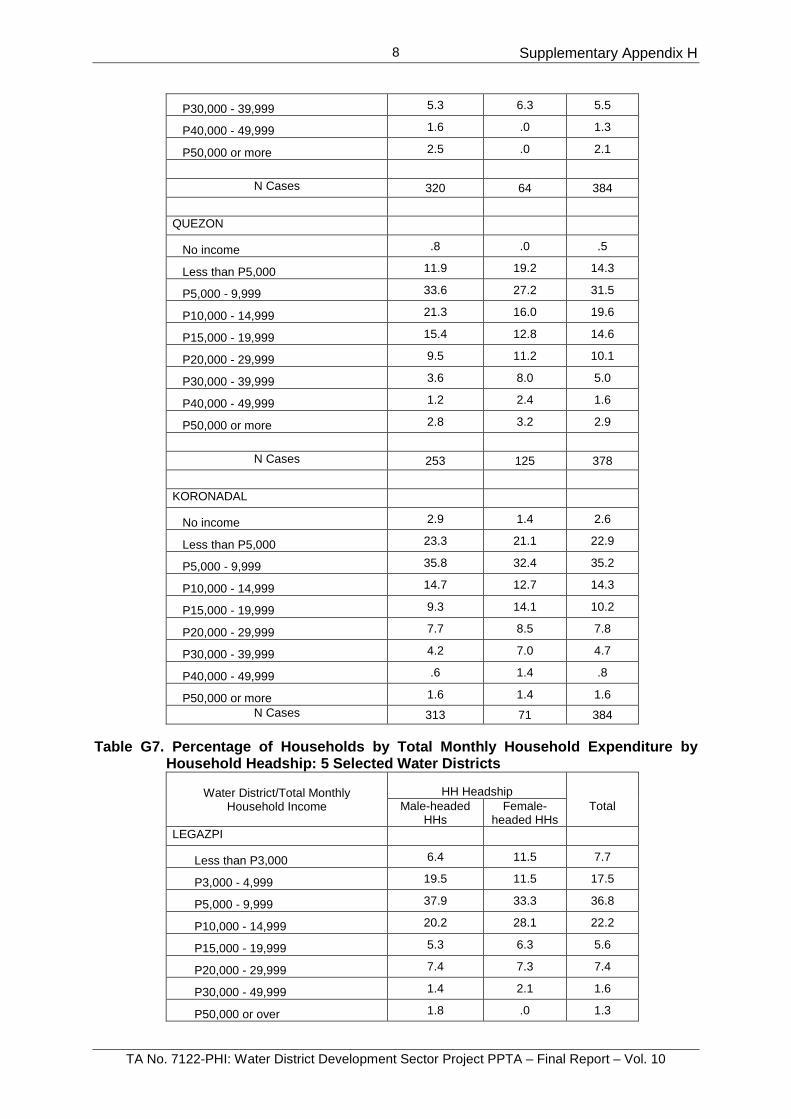
Supplementary Appendix H
TA No. 7122-PHI: Water District Development Sector Project PPTA – Final Report – Vol. 10
8
P30,000 - 39,999 5.3 6.3 5.5
P40,000 - 49,999 1.6 .0 1.3
P50,000 or more 2.5 .0 2.1
N Cases 320 64 384
QUEZON
No income .8 .0 .5
Less than P5,000 11.9 19.2 14.3
P5,000 - 9,999 33.6 27.2 31.5
P10,000 - 14,999 21.3 16.0 19.6
P15,000 - 19,999 15.4 12.8 14.6
P20,000 - 29,999 9.5 11.2 10.1
P30,000 - 39,999 3.6 8.0 5.0
P40,000 - 49,999 1.2 2.4 1.6
P50,000 or more 2.8 3.2 2.9
N Cases 253 125 378
KORONADAL
No income 2.9 1.4 2.6
Less than P5,000 23.3 21.1 22.9
P5,000 - 9,999 35.8 32.4 35.2
P10,000 - 14,999 14.7 12.7 14.3
P15,000 - 19,999 9.3 14.1 10.2
P20,000 - 29,999 7.7 8.5 7.8
P30,000 - 39,999 4.2 7.0 4.7
P40,000 - 49,999 .6 1.4 .8
P50,000 or more 1.6 1.4 1.6
N Cases 313 71 384 Table G7. Percentage of Households by Total Monthly Household Expenditure by
Household Headship: 5 Selected Water Districts
Water District/Total Monthly Household Income
HH Headship Total
Male-headed
HHs Female-
headed HHs LEGAZPI
Less than P3,000 6.4 11.5 7.7
P3,000 - 4,999 19.5 11.5 17.5
P5,000 - 9,999 37.9 33.3 36.8
P10,000 - 14,999 20.2 28.1 22.2
P15,000 - 19,999 5.3 6.3 5.6
P20,000 - 29,999 7.4 7.3 7.4
P30,000 - 49,999 1.4 2.1 1.6
P50,000 or over 1.8 .0 1.3

Supplementary Appendix H
TA No. 7122-PHI: Water District Development Sector Project PPTA – Final Report – Vol. 10
9
N Cases 282 96 378
LA UNION
Less than P3,000 7.0 12.6 8.6
P3,000 - 4,999 22.2 14.6 20.0
P5,000 - 9,999 40.1 35.0 38.6
P10,000 - 14,999 16.0 15.5 15.8
P15,000 - 19,999 7.4 12.6 8.9
P20,000 - 29,999 3.5 4.9 3.9
P30,000 - 49,999 3.9 2.9 3.6
P50,000 or over .0 1.9 .6
N Cases 257 103 360
LEYTE
Less than P3,000 8.3 4.8 7.7
P3,000 - 4,999 10.2 20.6 11.9
P5,000 - 9,999 44.4 36.5 43.1
P10,000 - 14,999 19.0 19.0 19.0
P15,000 - 19,999 7.6 9.5 7.9
P20,000 - 29,999 6.3 7.9 6.6
P30,000 - 49,999 3.2 1.6 2.9
P50,000 or over 1.0 .0 .8
N Cases 315 63 378
QUEZON
Less than P3,000 4.9 6.5 5.4
P3,000 - 4,999 9.1 15.3 11.2
P5,000 - 9,999 37.0 29.8 34.6
P10,000 - 14,999 25.5 16.9 22.6
P15,000 - 19,999 11.1 14.5 12.3
P20,000 - 29,999 7.4 9.7 8.2
P30,000 - 49,999 3.7 3.2 3.5
P50,000 or over 1.2 4.0 2.2
N Cases 243 124 367
KORONADAL
Less than P3,000 6.1 6.8 6.3
P3,000 - 4,999 16.2 13.7 15.7
P5,000 - 9,999 42.7 41.1 42.4
P10,000 - 14,999 20.7 24.7 21.5

Supplementary Appendix H
TA No. 7122-PHI: Water District Development Sector Project PPTA – Final Report – Vol. 10
10
P15,000 - 19,999 9.4 6.8 8.9
P20,000 - 29,999 2.9 6.8 3.7
P30,000 - 49,999 1.9 .0 1.6
P50,000 or over .0 .0 .0
N Cases 309 73 382
Table G8. Percentage of Households by Average Total Monthly Household Savings by
Household Headship: 5 Selected Water Districts
Water District/ Average Total Monthly Household Savings
HH Headship Total
Male-headed
HHs Female-
headed HHs LEGAZPI
None 67.1 61.1 65.6
Less than P1,000 18.9 25.3 20.5
P1,000 - 1,999 6.1 4.2 5.6
P2,000 - 2,999 3.6 2.1 3.2
P3,000 - 3,999 .7 .0 .5
P4,000 – 4,999 .4 .0 .3
P5,000 or over 3.2 7.4 4.3
N Cases 280 95 375
LA UNION
None 73.5 73.4 73.5
Less than P1,000 11.6 12.8 11.9
P1,000 - 1,999 6.7 4.6 6.1
P2,000 - 2,999 2.6 2.8 2.7
P3,000 - 3,999 .0 2.8 .8
P4,000 – 4,999 .7 .9 .8
P5,000 or over 4.9 2.8 4.2
N Cases 268 109 377
LEYTE
None 54.4 59.4 55.2
Less than P1,000 25.9 14.1 24.0
P1,000 - 1,999 8.1 12.5 8.9
P2,000 - 2,999 6.3 6.3 6.3
P3,000 - 3,999 1.6 3.1 1.8
P4,000 – 4,999 .9 3.1 1.3
P5,000 or over 2.8 1.6 2.6
N Cases 320 64 384

Supplementary Appendix H
TA No. 7122-PHI: Water District Development Sector Project PPTA – Final Report – Vol. 10
11
QUEZON
None 74.4 66.2 71.6
Less than P1,000 10.9 15.4 12.4
P1,000 - 1,999 6.2 4.6 5.7
P2,000 - 2,999 2.7 5.4 3.6
P3,000 - 3,999 2.3 3.1 2.6
P4,000 – 4,999 .0 1.5 .5
P5,000 or over 3.5 3.8 3.6
N Cases 258 130 388
KORONADAL
None 57.7 63.0 58.7
Less than P1,000 30.1 19.2 28.1
P1,000 - 1,999 5.0 2.7 4.6
P2,000 - 2,999 1.6 8.2 2.8
P3,000 - 3,999 .6 1.4 .8
P4,000 – 4,999 .6 .0 .5
P5,000 or over 4.4 5.5 4.6
N Cases 319 73 392
Table G9. Percentage of Households by Number of Household Members Currently
Working or Employed by Household Headship: 5 Selected Water Districts Water District/ Number of Household
Members Currently Working or Employed
HH Headship Total
Male-headed
HHs Female-
headed HHs LEGAZPI
None 10.2 7.1 9.4
1-2 members 77.0 78.8 77.5
3-4 members 12.4 13.1 12.6
5 or more members .4 1.0 .5
N Cases 283 99 382
LA UNION
None 6.2 22.5 10.9
1-2 members 85.7 68.5 80.7
3-4 members 7.0 6.3 6.8
5 or more members 1.1 2.7 1.6
N Cases 273 111 384
LEYTE
None 5.6 14.1 7.0
1-2 members 85.9 71.9 83.6

Supplementary Appendix H
TA No. 7122-PHI: Water District Development Sector Project PPTA – Final Report – Vol. 10
12
3-4 members 7.2 12.5 8.1
5 or more members 1.3 1.6 1.3
N Cases 319 64 383
QUEZON
None 6.0 10.0 7.4
1-2 members 85.2 74.6 81.6
3-4 members 7.6 11.5 8.9
5 or more members 1.2 3.8 2.1
N Cases 250 130 380
KORONADAL
None 8.9 22.5 11.4
1-2 members 83.2 49.3 77.0
3-4 members 7.9 25.4 11.1
5 or more members .0 2.8 .5
N Cases 316 71 387 Table G10. Proportion of Households With at Least One Member Who Had Borrowed
Money during the Past year by Household Headship: 5 Selected Water Districts
Water District HH Headship
Total
Male-headed HHs
Female-headed HHs
LEGAZPI Proportion of households with at least one member who had borrowed money during the past year
78.7 71.7 76.9
N Cases 286 99 385
LA UNION
Proportion of households with at least one member who had borrowed money during the past year
61.5 63.1 62.0
N Cases 273 111 384
LEYTE Proportion of households with at least one member who had borrowed money during the past year
76.3 68.8 75.1
N Cases 321 64 385
QUEZON
Proportion of households with at least one member who had borrowed money during the past
79.1 78.5 78.9

Supplementary Appendix H
TA No. 7122-PHI: Water District Development Sector Project PPTA – Final Report – Vol. 10
13
year
N Cases 258 130 388
KORONADAL
Proportion of households with at least one member who had borrowed money during the past year
71.9 60.3 69.7
N Cases 320 73 393
Table G11. Percentage of Households by Highest Grade Completed by Household
Head by Household Headship: 5 Selected Water Districts
Water District/ Highest Grade Completed by Household Head
HH Headship Total
Male-headed
HHs Female-
headed HHs LEGAZPI
No schooling 1.1 .0 .8 Elementary 30.8 32.3 31.2 High School 32.6 33.3 32.8 Vocational training 6.5 2.0 5.3 College and over 29.0 32.3 29.9
N Cases 276 99 375
LA UNION
No schooling .7 .9 .8 Elementary 14.1 24.5 17.1 High School 41.5 42.7 41.8 Vocational training 17.8 6.4 14.5 College and over 25.9 25.5 25.8
N Cases 270 110 380
LEYTE
No schooling 1.9 3.2 2.1 Elementary 33.5 30.2 33.0 High School 41.8 38.1 41.2 Vocational training 2.2 .0 1.8 College and over 20.6 28.6 21.9
N Cases 316 63 379
QUEZON
No schooling .4 2.3 1.0 Elementary 19.1 18.8 19.0 High School 38.7 37.5 38.3 Vocational training 5.9 3.9 5.2 College and over 35.9 37.5 36.5
N Cases 256 128 384

Supplementary Appendix H
TA No. 7122-PHI: Water District Development Sector Project PPTA – Final Report – Vol. 10
14
KORONADAL
No schooling 1.9 .0 1.6 Elementary 12.5 23.9 14.6 High School 37.8 38.0 37.9 Vocational training 6.7 2.8 6.0 College and over 41.0 35.2 39.9
N Cases 312 71 383 Table G12. Percentage of Households by Occupation of Household Head by
Household Headship: 5 Selected Water Districts
Water District/ Occupation of Household Head
HH Headship Total Male-headed
HHs Female-
headed HHs LEGAZPI
Own business 14.7 30.6 18.8 Government employee 9.4 8.2 9.1 Private employee 12.9 5.1 10.9 Temporary laborer 18.5 1.0 14.1 Street vendor 1.4 5.1 2.3 Retired/Pensioner 5.2 12.2 7.0 Unemployed 9.8 23.5 13.3 Others 14.7 9.2 13.3
N Cases 286 98 384
LA UNION
Farming or fishing 19.1 5.4 15.1 Own business 8.1 16.2 10.4 Government employee 5.1 2.7 4.4 Private employee 11.0 .0 7.8 Temporary laborer 7.7 .0 5.5 Street vendor .7 3.6 1.6 Retired/Pensioner 4.4 15.3 7.6 Unemployed 8.8 34.2 16.2 Others 34.9 22.5 31.3
N Cases 272 111 383
LEYTE Farming or fishing 20.6 7.8 18.4 Own business 14.3 34.4 17.7 Government employee 9.7 4.7 8.8 Private employee 14.6 4.7 13.0 Temporary laborer 5.6 4.7 5.5 Street vendor 1.6 4.7 2.1 Retired/Pensioner 4.7 14.1 6.2 Unemployed 3.4 12.5 4.9 Others 25.5 12.5 23.4

Supplementary Appendix H
TA No. 7122-PHI: Water District Development Sector Project PPTA – Final Report – Vol. 10
15
N Cases 321 64 385
QUEZON Farming or fishing 6.6 2.3 5.2 Own business 20.2 30.8 23.7 Government employee 10.9 4.6 8.8 Private employee 17.1 9.2 14.4 Temporary laborer 11.6 3.1 8.8 Street vendor .4 1.5 .8 Retired/Pensioner 10.5 13.1 11.3 Unemployed 10.5 25.4 15.5 Others 12.4 10.0 11.6
N Cases 258 130 388
KORONADAL
Farming or fishing 13.4 4.1 11.7 Own business 12.8 30.1 16.0 Government employee 11.6 5.5 10.4 Private employee 14.7 6.8 13.2 Temporary laborer 10.6 1.4 8.9 Street vendor 2.2 2.7 2.3 Retired/Pensioner 2.5 8.2 3.6 Unemployed 3.4 5.5 3.8 Others 28.8 35.6 30.0
N Cases 320 73 393
Table G13. Percentage of Households by Ownership Status of House Occupied by
Household Headship: 5 Selected Water Districts
Water District/ Ownership Status of House Occupied
HH Headship Total
Male-headed
HHs Female-
headed HHs LEGAZPI
House owner 93.0 87.9 91.7
Caretaker 2.1 2.0 2.1
Rent-free occupant 2.1 3.0 2.3
Renter 2.8 6.1 3.6
Living with relatives .0 1.0 .3
N Cases 286 99 385 LA UNION
House owner 81.0 87.4 82.8
Caretaker 4.8 .9 3.6
Rent-free occupant 8.1 4.5 7.0
Renter 4.4 6.3 4.9
Living with relatives 1.8 .9 1.6

Supplementary Appendix H
TA No. 7122-PHI: Water District Development Sector Project PPTA – Final Report – Vol. 10
16
N Cases 273 111 384
LEYTE
House owner 88.8 90.6 89.1
Caretaker .9 .0 .8
Rent-free occupant 3.7 1.6 3.4
Renter 5.3 7.8 5.7
Living with relatives 1.2 .0 1.0
N Cases 321 64 385 QUEZON
House owner 82.9 82.3 82.7
Caretaker 5.8 4.6 5.4
Rent-free occupant 3.5 3.1 3.4
Renter 7.4 10.0 8.2
Living with relatives .4 .0 .3
N Cases 258 130 388 KORONADAL
House owner 85.0 87.7 85.5
Caretaker 2.5 2.7 2.5
Rent-free occupant 7.2 2.7 6.4
Renter 5.0 6.8 5.3
Living with relatives .3 .0 .3
N Cases 320 73 393 Table G14. Percentage of Households by Ownership Status of the Lot Occupied on
Which House is Built by Household Headship: 5 Selected Water Districts
Water District/ Ownership Status of the Lot Occupied on Which House is Built
HH Headship Total
Male-headed
HHs Female-
headed HHs LEGAZPI
Owned 40.4 42.4 40.9 Caretaker 3.9 4.0 3.9 Rented/Leased 9.8 7.1 9.1 Common property w/ other family members/relatives 7.4 3.0 6.3
Government land 31.9 33.3 32.3 Others 6.7 10.1 7.6
N Cases 285 99 384
LA UNION

Supplementary Appendix H
TA No. 7122-PHI: Water District Development Sector Project PPTA – Final Report – Vol. 10
17
Owned 39.9 44.1 41.1 Caretaker 5.5 1.8 4.4 Rented/Leased 4.8 8.1 5.7 Common property w/ other family members/relatives 26.0 14.4 22.7
Government land 20.9 29.7 23.4 Others 2.9 1.8 2.6
N Cases 273 111 384
LEYTE
Owned 39.9 50.0 41.6 Caretaker 6.2 1.6 5.5 Rented/Leased 17.8 20.3 18.2 Common property w/ other family members/relatives 8.1 4.7 7.5
Government land 19.0 17.2 18.7 Others 9.0 6.3 8.6
N Cases 321 64 385
QUEZON Owned 64.7 68.5 66.0 Caretaker 8.1 8.5 8.2 Rented/Leased 10.5 13.1 11.3 Common property w/ other family members/relatives 8.9 3.1 7.0
Government land 5.8 6.9 6.2 Others 1.9 .0 1.3
N Cases 258 130 388
KORONADAL Owned 58.1 61.6 58.8 Caretaker 6.3 5.5 6.1 Rented/Leased 10.3 12.3 10.7 Common property w/ other family members/relatives 19.1 12.3 17.8
Government land 4.4 2.7 4.1 Others 1.9 5.5 2.5
N Cases 320 73 393
Table G15. Percentage of Households by Type of House/Building Occupied by
Household Headship: 5 Selected Water Districts
Water District/ Type of House or Building Occupied
HH Headship Total
Male-headed
HHs Female-
headed HHs LEGAZPI
Single 94.8 92.9 94.3 Duplex 2.8 4.0 3.1 Apartment/condo/townhouse 1.0 1.0 1.0 Others 1.4 2.0 1.6

Supplementary Appendix H
TA No. 7122-PHI: Water District Development Sector Project PPTA – Final Report – Vol. 10
18
N Cases 286 99 385
LA UNION
Single 88.2 89.2 88.5 Duplex 8.5 9.9 8.9 Apartment/condo/townhouse 1.5 .9 1.3 Commercial/industrial or agricultural bldg 1.1 .0 .8
Others .7 .0 .5
N Cases 272 111 383 LEYTE
Single 94.7 92.2 94.3 Duplex 5.3 6.3 5.5 Apartment/condo/townhouse .0 1.6 .3
N Cases 321 64 385
QUEZON
Single 93.8 87.7 91.8 Duplex 3.1 6.9 4.4 Apartment/condo/townhouse 2.3 4.6 3.1 Commercial/industrial or agricultural bldg .0 .8 .3
Others .8 .0 .5
N Cases 258 130 388 KORONADAL
Single 93.7 89.0 92.9 Duplex 1.9 5.5 2.6 Apartment/condo/townhouse 3.8 4.1 3.8 Commercial/industrial or agricultural bldg .3 .0 .3
Others .3 1.4 .5
N Cases 319 73 392 Table G16. Percentage of Households by Observed Materials that Make Up the
Dwelling Unit by Household Headship: 5 Selected Water Districts
Water District/ Observed materials that make up the dwelling unit
HH Headship Total
Male-headed
HHs Female-
headed HHs LEGAZPI
Strong materials 35.7 40.4 36.9 Light materials 14.3 18.2 15.3 Mixed but predominantly strong materials 26.2 28.3 26.8
Mixed but predominantly light materials
21.3 13.1 19.2

Supplementary Appendix H
TA No. 7122-PHI: Water District Development Sector Project PPTA – Final Report – Vol. 10
19
Salvaged/makeshift materials 1.7 .0 1.3 Mixed but predominantly salvaged materials .7 .0 .5
N Cases 286 99 385
LA UNION
Strong materials 57.5 54.1 56.5 Light materials 13.9 14.4 14.1 Mixed but predominantly strong materials 16.8 16.2 16.7
Mixed but predominantly light materials 6.6 9.9 7.6
Salvaged/makeshift materials 5.1 5.4 5.2
N Cases 273 111 384 LEYTE
Strong materials 16.5 10.9 15.6 Light materials 17.8 20.3 18.2 Mixed but predominantly strong materials 33.0 39.1 34.0
Mixed but predominantly light materials 31.2 26.6 30.4
Salvaged/makeshift materials 1.2 3.1 1.6 Mixed but predominantly salvaged materials .3 .0 .3
N Cases 321 64 385
QUEZON Strong materials 60.3 50.0 56.8 Light materials 11.3 12.3 11.6 Mixed but predominantly strong materials 23.0 33.1 26.4
Mixed but predominantly light materials 5.1 4.6 4.9
Salvaged/makeshift materials .4 .0 .3
N Cases 257 130 387
KORONADAL Strong materials 27.6 37.0 29.3 Light materials 19.1 20.5 19.4 Mixed but predominantly strong materials 34.2 20.5 31.6
Mixed but predominantly light materials 16.6 17.8 16.8
Salvaged/makeshift materials 2.5 4.1 2.8
N Cases 319 73 392

Supplementary Appendix H
TA No. 7122-PHI: Water District Development Sector Project PPTA – Final Report – Vol. 10
20
Table G17. Percentage of Households by Primary Water Sources (Multiple Responses) by Household Headship: 5 Selected Water Districts
Water District/ Primary Water Source HH Headship
Total
Male-headed HHs
Female-headed HHs
LEGAZPI Piped connection 69.9 69.7 69.9 Shallow well 46.5 38.4 44.4 Water vendors 9.8 15.2 11.2 Deep well 1.4 3.0 1.8 Public/Street faucet .7 1.0 .8 Spring/River/Pond/Stream 4.5 6.1 4.9 Rain 1.7 1.0 1.6
N Cases 286 99 385 LA UNION
Piped connection 18.3 18.0 18.2 Shallow well 83.5 83.8 83.6 Water vendors 34.4 46.8 38.0 Deep well 9.9 8.1 9.4 Public/Street faucet .7 .9 .8 Spring/River/Pond/Stream .7 .0 .5 Rain .7 .0 .5
N Cases 273 111 384 LEYTE
Piped connection 73.2 84.4 75.1 Shallow well 47.7 42.2 46.8 Water vendors 6.2 3.1 5.7 Deep well .9 .0 .8 Public/Street faucet 12.8 7.8 11.9 Spring/River/Pond/Stream .6 .0 .5 Rain .0 .0 .0
N Cases 321 64 385
QUEZON Piped connection 86.0 87.7 86.6 Shallow well 8.9 6.9 8.2 Water vendors 14.0 12.3 13.4 Deep well .4 .0 .3 Public/Street faucet 3.9 5.4 4.4 Spring/River/Pond/Stream 7.4 6.2 7.0 Rain .4 .0 .3
N Cases 258 130 388
KORONADAL

Supplementary Appendix H
TA No. 7122-PHI: Water District Development Sector Project PPTA – Final Report – Vol. 10
21
Piped connection 19.4 30.1 21.4 Shallow well 47.5 35.6 45.3 Water vendors 5.6 15.1 7.4 Deep well 31.3 37.0 32.3 Public/Street faucet 3.9 5.4 4.4 Spring/River/Pond/Stream 6.3 1.4 5.3 Rain 6.6 15.1 8.1
N Cases 320 73 393 Table G18. Proportion of Households that Have WD Pipe Connection by Household
Headship: 5 Selected Water Districts
Water District HH Headship
Total
Male-headed HHs
Female-headed HHs
LEGAZPI Proportion of households that have WD pipe connection 54.5 57.6 55.3
N Cases 286 99 385
LA UNION
Proportion of households that have WD pipe connection
9.2 15.3 10.9
N Cases 273 111 384
LEYTE Proportion of households that have WD pipe connection 29.3 43.8 31.7
N Cases 321 64 385
QUEZON
Proportion of households that have WD pipe connection 69.0 74.6 70.9
N Cases 258 130 388
KORONADAL
Proportion of households that have WD pipe connection 15.9 26.0 17.8
N Cases 320 73 393
Table G19. Percentage of Households by Type of Toilet Facility Owned/Used by
Household Headship: 5 Selected Water Districts
Water District/ Type of Toilet Facility Owned/Used
HH Headship Total
Male-headed
HHs Female-
headed HHs LEGAZPI
Water-sealed (flush/pourflush) connected to septic tank 72.7 80.8 74.8
Water-sealed (flush/pourflush) connected to drainage 10.5 2.0 8.3

Supplementary Appendix H
TA No. 7122-PHI: Water District Development Sector Project PPTA – Final Report – Vol. 10
22
Shared toilet 7.0 10.1 7.8 Water-sealed (flush/pourflush) connected to pit 3.5 .0 2.6
No toilet (wrap and throw, arinola, bush, sea/marshland , river ) 2.7 4.0 3.1
Non-water sealed (ventilated improved pit, sanitary pit privy) 2.1 .0 1.6
Non-water sealed (open pit privy, overhang) 1.4 1.0 1.3
Public toilet .0 2.0 .5 N Cases 286 99 385
LA UNION
Water-sealed (flush/pourflush) connected to septic tank 76.1 88.3 79.6
Shared toilet 12.1 4.5 9.9 Water-sealed (flush/pourflush) connected to pit 8.5 7.2 8.1
Non-water sealed (ventilated improved pit, sanitary pit privy) 1.5 .0 1.0
No toilet (wrap and throw, arinola, bush, sea/marshland , river ) 1.5 .0 1.0
Public toilet .4 .0 .3 N Cases 272 111 383
LEYTE
Water-sealed (flush/pourflush) connected to septic tank
67.9 82.8 70.4
Water-sealed (flush/pourflush) connected to pit 16.2 7.8 14.8
Non-water sealed (ventilated improved pit, sanitary pit privy) 7.5 3.1 6.8
Shared toilet 4.4 3.1 4.2 Public toilet .3 .0 .3 Non-water sealed (open pit privy, overhang) .3 .0 .3
No toilet (wrap and throw, arinola, bush, sea/marshland , river ) 2.4 .0 2.1
N Cases 321 64 385
QUEZON Water-sealed (flush/pourflush) connected to septic tank 87.6 89.2 88.1
Water-sealed (flush/pourflush) connected to drainage 9.7 9.2 9.5
Water-sealed (flush/pourflush) connected to sewerage system .8 .0 .5
Water-sealed (flush/pourflush) connected to pit .8 .0 .5
No toilet (wrap and throw, arinola, bush, sea/marshland , river ) .8 .8 .8
Shared toilet .0 .8 .3 Public toilet .4 .0 .3
N Cases 258 130 388
KORONADAL Water-sealed (flush/pourflush) connected to septic tank 80.6 75.3 79.6
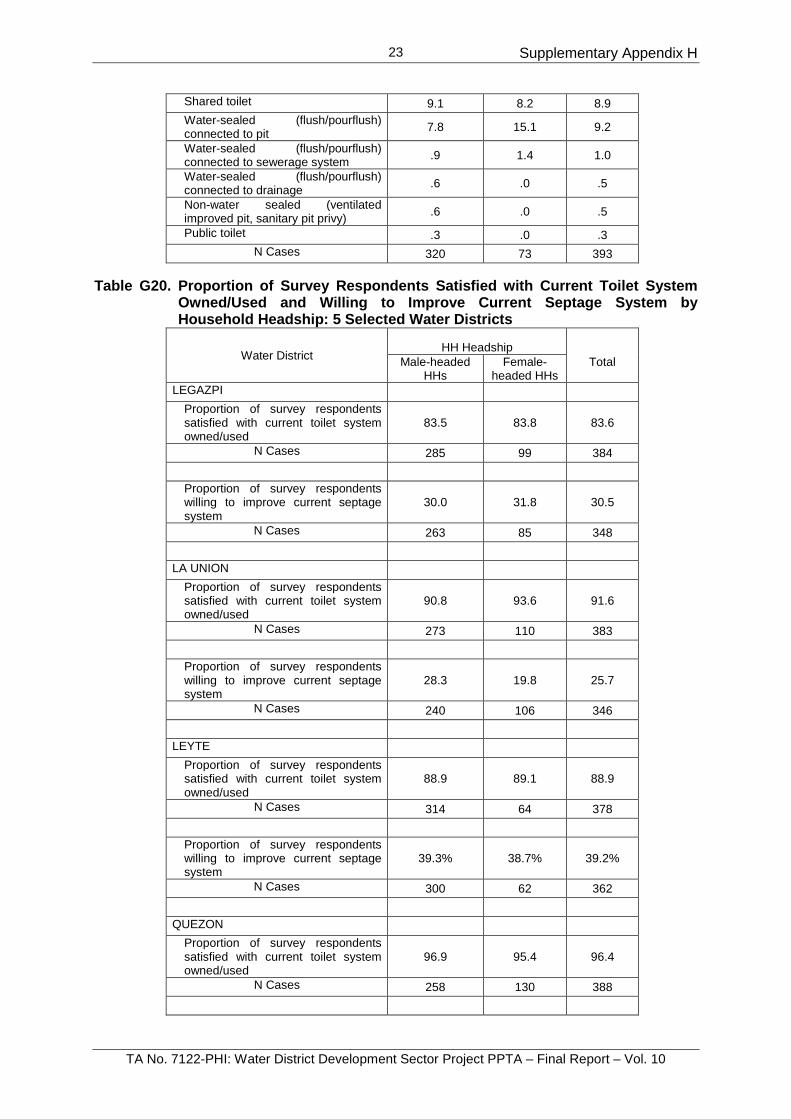
Supplementary Appendix H
TA No. 7122-PHI: Water District Development Sector Project PPTA – Final Report – Vol. 10
23
Shared toilet 9.1 8.2 8.9 Water-sealed (flush/pourflush) connected to pit 7.8 15.1 9.2
Water-sealed (flush/pourflush) connected to sewerage system .9 1.4 1.0
Water-sealed (flush/pourflush) connected to drainage .6 .0 .5
Non-water sealed (ventilated improved pit, sanitary pit privy) .6 .0 .5
Public toilet .3 .0 .3 N Cases 320 73 393
Table G20. Proportion of Survey Respondents Satisfied with Current Toilet System
Owned/Used and Willing to Improve Current Septage System by Household Headship: 5 Selected Water Districts
Water District HH Headship
Total
Male-headed HHs
Female-headed HHs
LEGAZPI Proportion of survey respondents satisfied with current toilet system owned/used
83.5 83.8 83.6
N Cases 285 99 384 Proportion of survey respondents willing to improve current septage system
30.0 31.8 30.5
N Cases 263 85 348
LA UNION Proportion of survey respondents satisfied with current toilet system owned/used
90.8 93.6 91.6
N Cases 273 110 383 Proportion of survey respondents willing to improve current septage system
28.3 19.8 25.7
N Cases 240 106 346
LEYTE Proportion of survey respondents satisfied with current toilet system owned/used
88.9 89.1 88.9
N Cases 314 64 378 Proportion of survey respondents willing to improve current septage system
39.3% 38.7% 39.2%
N Cases 300 62 362
QUEZON Proportion of survey respondents satisfied with current toilet system owned/used
96.9 95.4 96.4
N Cases 258 130 388

Supplementary Appendix H
TA No. 7122-PHI: Water District Development Sector Project PPTA – Final Report – Vol. 10
24
Proportion of survey respondents willing to improve current septage system
3.1 8.5 4.9
N Cases 255 130 385
KORONADAL Proportion of survey respondents satisfied with current toilet system owned/used
80.0 79.5 79.9
N Cases 320 73 393 Proportion of survey respondents willing to improve current septage system
31.2 26.9 30.4
N Cases 292 67 359 Table G21. Hygiene and Sanitation Practices by Household Headship: 5 Selected
Water Districts
Water District HH Headship
Total
Male-headed HHs
Female-headed HHs
Percent of households whose members wash hands before cooking
LEGAZPI 97.9 100.0 98.4 N Cases 286 99 385
LA UNION 98.5 100.0 99.0 N Cases 273 111 384
LEYTE 100.0 100.0 100.0 N Cases 321 64 385
QUEZON 96.5 97.7 96.9 N Cases 258 130 388
KORONADAL 99.7 100.0 99.7
N Cases 320 73 393 Percent of households whose members wash hands before eating
LEGAZPI 100.0 100.0 100.0 N Cases 286 99 385
LA UNION 98.9 100.0 99.2 N Cases 273 111 384
LEYTE 100.0 100.0 100.0 N Cases 321 64 385
QUEZON 98.8 99.2 99.0 N Cases 258 130 388
KORONADAL 100.0 100.0 100.0
N Cases 320 73 393
Percent of households whose members wash hands after using toilet
LEGAZPI 99.7 100.0 99.7 N Cases 286 99 385
LA UNION 99.3 100.0 99.5

Supplementary Appendix H
TA No. 7122-PHI: Water District Development Sector Project PPTA – Final Report – Vol. 10
25
N Cases 273 111 384 LEYTE 99.7 100.0 99.7
N Cases 321 64 385 QUEZON 99.2 100.0 99.5
N Cases 258 130 388 KORONADAL 100.0 100.0 100.0
N Cases 320 73 393 Percent of households whose members wash hands before breastfeeding
LEGAZPI 92.6 93.3 92.8 N Cases 54 15 69
LA UNION 67.5 25.0 57.7 N Cases 40 12 52
LEYTE 84.4 66.7 82.6 N Cases 77 9 86
QUEZON 76.9 94.4 82.5 N Cases 39 18 57
KORONADAL 53.8 41.7 51.9
N Cases 130 24 154
Percent of households whose members wash hands before feeding children
LEGAZPI 97.6 100.0 98.2 N Cases 125 38 163
LA UNION 87.0 72.0 83.0 N Cases 69 25 94
LEYTE 95.2 86.7 94.3 N Cases 125 15 140
QUEZON 92.5 100.0 95.3 N Cases 107 63 170
KORONADAL 66.4 51.9 64.1
N Cases 140 27 167
Percent of households whose members wash hands after changing diaper
LEGAZPI 92.3 89.5 91.7 N Cases 65 19 84
LA UNION 77.1 46.7 69.8 N Cases 48 15 63
LEYTE 85.1 81.8 84.7 N Cases 87 11 98
QUEZON 82.8 96.8 87.6 N Cases 58 31 89
KORONADAL 55.7 38.5 52.9
N Cases 131 26 157
Percent of households whose members wash hands after washing

Supplementary Appendix H
TA No. 7122-PHI: Water District Development Sector Project PPTA – Final Report – Vol. 10
26
the children after toilet
LEGAZPI 98.4 100.0 98.8 N Cases 125 39 164
LA UNION 92.3 83.3 89.8 N Cases 91 36 127
LEYTE 95.4 88.2 94.6 N Cases 131 17 148
QUEZON 94.9 100.0 96.8 N Cases 118 70 188
KORONADAL 85.7 55.6 81.7
N Cases 175 27 202 Table G22. Percentage of Households by Place where Children &Infants go for Toilet
Purposes by Household Headship: 5 Selected Water Districts
Water District / Place where Children &Infants go for Toilet Purposes
HH Headship Total
Male-headed
HHs Female-
headed HHs LEGAZPI
Toilet 92.7 89.2 91.8 Gutter/water canals 1.9 2.2 2.0 River .4 1.1 .6 Garden/backyard 1.5 4.3 2.3 Urinals/urinola 1.5 1.1 1.4 Disposable diapers 1.9 2.2 2.0
N Cases 260 93 353 LA UNION
Toilet 92.6 95.6 93.5 Garden/backyard 2.2 2.2 2.2 Urinals/urinola .9 1.1 .9 Disposable diapers 4.3 1.1 3.4
N Cases 231 91 322 LEYTE
Toilet 89.1 87.8 88.9 Gutter/water canals .8 .0 .7 River .4 .0 .3 Garden/backyard 2.3 2.4 2.3 Urinals/urinola 1.1 2.4 1.3 Disposable diapers 6.4 7.3 6.5
N Cases 265 41 306
QUEZON Toilet 99.6 98.3 99.2 Gutter/water canals .0 1.7 .5 Disposable diapers .4 .0 .3
N Cases 246 119 365
KORONADAL
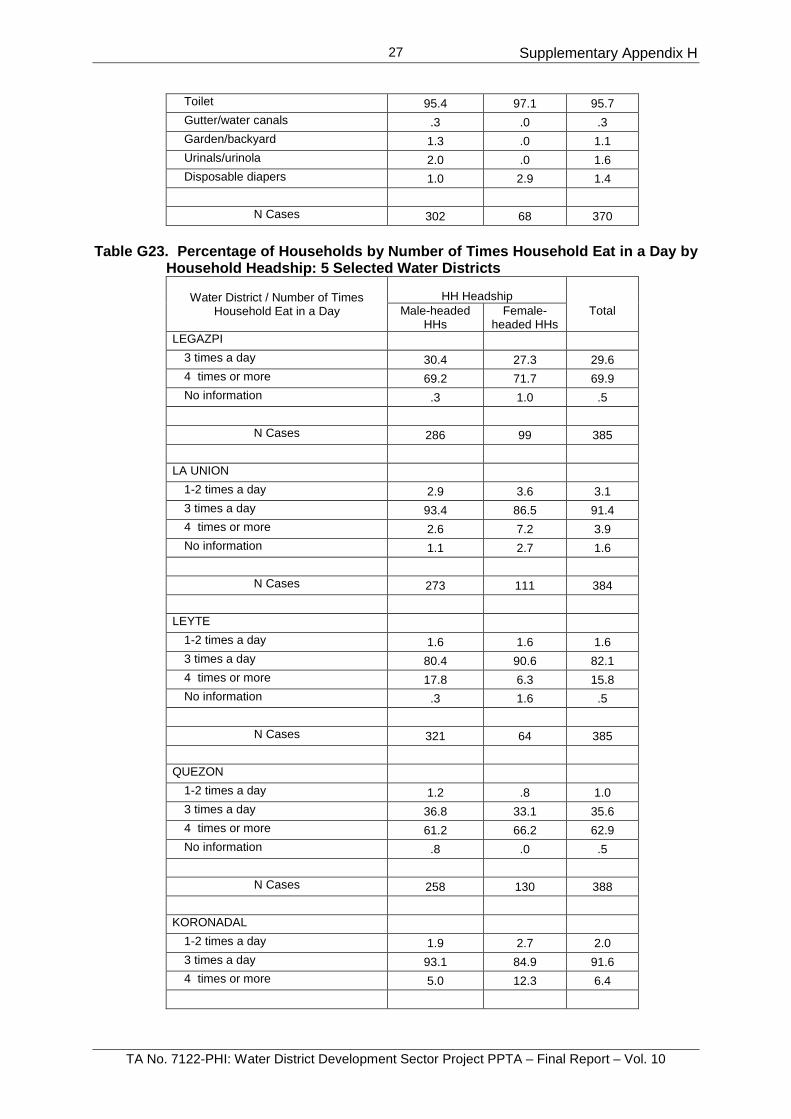
Supplementary Appendix H
TA No. 7122-PHI: Water District Development Sector Project PPTA – Final Report – Vol. 10
27
Toilet 95.4 97.1 95.7 Gutter/water canals .3 .0 .3 Garden/backyard 1.3 .0 1.1 Urinals/urinola 2.0 .0 1.6 Disposable diapers 1.0 2.9 1.4
N Cases 302 68 370
Table G23. Percentage of Households by Number of Times Household Eat in a Day by
Household Headship: 5 Selected Water Districts
Water District / Number of Times Household Eat in a Day
HH Headship Total
Male-headed
HHs Female-
headed HHs LEGAZPI
3 times a day 30.4 27.3 29.6 4 times or more 69.2 71.7 69.9 No information .3 1.0 .5
N Cases 286 99 385
LA UNION
1-2 times a day 2.9 3.6 3.1 3 times a day 93.4 86.5 91.4 4 times or more 2.6 7.2 3.9 No information 1.1 2.7 1.6
N Cases 273 111 384
LEYTE
1-2 times a day 1.6 1.6 1.6 3 times a day 80.4 90.6 82.1 4 times or more 17.8 6.3 15.8 No information .3 1.6 .5
N Cases 321 64 385
QUEZON
1-2 times a day 1.2 .8 1.0 3 times a day 36.8 33.1 35.6 4 times or more 61.2 66.2 62.9 No information .8 .0 .5
N Cases 258 130 388
KORONADAL
1-2 times a day 1.9 2.7 2.0 3 times a day 93.1 84.9 91.6 4 times or more 5.0 12.3 6.4

Supplementary Appendix H
TA No. 7122-PHI: Water District Development Sector Project PPTA – Final Report – Vol. 10
28
N Cases 320 73 393 Table G24. Child and Maternal Mortality Experience by Household Headship: 5
Selected Water Districts
Water District HH Headship
Total
Male-headed HHs
Female-headed HHs
Percent of households with children who died before reaching the age of 6
LEGAZPI 6.6 8.1 7.0 N Cases 286 99 385
LA UNION 8.1 12.6 9.4 N Cases 273 111 384
LEYTE 4.0 6.3 4.4 N Cases 321 64 385
QUEZON 1.6 1.5 1.5 N Cases 258 130 388
KORONADAL 2.2 6.8 3.1
N Cases 320 73 393 Percent of households with member who died during pregnancy or while giving birth
LEGAZPI 2.1 .0 1.6 N Cases 286 99 385
LA UNION 3.3 9.0 4.9 N Cases 273 111 384
LEYTE 4.4 1.6 3.9 N Cases 321 64 385
QUEZON .8 .0 .5 N Cases 258 130 388
KORONADAL 1.3 4.1 1.8
N Cases 320 73 393 Table G25. Percentage of Households by Health Facility Sought for Medical Services
by Household Headship: 5 Selected Water Districts
Water District / Health Facility Sought for Medical Services
HH Headship Total
Male-headed
HHs Female-
headed HHs LEGAZPI
Health center 35.2 37.4 35.8 Private clinic 18.9 17.2 18.4 Government hospital 24.2 21.2 23.4 Private hospital 10.3 14.1 11.3 Herbolario 5.3 8.1 6.1 Self medication 3.6 1.0 2.9 Others 2.5 1.0 2.1
Percent of survey respondents satisfied with available health services in their locality
85.7 83.8 85.2

Supplementary Appendix H
TA No. 7122-PHI: Water District Development Sector Project PPTA – Final Report – Vol. 10
29
N Cases 281 99 380 LA UNION
Health center 46.2 43.2 45.3 Private clinic 9.2 6.3 8.3 Government hospital 24.9 21.6 24.0 Private hospital 14.7 21.6 16.7 Self medication 1.8 4.5 2.6 Others 3.3 2.7 3.1
Percent of survey respondents satisfied with available health services in their locality
97.8 97.2 97.6
N Cases 273 111 384 LEYTE
Health center 29.6 17.2 27.5 Private clinic 6.3 7.8 6.5 Government hospital 37.4 34.4 36.9 Private hospital 9.7 15.6 10.7 Herbolario 1.3 .0 1.0 Self medication 14.2 25.0 16.0 Others 1.6 .0 1.3
Percent of survey respondents satisfied with available health services in their locality
59.8 59.4 59.7
N Cases 318 64 382
QUEZON Health center 38.7 29.7 35.7 Private clinic 17.6 16.4 17.2 Government hospital 12.5 12.5 12.5 Private hospital 25.4 34.4 28.4 Herbolario 2.3 .0 1.6 Self medication 2.7 2.3 2.6 Others .8 4.7 2.1
Percent of survey respondents satisfied with available health services in their locality
94.5 95.3 94.8
N Cases 256 128 384
KORONADAL Health center 56.9 46.6 55.0 Private clinic 13.4 23.3 15.3 Government hospital 15.9 20.5 16.8 Private hospital 8.1 4.1 7.4 Herbolario 2.2 2.7 2.3 Self medication 2.5 2.7 2.5 Others .9 .0 .8

Supplementary Appendix H
TA No. 7122-PHI: Water District Development Sector Project PPTA – Final Report – Vol. 10
30
Percent of survey respondents satisfied with available health services in their locality
90.6 94.5 91.3
N Cases 320 73 393 Table G26. Access to Insurance and Assistance for Health Expenses, and
Participation in Community Organization by Household Headship: 5 Selected Water Districts
Water District HH Headship
Total
Male-headed HHs
Female-headed HHs
Percent of households with at least one member who has Philhealth or any health insurance coverage
LEGAZPI 79.6 78.6 79.4 N Cases 286 99 385
LA UNION 69.7 71.8 70.3 N Cases 273 111 384
LEYTE 62.2 62.9 62.3 N Cases 321 64 385
QUEZON 71.8 70.0 71.2 N Cases 258 130 388
KORONADAL 72.2 78.1 73.3
N Cases 320 73 393 Percent of households with at least one member who gets any form of assistance for health expenses
LEGAZPI 32.7 36.4 33.7 N Cases 286 99 385
LA UNION 22.9 28.6 24.6 N Cases 273 111 384
LEYTE 27.0 30.2 27.6 N Cases 321 64 385
QUEZON 35.2 38.9 36.5 N Cases 258 130 388
KORONADAL 24.3 42.9 27.7
N Cases 320 73 393
Percent of households with at least one member who is a member of any organization/association in the community
LEGAZPI 48.6 40.4 46.5 N Cases 286 99 385
LA UNION 30.5 34.3 31.6 N Cases 273 111 384
LEYTE 39.4 32.8 38.3 N Cases 321 64 385
QUEZON 20.4 20.2 20.3 N Cases 258 130 388

Supplementary Appendix H
TA No. 7122-PHI: Water District Development Sector Project PPTA – Final Report – Vol. 10
31
KORONADAL 37.4 41.1 38.1
N Cases 320 73 393 Table G27. Percentage of Households by Household Decision-making Patterns by
Household Headship: 5 Selected Water Districts
Water District / Member of Household who decides
HH Headship Total
Male-headed
HHs Female-
headed HHs When to buy household equipment LEGAZPI
Husband 17.5 8.1 15.1 Wife 16.8 43.4 23.6 Both husband/wife 58.7 16.2 47.8 Other member(s) 7.0 32.3 13.5
N Cases 286 99 385
LA UNION Husband 22.1 7.3 17.8 Wife 16.9 35.5 22.3 Both husband/wife 55.1 16.4 44.0 Other member(s) 5.9 40.9 16.0
N Cases 272 110 382
LEYTE Husband 15.9 9.4 14.8 Wife 22.1 29.7 23.4 Both husband/wife 56.7 7.8 48.6 Other member(s) 5.3 53.1 13.2
N Cases 321 64 385
QUEZON Husband 19.8 3.1 14.2 Wife 20.5 51.5 30.9 Both husband/wife 53.9 26.9 44.8 Other member(s) 5.8 18.5 10.1
N Cases 258 130 388
KORONADAL Husband 15.0 5.5 13.2 Wife 15.3 45.2 20.9 Both husband/wife 67.2 17.8 58.0 Other member(s) 2.5 31.5 7.9
N Cases 320 73 393
When to renovate the house LEGAZPI
Husband 23.8 11.1 20.5 Wife 11.9 42.4 19.7

Supplementary Appendix H
TA No. 7122-PHI: Water District Development Sector Project PPTA – Final Report – Vol. 10
32
Both husband/wife 58.4 18.2 48.1 Other member(s) 5.9 28.3 11.7
N Cases 286 99 385
LA UNION Husband 27.3 6.3 21.2 Wife 8.1 36.0 16.2 Both husband/wife 55.4 15.3 43.7 Other member(s) 9.2 42.3 18.8
N Cases 271 111 382
LEYTE Husband 23.2 9.5 20.9 Wife 12.2 28.6 14.9 Both husband/wife 58.9 7.9 50.5 Other member(s) 5.6 54.0 13.6
N Cases 319 63 382
QUEZON Husband 31.0 9.3 23.8 Wife 11.2 44.2 22.2 Both husband/wife 50.4 29.5 43.4 Other member(s) 7.4 17.1 10.6
N Cases 258 129 387
KORONADAL Husband 16.8 4.2 14.4 Wife 12.7 41.7 18.0 Both husband/wife 64.6 18.1 55.9 Other member(s) 6.0 36.1 11.6
N Cases 316 72 388
When to build a toilet/septic tank LEGAZPI
Husband 24.6 12.1% 21.4 Wife 12.6 43.4% 20.6 Both husband/wife 56.8 17.2% 46.6 Other member(s) 6.0 27.3% 11.5
N Cases 285 99 384
LA UNION Husband 29.7 8.1 23.4 Wife 6.6 34.2 14.6 Both husband/wife 54.6 14.4 43.0 Other member(s) 9.2 43.2 19.0
N Cases 273 111 384
LEYTE
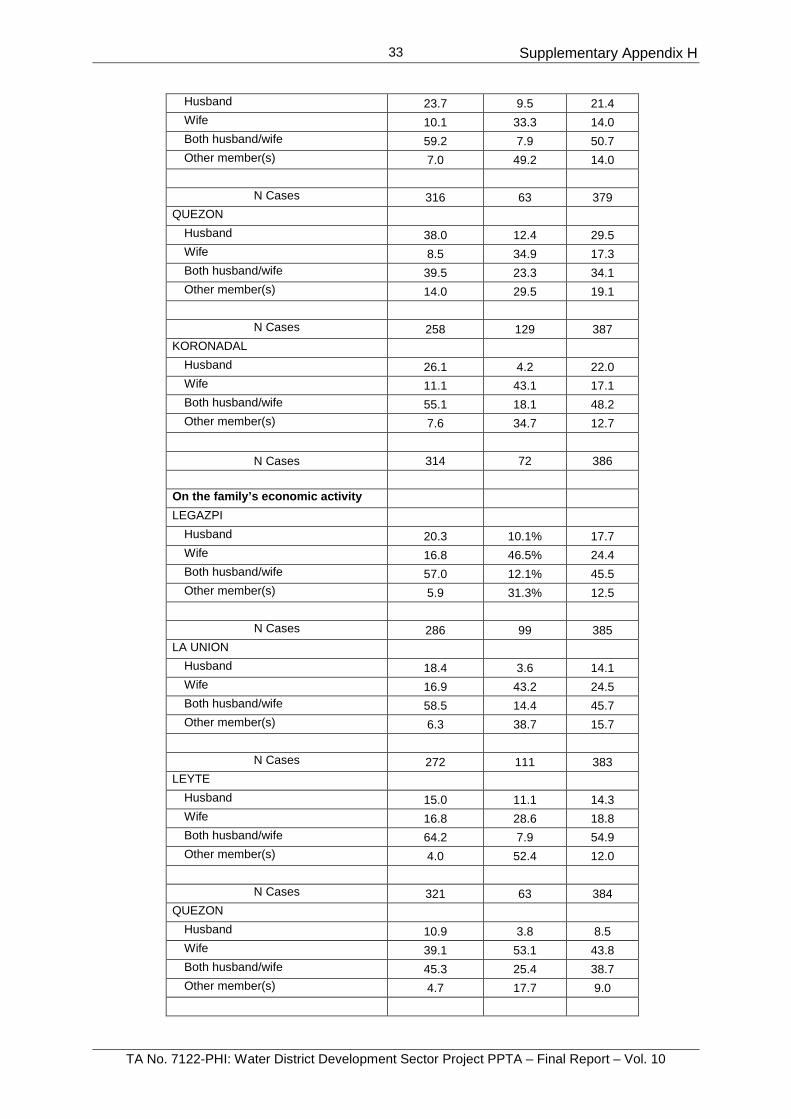
Supplementary Appendix H
TA No. 7122-PHI: Water District Development Sector Project PPTA – Final Report – Vol. 10
33
Husband 23.7 9.5 21.4 Wife 10.1 33.3 14.0 Both husband/wife 59.2 7.9 50.7 Other member(s) 7.0 49.2 14.0
N Cases 316 63 379
QUEZON Husband 38.0 12.4 29.5 Wife 8.5 34.9 17.3 Both husband/wife 39.5 23.3 34.1 Other member(s) 14.0 29.5 19.1
N Cases 258 129 387
KORONADAL Husband 26.1 4.2 22.0 Wife 11.1 43.1 17.1 Both husband/wife 55.1 18.1 48.2 Other member(s) 7.6 34.7 12.7
N Cases 314 72 386
On the family’s economic activity LEGAZPI
Husband 20.3 10.1% 17.7 Wife 16.8 46.5% 24.4 Both husband/wife 57.0 12.1% 45.5 Other member(s) 5.9 31.3% 12.5
N Cases 286 99 385
LA UNION Husband 18.4 3.6 14.1 Wife 16.9 43.2 24.5 Both husband/wife 58.5 14.4 45.7 Other member(s) 6.3 38.7 15.7
N Cases 272 111 383
LEYTE Husband 15.0 11.1 14.3 Wife 16.8 28.6 18.8 Both husband/wife 64.2 7.9 54.9 Other member(s) 4.0 52.4 12.0
N Cases 321 63 384
QUEZON Husband 10.9 3.8 8.5 Wife 39.1 53.1 43.8 Both husband/wife 45.3 25.4 38.7 Other member(s) 4.7 17.7 9.0

Supplementary Appendix H
TA No. 7122-PHI: Water District Development Sector Project PPTA – Final Report – Vol. 10
34
N Cases 258 130 388 KORONADAL
Husband 12.9 5.5 11.5 Wife 17.0 43.8 22.0 Both husband/wife 67.9 19.2 58.8 Other member(s) 2.2 31.5 7.7
N Cases 318 73 391
To bring the children to the doctor when sick
LEGAZPI Husband 8.7 5.2 7.8 Wife 32.7 53.1 38.0 Both husband/wife 52.7 13.5 42.6 Other member(s) 5.8 28.1 11.6
N Cases 275 96 371
LA UNION Husband 12.8 3.7 10.2 Wife 17.4 46.3 25.7 Both husband/wife 64.5 14.8 50.1 Other member(s) 5.3 35.2 13.9
N Cases 265 108 373
LEYTE Husband 8.9 8.5 8.8 Wife 33.1 33.9 33.2 Both husband/wife 52.9 5.1 44.9 Other member(s) 5.1 52.5 13.1
N Cases 293 59 352
QUEZON Husband 11.0 4.0 8.7 Wife 34.9 48.4 39.3 Both husband/wife 49.4 30.6 43.3 Other member(s) 4.7 16.9 8.7
N Cases 255 124 379
KORONADAL Husband 9.8 4.2 8.8 Wife 23.7 51.4 28.9 Both husband/wife 64.2 18.1 55.7 Other member(s) 2.2 26.4 6.7
N Cases 316 72 388
On water connection LEGAZPI
Husband 19.6 11.2 17.5

Supplementary Appendix H
TA No. 7122-PHI: Water District Development Sector Project PPTA – Final Report – Vol. 10
35
Wife 14.7 51.0 24.0 Both husband/wife 60.4 11.2 47.8 Other member(s) 5.3 26.5 10.7
N Cases 285 98 383
LA UNION Husband 27.4 5.4 21.0 Wife 7.0 37.8 16.0 Both husband/wife 57.8 18.0 46.2 Other member(s) 7.8 38.7 16.8
N Cases 270 111 381
LEYTE Husband 17.7 12.3 16.7 Wife 11.7 31.6 15.2 Both husband/wife 63.5 8.8 53.9 Other member(s) 7.1 47.4 14.2
N Cases 266 57 323
QUEZON Husband 27.1 11.0 21.7 Wife 12.9 40.2 22.0 Both husband/wife 51.4 29.1 44.0 Other member(s) 8.6 19.7 12.3
N Cases 255 127 382
KORONADAL Husband 15.7 5.8 13.8 Wife 10.6 43.5 16.9 Both husband/wife 71.0 17.4 60.8 Other member(s) 2.7 33.3 8.6
N Cases 293 69 362 Table G28. Percentage of Households by Household Responsibility Patterns by Household Headship: 5 Selected Water Districts
Water District / Member of household who is responsible
HH Headship Total
Male-headed
HHs Female-
headed HHs Supervising/reminding the children to wash hands
LEGAZPI Husband 6.0 5.3 5.8 Wife 55.8 57.4 56.2 Both husband/wife 30.0 8.5 24.4 Other member(s) 8.2 28.7 13.6
N Cases 267 94 361
LA UNION Husband 7.4 1.0 5.6

Supplementary Appendix H
TA No. 7122-PHI: Water District Development Sector Project PPTA – Final Report – Vol. 10
36
Wife 39.9 55.1 44.1 Both husband/wife 46.9 15.3 38.2 Other member(s) 5.8 28.6 12.1
N Cases 258 98 356
LEYTE Husband 2.3 12.0 3.8 Wife 65.5 42.0 61.8 Both husband/wife 25.8 2.0 22.0 Other member(s) 6.4 44.0 12.4
N Cases 264 50 314
QUEZON Husband 5.5 .8 4.0 Wife 40.6 56.5 45.8 Both husband/wife 41.3 25.8 36.2 Other member(s) 12.6 16.9 14.0
N Cases 254 124 378
KORONADAL Husband 4.4 4.4 4.4 Wife 44.0 55.9 46.1 Both husband/wife 45.9 10.3 39.6 Other member(s) 5.7 29.4 9.9
N Cases 316 68 384
Cleaning the toilet and water containers
LEGAZPI Husband 6.6 8.1 7.0 Wife 50.0 49.5 49.9 Both husband/wife 27.3 6.1 21.8 Other member(s) 16.1 36.4 21.3
N Cases 286 99 385
LA UNION Husband 10.7 .9 7.9 Wife 51.7 48.6 50.8 Both husband/wife 25.8 7.2 20.4 Other member(s) 11.8 43.2 20.9
N Cases 271 111 382
LEYTE Husband 6.6 10.9 7.3 Wife 64.8 34.4 59.7 Both husband/wife 14.5 1.6 12.3 Other member(s) 14.2 53.1 20.7

Supplementary Appendix H
TA No. 7122-PHI: Water District Development Sector Project PPTA – Final Report – Vol. 10
37
N Cases 318 64 382 QUEZON
Husband 18.6 8.5 15.2 Wife 40.7 52.3 44.6 Both husband/wife 22.5 13.8 19.6 Other member(s) 18.2 25.4 20.6
N Cases 258 130 388
KORONADAL Husband 10.0 2.7 8.7 Wife 38.1 43.8 39.2 Both husband/wife 30.0 6.8 25.7 Other member(s) 21.9 46.6 26.5
N Cases 320 73 393
Removing garbage LEGAZPI
Husband 18.2 5.1 14.8 Wife 27.6 37.4 30.1 Both husband/wife 28.3 8.1 23.1 Other member(s) 25.9 49.5 31.9
N Cases 286 99 385
LA UNION Husband 19.6 .9 14.1 Wife 39.9 46.8 41.9 Both husband/wife 26.2 7.2 20.7 Other member(s) 14.4 45.0 23.3
N Cases 271 111 382
LEYTE Husband 10.3 11.1 10.4 Wife 52.0 28.6 48.2 Both husband/wife 13.7 1.6 11.7 Other member(s) 24.0 58.7 29.7
N Cases 321 63 384
QUEZON Husband 34.9 18.5 29.4 Wife 20.2 35.4 25.3 Both husband/wife 21.3 10.0 17.5 Other member(s) 23.6 36.2 27.8
N Cases 258 130 388
KORONADAL Husband 15.6 4.1 13.5 Wife 32.5 41.1 34.1 Both husband/wife 28.8 6.8 24.7

Supplementary Appendix H
TA No. 7122-PHI: Water District Development Sector Project PPTA – Final Report – Vol. 10
38
Other member(s) 23.1 47.9 27.7
N Cases 320 73 393
Cleaning drainage/sewage systems LEGAZPI
Husband 25.0 8.3 20.7 Wife 21.4 32.3 24.2 Both husband/wife 28.9 9.4 23.9 Other member(s) 24.6 50.0 31.1
N Cases 280 96 376
LA UNION Husband 24.4 3.3 18.0 Wife 31.5 45.7 35.7 Both husband/wife 31.5 8.7 24.6 Other member(s) 12.7 42.4 21.6
N Cases 213 92 305
LEYTE Husband 20.7 11.8 19.2 Wife 36.6 32.4 35.9 Both husband/wife 18.3 2.9 15.7 Other member(s) 24.4 52.9 29.3
N Cases 164 34 198
QUEZON Husband 42.9 20.6 35.5 Wife 17.3 32.5 22.4 Both husband/wife 19.3 7.1 15.3 Other member(s) 20.5 39.7 26.8
N Cases 254 126 380
KORONADAL Husband 22.1 1.8 18.7 Wife 28.3 42.9 30.7 Both husband/wife 20.7 7.1 18.4 Other member(s) 29.0 48.2 32.2
N Cases 276 56 332

Supplementary Appendix H
TA No. 7122-PHI: Water District Development Sector Project PPTA – Final Report – Vol. 10
39
A. WD-CONNECTED HOUSEHOLDS Table G29. Percentage of WD-connected Households by Reason for Water Connection
by Household Headship: 5 Selected Water Districts
Reason for Water Connection HH Headship
Total
Male-headed HHs
Female-headed HHs
LEGAZPI Convenience 93.6% 91.2% 93.0% Health safeguard against water-borne diseases 21.7% 26.3% 22.9% Reliability of water supply 26.8% 28.1% 27.1% Status symbol (lifestyle) 0.6% 0.0% 0.5% Inadequacy of other sources 5.1% 10.5% 6.5% Cheaper 0.6% 1.8% 0.9%
LA UNION
Convenience 83.3% 82.4% 82.9% Health safeguard against water-borne diseases 25.0% 23.5% 24.4% Reliability of water supply 25.0% 11.8% 19.5% Status symbol (lifestyle) 0.0% 5.9% 2.4% Inadequacy of other sources 20.8% 17.6% 19.5% Cheaper 4.2% 5.9% 4.9%
LEYTE
Convenience 96.8% 96.4% 96.7% Health safeguard against water-borne diseases 28.7% 21.4% 27.0% Reliability of water supply 31.9% 28.6% 31.1% Status symbol (lifestyle) 1.1% 3.6% 1.6% Inadequacy of other sources 5.3% 3.6% 4.9% Cheaper 14.9% 10.7% 13.9%
QUEZON
Convenience 93.8% 92.8% 93.4% Health safeguard against water-borne diseases 11.9% 18.6% 14.2% Reliability of water supply 16.9% 18.6% 17.5% Status symbol (lifestyle) 0.0% 0.0% 0.0% Inadequacy of other sources 6.2% 8.2% 6.9% Cheaper 1.7% 4.1% 2.6%
KORONADAL
Convenience 86.8% 94.7% 88.9% Health safeguard against water-borne diseases 24.5% 31.6% 26.4% Reliability of water supply 9.4% 5.3% 8.3% Status symbol (lifestyle) 0.0% 5.3% 1.4% Inadequacy of other sources 0.0% 0.0% 0.0% Cheaper 3.8% 0.0% 2.8%

Supplementary Appendix H
TA No. 7122-PHI: Water District Development Sector Project PPTA – Final Report – Vol. 10
40
Table G30A. Percentage of WD-connected Households Providing Water to
Neighbor/Relatives by Household Headship: LEGAZPI
Indicators HH Headship Total
Male-headed HHs
Female-headed HHs
Percentage of WD-connected Households providing water to neighbor/ relatives
11.5% 12.3% 11.7%
N Cases 157 57 214
Number of other households/families using water from the household’s piped water
1 household/family 60.0% 66.7% 62.5%
2 households/families 30.0% 33.3% 31.3%
3 households/families 0.0% 0.0% 0.0%
4 households/families 10.0% 0.0% 6.3%
5 or more households/ families 0.0% 0.0% 0.0%
N Cases 10 6 16 Household is being charged by WD at:
Residential rate 98.1% 96.5% 97.7% Commercial rate 1.9% 3.5% 2.3%
N Cases 156 57 213

Supplementary Appendix H
TA No. 7122-PHI: Water District Development Sector Project PPTA – Final Report – Vol. 10
41
Table G30B. Percentage of WD-connected Households Providing Water to
Neighbor/Relatives by Household Headship: LA UNION
Indicators HH Headship Total
Male-headed HHs
Female-headed HHs
Percentage of WD-connected Households providing water to neighbor/ relatives
29.2% 11.8% 22.0%
N Cases 24 17 41
Number of other households/families using water from the household’s piped water
1 household/family 33.3% 100.0% 42.9%
2 households/families 33.3% 0.0% 28.6%
3 households/families 33.3% 0.0% 28.6%
4 households/families 0.0% 0.0% 0.0% 5 or more households/ families 0.0% 0.0% 0.0%
N Cases 6 1 7
Household is being charged by WD at:
Residential rate 95.8% 94.1% 95.1% Commercial rate 4.2% 5.9% 4.9%
N Cases 24 17 41

Supplementary Appendix H
TA No. 7122-PHI: Water District Development Sector Project PPTA – Final Report – Vol. 10
42
Table G30C. Percentage of WD-connected Households Providing Water to
Neighbor/Relatives by Household Headship: LEYTE
Indicators HH Headship Total
Male-headed HHs
Female-headed HHs
Percentage of WD-connected Households providing water to neighbor/ relatives
23.4% 21.4% 23.0%
N Cases 94 28 122
Number of other households/families using water from the household’s piped water
1 household/family 31.8% 16.7% 28.6%
2 households/families 9.1% 16.7% 10.7%
3 households/families 22.7% 0.0% 17.9%
4 households/families 0.0% 33.3% 7.1%
5 or more households/ families 36.4% 33.3% 35.7%
N Cases 22 6 28 Household is being charged by WD at:
Residential rate 92.5% 92.6% 92.5% Commercial rate 7.5% 7.4% 7.5%
N Cases 93 27 120

Supplementary Appendix H
TA No. 7122-PHI: Water District Development Sector Project PPTA – Final Report – Vol. 10
43
Table G30D. Percentage of WD-connected Households Providing Water to
Neighbor/Relatives by Household Headship: QUEZON
Indicators HH Headship Total
Male-headed HHs
Female-headed HHs
Percentage of WD-connected Households providing water to neighbor/ relatives
9.0% 8.2% 8.8%
N Cases 177 97 274
Number of other households/families using water from the household’s piped water
1 household/family 76.9% 57.1% 70.0%
2 households/families 15.4% 0.0% 10.0%
3 households/families 7.7% 0.0% 5.0%
4 households/families 0.0% 14.3% 5.0%
5 or more households/ families 0.0% 28.6% 10.0%
N Cases 13 7 20 Household is being charged by WD at:
Residential rate 94.8% 94.8% 94.8% Commercial rate 5.2% 5.2% 5.2%
N Cases 173 96 269

Supplementary Appendix H
TA No. 7122-PHI: Water District Development Sector Project PPTA – Final Report – Vol. 10
44
Table G30E. Percentage of WD-connected Households Providing Water to
Neighbor/Relatives by Household Headship: KORONADAL
Indicators HH Headship Total
Male-headed HHs
Female-headed HHs
Percentage of WD-connected Households providing water to neighbor/ relatives
13.2% 15.8% 13.9%
N Cases 53 19 72
Number of other households/families using water from the household’s piped water
1 household/family 85.7% 66.7% 80.0%
2 households/families 0.0% 0.0% 0.0%
3 households/families 14.3% 33.3% 20.0%
4 households/families 0.0% 0.0% 0.0%
5 or more households/ families 0.0% 0.0% 0.0%
N Cases 7 3 10 Household is being charged by WD at:
Residential rate 96.2% 100.0% 97.2% Commercial rate 3.8% .0% 2.8%
N Cases 53 19 72

Supplementary Appendix H
TA No. 7122-PHI: Water District Development Sector Project PPTA – Final Report – Vol. 10
45
Table G31. Proportion of WD-connected Households with at least One Member who Suffered from Water-related Diseases Last Year Due to Consumption of Water Supplied by the Water District by Household Headship: 5 Selected Water Districts
Indicators HH Headship
Total
Male-headed HHs
Female-headed HHs
LEGAZPI Percent of WD-connected Households with at least one member who suffered from water-related diseases last year due to consumption of water supplied by the water district
11.5% 15.8% 12.6%
N Cases 157 57 214
Percent of WD-connected Households that treat water from faucet before drinking 17.9% 19.3% 18.3%
N Cases 156 57 213 LA UNION Percent of WD-connected Households with at least one member who suffered from water-related diseases last year due to consumption of water supplied by the water district
12.5% 5.9% 9.8%
N Cases 24 17 41
Percent of WD-connected Households that treat water from faucet before drinking 4.2% 11.8% 7.3%
N Cases 24 17 41
LEYTE Percent of WD-connected Households with at least one member who suffered from water-related diseases last year due to consumption of water supplied by the water district
5.3% 0.0% 4.1%
N Cases 94 28 122
Percent of WD-connected Households that treat water from faucet before drinking 13.2% 7.1% 11.8%
N Cases 91 28 119
QUEZON Percent of WD-connected Households with at least one member who suffered from water-related diseases last year due to consumption of water supplied by the water district
10.4% 8.5% 9.7%
N Cases 173 94 267
Percent of WD-connected Households that treat water from faucet before drinking 6.3% 5.2% 5.9%
N Cases 176 96 272
KORONADAL Percent of WD-connected Households with 3.8% 15.8% 7.0%

Supplementary Appendix H
TA No. 7122-PHI: Water District Development Sector Project PPTA – Final Report – Vol. 10
46
at least one member who suffered from water-related diseases last year due to consumption of water supplied by the water district
N Cases 52 19 71
Percent of WD-connected Households that treat water from faucet before drinking 3.8% 0.0% 2.8%
N Cases 52 19 71
Table G32A. Percentage of WD-connected Households by Observed Pressure and
Sufficiency of Piped Water and Use of Water Pump/Tank by Household Headship: LEGAZPI
Indicators HH Headship Total
Male-headed HHs
Female-headed HHs
Observed Pressure of Piped Water Very adequate 10.3% 8.8% 9.9% Adequate 82.1% 84.2% 82.6% Poor 7.7% 5.3% 7.0% Very poor 0.0% 1.8% 0.5%
N Cases 156 57 213 Percent of Households using water pump to increase the pressure 1.9% 0.0% 1.4%
N Cases 157 57 214 Percent of Households with water storage tank 3.2% 0.0% 2.3%
N Cases 157 57 214 Percent of Households receiving water from piped water connection that is sufficient for their basic domestic needs
61.8% 52.6% 59.3%
N Cases 157 57 214 Percent of Households willing to get additional water needs from the WD piped connection
86.4% 74.1% 82.6%
N Cases 59 27 86

Supplementary Appendix H
TA No. 7122-PHI: Water District Development Sector Project PPTA – Final Report – Vol. 10
47
Table G32B. Percentage of WD-connected Households by Observed Pressure and
Sufficiency of Piped Water and Use of Water Pump/Tank by Household Headship: LA UNION
Indicators HH Headship Total
Male-headed HHs
Female-headed HHs
Observed Pressure of Piped Water Very adequate 25.0% 17.6% 22.0% Adequate 62.5% 70.6% 65.9% Poor 8.3% 5.9% 7.3% Very poor 4.2% 5.9% 4.9%
N Cases 24 17 41 Percent of Households using water pump to increase the pressure
8.3% 0.0% 4.9%
N Cases 24 17 41 Percent of Households with water storage tank 8.3% 11.8% 9.8%
N Cases 24 17 41 Percent of Households receiving water from piped water connection that is sufficient for their basic domestic needs
83.3% 82.4% 82.9%
N Cases 24 17 41 Percent of Households willing to get additional water needs from the WD piped connection
40.0% 50.0% 42.9%
N Cases 5 2 7

Supplementary Appendix H
TA No. 7122-PHI: Water District Development Sector Project PPTA – Final Report – Vol. 10
48
Table G32C. Percentage of WD-connected Households by Observed Pressure and
Sufficiency of Piped Water and Use of Water Pump/Tank by Household Headship: LEYTE
Indicators HH Headship Total
Male-headed HHs
Female-headed HHs
Observed Pressure of Piped Water Very adequate 5.3% 3.6% 4.9% Adequate 67.0% 71.4% 68.0% Poor 24.5% 25.0% 24.6% Very poor 3.2% 0.0% 2.5%
N Cases 94 28 122 Percent of Households using water pump to increase the pressure
1.1% 0.0% 0.8%
N Cases 91 28 119 Percent of Households with water storage tank 0.0% 0.0% 0.0%
N Cases 94 28 122 Percent of Households receiving water from piped water connection that is sufficient for their basic domestic needs
84.9% 96.4% 87.6%
N Cases 93 28 121 Percent of Households willing to get additional water needs from the WD piped connection
54.5% 0.0% 50.0%
N Cases 11 1 12
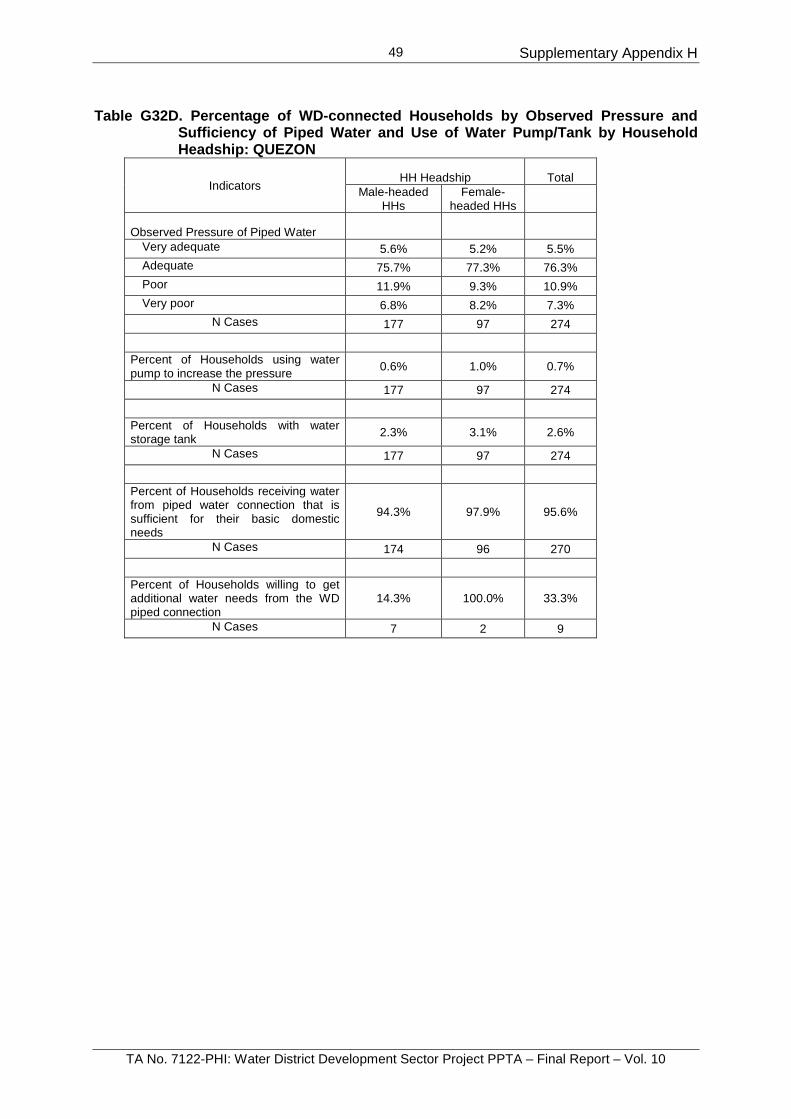
Supplementary Appendix H
TA No. 7122-PHI: Water District Development Sector Project PPTA – Final Report – Vol. 10
49
Table G32D. Percentage of WD-connected Households by Observed Pressure and
Sufficiency of Piped Water and Use of Water Pump/Tank by Household Headship: QUEZON
Indicators HH Headship Total
Male-headed HHs
Female-headed HHs
Observed Pressure of Piped Water Very adequate 5.6% 5.2% 5.5% Adequate 75.7% 77.3% 76.3% Poor 11.9% 9.3% 10.9% Very poor 6.8% 8.2% 7.3%
N Cases 177 97 274 Percent of Households using water pump to increase the pressure
0.6% 1.0% 0.7%
N Cases 177 97 274 Percent of Households with water storage tank 2.3% 3.1% 2.6%
N Cases 177 97 274 Percent of Households receiving water from piped water connection that is sufficient for their basic domestic needs
94.3% 97.9% 95.6%
N Cases 174 96 270 Percent of Households willing to get additional water needs from the WD piped connection
14.3% 100.0% 33.3%
N Cases 7 2 9

Supplementary Appendix H
TA No. 7122-PHI: Water District Development Sector Project PPTA – Final Report – Vol. 10
50
Table G32E. Percentage of WD-connected Households by Observed Pressure and
Sufficiency of Piped Water and Use of Water Pump/Tank by Household Headship: KORONADAL
Indicators HH Headship Total
Male-headed HHs
Female-headed HHs
Observed Pressure of Piped Water Very adequate 26.4% 26.3% 26.4% Adequate 71.7% 73.7% 72.2% Poor 1.9% 0.0% 1.4% Very poor 0.0% 0.0% 0.0%
N Cases 53 19 72 Percent of Households using water pump to increase the pressure
1.9% 0.0% 1.4%
N Cases 53 19 72 Percent of Households with water storage tank 1.9% 0.0% 1.4%
N Cases 53 19 72 Percent of Households receiving water from piped water connection that is sufficient for their basic domestic needs
81.1% 84.2% 81.9%
N Cases 53 19 72 Percent of Households willing to get additional water needs from the WD piped connection
100.0% 66.7% 91.7%
N Cases 9 3 12

Supplementary Appendix H
TA No. 7122-PHI: Water District Development Sector Project PPTA – Final Report – Vol. 10
51
Table G33. Amount of Monthly Water Bill that WD-connected Households are Willing
to Pay to Access Improved Water Supply Services by Household Headship: 5 Selected Water Districts
Water District/ Amount Willing to Pay to Access Improved Water Supply
Services
HH Headship Total
Male-headed
HHs Female-
headed HHs LEGAZPI
P1,000/month 4.5% 3.5% 4.2% P 900/month 0.6% 0.0% 0.5% P 800/month 2.5% 0.0% 1.9%
P 700/month 1.9% 1.8% 1.9%
P 600/month 1.3% 1.8% 1.4%
P 500/month 6.4% 7.0% 6.5%
P 450/month 0.0% 0.0% 0.0% P 400/month 4.5% 5.3% 4.7%
P 350/month 1.3% 1.8% 1.4%
P 300/month 12.1% 24.6% 15.4%
P 250/month 8.9% 10.5% 9.3%
P 200/month 24.8% 24.6% 24.8%
P150/month 31.8% 17.5% 28.0%
N Cases 157 57 214 LA UNION
P1,000/month 0.0% 0.0% 0.0% P 900/month 0.0% 0.0% 0.0% P 800/month 0.0% 0.0% 0.0% P 700/month 4.2% 0.0% 2.4%
P 600/month 4.2% 0.0% 2.4%
P 500/month 25.0% 0.0% 14.6%
P 450/month 4.2% 11.8% 7.3%
P 400/month 0.0% 0.0% 0.0% P 350/month 4.2% 5.9% 4.9%
P 300/month 8.3% 5.9% 7.3%
P 250/month 16.7% 17.6% 17.1%
P 200/month 12.5% 35.3% 22.0%
P150/month 20.8% 23.5% 22.0% N Cases 24 17 41 LEYTE
P1,000/month 0.0% 0.0% 0.0% P 900/month 2.1% 0.0% 1.6% P 800/month 0.0% 0.0% 0.0% P 700/month 0.0% 0.0% 0.0% P 600/month 1.1% 0.0% .8%
P 500/month 4.3% 7.1% 4.9%
P 450/month 1.1% 0.0% 0.8%
P 400/month 2.1% 0.0% 1.6%

Supplementary Appendix H
TA No. 7122-PHI: Water District Development Sector Project PPTA – Final Report – Vol. 10
52
P 350/month 2.1% 0.0% 1.6%
P 300/month 5.3% 7.1% 5.7%
P 250/month 2.1% 7.1% 3.3%
P 200/month 8.5% 17.9% 10.7%
P150/month 46.8% 35.7% 44.3%
N Cases 94 28 122
QUEZON
P1,000/month 6.8% 3.1% 5.5%
P 900/month 1.1% 1.0% 1.1%
P 800/month 4.0% 1.0% 2.9%
P 700/month 1.7% 1.0% 1.5%
P 600/month 4.0% 8.2% 5.5%
P 500/month 9.6% 9.3% 9.5%
P 450/month 0.6% 0.0% 0.4%
P 400/month 7.9% 3.1% 6.2%
P 350/month 4.5% 2.1% 3.6%
P 300/month 11.3% 11.3% 11.3%
P 250/month 12.4% 6.2% 10.2%
P 200/month 13.0% 19.6% 15.3%
P150/month 22.6% 34.0% 26.6%
N Cases 177 97 274 KORONADAL
P1,000/month 5.7% 0.0% 4.2% P 900/month 0.0% 0.0% 0.0% P 800/month 0.0% 5.3% 1.4%
P 700/month 0.0% 0.0% 0.0% P 600/month 1.9% 0.0% 1.4%
P 500/month 15.1% 15.8% 15.3%
P 450/month 0.0% 5.3% 1.4%
P 400/month 3.8% 5.3% 4.2%
P 350/month 1.9% 5.3% 2.8%
P 300/month 7.5% 5.3% 6.9%
P 250/month 15.1% 10.5% 13.9%
P 200/month 20.8% 5.3% 16.7%
P150/month 26.4% 42.1% 30.6%
N Cases 53 19 72

Supplementary Appendix H
TA No. 7122-PHI: Water District Development Sector Project PPTA – Final Report – Vol. 10
53
Table G34. Percentage of WD-connected Households by Preferred Aspect of Water
District Services Prioritized for Improvement by Household Headship: 5 Selected Water Districts
Water District/ Number of Households
HH Headship Total Male-headed
HHs Female-
headed HHs LEGAZPI
Water pressure 6.4% 7.0% 6.5% Billing 1.3% 0.0% 0.9% Complaints handling 9.6% 8.8% 9.3% Reduced water rates 33.1% 24.6% 30.8% Repairs 7.0% 5.3% 6.5% Others 42.7% 54.4% 45.8%
LA UNION
Water pressure 16.7% 17.6% 17.1% Billing 4.2% 5.9% 4.9% Complaints handling 12.5% 0.0% 7.3% Reduced water rates 29.2% 11.8% 22.0% Repairs 0.0% 0.0% 0.0% Others 37.5% 64.7% 48.8%
LEYTE
Water pressure 44.4% 40.7% 43.6% Billing 1.1% 7.4% 2.6% Complaints handling 6.7% 7.4% 6.8% Reduced water rates 17.8% 25.9% 19.7% Repairs 2.2% 3.7% 2.6% Others 27.8% 14.8% 24.8%
QUEZON
Water pressure 35.3% 40.4% 37.1% Billing 15.6% 14.9% 15.4% Complaints handling 5.2% 8.5% 6.4% Reduced water rates 14.5% 5.3% 11.2% Repairs 2.9% 5.3% 3.7% Others 26.6% 25.5% 26.2%
KORONADAL
Water pressure 1.9% 5.3% 2.8% Billing 1.9% 0.0% 1.4% Complaints handling 13.2% 5.3% 11.1% Reduced water rates 18.9% 26.3% 20.8% Repairs 3.8% 0.0% 2.8% Others 60.4% 63.2% 61.1%

Supplementary Appendix H
TA No. 7122-PHI: Water District Development Sector Project PPTA – Final Report – Vol. 10
54
B. NON-CONNECTED HOUSEHOLDS
Table G35a. Percentage of Non-connected Households by Source of Water for Various Uses by Household Headship: 5 Selected Water Districts (FOR DRINKING)
Water District/Source of Water for various Uses
HH Headship Total Male-headed
HHs Female-
headed HHs A. For Drinking
LEGAZPI
Piped water (not own connection) 29.5% 26.2% 28.7% Public faucet/ hydrant 0.0% 2.4% 0.6% Deep well 0.8% 7.1% 2.3% Shallow well 49.6% 50.0% 49.7% Spring/River/Stream/Pond 2.3% 2.4% 2.3% Water vendors & peddlers 10.1% 9.5% 9.9% Open dug well 3.1% 0.0% 2.3% BRAWASA Connection 4.7% 2.4% 4.1%
N Cases 129 42 171
LA UNION
Piped water (not own connection) 5.3% 5.3% 5.3% Public faucet/ hydrant 0.4% 2.1% 0.9% Deep well 4.5% 1.1% 3.5% Shallow well 47.8% 40.4% 45.7% Spring/River/Stream/Pond 0.4% 0.0% 0.3% Water vendors & peddlers 41.3% 51.1% 44.0% Open dug well 0.4% 0.0% 0.3% BRAWASA Connection 0.0% 0.0% 0.0%
N Cases 247 94 341
LEYTE
Piped water (not own connection) 62.1% 61.1% 62.0% Public faucet/ hydrant 17.6% 11.1% 16.7% Deep well 0.4% 0.0% 0.4% Shallow well 11.5% 11.1% 11.4% Spring/River/Stream/Pond 0.0% 0.0% 0.0% Water vendors & peddlers 7.5% 13.9% 8.4% Open dug well 0.9% 2.8% 1.1% BRAWASA Connection 0.0% 0.0% 0.0%
N Cases 227 36 263

Supplementary Appendix H
TA No. 7122-PHI: Water District Development Sector Project PPTA – Final Report – Vol. 10
55
Table G35a. Percentage of Non-connected Households by Source of Water for various Uses Household Headship: 5 Selected Water Districts (FOR DRINKING - CONTINUATION)
Water District/Source of Water for various Uses
HH Headship Total Male-headed
HHs Female-
headed HHs
QUEZON
Piped water (not own connection) 58.8% 51.5% 56.6% Public faucet/ hydrant 12.5% 18.2% 14.2% Deep well 0.0% 0.0% 0.0% Shallow well 6.3% 6.1% 6.2% Spring/River/Stream/Pond 7.5% 0.0% 5.3% Water vendors & peddlers 15.0% 24.2% 17.7% Open dug well 0.0% 0.0% 0.0% BRAWASA Connection 0.0% 0.0% 0.0%
N Cases 80 33 113
KORONADAL
Piped water (not own connection) 3.0% 5.6% 3.4% Public faucet/ hydrant 4.1% 1.9% 3.8% Deep well 30.8% 31.5% 30.9% Shallow well 40.6% 40.7% 40.6% Spring/River/Stream/Pond 2.6% 1.9% 2.5% Water vendors & peddlers 18.4% 18.5% 18.4% Open dug well 0.4% 0.0% 0.3% BRAWASA Connection 0.0% 0.0% 0.0%
N Cases 266 54 320

Supplementary Appendix H
TA No. 7122-PHI: Water District Development Sector Project PPTA – Final Report – Vol. 10
56
Table G35b. Percentage of Non-connected Households by Source of Water for various Uses Household Headship: 5 Selected Water Districts (FOR COOKING)
Water District/Source of Water for various Uses
HH Headship Total Male-headed
HHs Female-
headed HHs For Cooking LEGAZPI
Piped water (not own connection) 27.1% 26.2% 26.9% Public faucet/ hydrant 0.0% 4.8% 1.2% Deep well 0.8% 4.8% 1.8% Shallow well 62.8% 57.1% 61.4% Spring/River/Stream/Pond 2.3% 4.8% 2.9% Water vendors & peddlers 0.0% 0.0% 0.0% Open dug well 2.3% 0.0% 1.8% BRAWASA Connection 4.7% 2.4% 4.1%
N Cases 129 42 171
LA UNION
Piped water (not own connection) 6.9% 5.4% 6.5% Public faucet/ hydrant 0.8% 4.3% 1.8% Deep well 7.3% 5.4% 6.8% Shallow well 79.8% 76.3% 78.8% Spring/River/Stream/Pond 0.4% 0.0% 0.3% Water vendors & peddlers 3.6% 8.6% 5.0% Open dug well 1.2% 0.0% 0.9% BRAWASA Connection 0.0% 0.0% 0.0%
N Cases 247 93 340
LEYTE
Piped water (not own connection) 57.1% 69.4% 58.8% Public faucet/ hydrant 16.8% 13.9% 16.4% Deep well 0.9% 0.0% 0.8% Shallow well 21.2% 11.1% 19.8% Spring/River/Stream/Pond 0.0% 0.0% 0.0% Water vendors & peddlers 3.1% 2.8% 3.1% Open dug well 0.9% 2.8% 1.1% BRAWASA Connection 0.0% 0.0% 0.0%
N Cases 226 36 262

Supplementary Appendix H
TA No. 7122-PHI: Water District Development Sector Project PPTA – Final Report – Vol. 10
57
Table G35b. Percentage of Non-connected Households by Source of Water for various Uses Household Headship: 5 Selected Water Districts (FOR COOKING - CONTINUATION)
Water District/Source of Water for various Uses
HH Headship Total Male-headed
HHs Female-
headed HHs
QUEZON
Piped water (not own connection) 60.0% 54.5% 58.4% Public faucet/ hydrant 13.8% 18.2% 15.0% Deep well 1.3% 0.0% 0.9% Shallow well 12.5% 12.1% 12.4% Spring/River/Stream/Pond 7.5% 3.0% 6.2% Water vendors & peddlers 5.0% 12.1% 7.1% Open dug well 0.0% 0.0% 0.0% BRAWASA Connection 0.0% 0.0% 0.0%
N Cases 80 33 113
KORONADAL
Piped water (not own connection) 3.4% 5.6% 3.7% Public faucet/ hydrant 4.1% 0.0% 3.4% Deep well 34.1% 38.9% 34.9% Shallow well 52.1% 51.9% 52.0% Spring/River/Stream/Pond 4.1% 1.9% 3.7% Water vendors & peddlers 1.1% 1.9% 1.2% Open dug well 1.1% 0.0% 0.9% BRAWASA Connection 0.0% 0.0% 0.0%
N Cases 267 54 321

Supplementary Appendix H
TA No. 7122-PHI: Water District Development Sector Project PPTA – Final Report – Vol. 10
58
Table G35c. Percentage of Non-connected Households by Source of Water for various Uses Household Headship: 5 Selected Water Districts (FOR BATHING)
Water District/Source of Water for various Uses
HH Headship Total Male-headed
HHs Female-
headed HHs For bathing LEGAZPI
Piped water (not own connection) 10.9% 9.5% 10.5% Public faucet/ hydrant 0.0% 4.8% 1.2% Deep well 1.6% 4.8% 2.3% Shallow well 67.4% 61.9% 66.1% Spring/River/Stream/Pond 6.2% 7.1% 6.4% Water vendors & peddlers 0.0% 0.0% 0.0% Open dug well 9.3% 9.5% 9.4% BRAWASA Connection 4.7% 2.4% 4.1%
N Cases 129 42 171
LA UNION
Piped water (not own connection) 5.6% 5.3% 5.6% Public faucet/ hydrant 0.8% 3.2% 1.5% Deep well 8.1% 8.5% 8.2% Shallow well 82.7% 80.9% 82.2% Spring/River/Stream/Pond 0.8% 0.0% 0.6% Water vendors & peddlers 0.4% 2.1% 0.9% Open dug well 1.6% 0.0% 1.2% BRAWASA Connection 0.0% 0.0% 0.0%
N Cases 248 94 342
LEYTE
Piped water (not own connection) 21.1% 20.0% 21.0% Public faucet/ hydrant 7.5% 2.9% 6.9% Deep well 0.9% 0.0% 0.8% Shallow well 66.5% 77.1% 67.9% Spring/River/Stream/Pond 0.0% 0.0% 0.0% Water vendors & peddlers 0.0% 0.0% 0.0% Open dug well 4.0% 0.0% 3.4% BRAWASA Connection 0.0% 0.0% 0.0%
N Cases 227 35 262

Supplementary Appendix H
TA No. 7122-PHI: Water District Development Sector Project PPTA – Final Report – Vol. 10
59
Table G35c. Percentage of Non-connected Households by Source of Water for various Uses Household Headship: 5 Selected Water Districts (FOR BATHING - CONTINUATION)
Water District/Source of Water for various Uses
HH Headship Total Male-headed
HHs Female-
headed HHs
QUEZON
Piped water (not own connection) 55.0% 51.5% 54.0% Public faucet/ hydrant 13.8% 18.2% 15.0% Deep well 2.5% 0.0% 1.8% Shallow well 18.8% 27.3% 21.2% Spring/River/Stream/Pond 8.8% 3.0% 7.1% Water vendors & peddlers 1.3% 0.0% 0.9% Open dug well 0.0% 0.0% 0.0% BRAWASA Connection 0.0% 0.0% 0.0%
N Cases 80 33 113
KORONADAL
Piped water (not own connection) 2.3% 5.6% 2.8% Public faucet/ hydrant 3.8% 0.0% 3.1% Deep well 33.1% 40.7% 34.4% Shallow well 56.0% 50.0% 55.0% Spring/River/Stream/Pond 4.1% 1.9% 3.7% Water vendors & peddlers 0.4% 1.9% 0.6% Open dug well 0.4% 0.0% 0.3% BRAWASA Connection 0.0% 0.0% 0.0%
N Cases 266 54 320

Supplementary Appendix H
TA No. 7122-PHI: Water District Development Sector Project PPTA – Final Report – Vol. 10
60
Table G35d. Percentage of Non-connected Households by Source of Water for various Uses Household Headship: 5 Selected Water Districts (FOR GARDENING)
Water District/Source of Water for various Uses
HH Headship Total Male-headed
HHs Female-
headed HHs For gardening LEGAZPI
Piped water (not own connection) 11.2% 3.8% 9.6% Public faucet/ hydrant 0.0% 3.8% 0.9% Deep well 2.2% 7.7% 3.5% Shallow well 64.0% 69.2% 65.2% Spring/River/Stream/Pond 7.8% 3.8% 6.9% Water vendors & peddlers 0.0% 0.0% 0.0% Open dug well 7.9% 7.7% 7.8% BRAWASA Connection 6.7% 3.8% 6.1%
N Cases 89 26 115
LA UNION
Piped water (not own connection) 2.4% 4.8% 3.1% Public faucet/ hydrant 1.0% 3.6% 1.7% Deep well 9.2% 9.6% 9.3% Shallow well 85.5% 78.3% 83.4% Spring/River/Stream/Pond 0.5% 1.2% 0.7% Water vendors & peddlers 0.5% 2.4% 1.0% Open dug well 1.0% 0.0% 0.7% BRAWASA Connection 0.0% 0.0% 0.0%
N Cases 207 83 290
LEYTE
Piped water (not own connection) 6.3% 4.8% 6.1% Public faucet/ hydrant 3.1% 0.0% 2.7% Deep well 2.4% 0.0% 2.0% Shallow well 81.1% 95.2% 83.1% Spring/River/Stream/Pond 1.6% 0.0% 1.4% Water vendors & peddlers 0.0% 0.0% 0.0% Open dug well 5.5% 0.0% 4.7% BRAWASA Connection 0.0% 0.0% 0.0%
N Cases 127 21 148

Supplementary Appendix H
TA No. 7122-PHI: Water District Development Sector Project PPTA – Final Report – Vol. 10
61
Table G35d. Percentage of Non-connected Households by Source of Water for various Uses Household Headship: 5 Selected Water Districts (FOR GARDENING - CONTINUATION)
Water District/Source of Water for various Uses
HH Headship Total Male-headed
HHs Female-
headed HHs
QUEZON
Piped water (not own connection) 56.8% 64.3% 58.6% Public faucet/ hydrant 15.9% 7.1% 13.8% Deep well 2.3% 0.0% 1.7% Shallow well 11.4% 21.4% 13.8% Spring/River/Stream/Pond 13.7% 7.1% 12.0% Water vendors & peddlers 0.0% 0.0% 0.0% Open dug well 0.0% 0.0% 0.0% BRAWASA Connection 0.0% 0.0% 0.0%
N Cases 44 14 58
KORONADAL
Piped water (not own connection) 0.8% 2.0% 1.0% Public faucet/ hydrant 3.3% 0.0% 2.8% Deep well 31.0% 38.8% 32.3% Shallow well 58.6% 51.0% 57.3% Spring/River/Stream/Pond 5.0% 2.0% 4.5% Water vendors & peddlers 0.4% 0.0% 0.3% Open dug well 0.8% 6.1% 1.7% BRAWASA Connection 0.0% 0.0% 0.0%
N Cases 239 49 288
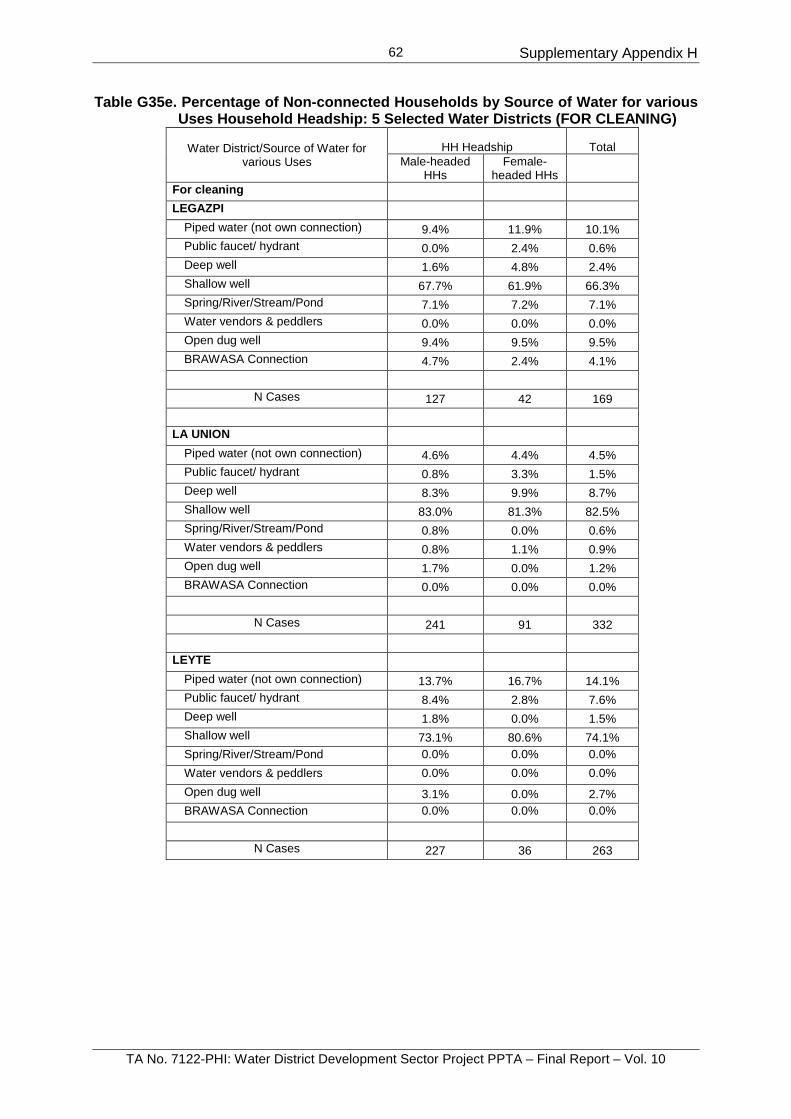
Supplementary Appendix H
TA No. 7122-PHI: Water District Development Sector Project PPTA – Final Report – Vol. 10
62
Table G35e. Percentage of Non-connected Households by Source of Water for various Uses Household Headship: 5 Selected Water Districts (FOR CLEANING)
Water District/Source of Water for various Uses
HH Headship Total Male-headed
HHs Female-
headed HHs For cleaning LEGAZPI
Piped water (not own connection) 9.4% 11.9% 10.1% Public faucet/ hydrant 0.0% 2.4% 0.6% Deep well 1.6% 4.8% 2.4% Shallow well 67.7% 61.9% 66.3% Spring/River/Stream/Pond 7.1% 7.2% 7.1% Water vendors & peddlers 0.0% 0.0% 0.0% Open dug well 9.4% 9.5% 9.5% BRAWASA Connection 4.7% 2.4% 4.1%
N Cases 127 42 169
LA UNION
Piped water (not own connection) 4.6% 4.4% 4.5% Public faucet/ hydrant 0.8% 3.3% 1.5% Deep well 8.3% 9.9% 8.7% Shallow well 83.0% 81.3% 82.5% Spring/River/Stream/Pond 0.8% 0.0% 0.6% Water vendors & peddlers 0.8% 1.1% 0.9% Open dug well 1.7% 0.0% 1.2% BRAWASA Connection 0.0% 0.0% 0.0%
N Cases 241 91 332
LEYTE
Piped water (not own connection) 13.7% 16.7% 14.1% Public faucet/ hydrant 8.4% 2.8% 7.6% Deep well 1.8% 0.0% 1.5% Shallow well 73.1% 80.6% 74.1% Spring/River/Stream/Pond 0.0% 0.0% 0.0% Water vendors & peddlers 0.0% 0.0% 0.0% Open dug well 3.1% 0.0% 2.7% BRAWASA Connection 0.0% 0.0% 0.0%
N Cases 227 36 263
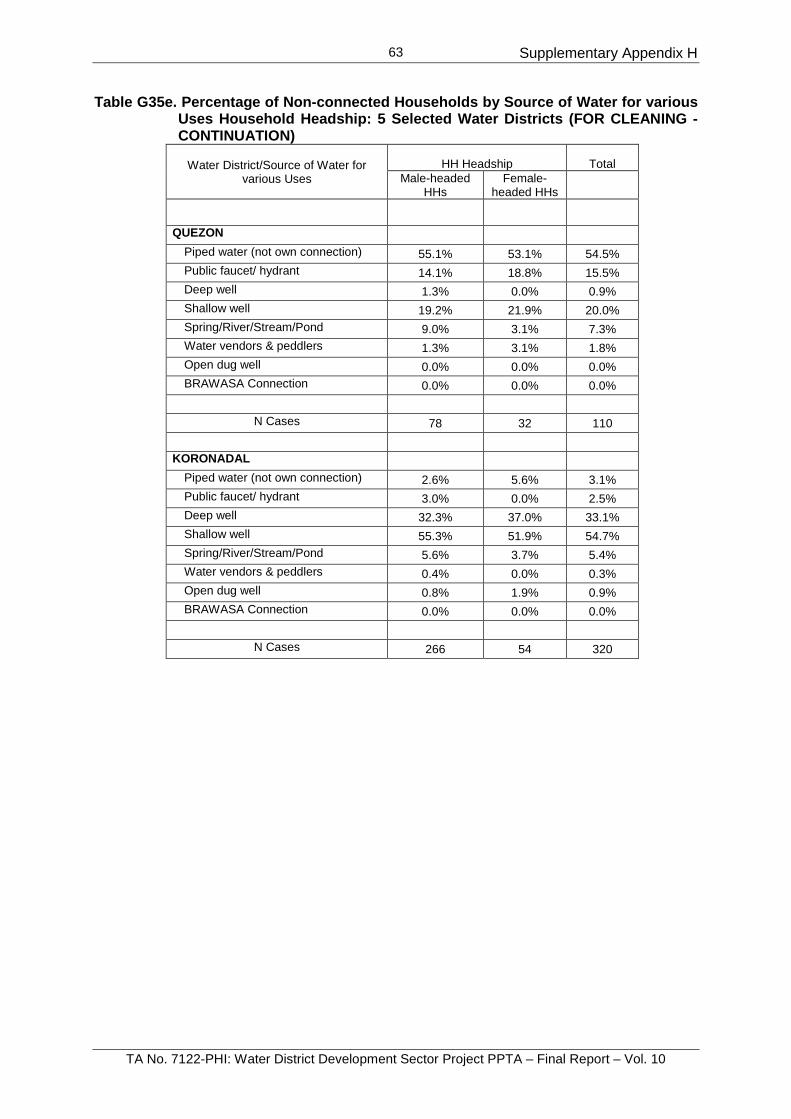
Supplementary Appendix H
TA No. 7122-PHI: Water District Development Sector Project PPTA – Final Report – Vol. 10
63
Table G35e. Percentage of Non-connected Households by Source of Water for various Uses Household Headship: 5 Selected Water Districts (FOR CLEANING - CONTINUATION)
Water District/Source of Water for various Uses
HH Headship Total Male-headed
HHs Female-
headed HHs
QUEZON
Piped water (not own connection) 55.1% 53.1% 54.5% Public faucet/ hydrant 14.1% 18.8% 15.5% Deep well 1.3% 0.0% 0.9% Shallow well 19.2% 21.9% 20.0% Spring/River/Stream/Pond 9.0% 3.1% 7.3% Water vendors & peddlers 1.3% 3.1% 1.8% Open dug well 0.0% 0.0% 0.0% BRAWASA Connection 0.0% 0.0% 0.0%
N Cases 78 32 110
KORONADAL
Piped water (not own connection) 2.6% 5.6% 3.1% Public faucet/ hydrant 3.0% 0.0% 2.5% Deep well 32.3% 37.0% 33.1% Shallow well 55.3% 51.9% 54.7% Spring/River/Stream/Pond 5.6% 3.7% 5.4% Water vendors & peddlers 0.4% 0.0% 0.3% Open dug well 0.8% 1.9% 0.9% BRAWASA Connection 0.0% 0.0% 0.0%
N Cases 266 54 320

Supplementary Appendix H
TA No. 7122-PHI: Water District Development Sector Project PPTA – Final Report – Vol. 10
64
Table G36. Percentage of Non-connected Households by Reason for Not Being Connected to Water District by Household Headship: 5 Selected Water Districts
Water District/ Reason for Not Being Connected to Water District
HH Headship Total Male-headed
HHs Female-
headed HHs
LEGAZPI
Connection is not available 7.0% 4.8% 6.4%
Connection fee too high 51.2% 42.9% 49.1% Present water source is adequate & satisfactory
32.6% 33.3% 32.7%
Monthly charges too high 25.6% 23.8% 25.1%
House is being rented 5.4% 7.1% 5.8%
Disconnected 6.2% 7.1% 6.4% WD piped water not safe/clean 5.4% 2.4% 4.7%
Waiting list for connection 1.6% 2.4% 1.8%
N Cases 129 42 171
LA UNION
Connection is not available 55.2% 53.2% 54.7%
Connection fee too high 19.4% 14.9% 18.1% Present water source is adequate & satisfactory 15.7% 12.8% 14.9%
Monthly charges too high 11.3% 8.5% 10.5%
House is being rented 2.8% 2.1% 2.6%
Disconnected 5.6% 10.6% 7.0% WD piped water not safe/clean 4.0% 4.3% 4.1%
Waiting list for connection 1.2% 1.1% 1.2%
N Cases 248 94 342
LEYTE
Connection is not available 36.6% 38.9% 36.9%
Connection fee too high 42.7% 33.3% 41.4% Present water source is adequate & satisfactory 4.4% 5.6% 4.6%
Monthly charges too high 22.5% 30.6% 23.6%
House is being rented 18.1% 13.9% 17.5%
Disconnected 5.3% 13.9% 6.5% WD piped water not safe/clean 2.6% 2.8% 2.7%
Waiting list for connection 4.8% 2.8% 4.6%
N Cases 227 36 263
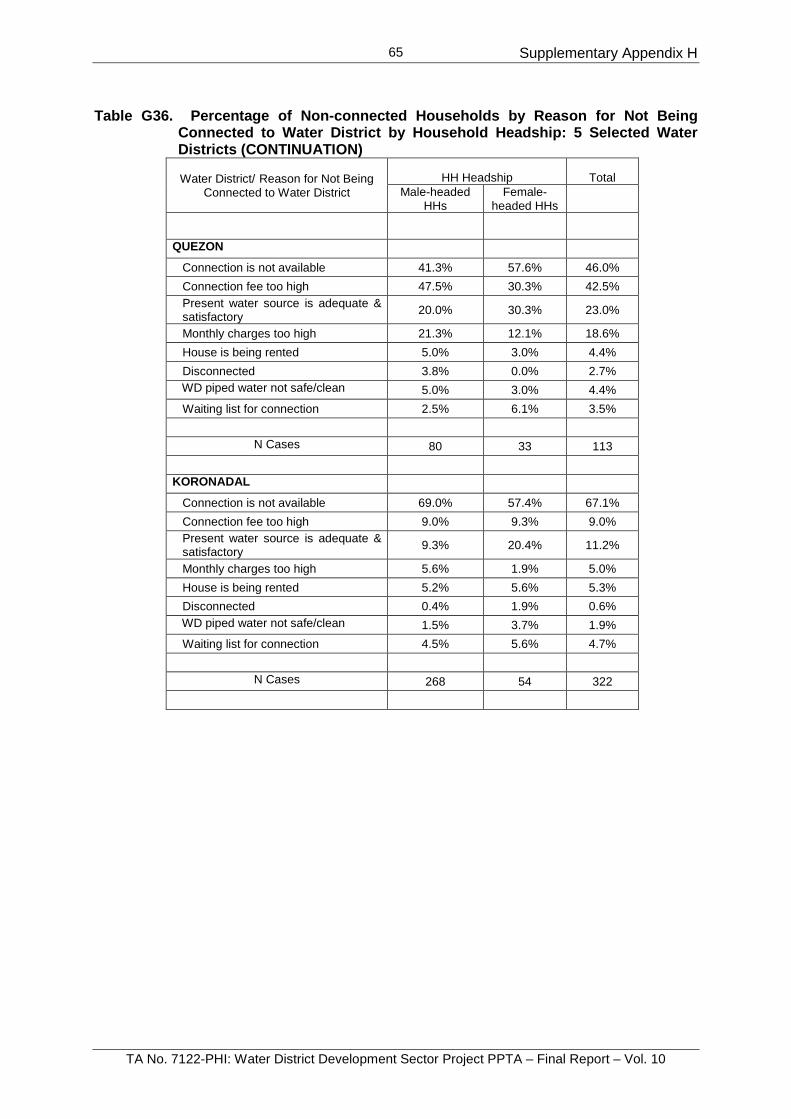
Supplementary Appendix H
TA No. 7122-PHI: Water District Development Sector Project PPTA – Final Report – Vol. 10
65
Table G36. Percentage of Non-connected Households by Reason for Not Being
Connected to Water District by Household Headship: 5 Selected Water Districts (CONTINUATION)
Water District/ Reason for Not Being Connected to Water District
HH Headship Total Male-headed
HHs Female-
headed HHs
QUEZON
Connection is not available 41.3% 57.6% 46.0%
Connection fee too high 47.5% 30.3% 42.5% Present water source is adequate & satisfactory 20.0% 30.3% 23.0%
Monthly charges too high 21.3% 12.1% 18.6%
House is being rented 5.0% 3.0% 4.4%
Disconnected 3.8% 0.0% 2.7% WD piped water not safe/clean 5.0% 3.0% 4.4%
Waiting list for connection 2.5% 6.1% 3.5%
N Cases 80 33 113
KORONADAL
Connection is not available 69.0% 57.4% 67.1%
Connection fee too high 9.0% 9.3% 9.0% Present water source is adequate & satisfactory 9.3% 20.4% 11.2%
Monthly charges too high 5.6% 1.9% 5.0%
House is being rented 5.2% 5.6% 5.3%
Disconnected 0.4% 1.9% 0.6% WD piped water not safe/clean 1.5% 3.7% 1.9%
Waiting list for connection 4.5% 5.6% 4.7%
N Cases 268 54 322

Supplementary Appendix H
TA No. 7122-PHI: Water District Development Sector Project PPTA – Final Report – Vol. 10
66
Table G37. Percentage of Non-connected Households by Observed Availability of Water Service in the Household and Ownership of Water Storage Tank by Household Headship: 5 Selected Water Districts
Water District HH Headship Total
Male-headed HHs
Female-headed HHs
LEGAZPI Observed availability of water service in the household
Sufficient all year round 89.9% 90.5% 90.1%
Insufficient during dry season 0.8% 2.4% 1.2%
Insufficient sometimes 7.8% 7.1% 7.6%
Insufficient mostly 0.0% 0.0% 0.0% No information 1.6% 0.0% 1.2%
N Cases 129 42 171
Percent of Non-connected Households with water storage tank 3.9% 7.1% 4.7%
N Cases 128 42 170
LA UNION Observed availability of water service in the household
Sufficient all year round 81.0% 87.2% 82.7%
Insufficient during dry season 14.5% 8.5% 12.9%
Insufficient sometimes 3.6% 2.1% 3.2%
Insufficient mostly 0.0% 0.0% 0.0% No information 0.8% 2.1% 1.2%
N Cases 248 94 342
Percent of Non-connected Households with water storage tank 12.6% 10.9% 12.1%
N Cases 247 92 339

Supplementary Appendix H
TA No. 7122-PHI: Water District Development Sector Project PPTA – Final Report – Vol. 10
67
Table G37. Percentage of Non-connected Households by Observed Availability of Water Service in the Household and Ownership of Water Storage Tank by Household Headship: 5 Selected Water Districts (CONTINUATION)
Water District HH Headship Total
Male-headed HHs
Female-headed HHs
LEYTE Observed availability of water service in the household
Sufficient all year round 60.8% 72.2% 62.4%
Insufficient during dry season 1.8% 0.0% 1.5%
Insufficient sometimes 23.8% 8.3% 21.7%
Insufficient mostly 12.8% 8.3% 12.2%
No information 0.9% 11.1% 2.3%
N Cases 227 36 263 Percent of Non-connected Households with water storage tank 0.4% 0.0% 0.4%
N Cases 225 36 261
QUEZON Observed availability of water service in the household
Sufficient all year round 87.5% 75.8% 84.1%
Insufficient during dry season 2.5% 6.1% 3.5%
Insufficient sometimes 8.8% 18.2% 11.5%
Insufficient mostly 0.0% 0.0% 0.0% No information 1.3% 0.0% 0.9%
N Cases 80 33 113
Percent of Non-connected Households with water storage tank 5.1% 6.1% 5.4%
N Cases 79 33 112

Supplementary Appendix H
TA No. 7122-PHI: Water District Development Sector Project PPTA – Final Report – Vol. 10
68
Table G37. Percentage of Non-connected Households by Observed Availability of
Water Service in the Household and Ownership of Water Storage Tank by Household Headship: 5 Selected Water Districts (CONTINUATION)
Water District HH Headship Total
Male-headed HHs
Female-headed HHs
KORONADAL Observed availability of water service in the household
Sufficient all year round 70.5% 75.9% 71.4%
Insufficient during dry season 0.0% 0.0% 0.0% Insufficient sometimes 23.9% 16.7% 22.7%
Insufficient mostly 3.7% 5.6% 4.0%
No information 1.9% 1.9% 1.9%
N Cases 268 54 322 Percent of Non-connected Households with water storage tank 8.6% 13.0% 9.3%
N Cases 267 54 321

Supplementary Appendix H
TA No. 7122-PHI: Water District Development Sector Project PPTA – Final Report – Vol. 10
69
Table G38. Percentage of Non-connected Households by Person Fetching Water from
Source by Household Headship: 5 Selected Water Districts
Water District/ Person Fetching Water from Source
HH Headship Total Male-headed
HHs Female-
headed HHs
LEGAZPI
Adult male household member(s) 61.1% 46.2% 57.2% Adult female household member(s) 11.5% 33.3% 17.1%
Children 4.4% 7.7% 5.3%
Anyone available 23.0% 12.8% 20.4%
N Cases 113 39 152 LA UNION
Adult male household member(s) 46.1% 33.3% 42.5% Adult female household member(s) 27.8% 48.4% 33.5%
Children 12.0% 8.6% 11.1%
Anyone available 14.1% 9.7% 12.9%
N Cases 241 93 334 LEYTE
Adult male household member(s) 44.1% 38.9% 43.3% Adult female household member(s) 10.9% 16.7% 11.8%
Children 24.8% 22.2% 24.4%
Anyone available 20.3% 22.2% 20.6%
N Cases 202 36 238
QUEZON Adult male household member(s) 39.2% 30.3% 36.6% Adult female household member(s) 19.0% 21.2% 19.6%
Children 13.9% 12.1% 13.4%
Anyone available 27.8% 36.4% 30.4%
N Cases 79 33 112
KORONADAL Adult male household member(s) 36.3% 13.2% 32.4% Adult female household member(s) 26.7% 15.1% 24.8%
Children 9.5% 30.2% 13.0%
Anyone available 27.5% 41.5% 29.8%
N Cases 262 53 315

Supplementary Appendix H
TA No. 7122-PHI: Water District Development Sector Project PPTA – Final Report – Vol. 10
70
Table G39. Percentage of Non-connected Households by Means of Transporting Water
from the Water Source by Household Headship: 5 Selected Water Districts
Water District/ Means of Transporting Water from the Water Source
HH Headship Total Male-headed
HHs Female-
headed HHs LEGAZPI
Water truck 0.0% 0.0% 0.0% Tricycle 0.0% 0.0% 0.0% Carry using pail/open containers 71.3% 71.8% 71.4% Carry using closed containers 13.9% 23.1% 16.2% Pipe or water hose connected to neighbor 8.7% 2.6% 7.1%
Carry using both closed & open containers 6.1% 2.6% 5.2%
Bicycle/Motorcycle 0.0% 0.0% 0.0% Own car/jeepney 0.0% 0.0% 0.0% Push cart 0.0% 0.0% 0.0%
N Cases 115 39 154
LA UNION Water truck 1.3% 2.2% 1.5% Tricycle 0.9% 1.1% 0.9% Carry using pail/open containers 84.8% 89.2% 86.1% Carry using closed containers 3.9% 1.1% 3.1% Pipe or water hose connected to neighbor 8.7% 6.5% 8.0%
Carry using both closed & open containers 0.0% 0.0% 0.0%
Bicycle/Motorcycle 0.0% 0.0% 0.0% Own car/jeepney 0.4% 0.0% 0.3% Push cart 0.0% 0.0% 0.0%
N Cases 230 93 323
LEYTE Water truck 1.0% 0.0% 0.9% Tricycle 6.1% 13.9% 7.3% Carry using pail/open containers 26.8% 27.8% 26.9% Carry using closed containers 54.5% 47.2% 53.4% Pipe or water hose connected to neighbor 1.0% 2.8% 1.3%
Carry using both closed & open containers 9.1% 8.3% 9.0%
Bicycle/Motorcycle 0.5% 0.0% 0.4% Own car/jeepney 0.5% 0.0% 0.4% Push cart 0.5% 0.0% 0.4%
N Cases 198 36 234

Supplementary Appendix H
TA No. 7122-PHI: Water District Development Sector Project PPTA – Final Report – Vol. 10
71
Table G39. Percentage of Non-connected Households by Means of Transporting
Water from the Water Source by Household Headship: 5 Selected Water Districts (CONTINUATION)
Water District/ Means of Transporting Water from the Water Source
HH Headship Total Male-headed
HHs Female-
headed HHs QUEZON
Water truck 7.8% 0.0% 5.6% Tricycle 5.2% 3.3% 4.7% Carry using pail/open containers 57.1% 66.7% 59.8% Carry using closed containers 3.9% 0.0% 2.8% Pipe or water hose connected to neighbor 26.0% 30.0% 27.1%
Carry using both closed & open containers 0.0% 0.0% 0.0%
Bicycle/Motorcycle 0.0% 0.0% 0.0% Own car/jeepney 0.0% 0.0% 0.0% Push cart 0.0% 0.0% 0.0%
N Cases 77 30 107
KORONADAL Water truck 0.8% 0.0% 0.6% Tricycle 1.9% 3.8% 2.2% Carry using pail/open containers 52.9% 55.8% 53.3% Carry using closed containers 19.0% 19.2% 19.0% Pipe or water hose connected to neighbor 5.7% 5.8% 5.7%
Carry using both closed & open containers 17.9% 13.5% 17.1%
Bicycle/Motorcycle 1.5% 1.9% 1.6% Own car/jeepney 0.4% 0.0% 0.3% Push cart 0.0% 0.0% 0.0%
N Cases 263 52 315

Supplementary Appendix H
TA No. 7122-PHI: Water District Development Sector Project PPTA – Final Report – Vol. 10
72
Table G40. Percentage of Non-connected Households by Total Time Spent for
Collecting Water per Day (In number of hours) and Schedule of Collecting by Household Headship: 5 Selected Water Districts
Water District HH Headship Total
Male-headed HHs
Female-headed HHs
LEGAZPI Total time spent
0.5 – 1 hour 82.6% 75.6% 80.9% 1.1 – 2 hours 13.2% 14.6% 13.6% 2- 4 hours 0.8% 2.4% 1.2% 5 hours or more 0.0% 2.4% 0.6% No information 3.3% 4.9% 3.7%
N Cases 121 41 162
Schedule of collecting
Morning 14.0% 16.7% 14.6% Evening 0.0% 0.0% 0.0% Afternoon 0.0% 0.0% 0.0% Anytime 72.9% 76.2% 73.7% No Information 13.2% 7.1% 11.7%
N Cases 129 42 171
LA UNION Total time spent
0.5 – 1 hour 90.6% 95.7% 92.0% 1.1 – 2 hours 1.2% 1.1% 1.2% 2- 4 hours 0.0% 1.1% 0.3% 5 hours or more 0.8% 1.1% 0.9% No information 7.3% 1.1% 5.6%
N Cases 245 93 338
Schedule of collecting
Morning 22.6% 13.8% 20.2% Evening 1.2% 2.1% 1.5% Afternoon 1.6% 0.0% 1.2% Anytime 66.5% 81.9% 70.8% No Information 8.1% 2.1% 6.4%
N Cases 248 94 342

Supplementary Appendix H
TA No. 7122-PHI: Water District Development Sector Project PPTA – Final Report – Vol. 10
73
Table G40. Percentage of Non-connected Households by Total Time Spent for
Collecting Water per Day (In number of hours) and Schedule of Collecting by Household Headship: 5 Selected Water Districts (CONTINUATION)
Water District HH Headship Total
Male-headed HHs
Female-headed HHs
LEYTE Total time spent
0.5 – 1 hour 76.6% 85.7% 77.8% 1.1 – 2 hours 5.4% 5.7% 5.4% 2- 4 hours 7.2% 5.7% 7.0% 5 hours or more 7.7% 2.9% 7.0% No information 3.2% 0.0% 2.7%
N Cases 222 35 257
Schedule of collecting
Morning 15.4% 5.6% 14.1% Evening 6.6% 2.8% 6.1% Afternoon 2.6% 8.3% 3.4% Anytime 65.6% 80.6% 67.7% No Information 9.7% 2.8% 8.7%
N Cases 227 36 263
QUEZON Total time spent
0.5 – 1 hour 84.5% 78.6% 82.8% 1.1 – 2 hours 1.4% 0.0% 1.0% 2- 4 hours 0.0% 0.0% 0.0% 5 hours or more 7.0% 3.6% 6.1% No information 7.0% 17.9% 10.1%
N Cases 71 28 99
Schedule of collecting
Morning 12.5% 15.2% 13.3% Evening 0.0% 0.0% 0.0% Afternoon 7.5% 0.0% 5.3% Anytime 66.3% 54.5% 62.8% No Information 13.8% 30.3% 18.6
N Cases 80 33 113

Supplementary Appendix H
TA No. 7122-PHI: Water District Development Sector Project PPTA – Final Report – Vol. 10
74
Table G40. Percentage of Non-connected Households by Total Time Spent for
Collecting Water per Day (In number of hours) and Schedule of Collecting by Household Headship: 5 Selected Water Districts (CONTINUATION)
Water District HH Headship Total
Male-headed HHs
Female-headed HHs
KORONADAL Total time spent
0.5 – 1 hour 95.8% 95.6% 95.8% 1.1 – 2 hours 1.7% 2.2% 1.8% 2- 4 hours 0.0% 0.0% 0.0% 5 hours or more 0.4% 0.0% 0.4% No information 2.1% 2.2% 2.1%
N Cases 239 45 284
Schedule of collecting
Morning 2.2% 3.7% 2.5% Evening 0.0% 0.0% 0.0% Afternoon 0.4% 0.0% 0.3% Anytime 94.0% 90.7% 93.5% No Information 3.4% 5.6% 3.7%
N Cases 268 54 322

Supplementary Appendix H
TA No. 7122-PHI: Water District Development Sector Project PPTA – Final Report – Vol. 10
75
Table G41. Proportion of Non-connected Households with at least One Member who
Suffered from Water-related Diseases Last Year Due to Consumption of Water Supplied by the Water District by Household Headship: 5 Selected Water Districts
Water District HH Headship
Total
Male-headed HHs
Female-headed HHs
LEGAZPI
Percent of Non-connected Households with at least one member who suffered from water-related diseases last year due to consumption of water supplied by the water district
5.4% 9.5% 6.4%
N Cases 129 42 171 Percent of Non-connected Households that treat water from faucet before drinking
13.2% 16.7% 14.0%
N Cases 129 42 171
LA UNION
Percent of Non-connected Households with at least one member who suffered from water-related diseases last year due to consumption of water supplied by the water district
4.8% 2.1% 4.1%
N Cases 248 94 342 Percent of Non-connected Households that treat water from faucet before drinking
16.9% 20.2% 17.8%
N Cases 248 94 342
LEYTE
Percent of Non-connected Households with at least one member who suffered from water-related diseases last year due to consumption of water supplied by the water district
15.9% 5.6% 14.4%
N Cases 227 36 263 Percent of Non-connected Households that treat water from faucet before drinking
18.5% 13.9% 17.9%
N Cases 227 36 263
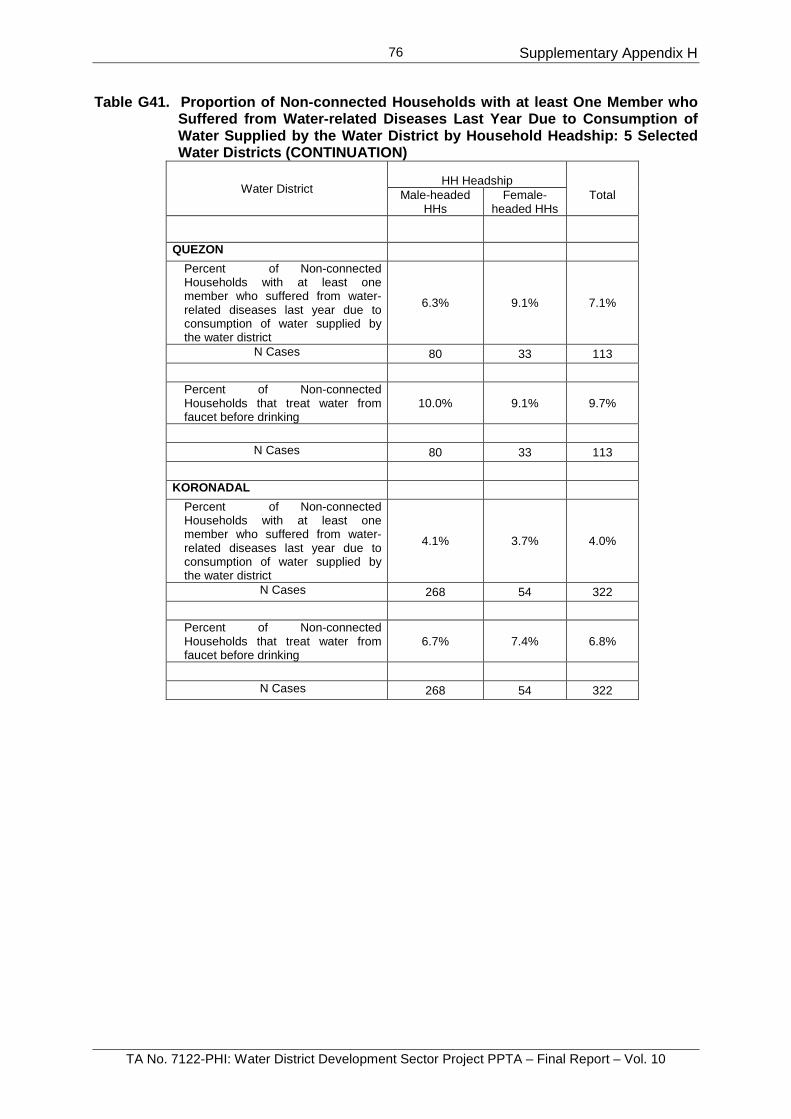
Supplementary Appendix H
TA No. 7122-PHI: Water District Development Sector Project PPTA – Final Report – Vol. 10
76
Table G41. Proportion of Non-connected Households with at least One Member who Suffered from Water-related Diseases Last Year Due to Consumption of Water Supplied by the Water District by Household Headship: 5 Selected Water Districts (CONTINUATION)
Water District HH Headship
Total
Male-headed HHs
Female-headed HHs
QUEZON
Percent of Non-connected Households with at least one member who suffered from water-related diseases last year due to consumption of water supplied by the water district
6.3% 9.1% 7.1%
N Cases 80 33 113 Percent of Non-connected Households that treat water from faucet before drinking
10.0% 9.1% 9.7%
N Cases 80 33 113
KORONADAL
Percent of Non-connected Households with at least one member who suffered from water-related diseases last year due to consumption of water supplied by the water district
4.1% 3.7% 4.0%
N Cases 268 54 322 Percent of Non-connected Households that treat water from faucet before drinking
6.7% 7.4% 6.8%
N Cases 268 54 322

Supplementary Appendix H
TA No. 7122-PHI: Water District Development Sector Project PPTA – Final Report – Vol. 10
77
Table G42. Willingness to Connect to WD Water Supply System of Currently Non-
connected Households by Household Headship: 5 Selected Water Districts
Water District HH Headship Total
Male-headed HHs
Female-headed HHs
LEGAZPI
Percent of non-connected households willing to connect with the existing water supply system
46.5% 47.6% 46.8%
N Cases 129 42 171
Percent of non-connected households willing to connect if existing water supply system will be improved (out of the households who do not want to connect to the existing water supply system)
4.3% 4.5% 4.4%
N Cases 69 22 91
LA UNION
Percent of non-connected households willing to connect with the existing water supply system
40.7% 44.7% 41.8%
N Cases 248 94 342
Percent of non-connected households willing to connect if existing water supply system will be improved (out of the households who do not want to connect to the existing water supply system)
6.2% 2.0% 5.1%
N Cases 145 50 195
LEYTE
Percent of non-connected households willing to connect with the existing water supply system
69.5% 75.0% 70.2%
N Cases 226 36 262
Percent of non-connected households 5.8% 0.0% 5.1%

Supplementary Appendix H
TA No. 7122-PHI: Water District Development Sector Project PPTA – Final Report – Vol. 10
78
willing to connect if existing water supply system will be improved (out of the households who do not want to connect to the existing water supply system)
N Cases 69 9 78
QUEZON
Percent of non-connected households willing to connect with the existing water supply system
43.8% 42.4% 43.4%
N Cases 80 33 113
Percent of non-connected households willing to connect if existing water supply system will be improved (out of the households who do not want to connect to the existing water supply system)
2.2% 5.3% 3.1%
N Cases 46 19 65

Supplementary Appendix H
TA No. 7122-PHI: Water District Development Sector Project PPTA – Final Report – Vol. 10
79
Table G42. Willingness to Connect to WD Water Supply System of Currently Non-
connected Households by Household Headship: 5 Selected Water Districts (CONTINUATION)
Water District HH Headship Total
Male-headed HHs
Female-headed HHs
KORONADAL Percent of non-connected households willing to connect with the existing water supply system
70.5% 72.2% 70.8%
N Cases 268 54 322
Percent of non-connected households willing to connect if existing water supply system will be improved (out of the households who do not want to connect to the existing water supply system)
7.7% 0.0% 6.5%
N Cases 78 15 93

Supplementary Appendix H
TA No. 7122-PHI: Water District Development Sector Project PPTA – Final Report – Vol. 10
80
Table 43. Reasons of Non-connected Households for Their Willingness/ Unwillingness
to Connect to the WD Piped Water System (Multiple Responses) by Household Headship: 5 Selected Water Districts
Water District HH Headship Total
Male-headed HHs
Female-headed HHs
LEGAZPI
Reason for willingness to connect
Convenience 61.9% 52.4% 59.5% Really want/need the improved water service 42.9% 23.8% 38.1%
Worried about the health risks of the water from current source 12.7% 9.5% 11.9%
Water bill is not too high 7.9% 14.3% 9.5%
N Cases 63 21 84
Reason for unwillingness to connect
Happy with our existing water source 62.1% 42.9% 57.5%
Monthly water bill is too high 40.9% 42.9% 41.4%
Connection charge is too high 24.2% 23.8% 24.1%
Do not own land/house occupied 0.0% 14.3% 3.4% Do not really want/need the improved service 9.1% 4.8% 8.0%
Not worried about the health risks from my existing water source 4.5% 0.0% 3.4%
N Cases 66 21 87

Supplementary Appendix H
TA No. 7122-PHI: Water District Development Sector Project PPTA – Final Report – Vol. 10
81
Table 43. Reasons of Non-connected Households for Their Willingness/ Unwillingness
to Connect to the WD Piped Water System (Multiple Responses) by Household Headship: 5 Selected Water Districts (CONTINUATION)
Water District HH Headship Total
Male-headed HHs
Female-headed HHs
LA UNION
Reason for willingness to connect
Convenience 23.2% 15.6% 21.0% Really want/need the improved water service 71.4% 64.4% 69.4%
Worried about the health risks of the water from current source 18.8% 17.8% 18.5%
Water bill is not too high 3.6% 13.3% 6.4%
N Cases 112 45 157
Reason for unwillingness to connect
Happy with our existing water source 67.6% 75.5% 69.7%
Monthly water bill is too high 30.1% 24.5% 28.6%
Connection charge is too high 20.6% 16.3% 19.5%
Do not own land/house occupied 5.9% 2.0% 4.9% Do not really want/need the improved service 3.7% 2.0% 3.2%
Not worried about the health risks from my existing water source 0.0% 0.0% 0.0%
N Cases 136 49 185
LEYTE
Reason for willingness to connect
Convenience 59.0% 40.7% 56.4% Really want/need the improved water service 52.2% 70.4% 54.8%
Worried about the health risks of the water from current source 26.7% 7.4% 23.9%
Water bill is not too high 18.0% 14.8% 17.6%
N Cases 161 27 188
Reason for unwillingness to connect
Happy with our existing water source 30.8% 33.3% 31.1%
Monthly water bill is too high 56.9% 44.4% 55.4%
Connection charge is too high 55.4% 77.8% 58.1%
Do not own land/house occupied 21.5% 11.1% 20.3% Do not really want/need the improved service 3.1% 0.0% 2.7%
Not worried about the health risks from my existing water source 1.5% 0.0% 1.4%
N Cases 65 9 74

Supplementary Appendix H
TA No. 7122-PHI: Water District Development Sector Project PPTA – Final Report – Vol. 10
82
Table 43. Reasons of Non-connected Households for Their Willingness/ Unwillingness to Connect to the WD Piped Water System (Multiple Responses) by Household Headship: 5 Selected Water Districts (CONTINUATION)
Water District HH Headship Total
Male-headed HHs
Female-headed HHs
QUEZON
Reason for willingness to connect
Convenience 16.7% 6.7% 13.7% Really want/need the improved water service 91.7% 80.0% 88.2%
Worried about the health risks of the water from current source 5.6% 26.7% 11.8%
Water bill is not too high 5.6% 33.3% 13.7%
N Cases 36 15 51
Reason for unwillingness to connect
Happy with our existing water source 52.3% 72.2% 58.1%
Monthly water bill is too high 45.5% 16.7% 37.1%
Connection charge is too high 20.5% 16.7% 19.4%
Do not own land/house occupied 9.1% 0.0% 6.5% Do not really want/need the improved service 13.6% 16.7% 14.5%
Not worried about the health risks from my existing water source 2.3% 0.0% 1.6%
N Cases 44 18 62
KORONADAL
Reason for willingness to connect
Convenience 41.1% 64.1% 44.9% Really want/need the improved water service
24.4% 30.8% 25.4%
Worried about the health risks of the water from current source 44.7% 35.9% 43.2%
Water bill is not too high 5.1% 2.6% 4.7%
N Cases 197 39 236
Reason for unwillingness to connect
Happy with our existing water source 31.0% 66.7% 37.2%
Monthly water bill is too high 33.8% 13.3% 30.2%
Connection charge is too high 28.2% 6.7% 24.4%
Do not own land/house occupied 19.7% 20.0% 19.8% Do not really want/need the improved service 1.4% 0.0% 1.2%
Not worried about the health risks from my existing water source 2.8% 0.0% 2.3%
N Cases 71 15 86

Supplementary Appendix H
TA No. 7122-PHI: Water District Development Sector Project PPTA – Final Report – Vol. 10
83
Table G44. Amount of Monthly Water Bill that Non-connected Households are Willing to Pay to Access Improved Water Supply Services by Household Headship: 5 Selected Water Districts
Water District/ Amount Willing to Pay to Access Improved Water Supply
Services
HH Headship Total
Male-headed
HHs Female-
headed HHs LEGAZPI
P1,000/month 0.0% 4.8% 1.2% P 900/month 0.0% 0.0% 0.0% P 800/month 0.0% 0.0% 0.0% P 700/month 0.0% 0.0% 0.0% P 600/month 1.6% 0.0% 1.2%
P 500/month 6.3% 14.3% 8.3%
P 450/month 1.6% 0.0% 1.2%
P 400/month 1.6% 4.8% 2.4%
P 350/month 0.0% 0.0% 0.0% P 300/month 3.2% 4.8% 3.6%
P 250/month 4.8% 4.8% 4.8%
P 200/month 30.2% 33.3% 31.0%
P150/month 47.6% 33.3% 44.0%
N Cases 63 21 84 LA UNION
P1,000/month 1.8% 0.0% 1.3% P 900/month 0.0% 0.0% 0.0% P 800/month 0.0% 0.0% 0.0% P 700/month 0.0% 0.0% 0.0% P 600/month 2.7% 0.0% 1.9%
P 500/month 6.3% 8.9% 7.0%
P 450/month 0.9% 2.2% 1.3%
P 400/month 0.0% 6.7% 1.9%
P 350/month 3.6% 6.7% 4.5%
P 300/month 10.7% 2.2% 8.3%
P 250/month 18.8% 28.9% 21.7%
P 200/month 25.0% 20.0% 23.6%
P150/month 28.6% 20.0% 26.1% N Cases 112 45 157

Supplementary Appendix H
TA No. 7122-PHI: Water District Development Sector Project PPTA – Final Report – Vol. 10
84
Table G44. Amount of Monthly Water Bill that Non-connected Households are Willing
to Pay to Access Improved Water Supply Services by Household Headship: 5 Selected Water Districts (CONTINUATION)
Water District/ Amount Willing to Pay to Access Improved Water Supply
Services
HH Headship Total
Male-headed
HHs Female-
headed HHs LEYTE
P1,000/month 1.9% 3.7% 2.1% P 900/month 1.9% 0.0% 1.6% P 800/month 3.1% 7.4% 3.7%
P 700/month 0.0% 0.0% 0.0% P 600/month 1.2% 0.0% 1.1%
P 500/month 7.5% 0.0% 6.4%
P 450/month 1.2% 0.0% 1.1%
P 400/month 1.9% 0.0% 1.6%
P 350/month 1.2% 0.0% 1.1%
P 300/month 6.8% 3.7% 6.4%
P 250/month 6.8% 7.4% 6.9%
P 200/month 18.0% 7.4% 16.5%
P150/month 39.1% 63.0% 42.6%
N Cases 161 27 188
QUEZON
P1,000/month 5.6% 6.7% 5.9%
P 900/month 0.0% 0.0% 0.0% P 800/month 2.8% 0.0% 2.0%
P 700/month 0.0% 0.0% 0.0% P 600/month 0.0% 6.7% 2.0%
P 500/month 8.3% 0.0% 5.9%
P 450/month 0.0% 0.0% 0.0% P 400/month 2.8% 0.0% 2.0%
P 350/month 0.0% 0.0% 0.0% P 300/month 16.7% 20.0% 17.6%
P 250/month 5.6% 20.0% 9.8%
P 200/month 8.3% 20.0% 11.8%
P150/month 47.2% 26.7% 41.2%
N Cases 36 15 51

Supplementary Appendix H
TA No. 7122-PHI: Water District Development Sector Project PPTA – Final Report – Vol. 10
85
Table G44. Amount of Monthly Water Bill that Non-connected Households are Willing
to Pay to Access Improved Water Supply Services by Household Headship: 5 Selected Water Districts (CONTINUATION)
Water District/ Amount Willing to Pay to Access Improved Water Supply
Services
HH Headship Total
Male-headed
HHs Female-
headed HHs KORONADAL
P1,000/month 10.2% 7.7% 9.7% P 900/month 0.0% 0.0% 0.0% P 800/month 0.0% 0.0% 0.0% P 700/month 0.0% 0.0% 0.0% P 600/month 0.5% 0.0% 0.4%
P 500/month 8.1% 20.5% 10.2%
P 450/month 0.5% 0.0% 0.4%
P 400/month 0.0% 0.0% 0.0% P 350/month 3.6% 2.6% 3.4%
P 300/month 8.6% 10.3% 8.9%
P 250/month 34.5% 12.8% 30.9%
P 200/month 19.3% 17.9% 19.1%
P150/month 14.2% 28.2% 16.5%
N Cases 197 39 236

Supplementary Appendix H
TA No. 7122-PHI: Water District Development Sector Project PPTA – Final Report – Vol. 10
86
Table G45. Satisfaction/Dissatisfaction with Current Toilet System by Gender of
Survey Respondents: 5 Selected Water Districts
Water District Gender of Respondent
Total Male Female
LEGAZPI
Percent of households satisfied with current toilet system 85.4% 83.1% 83.6%
Percent of households dissatisfied with current toilet system 14.6% 16.9% 16.4%
N Cases 82 302 384
Reasons for dissatisfaction
Backflow 54.5% 32.6% 36.8% Foul odor 18.2% 17.4% 17.5% Combination of backflow resulting to foul odor and inconvenience 27.3% 45.7% 42.1%
Rodent infestation 0.0% 0.0% 0.0% Flies/Insects 0.0% 4.3% 3.5%
N Cases 11 46 57
LA UNION Percent of households satisfied with current toilet system 92.5% 91.4% 91.6%
Percent of households dissatisfied with current toilet system 7.5% 8.6% 8.4%
N Cases 93 290 383
Reasons for dissatisfaction
Backflow 57.1% 40.0% 43.8% Foul odor 28.6% 40.0% 37.5% Combination of backflow resulting to foul odor and inconvenience 14.3% 16.0% 15.6%
Rodent infestation 0.0% 0.0% 0.0% Flies/Insects 0.0% 4.0% 3.1%
N Cases 7 25 32

Supplementary Appendix H
TA No. 7122-PHI: Water District Development Sector Project PPTA – Final Report – Vol. 10
87
Table G45. Satisfaction/Dissatisfaction with Current Toilet System by Gender of
Survey Respondents: 5 Selected Water Districts (CONTINUATION)
Water District Gender of Respondent
Total Male Female
LEYTE
Percent of households satisfied with current toilet system 92.3% 88.0% 88.9%
Percent of households dissatisfied with current toilet system 7.7% 12.0% 11.1%
N Cases 78 300 378
Reasons for dissatisfaction
Backflow 14.3% 28.6% 26.2% Foul odor 0.0% 11.4% 9.5% Combination of backflow resulting to foul odor and inconvenience 71.4% 57.1% 59.5%
Rodent infestation 0.0% 0.0% 0.0% Flies/Insects 14.3% 2.9% 4.8%
N Cases 7 35 42
QUEZON Percent of households satisfied with current toilet system 96.0% 96.6% 96.4%
Percent of households dissatisfied with current toilet system 4.0% 3.4% 3.6%
N Cases 125 263 388
Reasons for dissatisfaction
Backflow 50.0% 28.6% 36.4% Foul odor 25.0% 14.3% 18.2% Combination of backflow resulting to foul odor and inconvenience 25.0% 57.1% 45.5%
Rodent infestation 0.0% 0.0% 0.0% Flies/Insects 0.0% 0.0% 0.0%
N Cases 4 7 11

Supplementary Appendix H
TA No. 7122-PHI: Water District Development Sector Project PPTA – Final Report – Vol. 10
88
Table G45. Satisfaction/Dissatisfaction with Current Toilet System by Gender of
Survey Respondents: 5 Selected Water Districts (CONTINUATION)
Water District Gender of Respondent
Total Male Female
KORONADAL
Percent of households satisfied with current toilet system 83.8% 78.6% 79.9%
Percent of households dissatisfied with current toilet system 16.2% 21.4% 20.1%
N Cases 99 294 393
Reasons for dissatisfaction
Backflow 0.0% 13.1% 10.5% Foul odor 20.0% 14.8% 15.8% Combination of backflow resulting to foul odor and inconvenience 60.0% 62.3% 61.8%
Rodent infestation 13.3% 9.8% 10.5% Flies/Insects 6.7% 0.0% 1.3%
N Cases 15 61 76

Supplementary Appendix H
TA No. 7122-PHI: Water District Development Sector Project PPTA – Final Report – Vol. 10
89
Table G46. Satisfaction Level on the Quality of Water District Piped Water by Gender of Survey Respondents: 5 Selected Water Districts
Water District/ Aspects of Water Quality
Gender of Respondent Total
Male Female LEGAZPI
Taste
Extremely unsatisfied 22.2% 20.8% 21.1%
Moderately unsatisfied 29.6% 27.0% 27.7%
Moderately satisfied 33.3% 39.6% 38.0%
Extremely satisfied 1.9% 5.7% 4.7%
Neither satisfied nor unsatisfied 13.0% 6.9% 8.5%
Smell
Extremely unsatisfied 11.1% 13.2% 12.7%
Moderately unsatisfied 42.6% 28.3% 31.9%
Moderately satisfied 35.2% 46.5% 43.7%
Extremely satisfied 5.6% 6.3% 6.1%
Neither satisfied nor unsatisfied 5.6% 5.7% 5.6%
Color
Extremely unsatisfied 24.1% 26.4% 25.8%
Moderately unsatisfied 51.9% 32.7% 37.6%
Moderately satisfied 16.7% 30.2% 26.8%
Extremely satisfied 3.7% 5.0% 4.7%
Neither satisfied nor unsatisfied 3.7% 5.7% 5.2%
Overall quality of water
Extremely unsatisfied 15.4% 16.4% 16.1%
Moderately unsatisfied 38.5% 28.9% 31.3%
Moderately satisfied 38.5% 44.7% 43.1%
Extremely satisfied 1.9% 5.7% 4.7%
Neither satisfied nor unsatisfied 5.8% 4.4% 4.7%
N Cases 54 159 213

Supplementary Appendix H
TA No. 7122-PHI: Water District Development Sector Project PPTA – Final Report – Vol. 10
90
Table G46. Satisfaction Level on the Quality of Water District Piped Water by Gender of Survey Respondents: 5 Selected Water Districts (CONTINUATION)
Water District/ Aspects of Water Quality
Gender of Respondent Total
Male Female LA UNION
Taste
Extremely unsatisfied 10.0% 13.3% 12.5%
Moderately unsatisfied 10.0% 33.3% 27.5%
Moderately satisfied 40.0% 43.3% 42.5%
Extremely satisfied 40.0% 6.7% 15.0%
Neither satisfied nor unsatisfied 0.0% 3.3% 2.5%
Smell
Extremely unsatisfied 9.1% 13.3% 12.2%
Moderately unsatisfied 9.1% 26.7% 22.0%
Moderately satisfied 63.6% 53.3% 56.1%
Extremely satisfied 18.2% 6.7% 9.8%
Neither satisfied nor unsatisfied 0.0% 0.0% 0.0%
Color
Extremely unsatisfied 9.1% 13.3% 12.2%
Moderately unsatisfied 27.3% 30.0% 29.3%
Moderately satisfied 45.5% 50.0% 48.8%
Extremely satisfied 9.1% 3.3% 4.9%
Neither satisfied nor unsatisfied 9.1% 3.3% 4.9%
Overall quality of water
Extremely unsatisfied 10.0% 13.3% 12.5%
Moderately unsatisfied 10.0% 30.0% 25.0%
Moderately satisfied 60.0% 50.0% 52.5%
Extremely satisfied 20.0% 6.7% 10.0%
Neither satisfied nor unsatisfied 0.0% 0.0% 0.0%
N Cases 11 30 41

Supplementary Appendix H
TA No. 7122-PHI: Water District Development Sector Project PPTA – Final Report – Vol. 10
91
Table G46. Satisfaction Level on the Quality of Water District Piped Water by Gender
of Survey Respondents: 5 Selected Water Districts (CONTINUATION)
Water District/ Aspects of Water Quality
Gender of Respondent Total
Male Female LEYTE
Taste
Extremely unsatisfied 0.0% 1.1% .8%
Moderately unsatisfied 3.2% 8.8% 7.4%
Moderately satisfied 64.5% 63.7% 63.9%
Extremely satisfied 29.0% 24.2% 25.4%
Neither satisfied nor unsatisfied 3.2% 2.2% 2.5%
Smell
Extremely unsatisfied 0.0% 2.2% 1.6%
Moderately unsatisfied 0.0% 3.3% 2.5%
Moderately satisfied 67.7% 69.2% 68.9%
Extremely satisfied 32.3% 23.1% 25.4%
Neither satisfied nor unsatisfied 0.0% 2.2% 1.6%
Color
Extremely unsatisfied 0.0% 1.1% 0.8%
Moderately unsatisfied 6.5% 5.5% 5.7%
Moderately satisfied 58.1% 64.8% 63.1%
Extremely satisfied 32.3% 20.9% 23.8%
Neither satisfied nor unsatisfied 3.2% 7.7% 6.6%
Overall quality of water
Extremely unsatisfied 0.0% 2.2% 1.6%
Moderately unsatisfied 0.0% 2.2% 1.6%
Moderately satisfied 67.7% 65.9% 66.4%
Extremely satisfied 32.3% 26.4% 27.9%
Neither satisfied nor unsatisfied 0.0% 3.3% 2.5%
N Cases 31 91 122

Supplementary Appendix H
TA No. 7122-PHI: Water District Development Sector Project PPTA – Final Report – Vol. 10
92
Table G46. Satisfaction Level on the Quality of Water District Piped Water by Gender of Survey Respondents: 5 Selected Water Districts (CONTINUATION)
Water District/ Aspects of Water Quality
Gender of Respondent Total
Male Female QUEZON
Taste
Extremely unsatisfied 3.3% 2.8% 2.9%
Moderately unsatisfied 16.3% 15.5% 15.8%
Moderately satisfied 65.2% 66.9% 66.3%
Extremely satisfied 9.8% 5.5% 7.0%
Neither satisfied nor unsatisfied 5.4% 9.4% 8.1%
Smell
Extremely unsatisfied 1.1% 2.2% 1.8%
Moderately unsatisfied 12.0% 13.3% 12.8%
Moderately satisfied 67.4% 69.6% 68.9%
Extremely satisfied 12.0% 7.2% 8.8%
Neither satisfied nor unsatisfied 7.6% 7.7% 7.7%
Color
Extremely unsatisfied 1.1% 1.1% 1.1%
Moderately unsatisfied 18.5% 13.3% 15.0%
Moderately satisfied 59.8% 71.3% 67.4%
Extremely satisfied 14.1% 6.6% 9.2%
Neither satisfied nor unsatisfied 6.5% 7.7% 7.3%
Overall quality of water
Extremely unsatisfied 4.3% 1.1% 2.2%
Moderately unsatisfied 10.9% 9.5% 10.0%
Moderately satisfied 65.2% 72.1% 69.7%
Extremely satisfied 14.1% 6.7% 9.2%
Neither satisfied nor unsatisfied 5.4% 10.6% 8.9%
N Cases 92 181 273

Supplementary Appendix H
TA No. 7122-PHI: Water District Development Sector Project PPTA – Final Report – Vol. 10
93
Table G46. Satisfaction Level on the Quality of Water District Piped Water by Gender
of Survey Respondents: 5 Selected Water Districts (CONTINUATION)
Water District/ Aspects of Water Quality
Gender of Respondent Total
Male Female KORONADAL
Taste
Extremely unsatisfied 20.0% 22.2% 21.7%
Moderately unsatisfied 33.3% 27.8% 29.0%
Moderately satisfied 26.7% 37.0% 34.8%
Extremely satisfied 20.0% 13.0% 14.5%
Neither satisfied nor unsatisfied 0.0% 0.0% 0.0%
Smell
Extremely unsatisfied 13.3% 7.4% 8.7%
Moderately unsatisfied 13.3% 29.6% 26.1%
Moderately satisfied 53.3% 48.1% 49.3%
Extremely satisfied 20.0% 14.8% 15.9%
Neither satisfied nor unsatisfied 0.0% 0.0% 0.0%
Color
Extremely unsatisfied 20.0% 25.9% 24.6%
Moderately unsatisfied 33.3% 20.4% 23.2%
Moderately satisfied 33.3% 40.7% 39.1%
Extremely satisfied 13.3% 13.0% 13.0%
Neither satisfied nor unsatisfied 0.0% 0.0% 0.0%
Overall quality of water
Extremely unsatisfied 13.3% 18.5% 17.4%
Moderately unsatisfied 33.3% 22.2% 24.6%
Moderately satisfied 33.3% 44.4% 42.0%
Extremely satisfied 20.0% 13.0% 14.5%
Neither satisfied nor unsatisfied 0.0% 1.9% 1.4%
N Cases 15 54 69

Supplementary Appendix H
TA No. 7122-PHI: Water District Development Sector Project PPTA – Final Report – Vol. 10
94
Table G47a. Water District Service Performance Rating by Gender of Survey
Respondents: LEGAZPI
Water District/ Performance Rating Gender of Respondent Total
Male Female Continuity of water supply
Very Poor 0.0% 0.0% 0.0%
Poor 5.6% 1.3% 2.3%
Neutral 0.0% 0.6% 0.5%
Good 70.4% 68.1% 68.7%
Very Good 24.1% 30.0% 28.5%
Reliability of water meter
Very Poor 3.7% .0% .9%
Poor 3.7% 8.8% 7.5%
Neutral 7.4% 12.5% 11.2%
Good 53.7% 51.3% 51.9%
Very Good 31.5% 27.5% 28.5%
Regularity of billing and collection
Very Poor 1.9% 0.6% 0.9%
Poor 5.6% 0.6% 1.9%
Neutral 3.7% 1.9% 2.3%
Good 55.6% 63.1% 61.2%
Very Good 33.3% 33.8% 33.6%
Response to customer complaints
Very Poor 7.4% 10.0% 9.3%
Poor 7.4% 7.5% 7.5%
Neutral 16.7% 23.8% 22.0%
Good 53.7% 42.5% 45.3%
Very Good 14.8% 16.3% 15.9%
Repairtime/services
Very Poor 5.7% 9.4% 8.5%
Poor 5.7% 7.5% 7.0%
Neutral 18.9% 23.8% 22.5%
Good 54.7% 43.1% 46.0%
Very Good 15.1% 16.3% 16.0%
Overall water supply service
Very Poor 1.9% 0.6% 0.9%
Poor 9.4% 13.8% 12.7%
Neutral 3.8% 4.4% 4.2%
Good 67.9% 62.3% 63.7%
Very Good 17.0% 18.9% 18.4%
N Cases 54 160 214

Supplementary Appendix H
TA No. 7122-PHI: Water District Development Sector Project PPTA – Final Report – Vol. 10
95
Table G47b. Water District Service Performance Rating by Gender of Survey Respondents: LA UNION
Water District/ Performance Rating Gender of Respondent Total
Male Female Continuity of water supply
Very Poor 9.1% 6.7% 7.3%
Poor 9.1% 13.3% 12.2%
Neutral 0.0% 16.7% 12.2%
Good 54.5% 50.0% 51.2%
Very Good 27.3% 13.3% 17.1%
Reliability of water meter
Very Poor 0.0% 0.0% 0.0%
Poor 18.2% 13.3% 14.6%
Neutral 0.0% 13.3% 9.8%
Good 72.7% 60.0% 63.4%
Very Good 9.1% 13.3% 12.2%
Regularity of billing and collection
Very Poor 0.0% 0.0% 0.0%
Poor 0.0% 10.0% 7.3%
Neutral 18.2% 16.7% 17.1%
Good 63.6% 63.3% 63.4%
Very Good 18.2% 10.0% 12.2%
Response to customer complaints
Very Poor 9.1% 3.3% 4.9%
Poor 27.3% 13.3% 17.1%
Neutral 9.1% 26.7% 22.0%
Good 45.5% 43.3% 43.9%
Very Good 9.1% 13.3% 12.2%
Repairtime/services
Very Poor 9.1% 3.3% 4.9%
Poor 36.4% 20.0% 24.4%
Neutral 9.1% 26.7% 22.0%
Good 36.4% 36.7% 36.6%
Very Good 9.1% 13.3% 12.2%
Overall water supply service
Very Poor 18.2% 6.7% 9.8%
Poor 18.2% 16.7% 17.1%
Neutral 0.0% 16.7% 12.2%
Good 54.5% 53.3% 53.7%
Very Good 9.1% 6.7% 7.3%
N Cases 11 30 41
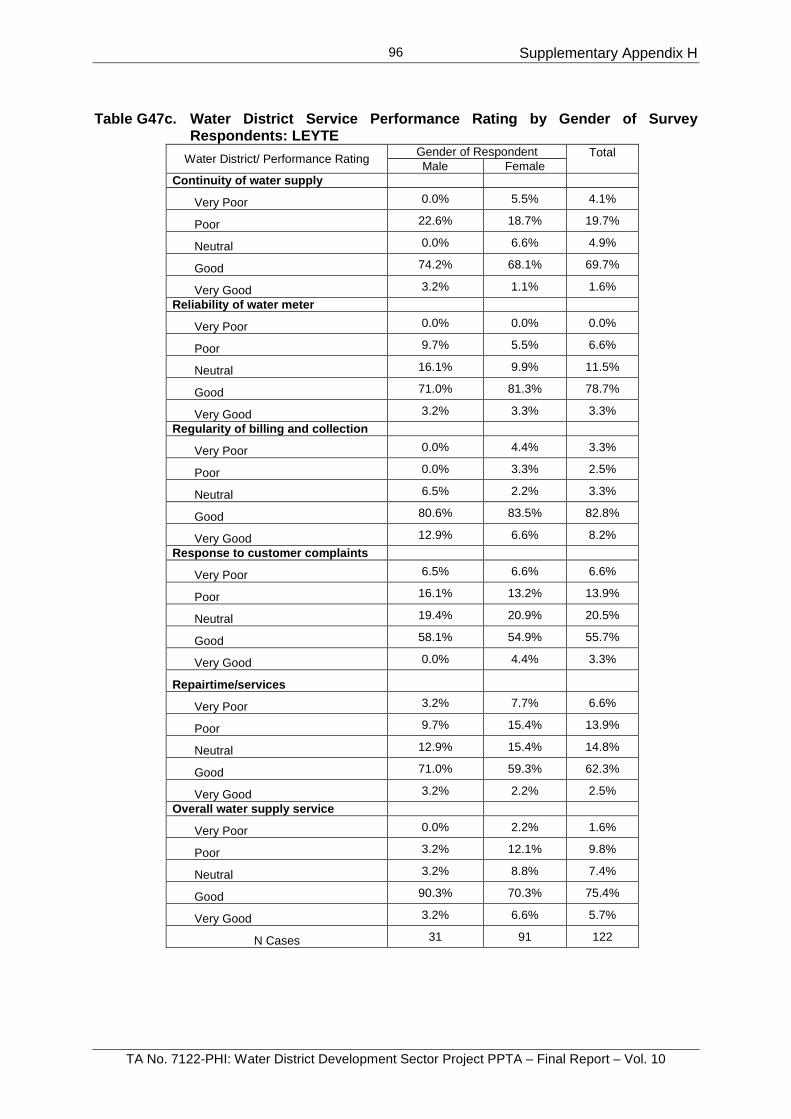
Supplementary Appendix H
TA No. 7122-PHI: Water District Development Sector Project PPTA – Final Report – Vol. 10
96
Table G47c. Water District Service Performance Rating by Gender of Survey
Respondents: LEYTE
Water District/ Performance Rating Gender of Respondent Total
Male Female Continuity of water supply
Very Poor 0.0% 5.5% 4.1%
Poor 22.6% 18.7% 19.7%
Neutral 0.0% 6.6% 4.9%
Good 74.2% 68.1% 69.7%
Very Good 3.2% 1.1% 1.6%
Reliability of water meter
Very Poor 0.0% 0.0% 0.0%
Poor 9.7% 5.5% 6.6%
Neutral 16.1% 9.9% 11.5%
Good 71.0% 81.3% 78.7%
Very Good 3.2% 3.3% 3.3%
Regularity of billing and collection
Very Poor 0.0% 4.4% 3.3%
Poor 0.0% 3.3% 2.5%
Neutral 6.5% 2.2% 3.3%
Good 80.6% 83.5% 82.8%
Very Good 12.9% 6.6% 8.2%
Response to customer complaints
Very Poor 6.5% 6.6% 6.6%
Poor 16.1% 13.2% 13.9%
Neutral 19.4% 20.9% 20.5%
Good 58.1% 54.9% 55.7%
Very Good 0.0% 4.4% 3.3%
Repairtime/services
Very Poor 3.2% 7.7% 6.6%
Poor 9.7% 15.4% 13.9%
Neutral 12.9% 15.4% 14.8%
Good 71.0% 59.3% 62.3%
Very Good 3.2% 2.2% 2.5%
Overall water supply service
Very Poor 0.0% 2.2% 1.6%
Poor 3.2% 12.1% 9.8%
Neutral 3.2% 8.8% 7.4%
Good 90.3% 70.3% 75.4%
Very Good 3.2% 6.6% 5.7%
N Cases 31 91 122

Supplementary Appendix H
TA No. 7122-PHI: Water District Development Sector Project PPTA – Final Report – Vol. 10
97
Table G47d. Water District Service Performance Rating by Gender of Survey
Respondents: QUEZON
Water District/ Performance Rating Gender of Respondent Total
Male Female Continuity of water supply
Very Poor 16.3% 11.0% 12.8%
Poor 19.6% 23.6% 22.3%
Neutral 21.7% 23.6% 23.0%
Good 41.3% 36.8% 38.3%
Very Good 1.1% 4.9% 3.6%
Reliability of water meter
Very Poor 4.3% 3.8% 4.0%
Poor 10.9% 9.9% 10.2%
Neutral 39.1% 40.1% 39.8%
Good 42.4% 43.4% 43.1%
Very Good 3.3% 2.7% 2.9%
Regularity of billing and collection
Very Poor 3.3% 2.2% 2.6%
Poor 3.3% 7.1% 5.8%
Neutral 43.5% 41.8% 42.3%
Good 47.8% 45.1% 46.0%
Very Good 2.2% 3.8% 3.3%
Response to customer complaints
Very Poor 17.4% 9.3% 12.0%
Poor 21.7% 22.0% 21.9%
Neutral 40.2% 41.2% 40.9%
Good 19.6% 26.9% 24.5%
Very Good 1.1% 0.5% 0.7%
Repairtime/services
Very Poor 13.0% 11.6% 12.1%
Poor 22.8% 18.2% 19.8%
Neutral 40.2% 40.9% 40.7%
Good 22.8% 28.7% 26.7%
Very Good 1.1% 0.6% 0.7%
Overall water supply service
Very Poor 10.9% 8.2% 9.1%
Poor 19.6% 14.8% 16.4%
Neutral 32.6% 35.2% 34.3%
Good 35.9% 40.1% 38.7%
Very Good 1.1% 1.6% 1.5%
N Cases 92 182 274

Supplementary Appendix H
TA No. 7122-PHI: Water District Development Sector Project PPTA – Final Report – Vol. 10
98
Table G47e. Water District Service Performance Rating by Gender of Survey
Respondents: KORONADAL
Water District/ Performance Rating Gender of Respondent Total
Male Female Continuity of water supply
Very Poor 0.0% 0.0% 0.0%
Poor 0.0% 1.8% 1.4%
Neutral 6.3% 12.5% 11.1%
Good 62.5% 46.4% 50.0%
Very Good 31.3% 39.3% 37.5%
Reliability of water meter
Very Poor 0.0% 1.8% 1.4%
Poor 0.0% 0.0% 0.0%
Neutral 6.3% 12.5% 11.1%
Good 56.3% 53.6% 54.2%
Very Good 37.5% 32.1% 33.3%
Regularity of billing and collection
Very Poor 0.0% 0.0% 0.0%
Poor 0.0% 0.0% 0.0%
Neutral 0.0% 7.2% 5.6%
Good 56.3% 48.2% 50.0%
Very Good 43.8% 44.6% 44.4%
Response to customer complaints
Very Poor 0.0% 3.6% 2.8%
Poor 6.3% 5.4% 5.6%
Neutral 12.5% 19.7% 18.1%
Good 50.0% 37.5% 40.3%
Very Good 31.3% 33.9% 33.3%
Repairtime/services
Very Poor 0.0% 1.8% 1.4%
Poor 12.5% 3.6% 5.6%
Neutral 0.0% 23.6% 18.3%
Good 62.5% 43.6% 47.9%
Very Good 25.0% 27.3% 26.8%
Overall water supply service
Very Poor 6.3% 5.4% 5.6%
Poor 6.3% 5.4% 5.6%
Neutral 0.0% 8.9% 6.9%
Good 50.0% 48.2% 48.6%
Very Good 37.5% 32.1% 33.3%
N Cases 16 56 72

Supplementary Appendix H
TA No. 7122-PHI: Water District Development Sector Project PPTA – Final Report – Vol. 10
99
Table G47. Aspects of WD Services that Survey Respondents Want to be Improved
(Multiple Responses) by Gender of Survey Respondents: 5 Selected Water Districts
Water District/ Performance Rating Gender of Respondent
Total Male Female
LEGAZPI
Water pressure 3.7% 7.5% 6.5%
Complaints handling 9.3% 9.4% 9.3%
Reduced water rates 24.1% 33.1% 30.8%
Repairs 7.4% 6.3% 6.5%
Billing 0.0% 1.3% .9%
Quality of water/ clean water
0.0% 0.0% 0.0%
Others 55.6% 42.5% 45.8%
N Cases 54 160 214
LA UNION
Water pressure 18.2% 16.7% 17.1%
Complaints handling 9.1% 6.7% 7.3%
Reduced water rates 9.1% 26.7% 22.0%
Repairs 0.0% 0.0% 0.0% Billing 18.2% 0.0% 4.9%
Quality of water/ clean water
0.0% 0.0% 0.0%
Others 45.5% 50.0% 48.8%
N Cases 11 30 41
LEYTE
Water pressure 46.4% 42.7% 43.6%
Complaints handling 10.7% 5.6% 6.8%
Reduced water rates 17.9% 20.2% 19.7%
Repairs 7.1% 1.1% 2.6%
Billing 0.0% 3.4% 2.6%
Quality of water/ clean water
0.0% 0.0% 0.0%
Others 17.9% 27.0% 24.8%
N Cases 28 89 117

Supplementary Appendix H
TA No. 7122-PHI: Water District Development Sector Project PPTA – Final Report – Vol. 10
100
Table G47. Aspects of WD Services that Survey Respondents Want to be Improved
(Multiple Responses) by Gender of Survey Respondents: 5 Selected Water Districts (CONTINUATION)
Water District/ Performance Rating Gender of Respondent
Total Male Female
QUEZON
Water pressure 44.3% 33.5% 37.1%
Complaints handling 4.5% 7.3% 6.4%
Reduced water rates 11.4% 11.2% 11.2%
Repairs 2.3% 4.5% 3.7%
Billing 10.2% 17.9% 15.4%
Quality of water/ clean water
0.0% 0.0% 0.0%
Others 27.3% 25.7% 26.2%
N Cases 88 179 267
KORONADAL
Water pressure 0.0% 3.6% 2.8%
Complaints handling 12.5% 10.7% 11.1%
Reduced water rates 18.8% 21.4% 20.8%
Repairs 0.0% 3.6% 2.8%
Billing 0.0% 1.8% 1.4%
Quality of water/ clean water
0.0% 0.0% 0.0%
Others 68.8% 58.9% 61.1%
N Cases 16 56 72

Supplementary Appendix H
TA No. 7122-PHI: Water District Development Sector Project PPTA – Final Report – Vol. 10
101
Table G48a. Satisfaction Level on the Quality of Water from Various Sources of Non-
connected Households by Gender of Survey Respondents: LEGAZPI
Water District/ Aspects of Water Quality
Gender of Respondent Total
Male Female
Taste
Extremely unsatisfied 3.4% 2.1% 2.3%
Moderately unsatisfied 13.8% 5.6% 7.0%
Moderately satisfied 41.4% 46.5% 45.6%
Extremely satisfied 41.4% 45.1% 44.4%
Neither satisfied nor unsatisfied 0.0% 0.7% 0.6%
No Information 0.0% 0.0% 0.0%
Smell
Extremely unsatisfied 6.9% 1.4% 2.3%
Moderately unsatisfied 3.4% 4.9% 4.7%
Moderately satisfied 48.3% 51.4% 50.9%
Extremely satisfied 41.4% 41.5% 41.5%
Neither satisfied nor unsatisfied 0.0% 0.7% 0.6%
No Information 0.0% 0.0% 0.0%
Color
Extremely unsatisfied 6.9% 2.1% 2.9%
Moderately unsatisfied 6.9% 12.7% 11.7%
Moderately satisfied 48.3% 43.7% 44.4%
Extremely satisfied 37.9% 41.5% 40.9%
Neither satisfied nor unsatisfied 0.0% 0.0% 0.0% No Information 0.0% 0.0% 0.0%
Overall quality of water
Extremely unsatisfied 3.4% 2.1% 2.3%
Moderately unsatisfied 6.9% 2.8% 3.5%
Moderately satisfied 48.3% 53.5% 52.6%
Extremely satisfied 41.4% 41.5% 41.5%
Neither satisfied nor unsatisfied 0.0% 0.0% 0.0% No Information 0.0% 0.0% 0.0%
N Cases 29 142 171

Supplementary Appendix H
TA No. 7122-PHI: Water District Development Sector Project PPTA – Final Report – Vol. 10
102
Table G48b. Satisfaction Level on the Quality of Water from Various Sources of Non-connected Households by Gender of Survey Respondents: LA UNION
Water District/ Aspects of Water Quality
Gender of Respondent Total
Male Female
Taste
Extremely unsatisfied 0.0% 1.2% 0.9%
Moderately unsatisfied 7.3% 7.7% 7.6%
Moderately satisfied 68.3% 68.5% 68.4%
Extremely satisfied 24.4% 20.8% 21.6%
Neither satisfied nor unsatisfied 0.0% 0.8% 0.6%
No Information 0.0% 1.2% 0.9%
Smell
Extremely unsatisfied 0.0% 0.0% 0.0% Moderately unsatisfied 2.4% 4.6% 4.1%
Moderately satisfied 74.4% 71.9% 72.5%
Extremely satisfied 23.2% 21.5% 21.9%
Neither satisfied nor unsatisfied 0.0% 0.8% 0.6%
No Information 0.0% 1.2% 0.9%
Color
Extremely unsatisfied 0.0% 0.0% 0.0% Moderately unsatisfied 2.4% 4.6% 4.1%
Moderately satisfied 74.4% 71.5% 72.2%
Extremely satisfied 23.2% 21.9% 22.2%
Neither satisfied nor unsatisfied 0.0% 0.8% 0.6%
No Information 0.0% 1.2% 0.9%
Overall quality of water
Extremely unsatisfied 1.2% 0.4% 0.6%
Moderately unsatisfied 2.4% 5.4% 4.7%
Moderately satisfied 73.2% 70.4% 71.1%
Extremely satisfied 23.2% 21.9% 22.2%
Neither satisfied nor unsatisfied 0.0% 0.4% 0.3%
No Information 0.0% 1.5% 1.2%
N Cases 82 260 342
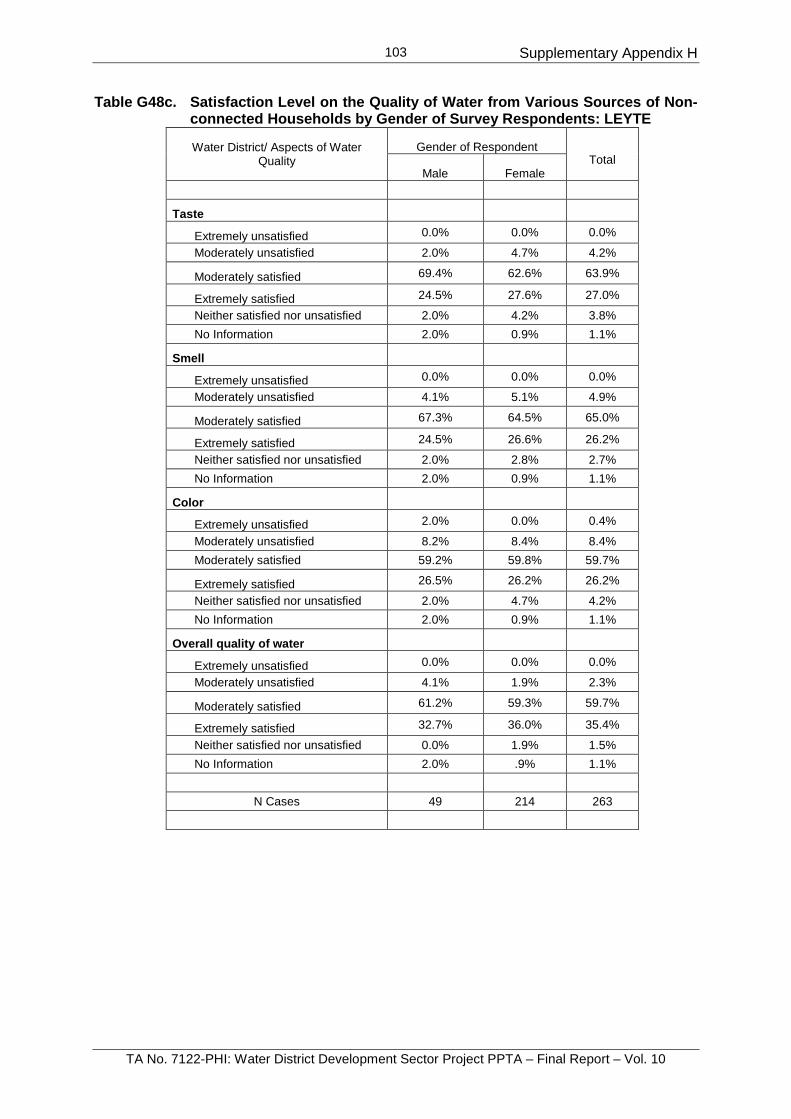
Supplementary Appendix H
TA No. 7122-PHI: Water District Development Sector Project PPTA – Final Report – Vol. 10
103
Table G48c. Satisfaction Level on the Quality of Water from Various Sources of Non-connected Households by Gender of Survey Respondents: LEYTE
Water District/ Aspects of Water Quality
Gender of Respondent Total
Male Female
Taste
Extremely unsatisfied 0.0% 0.0% 0.0%
Moderately unsatisfied 2.0% 4.7% 4.2%
Moderately satisfied 69.4% 62.6% 63.9%
Extremely satisfied 24.5% 27.6% 27.0%
Neither satisfied nor unsatisfied 2.0% 4.2% 3.8%
No Information 2.0% 0.9% 1.1%
Smell
Extremely unsatisfied 0.0% 0.0% 0.0% Moderately unsatisfied 4.1% 5.1% 4.9%
Moderately satisfied 67.3% 64.5% 65.0%
Extremely satisfied 24.5% 26.6% 26.2%
Neither satisfied nor unsatisfied 2.0% 2.8% 2.7%
No Information 2.0% 0.9% 1.1%
Color
Extremely unsatisfied 2.0% 0.0% 0.4%
Moderately unsatisfied 8.2% 8.4% 8.4%
Moderately satisfied 59.2% 59.8% 59.7%
Extremely satisfied 26.5% 26.2% 26.2%
Neither satisfied nor unsatisfied 2.0% 4.7% 4.2%
No Information 2.0% 0.9% 1.1%
Overall quality of water
Extremely unsatisfied 0.0% 0.0% 0.0% Moderately unsatisfied 4.1% 1.9% 2.3%
Moderately satisfied 61.2% 59.3% 59.7%
Extremely satisfied 32.7% 36.0% 35.4%
Neither satisfied nor unsatisfied 0.0% 1.9% 1.5%
No Information 2.0% .9% 1.1%
N Cases 49 214 263

Supplementary Appendix H
TA No. 7122-PHI: Water District Development Sector Project PPTA – Final Report – Vol. 10
104
Table G48d. Satisfaction Level on the Quality of Water from Various Sources of Non-connected Households by Gender of Survey Respondents: QUEZON
Water District/ Aspects of Water Quality
Gender of Respondent Total
Male Female
Taste
Extremely unsatisfied 0.0% 0.0% 0.0% Moderately unsatisfied 6.1% 7.5% 7.1%
Moderately satisfied 66.7% 70.0% 69.0%
Extremely satisfied 21.2% 16.3% 17.7%
Neither satisfied nor unsatisfied 6.1% 5.0% 5.3%
No Information 0.0% 1.3% .9%
Smell
Extremely unsatisfied 0.0% 1.3% 0.9%
Moderately unsatisfied 3.0% 8.8% 7.1%
Moderately satisfied 72.7% 62.5% 65.5%
Extremely satisfied 24.2% 20.0% 21.2%
Neither satisfied nor unsatisfied 0.0% 6.3% 4.4%
No Information 0.0% 1.3% 0.9%
Color
Extremely unsatisfied 0.0% 1.3% 0.9%
Moderately unsatisfied 6.1% 6.3% 6.2%
Moderately satisfied 66.7% 68.8% 68.1%
Extremely satisfied 21.2% 18.8% 19.5%
Neither satisfied nor unsatisfied 6.1% 3.8% 4.4%
No Information 0.0% 1.3% 0.9%
Overall quality of water
Extremely unsatisfied 0.0% 1.3% 0.9%
Moderately unsatisfied 3.0% 2.5% 2.7%
Moderately satisfied 69.7% 71.3% 70.8%
Extremely satisfied 21.2% 17.5% 18.6%
Neither satisfied nor unsatisfied 3.0% 5.0% 4.4%
No Information 3.0% 2.5% 2.7%
N Cases 33 80 113

Supplementary Appendix H
TA No. 7122-PHI: Water District Development Sector Project PPTA – Final Report – Vol. 10
105
Table G48e. Satisfaction Level on the Quality of Water from Various Sources of Non-
connected Households by Gender of Survey Respondents: KORONADAL
Water District/ Aspects of Water Quality
Gender of Respondent Total
Male Female
Taste
Extremely unsatisfied 3.6% 3.8% 3.7%
Moderately unsatisfied 6.0% 9.2% 8.4%
Moderately satisfied 63.9% 65.3% 64.9%
Extremely satisfied 25.3% 20.9% 22.0%
Neither satisfied nor unsatisfied 1.2% 0.4% 0.6%
No Information 0.0% 0.4% 0.3%
Smell
Extremely unsatisfied 2.4% 4.2% 3.7%
Moderately unsatisfied 6.0% 7.5% 7.1%
Moderately satisfied 63.9% 64.4% 64.3%
Extremely satisfied 26.5% 23.0% 23.9%
Neither satisfied nor unsatisfied 1.2% 0.4% 0.6%
No Information 0.0% 0.4% 0.3%
Color
Extremely unsatisfied 3.6% 3.8% 3.7%
Moderately unsatisfied 3.6% 7.9% 6.8%
Moderately satisfied 63.9% 64.0% 64.0%
Extremely satisfied 27.7% 23.4% 24.5%
Neither satisfied nor unsatisfied 1.2% 0.4% 0.6%
No Information 0.0% 0.4% 0.3%
Overall quality of water
Extremely unsatisfied 3.6% 3.3% 3.4%
Moderately unsatisfied 4.8% 8.4% 7.5%
Moderately satisfied 62.7% 64.0% 63.7%
Extremely satisfied 27.7% 23.4% 24.5%
Neither satisfied nor unsatisfied 1.2% 0.4% 0.6%
No Information 0.0% 0.4% 0.3%
N Cases 83 239 322

Supplementary Appendix H
TA No. 7122-PHI: Water District Development Sector Project PPTA – Final Report – Vol. 10
106
Table G49. Proportion of Survey Respondents who are Satisfied with Available Health
Services in Their Locality by Gender of Respondent: 5 Selected Water Districts
Water District / Health Facility Sought for Medical Services
Gender of Respondent Total
Male Female
LEGAZPI Percent of survey respondents satisfied with available health services in their locality
86.7% 84.8% 85.2%
N Cases 83 302 385 LA UNION Percent of survey respondents satisfied with available health services in their locality
96.7% 97.9% 97.6%
N Cases 92 285 377 LEYTE Percent of survey respondents satisfied with available health services in their locality
57.5% 60.3% 59.7%
N Cases 80 305 385 QUEZON Percent of survey respondents satisfied with available health services in their locality
90.2% 96.9% 94.8%
N Cases 123 261 384 KORONADAL Percent of survey respondents satisfied with available health services in their locality
92.9% 90.8% 91.3%
N Cases 99 293 392

Supplementary Appendix H
TA No. 7122-PHI: Water District Development Sector Project PPTA – Final Report – Vol. 10
1
ANNEX 2
DISTRIBUTION OF SAMPLE HOUSEHOLDS FOR THE WDDSP HOUSEHOLD SURVEY
I. LEGAZPI CITY WATER DISTRICT
Barangay # of HHs (2007) Sample HHs
Total
8,219 384
Serviced Barangays
7,012 363
Bgy 1 Bgy. 1 - Em's Barrio (Pob.)
837 43
Bgy 2 Bgy. 11 - Maoyod Pob. (Bgy. 10 & 11)
212 11
Bgy 3 Bgy. 21 - Binanuahan West (Pob.)
171 9
Bgy 4 Bgy. 25 - Lapu-lapu (Pob.)
218 11
Bgy 5 Bgy. 33 - PNR-Peñaranda St.-Iraya(Pob.)
549 28
Bgy 6 Bgy. 34 - Oro Site-Magallanes St. (Pob.)
521 27
Bgy 7 Bgy. 49 - Bigaa (Bgy. 44)
1,040 54
Bgy 8 Bgy. 57 - Dap-dap (Bgy. 69)
391 20
Bgy 9 Bgy. 44 - Pawa (Bgy. 61)
610 32
Bgy 10 Bgy. 42 - Rawis (Bgy. 65)
1,664 86
Bgy 11 Bgy. 58 - Buragwis
799 41
Proposed Expansion Areas
1,207 21
Bgy 12 Bgy. 66 - Banquerohan (Bgy. 43)
1,207 21
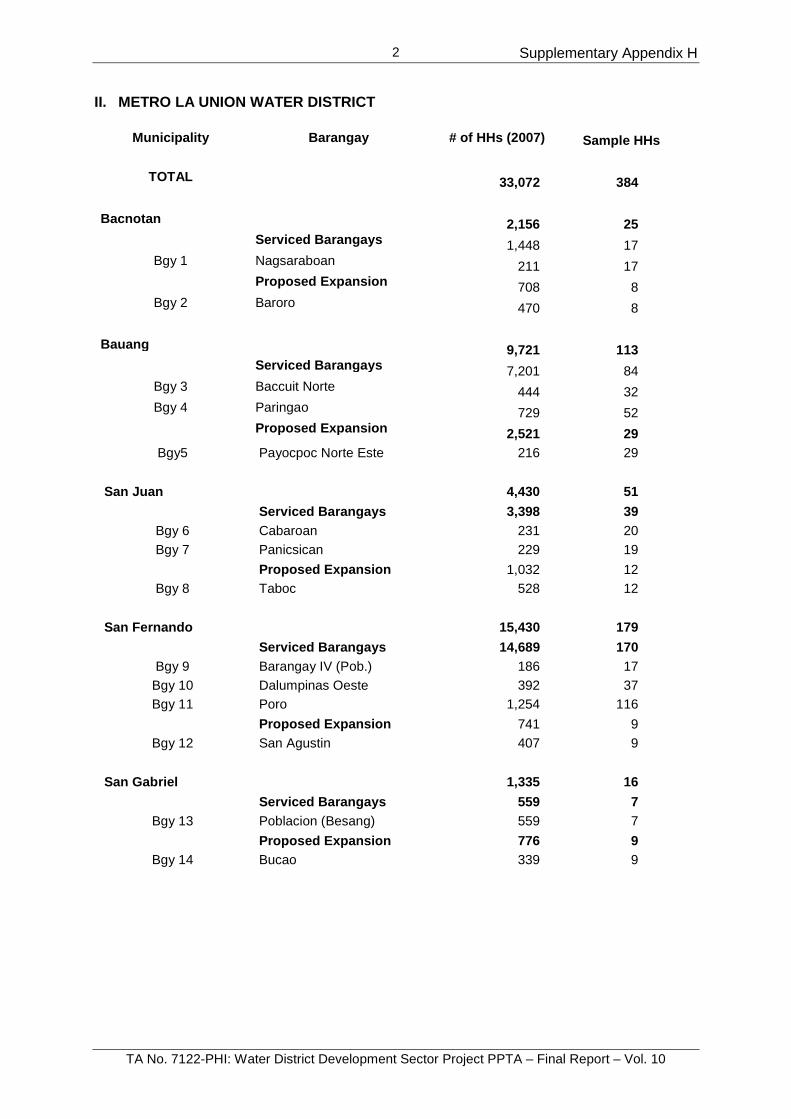
Supplementary Appendix H
TA No. 7122-PHI: Water District Development Sector Project PPTA – Final Report – Vol. 10
2
II. METRO LA UNION WATER DISTRICT
Municipality Barangay # of HHs (2007) Sample HHs
TOTAL 33,072 384
Bacnotan 2,156 25 Serviced Barangays 1,448 17
Bgy 1 Nagsaraboan 211 17 Proposed Expansion 708 8
Bgy 2 Baroro 470 8 Bauang 9,721 113 Serviced Ba rangays 7,201 84
Bgy 3 Baccuit Norte 444 32 Bgy 4 Paringao 729 52
Proposed Expansion 2,521 29 Bgy5 Payocpoc Norte Este 216 29
San Juan 4,430 51
Serviced Barangays 3,398 39 Bgy 6 Cabaroan 231 20 Bgy 7 Panicsican 229 19
Proposed Expansion 1,032 12 Bgy 8 Taboc 528 12
San Fernando 15,430 179
Serviced Barangays 14,689 170 Bgy 9 Barangay IV (Pob.) 186 17 Bgy 10 Dalumpinas Oeste 392 37 Bgy 11 Poro 1,254 116
Proposed Expansion 741 9 Bgy 12 San Agustin 407 9
San Gabriel 1,335 16
Serviced Barangays 559 7 Bgy 13 Poblacion (Besang) 559 7
Proposed Expansion 776 9 Bgy 14 Bucao 339 9

Supplementary Appendix H
TA No. 7122-PHI: Water District Development Sector Project PPTA – Final Report – Vol. 10
3
III. LEYTE METRO WATER DISTRICT
Municipality Barangay # of HHs (2007) Sample HHs Remarks
TOTAL
384
1. Dagami
20
Serviced Barangays
9
Bgy 1 Sampao East Pob. (Dist. 9) 125
9
Expansion Areas
11
Bgy 2 Caluctugan 104
11
2. Palo
58
Serviced Barangays
55
Bgy 3 Cangumbang 196 With public faucet
Bgy 4 Salvacion 390
Expansion Areas
3
Bgy 5 Barayong 333
3
3. Pastrana
13
Serviced Barangays
13
Bgy 6 Lanawan 156
13
4. Santa Fe
16
Serviced Barangays
8
Bgy 7 Pilit 227
8
Expansion Areas
8
Bgy 8 San Isidro 292
8
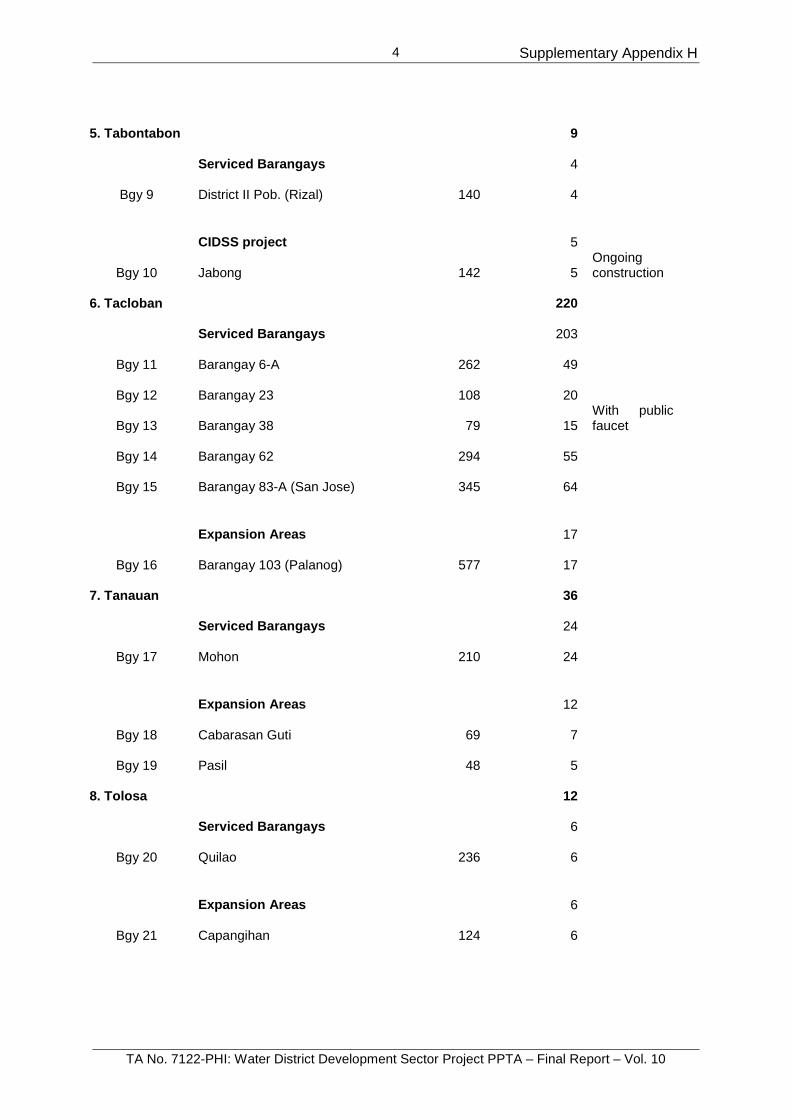
Supplementary Appendix H
TA No. 7122-PHI: Water District Development Sector Project PPTA – Final Report – Vol. 10
4
5. Tabontabon
9
Serviced Barangays
4
Bgy 9 District II Pob. (Rizal) 140
4
CIDSS project
5
Bgy 10 Jabong 142
5 Ongoing construction
6. Tacloban
220
Serviced Barangays
203
Bgy 11 Barangay 6-A 262
49
Bgy 12 Barangay 23 108
20
Bgy 13 Barangay 38 79
15 With public faucet
Bgy 14 Barangay 62 294
55
Bgy 15 Barangay 83-A (San Jose) 345
64
Expansion Areas
17
Bgy 16 Barangay 103 (Palanog) 577
17
7. Tanauan
36
Serviced Barangays
24
Bgy 17 Mohon 210
24
Expansion Areas
12
Bgy 18 Cabarasan Guti 69
7
Bgy 19 Pasil 48
5
8. Tolosa
12
Serviced Barangays
6
Bgy 20 Quilao 236
6
Expansion Areas
6
Bgy 21 Capangihan 124
6

Supplementary Appendix H
TA No. 7122-PHI: Water District Development Sector Project PPTA – Final Report – Vol. 10
5
IV. QUEZON METRO WATER DISTRICT
Municipality/Barangay
# of HHs (2007) Sample HHs Remarks
TOTAL
69,864
384
Lucena
43,872
241
Serviced Barangays
43,872
241
Bgy 1 Barangay 3 (Pob.)
286
7
Bgy 2 Gulang-gulang
5,310
126
Bgy 3 Ibabang Iyam
4,551
108
Pagbilao
9,063
50
Serviced Barangays
7,529
42
Bgy 4 Bukal
1,745
33
Bgy 5 Barangay 2 Daungan (Pob.)
463
9
Expansion Areas
1,534
8
Bgy 6 Silangan Malicboy
973
8
Tayabas
16,930
93
Serviced Barangays
14,319
79
Bgy 7 Angeles Zone IV
262
16
Bgy 8 Dapdap
446
27
Bgy 9 Domoit Kanluran
74
5 Water source
Bgy 10 Potol
182
11
Bgy 11 Tongko
321
20
Expansion Areas
2,611
14
Bgy 12 Palale Kanluran
333
6
Bgy 13 Palale Silangan
518
8
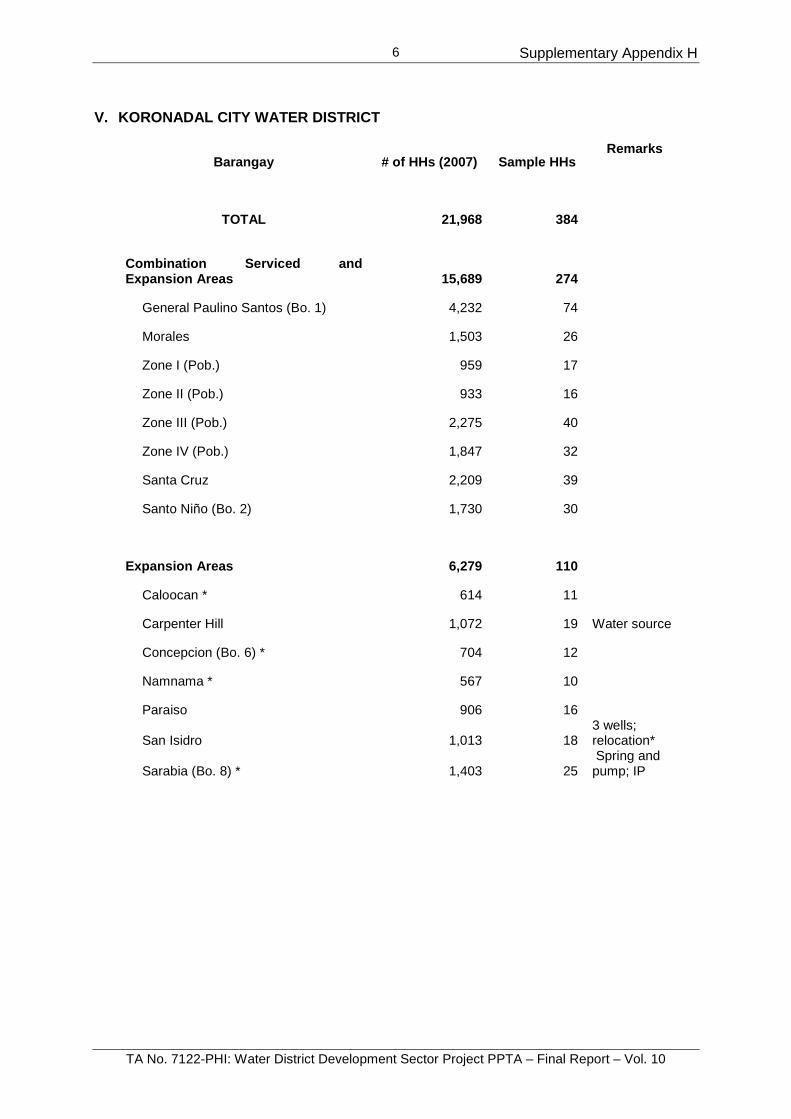
Supplementary Appendix H
TA No. 7122-PHI: Water District Development Sector Project PPTA – Final Report – Vol. 10
6
V. KORONADAL CITY WATER DISTRICT
Barangay # of HHs (2007) Sample HHs Remarks
TOTAL 21,968 384
Combination Servi ced and Expansion Areas 15,689 274
General Paulino Santos (Bo. 1) 4,232 74
Morales 1,503 26
Zone I (Pob.) 959 17
Zone II (Pob.) 933 16
Zone III (Pob.) 2,275 40
Zone IV (Pob.) 1,847 32
Santa Cruz 2,209 39
Santo Niño (Bo. 2) 1,730 30
Expansion Areas 6,279 110
Caloocan * 614 11
Carpenter Hill 1,072 19 Water source
Concepcion (Bo. 6) * 704 12
Namnama * 567 10
Paraiso 906 16
San Isidro 1,013 18 3 wells; relocation*
Sarabia (Bo. 8) * 1,403 25 Spring and pump; IP

Supplementary Appendix H
TA No. 7122-PHI: Water District Development Sector Project PPTA – Final Report – Vol. 10
1
SOCIO-ECONOMIC AND WATER AND SANITATION HOUSEHOLD SURVEY - WDDSP
ANNEX 3: QUESTIONNAIRE (ENGLISH) Instruction: Please do not leave any item blank. Write N/A if the question does not apply. Please specify where response is “Others”
PART 1
Section A. Household Identification Household ID No. _______ Date of Interview: _____________ A1. Location 1 Rural 2 Urban
Interviewed by: Checked by: Encoded by:
A2. Town/City_______________________________________ A3. House Number/ Street/ Sitio: __________________________
A4. Barangay: ______________________________
A5. NAME of Respondent: A6. Relationship of Respondent with Household Head: 1 HH head 2 Spouse 3 Child 4 Relative
A7. Civil Status: 1 Single 3 Separated 2 Married 4 Widow/er
A8. Gender of Respondent: 1 Male 2 Female
A9. Household Composition: Total number of persons living in the Household: _____ Number of persons living in the Household who are 14 years
old and below: ______ Number of persons living in the Household who are 65 years
or over: ______
A10. Number of Households living in the dwelling unit : ______
A11. Year since the Household first stayed in the
barangay: _______________ (e.g., 1995, 2005)
Section B. General Information about Household Head B1. Name of Household Head : ________________________________________ B2. Age: ______ B3. Gender of Household head 1 Male 2 Female B4. Ethnic affiliation of HHead:__________________ B5. Highest grade completed by the Household Head?
1 No schooling 2 Elementary 3 High School 4 Vocational training 5 College and over
B6. What is the current occupation of the Household Head? 1 Farming or fishing 6 Street vendor 2 Own business 7 Retired/Pensioner 3 Government employee 8 Unemployed 4 Private employee 9 Others, specify: 5 Temporary labourer _________________
Section C. Housing and Land Tenure C1. What is the ownership status of your house?
1 House owner 2 Caretaker 3 Rent-free occupant 4 Renter 5 Others, specify:________________
C2. What is the ownership status of the lot on which the house is built? 1 Owned 2 Caretaker 3 Rented/Leased 4 Common property with other family members or relatives 5 Government land 6 Others, specify:__________________________________
C3. Type of building/house 1 Single 2 Duplex 3 Apartment /condo/townhouse 4 Commercial/industrial or agricultural bldg 5 Others, specify: _____________________
C4. Observed materials that make up the dwelling unit: 1 Strong materials (galvanized iron, tile, concrete, brick stone) 2 Light materials (cogon, nipa, anahaw, wood) 3 Mixed but predominantly strong materials 4 Mixed but predominantly light materials 5 Salvaged/makeshift materials 6 Mixed but predominantly salvaged materials

Supplementary Appendix H
TA No. 7122-PHI: Water District Development Sector Project PPTA – Final Report – Vol. 10
2
Section D. Household Income and Expenditure D1. How many members of this household are currently working or employed? _______ D2. How many persons contribute to household income? _______
Income Expenditures Savings
D3. What is the estimated monthly income of your household for the past month?
From regular employment: ___________________
From other sources: Business _______________ Pension ______________ Agriculture ______________ Remittances (from Phil) _________ Remittances (OFW) ____________ Others ______________
D4. In your estimate, how much does your household spend for the following? (In pesos)
Food (per week) _____________ Clothing (per year) _____________ Housing (amortization/
rent, repair, etc.) per year _____________ Transportation (per week) _____________ Education (per year) _____________ Furniture/appliances (per year) ___________ Utilities (per month) a. Water _____________ b. Electricity _____________ c. Telecommunications
(telephone, cell phone, internet)_________ d. Fuel for cooking (LPG,
kerosene, charcoal, wood) __________
Medical bills (per month) __________ Entertainment/recreation __________ Remittances to relatives outside
household __________ Betting __________ Cigarette/alcohol (per month) __________ Others, (e.g., TV cable) specify __________
D5. On average, how much of your net income are you able to save in a month?
1 None 2 Less than P1000 3 P 1000 – 1999 4 P 2000 – 2,999 5 P 3,000 - 3,999 6 P 4,000 – 4,999 7 P 5,000 or over
D6. What valuable items are owned by the household?
Item Yes – 1 No – 2
How many?
Transport (car, motorcycle, tricycle) Truck
TV
Refrigerator
Telephone/Cellphone Washing machine
Airconditioner
Personal Computer
Electric water pump/ overhead tank
Others ____________
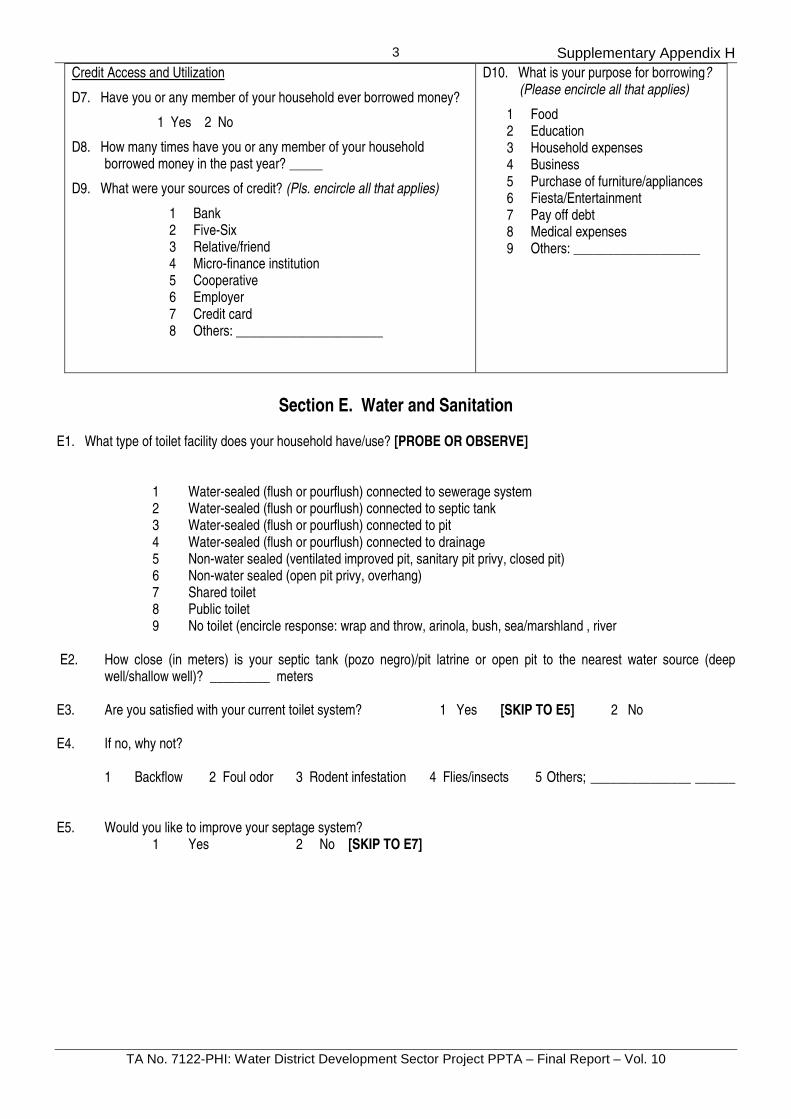
Supplementary Appendix H
TA No. 7122-PHI: Water District Development Sector Project PPTA – Final Report – Vol. 10
3
Credit Access and Utilization
D7. Have you or any member of your household ever borrowed money?
1 Yes 2 No
D8. How many times have you or any member of your household borrowed money in the past year? _____
D9. What were your sources of credit? (Pls. encircle all that applies)
1 Bank 2 Five-Six 3 Relative/friend 4 Micro-finance institution 5 Cooperative 6 Employer 7 Credit card 8 Others: ______________________
D10. What is your purpose for borrowing? (Please encircle all that applies)
1 Food 2 Education 3 Household expenses 4 Business 5 Purchase of furniture/appliances 6 Fiesta/Entertainment 7 Pay off debt 8 Medical expenses 9 Others: ___________________
Section E. Water and Sanitation
E1. What type of toilet facility does your household have/use? [PROBE OR OBSERVE]
1 Water-sealed (flush or pourflush) connected to sewerage system 2 Water-sealed (flush or pourflush) connected to septic tank 3 Water-sealed (flush or pourflush) connected to pit 4 Water-sealed (flush or pourflush) connected to drainage 5 Non-water sealed (ventilated improved pit, sanitary pit privy, closed pit) 6 Non-water sealed (open pit privy, overhang) 7 Shared toilet 8 Public toilet 9 No toilet (encircle response: wrap and throw, arinola, bush, sea/marshland , river
E2. How close (in meters) is your septic tank (pozo negro)/pit latrine or open pit to the nearest water source (deep
well/shallow well)? _________ meters E3. Are you satisfied with your current toilet system? 1 Yes [SKIP TO E5] 2 No E4. If no, why not?
1 Backflow 2 Foul odor 3 Rodent infestation 4 Flies/insects 5 Others; _______________ ______
E5. Would you like to improve your septage system?
1 Yes 2 No [SKIP TO E7]

Supplementary Appendix H
TA No. 7122-PHI: Water District Development Sector Project PPTA – Final Report – Vol. 10
4
E6. If YES (in E5), what improvement would you prefer?
Type of Improvement
Willing to install/use service?
1 Yes 2 No
Would you be willing to pay for improvement or
service? 1 Yes 2 No
**How much would you be willing to pay?
1 Installation of septic tank 1 P 10,000 - 14,999 2 P 15,000 - 19,999 3 P 20,000 - 25,000 4 Others: __________
2 Improvement/rehabilitation of existing septic tank
1 P 5,000 - 9,999 2 P10,000 - 14,999 3 P15,000 or over 4 Others: __________
3 De-sludging of septic tank (Prevailing rate in the area ___________)
___________________
4 Others, specify: _____________ ______________________________
**Note to interviewer: Before asking question, please use introduction that a septic tank which is emptied and cleaned regularly reduces the risk of leaking contaminants in the ground, thus, reducing the risk of water-related diseases such as diarrhea, dysentery, intestinal worms, etc. However, maintaining and emptying the septic tank may entail cost.
E7. What is/are your primary source(s) of water? [Encircle all sources mentioned]
1 Piped connection 2 Public/Street faucet [IF PIPED CONNECTION IS NOT MENTIONED, 3 Deep well GO TO PART 3] 4 Shallow well 5 Spring/River/Pond/Stream 6 Rain 7 Water vendors (e.g, bottled water, container, peddlers) 9 Others; Specify: _______________________
E8. Does your household receive water from the ______ Water District (__WD)?
1 Yes [SKIP TO E9] 2 No [CONTINUE]
If NO, where does your piped water come from?
1 Neighbor who has own __WD piped connection [GO TO PART 3] 2 Others, specify: __________________ [GO TO PART 3]
E9. What is your meter number? ___________________ If none, [SKIP TO PART 3] E10. Does your household receive monthly water bills from __WD?
1 Yes [SKIP TO PART 2] (HH’s with direct __WD connection) 2 No
If NO, why are you not receiving monthly water bills from MIWD?
1 Already disconnected [GO TO PART 3] 2 I don’t know why they do not send the water bill [GO TO PART 2] 3 We get free water supply from __WD [GO TO PART 2] 4 Others; specify__________________________________ [PROBE FURTHER AND BASED ON
RESPONSES, DECIDE WHETHER THEY STILL HAVE CONNECTIONS TO __WD]

Supplementary Appendix H
TA No. 7122-PHI: Water District Development Sector Project PPTA – Final Report – Vol. 10
5
PART 2 HOUSEHOLDS WITH __WD PIPED CONNECTIONS
2.1 What do you think are the most important reasons for having a water connection?
1 Convenience 5 Alternative source(s) of water not adequate; quality not 2 2 2 Health safeguard against water-borne diseases satisfactory 3 Reliability of water supply 6 Cheaper 4 Status symbol (lifestyle) 7 Others, specify: ___________________
2.2 How much piped water does your household consume per month? ___________cubic meter per month [SEE MONTHLY BILL]
2.3 How much is the average monthly water bill that your household pays to the ___WD? Php __________________ per
month 2.4 Do you provide piped water to your neighbour or relatives who have no piped water connection?
1 Yes 2 No [SKIP TO 2.6]
2.5 If yes, how many households/families other than your own household use water from your piped water connection? ________ households/families
2.6 Are you being charged by __WD on: 1 Residential rate 2 Commercial rate 2.7 How many hours per day, on the average, do you receive water from the piped water system? __________ hours per
day 2.8 How many days per week do you receive water from the piped water system? _______ days per week 2.9 During the summer/dry season, how many days per week do you receive water from the piped water system?
_________ days 2.10 During the rainy season, how many days per week do you receive water from the piped water system? ________ days 2.11 How do you rate your satisfaction with the quality of water supplied by the piped water system? [CHECK]
Extremely unsatisfied
Moderately unsatisfied
Moderately satisfied
Extremely satisfied
Neither satisfied nor unsatisfied
Taste Smell Color Overall quality
2.12 Has any member of your household suffered from water-related diseases during the last 12 months (April 2007 to
March 2008) due to consumption of water supplied by piped water system? 1 Yes 2 No [SKIP TO 2.14]

Supplementary Appendix H
TA No. 7122-PHI: Water District Development Sector Project PPTA – Final Report – Vol. 10
6
2.13 If YES, how many household members were afflicted by water-related diseases during the last 12 months and what
types of diseases, average number of days sick and cost of medication? [MULTIPLE RESPONSES]
Type of Disease
No. of HH members who got sick
Average number of
days member(s) were sick
Total cost of
medication
Sought treatment from: 1 – Hospital 2 - Barangay Health
Center 3 - Municipal clinic 4 – herbolario 5 - self treatment 6 – no treament
Adults Children
Diarrhea or bowel movement at least 3x/day
Amoebiasis Gastroenteritis Dysentery Typhoid fever Dengue/Malaria Skin diseases such as scabies,
or other types of skin infection
Sore eyes Worms – passage of worms
upon bowel movement or thru body part
Others, specify Total
*May include costs for hospitalization, doctor's fees, laboratory tests, medicine, and transport costs. 2.14 How would you describe the current pressure of your piped water?
1 Very adequate (meaning, water comes out adequately from the shower/faucet in the second floor of the house) 2 Adequate (meaning, water comes out adequately from the shower or sink faucet in the ground floor of the house) 3 Poor (meaning, water comes out only from the water outlet about 2 feet in height inside the house) 4 Very poor (meaning, water comes out only from the water outlet infront or outside the house)
2.15 Do you use a pump to increase the pressure of your piped water? 1 Yes 2 No 2.16 Do you treat the water from your faucet before drinking? 1Yes 2 No [SKIP TO 2.18] 2.17 If YES, what is your method of treatment, volume treated per day, the cost of treatment and cost of installing the
treatment system/equipment?
Treatment Method Number of ______
(unit) per day 1 Cost of treatment per
day 2 Cost of installation of system or equipment
Boiling Boiling + filtering Filtering Adding chemicals (e.g, chlorine) Others, specify: ____________
1Record any unit of measurement mentioned, i.e., gallons, bucket, tanks, etc. Validate by checking the container being used by the respondent in estimating, then, later estimate volume in gallons if 1 gallon = 3.785 liters, 2Include estimated costs of chemicals added and fuel used for boiling, i.e., electricity, LPG, kerosene, fuel wood, charcoal.

Supplementary Appendix H
TA No. 7122-PHI: Water District Development Sector Project PPTA – Final Report – Vol. 10
7
2.18 Do you have a water storage tank? 1 Yes 2 No [GO TO 2.19]
If YES, what is the total capacity of the storage tank? ________________ in cubic meters How much did you spend to install the storage tank? Php ___________
2.19 If you have no storage tank, where do you store your water? What type of storage, total volume of storage?
Storage capacity 1
Unit of Measurement (liters,
gallons, cubic meter)
1 Drum _______________ _______________ 2 Bucket/pail/kerosene can _______________ _______________ 3 Others, specify: ________________ _______________ _______________ 3 None (Does not store)
1Record any unit of measurement mentioned, i.e., gallons, bucket, tanks, etc. Validate by checking the container being used by the respondent in estimating, then, later estimate volume in cubic meters if 1 gallon = 3.785 liters, 1 drum = 200 liters, 1 cubic meter = 1000 liters
2.20 Is the water that you receive from your piped water connection sufficient for your basic domestic needs? 1 Yes [SKIP TO 2.22] 2 No 2.21 If NO (in 2.20), where do you get your additional water needs?
Secondary sources
Distance of source from the house
(in meters)
Volume of water used
per day 1
[SPECIFY UNIT
MENTIONED]
Total cost of water used per
day2
(in Pesos)
Time consumed by the HH to collect (minutes per day)
Used for what? (CHECK)
Installation cost3
(in Pesos)
Dri
nki
ng
Co
oki
ng
Bat
hin
g
Lau
nd
ry
Gar
den
ing
Oth
ers_
____
____
Public faucet Private deep well Private shallow
well
Spring/River/ Stream/ Pond
Rain Water vendors Purified water refilling station
Others: _____________
1Record any unit of measurement mentioned, i.e., gallons, bucket, tanks, etc. Validate by checking the container being used by the respondent in estimating, then, later estimate volume in cubic meters if 1 gallon = 3.785 liters, 1 drum = 200 liters, 1 cubic meter = 1000 liters 2Include O&M costs, payment made to delivery person or tanker, cost of electricity, etc. 3Include construction cost of well, cost of pump and its installation, etc.

Supplementary Appendix H
TA No. 7122-PHI: Water District Development Sector Project PPTA – Final Report – Vol. 10
8
2.22 How would you rate the performance of __WD piped water supply service? CHECK
Very Poor
Poor
No Comment
Good
Very Good
Continuity of water supply _____ _____ _____ _____ _____ Reliability of water meter _____ _____ _____ _____ _____ Regularity of billing and collection _____ _____ _____ _____ _____ Response to customer complaints _____ _____ _____ _____ _____ Repair time/service _____ _____ _____ _____ _____ Overall water supply service _____ _____ _____ _____ _____
2.23 TO BE ASKED ONLY FROM THOSE WHO ANSWERED NO IN 2.20 If the existing __WD piped water system is
improved, such that all households receive 24-hour service 7 days a week, and water is safe to drink (meaning, no need to boil/filter water or buy bottled water), are you willing to get your additional water needs from the __WD piped connection? 1 Yes 2 No
If NO, where do you think your household would obtain the water?
1 Private well 2 Water vendors 3 Others, specify:_______________________ 4 Don’t know/not sure
2.24 Your access to the improved __WD water supply system would mean additional cost to you in terms of increased
monthly water bill and possibly a higher tariff to make up for the investments of __WD. Currently, you are paying an average of Php _____ per month (from Question 2.3). As a consequence of the improvements, how much would your household be willing to pay per month for water? Would you be willing to pay _______? (Bidding game; Ask each amount sequentially from Php 1,000/mo to Php 150/mo.) CHECK IF ANSWER IS YES.
Php 1,000/month ______ Php 500/month ______ Php 250/month _____ Php 900/month ______ Php 450/month ______ Php 200/month _____ Php 800/month ______ Php 400/month ______ Php 150/month _____ Php 700/month ______ Php 350/month ______ Php 600/month ______ Php 300/month ______
2.25 What would be your main reasons for staying connected with the improved __WD piped water system? 1 Really want/need the improved water service 2 Increased water bill is not too high 3 Worried about the health risks of drinking water from other sources 4 Other reasons, specify: __________________________________________
_____________________________________________________________
2.26 If the __WD service would be improved, what aspect of WD service would you like to be prioritized? [CHECK ONE]
1 Water pressure 2 Billing 3 Complaints handling 4 Reduced water rates 5 Repairs 6 Iba pa, specify: _____________
Please Proceed to PART 4

Supplementary Appendix H
TA No. 7122-PHI: Water District Development Sector Project PPTA – Final Report – Vol. 10
9
PART 3 HOUSEHOLDS NOT CONNECTED TO __WD SYSTEM
3.1 Where do you get your supply of water for the following domestic uses?
Water Uses
Sources
(Use CODES below)
Distance from
source (in
meters)
Volume of water used per
day 1 (___
units)
Estimatedcost of
water used per
day2
(in Pesos)
Estimated Time
consumed to collect (minutes per day)
Frequency of sourcing
Days/ month
Installation cost3
of source (in Pesos)
Drinking Cooking Bathing Gardening Cleaning
CODES for Sources: 1 Piped water (not own connection) 5 Spring/River/Stream/ Pond 2 Public faucet/ hydrant 6 Rain 3 Private deep well 7 Water vendors (bottled, 5-gallon containers) and peddlers 4 Private shallow well 8 Others, specify: _______________
1Record any unit of measurement mentioned, i.e., gallons, bucket, tanks, etc. Validate by checking the container being used by the respondent in estimating, then, later estimate volume in cubic meters if 1 gallon = 3.785 liters, 1 drum = 200 liters, 1 cubic meter = 1000 liters 2Include O&M costs, payment made to delivery person or tanker, cost of electricity, etc.
3Include construction cost of well, cost of pump and its installation, etc.
3.2 IF THE SOURCE IS PIPED WATER IN 3.1 (FOR ANY USE), Do you pay for your supply of piped water?
1 Yes 2 No If YES, to whom do you pay?
1 Neighbor who has own __WD piped connection 2 Others, specify: _______________________ 3.3 What are the reasons why your household does not have __WD piped water connection?
1 Connection fee too high 5 House is being rented 2 Monthly charges too high 6 Waiting list for connection 3 Connection is not available 7 Disconnected 4 Present water source is adequate and satisfactory 8 Others, specify:
_________________________
3.4 How sufficient is the supply of water in your household? 1 Sufficient all year round 2 Insufficient during dry season 3 Insufficient sometimes 4 Insufficient mostly
3.5 Water Collection, Storage and Transport:
Water Collection and Storage
Who usually fetches water from the source? 1 Adult male household member(s) 2 Adult female household
member(s) 3 Children 4 Others, specify: ______________
Water Transport How is water being transported? 1 Water truck 2 Tricycle 3 Carry using pail/open containers 4 Carry using closed water
containers 5 Others ____________________
How much time is spent collecting water per day?
1 0.5 – 1 hr 2 1.1 - 2hrs 3 2 – 4 hrs 4 5 hrs or more 9 Not applicable
What time of day do you collect water? 1 Morning 3 Evening 2 Afternoon 4 Anytime
3.6 How do you rate your satisfaction with the quality of the water derived from your source? [CHECK]

Supplementary Appendix H
TA No. 7122-PHI: Water District Development Sector Project PPTA – Final Report – Vol. 10
10
Extremely
unsatisfied Moderately unsatisfied
Moderately satisfied
Extremely satisfied
Neither satisfied nor unsatisfied
Taste Smell Color Overall quality
3.7 Has any member of your household suffered from water-related diseases during the last 12 months (April 2008 to
March 2009) due to consumption of water obtained from your source? 1 Yes 2 No [SKIP TO 3.9]
3.8 If YES, how many household members were afflicted by water-related diseases during the last 12 months and what
types of diseases, average number of days sick and cost of medication? [MULTIPLE RESPONSES]
Type of Disease
No. of HH members who got sick
Average number of
days member(s) were sick
*Total cost of
medication
Sought treatment from: 1 Health center 2 Private clinic 3 Government hospital 4 Private hospital 5 Herbolario 6 Self medication 7 Others; specify ____
Adults Children
Diarrhea or bowel movement at least 3x/day
Amoebiasis Gastroenteritis Dysentery Typhoid fever Dengue/Malaria Skin diseases such as scabies,
or other types of skin infection
Sore eyes Worms – passage of worms
upon bowel movement or thru body part
Others, specify Total
*May include costs for hospitalization, doctor's fees, laboratory tests, medicine, and transport costs.
3.9 Do you treat the water that you get from your source before drinking?
1 Yes 2 No [SKIP TO 3.11] 3.10 If YES, what is your method of treatment, volume treated per day, the cost of treatment and cost of installing the
treatment system/equipment?
Treatment Method Number of ______
(unit) per day 1 Cost of treatment per
day 2 Cost of installation of system or equipment
Boiling Boiling + filtering Filtering Adding chemicals (e.g, chlorine) Others, specify: ____________
1Record any unit of measurement mentioned, i.e., gallons, bucket, tanks, etc. Validate by checking the container being used by the respondent in estimating, then, later estimate volume in gallons if 1 gallon = 3.785 liters, 2Include estimated costs of chemicals added and fuel used for boiling, i.e., electricity, LPG, kerosene, fuel wood, charcoal.

Supplementary Appendix H
TA No. 7122-PHI: Water District Development Sector Project PPTA – Final Report – Vol. 10
11
3.11 Do you have a water storage tank? 1 Yes 2 No [SKIP TO 3.12]
If YES, what is the total capacity of the storage tank? ________________ in cubic meters What much did you spend to install the storage tank? Php ___________
3.12 If you have no storage tank, where do you store your water? What type of storage, total volume of storage?
Storage capacity 1
Unit of Measurement
(liters, gallons, cubic meter)
1 Drum _______________ ______________ 2 Bucket/pail/kerosene can _______________ ______________ 3 Others, specify: ________________ _______________ ______________ 4 None (Does not store)
1Record any unit of measurement mentioned, i.e., gallons, bucket, tanks, etc. Validate by checking the container being used by the respondent in estimating, then, later estimate volume in cubic meters if 1 gallon = 3.785 liters, 1 drum = 200 liters, 1 cubic meter = 1000 liters
3.13 If you are given a chance to connect to the existing __WD piped water system for which you have to pay a one-time
connection charge of Php ____ and an average amount of Php___ per month in water bill, would you be willing to connect to the system? 1 Yes [SKIP TO 3.15] 2 No [CONTINUE]
3.14 Your existing __WD piped water system will be improved such that all households receive 24-hour service 7 days a
week, water is safe to drink (no need to boil/filter water or buy bottled water), and water pressure is sufficient. This means that your household could source all your water needs from the system without having to get from your current sources. To be connected to the improved system, however, you have to pay a one-time connection charge of Php ___ and an average amount of Php___ per month in water bill. Would you be willing to connect to the system?
1 Yes 2 No [SKIP TO 3.16] 3.15 If YES (in 3.13 or 3.14), what are your reasons for your willingness to connect to the __WD piped water system?
1 Really want/need the improved water service 2 Water bill is not too high 3 Worried about the health risks of the water from current source 4 Other reasons, specify:
_____________________ [GO TO 3.17]
3.16 If NO (in 3.14), what are your reasons for not wanting to connect to the improved piped network?
1 Do not really want/need the improved service 2 Monthly water bill is too high and I cannot afford it 3 Connection charge is too high 4 Not worried about the health risks from my existing water source 5 Happy with our existing water source 6 Other reasons, specify: _______________________________________
[STOP, GO TO PART 4]
3.17 To access the improved piped water supply means that your household will have to pay monthly water bill which will be computed based on the quantity of water your household will consume and applicable tariffs. How much would your household be willing to pay per month for water bill? Would you be willing to pay _______? (Bidding game; Ask each amount sequentially from Php 1000/mo to Php 150/mo.) CHECK IF ANSWER IS YES, THEN STOP.
Php 1,000/month ______ Php 500/month ______ Php 250/month _____ Php 900/month ______ Php 450/month ______ Php 200/month _____ Php 800/month ______ Php 400/month ______ Php 150/month _____ Php 700/month ______ Php 350/month ______ Php 600/month ______ Php 300/month ______

Supplementary Appendix H
TA No. 7122-PHI: Water District Development Sector Project PPTA – Final Report – Vol. 10
12
PART 4 SECTION F: HYGIENE, HEALTH AND HEALTH SERVICES
F1. Washing of hands:
Do members of the household wash hands …… ?
[ENCIRCLE RESPONSE]
HOW? 1 With soap and water 2 With water only 3 Do not wash hands 4 Others, specify 9 Not applicable (do
not wash hands] (Indicate code below)
Before cooking? 1 Yes 2 No Before eating? 1 Yes 2 No After using the toilet? 1 Yes 2 No Before breastfeeding? 1 Yes 2 No Before feeding children? 1 Yes 2 No After changing diapers? 1 Yes 2 No After washing the children after toilet? 1 Yes 2 No
F2. Where do children/infants in the household go for toilet
purposes?
1 Toilet 2 Gutter/water canals 3 River 4 Garden/backyard 5 Urinals/urinola 6 Others, _________
F4. Were there children in the household who died before
reaching the age of 6? 1 Yes 2 No 1f yes, cause of death? __________________________ ______________________________________________ F5. Were there household members who died due to
pregnancy/childbirth?
1 Yes 2 No F3. How many times does the household usually eat in a
day? 1 1-2 times a day 2 3 times a day 3 4 times or more
F6. What are the hygiene and sanitation problems in the
community? 1 Lack of water for washing and cleanliness 2 No/irregular garbage collection 3 Exposed drainage system 4 Flies 5 Others, specify:
________________________________ F7. Are there initiatives to improve hygiene and sanitation
in your community? 1 Yes 2 No
F8. If YES in F7, what are the hygiene and sanitation initiatives in the community?
1 Public awareness campaign 2 Rules and regulations, please mention _______ 3 Inspection 4 Cleanliness and beautification contests 5 Others, specify: _____________________________
___________________________________ ________________________________
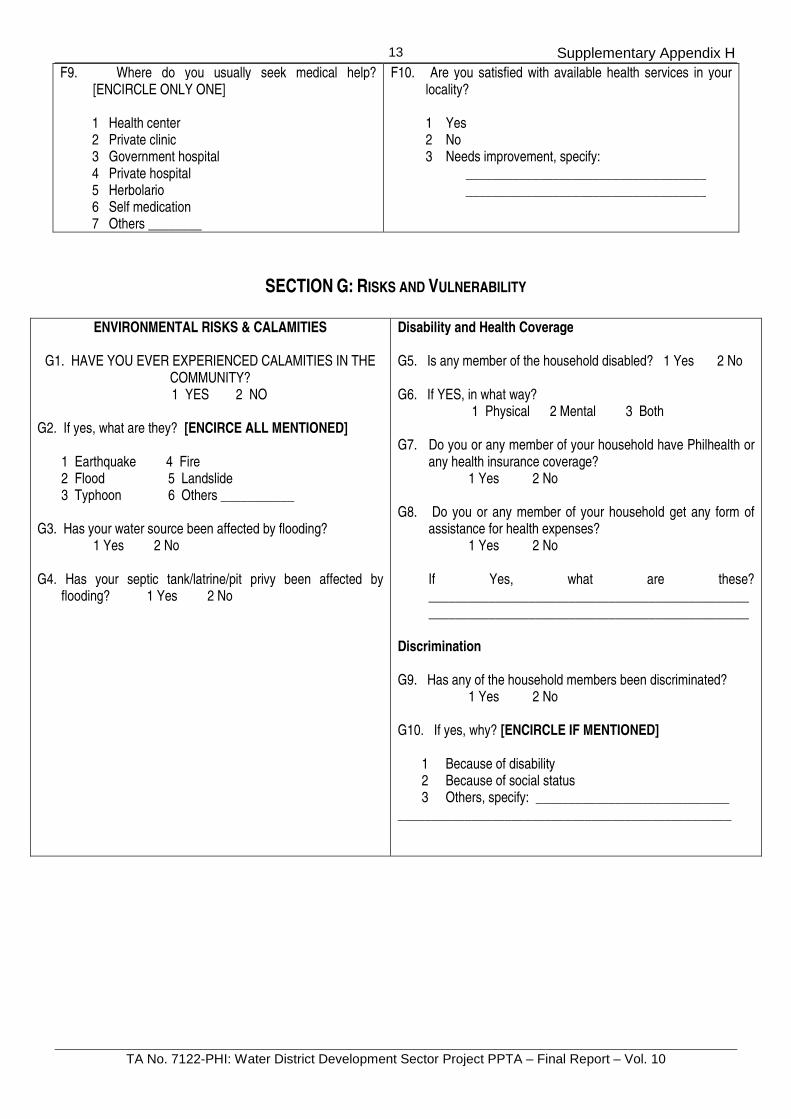
Supplementary Appendix H
TA No. 7122-PHI: Water District Development Sector Project PPTA – Final Report – Vol. 10
13
F9. Where do you usually seek medical help? [ENCIRCLE ONLY ONE]
1 Health center 2 Private clinic 3 Government hospital 4 Private hospital 5 Herbolario 6 Self medication 7 Others ________
F10. Are you satisfied with available health services in your locality?
1 Yes 2 No 3 Needs improvement, specify: ____________________________________
____________________________________
SECTION G: RISKS AND VULNERABILITY
ENVIRONMENTAL RISKS & CALAMITIES
G1. HAVE YOU EVER EXPERIENCED CALAMITIES IN THE COMMUNITY? 1 YES 2 NO
G2. If yes, what are they? [ENCIRCE ALL MENTIONED]
1 Earthquake 4 Fire 2 Flood 5 Landslide 3 Typhoon 6 Others ___________
G3. Has your water source been affected by flooding?
1 Yes 2 No G4. Has your septic tank/latrine/pit privy been affected by
flooding? 1 Yes 2 No
Disability and Health Coverage G5. Is any member of the household disabled? 1 Yes 2 No G6. If YES, in what way?
1 Physical 2 Mental 3 Both G7. Do you or any member of your household have Philhealth or
any health insurance coverage? 1 Yes 2 No
G8. Do you or any member of your household get any form of
assistance for health expenses? 1 Yes 2 No
If Yes, what are these? ________________________________________________________________________________________________
Discrimination G9. Has any of the household members been discriminated?
1 Yes 2 No G10. If yes, why? [ENCIRCLE IF MENTIONED]
1 Because of disability 2 Because of social status 3 Others, specify: _____________________________
__________________________________________________

Supplementary Appendix H
TA No. 7122-PHI: Water District Development Sector Project PPTA – Final Report – Vol. 10
14
Section H: Social Networks
H1. Are you or any member of your household a member of an organization or association/s (in/out of community): 1 Yes 2 No [SKIP TO H7]
H2. Name of organization (s) : 1. ____________________________________ 2. ____________________________________ 3. ____________________________________ H3. Type of organization:
1 Home Owners Association 2 Cooperative 3 Women’s group 4 Savings group 5 Religious org 6 Others _______________
H4. WHAT ARE THE PROJECTS OF THE ORGANIZATION/S?
[ENCIRCLE ALL MENTIONED] 1 Peace and order 4 Savings 2 Livelihood 5 Religious 3 Health 6 Others
_______________ H5. MEMBERSHIP STATUS
1 Active 2 Inactive
H6. If active, in what ways? [ENCIRCLE ALL MENTIONED]
1 Attends meetings 2 Votes during elections 3 Gives suggestions 4 Being consulted in decisions 5 Others:_______________ _________
H7. Did you or any eligible member of your household vote during the last national or local election?
1 Yes 2 No
H8. If no, why not?
1 Not registered 2 Not interested 3 Busy 4 Others: __________ ____________________
H9. What are the NGOs and agencies present in the community/district?
Forms of assistance given by the NGOs and agencies To your household To the community
1. 2. 3.
Section I. Gender
I1. In the home, who decides on the following?
1 Husband 3 Both Husband/Wife 2 Wife 4 Other member(s) of the household;
specify relationship to household head (Indicate code below)
a. When to buy household equipment b. When to renovate the house c. When to build a toilet/septic tank d. The family’s economic activity e. To bring the children to the doctor when sick f. On water connection
I2. In the home, who is responsible for doing the following?
1 Husband 3 Both Husband/Wife 2 Wife 4 Other member(s) of the household;
specify relationship to household head (Indicate code below)
a. Supervising/reminding the children to wash hands b. Cleaning the toilet and water containers c. Removing garbage d. Cleaning drainage/sewage systems

Supplementary Appendix I
TA No. 7122-PHI: Water District Development Sector Project PPTA – Final Report – Vol. 10
STAKEHOLDER CONSULTATION AND PARTICIPATION
Contents 1 Stakeholder Consultation and Participation Plan ................................................. 1 2 Implementation of Stakeholder Consultation and Participation ............................ 2 2.1 Stakeholder Analysis .................................................................................... 2 2.2 Methodology ................................................................................................. 3 3 Summary of Consultations ................................................................................... 4 3.1 Metro La Union Water District ..................................................................... 4 3.2 Quezon Metro Water District ....................................................................... 4 3.3 City of Legazpi Water District ...................................................................... 5 3.4 Metro Leyte Water District ........................................................................... 5 3.5 City of Koronadal Water District .................................................................. 5 4 Lessons Learned and Some Issues Raised ......................................................... 6 5 Some Social Policy Issues and Concerns Identified during Stakeholders
Consultations ....................................................................................................... 8 5.1 Ensuring Sustainability of Water Sources .................................................... 8 5.2 Indigenous Peoples and Resource Management ........................................ 9 5.3 Policy, Legal and Regulatory Reform .......................................................... 9 5.4 Water Quality and Institutional Gray Areas ................................................ 10 5.5 Water User Fees ....................................................................................... 10 5.6 Financial Mechanisms and Technology Choices ....................................... 10 5.7 Institutional Arrangements......................................................................... 11
Tables 1 Project Preparation and Pre-Implementation Phases 1 2 Stakeholder Consultation Objectives and Participants 3 3 Highlights of Stakeholder Consultations, April – September 2009 6 4 Good Practice and Emerging Areas of Cooperation 8 Annexes 1 Summary of Stakeholder Consultations in Water Districts 12 2 Project Disclosure 17

Supplementary Appendix I
TA No. 7122-PHI: Water District Development Sector Project PPTA – Final Report – Vol. 10
1
1 STAKEHOLDER CONSULTATION AND PARTICIPATION PLAN
1. ADB’s information disclosure, consultation, and participation policy requires the PPTA to share information with stakeholders and project-affected people early enough to allow them to provide meaningful inputs into project design. The objective is for WDDSP plans to reflect stakeholders’ inputs and the actual needs of the intended clientele to enhance project ownership and sustainability. Consultation is an iterative process.
2. Disclosure and consultation activities followed the overall framework for the project preparation stage as shown in Table 1 . Objectives and expected outputs were as described in the following sections.
3. Consultations objectives were to: raise awareness on the project; generate/validate information on planning contexts, and build consensus on analysis of problems and required action within the water district and among other stakeholders, while fostering a sense of ownership of investment plan by the proponent, partners and clients. Plans were prepared and validated with increased awareness and participation in the project and its processes.
Table 1: Project Preparation and Pre-Implementation Phases
Stage Subject of Consultation
Role of Stakeholders and Households (HHs) and Affected Households
(AHs)
Reasons for Stakeholder/Community
Participation
Preparation Stage
Consultation and focus group discussions/ meetings
Project disclosure - Understanding the subproject
Households (HH) and affected households (AH) participate in community consultations
Involve LGUs, NGOs, the private sector during consultation
Ensure that HHs/AHs fully understand the proposed subproject and its benefits
Promote an informed and collective-decision making
Gather issues and concerns of the community/ stakeholders that can be incorporated in the plan
Planning for WDDSP Implementing arrangements and design options for sanitation
Pro-poor policies
Input water and sanitation arrangements
LGUs/private sector as partners on sanitation
Ensure men’s and women’s/ poor’s needs and concerns for access to services and participation in O and M are addressed
Consultation on WDDSP before submission to ADB
Proposed plans per component
Review and concur on key features of plan
Promotes informed and collective decision-making among stakeholder groups
Consultation delivers the message of transparency seeing to it that their comments /suggestions are incorporated in plan
Construction Stage of Subproject
Employment of HHs/AHs in the subproject
Additional assistance to HHs/AHs
HHs/AHs or any of their household members will be employed during the construction of the subproject
Employment with the project will also enhance their income

Supplementary Appendix I
TA No. 7122-PHI: Water District Development Sector Project PPTA – Final Report – Vol. 10
2
Stage Subject of Consultation
Role of Stakeholders and Households (HHs) and Affected Households
(AHs)
Reasons for Stakeholder/Community
Participation
Implementation Phase
Review compensation and entitlement package
Compensation and entitlement package
Approve the compensation and entitlement package by issuing written resolutions
This measure will lessen conflicts and send the message to AHs that they are involved in WDDSP’s consultative decision-making
Public information and consultation for implementation on sanitation
The need to upgrade sanitation facilities and improve sanitation practices
Facilitate inspection of septic tanks in premises (assess needed action - desludging, repair or construction of septic tank)
Determine incentives/mechanisms to facilitate general improvement of septic tanks
Coordinate on role of LGU, desludging companies, HHs, business sector
Prepare operational plans for roles of partners in policy making and implementation
Generate popular support for sanitation improvement
Identify additional mechanisms to facilitate popular compliance
HHs and businesses informed on available mechanisms and financial arrangements
Consultation on location and terms of installing public/shared water and sanitation facilities
Agreements on the installation of water and sanitation structures
Identify location/design option for structure
Agree on costs, contributions and roles and rules of user group
Involve NGOs
Coordinate with LGUs on possible role in water/sanitation implementation especially for poor areas
Ensure that user groups have clear roles and operating rules for maintenance, collection, etc
Ensure that the impacts of disruption are lessened.
Ensure adequate social preparation
Engagement in watershed or water-related livelihood undertakings.
Livelihoods that can be engaged by AHs/HHs.
Involvement of women in micro enterprise development
Access of both women and men to micro-credit facilities
Women are known to have skills in micro enterprise management which could enhance family income and capacity to pay monthly installment on water/sanitation fees
Grievance and redress. Grievance and redress mechanism.
Ensure that problems are addressed within reasonable time
Election of officers in water user group
Officers of water user groups (WUG)
Elect the officers of WUGs The officers of WUGs will assist WDs facilitate O and M by organization
2 IMPLEMENTATION OF STAKEHOLDER CONSULTATION AND PARTICIPATION
2.1 STAKEHOLDER ANALYSIS
4. Initial stakeholder analysis helped identify common areas of interests between water districts, local governments and other agencies, clientele sub-groups and all other stakeholders that should be most actively involved in plan preparation.

Supplementary Appendix I
TA No. 7122-PHI: Water District Development Sector Project PPTA – Final Report – Vol. 10
3
2.2 METHODOLOGY
5. Information dissemination focused on project objectives, strategies and components and principles of participation. It also included scope and aspects of design, projected costs, likely impacts (positive and negative) of the project on various sectors of the community.
6. Focus Group Discussion (FGD) was the key technique for information sharing, analyzing issues and exploring specific/joint strategies on such areas as sanitation, targeting of poverty groups, policy support and other action plans such as on IEC, watershed management, etc.
7. The process ensured adequate women representation of hardship and other vulnerable groups as well as local government units and barangays, non-government organizations and the private sector, in addition to WD representatives in management, staff, and the board of directors.
8. A draft plan was presented to the water district, partners and clientele representatives for review, confirmation and support.
9. Table 2 lists stakeholder consultation objectives and participants.
Table 2: Stakeholder Consultation Objectives and Participants
Activity Objective Types of Participants
Project disclosure during reconnaissance survey and socio-economic, water and sanitation household survey
Orientation of city and barangay leaders and survey respondents on WDDSP
Households in service and proposed service barangays
City, municipal/provincial and barangays officials
FGD with WD board management and board
Have common understanding and consensus on project and components
WD board members and management
KI/FGD with IP and/or watershed communities
Discuss issues, needs re WATSAN* and potential role of IPs in water source maintenance/management
Review of proposed plans
IP and watershed communities, leaders of affected areas and
Officials, NCIP, DENR
FGD with women and urban poor in selected sanitation hot spots
Identify issues, needs and priorities of poverty groups; role of LGU in water and sanitation
Community representatives and municipal and barangay leaders along critical waterways and/or urban poor communities within service area
Public Consultation Resettlement planning Affected persons e.g. land owners/ occupants
FGD with LGUs, partner agencies, NGOs, urban poor organizations, private sector on gender, water and sanitation and special concerns
Discuss appropriate mechanisms and components on sanitation and address identified issues and concerns including women’s participation issues, needs and preferences; roles in (water and sanitation); review of draft plan
Concerned agencies on planning, public health, IP and environment, etc, clientele representatives, SCU, NGOs on gender, etc.
Key Informant interview group discussion with sanitation service providers (desludgers)
Learn about services, resources and capability and willingness to participate
Desludgers as partners on sanitation component
Public/Consultations Validate plans for water and sanitation by WD and among key stakeholders
Management and board of directors
LGU, NGOs, representatives of APs

Supplementary Appendix I
TA No. 7122-PHI: Water District Development Sector Project PPTA – Final Report – Vol. 10
4
3 SUMMARY OF CONSULTATIONS
10. There was a positive response to the project in all of the sites. Also common to all was that while many were willing to connect and to pay for improved services, there was a sector that indicated it would be unable to afford piped water services or sanitation improvement thus a need for policies that target the poor for affordable access to services.
11. Consensus was built on a wide range of concerns within the WDs and between the WD and key partners including LGUs, NGOs and the private sector on such matters as pro-poor strategies and mechanisms for implementation of sanitation component. Except for Leyte that deferred participation in the sanitation component, it was agreed that sanitation was not the work of one agency. The LGU role in legislation is critical; specific mechanisms were also explored such as building in sanitation cost into water bill. Desludging companies looked forward to participating in the sanitation component and were willing to invest in vacuum trucks and to pay as much as P500 in tipping fees.
12. To maximize positive impacts on women, gender action plans resulting from WD consultation-workshops resulted in proposed actions to address identified gender, poverty and environmental issues. While not necessarily resolved, policy issues involving sustainability of water resources were also brought to the fore. Other site specific matters and recommendations follow.
3.1 METRO LA UNION WATER DISTRICT
13. USAID will provide at least $ 100,000 grant assistance to be matched by Rotary Club. The City government will provide one hectare of lot as a counterpart. Lime stabilization is the technology proposed by USAID to treat septage; emphasis on coordination of all resources coming in for sanitation to maximize synergy. USAID assistance which will be implemented starting October 2009 could be Phase 1 of the septage management system while the ADB assistance which may start by 2012 could be Phase 2. (Dave Robbins, USAID).
14. Other LGUs may participate in the septage management program but have to pay tipping fees; private sector (e.g. desludgers) may participate through contracts with WD; LGU is interested to acquire vacuum trucks thru USAID project or their own funds as back-up in case private sector or WD trucks fail to operate or desludging fees become exorbitant. (LGU San Fernando).
15. Royalties or discounts needed for water source municipalities (Municipalities of San Juan; San Gabriel Development Plan).
3.2 QUEZON METRO WATER DISTRICT
16. Recommendations and feedback on existing situation were also provided such as follows:
• The WD draws much of its water from Tayabas (May-it spring) and the transmission pipeline crosses Tayabas, but the municipality feels deprived of the benefits of the water supply system due to low coverage (only one-third of Tayabas is connected), poor water quality and pressure, and general poor WD performance. Also, WD carries out rehabilitation works (with no prior discussion with the LGU), roads are damaged and contractors never put the roads back to their previous condition. (Tayabas mayor).
• WD and LGU can work together to expand reach of water service - donation from local government – tank or truck – cheaper mobilization; for LGU initiated water

Supplementary Appendix I
TA No. 7122-PHI: Water District Development Sector Project PPTA – Final Report – Vol. 10
5
projects, WD can provide chlorination, etc; common septic tank is viable to be managed by organized user groups (WD staff).
• Pagbilao municipality is not willing to host a septage treatment facility for nearby municipalities. It would want exclusive use of the facility.
• Urban poor have dire need for improved water service and are interested to have water-related livelihood options (Gulang-gulang).
• Urban poor organizations would like to facilitate community planning (NGO, Urban poor).
3.3 CITY OF LEGAZPI WATER DISTRICT
17. Limited information dissemination on public hearing to raise water bill; Needed – regular (quarterly) consultation by WD management on status of water services, on planned improvement, organized in proper venue; Contamination of pbc pipes in swampy areas (e.g. Barangay 23) which cross drainage canals causes double burden since consumers buy water to drink from refilling stations; WD promo has had positive impact on connection of poor (Installation fee - P500 and balance within 1 year as part of bill); needed: income generation from sanitation wastes; NGOs are willing to participate in social marketing and community mobilization for the Project ; poor will be heavily affected if WDDSP development costs are passed on to consumers through bill increase (NGO, Urban poor organization).
18. LGU and DENR to closely monitor discharge of wastes into waterways (Desludging company).
19. Increase water service connection among women-headed households (Gender action plan of WD).
3.4 METRO LEYTE WATER DISTRICT
20. There is interest to connect by some households along transmission line; future planning to involve Association of Barangay Captains to set priority areas for water and sanitation and to discuss roles and responsibilities (Pastrana municipal secretary).
21. Public faucets were disconnected due to non-payment of bills and lack of maintenance; unstable income with copra as source; poor affordability for connection at water source (Tingib).
22. High cost of connection and higher still for certain areas where main pipe crosses the road since DPWH charges fees for rehabilitation of road.
23. GAD Plan to empower women to assist in water maintenance.
3.5 CITY OF KORONADAL WATER DISTRICT
24. Koronadal City is a regional center with a fast-growing population and experiencing pressure on basic services such as water and sanitation. Stakeholders confirmed immediate need for water component and gave a positive response for partnership on sanitation. Thus, densely populated areas will be prioritized under a LWUA project that will start earlier. Consultations identified vulnerability to the continuing deterioration of the watershed and the resulting higher cost using groundwater sources.

Supplementary Appendix I
TA No. 7122-PHI: Water District Development Sector Project PPTA – Final Report – Vol. 10
6
• P75 M loan for Koronanal was approved June 11; 3 new wells and additional distribution pipes for San Isidro, Paraisao and Carpenter Hill; WDDSP to cover north/south expansion.
• Role of barangay is important in waste management; important role in legislation; but training would be needed under WDDSP.
• Sanitation hot spots is upstream and along waterways. • Barangay provides assistance to poor in making bridge payment of water bills in
arrears; it has role in pro-poor program of WD (Barangay Santa Cruz). • Deterioration in water supply (quality and quantity) due to upland activity
(Saravia). • IPs need assistance in establishing sustainable livelihood options that are
compatible to watershed management (El Gawel). • Gender mainstreaming for concessionaires.
4 LESSONS LEARNED AND SOME ISSUES RAISED
25. Table 3 shows a summary of issues and concerns raised at consultations. Table 4 also documents some pertinent good practices in water distribution and management.
Table 3: Highlights of Stakeholder Consultations, April – September 2009
Water District Type of Stakeholders Main Issues and Concerns Agreements Reached All sites
WD and WD concessionaires
High demand for water services as priority areas for water improvement
Population centers and growth areas prioritized consistent with development plans; new subdivisions; government and growth centers, urban areas with no alternate water sources; expansion into rural and population centers of city/municipalities; pro-poor provisions identified
All sites LGU and agencies, WD and WD concessionaires Urban poor NGOs
Water contamination issues especially in slums and waterways Non-standard septic tanks
Prioritized urban poor and informal settlers in sanitation hot spots – shorelines, riverbanks, slums - for communal septic tank provision
All sites LGU, WD, representatives in franchise area
High need for water service but percentage with affordability issues
Pro-poor programs – e.g public faucets, targeting of high need areas
La Union LGU, WD and business representatives
.Chamber of Commerce (P230 x 2 for first 10 cm)
Legazpi City LGU, NGO and community representatives
Dialogue on issue over doubling of rates with bulk water provider; maximize use of gravity water sources
La Union Leyte Koronadal Quezon
Water source communities
Equity Concern - Water source communities were not served by WD due to lack of demand, technical and cost considerations or no share of revenues for watershed communities/LGU except for May-it in Quezon
Inequitable distribution of service to be addressed through appropriate water service and watershed programs (Leyte, Quezon)
All except Leyte LGU, agencies, NGOs High cost of sanitation; Low priority/budget for Sanitation
WD-LGU cooperation on sanitation
La Union WD, WD concessionaires
Lack/Loss of water sources Prioritize half of served clientele disconnected due to lack of WD service
Quezon WD concessionaire Perceived high cost of Viability of gravity sources
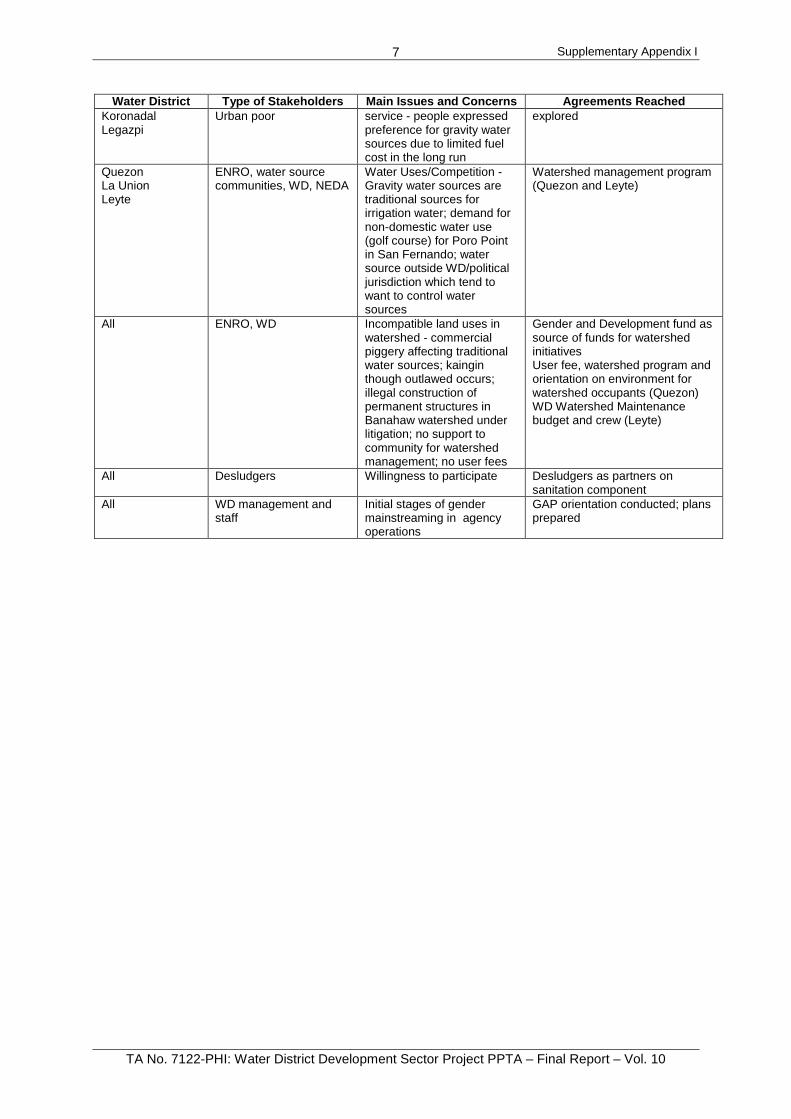
Supplementary Appendix I
TA No. 7122-PHI: Water District Development Sector Project PPTA – Final Report – Vol. 10
7
Water District Type of Stakeholders Main Issues and Concerns Agreements Reached Koronadal Legazpi
Urban poor service - people expressed preference for gravity water sources due to limited fuel cost in the long run
explored
Quezon La Union Leyte
ENRO, water source communities, WD, NEDA
Water Uses/Competition - Gravity water sources are traditional sources for irrigation water; demand for non-domestic water use (golf course) for Poro Point in San Fernando; water source outside WD/political jurisdiction which tend to want to control water sources
Watershed management program (Quezon and Leyte)
All ENRO, WD Incompatible land uses in watershed - commercial piggery affecting traditional water sources; kaingin though outlawed occurs; illegal construction of permanent structures in Banahaw watershed under litigation; no support to community for watershed management; no user fees
Gender and Development fund as source of funds for watershed initiatives User fee, watershed program and orientation on environment for watershed occupants (Quezon) WD Watershed Maintenance budget and crew (Leyte)
All Desludgers Willingness to participate Desludgers as partners on sanitation component
All WD management and staff
Initial stages of gender mainstreaming in agency operations
GAP orientation conducted; plans prepared

Supplementary Appendix I
TA No. 7122-PHI: Water District Development Sector Project PPTA – Final Report – Vol. 10
8
Table 4: Good Practice and Emerging Areas of Cooperation
Good Practice Water District Comments
Distribution of Benefits
1. User Fees Quezon Royalties are paid at main water source consistent with local government code; incentive for role of community in watershed maintenance
2. Water for All Initiative Quezon Water delivery truck to barangays within franchise but outside serviced area; at cost price
3. WD- LGU cooperation in service expansion
La Union, Quezon
LGU counterpart in expansion of services to requesting barangay (Bacuit Sur, Bauang); WD technical assistance with LGU community labor and materials; use of barangay funds in Quezon
Quezon Project proposal for external support by WD
Water Source Conservation
4. Emerging multi-agency cooperation on watershed management
La Union North Quad as framework to discuss inter-regional water sharing/watershed management
Quezon, Leyte Quezon - Kaingin discouraged in watershed; 50-hectare watershed project of WD; annual tree planting with other groups; Leyte – P34M budget for watershed management
5. Environmental Education
Quezon Settler within watershed is briefed on stewardship role
Sanitation
6. Addressing high cost of sanitation
La Union San Fernando fisherman’s village: non-water technology in toilets; no septic tank needed
Gender Mainstreaming
7. Existing program for gender mainstreaming in agency operations
Quezon, La Union
Willing to cooperate on gender assessment at PPTA and on mainstreaming at implementation phase
5 SOME SOCIAL POLICY ISSUES AND CONCERNS IDENTIFIED DURING STAKEHOLDERS CONSULTATIONS
26. As a poverty reduction project, a key concern is how to make the WDDSP more pro-poor, inclusive, and sustainable. Consultations identified/validated the following policy issues/concerns. While the intent of the project is its financial viability and sustenance, there are overarching social issues that need to be addressed if we are to make the project more pro-poor and socially inclusive. Some of these issues include the following:
5.1 ENSURING SUSTAINABILITY OF WATER SOURCES
27. Within the next 20 years, freshwater is expected to become the most important strategic resource with potential to be one of the root causes of socio-political stress. Loss of water sources has enormous impacts on socio-economic systems which will affect the poor even more heavily. Official indicators tend to only look at the issue of access to safe drinking water; there is limited stress on the state of water resources or on the real score on water resources management.
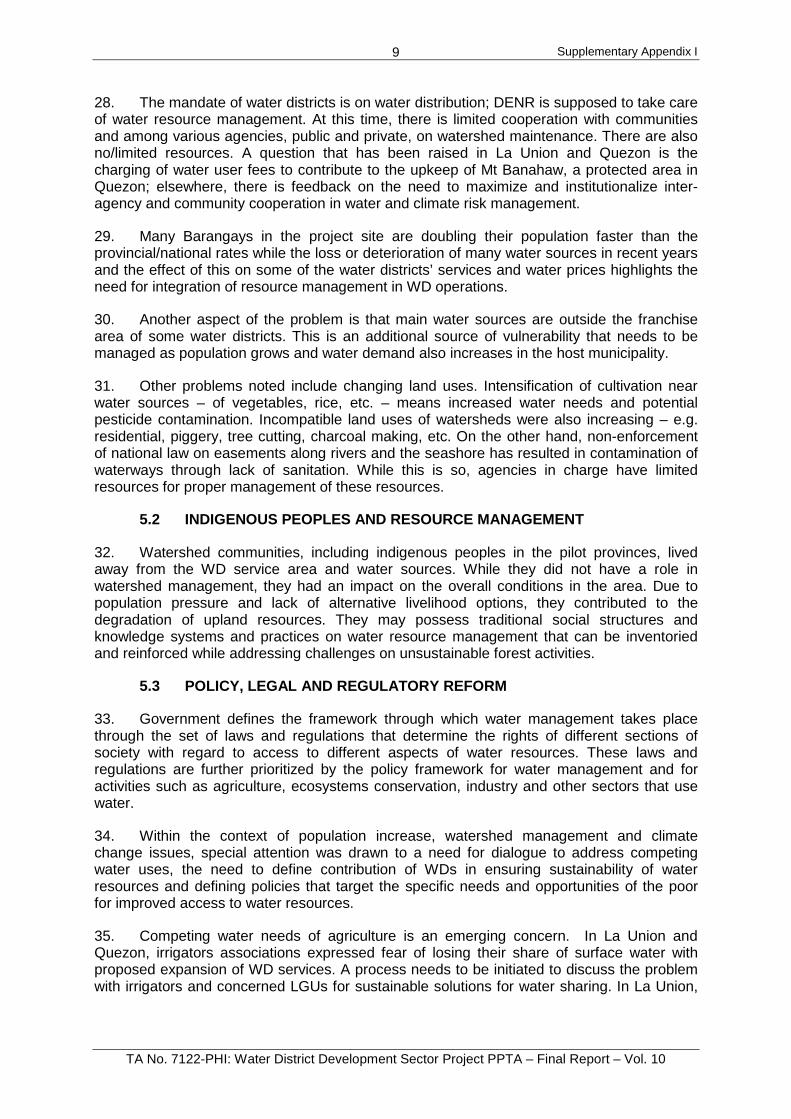
Supplementary Appendix I
TA No. 7122-PHI: Water District Development Sector Project PPTA – Final Report – Vol. 10
9
28. The mandate of water districts is on water distribution; DENR is supposed to take care of water resource management. At this time, there is limited cooperation with communities and among various agencies, public and private, on watershed maintenance. There are also no/limited resources. A question that has been raised in La Union and Quezon is the charging of water user fees to contribute to the upkeep of Mt Banahaw, a protected area in Quezon; elsewhere, there is feedback on the need to maximize and institutionalize inter-agency and community cooperation in water and climate risk management.
29. Many Barangays in the project site are doubling their population faster than the provincial/national rates while the loss or deterioration of many water sources in recent years and the effect of this on some of the water districts’ services and water prices highlights the need for integration of resource management in WD operations.
30. Another aspect of the problem is that main water sources are outside the franchise area of some water districts. This is an additional source of vulnerability that needs to be managed as population grows and water demand also increases in the host municipality.
31. Other problems noted include changing land uses. Intensification of cultivation near water sources – of vegetables, rice, etc. – means increased water needs and potential pesticide contamination. Incompatible land uses of watersheds were also increasing – e.g. residential, piggery, tree cutting, charcoal making, etc. On the other hand, non-enforcement of national law on easements along rivers and the seashore has resulted in contamination of waterways through lack of sanitation. While this is so, agencies in charge have limited resources for proper management of these resources.
5.2 INDIGENOUS PEOPLES AND RESOURCE MANAGEMENT
32. Watershed communities, including indigenous peoples in the pilot provinces, lived away from the WD service area and water sources. While they did not have a role in watershed management, they had an impact on the overall conditions in the area. Due to population pressure and lack of alternative livelihood options, they contributed to the degradation of upland resources. They may possess traditional social structures and knowledge systems and practices on water resource management that can be inventoried and reinforced while addressing challenges on unsustainable forest activities.
5.3 POLICY, LEGAL AND REGULATORY REFORM
33. Government defines the framework through which water management takes place through the set of laws and regulations that determine the rights of different sections of society with regard to access to different aspects of water resources. These laws and regulations are further prioritized by the policy framework for water management and for activities such as agriculture, ecosystems conservation, industry and other sectors that use water.
34. Within the context of population increase, watershed management and climate change issues, special attention was drawn to a need for dialogue to address competing water uses, the need to define contribution of WDs in ensuring sustainability of water resources and defining policies that target the specific needs and opportunities of the poor for improved access to water resources.
35. Competing water needs of agriculture is an emerging concern. In La Union and Quezon, irrigators associations expressed fear of losing their share of surface water with proposed expansion of WD services. A process needs to be initiated to discuss the problem with irrigators and concerned LGUs for sustainable solutions for water sharing. In La Union,

Supplementary Appendix I
TA No. 7122-PHI: Water District Development Sector Project PPTA – Final Report – Vol. 10
10
the water demand of a golf course at Poro Point, an American base that was converted into a mix use estate, highlights the need for prioritizing provision of drinking water.
5.4 WATER QUALITY AND INSTITUTIONAL GRAY AREAS
36. Gap in water service is often filled by private water providers and other open sources. There are different government agencies and regulatory bodies for different water service providers but often safe water supply remains a problem in some urban and rural barangays. However, it is not clear which agency regulates and monitors private water supply providers that deliver water using trucks in areas not served by WDs or water refilling stations.
5.5 WATER USER FEES
37. There are suggestions to institutionalize the payment of water user fees and royalties by water districts to help pay for watershed management but that such payment is partly used for water source management.
5.6 FINANCIAL MECHANISMS AND TECHNOLOGY CHOICES
38. While local governments acknowledged that passage and enforcement of sanitation regulations was their responsibility, ability to pay was recognized as a constraint. This may in turn reduce level of attainment of the desired impact of sanitation via improvement of septic tanks.
39. While pro-poor policies were established by identifying the needs and setting targets for women and vulnerable groups, the development of appropriate options to meet the needs and capabilities of the poor, was also raised. Thus, a continuing challenge is to broaden the range of affordable technology and management choices available to poor people.
40. A sizable percentage of the poor are willing to pay for improved water and sanitation. Credit and financial management systems that are accessible/affordable by the poor that will allow a high level of cost recovery was indicated. Financial instruments are needed to meet their specific needs, such as microcredit options to pay for one-time expenses (connection charges, household/shared sanitation infrastructure) and flexible fee structures to accommodate household income cycles. This will require social preparation and will benefit from the involvement of NGOs in facilitating the process. The following were validated:
41. Financing options:
o Highlight women’s strengths in mobilizing savings and resources and the opportunity of using Gender and Development Funds to support some community-based water and sanitation income generating initiatives that can improve capacity to pay.
o At pre-implementation stage, the process shall clarify preferences of men and women in the community on: financing arrangement (e.g., level of fixed cost and O & M fees, cash vs. in-kind/labor contribution).
o Consider targeting and possible preferential treatment for very poor female-headed and other disadvantaged families.
o Initial NGO management of credit or community-based revolving funds for water and sanitation.
42. Expanding the reach of services in lower income communities can be in partnership with local government which also has a mandate on water and sanitation. Water-related income generating activity managed by women and the poor can be an option to expand the

Supplementary Appendix I
TA No. 7122-PHI: Water District Development Sector Project PPTA – Final Report – Vol. 10
11
reach of services among the poor while increasing water consumption and reducing water delivery costs.
43. Implementing/expanding coverage of sanitation can only be in partnership with LGUs. There was a strong case for private sector involvement in desludging. These have equipment, manpower and often had coverage areas outside of the base local government unit, thus the potential to expand the reach of the desludging services outside of project site.
5.7 INSTITUTIONAL ARRANGEMENTS
44. Institutional strengthening and more effective institutional coordination was identified, in particular with LGU and government agencies to create a supportive environment for sanitation and for management of water resources together with the private sector, civil society and community level organizations. Two critical gaps were the absence of a responsibility center for implementing a partnership strategy within the WDs and strengthening local government capacity for integration sanitation in governance through the passage of laws and the promotion of community managed water and sanitation in poor areas.

Supplementary Appendix I
TA No. 7122-PHI: Water District Development Sector Project PPTA – Final Report – Vol. 10
12
ANNEX 1: SUMMARY OF STAKEHOLDER CONSULTATIONS IN WAT ER DISTRICTS
Table A: Summary of Stakeholder Consultations - Metro La Union Water District April – August, 2009
Stakeholder Office/People Met Date/Venue Gender of Participants
LGU Bauang MPDC, Health and Sanitation, Engineer, Gender and Social Welfare, Environment Officers
June 4 Bauang Municipal Hall
F – 8 M – 4
LGU San Fernando Mayor MPDC, Health and Sanitation, Engineer, Gender and Social Welfare, Environment Officers
June 4 San Fernando City Hall
F – 4 M - 7
LGU Bacnotan City Planning, Health and Sanitation, Engineer, Gender and Social Welfare, Environment Officers
June 4 Bacnotan Municipal Hall
F – 4 M - 8
WD Management – GM, Administrative and Engineering chiefs
July 15 Board Roam, WD
F – 2 M – 2
WD Gender Focal Point of WD and 2 LWUA representatives
July 16 Board Room, WD
M – 4 F - 6
Desludging company
McClean July 15 M - 1
LGU San Juan Municipality
Mayor and technical staff July 16 Mayor’s Office
M - 3
LGU San Fernando and funding agencies
USAID, BORDA, WD, LGU San Fernando July 15 City Hall
M – 4 F – 1
LGU San Fernando LGU and WD on sanitation July 16 City Hall
F – 1 M - 4
LGU La Union Province
Provincial Governor, Provincial planning office, health and sanitation offices
April Provincial Capitol
F – 5 M – 4
NEDA NEDA Chief, planning, poverty and gender and development focal persons
April NEDA Office
M – 2 F – 1
LGU Barangay Urban Poor
Barangay Ssecretary, WD July 15 San Agustin Barangay, SF
F – 2
Urban poor resettlement site
Family representative in urban poor housing
June 4 Fisherman’s Village (resettlement site), SF
F – 1 M – 1
Public Consultation to disclose the WDSSP project to project affected household, LGUs, NGOs
5 Mayor and agency representatives of 5 LGUs, NGO representatives for vulnerable groups, women and environment
September 4, 2009 Midtown Restaurant, San Fernando City
F – 13 M - 13
WD workshop on project components, costings, capacity development and social safeguards (environment and resettlement)
WD board member, GM and technical staff August 26 – 27 INNOTECH, Quezon City
M -3 F - 1

Supplementary Appendix I
TA No. 7122-PHI: Water District Development Sector Project PPTA – Final Report – Vol. 10
13
Table B: Summary of Stakeholder Consultation - Quezon Metro Water District April – September 2009
Stakeholder Group Office/ People Met Date/Venue Gender of Participants
FGD with management and Board of Directors
Board of Directors GM, technical staff
May 14 QMWD Board Room
M – 8 F - 4
Barangay May-it LGU Barangay Captain and Treasurer April 14 QMWD Board Room
M – 2
Provincial Gender and Development Office
Provincial Gender and Development Officer and technical staff
April 14 GAD Office Provincial Capitol
F – 2
Lucena City LGU and agencies
City planning, Legal counsel, finance, health
June 17 City Hall
F – 6 M – 5
Pagbilao LGU and agencies Mayor, Executive secretary, technical staff for engineering and assessor’s office, MAO, accounting, budget, health and sanitation, environment, gender and welfare, etc.
June 17 Municipal Hall
F – 8 M – 9
Barangay LGU Gulang-gulang
Barangay captain, barangay official June 18 Barangay Hall
M – 2
Urban poor associations – 1) Purok Tando Gulang-gulang, 2) Purok Bagong Silang, 3) Purok Pagsisikap, 4) Promised Land, 5) Purok Gulang-gulang High School
Urban poor association presidents and community members
June 18 5 urban poor locations
F – 6 M – 4
WD Management and staff July 13 Board Room, WD
F – 4 M – 5
WD Management and staff – 3 batches for staff Gender focal point
July 13 - 14 M – 16 F – 17
Pagbilao LGU and agencies Executive secretary, technical staff for engineering and assessor’s office
July 14 Municipal Hall
M – 4
FGD with Women and Urban Poor Organizations
President of Urban poor federation – 120 chapters KBPLI – 2 City Engineer Urban Poor Affairs Office – 2
July 14 Urban Poor Affairs Office, Lucena City
M – 1 F - 5
KI with ENRO ENRO Manuel Beloso April 14 Office of ENRO
M - 1
KI Desludging company Proprietor - Soriano desludging company
July 13
M - 1
Public Consultation to disclose the WDSSP project to project affected households, LGUs, NGOs,
Mayor and agency representativ, NGOs of 5 LGUs, NGO representatives for vulnerable groups, women and environment
August 14, 2009 M- 10 F- 8
WD workshop on project components, costings, capacity development and social safeguards (environment and resettlement)
WD board member, GM and technical staff
August 26 – 27 INNOTECH, Quezon City
M -3 F - 1
Meeting with LGU Tayabas Mayor of Tayabas September 11 - Office of GNCA Holdings Inc, Makati City
M – 4

Supplementary Appendix I
TA No. 7122-PHI: Water District Development Sector Project PPTA – Final Report – Vol. 10
14
Table C: Summary of Stakeholder Consultations - Legazpi City Water District May – August 2009
Stakeholder Office/People Met Date/Venue Gender of Participants
LGU Legazpi Task Force Sanitation May 13 City mayor’s Office
F – 5 M - 10
WD Board of Directors – 5 members; GM
May 15 Board Room, WD
M – 5 F – 3
WD AGM, heads of departments July 2 Board Room, WD
F - 4
WD Gender Focal Point Heads and representatives of departments
July 16 Board Room
M – 10 F - 16
Community-Based Organization – Urban Poor
NGO COPE – 2 members Slum Dwellers Federation - President
July 2 COPE Office Barangay 23
F – 3 M – 4 F – 5
Desludging Company Proprietor/RzM Excavators June 3 – RzM Office M – 1 City health Office Health and sanitation officers May 12
City health Office M – 1 F – 1
Public Consultation to disclose the WDSSP project to project affected houshelold, LGUs, NGOs
Mayor and agency representative of 5 LGUs, NGO representatives for vulnerable groups, women and environment
August 16, 2009 M- 10 F- 8
WD workshop on project components, costings, capacity development and social safeguards (environment and resettlement)
WD board member, GM and technical staff
August 26 – 27 INNOTECH, Quezon City
M -3 F - 1

Supplementary Appendix I
TA No. 7122-PHI: Water District Development Sector Project PPTA – Final Report – Vol. 10
15
Table D: Summary of Stakeholder Consultations - Leyte Metro Water District May – August 2009
Stakeholder Office/People Met Date/Venue Gender of Participants
WD GM, HR May 13 MLWD
F – 3 M - 1
WD GAD Focal Point, management and staff -
July 15 - MLWD M – 60 F – 50
Provincial Government PPDC and technical staff - Provincial
May 13 Planning and Development Office
F - 2
Barangay LGU Public faucet locations
Barangay secretary of Tingib and key informant interview of public water faucet managers and users -
May 14 Water points in Tingib and other barangays in Pastrana, Palo and Tacloban City
M - 10 F - 7
LGU Pastrana Municipality Barangay secretary May 12 Pastrana municipal hall
M – 1
Public Consultation to disclose the WDSSP project to project affected houshelold, LGUs, NGOs
Mayor and agency representative of 5 LGUs, NGO representatives for vulnerable groups, women and environment
August 16, 2009 M- 10 F- 8
WD workshop on project components, costings, capacity development and social safeguards (environment and resettlement)
WD board member, GM and technical staff
August 26 – 27 INNOTECH, Quezon City
M -3 F - 1
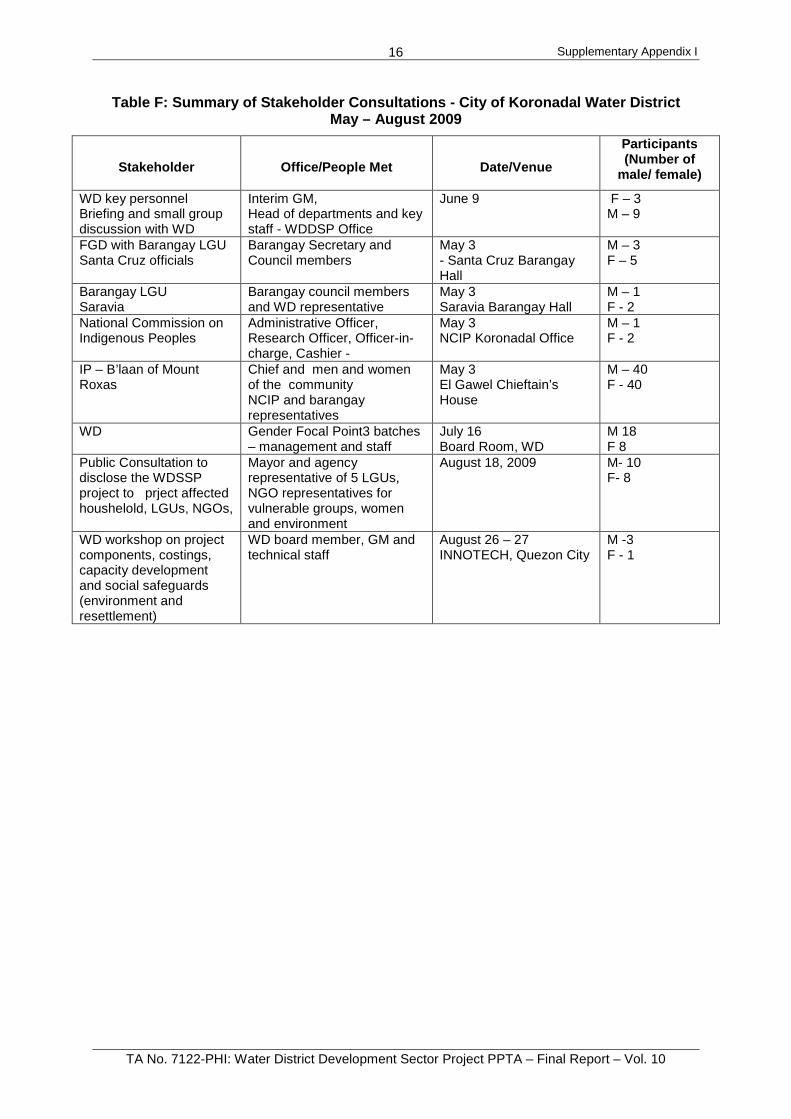
Supplementary Appendix I
TA No. 7122-PHI: Water District Development Sector Project PPTA – Final Report – Vol. 10
16
Table F: Summary of Stakeholder Consultations - City of Koronadal Water District May – August 2009
Stakeholder
Office/People Met
Date/Venue
Participants (Number of
male/ female)
WD key personnel Briefing and small group discussion with WD
Interim GM, Head of departments and key staff - WDDSP Office
June 9
F – 3 M – 9
FGD with Barangay LGU Santa Cruz officials
Barangay Secretary and Council members
May 3 - Santa Cruz Barangay Hall
M – 3 F – 5
Barangay LGU Saravia
Barangay council members and WD representative
May 3 Saravia Barangay Hall
M – 1 F - 2
National Commission on Indigenous Peoples
Administrative Officer, Research Officer, Officer-in-charge, Cashier -
May 3 NCIP Koronadal Office
M – 1 F - 2
IP – B’laan of Mount Roxas
Chief and men and women of the community NCIP and barangay representatives
May 3 El Gawel Chieftain’s House
M – 40 F - 40
WD Gender Focal Point3 batches – management and staff
July 16 Board Room, WD
M 18 F 8
Public Consultation to disclose the WDSSP project to prject affected houshelold, LGUs, NGOs,
Mayor and agency representative of 5 LGUs, NGO representatives for vulnerable groups, women and environment
August 18, 2009 M- 10 F- 8
WD workshop on project components, costings, capacity development and social safeguards (environment and resettlement)
WD board member, GM and technical staff
August 26 – 27 INNOTECH, Quezon City
M -3 F - 1

Supplementary Appendix I
TA No. 7122-PHI: Water District Development Sector Project PPTA – Final Report – Vol. 10
17
ANNEX 2: PROJECT DISCLOSURE Part 1:
1. Purpose of the public meeting/consultation . Thank you very much for your attendance. There are two reasons why we have invited you to this public meeting. First, is to establish the basis for the formulation of policies and guidelines in the ongoing study on Water District Development Sector Project (WDDSP) and get the opinions of various stakeholders particularly the opinions of affected persons/households (AP). And second, is to comply with the provision of the law that there should be consultation with the community to obtain their opinions before any project is implemented by the concerned government agency.
2. The need to know issues and constraints. – The issues and constraints
encountered by the stakeholders and the APs in their community should be disclosed, as these are the basis for formulating the policies and plans for WDDSP Subprojects. For this subproject, community issues vary from each other and they have their own individuality. For example, water sources or water service distribution could be a problem in your community, while it could be another problem in other community. What we want to know in this public meeting are the issues concerning water service and sanitation service delivery in your community particularly related to specific issues such quality, efficiency and tariff.
3. People’s awareness on WDDSP in your locality . – What this public meeting/consultation also wants to know is if you are aware if there is a subproject is being initiated, and or for implementation by the Water District or any government agency in partnership with LWUA and other concerned agencies including the private sector. If there is a project being promoted or implemented in your locality, kindly mention what this project is and why do you think it is appropriate to your community.
Open Discussion (30 minutes)

Supplementary Appendix I
TA No. 7122-PHI: Water District Development Sector Project PPTA – Final Report – Vol. 10
18
Part 2: WDDSP: PROJECT INFORMATION BULLETIN (PIB) Frequently Asked Questions:
1. Question: What is the Water District Development Sector Project? (WDDSP)
Answer :
• WDDSP is a national government project of LWUA that will be implemented nationwide with the objective of uplifting the quality of water and sanitation services for the Cities and Municipalities outside the Metro Manila areas. A project preparatory technical assistance study (PPTA) for LWUA and the initial 5 pilot WDs will be undertaken. It will formulate a sector investment project (WDDSP) in the water supply and sanitation sector with funding from ADB and other investment sources. Based on the financial planning budget of ADB, the scope of the initial phase of the Project will cover a short-list of up to five pilot water districts (WD),namely: Metro La Union Water District, La Union Province, Luzon; Quezon Metro Water District, Quezon Province, Luzon; Legazpi City Water District, Albay Province, Luzon; Leyte Metro Water District, Leyte Province, Visayas;; City of Koronadal Water District, South Cotabato province, Mindanao and a long-list of WDs will be identified for implementation under subsequent phases. It will also undertake a preparation of implementation support and institutional development programs addressing sector reform, governance and public awareness.
• It will be implemented by the Local Water Utilities Administration (LWUA) and the Water Districts. The ADB provided grant for Technical Assistance (TA) in the subproject preparatory study and eventually a loan facility for the implementation of the project. The WDDSP consists of two components: (i) Infrastructure Investments that will cover all WDs nationwide; (ii) Institutional Capacity Development and Sector Policy Reform component. The intended impact of the Project is to improve water and sanitation service delivery by WD throughout the Philippines. The targeted outcomes of the Project are the increase in quality, coverage and reliability of water and sanitation services, improved infrastructure facilities and sustainable water sources, and an improved institutional capacity of WDs to manage and undertake development of sustainable water services.
2. Question: What are the key concerns/issues and activities to be addressed
by the Water District Development Sector Project? (WDDSP)
Answer: • Scope of subproject, in view of future population and water demand. • Non-revenue water. • Sanitation component (septage management). • Social and environmental safeguards. • Political/stakeholder support • Water resources assessments • Water supply audits • Sanitation audits • Social/ Resettlement risks assessments and mitigations • Socioeconomic survey and poverty analysis • Subproject community consultations and focus group discussions • Subproject environmental assessments and public consultations • LWUA/WD capacity building, training needs assessments
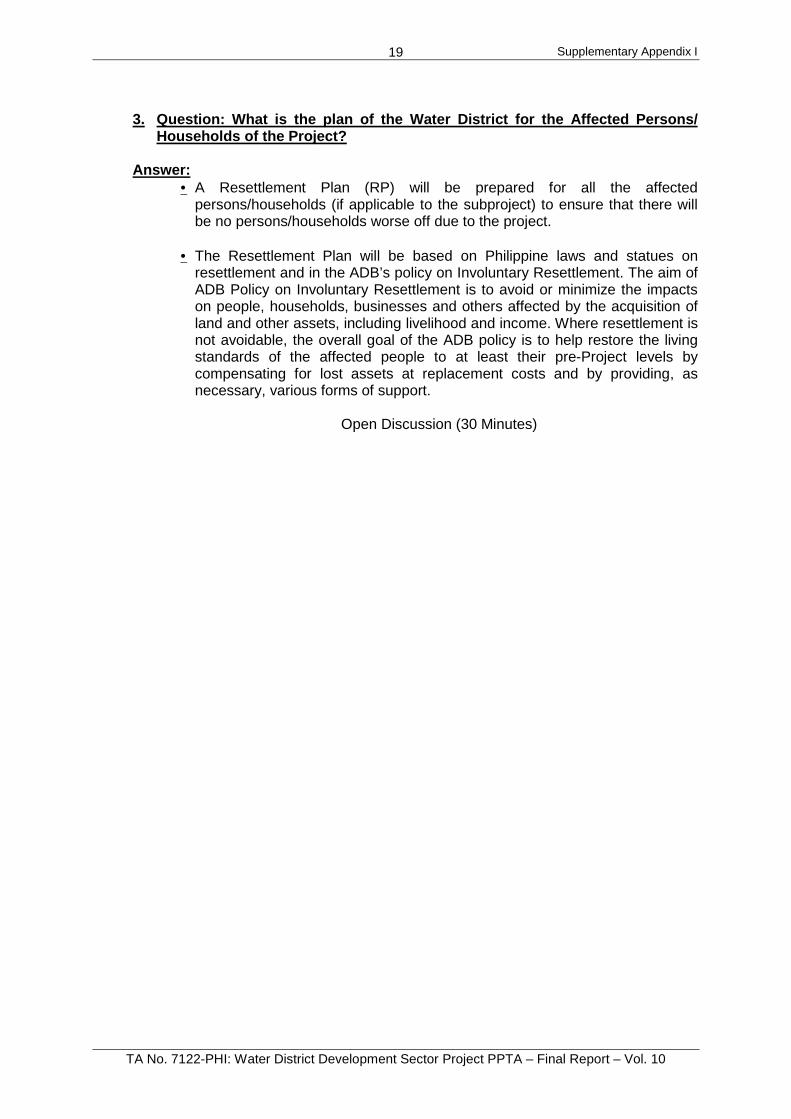
Supplementary Appendix I
TA No. 7122-PHI: Water District Development Sector Project PPTA – Final Report – Vol. 10
19
3. Question: What is the plan of the Water District for the Affected Persons/
Households of the Project? Answer:
• A Resettlement Plan (RP) will be prepared for all the affected persons/households (if applicable to the subproject) to ensure that there will be no persons/households worse off due to the project.
• The Resettlement Plan will be based on Philippine laws and statues on
resettlement and in the ADB’s policy on Involuntary Resettlement. The aim of ADB Policy on Involuntary Resettlement is to avoid or minimize the impacts on people, households, businesses and others affected by the acquisition of land and other assets, including livelihood and income. Where resettlement is not avoidable, the overall goal of the ADB policy is to help restore the living standards of the affected people to at least their pre-Project levels by compensating for lost assets at replacement costs and by providing, as necessary, various forms of support.
Open Discussion (30 Minutes)

Supplementary Appendix J
TA No. 7122-PHI: Water District Development Sector Project PPTA – Final Report – Vol. 10
1
INDIGENOUS PEOPLES
1 Introduction 1 2 ADB Policy on Poverty Reduction and Indigenous Peoples 1 2.1 Indigenous Peoples Development Plan 2 2.2 Indigenous Peoples Development Framework 3 2.3 Indigenous Peoples Specific Action 3 3 Indigenous Peoples in the Philippines 4 4 Indigenous Peoples Development Framework for WDDSP 4 4.1 Objective 4 4.2 Social Analysis 4 4.3 Strategy for Ensuring Participation of IPs/ Affected IPs 5 4.4 Institutional Arrangements for Preparation and Implementation of the IPDP 6 4.5 Budget for the Fotmulation and Implementation of IPDPs 6 4.6 Monitoring and Evaluation 7 Sample Indigenous Peoples Development Plan (The B’laan of Koronadal) 8 Annex: Sample Guide for NGO Engagement 12
1 INTRODUCTION
1. Indigenous peoples, as a group that retain their territory and way of life, are accorded protection by the project based on ADB’s Policy on Indigenous Peoples (IP) as well as on the country’s Indigenous People’s Rights Act of 1997.
2. There are no affected IPs in the pilot sites but should there be IPs in forthcoming project areas, an Indigenous Peoples’ Development Plan shall be prepared.
2 ADB POLICY ON POVERTY REDUCTION AND INDIGENOUS PEOPLES
3. The Water District Development Sector Project aims to reduce poverty through the development of urban water and sanitation. ADB’s Poverty Reduction Strategy recognizes that particular sections of populations may suffer from social exclusion, and lack of social capital, and therefore remain in poverty. Indigenous Peoples (IP) are often found to lack access to assets and opportunities required for them to participate in mainstream development. They lack access to basic services more so than the majority. As such, they require special support.
4. ADB Policy requires proponents to prepare an Indigenous Peoples’ Plan (IPP) for projects and project components which will affect IP adversely and significantly. Thus, an IPP is required for any project with significant impacts on IP whether the impacts are beneficial or adverse.
5. The Policy states a commitment of the ADB to the following:
Supplementary Appendix J
TA No. 7122-PHI: Water District Development Sector Project PPTA – Final Report – Vol. 10
2
1. Recognize the potential vulnerability of indigenous peoples in development processes.
2. Ensure that indigenous peoples have opportunities to participate in and benefit equally from development.
3. Avoid negatively affecting indigenous peoples, and provide adequate and appropriate compensation when a negative impact is unavoidable.
4. Ensure that development initiatives affecting indigenous peoples are effective and sustainable.
5. Strategies and approaches must have clear mechanisms for accurate, objective analysis of their circumstances of development.
6. Incorporate transparency and accountability. 6. Furthermore, in implementation, projects must:
1. Include respect for indigenous peoples' dignity, human rights, and cultural uniqueness.
2. Operate in line with an Indigenous People’s Development Framework (IPDF)
1/Indigenous People’s Development Plan—with samples outlined below, and in line with the initial social assessment for the whole project.
3. Initiatives should be compatible with the affected peoples’ culture and social and economic institutions, and commensurate with the needs, aspirations and demands of affected peoples.
4. Initiatives should be conceived, planned, and implemented, to the maximum extent possible, with the informed consent of affected communities.
7. Projects are categorized by the significance of their impacts on indigenous peoples, although water and sanitation infrastructure is not expected to create significant negative impacts. The significance is decided based on the type, location, scale, nature, and magnitude of a project’s potential impacts on indigenous peoples. The categories are as follows:
1. Category A. Such projects are expected to have significant impacts that require indigenous peoples development plans/framework (IPDP and/or IPDF).
2. Category B. Such projects are expected to have limited impacts. Specific action for indigenous peoples, specified in the Report and Recommendation of the President (RRP) and in related plans, is required to address the limited impacts.
3. Category C. Such projects are not expected to have impacts on indigenous peoples, and therefore do not require special provisions for them.
8. The impacts of ADB’s projects on indigenous peoples will be considered significant if they positively or negatively (i) affect their customary rights of use and access to land and natural resources; (ii) change their socioeconomic status; (iii) affect their cultural and communal integrity; (iv) affect their health, education, livelihood, and social security status; or (v) alter or undermine the recognition of indigenous knowledge.
9. Based on the significance of impacts on IP, IPP may take the following forms:
2.1 INDIGENOUS PEOPLES DEVELOPMENT PLAN (IPDP)
10. This is a planning document to incorporate IP concerns into the project design. It includes provisions for project implementation, monitoring, and evaluation. The IPDP is time-
1 References: ADB.1998. Indigenous Peoples Policy. Manila; Operations Manual on the ADB Policy on Indigenous Peoples, http://www.adb.org/Documents/Manuals/Operations/OMF03_25sep06.pdf

Supplementary Appendix J
TA No. 7122-PHI: Water District Development Sector Project PPTA – Final Report – Vol. 10
3
bound, with an adequate budget for its implementation. An IPDP is required for any ADB-funded development activities when:
• an IP community is the main beneficiary of a development project; • a project component may significantly benefit the community; and/or • the project or project component may have significant adverse impacts on IPs.
11. An acceptable IPDP addresses:
• aspirations, needs and preferred options of the affected IP; • local social organization, cultural beliefs, ancestral territory, and resource use
patterns among the affected IP; • potential positive and negative impacts on IP; • measures to avoid, mitigate, or compensate the adverse project effects; • measures to ensure project benefits will accrue to IP; • measures to strengthen social, legal, and technical capabilities of government
institutions to address IP issues; • the possibility of involving local organizations and non-governmental organizations
with expertise in IP issues; • budget allocation; and • monitoring.
2.2 INDIGENOUS PEOPLES DEVELOPMENT FRAMEWORK (IPDF)
12. Like the IPDP, an IPDF is required for projects where the specific location of the IP cannot be ascertained before loan submission but where:
• an IP community is the main beneficiary of a development project; • a project component may significantly benefit the IP community; and/or • the project or project component may have significant adverse impacts on IPs.
13. An acceptable IPDF must include all of the following:
• project background; • objectives of the IPDF; • strategy for ensuring the participation of the affected IP; • strategy to ensure project benefit, and mitigate any adverse impact; • institutional arrangements for preparation and implementation of the IPDP; • a budget for the formulation and implementation of IPDPs for subprojects; • monitoring and evaluation programs.
2.3 INDIGENOUS PEOPLES SPECIFIC ACTION
14. An IP Specific Action is required to address impacts or risks when a project is expected to have limited impacts or if there is a risk that the project may not bring the intended benefits to the affected IP within a specific plan. The IP Specific Action is specified in the report and recommendation of the President (RRP) and in related plans.
15. An IP Specific Action may take the form of:
1. incorporating IP (who might be excluded from the project) into the project beneficiary group;
2. incorporating IP's specific needs (that may not be addressed by the project) into the project plan; and

Supplementary Appendix J
TA No. 7122-PHI: Water District Development Sector Project PPTA – Final Report – Vol. 10
4
3. a common community action plan where indigenous groups live with the non-indigenous peoples in the same project location.
3 INDIGENOUS PEOPLES IN THE PHILIPPINES
16. IP communities in the Philippines are found in the various islands of the archipelago. They are identified by self ascription and ascription by others and have continuously lived as organized communities, or in communally bounded and defined territory.They share common bonds of language, customs, traditions and other distinctive cultural traits and institutions. Through resistance to political, social and cultural inroads of colonization, some have become historically differentiated from the majority Filipinos. It is possible that they may also now have been displaced from their traditional domains or may have resettled outside their ancestral domains.
17. The presence of some of the following characteristics in varying degrees is used to identify tribal or indigenous communities in the Philippines:
(i) A close attachment to their ancestral territories and natural resources. (ii) Self identification and identification by others as members of a distinct cultural group. (iii) An indigenous language, often different from the national language. (iv) Presence of distinct social, cultural and political institutions. (v) Primarily subsistence oriented production.
18. The total IP population in the Philippines is approximately 12–15 million. There are about 171 ethnoliguistic groups.2 While the exact numbers of IP communities likely to be included is not known at this stage, likely participants are IP households in ancestral domains and water source communities. There may also be concentrated IP populations or migrant ethnic groups in rural and urban settings.
4 INDIGENOUS PEOPLES DEVELOPMENT FRAMEWORK FOR WDDSP
4.1 OBJECTIVE
19. The Indigenous Peoples Development Framework (IPDF) will guide the preparation of IP plans for all WDDSP sites that cover/affect IP populations. Plans ensure inclusion of IPs and incorporate IP concerns into the project design. It includes provisions for project implementation, monitoring, and evaluation
4.2 SOCIAL ANALYSIS
20. The identification of indigenous people will be based on population data submitted by the WD on its initial subproject application. The initial social assessment should provide an overview of the ethnic population characteristics in the project area followed by a more detailed profile of the economic activities of each of the groups, land tenure, identification of the existing problems in performing economic activities, access to water and sanitation, vulnerable groups, women’s and community organizations, indigenous structures, description of local capacity dealing with indigenous groups, and any differential effect due to the subproject. Social analysis will also include data concerning indigenous knowledge systems and practices and possible issues and roles in natural resource management.
2 Indigenous Peoples of the Philippines, http://www.adb.org/Documents/Reports/Indigenous_Peoples/PHI/chapter_3.pdf

Supplementary Appendix J
TA No. 7122-PHI: Water District Development Sector Project PPTA – Final Report – Vol. 10
5
4.3 STRATEGY FOR ENSURING PARTICIPATION OF IPS/ AFFECTED IPS
21. WDDSP will adopt a culturally appropriate and participatory approach for IP communities, wherever they are identified to be within a subproject’s target areas. The Project will make provisions to include IPs for improved access to water and sanitation. Due to watershed degradation and emerging water issues in urban areas, it is critical to ensure sustainable water resources. The IPs’ potential role in watershed management shall be recognized, since often they reside in the vicinity of watersheds and major water sources. The WDs can advocate for and support integrated resource management of such areas. Where appropriate, water-related livelihood initiatives may also be initiated. This may be through the use of Gender Development Funds and facilitating access to external resources.
22. As elsewhere, the Project will support hygiene education and capacity building of water user groups and women/community organizations. IP women’s role in organizations shall be encouraged through training and through ways to increase participation/leadership in water user groups, livelihood development and natural resource management. Since affordability may be a problem, the WD may actively work with the private sector, NGOs and local government units to leverage resources to expand the reach of water and sanitation services in IP territory.
23. Consultation. The approach is to improve development outcomes for indigenous communities through their informed participation and decision making. Detailed social analysis and field assessments can be guided by the ADB’s Handbook for Incorporation of Social Dimensions in Project Design and the ADB Operations Manual on Indigenous Peoples.
24. The planning process shall include a separate community consultation process for IPs within the target area so that IP interests are fully reflected in WD plans. Project disclosure will be conducted at IP community level meetings. Information is imparted regarding WDDSP and its outputs including potential project impacts and mitigation measures. These are discussed with the community groups through participatory focus groups.
25. Groups to be involved in such consultations include IP leaders, IP organizations, IP women, representatives of traditional councils, and barangay and LGU representatives. Consultations will also be held with the National Commission on Indigenous Peoples (NCIP).
26. Some Processes and Provisions:
� Consistent with the principle of social equity and environmental justice, the WD will ensure that IPs and water source communities are given access to appropriate water and sanitation facilities within the duration of the project.
� The subproject design is carried out with the support of IPs and/or those affected by project activities. The WD ensures participation of IPs in all subproject activities and their participation in training programs and evaluations.
� The project preparation team establishes the presence of indigenous peoples in the project site during initial social assessment to ensure IP participation at the earliest instance.
� The identification of indigenous people will be based on population data submitted by the WD on its initial subproject application. The initial social assessment shall provide an overview of the IP population in terms of territory occupied within the project site.
� Projects with IP populations will have a separate social assessment, which includes establishment of social data in comparison with majority populations. Data sets include population size in relation to total population of franchise area, a profile of the economic activities of the group/s, differences in economic status

Supplementary Appendix J
TA No. 7122-PHI: Water District Development Sector Project PPTA – Final Report – Vol. 10
6
between indigenous peoples and majority populations, identification of the existing problems in performing economic activities or access to basic services such as water and sanitation, and local capacity in dealing with indigenous groups.
� IPs shall be represented in the socio-economic survey that will be conducted. Data will also be gathered to identify vulnerable groups. Additional data needs include indigenous knowledge systems and practices, or structures that can help improve management of water user groups and natural resources.
� Design activities will include a participatory walk-through with members of IP community, local government officials and Project technical staff. Specific issues that may affect IP group/affected persons will be formally noted at this point.
� The WD will determine the leadership of the IPs, and a community consultation/s is convened to identify specific concerns related to project design and implementation for both water and sanitation.
� Guidelines for affected IP households/properties shall follow those established under the resettlement framework plan. If affected, IPs are not just compensated. Measures are taken that will improve their conditions and not just return them to pre-disturbance status.
� Indigenous peoples shall participate in any construction and other job openings that may arise in relation to the project. WDs are encouraged to identify and maximize the hiring of qualified members of IPs, including women to work as field/technical staff wherever possible.
� The WD will assess whether IPs have any water access issues and should note whether any of these are due to ethnic factors.
� Ethnic issues will be resolved or compensated through normal Project mechanisms. Should any issues be identified and not resolved, then the subproject will be rejected as infeasible unless there are extenuating circumstances that require further action.
� Indigenous knowledge shall be harnessed such as in determining water sources and natural environmental flows and in determining local products and economic opportunities for livelihood development.
� All IP activities will be carried out as part of the normal subproject development activities.
4.4 INSTITUTIONAL ARRANGEMENTS FOR PREPARATION AND IMPLEMENTATION OF THE IPDP
27. Survey and consultations will be done by the project preparation team. Responsibility center for social preparation and the implementation of the plan shall be established within the WD and may be in coordination with a non-government organization. Responsibility center is also designated to advocate for the preparation of an integrated watershed management plan by/with the DENR, NCIP, local government and appropriate agencies that the WD may support. Alternatively, the WD can initiate its own watershed protection program around its waters source. The LWUA shall see to it that the ADB Policy on Indigenous Peoples is implemented through its monitoring and training support functions.
4.5 BUDGET FOR THE FORMULATION AND IMPLEMENTATION OF IPDPS
28. Budget for data gathering is built into project survey and consultation expenses, including inventory of losses for affected persons. IPs shall be targeted as beneficiaries of appropriate and affordable water and sanitation services. This shall be reflected in cost estimates for public faucets, septic tanks and other project features.

Supplementary Appendix J
TA No. 7122-PHI: Water District Development Sector Project PPTA – Final Report – Vol. 10
7
29. Since a special opportunity exists to strengthen forestry stewardship by residents in the vicinity of watersheds, budgetary support shall be established for elements of the plan which may include community organizing, resource management planning and development of livelihood options for buffer zone communities. Budget components may include:
• Cost of appropriate and affordable water facility as determined by IP users. • Microfinance allocation for appropriate sanitation facilities. • Budgetary support for participatory watershed planning—this may be arranged as
DENR/local government counterpart. • Microfinance facility for development of compatible livelihood options such as
seedling production, watershed protection, restocking of renewable resources to support rural industry such as bamboo and rattan, etc.
• Watershed management fund (may be managed as a component of WD operations or as contributions for implementation of a local watershed management plan).
• Water user fees, royalties or equivalent (which can be negotiated as contribution for watershed maintenance) – which may be 1% of gross income.
• Participatory monitoring and evaluation.
4.6 MONITORING AND EVALUATION
30. The IPDP will be monitored and evaluated as part of regular project monitoring. All benefit monitoring and evaluation (BME) will take into account the IPs requirements, as well as constraints, and address these aspects when examining the extent to which their lives were improved by Project interventions.
31. The success and sustainability of sub-projects and watershed and livelihood development initiatives will be reviewed to ensure that affected persons are not worse off, that target beneficiaries were reached, that households have the necessary capability to sustain common water and sanitation facilities as well as livelihood options and resource management initiatives. The results of the review will be incorporated into annual planning for each subcomponent of the Project.
32. Participatory assessment methodologies such as focus group discussion may also be used. Some parameters for review are:
• Representation of IPs/water source communities among beneficiaries. • Social equity and access to benefits. • Establishment and implementation of water resource sustainability
measures/watershed management plan. • Improvements in/role of IPs in community resource management. • Budget allocation—effectiveness, efficiency of use. • Sustainability of water user groups/facilities. • Output of specific interventions. • Level and quality of participation.

Supplementary Appendix J
TA No. 7122-PHI: Water District Development Sector Project PPTA – Final Report – Vol. 10
8
SAMPLE INDIGENOUS PEOPLES DEVELOPMENT PLAN The B’laan of Koronadal 3
1 GENERAL
1. The Water District Development Sector Project aims to reduce poverty through the development of urban water and sanitation. ADB’s Poverty Reduction Strategy recognizes that Indigenous Peoples may suffer from social exclusion, and lack basic services and social capital, and therefore remain in poverty. As such, they require special support.
2. The City of Koronadal Water District has a wide distribution of ethnic groups but the Roxas Mountain Range is the home of the B’laan where they occupy an ancestral domain of 2,000 hectares. It is also a declared forest reservation. It is the location of 4 upland barangays of Koronadal with a population of 6,000. The area is rich with fresh water resources such as springs. El Gawel, a Sitio of Baragany Saravia, is an existing water source of the City of Korondal Water District. No new water sources will be tapped from the area.
3. The B’laan of Koronadal comprises 18% of the population of the city. El Gawel has 160 households. The other upland barangays have another 800 households. About 95% (20 households of El Gawel) of those interviewed were below the poverty threshold of P6,000, for rural areas of South Cotabato, compared to 50% for the rest of the survey sample population. Main livelihood sources are slash and burn agriculture, charcoal making, small-scale logging and sale of minor forest products such as bamboo, honey and others. Due to deforestation, a landslide in August 2008 resulted in death and destruction of property.
4. The people consulted aspired for education for their children and for more environmentally sustainable livelihood sources. In line with the need to climate-change proof WD operations, the B’laans of El Gawel sought support for alternative livelihood options. In this regard, the people expressed need for assistance even as lowland barangays served by water sources from the area noted deterioration of water supply quality and quantity due to deforestation. The people also sought to manage existing resort facilities of the local government in El Gawel in support of eco-tourism as a potential livelihood option.
5. El Gawel, as an existing water source, is not served by the WD. The other barangays also have springs as primary water source. Main system of sanitation is the pit privy. The WD does not maintain a watershed management program in the area. In 2009, the DENR initiated a replanting program with assistance from the United Nations Development Program (UNDP) in Mindanao. DENR, the private sector and the city government would like to coordinate with the WD on a resource management plan for the B’laan Ancestral Domain of the Roxas Mountain Range.
6. The following indigenous peoples’ development plan (IPDP) is prepared as a precautionary measure and as a guide to be integrated in WD’s work plan.
2 IMPLEMENTATION STRATEGY
7. The WDDSP approach is to maximize the participation of indigenous peoples/affected IPs and to ensure their inclusion in all subproject benefits, activities and training programs. Furthermore, any adverse impacts of the project on the people are avoided or mitigated. Due to the strategic importance of watershed management in ensuring sustainability of water
3 For sample format/content purposes only. Not all statistics may be accurate.
Supplementary Appendix J
TA No. 7122-PHI: Water District Development Sector Project PPTA – Final Report – Vol. 10
9
sources, the B’laan’s role in forest protection shall be mobilized in coordination with other agencies.
8. Implementation of the indigenous people’s development plan will be in partnership with NGOs and with concerned agencies such as the National Commission on Indigenous Peoples, Department of Environment and Natural Resources and barangays and city government and guided by the following:
(1) WD targets a percentage of IP households to be benefited (e.g. through piped connection/public faucets as appropriate – e.g. 35% by end of project).
(2) The WD ensures participation of the B’laan community in all subproject activities, as well as their participation in sanitation and hygiene education, resource management and other training programs and evaluations.
(3) The WD will coordinate with the leadership of the B’laan to convene community meetings that will identify specific concerns related to the design and implementation of water and sanitation sub-components in the area.
(4) A NGO partner may facilitate organization of sanitation/water user groups and resource management planning taking into consideration indigenous knowledge, systems and practices.
(5) The B’laan will be notified of construction and other job openings in the WD for a chance to be considered for available positions including women to work as Community Organizers (CO), etc.
(6) The WD shall coordinate with partner agencies through a workshop to advocate for the preparation of a resource management plan that also establishes roles and responsibilities and resource commitments by each towards plan implementation. Among areas of concern are: � Clarification of sanitation, land use and zoning rules and regulations. � Coordination on delivery of needed training. � Establishment of appropriate livelihood options as incentives for watershed
management that shall be supported with allocation from Gender and Development funds to augment resources from other agencies and the private sector.
(8) The WD will assess whether IPs have any water access issues and should note whether any of these are due to ethnic factors.
(9) IP issues and concerns of affected persons will be resolved or compensated through normal Project mechanisms and as established in the Project’s resettlement framework plan.
3 INSTITUTIONAL ARRANGEMENTS FOR PREPARATION AND IMPLEMENTATION OF THE IPDP
9. Survey and consultations will be done by the project preparation team. Responsibility center for social preparation and the implementation of the plan shall be established within the WD and may be in coordination with the gender and development component. NGO shall be chosen following a selection process and criteria. (Please check sample TOR for NGO Participation.)
10. Since certain components require coordination with other agencies, responsibility center is also designated to strengthen partnerships on such components as sanitation, pro-poor water provision, hygiene education and integrated watershed management plan implementation, etc. Among others, partners for watershed management include DENR, NCIP, local government and appropriate agencies which may take the lead in plan implementation. Alternatively, the WD can initiate its own water source protection program. The LWUA shall see to it that the ADB Policy on Indigenous Peoples is implemented through its monitoring and training support functions.

Supplementary Appendix J
TA No. 7122-PHI: Water District Development Sector Project PPTA – Final Report – Vol. 10
10
4 BUDGET FOR THE FORMULATION AND IMPLEMENTATION OF IPDPS
11. Expense categories cover data gathering, implementation of sub-projects and budget allocation for water resource management. Additional public faucets and shared sanitation facilities may be worked out as local government counterpart. Support for livelihood development may be accessed from Gender and Development funds and by tapping external resources.
Sample Budget Formulation and Implementation of IPDP
Expense Category Proposed Budget Socio-economic survey and inventory of losses
P50,000
Social preparation and NGO community organizing
P1,250,000*
Cost of appropriate and affordable water facility
P30,000 for 3 public faucets
Budget for microfinance facility for development of compatible livelihood options such as seedling production, watershed protection, planting of renewable resources to support rural industry such as bamboo and rattan, etc.
P1,500,000
Cost for provision of appropriate sanitation facilities
P40,000 for 2 shared sanitation facilities
Budgetary support for participatory watershed planning – may be arranged as local government counterpart
P10,000
Watershed management fund for area to be managed by the WD
P500,000
Watershed management fund reflected as water user fees, royalties or equivalent (which can be negotiated for use in watershed maintenance)
computed as 1% of gross income
Monitoring and evaluation P20,000 Total P2,400,000+
*To include areas outside IP territory.
5 MONITORING AND EVALUATION
12. Some indicators relating to process as well as attainment of targets are:
• Social equity can be gauged by size of the population that is served/proportionally represented as targets for access to services and in the water user groups.
� Number of IP HHs vs. number benefited (for water and sanitation). � Number of IP workers/staff hired. • Enhanced role of IPs in community resource management. � Mechanisms/organizations established. � Number of livelihood options established/number benefited. � Linkages established in support of resource management initiatives. • Output of specific interventions planned—e.g. number of seedlings
produced/planted; number of hectares reforested/rehabilitated; survival rate of seedlings planted; number of water user groups established, repayment of microfinance funds.

Supplementary Appendix J
TA No. 7122-PHI: Water District Development Sector Project PPTA – Final Report – Vol. 10
11
• Level and quality of participation—organization of sanitation/water user group, when appropriate; number of participants/women in survey, focus group discussion, key informant interview; number and type of issues resolved.

Supplementary Appendix J
TA No. 7122-PHI: Water District Development Sector Project PPTA – Final Report – Vol. 10
12
Annex: Sample Guide for NGO Engagement
1. The project shall invite applications for the pre-qualification process from organizations interested to be engaged as support organization for social development work in WDDSP.
2. NGOs can be engaged for gender mainstreaming and community mobilization depending upon their capability to render the required services as shown in the criteria set for social activities both in pre-qualification and competitive bidding.
3. Prerequisites for Pre-Qualification for NGOs. A public notice in local newspaper and public billboards shall be published giving reasonable time for NGOs to apply for pre-qualification. The prerequisites to apply for pre-qualification shall be as follows:
� Must be registered as an NGO. � Must have written constitution indicating objectives of organization. � Must have its account audited each year and must submit the latest audit report. � Must have at least two years of experience in implementation of participatory
projects or community development in recent years. � Newly established NGOs lacking two years of track record but staffed with
adequate professionals in required disciplines having at least 5 years experience can also apply for corresponding pre-qualification package.
� Must have engaged professionals and other support staff or is in a position to engage staff.
� The organization must be based in the region or have permanent affiliated office in the province or city.
� The previously pre-qualified NGOs willing to apply for the present work are required to submit copies of renewal of registration and certificate of audit of preceding year.
� NGOs with female staff have an advantage.
4. Competitive Bidding. Evaluation of technical proposal and financial proposal will form the main basis for selection of organizations for social development work. Selection will be done by WD with assistance of LWUA.
5. Evaluation of Technical Proposals. After preparing a list of organizations passing through pre-qualification process, WDDSP shall publish public notice for submission of technical and financial proposals from pre-qualified NGOs. Terms of reference for preparing technical proposal will be provided for competing organizations.
6. Evaluation of technical proposals for the social component will be done by scoring the marks on experience, concept and methodology, qualification and experience of proposed personnel, and financial soundness of the organization:
� Experience of organization 15 � Proposed concept and methodology 25 � Qualification and experience of proposed personnel 50 � Completeness of required document 10
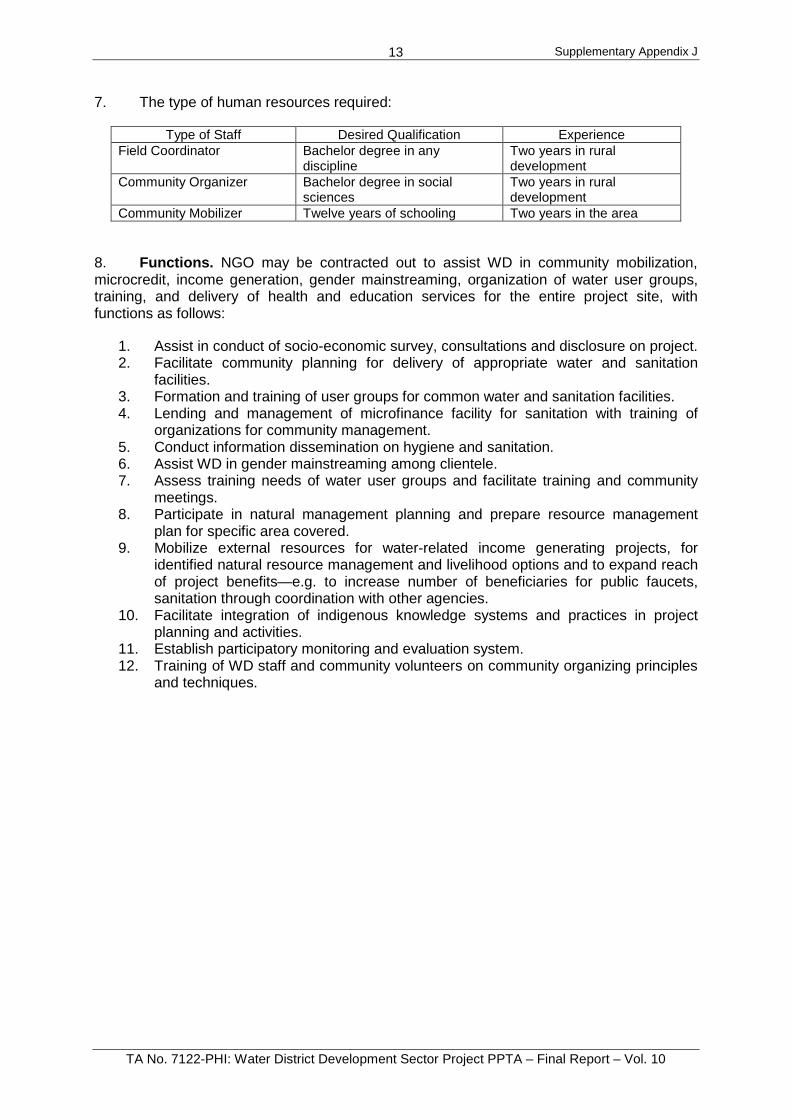
Supplementary Appendix J
TA No. 7122-PHI: Water District Development Sector Project PPTA – Final Report – Vol. 10
13
7. The type of human resources required:
Type of Staff Desired Qualification Experience Field Coordinator Bachelor degree in any
discipline Two years in rural development
Community Organizer Bachelor degree in social sciences
Two years in rural development
Community Mobilizer Twelve years of schooling Two years in the area
8. Functions. NGO may be contracted out to assist WD in community mobilization, microcredit, income generation, gender mainstreaming, organization of water user groups, training, and delivery of health and education services for the entire project site, with functions as follows:
1. Assist in conduct of socio-economic survey, consultations and disclosure on project. 2. Facilitate community planning for delivery of appropriate water and sanitation
facilities. 3. Formation and training of user groups for common water and sanitation facilities. 4. Lending and management of microfinance facility for sanitation with training of
organizations for community management. 5. Conduct information dissemination on hygiene and sanitation. 6. Assist WD in gender mainstreaming among clientele. 7. Assess training needs of water user groups and facilitate training and community
meetings. 8. Participate in natural management planning and prepare resource management
plan for specific area covered. 9. Mobilize external resources for water-related income generating projects, for
identified natural resource management and livelihood options and to expand reach of project benefits—e.g. to increase number of beneficiaries for public faucets, sanitation through coordination with other agencies.
10. Facilitate integration of indigenous knowledge systems and practices in project planning and activities.
11. Establish participatory monitoring and evaluation system. 12. Training of WD staff and community volunteers on community organizing principles
and techniques.