Asia and Thailand Reward Trends 2011-2012
59
Asia and Thailand Reward Trends 2011-2012 16 th March 2012 Thanwa Chulajata
Transcript of Asia and Thailand Reward Trends 2011-2012
Asia and Thailand Reward Trends 2011-2012
16th March 2012 Thanwa Chulajata
2 © 2012 Hay Group. All Rights Reserved
What we will cover
Regional Market Snapshot
Thailand Reward Trends
Economic Indicators
Pay Market Findings
Participant Profile
Remuneration Management
Market Pay Movement
Working Conditions and HR Issues

About Hay Group: we look at things differently
4 © 2012 Hay Group. All Rights Reserved
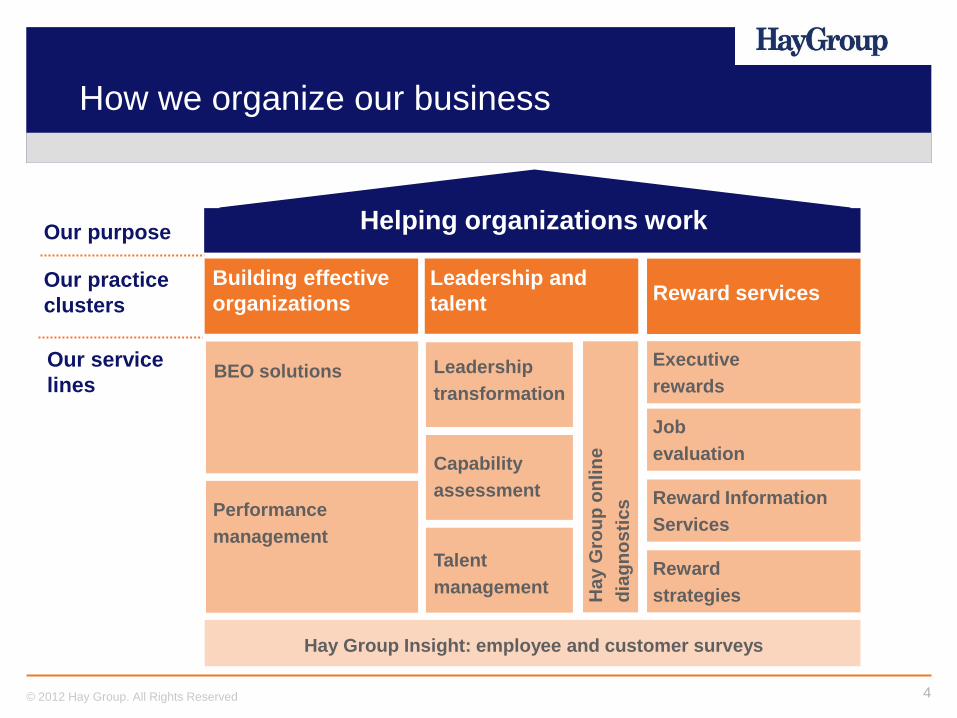
How we organize our business
Building effective
organizations
Leadership and
talent Reward services
Leadership
transformation
Capability
assessment
Talent
management H
ay G
rou
p o
nli
ne
dia
gn
os
tics
Executive
rewards
Job
evaluation
Reward Information
Services
Reward
strategies
Hay Group Insight: employee and customer surveys
Performance
management
BEO solutions
Helping organizations work Our purpose
Our practice
clusters
Our service
lines
5 © 2012 Hay Group. All Rights Reserved
Helping organizations with their leadership and talent issues
No matter how good they may be, your top people and emerging talent
need to be in step with your strategy and operating model to deliver the
best results.
We can help you develop and retain leaders, leadership teams and other strategic talent
that is crucial to sustained success.
You can leverage our pioneering research into human behavior to align your leaders
with your strategy.
Our services help you identify and nurture future leaders and make sure your people
are focused on your business objectives.
Drawing on our renowned databases of leadership data, you can benchmark your
people against outstanding performers in order to make the best staffing decisions.
6 © 2012 Hay Group. All Rights Reserved
Helping organizations through our reward services
From setting remuneration levels to identifying the right benefits and
executive rewards, providing the right reward program is essential to
attracting and retaining talented staff at all levels.
Hay Group research has shown that, on average, it costs the equivalent of six months‟
salary to replace a person who leaves an organization.
So it‟s important to invest time and effort to get your reward programs right.
With Hay Group, you gain experience, expertise, market knowledge and insight, as well
as the world‟s most comprehensive remuneration, benefits and reward management
practices databases.
Our global network of total rewards consultants provides a clear understanding of
business practices, industry trends and most of all, a clear understanding of people.
7 © 2012 Hay Group. All Rights Reserved
Helping clients to build effective organizations
If you are driving change or simply trying to realize more value from your
plans, being able to translate your strategy into reality is key to building an
effective organization.
Hay Group works with leaders to solve their business issues by:
Creating a „joined-up‟ effective organization. We ensure that core operating principles,
organization structure, culture and accountabilities are truly aligned with, and deliver,
the business strategy.
Helping clients develop clarity of direction and purpose. We help provide clarity and gain
commitment to goals and strategies, developing both the team and individual's
capability to sustain an effective organization.
Focusing on generating value. We focus on implementing improvements that generate
real benefits to our clients' businesses as speedily as possible.
8 © 2012 Hay Group. All Rights Reserved
Helping organizations with their employee and customer surveys
An effective employee survey is one of the key means through which
your organization can define and measure whether it is creating the
necessary energy and purpose to ensure that great results occur.
It‟s no surprise then that most organizations use employee and customer surveys. But
asking the question isn‟t enough.
The true benefits come when employee feedback is translated into meaningful action.
It‟s here that Hay Group‟s employee survey process stands out.
We can help you ask the right questions, understand what the results mean and
prioritize actions (using our comprehensive database of normative benchmarks) and in
doing so help your organization and your people achieve their potential.
9 © 2012 Hay Group. All Rights Reserved
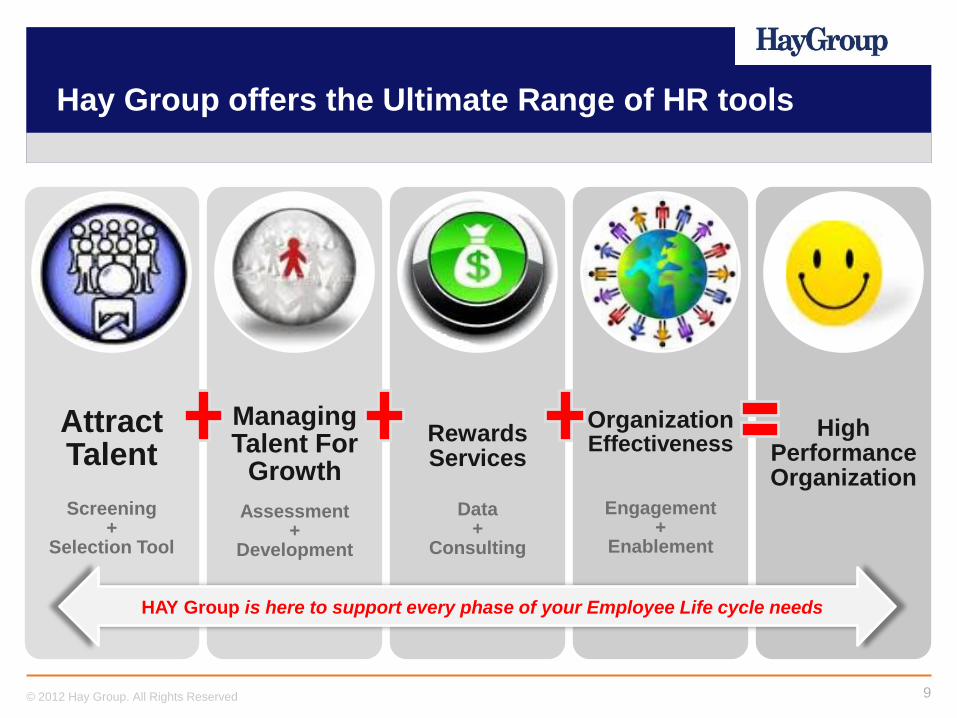
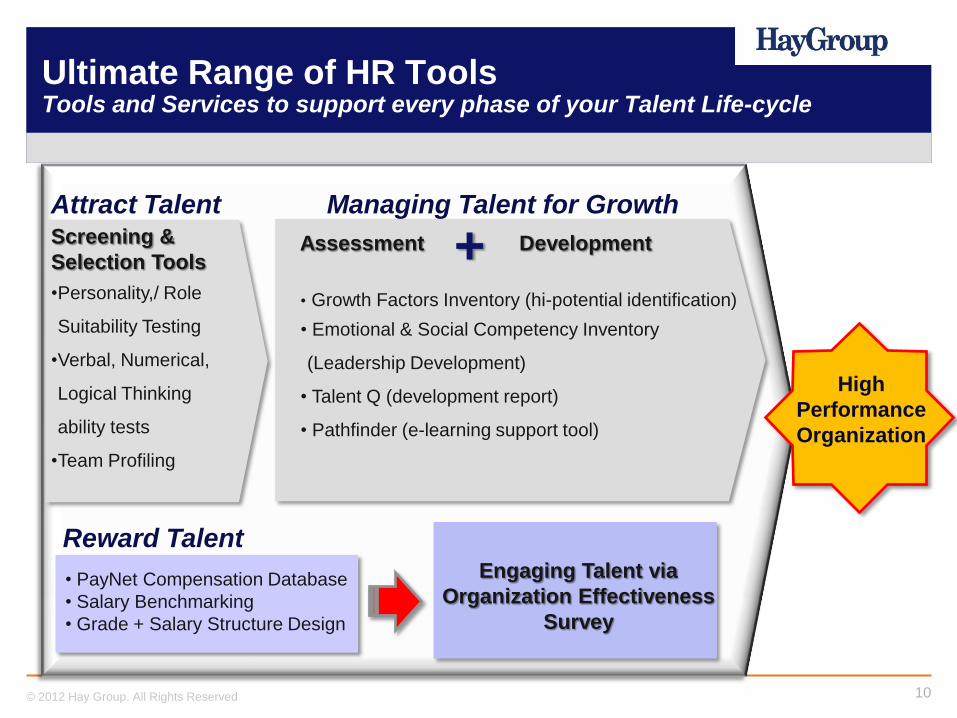
Hay Group offers the Ultimate Range of HR tools
Attract Talent
Screening
+ Selection Tool
Managing Talent For
Growth
Assessment +
Development
Rewards Services
Data
+ Consulting
Organization Effectiveness
Engagement +
Enablement
High Performance Organization
HAY Group is here to support every phase of your Employee Life cycle needs
10 © 2012 Hay Group. All Rights Reserved
Screening &
Selection Tools
•Personality,/ Role
Suitability Testing
•Verbal, Numerical,
Logical Thinking
ability tests
•Team Profiling
Assessment
Development
• Growth Factors Inventory (hi-potential identification)
• Emotional & Social Competency Inventory
(Leadership Development)
• Talent Q (development report)
• Pathfinder (e-learning support tool)
Ultimate Range of HR Tools Tools and Services to support every phase of your Talent Life-cycle
Managing Talent for Growth Attract Talent
High
Performance
Organization
+
Reward Talent
• PayNet Compensation Database
• Salary Benchmarking
• Grade + Salary Structure Design
Engaging Talent via
Organization Effectiveness
Survey
11 © 2012 Hay Group. All Rights Reserved
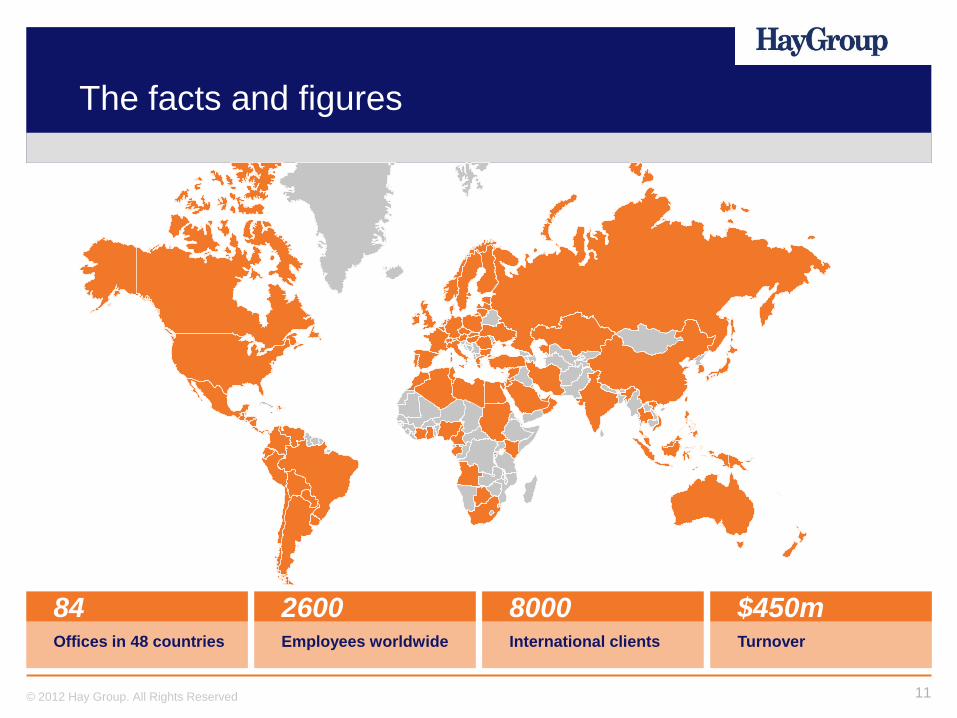
The facts and figures
84 Offices in 48 countries
2600 Employees worldwide
8000 International clients
$450m Turnover
Regional Market Snapshot
01
13 © 2012 Hay Group. All Rights Reserved
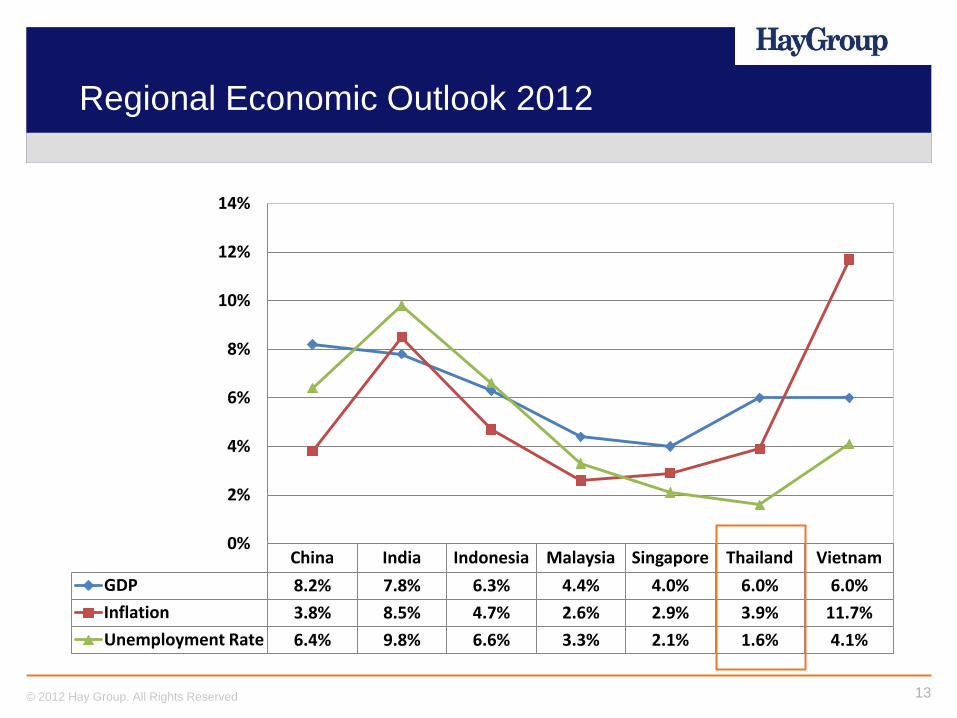
Regional Economic Outlook 2012
China India Indonesia Malaysia Singapore Thailand Vietnam
GDP 8.2% 7.8% 6.3% 4.4% 4.0% 6.0% 6.0%
Inflation 3.8% 8.5% 4.7% 2.6% 2.9% 3.9% 11.7%
Unemployment Rate 6.4% 9.8% 6.6% 3.3% 2.1% 1.6% 4.1%
0%
2%
4%
6%
8%
10%
12%
14%
14 © 2012 Hay Group. All Rights Reserved
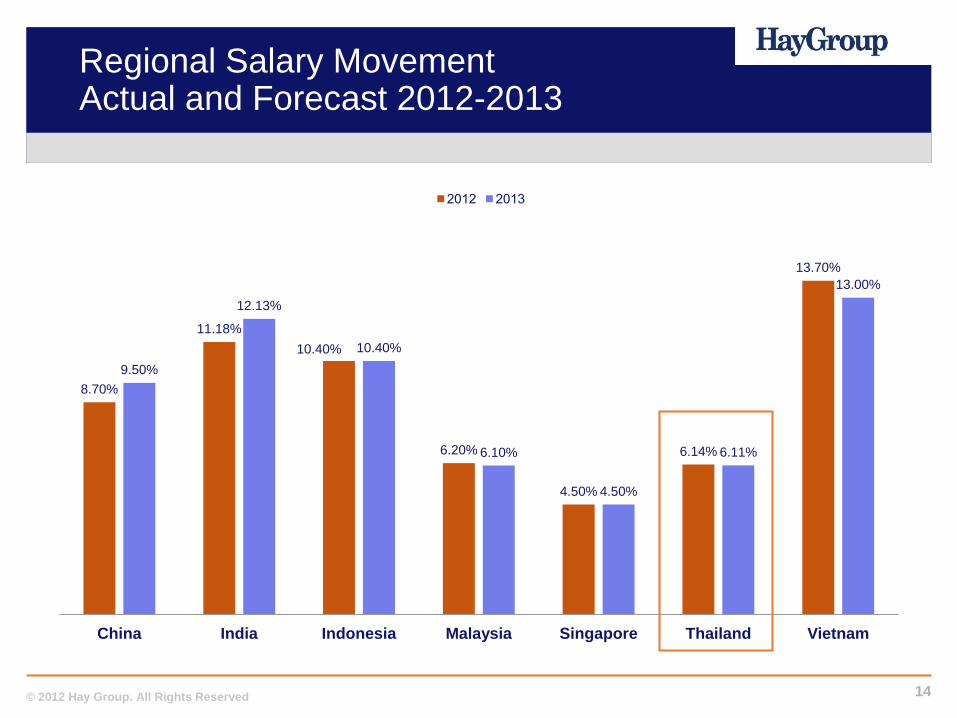
Regional Salary Movement Actual and Forecast 2012-2013
8.70%
11.18%
10.40%
6.20%
4.50%
6.14%
13.70%
9.50%
12.13%
10.40%
6.10%
4.50%
6.11%
13.00%
China India Indonesia Malaysia Singapore Thailand Vietnam
2012 2013
15 © 2012 Hay Group. All Rights Reserved
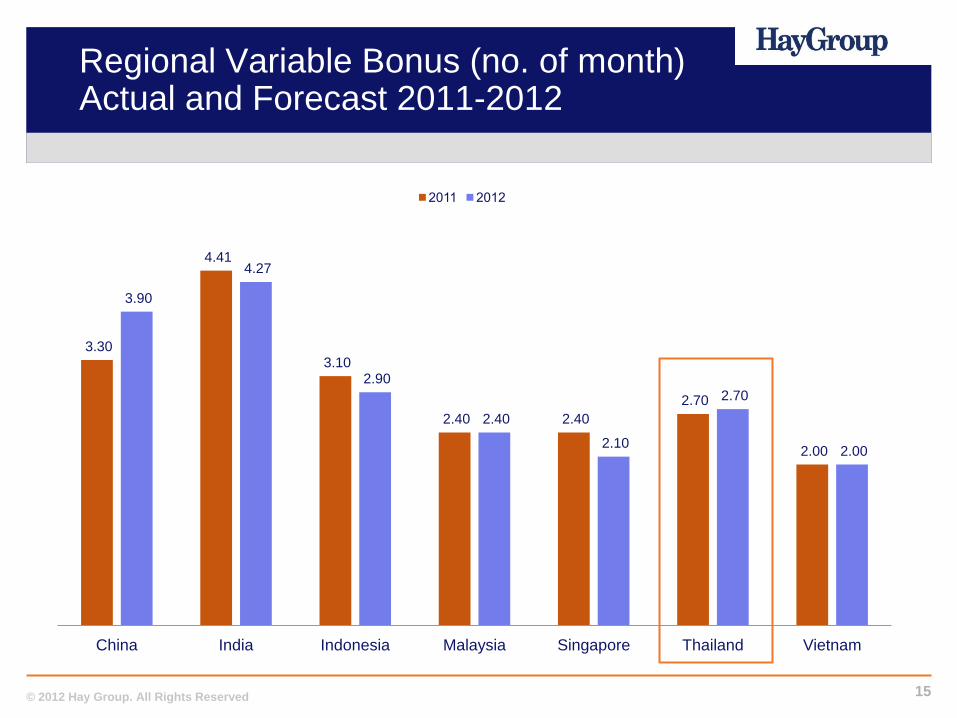
Regional Variable Bonus (no. of month) Actual and Forecast 2011-2012
3.30
4.41
3.10
2.40 2.40
2.70
2.00
3.90
4.27
2.90
2.40
2.10
2.70
2.00
China India Indonesia Malaysia Singapore Thailand Vietnam
2011 2012
16 © 2012 Hay Group. All Rights Reserved
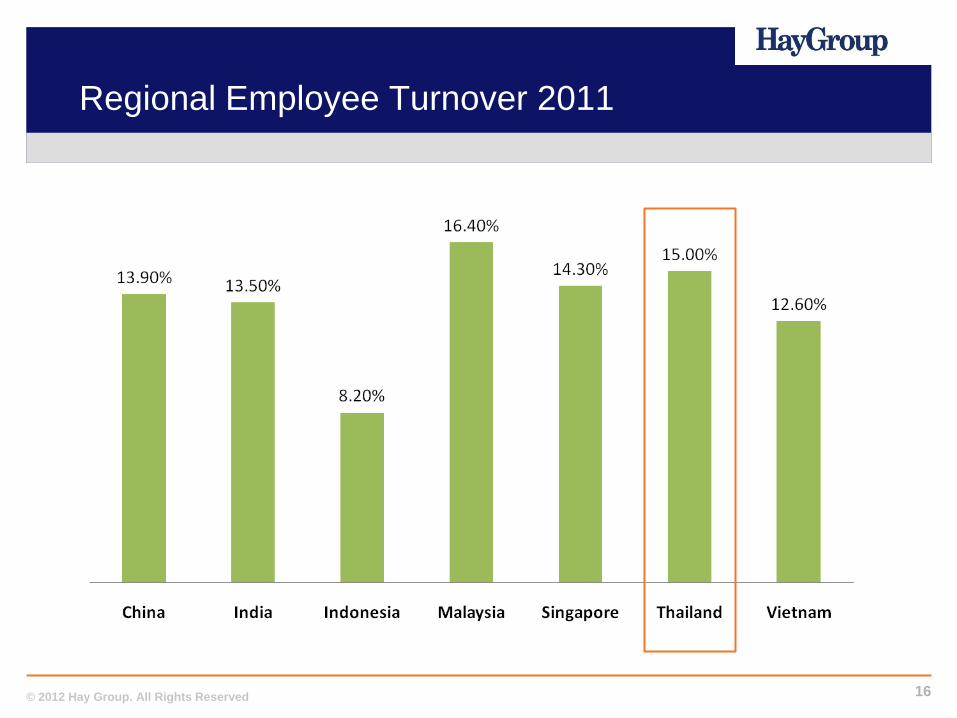
Regional Employee Turnover 2011
17 © 2012 Hay Group. All Rights Reserved
Country Insight - India
Workforce planning/sourcing : India is a growing market with the globalization
economy is open for the talent war with the options available to professionals. Talent
acquisition is and quality of manpower is the key issues now.
Employee motivation : Keeping the workforce motivated is one of the key challenges
of HR. Motivation no longer comes from not only a attractive pay package but also
talent segmentation with performance appraisal and rewards is essential to a good
team of workers. Employees also expect job satisfaction, learning and development
facilities.
Talent retention and employee engagement : Work-life balance and organization
climate are considered part of the employee experience. Employee Satisfaction
Surveys cannot just remain an exercise and results cannot simply be ignored yet
implementation to develop have to be presented.
18 © 2012 Hay Group. All Rights Reserved
Country Insight - China
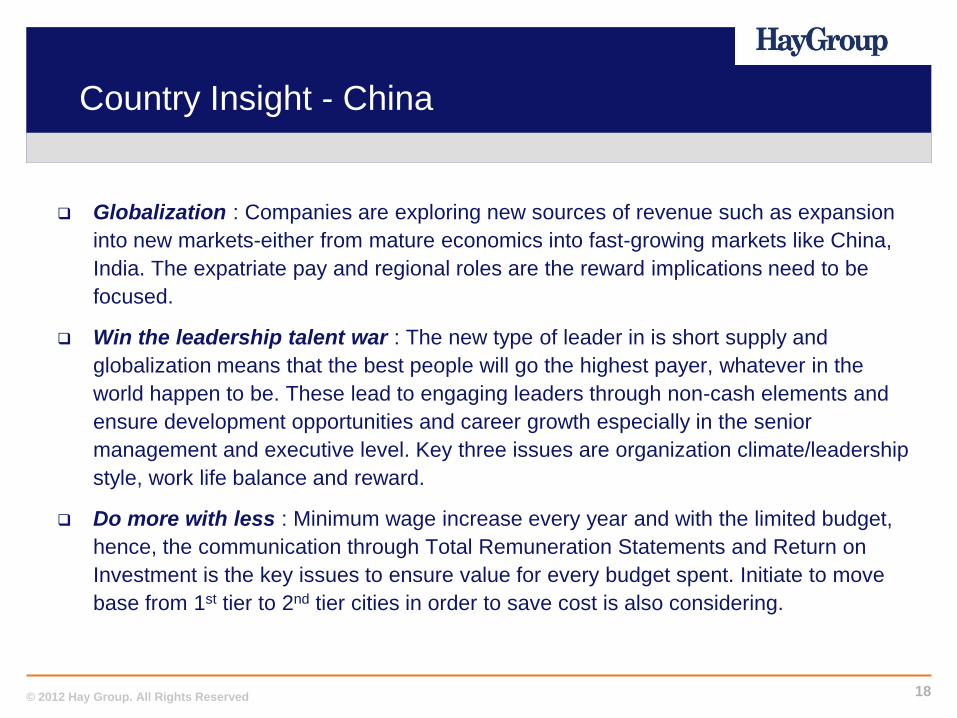
Globalization : Companies are exploring new sources of revenue such as expansion
into new markets-either from mature economics into fast-growing markets like China,
India. The expatriate pay and regional roles are the reward implications need to be
focused.
Win the leadership talent war : The new type of leader in is short supply and
globalization means that the best people will go the highest payer, whatever in the
world happen to be. These lead to engaging leaders through non-cash elements and
ensure development opportunities and career growth especially in the senior
management and executive level. Key three issues are organization climate/leadership
style, work life balance and reward.
Do more with less : Minimum wage increase every year and with the limited budget,
hence, the communication through Total Remuneration Statements and Return on
Investment is the key issues to ensure value for every budget spent. Initiate to move
base from 1st tier to 2nd tier cities in order to save cost is also considering.
19 © 2012 Hay Group. All Rights Reserved
Country Insight - Malaysia
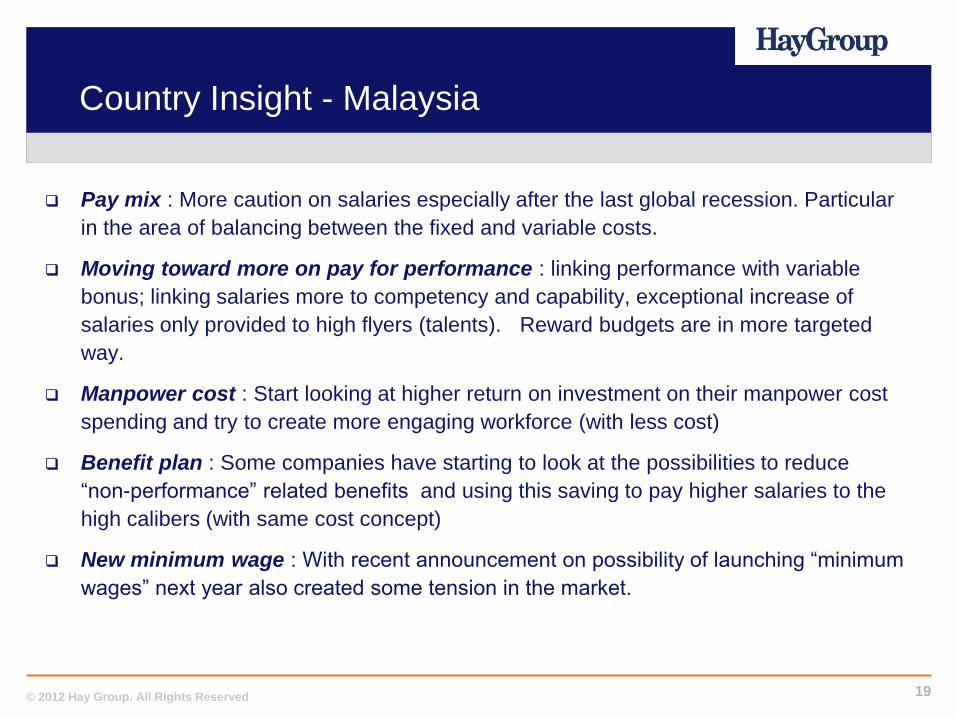
Pay mix : More caution on salaries especially after the last global recession. Particular
in the area of balancing between the fixed and variable costs.
Moving toward more on pay for performance : linking performance with variable
bonus; linking salaries more to competency and capability, exceptional increase of
salaries only provided to high flyers (talents). Reward budgets are in more targeted
way.
Manpower cost : Start looking at higher return on investment on their manpower cost
spending and try to create more engaging workforce (with less cost)
Benefit plan : Some companies have starting to look at the possibilities to reduce
“non-performance” related benefits and using this saving to pay higher salaries to the
high calibers (with same cost concept)
New minimum wage : With recent announcement on possibility of launching “minimum
wages” next year also created some tension in the market.
20 © 2012 Hay Group. All Rights Reserved
Country Insight - Singapore
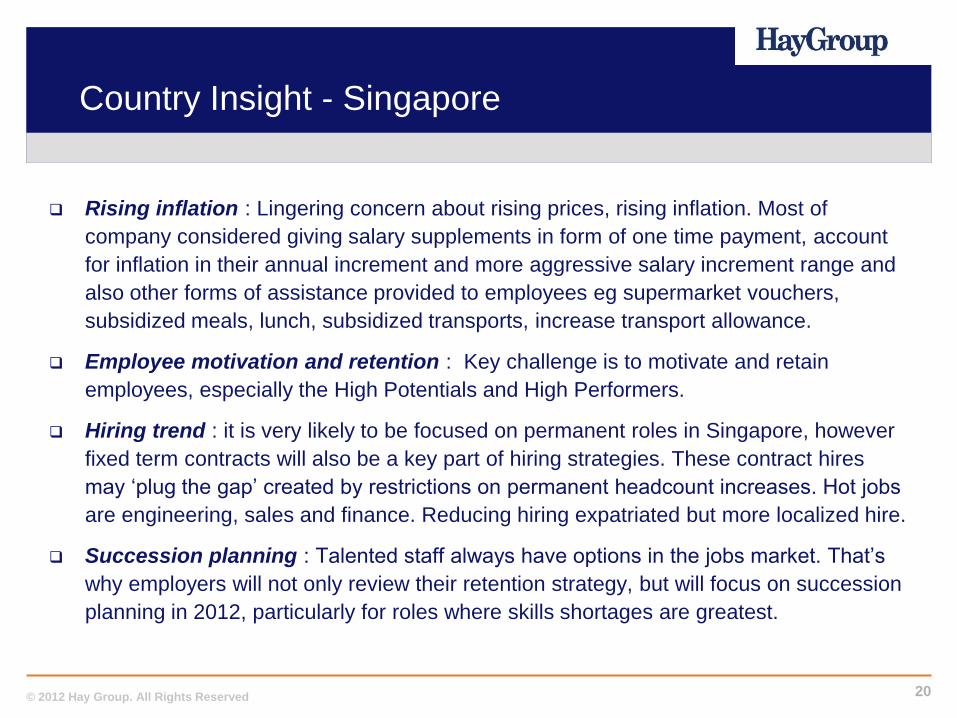
Rising inflation : Lingering concern about rising prices, rising inflation. Most of
company considered giving salary supplements in form of one time payment, account
for inflation in their annual increment and more aggressive salary increment range and
also other forms of assistance provided to employees eg supermarket vouchers,
subsidized meals, lunch, subsidized transports, increase transport allowance.
Employee motivation and retention : Key challenge is to motivate and retain
employees, especially the High Potentials and High Performers.
Hiring trend : it is very likely to be focused on permanent roles in Singapore, however
fixed term contracts will also be a key part of hiring strategies. These contract hires
may „plug the gap‟ created by restrictions on permanent headcount increases. Hot jobs
are engineering, sales and finance. Reducing hiring expatriated but more localized hire.
Succession planning : Talented staff always have options in the jobs market. That‟s
why employers will not only review their retention strategy, but will focus on succession
planning in 2012, particularly for roles where skills shortages are greatest.
21 © 2012 Hay Group. All Rights Reserved
Country Insight - Indonesia
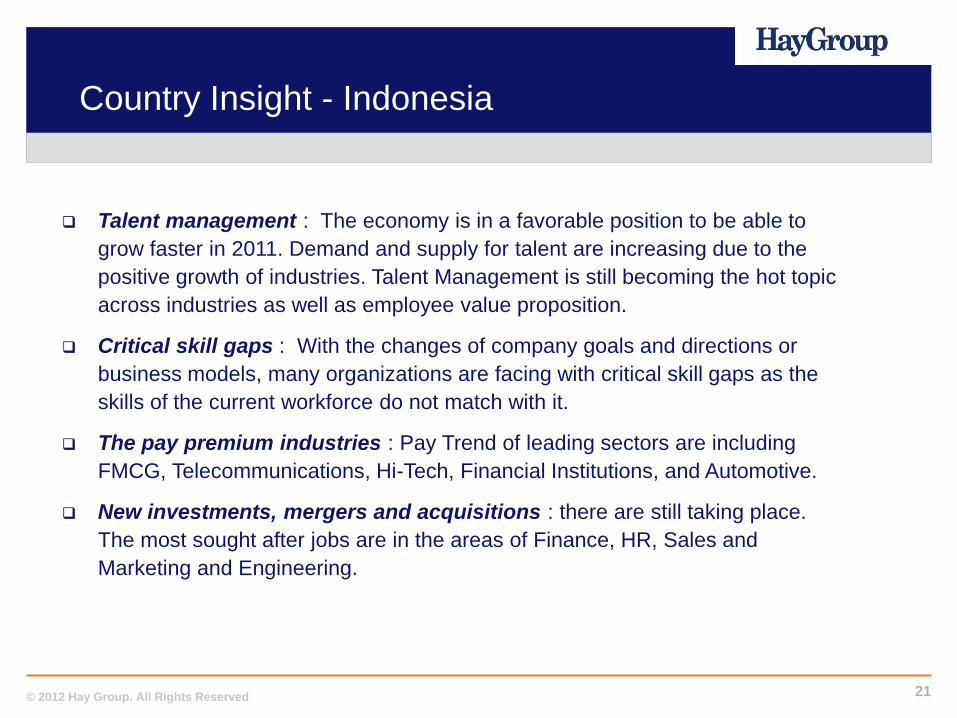
Talent management : The economy is in a favorable position to be able to
grow faster in 2011. Demand and supply for talent are increasing due to the
positive growth of industries. Talent Management is still becoming the hot topic
across industries as well as employee value proposition.
Critical skill gaps : With the changes of company goals and directions or
business models, many organizations are facing with critical skill gaps as the
skills of the current workforce do not match with it.
The pay premium industries : Pay Trend of leading sectors are including
FMCG, Telecommunications, Hi-Tech, Financial Institutions, and Automotive.
New investments, mergers and acquisitions : there are still taking place.
The most sought after jobs are in the areas of Finance, HR, Sales and
Marketing and Engineering.
22 © 2012 Hay Group. All Rights Reserved
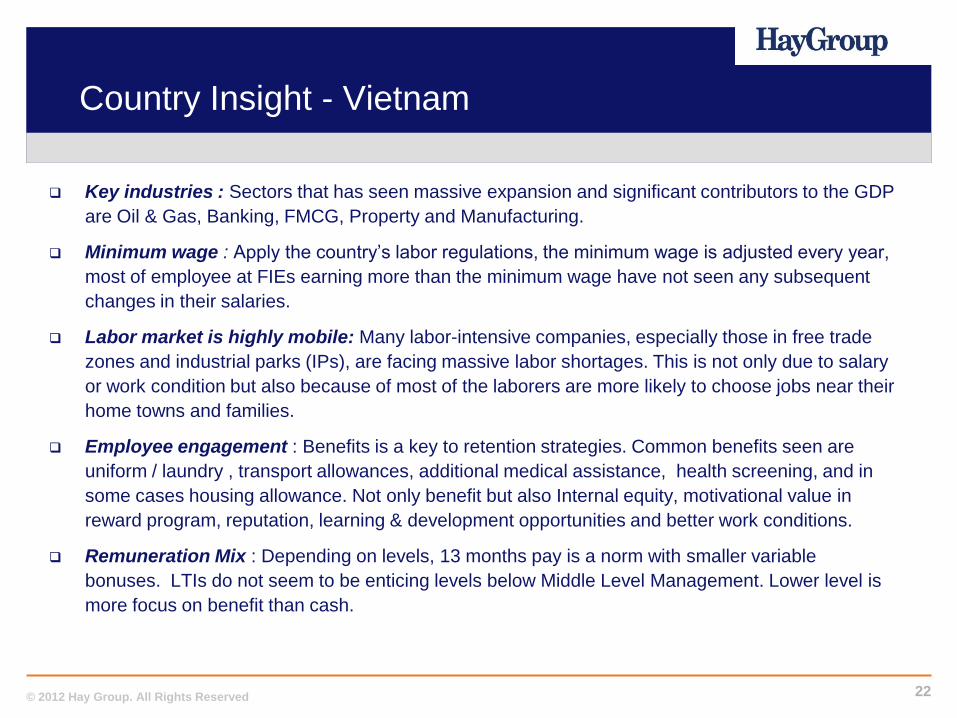
Country Insight - Vietnam
Key industries : Sectors that has seen massive expansion and significant contributors to the GDP
are Oil & Gas, Banking, FMCG, Property and Manufacturing.
Minimum wage : Apply the country‟s labor regulations, the minimum wage is adjusted every year,
most of employee at FIEs earning more than the minimum wage have not seen any subsequent
changes in their salaries.
Labor market is highly mobile: Many labor-intensive companies, especially those in free trade
zones and industrial parks (IPs), are facing massive labor shortages. This is not only due to salary
or work condition but also because of most of the laborers are more likely to choose jobs near their
home towns and families.
Employee engagement : Benefits is a key to retention strategies. Common benefits seen are
uniform / laundry , transport allowances, additional medical assistance, health screening, and in
some cases housing allowance. Not only benefit but also Internal equity, motivational value in
reward program, reputation, learning & development opportunities and better work conditions.
Remuneration Mix : Depending on levels, 13 months pay is a norm with smaller variable
bonuses. LTIs do not seem to be enticing levels below Middle Level Management. Lower level is
more focus on benefit than cash.
23 © 2012 Hay Group. All Rights Reserved
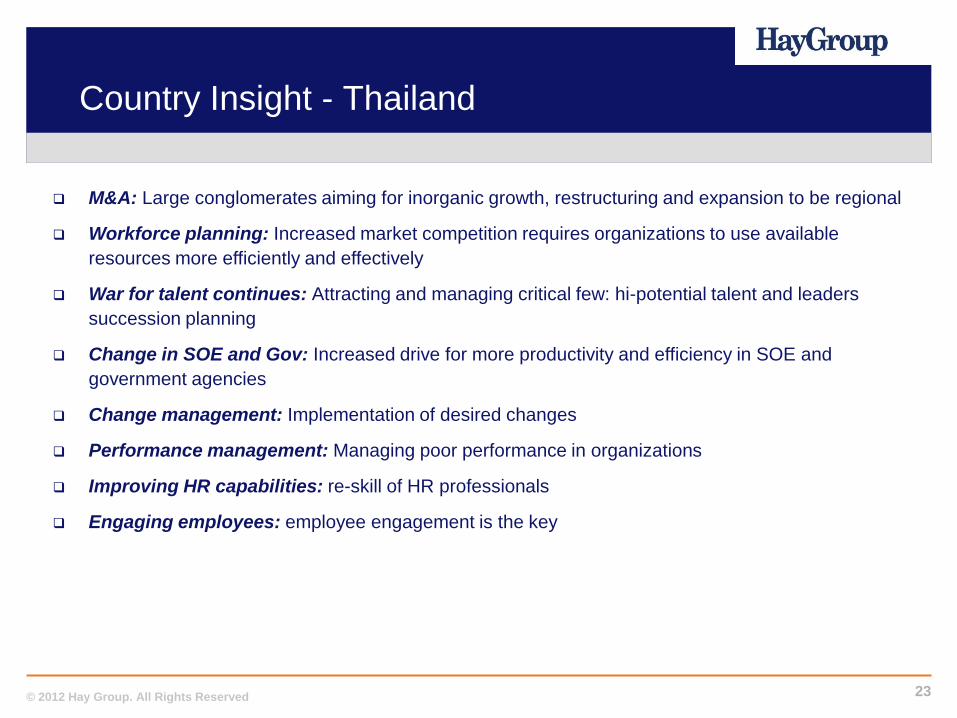
M&A: Large conglomerates aiming for inorganic growth, restructuring and expansion to be regional
Workforce planning: Increased market competition requires organizations to use available
resources more efficiently and effectively
War for talent continues: Attracting and managing critical few: hi-potential talent and leaders
succession planning
Change in SOE and Gov: Increased drive for more productivity and efficiency in SOE and
government agencies
Change management: Implementation of desired changes
Performance management: Managing poor performance in organizations
Improving HR capabilities: re-skill of HR professionals
Engaging employees: employee engagement is the key
Country Insight - Thailand
24 © 2012 Hay Group. All Rights Reserved
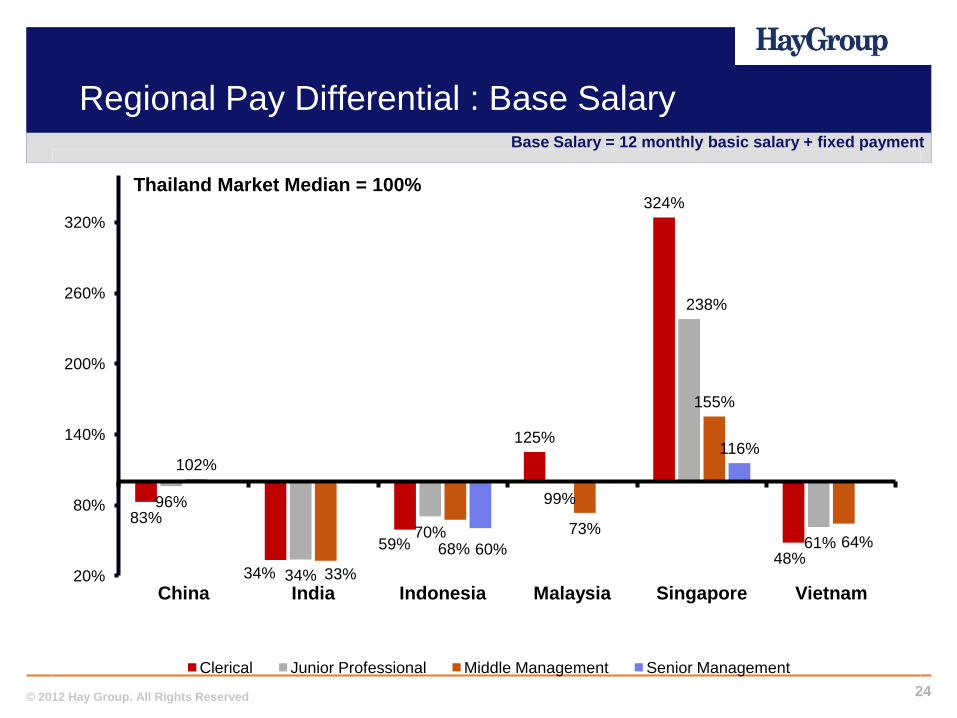
Regional Pay Differential : Base Salary
83%
34%
59%
125%
324%
48%
96%
34%
70%
99%
238%
61%
102%
33%
68%
73%
155%
64% 60%
116%
20%
80%
140%
200%
260%
320%
China India Indonesia Malaysia Singapore Vietnam
Thailand Market Median = 100%
Clerical Junior Professional Middle Management Senior Management
Base Salary = 12 monthly basic salary + fixed payment
25 © 2012 Hay Group. All Rights Reserved
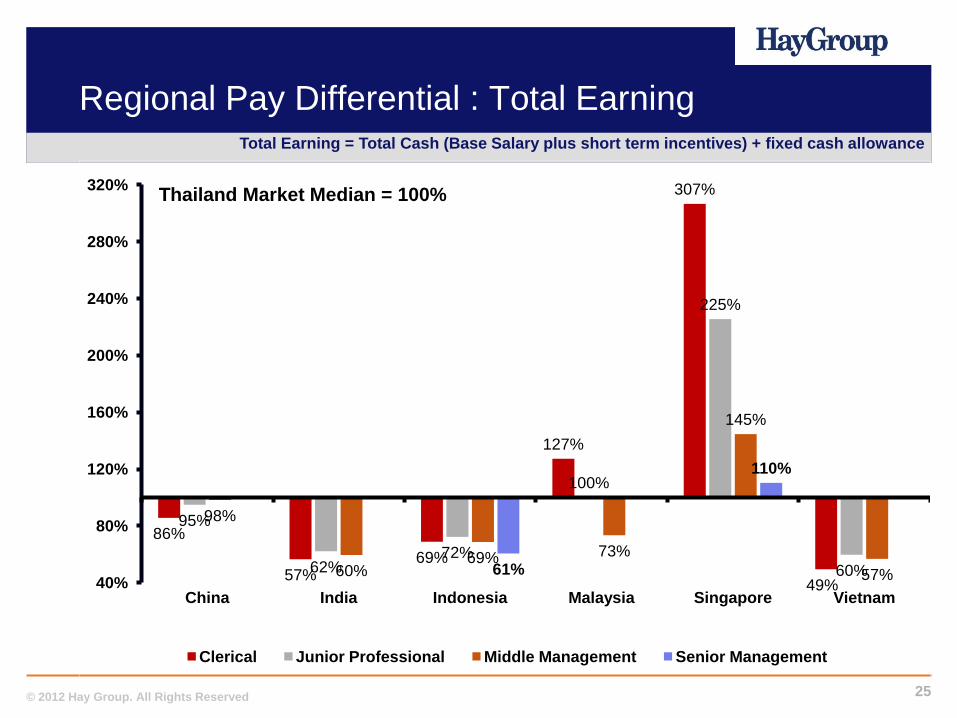
Regional Pay Differential : Total Earning
86%
57% 69%
127%
307%
49%
95%
62% 72%
100%
225%
60%
98%
60% 69% 73%
145%
57% 61%
110%
40%
80%
120%
160%
200%
240%
280%
320%
China India Indonesia Malaysia Singapore Vietnam
Thailand Market Median = 100%
Clerical Junior Professional Middle Management Senior Management
Total Earning = Total Cash (Base Salary plus short term incentives) + fixed cash allowance
Thailand Reward Trends
02
27 © 2012 Hay Group. All Rights Reserved
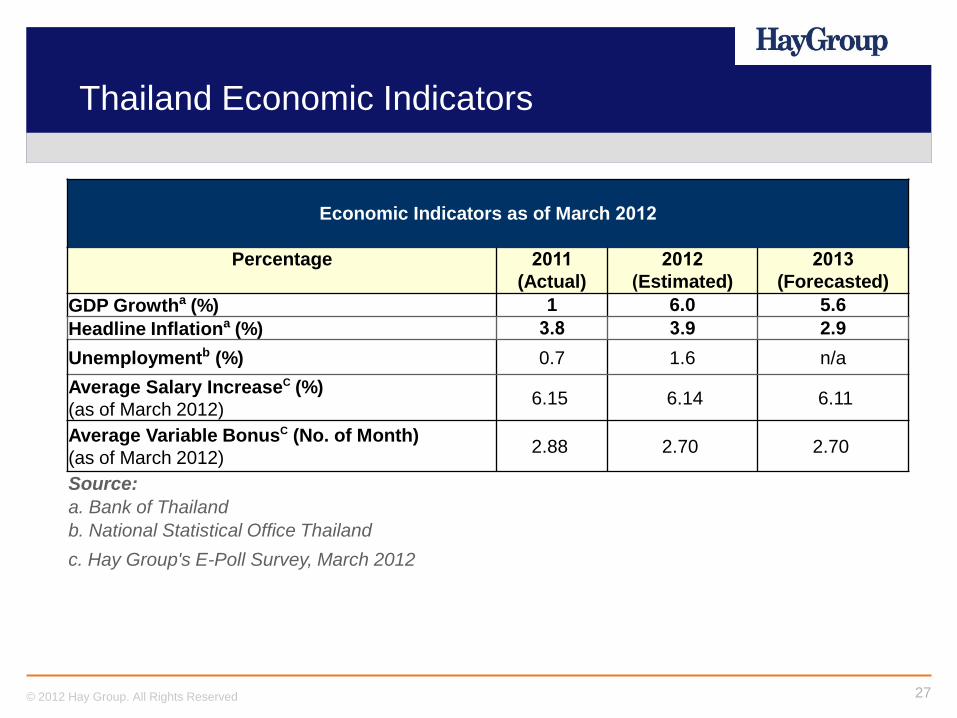
Thailand Economic Indicators
Economic Indicators as of March 2012
Percentage 2011
(Actual)
2012
(Estimated)
2013
(Forecasted)
GDP Growtha (%) 1 6.0 5.6
Headline Inflationa (%) 3.8 3.9 2.9
Unemploymentb (%) 0.7 1.6 n/a
Average Salary IncreaseC (%)
(as of March 2012) 6.15 6.14 6.11
Average Variable BonusC (No. of Month)
(as of March 2012) 2.88 2.70 2.70
Source:
a. Bank of Thailand
b. National Statistical Office Thailand
c. Hay Group's E-Poll Survey, March 2012

Participant Profile
29 © 2012 Hay Group. All Rights Reserved
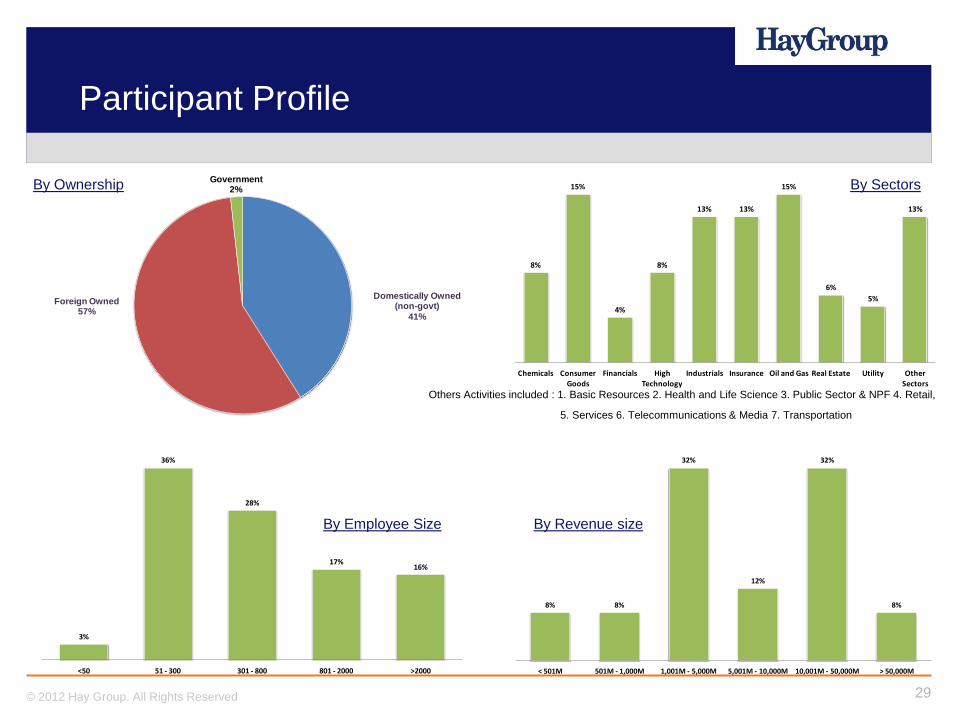
Participant Profile
Domestically Owned (non-govt)
41%
Foreign Owned57%
Government2%
8%
15%
4%
8%
13% 13%
15%
6%
5%
13%
Chemicals Consumer Goods
Financials High Technology
Industrials Insurance Oil and Gas Real Estate Utility Other Sectors
8% 8%
32%
12%
32%
8%
< 501M 501M - 1,000M 1,001M - 5,000M 5,001M - 10,000M 10,001M - 50,000M > 50,000M
3%
36%
28%
17%16%
<50 51 - 300 301 - 800 801 - 2000 >2000
By Ownership By Sectors
By Revenue size By Employee Size
Others Activities included : 1. Basic Resources 2. Health and Life Science 3. Public Sector & NPF 4. Retail,
5. Services 6. Telecommunications & Media 7. Transportation
30 © 2012 Hay Group. All Rights Reserved
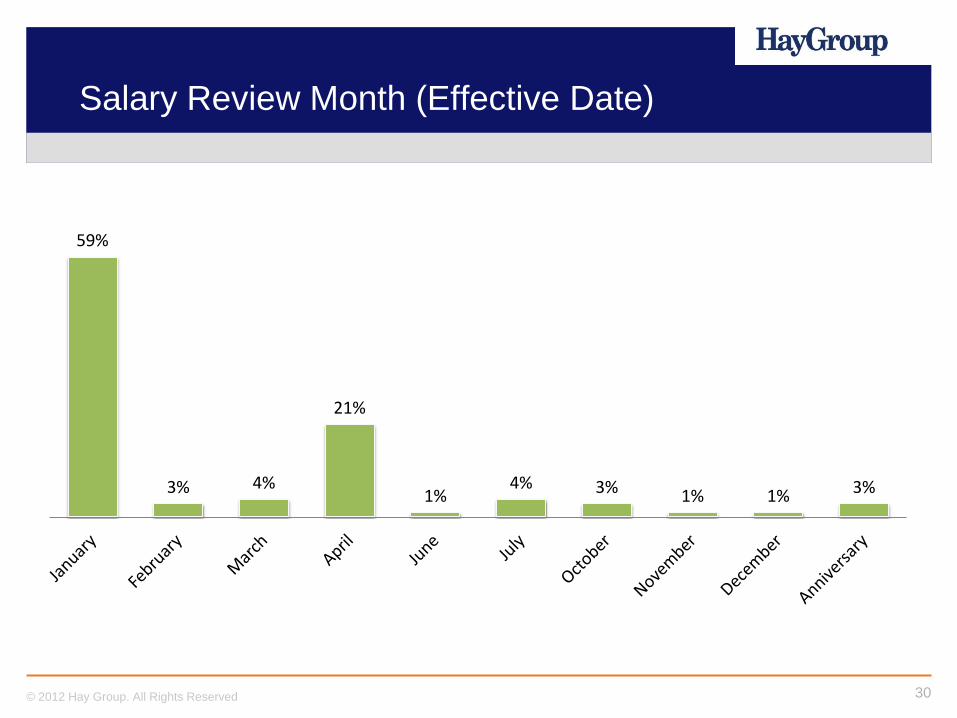
Salary Review Month (Effective Date)
59%
3% 4%
21%
1% 4% 3% 1% 1% 3%
Remuneration Management
32 © 2012 Hay Group. All Rights Reserved
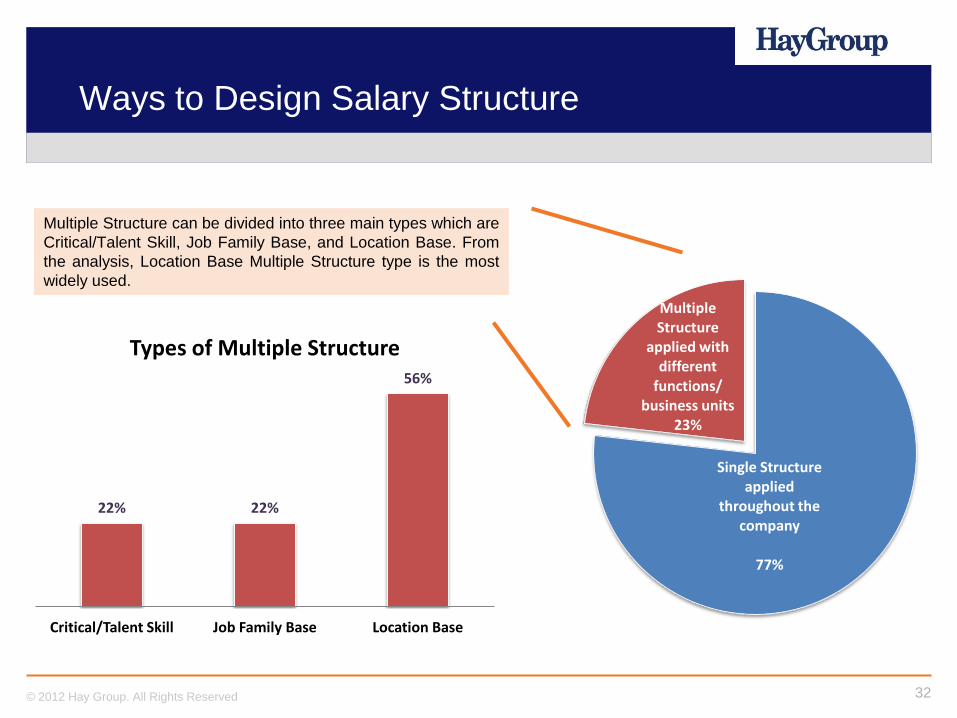
Ways to Design Salary Structure
Single Structure applied
throughout the company
77%
Multiple Structure
applied with different
functions/ business units
23%
22% 22%
56%
Critical/Talent Skill Job Family Base Location Base
Types of Multiple Structure
Multiple Structure can be divided into three main types which are
Critical/Talent Skill, Job Family Base, and Location Base. From
the analysis, Location Base Multiple Structure type is the most
widely used.
33 © 2012 Hay Group. All Rights Reserved
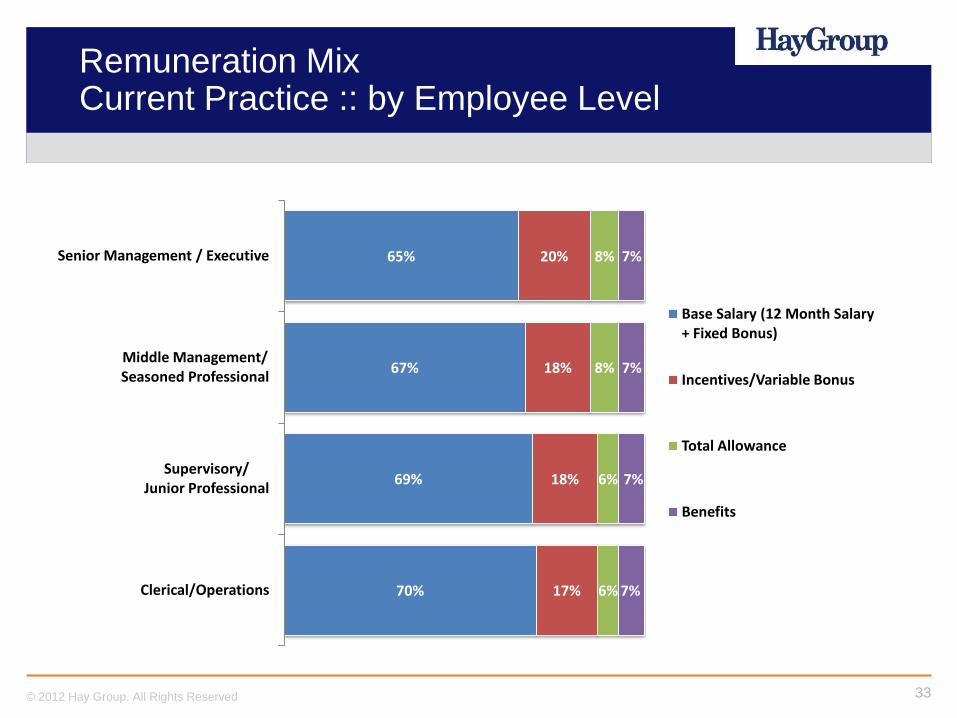
Remuneration Mix Current Practice :: by Employee Level
70%
69%
67%
65%
17%
18%
18%
20%
6%
6%
8%
8%
7%
7%
7%
7%
Clerical/Operations
Supervisory/ Junior Professional
Middle Management/ Seasoned Professional
Senior Management / Executive
Base Salary (12 Month Salary + Fixed Bonus)
Incentives/Variable Bonus
Total Allowance
Benefits
34 © 2012 Hay Group. All Rights Reserved
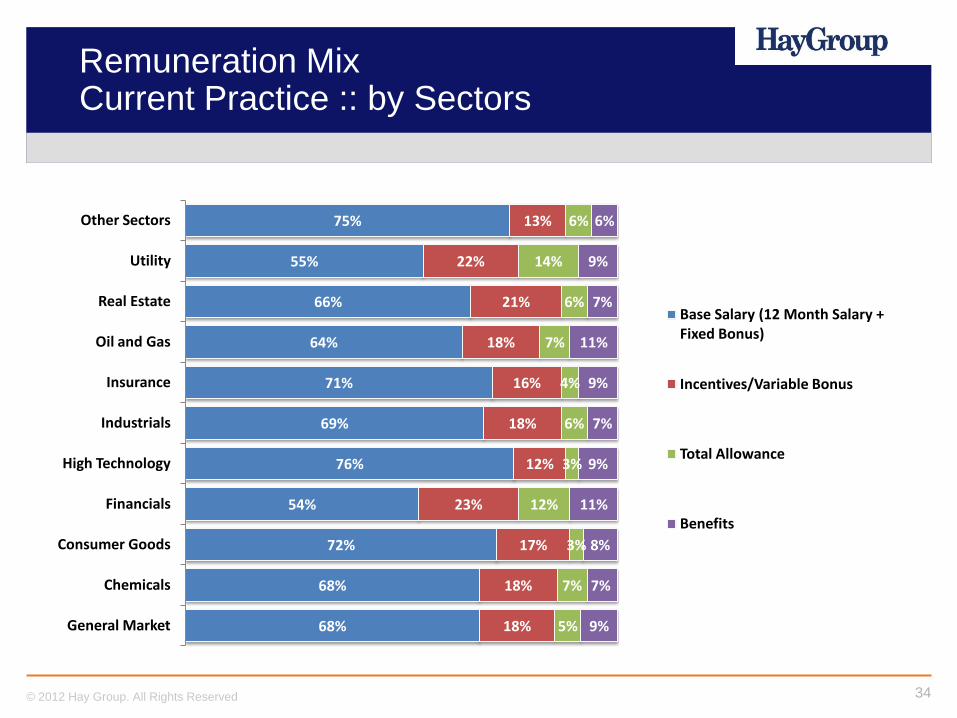
Remuneration Mix Current Practice :: by Sectors
68%
68%
72%
54%
76%
69%
71%
64%
66%
55%
75%
18%
18%
17%
23%
12%
18%
16%
18%
21%
22%
13%
5%
7%
3%
12%
3%
6%
4%
7%
6%
14%
6%
9%
7%
8%
11%
9%
7%
9%
11%
7%
9%
6%
General Market
Chemicals
Consumer Goods
Financials
High Technology
Industrials
Insurance
Oil and Gas
Real Estate
Utility
Other Sectors
Base Salary (12 Month Salary + Fixed Bonus)
Incentives/Variable Bonus
Total Allowance
Benefits
35 © 2012 Hay Group. All Rights Reserved
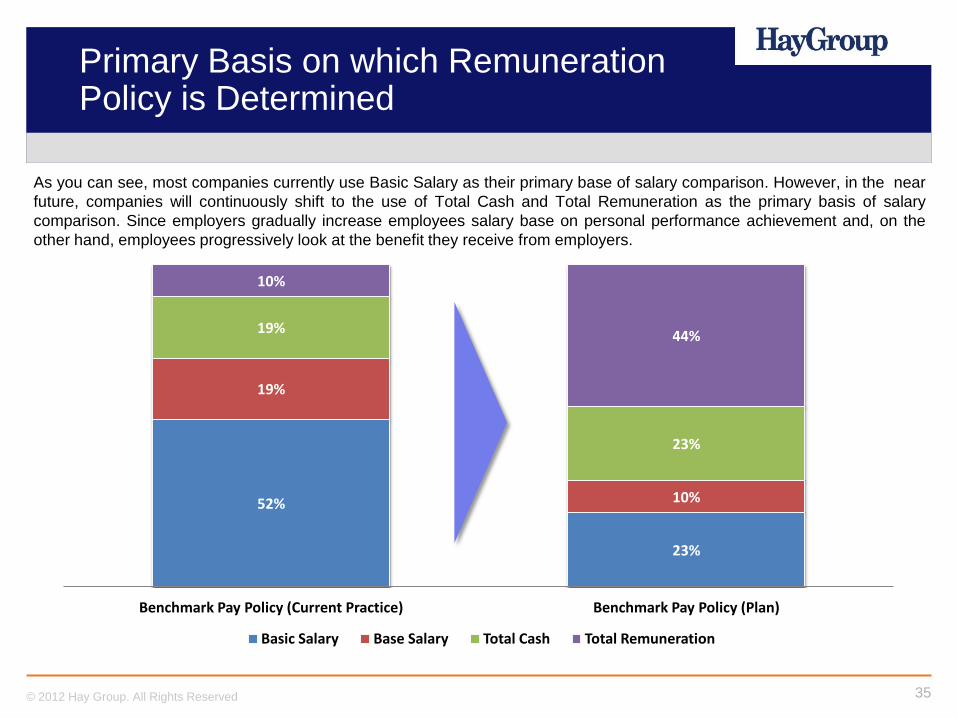
Primary Basis on which Remuneration Policy is Determined
52%
23%
19%
10%
19%
23%
10%
44%
Benchmark Pay Policy (Current Practice) Benchmark Pay Policy (Plan)
Basic Salary Base Salary Total Cash Total Remuneration
As you can see, most companies currently use Basic Salary as their primary base of salary comparison. However, in the near
future, companies will continuously shift to the use of Total Cash and Total Remuneration as the primary basis of salary
comparison. Since employers gradually increase employees salary base on personal performance achievement and, on the
other hand, employees progressively look at the benefit they receive from employers.
36 © 2012 Hay Group. All Rights Reserved
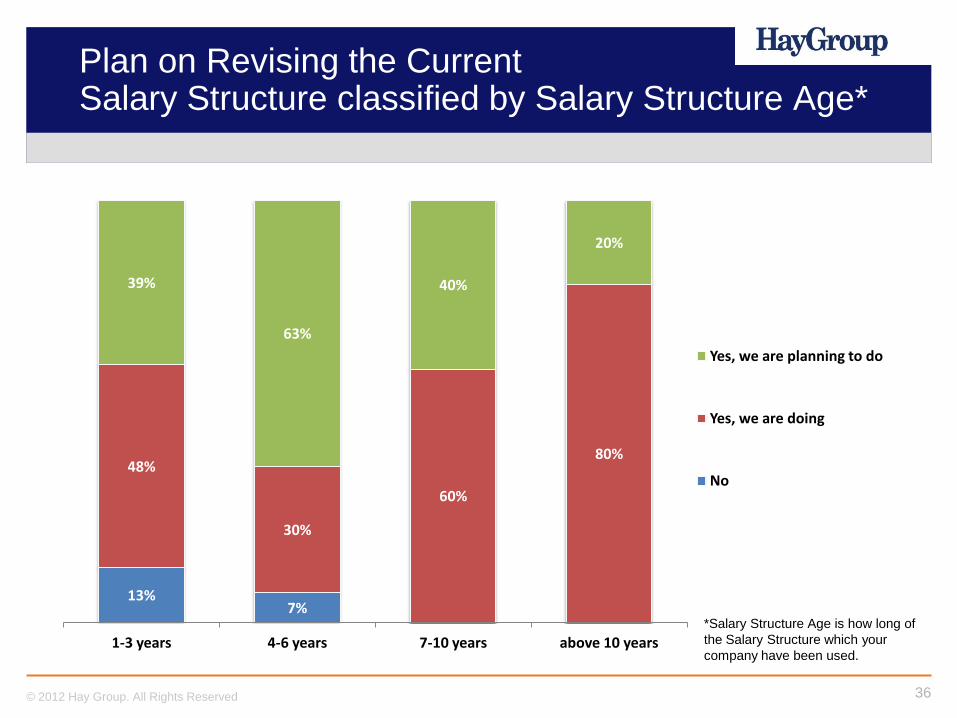
Plan on Revising the Current Salary Structure classified by Salary Structure Age*
*Salary Structure Age is how long of
the Salary Structure which your
company have been used.
13% 7%
48%
30%
60%
80%
39%
63%
40%
20%
1-3 years 4-6 years 7-10 years above 10 years
Yes, we are planning to do
Yes, we are doing
No
Developing Remuneration Policy
38 © 2012 Hay Group. All Rights Reserved
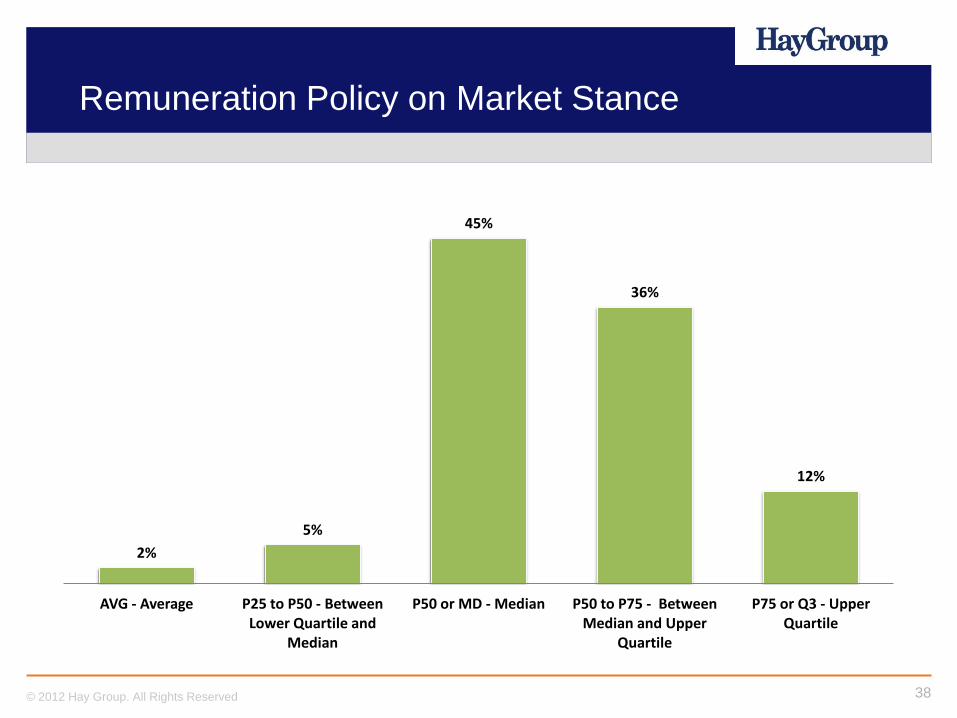
Remuneration Policy on Market Stance
2%
5%
45%
36%
12%
AVG - Average P25 to P50 - Between Lower Quartile and
Median
P50 or MD - Median P50 to P75 - Between Median and Upper
Quartile
P75 or Q3 - Upper Quartile
39 © 2012 Hay Group. All Rights Reserved
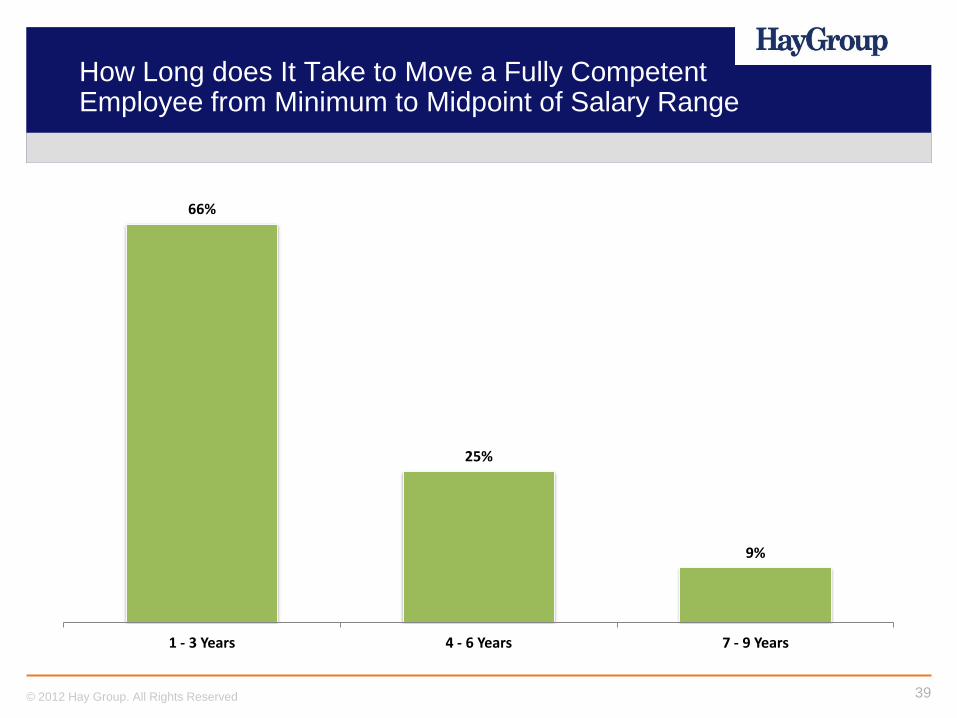
How Long does It Take to Move a Fully Competent Employee from Minimum to Midpoint of Salary Range
66%
25%
9%
1 - 3 Years 4 - 6 Years 7 - 9 Years
40 © 2012 Hay Group. All Rights Reserved
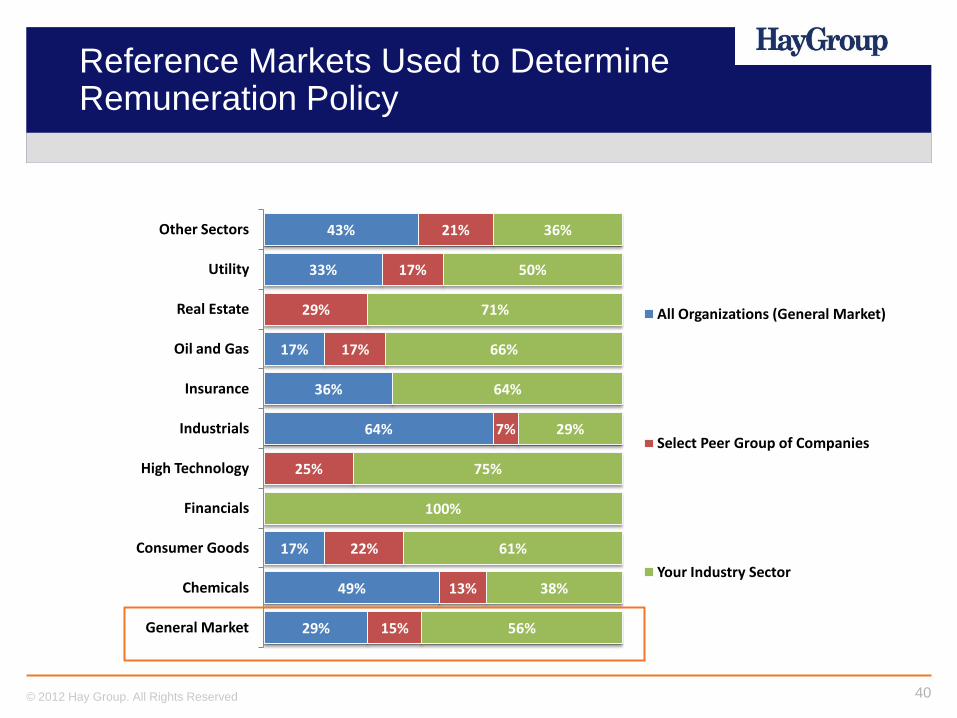
Reference Markets Used to Determine Remuneration Policy
29%
49%
17%
64%
36%
17%
33%
43%
15%
13%
22%
25%
7%
17%
29%
17%
21%
56%
38%
61%
100%
75%
29%
64%
66%
71%
50%
36%
General Market
Chemicals
Consumer Goods
Financials
High Technology
Industrials
Insurance
Oil and Gas
Real Estate
Utility
Other Sectors
All Organizations (General Market)
Select Peer Group of Companies
Your Industry Sector
Market Pay Movement
42 © 2012 Hay Group. All Rights Reserved
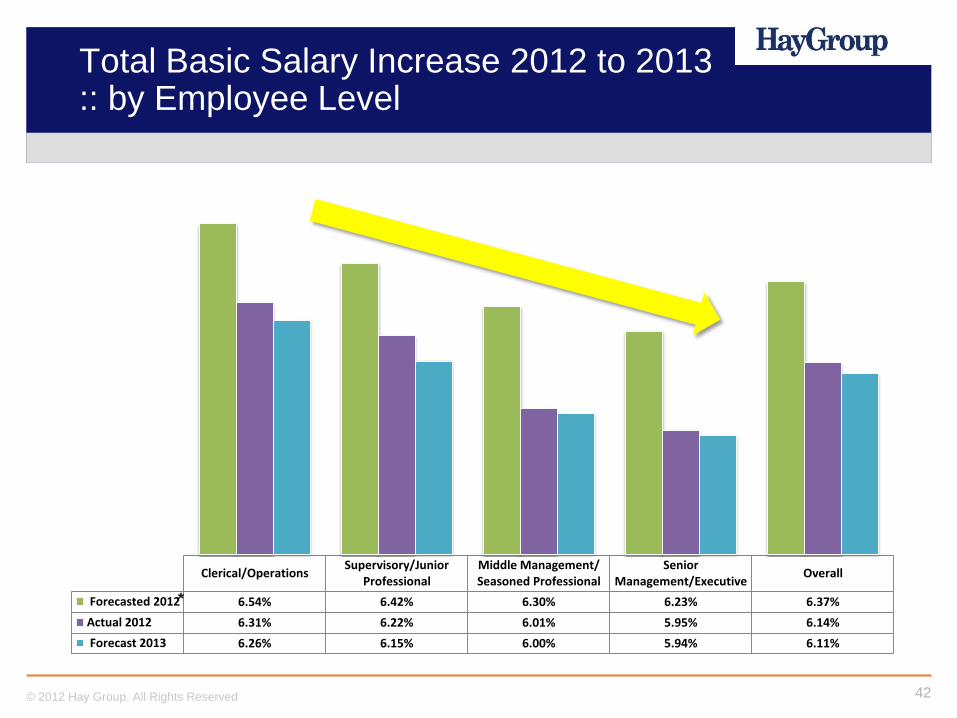
Total Basic Salary Increase 2012 to 2013 :: by Employee Level
Clerical/Operations Supervisory/Junior
Professional Middle Management/ Seasoned Professional
Senior Management/Executive
Overall
Forecasted 2012 6.54% 6.42% 6.30% 6.23% 6.37%
Actual 2012 6.31% 6.22% 6.01% 5.95% 6.14%
Forecast 2013 6.26% 6.15% 6.00% 5.94% 6.11%
*
43 © 2012 Hay Group. All Rights Reserved
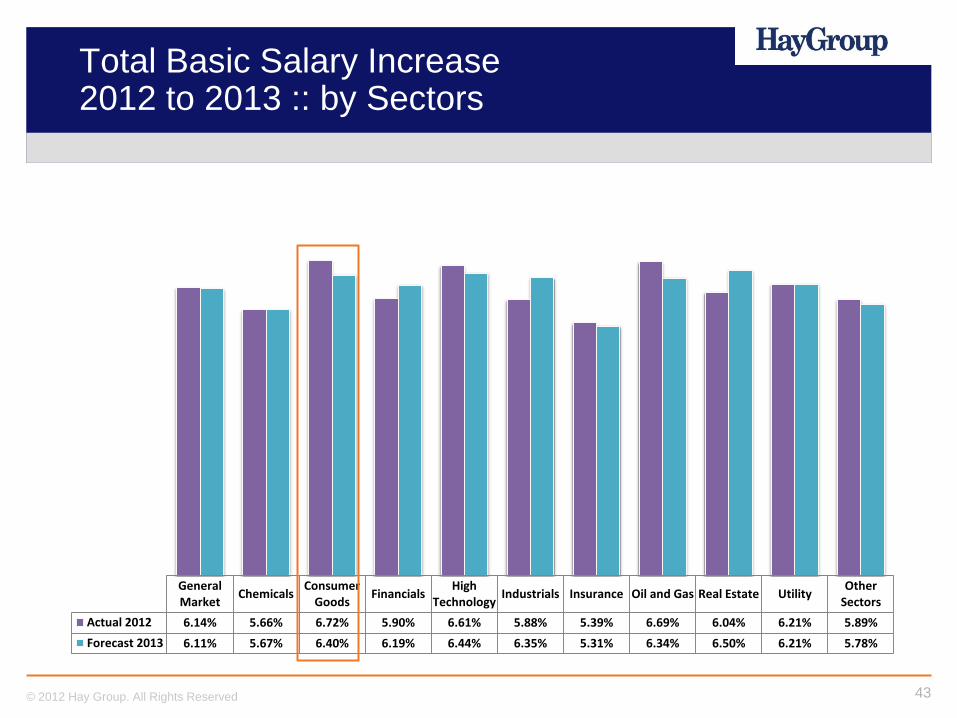
Total Basic Salary Increase 2012 to 2013 :: by Sectors
General Market
Chemicals Consumer
Goods Financials
High Technology
Industrials Insurance Oil and Gas Real Estate Utility Other
Sectors
Actual 2012 6.14% 5.66% 6.72% 5.90% 6.61% 5.88% 5.39% 6.69% 6.04% 6.21% 5.89%
Forecast 2013 6.11% 5.67% 6.40% 6.19% 6.44% 6.35% 5.31% 6.34% 6.50% 6.21% 5.78%
44 © 2012 Hay Group. All Rights Reserved
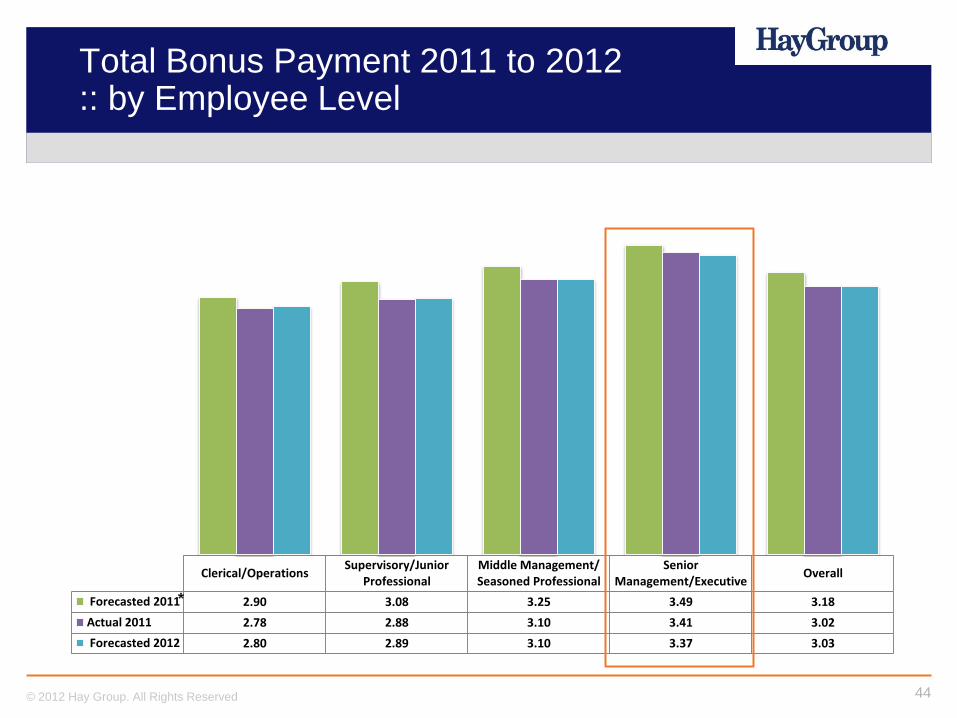
Total Bonus Payment 2011 to 2012 :: by Employee Level
Clerical/Operations Supervisory/Junior
Professional Middle Management/ Seasoned Professional
Senior Management/Executive
Overall
Forecasted 2011 2.90 3.08 3.25 3.49 3.18
Actual 2011 2.78 2.88 3.10 3.41 3.02
Forecasted 2012 2.80 2.89 3.10 3.37 3.03
*
45 © 2012 Hay Group. All Rights Reserved
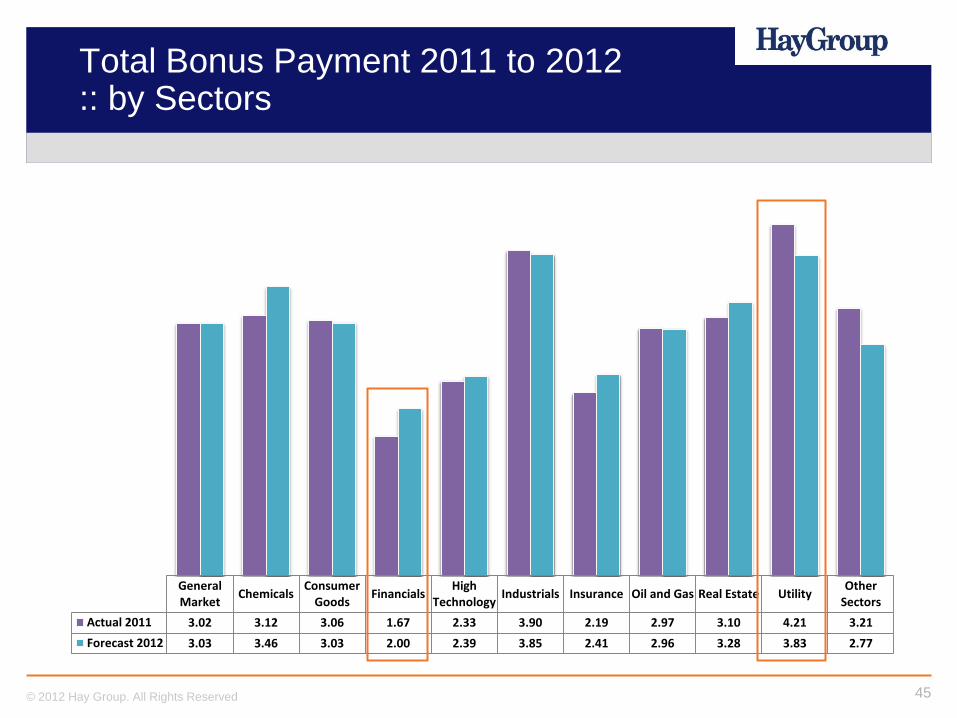
Total Bonus Payment 2011 to 2012 :: by Sectors
General Market
Chemicals Consumer
Goods Financials
High Technology
Industrials Insurance Oil and Gas Real Estate Utility Other
Sectors
Actual 2011 3.02 3.12 3.06 1.67 2.33 3.90 2.19 2.97 3.10 4.21 3.21
Forecast 2012 3.03 3.46 3.03 2.00 2.39 3.85 2.41 2.96 3.28 3.83 2.77
46 © 2012 Hay Group. All Rights Reserved
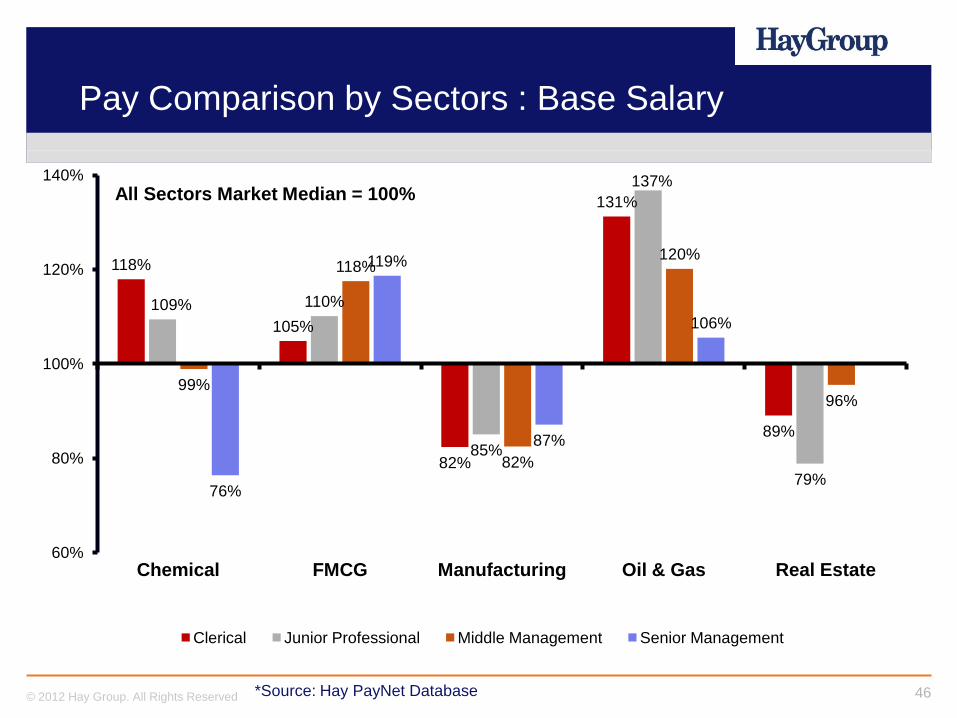
Pay Comparison by Sectors : Base Salary
118%
105%
82%
131%
89%
109% 110%
85%
137%
79%
99%
118%
82%
120%
96%
76%
119%
87%
106%
60%
80%
100%
120%
140%
Chemical FMCG Manufacturing Oil & Gas Real Estate
All Sectors Market Median = 100%
Clerical Junior Professional Middle Management Senior Management
*Source: Hay PayNet Database
47 © 2012 Hay Group. All Rights Reserved
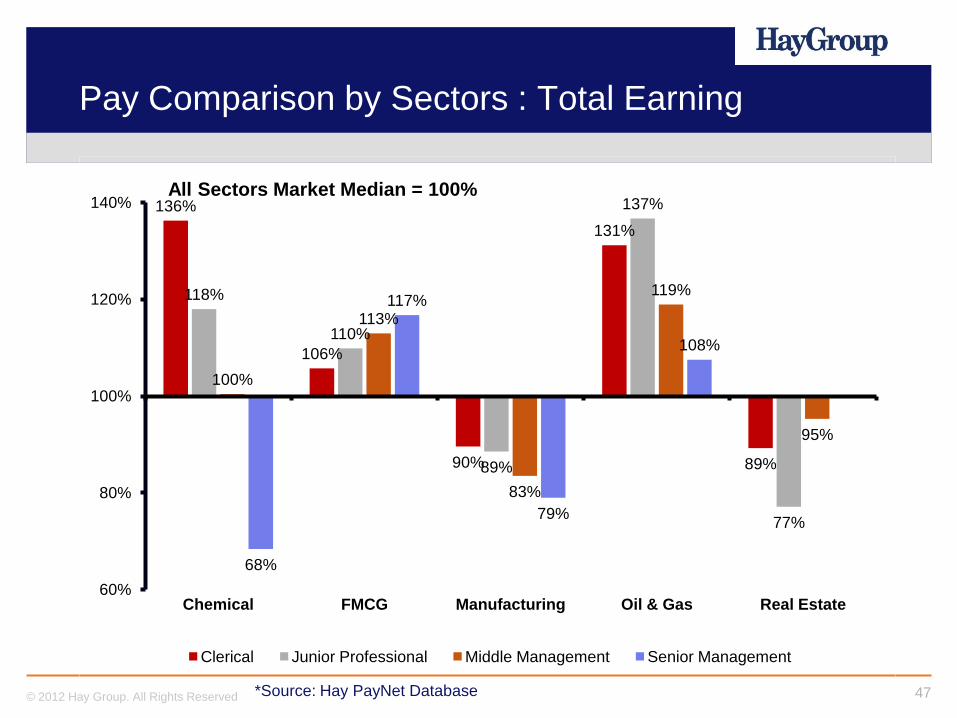
Pay Comparison by Sectors : Total Earning
136%
106%
90%
131%
89%
118%
110%
89%
137%
77%
100%
113%
83%
119%
95%
68%
117%
79%
108%
60%
80%
100%
120%
140%
Chemical FMCG Manufacturing Oil & Gas Real Estate
All Sectors Market Median = 100%
Clerical Junior Professional Middle Management Senior Management
*Source: Hay PayNet Database
48 © 2012 Hay Group. All Rights Reserved
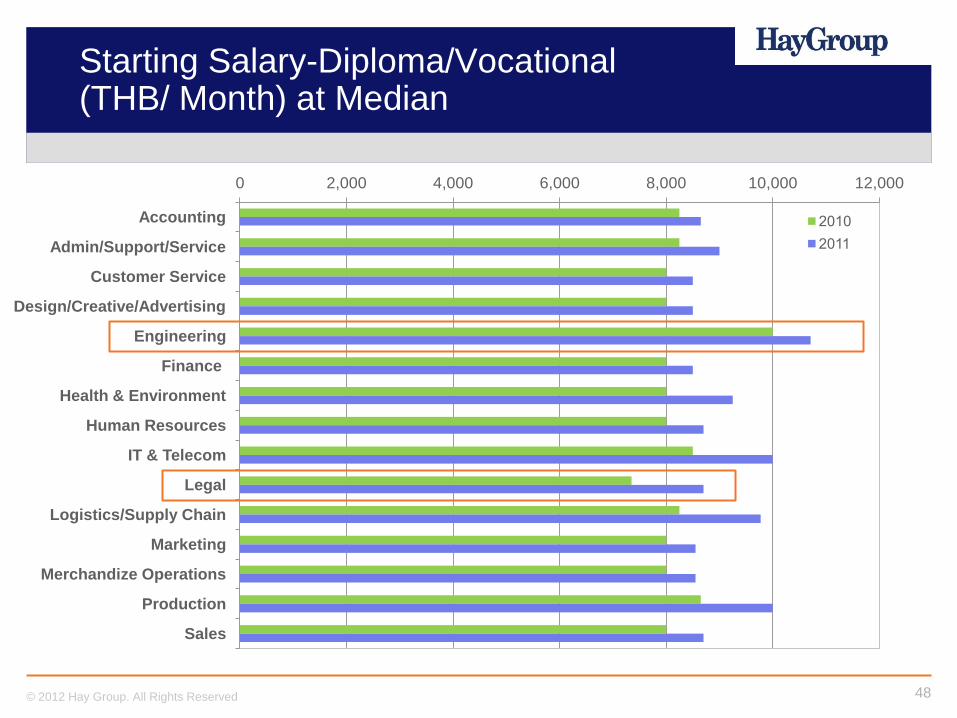
Starting Salary-Diploma/Vocational (THB/ Month) at Median
0 2,000 4,000 6,000 8,000 10,000 12,000
Accounting
Admin/Support/Service
Customer Service
Design/Creative/Advertising
Engineering
Finance
Health & Environment
Human Resources
IT & Telecom
Legal
Logistics/Supply Chain
Marketing
Merchandize Operations
Production
Sales
2010
2011
49 © 2012 Hay Group. All Rights Reserved
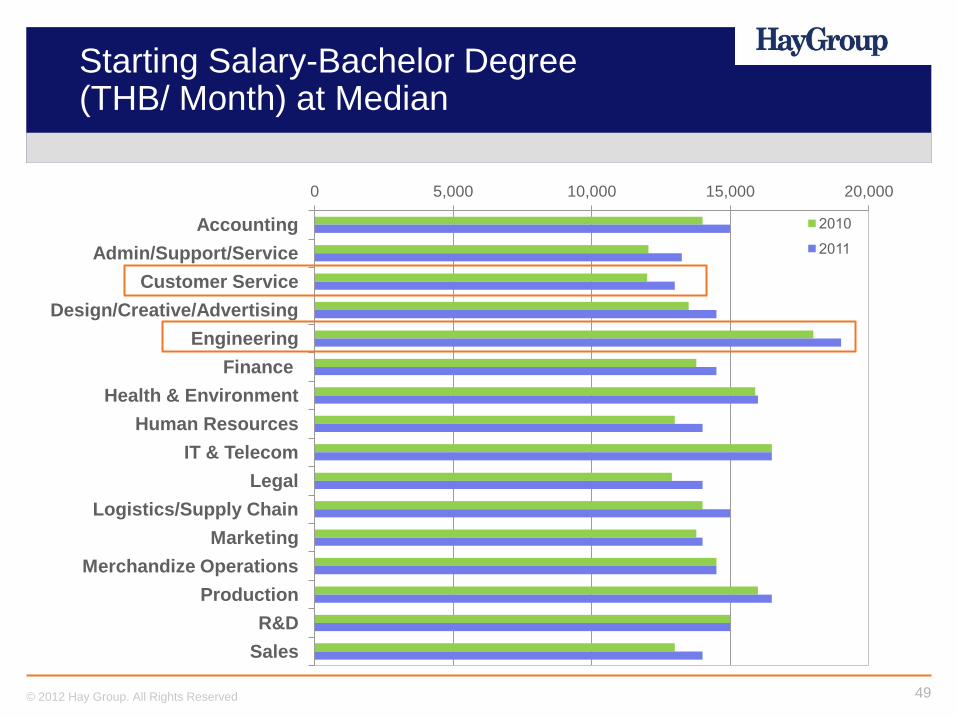
Starting Salary-Bachelor Degree (THB/ Month) at Median
0 5,000 10,000 15,000 20,000
Accounting
Admin/Support/Service
Customer Service
Design/Creative/Advertising
Engineering
Finance
Health & Environment
Human Resources
IT & Telecom
Legal
Logistics/Supply Chain
Marketing
Merchandize Operations
Production
R&D
Sales
2010
2011
50 © 2012 Hay Group. All Rights Reserved
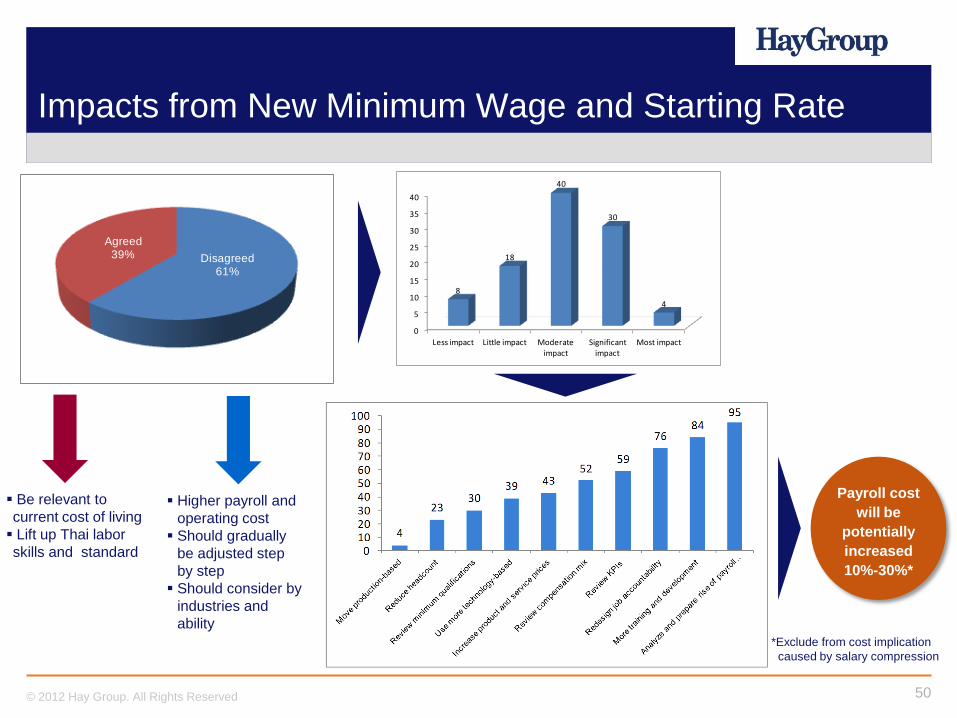
Impacts from New Minimum Wage and Starting Rate
Higher payroll and
operating cost
Should gradually
be adjusted step
by step
Should consider by
industries and
ability
Be relevant to
current cost of living
Lift up Thai labor
skills and standard
0
5
10
15
20
25
30
35
40
Less impact Little impact Moderate impact
Significant impact
Most impact
8
18
40
30
4
Disagreed 61%
Agreed 39%
Payroll cost
will be
potentially
increased
10%-30%*
*Exclude from cost implication
caused by salary compression
Working Conditions and HR Issues
52 © 2012 Hay Group. All Rights Reserved
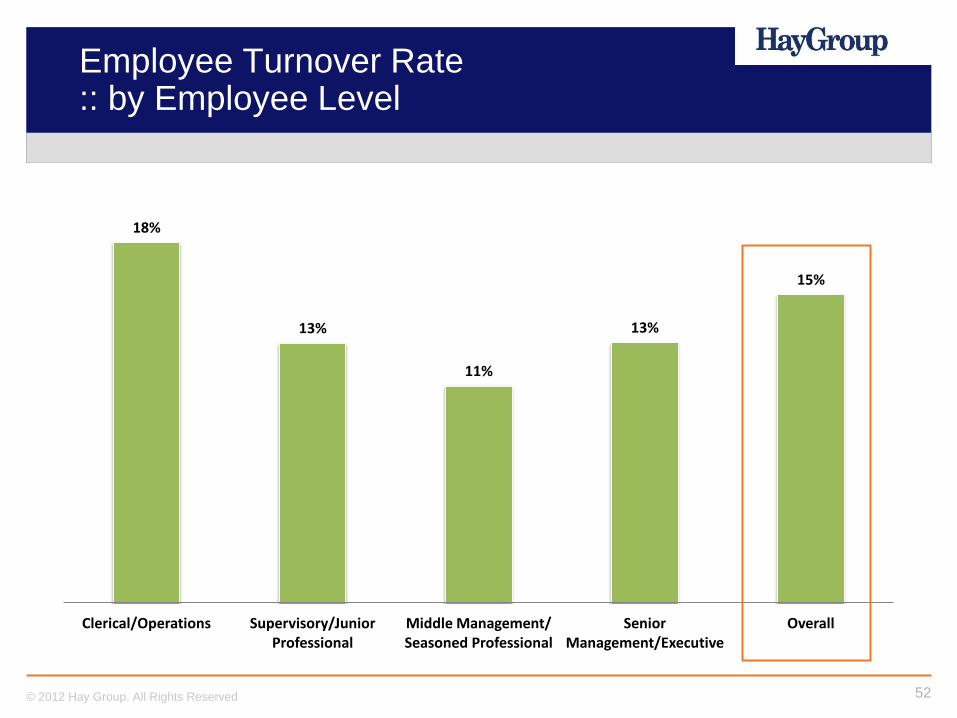
Employee Turnover Rate :: by Employee Level
18%
13%
11%
13%
15%
Clerical/Operations Supervisory/Junior Professional
Middle Management/ Seasoned Professional
Senior Management/Executive
Overall
53 © 2012 Hay Group. All Rights Reserved
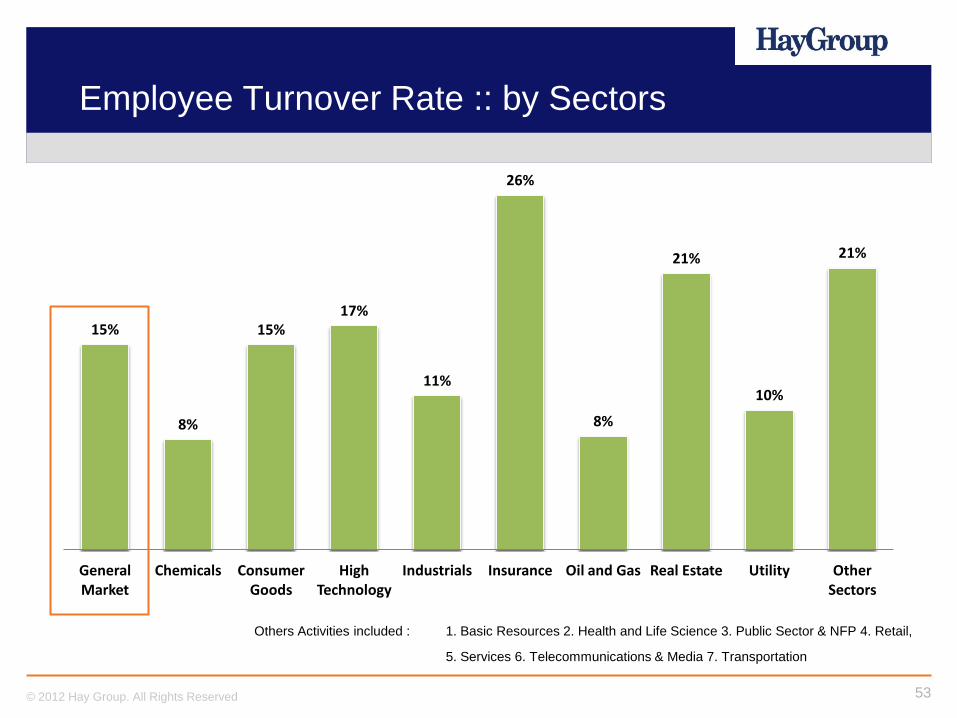
Employee Turnover Rate :: by Sectors
15%
8%
15% 17%
11%
26%
8%
21%
10%
21%
General Market
Chemicals Consumer Goods
High Technology
Industrials Insurance Oil and Gas Real Estate Utility Other Sectors
Others Activities included : 1. Basic Resources 2. Health and Life Science 3. Public Sector & NFP 4. Retail,
5. Services 6. Telecommunications & Media 7. Transportation
54 © 2012 Hay Group. All Rights Reserved
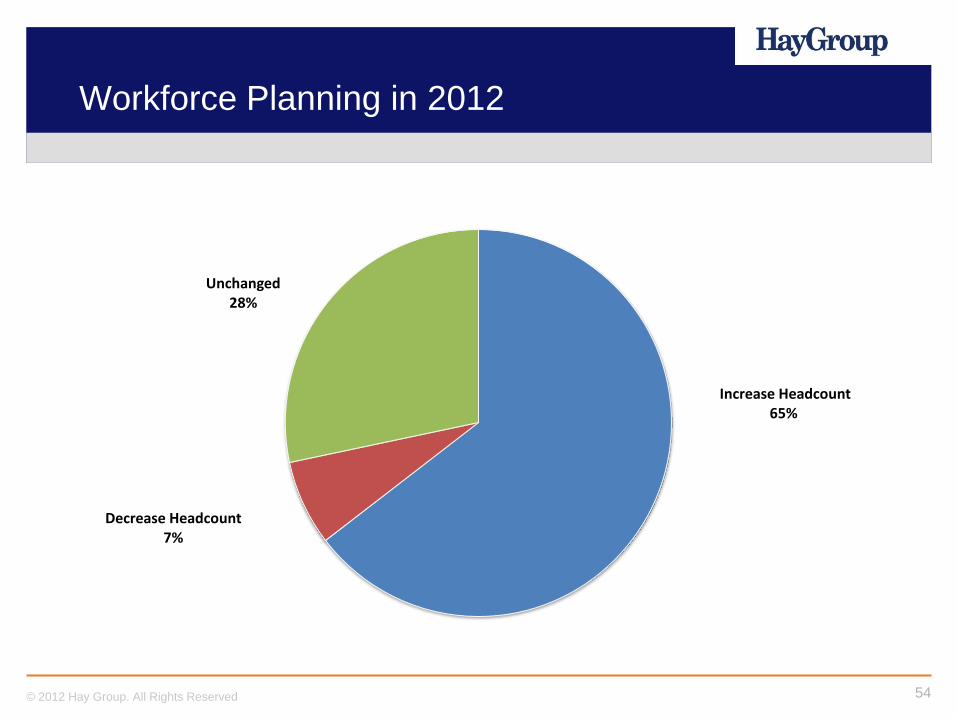
Workforce Planning in 2012
Increase Headcount 65%
Decrease Headcount 7%
Unchanged 28%
55 © 2012 Hay Group. All Rights Reserved
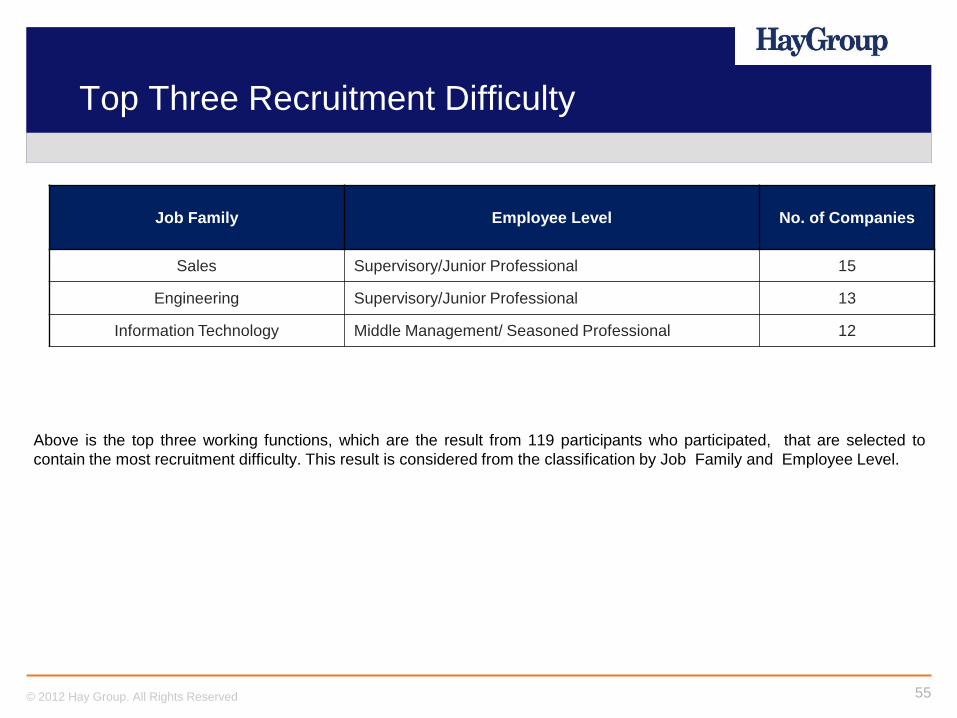
Top Three Recruitment Difficulty
Job Family Employee Level No. of Companies
Sales Supervisory/Junior Professional 15
Engineering Supervisory/Junior Professional 13
Information Technology Middle Management/ Seasoned Professional 12
Above is the top three working functions, which are the result from 119 participants who participated, that are selected to
contain the most recruitment difficulty. This result is considered from the classification by Job Family and Employee Level.
56 © 2012 Hay Group. All Rights Reserved
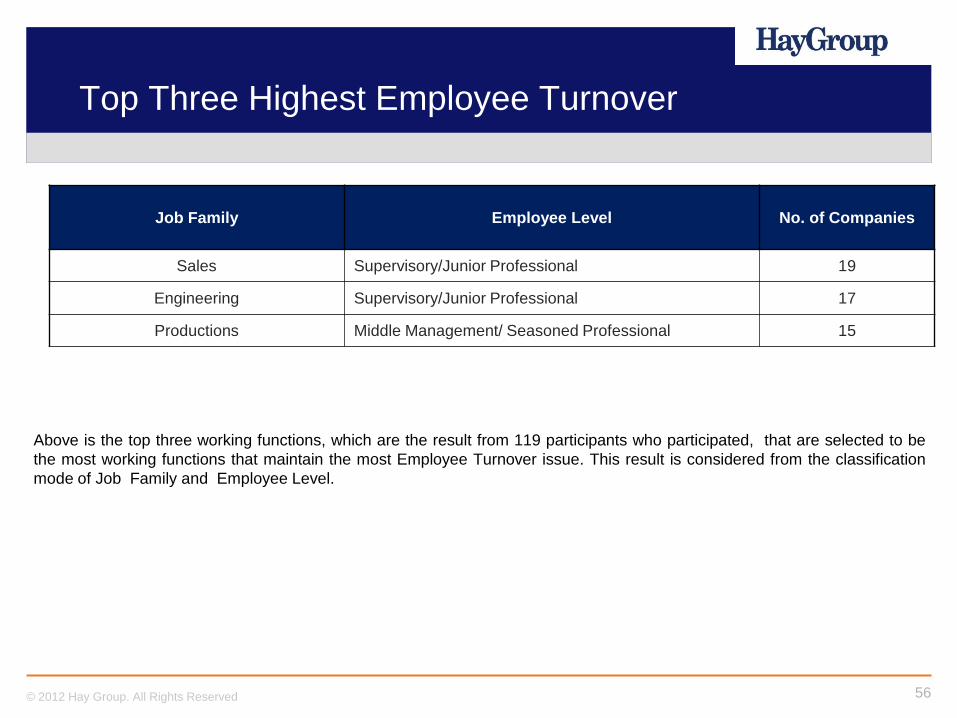
Top Three Highest Employee Turnover
Job Family Employee Level No. of Companies
Sales Supervisory/Junior Professional 19
Engineering Supervisory/Junior Professional 17
Productions Middle Management/ Seasoned Professional 15
Above is the top three working functions, which are the result from 119 participants who participated, that are selected to be
the most working functions that maintain the most Employee Turnover issue. This result is considered from the classification
mode of Job Family and Employee Level.
57 © 2012 Hay Group. All Rights Reserved
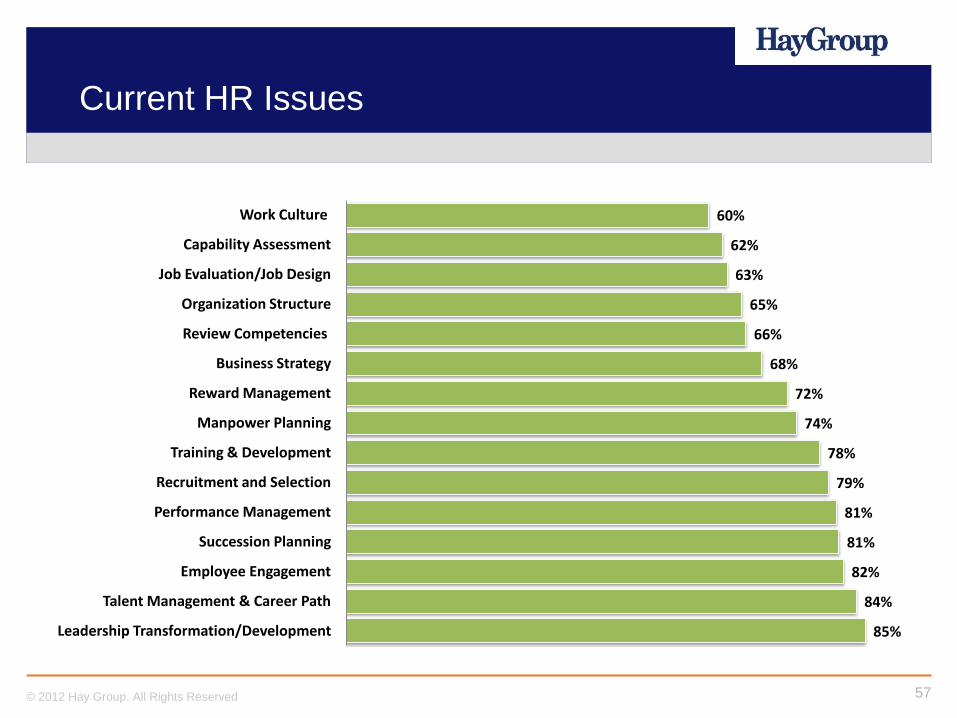
Current HR Issues
85%
84%
82%
81%
81%
79%
78%
74%
72%
68%
66%
65%
63%
62%
60%
Leadership Transformation/Development
Talent Management & Career Path
Employee Engagement
Succession Planning
Performance Management
Recruitment and Selection
Training & Development
Manpower Planning
Reward Management
Business Strategy
Review Competencies
Organization Structure
Job Evaluation/Job Design
Capability Assessment
Work Culture
58 © 2012 Hay Group. All Rights Reserved
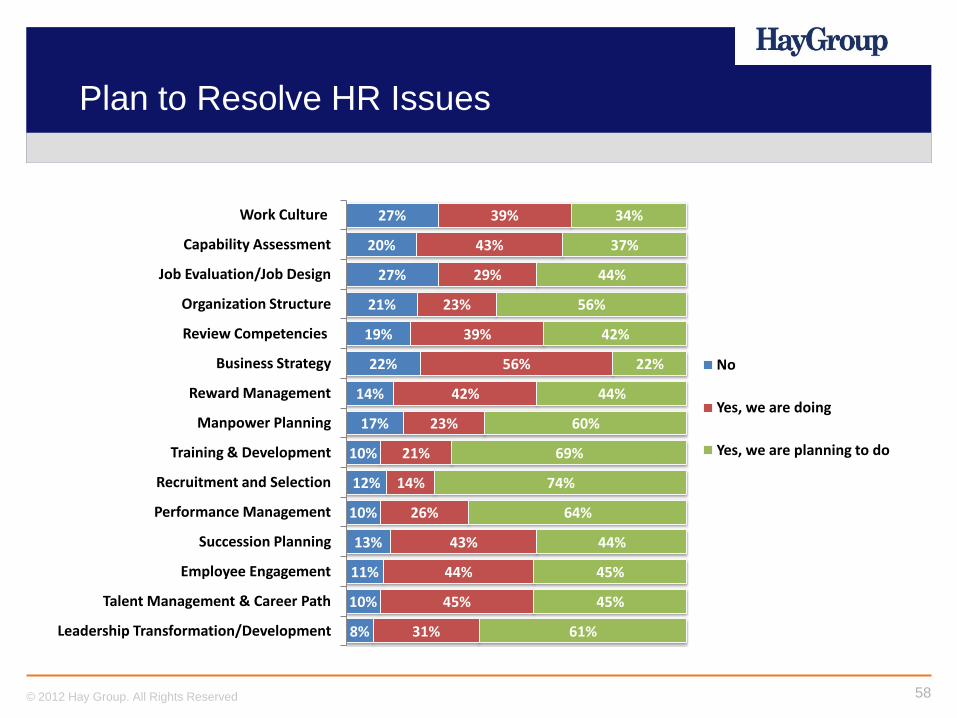
Plan to Resolve HR Issues
8%
10%
11%
13%
10%
12%
10%
17%
14%
22%
19%
21%
27%
20%
27%
31%
45%
44%
43%
26%
14%
21%
23%
42%
56%
39%
23%
29%
43%
39%
61%
45%
45%
44%
64%
74%
69%
60%
44%
22%
42%
56%
44%
37%
34%
Leadership Transformation/Development
Talent Management & Career Path
Employee Engagement
Succession Planning
Performance Management
Recruitment and Selection
Training & Development
Manpower Planning
Reward Management
Business Strategy
Review Competencies
Organization Structure
Job Evaluation/Job Design
Capability Assessment
Work Culture
No
Yes, we are doing
Yes, we are planning to do
59 © 2012 Hay Group. All Rights Reserved
Thank You
For more information please contact
Hay Group Limited
18th Floor Unit 3, Q. House Lumpini,
1 South Sathorn Road, Thung Mahamek,
Sathorn, Bangkok 10120, Thailand
Tel: (02) 677-7515
Fax: (02) 677-7505