ARTICLE · ARTICLE Can traditional methods of selecting food accurately assess fish health? Peter...
18
ARTICLE Can traditional methods of selecting food accurately assess fish health? Peter A. Cott, Amy L. Amos, Matthew M. Guzzo, Louise Chavarie, Cameron P. Goater, Derek C.G. Muir, and Marlene S. Evans Abstract: Indigenous peoples living in Canada’s north have long-valued the livers of Burbot (Lota lota) as a traditional food source; however, there has been concern relating to liver quality and potential contaminants. In this study, livers of Burbot collected in lower Mackenzie River were ranked using a traditional appearance-based assessment. These rank- ings were compared to a variety of biological and contaminant metrics. Livers ranked “most palatable” had a significantly higher mass and lipid content and were from younger fish with greater hepatosomatic index and total mass and had lower parasite intensities. There were no differences in the concentrations of persistent organic pollutants or metals, except copper, which although still well below consumption guidelines, was significantly higher in fish with livers that appeared most palatable. The results of this study demonstrated that traditional methods effectively assessed the quality of livers by selecting for the most nutri- tious (high lipid levels) and safest (low parasite loading) food. This method could be incorpo- rated into a community-based monitoring framework as a rough index of overall fish and ecosystem health; however, would not be effective in screening food for anthropogenic con- taminants. This study highlights the importance and value of linking traditional knowledge into scientific studies. Key words: Lota lota, contaminant, Mackenzie River, parasite, traditional knowledge. Résumé : Les peuples autochtones vivant dans le nord du Canada valorisent les foies de la Lotte ( Lota lota) comme source de nourriture traditionnelle. Récemment, il y a des préoccupations chez les autochtones concernant la concentration des contaminants affec- tant la qualité de leur nourriture traditionnelle, particulièrement pour les foies. Dans cette étude, les foies de la Lotte ont été recueillis en bas du fleuve Mackenzie et ont été classés en utilisant une évaluation basée sur l’apparence traditionnelle. Ces classements sur l’appar- ence traditionnelle ont été comparés à une variété de paramètres biologiques et de contam- inants (i.e., concentration). Les foies classés « le plus savoureux » avait une masse et une teneur lipidique significativement plus élevées, provenaient de poissons plus jeunes avec un meilleur indice hépato-somatique, une masse totale plus élevée et des intensités de para- sites plus faibles. Aucunes différences dans les concentrations de polluants organiques per- sistants ou de métaux ont été trouvées parmi les foies classifiés sur l ’ apparence traditionnelle, sauf pour le cuivre. Bien qu’en dessous des recommandations de consomma- tion, les taux de concentrations de cuivre étaient significativement plus élevés pour les foies Received 23 October 2017. Accepted 27 February 2018. P.A. Cott. Cott Environmental, 5409-49th Street, Yellowknife, NT X1A 1R2, Canada. A.L. Amos. Gwich’in Renewable Resources Board, PO Box 2240, Inuvik, NT X0E 0T0, Canada. M.M. Guzzo. Biological Sciences, University of Manitoba, 50 Sifton Road, Winnipeg, MB R3T 2N2, Canada. L. Chavarie. Center for Systems Integration and Sustainability, Michigan State University, 115 Manly Miles Building, 1405 South Harrison Road, East Lansing, MI 48823, USA. C.P. Goater. Department of Biological Sciences, University of Lethbridge, Lethbridge, AB T1K 3M4, Canada. D.C.G. Muir. Environment and Climate Change Canada, 867 Lakeshore Road, Burlington, ON L7R 4A6, Canada. M.S. Evans. Environment and Climate Change Canada, 11 Innovation Blvd., Saskatoon, SK S7N 3H5, Canada. Corresponding author: Peter A. Cott (e-mail: [email protected]). This article is open access. This work is licensed under a Creative Commons Attribution 4.0 International License (CC BY 4.0). http://creativecommons.org/licenses/by/4.0/deed.en_GB. 205 Arctic Science 4: 205–222 (2018) dx.doi.org/10.1139/as-2017-0052 Published at www.nrcresearchpress.com/as on 8 March 2018. Arctic Science Downloaded from www.nrcresearchpress.com by UNIVERSITY OF BRITISH COLUMBIA on 09/17/18 For personal use only.
Transcript of ARTICLE · ARTICLE Can traditional methods of selecting food accurately assess fish health? Peter...

ARTICLE
Can traditional methods of selecting foodaccurately assess fish health?
Peter A. Cott, Amy L. Amos, Matthew M. Guzzo, Louise Chavarie, Cameron P. Goater,Derek C.G. Muir, and Marlene S. Evans
Abstract: Indigenous peoples living in Canada’s north have long-valued the livers of Burbot(Lota lota) as a traditional food source; however, there has been concern relating to liverquality and potential contaminants. In this study, livers of Burbot collected in lowerMackenzie River were ranked using a traditional appearance-based assessment. These rank-ings were compared to a variety of biological and contaminant metrics. Livers ranked “mostpalatable” had a significantly higher mass and lipid content and were from younger fishwith greater hepatosomatic index and total mass and had lower parasite intensities. Therewere no differences in the concentrations of persistent organic pollutants or metals, exceptcopper, which although still well below consumption guidelines, was significantly higher infish with livers that appeared most palatable. The results of this study demonstrated thattraditional methods effectively assessed the quality of livers by selecting for the most nutri-tious (high lipid levels) and safest (low parasite loading) food. This method could be incorpo-rated into a community-based monitoring framework as a rough index of overall fish andecosystem health; however, would not be effective in screening food for anthropogenic con-taminants. This study highlights the importance and value of linking traditional knowledgeinto scientific studies.
Key words: Lota lota, contaminant, Mackenzie River, parasite, traditional knowledge.
Résumé : Les peuples autochtones vivant dans le nord du Canada valorisent les foies de laLotte (Lota lota) comme source de nourriture traditionnelle. Récemment, il y a despréoccupations chez les autochtones concernant la concentration des contaminants affec-tant la qualité de leur nourriture traditionnelle, particulièrement pour les foies. Dans cetteétude, les foies de la Lotte ont été recueillis en bas du fleuve Mackenzie et ont été classés enutilisant une évaluation basée sur l’apparence traditionnelle. Ces classements sur l’appar-ence traditionnelle ont été comparés à une variété de paramètres biologiques et de contam-inants (i.e., concentration). Les foies classés « le plus savoureux » avait une masse et uneteneur lipidique significativement plus élevées, provenaient de poissons plus jeunes avecun meilleur indice hépato-somatique, une masse totale plus élevée et des intensités de para-sites plus faibles. Aucunes différences dans les concentrations de polluants organiques per-sistants ou de métaux ont été trouvées parmi les foies classifiés sur l’apparencetraditionnelle, sauf pour le cuivre. Bien qu’en dessous des recommandations de consomma-tion, les taux de concentrations de cuivre étaient significativement plus élevés pour les foies
Received 23 October 2017. Accepted 27 February 2018.
P.A. Cott. Cott Environmental, 5409-49th Street, Yellowknife, NT X1A 1R2, Canada.A.L. Amos. Gwich’in Renewable Resources Board, PO Box 2240, Inuvik, NT X0E 0T0, Canada.M.M. Guzzo. Biological Sciences, University of Manitoba, 50 Sifton Road, Winnipeg, MB R3T 2N2, Canada.L. Chavarie. Center for Systems Integration and Sustainability, Michigan State University, 115 Manly Miles Building,1405 South Harrison Road, East Lansing, MI 48823, USA.C.P. Goater. Department of Biological Sciences, University of Lethbridge, Lethbridge, AB T1K 3M4, Canada.D.C.G. Muir. Environment and Climate Change Canada, 867 Lakeshore Road, Burlington, ON L7R 4A6, Canada.M.S. Evans. Environment and Climate Change Canada, 11 Innovation Blvd., Saskatoon, SK S7N 3H5, Canada.Corresponding author: Peter A. Cott (e-mail: [email protected]).This article is open access. This work is licensed under a Creative Commons Attribution 4.0 International License (CC BY4.0). http://creativecommons.org/licenses/by/4.0/deed.en_GB.
205
Arctic Science 4: 205–222 (2018) dx.doi.org/10.1139/as-2017-0052 Published at www.nrcresearchpress.com/as on 8 March 2018.
Arc
tic S
cien
ce D
ownl
oade
d fr
om w
ww
.nrc
rese
arch
pres
s.co
m b
y U
NIV
ER
SIT
Y O
F B
RIT
ISH
CO
LU
MB
IA o
n 09
/17/
18Fo
r pe
rson
al u
se o
nly.

classifiés « savoureux ». Les résultats de cette étude ont démontré que la méthode desélection par l’apparence traditionnelle a efficacement évalué la qualité des foies avec unepréférence marquée chez les autochtones pour les foies plus nutritifs (niveau élevé de lip-ides) et les plus sûrs (faible charge parasitaire). Cette méthode de sélection par l’apparencetraditionnelle pourrait être incorporée dans un cadre de surveillance communautairecomme un indicateur approximatif de l’état de santé de l’ensemble des poissons et desécosystèmes. Cependant, la méthode de sélection par l’apparence traditionnelle n’est pasefficace pour dépister les variations des concentrations des contaminants anthropiques.Cette étude met en évidence l’importance de l’intégration des connaissances traditionnellesdans les études scientifiques. [Traduit par la Rédaction]
Mots-clés : Lota lota, contaminant, fleuve Mackenzie, parasite, savoir traditionnel.
Introduction
Northern environments have received contaminant loading via long-range atmospherictransport from industrial and agricultural activities in southern latitudes (Donaldson et al.2010). These contaminants accumulate in a variety of taxa: fish (e.g., Kidd et al. 1995, 1998;Carrie et al. 2009; Stapanian et al. 2014), birds (e.g., Guzzo et al. 2013), and mammals(e.g., Muir et al. 2000; Riget et al. 2005) — including humans (e.g., Kuhnlein et al. 1995;Donaldson et al. 2010). Atmospheric contaminants tend to bioaccumulate and biomagnifywith trophic position, with the highest concentrations in predatory animals (Donaldsonet al. 2010). This is problematic for northern peoples who eat more wild fish and game thantheir southern counterparts, potentially exposing them to higher levels of contaminants(Donaldson et al. 2010). For example, >40% of the population in Canada’s NorthwestTerritories (NWT) use wild foods to supplement their diet [Government of the NorthwestTerritories (GNWT) 2014]. Furthermore, many environmental pollutants are lipophilic andtraditionally harvesters tend to target species that are naturally fat rich because of thecaloric and nutritional advantage they provide (Donaldson et al. 2010). Consequently,“are the fish safe to eat?” is one of the fundamental questions relating to aquatic systemsposed by members of northern communities (GNWT 2013).
The Burbot (Lota lota, Linnaeus 1758) is an important subsistence fish for Indigenouspopulations in northern United States and Canada (Stapanian et al. 2010). This top-levelpredator is found in cold-water lakes and rivers throughout the northern hemisphere(Cohen et al. 1990; McPhail and Paragamian 2000; Stapanian et al. 2010). Burbot, like othermembers of the cod family (Gadidae), have large lipid-rich livers that are high in n-3 fattyacids, and vitamins A, D, and K (Wong 2008), and are also high in protein and healthy lipids(Robidoux et al. 2009). The nutritional value of Burbot livers has long been recognized bythe Indigenous people living along the lower Mackenzie River, NWT, Canada, and Burbotlivers remain a culturally significant food source for the Gwich’in people [Gwich’inRenewable Resources Board (GRRB) 1997]. Burbot, locally known as “loche”, are fished eachyear when the ice first forms by jigging a lure or baited hook in shallow water at the conflu-ence of small creeks and larger channels (GRRB 1997). Concerns relating to the poor qualityof Burbot livers in Canada’s north are long-standing. Following community complaints ofpoor-quality fish in areas where there was oil and gas development, Lockhart et al. (1987)investigated the potential for hydrocarbon contamination of subsistence-harvested fish,including Burbot. Being a top predator and prone to the bioaccumulation of contaminants,Burbot have been used as biomonitors for metals, including mercury, and persistentorganic contaminants in the Mackenzie River at Fort Good Hope and Great Slave Lake sincethe 1990s (Evans et al. 2005, Carrie et al. 2009; Muir et al. 2013) with past studies alsoconducted on the Slave River delta (McCarthy et al. 1997). Still, the concern over Burbotliver quality remains [H. Sayine-Crawford, GNWT Sahtu Region; A. Amos, GRRB; K. Hynes,
206 Arctic Science Vol. 4, 2018
Published by NRC Research Press
Arc
tic S
cien
ce D
ownl
oade
d fr
om w
ww
.nrc
rese
arch
pres
s.co
m b
y U
NIV
ER
SIT
Y O
F B
RIT
ISH
CO
LU
MB
IA o
n 09
/17/
18Fo
r pe
rson
al u
se o
nly.

Fisheries Joint Management Committee, Inuvialuit Settlement Region, pers. comm.,January 2016].
Recognizing this persistant community concern over liver quality, the GRRB initiated acollaborative study with local harvesters and scientists to investigate the possible linkbetween Burbot liver appearance (perceived palatability) and contaminant concentrations.The goals of this study were to investigate a problem identified by, and relevant to Gwich’infishers, and conducted in collaboration with harvesters in conjunction with their tradi-tional harvest activities. This study was designed to (1) evaluate associations between thecondition of Burbot livers, as identified by traditional means, and contaminant concentra-tions, parasite loading, trophic position, and various biological metrics; and, (2) assesswhether a traditional assessment of Burbot liver quality could be a useful community-basedmeans to monitor the potential for increased contaminant levels in Burbot or detect broad-level fish health and environmental change.
We hypothesized that traditional local knowledge through visual assessment would beeffective in selecting livers from fish that are safe to eat and screening out those that arenot. Specifically, we predicted that Burbot livers that were deemed palatable would be fromfish having (a) lower contaminant levels, (b) higher body condition, (c) higher gonadoso-matic index (GSI), (d) higher hepatosomatic index (HSI), and (e) lower intensities of parasitesrelative to those that were deemed unpalatable, (f) and that there would be no correlationto perceived palatability and the other metrics investigated. This project is directed andinformed by traditional and local knowledge and complemented by scientific methodology,bridging the qualitative and quantitative natures of each approach.
Materials and methods
Sample collectionAdult Burbot (n = 136) were collected from traditional fishing areas in proximity to
four communities; Inuvik, Aklavik, Fort McPherson, and Tsiigehtchic along the lowerMackenzie River system, in the Gwich’in Settlement Area (GSA), NWT, Canada (Fig. 1). Inmost cases, there were multiple sample sites near each community that provided acomposite sample associated with each of the four communities. Sampling was con-ducted between October and December, in 2007 and 2008, using traditional hook and linemethods (GRRB 1997). For each Burbot collected, the following information was taken:total length (± mm), total mass (± g), liver mass (± g), gonad mass (± g), sex, and liverappearance as described below.
Traditional assessment of liversLivers were categorized by Gwich’in fishers based on liver appearance. The GRRB
requested that the Renewable Resource Council (RRC) select appropriate volunteers fromeach Gwich’in community. A total of 18 harvesters were selected, four to five from eachcommunity. Each fisher had a minimum of 20 years experience of subsistence fishingand was able to visually characterize the variability in fish liver appearance. Ranking oflivers was not standardized among individual fishers or among communities as we didnot want to obscure or distort that decision-making process by having local fishers “see”livers differently than they currently do as that would be counter-productive in testingour hypothesis that traditional and local knowledge can be used to identify fish that aresafe to eat. Therefore, variation in decision-making about liver ranking among individualfishers reflects real variation in fish use by people in the region. We used the traditionaland local knowledge of these individuals to subjectively rank each liver by asking themfor each; “would you eat it, feed it to your dogs, or throw it out?” (corresponding to ranks1, 2, and 3, respectively) immediately after catching and filleting the fish. Fishers were
Cott et al. 207
Published by NRC Research Press
Arc
tic S
cien
ce D
ownl
oade
d fr
om w
ww
.nrc
rese
arch
pres
s.co
m b
y U
NIV
ER
SIT
Y O
F B
RIT
ISH
CO
LU
MB
IA o
n 09
/17/
18Fo
r pe
rson
al u
se o
nly.

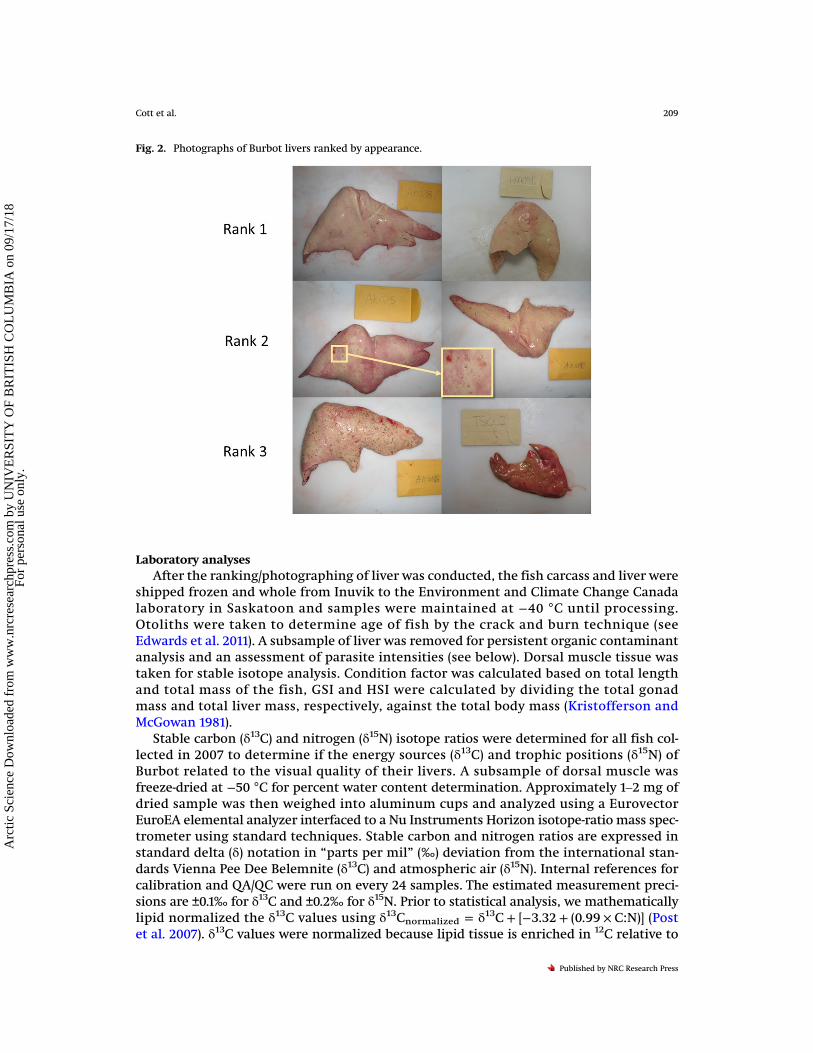
accompanied by the GRRB Fisheries Biologist during the actual fishing activity. The fisherdissected Burbot and ranked livers, and the biologist recorded the ranking and biologicalinformation and took photos of the livers. Visual assessments were of fresh, unfrozenBurbot livers sampled at time of harvest. If a ranker was unable to participate in theactual harvest, a photo of the fresh liver was used as a surrogate. Rank 1 livers were con-sidered healthy and consumable, were white in colour, large and had no spots or marksvisible (Fig. 2). Rank 2 livers were considered less healthy and harvesters would feed thesefish to their dogs but would not eat the fish themselves. These livers were slightly discol-oured, had a few spots or a few marks (Fig. 2, see inset). Rank 3 livers were very deformedlivers, discoloured, small, and (or) had many spots/marks, and deemed unfit for consump-tion (Fig. 2).
Fig. 1. Study area and communities within the Gwich’in Settlement Area (GSA), Northwest Territories, Canada.Shaded areas indicate Gwich’in owned lands within the GSA. Map data © 2013 CANVEC.
208 Arctic Science Vol. 4, 2018
Published by NRC Research Press
Arc
tic S
cien
ce D
ownl
oade
d fr
om w
ww
.nrc
rese
arch
pres
s.co
m b
y U
NIV
ER
SIT
Y O
F B
RIT
ISH
CO
LU
MB
IA o
n 09
/17/
18Fo
r pe
rson
al u
se o
nly.
Laboratory analysesAfter the ranking/photographing of liver was conducted, the fish carcass and liver were
shipped frozen and whole from Inuvik to the Environment and Climate Change Canadalaboratory in Saskatoon and samples were maintained at −40 °C until processing.Otoliths were taken to determine age of fish by the crack and burn technique (seeEdwards et al. 2011). A subsample of liver was removed for persistent organic contaminantanalysis and an assessment of parasite intensities (see below). Dorsal muscle tissue wastaken for stable isotope analysis. Condition factor was calculated based on total lengthand total mass of the fish, GSI and HSI were calculated by dividing the total gonadmass and total liver mass, respectively, against the total body mass (Kristofferson andMcGowan 1981).
Stable carbon (δ13C) and nitrogen (δ15N) isotope ratios were determined for all fish col-lected in 2007 to determine if the energy sources (δ13C) and trophic positions (δ15N) ofBurbot related to the visual quality of their livers. A subsample of dorsal muscle wasfreeze-dried at −50 °C for percent water content determination. Approximately 1–2 mg ofdried sample was then weighed into aluminum cups and analyzed using a EurovectorEuroEA elemental analyzer interfaced to a Nu Instruments Horizon isotope-ratio mass spec-trometer using standard techniques. Stable carbon and nitrogen ratios are expressed instandard delta (δ) notation in “parts per mil” (‰) deviation from the international stan-dards Vienna Pee Dee Belemnite (δ13C) and atmospheric air (δ15N). Internal references forcalibration and QA/QC were run on every 24 samples. The estimated measurement preci-sions are ±0.1‰ for δ13C and ±0.2‰ for δ15N. Prior to statistical analysis, we mathematicallylipid normalized the δ13C values using δ13Cnormalized = δ13C + [−3.32 + (0.99 × C:N)] (Postet al. 2007). δ13C values were normalized because lipid tissue is enriched in 12C relative to
Fig. 2. Photographs of Burbot livers ranked by appearance.
Cott et al. 209
Published by NRC Research Press
Arc
tic S
cien
ce D
ownl
oade
d fr
om w
ww
.nrc
rese
arch
pres
s.co
m b
y U
NIV
ER
SIT
Y O
F B
RIT
ISH
CO
LU
MB
IA o
n 09
/17/
18Fo
r pe
rson
al u
se o
nly.

bulk protein, and therefore differences in lipid content among fish may bias interpretationof energy sources of Burbot assigned to each liver ranking.
Subsamples (n = 22) of liver (0.5 g) were acid digested using an 8:1 ratio of nitric acid andhydrogen peroxide. A multielement suite including As, Se, Cu, and Zn was determinedusing inductively coupled plasma mass spectrometry (ICP-MS). The methodology isdescribed in Riget et al. (2005). Total Hg analyses were conducted by automated thermaldecomposition and atomic absorption detection using a Milestone Direct Hg Analyzerfollowing US EPA method 7473. A subsample of 0.1–0.2 g of frozen liver was used; resultswere expressed on a wet weight basis. Reference materials were SRM 2976 from theNational Institute of Standards and Technology (Standard Reference Materials Program,Gaithersburg, MD, USA) and DORM-3 and DOLT-4 from the National Research Councilof Canada (Certified Reference Materials Program, Ottawa, ON, Canada). The methoddetection limit, determined as 3× the standard deviation of the blanks, was 0.3 ng Hg(approximately 2 ng/g wet weight).
The liver subsamples used for metals analysis were also analysed for polychlorinatedbiphenyl/organic chlorine (PCB/OC) pesticides at the National Laboratory for EnvironmentalTesting, Environment and Climate Change Canada, using procedures outlined in Muir et al.(1988, 2000). Overall, samples were homogenized with sodium sulfate and Soxhlet extractedwith dichloromethane–hexane (1:1). Legacy organochlorines were isolated by gel permeationchromatography followed by silica gel clean-up. Standard reference material (cod liver 1588a)was from the National Institute of Standards and Technology (NIST, Gaithersburg, MD, USA)after every 20 samples. PCB congeners were generally within 25% of certified values.
All frozen livers were sent to the Parasitology Laboratory at the University of Lethbridgeto evaluate the prevalence (proportion of hosts in a sample that are infected) and intensity(number of worms in an infected host) of larvae of the ascarid nematode Raphidascaris acus(Bloch, 1779). The results of previous host surveys show that larvae of this large-bodiedworm are the only macroparasite present in livers of Burbot sampled from this region(Bernier 1986; Dick and Bernier 1987). Larvae observed in the livers of Burbot are typicallyassociated within darkened, granulomatous nodules, each of which contains a dead worm.We estimated larval R. acus intensities by subsampling three randomly selected 5–6 mmsections of liver as per Goater and Doster (1997). The sections were weighed and the totalnumber of nematodes in each section was counted under a dissecting microscope.Total larval intensities per host were estimated by scaling up to the total weight of the liver.
StatisticsAll data analyses were completed using R (version 3.2.3, R Core Team 2016). We tested for
differences in whole-body and liver characteristics of Burbot among collection sites usinganalysis of variance (one-way ANOVA). We tested for differences in whole-body characteris-tics and liver characteristics, as well as metal, OC, and parasite profiles among Burbotwhose livers were ranked 1, 2, or 3 for palatability by traditional harvesters using a combi-nation of linear and generalized mixed effects models. In each mixed model, we treatedcollection year and community as random intercepts so that the main effect of liver rank,treated as a factor (1, 2, or 3), could be analysed while accounting for potential variationacross collection years and sites (Zuur et al. 2009). Chemical and stable isotope analyseswere only run on samples collected in 2007, therefore, only community was included as arandom intercept for those analyses. Where significant effects of liver rank were found,Tukey’s tests with p-value adjustments for multiple comparisons were used to test forsignificant pairwise differences among ranks. Tukey’s tests and estimation of leastsquare means were performed using the R package “lsmeans” (Lenth 2016). We consideredP< 0.05 to represent statistical significance.
210 Arctic Science Vol. 4, 2018
Published by NRC Research Press
Arc
tic S
cien
ce D
ownl
oade
d fr
om w
ww
.nrc
rese
arch
pres
s.co
m b
y U
NIV
ER
SIT
Y O
F B
RIT
ISH
CO
LU
MB
IA o
n 09
/17/
18Fo
r pe
rson
al u
se o
nly.

Linear mixed models (LMM) were used for all response variables, except Burbot age,which was modelled with a generalized linear mixed model (GLMM) with Poisson distribu-tion. For LMM, normality and heteroscedacity were tested graphically using QQ-plots andhistograms of standardized residuals (Zuur et al. 2009). Where deviations from assumptionswere found, data were transformed for LMM analysis. This included log10 transformation offish body mass, HSI, liver mass, R. acus intensities, arsenic (As), total mercury (Hg), copper(Cu), zinc (Zn), carboxybenzyl (CBZ), dichlorodiphenyltrichloroethane (DDT), toxaphene(TOXA), chlordanes (CHL), and total PCB and square-root transformation of selenium (Se).GSI, condition factor, fish total length, liver lipids, hexachlorocyclohexane, δ13C, and δ15Ndid not require transformation. Mixed models were fit using the R package “lme4” (Bateset al. 2016) with p-values obtained using the Kenward–Roger modified F test for LMM fromthe R package “pbkrtest” (Halekoh and Højsgaard 2014) and likelihood ratio tests forGLMM from the R package “afex” (Singmann et al. 2016).
Results
Overall, sampled Burbot averaged a total length of (mean ± SD) 727 ± 87 mm (range535–990 mm), a mass of 3315 ± 1220 g (1000–8250 g), and were 13.7 ± 3.1 years old(8–27 years old). Individuals had an average condition factor of 0.7 ± 0.1 (−0.12 to 1.7), a HSI of7.8% ± 2.3% (2.4%–18.3%), and a GSI of 6.8% ± 4.1% (0.001%–0.21%). Finally, muscle δ13C and δ15Nvalues averaged −25.2‰ ± 1.1‰ (−27.7‰ to 23.1‰) and 12.1‰ ± 1.5‰ (7.9‰–15.4‰), respec-tively (Table 1). Burbot livers weighed on average 221 ± 114.6 g (42–624 g) and had lipid concen-trations of 28.5% ± 7.9% (8.6%–41.9%). Biological and ecological characteristics of sampledBurbot demonstrated significant variation in total length, body mass, condition, HSI,GSI, δ13C, δ15N, and liver mass (ANOVA: all P < 0.05; Table 1) among the four northern com-munities, whereas age and liver lipids were comparable (ANOVA: all P > 0.05; Table 1).A total of 217 livers were ranked for palatability by harvesters, which were dividedinto three quality rankings (1–3; palatable to not palatable) as follow: 119 (54.8%) rank 1,81 (37.3%) rank 2, and 17 (7.8%) as rank 3 (Fig. 3A). The frequency of ranked livers followedthe same basic trend among communities with most of the livers sampled being of rank 1,followed closely with rank 2, and a smaller number of rank 3 livers. Fort McPherson hadthe highest percentage of rank 1 and lowest percentage of rank 3 livers; however,Aklavik, Inuvik, and Tsiigehtchic were similar in their relative frequency of livers byrankings (Fig. 3B).
Burbot body and liver characteristics ranked by harvesters for palatability differedin fish age (F2,2 = 8.27; P = 0.02), HSI (F2,209.5 = 9.24; P < 0.01), and liver mass (g)(F2,210.3 = 8.10; P < 0.01) (Table 2; Fig. 4). Specifically, livers ranked as unpalatable (rank 3)were from fish that were older and had lower HSI than livers ranked as palatable (ranks 1, 2).In addition, bigger livers were generally ranked as more palatable than smaller livers.Marginal evidence was found for selecting livers from fish with higher whole-bodymass (g) (P = 0.05) and those with higher liver lipids (P = 0.06). The characteristics variedamong ranked livers but, in general, livers from heavier Burbot and fatter livers wereranked as more palatable. Finally, no differences in the total length, condition factor, GSI,δ13C, or δ15N were found among fish whose livers were ranked for palatability (Table 2).
Livers ranked by harvesters for palatability differed in Cu (F2,16.10 = 5.65; P = 0.01) and inworm intensities (F2,128.8 = 8.10; P< 0.01), but did not differ for any other metals (Hg, As, Se,and Zn) or organochlorines (Table 3; Fig. 5). Specifically, higher concentration of Cu werefound in livers ranked higher for palatability (rank 1) compared to livers described as unpal-atable (rank 3). In contrast, R. acus intensities increased as the liver palatability decreased(rank 1–3).
Cott et al. 211
Published by NRC Research Press
Arc
tic S
cien
ce D
ownl
oade
d fr
om w
ww
.nrc
rese
arch
pres
s.co
m b
y U
NIV
ER
SIT
Y O
F B
RIT
ISH
CO
LU
MB
IA o
n 09
/17/
18Fo
r pe
rson
al u
se o
nly.

Table 1. Among-community comparison of biological characteristics (mean ± SD) of Burbot (Lota lota) whose livers were ranked for palatability by aboriginal harvesters ineach community and pooled.
Tissue Measure
Community
Aklavik Fort McPherson Inuvik Tsiigehtchic Sites Pooled
Whole body Total length (mm) 738 ± 67 (n = 60) 703 ± 97 (n = 80) 756 ± 85 (n = 49) 713.1 ± 74 (n = 28) 726 ± 86 (n = 217)Body mass (g) 3533 ± 931 (n = 60) 3141 ± 1212 (n = 80) 3776 ± 1455 (n = 49) 2526 ± 848 (n = 28) 3314 ± 1220 (n = 217)Condition 0.7 ± 0.1 (n = 60) 0.7 ± 0.1 (n = 80) 0.7 ± 0.2 (n = 49) 0.6 ± 0.1 (n = 28) 0.7 ± 0.1 (n = 217)Age (years) 13.5 ± 2.1 (n = 60) 13.1 ± 3.3 (n = 80) 13.9 ± 2.8 (n = 49) 14.9 ± 3.9 (n = 28) 13.7 ± 3.1 (n = 217)HSI (%) 8.6 ± 2.2 (n = 60) 7.9 ± 2.1 (n = 80) 7.6 ± 2.5 (n = 49) 5.9 ± 1.9 (n = 28) 7.8 ± 2.3 (n = 217)GSI (%) 7.4 ± 4.2 (n = 60) 6.7 ± 3.4 (n = 80) 7.6 ± 3.8 (n = 49) 4.6 ± 5.5 (n = 28) 6.8 ± 4.1 (n = 217)δ15N (‰) 12.6 ± 1.2 (n = 33) 11.3 ± 1.2 (n = 50) 13.4 ± 1.3 (n = 19) 12.2 ± 1.7 (n = 28) 12.1 ± 1.5 (n = 130)δ13C (‰) −25.6 ± 1.0 (n = 33) −25.5 ± 0.9 (n = 50) −24.1 ± 0.9 (n = 19) −24.8 ± 1.0 (n = 28) −25.2 ± 1.1 (n = 130)
Liver Mass (g) 251.9 ± 104.8 (n = 60) 214.3 ± 120.2 (n = 80) 240.3 ± 114.1 (n = 49) 141.6 ± 78.7 (n = 28) 221.2 ± 114.6 (n = 217)Lipid (%) 30.0 ± 6.5 (n = 7) 29.5 ± 4.9 (n = 6) 21.5 ± 8.5 (n = 8) 33.4 ± 8.4 (n = 5) 28.5 ± 7.9 (n = 26)
Note: SD, standard deviation; HSI, hepatosomatic index; GSI, gonadosomatic index.
212Arctic
Science
Vol.4,2018
Publish
edbyNRCResearch
Press
Arc
tic S
cien
ce D
ownl
oade
d fr
om w
ww
.nrc
rese
arch
pres
s.co
m b
y U
NIV
ER
SIT
Y O
F B
RIT
ISH
CO
LU
MB
IA o
n 09
/17/
18Fo
r pe
rson
al u
se o
nly.

Discussion
The effectiveness of using traditional visual assessments to determine the quality of theliver as a general indicator of Burbot health was supported in our results. Traditional meth-ods worked well for selecting lipid-rich Burbot livers with low intensities of fish parasites.However, these methods were not effective for detecting Burbot with elevated concentra-tions of heavy metals or organochlorine compounds.
There was no correlation observed between any of the metal or organochlorines param-eters tested and the perceived palatability of livers, apart from Cu. Cu concentrations weresignificantly higher in the livers ranked “most palatable”. It should be noted that Cu is anessential element for human health and the concentrations found in all livers assessedin this study (from most to least palatable) were well below consumption guidelines(WHO 2004). Further, Hg, As, and Se concentrations were comparable to other studies,but Cu concentrations were substantially lower in fish from our study area than from
Fig. 3. Number of Burbot liver samples by palatability ranking (A), and frequency of Burbot samples by rankingper community (B), Gwich’in Settlement Area, Northwest Territories, Canada. Palatability rank of 1 being “good”,2 “fair”, and 3 “bad”.
Cott et al. 213
Published by NRC Research Press
Arc
tic S
cien
ce D
ownl
oade
d fr
om w
ww
.nrc
rese
arch
pres
s.co
m b
y U
NIV
ER
SIT
Y O
F B
RIT
ISH
CO
LU
MB
IA o
n 09
/17/
18Fo
r pe
rson
al u
se o
nly.

Table 2. Among-rank differences in body and liver characteristics (mean ± SD) of Burbot (Lota lota) whose livers were ranked 1–3 for palatability by Indigenous harvesters(1 being “good”, 2 “fair”, and 3 “bad”).
Specimen Measure
Liver rank Model results
1 2 3 ndf, ddf F P Tukeya
Whole body Total length (mm) 730 ± 90 (n = 119) 721 ± 81 (n = 81) 721 ± 82 (n = 17) 2, 212.6 0.85 0.43 N/ABody mass (g) 3472 ± 1301 (n = 119) 3153 ± 1123 (n = 81) 2989 ± 937 (n = 17) 2, 210.0 2.77 0.07 N/ACondition 71.9 ± 16.0 (n = 119) 67.5 ± 9.7 (n = 81) 68.1 ± 15.4 (n = 17) 2, 210.9 1.28 0.28 N/AAge (years) 13.6 ± 2.9 (n = 119) 13.2 ± 2.9 (n = 81) 16.8 ± 3.7 (n = 17) 2, 2.0 8.27 0.02 b, cHSI (%) 8.1 ± 2.2 (n = 119) 7.6 ± 2.4 (n = 81) 6.2 ± 2.8 (n = 17) 2, 209.5 9.24 <0.01 b, cGSI (%) 6.9 ± 3.9 (n = 119) 6.5 ± 4.3 (n = 81) 7.6 ± 5.2 (n = 17) 2, 192.4 0.46 0.63 N/Aδ15N (‰) 12.1 ± 1.6 (n = 70) 12.1 ± 1.4 (n = 50) 12.0 ± 1.1 (n = 10) 2, 124.5 0.38 0.69 N/Aδ13C (‰) −25.0 ± 1.1 (n = 70) −25.3 ± 1.1 (n = 50) −25.5 ± 0.9 (n = 10) 2, 124.4 2.17 0.12 N/A
Liver Mass (g) 243 ± 122 (n = 119) 199 ± 94 (n = 81) 170 ± 113 (n = 17) 2, 210.3 8.10 <0.01 a, b, cLipid (%) 30.9 ± 7.0 (n = 7) 33.0 ± 4.9 (n = 5) 25.1 ± 8.4 (n = 14) 2, 18.3 3.94 0.06 N/A
Note: Model results indicating if body and liver characteristics differed among palatability rank were obtained using Kenward–Rogers F tests on linear mixed effects models and likelihoodratio tests on generalized linear mixed effect models with collection year and community treated as random intercepts. Tukey’s tests were used to obtain pairwise multiple comparisons betweenliver ranks. SD, standard deviation.
aa, b, and c corresponds to significant differences at P< 0.05 determined by Tukey’s tests between liver ranks 1–2, 1–3, and 2–3, respectively. An N/A value indicates a Tukey’s test was notperformed because the factor liver rank was not significant.
214Arctic
Science
Vol.4,2018
Publish
edbyNRCResearch
Press
Arc
tic S
cien
ce D
ownl
oade
d fr
om w
ww
.nrc
rese
arch
pres
s.co
m b
y U
NIV
ER
SIT
Y O
F B
RIT
ISH
CO
LU
MB
IA o
n 09
/17/
18Fo
r pe
rson
al u
se o
nly.

Great Slave Lake. McCarthy et al. (1997) reported amedian Cu concentration of 7.6–8.7 μg/g forBurbot collected annually in the Slave River at Fort Smith over 1991–1993 and 3.8–4.2 μg/gfor two reference lakes. Although parasite intensities may affect the accumulation of metalsby fish (Sures 2001), this was not apparent in our study.
Parasite intensity can physiologically compromise individual hosts, resulting in reducedoverall fitness, and animals that are in otherwise poor health are often associated withreduced immune-competence (Goater et al. 2014). We found a clear inverse relationshipbetween the perceived palatability of livers and parasite intensity. The larvae of R. acusare found in and on the livers of a range of fishes from Eurasia and North America (Goateret al. 2014). Unlike tapeworms, roundworm do not infect humans and dogs (Stewartand Bernier 1999). The larvae typically enter a resting stage that encysts on the stomach,caecae, and intestine of intermediate hosts such as coregoine fishes. Following theingestion of an appropriate intermediate host, adult worms develop to reproductivematurity within the intestines of the definitive host, usually Northern Pike (Esox lucius,Linnaeus 1758). Infection characteristics of R. acus within Burbot are atypical because
Fig. 4. (A) Body mass (log10), (B) liver mass (log10), (C) liver lipids, and (D) hepatosematic index (HSI; log10) ofindividual Burbot sampled, organized by liver palatability ranking (1 being “good”, 2 “fair”, and 3 “bad”),Gwich’in Settlement Area, Northwest Territories, Canada. Black lines are loess smoothers to visualize trendswhere significant differences among liver ranks existed (Table 2).
Cott et al. 215
Published by NRC Research Press
Arc
tic S
cien
ce D
ownl
oade
d fr
om w
ww
.nrc
rese
arch
pres
s.co
m b
y U
NIV
ER
SIT
Y O
F B
RIT
ISH
CO
LU
MB
IA o
n 09
/17/
18Fo
r pe
rson
al u
se o
nly.

Table 3. Comparison of concentrations of organochlorines (ng/g) and metals (μg/g), and amount of the nematode (Raphidascaris acus) measured in Burbot (Lota lota) liversranked 1–3 for palatability by Indigenous harvesters (1 being “good”, 2 “fair”, and 3 “bad”).
Stressor Measure
Concentrations/Counts Model results
Liver rank 1 Liver rank 2 Liver rank 3 ndf, ddf F P Tukeya
Organochlorines ΣPCB 26.6 ± 12.4 (n = 7) 50.2 ± 56.7 (n = 5) 43.6 ± 35.4 (n = 14) 2, 18.98 0.27 0.76 N/AΣDDT 6.3 ± 4.4 (n = 7) 15.0 ± 17.1 (n = 5) 10.6 ± 10.3 (n = 14) 2, 18.75 0.49 0.62 N/AΣCHL 8.6 ± 5.1 (n = 7) 17.1 ± 18.1 (n = 5) 9.5 ± 9.3 (n = 14) 2, 18.98 0.54 0.59 N/AΣHCH 0.8 ± 0.4 (n = 7) 0.9 ± 0.3 (n = 5) 0.7 ± 0.3 (n = 14) 2, 18.38 1.88 0.18 N/AΣCBZ 3.0 ± 1.7 (n = 7) 3.1 ± 0.9 (n = 5) 2.8 ± 1.6 (n = 14) 2, 18.98 0.15 0.86 N/AΣTOXA 26.4 ± 20.2 (n = 7) 37.7 ± 37.1 (n = 5) 21.7 ± 25.8 (n = 14) 2, 18.98 0.58 0.57 N/A
Metals HG 0.3 ± 0.2 (n = 7) 0.4 ± 0.1 (n = 5) 0.4 ± 0.2 (n = 14) 2, 16.28 1.96 0.17 N/AAS 2.7 ± 2.1 (n = 7) 2.5 ± 1.8 (n = 5) 2.4 ± 2.7 (n = 14) 2, 16.20 0.49 0.62 N/ASE 0.5 ± 0.1 (n = 7) 0.5 ± 0.1 (n = 5) 0.5 ± 0.1 (n = 14) 2, 16.56 0.03 0.97 N/ACU 0.3 ± 0.1 (n = 7) 0.2 ± 0.1 (n = 5) 0.2 ± 0.1 (n = 14) 2, 16.10 5.65 0.01 bZN 10.2 ± 7.8 (n = 7) 7.5 ± 0.9 (n = 5) 6.9 ± 1.0 (n = 14) 2, 17.46 1.27 0.31 N/A
Parasites Nemetoda 32.7 ± 32.6 (n = 77) 56.6 ± 58.6 (n = 51) 247.1 ± 462.4 (n = 6) 2, 128.8 5.29 <0.01 a, b
Note: Model results indicate if body and liver characteristics differed among palatability rank using Kenward–Rogers F tests on linear mixed effects models with each community treated as arandom intercept. Tukey’s tests were used to obtain pairwise multiple comparisons between liver ranks.
aa, b, and c corresponds to significant differences at P< 0.05 determined by Tukey’s tests between liver ranks 1–2, 1–3, and 2–3, respectively.
216Arctic
Science
Vol.4,2018
Publish
edbyNRCResearch
Press
Arc
tic S
cien
ce D
ownl
oade
d fr
om w
ww
.nrc
rese
arch
pres
s.co
m b
y U
NIV
ER
SIT
Y O
F B
RIT
ISH
CO
LU
MB
IA o
n 09
/17/
18Fo
r pe
rson
al u
se o
nly.
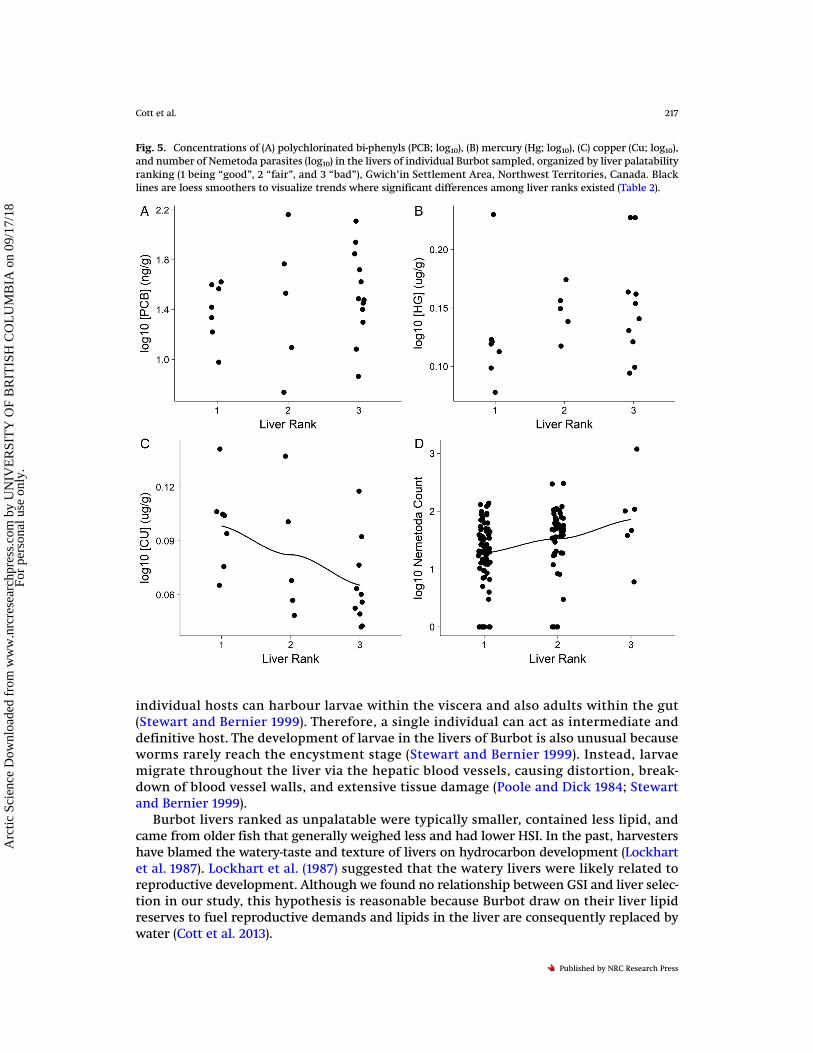
individual hosts can harbour larvae within the viscera and also adults within the gut(Stewart and Bernier 1999). Therefore, a single individual can act as intermediate anddefinitive host. The development of larvae in the livers of Burbot is also unusual becauseworms rarely reach the encystment stage (Stewart and Bernier 1999). Instead, larvaemigrate throughout the liver via the hepatic blood vessels, causing distortion, break-down of blood vessel walls, and extensive tissue damage (Poole and Dick 1984; Stewartand Bernier 1999).
Burbot livers ranked as unpalatable were typically smaller, contained less lipid, andcame from older fish that generally weighed less and had lower HSI. In the past, harvestershave blamed the watery-taste and texture of livers on hydrocarbon development (Lockhartet al. 1987). Lockhart et al. (1987) suggested that the watery livers were likely related toreproductive development. Although we found no relationship between GSI and liver selec-tion in our study, this hypothesis is reasonable because Burbot draw on their liver lipidreserves to fuel reproductive demands and lipids in the liver are consequently replaced bywater (Cott et al. 2013).
Fig. 5. Concentrations of (A) polychlorinated bi-phenyls (PCB; log10), (B) mercury (Hg; log10), (C) copper (Cu; log10),and number of Nemetoda parasites (log10) in the livers of individual Burbot sampled, organized by liver palatabilityranking (1 being “good”, 2 “fair”, and 3 “bad”), Gwich’in Settlement Area, Northwest Territories, Canada. Blacklines are loess smoothers to visualize trends where significant differences among liver ranks existed (Table 2).
Cott et al. 217
Published by NRC Research Press
Arc
tic S
cien
ce D
ownl
oade
d fr
om w
ww
.nrc
rese
arch
pres
s.co
m b
y U
NIV
ER
SIT
Y O
F B
RIT
ISH
CO
LU
MB
IA o
n 09
/17/
18Fo
r pe
rson
al u
se o
nly.

The fish used in this study were also used for a study on the ecology of Burbot where sta-ble isotope analysis was conducted (see Recknagel et al. 2015). We used these data opportun-istically to determine if any generalizations could be made on trophic ecology using thistraditional monitoring approach that could be later incorporated into a community-basedmonitoring program. As with contaminants, we found no difference in δ13C or δ15N amongBurbot with different liver-palatability rankings suggesting that energy sources or trophicposition were not related to liver palatability. Burbot occupy a top trophic position inaquatic food webs (Cott et al. 2011), which is unsurprising as they become obligate pisci-vores upon reaching adulthood (Amundsen et al. 2003). Burbot in the lower MackenzieRiver are no exception, with fish being their primary food source of the Burbot used is thisstudy (see Recknagel et al. 2015), including a high degree of cannibalism (Gallagher andDick 2015). Whether Burbot are in poor health with “bad” looking livers or not, they wouldstill be eating fish, and therefore should occupy a trophic niche like those with “good”livers.
For millennia, Gwich’in hunters and fishers have used the appearance of the liver andintestines to determine the health of the animals they have harvested. The liver should beclear, dark (or creamy in the case of Burbot), and uniform in colour and be free of spots orblisters, otherwise the animal is deemed to be sick and is not eaten (GRRB 2001). The abilityto identify and avoid eating physiologically compromised animals is an important skill andprecautionary strategy for Gwich’in harvesters as the consequences of infection particu-larly without medical treatment, can be severe. This may simply be a form “of an adaptivedisgust response” where possible pathways for disease are instinctively avoided (Curtiset al. 2011). The propensity for people to select for food that looks “good” may have evolvedfrom a food safety standpoint but has developed into a habitual human trait in modernsociety as well. In a study by Yue et al. (2009), 75% of people were willing to pay a premiumfor organically grown apples over conventionally grown apples (i.e., where pesticides andchemical fertilizers are used), but this willingness was proportional to the appearance ofthe apple. If the organically grown apples appeared cosmetically imperfect they wererejected in favour of the nonorganic but aesthetically pleasing alternative. In other words,appearance of a food item is a fundamental driver of food selection even when presentedwith the knowledge that it may not be as healthy as less aesthetically pleasing alternatives,and our idea of what is palatable is subject to change over time. This hold true with theappearance of traditional foods as well. Robidoux et al. (2009) reported on an initiative toreintegrate traditional foods into the diets of people from a First Nation community onNorthern Ontario. In their study, they documented the use of Burbot livers by communitymembers and also quantified the nutritional value of Burbot livers. Like the Gwich’in, thisFirst Nation historically used burbot livers and have long known that they are a healthyfood. However, in contrast to the Gwich’in, these fishers no longer actively harvestBurbot. If caught Burbot are thrown away and fishers even avoid touching them(Robidoux et al. 2009).
The difference — and the problem — with environmental contaminants in subsistencefoods is that in contrast to something like parasites, contaminants may not change a food’sappearance, and harvesters likely do not have a priori knowledge of contaminant concen-trations, or any way to visually detect and select foods that would be lower in contaminants.Being a product of the industrial era anthropogenic pollutants, including the increased con-centrations of elemental metals, are recent occurrences relative to the amount of timeIndigenous people have been relying on wild fish and game. Such pollutants are nowubiquitous and represent a potential health concern for traditional harvesters (Muir et al.2005). It is conceivable that, due to the lipophilic nature of these compounds, selecting forthe largest and fattiest livers also selects for livers with higher concentrations of
218 Arctic Science Vol. 4, 2018
Published by NRC Research Press
Arc
tic S
cien
ce D
ownl
oade
d fr
om w
ww
.nrc
rese
arch
pres
s.co
m b
y U
NIV
ER
SIT
Y O
F B
RIT
ISH
CO
LU
MB
IA o
n 09
/17/
18Fo
r pe
rson
al u
se o
nly.

contaminants as they cannot be seen directly. In a recent study, Burbot in a heavily industri-alised area of Lake Erie and a point source for PCB pollution had 60 times the levels of PCBsper gram of tissue than Burbot from Great Slave Lake (Stapanian et al. 2014). Inability of tra-ditional methods to avoid contaminated subsistence fish could be problematic where fishcould be exposed to such contaminant “hot spots”. Fortunately, contaminant concentra-tions in fish from the GSA are below consumption guidelines. In many cases, the nutri-tional benefits of eating traditional foods outweigh potential risk from potentialcontaminants that may be present in fish tissue (Donaldson et al. 2010; Reyes 2016).With the importance of harvesting and eating traditional foods to the Gwichi’in people,the monitoring of contaminants in subsistence food sources should be a priority.
Effective community/harvest-based environmental monitoring should satisfy severalfundamental principles including being relatively simple to implement and complete,employing scientifically defensible methods, and being guided by community interests(Bell and Harwood 2012). The work presented here offers an example of a straightforwardapproach that can be easily implemented into a community-based monitoring templatethat could be conducted during regular harvesting practices and assist in the detection ofenvironmental change. Furthermore, using traditional harvests — such as in this study —
can be a cost-effective means of sample collection while combining the mutually beneficialaspects of traditional and local knowledge and scientific investigation (Moller et al. 2004;Bell and Harwood 2012). Future research could include conducting community-based mon-itoring to assess Burbot liver quality on an annual basis to enable the detection of inter-annual variation in different areas where Burbot are regularly harvested for their livers,such as in the Inuvialuit Settlement Region. Such an expansion in geographic scope wouldpermit the investigation of regional variation. Burbot could also be sampled from an areathat is known to be contaminated (e.g., areas of Lake Erie; see Stapanian et al. 2014), andtheir livers could be visually assessed by northern harvesters (through photos that weretaken using a standardized approach). This would act as a surrogate to a traditional harvestscenario in a polluted area.
This research and proposed monitoring approach represents a successful and usefulmelding of traditional and local knowledge and science to address community concernsover a traditional food source. The wide pan-Arctic range of Burbot makes them as an excel-lent bioindicator species for environmental monitoring purposes (Stapainian et al. 2010).We demonstrate that the relative appearance of a Burbot liver can be an indication ofoverall condition of the fish. If the proportion of palatable to unpalatable livers is foundto be beyond normal variability it could be an indication of environmental change. If so, atargeted scientific study could be aimed at investigating the metric further (e.g.,are parasite intensities in Burbot livers increasing?). Our study was “user-inspired” and“user-useful” (Raymond et al. 2010) and demonstrated that the resource users— in this casesubsistence Gwich’in fishers — can be integral in the development and implementation ofscientific studies.
Acknowledgements
We would like to thank Nihtat Gwich’in elder Tom Wright who oversaw the liver rank-ings, the community harvesters who collected Burbot; Russell Andre, Willie Clark, LouisCardinal, Abe Peterson, Jonny Kay, Wally Tyrell, Ryan McLeod, Jozef Carnogursky, CollinKoe, Alec Vittrekwa, George Niditchie Sr., Willy Clark, Andy Andre, Merven Snowshoe,William Koe; the youth that helped in the field; Billy Tyrell, Annie Tyrell, GrahamMacDonald; the Renewable Resource Councils who supported the project, Ehdiitat RRC(Aklavik) Nihtat RRC (Inuvik) Tetlit RRC (Fort McPherson) Gwichya Gwich’in RRC(Tsiightchic); and others who supported or contributed in the project in various ways,
Cott et al. 219
Published by NRC Research Press
Arc
tic S
cien
ce D
ownl
oade
d fr
om w
ww
.nrc
rese
arch
pres
s.co
m b
y U
NIV
ER
SIT
Y O
F B
RIT
ISH
CO
LU
MB
IA o
n 09
/17/
18Fo
r pe
rson
al u
se o
nly.

notably Terry Dick, Allen Firth, Julie-Anne Andre, Nathan Miller, Brian Dokum, MCpl RyanJackson, Julian Kanigan, Meghan Beveridge, Jen Fresque-Baxter, Isaac Beattie-Booth, JoeAcorn, Sarah Lord, Kathryn Elmer, Hans Recknagel, and Axel Meyer. Finally, we wouldlike to thank the anonymous peer-reviewers and the Associate Editor whose critical andconstructive feedback improved this manuscript. Funding for this project was provided bythe Gwich’in Renewable Resources Board, the Department of Fisheries and Oceans, andEnvironment Canada. Fish and Traditional Knowledge were collected under the authorityof DFO licence to fish for scientific purposes S-07/08-4002-IN, DFO Animal Use ProtocolsFWI-ACC-2007-2008-014 and FWI-ACC-2008-2009-033, Aurora Research Institute Licence14141and 14364 (for fish sampling) and 14234 (for obtaining Traditional Knowledge).
ReferencesAmundsen, P.A., Bøhn, T., Popova, O.A., Staldvik, F.J., Reshetnikov, Y.S., Kashulin, N.A., and Lukin, A.A. 2003.Ontogenetic niche shifts and resource partitioning in a subarctic piscivore fish guild. Hydrobiologia, 497: 109–119.
Bates, D., Maechler, M., and Bolker, B. 2016. lme4: linear mixed-effects models using Eigen and S4. Version 1.1-12.https://cran.r-project.org/web/packages/lme4/lme4.pdf.
Bell, R.K., and Harwood, L.A. 2012. Harvest-based monitoring in the Inuvialuit settlement region: steps for success.Arctic, 65: 421–432. doi: 10.14430/arctic4240.
Bernier, L.M.J. 1986. Liver pathology of burbot Lota lota (Linnaeus) and the parasites Raphidascaris acus (Bloch) andTriaenophorus nodulosus (Pallas) with notes on transmission routes. Arctic Biological Consultants, Department ofFisheries and Oceans, Winnipeg, MB. 23 p.
Carrie, J., Wang, F., Sanei, H., Macdonald, R.W., Outridge, P.M., and Stern, G.A. 2009. Increasing contaminant bur-dens in an Arctic fish, burbot (Lota lota), in a warming climate. Environ. Sci. Technol. 44: 316–322. doi: 10.1021/es902582y.
Cohen, D.M., Iwamoto, T., Scialabba, T., Whitehead, N., Palmer, P.J., and Cohen, D.M. 1990. FAO species catalogue:vol. 10 gadiform fishes of the world (order gadiformes), an annotated and illustrated catalogue of cods. Hakes,grenadiers and other gadiform fishes known to date. FAO.
Cott, P.A., Johnston, T.A., and Gunn, J.M. 2011. Food web position of Burbot relative to Lake Trout, Northern Pike,and Lake Whitefish in four sub-Arctic boreal lakes. J. Appl. Ichthyol. 27: 49–56. doi: 10.1111/j.1439-0426.2011.01843.x.
Cott, P.A., Johnston, T.A., and Gunn, J.M. 2013. Sexual dimorphism in an under-ice spawning fish: the burbot(Lota lota). Can. J. Zool. 91: 732–740. doi: 10.1139/cjz-2013-0083.
Curtis, V., De Barra, M., and Aunger, R. 2011. Disgust as an adaptive system for disease avoidance behaviour. Philos.Trans. R. Soc. London B: Biol. Sci. 366: 389–401. doi: 10.1098/rstb.2010.0117.
Dick, T.A., and Bernier, L.M.J. 1987. Liver pathology of burbot Lota lota (Linnaeus) infected with larvae of the nema-tode Raphidascaris acus (Bloch, 1799) from the Northwest Territories. Prepared for Department of Fisheries andOceans, Winnipeg, MB. i+ 47 pp.
Donaldson, S.G., Van Oostdam, J., Tikhonov, C., Feeley, M., Armstrong, B., Ayotte, P., Boucher, O., Bowers, W., Chan,L., Dallaire, F., Dallaire, R., Dewailly, É., Edwards, J., Egeland, G.M., Fontaine, J., Furgal, C., Leech, T., Loring, E.,Muckle, G., Nancarrow, T., Pereg, D., Plusquellec, P., Potyrala, M., Receveur, O., and Shearer, R.G. 2010.Environmental contaminants and human health in the Canadian Arctic. Sci. Total Environ. 408: 5165–5234.doi: 10.1016/j.scitotenv.2010.04.059. PMID: 20728918.
Edwards, W.H., Stapanian, M.A., and Stoneman, A.T. 2011. Precision of twomethods for estimating age from burbototoliths. J. Appl. Ichthyol. 27: 43–48.
Evans, M.S., Muir, D., Lockhart, W.L., Stern, G., Ryan, M., and Roach, P. 2005. Persistent organic pollutants and met-als in the freshwater biota of the Canadian Subarctic and Arctic: an overview. Sci. Total Environ. 351–352: 94–147.doi: 10.1016/j.scitotenv.2005.01.052.
Gallagher, C.P., and Dick, T.A. 2015. Winter feeding ecology and the importance of cannibalism in juvenile and adultburbot (Lota lota) from the Mackenzie Delta, Canada. Hydrobiologia, 757: 73–88. doi: 10.1007/s10750-015-2227-z.
Goater, C.P., and Doster, G.L. 1997. Collection and quantification of avian helminths and protozoa. In Host-parasiteevolution: general principles and avian models. Edited by D.H. Clayton and J. Moore. Oxford University Press,Oxford, UK.
Goater, T.M., Goater, C.P., and Esch, G.W. 2014. Parasitism: the diversity and ecology of animal parasites. 2nd ed.Cambridge University Press, Cambridge, UK.
Government of the Northwest Territories (GNWT). 2013. NWTwater stewardship strategy implementation progressreport — April 2011–March 2013. http://www.assembly.gov.nt.ca/sites/default/files/td_145-174.pdf (last accessed18 August 2017).
Government of the Northwest Territories (GNWT). 2014. Environment and natural resources. NWT state of the envi-ronment report. Chapter 18.2. Trends in Hunting and Fishing in the NWT (2014). http://www.enr.gov.nt.ca/state-environment/182-trends-hunting-and-fishing-nwt (last accessed 09 May 2017).
220 Arctic Science Vol. 4, 2018
Published by NRC Research Press
Arc
tic S
cien
ce D
ownl
oade
d fr
om w
ww
.nrc
rese
arch
pres
s.co
m b
y U
NIV
ER
SIT
Y O
F B
RIT
ISH
CO
LU
MB
IA o
n 09
/17/
18Fo
r pe
rson
al u
se o
nly.

Guzzo, M.M., Eckbo, N.H., Gabrielsen, G.H., Fisk, A.T., Hylland, K., and Borgå, K. 2013. Persistent organic pollutantconcentrations in fledglings of two arctic seabird species. Environ. Pollut. 184: 414–418. doi: 10.1016/j.envpol.2013.09.007. PMID: 24121265.
Gwich’in Renewable Resources Board (GRRB). 1997. Nành’ Kak Geenjit Gwich’in Ginjik. In Gwich’in words about theland. Edited by A. Fehr, N. Davis, and S. Black. Gwich’in Renewable Resources Board, Inuvik, NWT.
Gwich’in Renewable Resources Board (GRRB). 2001. Gwìndòo Nành’ Kak Geenjit Gwich’in Ginjik. InMore Gwich’inwords about the land. Edited by T. Leigh. Gwich’in Renewable Resources Board, Inuvik, NWT.
Halekoh, U., and Højsgaard, S. 2014. A Kenward-Roger approximation and parametric bootstrap methods for testsin linear mixed models — the R Package pbkrtest. J. Stat. Softw. 59: 1–30. doi: 10.18637/jss.v059.i09.
Kidd, K.A., Schindler, D.W., Muir, D.C., Lockhart, W.L., and Hesslein, R.H. 1995. High concentrations of toxaphenein fishes from a subarctic lake. Science, 269: 240–242. doi: 10.1126/science.269.5221.240. PMID: 17789852.
Kidd, K.A., Schindler, D.W., Hesslein, R.H., and Muir, D.C.G. 1998. Effects of trophic position and lipid on organo-chlorine concentrations in fishes from subarctic lakes in Yukon Territory. Can. J. Fish. Aquat. Sci. 55: 869–881.doi: 10.1139/f97-307.
Kristofferson, A.H., and McGowan, D.K. 1981. Data on Arctic Charr, Salvelinus alpinus (Linnaeus), collected from testfisheries in the Baffin Region, Northwest Territories, 1975–79. 255, Department of Fisheries and Oceans,Winnipeg, Man.
Kuhnlein, H.V., Receveur, O., Muir, D.C.G., Chan, H.M., and Soueida, R. 1995. Arctic indigenous women consumegreater than acceptable levels of organochlorines. J. Nutr. 125: 2501–2510. PMID: 7562084.
Lenth, R. 2016. Lsmeans: least-squares means. Version 2.23-5. https://cran.r-project.org/web/packages/lsmeans/lsmeans.pdf.
Lockhart, W.L., Metner, D.A., Murray, D.A.J., and Muir, D.C.G. 1987. Hydrocarbons and complaints about fish qualityin the Mackenzie River, Northwest Territories, Canada. Water Poll. Res. J. Can. 22: 616–628.
McCarthy, L.H., Stephens, G.R., Whittle, D.M., Peddle, J., Harbicht, S., LaFontaine, C., and Gregor, D.J. 1997. Baselinestudies in the Slave River, NWT, 1990-1994: Part II. Body burden contaminants in whole fish tissue and livers. Sci.Total Environ. 197: 55–86. doi: 10.1016/S0048-9697(96)05420-4. PMID: 9151436.
McPhail, J.D., and Paragamian, V.L. 2000. Burbot biology and life history. In Burbot: biology, ecology, and manage-ment. American Fisheries Society, Fisheries Management Section, Bethesda, Md., Publication 1: 11–23.
Moller, H., Berkes, F., Lyver, P.O.B., and Kislalioglu, M. 2004. Combining science and traditional ecological knowl-edge: monitoring populations for co-management. Ecol. Soc. 9: 2. doi: 10.5751/ES-00675-090302.
Muir, D., Riget, F., Cleemann, M., Kleivane, L., Skaare, J., Nakata, H., Dietz, R., Severinsen, T., and Tanabe, S. 2000.Circumpolar trends of PCBs and organochlorine pesticides in the Arctic marine environment inferred from levelsin ringed seals. Environ. Sci. Technol. 34: 2431–2438. doi: 10.1021/es991245i.
Muir, D.C.G., Norstrom, R.J., and Simon, M. 1988. Organochlorine contaminants in arctic marine food chains:accumulation of specific polychlorinated biphenyls and chlordane-related compounds. Environ. Sci. Technol.22: 1071–1079. doi: 10.1021/es00174a012. PMID: 22148662.
Muir, D.C.G., Shearer, R.G., Van Oostdam, J., Donaldson, S.G., and Furgal, C. 2005. Contaminants in Canadian arcticbiota and implications for human health: conclusions and knowledge gaps. Sci. Total Environ. 351: 539–546.doi: 10.1016/j.scitotenv.2005.08.030. PMID: 16219339.
Muir, D.C.G., Kurt-Karakas, P., and Stow, J. 2013. Canadian Arctic contaminants assessment report on persistentorganic pollutants. Ottawa, Ont.
Poole, B.C., and Dick, T.A. 1984. Liver pathology of yellow perch, Perca flavescens (Mitchill), infected with larvae of thenematode Raphidascaris acus (Bloch, 1779). J. Wildl. Dis. 20: 303–307.
Post, D.M., Layman, C.A., Arrington, D.A., Takimoto, G., Quattrochi, J., and Montana, C.G. 2007. Getting to the fatof the matter: models, methods and assumptions for dealing with lipids in stable isotope analyses. Oecologia,152: 179–189. doi: 10.1007/s00442-006-0630-x. PMID: 17225157.
R Core Team. 2016. R: a language and environment for statistical computing. Foundation for Statistical Computing,Vienna, Austria. http://R-project.org/.
Raymond, C.M., Fazey, I., Reed, M.S., Stringer, L.C., Robinson, G.M., and Evely, A.C. 2010. Integratinglocal and scientific knowledge for environmental management. J. Environ. Manage. 91: 1766–177.
Recknagel, H., Amos, A., and Elmer, K.R. 2015. Morphological and ecological variation among populations andsubspecies of Burbot (Lota lota [L, 1758]) from the Mackenzie River Delta, Canada. Can. Field-Nat. 128: 377–384.doi: 10.22621/cfn.v128i4.1632.
Reyes, E.S. 2016. Assessing mercury risks for the optimization of nutrient benefits from wild-harvested fishconsumption in the Northwest Territories, Canada. M.Sc. thesis. University of Waterloo. UWSpace. http://hdl.handle.net/10012/10320
Riget, F., Muir, D., Kwan, M., Savinova, T., Nyman, M., Woshner, V., and O’Hara, T. 2005. Circumpolar pattern ofmercury and cadmium in ringed seals. Sci. Total Environ. 351/352: 312–322. doi: 10.1016/j.scitotenv.2004.05.032.
Robidoux, M.A., Haman, F., and Sethna, C. 2009. The relationship of the burbot (Lota lota L.) to the reintroduction ofoff-the-land foods in the Sandy Lake First Nation Community. Biodemogr. Soc. Biol. 55: 12–29. doi: 10.1080/19485560903054630.
Singmann, H., Bolker, B., Westfall, J., and Aust, F. 2016. Analysis of factorial experiments. Version 0.16-1, https://cran.r-project.org/web/packages/afex/afex.pdf.
Stapanian, M.A., Paragamian, V.L., Madenjian, C.P., Jackson, J.R., Lappalainen, J., Evenson, M.J., and Neufeld, M.D.2010. Worldwide status of burbot and conservation measures. Fish Fish. 11: 34–56.
Cott et al. 221
Published by NRC Research Press
Arc
tic S
cien
ce D
ownl
oade
d fr
om w
ww
.nrc
rese
arch
pres
s.co
m b
y U
NIV
ER
SIT
Y O
F B
RIT
ISH
CO
LU
MB
IA o
n 09
/17/
18Fo
r pe
rson
al u
se o
nly.

Stapanian, M.A., Madenjian, C.P., Cott, P.A., Rediske, R.R., and O’Keefe, J.P. 2014. Polychlorinated biphenyl conge-ner distributions in burbot: evidence for a latitude effect. Environ. Toxicol. Chem. 33: 2448–2454. doi: 10.1002/etc.2703. PMID: 25088677.
Stewart, D.B., and Bernier, L.M.J. 1999. Common parasites, diseases and injuries of freshwater fishes in theNorthwest Territories and Nunavut. Arctic Biological Consultants, Winnipeg, for DFO, Central and Arctic Region.
Sures, B. 2001. The use of fish parasites as bioindicators of heavy metals in aquatic ecosystems: a review. Aquat.Ecol. 35: 245–255. doi: 10.1023/A:1011422310314.
Wong, A. 2008. Lipidic profiles of tissue and liver oil of burbot, Lota lota (L.). Acta Ichthyol. Pisc. 38: 55–61.doi: 10.3750/AIP2008.38.1.09.
World health Organization (WHO). 2004. Copper in drinking-water. Background document for developmentof WHO guidelines for drinking-water quality. http://www.who.int/water_sanitation_health/dwq/chemicals/copper.pdf (last accessed 22 August 2017).
Yue, C., Alfnes, F., and Jensen, H.H. 2009. Discounting spotted apples: investigating consumers’ willingness toaccept cosmetic damage in an organic product. J. Agric. Appl. Econ. 41: 29–46. doi: 10.1017/S1074070800002534.
Zuur, A., Ieno, E.N., Walker, N., Saveliev, A.A., and Smith, G.M. 2009. Mixed effects models and extensions inecology with R. Springer, New York, N.Y.
222 Arctic Science Vol. 4, 2018
Published by NRC Research Press
Arc
tic S
cien
ce D
ownl
oade
d fr
om w
ww
.nrc
rese
arch
pres
s.co
m b
y U
NIV
ER
SIT
Y O
F B
RIT
ISH
CO
LU
MB
IA o
n 09
/17/
18Fo
r pe
rson
al u
se o
nly.