Hello and good afternoon. I am Adam Guzzo with the U.S ... · 2018-04-03 15.00 Taking Control Page...
23
2018-04-03 15.00 Taking Control Page 1 of 23 Adam Guzzo, Adam Jacobs, Mark Campbell, Andrew Carter www.verbalink.com Page 1 of 23 Adam Guzzo: Hello and good afternoon. I am Adam Guzzo with the U.S. Department of Energy’s Better Buildings Initiative. I would like to welcome you to the April edition of the Better Buildings webinar series, titled Taking Control: Best Practices in Energy Data Management and Tools for Success. In this series we profile the best practices of Better Buildings Challenge and alliance partners and other organizations working to make buildings more energy efficient. Thanks to all of you for joining us this afternoon. Before we get started with our presentations, I want to remind our audience that we will hold questions until near the end of the hour. So please send in questions through the chat box on your webinar screen. And you can do that at any time during today’s webinar. And we’ll try to get to as many of them as we can at the conclusion of the presentations. Today’s webinar will also be recorded and posted to the web so you can listen and view the slides at some other time or share the webinar with your colleagues that weren’t able to join us today. So now that we have the logistics out of the way, let’s dive into our presentation. Next slide, please. Today you’re going to hear from three outstanding panelists from the City of Boston, MGM Resorts International, and the Commonwealth of Kentucky. We are going to talk about the process, strategies, and tools their respective organizations have used to implement data-driven energy management. But before I introduce them, I want to briefly provide a bit of broader context for today’s presentation and give you a sneak peak at a new DOE resources that will be available this summer. So you’ve probably all heard it said that you can’t manage what you don’t measure. But I really like Peter Drucker’s variation on that saying, which is what gets measured gets improved. And that really is what this webinar is about today; it’s about the importance of data for setting realistic goals, making informed decisions, identifying opportunities, measuring success, and then using data to reassess or reevaluate your goals. That’s applicable across any industry, but obviously with the focus of today’s webinar is how to institutionalize data-driven decision-
-
Upload
nguyenhuong -
Category
Documents
-
view
215 -
download
0
Transcript of Hello and good afternoon. I am Adam Guzzo with the U.S ... · 2018-04-03 15.00 Taking Control Page...

2018-04-03 15.00 Taking Control Page 1 of 23 Adam Guzzo, Adam Jacobs, Mark Campbell, Andrew Carter
www.verbalink.com Page 1 of 23
Adam Guzzo: Hello and good afternoon. I am Adam Guzzo with the U.S. Department of Energy’s Better Buildings Initiative. I would like to welcome you to the April edition of the Better Buildings webinar series, titled Taking Control: Best Practices in Energy Data Management and Tools for Success.
In this series we profile the best practices of Better Buildings
Challenge and alliance partners and other organizations working to make buildings more energy efficient. Thanks to all of you for joining us this afternoon.
Before we get started with our presentations, I want to remind our
audience that we will hold questions until near the end of the hour. So please send in questions through the chat box on your webinar screen. And you can do that at any time during today’s webinar. And we’ll try to get to as many of them as we can at the conclusion of the presentations.
Today’s webinar will also be recorded and posted to the web so
you can listen and view the slides at some other time or share the webinar with your colleagues that weren’t able to join us today.
So now that we have the logistics out of the way, let’s dive into our
presentation. Next slide, please. Today you’re going to hear from three outstanding panelists from
the City of Boston, MGM Resorts International, and the Commonwealth of Kentucky. We are going to talk about the process, strategies, and tools their respective organizations have used to implement data-driven energy management.
But before I introduce them, I want to briefly provide a bit of
broader context for today’s presentation and give you a sneak peak at a new DOE resources that will be available this summer.
So you’ve probably all heard it said that you can’t manage what
you don’t measure. But I really like Peter Drucker’s variation on that saying, which is what gets measured gets improved. And that really is what this webinar is about today; it’s about the importance of data for setting realistic goals, making informed decisions, identifying opportunities, measuring success, and then using data to reassess or reevaluate your goals.
That’s applicable across any industry, but obviously with the focus
of today’s webinar is how to institutionalize data-driven decision-
2018-04-03 15.00 Taking Control Page 2 of 23 Adam Guzzo, Adam Jacobs, Mark Campbell, Andrew Carter
www.verbalink.com Page 2 of 23
making or data-driven energy management in and throughout an organization. Next slide, please.
With that in mind, the Department of Energy has developed a
resource we have simply called the Energy Data Management Guide to help organizations establish a robust and sustainable energy data management program. The primary audience for the guide is the public sector; states, local governments, and schools. But the principles are broadly applicable.
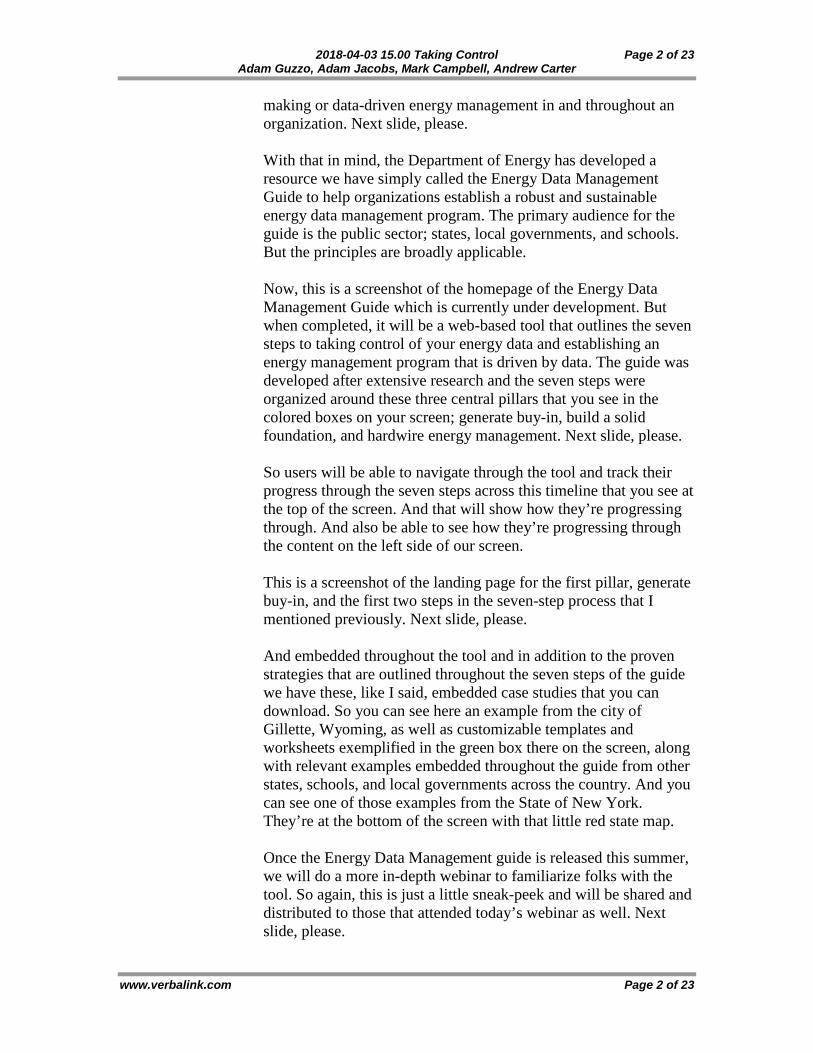
Now, this is a screenshot of the homepage of the Energy Data
Management Guide which is currently under development. But when completed, it will be a web-based tool that outlines the seven steps to taking control of your energy data and establishing an energy management program that is driven by data. The guide was developed after extensive research and the seven steps were organized around these three central pillars that you see in the colored boxes on your screen; generate buy-in, build a solid foundation, and hardwire energy management. Next slide, please.
So users will be able to navigate through the tool and track their
progress through the seven steps across this timeline that you see at the top of the screen. And that will show how they’re progressing through. And also be able to see how they’re progressing through the content on the left side of our screen.
This is a screenshot of the landing page for the first pillar, generate
buy-in, and the first two steps in the seven-step process that I mentioned previously. Next slide, please.
And embedded throughout the tool and in addition to the proven
strategies that are outlined throughout the seven steps of the guide we have these, like I said, embedded case studies that you can download. So you can see here an example from the city of Gillette, Wyoming, as well as customizable templates and worksheets exemplified in the green box there on the screen, along with relevant examples embedded throughout the guide from other states, schools, and local governments across the country. And you can see one of those examples from the State of New York. They’re at the bottom of the screen with that little red state map.
Once the Energy Data Management guide is released this summer,
we will do a more in-depth webinar to familiarize folks with the tool. So again, this is just a little sneak-peek and will be shared and distributed to those that attended today’s webinar as well. Next slide, please.

2018-04-03 15.00 Taking Control Page 3 of 23 Adam Guzzo, Adam Jacobs, Mark Campbell, Andrew Carter
www.verbalink.com Page 3 of 23
So with that, let me introduce our presenters. All of these guys
have a lot of experience, so I won’t run through all of their experience but instead just hit some of the highlights.
And our first presenter today will be Adam Jacobs from the City of Boston. Adam is the energy manager for the City of Boston. In his role he monitors and reviews energy data to track progress towards meeting clean energy goals, verifies energy performance improvements from operational and capital investments, and identifies potential opportunities for additional energy improvements.
Our next speaker will be Mark Campbell. Mark is the director of
sustainable facilities for MGM Resorts International in the company’s corporate sustainability division. His responsibilities center on identifying and implementing energy conservation projects across MGM’s portfolio of properties.
And then our final speaker today is Andrew Carter from the
Commonwealth of Kentucky. Andrew is the energy management program manager in Kentucky’s Division of Facility Efficiency, which includes responsibility for the Commonwealth Energy Management and Control System, which you’ll hear more about in a bit.
So as you can see, it’s a great panel. And when these guys are not
working to help their respective organizations save energy, you can find them hiking and camping in the great outdoors. So I think you can see that by Adam’s headshot here. And if we don’t get to all of your questions today, look for these guys out on the trail in your area and you can learn more that way.
So with that I’ll turn it over to our first presenter, Adam Jacobs
from the City of Boston. Next slide. Adam Jacobs: Great. Good afternoon. Can everyone hear me okay? Adam, can
you hear me okay? Adam Guzzo: Yes, you’re great. Adam Jacobs: Perfect. All right. Next slide. As mentioned, my name is Adam
Jacobs. I am the energy manager of the City of Boston. And I wanted to give everyone sort of a nice, better weather looking picture than what Boston has been experiencing in the last month or so with repeat nor’easters. Next slide here.

2018-04-03 15.00 Taking Control Page 4 of 23 Adam Guzzo, Adam Jacobs, Mark Campbell, Andrew Carter
www.verbalink.com Page 4 of 23
So just as a quick outline of where and how the City of Boston
consumes energy. We have about 67,000 street lights. We have over 3,500 fleet vehicles. And the vast bulk of our energy consumption is coming through 300-some-odd municipal buildings. And that includes everything from the Boston Police and fire departments, to the school department, to the libraries, community centers. Pretty much any administrative building that is within city government. Next slide, please.
So I wanted to go through a couple different sources and uses of
energy data and kind of cover it from a ground-up standpoint. If you’re just starting with an energy management program, going through some of these different sources of energy data is a good start and doing some evaluation of when and how you need this information.
So the first and foremost place you can get energy data obviously
is the bill. It comes every month for the most part unless your utility is a little bit late on billing. And there’s a lot of really good information in here. So you’ll get service address, which also usually is a decent quality, but sometimes you’ve got to correct them on that. The rate class; so what tariff schedule is your electric, gas, or water count on. You always find the service period to and from dates. The usage, which is important to things like Better Buildings Challenge and measuring energy performance in your building. And then the cost. So under cost you’re going to get all sorts of different pieces of information, from the commodity or supply component of your bill if you’re in a deregulated market. So I guess that would also be in a regulated electric or gas market. And then under your delivery or distribution of your energy depending on which service type you’re talking about, there’s a lot of really useful information to dig into there. So you’ll have things like your demand charge if it’s a large time of use electricity account. If your state or government has energy efficiency resource vendors or _____ portfolio standards, you can see all of the information associated with how much you’re being charged on a volumetric basis for those things. So the bill is kind of where everything starts as it relates to energy data. Next slide.
And there’s a lot of really useful things you can do with that data.
So I covered some of them. The one that obviously comes to mind is budgeting. Your organization budgets for everything from salaries to utilities, overhead, and just general administrative costs. So looking at what your budget is going to be for the following fiscal year is always a good thing to do. Once you have aggregated

2018-04-03 15.00 Taking Control Page 5 of 23 Adam Guzzo, Adam Jacobs, Mark Campbell, Andrew Carter
www.verbalink.com Page 5 of 23
energy data, you can analyze the performance of your buildings and benchmark your properties through tools like Energy Star Portfolio Manager and compare yourself to your peers via any of those indices that have aggregated energy performance data.
If you’re like the City of Boston, then you have a greenhouse gas
inventory that you are required to report on every year. So for municipal operations we report out our GHGs annually and have targets for reducing those. And just more budgeting. These are really important things and they impact the bottom line of pretty much any entity. And particularly with in the City of Boston we have a lot of very different services that the city is required to perform, from public safety to education, to keeping the streets clean and well-lit. and every single one of those entities is required to put together what their energy budget is regardless of what services they’re offering. So pretty much any large enterprise is going to have to deal with this. Next slide, please.
And then more recently, particularly for the City of Boston, but
just in general, your monthly bill you’re really going to get one data point every 30 days or so. Maybe you have a couple of accounts for a given building, so you might get a little bit more. But you’re not really getting very granularly with the data. So time of use metering data is a really valuable tool to look at when it comes to getting a better look at how you’re using energy.
And there are a couple different ways to look at this. So the
frequency of the data that you’re getting. You can look at it from both how frequently is the data collected – so does your utility measure your time of use electric consumption in five or 15-minute increments? And then the other way to look at frequency is how often you’re receiving that information.
So the City of Boston for example, we have a couple buildings that
we have real-time metering installs where I’m getting updates basically for – it’s 3:11 PM right now on the East Coast. So I would have a data point from just a minute ago or two minutes ago now on a couple of our buildings’ electric usage. But there’s also different ways to get access to this data.
So in Massachusetts our utility companies are obligated to provide their TOU data to us or to any customer that has a time of use account with this kind of metering install. They are required to give us that data once a year. And it’s not quite as valuable as if you were getting in real-time, but you can look back through all of that data and see if you can identify scheduling anomalies based on

2018-04-03 15.00 Taking Control Page 6 of 23 Adam Guzzo, Adam Jacobs, Mark Campbell, Andrew Carter
www.verbalink.com Page 6 of 23
the load shape of your facilities. So depending on what utility you work with – I remember I used to work down in the D.C. area, and Baltimore Gas and Electric would make that data available to you. This was a couple of years ago. But that data you could pretty much get the next day through their customer portal. And I know that’s something that our electric utility is looking into as well. The data you can get from this, your kilowatt, your instantaneous power, your demand. And you can get the power factor; so the quality of the electricity coming into your building. Next slide, please. So the uses of this. I went through a couple of these, but to U.S. go through them again quickly. Looking at your building schedule to make sure that everything is – major equipment is coming on when it’s supposed to and is shutting down when it’s supposed to. Checking to see if you have your night and weekend setbacks in place. And it’s a good opportunity to review overall what your building’s operations look like. Now, it’s more valuable if you can get down below the aggregate electric meter coming into the building. So if you have any submetering throughout the facility. But even just looking at something like this, you can get a pretty good sense for how tightly your building is scheduled and whether or not you have a long ramp up time for starting you heating and cooling. And if you have peak loads in the middle of the day that have to do with anything process-driven in your building, those things will jump right off the page. A couple other things that we’ve been using energy data for is measuring energy savings, so performing measurement verification on any sort of ESCO-related project or even just something that your organization chooses to fund through capital dollars. And you can identify did those savings actually materialize for anything that has substantial impact. So it would have to be a pretty major piece of mechanical equipment for you to actually see those savings. But again, it’s all back to scheduling of equipment and your ability to manage the building’s load on a daily basis. Something else we spend a good amount of time with is demand response. So this is where your organization, whether through energy reduction or through on-site generation, reduces the stress on your grid. There are a lot of different programs around the country. In New England and Massachusetts specifically we are part of the ISO New England. Basically a demand response program for capacity. So at the beginning of every year we commit for a certain number of buildings a reduction in kilowatt load, and

2018-04-03 15.00 Taking Control Page 7 of 23 Adam Guzzo, Adam Jacobs, Mark Campbell, Andrew Carter
www.verbalink.com Page 7 of 23
we get compensated for that. So it’s something that I’m sure you can look on DOE’s website for more detail on things like that. And actually, oddly enough, you can get right back to budgeting again with your TOU meter data. If you’re tracking this stuff in real-time – you know, for Boston our distribution charges on our electricity accounts, they can make up as much as three-quarters of our distribution bill, that once a month, you know, peak. So if you’re tracking your peak demand every month, you can have a pretty good idea what your bill is going to look like. And it’s also the easiest way to reduce your bill since so much of the charge is built up on that once a month demand. Next slide, please. So for the City of Boston we actually had an interesting process play out where through competitive solicitation we ended up segmenting our energy data management based on the two sources I mentioned to you earlier. So we have worked with a vendor to basically take in our incoming electric account and gas account bills every month. And I think in total we’re close to 4,000 accounts that we’re paying every month. And we are paying a vendor to essentially review these charges, make sure that they’re accurate, and issue a report to our auditing department that we then use to pay off our bill every month. So they’re telling us what charges are good to pay and what charges we should have a little bit more review with the utility company or supplier before paying. And through this more close analysis of it we have been able to pick up over a million dollars in errors and credits in our bill. And this was in the first 18-some-odd months of a contract we had with this vendor who is auditing our bills. And just the return on paying a little bit closer attention to it has been immense. I pulled out a number here. It’s a little bit over a 400 percent return on investment for what we got out of just paying a little bit closer attention to the charges that we were accruing every month. Next slide, please. Now this is something that I don’t think has come up with other organizations that we’ve spoken to very much. But this is something the City of Boston found to be an innovative strategy in that for our time of use metering data, we actually had a lot of different sources of that kind of data out there already through one-off pilot projects or when we enrolled in a demand response program we got time of use metering installed. And what kept happening was each meter that we got installed through whatever program it was ended up having its own proprietary software and its own menu that a building engineer would have to navigate its way through in order to actually view the data. Which if you’re

2018-04-03 15.00 Taking Control Page 8 of 23 Adam Guzzo, Adam Jacobs, Mark Campbell, Andrew Carter
www.verbalink.com Page 8 of 23
working in an operations-based environment, you’re not really sitting down in front of your computer all the time. You might not have time to remember that username, that password, that login and how to navigate your way through the menu. So what we actually did was take the raw data from all of these meters and through working with our Department of Innovation and Technology, essentially our IT department for the City of Boston, we used an existing dashboard and analytics tool called Tableau to create pretty much custom dashboards. So if you look at either of these, these are mobile-app optimized visualizations that are interactive. You can click on any of these at any time and see what the load was for the last two days. And we custom branded all the coloring with the City of Boston and Boston Public Library color schemes. So it makes it feel like a little bit more of an official internal document. Next slide, please. Sorry, my computer might be frozen here. Oh, there we go. So we’ve used this same application for a number of different problems that have come up, or challenges rather. So over the last winter the City of Boston City Hall Plaza was host to a winter garden where there’s an ice rink out on the plaza. And we had to monitor the electric load for this plaza event. So this is another dashboard that we put together to monitor both City Hall’s electric load as well as the load that was being contributed from the ice rink out on the plaza. Next slide, please. And I have yet to see an organization that can put something like this together, which was a really custom application where we had real-time data on the performance of a number of combined heat and power generators. And we wanted to put that data into a similar dashboard that would monitor the first law efficiency of the units. So here I can track in basically track the efficiency of our cogen units and work with our facilities teams to identify whether or not it makes sense to continue running the units once we get into the spring or shoulder seasons. Next slide, please. And this might only be applicable for public entities. But any organization that wants to be more transparent about all of their energy consumption and emissions data. We post all of these data sets to Analyze Boston, which is the City of Boston’s open data portal. So anyone can go in and download any of this data. We have our own visualizations for internal use. But if anyone is interested in checking out this data, it’s all available to the public. And I know it’s good for sharing data with vendors who might want to do business with the city, as well as academic and research

2018-04-03 15.00 Taking Control Page 9 of 23 Adam Guzzo, Adam Jacobs, Mark Campbell, Andrew Carter
www.verbalink.com Page 9 of 23
institutions that want to have real-world data to do any sort of research or analysis. And I think I have just one last slide here. I know I’m over time. Next slide, please. I guess this is just a notes on working with outside vendors for energy management problems. And I just wanted to highlight that in the acronym software as a service, SAAS, I really like to focus on the service side of things. So when we went out to do our procurement, we really wanted to find a valuable service that was delivered via software, not just a software tool that we expected to fix our problems for us. And this last one is my last slide and I’ll just jump right through it. So just a couple closing notes. That Tableau license that we had for that business analytics tool, that was an existing license. The city didn’t need to spend any money on it. So looking at what tools you have at your _____ before you go out and buy new ones is always a good piece of advice. When I did the stakeholder assessment of what we needed out of a bill management system, I definitely made it a point to identify problems and challenges other departments were having and how the work that we were doing could help solve those problems. So make your tool a solution to other department’s problems, especially if that department pays the bills. Our budget office really appreciates the close attention we’re paying to this data and what we are getting out of it. And the last thing – I’ll just skip this one – is to pay attention to the staffing part of RFP bid responses. You know, are you getting people who can help you out with your energy data challenges? Are they software engineers or are they energy experts who are deep within the industry and know that challenges you might be facing? Sorry, I went a little over on time there.
Adam Guzzo: Thank you, Adam. Yeah, that was really insightful and I appreciate
you sharing those valuable insights with the group. Next slide. Next we’ll hear from Mark Campbell from MGM Resorts International. Mark?
Mark Campbell: Good afternoon. Thanks for having me on the webinar today. You
can go ahead and go to the next slide, please. I would like to give a little background on MGM Resorts International, talk numbers here for a minute.
2018-04-03 15.00 Taking Control Page 10 of 23 Adam Guzzo, Adam Jacobs, Mark Campbell, Andrew Carter
www.verbalink.com Page 10 of 23
So we have 27 hotel offerings across the country. In Las Vegas alone 740 acres and about 48,000 guest rooms. So I’ll give you some of that scale. Many restaurants, energy-intensive areas. And 77,000 employees. We have an ever-growing amount of convention space here in Las Vegas in particular. And so with all those numbers, we have a large, albeit shrinking amount of energy consumption – hopefully, if I do my job right – of over 1.1 million megawatt hours per year. So just seeing that kind of scale necessitates looking at energy data and managing it appropriately. Go ahead to the next slide, please.
So we’re going to go over three areas here about how we do things
at MGM. And the first one is really looking at our employees. In many ways as a sustainability division that I’m part of, we’re consultants, internal consultants to MGM. And we start at our employees. We have a program that’s a web-based program. I’m going to talk about a little bit how we educate and engage our employees. Also going to talk about how we manage our real energy data, similar to what Adam was just talking about, and how we distribute that information to more relevant parties, facilities, finance, and such. And then finally we’re going to talk about how you can build on successes to drive looking at energy up to the executive level.
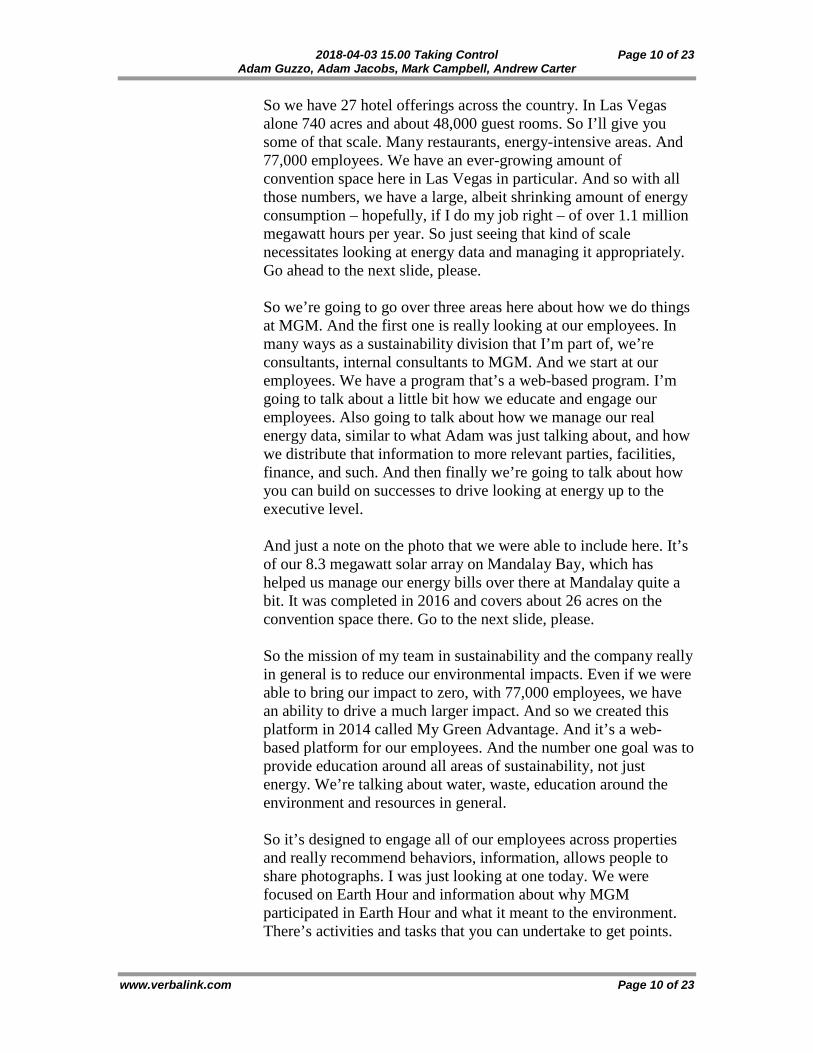
And just a note on the photo that we were able to include here. It’s
of our 8.3 megawatt solar array on Mandalay Bay, which has helped us manage our energy bills over there at Mandalay quite a bit. It was completed in 2016 and covers about 26 acres on the convention space there. Go to the next slide, please.
So the mission of my team in sustainability and the company really
in general is to reduce our environmental impacts. Even if we were able to bring our impact to zero, with 77,000 employees, we have an ability to drive a much larger impact. And so we created this platform in 2014 called My Green Advantage. And it’s a web-based platform for our employees. And the number one goal was to provide education around all areas of sustainability, not just energy. We’re talking about water, waste, education around the environment and resources in general.
So it’s designed to engage all of our employees across properties
and really recommend behaviors, information, allows people to share photographs. I was just looking at one today. We were focused on Earth Hour and information about why MGM participated in Earth Hour and what it meant to the environment. There’s activities and tasks that you can undertake to get points.

2018-04-03 15.00 Taking Control Page 11 of 23 Adam Guzzo, Adam Jacobs, Mark Campbell, Andrew Carter
www.verbalink.com Page 11 of 23
And what we found with this tool was what we thought was going to be an educational platform turned into a much more robust engagement platform with our employees. So if you could go to the next slide, please?
The flow here is just basically to say that what we learned was we
could create some pretty friendly competition – mostly friendly competition – between both teams of properties and groups, but also down to the employee level within those groups. And so this is a snapshot of what our last 30 days would look like in terms of points accumulated by staff members. And you can go from a little action such as turning off the lights before you leave the office, which might get you five points, up to doing something at home like installing solar, which might give you hundreds of points. And it’s all on the honor system, but it’s quite fun.
So we have over 20,000 of our employees have become part of this
platform. It’s driven all sorts of innovative actions. I’ve got a photo here of an on-site operation, growing produce at our property in Detroit, MGM Grand Detroit. And then we are able to track what those impacts are. And you can see we’ve achieved over 5 million actions since 2014. Many points earned. And we translate that into what these things mean in terms of kilowatt hours, tress, and other things. And yet interestingly we track our energy savings in seconds, which I had to do some math there just to make sense to myself. That’s about 32 hours powering New York City. So we can go to the next slide.
So moving from engagement with our large employee base down
to looking at our more granular energy data, we have a goal to use as little energy as possible without impacting our guest experience. Obviously as an entertainment and hospitality company, we’ve got to keep everybody happy. And so our group has been dedicated to selecting data similar to what Adam mentioned; utility billing, processing that data, trying to make sense of where we need to prioritize our work. But we also look at pretty detailed building data as well.
And so in the past we would go through what would be a typical
billing and review and payable process to where we would deliver an energy report on a monthly basis to a property, but it would be two, three months behind. That makes it difficult to find those granular events that might set your demand peak or big spikes, something runaway or being overridden. So over the last couple of years we’ve been able to use different types of software and a couple of vendors to get to the point where we have more real-time

2018-04-03 15.00 Taking Control Page 12 of 23 Adam Guzzo, Adam Jacobs, Mark Campbell, Andrew Carter
www.verbalink.com Page 12 of 23
energy data, both going to our division as well as vice presidents of facilities and others.
And then for us it’s critical to look at how the building is doing
itself in order to find these things. And so we’ve had building management systems that were installed when many of our buildings were built that were legacy and fundamentally had very little storage of data. And so we’ve made a large push into starting with collecting data, the most relevant data being submetering and data points around our largest energy areas, such as our central plants, both heating and cooling plants. And again, working with our stakeholders to understand what data is important to them and then following that up with upgrading our building management systems to other parts of the building.
And just to give you some perspective, in Las Vegas we are
looking at over 60 utility meters. We’ve submitted a couple hundred loads underneath those meters. And we’re looking at about 30-plus gas meters as well. We have a lot of data to look through. And bringing that data into more real-time view has been a great jump for us. Go to the next slide, please.
So the essence of what we’re talking about on this slide is just that
data can drive projects and it’s driven projects for us in the past even when we were looking at months-old energy data, and it continues to do so now that we are in more real-time type situations.
So I’ve got a picture here of a pressure independent control valve
and some of the data. And we had a property that had a significant drop in energy consumption. We didn’t know why. We asked the property and they said oh, we put in 30 of these large pressure independent valves on air handlers. And we’re saving a lot of chilled water, and that’s cascading back to our central plant.
And so we were able to verify that and through that data we ended
up rolling out that project to seven additional properties, performed measurement and verification. We’ve reduce in some cases the run time of an entire chiller for a year by reducing energy demand from our air handlers.
And pilot testing or testing of new products is something that every
one of our properties is very interested in doing. And so that’s another sort of friendly competition environment that we’ve built where our properties enjoy being the first one to do something.

2018-04-03 15.00 Taking Control Page 13 of 23 Adam Guzzo, Adam Jacobs, Mark Campbell, Andrew Carter
www.verbalink.com Page 13 of 23
And we encourage that and work with them to measure things like that.
We also have a maintenance contract on our chillers. And by
submetering our chillers and bringing that data in and running reports on it, we are able to hold that company accountable for proper functioning of our equipment. That’s part of our deal with them. And so we are able to carry that thought process to other areas of the business as well.
And then finally we are able to do measurement verification. So
I’ve got a sort of generic graph here. But this is real data for 2017. One of our buildings got a major upgrade in the control system in the central plant along with VFD on chillers and enabling heat exchangers for the use of free cooling. You can see red being baseline, blue being predicted, and green being actual energy consumption by month for that property. And this property has become the absolute sales pitch test case for our group when it comes to doing upgrades across the properties for control systems and such. Go to the next page, please.
We talked about building data and data points. Brought a real
specific example here of what we’re doing at the Bellagio. And this is across our portfolio really that started here. And so worked with the property to understand what type of data is most critical to them when they’re running the building and what do they want to know now. And so we’ve got a look here at four major points that they want to know when they look at our software. And so this data analytics platform at this point has over 100,000 points from across our properties. We’re using it to track things like you see here, but we’re also tracking issues with equipment that might require maintenance. And we’re also tracking overrides on equipment. And that’s become something that has been a great feedback loop with our properties. So we’ll give them a report in the morning that says here are all the points that were overridden, here’s how long they were overridden. And they take that every morning and run through it and look at what they can change. And if there’s something that is fundamentally always overridden, we dig into that a little deeper.
Finally, I mentioned central plant. We’ve really focused on the
efficiency of our central plants. And so we can track that number down to the interval of I think about every five minutes on this graph. Go to the next slide, please.

2018-04-03 15.00 Taking Control Page 14 of 23 Adam Guzzo, Adam Jacobs, Mark Campbell, Andrew Carter
www.verbalink.com Page 14 of 23
So bringing this back to the corporate sort of culture. We’ve got an employee base that’s become engaged. We’ve got leadership that encourages principles of all of our CSR pillars across the company. But sustainability is a major one. And we have groups at each property that are dedicated to looking at sustainability and coming up with ideas. We’ve gotten quite a few ideas that have spread across our company.
And I came across this quote last week. It’s attributed to several
different people. And I’m particularly interested in the last half, which is that not everything that can be counted counts. I am reporting to a CFO as the leader of our sustainability division. And her mentality is that we want to avoid having too much “dumb” data, if you will. And so we really try to dial in on what’s important and take action on that. And the results of successes and data and delivering the data to the right people has gotten to the top of the company. And so MGM executives have set goals. In 2017 it was a goal for all of our properties to do LED retrofits in complete, all front-of-house non-specialty areas. We’ve actually gotten up to the point of 1.4 million LEDs installed into this year, in 2018. And it goes to the level of having KPIs on energy and energy-related tasks that are tied to bonuses. And so it creates a loop of engagement and also motivation. But everybody is very proud of these projects and these results. And with that I’ll wrap up my presentation. Thank you.
Adam Guzzo: Thanks, Mark. That was fantastic. Before I turn it over to Andrew,
just a quick reminder to send any questions you may have through the webinar chat box. We’ve already got a bunch, but continue to do that and we’ll collect those and address them during the Q&A period at the end of the session.
So our final speaker is Andrew Carter from the Commonwealth of
Kentucky. Take it away, Andrew. Andrew Carter: Thanks, Adam. Like Adam mentioned earlier, I’m going to be
talking about the Commonwealth’s Energy Management and Control System. If you’re not familiar with EMCS, you can think of us like most other energy management information systems. We are essentially a data project. Data relating to our building operations, energy usage and costs. With one real goal; how do we maintain comfort and reliability in our buildings while reducing the energy consumed and associated costs? Go to the next slide, please. One more. Thank you.

2018-04-03 15.00 Taking Control Page 15 of 23 Adam Guzzo, Adam Jacobs, Mark Campbell, Andrew Carter
www.verbalink.com Page 15 of 23
A little bit of background. The notion of CEMCS came about about ten years ago with house bill 2, which would eventually lead to _____. And that says that we need to report on our energy consumption and expenditures, what savings measures we’ve taken, and how we are doing on said measures. So we brainstormed a web-based enterprise software system that could collect utility information, create outputs to EMAR to pay bills more simply, giving fiscal managers kind of a carrot to use the software. Integrate with building automation systems and act as diagnostic tools to find operational improvements.
So with those goals in mind, we went to work on an RFP in 2010 which was awarded to NORESCO with Interval Data Systems as their subcontractor. We paid for that with our grant money. And if you fast-forward to now, we’ve added about 21 million square feet to the portfolio. We are tracking about $34 million in annual utility costs over 1,350 accounts. But we’re still growing. The goal is to get to 36 million square feet. That’s the footprint of all of the executive cabinet and non-university buildings. If the universities want to join as well, they are more than welcome. But that’s our goal. So next slide. And I would just like to briefly cover some of the tools that we use, some of the projects that we’ve got going on and completed by using the available data. And other projects where just kind of awareness has influenced decisions where in the past it may not have. Next slide. So starting with utilities. Adam Jacobs mentioned earlier utilities is where it all begins, that monthly bill and the information that comes off of it. So you can see here that graph on the top. The bars are your current 12 months. We’ve got a weather-normalized shaded background. And you can see that comparison from then to now. And we’re getting that utility bill data a couple of different ways. Manual entry, like I mentioned earlier. The fiscal managers are entering this information into the system as they pay the bill ideally. And we also get electronic data interchange, EDI, for the utilities that offer that. The big one – and both these guys mentioned this – interval data. Each dot represents a daily kilowatt hour consumption. And so at a glance you’re looking at a year’s worth of data and you can really cleanly see how we’re doing as far as scheduling is concerned. The tan dots are the weekend and your blue dots are your weekdays. So it looks like this building is running a really effective setback

2018-04-03 15.00 Taking Control Page 16 of 23 Adam Guzzo, Adam Jacobs, Mark Campbell, Andrew Carter
www.verbalink.com Page 16 of 23
program and the schedules are all looking really nice. Next slide. Did we switch?
Adam Guzzo: Yeah, we’re on slide 37, Andrew. I think you may want to go back one.
Andrew Carter: I’m sorry. Go back to 36. It’s not showing up on my screen. There
we go. All right. So with the interval data in mind we’re doing the same thing with BAS data. We are pulling in about 200,000 trim points over 130 or 140 buildings. And we’ve got it broken out into several analytics tools that IDS has developed. The first one, the top one, we’re not going to go into deal about this – comfort scores where you can look at every zone on an air handler and pick out zones that don’t look like they’re maintaining comfort within the space. And this is just for during occupied times.
The next one down looks at just run times so you can grade your
schedules. The equipment that is scheduled longer sticks out like a sore thumb as you can see there. We’ve got a lot of ten-hour, 12-hour. And then you jump up to maybe a 16-hour operating load per day.
The next graph down shows damper positions. It’s got a little bit of
green on some of those bars, a little bit of red, but mostly yellow. That means the valves or the dampers are modulating to maintain space temperature. We would really want to look at one if it was pegged all the time, that bar would be red. And that means it’s having trouble maintaining the set point.
And then we’ve got a diagnostics chart down at the bottom. Now
this shows averages for the entire building and then you can use the filters on the right to kind of zoom in to what pieces of equipment you’d like to see. And we’ve got that for primary systems or your hot water or chilled water systems. We’ve got it for air handles, and we’ve got it for our terminal units.
So I would also like to note that these kind of tools would be
incredibly difficult to build in-house without the help of a third party. They bring building expertise, controls expertise, IT and data expertise, all that to the table, which really complements my staff really well.
So with that, I’d like to get into some examples of work that we’ve
done. Talk about three buildings or so and some of the results this has brought about. Next slide.

2018-04-03 15.00 Taking Control Page 17 of 23 Adam Guzzo, Adam Jacobs, Mark Campbell, Andrew Carter
www.verbalink.com Page 17 of 23
This is the Cabinet for Human Resources Building. It’s a little over 300,000 square feet. We’ve been working to lower the pressure in the ductwork while maintaining proper air distribution. So you can see here we’ve been adjusting our static pressure reset from four inches water column to two inches water column. And that provides a dollar savings of up to $46,000 a year. That has kind of been raised back up. Not all the way back to four inches all the time, but we were having some balancing issues that we’re working through.
They’re actually going to be doing a capital project replacing all of
the VAV boxes through the building. And that’s driven by the fault detection program that we have installed in the building automation system. And using the data from that, we can see that most of these VAV boxes, which are nearing the end of their useful – they’re way past their useful life. So that’s kind of driven a large capital project.
We’ve added VABs on the air handlers, the supply fans. There are
four of them. They’re 125 horsepower. Four return fans. I think they were 50 horsepower. We have added _____ to stage those on and off whereas initially three supply fans were running at 80 percent 24/7. And the next thing is revising the schedule from 24/7 down to 12-hour days, six to six.
And so you can see here, this is based on an allocation master metered campus. We actually do have most of these buildings metered now and are working to take in that data and use that instead of the estimate allocations. But for the campus we are showing a savings of about $150,000 a year. Next slide. The Transportation Cabinet Office Building looks pretty and impressive, but the HVAC was a mess in this building. We had an under-the-floor system with not-so-reliable terminal units. And we’ve got a VAV system. The VAVs needed recalibration as well. But these systems kind of fought each other. It’s an open floor space. So one thing that we did and kind of a no-brainer was adjust and make consistent all of the cooling and heating setpoints through the building so that at least we could agree on that. We recalibrated 104 VAV boxes or worked with maintenance to do that. And we revised the schedule from 24/7 to six to six. And these are pretty easy things to do. We’ve got a long list of projects and so I want to highlight a couple. But you can see here that the work is paying off.
2018-04-03 15.00 Taking Control Page 18 of 23 Adam Guzzo, Adam Jacobs, Mark Campbell, Andrew Carter
www.verbalink.com Page 18 of 23
We’ve got about $234,000 a year for this campus, which includes one more building which I’m going to talk about, and then a smaller building which we haven’t done that much work at. Next slide, please. The other building is the Kentucky State Office Building. We have replaced a lot of control valve actuators here. We’ve got VAV boxes that were having trouble maintaining space temperature. So we’ve adjusted that. They’re all working very nicely now. We tried a standby mode as a pilot project on the eighth floor. And we use wireless sensors, occupancy sensors to do that. What we really found was that our schedules were pretty tight with the occupancy of the building. So we’re going to try the sensors down on the first floor where they’ve got some classrooms and auditorium space. So this is another component of that $234,000 annual savings. And we’re getting about a hundred here. So that’s not too bad. Next slide, please. Tracking the projects. The IDS operational reviews were really providing us a lot of good recommendations. So last year we got together and built a project tracking tool that’s integrated with our EMIS. We’ve got 838 projects on here as of Friday. And we’ve also got that linked to our trend data so that we can pull trends, flag the projects that we’ve completed, and hopefully show where that has made a difference in the operation of whatever device or piece of equipment of setpoint that we’re looking at. Next slide, please. And while tracking all this information, we’ve found a commonality. A lot of these issues are kind of controls related. Some of them are sequence related. And so we’re starting to on new constructions review the sequences of operations from the engineer to make sure that it’s clear enough to get their point across to the controls vendor, who then doesn’t have to get creative when they’re working on a new building. So this is an example of a $220 million renovation for the Kentucky International Convention Center. We’ve reviewed the engineer drawings. And so the next step is to review the control sequences whenever they’re done _____. Next slide, please. And then these are projects that my division is not necessarily doing, but our sister division, Engineering and Contracting Administration, does all the capital projects and construction projects for the state. So we’ve got just a few things here. Central lab, boiler replacement project. Normally in the past we would

2018-04-03 15.00 Taking Control Page 19 of 23 Adam Guzzo, Adam Jacobs, Mark Campbell, Andrew Carter
www.verbalink.com Page 19 of 23
have just RFP’d it out and gone with the cheapest bid. Now I think because we talk about it so much within this building, it’s kind of put an emphasis on reducing operating costs and energy costs. So they’re making different decisions. Same with the Capital Plaza Tower Complex. The tower on the left is no longer standing. It’s going to be replaced by a building similar to the one we have on the right. The construction versus renovation was about the same. The operating costs should be about a third of what it was before. Normally I’m not really an advocate of tearing down a building. But apparently with all the factors in play, that was really the way to go. And then the gas procurement contract. We pre-purchase our gas for four of our largest sites. We pre-purchase it in the spring at a really cheap rate and it provides savings on our gas costs in the wintertime. So this fiscal year we’ve saved about $170,000 just by purchasing that gas in advance from a third party. Next slide.
Adam Guzzo: And Andrew, if you could wrap up here shortly. We need to move to the Q&A period. Appreciate it.
Andrew Carter: Sure thing. So this is my last slide with content on it. Just wanted
to show that all of this summed together, looking at the data, making changes to the buildings when we need to, get the word out there and affecting decisions that are made on other projects and equipment replacements really save a lot of money. So for the total portfolio we’re looking at an annual savings of about $5.8 million right now. And of course in the future we hope to see that number go up. Next slide.
And this is a snapshot of the dashboard homepage. It’s public-
facing. It shows monthly energy data for all the buildings that we have turned on to report to the dashboard. So if you have some time, please stop by _____. And with that, I think the next slide is – thank you. Thank you for everyone’s time today.
Adam Guzzo: Thanks Andrew. That was a great way to wrap things up. So the
next slide please. Just some additional resources. That was a lot of great content. And if you want to learn more – I won’t go through these in detail for the sake of time. But there’s a fact sheet on the Energy Data Management Guide that I talked about, as well as some success stories on Boston and MGM and Kentucky and some more details about some of the things that they’re doing. So I would encourage you, all of these resources are linked. So I would encourage you to take a look at these at your convenience. Next slide, please.

2018-04-03 15.00 Taking Control Page 20 of 23 Adam Guzzo, Adam Jacobs, Mark Campbell, Andrew Carter
www.verbalink.com Page 20 of 23
So we will go now into the Q&A portion. And we will probably –
we are at 3:55, so we will take about ten minutes to do the Q&A for those who can stick around. We’ll go a little over our time. And then we’ll wrap up.
So there are a few questions from the audience about the types of
vendors that our panelists use for their various systems. For the sake of time, I’ll ask that those folks follow up directly with our presenters about that. Their contact information will be provided at the end of the presentation.
So I’ll start with just a general question for the whole group. And
maybe a couple of you guys can jump in. Let’s see. There’s a question here about how you get buy-in. So especially if there’s not like a fiscal or an actual dollar incentive, how you guys have been able to get buy-in from leadership to really implement some of these activities and really implement energy data management across your organizations. And if maybe each of you wants to answer that one quickly.
Adam Jacobs: Sure. This is Adam. I’ll start off. I work out of the City of Boston’s
environment department. But when I did my stakeholder needs assessment for what energy management tools we needed, I really took that to heart that it was something that needed to be more valuable than just what the environment department needed. So I spoke to multiple people within our budget office, our auditing office, and our IT department to do a full stakeholder assessment so that I made sure what we put into the scope of work for RFP encompassed everyone’s concerns. And that really helped with buy-in. Because now that we’re up-and-running, everyone had a part in crafting what we ultimately went out and purchased.
Mark Campbell: This is Mark. I can speak to it as well. And I think we may be a
little bit different in the sense that the sustainability division at MGM has been around for going on 11 or 12 years. So it was something that became an imperative and really was driven by the leadership of our company. And so the folks that were the first movers in our company were able to – there was a lot of low-hanging fruit, let’s put it that way. And they delivered projects that had better ROIs than just about anything we were doing as a company. And so that was able to lay the foundation for okay, when they vet a project, when they deliver a project, it has success and we’ll listen when they come.

2018-04-03 15.00 Taking Control Page 21 of 23 Adam Guzzo, Adam Jacobs, Mark Campbell, Andrew Carter
www.verbalink.com Page 21 of 23
Adam Guzzo: Great. Thanks to you both. So anther question if you guys want to jump in on this one. About really tracking avoided costs versus true savings. And so how do you do that cost allocation? And the purpose being so that management understands the true total savings from, as this person worded it, proactive energy management. Do you guys want to speak to that?
Mark Campbell: This is Mark. I can jump in a little bit. We go through it a couple
different ways. It’s kind of interesting. You can think about it in the sense of how some utilities do their energy programs where some of the benefits are very clear. We’re talking about LEDs, talking about the way things are used on a regular schedule. But we’ve done some of the larger projects that seemed to be a little more obscure when it comes to measuring them. We’ve added into the budget to do measurement and verification simply because we looked at it as a little bit of a long-term play across the company. I’ve been on both sides of doing M&V, as a customer and as a provider. And there’s a budget you need to have for it, but you also have to understand you have limits when you can measure things. So where you have large scale projects that can hit any type of meter or submeter, it’s usually worth it to include an M&V budget and possibly include metering as a part of the budget.
Adam Guzzo: Thanks, Mark. Go ahead, Adam. Adam Jacobs: I guess just to add on to that. Everything that Mark is talking about
with regard to energy conservation, I would echo that. But the other point that I would just draw back to part of what I was presenting is the $1.2 million that we’ve found through errors in our utility bills across the 4,000 some-odd accounts. Those were checks that we had cut back to the city directly for whatever we were owed. So there is this sort of illiquidness of tracking energy conservation by better auditing and tracking the bills themselves. And you can just find very real dollars that will go back into your budget that does allow your organization to do more. So there’s both sides, both by tracking and managing it, and then also the conservation side of things obviously. You’ve got to build up the business case through M&V.
Andrew Carter: Absolutely. I had a very small corrections building last summer.
It’s about a 2,200 square foot building. So it’s like the size of a house. And they had a $1,200 a month utility bill just because they were on the wrong rate. So they were getting a demand charge. And of course it was a minimum demand charge because they weren’t creating enough demand to do anything. And so once we

2018-04-03 15.00 Taking Control Page 22 of 23 Adam Guzzo, Adam Jacobs, Mark Campbell, Andrew Carter
www.verbalink.com Page 22 of 23
got them off that rate, it was a $700 a month savings, easy. So I mean, yeah, that just echoes his point.
Adam Guzzo: Any other examples, Mark, similar to that that you want to share,
like real examples of those kinds of errors that were identified and savings that resulted from that or returned funds if you will?
Adam Jacobs: Yes. One of the large ones that we had was after we did a pretty
large-scale renovation of our central library. We had a new meter installed on the new switchgear. And the utility company never removed the old meter. So we were being billed on the same usage basically twice. And by analyzing bills and realizing we’re not consuming twice as much as we were last year, you know, the library is back up and open. But we’re definitely not consuming nearly that much. It sort of created red flags for us. And then once we finally went through the process and identified it, they had been billing us basically double for six months on one of the largest facilities the city owns. So it was definitely showing up in the budget and we’re thrilled to be able to identify and recover those funds.
Adam Guzzo: That’s great. Mark Campbell: And you asked me to weigh in. Having been at MGM for almost
three years, I have to give a credit to another gentleman in our group named Henry Shields who has been all over our energy billing for quite some time. So in my time we haven’t had that issue. But I’m sure he solved many of those before me.
Adam Guzzo: And I’ve heard plenty of cases where that is that case. And we’ve
got some examples of that in our Energy Data Management Guide as well. So those often don’t get talked about enough. But obviously those are significant cost savings that come from that.
So a little bit different subject here, but there’s a few questions for
each of you along the lines of capacity and staffing. So Adam, I’ll start with you. And question about if you don’t have a full-time energy manager and municipality but you’ve got volunteers, how do you focus their time on the most valuable – what’s the most valuable use of their time and kind of how do you get them started and where would you put their energies into this kind of effort?
Adam Jacobs: Sure. So I guess some of that you’ve got to put back and do some
soul-searching there as to what are your priorities. If your goal is to reduce your energy consumption and greenhouse gas emissions, then if you’re working with a part-time staffer or volunteers, I

2018-04-03 15.00 Taking Control Page 23 of 23 Adam Guzzo, Adam Jacobs, Mark Campbell, Andrew Carter
www.verbalink.com Page 23 of 23
would focus on your largest buildings first. So your city hall, your high school if you’re a small municipality. But if you do have a little bit more time and you’re looking at, like Mark said, the long haul here, I would recommend just doing a very thorough baseline exercise where you collect all of the utility bills –
[End of Audio]