![Bases Bases Bases Bases Bases Bases Bases Bases Bases ......Hair loss or alopecia is a problem in modern society, which is usually related to hair loss on the scalp [1]. The most common](https://static.fdocuments.us/doc/165x107/5f692ed64ffcd531a566bfdf/bases-bases-bases-bases-bases-bases-bases-bases-bases-hair-loss-or-alopecia.jpg)
Army Study Program Indigenous Construction Materials for ... · Wood-frame construction is the...
155
ERDC TR-13-13 Army Study Program Indigenous Construction Materials for Theater Facilities Engineer Research and Development Center Ghassan Al-Chaar, Lucy A. Whalley, Jonathan T. Beckstrom, H. Garth Anderson, Rosa T. Affleck, Meredith Carr, and Jennifer S. Macpherson September 2013 Approved for public release; distribution is unlimited.
-
Upload
truongkhanh -
Category
Documents
-
view
216 -
download
0
Transcript of Army Study Program Indigenous Construction Materials for ... · Wood-frame construction is the...
ERD
C TR
-13
-13
Army Study Program
Indigenous Construction Materials for Theater Facilities
En
gin
eer
Res
earc
h a
nd
D
evel
opm
ent
Cen
ter
Ghassan Al-Chaar, Lucy A. Whalley, Jonathan T. Beckstrom, H. Garth Anderson, Rosa T. Affleck, Meredith Carr, and Jennifer S. Macpherson
September 2013
Approved for public release; distribution is unlimited.
The US Army Engineer Research and Development Center (ERDC) solves the nation’s toughest engineering and environmental challenges. ERDC develops innovative solutions in civil and military engineering, geospatial sciences, water resources, and environmental sciences for the Army, the Department of Defense, civilian agencies, and our nation’s public good. Find out more at www.erdc.usace.army.mil.
To search for other technical reports published by ERDC, visit the ERDC online library at http://acwc.sdp.sirsi.net/client/default.
Army Study Program ERDC TR-13-13 September 2013
Indigenous Construction Materials for Theater Facilities
Ghassan Al-Chaar, Lucy A. Whalley, Jonathan T. Beckstrom, and H. Garth Anderson, Construction Engineering Research Laboratory US Army Engineer Research and Development Center 2902 Newmark Drive Champaign, IL 61822
Rosa T. Affleck, Meredith Carr, and Jennifer S. Macpherson Cold Regions Research and Engineering Laboratory US Army Engineer Research and Development Center 72 Lyme Road Hanover, NH 03755-1290
Final report
Approved for public release; distribution is unlimited.
Prepared for US Army Corps of Engineers Washington, DC 20314-1000
Under Army Study #4, “Indigenous Construction Materials for Theater Facilities”
ERDC TR-13-13 ii
Abstract
Wood-frame construction is the principal construction method for US Ar-my Forward Operating Bases (FOBs). Typical FOBs are located where there is no ready access to commercial-grade construction materials. Be-cause materials must be transported to FOBs by cargo aircraft and convoy, construction is expensive and often hazardous. The authors investigated ways to minimize FOB construction logistical burdens through increased usage of indigenous construction materials (ICMs). The objective was to develop a tool capable of using quantitative data to help decision makers determine the practicality of using ICMs to build FOB facilities during contingency operations, humanitarian assistance, or reconstruction ef-forts.
This report documents a decision-support tool called the Indigenity Index, which was developed to provide a standardized procedure and criteria for selecting the most feasible solutions for housing personnel in FOBs. Indigenity ranking metrics address constructed quality, mission-sustainment capability, life-cycle cost-effectiveness, and others. The tool is driven by data specified to provide information about key criteria and an algorithm for processing those data. The result is an overall Indigenity In-dex value that indicates the relative indigenity of competing construction approaches. The report includes an experimental application of the Indigenity Index algorithm to a hypothetical case study using data relevant to South Sudan.
DISCLAIMER: The contents of this report are not to be used for advertising, publication, or promotional purposes. Citation of trade names does not constitute an official endorsement or approval of the use of such commercial products. All product names and trademarks cited are the property of their respective owners. The findings of this report are not to be construed as an official Department of the Army position unless so designated by other authorized documents.
DESTROY THIS REPORT WHEN NO LONGER NEEDED. DO NOT RETURN IT TO THE ORIGINATOR.
ERDC TR-13-13 iii
Contents Abstract .................................................................................................................................... ii
Figures and Tables .................................................................................................................. vi
Preface ...................................................................................................................................viii
Unit Conversion Factors ........................................................................................................ ix
1 Introduction ...................................................................................................................... 1 1.1 Background ........................................................................................................ 1 1.2 Objectives ........................................................................................................... 2 1.3 Approach ............................................................................................................ 3 1.4 Mode of technology transfer ............................................................................. 3
2 Conceptual Framework ................................................................................................... 4 2.1 Overview ............................................................................................................. 4 2.2 Current FOB construction practice ................................................................... 6 2.3 Sustainability defined ........................................................................................ 8 2.4 Indigenous materials and methods .................................................................. 8 2.5 Input variables ................................................................................................. 10 2.6 Variable mapping .............................................................................................11 2.7 Life-cycle cost factors ..................................................................................... 12 2.8 Optimizing solutions for specific FOB location ............................................... 14
3 Ranking Metrics ............................................................................................................. 18 3.1 Material factor .................................................................................................19 3.2 Transportation factor ....................................................................................... 21 3.3 Construction factor ......................................................................................... 23 3.4 Functionality factor ......................................................................................... 28 3.5 Disposal factor ................................................................................................ 30
4 Structural and Constructability Characteristics ........................................................ 32 4.1 Required structural properties ....................................................................... 32 4.2 Conventional systems researched ................................................................. 33
4.2.1 B-Hut .......................................................................................................................... 33 4.2.2 Concrete masonry units and brick ........................................................................... 34 4.2.3 Mortarless masonry .................................................................................................. 36 4.2.4 K-Span ....................................................................................................................... 37 4.2.5 Containerized housing units (CHU) .......................................................................... 38 4.2.6 Foam .......................................................................................................................... 40 4.2.7 Shotcrete ................................................................................................................... 40
4.3 Indigenous systems researched ..................................................................... 41
ERDC TR-13-13 iv
4.3.1 Adobe ......................................................................................................................... 41 4.3.2 Compressed-earth block ........................................................................................... 47 4.3.3 Hesco bastion............................................................................................................ 54
4.4 Construction and testing standards ............................................................... 57
5 The South Sudan Case Study ........................................................................................ 60 5.1 Economy ........................................................................................................... 61 5.2 Climate ............................................................................................................. 61
5.2.1 Precipitation .............................................................................................................. 62 5.2.1 Temperature .............................................................................................................. 62 5.2.2 Wind ........................................................................................................................... 64
5.3 Environmental and resources characterization ............................................ 64 5.3.1 Tir ............................................................................................................................... 64 5.3.2 Raga ........................................................................................................................... 65 5.3.3 Juba ........................................................................................................................... 66 5.3.4 Boma.......................................................................................................................... 67
5.4 Material factor ................................................................................................ 68 5.4.1 Natural resources ..................................................................................................... 68 5.4.2 South Sudan characteristics .................................................................................... 69 5.4.3 Case study results ..................................................................................................... 69
5.5 Transportation factor ...................................................................................... 70 5.5.1 Land transportation .................................................................................................. 71 5.5.2 Air transportation ...................................................................................................... 72 5.5.3 Water transportation ................................................................................................. 72 5.5.4 Checkpoints and fees ............................................................................................... 73 5.5.5 Case study results ..................................................................................................... 74
5.6 Construction factor .......................................................................................... 76 5.6.1 Location ..................................................................................................................... 76 5.6.2 Construction permits ................................................................................................ 77 5.6.3 Registering property.................................................................................................. 77 5.6.4 Labor .......................................................................................................................... 77 5.6.5 Existing housing ........................................................................................................ 80 5.6.6 Case study results ..................................................................................................... 80
5.7 Functionality factor ......................................................................................... 82 5.7.1 Water service in South Sudan .................................................................................. 82 5.7.2 Power service in South Sudan .................................................................................. 83 5.7.3 Case study results ..................................................................................................... 84
5.8 Disposal factor ................................................................................................. 87 5.8.1 South Sudan methods and characteristics ............................................................. 87 5.8.2 Case study results ..................................................................................................... 88
5.9 Overall Indigenity Index .................................................................................. 89
6 Conclusions and Recommendations ........................................................................... 92 6.1 Conclusions ..................................................................................................... 92 6.2 Recommendations ......................................................................................... 93
ERDC TR-13-13 v
References ............................................................................................................................. 95
Appendix A: Design Constraints and Requirements for Algorithm Inputs .................... 99
Appendix B: Calculations and Parameters for Indigenity Index Factors .................... 108
Appendix C: Case Study Calculations ............................................................................. 113
Appendix D: Critical Qualitative Features of Military Semipermanent Buildings...... 129
Appendix E: Geospatial Maps ........................................................................................... 131
Report Documentation Page
ERDC TR-13-13 vi
Figures and Tables
Figures
Figure 1. Infrastructure planning. ................................................................................................ 5 Figure 2. Conceptual framework. ................................................................................................ 6 Figure 3. Military base camps in Iraq. ......................................................................................... 7 Figure 4. Maps and databases. ................................................................................................. 11 Figure 5. Life-cycle cost breakdown. ......................................................................................... 13 Figure 6. Example of transportation factor variables. ............................................................ 14 Figure 7. Determining material usefulness. ............................................................................. 15 Figure 8. Interaction of qualitative features. ............................................................................ 16 Figure 9. Indigenity Index breakdown. ...................................................................................... 18 Figure 10. Material factor scores. .............................................................................................. 20 Figure 11. Typical wood-frame B-Hut. ....................................................................................... 33 Figure 12. Example of conventional CMU construction. ........................................................ 34 Figure 13. Traditional brick and mortar construction (Brice Blondel). ................................. 35 Figure 14. Interlocking mortarless masonry bricks (Dujon Fernandes). .............................. 36 Figure 15. Typical military K-span structure (US Marines). .................................................... 37 Figure 16. CHUs at Camp Lemonier in Africa (Kristin McHugh/Stanley Foundation). ................................................................................................................................. 38 Figure 17. Layout of a two-person CHU. .................................................................................... 39 Figure 18. Example of military foam dome application. ......................................................... 40 Figure 19. Shotcrete placement (WSDOT). .............................................................................. 41 Figure 20. Adobe brick structure. .............................................................................................. 42 Figure 21. Adobe wall system (left) and wall system with roof (right). .................................. 43 Figure 22. Adobe bricks drying (Heinz-Josef Lücking). ........................................................... 46 Figure 23. CEB complete wall and arch system (left). interior arch system (right). ............ 48 Figure 24. Temporary training facility made out of CEBs (Leading Edge Group, Inc). ................................................................................................................................................ 49 Figure 25. CEB ballistics test specimens (Leading Edge Group, Inc.). ................................. 51 Figure 26.The Ziggurat of Ur near the Talil Air Base. .............................................................. 52 Figure 27. The tomb of Puabi, built 2600 BC. .......................................................................... 52 Figure 28. LEGI Series 480 CSBM (LEGI). ................................................................................ 54 Figure 29. Hesco bastion prior to placement and filling (US Army photo). .......................... 54 Figure 30. Filling of HESCO bastions in Iraq (US Army). ......................................................... 57 Figure 31. Typical Iraqi bricks. .................................................................................................... 58 Figure 32. In-plane loading test on Iraqi indigenous brick wall specimen. .......................... 59 Figure 33. Case study locations in South Sudan. ................................................................... 60

ERDC TR-13-13 vii
Figure 34. Monthly average precipitation in Juba (climatemps.com). ................................. 62 Figure 35. Monthly average high and low temperatures in Juba (climatemps.com). ....................................................................................................................... 63 Figure 36. Material factors for the locations in South Sudan. ............................................... 70 Figure 37. Average daily annual traffic in South Sudan (AIDC). ............................................. 71 Figure 38. Transportation factors for the locations in South Sudan. ................................... 76 Figure 39. Construction factors for the locations in South Sudan. ....................................... 82 Figure 40. Sanitation and water supply in South Sudan (Raganathan and Briceño-Garmendia 2011). ......................................................................................................... 83 Figure 41. Functionality factors for locations in South Sudan. .............................................. 87 Figure 42. Disposal factors for locations in South Sudan. ..................................................... 89 Figure 43. Indigenity Index final values. ................................................................................... 90 Figure 44. Transportation map of South Sudan. .................................................................. 131 Figure 45. 1994 Settlement populations map for South Sudan. ...................................... 132 Figure 46. Soil map of South Sudan. ..................................................................................... 133 Figure 47. Distribution of boreholes and wells in South Sudan. ........................................ 134 Figure 48. Coal and power map of South Sudan. ................................................................ 135 Figure 49. Cement plant locations map for South Sudan. ................................................. 136 Figure 50. Daily average temperature map of South Sudan. ............................................. 137 Figure 51. Daily average maximum temperature map of South Sudan............................ 138 Figure 52. Average heat index map of South Sudan. .......................................................... 139 Figure 53. Precipitation map of South Sudan. ..................................................................... 140 Figure 54. Earthquake potential of Africa (USGS). ................................................................141 Figure 55. Detailed city information for Juba, South Sudan. .............................................. 142
Tables
Table 1. Cost of base camps in Iraq. ........................................................................................... 7 Table 2. Traditional and project-specific implications of “indigenous.” .................................. 8 Table 3. Advantages and disadvantages of ICMs. .................................................................... 9 Table 4. Stabilized CEB versus other walling materials (Adam 2001). ................................ 48 Table 5. Cost of CEB versus other masonry units. .................................................................. 51 Table 6. Iraq versus United States brick strengths. ................................................................ 58 Table 7. Heat index ranges (°C) and OSHA recommended measures. ................................ 63 Table 8. Comparison of accessible electricity (Rupa et al. 2011). ........................................84
ERDC TR-13-13 viii
Preface
This study was conducted for the Army Study Program Management Of-fice (ASPMO) under Army Study #4, Project 400246, “Indigenous Con-struction Materials for Theater Facilities.” The study coordinator was Rob-in B. Lambert (CERD-ZC), and the Director of the Army Study Program was Meghan Mariman (ASPMO).
The work was supervised by the Materials and Structures Branch (CF-M) of the Facilities Division (CF), US Army Engineer Research and Develop-ment Center, Construction Engineering Research Laboratory (ERDC-CERL). A portion of the work was performed at the ERDC Cold Regions Research and Engineering Laboratory (ERDC-CRREL), Hanover, NH. At the time of publication, Vicki L. Van Blaricum was Chief, CEERD-CF-M; L. Michael Golish was Chief, CEERD-CF; Alan B. Anderson (CEERD-CV-T) was the Technical Director for Military Ranges & Lands; Kurt Kinnevan (CEERD-CV-T) was the Acting Technical Director for Adaptive and Resili-ent Installations; and Debbie J. Lawrence (CEERD-CV-T) was the Associ-ate Technical Director for Adaptive and Resilient Installations. The Deputy Director of ERDC-CERL was Dr. Kirankumar Topudurti and the Director was Dr. Ilker Adiguzel.
This study was coordinated with BG Peter A. DeLuca, who at the time was Commandant of the US Army Engineer School, Fort Leonard Wood, MO; and James B. Balocki, Chief, Interagency and International Services (CEMP-ZD), Headquarters, US Army Corps of Engineers. The authors gratefully acknowledge their contributions to this research.
To the best of the authors’ ability to confirm, and unless otherwise indicat-ed, photographs used in this report were created by soldiers or govern-ment personnel performing official duties, or are from other public do-main sources such as government documents.
COL Jeffrey R. Eckstein was the Commander of ERDC, and Dr. Jeffery P. Holland was the Director.
ERDC TR-13-13 ix
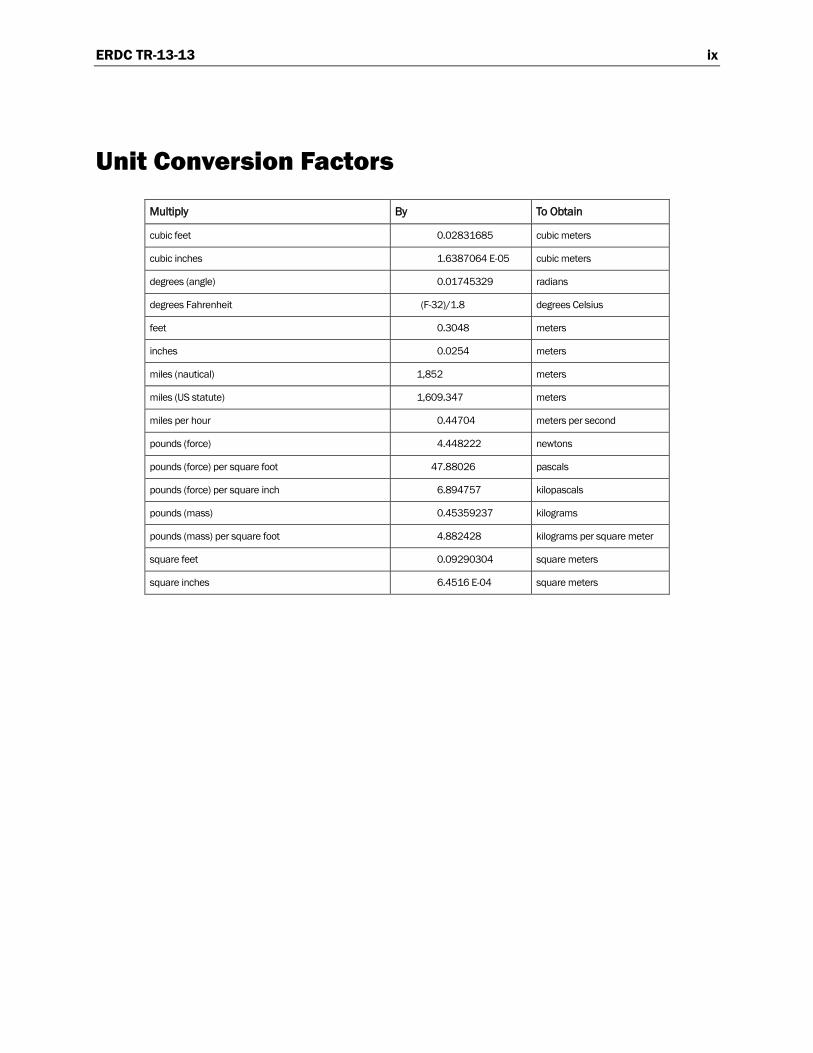
Unit Conversion Factors
Multiply By To Obtain
cubic feet 0.02831685 cubic meters
cubic inches 1.6387064 E-05 cubic meters
degrees (angle) 0.01745329 radians
degrees Fahrenheit (F-32)/1.8 degrees Celsius
feet 0.3048 meters
inches 0.0254 meters
miles (nautical) 1,852 meters
miles (US statute) 1,609.347 meters
miles per hour 0.44704 meters per second
pounds (force) 4.448222 newtons
pounds (force) per square foot 47.88026 pascals
pounds (force) per square inch 6.894757 kilopascals
pounds (mass) 0.45359237 kilograms
pounds (mass) per square foot 4.882428 kilograms per square meter
square feet 0.09290304 square meters
square inches 6.4516 E-04 square meters

ERDC TR-13-13 x
ERDC TR-13-13 1
1 Introduction
1.1 Background
The need to build Forward Operating Bases (FOBs) overseas, particularly in underdeveloped nations, presents significant problems for the US Ar-my. The two principal problems are the high cost of construction and the need to rely on long-distance supply lines that are vulnerable to interrup-tion or attack. FOBs in remote and hostile locations depend at least in part on convoy transportation for critical supplies ranging from motor fuel to the construction materials needed to build housing. The logistical burden created by importing construction supplies can be particularly difficult and costly. FOBs are usually located in regions with little or no access to US-grade commercial construction materials such as lumber and masonry units, so these supplies must be transported in at great cost and potential risk. In some cases, convoys or caravans may even have to serve as tempo-rary mobile contingency bases. Both options are in use today, and both are costly and risky for US military personnel and host-nation partners.
The findings of the 2010 Functional Solutions Analysis for Base Camps for Full Spectrum Operation recommended developing new policies for using materials and techniques indigenous to the location of new FOB facilities. Addressing the same topic, the Assistant Secretary for the Army for Acqui-sition, Logistics, and Technology (ASA (AL&T)) has identified reduction of expeditionary sustainment demands as a major Army science and technol-ogy problem (DoD 2012). These positions reflect a high level of interest in reducing the military resource footprint and decreasing the dependency on exogenous supplies to satisfy contingency mission requirements, including the reduction of fossil fuel demand.
Despite the policy drivers for improving the sustainability of contingency base facilities, the Army Facilities Component System (AFCS) offers pri-marily wood-frame construction designs that were developed for use on conventional military installations in developed areas. The concrete ma-sonry unit (CMU) designs included in the AFCS also were developed for construction on a typical US installation, not an expeditionary base. In many emerging Army areas of operation, the materials needed for wood-frame buildings are scarce or unavailable, so they must be delivered over long distances by truck convoy or air. These modes of delivery are expen-
ERDC TR-13-13 2
sive and often hazardous, and the finished wood structures may be ill suit-ed to the specific area of operations in terms of energy efficiency, durabil-ity, and quality of life for the soldier.
To avoid FOB housing approaches that overburden Army logistical capa-bilities or produce low-quality, low-efficiency, high-cost results, there is a need to explore the mission sustainability benefits of using indigenous construction materials (ICMs), structural systems, and building methods to produce semipermanent structures for contingency operations. The use of ICMs and techniques could significantly decrease the cost of FOB con-struction by reducing the amount of imported materials required. Also, when feasible in specific locales, costs could be lowered further by hiring local laborers experienced with indigenous structural systems, thereby re-ducing the number of US contractors needed onsite. And because indige-nous-type structures are more suitable for local climate extremes (e.g., ex-cessive heat or cold) than wood-frame buildings, energy consumption may be lowered while improving soldier comfort indoors. Finally, indigenous-type construction is culturally suitable for transfer to local populations af-ter the mission concludes, eliminating the cost of demolishing and dispos-ing of temporary wood buildings.
A decision-support tool for planning and designing contingency bases with optimal use of ICMs, methods, and labor would be highly beneficial in helping the Army to implement FOB sustainability policy. Ideally, such a tool would use a metrics-based approach to recommend the optimal use of ICMs and techniques in adapting standard military designs for use in various geographies and climates, including arid and tropical.
1.2 Objectives
The main objective of this study was to develop a prototype metrics-based rating methodology that can help to reduce FOB facility life-cycle costs by identifying indigenous construction materials and methods that can re-duce logistical requirements in any planned area of operation. A subsidi-ary objective of the work was to demonstrate the methodology in a hypo-thetical case study located in South Sudan and ascertain its feasibility for further development.
ERDC TR-13-13 3
1.3 Approach
Evaluation factors for assessing the applicability of ICMs and methods to a given locale will include cost of indigenous materials, the cost and risk of transporting conventional construction materials, local construction labor costs and availability, potential energy-efficiency improvements from us-ing ICMs, durability, and force-protection characteristics.
The research team included experts in sociocultural and human factors, environmental factors, geospatial information, climate, and structural as-sessment. Information was gathered from the technical literature, relevant documents on contingency and humanitarian operations, and construction product marketing materials. This information was then used to develop a uniform structure-rating algorithm based on critical performance metrics for FOB facilities. The algorithm incorporates variables related to facility design and resource availability throughout all mission life-cycle phases.
The algorithm processes all input data to return a quantitative ranking called the Indigenity Index. The structural type that returns the lowest Indigenity Index value represents the most sustainable construction type for the specific region in question.
1.4 Mode of technology transfer
The results of this study are appropriate for follow-on development work that focuses on refinement of methods, enhancement of data sources, and testing of materials and methods that are indigenous to prospective oper-ating areas with different geological and climate characteristics.
With successful development work, the technologies documented in this report should be appropriate to consider for inclusion in criteria docu-ments such as the Unified Facility Criteria (UFC) and the US Army Corps of Engineers Theater Construction Management System (TCMS). Future implementation could also include development of a field design guide to aid in the selection of appropriate construction material and structural types for any prospective area of operations.
ERDC TR-13-13 4
2 Conceptual Framework
This chapter describes a framework for the use of ICMs for sustainable contingency housing in foreign countries. In general, the use of indigenous construction materials and techniques to reduce the logistical burden of providing quality FOB housing is described. Evaluation factors for each material and technique are identified and explained, and a rating system and its variables are introduced. This rating system is applied in a case study (Chapter 5) to determine the most sustainable structural system for South Sudan.
2.1 Overview
As stated in Chapter 1, there is a need to explore alternate structural sys-tems for FOBs that meet minimum military requirements. Base camp managers would greatly benefit from a standardized structural system se-lection procedure to facilitate the acquisition of the highest-value systems feasible in the specific operating area. This type of selection procedure would guide the user through a series of questions and prompts to deter-mine the most cost-effective sustainable indigenous construction system for the FOB.
Geospatial information for the region of interest will be incorporated into this procedure. Much of this information can be found in maps and data-bases, ranging from climate information to the locations of indigenous ma-terials and resources. This information base should also provide local la-bor information, transportation quality and efficiency, and any locally available utilities. The procedure documented in this report uses the quali-tative and quantitative geospatial information from maps of a case study area (i.e., South Sudan) to develop an algorithm that can quantitatively de-termine which type of ICM and method of construction can minimize the life-cycle cost most effectively. This case study will serve as a general pro-cedure that can be replicated for future FOB locations.
In the context of this report, the term infrastructure planning refers to the development of a procedure for choosing ICMs and indigenous construc-tion procedures as well as their implementation in a contingency base and beyond. Infrastructure planning is shown as a step-by-step plan in Figure 1.
ERDC TR-13-13 5
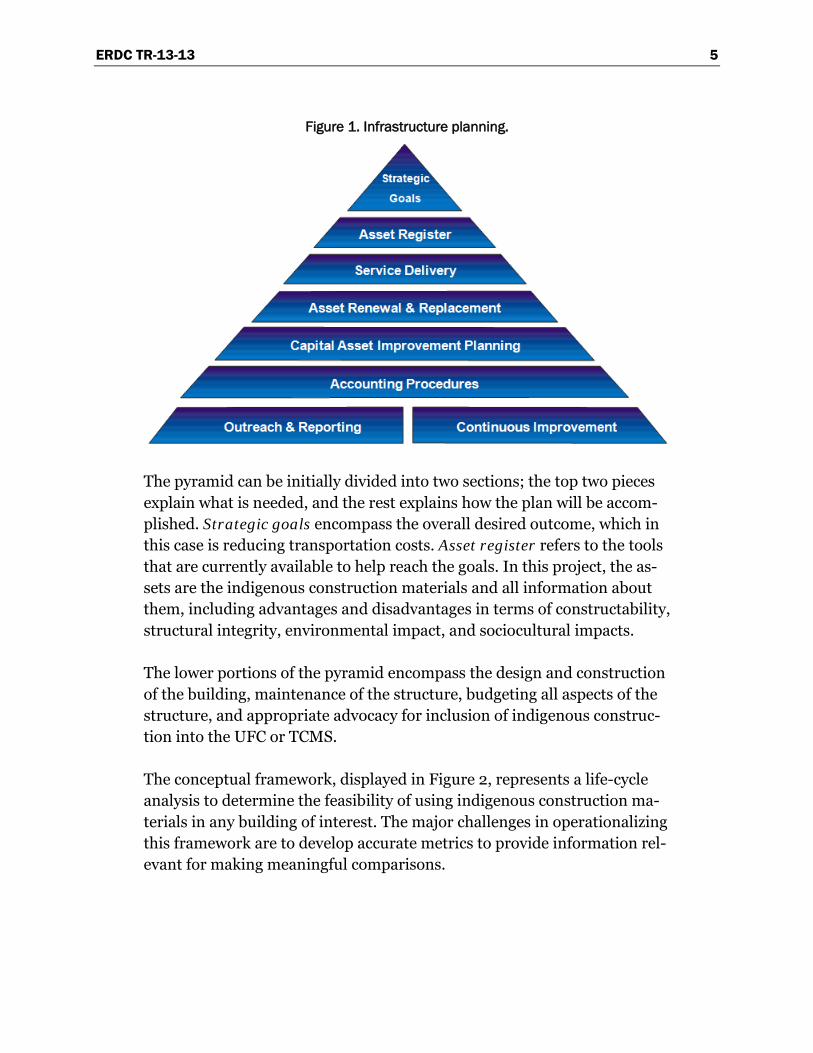
Figure 1. Infrastructure planning.
The pyramid can be initially divided into two sections; the top two pieces explain what is needed, and the rest explains how the plan will be accom-plished. Strategic goals encompass the overall desired outcome, which in this case is reducing transportation costs. Asset register refers to the tools that are currently available to help reach the goals. In this project, the as-sets are the indigenous construction materials and all information about them, including advantages and disadvantages in terms of constructability, structural integrity, environmental impact, and sociocultural impacts.
The lower portions of the pyramid encompass the design and construction of the building, maintenance of the structure, budgeting all aspects of the structure, and appropriate advocacy for inclusion of indigenous construc-tion into the UFC or TCMS.
The conceptual framework, displayed in Figure 2, represents a life-cycle analysis to determine the feasibility of using indigenous construction ma-terials in any building of interest. The major challenges in operationalizing this framework are to develop accurate metrics to provide information rel-evant for making meaningful comparisons.

ERDC TR-13-13 6
Figure 2. Conceptual framework.
The process starts with site selection and specification that ensure all mis-sion requirements will be met (e.g., good force protection) for the FOB. Next, geospatial data for the selected site is used to gather information on all of the variables that must be considered in planning and decision mak-ing. A visit to the proposed site is also important for gathering information that is not readily available in the geospatial information base. A life-cycle cost comparison between the types of buildings is then performed using an algorithm developed for that purpose. It is intended that this algorithm be implemented as a computer-automated tool, but that development work is beyond the scope of the current project.
2.2 Current FOB construction practice
The Army currently specifies US construction standards, primarily wood-frame systems and methods, for FOB construction. In locations with no timber availability, this requires that lumber be transported to the FOB site, putting military personnel at elevated risk in hostile territory. The
ERDC TR-13-13 7
sustainment of convoys for construction purposes competes for money and resources needed to directly carry out the mission or operation.
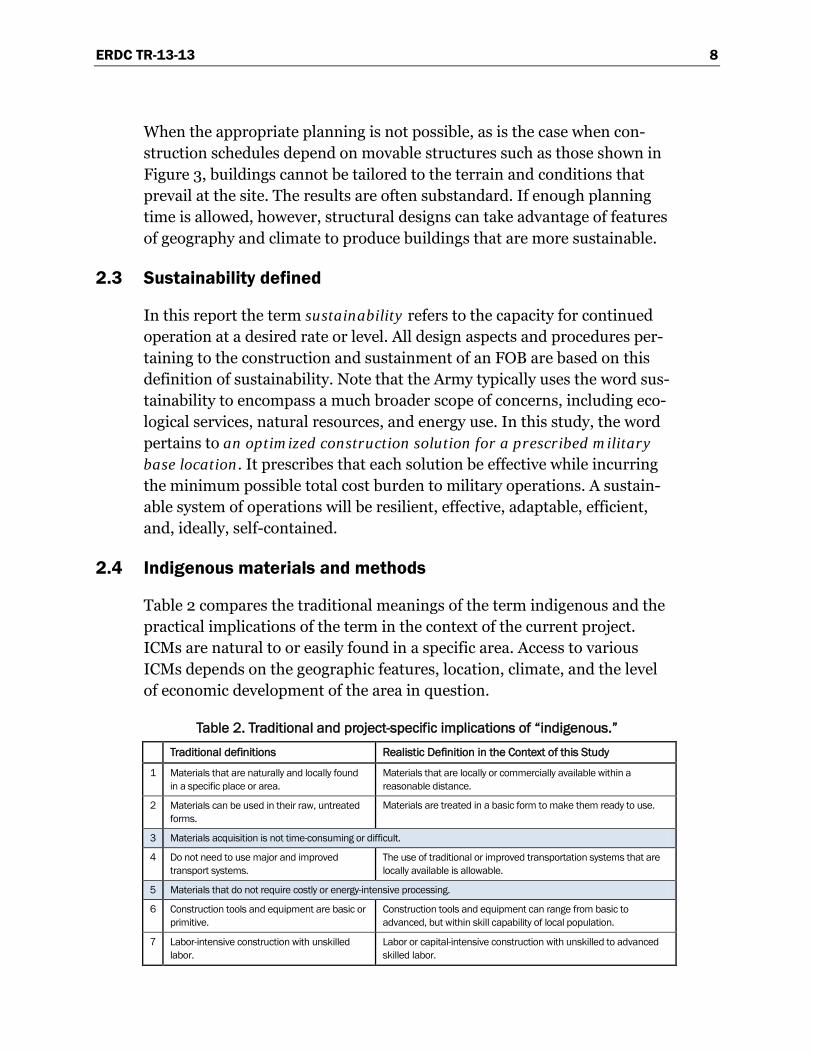
A representative contingency base camp of the type used in Iraq is pic-tured in Figure 3. The convoy needed to supply materials to build a FOB such as this is a logistical burden on the mission, and the cost of importing non-indigenous materials is high. This type of FOB is usually established with little planning and built rapidly with costly materials and resources. The cost to sustain such a base is broken down based on service life in Ta-ble 1.
Figure 3. Military base camps in Iraq.
Table 1. Cost of base camps in Iraq. Construction Construction +3
Month Service Construction +6 Month Service
Construction +6 Month Service
Construction +12 Month Service
Equipment $735,700 $735,700 $735,700 $735,700
Material $246,000 $250,900 $250,900 $260,600
Subcontract $12,138,000 $14,944,600 $14,944,600 $23,035,200
Camp Security $2,661,800
Total $13,119,700 $15,931,200 $17,606,400 $24,031,600
Cost per Day $486 $295 $326 $219
Savings per Day $259 x 200 = $51000 $450 x 200 = $90,000 $419 x 200 = $83,800 $526 x 200 = $105,200
Estimated Break even in Days
253 177 210 228
ERDC TR-13-13 8
When the appropriate planning is not possible, as is the case when con-struction schedules depend on movable structures such as those shown in Figure 3, buildings cannot be tailored to the terrain and conditions that prevail at the site. The results are often substandard. If enough planning time is allowed, however, structural designs can take advantage of features of geography and climate to produce buildings that are more sustainable.
2.3 Sustainability defined
In this report the term sustainability refers to the capacity for continued operation at a desired rate or level. All design aspects and procedures per-taining to the construction and sustainment of an FOB are based on this definition of sustainability. Note that the Army typically uses the word sus-tainability to encompass a much broader scope of concerns, including eco-logical services, natural resources, and energy use. In this study, the word pertains to an optimized construction solution for a prescribed military base location. It prescribes that each solution be effective while incurring the minimum possible total cost burden to military operations. A sustain-able system of operations will be resilient, effective, adaptable, efficient, and, ideally, self-contained.
2.4 Indigenous materials and methods
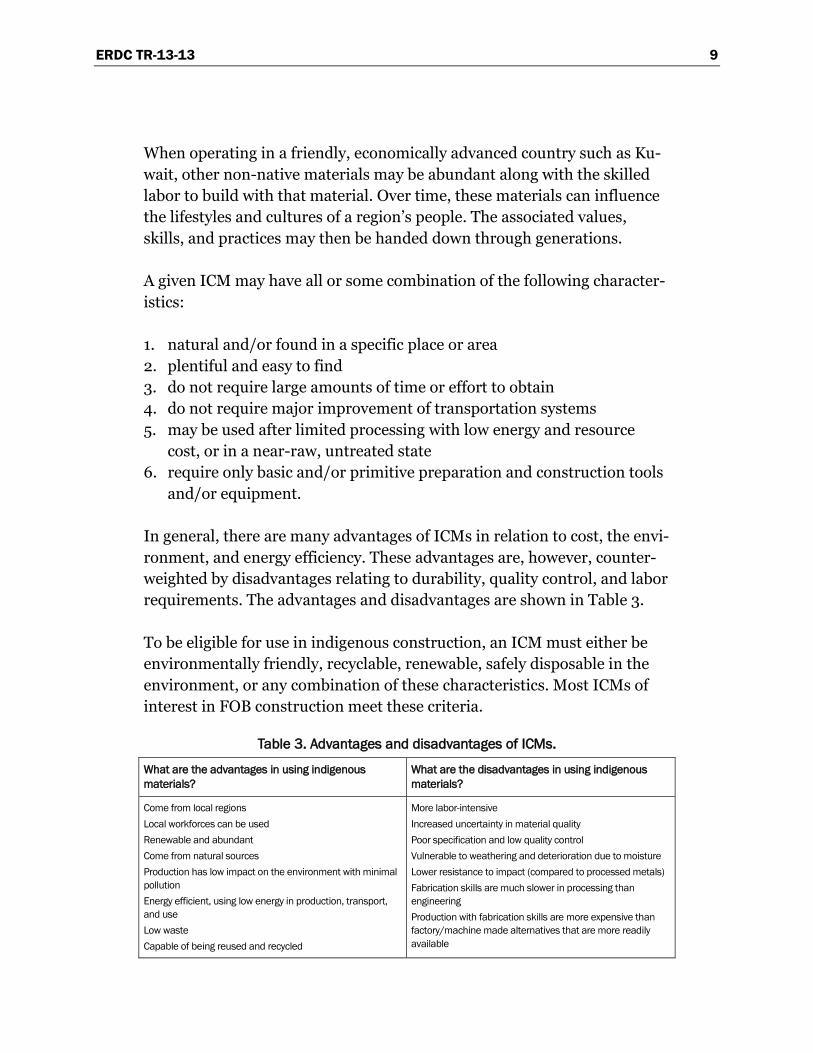
Table 2 compares the traditional meanings of the term indigenous and the practical implications of the term in the context of the current project. ICMs are natural to or easily found in a specific area. Access to various ICMs depends on the geographic features, location, climate, and the level of economic development of the area in question.
Table 2. Traditional and project-specific implications of “indigenous.” Traditional definitions Realistic Definition in the Context of this Study
1 Materials that are naturally and locally found in a specific place or area.
Materials that are locally or commercially available within a reasonable distance.
2 Materials can be used in their raw, untreated forms.
Materials are treated in a basic form to make them ready to use.
3 Materials acquisition is not time-consuming or difficult.
4 Do not need to use major and improved transport systems.
The use of traditional or improved transportation systems that are locally available is allowable.
5 Materials that do not require costly or energy-intensive processing.
6 Construction tools and equipment are basic or primitive.
Construction tools and equipment can range from basic to advanced, but within skill capability of local population.
7 Labor-intensive construction with unskilled labor.
Labor or capital-intensive construction with unskilled to advanced skilled labor.
ERDC TR-13-13 9
When operating in a friendly, economically advanced country such as Ku-wait, other non-native materials may be abundant along with the skilled labor to build with that material. Over time, these materials can influence the lifestyles and cultures of a region’s people. The associated values, skills, and practices may then be handed down through generations.
A given ICM may have all or some combination of the following character-istics:
1. natural and/or found in a specific place or area 2. plentiful and easy to find 3. do not require large amounts of time or effort to obtain 4. do not require major improvement of transportation systems 5. may be used after limited processing with low energy and resource
cost, or in a near-raw, untreated state 6. require only basic and/or primitive preparation and construction tools
and/or equipment.
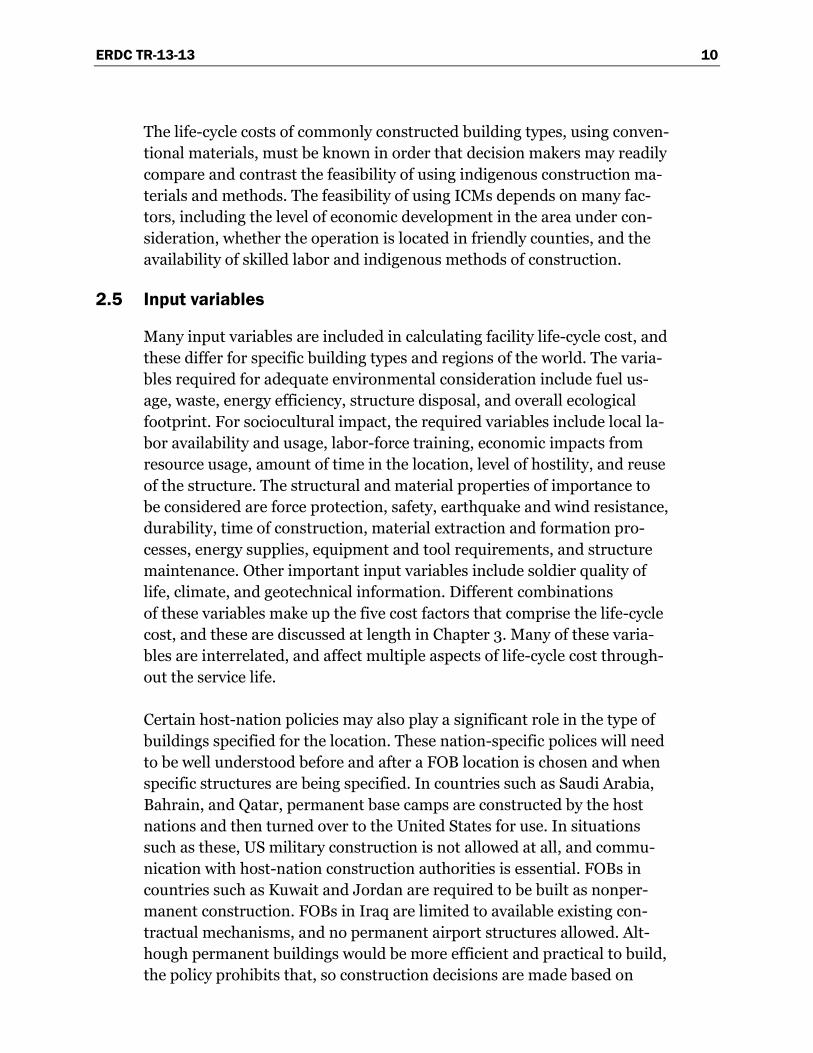
In general, there are many advantages of ICMs in relation to cost, the envi-ronment, and energy efficiency. These advantages are, however, counter-weighted by disadvantages relating to durability, quality control, and labor requirements. The advantages and disadvantages are shown in Table 3.
To be eligible for use in indigenous construction, an ICM must either be environmentally friendly, recyclable, renewable, safely disposable in the environment, or any combination of these characteristics. Most ICMs of interest in FOB construction meet these criteria.
Table 3. Advantages and disadvantages of ICMs.
What are the advantages in using indigenous materials?
What are the disadvantages in using indigenous materials?
Come from local regions Local workforces can be used Renewable and abundant Come from natural sources Production has low impact on the environment with minimal pollution Energy efficient, using low energy in production, transport, and use Low waste Capable of being reused and recycled
More labor-intensive Increased uncertainty in material quality Poor specification and low quality control Vulnerable to weathering and deterioration due to moisture Lower resistance to impact (compared to processed metals) Fabrication skills are much slower in processing than engineering Production with fabrication skills are more expensive than factory/machine made alternatives that are more readily available
ERDC TR-13-13 10
The life-cycle costs of commonly constructed building types, using conven-tional materials, must be known in order that decision makers may readily compare and contrast the feasibility of using indigenous construction ma-terials and methods. The feasibility of using ICMs depends on many fac-tors, including the level of economic development in the area under con-sideration, whether the operation is located in friendly counties, and the availability of skilled labor and indigenous methods of construction.
2.5 Input variables
Many input variables are included in calculating facility life-cycle cost, and these differ for specific building types and regions of the world. The varia-bles required for adequate environmental consideration include fuel us-age, waste, energy efficiency, structure disposal, and overall ecological footprint. For sociocultural impact, the required variables include local la-bor availability and usage, labor-force training, economic impacts from resource usage, amount of time in the location, level of hostility, and reuse of the structure. The structural and material properties of importance to be considered are force protection, safety, earthquake and wind resistance, durability, time of construction, material extraction and formation pro-cesses, energy supplies, equipment and tool requirements, and structure maintenance. Other important input variables include soldier quality of life, climate, and geotechnical information. Different combinations of these variables make up the five cost factors that comprise the life-cycle cost, and these are discussed at length in Chapter 3. Many of these varia-bles are interrelated, and affect multiple aspects of life-cycle cost through-out the service life.
Certain host-nation policies may also play a significant role in the type of buildings specified for the location. These nation-specific polices will need to be well understood before and after a FOB location is chosen and when specific structures are being specified. In countries such as Saudi Arabia, Bahrain, and Qatar, permanent base camps are constructed by the host nations and then turned over to the United States for use. In situations such as these, US military construction is not allowed at all, and commu-nication with host-nation construction authorities is essential. FOBs in countries such as Kuwait and Jordan are required to be built as nonper-manent construction. FOBs in Iraq are limited to available existing con-tractual mechanisms, and no permanent airport structures allowed. Alt-hough permanent buildings would be more efficient and practical to build, the policy prohibits that, so construction decisions are made based on
ERDC TR-13-13 11
short-term needs. Factors and stipulations such as these need to be fully understood and addressed after the FOB location is chosen and before any construction begins.
2.6 Variable mapping
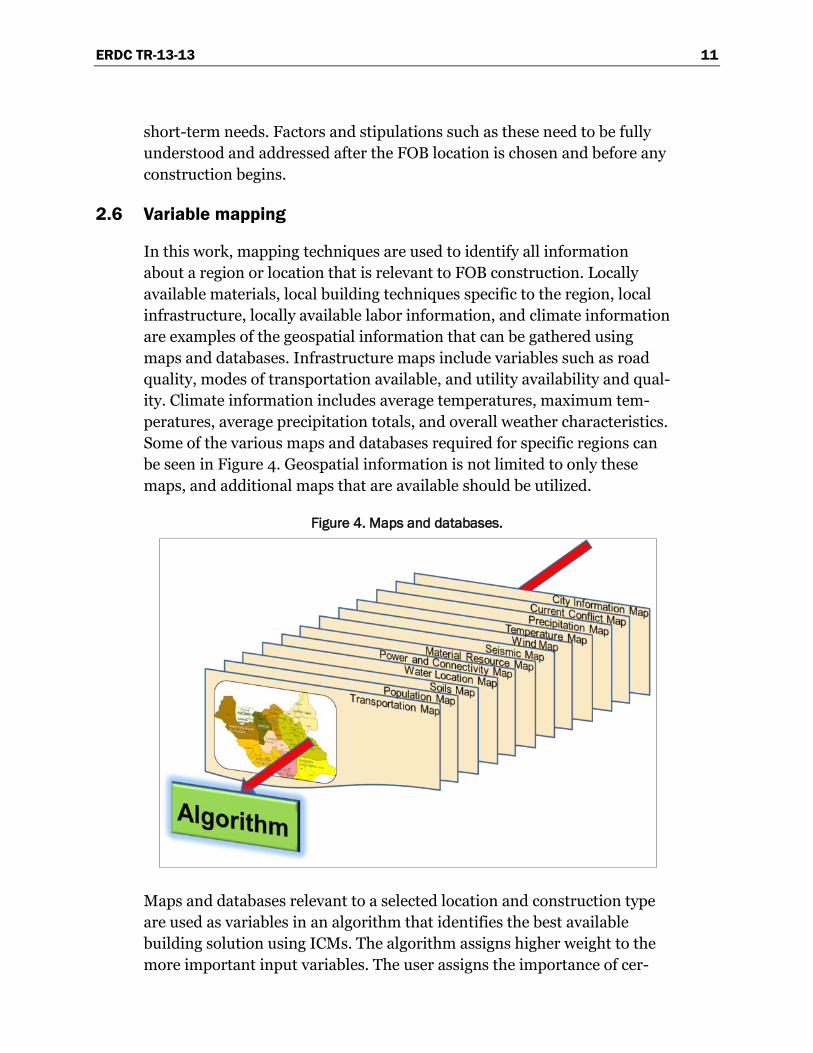
In this work, mapping techniques are used to identify all information about a region or location that is relevant to FOB construction. Locally available materials, local building techniques specific to the region, local infrastructure, locally available labor information, and climate information are examples of the geospatial information that can be gathered using maps and databases. Infrastructure maps include variables such as road quality, modes of transportation available, and utility availability and qual-ity. Climate information includes average temperatures, maximum tem-peratures, average precipitation totals, and overall weather characteristics. Some of the various maps and databases required for specific regions can be seen in Figure 4. Geospatial information is not limited to only these maps, and additional maps that are available should be utilized.
Figure 4. Maps and databases.
Maps and databases relevant to a selected location and construction type are used as variables in an algorithm that identifies the best available building solution using ICMs. The algorithm assigns higher weight to the more important input variables. The user assigns the importance of cer-
ERDC TR-13-13 12
tain variables as case-specific inputs. The case study for South Sudan in Chapter 5 uses variables and maps that are specific to South Sudan. (Ex-amples of these maps are presented in Appendix E.) All of the information gathered for the case study is used to compare the building types made of different materials, including both conventional modern materials used globally and ICMs. The case study considers earth block, Hesco bastions, traditional masonry, k-spans, container-based housing units, and struc-tural foam.
2.7 Life-cycle cost factors
In this methodology, a life-cycle cost analysis is performed to account for the total cost of resource acquisition and transportation, construction, uti-lization, and disposal of each type of structure. The life-cycle costs of al-ternate construction solutions are then compared. The first step requires a needs assessment that accounts for environmental impacts, sociocultural impacts, and structural requirements in relation to the location of the base. The characteristics and requirements of these variables will help to provide the information needed to calculate the life-cycle costs. For exam-ple, a base built in hostile territory will have much different performance and construction requirements than a base built in a friendly host nation.
The material factor used in this methodology is based on material costs. These can vary from simply purchasing the material from a local distribut-er to the costs arising from the use of equipment, the formation process needed to fabricate structural elements, and the cost of all the constituent resources embodied in the material. The material factor is highly depend-ent on the location, material availability, and level of construction industry development in the project area.
The transportation factor accounts for the costs of moving materials, equipment, labor, and waste to and/or from the FOB location. This factor depends heavily on the project area’s infrastructure.
The construction factor accounts for the resources needed for construc-tion, including labor. This factor depends not only on the location of FOB but also very much on the building type.
The functionality factor accounts for the operational costs of the structure, including safety, utilities, maintenance, and soldier quality of life.
ERDC TR-13-13 13
The disposal factor is based on the costs incurred after the conclusion of the building’s military life cycle. It is highly dependent on whether the structure can be given to the local population or if it must be demolished and removed.
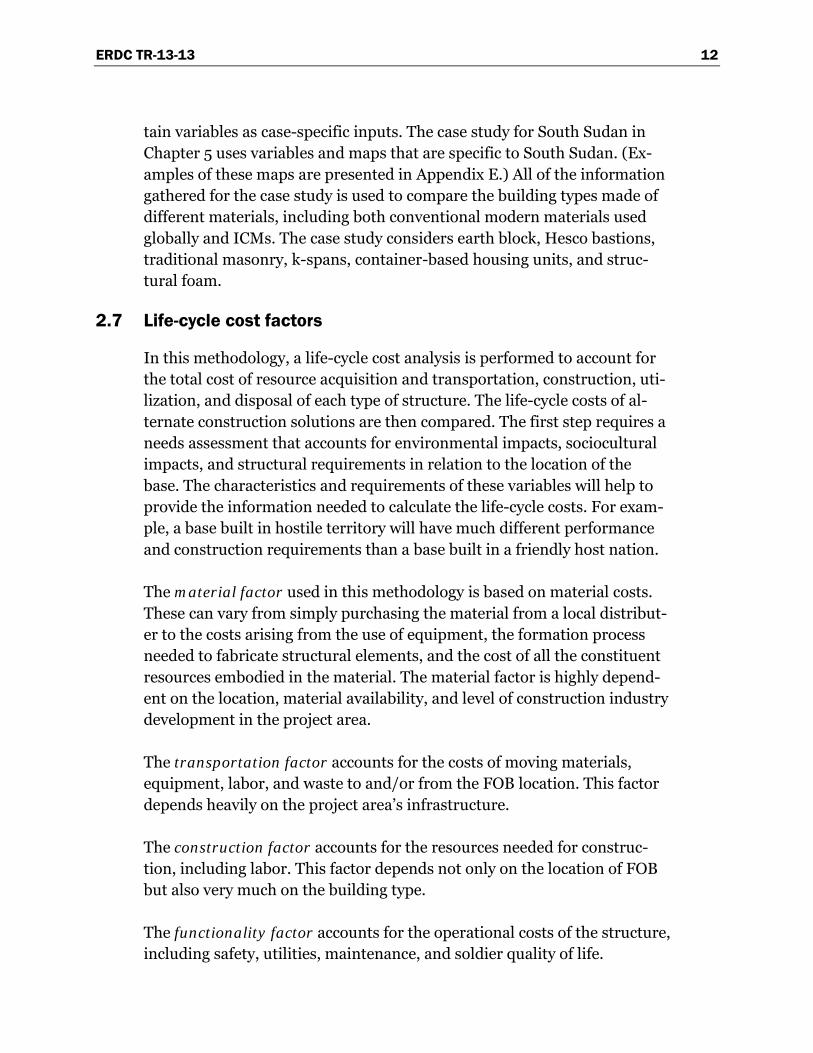
The inputs to the total life-cycle cost are shown in Figure 5
Figure 5. Life-cycle cost breakdown.
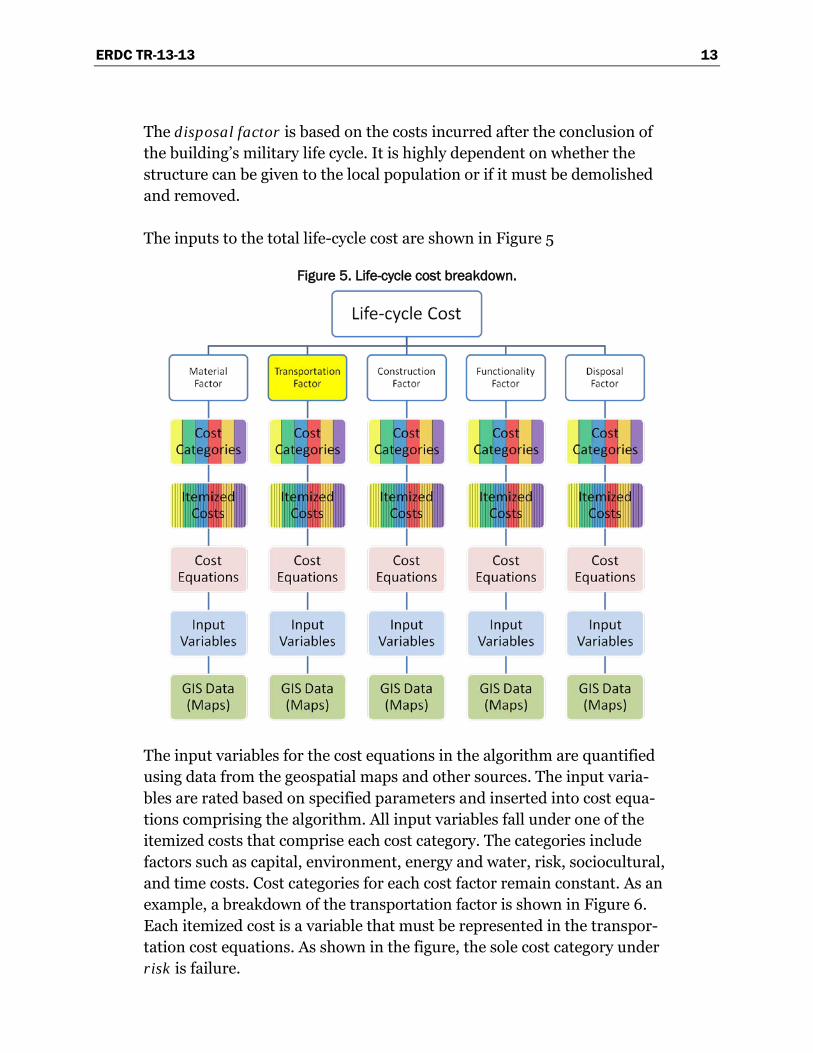
The input variables for the cost equations in the algorithm are quantified using data from the geospatial maps and other sources. The input varia-bles are rated based on specified parameters and inserted into cost equa-tions comprising the algorithm. All input variables fall under one of the itemized costs that comprise each cost category. The categories include factors such as capital, environment, energy and water, risk, sociocultural, and time costs. Cost categories for each cost factor remain constant. As an example, a breakdown of the transportation factor is shown in Figure 6. Each itemized cost is a variable that must be represented in the transpor-tation cost equations. As shown in the figure, the sole cost category under risk is failure.
ERDC TR-13-13 14
Figure 6. Example of transportation factor variables.
The variables that affect the risk involved in transporting resources are so-cial or military hostility, the terrain that needs to be traversed, transport distance, road quality, and mode of transportation. The values of these variables are determined and assigned based on the geospatial input data. These values are then inserted into the cost equations, which are then op-erationalized in the algorithm. Every itemized cost is accounted for simi-larly within the other four factors. In aggregate, the five factors account for all itemized costs comprising the life-cycle cost for each building type.
There will not necessarily be data available for every itemized cost for each cost category and building type. In such cases, the variable is disregarded for all building types to ensure that the life-cycle cost calculation is uni-form for purposes of comparison.
2.8 Optimizing solutions for specific FOB location
The usefulness of a material for construction is determined by many fac-tors, especially physical factors. Figure 7 displays how material usefulness is determined.
ERDC TR-13-13 15
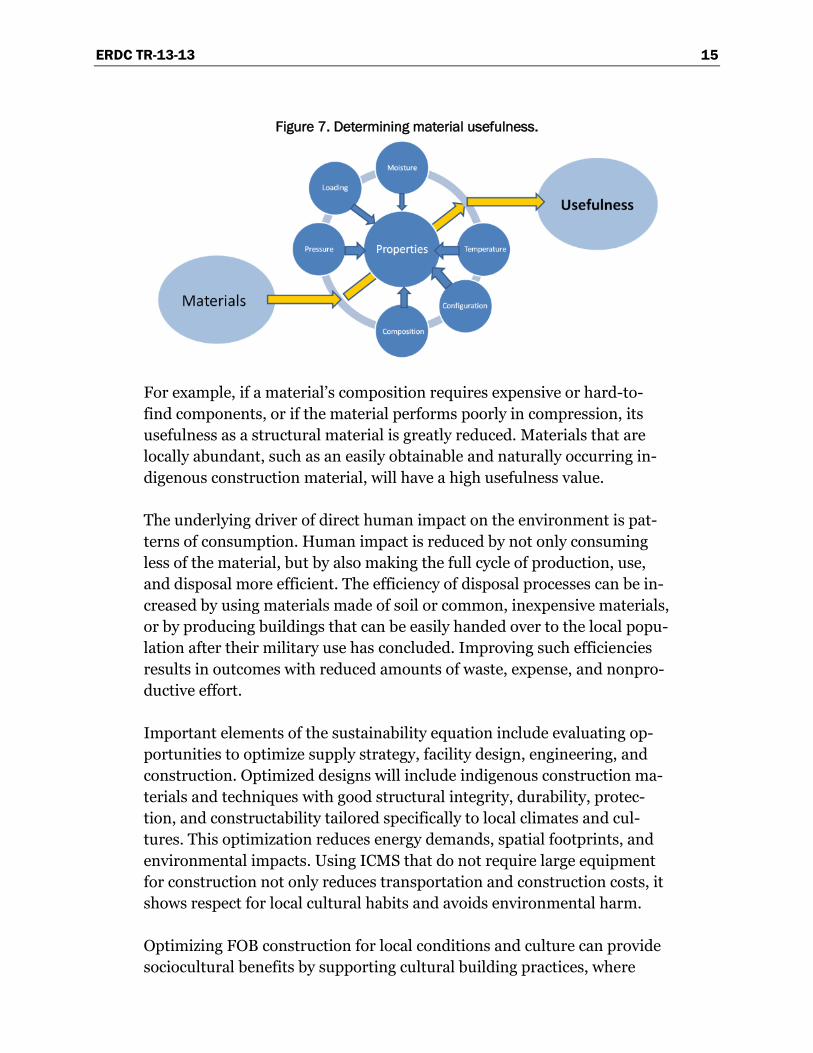
Figure 7. Determining material usefulness.
For example, if a material’s composition requires expensive or hard-to-find components, or if the material performs poorly in compression, its usefulness as a structural material is greatly reduced. Materials that are locally abundant, such as an easily obtainable and naturally occurring in-digenous construction material, will have a high usefulness value.
The underlying driver of direct human impact on the environment is pat-terns of consumption. Human impact is reduced by not only consuming less of the material, but by also making the full cycle of production, use, and disposal more efficient. The efficiency of disposal processes can be in-creased by using materials made of soil or common, inexpensive materials, or by producing buildings that can be easily handed over to the local popu-lation after their military use has concluded. Improving such efficiencies results in outcomes with reduced amounts of waste, expense, and nonpro-ductive effort.
Important elements of the sustainability equation include evaluating op-portunities to optimize supply strategy, facility design, engineering, and construction. Optimized designs will include indigenous construction ma-terials and techniques with good structural integrity, durability, protec-tion, and constructability tailored specifically to local climates and cul-tures. This optimization reduces energy demands, spatial footprints, and environmental impacts. Using ICMS that do not require large equipment for construction not only reduces transportation and construction costs, it shows respect for local cultural habits and avoids environmental harm.
Optimizing FOB construction for local conditions and culture can provide sociocultural benefits by supporting cultural building practices, where
ERDC TR-13-13 16
possible. It also makes use of local labor forces, which provides opportuni-ties for positive social interaction and communication between local com-munities and US personnel. It also can provide buildings suitable for reuse that are compatible with the local way of life after the military construction life cycle ends. ICMs are essential for reducing the cost of constructing buildings that are sustainable, economical, and structurally sound.
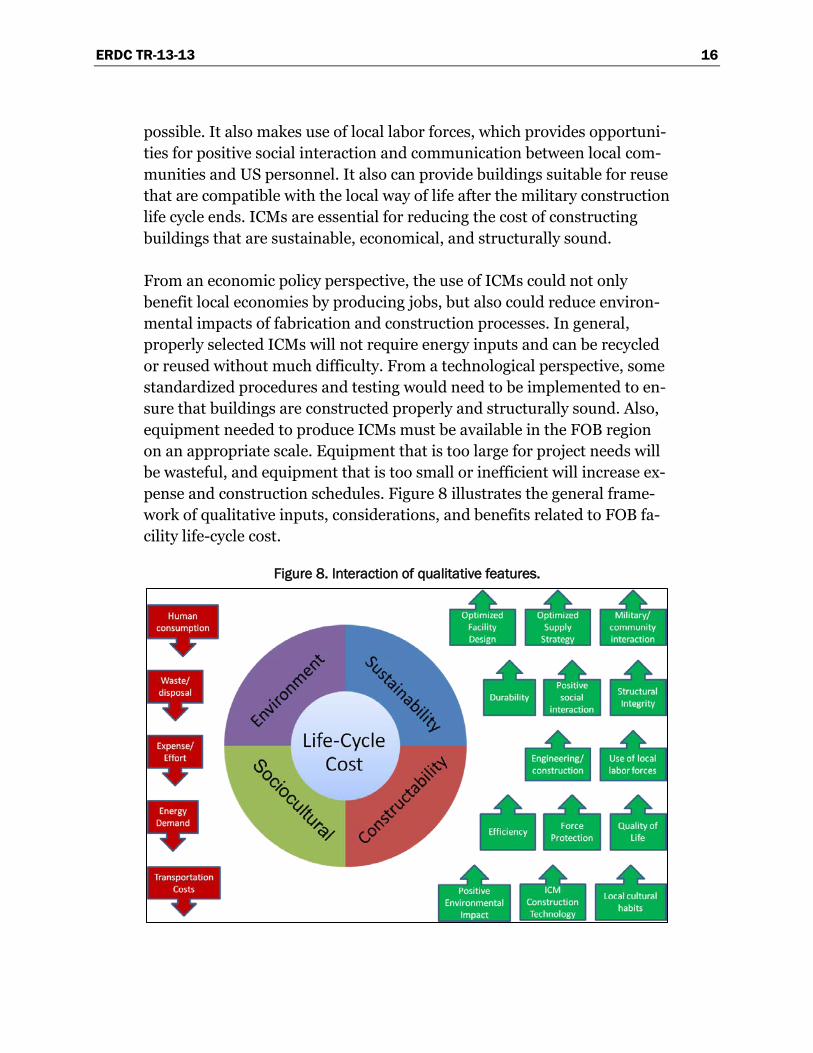
From an economic policy perspective, the use of ICMs could not only benefit local economies by producing jobs, but also could reduce environ-mental impacts of fabrication and construction processes. In general, properly selected ICMs will not require energy inputs and can be recycled or reused without much difficulty. From a technological perspective, some standardized procedures and testing would need to be implemented to en-sure that buildings are constructed properly and structurally sound. Also, equipment needed to produce ICMs must be available in the FOB region on an appropriate scale. Equipment that is too large for project needs will be wasteful, and equipment that is too small or inefficient will increase ex-pense and construction schedules. Figure 8 illustrates the general frame-work of qualitative inputs, considerations, and benefits related to FOB fa-cility life-cycle cost.
Figure 8. Interaction of qualitative features.
ERDC TR-13-13 17
A matrix of all the costs broken down into each itemized cost is developed to compare the material, transportation, construction, functionality, and disposal factors for each structural type. These costs are presented in a se-ries of tables similar to those shown in Appendix C, rated using the meth-ods and parameters presented in Appendix B. The developed algorithm uses these values to output a single cost value.
By comparing the values returned by the algorithm for each candidate structure type, the optimal local construction solution can be identified. The optimal localized solution is indicated by the lowest life-cycle cost val-ue calculated for all construction types being considered. The process of ranking individual components, based both on their inherent characteris-tics and their interaction with all other applicable variables, is described with more detail in Chapter 3.
ERDC TR-13-13 18
3 Ranking Metrics
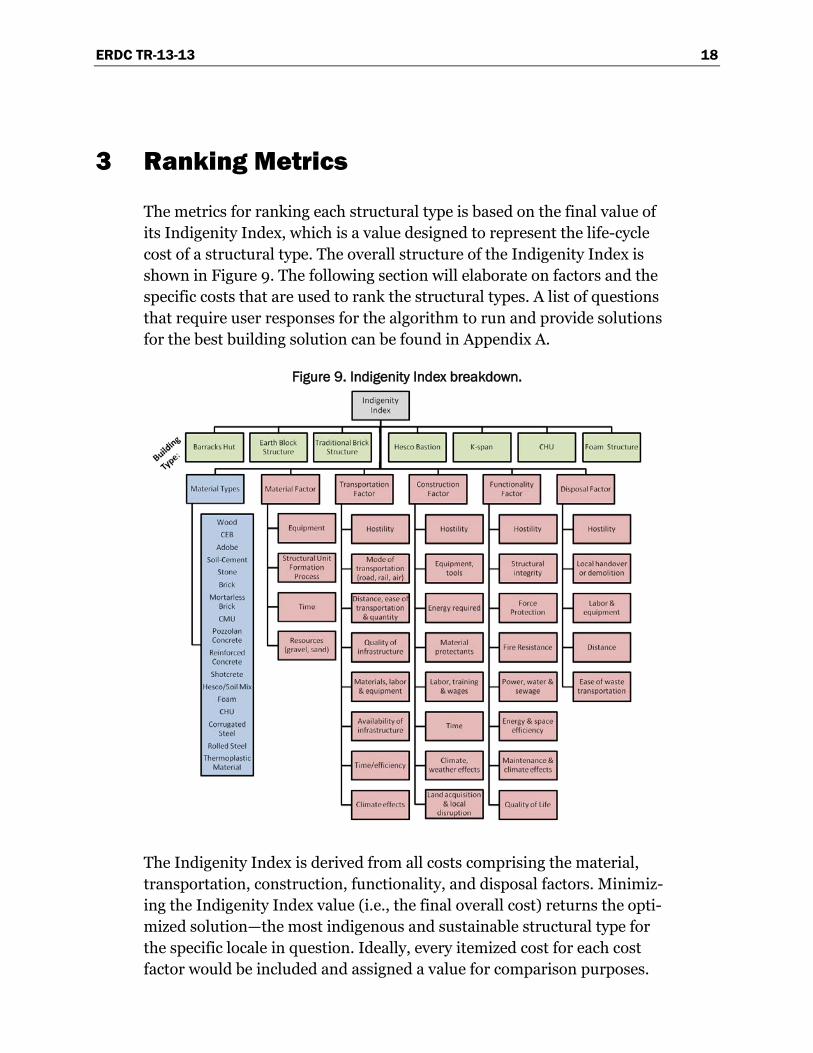
The metrics for ranking each structural type is based on the final value of its Indigenity Index, which is a value designed to represent the life-cycle cost of a structural type. The overall structure of the Indigenity Index is shown in Figure 9. The following section will elaborate on factors and the specific costs that are used to rank the structural types. A list of questions that require user responses for the algorithm to run and provide solutions for the best building solution can be found in Appendix A.
Figure 9. Indigenity Index breakdown.
The Indigenity Index is derived from all costs comprising the material, transportation, construction, functionality, and disposal factors. Minimiz-ing the Indigenity Index value (i.e., the final overall cost) returns the opti-mized solution—the most indigenous and sustainable structural type for the specific locale in question. Ideally, every itemized cost for each cost factor would be included and assigned a value for comparison purposes.
ERDC TR-13-13 19
The available itemized cost information that can be found for the intended FOB location is simplified into the input variables shown in Figure 9. These variables will tend to incorporate information that is most readily available. Information that is not available for one construction type will be assigned a value of zero for all types to remove it as a cost factor for all construction types being considered. Cost factors may be weighted by the algorithm user to allow for case-specific importance of a given factor. By default, each of the five factors is multiplied by 20%, with a possible range of 1 – 96%. The total for all five factors must add up to 100%. When all re-quired user information is input, the algorithm produces a single Indigenity Index value for each structural type at the intended FOB loca-tion. The lower the Indigenity Index value, the more indigenous, sustaina-ble, and optimized is the building type for the FOB locale.
The equations used to calculate each of the five cost factors are shown in Appendix B, with tables showing how the values for each variable are as-signed. Appendix C shows the assumed values for all variables that are in-cluded in the algorithm, with a brief explanation for the assigned value. The text that follows discusses the ranking metrics pertaining to each of the five Indigenity Index cost factors.
3.1 Material factor
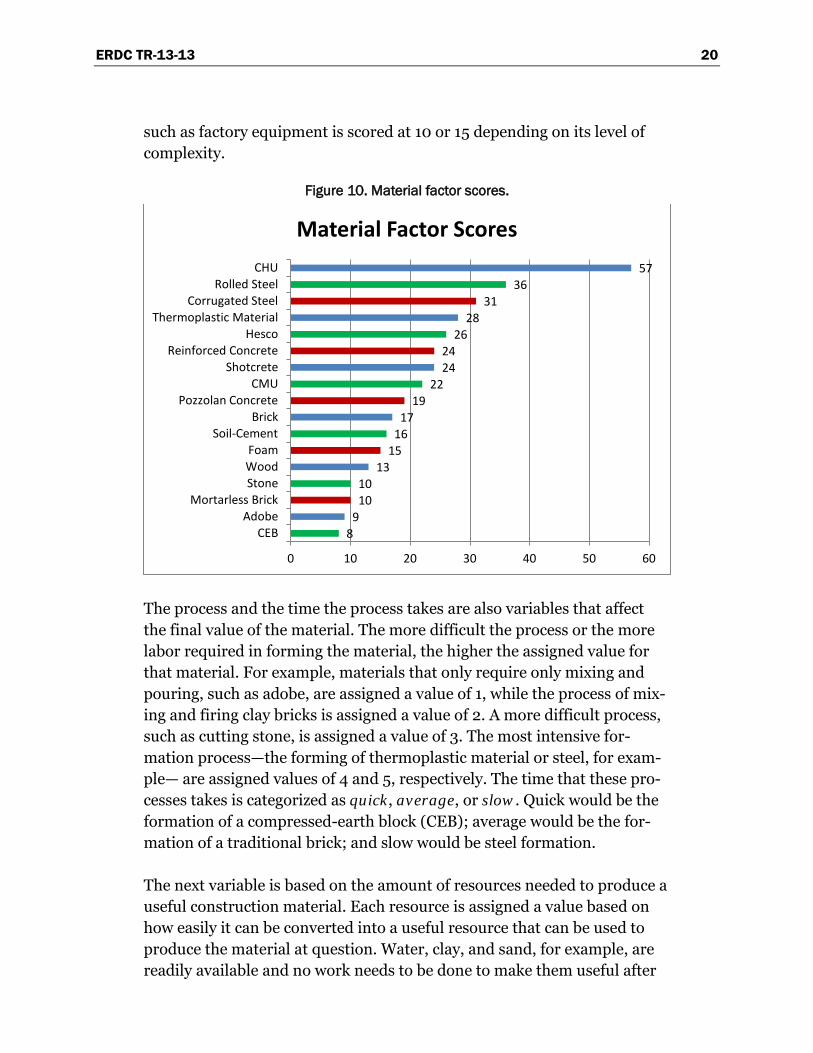
The initial life-cycle cost of a structure is the cost of its material. The cost may simply be the price of purchase from a local distributor, but if there is no local distributor then the material will need to be produced. The pro-duction costs includes the costs of all constituent resources embodied in the raw materials, the equipment required, and the formation process needed to fabricate the element. The material factor includes the steps of manufacture for materials not occurring naturally in the area, such as steel or thermoplastic material. In general, the more indigenous a material is, the lower its cost will be. The rankings of the scores for the material factor can be seen in Figure 10.
One variable in the material factor is the equipment and tools required during formation of the construction material. This variable is quantified based on the amount and complexity of equipment required. Simple equipment such as molds are scored a value of 1; basic equipment such as a mixer is given a value of 2; higher-complexity equipment such as a com-pression block machine is assigned a value of 3; and advanced machinery
ERDC TR-13-13 20
such as factory equipment is scored at 10 or 15 depending on its level of complexity.
Figure 10. Material factor scores.
The process and the time the process takes are also variables that affect the final value of the material. The more difficult the process or the more labor required in forming the material, the higher the assigned value for that material. For example, materials that only require only mixing and pouring, such as adobe, are assigned a value of 1, while the process of mix-ing and firing clay bricks is assigned a value of 2. A more difficult process, such as cutting stone, is assigned a value of 3. The most intensive for-mation process—the forming of thermoplastic material or steel, for exam-ple— are assigned values of 4 and 5, respectively. The time that these pro-cesses takes is categorized as quick, average, or slow. Quick would be the formation of a compressed-earth block (CEB); average would be the for-mation of a traditional brick; and slow would be steel formation.
The next variable is based on the amount of resources needed to produce a useful construction material. Each resource is assigned a value based on how easily it can be converted into a useful resource that can be used to produce the material at question. Water, clay, and sand, for example, are readily available and no work needs to be done to make them useful after
8 9 10 10
13 15 16 17
19 22
24 24
26 28
31 36
57
0 10 20 30 40 50 60
CEB Adobe
Mortarless Brick Stone Wood Foam
Soil-Cement Brick
Pozzolan Concrete CMU
Shotcrete Reinforced Concrete
Hesco Thermoplastic Material
Corrugated Steel Rolled Steel
CHU
Material Factor Scores
ERDC TR-13-13 21
they are found, so they are assigned a value of 1. Materials such as cement or steel are assigned values of 7 and 10, respectively, due to the required manufacturing process, the amount of energy needed, and environmental impact. Some construction materials consist of just one resource (for ex-ample, stone is composed of stone), but other materials are composed of several resources. For example, concrete masonry units are made of sand, water, gravel, cement, and cement mortar. A table of these values for each material type can be found in Appendix C.
Another factor in assessing the cost of construction materials is the extent to which foreign imports are used (Ofori 2001:46). Even though the cost of producing the materials may be relatively low in neighboring countries, market-driven pricing and tariff and transportation costs increase the cost of construction materials. For example, much of the cement used in con-struction in South Sudan has to be imported from Kenya or Uganda at ex-tra cost. On the other hand, Chinese companies view the production of building materials as an opportunity for profitable investment; the China National Machinery and Equipment Import and Export Corporation is planning to build a cement factory in Kapoeta County, South Sudan (Kuo et al. 2012:8).
3.2 Transportation factor
Another early life-cycle cost of a FOB is the transportation costs for mate-rials, equipment, labor, and anything else that must be moved to or re-moved from the site. The transportation factor is based on the mode of transportation, the distance that must be traveled, hostility of the envi-ronment, condition of infrastructure, and the weather and climate. Other factors include fuel required, time, and the amount of all construction ma-terials, equipment, and labor that must be transported. For each resource that must be transported, the factor will be calculated and each factor add-ed together to comprise the transportation factor. This factor will increase the overall cost and account for resources that are more difficult to obtain. It should be noted that if a material is available at a local hardware store that is closer than a manufacturing plant or location where the material is available, the material should be purchased at the hardware store as long as the cost is reasonable and the quality and quantity is sufficient.
The overall transportation cost is defined by the mode of transportation, which can include animals, vehicles, trains, or airplanes. For the case study presented in Chapter 5, motor vehicles are assumed to be the only
ERDC TR-13-13 22
type of transportation using the road. The distance that the resource must travel is another key component of the transportation factor. The factor itself depends on the mode of transportation, and increases based on dis-tance ranges. The lowest factor is applied to distances between 0 and 50 miles, with increasingly larger factors for 50 – 150 miles, 150 – 300 miles, 300 to 500 miles, and more than 500 miles. The quality of infrastructure for these modes also impacts how easily resources can be moved. For ex-ample, unpaved dirt roads are assigned a higher value than paved roads due to slower transporting and a higher risk of vehicle damage and prob-lems. Paved roads, high-quality rail, and air transportation with sufficient paved airstrips are assigned the lowest value; deficiencies will cause this value to increase. In some areas of the world, river transportation (e.ge., the Mississippi River in the central United States or the Nile in Sudan and Egypt) is vital to the local economy and can provide a means for transport-ing such construction materials. Therefore, water transportation is includ-ed in the possible modes of transportation.
Another major factor in transportation is whether the resource will be transported through hostile territory. In hostile territory security costs be-come a major factor, whether it is to deal with hostile enemy action or criminal activity. Hostility will range from friendly locations, where there should be no issues with any local people, to locations that are currently at war with US forces or allies. In between these will include locations where crime is high, or political unrest or upheaval, or hostile locations at war with other countries. The hostility factor applies to the FOB location, the location of resources, and the route used to transport the resources. If all three of these locations are friendly, for example, then the entire transpor-tation factor is multiplied by the minimum value. If any of these locations are located in hostile or current warfare locations, they are multiplied by increasing values to account for the increased difficulties and risks in the transportation process. Hostile locations may exhibit characteristics such as political violence, popular support for violent factions, economic incen-tives for violence, criminalization of state institutions, or general contempt for the United States. For example, foreign construction workers have be-come targets of violence. Kuo et al. (2012:9) report that 29 Chinese road workers were kidnapped in January 2012 by armed groups in Sudan’s South Kordofan state.
Additional variables accounted for in the transportation factor include ease of transporting the resource, quantity of material, transit time, and
ERDC TR-13-13 23
weather. The ease of transportation represents how easily the material can be moved to the project location. For example, large equipment is consid-erably more difficult to move than a truckload of gravel. The quantity of equipment needed for transport (e.g., dump trucks, flatbeds, etc.) will also play a large role in the cost. Larger quantities of equipment and resources will increase costs and the fuel consumption of the transport vehi-cles. These costs will increase the transportation factor based on how diffi-cult it is to acquire the required machinery, the amount of equipment re-quired, the difficulty in transporting it, and its fuel consumption. Time also plays a large role in the transportation factor. The more time spent transporting resources, the more risk increases for damage to equipment and materials, with even greater risk in hostile territory. In addition, if construction materials have to be imported across borders, inefficient bor-der procedures and lack of reliable logistics services extend time in trans-portation and add to costs, particularly when dealing with landlocked economies (Arvis et al. 2010).
The type of weather in the region where the transportation is taking place will also affect the transportation factor. Locations with snowy or rainy climates are assigned higher values than moderate and dry locations due to the increased difficulty of transportation. The terrain of the region also affects the efficiency and time spent transporting. Transportation through mountainous regions increases fuel consumption and travel time, for ex-ample, and desert regions have dust storms and sand-blocked roads dur-ing certain times of the year). All these factors need to be included to accu-rately represent the transportation factor for various types of construction materials.
3.3 Construction factor
The construction of the buildings in a FOB makes up a large portion of the life-cycle cost. The construction factor consists of variables related to the location of the FOB, the construction procedure, and the labor required for the construction.
The location variables take into account whether the land for the FOB is acquired for free, or if it needs to be purchased, leased, negotiated or oth-erwise taken by force. Taking land by force should be a last resort in order to avoid unnecessary conflict. The US military will rarely, if ever, purchase land in a foreign country, so leasing land or being granted free access to government-owned land are the most probable alternatives. Newly created
ERDC TR-13-13 24
nations or nations with weak governance are likely to be in the process of developing standardized, government-regulated systems of land owner-ship and registration. Research conducted by The World Bank and Inter-national Finance Corporation (Morisset and Neso 2002:5) for 20 African and 7 Eastern and Central European nations found that land ownership is a sensitive issue. Therefore, investors prefer to lease the land, although both leasing and purchasing land have many administrative steps that add to the cost of the transaction. Subsequent research by the World Bank (2011) identifies the steps and the cost involved for registering property for construction sites, which will be discussed later in this section. Generally, purchasing land is more expensive than leasing, since resolving land own-ership may be contentious. The issue of land rights is often complicated and contentious in the partner nations in which the US may be contem-plating the construction of FOB facilities.
Another important variable is disruption caused to the local economy or social interactions. Local disruption should be minimized to prevent nega-tive impact on the local culture and economy. The largest cities and large airports are affected much more than small towns or local airstrips. The hostility of the location in which construction is taking place will also af-fect the construction factor. For the construction factor, hostility is taken into account as it was for the transportation factor, but only at the pro-posed FOB location. Security costs increase for construction increase with local hostile activity. Safety barriers may have to be built if there is poten-tial danger to soldiers or workers, and the stealing of supplies may become an issue when construction has ceased for the night. In a hostile area, the time spent screening workers as they enter a base directly reduces produc-tive construction time, and it pulls US personnel away from other missions to oversee local laborers. Also, weather can negatively affect the construc-tion of the buildings. A minimum value is assigned for locations with a warm climate most of the year and minimal precipitation and rain. The construction factor value increases with adverse weather conditions, such as excessive heat, cold, wind, rain, or snow. The more of these conditions that may occur, the longer construction will take, thus increasing the con-struction factor rating.
Increased costs of construction are also related to the length of time and costs of complying with procedures instituted by the host nation govern-ment. Procedures include any interaction of the company constructing the building with external parties, such as government agencies, notaries, land
ERDC TR-13-13 25
registry, cadastre, utility companies, public and private inspectors, and technical experts. Activities involved in carrying out the procedures are obtaining clearances, licenses, permits, and certificates; completing notifi-cations and inspections; obtaining utility connections to electricity, water, sewerage, and telephone services; and registering the building after its completion. Time for conducting procedures is expressed in calendar days. Only official costs are presented in US dollars and the local currency. The World Bank (2011) measured the effects of government regulations that impact the life cycle of small- or medium-size business (i.e., starting a business, dealing with construction permits, registering property, getting credit, protecting investors, paying taxes, trading across borders, enforcing contracts, and closing a business). This publication was also a source of information on employing workers that was helpful in estimating the cost of labor.
The procedure for calculating the construction factor incorporates several variables, starting with the equipment and its complexity. For example, tools such as a hammer and nails for wood construction, or masonry tools for adobe, are easier to use than those needed to build a Hesco bastion, which needs an excavator for efficient construction. The energy used by this equipment is another variable that affects costs. Hand tools are given the lowest values, increasing all the way up to high values for heavy ma-chinery such as excavators or cranes. If generators or diesel equipment are used during the construction process, the value of the construction factor will be increased to account for the energy required. Additional variables in the construction process are the climate and application of protective coatings. Higher precipitation amounts will generally degrade the building at a faster rate, or else waterproofing or other material stabilization meth-ods are needed. As average precipitation increases or as heat increases, the need for coatings such as ultraviolet (UV) radiation protection or water-proofing also increases. Precipitation and extreme heat or dryness will also decrease productivity, thus increasing the overall construction time. The final variable that makes up the construction procedure is the expected time of construction. Construction that takes only a single day is given the minimum value; construction that takes less than a week and less than a month is given progressively higher values; and construction that takes more than a month is assigned the highest value.
The labor required for construction encompasses variables that include the amount and type of training required and the wages to be paid to the la-
ERDC TR-13-13 26
bor. As training requirements increase from zero training to extensive training, the value of the variable will likewise increase. Similarly, as wages increase from unskilled to very skilled labor, the value of the construction factor will increase accordingly. These labor variables and all the others that account for the location and construction procedure will affect the construction factor rating and the Indigenity Index value.
Additional sociocultural aspects of labor and training in the construction process can be assessed by adapting several indicators presented by Ofori (2001). These indicators are based on the work of the CIB* Task Group 29, which was conducted at the conference on Construction in Developing Countries in Arusha, Tanzania, in September 1998. The following indica-tors also give information about the status of local capacity to carry out construction projects.
In nations where a construction industry is in the early stages of develop-ing, it is useful to track whether labor is local or foreign, and the level of training obtained by indigenous workers such as skilled and unskilled la-bor, supervisors, and professionals (Ofori 2001:46). Another aspect of in-terest when dealing with an emerging construction industry is to examine the nature of corporate development, with attention to
• total number of construction companies • number of companies registered and deregistered for a specific period • categorization of companies into foreign, local, and local-foreign joint
venture ownership • areas of specialization represented, e.g., architects, civil engineers, sur-
veyors, contract or real estate specialists.
Information on the number of companies registered and de-registered for a specific period and categorization of companies, as suggested above, may be available on a government business registry.
Ofori (2001:46) also suggests that the distribution of indigenous involve-ment of local nationals in the planning, design, and construction of facili-ties gives information about the nature of the development of the indige-nous construction industry. This can be measured by the proportion of construction output by size of enterprises (large, medium, and small * International Council for Research and Innovation in Building and Construction, formerly named
Conseil International du Batiment.
ERDC TR-13-13 27
firms) and by the origin of owners (local, foreign, joint local-foreign). However, this does not account for the fact that a foreign-owned firm may employ and train local workers. For example, the privately owned Zhonghao Overseas Construction Engineering Company, Ltd., employs 100 Chinese workers and 1,000 South Sudanese (Kuo et al. 2012:12, Note 26). A goal of international development agencies, such as the United States Agency for International Development (USAID), is to build indige-nous capacity in the construction industry, particularly with regard to in-frastructure development. Thus, USAID has an annual work plan for the USAID Sudan Infrastructure Capacity Building Program since the roads program is the largest employer in South Sudan, and a Sudan Infrastruc-ture Services Project (http://sisp-sudan.com), which teaches local entre-preneurs how to establish contracts for local labor on infrastructure pro-jects.
A more in-depth survey of indigenous distribution in the pool of construc-tion labor resources (Ofori 2001:46) would include:
• total number of professionals and technicians by specialization per year
• number of graduates from professional and technical courses per year • total number of skilled personnel by type of skill, e.g., carpenter, ma-
son, per year • number of persons trained in formal programs or apprenticeships by
skill per year • total number of general laborers.
The extent of information publicly available on a nation’s construction in-dustry depends on the capacity of the government to collect and maintain census and survey data. In a country such as the United States, the Census Bureau produces a multitude of perspectives on the construction industry from industry snapshots in the economic census to employment profiles of individual households. For a new country such as South Sudan, categories represented in census and survey data collection are more limited. In addi-tion, the most recent census, conducted in 2008, was completed before the creation of the Republic of South Sudan in 2011. In the case of South Su-dan, one must rely on reports sponsored by development agencies, such as Labour Market in South Sudan or Doing Business in Juba 2011. These sources focus on topics of interest to the organization that funded the
ERDC TR-13-13 28
work, but inferences can be made about wages and skill levels for those engaged in construction.
3.4 Functionality factor
The functionality factor encompasses the whole operational phase of the FOB throughout its useful life, which covers all costs after construction but before its disposal. It includes operational safety, how utilities are brought into the structure, energy efficiency, maintenance, and soldier quality of life.
The most important safety factor in hostile locations is force protection. Generally, thicker walls (i.e., adobe walls) will have better force protection over thinner walls (i.e., wood frame construction). A building’s resistance to weapons attack is another safety factor. Fire resistance is similarly im-portant. A final safety factor is structural integrity, which can be improved by specifying high-quality construction, building the structure on an ap-propriate foundation, and specifying the use of reinforcing steel in the de-sign. High-quality of construction, good foundations, and well specified reinforcing serve to help minimize the functionality factor rating. Earth-quake and hurricane potential of the area also impact final factor score, with higher potential resulting in higher (i.e., less favorable) functionality factor ratings.
Getting utilities to the location is a critical component of the functionality factor. For electric power, water, and sewage, use of locally available infra-structure would be best, but this is not probable in underdeveloped coun-tries. Using solar power, hydropower, or similar natural power generation methods would be the next-best choices for power, followed by the least sustainable choice: diesel generators. For short missions, bottled water will suffice for FOB drinking needs. For longer missions, it would be more efficient to bring in water-treatment equipment for reusing graywater. A freshwater source near the FOB would be the next-best source of water af-ter clean piped water. If local sewage pipes are not available, the next-best choices would be septic tanks, local lagoons, or sewage-treatment plants. If the mission is short-term, a lagoon may be the best choice, but septic tanks or a water-treatment station would be more efficient for an extended mis-sion.
Factors that are based more on the structural type than the climate are en-ergy efficiency and insulation (r-value). These values generally improve as
ERDC TR-13-13 29
the thermal mass of the walls in buildings increase. Energy efficiency is important for any FOB because increased energy efficiency means lower costs to sustain the structure. This factor is largely determined by the type of material that makes up the structure. Materials with higher r-values (e.g., thick adobe walls) will retain more heat in the winter and keep exces-sive heat out in the summer . For buildings with large r-values, heating and cooling requirements are reduced. For climates with large tempera-ture swings over a full day or throughout the year, high r-values are of great importance in reducing energy life-cycle cost. Also, the direction in which the structure faces and the placement of windows can reduce energy requirements based on the wind and how the sunlight arrives at the struc-ture.
Space utilization can play a role in general functionality. Wasted space can occur in buildings such as k-spans because the outer edge of the walls be-come unusable due to the way in which the wall meets the ground. Ex-tremely thick walls, such as those in buildings constructed out of Hesco bastions, will also come with an inherent loss of interior space.
Facility maintenance also is accounted for in the functionality factor. The more severe the climate—excessive heat or extreme amounts of rainfall for example—the more often maintenance will be required. Materials of lower durability need maintenance more often than durable ones to avoid reduc-tion of structural integrity. Coatings for UV protection and waterproofing may need to be reapplied periodically throughout the life of the structure. Various maintenance inspections must be performed regularly to ensure that the building envelope is intact, utility connections are adequate, etc.
One of the most important factors throughout the length of operation is the quality of life for the soldier. Sleeping arrangements can greatly impact quality of life. Individual rooms improve quality of life. Heaters, air condi-tioners, and windows allow occupants to control thermal comfort. General climate characteristics can also affect the quality of life for a soldier (e.g., locations with continual rain can reduce morale). The quality of life made possible by FOB facilities has a direct impact on soldier physical and psy-chological wellbeing.
Soldier quality of life also extends to the quality of the experience of being inside the building. The Leadership in Energy and Environmental Design (LEED) certification program for new construction and major renovations,
ERDC TR-13-13 30
established by the US Green Building Council, provides a rating system for assessing indoor environmental quality. This system could be adopted into the planning and design of interior spaces of FOB facilities to increase sol-dier quality of life, However, the likely increase in construction costs would outweigh the positive impacts on soldier quality of life. Incorporat-ing LEED standards would increase the construction factor while only fractionally reducing the functionality factor, the net result of which would be to increase the overall Indigenity Index. This means that the inclusion of LEED requirements would hinder the sustainability of structures built in FOB facilities, using the definition of sustainability established in sec-tion 2.3. The use of indigenous building design and functionality in gen-eral could contribute to the achievement of higher ratings in the LEED rat-ing system for indoor environmental quality, but again, building to LEED standards in theater would unacceptably increase the Indigenity Index.
With regard to thermal comfort, traditional indigenous building styles are dependent on passive cooling and heating technology and make use of natural ventilation and introduction of daylight into living spaces. Fur-thermore, emissions from adhesives and sealants, paints and coatings, flooring systems, composite wood and agrifiber products, and indoor chemical and pollutant sources are 20th century western-society additions to the indoor environment. For example, research on the performance of traditional buildings in hot, arid climates discusses the scientific results of employing passive cooling strategies, such as ventilated interior court-yards, wind towers, and heavy wall and roof construction in adobe build-ings (Fardeheb 1987; Al-Hemiddi and Al-Saud 2001; Ghaemmaghami and Mahmoudi 2005; Safarzadeh and Bahadori 2005). Feriadi and Wong (2004) investigate the function of naturally ventilated houses in hot, hu-mid Indonesia and document how the residents experience and maintain thermal comfort. It would be useful to further explore this line of research results for possible incorporation into an Army strategy for taking ad-vantage of ICM and traditional architecture functionality in the construc-tion of sustainable and comfortable FOB facilities.
3.5 Disposal factor
The disposal depends on what is done with the structure after its useful military life comes to an end. The most sustainable and environmentally sensitive decision would be to hand over the facility to the local popula-tion. For this to be possible, the structure must incorporate local design aspects and be maintainable by the local population. A structure built with
ERDC TR-13-13 31
materials and technologies that cannot be maintained using local capabili-ties and knowledge will provide no useful benefit for the recipients. If the structure can be handed over to the local population, however, the military avoids costs that would have been required for labor, equipment, and transportation related to facility disposal.
In the event that local handover is not possible, the military will have to demolish the structure. If the demolition rubble is not left in place, it will have to be recycled or hauled to a landfill. These options require equip-ment, labor, and probably motor vehicles for waste transportation. Vehi-cles will not be needed if the structure to be demolished is built entirely from naturally occurring inert materials such as clay, mud, or other mate-rials whose debris will not adversely affect the environment. All other ma-terials should be recycled if possible to minimize impact on the environ-ment and local residents. All other materials must be disposed of at a landfill or other location acceptable to the local government, including hazardous materials.
ERDC TR-13-13 32
4 Structural and Constructability Characteristics
This chapter explains the structural properties and constructability of sev-eral types of conventional and indigenous building materials. Adobe, com-pressed-earth blocks, soil-cement blocks, and Hesco bastions are com-pared with more commonly used construction technologies, such as wood (used in the standard military barracks-hut, or B-Hut), concrete masonry units (CMUs), traditional and mortarless bricks, steel k-spans, foam, and containerized housing units (CHUs) based on metal shipping containers. Adobe, CEBs, and Hesco bastions are the most viable and indigenous op-tions for use in Sudan, so they are extensively discussed in this report.
4.1 Required structural properties
Structural integrity is one of the most important structural properties of any military building in foreign territory. Structural integrity ensures that the building can handle the loads associated with daily activities, as well as location-specific risks such as earthquakes and heavy winds, through the interaction of all the structural and nonstructural elements. Integrity can be assured through the use of appropriately engineered foundations and stabilized soil as well as reinforcement detailing and good overall con-struction quality .
The next-most important structural property for a military structure is force protection. This property resists harm to building occupants and contents from ballistic weapons, explosions, and heavy object impacts such as motor vehicles.
Closely related to the first two required properties is safety, which is em-bodied in a building by the inclusion of fire-resistance, egress, and compli-ance with safety codes.
Other important structural properties include constructability and scala-bility. Constructability is a measure of how advanced the required tools and equipment must be to build with the material, the skill levels needed by the constructors, and the timeframe required to finish construction. Scalability addresses how easily a structure of a certain material can be
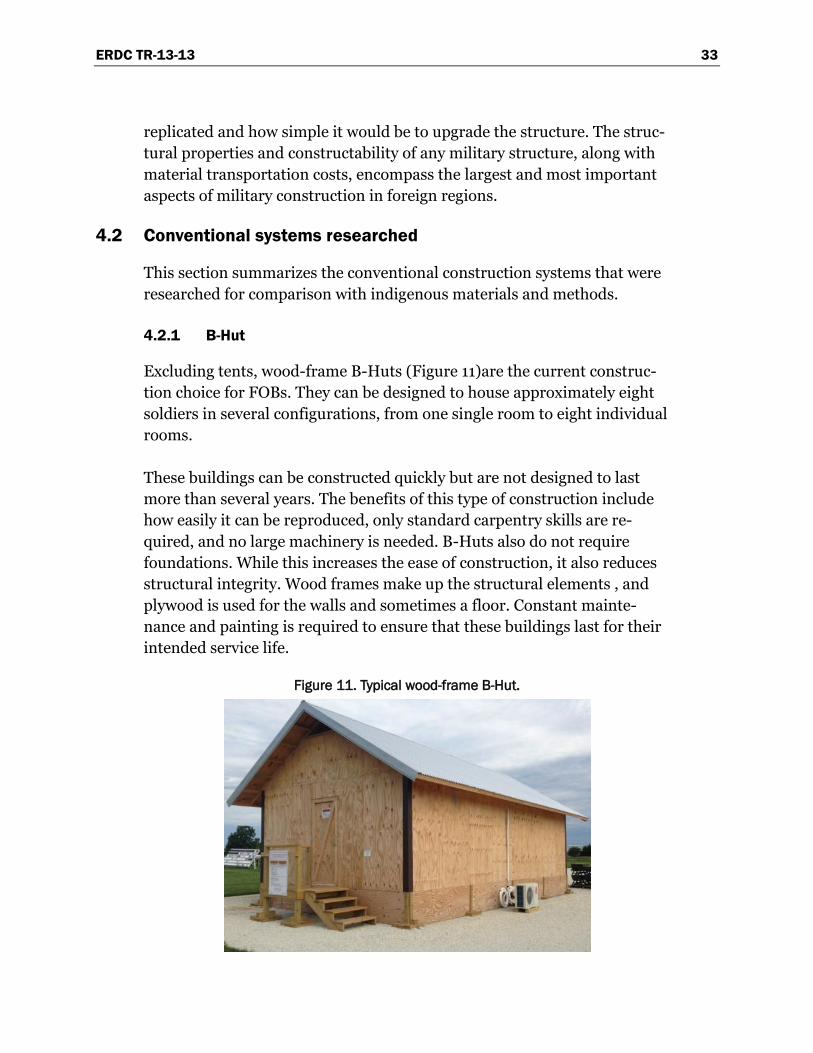
ERDC TR-13-13 33
replicated and how simple it would be to upgrade the structure. The struc-tural properties and constructability of any military structure, along with material transportation costs, encompass the largest and most important aspects of military construction in foreign regions.
4.2 Conventional systems researched
This section summarizes the conventional construction systems that were researched for comparison with indigenous materials and methods.
4.2.1 B-Hut
Excluding tents, wood-frame B-Huts (Figure 11)are the current construc-tion choice for FOBs. They can be designed to house approximately eight soldiers in several configurations, from one single room to eight individual rooms.
These buildings can be constructed quickly but are not designed to last more than several years. The benefits of this type of construction include how easily it can be reproduced, only standard carpentry skills are re-quired, and no large machinery is needed. B-Huts also do not require foundations. While this increases the ease of construction, it also reduces structural integrity. Wood frames make up the structural elements , and plywood is used for the walls and sometimes a floor. Constant mainte-nance and painting is required to ensure that these buildings last for their intended service life.
Figure 11. Typical wood-frame B-Hut.
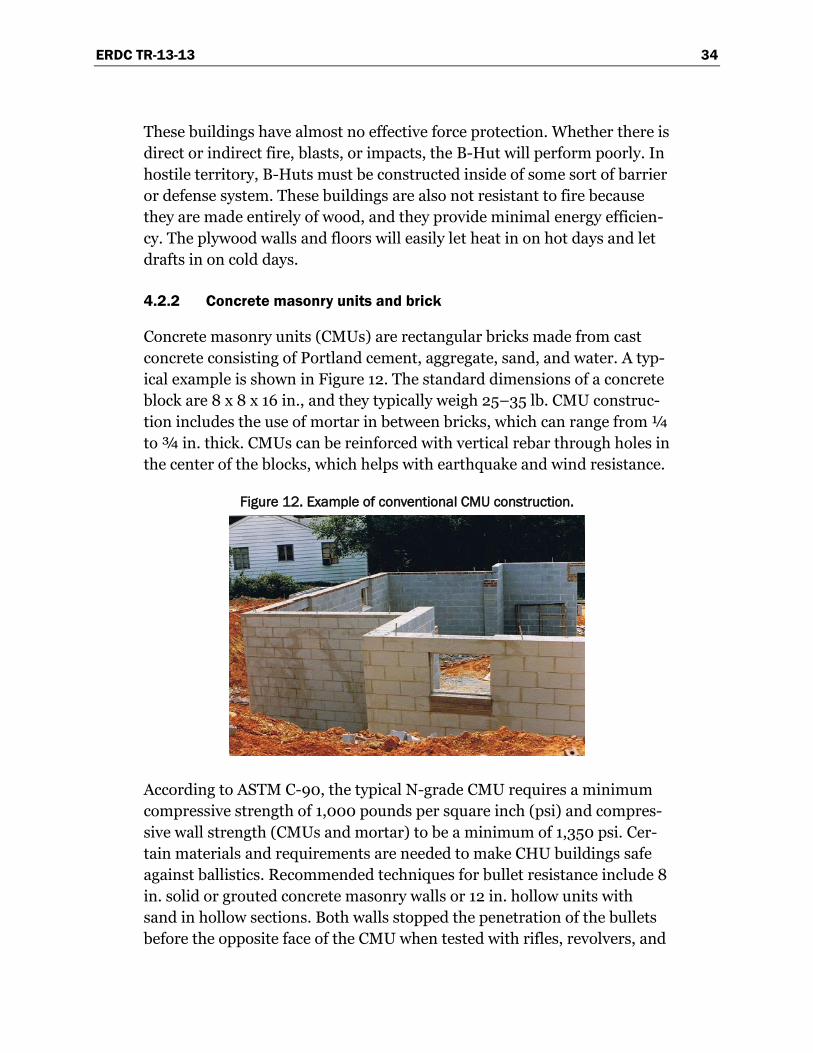
ERDC TR-13-13 34
These buildings have almost no effective force protection. Whether there is direct or indirect fire, blasts, or impacts, the B-Hut will perform poorly. In hostile territory, B-Huts must be constructed inside of some sort of barrier or defense system. These buildings are also not resistant to fire because they are made entirely of wood, and they provide minimal energy efficien-cy. The plywood walls and floors will easily let heat in on hot days and let drafts in on cold days.
4.2.2 Concrete masonry units and brick
Concrete masonry units (CMUs) are rectangular bricks made from cast concrete consisting of Portland cement, aggregate, sand, and water. A typ-ical example is shown in Figure 12. The standard dimensions of a concrete block are 8 x 8 x 16 in., and they typically weigh 25–35 lb. CMU construc-tion includes the use of mortar in between bricks, which can range from ¼ to ¾ in. thick. CMUs can be reinforced with vertical rebar through holes in the center of the blocks, which helps with earthquake and wind resistance.
Figure 12. Example of conventional CMU construction.
According to ASTM C-90, the typical N-grade CMU requires a minimum compressive strength of 1,000 pounds per square inch (psi) and compres-sive wall strength (CMUs and mortar) to be a minimum of 1,350 psi. Cer-tain materials and requirements are needed to make CHU buildings safe against ballistics. Recommended techniques for bullet resistance include 8 in. solid or grouted concrete masonry walls or 12 in. hollow units with sand in hollow sections. Both walls stopped the penetration of the bullets before the opposite face of the CMU when tested with rifles, revolvers, and
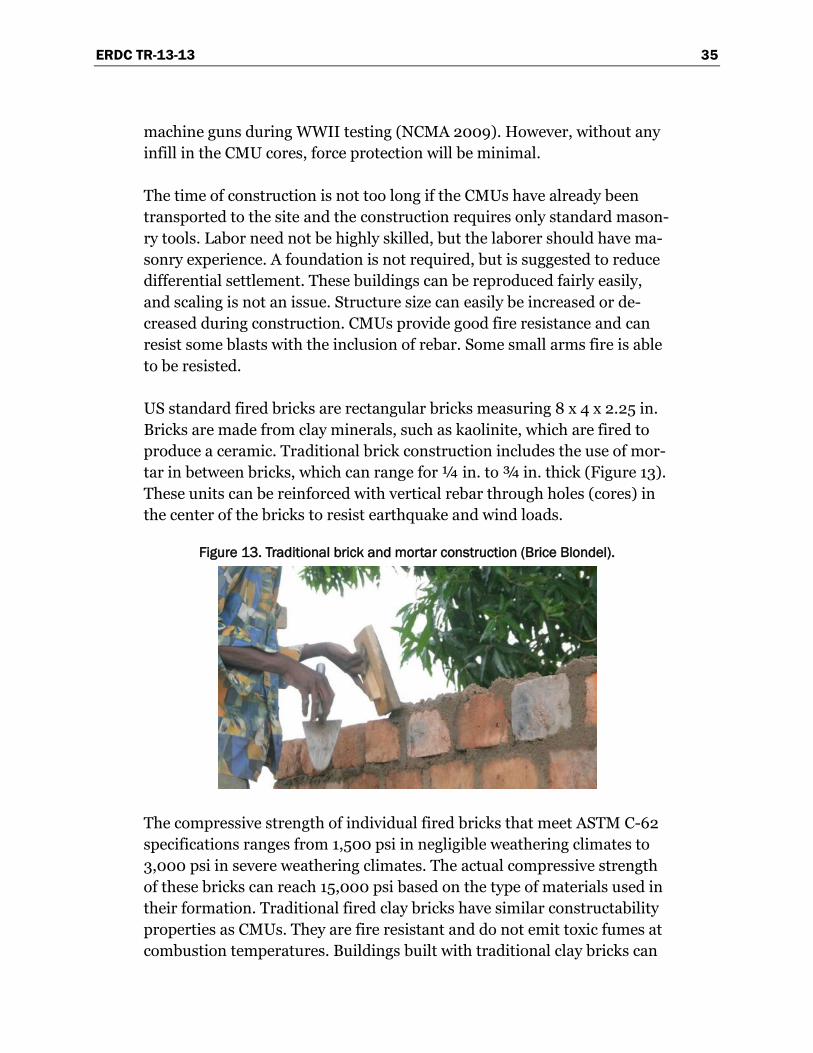
ERDC TR-13-13 35
machine guns during WWII testing (NCMA 2009). However, without any infill in the CMU cores, force protection will be minimal.
The time of construction is not too long if the CMUs have already been transported to the site and the construction requires only standard mason-ry tools. Labor need not be highly skilled, but the laborer should have ma-sonry experience. A foundation is not required, but is suggested to reduce differential settlement. These buildings can be reproduced fairly easily, and scaling is not an issue. Structure size can easily be increased or de-creased during construction. CMUs provide good fire resistance and can resist some blasts with the inclusion of rebar. Some small arms fire is able to be resisted.
US standard fired bricks are rectangular bricks measuring 8 x 4 x 2.25 in. Bricks are made from clay minerals, such as kaolinite, which are fired to produce a ceramic. Traditional brick construction includes the use of mor-tar in between bricks, which can range for ¼ in. to ¾ in. thick (Figure 13). These units can be reinforced with vertical rebar through holes (cores) in the center of the bricks to resist earthquake and wind loads.
Figure 13. Traditional brick and mortar construction (Brice Blondel).
The compressive strength of individual fired bricks that meet ASTM C-62 specifications ranges from 1,500 psi in negligible weathering climates to 3,000 psi in severe weathering climates. The actual compressive strength of these bricks can reach 15,000 psi based on the type of materials used in their formation. Traditional fired clay bricks have similar constructability properties as CMUs. They are fire resistant and do not emit toxic fumes at combustion temperatures. Buildings built with traditional clay bricks can
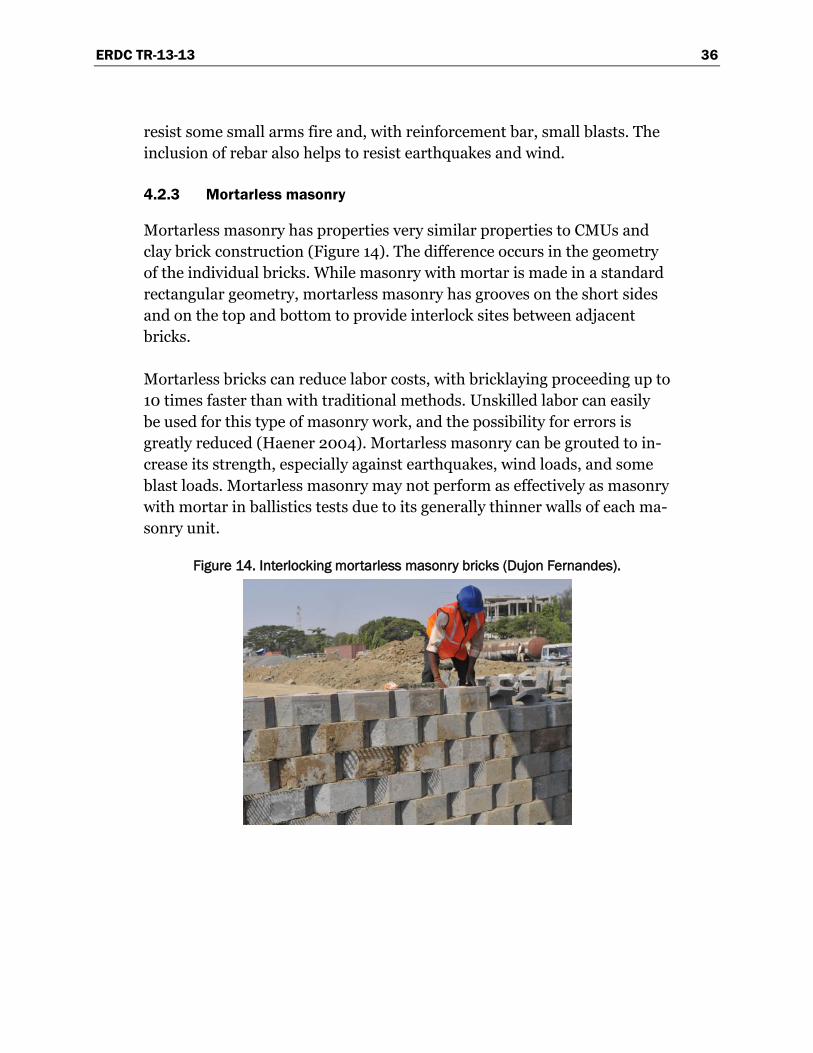
ERDC TR-13-13 36
resist some small arms fire and, with reinforcement bar, small blasts. The inclusion of rebar also helps to resist earthquakes and wind.
4.2.3 Mortarless masonry
Mortarless masonry has properties very similar properties to CMUs and clay brick construction (Figure 14). The difference occurs in the geometry of the individual bricks. While masonry with mortar is made in a standard rectangular geometry, mortarless masonry has grooves on the short sides and on the top and bottom to provide interlock sites between adjacent bricks.
Mortarless bricks can reduce labor costs, with bricklaying proceeding up to 10 times faster than with traditional methods. Unskilled labor can easily be used for this type of masonry work, and the possibility for errors is greatly reduced (Haener 2004). Mortarless masonry can be grouted to in-crease its strength, especially against earthquakes, wind loads, and some blast loads. Mortarless masonry may not perform as effectively as masonry with mortar in ballistics tests due to its generally thinner walls of each ma-sonry unit.
Figure 14. Interlocking mortarless masonry bricks (Dujon Fernandes).
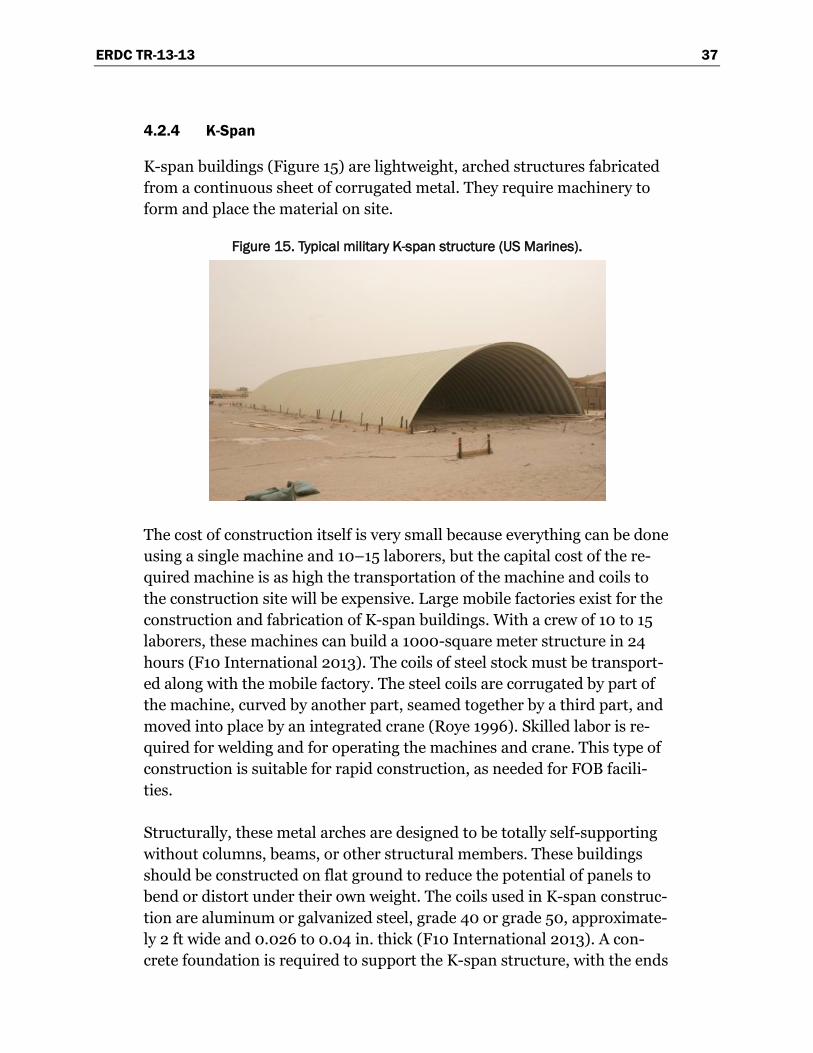
ERDC TR-13-13 37
4.2.4 K-Span
K-span buildings (Figure 15) are lightweight, arched structures fabricated from a continuous sheet of corrugated metal. They require machinery to form and place the material on site.
Figure 15. Typical military K-span structure (US Marines).
The cost of construction itself is very small because everything can be done using a single machine and 10–15 laborers, but the capital cost of the re-quired machine is as high the transportation of the machine and coils to the construction site will be expensive. Large mobile factories exist for the construction and fabrication of K-span buildings. With a crew of 10 to 15 laborers, these machines can build a 1000-square meter structure in 24 hours (F10 International 2013). The coils of steel stock must be transport-ed along with the mobile factory. The steel coils are corrugated by part of the machine, curved by another part, seamed together by a third part, and moved into place by an integrated crane (Roye 1996). Skilled labor is re-quired for welding and for operating the machines and crane. This type of construction is suitable for rapid construction, as needed for FOB facili-ties.
Structurally, these metal arches are designed to be totally self-supporting without columns, beams, or other structural members. These buildings should be constructed on flat ground to reduce the potential of panels to bend or distort under their own weight. The coils used in K-span construc-tion are aluminum or galvanized steel, grade 40 or grade 50, approximate-ly 2 ft wide and 0.026 to 0.04 in. thick (F10 International 2013). A con-crete foundation is required to support the K-span structure, with the ends
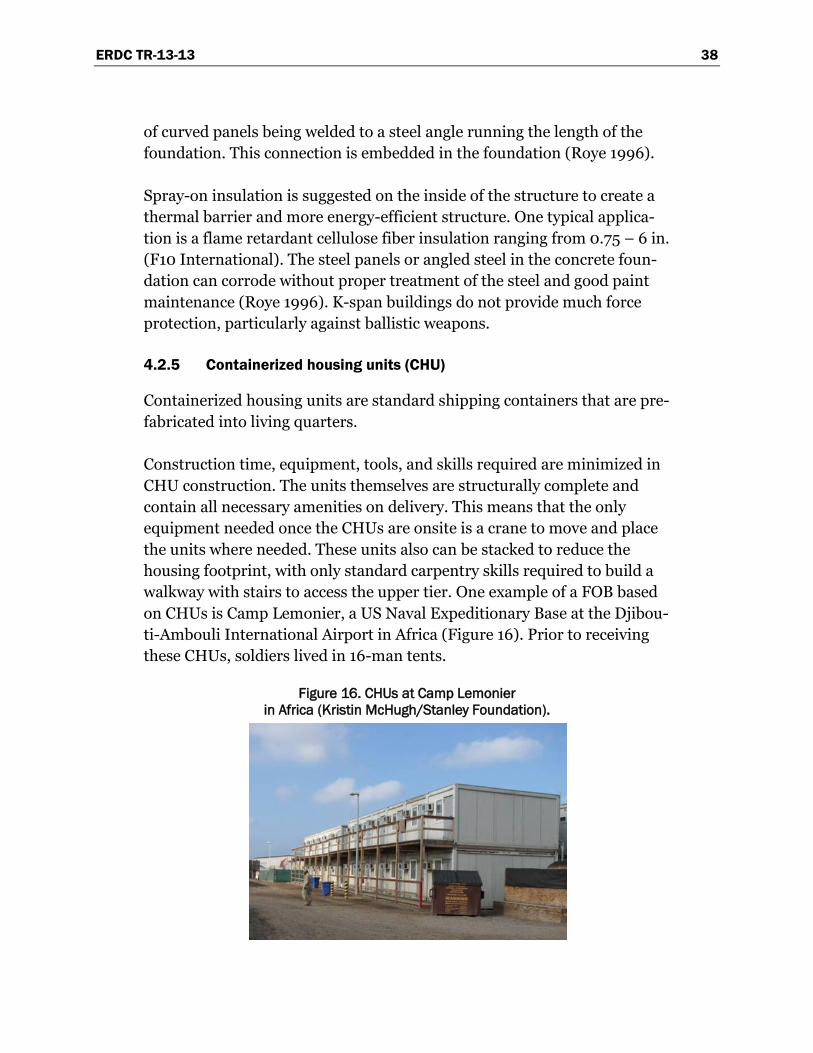
ERDC TR-13-13 38
of curved panels being welded to a steel angle running the length of the foundation. This connection is embedded in the foundation (Roye 1996).
Spray-on insulation is suggested on the inside of the structure to create a thermal barrier and more energy-efficient structure. One typical applica-tion is a flame retardant cellulose fiber insulation ranging from 0.75 – 6 in. (F10 International). The steel panels or angled steel in the concrete foun-dation can corrode without proper treatment of the steel and good paint maintenance (Roye 1996). K-span buildings do not provide much force protection, particularly against ballistic weapons.
4.2.5 Containerized housing units (CHU)
Containerized housing units are standard shipping containers that are pre-fabricated into living quarters.
Construction time, equipment, tools, and skills required are minimized in CHU construction. The units themselves are structurally complete and contain all necessary amenities on delivery. This means that the only equipment needed once the CHUs are onsite is a crane to move and place the units where needed. These units also can be stacked to reduce the housing footprint, with only standard carpentry skills required to build a walkway with stairs to access the upper tier. One example of a FOB based on CHUs is Camp Lemonier, a US Naval Expeditionary Base at the Djibou-ti-Ambouli International Airport in Africa (Figure 16). Prior to receiving these CHUs, soldiers lived in 16-man tents.
Figure 16. CHUs at Camp Lemonier in Africa (Kristin McHugh/Stanley Foundation).
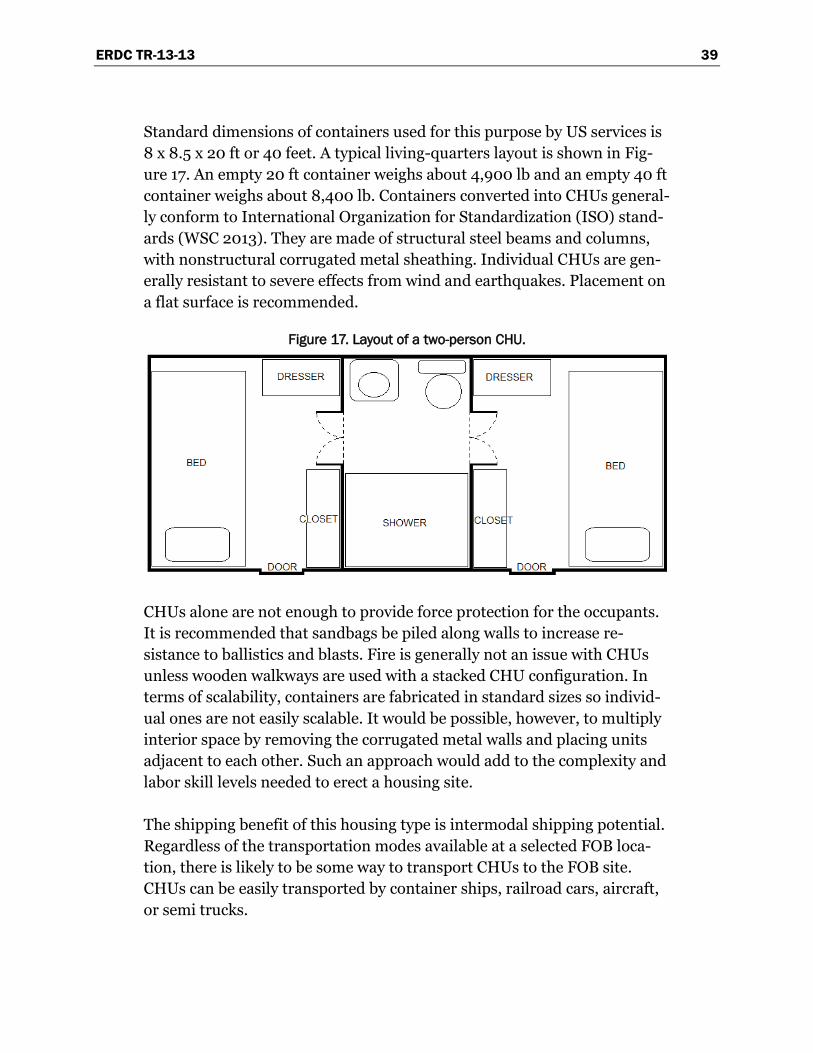
ERDC TR-13-13 39
Standard dimensions of containers used for this purpose by US services is 8 x 8.5 x 20 ft or 40 feet. A typical living-quarters layout is shown in Fig-ure 17. An empty 20 ft container weighs about 4,900 lb and an empty 40 ft container weighs about 8,400 lb. Containers converted into CHUs general-ly conform to International Organization for Standardization (ISO) stand-ards (WSC 2013). They are made of structural steel beams and columns, with nonstructural corrugated metal sheathing. Individual CHUs are gen-erally resistant to severe effects from wind and earthquakes. Placement on a flat surface is recommended.
Figure 17. Layout of a two-person CHU.
CHUs alone are not enough to provide force protection for the occupants. It is recommended that sandbags be piled along walls to increase re-sistance to ballistics and blasts. Fire is generally not an issue with CHUs unless wooden walkways are used with a stacked CHU configuration. In terms of scalability, containers are fabricated in standard sizes so individ-ual ones are not easily scalable. It would be possible, however, to multiply interior space by removing the corrugated metal walls and placing units adjacent to each other. Such an approach would add to the complexity and labor skill levels needed to erect a housing site.
The shipping benefit of this housing type is intermodal shipping potential. Regardless of the transportation modes available at a selected FOB loca-tion, there is likely to be some way to transport CHUs to the FOB site. CHUs can be easily transported by container ships, railroad cars, aircraft, or semi trucks.
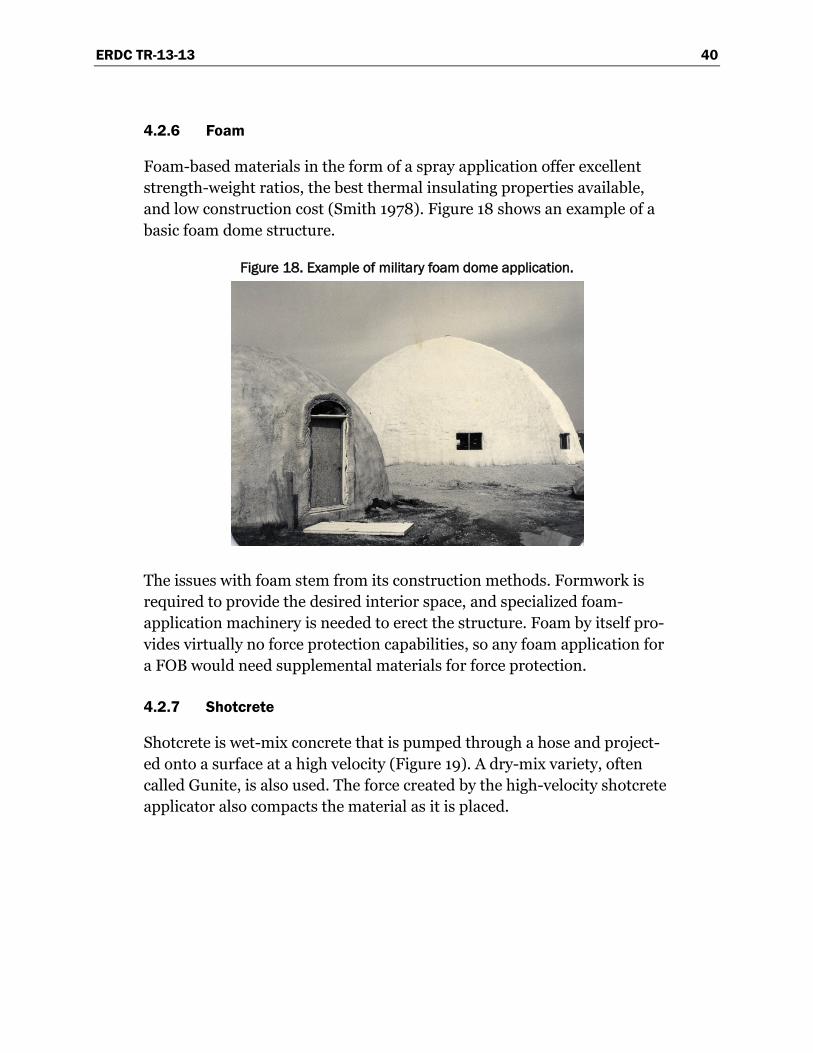
ERDC TR-13-13 40
4.2.6 Foam
Foam-based materials in the form of a spray application offer excellent strength-weight ratios, the best thermal insulating properties available, and low construction cost (Smith 1978). Figure 18 shows an example of a basic foam dome structure.
Figure 18. Example of military foam dome application.
The issues with foam stem from its construction methods. Formwork is required to provide the desired interior space, and specialized foam-application machinery is needed to erect the structure. Foam by itself pro-vides virtually no force protection capabilities, so any foam application for a FOB would need supplemental materials for force protection.
4.2.7 Shotcrete
Shotcrete is wet-mix concrete that is pumped through a hose and project-ed onto a surface at a high velocity (Figure 19). A dry-mix variety, often called Gunite, is also used. The force created by the high-velocity shotcrete applicator also compacts the material as it is placed.
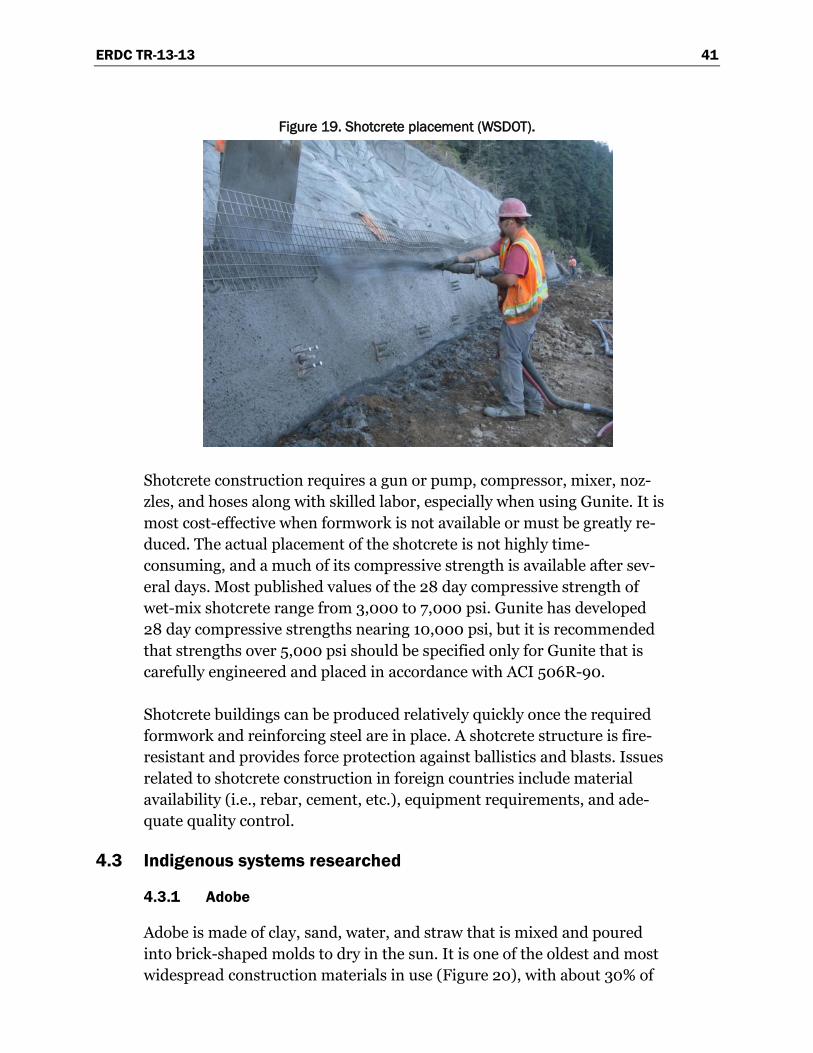
ERDC TR-13-13 41
Figure 19. Shotcrete placement (WSDOT).
Shotcrete construction requires a gun or pump, compressor, mixer, noz-zles, and hoses along with skilled labor, especially when using Gunite. It is most cost-effective when formwork is not available or must be greatly re-duced. The actual placement of the shotcrete is not highly time-consuming, and a much of its compressive strength is available after sev-eral days. Most published values of the 28 day compressive strength of wet-mix shotcrete range from 3,000 to 7,000 psi. Gunite has developed 28 day compressive strengths nearing 10,000 psi, but it is recommended that strengths over 5,000 psi should be specified only for Gunite that is carefully engineered and placed in accordance with ACI 506R-90.
Shotcrete buildings can be produced relatively quickly once the required formwork and reinforcing steel are in place. A shotcrete structure is fire-resistant and provides force protection against ballistics and blasts. Issues related to shotcrete construction in foreign countries include material availability (i.e., rebar, cement, etc.), equipment requirements, and ade-quate quality control.
4.3 Indigenous systems researched
4.3.1 Adobe
Adobe is made of clay, sand, water, and straw that is mixed and poured into brick-shaped molds to dry in the sun. It is one of the oldest and most widespread construction materials in use (Figure 20), with about 30% of
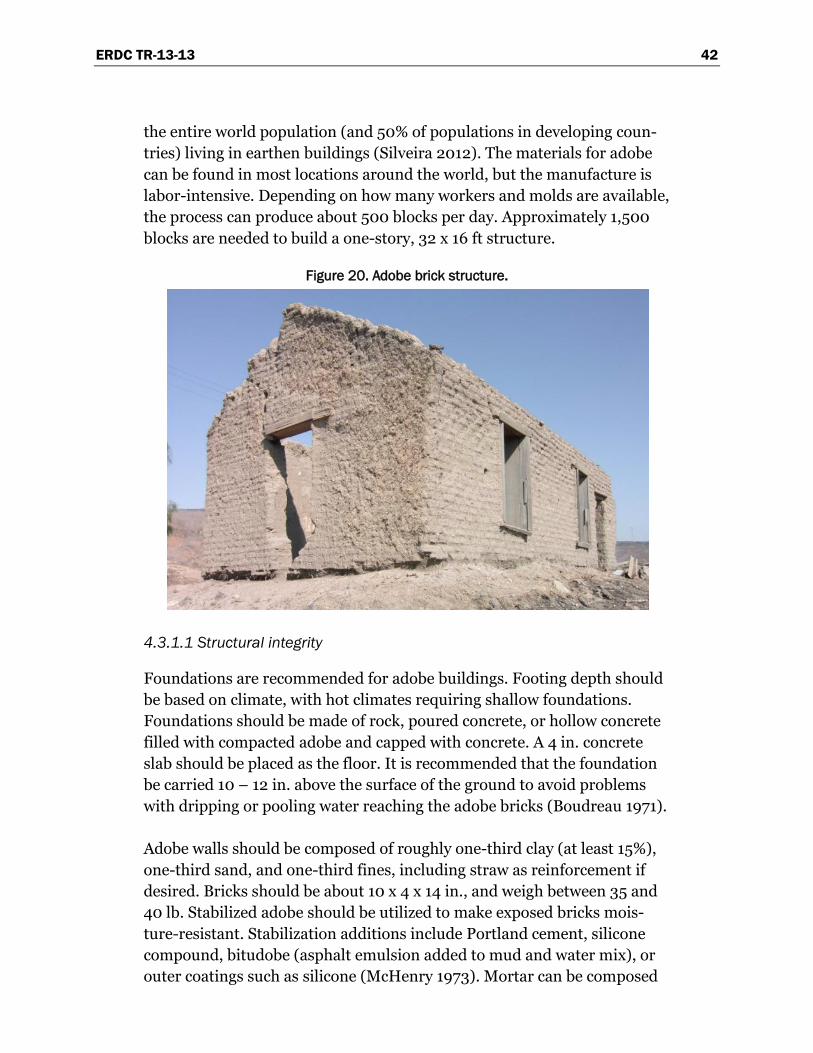
ERDC TR-13-13 42
the entire world population (and 50% of populations in developing coun-tries) living in earthen buildings (Silveira 2012). The materials for adobe can be found in most locations around the world, but the manufacture is labor-intensive. Depending on how many workers and molds are available, the process can produce about 500 blocks per day. Approximately 1,500 blocks are needed to build a one-story, 32 x 16 ft structure.
Figure 20. Adobe brick structure.
4.3.1.1 Structural integrity
Foundations are recommended for adobe buildings. Footing depth should be based on climate, with hot climates requiring shallow foundations. Foundations should be made of rock, poured concrete, or hollow concrete filled with compacted adobe and capped with concrete. A 4 in. concrete slab should be placed as the floor. It is recommended that the foundation be carried 10 – 12 in. above the surface of the ground to avoid problems with dripping or pooling water reaching the adobe bricks (Boudreau 1971).
Adobe walls should be composed of roughly one-third clay (at least 15%), one-third sand, and one-third fines, including straw as reinforcement if desired. Bricks should be about 10 x 4 x 14 in., and weigh between 35 and 40 lb. Stabilized adobe should be utilized to make exposed bricks mois-ture-resistant. Stabilization additions include Portland cement, silicone compound, bitudobe (asphalt emulsion added to mud and water mix), or outer coatings such as silicone (McHenry 1973). Mortar can be composed
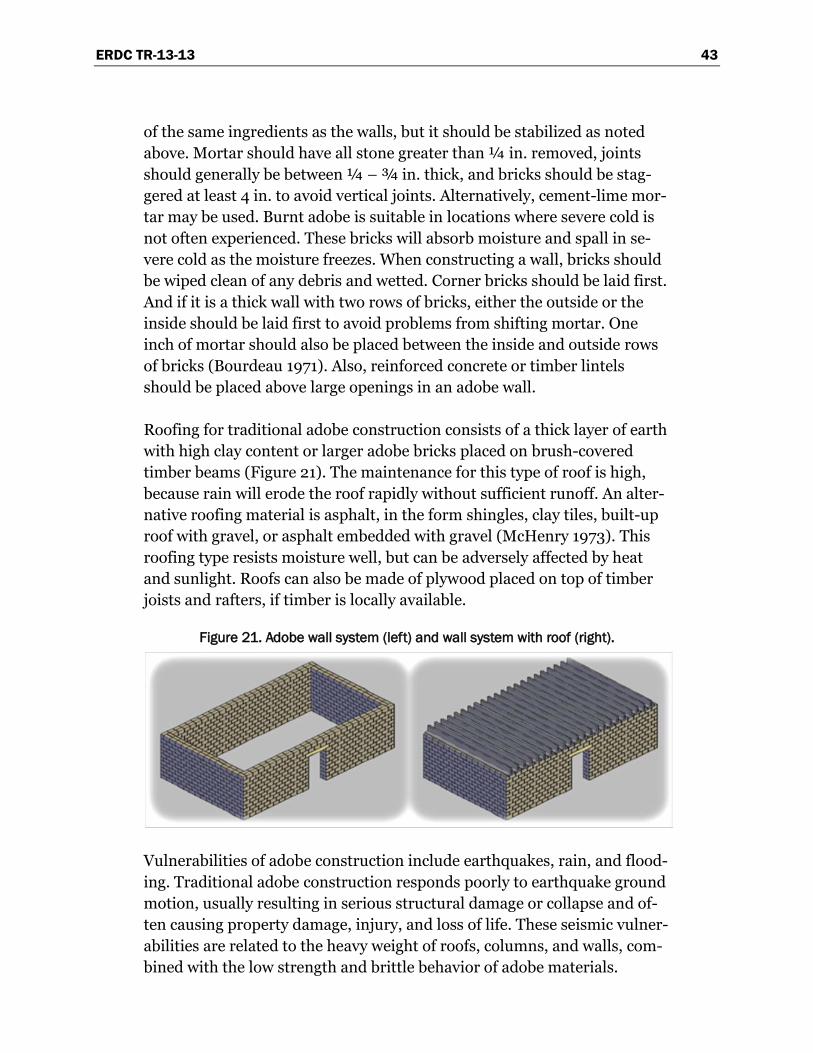
ERDC TR-13-13 43
of the same ingredients as the walls, but it should be stabilized as noted above. Mortar should have all stone greater than ¼ in. removed, joints should generally be between ¼ – ¾ in. thick, and bricks should be stag-gered at least 4 in. to avoid vertical joints. Alternatively, cement-lime mor-tar may be used. Burnt adobe is suitable in locations where severe cold is not often experienced. These bricks will absorb moisture and spall in se-vere cold as the moisture freezes. When constructing a wall, bricks should be wiped clean of any debris and wetted. Corner bricks should be laid first. And if it is a thick wall with two rows of bricks, either the outside or the inside should be laid first to avoid problems from shifting mortar. One inch of mortar should also be placed between the inside and outside rows of bricks (Bourdeau 1971). Also, reinforced concrete or timber lintels should be placed above large openings in an adobe wall.
Roofing for traditional adobe construction consists of a thick layer of earth with high clay content or larger adobe bricks placed on brush-covered timber beams (Figure 21). The maintenance for this type of roof is high, because rain will erode the roof rapidly without sufficient runoff. An alter-native roofing material is asphalt, in the form shingles, clay tiles, built-up roof with gravel, or asphalt embedded with gravel (McHenry 1973). This roofing type resists moisture well, but can be adversely affected by heat and sunlight. Roofs can also be made of plywood placed on top of timber joists and rafters, if timber is locally available.
Figure 21. Adobe wall system (left) and wall system with roof (right).
Vulnerabilities of adobe construction include earthquakes, rain, and flood-ing. Traditional adobe construction responds poorly to earthquake ground motion, usually resulting in serious structural damage or collapse and of-ten causing property damage, injury, and loss of life. These seismic vulner-abilities are related to the heavy weight of roofs, columns, and walls, com-bined with the low strength and brittle behavior of adobe materials.
ERDC TR-13-13 44
Typical failure modes during earthquakes include severe cracking of walls, separation of walls at the corners, and separation of roofs from the walls. These failures often lead to partial or complete collapse. Many improve-ments can be incorporated into the design and construction of new adobe buildings to help increase their performance during seismic motion. Most of these are achieved through quality construction, engineered building layout, and the use of improved building technologies, including seismic reinforcement.
The quality of construction along with the adobe block composition plays the most important role in seismic performance. The clay component of the soil is highly important because the clay provides the dry strength of the soil. To ensure an adequate amount of clay is present, a variety of tests can be preformed. One such test, the “dry strength test,” involves forming at least three 2 cm diameter balls, drying them for at least 24 hours, and crushing them between the fingers. If none of the balls is broken, the soil is adequate. Another composition requirement includes straw and coarse sand additives. These materials reduce micro-cracking in the mortar, and allow for strong masonry. Methods for increasing the quality of construc-tion include storing the mud for a few days in the shade before fabrication to allow for better distribution of water to increase the cohesive properties; and wetting the bricks before laying to provide better cohesion with the mortar. All foreign matter should also be removed from the soil to ensure uniform distribution of important particles.
A robust building layout plays an important role for adobe to resist earth-quake motion. Only one-story buildings should be built, and they should be placed on a firm foundation with an insulated, lightweight roof instead of a heavy, compacted-earth roof. The wall layout should provide mutual support through cross walls and intersecting walls at regular intervals, with openings kept small and well-spaced in the walls. Dimensional rec-ommendations include a wall height limited to eight times the wall thick-ness, or 3.5 m; unsupported wall lengths limited to ten times the wall thickness, or 7 m; wall openings no larger than one-third total wall length, 1.2 m maximum opening width; and 1.2 m-wide piers between openings.
Improved building technologies is a key factor in the design of earthquake-resistant adobe buildings. To increase the ductility of adobe buildings, hor-izontal and vertical reinforcing should be used. The reinforcement can be made up of any ductile material, including bamboo, reeds, cane, vines,
ERDC TR-13-13 45
rope, timber, chicken wire, barbed wire, or steel bars. This reinforcement will resist bending moments and shear stresses, and will tie the founda-tion, ring beams, roofs, and walls together. The adobe brick layout can be designed to include this reinforcing in the mortar joints. Drilling through bricks for vertical reinforcing is allowable as well. Timber or concrete ring beams, collars that tie the walls in a boxlike structure, are also suggested to ensure good seismic performance. These ring beams are placed along the tops of walls, providing tensile strength to the adobe, particularly at joints and between walls. Along with the reinforcing, buttresses or pilas-ters can be used to increase stability and stress resistance. These features should be placed at corners and intermediate locations along the wall to act as perpendicular braces (Blondet 2003).
4.3.1.2 Safety
Adobe building codes can be currently found in the Uniform Building Code and the International Building Code (IBC). Individual states and countries also have their own building codes, with NZS 4298 in New Zealand, NTE E.080 in Peru, and 14.7.4 NMAC in New Mexico being the most compre-hensive. The minimum compressive strength required based on the New Mexico Earthen Building Materials Code is 300 psi, with one sample al-lowed to be as low as 250 psi. According to the New Zealand code and the Peruvian code, the least of the individual compressive strengths must be great than 0.7 x 189 psi and 80% of tested specimens must have a com-pressive strength greater than 0.7 x 171 psi, respectively. For tensile strength in accordance with the New Mexico and New Zealand code, mean tensile strength must be at least 50 psi and the least of individual results must be greater than 36 psi, respectively (Silveira 2012). Adobe is resistant to fire because it consists mostly of earth.
4.3.1.3 Force protection
The thicker the walls of an adobe structure, the better force protection they provide. Adobe walls can stop some small arms fire.
4.3.1.4 Constructability
Equipment required for the forming of adobe bricks includes brick molds, shovels for moving the mud mix into molds, and some type of mixer. If foundations are included in the design, excavation equipment would be
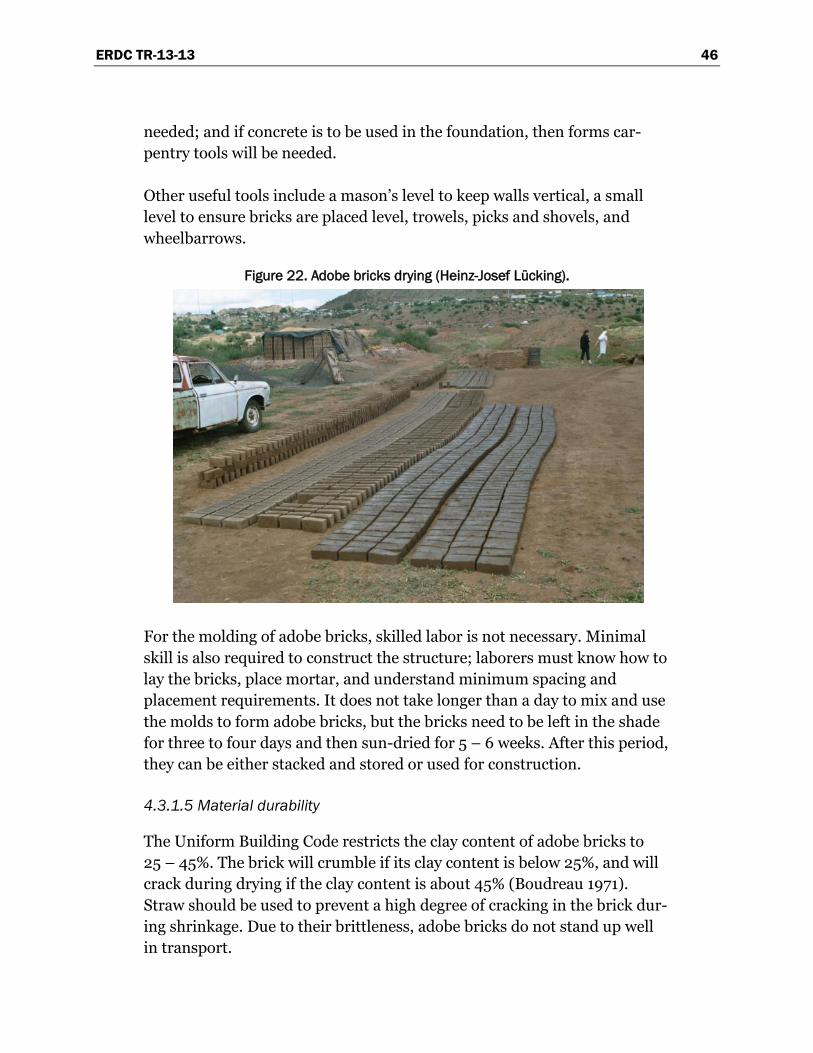
ERDC TR-13-13 46
needed; and if concrete is to be used in the foundation, then forms car-pentry tools will be needed.
Other useful tools include a mason’s level to keep walls vertical, a small level to ensure bricks are placed level, trowels, picks and shovels, and wheelbarrows.
Figure 22. Adobe bricks drying (Heinz-Josef Lücking).
For the molding of adobe bricks, skilled labor is not necessary. Minimal skill is also required to construct the structure; laborers must know how to lay the bricks, place mortar, and understand minimum spacing and placement requirements. It does not take longer than a day to mix and use the molds to form adobe bricks, but the bricks need to be left in the shade for three to four days and then sun-dried for 5 – 6 weeks. After this period, they can be either stacked and stored or used for construction.
4.3.1.5 Material durability
The Uniform Building Code restricts the clay content of adobe bricks to 25 – 45%. The brick will crumble if its clay content is below 25%, and will crack during drying if the clay content is about 45% (Boudreau 1971). Straw should be used to prevent a high degree of cracking in the brick dur-ing shrinkage. Due to their brittleness, adobe bricks do not stand up well in transport.

ERDC TR-13-13 47
Adobe walls are capable of providing structural support for many years if they are properly protected from extreme weather. Exterior protective coatings are suggested, even for stabilized adobe, to decrease surface dete-rioration due to sand, wind, and insects. Indigenous protective coatings include mud plaster, whitewash, lime plaster, and stucco. Adobe buildings are also vulnerable to moisture. Adobe materials lose strength when satu-rated, basically reverting to mud. To avoid the destructive effects of mois-ture, the ground should be graded to drain water away from the structure. Also, stabilizers should be applied to bricks, hydrophobic coatings should be applied to walls, the roof should be sloped to shed water. All trees, plants, and vegetation should also be removed from walls and around foundations because vegetation collects and retains water in its roots. Adobe walls also provide good resistance to vermin.
4.3.1.6 Scalability
Adobe bricks can be produced on a small-scale manually at a rate fully de-pendent on the number of workers and molds available. A single laborer with a single mold would be able to produce around 70 bricks measuring 4 x 7.5 x 16 in., or 35 bricks measuring 4 x 12 x 18 in. per 8 hours (Boudreau 1971). Scaling down a structure constructed by Boudreau, a single-story building approximately 32 x 16 ft will require a about 1,300 – 1,500 bricks of the sizes previously mentioned (including variation for different heights), 40 tons of soil for the bricks, and 8 tons of soil for the mortar (dependent on thickness applied).
4.3.2 Compressed-earth block
Compressed-earth blocks (CEBs) are unfired, compressed soil blocks, ex-tracted directly from the ground, that must include clay to hold the blocks in form. Stabilized CEBs should be manufactured from soil containing a minimal quantity of silt and clay, but both components are necessary in a proper amount. According to one manufacturer of CEB fabrication equip-ment, the ideal soil content would consist approximately of 20 – 30% clay (LEGI 2013), but production is possible with 10 – 90% clay. About 85% of the soil worldwide is usable for this system. CEBs are generally produced with a mobile compressing machine that can produce anywhere about 200 to more than 2,000 units per day. CEBs are considered to be an inferior building material in many societies, so low acceptability for use of earthen building materials is common among many groups. Table 4 compares CEB properties with materials used in other systems.
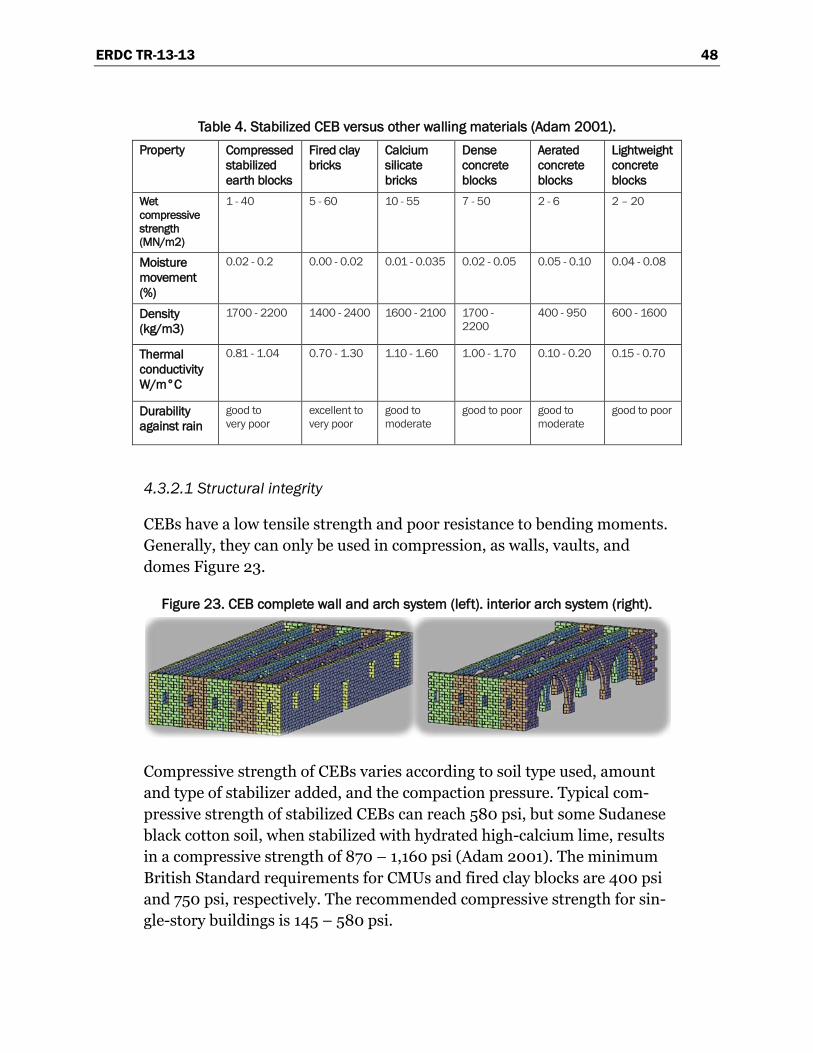
ERDC TR-13-13 48
Table 4. Stabilized CEB versus other walling materials (Adam 2001). Property Compressed
stabilized earth blocks
Fired clay bricks
Calcium silicate bricks
Dense concrete blocks
Aerated concrete blocks
Lightweight concrete blocks
Wet compressive strength (MN/m2)
1 - 40 5 - 60 10 - 55 7 - 50 2 - 6 2 – 20
Moisture movement (%)
0.02 - 0.2 0.00 - 0.02 0.01 - 0.035 0.02 - 0.05 0.05 - 0.10 0.04 - 0.08
Density (kg/m3)
1700 - 2200 1400 - 2400 1600 - 2100 1700 - 2200
400 - 950 600 - 1600
Thermal conductivity W/m°C
0.81 - 1.04 0.70 - 1.30 1.10 - 1.60 1.00 - 1.70 0.10 - 0.20 0.15 - 0.70
Durability against rain
good to very poor
excellent to very poor
good to moderate
good to poor good to moderate
good to poor
4.3.2.1 Structural integrity
CEBs have a low tensile strength and poor resistance to bending moments. Generally, they can only be used in compression, as walls, vaults, and domes Figure 23.
Figure 23. CEB complete wall and arch system (left). interior arch system (right).
Compressive strength of CEBs varies according to soil type used, amount and type of stabilizer added, and the compaction pressure. Typical com-pressive strength of stabilized CEBs can reach 580 psi, but some Sudanese black cotton soil, when stabilized with hydrated high-calcium lime, results in a compressive strength of 870 – 1,160 psi (Adam 2001). The minimum British Standard requirements for CMUs and fired clay blocks are 400 psi and 750 psi, respectively. The recommended compressive strength for sin-gle-story buildings is 145 – 580 psi.
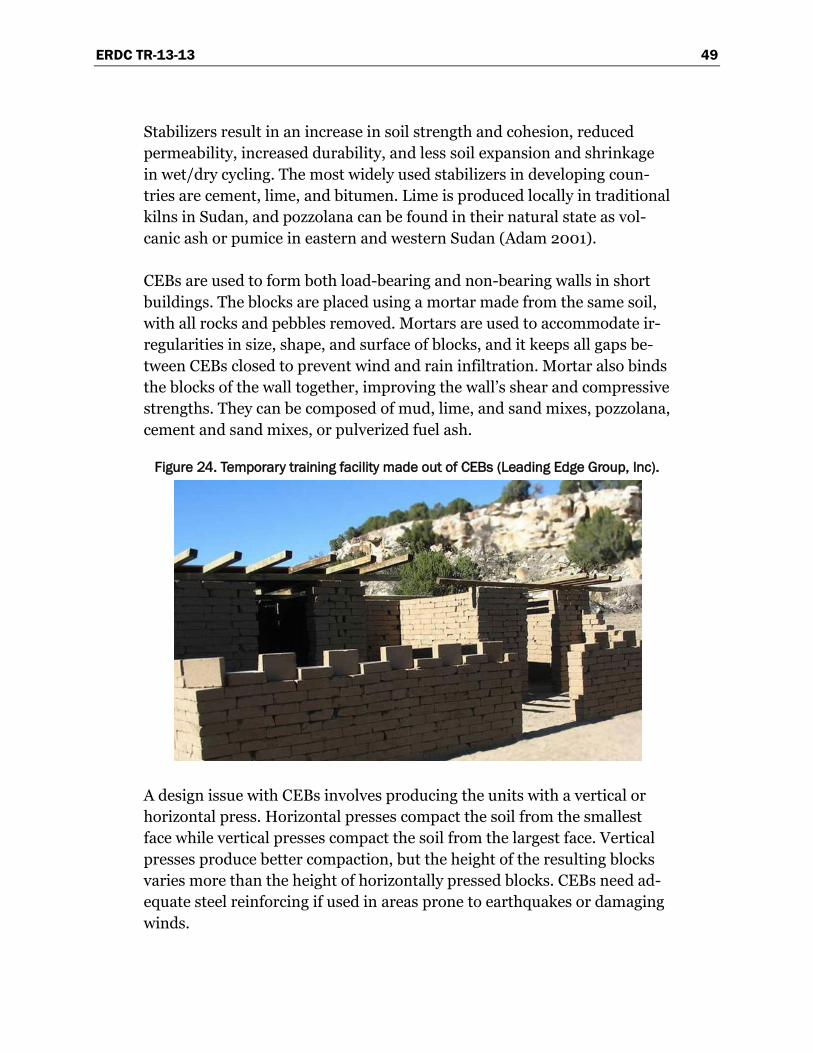
ERDC TR-13-13 49
Stabilizers result in an increase in soil strength and cohesion, reduced permeability, increased durability, and less soil expansion and shrinkage in wet/dry cycling. The most widely used stabilizers in developing coun-tries are cement, lime, and bitumen. Lime is produced locally in traditional kilns in Sudan, and pozzolana can be found in their natural state as vol-canic ash or pumice in eastern and western Sudan (Adam 2001).
CEBs are used to form both load-bearing and non-bearing walls in short buildings. The blocks are placed using a mortar made from the same soil, with all rocks and pebbles removed. Mortars are used to accommodate ir-regularities in size, shape, and surface of blocks, and it keeps all gaps be-tween CEBs closed to prevent wind and rain infiltration. Mortar also binds the blocks of the wall together, improving the wall’s shear and compressive strengths. They can be composed of mud, lime, and sand mixes, pozzolana, cement and sand mixes, or pulverized fuel ash.
Figure 24. Temporary training facility made out of CEBs (Leading Edge Group, Inc).
A design issue with CEBs involves producing the units with a vertical or horizontal press. Horizontal presses compact the soil from the smallest face while vertical presses compact the soil from the largest face. Vertical presses produce better compaction, but the height of the resulting blocks varies more than the height of horizontally pressed blocks. CEBs need ad-equate steel reinforcing if used in areas prone to earthquakes or damaging winds.
ERDC TR-13-13 50
4.3.2.2 Safety
CEB construction is not included in most building codes. As noted in sec-tion 4.3.1.2, however, adobe construction is accepted in building codes throughout the world. The New Mexico Administrative Code also includes a section about CEB construction, which addresses topics such as building limits and required strength properties. CEBs produced by one manufac-turer that was researched can exceed the building strength of non-fired masonry construction materials by a factor of three to five (LEGI 2013). Unstabilized blocks have a compressive strength of 1 – 1.5 kips per square inch (ksi), and stabilized blocks have a compressive strength of 2.5 – 3.9 ksi. The New Mexico Earthen Building Code requires a minimum strength of 0.3 ksi in compression. These CEBs also exceed the earthen block strengths required in the UBC, IBC, the Southern Building Code, and sev-eral others. When compression tests are performed, it is very important to keep in mind how wet the CEBs are, because the wet strength of CEBs may be as low as 2/3 of its dry strength (Adam 2001).
CEBs offer excellent fire resistance to the structure and their constituent materials are noncombustible.
4.3.2.3 Force protection
A benefit of CEBs is their force protection and ballistic resistance capabili-ties. Southwest Research Institute (SwRI) tested a small-scale CEB wall constructed exclusively out of soil against attack with large-caliber ballistic threats, specifically 20 mm and .50 cal fragment-simulating projectiles (FSP). Neither test resulted in perforation of the witness plate*, but the 20 mm rounds did generate spall on the back face of the wall (SwRI 2010). The wall was 14 in. thick, and the tests resulted in penetrations of 4.75 in. (.50 cal FSP) and 11.25 in. (20 mm FSP). Figure 25 illustrates the results of a CEB ballistics test.
* A12 x 16 x 0.020 in. 2024-T3 aluminum panel located approximately 6 in. behind the rear face of the
target to detect projectile penetration of the test wall.

ERDC TR-13-13 51
Figure 25. CEB ballistics test specimens (Leading Edge Group, Inc.).
4.3.2.4 Constructability
Soil for CEBs should be crushed so it will pass through a ¼ in. sieve, and it should be compacted, especially when stabilizers are used to reduce the amount of stabilizer required. Mixing of soil types is required to not only improve the soil, but bring stabilizers into direct content with the soil. Sample blocks should be produced and tested to ensure they have the de-sired characteristics and strength. After the CEBs have been formed, they should be allowed to cure for a couple days while being kept moist to achieve maximum strength. It is recommended to let blocks stabilized with cement stabilizer cure for 3 weeks before using them to construction and lime stabilizer for four weeks before being used for construction (Adam 2001).
Table 5 presents a cost comparison of CEB with CMU and clay brick con-struction methods.
Table 5. Cost of CEB versus other masonry units.
Brick Type Cost Mortar Transportation Total
(Terra) Block (CEB) $0.12 $0.00 $0.00 $0.12
Fired Brick $0.65 $0.03 $0.02 $0.70
Concrete Block $1.25 $0.10 $0.02 $1.37
Manual CEB presses are sturdy, inexpensive, and easy to manufacture and repair, but they can wear out quickly and only handle one mold. Press size varies between hand-powered, hydraulic, or heavy mechanical presses. Motorized mechanical presses can cost from four to seven times as much as manual presses, but they can use multiple molds. Motorized hydraulic presses are capable of medium output, but are appropriate mainly in more technologically advanced environments due to the need for spare parts. Mobile production units are designed to be easily movable, with self-
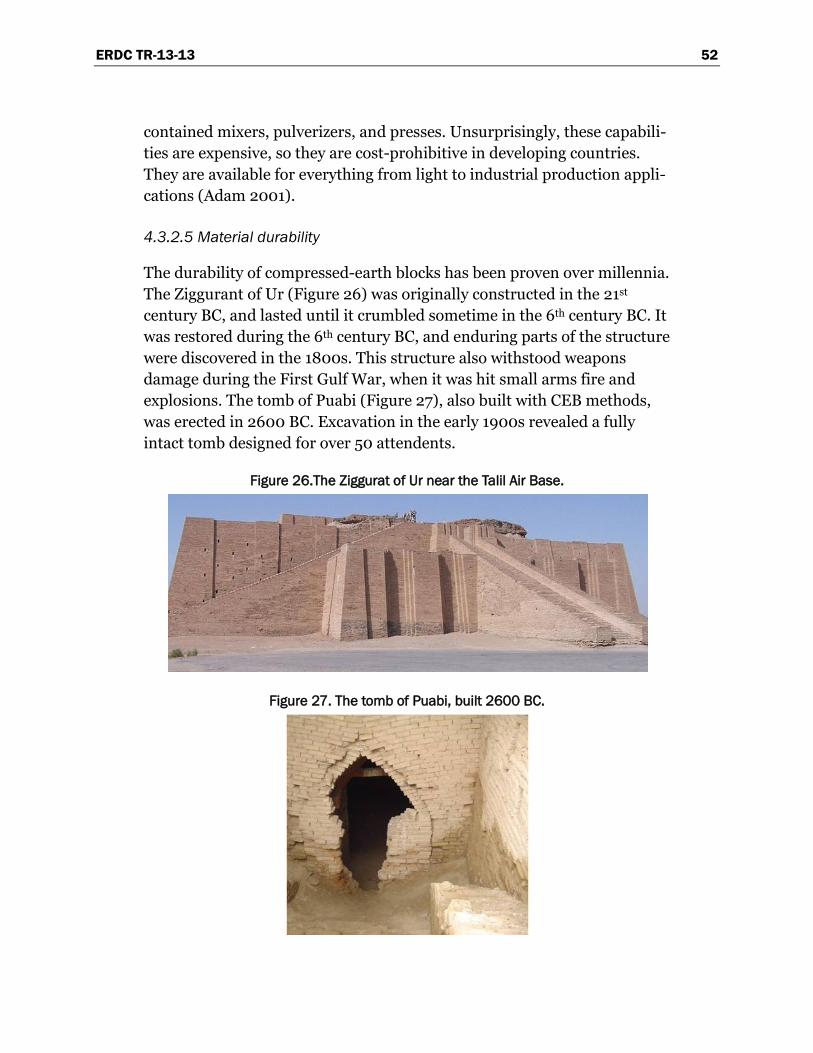
ERDC TR-13-13 52
contained mixers, pulverizers, and presses. Unsurprisingly, these capabili-ties are expensive, so they are cost-prohibitive in developing countries. They are available for everything from light to industrial production appli-cations (Adam 2001).
4.3.2.5 Material durability
The durability of compressed-earth blocks has been proven over millennia. The Ziggurant of Ur (Figure 26) was originally constructed in the 21st century BC, and lasted until it crumbled sometime in the 6th century BC. It was restored during the 6th century BC, and enduring parts of the structure were discovered in the 1800s. This structure also withstood weapons damage during the First Gulf War, when it was hit small arms fire and explosions. The tomb of Puabi (Figure 27), also built with CEB methods, was erected in 2600 BC. Excavation in the early 1900s revealed a fully intact tomb designed for over 50 attendents.
Figure 26.The Ziggurat of Ur near the Talil Air Base.
Figure 27. The tomb of Puabi, built 2600 BC.
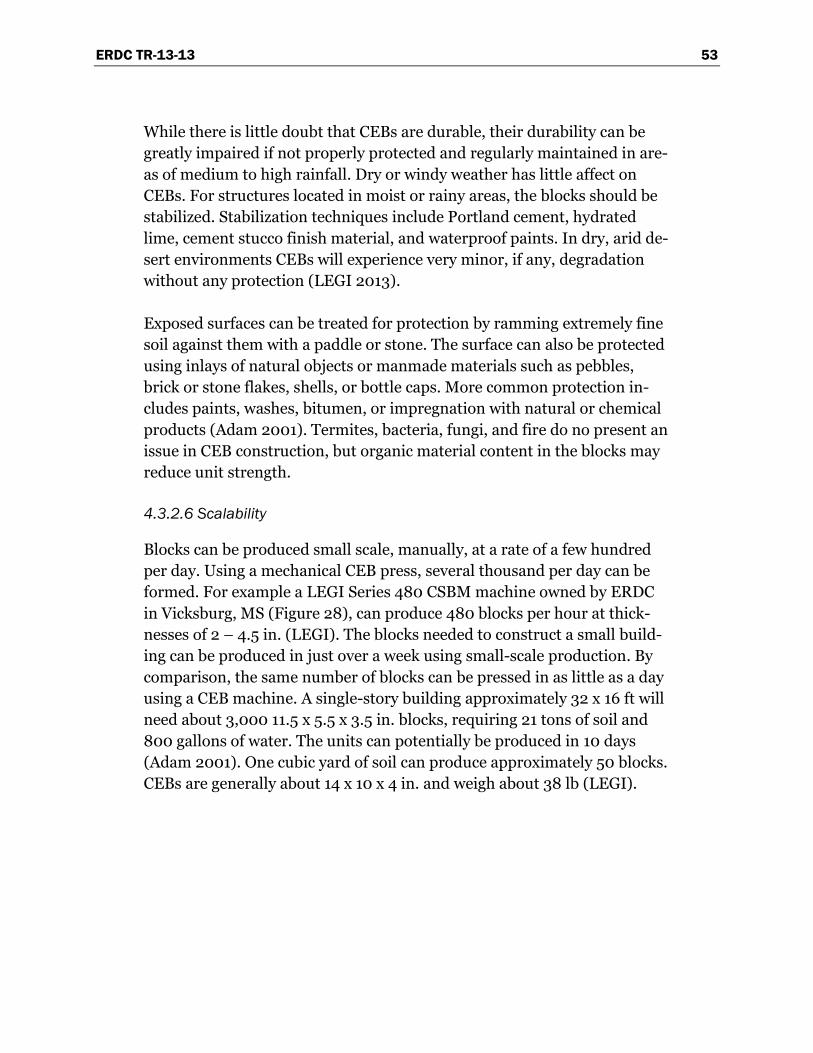
ERDC TR-13-13 53
While there is little doubt that CEBs are durable, their durability can be greatly impaired if not properly protected and regularly maintained in are-as of medium to high rainfall. Dry or windy weather has little affect on CEBs. For structures located in moist or rainy areas, the blocks should be stabilized. Stabilization techniques include Portland cement, hydrated lime, cement stucco finish material, and waterproof paints. In dry, arid de-sert environments CEBs will experience very minor, if any, degradation without any protection (LEGI 2013).
Exposed surfaces can be treated for protection by ramming extremely fine soil against them with a paddle or stone. The surface can also be protected using inlays of natural objects or manmade materials such as pebbles, brick or stone flakes, shells, or bottle caps. More common protection in-cludes paints, washes, bitumen, or impregnation with natural or chemical products (Adam 2001). Termites, bacteria, fungi, and fire do no present an issue in CEB construction, but organic material content in the blocks may reduce unit strength.
4.3.2.6 Scalability
Blocks can be produced small scale, manually, at a rate of a few hundred per day. Using a mechanical CEB press, several thousand per day can be formed. For example a LEGI Series 480 CSBM machine owned by ERDC in Vicksburg, MS (Figure 28), can produce 480 blocks per hour at thick-nesses of 2 – 4.5 in. (LEGI). The blocks needed to construct a small build-ing can be produced in just over a week using small-scale production. By comparison, the same number of blocks can be pressed in as little as a day using a CEB machine. A single-story building approximately 32 x 16 ft will need about 3,000 11.5 x 5.5 x 3.5 in. blocks, requiring 21 tons of soil and 800 gallons of water. The units can potentially be produced in 10 days (Adam 2001). One cubic yard of soil can produce approximately 50 blocks. CEBs are generally about 14 x 10 x 4 in. and weigh about 38 lb (LEGI).
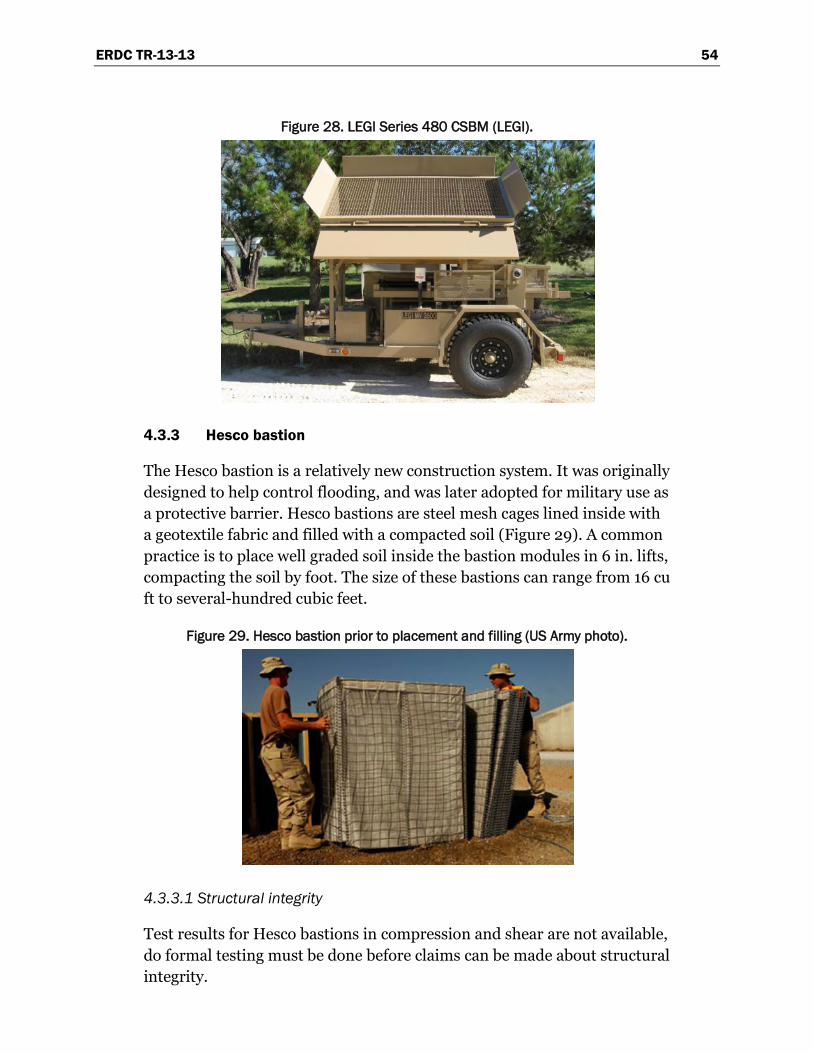
ERDC TR-13-13 54
Figure 28. LEGI Series 480 CSBM (LEGI).
4.3.3 Hesco bastion
The Hesco bastion is a relatively new construction system. It was originally designed to help control flooding, and was later adopted for military use as a protective barrier. Hesco bastions are steel mesh cages lined inside with a geotextile fabric and filled with a compacted soil (Figure 29). A common practice is to place well graded soil inside the bastion modules in 6 in. lifts, compacting the soil by foot. The size of these bastions can range from 16 cu ft to several-hundred cubic feet.
Figure 29. Hesco bastion prior to placement and filling (US Army photo).
4.3.3.1 Structural integrity
Test results for Hesco bastions in compression and shear are not available, do formal testing must be done before claims can be made about structural integrity.
ERDC TR-13-13 55
4.3.3.2 Safety
Hesco bastions are not flammable and do not pose a fire hazard. They also will provide flood resistance where they are placed to create a barrier for that purpose.
4.3.3.3 Force protection
Assuming correct assembly and appropriate configuration layout, Hesco bastions should provide sufficient force protection when they are used as barriers in military operations.
In the case of small arms fire and artillery, a test was performed by the US Army in 2005 using two levels of bastions of 50 cm thickness, which is less than half the thickness of the standard Hesco bastion. This Hesco wall was attacked using a Chinese Type 65 107 mm HE rocket, two 40 mm M203 high-explosive dual purpose (HEDP) anti-tank rounds, and 400 rounds of 5.56 mm ball. After the test, the wall remained standing and no through-penetration had occurred. Because recommended construction practice requires the second level of the wall to be twice as thick as the one in this test, and the first level to be four times as thick, a Hesco bastion designed and constructed to this standard in the field should easily resist similar firepower (Hesco 2013).
Another key type of force protection required in regions with a terrorist threat is resistance to a moving vehicle attack. A test performed in the UK in 2004 used four Hesco bastions (measuring 3.5 x 3.5 x 4.5 ft ) filled with a sand and gravel, foot-compacted mix. They were placed on a concrete pad, to reduce surface friction, to form a 7 x 7 ft thick section. A 7.5 ton commercial flatbed truck was driven into two Hesco bastions at 42 miles per hour. (This truck was selected because it is the largest vehicle that does not need a special operator’s license). The resulting impact destroyed the vehicle and propelled the Hesco bastions 8 ft. The results showed that Hesco bastions could be used to channel traffic and stop a large, out-of-control vehicle (Hesco 2013).
Another vehicle impact test was done by the US Air Force to test a Hesco bastion configuration in the field. The US Department of State require-ment for vehicle crash barriers specifies that a structure must stop a 15,000 pound vehicle traveling at 50 miles per hour within 1 m of the in-side face of the wall. This requirement was tested using a 32 ft long wall
ERDC TR-13-13 56
constructed with one Hesco bastion placed on top of two others, producing a section that was 7 ft wide and 9 ft high. The bastions were filled with coarse sand compacted by foot. The vehicle impacted the wall at the center and was stopped dead with only 3 ft of penetration at the exterior face of the barrier. The interior side of the barrier showed no penetration effects; there was no displacement at the ends and no secondary fragments were generated from the wall or let through the wall from the vehicle (Armed Forces International 2013).
A force protection test of open Hesco units and a shelter with Hesco walls and a steel roof was performed in Norway to simulate direct blast impacts. Open Hesco units withstood ordinary charges simulating 120 mm and 155 mm shells, but charges simulating RPG-7 penetrated the walls. The amount of debris generated correlated directly to the grain size of the fill material, but in general amounts of debris were small. Ordinary shell charges were also detonated against Hesco shelter walls. The blasts pro-duced craters, but debris did not fully perforate any of the Hesco walls. Fi-nally, a 420 kg TNT charge representing a car bomb was detonated 20 me-ters from the Hesco wall resulting in no significant damage to the Hesco wall (Holm 2011).
4.3.3.4 Constructability
Construction of Hesco walls is a rapid process, especially in comparison with sandbagging, which uses earthen materials and textiles to produce a barrier with properties similar to the Hesco. For a barrier consisting of 1,500 sandbags, it takes approximately 10 people about 7 hours to fill and place the units without heavy equipment. By comparison, it requires only two people about 30 minutes to fill and erect the same size barrier using Hesco bastions (Hesco 2013), but heavy equipment is required to complete the construction in that amount of time. Figure 30 shows the filling pro-cess for a Hesco barrier.
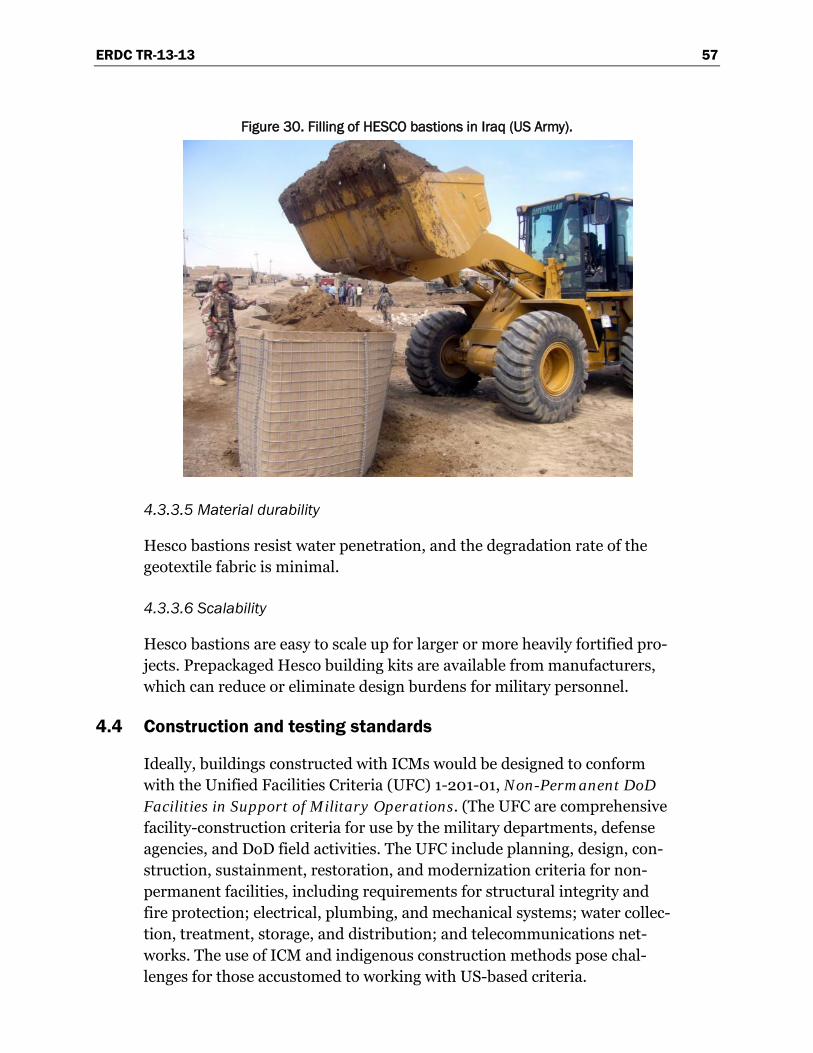
ERDC TR-13-13 57
Figure 30. Filling of HESCO bastions in Iraq (US Army).
4.3.3.5 Material durability
Hesco bastions resist water penetration, and the degradation rate of the geotextile fabric is minimal.
4.3.3.6 Scalability
Hesco bastions are easy to scale up for larger or more heavily fortified pro-jects. Prepackaged Hesco building kits are available from manufacturers, which can reduce or eliminate design burdens for military personnel.
4.4 Construction and testing standards
Ideally, buildings constructed with ICMs would be designed to conform with the Unified Facilities Criteria (UFC) 1-201-01, Non-Permanent DoD Facilities in Support of Military Operations. (The UFC are comprehensive facility-construction criteria for use by the military departments, defense agencies, and DoD field activities. The UFC include planning, design, con-struction, sustainment, restoration, and modernization criteria for non-permanent facilities, including requirements for structural integrity and fire protection; electrical, plumbing, and mechanical systems; water collec-tion, treatment, storage, and distribution; and telecommunications net-works. The use of ICM and indigenous construction methods pose chal-lenges for those accustomed to working with US-based criteria.
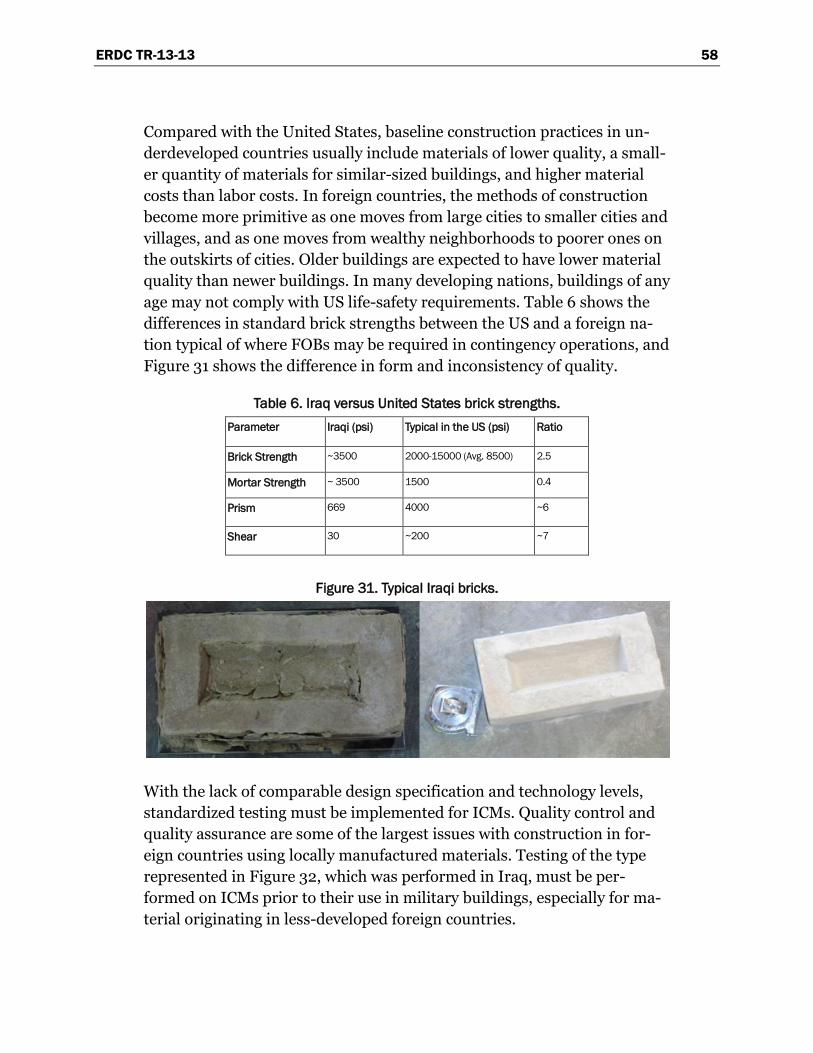
ERDC TR-13-13 58
Compared with the United States, baseline construction practices in un-derdeveloped countries usually include materials of lower quality, a small-er quantity of materials for similar-sized buildings, and higher material costs than labor costs. In foreign countries, the methods of construction become more primitive as one moves from large cities to smaller cities and villages, and as one moves from wealthy neighborhoods to poorer ones on the outskirts of cities. Older buildings are expected to have lower material quality than newer buildings. In many developing nations, buildings of any age may not comply with US life-safety requirements. Table 6 shows the differences in standard brick strengths between the US and a foreign na-tion typical of where FOBs may be required in contingency operations, and Figure 31 shows the difference in form and inconsistency of quality.
Table 6. Iraq versus United States brick strengths. Parameter Iraqi (psi) Typical in the US (psi) Ratio
Brick Strength ~3500 2000-15000 (Avg. 8500) 2.5
Mortar Strength ~ 3500 1500 0.4
Prism 669 4000 ~6
Shear 30 ~200 ~7
Figure 31. Typical Iraqi bricks.
With the lack of comparable design specification and technology levels, standardized testing must be implemented for ICMs. Quality control and quality assurance are some of the largest issues with construction in for-eign countries using locally manufactured materials. Testing of the type represented in Figure 32, which was performed in Iraq, must be per-formed on ICMs prior to their use in military buildings, especially for ma-terial originating in less-developed foreign countries.
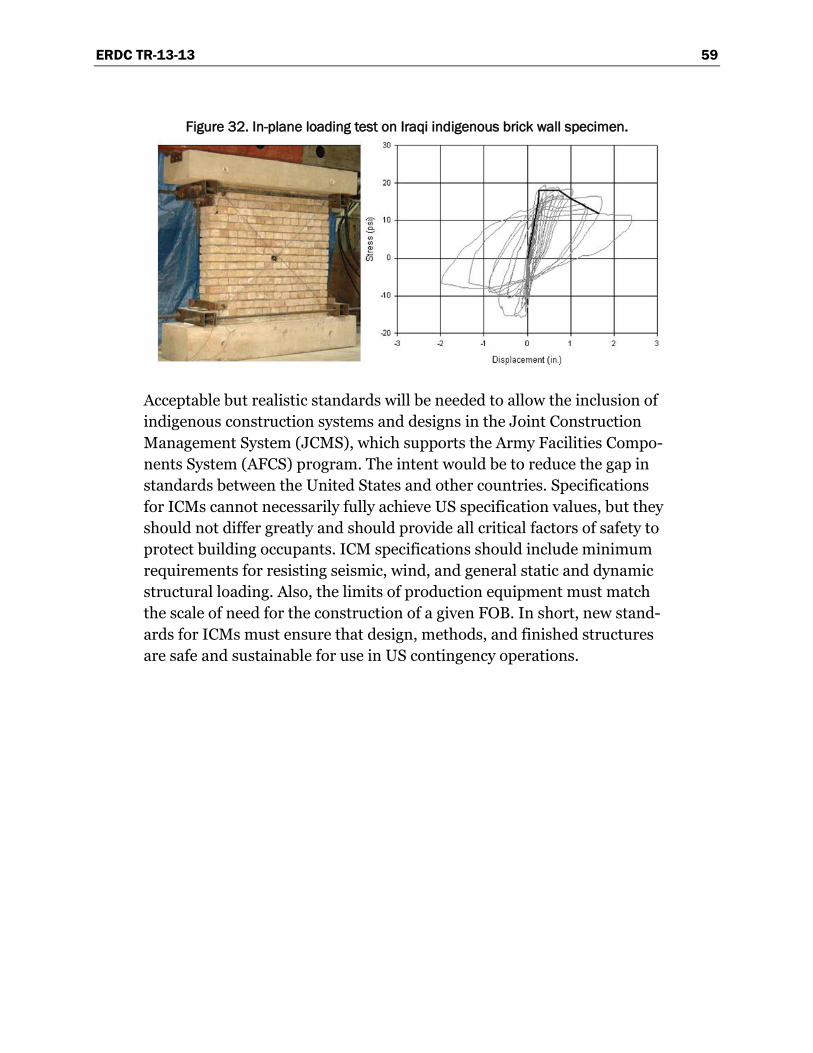
ERDC TR-13-13 59
Figure 32. In-plane loading test on Iraqi indigenous brick wall specimen.
Acceptable but realistic standards will be needed to allow the inclusion of indigenous construction systems and designs in the Joint Construction Management System (JCMS), which supports the Army Facilities Compo-nents System (AFCS) program. The intent would be to reduce the gap in standards between the United States and other countries. Specifications for ICMs cannot necessarily fully achieve US specification values, but they should not differ greatly and should provide all critical factors of safety to protect building occupants. ICM specifications should include minimum requirements for resisting seismic, wind, and general static and dynamic structural loading. Also, the limits of production equipment must match the scale of need for the construction of a given FOB. In short, new stand-ards for ICMs must ensure that design, methods, and finished structures are safe and sustainable for use in US contingency operations.
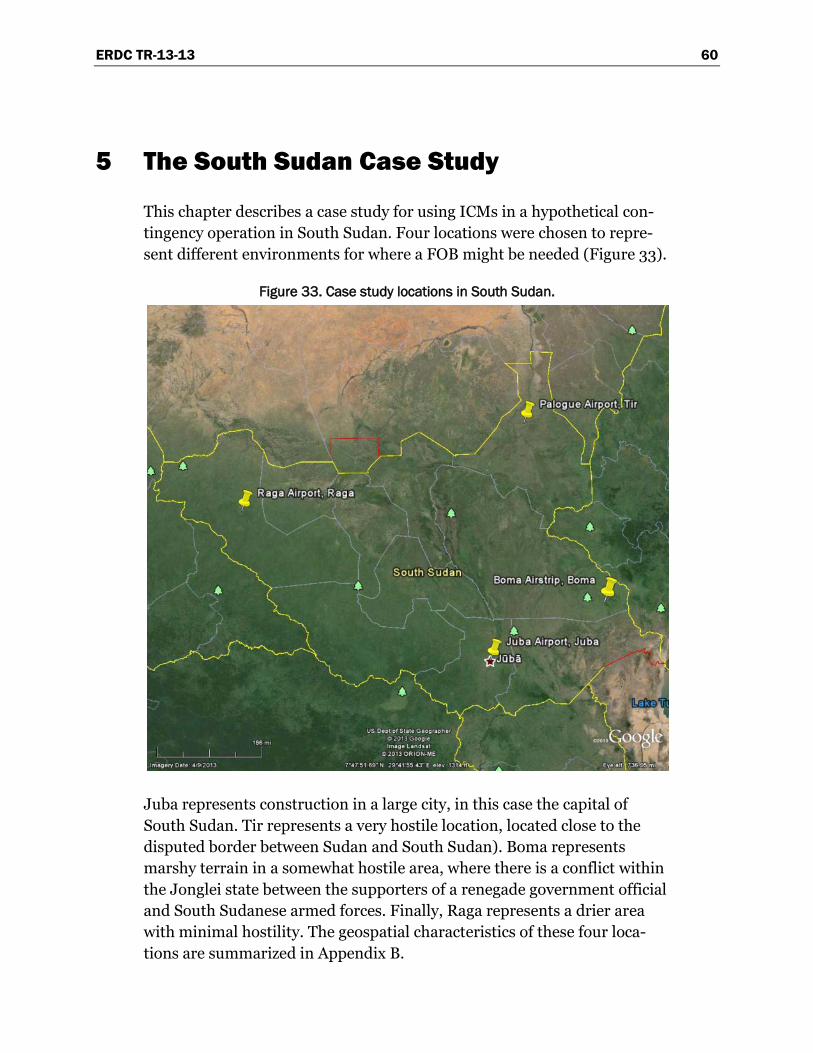
ERDC TR-13-13 60
5 The South Sudan Case Study
This chapter describes a case study for using ICMs in a hypothetical con-tingency operation in South Sudan. Four locations were chosen to repre-sent different environments for where a FOB might be needed (Figure 33).
Figure 33. Case study locations in South Sudan.
Juba represents construction in a large city, in this case the capital of South Sudan. Tir represents a very hostile location, located close to the disputed border between Sudan and South Sudan). Boma represents marshy terrain in a somewhat hostile area, where there is a conflict within the Jonglei state between the supporters of a renegade government official and South Sudanese armed forces. Finally, Raga represents a drier area with minimal hostility. The geospatial characteristics of these four loca-tions are summarized in Appendix B.
ERDC TR-13-13 61
In terms of assessing hostility levels, it can be difficult to find an authorita-tive and frequently updated information on conflicts worldwide. The first and typically most effective source is intelligence reports gathered directly from the area. Another useful source is the website of the International Crisis Group (www.crisisgroup.org), which offers the CrisisWatch database. The organization states that the database gives updates on “all the most signifi-cant situations of conflict or potential conflict around the world” based on information in current and past issues of the CrisisWatch bulletin. That information is derived from news media reports. For example, for the pe-riod of 1 January – 25 June 2013, the CrisisWatch database reports that conflict occurs in Boma, a town in the Jonglei state and disputed area at the border of Unity state, Warrap state, and Lakes state.
5.1 Economy
The economy of South Sudan is virtually one-dimensional, and industry is severely underdeveloped. South Sudan gets almost most 98% of its reve-nue from the nearly 375,000 barrels of oil it exports each day. Even though it is one of the most agriculturally rich areas in Africa, farming does not play a large role in the economy. It is estimated that at least 90% of the land in South Sudan is suitable for farming, but only 4.5% of the land is being cultivated. Most of this cultivation is for subsistence farming, and more than 90% of South Sudan’s food is imported. Currently, the re-gion depends totally on food imports from neighboring countries such as Uganda, Kenya, and northern Sudan. The major crops produced in this sector includes, sorghum, maize, rice, sunflower, cotton, sesame, cassava, beans and peanuts. Other crops that are produced in small scale include coffee, tea, sugar, and tobacco. There is great potential for growing fruits and vegetables such as bananas, mangoes, lemons, pineapples, onions, okra, tomatoes, eggplants, potatoes, and cabbages (NABC 2011). As of Sep-tember 2011, the World Bank had donated $440 million out of the prom-ised $548 million to South Sudan for 2011 (Africa Business Initiative).
5.2 Climate
South Sudan’s natural weather and environmental characteristics must be considered in potential ICM applications. Hazards include dust storms, periodic persistent droughts, soil erosion, desertification, and inadequate supplies of potable water. Other important features of Sudan include a generally flat terrain, and a largely arid desert climate that includes a rainy
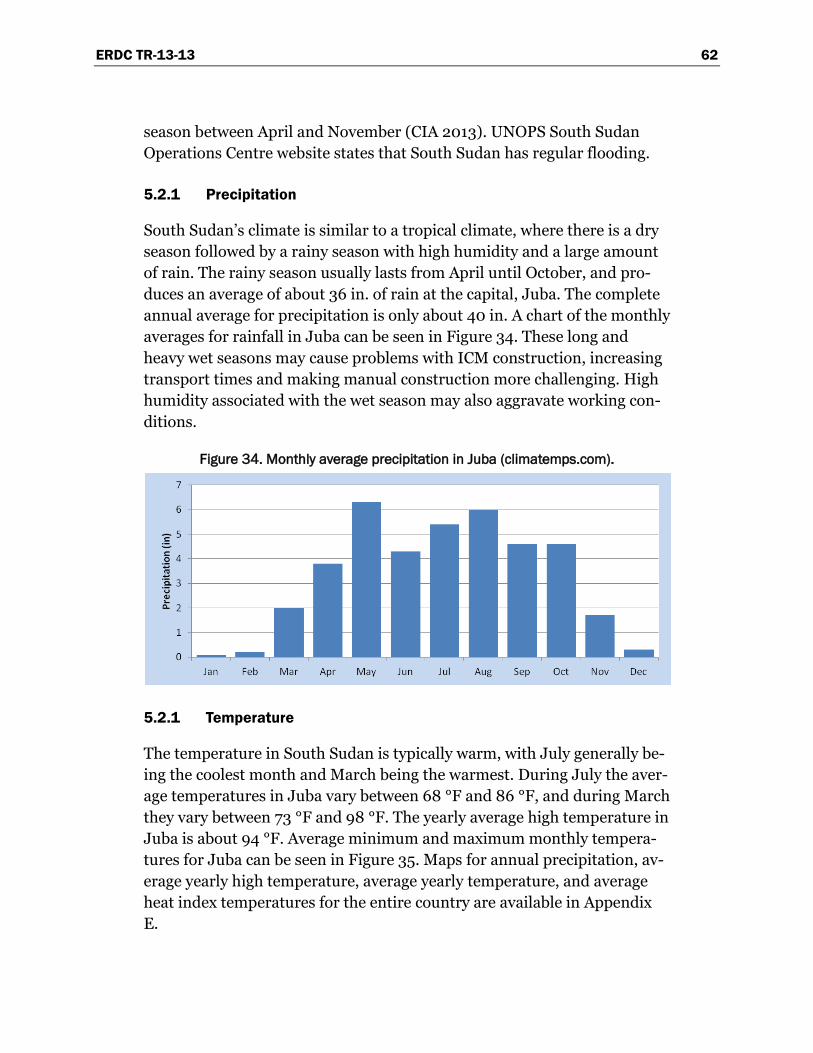
ERDC TR-13-13 62
season between April and November (CIA 2013). UNOPS South Sudan Operations Centre website states that South Sudan has regular flooding.
5.2.1 Precipitation
South Sudan’s climate is similar to a tropical climate, where there is a dry season followed by a rainy season with high humidity and a large amount of rain. The rainy season usually lasts from April until October, and pro-duces an average of about 36 in. of rain at the capital, Juba. The complete annual average for precipitation is only about 40 in. A chart of the monthly averages for rainfall in Juba can be seen in Figure 34. These long and heavy wet seasons may cause problems with ICM construction, increasing transport times and making manual construction more challenging. High humidity associated with the wet season may also aggravate working con-ditions.
Figure 34. Monthly average precipitation in Juba (climatemps.com).
5.2.1 Temperature
The temperature in South Sudan is typically warm, with July generally be-ing the coolest month and March being the warmest. During July the aver-age temperatures in Juba vary between 68 °F and 86 °F, and during March they vary between 73 °F and 98 °F. The yearly average high temperature in Juba is about 94 °F. Average minimum and maximum monthly tempera-tures for Juba can be seen in Figure 35. Maps for annual precipitation, av-erage yearly high temperature, average yearly temperature, and average heat index temperatures for the entire country are available in Appendix E.
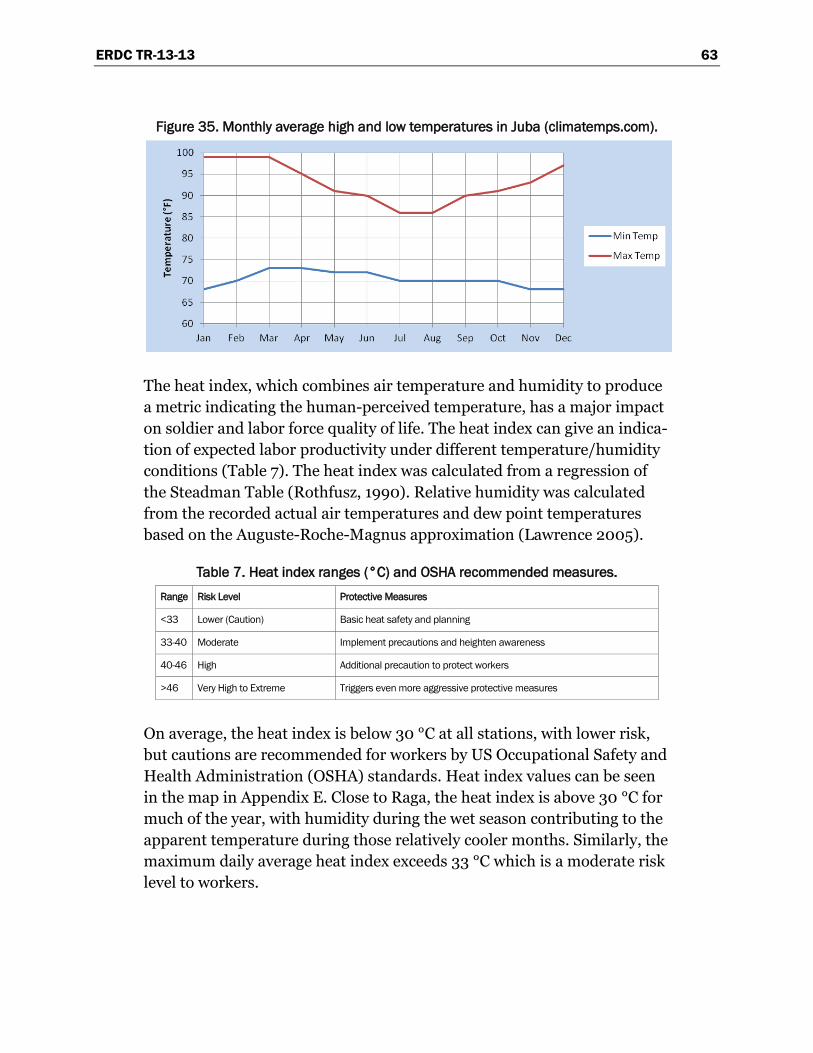
ERDC TR-13-13 63
Figure 35. Monthly average high and low temperatures in Juba (climatemps.com).
The heat index, which combines air temperature and humidity to produce a metric indicating the human-perceived temperature, has a major impact on soldier and labor force quality of life. The heat index can give an indica-tion of expected labor productivity under different temperature/humidity conditions (Table 7). The heat index was calculated from a regression of the Steadman Table (Rothfusz, 1990). Relative humidity was calculated from the recorded actual air temperatures and dew point temperatures based on the Auguste-Roche-Magnus approximation (Lawrence 2005).
Table 7. Heat index ranges (°C) and OSHA recommended measures. Range Risk Level Protective Measures
<33 Lower (Caution) Basic heat safety and planning
33-40 Moderate Implement precautions and heighten awareness
40-46 High Additional precaution to protect workers
>46 Very High to Extreme Triggers even more aggressive protective measures
On average, the heat index is below 30 °C at all stations, with lower risk, but cautions are recommended for workers by US Occupational Safety and Health Administration (OSHA) standards. Heat index values can be seen in the map in Appendix E. Close to Raga, the heat index is above 30 °C for much of the year, with humidity during the wet season contributing to the apparent temperature during those relatively cooler months. Similarly, the maximum daily average heat index exceeds 33 °C which is a moderate risk level to workers.

ERDC TR-13-13 64
5.2.2 Wind
The average annual daily wind speed in Juba is 5 kilometers per hour (kph), and the average annual daily maximum wind speed in Juba is 11 kph. Farther north, in locations closer to Tir, the average annual daily wind speed is about 9 kph and the average annual daily maximum ap-proaches 17 kph. These wind speeds do not cause much concern for use of appropriately selected ICMs.
5.3 Environmental and resources characterization
The relevant information for all four selected locales is presented below in list form.
5.3.1 Tir
• Road access connectivity to the area is through a main highway going north and south and unimproved roads to the west.
• There are settlements situated along the roads; closest major town to the south is Malakal. The population within that 100 miles radius is in the range of 100,000 to 200,000 people.
• The site is near a sugar plant, but does not seem to have adequate pow-er distribution for possible power source. Generator is required for power source.
• At approximately 1,270 ft ASL and located on the lowland, this area will potentially have drainage problem as it is located near wetlands or within the floodplain (potential for flooding).
• The site is surrounded with water wells from approximately 20 to 50 miles away; drilling a well for water may be possible since the location is near waterways; however water quality is likely to be an issue.
• It is in an open and may have the potential for force protection vulner-ability.
• Material sources: o It is surrounded be grassland, source of straw within 10 to 20 miles. o Cement and other construction supplies have to be transported ap-
proximately more than 300 miles from cement factories in Khar-toum and Rabak Sudan to this site.
o The predominant soil in Tir and vicinity is clayey sand. o There is no quarry for sand and gravel in the area. These materials
have to be mined and transported approximately from 300 miles

ERDC TR-13-13 65
away, southwest in the country or the same distance in southeast Ethiopia.
• Dryer and hotter than other sites in the country, with an average daily temperature exceeding 28 °C, but precipitation less than expected evapotranspiration, which limits water resources. Shorter wet season may allow more rain-free work days than other sites
• High heat indexes in warmer months indicate higher safety standards needed for workers.
• Highest air-conditioning degree day (ACDD) values indicate energy use during the life of the building for cooling will be significant and materi-als that support passive cooling are preferred.
5.3.2 Raga
• Area is located along the main major highway for accessibility and lo-gistics, with connecting passage of unimproved road to the east.
• There is no electrical power distribution in the area. Generator is re-quired for power source.
• Area is located on high elevated and sloped area (approximately at 1,788 ft elevation above sea level [ASL]); the drainage is not likely to be an issue.
• The location is between the confluence of two rivers; if extreme event rainfall occurs, it may have erosion on steep slopes however, the pre-sent of vegetation may help alleviate the erosion.
• Drilling a well is the potential source for water. There are existing wa-ter wells from approximately 50–70 miles away to the north, but water quality is likely to be an issue.
• The area is relatively in an open area with sparse vegetation that is classified as open to very open (deciduous) trees and savannah and open grass land cover.
• There are a few settlements in the area; the next major town is Uwayl, approximately 150 miles to the east connected on secondary road. The population within that 100 miles radius is approximately in 100,000 people.
• Material sources: o Timber and straw are potentially available within the region. o Cement and other construction supplies have to be transported ap-
proximately 850 miles from cement factories in Uganda (through Juba by road) to this site. Other suppliers from Sudan and Ethiopia are even farther than Uganda by road transport.
ERDC TR-13-13 66
o The location is on poorly graded sand and surrounded with silt and silty gravels.
o An existing quarry for sand and gravel in the area is 125 miles in Uwayl. Potential source of sand and gravel can be mined in the vi-cinity.
o The source of clay for construction is can be mined in the lowlands approximately 200 miles away to the east.
• One of the cooler sites, though still considered a tropical savanna with temperatures exceeding 18 °C year round. Average temperature of 25.5 °C and a long wet season, which may interfere with construction and material transport.
• Heat index within high end of low risk for workers. Humidity during wet season will keep working conditions intense even as temperatures decline.
• Average monthly ACDD indicates energy demands similar to Houston, TX. Dehumidification costs may also reduce sustainability at this site.
5.3.3 Juba
• Road access is through a main highway and potentially has a function-ing airport for accessibility and logistics.
• Availability of electrical power distribution is inadequate in the area. Generator is required for power source.
• Located on elevated and mountain side area (approximately at 1,800 ft ASL), the likelihood of having a drainage issue is inconsiderable and potential erosion is unlikely.
• Drilling a well is the potential source for water but water quality is like-ly an issue and filtration will be required for potable water. There are existing water wells from approximately 50 miles away to the north.
• The area is relatively open with sparse deciduous trees. • Juba is the capital and largest city in South Sudan with a population
exceeding 370,000. • Material sources:
o The source of straw is probably within the region (~100 miles radi-us) since there are grassland to the east.
o Cement and other construction supplies have to be transported ap-proximately 350 miles from factories Uganda to this site. Other suppliers from the north in Sudan and east in Ethiopia are even far-ther than Uganda by road transport
o Soils in the vicinity are clayey sand and gravel and surrounded with silts and silty gravel.
ERDC TR-13-13 67
o An existing quarry is right within distance; this area is likely to have a good source of sands, gravel and clays.
o Other construction materials not available in the country have to be transported into Juba.
• The site is warm, with an average daily temperature of almost 28 °C and a pronounced long wet season from April–October, which may in-terfere with construction and material transport but provide water re-sources needs.
• Heat index is at the high end of low risk for workers. Humidity during wet season will keep working conditions intense even as temperatures decline.
• Average monthly ACDD value is similar to Raga site. Dehumidification costs may also reduce sustainability at this site.
5.3.4 Boma
• Location is remote with road access that is partly on a highway and the rest is secondary or most probably unimproved road.
• It is likely there is no availability of electrical power distribution in the area. Generator is required for power source.
• Drainage and erosion issues may be present due to sloping terrain and high precipitation during the intense wet season, though vegetation may protect some of the slopes.
• Source for water is questionable as there are no existing water wells and no settlements.
• The area is relatively open with sparse shrubs and woody vegetation. • There are few settlements in the area; the next major town is Torit, ap-
proximately 200 miles away by secondary road. The population within that 100 miles radius is less than 100,000 people.
• Material sources: o The source of straw is probably within the region to the south. o Cement and other construction supplies have to be transported ap-
proximately 600 miles from factories in Uganda (through Juba by road) to this site. Other suppliers from Sudan and Ethiopia are even farther than Uganda by road transport
o Typical soils in the vicinity are clayey sand and gravel and sur-rounded with silts and silty gravel.
o Inferring from the soil map, potential source of clay, sand and grav-el can be mined in the vicinity.
o Other construction materials not available in the country have to be transported through Juba.
ERDC TR-13-13 68
• This is the coolest of the sites, with an average daily temperature of 22.2 °C, though still exceeding 18 °C with a pronounced wet season, in-dicating a tropical savanna climate. It is also the wettest of all sites in terms of precipitation.
• Heat index is the lowest of all sites, suggesting impact of heat on man-ual labor will be smallest of the four sites.
• Lowest monthly ACDD of the sites, similar to Midwest US cooling en-ergy costs.
5.4 Material factor
5.4.1 Natural resources
South Sudan is a landlocked country in eastern Africa located near the Equator with the White Nile, a tributary of the Nile River, running through the middle of the country. Aside from the forest preserves (located in the south), the majority of the country consists of grasslands, high-altitude plateaus and escarpments, wooded and grassy savannas, floodplains, and wetlands. Natural forests and woodlands cover only 29 per cent of the total land area of South Sudan. Currently, commercial exploitation is limited only to teak, natural mahogany, and gum Arabic. From the soils map in Appendix E, it can be seen that South Sudan has two primary soil types: clay sand and gravels in the north and east; and silty sands and gravels in the hilly uplands of the south and west. The country’s only two quarries are both located within these latter areas of graded gravel and sand.
These two indentified quarries, which can be seen in Appendix E, are lo-cated just outside of Juba (the Fattouch Industrial Holding, LTD) and northwest of Wau (the Quarry Khersana). Fattouch Industrial owns the only large gravel crusher in the country. With no cement factories within South Sudan, cement must be imported from Ethiopia, Uganda, and Su-dan. Cement plants in Ethiopia and Uganda are not easily accessible by main road, so South Sudan relies on cement coming from Sudan, which has a better road system than Ethiopia. The closest is the Rabak Cement Factory, which is located in Kosti, Sudan, about 270 miles north of Makalel. Juba, in the southern portion of the country, likely imports ce-ment from plants in Uganda.
ERDC TR-13-13 69
5.4.2 South Sudan characteristics
Another factor in assessing the cost of construction materials is the extent to which foreign imports are used (Ofori 2001:46). Even though the cost of producing the materials may be relatively low in neighboring countries, market-driven pricing and tariff and transportation costs increase the cost of construction materials. For example, much of the cement used in con-struction in South Sudan has to be imported from Kenya or Uganda. On the other hand, Chinese companies view the production of building mate-rials as an opportunity for profitable investment. Thus, the China National Machinery and Equipment Import and Export Corporation is planning to build a cement factory in Kapeota County (Kuo et al. 2012:8). The Africa Business Initiative of the US Chamber of Commerce states:
Commercial Construction and Housing South Sudan’s rapidly increasing
housing demand, largely due to urbanization and an influx of foreigners,
presents a plethora of opportunities for construction companies and
suppliers. According to analysts at CFC Stanbic Bank, Kenyan cement
manufacturers are among the biggest beneficiaries of South Sudan’s in-
dependence. The market for cement and bricks is currently dominated by
a host of regional players that reportedly cannot keep up with the boom-
ing demand for their products. Kenya’s Athi River Mining, Kenya’s third
largest cement manufacturer, is planning to increase its presence in the
region and expects the market to grow between 20% and 25% a year, sig-
nificantly faster than in other East African countries.
5.4.3 Case study results
To calculate the material factor for South Sudan, just the materials that make up the eleven building types in question are used. The material fac-tor scores of these 11 material types are divided by a constant value of 100 to form a decimal. The resulting value is the material factors for all build-ing types discussed in Chapter 4. Material factors that exceed a value of 1 are reduced to 1. This value represents the maximum allowable; higher values would not be considered indigenous and would skew the material factor rankings. The results are shown in Figure 36.
Note that the material factor is calculated independently of the location in which it will be used. This holds true because the procedure and resources used in developing the material is independent of the location in which the materials are used to construct the building. The transportation of these
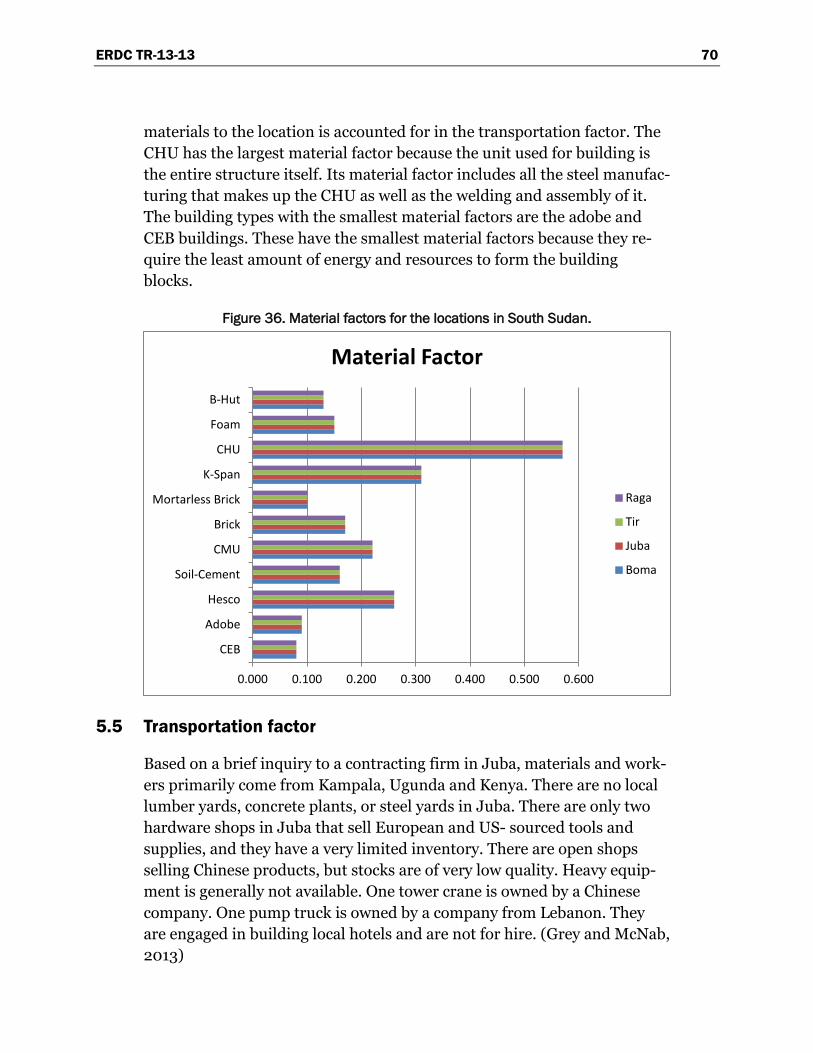
ERDC TR-13-13 70
materials to the location is accounted for in the transportation factor. The CHU has the largest material factor because the unit used for building is the entire structure itself. Its material factor includes all the steel manufac-turing that makes up the CHU as well as the welding and assembly of it. The building types with the smallest material factors are the adobe and CEB buildings. These have the smallest material factors because they re-quire the least amount of energy and resources to form the building blocks.
Figure 36. Material factors for the locations in South Sudan.
5.5 Transportation factor
Based on a brief inquiry to a contracting firm in Juba, materials and work-ers primarily come from Kampala, Ugunda and Kenya. There are no local lumber yards, concrete plants, or steel yards in Juba. There are only two hardware shops in Juba that sell European and US- sourced tools and supplies, and they have a very limited inventory. There are open shops selling Chinese products, but stocks are of very low quality. Heavy equip-ment is generally not available. One tower crane is owned by a Chinese company. One pump truck is owned by a company from Lebanon. They are engaged in building local hotels and are not for hire. (Grey and McNab, 2013)
0.000 0.100 0.200 0.300 0.400 0.500 0.600
CEB
Adobe
Hesco
Soil-Cement
CMU
Brick
Mortarless Brick
K-Span
CHU
Foam
B-Hut
Material Factor
Raga
Tir
Juba
Boma
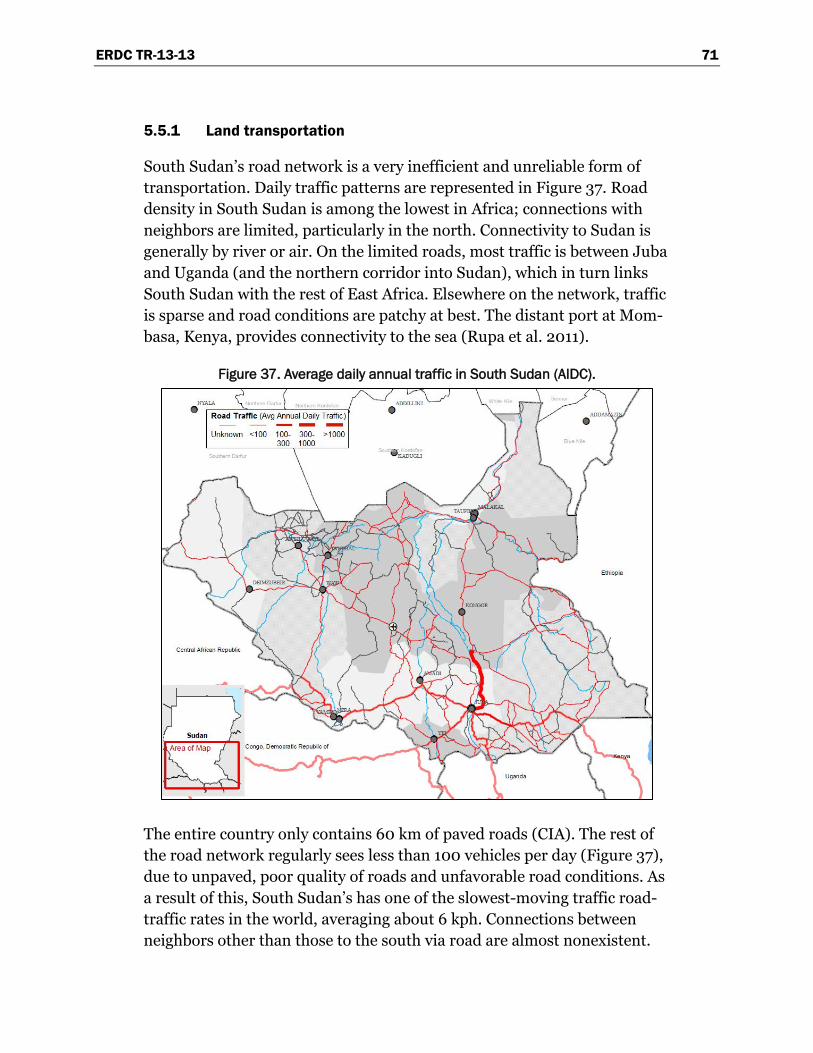
ERDC TR-13-13 71
5.5.1 Land transportation
South Sudan’s road network is a very inefficient and unreliable form of transportation. Daily traffic patterns are represented in Figure 37. Road density in South Sudan is among the lowest in Africa; connections with neighbors are limited, particularly in the north. Connectivity to Sudan is generally by river or air. On the limited roads, most traffic is between Juba and Uganda (and the northern corridor into Sudan), which in turn links South Sudan with the rest of East Africa. Elsewhere on the network, traffic is sparse and road conditions are patchy at best. The distant port at Mom-basa, Kenya, provides connectivity to the sea (Rupa et al. 2011).
Figure 37. Average daily annual traffic in South Sudan (AIDC).
The entire country only contains 60 km of paved roads (CIA). The rest of the road network regularly sees less than 100 vehicles per day (Figure 37), due to unpaved, poor quality of roads and unfavorable road conditions. As a result of this, South Sudan’s has one of the slowest-moving traffic road-traffic rates in the world, averaging about 6 kph. Connections between neighbors other than those to the south via road are almost nonexistent.

ERDC TR-13-13 72
During the rainy season in South Sudan, most of the roads are impassable, especially in the north (Ruga et al. 2011).
A rail network is almost nonexistant, with the railroad located between the border of Sudan and Uwayi, and between Uwayi and Wau in northern South Sudan. The railway is currently in good condition, however, because it was rehabilitated between 2005 and 2010.
5.5.2 Air transportation
There are many single unpaved airstrips across South Sudan, but there are only four locations that are classified as airports. Of these four airports, three have strips that are unpaved or in dire need of maintenance and restoration. No locations have regularly scheduled flights, and air safety is not adequate. Even the existing international airports do not conform to International Civil Aviation Organisation (ICAO) standards. (South Sudan Development Plan 2011-2013:75). The EU currently does not allow any South Sudanese airlines to fly into any EU member country due to these inadequacies. The airport at Juba, the capital city of South Sudan, is designated as the first priority for upgrades (South Sudan Development Plan 2011-2013:84).
5.5.3 Water transportation
A report by the United Nations Environmental Programme (UNEP) (Karyabwite 2000:36) details the significance of the Nile River for transportation in Sudan and the region:
The Nile River is still a vital waterway for the transportation of people
and goods. River steamers still provide the only means of transport
facilities, especially in Sudan south of latitude 15º N, where road
transport is not usually possible from May to November, during the flood
season. Most of the towns in Egypt and Sudan are situated on or near
riverbanks. In Sudan steamer service on the Nile and its tributaries
extends for about 3,800 km. Until 1962 the sole link between the
northern and southern parts of Sudan was stern-wheel river steamers of
shallow draft. The main service is from Kusti to Juba. There are also
seasonal and subsidiary services on the Dunqulah reaches of the main
Nile, on the Blue Nile, up the Sobat to Gambela in Ethiopia, and up the
Al-Ghazal River in the high-water season. The Blue Nile is navigable only
during the high-water season and then only as far as Ar-Rusayris.

ERDC TR-13-13 73
Because of the presence of the cataracts north of Khartoum, the river is
navigable in Sudan only in three stretches. The first of these is from the
Egyptian border to the south end of Lake Nasser. The second is the
stretch between the third and the fourth cataract. The third and most
important stretch extends from Khartoum southward to Juba. In Egypt,
the Nile is navigable by sailing vessels and shallow-draft river steamers
as far south as Aswan.
The South Sudan Development Plan 2011-2013 (2011:75) confirms that river transportation remains important within South Sudan. It mentions that six states in South Sudan have access to navigation along the Nile River and that river transport is more feasible and easier to establish than roads in some areas. Therefore, plans for improvement of river navigability include management of river courses and dredging, establishment of navigation aids, and construction of docking facilities.
5.5.4 Checkpoints and fees
The limited and poor-quality transportation network linking South Sudan with its neighbors adds time to the transportation of construction materials. In addition, the existence of checkpoints on the major trade routes entering and traversing South Sudan would increase the cost and time involved in transporting construction materials, depending on the number of checkpoints encountered en route. A report commissioned by the Ministry of Finance and Economic Planning of South Sudan (National Bureau of Statistics 2011) surveyed activities at checkpoints along ten trade routes in Sudan. On average, there was one checkpoint per 25 km, with drivers making payments at 93% of the checkpoints encountered. The study found that payments vary substantially over the different routes and by monetary value of the cargo. Average payment by trip can be as high as 10.3% or as low as 4.1 % of the value of the cargo. Waiting times at checkpoints also vary per route, with the highest waiting time occurring along the Kaya-to-Juba route (10 hours and 26 minutes per 100 km). However, the average waiting time for all seven of the routes surveyed was 1 hour per 100 km.
Doing Business in Juba (2011:71) indicates in the section entitled “Trading across borders” that importing materials into Juba through the port of Mombasa, Kenya, takes a total of 60 days at a cost of $9,420 US per container. This timeframe includes documents preparation, customs clearance and technical control, ports and terminal handling, and inland
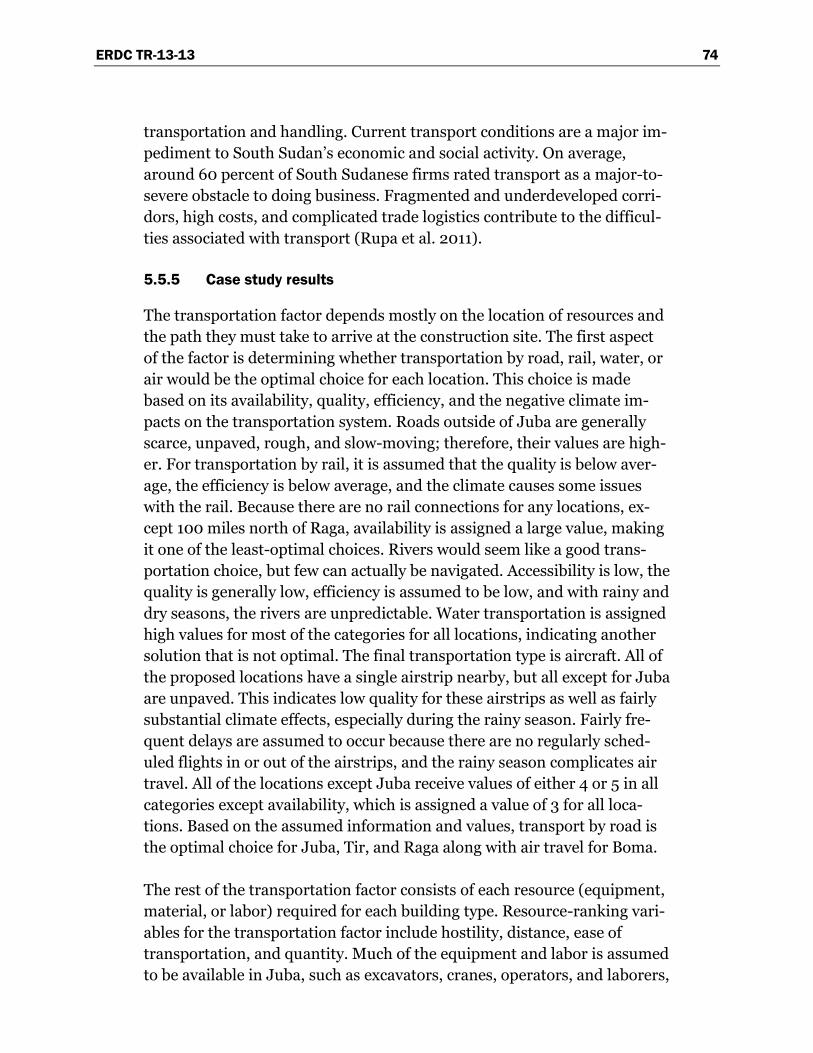
ERDC TR-13-13 74
transportation and handling. Current transport conditions are a major im-pediment to South Sudan’s economic and social activity. On average, around 60 percent of South Sudanese firms rated transport as a major-to-severe obstacle to doing business. Fragmented and underdeveloped corri-dors, high costs, and complicated trade logistics contribute to the difficul-ties associated with transport (Rupa et al. 2011).
5.5.5 Case study results
The transportation factor depends mostly on the location of resources and the path they must take to arrive at the construction site. The first aspect of the factor is determining whether transportation by road, rail, water, or air would be the optimal choice for each location. This choice is made based on its availability, quality, efficiency, and the negative climate im-pacts on the transportation system. Roads outside of Juba are generally scarce, unpaved, rough, and slow-moving; therefore, their values are high-er. For transportation by rail, it is assumed that the quality is below aver-age, the efficiency is below average, and the climate causes some issues with the rail. Because there are no rail connections for any locations, ex-cept 100 miles north of Raga, availability is assigned a large value, making it one of the least-optimal choices. Rivers would seem like a good trans-portation choice, but few can actually be navigated. Accessibility is low, the quality is generally low, efficiency is assumed to be low, and with rainy and dry seasons, the rivers are unpredictable. Water transportation is assigned high values for most of the categories for all locations, indicating another solution that is not optimal. The final transportation type is aircraft. All of the proposed locations have a single airstrip nearby, but all except for Juba are unpaved. This indicates low quality for these airstrips as well as fairly substantial climate effects, especially during the rainy season. Fairly fre-quent delays are assumed to occur because there are no regularly sched-uled flights in or out of the airstrips, and the rainy season complicates air travel. All of the locations except Juba receive values of either 4 or 5 in all categories except availability, which is assigned a value of 3 for all loca-tions. Based on the assumed information and values, transport by road is the optimal choice for Juba, Tir, and Raga along with air travel for Boma.
The rest of the transportation factor consists of each resource (equipment, material, or labor) required for each building type. Resource-ranking vari-ables for the transportation factor include hostility, distance, ease of transportation, and quantity. Much of the equipment and labor is assumed to be available in Juba, such as excavators, cranes, operators, and laborers,
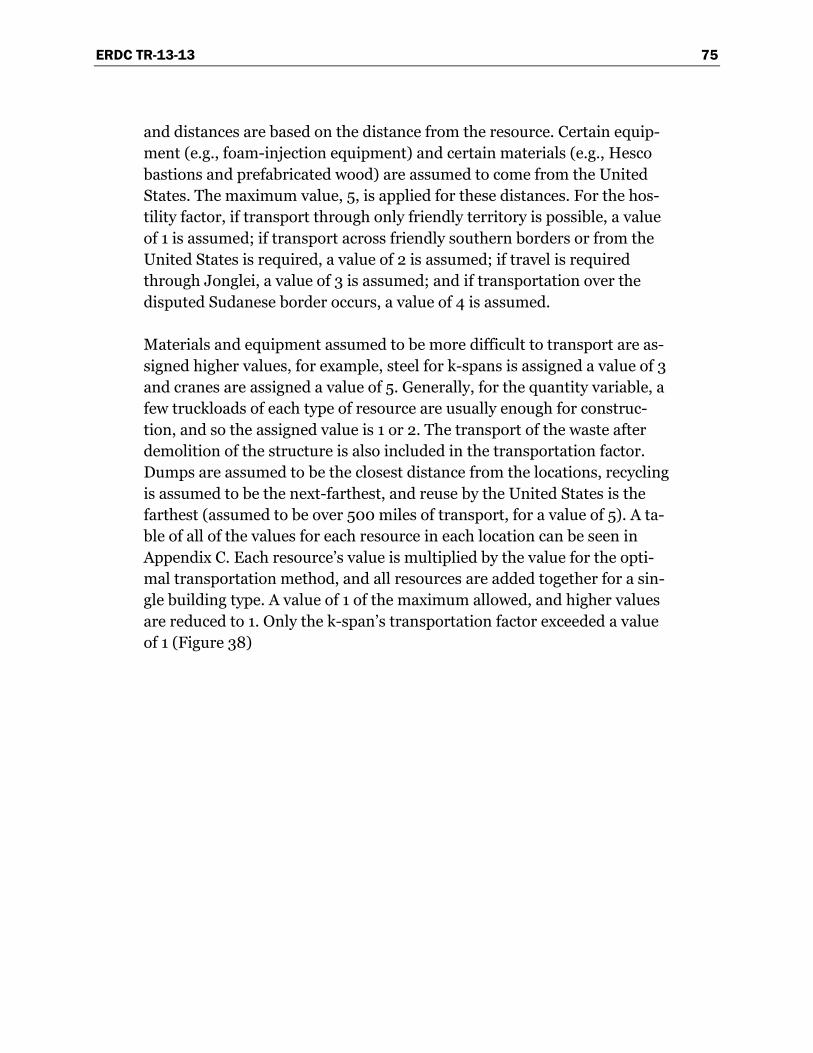
ERDC TR-13-13 75
and distances are based on the distance from the resource. Certain equip-ment (e.g., foam-injection equipment) and certain materials (e.g., Hesco bastions and prefabricated wood) are assumed to come from the United States. The maximum value, 5, is applied for these distances. For the hos-tility factor, if transport through only friendly territory is possible, a value of 1 is assumed; if transport across friendly southern borders or from the United States is required, a value of 2 is assumed; if travel is required through Jonglei, a value of 3 is assumed; and if transportation over the disputed Sudanese border occurs, a value of 4 is assumed.
Materials and equipment assumed to be more difficult to transport are as-signed higher values, for example, steel for k-spans is assigned a value of 3 and cranes are assigned a value of 5. Generally, for the quantity variable, a few truckloads of each type of resource are usually enough for construc-tion, and so the assigned value is 1 or 2. The transport of the waste after demolition of the structure is also included in the transportation factor. Dumps are assumed to be the closest distance from the locations, recycling is assumed to be the next-farthest, and reuse by the United States is the farthest (assumed to be over 500 miles of transport, for a value of 5). A ta-ble of all of the values for each resource in each location can be seen in Appendix C. Each resource’s value is multiplied by the value for the opti-mal transportation method, and all resources are added together for a sin-gle building type. A value of 1 of the maximum allowed, and higher values are reduced to 1. Only the k-span’s transportation factor exceeded a value of 1 (Figure 38)
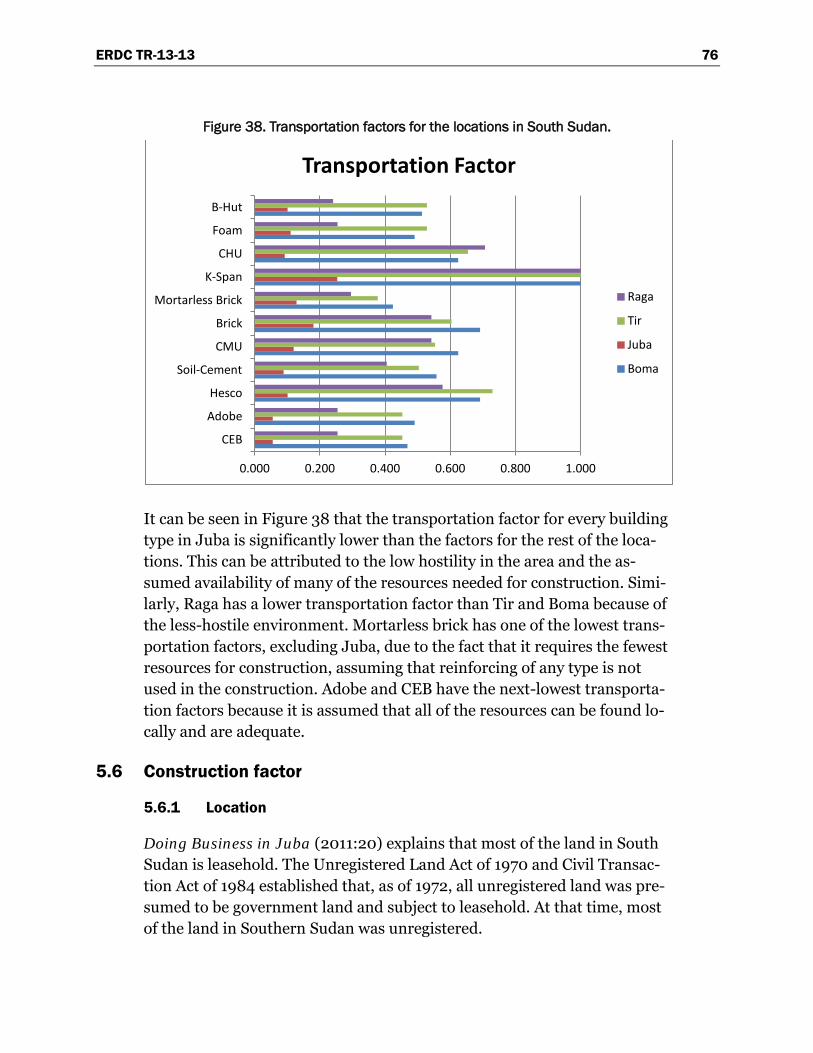
ERDC TR-13-13 76
Figure 38. Transportation factors for the locations in South Sudan.
It can be seen in Figure 38 that the transportation factor for every building type in Juba is significantly lower than the factors for the rest of the loca-tions. This can be attributed to the low hostility in the area and the as-sumed availability of many of the resources needed for construction. Simi-larly, Raga has a lower transportation factor than Tir and Boma because of the less-hostile environment. Mortarless brick has one of the lowest trans-portation factors, excluding Juba, due to the fact that it requires the fewest resources for construction, assuming that reinforcing of any type is not used in the construction. Adobe and CEB have the next-lowest transporta-tion factors because it is assumed that all of the resources can be found lo-cally and are adequate.
5.6 Construction factor
5.6.1 Location
Doing Business in Juba (2011:20) explains that most of the land in South Sudan is leasehold. The Unregistered Land Act of 1970 and Civil Transac-tion Act of 1984 established that, as of 1972, all unregistered land was pre-sumed to be government land and subject to leasehold. At that time, most of the land in Southern Sudan was unregistered.
0.000 0.200 0.400 0.600 0.800 1.000
CEB
Adobe
Hesco
Soil-Cement
CMU
Brick
Mortarless Brick
K-Span
CHU
Foam
B-Hut
Transportation Factor
Raga
Tir
Juba
Boma
ERDC TR-13-13 77
5.6.2 Construction permits
Doing Business in Juba (2011:16) explains that construction permits that enforce building regulations are designed to ensure public safety. Howev-er, they find that in Juba, similar to other developing economies, 60 –80% of construction projects are executed without construction permits. In de-veloping economies, this is usually due to the complexity and inefficiency of the approval process and the lack of oversight available for the process. In Juba, there are 10 required procedures for obtaining construction per-mits, whereas the global average is 18. However, these regulations do not take into account some basic internationally agreed-upon requirements. In addition, these regulations are poorly enforced, because only a few quali-fied engineers are available to check the permit applications and inspect construction sites. The result is that in 2010, in the midst of a construction boom, a construction permit could be processed in 4 days even though of-ficial documents claimed a total processing time of 30 days (Doing Busi-ness in Juba 2011:17).
Obtaining a construction permit in Juba can be fast, but it is expensive — i.e., 5,936% of income per capita, versus 192% of income per capita in Khartoum, the capital of Sudan. Of the 183 economies surveyed by Doing Business, only Liberia and Afghanistan have more expensive construction permitting procedures than Juba. Doing Business in Juba (2011:18) notes that 94% of the cost of obtaining a construction permit is spent on con-necting the building to utilities, which is discussed in section 5.7.
5.6.3 Registering property
Doing Business in Juba (2011:20) finds that registration of property in Juba takes 18 days to execute 7 procedures at a cost of 14.7% of the proper-ty value. Juba ranks 124th of the 183 economies surveyed by Doing Busi-ness for ease of registering property.
5.6.4 Labor
5.6.4.1 Training
The only local labor utilized is unskilled labor and skilled labors are for-eigners. There are no trade schools (Grey and McNab 2013). The situation in South Sudan suggests that the labor pool for an indigenous construction industry contains mostly workers who have not acquired the skills neces-sary for specialization in building design, construction, and construction
ERDC TR-13-13 78
management and oversight. As previously noted, Doing Business in Juba (2011) reported a lack of qualified engineers to review permits and conduct site inspections.
The South Sudan Development Plan (2011:7) discusses the lack of eco-nomic opportunities, particularly in rural areas. Most workers are reported to be employed in traditional agriculture and animal husbandry, with far fewer members of the population engaged in forestry, commerce, low-level trade, crafts, construction, and services. Even the economically important oil sector offers little employment for South Sudanese. The relative im-portance of agriculture as a source of employment varies by state, with 90% of households in the state of Western Equatoria reporting agriculture as their primary activity, as compared to 56% of households in Central Equatoria (where Juba is located) reporting the same (Guarcello et al. 2011:4). Only 13% of workers report formal salaried employment (Guarcello et al. 2011:12). The National Baseline Household Survey of 2009 finds that only 27% of the population 15 years and older is literate, with large variation between urban (53%) and rural (22%) residents. Ac-cording to the 2008 census, 94% of young people enter the labor market with no qualifications (Guarcello et al. 2011:4).
The potential labor pool for construction workers also may include the 9,000 former combatants released from the Sudan People’s Liberation Army in 2009 as a consequence of the Disarmament, Demobilization, and Reintegration (DDR) policy. A skill and vocational training program has been arranged to prepare them for productive reintegration into the econ-omy. Some 748 candidates (527 male and 221 female) are reported to have enrolled in the program (Toh 2009:27). Therefore, most likely extensive training will be required before local labor can be utilized for US military construction, especially advanced construction methods such as k-span or foam buildings.
5.6.4.2 Wages
World Bank (2011) lists the minimum wage of a 19 year old worker or ap-prentice as US$90.6 per month. This report does not mention the wages for other skill levels that would be associated with a construction compa-ny, such as architects, carpenters, bricklayers, or managers. Another topic not covered is the overhead costs on labor, e.g., insurance, overtime, health plan, which would be accounted for in the cost of doing business
ERDC TR-13-13 79
with that company. No other wage or salary information was readily avail-able.
5.6.4.3 Capacity
The following indicators from Ofori (2001:46) were previously discussed (section 3.3) as relevant to assessing the capacity of an indigenous con-struction industry:
• total number of construction companies • number of companies registered and deregistered for a specific period • categorization of companies into foreign, local, and local-foreign joint
venture ownership and areas of specialization represented, e.g., archi-tects, civil engineers, surveyors, contract or real estate specialists.
Information on the total number of construction companies operating in a specific country, number of companies registered and deregistered for a specific period, and categorization of companies may be available on a business registry. For example, South Sudan has a business registry main-tained by the Ministry of Justice purportedly available at http://www.goss-online.org, but the link was not functional as of 8 July 2013. A web search has returned some evidence that locally based con-struction firms do exist in South Sudan, although actual company owner-ship cannot be discerned from the web pages examined. For example, Amoco Construction Company (amocosd.com) is based in Juba. Sudan construction companies are listed at www.sudanconstruction.com. Ac-cording to the website at www.easyinfo-ss.com, 47 construction companies are located in Juba. ABMC, advertised at www.abmc-group.com, lists itself as one of the largest indigenous construction firms in South Sudan.
Ofori (2001:46) also suggests that an in-depth survey of the indigenous distribution in the pool of construction labor resources would also aid in the assessment of the capacity of indigenous labor. He recommended indi-cators, such as:
• total number of professionals and technicians by specialization per year
• number of graduates from professional and technical courses per year • total number of skilled personnel by type of skill, e.g., carpenter, ma-
son, per year
ERDC TR-13-13 80
• number of persons trained in formal programs or apprenticeships by skill per year
• total number of general laborers.
At this writing, however, these data for South Sudan could not be located through a web search.
5.6.5 Existing housing
The most common type of housing in South Sudan rural areas is a round hut known as a tukul. It has a thatched conical roof and structural wooden poles (Din Sabr et al 2013). Sixty-five percent of the people live in tukul/gottya mud structures, 19% are tukul/gottya stick structures and small percentage of population lives in houses constructed of concrete bricks and wood (Kayiira 2012).
Redevelopment programs are providing newer, more modern housing fa-cilities, particularly in Juba and the larger cities. These include all modern amenities, constructed from cement and concrete, and are geared toward the upper- and middle-income classes. However, new housing is also being built for lower-income families (SSCCSE 2010).
5.6.6 Case study results
The construction factor depends largely on the building type, but location also plays a role. The location component is related to control of the land for the structure, disruption caused to the existing way of life in the loca-tion, hostility, and local climate effects. It was assumed that negotiations would be needed to acquire the land in Boma, Tir, and Raga because they are highly remote locations. In Juba it was assumed that land would have to be rented. A larger value, 4, is assigned for the renting of the land, while negotiations are assigned a value of 2. The disruption of the airport and economy of Juba related to locating a military base on adjacent land it is immense, and it is assigned a value of 5. The other three locations will not be affected by a military base other than the use of a local airstrip; there-fore, they are assigned a value of 2. Hostility hinders construction, so the values will be assigned similarly as previously stated. Local climate also affects construction efficiency. The rainy season makes construction more difficult while the hot temperatures of the dry season hinder worker productivity. Because of these variables, average climate effects, value of 3,
ERDC TR-13-13 81
is assigned for all the locations even though annual rain amounts range from about 28 – 43 inches between the locations of interest.
The variables that change with building type include the construction pro-cess, labor requirements, and any protectant treatments that must be ap-plied to preserve the structure in its environment. Equipment and tools comprise the first variable of the construction process. Simple tools (ma-sonry and carpentry) are required for brick construction and B-hut, and are assigned a value of 1. Equipment that is large or difficult to use, such as foam pumps, excavators, and cranes, are assigned values of 3, 4, and 5, re-spectively. The energy required for this equipment is also an important variable. Large diesel equipment is assigned a value of 4, while smaller diesel equipment is assigned a value of 3. The cost of construction also in-creases as work duration increases. Construction taking less than a week is assigned a value of 2, and construction that takes less than 1 day (CHU) is assigned a value of 1. If material protective treatments are required, as is the case with every material type except CHU, a value of 1 is applied for waterproofing and UV protection. Otherwise, a value of zero is applied.
For labor, training and wages impact construction costs. Training is de-termined based on an assumption of how well the local labor forces under-stand the construction method. It is assumed that at least some training, an applied value of 1, will be required for construction that meets US standards. Some training, an applied value of 2, will be required for Hesco bastions, soil-cement structures, CHUs, and B-huts, while k-spans and foam construction require extensive training (value of 4). Values for the cost of wages are determined based on the average wage to be paid for all of the labor. Unskilled laborers are assigned a value of 1, masons and car-penters are assigned a value of 2, skilled laborers are assigned a value of 3, and operators are assigned a value of 4.
In Figure 39 it can be seen the construction factors for most methods are very similar, with a majority of factors falling between values of 1.5 and 2.5. Foam construction, Hesco bastions, and k-spans all have higher con-struction factors due to the increased training and larger equipment re-quirements for those methods. For every building type, Tir and Boma have higher factors than Raga and Juba. This is because the hostility present in Tir and Boma, as previously discussed.
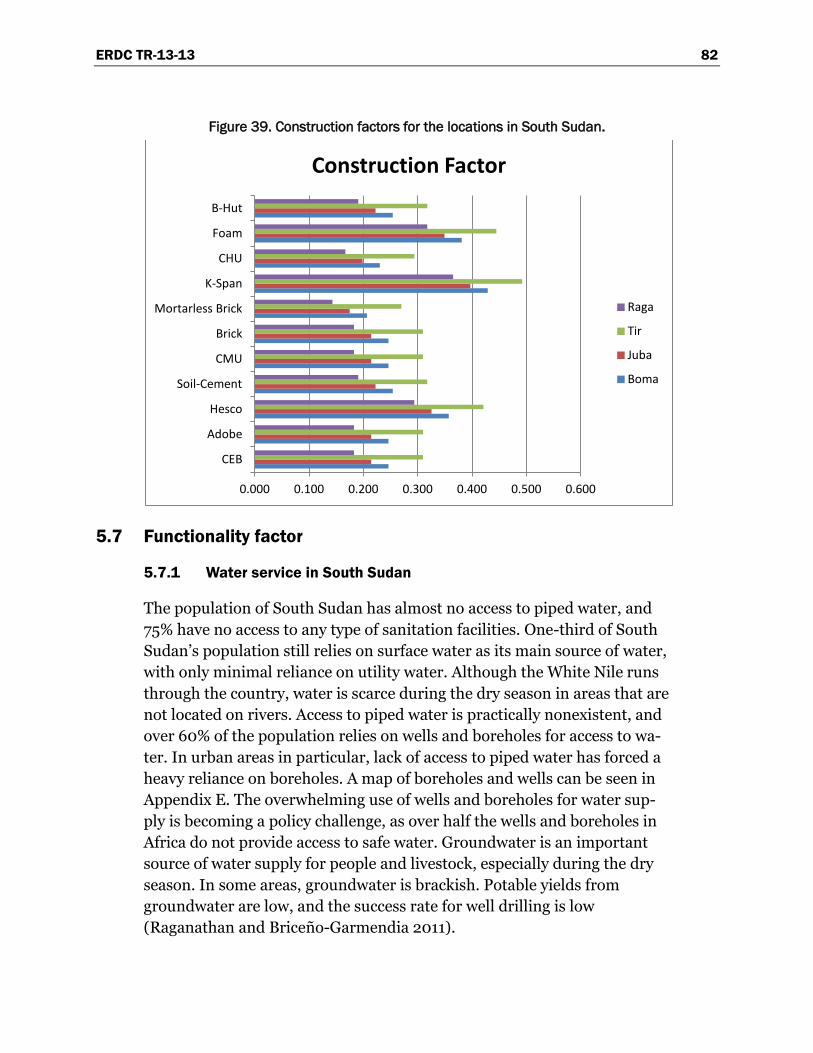
ERDC TR-13-13 82
Figure 39. Construction factors for the locations in South Sudan.
5.7 Functionality factor
5.7.1 Water service in South Sudan
The population of South Sudan has almost no access to piped water, and 75% have no access to any type of sanitation facilities. One-third of South Sudan’s population still relies on surface water as its main source of water, with only minimal reliance on utility water. Although the White Nile runs through the country, water is scarce during the dry season in areas that are not located on rivers. Access to piped water is practically nonexistent, and over 60% of the population relies on wells and boreholes for access to wa-ter. In urban areas in particular, lack of access to piped water has forced a heavy reliance on boreholes. A map of boreholes and wells can be seen in Appendix E. The overwhelming use of wells and boreholes for water sup-ply is becoming a policy challenge, as over half the wells and boreholes in Africa do not provide access to safe water. Groundwater is an important source of water supply for people and livestock, especially during the dry season. In some areas, groundwater is brackish. Potable yields from groundwater are low, and the success rate for well drilling is low (Raganathan and Briceño-Garmendia 2011).
0.000 0.100 0.200 0.300 0.400 0.500 0.600
CEB
Adobe
Hesco
Soil-Cement
CMU
Brick
Mortarless Brick
K-Span
CHU
Foam
B-Hut
Construction Factor
Raga
Tir
Juba
Boma
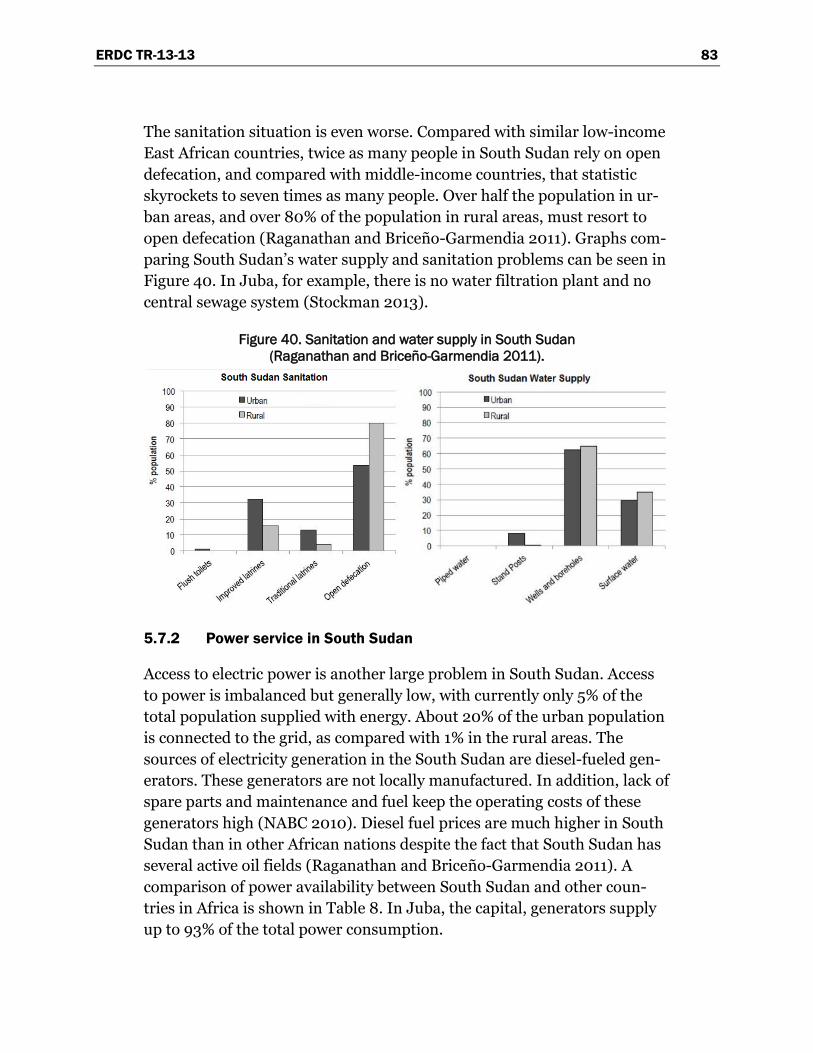
ERDC TR-13-13 83
The sanitation situation is even worse. Compared with similar low-income East African countries, twice as many people in South Sudan rely on open defecation, and compared with middle-income countries, that statistic skyrockets to seven times as many people. Over half the population in ur-ban areas, and over 80% of the population in rural areas, must resort to open defecation (Raganathan and Briceño-Garmendia 2011). Graphs com-paring South Sudan’s water supply and sanitation problems can be seen in Figure 40. In Juba, for example, there is no water filtration plant and no central sewage system (Stockman 2013).
Figure 40. Sanitation and water supply in South Sudan (Raganathan and Briceño-Garmendia 2011).
5.7.2 Power service in South Sudan
Access to electric power is another large problem in South Sudan. Access to power is imbalanced but generally low, with currently only 5% of the total population supplied with energy. About 20% of the urban population is connected to the grid, as compared with 1% in the rural areas. The sources of electricity generation in the South Sudan are diesel-fueled gen-erators. These generators are not locally manufactured. In addition, lack of spare parts and maintenance and fuel keep the operating costs of these generators high (NABC 2010). Diesel fuel prices are much higher in South Sudan than in other African nations despite the fact that South Sudan has several active oil fields (Raganathan and Briceño-Garmendia 2011). A comparison of power availability between South Sudan and other coun-tries in Africa is shown in Table 8. In Juba, the capital, generators supply up to 93% of the total power consumption.
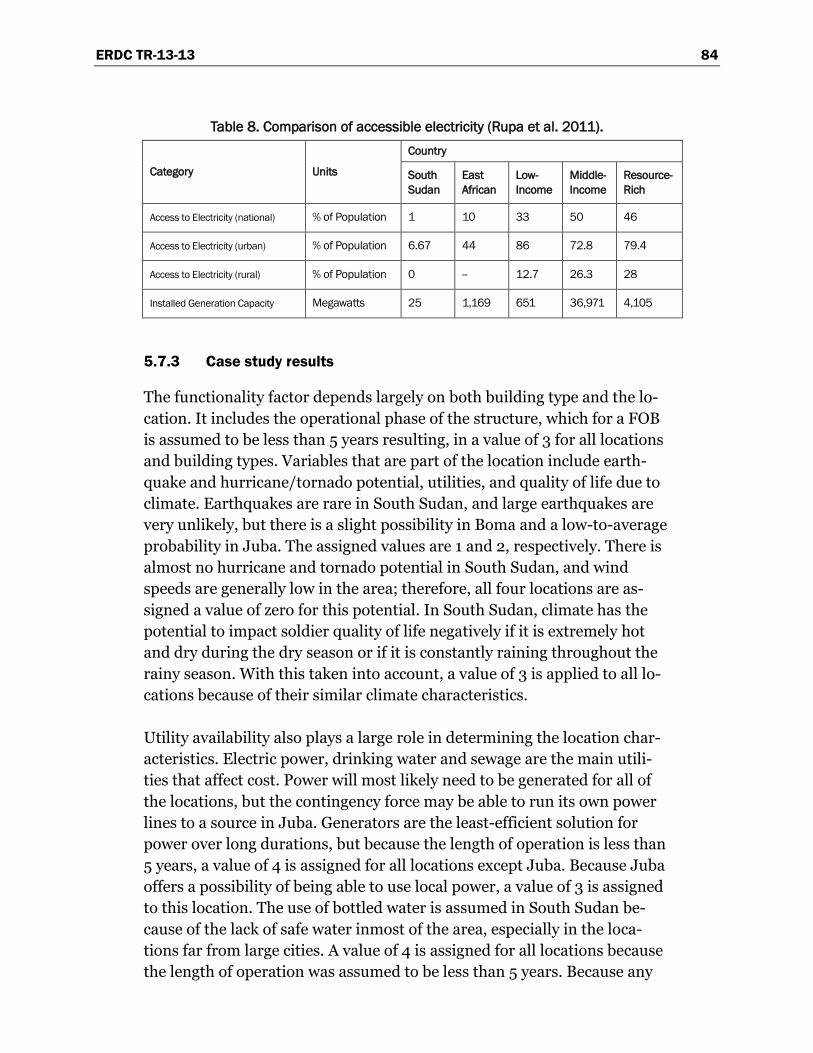
ERDC TR-13-13 84
Table 8. Comparison of accessible electricity (Rupa et al. 2011).
Category Units
Country
South Sudan
East African
Low-Income
Middle-Income
Resource-Rich
Access to Electricity (national) % of Population 1 10 33 50 46
Access to Electricity (urban) % of Population 6.67 44 86 72.8 79.4
Access to Electricity (rural) % of Population 0 -- 12.7 26.3 28
Installed Generation Capacity Megawatts 25 1,169 651 36,971 4,105
5.7.3 Case study results
The functionality factor depends largely on both building type and the lo-cation. It includes the operational phase of the structure, which for a FOB is assumed to be less than 5 years resulting, in a value of 3 for all locations and building types. Variables that are part of the location include earth-quake and hurricane/tornado potential, utilities, and quality of life due to climate. Earthquakes are rare in South Sudan, and large earthquakes are very unlikely, but there is a slight possibility in Boma and a low-to-average probability in Juba. The assigned values are 1 and 2, respectively. There is almost no hurricane and tornado potential in South Sudan, and wind speeds are generally low in the area; therefore, all four locations are as-signed a value of zero for this potential. In South Sudan, climate has the potential to impact soldier quality of life negatively if it is extremely hot and dry during the dry season or if it is constantly raining throughout the rainy season. With this taken into account, a value of 3 is applied to all lo-cations because of their similar climate characteristics.
Utility availability also plays a large role in determining the location char-acteristics. Electric power, drinking water and sewage are the main utili-ties that affect cost. Power will most likely need to be generated for all of the locations, but the contingency force may be able to run its own power lines to a source in Juba. Generators are the least-efficient solution for power over long durations, but because the length of operation is less than 5 years, a value of 4 is assigned for all locations except Juba. Because Juba offers a possibility of being able to use local power, a value of 3 is assigned to this location. The use of bottled water is assumed in South Sudan be-cause of the lack of safe water inmost of the area, especially in the loca-tions far from large cities. A value of 4 is assigned for all locations because the length of operation was assumed to be less than 5 years. Because any
ERDC TR-13-13 85
type of sewer system in South Sudan is nonexistent, a septic tank of some sort will be required in all the locations. A value of 3 is assigned to all loca-tions for sewage.
The most important variable that depends predominantly on building type is structural integrity (followed by safety, quality of life, efficiency, and maintenance), which addresses the type of foundation, earthquake and hurricane/tornado resistance, and the quality of construction. The quality of construction is assumed to be average (value of 3), and the foundation is assumed to be unstabilized (value of 5) unless some sort of stabilization is required. Hesco bastions and B-huts must be built on some sort of stabi-lized ground (value of 4), and k-span buildings must be built with a con-crete foundation (value of 1). The addition of stabilized ground and foun-dations is reflected as an increase in construction factor because they increase costs, but that coincides with a reduction of the functionality fac-tor. For earthquake and hurricane/tornado resistance, it is assumed that traditional and earthen brick construction is done with no rebar detailing and minimal redundancy, which assigns them a value of 4. Hesco bastions are assumed to be average in terms of hazard resistance, due to their par-tially stabilized ground and large, heavy walls; and k-spans are considered average as well due to their concrete foundations. B-huts are assumed to be below average (value of 4) for both hazards. CHUs are assumed to be above average in both cases (value of 2). Foam buildings are assumed to perform above average against wind and average against earthquakes.
For safety, the constituent variables are force protection and fire re-sistance. Hesco bastions are best for force protection, followed by earthen block, and then traditional bricks with values of 1, 2, and 3, respectively. K-spans and CHUs have poor force protection properties because of their skin metal walls and roofs, and foam and B-huts are the most fragile mate-rials. Therefore, these four building types are assigned values of 5. Fire re-sistance was determined using ISO and IBC classifications. CED, adobe, Hesco, and soil-cement are the most fire-resistant buildings, and assigned a value of 1. The remaining building types are rated between average and poor in terms of fire resistance (value of 3–5). For quality of life dependent on the building type, air conditioning, heaters, and windows can have a large impact. It is assumed that air conditioning and heat will be installed in each building type, which results in a quality-of-life value of 1.
ERDC TR-13-13 86
Efficiency is decomposed into space efficiency and energy efficiency. Space efficiency is based on wall thickness and any wasted space. Thin walls without any wasted space include traditional brick buildings (value of 1); thicker walls without any wasted space include earthen blocks (value of 2), and the rest of the building types lose efficiency through high wall thick-ness, wasted space, and limited space (value of 4). Energy efficiency is based on r-factors. Large r-factors generally come from large, heavy walls and roofs, which include earthen blocks and Hesco bastions (value of 1). Clay bricks and foam buildings are assigned a value of 3 for having an av-erage r-factor, and the steel buildings and the B-hut have small r-factors, resulting in a value of 5. All of the maintenance that a structure may need is all combined into one general maintenance category. The maintenance is based on the quality of construction, roof design and efficiency, and cli-mate characteristics, including water table location and weather. It is as-sumed that k-span and CHU buildings will require no maintenance (value of 1) due to the roofing design and self-contained structure, respectively. CMU and brick construction is assumed to require average maintenance (value of 3) due to mortar cracking and typical roofing problems. Earthen block construction is assumed to require above-average maintenance due to mortar and block cracking as well as roof problems. The other materials are assumed to have below-average maintenance requirements (value of 2) for any small issues that may arise.
A summary of the functionality factor components for each building type is provided graphically in Figure 41. For each location in general, function-ality factor values are similar between the building types. Hesco bastions and k-span buildings have the only values below 0.150, a result of good functional performance after construction. This is the only factor where these building types rank as highly sustainable. The large disparity be-tween locations is a consequence of different earthquake vulnerabilities. While Raga and Tir are located just north of any earthquake potential, Boma is located in a zone of slight probability and Juba in an area of low-to-average probability of earthquakes. Although the probability is low, buildings constructed in locations with the potential for an earthquake must be designed to withstand such an event for occupant safety.

ERDC TR-13-13 87
Figure 41. Functionality factors for locations in South Sudan.
5.8 Disposal factor
5.8.1 South Sudan methods and characteristics
Disposal problems arise in South Sudan because the overwhelming major-ity of landfills are just open dumps. They are typically not located far from wetland areas or surface-water sources, and locations are not chosen with concern for hydrological or public health. Disposal facilities are generally located based on ease of access for the collection vehicle, usually on the perimeter of major urban areas in open lots as well as the other locations previously stated. Even though there are construction and maintenance requirements for such facilities, the rules usually go unenforced. The lack of financial and human resources limit how effectively these landfills can built and operated at even minimum sanitary standards. South Sudan cur-rently does not have any recycling programs, but awareness for the need is being increasingly promoted (IETC).
Although western-type recycling programs do not operate, reuse of scarce materials such as steel from a demolished k-span would not be uncom-mon. Even scrap metal would eagerly be taken and transported by the lo-cal people. Wood from a B-hut would also be taken over by the local resi-dents for reuse at no cost to the military. For materials that the United States would like to reuse somewhere else, such as Hesco bastions, the cost
0.000 0.050 0.100 0.150 0.200
CEB
Adobe
Hesco
Soil-Cement
CMU
Brick
Mortarless Brick
K-Span
CHU
Foam
B-Hut
Functionality Factor
Raga
Tir
Juba
Boma
ERDC TR-13-13 88
would fall on the military to remove and transport the material. Demol-ished traditional brick buildings will most likely require transport to a lo-cal dump by the military, depending on the location of the structure. Dis-posal of building material such as adobe or CEB would require no transportation because it could most likely just be left where it was demol-ished.
For a country with economic conditions like South Sudan, the local popu-lation would most take over abandoned military buildings for private use, and the military would allow not object as long sensitive information and equipment have been removed. Because local handover would not effec-tively show how the rating system for the disposal factor works, this meth-od of decommissioning is not considered here.
5.8.2 Case study results
The disposal factor depends mainly on the building type. For this case study, it was assumed that local handover of the structure at the end of its useful life does not occur, as noted above. Instead, it was assumed that demolition would occur. Earthen bricks were assumed to be easily demol-ished, resulting in a value of 2; concrete and fired bricks were assumed to present some demolition difficulty, resulting in a value of 3; and all other types fell within the same demolition rating range except for Hesco basti-ons and k-spans, which were medium and difficult to demolish (value of 3 and 4, respectively).
Equipment and labor requirements are determined based on what is done with the demolished material. For material that can be demolished and left in place (i.e., adobe and CEB), a value of 1 is assigned. Demolished materi-al that cannot be left in place may be transported to local dumps, recycling locations, or to another United States FOB; these options are assigned val-ues of 2, 3, and 4, respectively. For example, foam will be brought to a dump, wood from a B-hut will be recycled and reused, and Hesco bastions will be reused in another US mission.
This factor also depends on the transportation of the material after demo-lition, if applicable. Materials that can be demolished into small pieces, such as bricks, are assumed to be easy to transport and are assigned a val-ue of 1. Materials that remain large, such as metal from k-spans or CHUs, are harder to transport and are assigned values of 4 and 5, respectively. Transportation distances are calculated based on what is done with the

ERDC TR-13-13 89
demolished material and the location it is being transported from. It is as-sumed there is a dump and recycling location near Juba; therefore, it is assigned the smallest distance value of 1. It is also assumed that recycling locations will be farther away than dumps for the other three locations. For materials being reused by the United States, the largest distance value, 5 is assigned for all of the locations. The materials being transported will also be subject the hostility factor previously discussed. Figure 42 illus-trates the results.
Figure 42. Disposal factors for locations in South Sudan.
It can be seen in Figure 42 that CEB, adobe, and soil-cement will result in the smallest disposal factor (assuming local handover does not occur) be-cause no transportation of the demolished material is required. On the other hand, the Hesco bastion, CHU, and k-span have the largest disposal factors, as explained above. The locations of Boma and Tir generally have larger disposal factors owing to the longer distances that must be traveled and the hostility present in those areas.
5.9 Overall Indigenity Index
The Indigenity Index for South Sudan takes into account the material, transportation, construction, functionality, and disposal factors with no
0.000 0.100 0.200 0.300 0.400 0.500 0.600 0.700
CEB
Adobe
Hesco
Soil-Cement
CMU
Brick
Mortarless Brick
K-Span
CHU
Foam
B-Hut
Disposal Factor
Raga
Tir
Juba
Boma
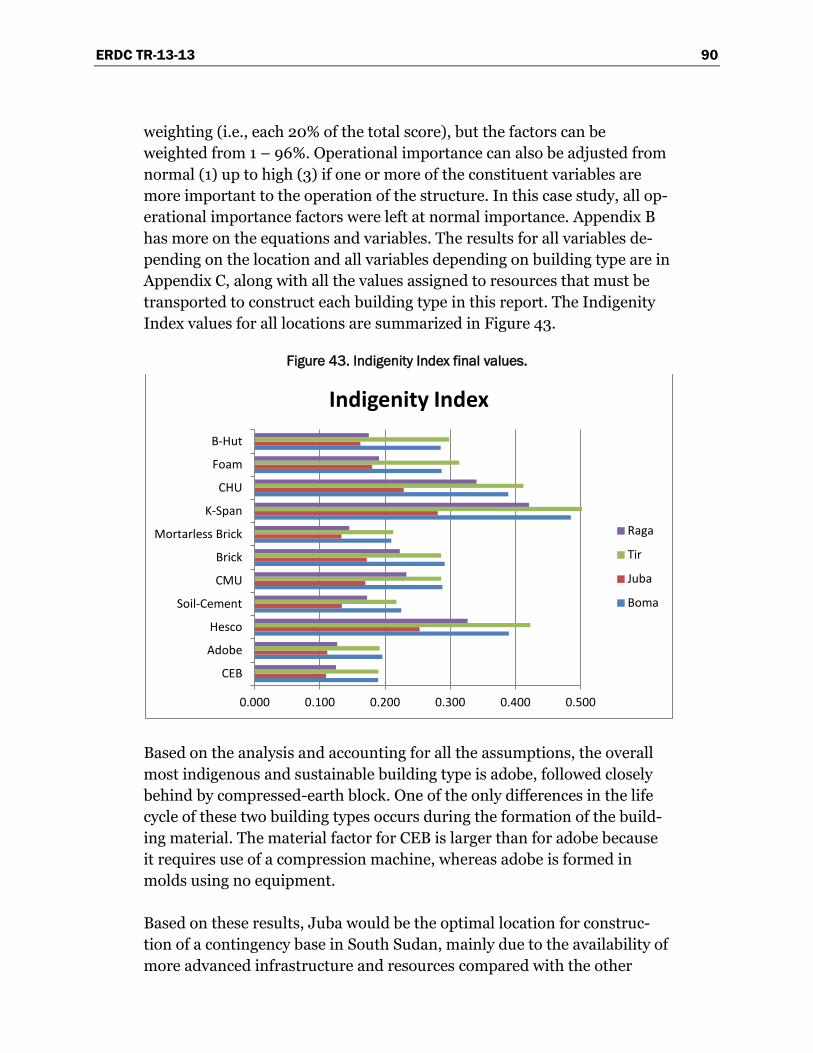
ERDC TR-13-13 90
weighting (i.e., each 20% of the total score), but the factors can be weighted from 1 – 96%. Operational importance can also be adjusted from normal (1) up to high (3) if one or more of the constituent variables are more important to the operation of the structure. In this case study, all op-erational importance factors were left at normal importance. Appendix B has more on the equations and variables. The results for all variables de-pending on the location and all variables depending on building type are in Appendix C, along with all the values assigned to resources that must be transported to construct each building type in this report. The Indigenity Index values for all locations are summarized in Figure 43.
Figure 43. Indigenity Index final values.
Based on the analysis and accounting for all the assumptions, the overall most indigenous and sustainable building type is adobe, followed closely behind by compressed-earth block. One of the only differences in the life cycle of these two building types occurs during the formation of the build-ing material. The material factor for CEB is larger than for adobe because it requires use of a compression machine, whereas adobe is formed in molds using no equipment.
Based on these results, Juba would be the optimal location for construc-tion of a contingency base in South Sudan, mainly due to the availability of more advanced infrastructure and resources compared with the other
0.000 0.100 0.200 0.300 0.400 0.500
CEB
Adobe
Hesco
Soil-Cement
CMU
Brick
Mortarless Brick
K-Span
CHU
Foam
B-Hut
Indigenity Index
Raga
Tir
Juba
Boma
ERDC TR-13-13 91
three locations. Boma and Tir are consistently ranked higher (less favora-ble), which can be attributed partially to the hostility in the areas. The k-span building type resulted in the highest (least indigenous) values for every location, largely due to the complexity of construction coupled with the lack of local resources to support the construction method.
These results represent a hypothetical case study for four locations in South Sudan, and include many stipulated assumptions. These assump-tions pertain to characteristics of the land, resources available, and current construction practices in South Sudan, and also to material and structural characteristics and formation procedures required for the building types evaluated.
In any real-world case, site visits to the proposed base locations and neighboring areas will be required to obtain accurate information about resource and skill availability, and the prevailing construction practices in the area. Refinement of the rating system by subject-matter experts for specific variables (i.e., force protection, wastewater treatment, and quality of life) will be required to further develop the Indigenity Index into a field-usable methodology.
ERDC TR-13-13 92
6 Conclusions and Recommendations
6.1 Conclusions
This report describes the development and experimental application of an Indigenity Index that uses quantitative data and expert technical judgment to assess the feasibility of constructing FOB facilities using indigenous ma-terials and techniques. The purpose of the Indigenity Index is to help Ar-my decision makers plan, design, and build infrastructure to support con-tingency operations at the lowest feasible life-cycle cost. The objective is to provide or acquire suitable housing, utilities, force protection, and other necessities by the most sustainable means possible with respect to loca-tion-specific variables. For this project, the sustainability refers to the op-timal construction solution for a prescribed military contingency base lo-cation, not the broad and full scope of the term as used in Army sustainability doctrine.
The Indigenity Index is produced by a holistic life-cycle assessment that accounts not only for the constructability and operational characteristics of specific types of structures intended for specific locations, but also for the sociocultural and environment impacts. The Indigenity Index is calcu-lated from the scoring of five categories of metrics:
1. material factor 2. transportation factor 3. construction factor 4. functionality factor 5. disposal factor.
These five factors consist of all known significant cost factors that must be accounted for in calculating the mission life-cycle cost of FOB facilities. These costs are processed using an algorithm that encompasses the calcu-lations and parameters presented in Appendix B.
The experimental application of the Indigenity Index for a hypothetical case, located in South Sudan, is presented in Chapter 5. The scope of the demonstration was to compare certain established, international modern construction systems and three globally used systems that are either fully indigenous or have a high requirement for indigenous materials (i.e., ado-
ERDC TR-13-13 93
be, compressed-earth blocks, and soil-filled Hesco bastions). The specific information base used in the demonstration pertained specifically to the selected structural types and the geographical location of a proposed FOB. The geospatial information included data on the location of internal and cross-border hostilities that could affect the logistical burden of establish-ing the FOB.
The Indigenity Index represents a new framework that provides a demon-strated basis for planning FOB facilities to maximize mission sustainment through the informed use of indigenous materials and methods in contin-gency base construction.
6.2 Recommendations
The Indigenity Index presented here represents a prototype tool for proof of concept. Before applying the Indigenity Index to a real-world case, it is recommended that every variable be researched thoroughly by individuals with expertise in the applicable technical disciplines, such as force protec-tion, fire safety, overseas labor markets, etc. Expert input for any new con-tingency action will be needed to accurately represent location-specific variables required to quantify FOB facility life-cycle cost.
When applying the Indigenity Index to a real-world contingency activity, the developers should seek access to in-country sources of information where needed, and should further refine the indigenity ranking system based both on expert judgment and the best validated data sources availa-ble.
The use of locally available construction materials, practices, and labor has the potential to build indigenous capacity, encourage economic develop-ment, and support partnerships with host nations. To achieve these goals, the Department of Defense, the Army, and NGOs would benefit from knowing how to work with the indigenous construction industry, including information on host-nation construction regulations and codes, and sources for hiring construction professionals, trades workers, and labor-ers. Krooks et al. (2012) suggest that more research on each specific nation will be necessary to achieve an understanding of how best to work with its indigenous construction industry.
With the growing international attention on sustainable construction de-signs and practices, there is an increasing amount of research available on
ERDC TR-13-13 94
the performance of traditional indigenous buildings in terms of passive cooling and heating methods and natural ventilation. Traditional Army theater facilities are highly dependent on mechanical cooling, heating, and ventilation methods that require power from diesel generators, which con-sumes fossil fuels and contributes to air and noise pollution. Alternative methods for providing sufficient interior comfort, inspired by traditional indigenous construction, could be researched and presented in a form use-able by Army planners, designers, and builders. Incorporating such meth-ods into FOB facilities could improve FOB sustainability and reduce life-cycle costs to the Army.
Information on the development of a construction industry at the level of specificity recommended by Ofori (2001) and the World Bank’s Doing Business project (2011) would be useful for Army planners, designers, and builders. This information could be organized and synthesized into an analytical framework that would point to data requirements that would contribute to understanding of the indigenous construction industry and its regulation by government.
It is also recommended that a material screening process and testing pro-tocol be developed to ensure sufficient quality control of indigenous con-struction materials.
Further engagement with the US Army Engineer School and the USACE Army Facilities Component System program is recommended to integrate indigenous construction materials into military design and construction standards.
ERDC TR-13-13 95
References ACI 506R-90. Guide to Shotcrete. ACI Committee 506.
Adam, E. A., and A. R. A. Agib. July 2001. Compressed Stabilised Earth Block Manufacture in Sudan. United Nations Educational, Scientific and Cultural Organization.
Africa Business Initiative: US Chamber of Commerce. September 2011. Investment Climate Update: South Sudan 2(3).
Al-Hemiddi, Nasser A., and Khalid A. Megren Al-Saud. 2001. “The Effect of a Ventilated Interior Courtyard on the Thermal Performance of a House in a Hot-Arid Region.” Renewable Energy 24(3-4):581-595.
Armed Forces International. The Effectiveness of Concertainer Structures Against Attack from Vehicles: HESCO Bastion Concertainer, http://www.armedforces-int.com, accessed 20 February 2013.
Arvis, Jean-Francois, Gael Raballand, and Jean-Francois Marteau. 2010. The Cost of Being Landlocked: Logistics Costs and Supply Chain Reliability. The World Bank.
ATCO. Masonry Units. ATCO Concrete Products. Retrieved on 4/10/2013 from http://www.atcoconcreteproducts.com.
Blondet, Marcial. Gladys Villa Garcia M. Brzev, Svetlana. March 2003. Earthquake-Resistant Construction of Adobe Buildings: A Tutorial. EERI/IAEE World Housing Encyclopedia.
Boudreau, Eugene H. 1971. Making the Adobe Brick. Berkeley, CA: Fifth Street Press.
CIA. "Sudan." cia.gov. Central Intelligence Agency, February 5, 2013. Retrieved March 21, 2013 from https://www.cia.gov/library/publications/the-world-factbook/geos/su.html.
CrisisWatch. http://www.crisisgroup.org/en/publication-type/crisiswatch/crisiswatch-database.aspx?CountryIDs=%7BC076CDFE-2B2D-4642-8895-5EF27AE4E416%7D.
Din Sabr, Mohy el, Spaulding, J.L, Sikainga, A.A, editors, 2013 “South Sudan” in www.britannica.com/EBchecked/topic/1779607/South-Sudan/300736/Settlement-patterns
F10 International. K-Span Structures, http://www.f10international.com, accessed 3 April 2013.
Fardeheb, F. 1987. “Examination and Classification of Passive Solar Cooling Strategies in Middle Eastern Vernacular Architecture.” Passive Solar Journal 4(4):377-418.
ERDC TR-13-13 96
Feriadi, Henry, and Nyuk Hien Wong. 2004. Thermal Comfort for Naturally Ventilated Houses in Indonesia. Energy and Buildings 36:614-626.
Ghaemmaghami, P.S., and M. Mahmoudi. 2005. Wind Tower a Natural Cooling System in Iranian Traditional Architecture. International Conference “Passsive and Low Energy Cooling for the Built Environment,” May 2005, Santorini, Greece.
Google Earth. South Sudan. April 9, 2013, accessed May 2013.
Grey, D. and McNab, R. 2013. Personal Communication with Rosa Affleck on July 19, 2013. The Louis Berger Group.
Guarcello, L, S. Lyon, F. C. Rosati 2011 Labour Market in South Sudan, Understanding Children’s Work Programme Working Paper Series, December 2011.
Haener Block. Mortarless Masonry. Masonry Magazine. July 2004. Retrieved on 4/4/2013 from http://www.haenerblock.com.
HESCO Barriers, http://www.Hescobarriers.com, accesed 20 February 2013.
Hillstrom Contracting, Inc. “Shotcrete,” http://hillconinc.com, accessed 10 April 2013.
Holm, Knut B., Fykse, Haakon. Tests of Hesco Shelters, November 2010. Norwegian Defense Research Establishment (FFI). 4 July 2011.
IETC. Newsletter and Technical Publications: Municipal Solid Waste Management. UNEP: Division of Technology, Industry and Economics. http://www.unep.or.jp/ietc/estdir/pub/msw/ro/contents_Africa.asp.
Karyabwite, Diana Rizzolio. 2000. Water Sharing in the Nile River Valley, Project GNV011: Using GIS/Remote Sensing for the Sustainable Use of Natural Resources. UNEP/DEWA/GRID – Geneva, January-March 1999, January-June 2000.
Kayiira, D. 2012. South Sudan Housing Finance Report. Center for Affordable Housing Finance in Africa http://www.housingfinanceafrica.org/wp-content/uploads/2012/09/South-Sudan-Housing-Finance-Report.pdf.
Krooks, David A., Lucy A. Whalley, and H. Garth Anderson. July 2012. Contingency Bases and the Problem of Sociocultural Context. ERDC/CERL TN-12-2. Champaign, IL: US Army Engineer Research and Development Center, Construction Engineering Research Laboratory.
Kuo, Steven C., Laura Barber, Xiao Yuhua, and Thomas Wheeler, “China and South Sudan, Saferworld Briefing, August 2012,” http://www.saferworld.org.uk/downloads/pubdocs/China-South%20Sudan%20briefing%20English.pdf, accessed 8 July 2013.
Lawrence, M.G. 2005. “The Relationship between Relative Humidity and the Dewpoint Temperature in Moist Air.” Bulletin of the American Meteorological Society, February 2005, pp 225-233.
ERDC TR-13-13 97
LEED 2009 for New Construction and Major Renovations Rating System. 2009. Download the rating system via PDF from http://www.usgbc.org/resources/leed-new-construction-v2009-current-version.
LEGI. Compressed Soil Block Machine, Model Series LEGI 480 brochure. Leading Edge Group, Inc.
LEGI. Compressed Soil Blocks. Leading Edge Group, Inc., http://compressedsoilblocks.com, 27 February 2013 .
McHenry Jr., Paul Graham. 1973. Adobe, Build it Yourself. Tucson, AZ: The University of Arizona Press.
Morisset, Jacques, and Olivier Lumenga Neso. May 2002. Administrative Barriers to Foreign Investment in Developing Countries. Policy Research Working Paper 2848. The World Bank and International Finance Corporation.
NBS. South Sudan Statistical Yearbook 2011. National Bureau of Statistics. Juba.
NCMA. July 2009. Blast and Bullet Resistant Concrete Masonry Building, http://www.ncma.org, accessed 15 April 2013.
Netherlands-African Business Council (NABC). 2011. Fact Sheet Trade Mission South Sudan, 9-13 October 2011
Niecee. Styrofoam Houses in Japan, http://niecee.com, accessed 10 April 2013.
NMAC. 2009. New Mexico Earthen Building Materials Code. 14.7.4 New Mexico Administrative Code. Construction Industries Division of the Regulation and Licensing. 2009.
Ofori, George. 2001. “Indicators for Measuring Construction Industry Development in Developing Countries.” Building Research and Information 29(1):40-50.
Oskam V/F. Compressed-earth block machines, http://www.oskam-vf.com, accessed 26 February 2013.
Polycel Structural Foam. Why Structural Foam?. Retrieved on 4/8/2013 from http://polycel.com/why.html.
Raganathan, Rupa, and Cecilia M. Briceño-Garmendia. June 2011. South Sudan’s Infrastructure: A Continental Perspective. AICD Country Report. Washington, DC: The World Bank.
Rothfusz, L.P. 1990. “The Heat Index Equation.” National Weather Service Technical Attachment SR 90-23.
Roye, Kevin L., Metal Building Construction Using the MIC-240 ABM K-Span Machine. Naval Postgraduate School, Monterey, CA 93943. University of Florida. Fall 1996.
Safarzadeh, H., and M. N. Bahadori. 2005. “Passive Cooling Effects of Courtyards.” Building and Environment 40(1):89-104.

ERDC TR-13-13 98
Silveirs, Dora. Varum, Humberto. Costa, Aníbal. Martins, Tiago. Pereira, Henrique. Almeida, João. Mechanical Properties of adobe bricks in ancient constructions. Construction and Building Materials 28 (2012) p36-44.
Smith, Alvin. Feasibility of Structural Foam/Concrete Building for Theater of Operations Use. CERL Technical Report M-231. March 1978.
South Sudan Development Plan 2011–2013. 2011. Government of South Sudan, Juba, August 2011.
South Sudan National Bureau of Statistics. 2011. South Sudan Cost-to-Market Report: An Analysis of Check-points on the Major Trade Routes in South Sudan, August 2011.
SSCCSE. 2010 Southern Sudan Centre for Census Statistics and Evaluation, Annual Report, 2010.
Stockman, F. 2013 The Wild West in South Sudan. Boston Globe, June 9, 2013. http://www.bostonglobe.com/opinion/2013/06/08/cowboy-capitalists-rush-into-south-sudan/Mkk9CBw5idzolS3C38F1BJ/story.html.
SwRI. 20mm and .50cal FSP Testing of Compressed Soil Block Wall Final Report. Southwest Research Institute. May 2010
Taylor Concrete Products, Inc. Azar Mortarless Building Systems Inc, http://www.taylorconcrete.com, accessed 4 April 2013.
Terra Block Compressed-earth blocks, http://www.terrablock.com, accessed 28 February 2013.
The World Bank. 2011. Data sheet. Vol. 1 of Sudan - Rural Water Supply and Sanitation Project : restructuring. Washington DC: The World Bank.
Toh, Kiertisak. 2009. Southern Sudan: Post –Conflict Economic Recovery and Growth, An Agenda for USAID Engagement. Management Systems International, Contracted under DFD-I-00-05-00251-00, Task Order # 2, USAID, 31 July 2009.
Wayne, A. Charlie, Mohamed A. Osman, and Elfatih M. Ali. Construction on Expansive Soils in Sudan. J. Constr. Eng. Manage. 1984. 110: pp. 359-374.
Weather Averages for Juba, Sudan, Climate, http://www.juba.climatemps.com/, accessed 14 August 2013.
World Bank. 2011. Doing Business in Juba 2011. The International Bank for Reconstruction and Development/The World Bank (accessed 8 July 2013 from http://www.doingbusiness.org).
World Weather and Climate Information. Retrieved on July 17, 2013 from http://www.weather-and-climate.com/average-monthly-Rainfall-Temperature-Sunshine,Juba,Sudan.
WSC. About the Industry: Containers. World Shipping Industry, http://www.worldshipping.org, accessed 8 April 2013.
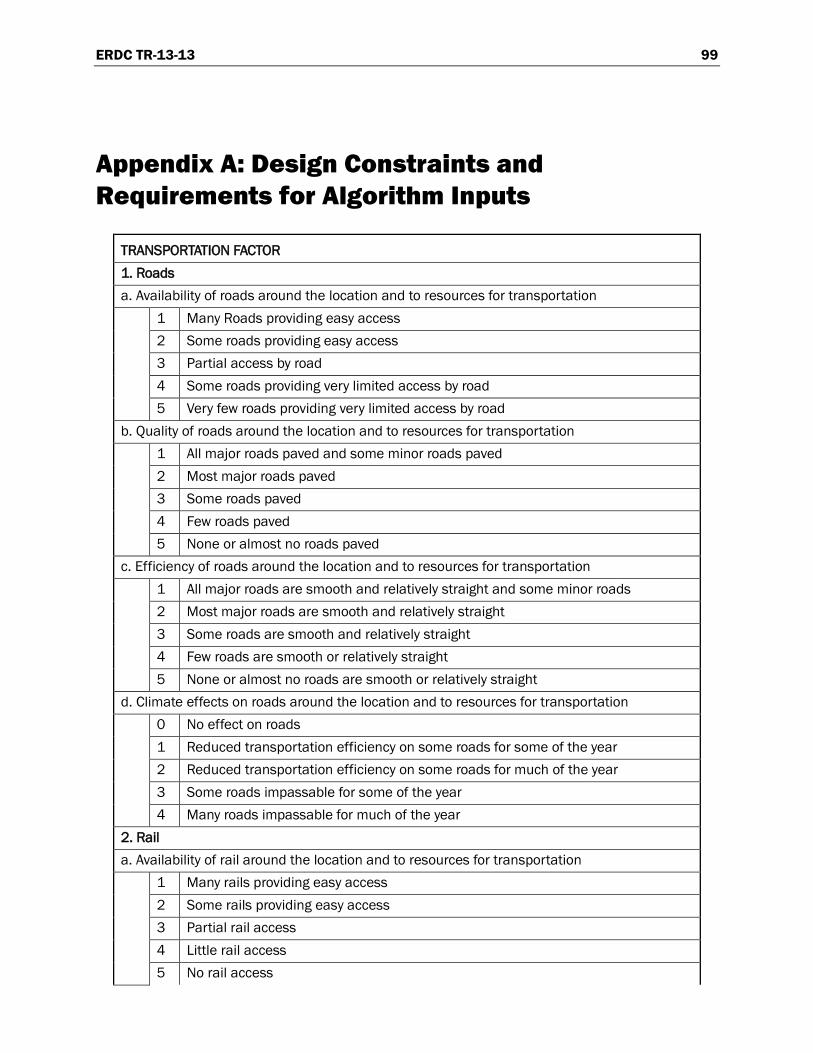
ERDC TR-13-13 99
Appendix A: Design Constraints and Requirements for Algorithm Inputs
TRANSPORTATION FACTOR 1. Roads a. Availability of roads around the location and to resources for transportation
1 Many Roads providing easy access 2 Some roads providing easy access 3 Partial access by road 4 Some roads providing very limited access by road 5 Very few roads providing very limited access by road
b. Quality of roads around the location and to resources for transportation
1 All major roads paved and some minor roads paved 2 Most major roads paved 3 Some roads paved 4 Few roads paved 5 None or almost no roads paved
c. Efficiency of roads around the location and to resources for transportation
1 All major roads are smooth and relatively straight and some minor roads 2 Most major roads are smooth and relatively straight 3 Some roads are smooth and relatively straight 4 Few roads are smooth or relatively straight 5 None or almost no roads are smooth or relatively straight
d. Climate effects on roads around the location and to resources for transportation
0 No effect on roads 1 Reduced transportation efficiency on some roads for some of the year 2 Reduced transportation efficiency on some roads for much of the year 3 Some roads impassable for some of the year 4 Many roads impassable for much of the year
2. Rail a. Availability of rail around the location and to resources for transportation
1 Many rails providing easy access 2 Some rails providing easy access 3 Partial rail access 4 Little rail access 5 No rail access
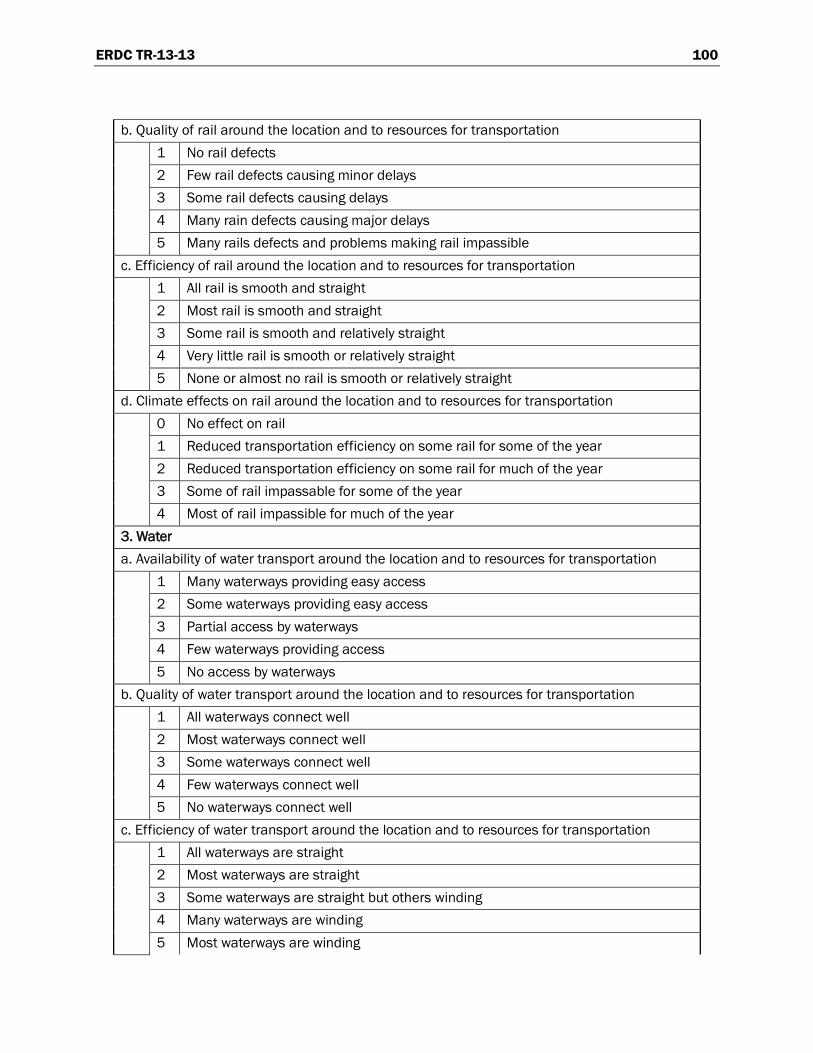
ERDC TR-13-13 100
b. Quality of rail around the location and to resources for transportation
1 No rail defects 2 Few rail defects causing minor delays 3 Some rail defects causing delays 4 Many rain defects causing major delays 5 Many rails defects and problems making rail impassible
c. Efficiency of rail around the location and to resources for transportation
1 All rail is smooth and straight 2 Most rail is smooth and straight 3 Some rail is smooth and relatively straight 4 Very little rail is smooth or relatively straight 5 None or almost no rail is smooth or relatively straight
d. Climate effects on rail around the location and to resources for transportation
0 No effect on rail 1 Reduced transportation efficiency on some rail for some of the year 2 Reduced transportation efficiency on some rail for much of the year 3 Some of rail impassable for some of the year 4 Most of rail impassible for much of the year
3. Water a. Availability of water transport around the location and to resources for transportation
1 Many waterways providing easy access 2 Some waterways providing easy access 3 Partial access by waterways 4 Few waterways providing access 5 No access by waterways
b. Quality of water transport around the location and to resources for transportation
1 All waterways connect well 2 Most waterways connect well 3 Some waterways connect well 4 Few waterways connect well 5 No waterways connect well
c. Efficiency of water transport around the location and to resources for transportation
1 All waterways are straight 2 Most waterways are straight 3 Some waterways are straight but others winding 4 Many waterways are winding 5 Most waterways are winding
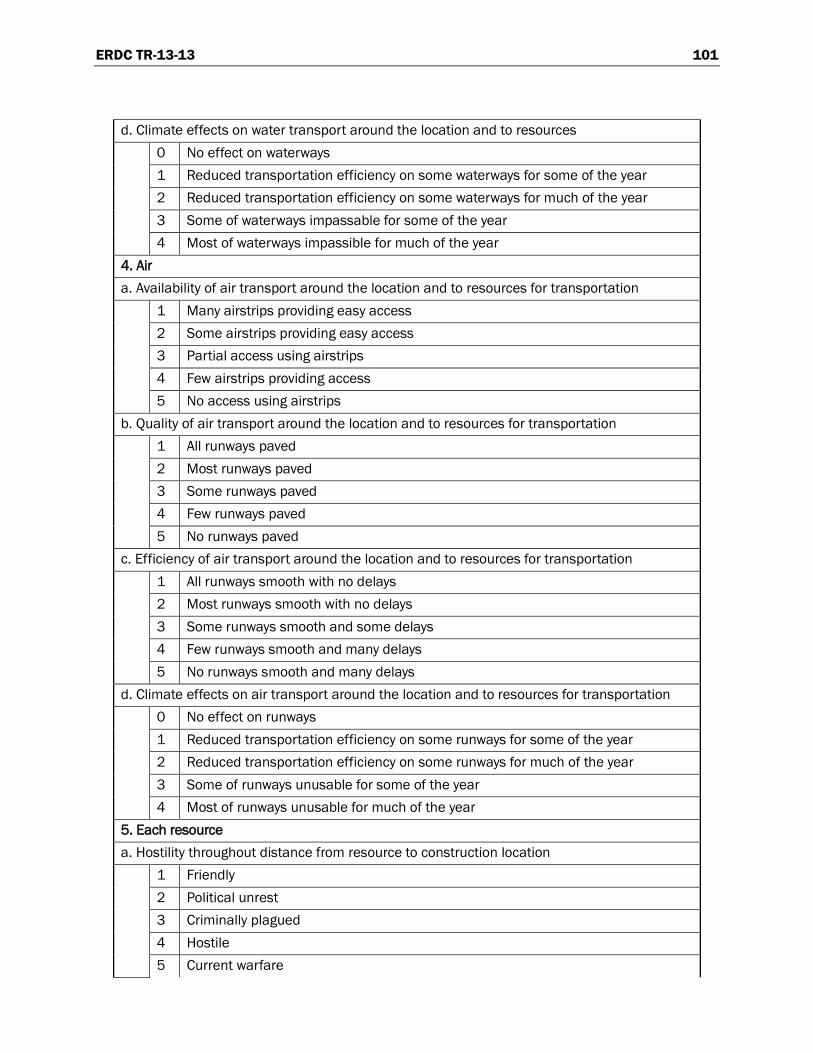
ERDC TR-13-13 101
d. Climate effects on water transport around the location and to resources
0 No effect on waterways 1 Reduced transportation efficiency on some waterways for some of the year 2 Reduced transportation efficiency on some waterways for much of the year 3 Some of waterways impassable for some of the year 4 Most of waterways impassible for much of the year
4. Air a. Availability of air transport around the location and to resources for transportation
1 Many airstrips providing easy access 2 Some airstrips providing easy access 3 Partial access using airstrips 4 Few airstrips providing access 5 No access using airstrips
b. Quality of air transport around the location and to resources for transportation
1 All runways paved 2 Most runways paved 3 Some runways paved 4 Few runways paved 5 No runways paved
c. Efficiency of air transport around the location and to resources for transportation
1 All runways smooth with no delays 2 Most runways smooth with no delays 3 Some runways smooth and some delays 4 Few runways smooth and many delays 5 No runways smooth and many delays
d. Climate effects on air transport around the location and to resources for transportation
0 No effect on runways 1 Reduced transportation efficiency on some runways for some of the year 2 Reduced transportation efficiency on some runways for much of the year 3 Some of runways unusable for some of the year 4 Most of runways unusable for much of the year
5. Each resource a. Hostility throughout distance from resource to construction location
1 Friendly 2 Political unrest 3 Criminally plagued 4 Hostile 5 Current warfare

ERDC TR-13-13 102
b. Distance from resource to construction location
1 0-50 miles 2 50-150 miles 3 150-300 miles 4 300-500 miles 5 More than 500 miles
c. Ease of resource transportation
1 No difficulty 2 Little difficulty 3 Some difficulty 4 Difficult 5 Extremely difficult
d. Quantity of resources transported
1 One truckload 2 Couple truckloads 3 Few truckloads 4 Several truckloads 5 Many truckloads
CONSTRUCTION FACTOR 1. Location of construction a. How to take ownership of the land
1 Free land 2 Negotiate for the land 3 Lease the land 4 Buy the land 5 Take land by force
b. Local disruption caused by construction location
1 No disruption to anyone 2 Disruption to normal traffic or airspace 3 Disruption to small towns or airstrips that are not very busy 4 Disruption to bigger towns or airstrips 5 Disruption to large cities or airports
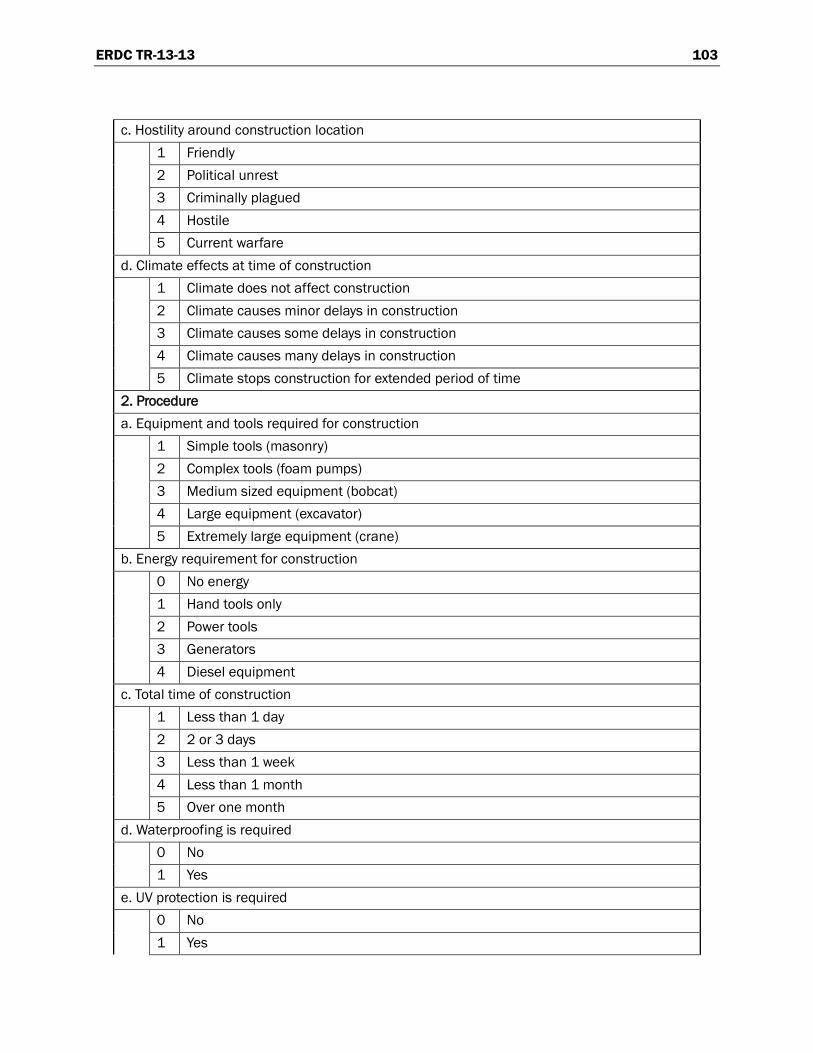
ERDC TR-13-13 103
c. Hostility around construction location
1 Friendly 2 Political unrest 3 Criminally plagued 4 Hostile 5 Current warfare
d. Climate effects at time of construction
1 Climate does not affect construction 2 Climate causes minor delays in construction 3 Climate causes some delays in construction 4 Climate causes many delays in construction 5 Climate stops construction for extended period of time
2. Procedure a. Equipment and tools required for construction
1 Simple tools (masonry) 2 Complex tools (foam pumps) 3 Medium sized equipment (bobcat) 4 Large equipment (excavator) 5 Extremely large equipment (crane)
b. Energy requirement for construction
0 No energy 1 Hand tools only 2 Power tools 3 Generators 4 Diesel equipment
c. Total time of construction
1 Less than 1 day 2 2 or 3 days 3 Less than 1 week 4 Less than 1 month 5 Over one month
d. Waterproofing is required
0 No 1 Yes
e. UV protection is required
0 No 1 Yes
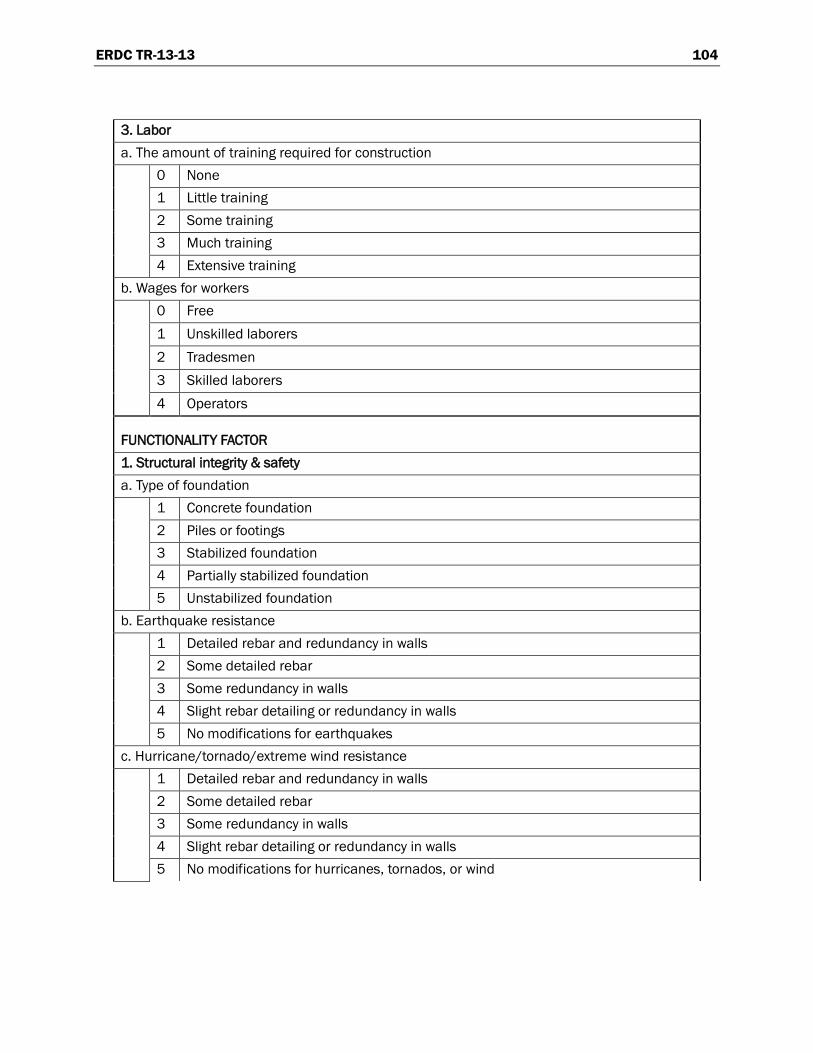
ERDC TR-13-13 104
3. Labor a. The amount of training required for construction
0 None 1 Little training 2 Some training 3 Much training 4 Extensive training
b. Wages for workers
0 Free 1 Unskilled laborers 2 Tradesmen 3 Skilled laborers 4 Operators
FUNCTIONALITY FACTOR 1. Structural integrity & safety a. Type of foundation
1 Concrete foundation 2 Piles or footings 3 Stabilized foundation 4 Partially stabilized foundation 5 Unstabilized foundation
b. Earthquake resistance
1 Detailed rebar and redundancy in walls 2 Some detailed rebar 3 Some redundancy in walls 4 Slight rebar detailing or redundancy in walls 5 No modifications for earthquakes
c. Hurricane/tornado/extreme wind resistance
1 Detailed rebar and redundancy in walls 2 Some detailed rebar 3 Some redundancy in walls 4 Slight rebar detailing or redundancy in walls 5 No modifications for hurricanes, tornados, or wind

ERDC TR-13-13 105
d. Earthquake potential at structure's location
0 None 1 Low probability 2 Average probability 3 Increased probability 4 High probability
e. Hurricane/tornado/extreme wind potential at structure's location
0 None 1 Low probability 2 Average probability 3 Increased probability 4 High probability
f. Quality of construction
1 Excellent 2 Good 3 Average 4 Poor 5 Unstable
2. Utilities a. How power will be generated
1 Use efficient local power lines for power 2 Using inefficient local power lines along with generators 3 Running power lines to efficient local power plant 4 Running power lines to inefficient local power plant along with generators 5 Solely generators
b. How drinking water will be obtained
1 Using high quality water from local pipes 2 Using local pipes but needs filtering 3 Using bottled water for short period or reverse osmosis machines for long period 4 Using bottled water or reverse osmosis machines for medium period 5 Using bottled water for long period or reverse osmosis machines for short period
c. How sewage will be disposed
1 Use local sewage pipes 2 Using local latrines 3 Using local lagoon for disposal 4 Building septic tank 5 Build water treatment plant
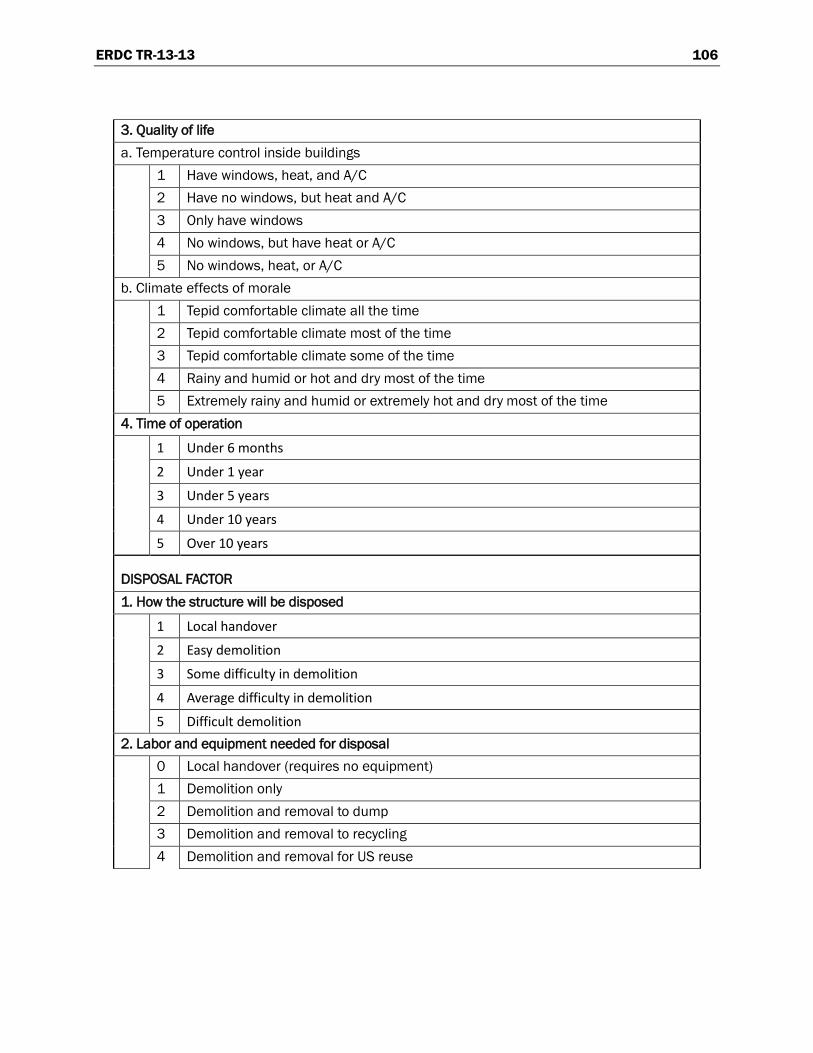
ERDC TR-13-13 106
3. Quality of life a. Temperature control inside buildings
1 Have windows, heat, and A/C 2 Have no windows, but heat and A/C 3 Only have windows 4 No windows, but have heat or A/C 5 No windows, heat, or A/C
b. Climate effects of morale
1 Tepid comfortable climate all the time 2 Tepid comfortable climate most of the time 3 Tepid comfortable climate some of the time 4 Rainy and humid or hot and dry most of the time 5 Extremely rainy and humid or extremely hot and dry most of the time
4. Time of operation
1 Under 6 months
2 Under 1 year
3 Under 5 years
4 Under 10 years
5 Over 10 years
DISPOSAL FACTOR 1. How the structure will be disposed
1 Local handover
2 Easy demolition
3 Some difficulty in demolition
4 Average difficulty in demolition
5 Difficult demolition 2. Labor and equipment needed for disposal
0 Local handover (requires no equipment) 1 Demolition only 2 Demolition and removal to dump 3 Demolition and removal to recycling 4 Demolition and removal for US reuse
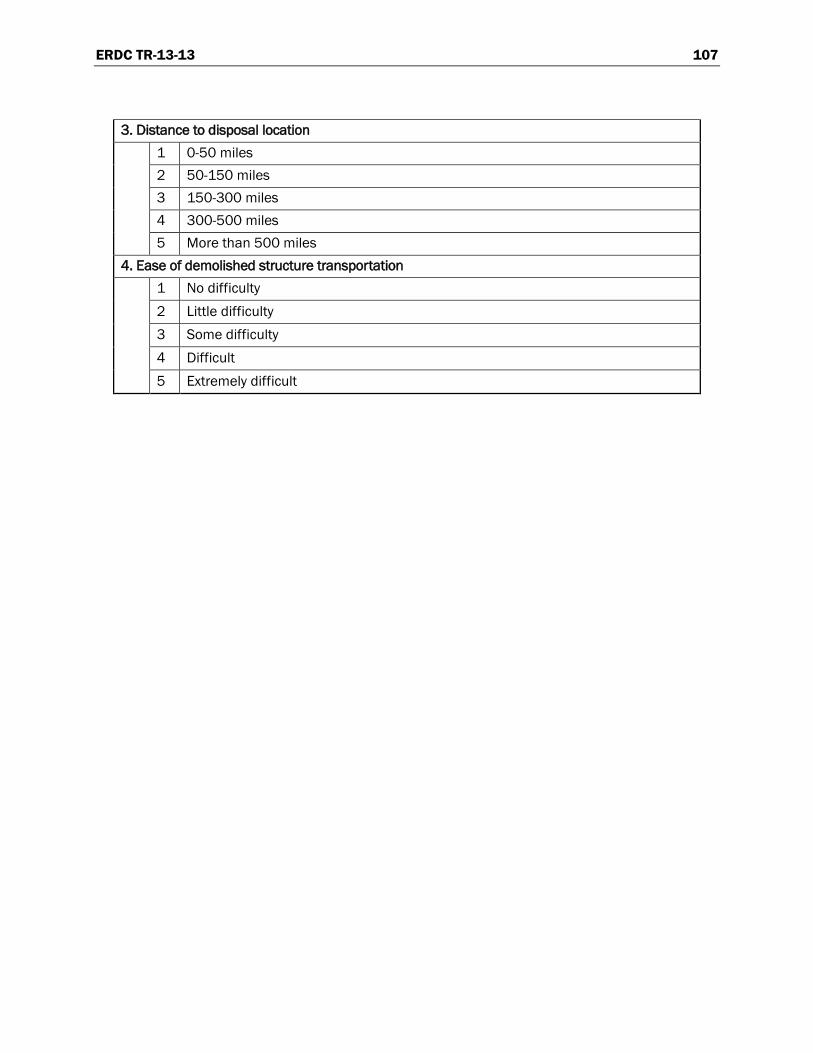
ERDC TR-13-13 107
3. Distance to disposal location
1 0-50 miles 2 50-150 miles 3 150-300 miles 4 300-500 miles 5 More than 500 miles
4. Ease of demolished structure transportation
1 No difficulty 2 Little difficulty 3 Some difficulty 4 Difficult 5 Extremely difficult
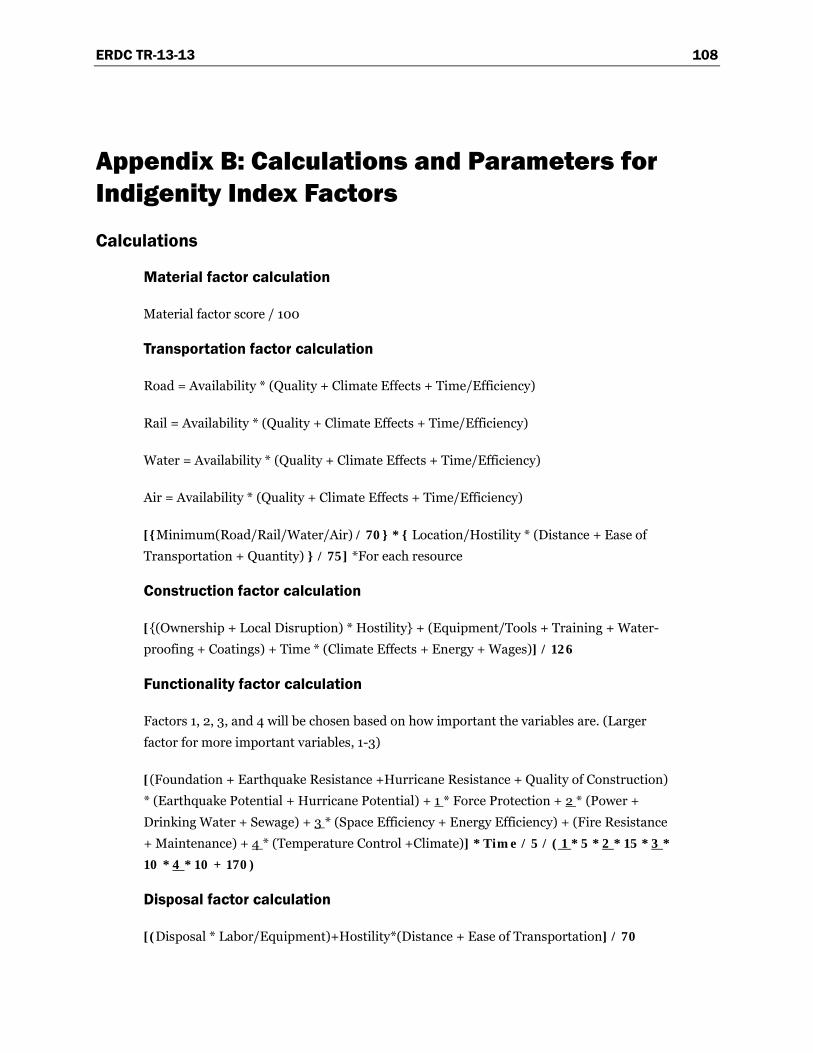
ERDC TR-13-13 108
Appendix B: Calculations and Parameters for Indigenity Index Factors
Calculations
Material factor calculation
Material factor score / 100
Transportation factor calculation
Road = Availability * (Quality + Climate Effects + Time/Efficiency)
Rail = Availability * (Quality + Climate Effects + Time/Efficiency)
Water = Availability * (Quality + Climate Effects + Time/Efficiency)
Air = Availability * (Quality + Climate Effects + Time/Efficiency)
[{Minimum(Road/Rail/Water/Air) / 70} * { Location/Hostility * (Distance + Ease of
Transportation + Quantity) } / 75] *For each resource
Construction factor calculation
[{(Ownership + Local Disruption) * Hostility} + (Equipment/Tools + Training + Water-
proofing + Coatings) + Time * (Climate Effects + Energy + Wages)] / 126
Functionality factor calculation
Factors 1, 2, 3, and 4 will be chosen based on how important the variables are. (Larger
factor for more important variables, 1-3)
[(Foundation + Earthquake Resistance +Hurricane Resistance + Quality of Construction)
* (Earthquake Potential + Hurricane Potential) + 1 * Force Protection + 2 * (Power +
Drinking Water + Sewage) + 3 * (Space Efficiency + Energy Efficiency) + (Fire Resistance
+ Maintenance) + 4 * (Temperature Control +Climate)] * Time / 5 / ( 1 * 5 * 2 * 15 * 3 * 10 * 4 * 10 + 170)
Disposal factor calculation
[(Disposal * Labor/Equipment)+Hostility*(Distance + Ease of Transportation] / 70
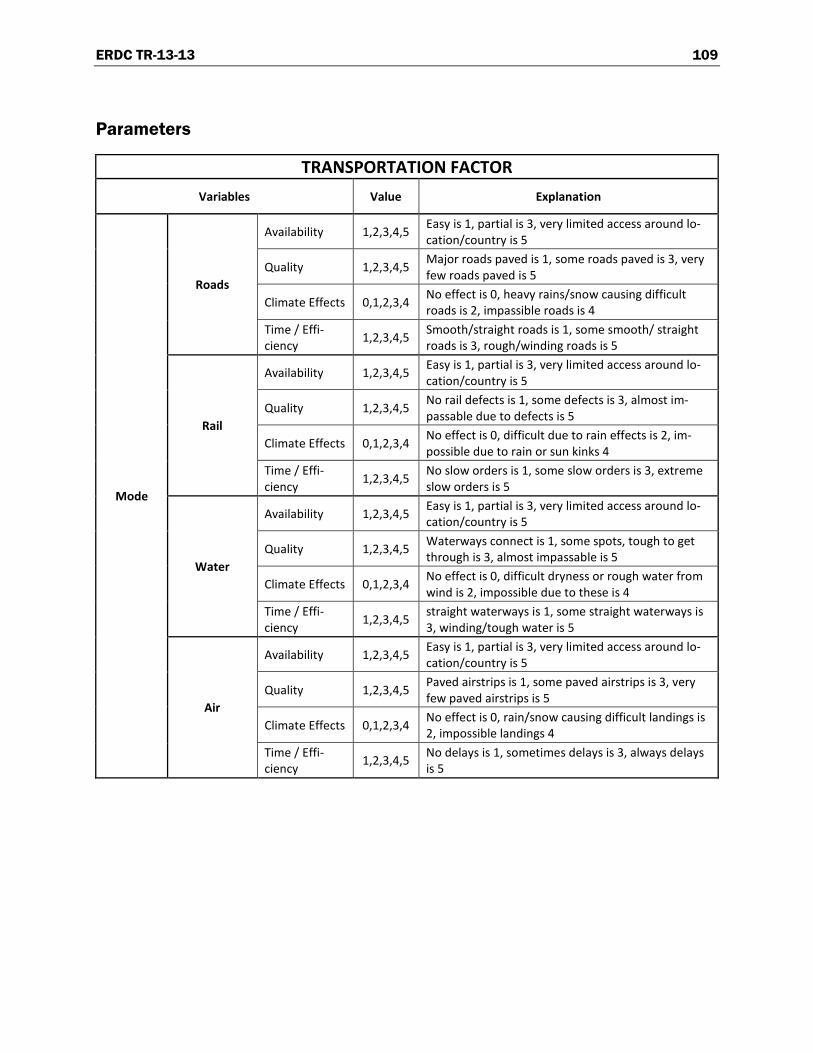
ERDC TR-13-13 109
Parameters
TRANSPORTATION FACTOR Variables Value Explanation
Mode
Roads
Availability 1,2,3,4,5 Easy is 1, partial is 3, very limited access around lo-cation/country is 5
Quality 1,2,3,4,5 Major roads paved is 1, some roads paved is 3, very few roads paved is 5
Climate Effects 0,1,2,3,4 No effect is 0, heavy rains/snow causing difficult roads is 2, impassible roads is 4
Time / Effi-ciency 1,2,3,4,5 Smooth/straight roads is 1, some smooth/ straight
roads is 3, rough/winding roads is 5
Rail
Availability 1,2,3,4,5 Easy is 1, partial is 3, very limited access around lo-cation/country is 5
Quality 1,2,3,4,5 No rail defects is 1, some defects is 3, almost im-passable due to defects is 5
Climate Effects 0,1,2,3,4 No effect is 0, difficult due to rain effects is 2, im-possible due to rain or sun kinks 4
Time / Effi-ciency 1,2,3,4,5 No slow orders is 1, some slow orders is 3, extreme
slow orders is 5
Water
Availability 1,2,3,4,5 Easy is 1, partial is 3, very limited access around lo-cation/country is 5
Quality 1,2,3,4,5 Waterways connect is 1, some spots, tough to get through is 3, almost impassable is 5
Climate Effects 0,1,2,3,4 No effect is 0, difficult dryness or rough water from wind is 2, impossible due to these is 4
Time / Effi-ciency 1,2,3,4,5 straight waterways is 1, some straight waterways is
3, winding/tough water is 5
Air
Availability 1,2,3,4,5 Easy is 1, partial is 3, very limited access around lo-cation/country is 5
Quality 1,2,3,4,5 Paved airstrips is 1, some paved airstrips is 3, very few paved airstrips is 5
Climate Effects 0,1,2,3,4 No effect is 0, rain/snow causing difficult landings is 2, impossible landings 4
Time / Effi-ciency 1,2,3,4,5 No delays is 1, sometimes delays is 3, always delays
is 5
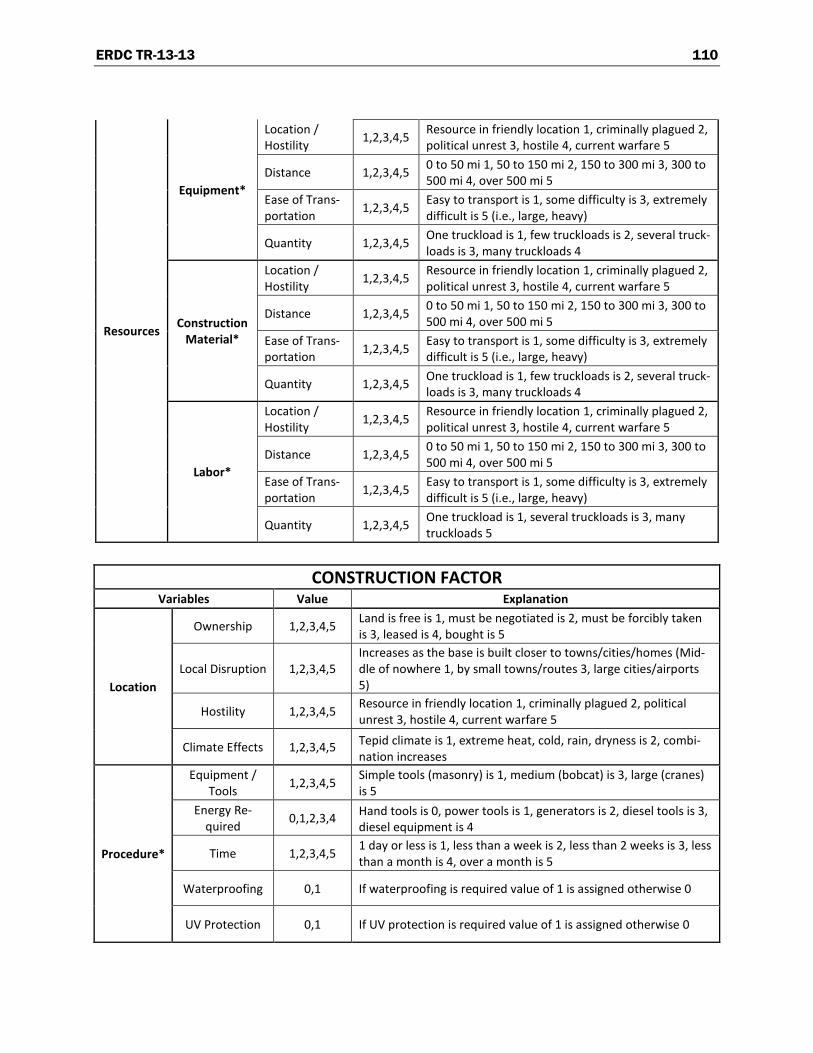
ERDC TR-13-13 110
Resources
Equipment*
Location / Hostility 1,2,3,4,5 Resource in friendly location 1, criminally plagued 2,
political unrest 3, hostile 4, current warfare 5
Distance 1,2,3,4,5 0 to 50 mi 1, 50 to 150 mi 2, 150 to 300 mi 3, 300 to 500 mi 4, over 500 mi 5
Ease of Trans-portation 1,2,3,4,5 Easy to transport is 1, some difficulty is 3, extremely
difficult is 5 (i.e., large, heavy)
Quantity 1,2,3,4,5 One truckload is 1, few truckloads is 2, several truck-loads is 3, many truckloads 4
Construction Material*
Location / Hostility 1,2,3,4,5 Resource in friendly location 1, criminally plagued 2,
political unrest 3, hostile 4, current warfare 5
Distance 1,2,3,4,5 0 to 50 mi 1, 50 to 150 mi 2, 150 to 300 mi 3, 300 to 500 mi 4, over 500 mi 5
Ease of Trans-portation 1,2,3,4,5 Easy to transport is 1, some difficulty is 3, extremely
difficult is 5 (i.e., large, heavy)
Quantity 1,2,3,4,5 One truckload is 1, few truckloads is 2, several truck-loads is 3, many truckloads 4
Labor*
Location / Hostility 1,2,3,4,5 Resource in friendly location 1, criminally plagued 2,
political unrest 3, hostile 4, current warfare 5
Distance 1,2,3,4,5 0 to 50 mi 1, 50 to 150 mi 2, 150 to 300 mi 3, 300 to 500 mi 4, over 500 mi 5
Ease of Trans-portation 1,2,3,4,5 Easy to transport is 1, some difficulty is 3, extremely
difficult is 5 (i.e., large, heavy)
Quantity 1,2,3,4,5 One truckload is 1, several truckloads is 3, many truckloads 5
CONSTRUCTION FACTOR
Variables Value Explanation
Location
Ownership 1,2,3,4,5 Land is free is 1, must be negotiated is 2, must be forcibly taken is 3, leased is 4, bought is 5
Local Disruption 1,2,3,4,5 Increases as the base is built closer to towns/cities/homes (Mid-dle of nowhere 1, by small towns/routes 3, large cities/airports 5)
Hostility 1,2,3,4,5 Resource in friendly location 1, criminally plagued 2, political unrest 3, hostile 4, current warfare 5
Climate Effects 1,2,3,4,5 Tepid climate is 1, extreme heat, cold, rain, dryness is 2, combi-nation increases
Procedure*
Equipment / Tools 1,2,3,4,5 Simple tools (masonry) is 1, medium (bobcat) is 3, large (cranes)
is 5 Energy Re-
quired 0,1,2,3,4 Hand tools is 0, power tools is 1, generators is 2, diesel tools is 3, diesel equipment is 4
Time 1,2,3,4,5 1 day or less is 1, less than a week is 2, less than 2 weeks is 3, less than a month is 4, over a month is 5
Waterproofing 0,1 If waterproofing is required value of 1 is assigned otherwise 0
UV Protection 0,1 If UV protection is required value of 1 is assigned otherwise 0
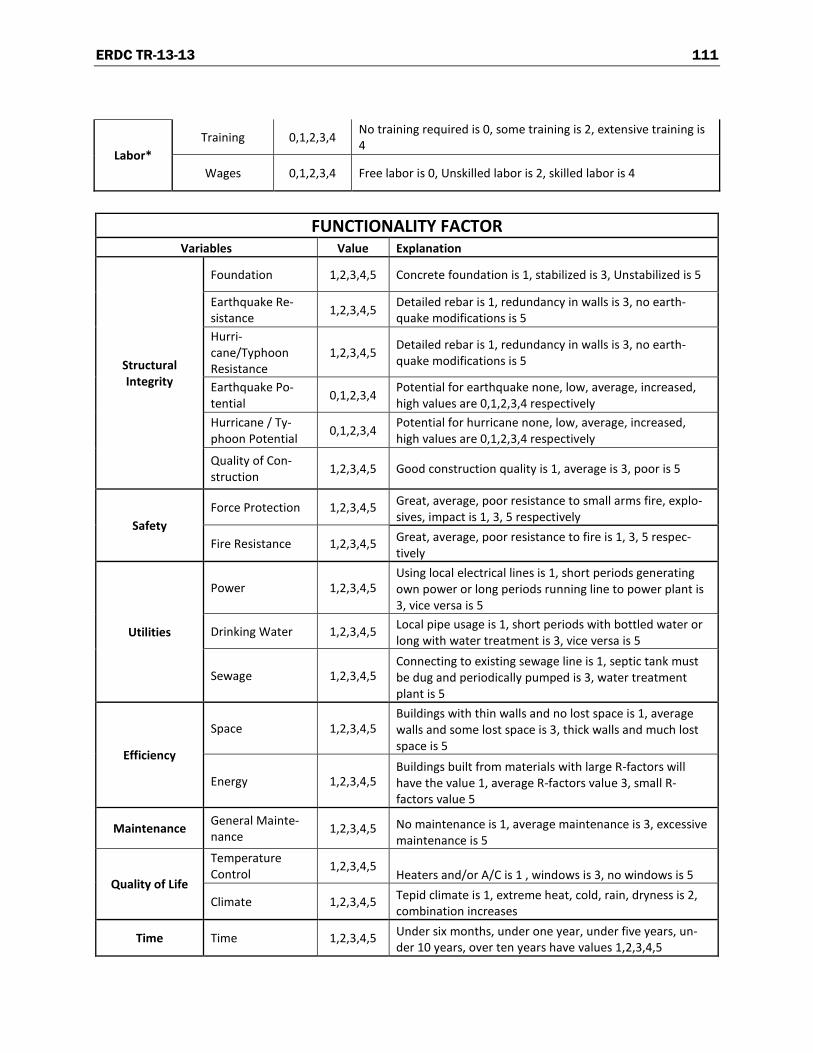
ERDC TR-13-13 111
Labor* Training 0,1,2,3,4 No training required is 0, some training is 2, extensive training is
4
Wages 0,1,2,3,4 Free labor is 0, Unskilled labor is 2, skilled labor is 4
FUNCTIONALITY FACTOR
Variables Value Explanation
Structural Integrity
Foundation 1,2,3,4,5 Concrete foundation is 1, stabilized is 3, Unstabilized is 5
Earthquake Re-sistance 1,2,3,4,5 Detailed rebar is 1, redundancy in walls is 3, no earth-
quake modifications is 5 Hurri-cane/Typhoon Resistance
1,2,3,4,5 Detailed rebar is 1, redundancy in walls is 3, no earth-quake modifications is 5
Earthquake Po-tential 0,1,2,3,4 Potential for earthquake none, low, average, increased,
high values are 0,1,2,3,4 respectively Hurricane / Ty-phoon Potential 0,1,2,3,4 Potential for hurricane none, low, average, increased,
high values are 0,1,2,3,4 respectively
Quality of Con-struction 1,2,3,4,5 Good construction quality is 1, average is 3, poor is 5
Safety Force Protection 1,2,3,4,5 Great, average, poor resistance to small arms fire, explo-
sives, impact is 1, 3, 5 respectively
Fire Resistance 1,2,3,4,5 Great, average, poor resistance to fire is 1, 3, 5 respec-tively
Utilities
Power 1,2,3,4,5 Using local electrical lines is 1, short periods generating own power or long periods running line to power plant is 3, vice versa is 5
Drinking Water 1,2,3,4,5 Local pipe usage is 1, short periods with bottled water or long with water treatment is 3, vice versa is 5
Sewage 1,2,3,4,5 Connecting to existing sewage line is 1, septic tank must be dug and periodically pumped is 3, water treatment plant is 5
Efficiency
Space 1,2,3,4,5 Buildings with thin walls and no lost space is 1, average walls and some lost space is 3, thick walls and much lost space is 5
Energy 1,2,3,4,5 Buildings built from materials with large R-factors will have the value 1, average R-factors value 3, small R-factors value 5
Maintenance General Mainte-nance 1,2,3,4,5 No maintenance is 1, average maintenance is 3, excessive
maintenance is 5
Quality of Life
Temperature Control 1,2,3,4,5
Heaters and/or A/C is 1 , windows is 3, no windows is 5
Climate 1,2,3,4,5 Tepid climate is 1, extreme heat, cold, rain, dryness is 2, combination increases
Time Time 1,2,3,4,5 Under six months, under one year, under five years, un-der 10 years, over ten years have values 1,2,3,4,5
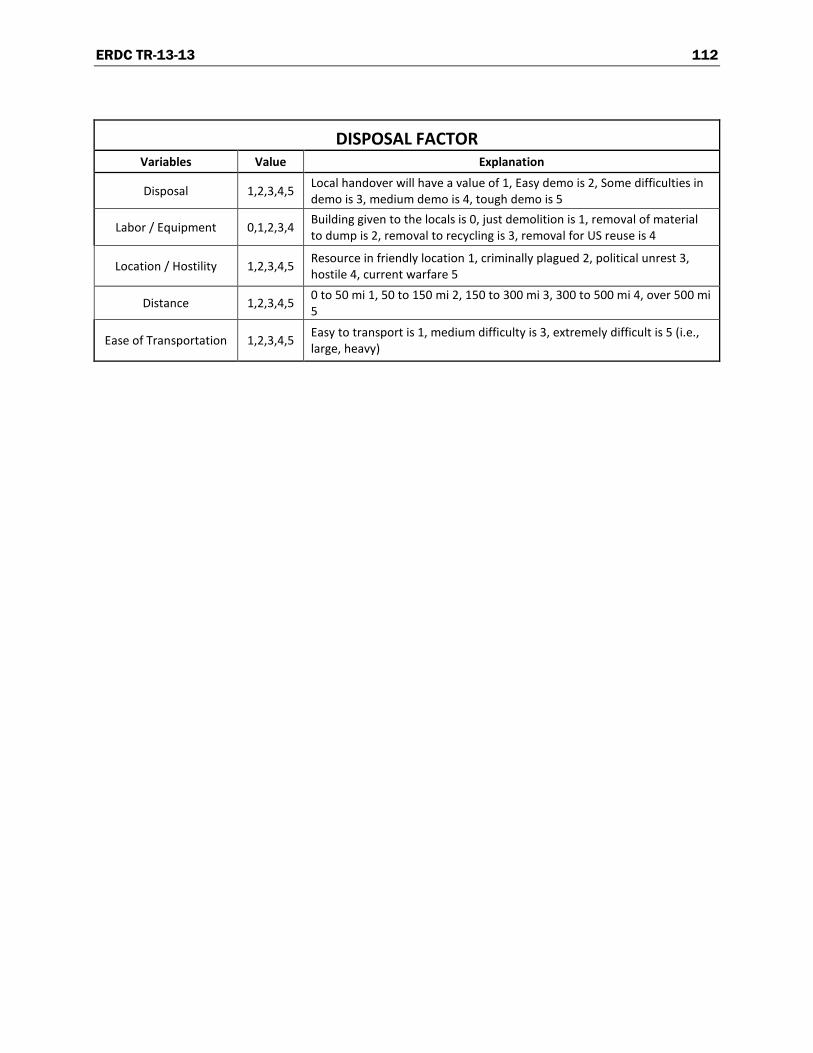
ERDC TR-13-13 112
DISPOSAL FACTOR Variables Value Explanation
Disposal 1,2,3,4,5 Local handover will have a value of 1, Easy demo is 2, Some difficulties in demo is 3, medium demo is 4, tough demo is 5
Labor / Equipment 0,1,2,3,4 Building given to the locals is 0, just demolition is 1, removal of material to dump is 2, removal to recycling is 3, removal for US reuse is 4
Location / Hostility 1,2,3,4,5 Resource in friendly location 1, criminally plagued 2, political unrest 3, hostile 4, current warfare 5
Distance 1,2,3,4,5 0 to 50 mi 1, 50 to 150 mi 2, 150 to 300 mi 3, 300 to 500 mi 4, over 500 mi 5
Ease of Transportation 1,2,3,4,5 Easy to transport is 1, medium difficulty is 3, extremely difficult is 5 (i.e., large, heavy)
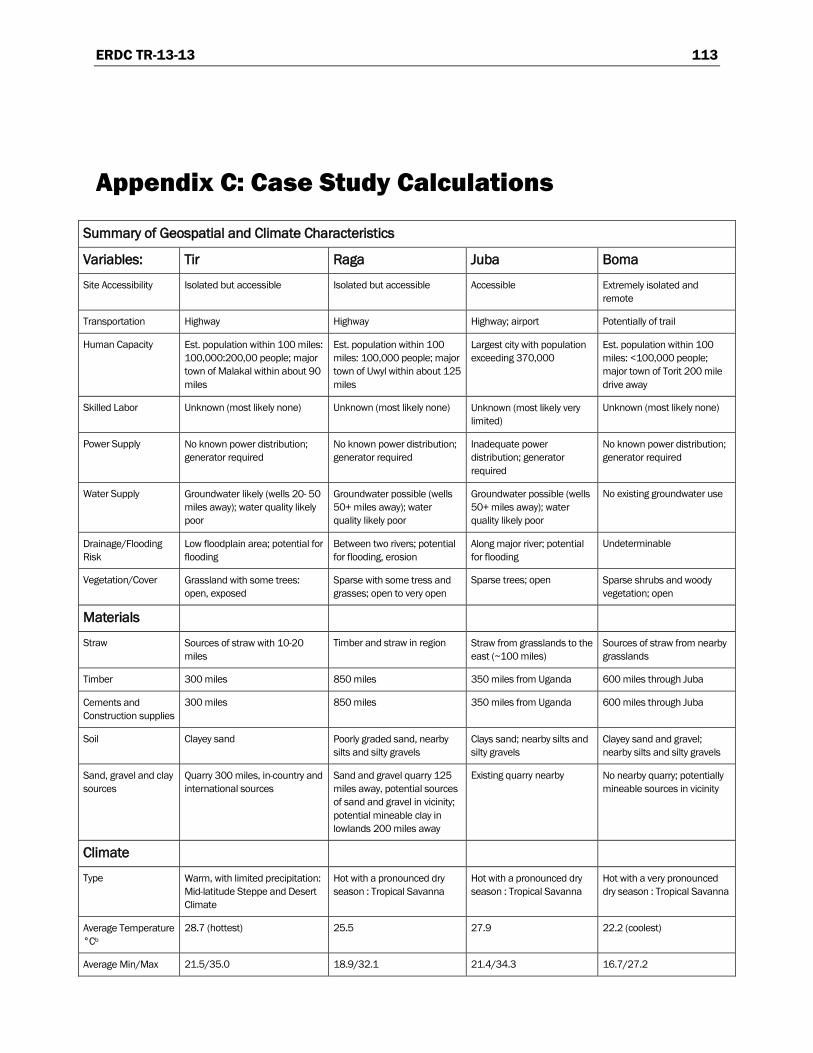
ERDC TR-13-13 113
Appendix C: Case Study Calculations
Summary of Geospatial and Climate Characteristics
Variables: Tir Raga Juba Boma
Site Accessibility Isolated but accessible Isolated but accessible Accessible Extremely isolated and remote
Transportation Highway Highway Highway; airport Potentially of trail
Human Capacity Est. population within 100 miles: 100,000:200,00 people; major town of Malakal within about 90 miles
Est. population within 100 miles: 100,000 people; major town of Uwyl within about 125 miles
Largest city with population exceeding 370,000
Est. population within 100 miles: <100,000 people; major town of Torit 200 mile drive away
Skilled Labor Unknown (most likely none) Unknown (most likely none) Unknown (most likely very limited)
Unknown (most likely none)
Power Supply No known power distribution; generator required
No known power distribution; generator required
Inadequate power distribution; generator required
No known power distribution; generator required
Water Supply Groundwater likely (wells 20- 50 miles away); water quality likely poor
Groundwater possible (wells 50+ miles away); water quality likely poor
Groundwater possible (wells 50+ miles away); water quality likely poor
No existing groundwater use
Drainage/Flooding Risk
Low floodplain area; potential for flooding
Between two rivers; potential for flooding, erosion
Along major river; potential for flooding
Undeterminable
Vegetation/Cover Grassland with some trees: open, exposed
Sparse with some tress and grasses; open to very open
Sparse trees; open Sparse shrubs and woody vegetation; open
Materials
Straw Sources of straw with 10-20 miles
Timber and straw in region Straw from grasslands to the east (~100 miles)
Sources of straw from nearby grasslands
Timber 300 miles 850 miles 350 miles from Uganda 600 miles through Juba
Cements and Construction supplies
300 miles 850 miles 350 miles from Uganda 600 miles through Juba
Soil Clayey sand Poorly graded sand, nearby silts and silty gravels
Clays sand; nearby silts and silty gravels
Clayey sand and gravel; nearby silts and silty gravels
Sand, gravel and clay sources
Quarry 300 miles, in-country and international sources
Sand and gravel quarry 125 miles away, potential sources of sand and gravel in vicinity; potential mineable clay in lowlands 200 miles away
Existing quarry nearby No nearby quarry; potentially mineable sources in vicinity
Climate
Type Warm, with limited precipitation: Mid-latitude Steppe and Desert Climate
Hot with a pronounced dry season : Tropical Savanna
Hot with a pronounced dry season : Tropical Savanna
Hot with a very pronounced dry season : Tropical Savanna
Average Temperature °Cb
28.7 (hottest) 25.5 27.9 22.2 (coolest)
Average Min/Max 21.5/35.0 18.9/32.1 21.4/34.3 16.7/27.2
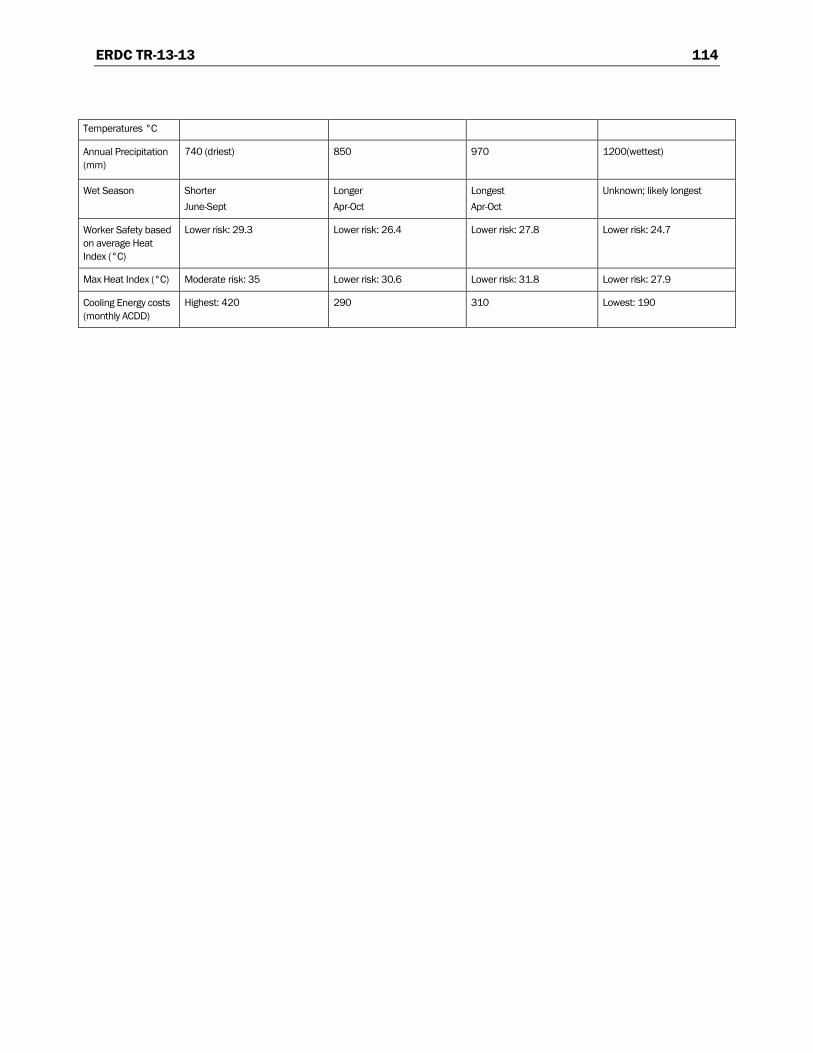
ERDC TR-13-13 114
Temperatures °C
Annual Precipitation (mm)
740 (driest) 850 970 1200(wettest)
Wet Season Shorter June-Sept
Longer Apr-Oct
Longest Apr-Oct
Unknown; likely longest
Worker Safety based on average Heat Index (°C)
Lower risk: 29.3 Lower risk: 26.4 Lower risk: 27.8 Lower risk: 24.7
Max Heat Index (°C) Moderate risk: 35 Lower risk: 30.6 Lower risk: 31.8 Lower risk: 27.9
Cooling Energy costs (monthly ACDD)
Highest: 420 290 310 Lowest: 190
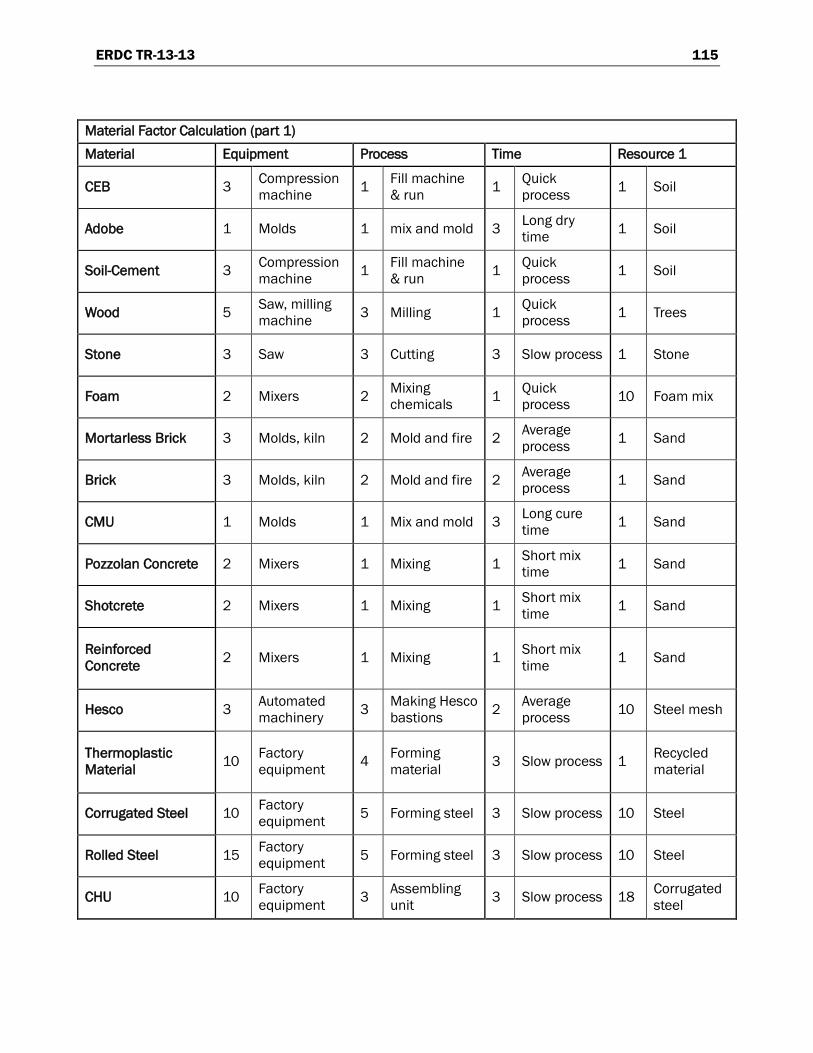
ERDC TR-13-13 115
Material Factor Calculation (part 1) Material Equipment Process Time Resource 1
CEB 3 Compression machine 1 Fill machine
& run 1 Quick process 1 Soil
Adobe 1 Molds 1 mix and mold 3 Long dry time 1 Soil
Soil-Cement 3 Compression machine 1 Fill machine
& run 1 Quick process 1 Soil
Wood 5 Saw, milling machine 3 Milling 1 Quick
process 1 Trees
Stone 3 Saw 3 Cutting 3 Slow process 1 Stone
Foam 2 Mixers 2 Mixing chemicals 1 Quick
process 10 Foam mix
Mortarless Brick 3 Molds, kiln 2 Mold and fire 2 Average process 1 Sand
Brick 3 Molds, kiln 2 Mold and fire 2 Average process 1 Sand
CMU 1 Molds 1 Mix and mold 3 Long cure time 1 Sand
Pozzolan Concrete 2 Mixers 1 Mixing 1 Short mix time 1 Sand
Shotcrete 2 Mixers 1 Mixing 1 Short mix time 1 Sand
Reinforced Concrete 2 Mixers 1 Mixing 1 Short mix
time 1 Sand
Hesco 3 Automated machinery 3 Making Hesco
bastions 2 Average process 10 Steel mesh
Thermoplastic Material 10 Factory
equipment 4 Forming material 3 Slow process 1 Recycled
material
Corrugated Steel 10 Factory equipment 5 Forming steel 3 Slow process 10 Steel
Rolled Steel 15 Factory equipment 5 Forming steel 3 Slow process 10 Steel
CHU 10 Factory equipment 3 Assembling
unit 3 Slow process 18 Corrugated steel
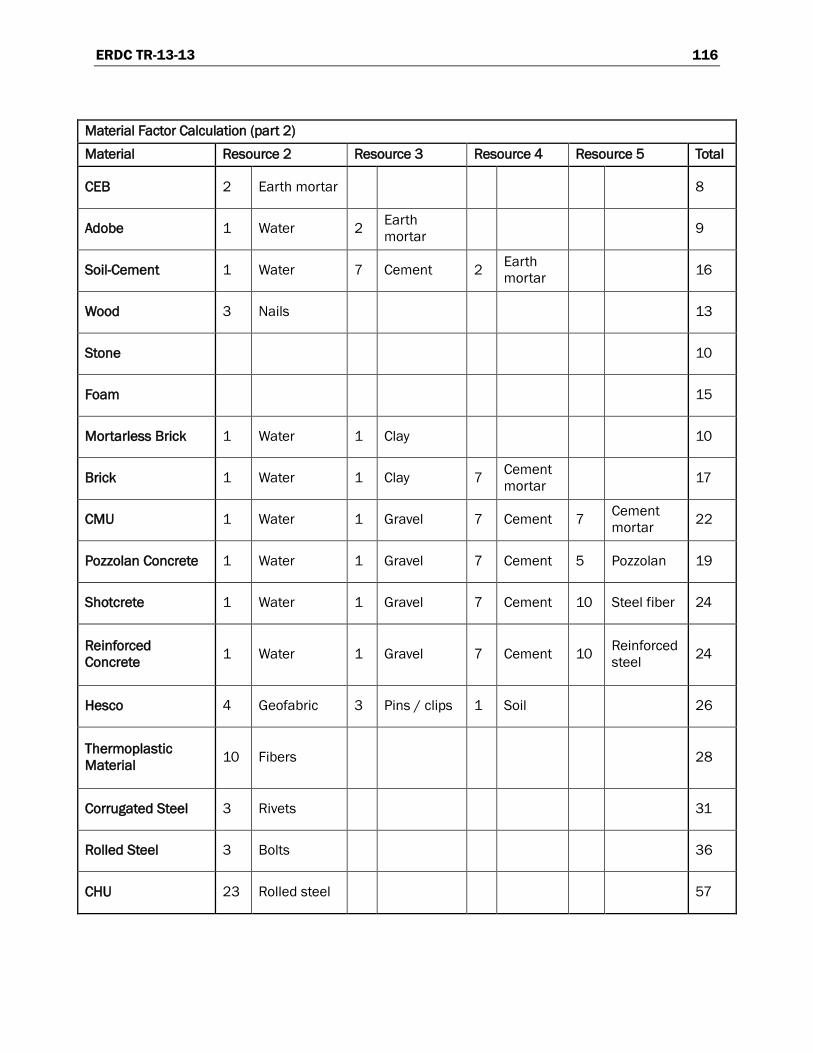
ERDC TR-13-13 116
Material Factor Calculation (part 2) Material Resource 2 Resource 3 Resource 4 Resource 5 Total
CEB 2 Earth mortar 8
Adobe 1 Water 2 Earth mortar 9
Soil-Cement 1 Water 7 Cement 2 Earth mortar 16
Wood 3 Nails 13
Stone 10
Foam 15
Mortarless Brick 1 Water 1 Clay 10
Brick 1 Water 1 Clay 7 Cement mortar 17
CMU 1 Water 1 Gravel 7 Cement 7 Cement mortar 22
Pozzolan Concrete 1 Water 1 Gravel 7 Cement 5 Pozzolan 19
Shotcrete 1 Water 1 Gravel 7 Cement 10 Steel fiber 24
Reinforced Concrete 1 Water 1 Gravel 7 Cement 10 Reinforced
steel 24
Hesco 4 Geofabric 3 Pins / clips 1 Soil 26
Thermoplastic Material 10 Fibers 28
Corrugated Steel 3 Rivets 31
Rolled Steel 3 Bolts 36
CHU 23 Rolled steel 57
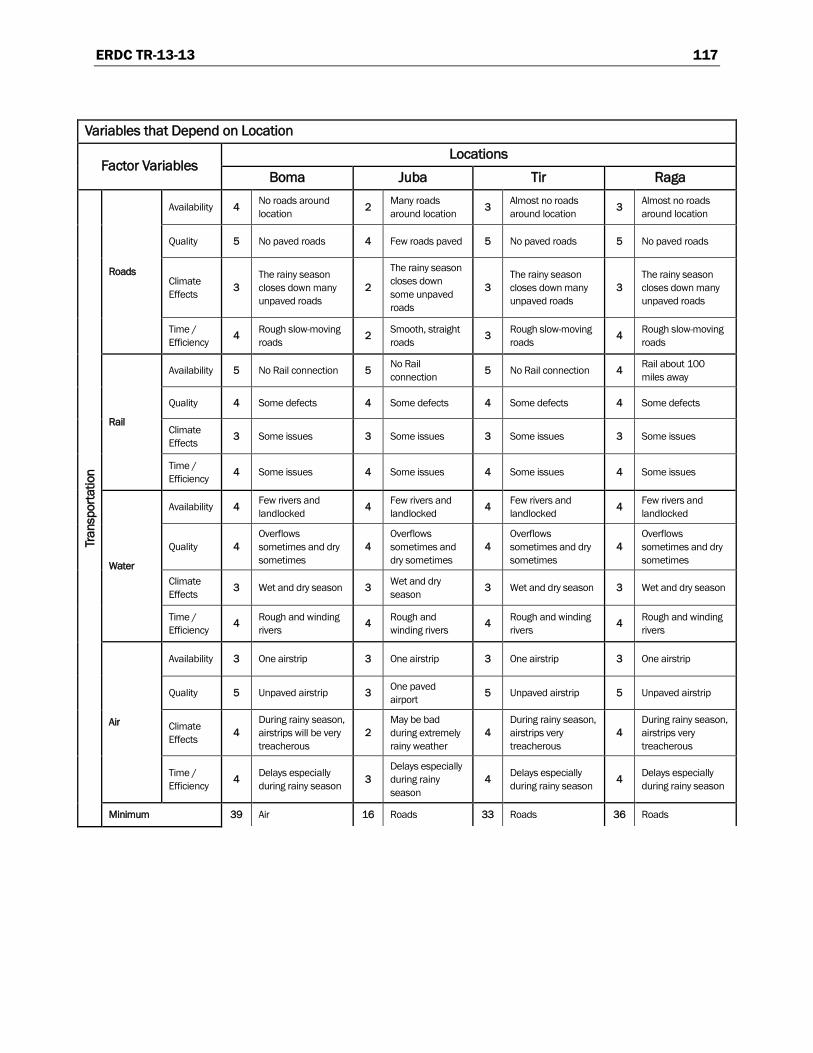
ERDC TR-13-13 117
Variables that Depend on Location
Factor Variables Locations
Boma Juba Tir Raga
Tran
spor
tatio
n
Roads
Availability 4 No roads around location 2 Many roads
around location 3 Almost no roads around location 3 Almost no roads
around location
Quality 5 No paved roads 4 Few roads paved 5 No paved roads 5 No paved roads
Climate Effects 3
The rainy season closes down many unpaved roads
2
The rainy season closes down some unpaved roads
3 The rainy season closes down many unpaved roads
3 The rainy season closes down many unpaved roads
Time / Efficiency 4 Rough slow-moving
roads 2 Smooth, straight roads 3 Rough slow-moving
roads 4 Rough slow-moving roads
Rail
Availability 5 No Rail connection 5 No Rail connection 5 No Rail connection 4 Rail about 100
miles away
Quality 4 Some defects 4 Some defects 4 Some defects 4 Some defects
Climate Effects 3 Some issues 3 Some issues 3 Some issues 3 Some issues
Time / Efficiency 4 Some issues 4 Some issues 4 Some issues 4 Some issues
Water
Availability 4 Few rivers and landlocked 4 Few rivers and
landlocked 4 Few rivers and landlocked 4 Few rivers and
landlocked
Quality 4 Overflows sometimes and dry sometimes
4 Overflows sometimes and dry sometimes
4 Overflows sometimes and dry sometimes
4 Overflows sometimes and dry sometimes
Climate Effects 3 Wet and dry season 3 Wet and dry
season 3 Wet and dry season 3 Wet and dry season
Time / Efficiency 4 Rough and winding
rivers 4 Rough and winding rivers 4 Rough and winding
rivers 4 Rough and winding rivers
Air
Availability 3 One airstrip 3 One airstrip 3 One airstrip 3 One airstrip
Quality 5 Unpaved airstrip 3 One paved airport 5 Unpaved airstrip 5 Unpaved airstrip
Climate Effects 4
During rainy season, airstrips will be very treacherous
2 May be bad during extremely rainy weather
4 During rainy season, airstrips very treacherous
4 During rainy season, airstrips very treacherous
Time / Efficiency 4 Delays especially
during rainy season 3 Delays especially during rainy season
4 Delays especially during rainy season 4 Delays especially
during rainy season
Minimum 39 Air 16 Roads 33 Roads 36 Roads
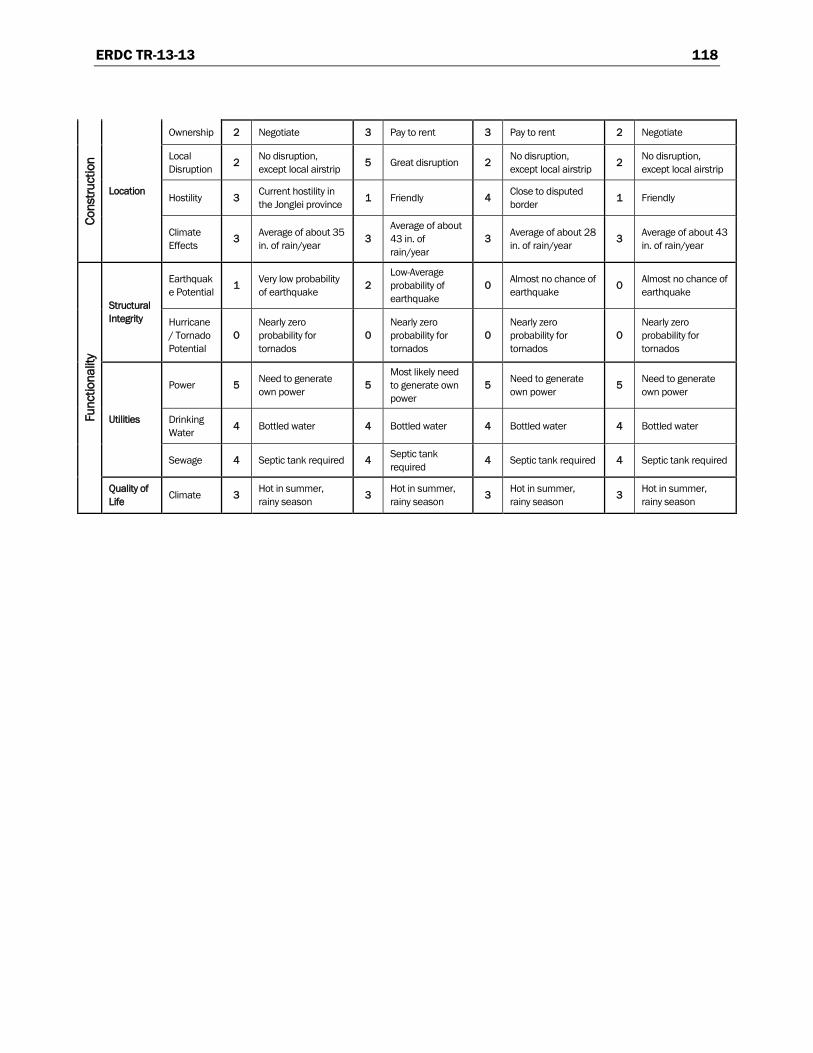
ERDC TR-13-13 118
Cons
truct
ion
Location
Ownership 2 Negotiate 3 Pay to rent 3 Pay to rent 2 Negotiate
Local Disruption 2 No disruption,
except local airstrip 5 Great disruption 2 No disruption, except local airstrip 2 No disruption,
except local airstrip
Hostility 3 Current hostility in the Jonglei province 1 Friendly 4 Close to disputed
border 1 Friendly
Climate Effects 3 Average of about 35
in. of rain/year 3 Average of about 43 in. of rain/year
3 Average of about 28 in. of rain/year 3 Average of about 43
in. of rain/year
Func
tiona
lity
Structural Integrity
Earthquake Potential 1 Very low probability
of earthquake 2 Low-Average probability of earthquake
0 Almost no chance of earthquake 0 Almost no chance of
earthquake
Hurricane / Tornado Potential
0 Nearly zero probability for tornados
0 Nearly zero probability for tornados
0 Nearly zero probability for tornados
0 Nearly zero probability for tornados
Utilities
Power 5 Need to generate own power 5
Most likely need to generate own power
5 Need to generate own power 5 Need to generate
own power
Drinking Water 4 Bottled water 4 Bottled water 4 Bottled water 4 Bottled water
Sewage 4 Septic tank required 4 Septic tank required 4 Septic tank required 4 Septic tank required
Quality of Life Climate 3 Hot in summer,
rainy season 3 Hot in summer, rainy season 3 Hot in summer,
rainy season 3 Hot in summer, rainy season
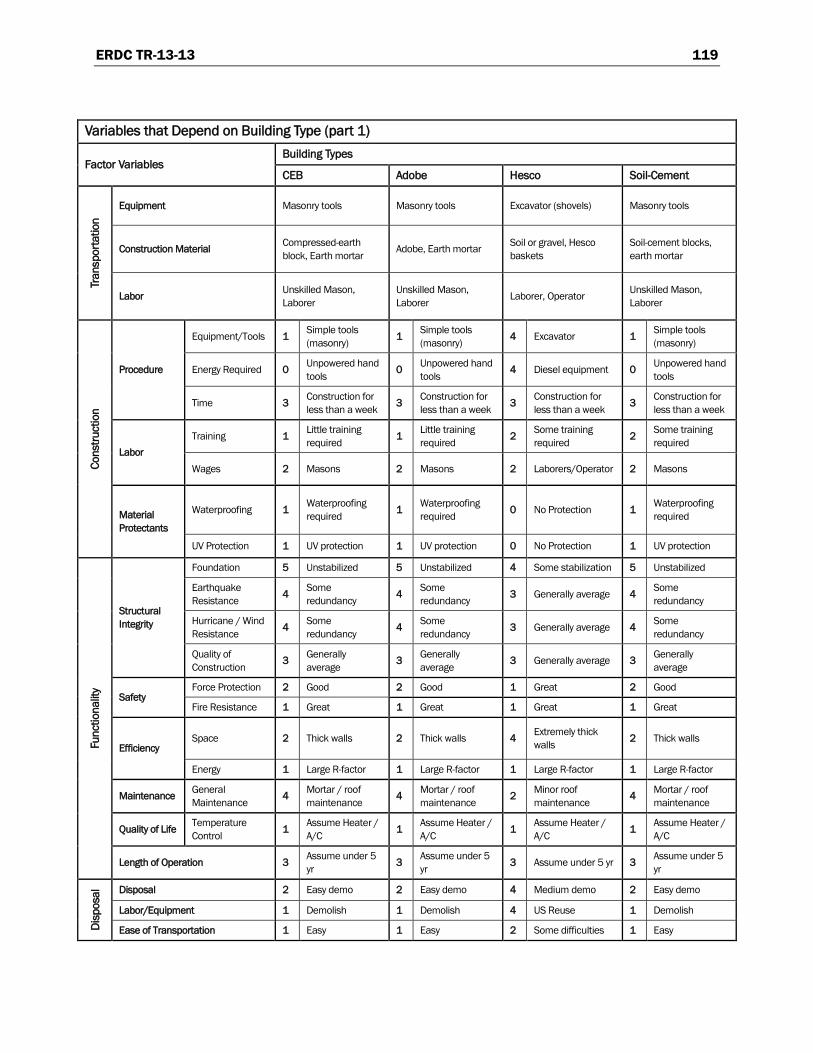
ERDC TR-13-13 119
Variables that Depend on Building Type (part 1)
Factor Variables Building Types
CEB Adobe Hesco Soil-Cement
Tran
spor
tatio
n
Equipment Masonry tools Masonry tools Excavator (shovels) Masonry tools
Construction Material Compressed-earth block, Earth mortar Adobe, Earth mortar Soil or gravel, Hesco
baskets Soil-cement blocks, earth mortar
Labor Unskilled Mason, Laborer
Unskilled Mason, Laborer Laborer, Operator Unskilled Mason,
Laborer
Cons
truct
ion
Procedure
Equipment/Tools 1 Simple tools (masonry) 1 Simple tools
(masonry) 4 Excavator 1 Simple tools (masonry)
Energy Required 0 Unpowered hand tools 0 Unpowered hand
tools 4 Diesel equipment 0 Unpowered hand tools
Time 3 Construction for less than a week 3 Construction for
less than a week 3 Construction for less than a week 3 Construction for
less than a week
Labor Training 1 Little training
required 1 Little training required 2 Some training
required 2 Some training required
Wages 2 Masons 2 Masons 2 Laborers/Operator 2 Masons
Material Protectants
Waterproofing 1 Waterproofing required 1 Waterproofing
required 0 No Protection 1 Waterproofing required
UV Protection 1 UV protection 1 UV protection 0 No Protection 1 UV protection
Func
tiona
lity
Structural Integrity
Foundation 5 Unstabilized 5 Unstabilized 4 Some stabilization 5 Unstabilized
Earthquake Resistance 4 Some
redundancy 4 Some redundancy 3 Generally average 4 Some
redundancy
Hurricane / Wind Resistance 4 Some
redundancy 4 Some redundancy 3 Generally average 4 Some
redundancy
Quality of Construction 3 Generally
average 3 Generally average 3 Generally average 3 Generally
average
Safety Force Protection 2 Good 2 Good 1 Great 2 Good
Fire Resistance 1 Great 1 Great 1 Great 1 Great
Efficiency Space 2 Thick walls 2 Thick walls 4 Extremely thick
walls 2 Thick walls
Energy 1 Large R-factor 1 Large R-factor 1 Large R-factor 1 Large R-factor
Maintenance General Maintenance 4 Mortar / roof
maintenance 4 Mortar / roof maintenance 2 Minor roof
maintenance 4 Mortar / roof maintenance
Quality of Life Temperature Control 1 Assume Heater /
A/C 1 Assume Heater / A/C 1 Assume Heater /
A/C 1 Assume Heater / A/C
Length of Operation 3 Assume under 5 yr 3 Assume under 5
yr 3 Assume under 5 yr 3 Assume under 5 yr
Disp
osal
Disposal 2 Easy demo 2 Easy demo 4 Medium demo 2 Easy demo
Labor/Equipment 1 Demolish 1 Demolish 4 US Reuse 1 Demolish
Ease of Transportation 1 Easy 1 Easy 2 Some difficulties 1 Easy
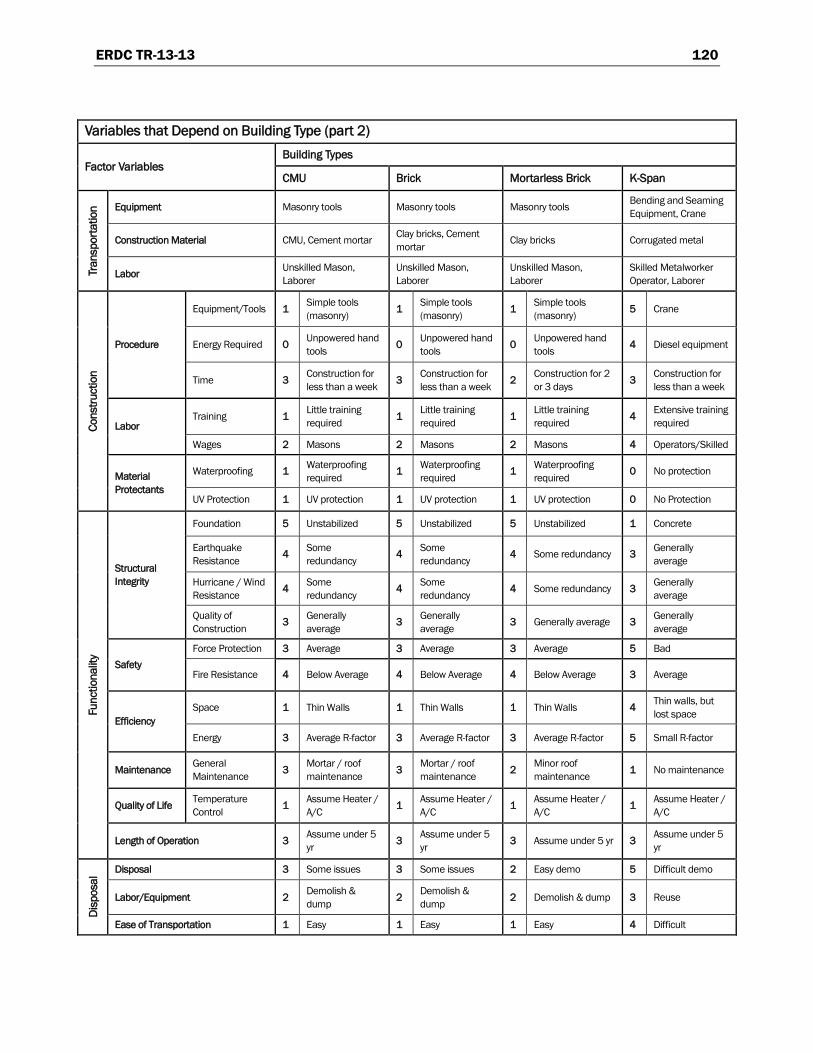
ERDC TR-13-13 120
Variables that Depend on Building Type (part 2)
Factor Variables Building Types
CMU Brick Mortarless Brick K-Span
Tran
spor
tatio
n Equipment Masonry tools Masonry tools Masonry tools Bending and Seaming Equipment, Crane
Construction Material CMU, Cement mortar Clay bricks, Cement mortar Clay bricks Corrugated metal
Labor Unskilled Mason, Laborer
Unskilled Mason, Laborer
Unskilled Mason, Laborer
Skilled Metalworker Operator, Laborer
Cons
truct
ion
Procedure
Equipment/Tools 1 Simple tools (masonry) 1 Simple tools
(masonry) 1 Simple tools (masonry) 5 Crane
Energy Required 0 Unpowered hand tools 0 Unpowered hand
tools 0 Unpowered hand tools 4 Diesel equipment
Time 3 Construction for less than a week 3 Construction for
less than a week 2 Construction for 2 or 3 days 3 Construction for
less than a week
Labor Training 1 Little training
required 1 Little training required 1 Little training
required 4 Extensive training required
Wages 2 Masons 2 Masons 2 Masons 4 Operators/Skilled
Material Protectants
Waterproofing 1 Waterproofing required 1 Waterproofing
required 1 Waterproofing required 0 No protection
UV Protection 1 UV protection 1 UV protection 1 UV protection 0 No Protection
Func
tiona
lity
Structural Integrity
Foundation 5 Unstabilized 5 Unstabilized 5 Unstabilized 1 Concrete
Earthquake Resistance 4 Some
redundancy 4 Some redundancy 4 Some redundancy 3 Generally
average
Hurricane / Wind Resistance 4 Some
redundancy 4 Some redundancy 4 Some redundancy 3 Generally
average
Quality of Construction 3 Generally
average 3 Generally average 3 Generally average 3 Generally
average
Safety Force Protection 3 Average 3 Average 3 Average 5 Bad
Fire Resistance 4 Below Average 4 Below Average 4 Below Average 3 Average
Efficiency Space 1 Thin Walls 1 Thin Walls 1 Thin Walls 4 Thin walls, but
lost space
Energy 3 Average R-factor 3 Average R-factor 3 Average R-factor 5 Small R-factor
Maintenance General Maintenance 3 Mortar / roof
maintenance 3 Mortar / roof maintenance 2 Minor roof
maintenance 1 No maintenance
Quality of Life Temperature Control 1 Assume Heater /
A/C 1 Assume Heater / A/C 1 Assume Heater /
A/C 1 Assume Heater / A/C
Length of Operation 3 Assume under 5 yr 3 Assume under 5
yr 3 Assume under 5 yr 3 Assume under 5 yr
Disp
osal
Disposal 3 Some issues 3 Some issues 2 Easy demo 5 Difficult demo
Labor/Equipment 2 Demolish & dump 2 Demolish &
dump 2 Demolish & dump 3 Reuse
Ease of Transportation 1 Easy 1 Easy 1 Easy 4 Difficult
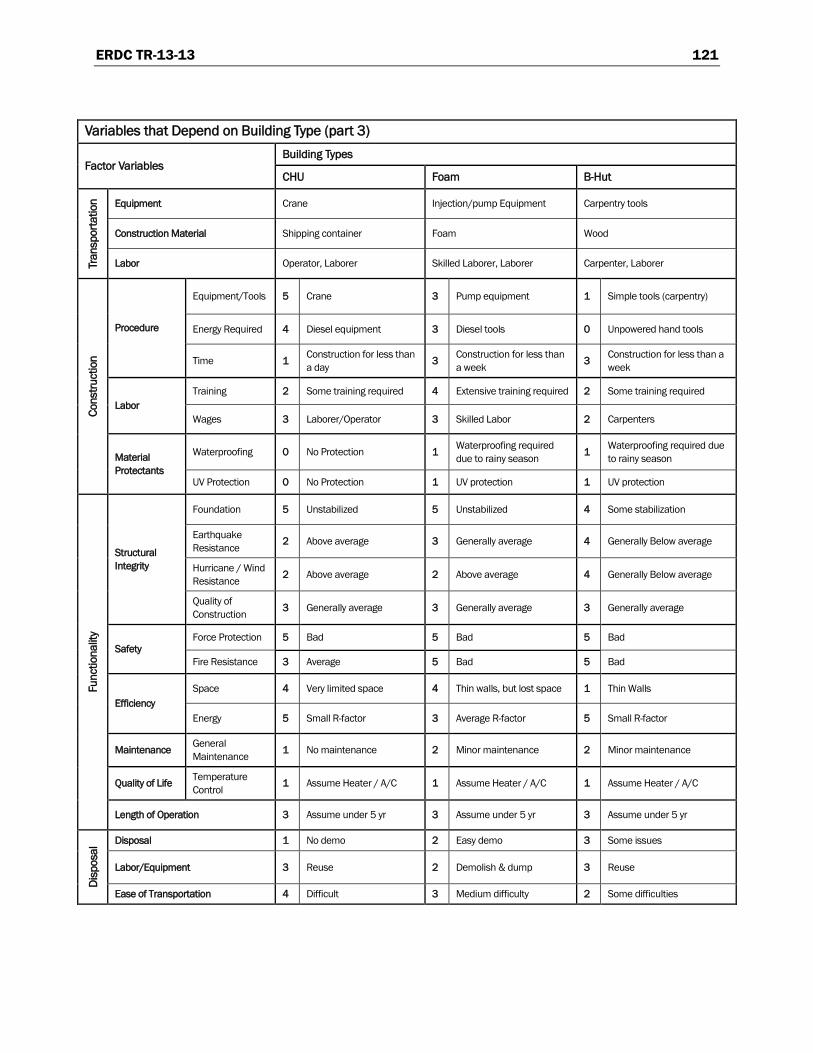
ERDC TR-13-13 121
Variables that Depend on Building Type (part 3)
Factor Variables Building Types
CHU Foam B-Hut
Tran
spor
tatio
n Equipment Crane Injection/pump Equipment Carpentry tools
Construction Material Shipping container Foam Wood
Labor Operator, Laborer Skilled Laborer, Laborer Carpenter, Laborer
Cons
truct
ion
Procedure
Equipment/Tools 5 Crane 3 Pump equipment 1 Simple tools (carpentry)
Energy Required 4 Diesel equipment 3 Diesel tools 0 Unpowered hand tools
Time 1 Construction for less than a day 3 Construction for less than
a week 3 Construction for less than a week
Labor Training 2 Some training required 4 Extensive training required 2 Some training required
Wages 3 Laborer/Operator 3 Skilled Labor 2 Carpenters
Material Protectants
Waterproofing 0 No Protection 1 Waterproofing required due to rainy season 1 Waterproofing required due
to rainy season
UV Protection 0 No Protection 1 UV protection 1 UV protection
Func
tiona
lity
Structural Integrity
Foundation 5 Unstabilized 5 Unstabilized 4 Some stabilization
Earthquake Resistance 2 Above average 3 Generally average 4 Generally Below average
Hurricane / Wind Resistance 2 Above average 2 Above average 4 Generally Below average
Quality of Construction 3 Generally average 3 Generally average 3 Generally average
Safety Force Protection 5 Bad 5 Bad 5 Bad
Fire Resistance 3 Average 5 Bad 5 Bad
Efficiency Space 4 Very limited space 4 Thin walls, but lost space 1 Thin Walls
Energy 5 Small R-factor 3 Average R-factor 5 Small R-factor
Maintenance General Maintenance 1 No maintenance 2 Minor maintenance 2 Minor maintenance
Quality of Life Temperature Control 1 Assume Heater / A/C 1 Assume Heater / A/C 1 Assume Heater / A/C
Length of Operation 3 Assume under 5 yr 3 Assume under 5 yr 3 Assume under 5 yr
Disp
osal
Disposal 1 No demo 2 Easy demo 3 Some issues
Labor/Equipment 3 Reuse 2 Demolish & dump 3 Reuse
Ease of Transportation 4 Difficult 3 Medium difficulty 2 Some difficulties
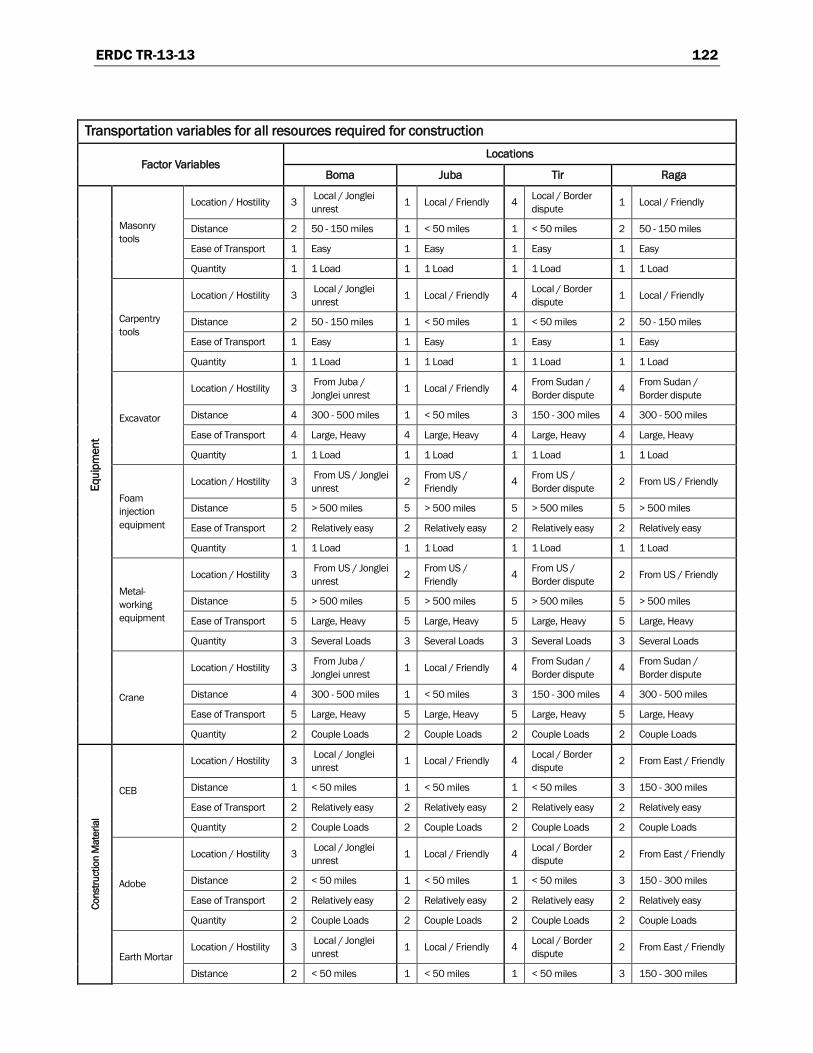
ERDC TR-13-13 122
Transportation variables for all resources required for construction
Factor Variables Locations
Boma Juba Tir Raga
Equi
pmen
t
Masonry tools
Location / Hostility 3 Local / Jonglei unrest 1 Local / Friendly 4 Local / Border
dispute 1 Local / Friendly
Distance 2 50 - 150 miles 1 < 50 miles 1 < 50 miles 2 50 - 150 miles
Ease of Transport 1 Easy 1 Easy 1 Easy 1 Easy
Quantity 1 1 Load 1 1 Load 1 1 Load 1 1 Load
Carpentry tools
Location / Hostility 3 Local / Jonglei unrest 1 Local / Friendly 4 Local / Border
dispute 1 Local / Friendly
Distance 2 50 - 150 miles 1 < 50 miles 1 < 50 miles 2 50 - 150 miles
Ease of Transport 1 Easy 1 Easy 1 Easy 1 Easy
Quantity 1 1 Load 1 1 Load 1 1 Load 1 1 Load
Excavator
Location / Hostility 3 From Juba / Jonglei unrest 1 Local / Friendly 4 From Sudan /
Border dispute 4 From Sudan / Border dispute
Distance 4 300 - 500 miles 1 < 50 miles 3 150 - 300 miles 4 300 - 500 miles
Ease of Transport 4 Large, Heavy 4 Large, Heavy 4 Large, Heavy 4 Large, Heavy
Quantity 1 1 Load 1 1 Load 1 1 Load 1 1 Load
Foam injection equipment
Location / Hostility 3 From US / Jonglei unrest 2 From US /
Friendly 4 From US / Border dispute 2 From US / Friendly
Distance 5 > 500 miles 5 > 500 miles 5 > 500 miles 5 > 500 miles
Ease of Transport 2 Relatively easy 2 Relatively easy 2 Relatively easy 2 Relatively easy
Quantity 1 1 Load 1 1 Load 1 1 Load 1 1 Load
Metal-working equipment
Location / Hostility 3 From US / Jonglei unrest 2 From US /
Friendly 4 From US / Border dispute 2 From US / Friendly
Distance 5 > 500 miles 5 > 500 miles 5 > 500 miles 5 > 500 miles
Ease of Transport 5 Large, Heavy 5 Large, Heavy 5 Large, Heavy 5 Large, Heavy
Quantity 3 Several Loads 3 Several Loads 3 Several Loads 3 Several Loads
Crane
Location / Hostility 3 From Juba / Jonglei unrest 1 Local / Friendly 4 From Sudan /
Border dispute 4 From Sudan / Border dispute
Distance 4 300 - 500 miles 1 < 50 miles 3 150 - 300 miles 4 300 - 500 miles
Ease of Transport 5 Large, Heavy 5 Large, Heavy 5 Large, Heavy 5 Large, Heavy
Quantity 2 Couple Loads 2 Couple Loads 2 Couple Loads 2 Couple Loads
Cons
truct
ion
Mat
eria
l
CEB
Location / Hostility 3 Local / Jonglei unrest 1 Local / Friendly 4 Local / Border
dispute 2 From East / Friendly
Distance 1 < 50 miles 1 < 50 miles 1 < 50 miles 3 150 - 300 miles
Ease of Transport 2 Relatively easy 2 Relatively easy 2 Relatively easy 2 Relatively easy
Quantity 2 Couple Loads 2 Couple Loads 2 Couple Loads 2 Couple Loads
Adobe
Location / Hostility 3 Local / Jonglei unrest 1 Local / Friendly 4 Local / Border
dispute 2 From East / Friendly
Distance 2 < 50 miles 1 < 50 miles 1 < 50 miles 3 150 - 300 miles
Ease of Transport 2 Relatively easy 2 Relatively easy 2 Relatively easy 2 Relatively easy
Quantity 2 Couple Loads 2 Couple Loads 2 Couple Loads 2 Couple Loads
Earth Mortar Location / Hostility 3 Local / Jonglei
unrest 1 Local / Friendly 4 Local / Border dispute 2 From East / Friendly
Distance 2 < 50 miles 1 < 50 miles 1 < 50 miles 3 150 - 300 miles
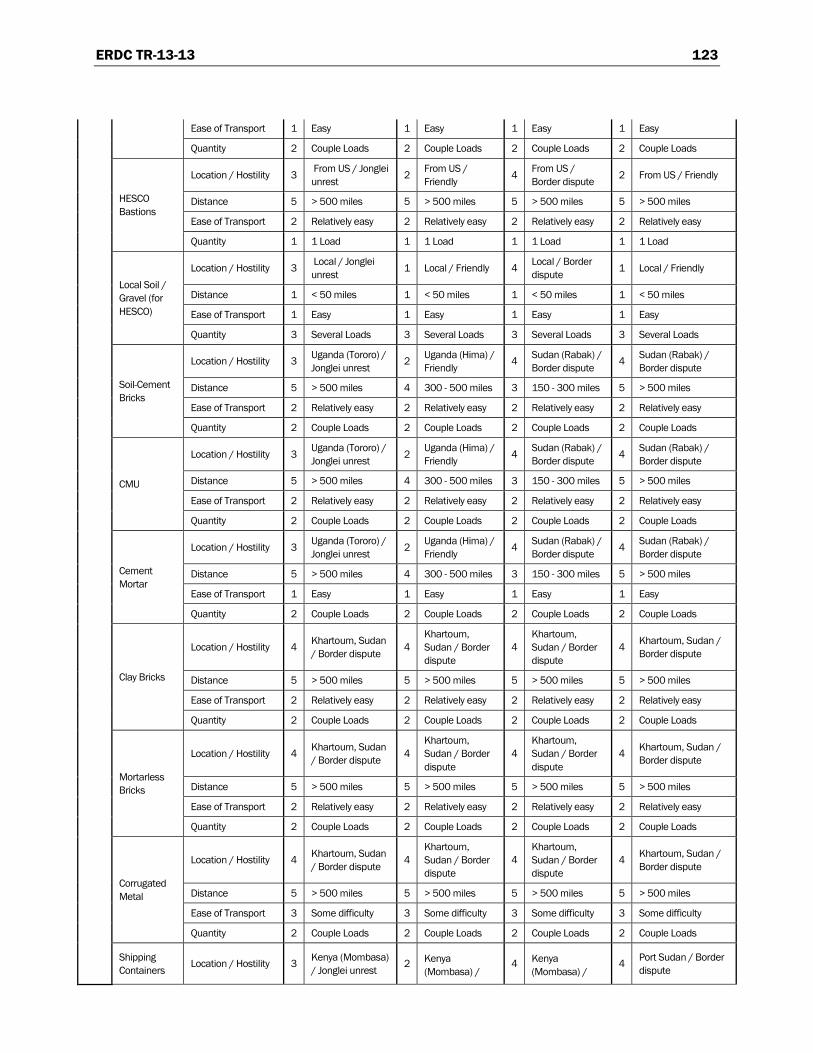
ERDC TR-13-13 123
Ease of Transport 1 Easy 1 Easy 1 Easy 1 Easy
Quantity 2 Couple Loads 2 Couple Loads 2 Couple Loads 2 Couple Loads
HESCO Bastions
Location / Hostility 3 From US / Jonglei unrest 2 From US /
Friendly 4 From US / Border dispute 2 From US / Friendly
Distance 5 > 500 miles 5 > 500 miles 5 > 500 miles 5 > 500 miles
Ease of Transport 2 Relatively easy 2 Relatively easy 2 Relatively easy 2 Relatively easy
Quantity 1 1 Load 1 1 Load 1 1 Load 1 1 Load
Local Soil / Gravel (for HESCO)
Location / Hostility 3 Local / Jonglei unrest 1 Local / Friendly 4 Local / Border
dispute 1 Local / Friendly
Distance 1 < 50 miles 1 < 50 miles 1 < 50 miles 1 < 50 miles
Ease of Transport 1 Easy 1 Easy 1 Easy 1 Easy
Quantity 3 Several Loads 3 Several Loads 3 Several Loads 3 Several Loads
Soil-Cement Bricks
Location / Hostility 3 Uganda (Tororo) / Jonglei unrest 2 Uganda (Hima) /
Friendly 4 Sudan (Rabak) / Border dispute 4 Sudan (Rabak) /
Border dispute
Distance 5 > 500 miles 4 300 - 500 miles 3 150 - 300 miles 5 > 500 miles
Ease of Transport 2 Relatively easy 2 Relatively easy 2 Relatively easy 2 Relatively easy
Quantity 2 Couple Loads 2 Couple Loads 2 Couple Loads 2 Couple Loads
CMU
Location / Hostility 3 Uganda (Tororo) / Jonglei unrest 2 Uganda (Hima) /
Friendly 4 Sudan (Rabak) / Border dispute 4 Sudan (Rabak) /
Border dispute
Distance 5 > 500 miles 4 300 - 500 miles 3 150 - 300 miles 5 > 500 miles
Ease of Transport 2 Relatively easy 2 Relatively easy 2 Relatively easy 2 Relatively easy
Quantity 2 Couple Loads 2 Couple Loads 2 Couple Loads 2 Couple Loads
Cement Mortar
Location / Hostility 3 Uganda (Tororo) / Jonglei unrest 2 Uganda (Hima) /
Friendly 4 Sudan (Rabak) / Border dispute 4 Sudan (Rabak) /
Border dispute
Distance 5 > 500 miles 4 300 - 500 miles 3 150 - 300 miles 5 > 500 miles
Ease of Transport 1 Easy 1 Easy 1 Easy 1 Easy
Quantity 2 Couple Loads 2 Couple Loads 2 Couple Loads 2 Couple Loads
Clay Bricks
Location / Hostility 4 Khartoum, Sudan / Border dispute 4
Khartoum, Sudan / Border dispute
4 Khartoum, Sudan / Border dispute
4 Khartoum, Sudan / Border dispute
Distance 5 > 500 miles 5 > 500 miles 5 > 500 miles 5 > 500 miles
Ease of Transport 2 Relatively easy 2 Relatively easy 2 Relatively easy 2 Relatively easy
Quantity 2 Couple Loads 2 Couple Loads 2 Couple Loads 2 Couple Loads
Mortarless Bricks
Location / Hostility 4 Khartoum, Sudan / Border dispute 4
Khartoum, Sudan / Border dispute
4 Khartoum, Sudan / Border dispute
4 Khartoum, Sudan / Border dispute
Distance 5 > 500 miles 5 > 500 miles 5 > 500 miles 5 > 500 miles
Ease of Transport 2 Relatively easy 2 Relatively easy 2 Relatively easy 2 Relatively easy
Quantity 2 Couple Loads 2 Couple Loads 2 Couple Loads 2 Couple Loads
Corrugated Metal
Location / Hostility 4 Khartoum, Sudan / Border dispute 4
Khartoum, Sudan / Border dispute
4 Khartoum, Sudan / Border dispute
4 Khartoum, Sudan / Border dispute
Distance 5 > 500 miles 5 > 500 miles 5 > 500 miles 5 > 500 miles
Ease of Transport 3 Some difficulty 3 Some difficulty 3 Some difficulty 3 Some difficulty
Quantity 2 Couple Loads 2 Couple Loads 2 Couple Loads 2 Couple Loads
Shipping Containers Location / Hostility 3 Kenya (Mombasa)
/ Jonglei unrest 2 Kenya (Mombasa) /
4 Kenya (Mombasa) /
4 Port Sudan / Border dispute
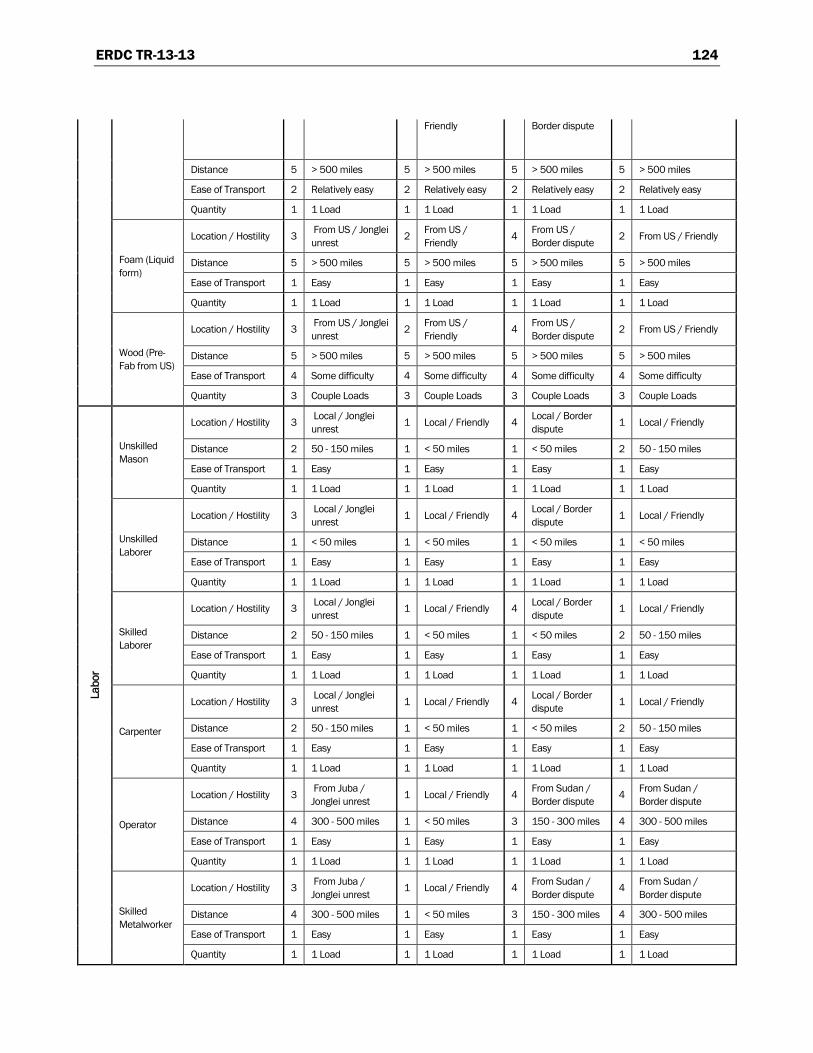
ERDC TR-13-13 124
Friendly Border dispute
Distance 5 > 500 miles 5 > 500 miles 5 > 500 miles 5 > 500 miles
Ease of Transport 2 Relatively easy 2 Relatively easy 2 Relatively easy 2 Relatively easy
Quantity 1 1 Load 1 1 Load 1 1 Load 1 1 Load
Foam (Liquid form)
Location / Hostility 3 From US / Jonglei unrest 2 From US /
Friendly 4 From US / Border dispute 2 From US / Friendly
Distance 5 > 500 miles 5 > 500 miles 5 > 500 miles 5 > 500 miles
Ease of Transport 1 Easy 1 Easy 1 Easy 1 Easy
Quantity 1 1 Load 1 1 Load 1 1 Load 1 1 Load
Wood (Pre-Fab from US)
Location / Hostility 3 From US / Jonglei unrest 2 From US /
Friendly 4 From US / Border dispute 2 From US / Friendly
Distance 5 > 500 miles 5 > 500 miles 5 > 500 miles 5 > 500 miles
Ease of Transport 4 Some difficulty 4 Some difficulty 4 Some difficulty 4 Some difficulty
Quantity 3 Couple Loads 3 Couple Loads 3 Couple Loads 3 Couple Loads
Labo
r
Unskilled Mason
Location / Hostility 3 Local / Jonglei unrest 1 Local / Friendly 4 Local / Border
dispute 1 Local / Friendly
Distance 2 50 - 150 miles 1 < 50 miles 1 < 50 miles 2 50 - 150 miles
Ease of Transport 1 Easy 1 Easy 1 Easy 1 Easy
Quantity 1 1 Load 1 1 Load 1 1 Load 1 1 Load
Unskilled Laborer
Location / Hostility 3 Local / Jonglei unrest 1 Local / Friendly 4 Local / Border
dispute 1 Local / Friendly
Distance 1 < 50 miles 1 < 50 miles 1 < 50 miles 1 < 50 miles
Ease of Transport 1 Easy 1 Easy 1 Easy 1 Easy
Quantity 1 1 Load 1 1 Load 1 1 Load 1 1 Load
Skilled Laborer
Location / Hostility 3 Local / Jonglei unrest 1 Local / Friendly 4 Local / Border
dispute 1 Local / Friendly
Distance 2 50 - 150 miles 1 < 50 miles 1 < 50 miles 2 50 - 150 miles
Ease of Transport 1 Easy 1 Easy 1 Easy 1 Easy
Quantity 1 1 Load 1 1 Load 1 1 Load 1 1 Load
Carpenter
Location / Hostility 3 Local / Jonglei unrest 1 Local / Friendly 4 Local / Border
dispute 1 Local / Friendly
Distance 2 50 - 150 miles 1 < 50 miles 1 < 50 miles 2 50 - 150 miles
Ease of Transport 1 Easy 1 Easy 1 Easy 1 Easy
Quantity 1 1 Load 1 1 Load 1 1 Load 1 1 Load
Operator
Location / Hostility 3 From Juba / Jonglei unrest 1 Local / Friendly 4 From Sudan /
Border dispute 4 From Sudan / Border dispute
Distance 4 300 - 500 miles 1 < 50 miles 3 150 - 300 miles 4 300 - 500 miles
Ease of Transport 1 Easy 1 Easy 1 Easy 1 Easy
Quantity 1 1 Load 1 1 Load 1 1 Load 1 1 Load
Skilled Metalworker
Location / Hostility 3 From Juba / Jonglei unrest 1 Local / Friendly 4 From Sudan /
Border dispute 4 From Sudan / Border dispute
Distance 4 300 - 500 miles 1 < 50 miles 3 150 - 300 miles 4 300 - 500 miles
Ease of Transport 1 Easy 1 Easy 1 Easy 1 Easy
Quantity 1 1 Load 1 1 Load 1 1 Load 1 1 Load
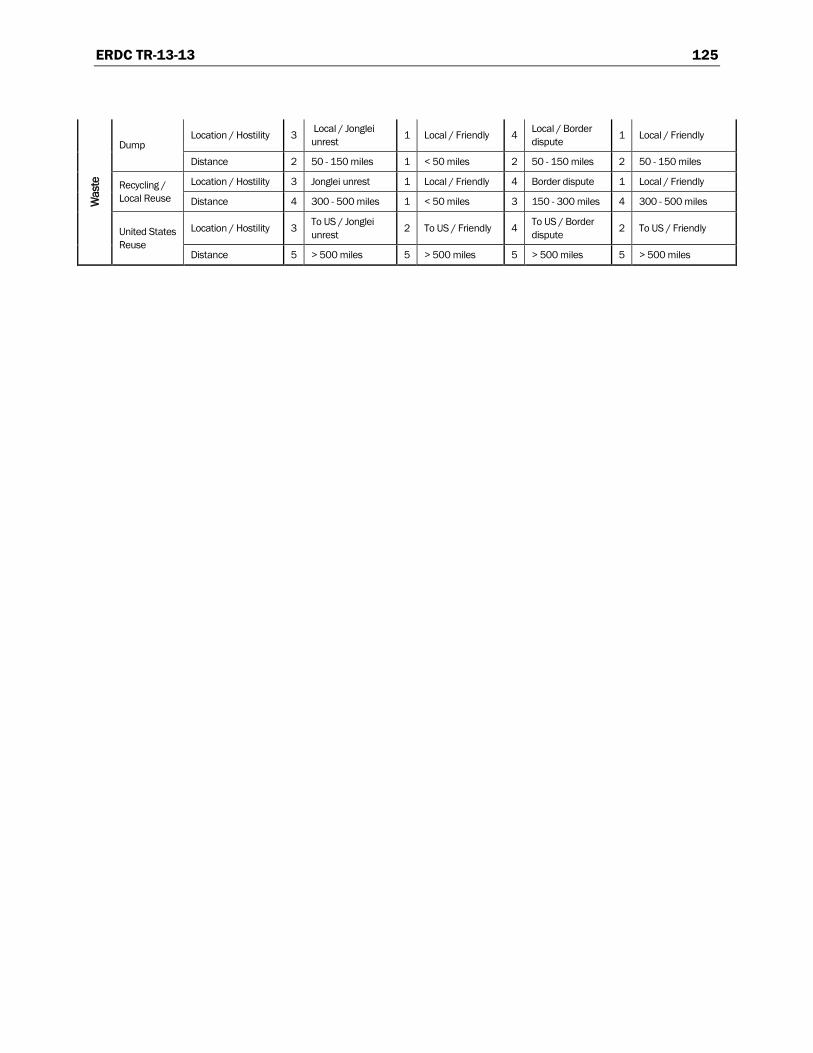
ERDC TR-13-13 125
Was
te
Dump Location / Hostility 3 Local / Jonglei
unrest 1 Local / Friendly 4 Local / Border dispute 1 Local / Friendly
Distance 2 50 - 150 miles 1 < 50 miles 2 50 - 150 miles 2 50 - 150 miles
Recycling / Local Reuse
Location / Hostility 3 Jonglei unrest 1 Local / Friendly 4 Border dispute 1 Local / Friendly
Distance 4 300 - 500 miles 1 < 50 miles 3 150 - 300 miles 4 300 - 500 miles
United States Reuse
Location / Hostility 3 To US / Jonglei unrest 2 To US / Friendly 4 To US / Border
dispute 2 To US / Friendly
Distance 5 > 500 miles 5 > 500 miles 5 > 500 miles 5 > 500 miles
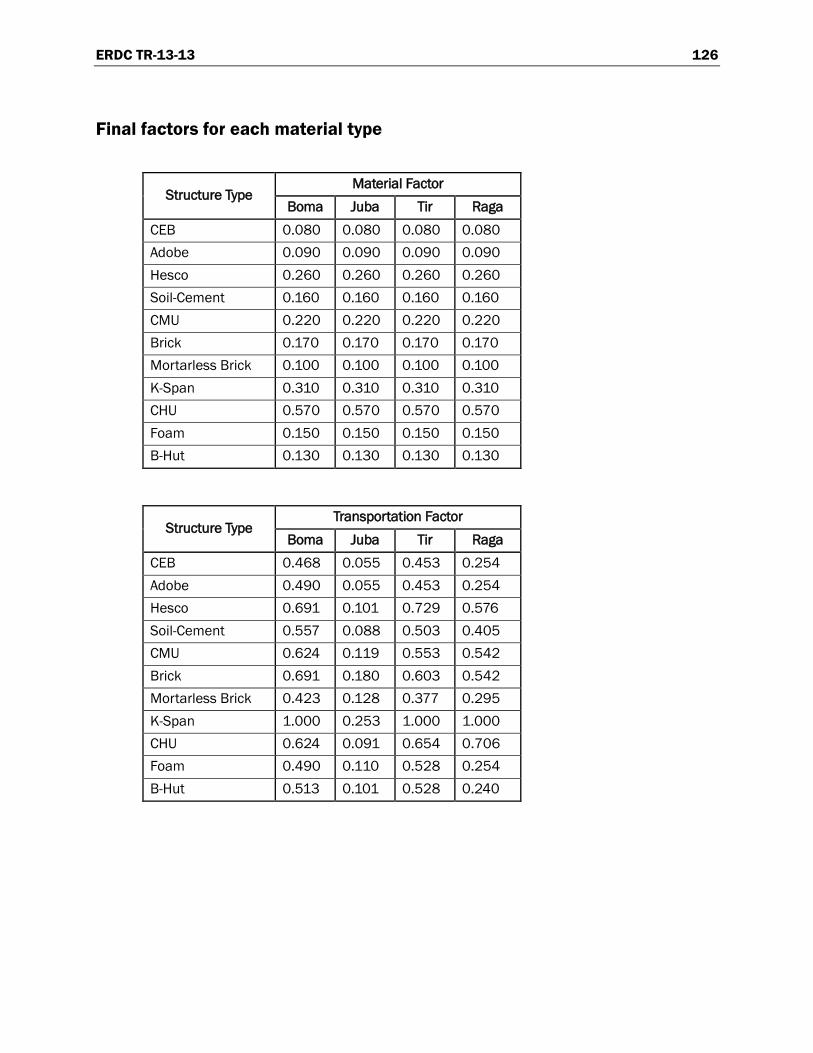
ERDC TR-13-13 126
Final factors for each material type
Structure Type Material Factor
Boma Juba Tir Raga CEB 0.080 0.080 0.080 0.080 Adobe 0.090 0.090 0.090 0.090 Hesco 0.260 0.260 0.260 0.260 Soil-Cement 0.160 0.160 0.160 0.160 CMU 0.220 0.220 0.220 0.220 Brick 0.170 0.170 0.170 0.170 Mortarless Brick 0.100 0.100 0.100 0.100 K-Span 0.310 0.310 0.310 0.310 CHU 0.570 0.570 0.570 0.570 Foam 0.150 0.150 0.150 0.150 B-Hut 0.130 0.130 0.130 0.130
Structure Type Transportation Factor
Boma Juba Tir Raga CEB 0.468 0.055 0.453 0.254 Adobe 0.490 0.055 0.453 0.254 Hesco 0.691 0.101 0.729 0.576 Soil-Cement 0.557 0.088 0.503 0.405 CMU 0.624 0.119 0.553 0.542 Brick 0.691 0.180 0.603 0.542 Mortarless Brick 0.423 0.128 0.377 0.295 K-Span 1.000 0.253 1.000 1.000 CHU 0.624 0.091 0.654 0.706 Foam 0.490 0.110 0.528 0.254 B-Hut 0.513 0.101 0.528 0.240
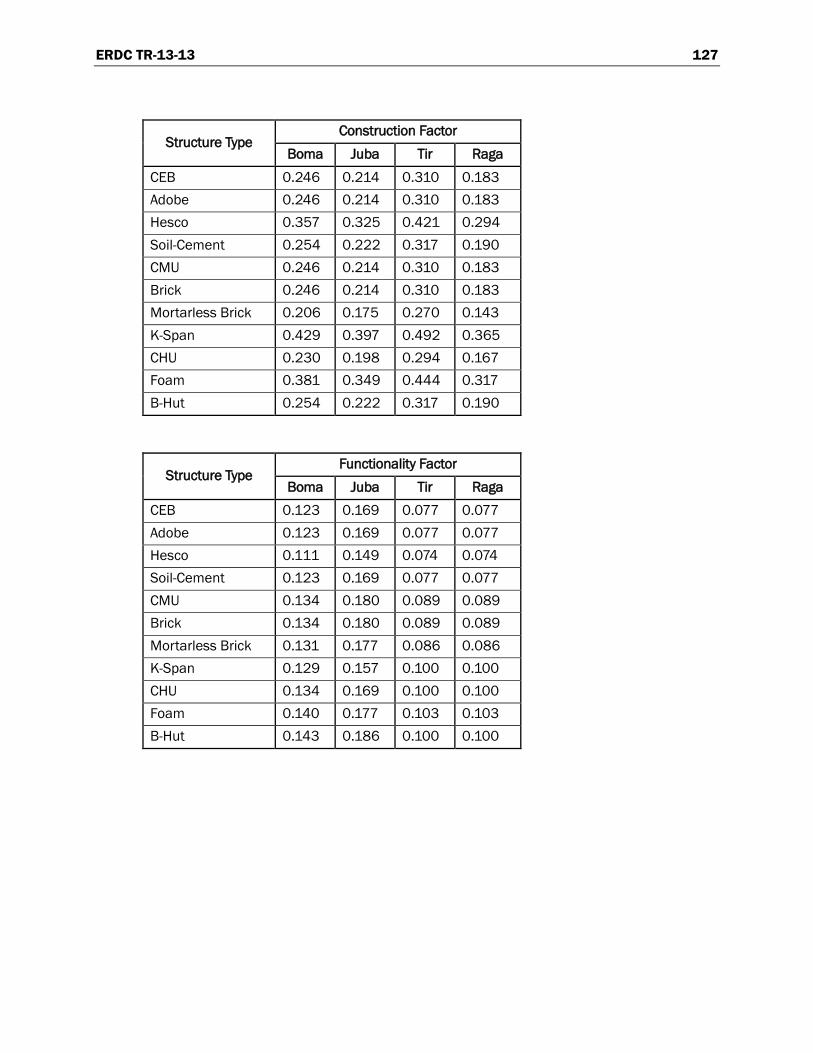
ERDC TR-13-13 127
Structure Type Construction Factor
Boma Juba Tir Raga CEB 0.246 0.214 0.310 0.183 Adobe 0.246 0.214 0.310 0.183 Hesco 0.357 0.325 0.421 0.294 Soil-Cement 0.254 0.222 0.317 0.190 CMU 0.246 0.214 0.310 0.183 Brick 0.246 0.214 0.310 0.183 Mortarless Brick 0.206 0.175 0.270 0.143 K-Span 0.429 0.397 0.492 0.365 CHU 0.230 0.198 0.294 0.167 Foam 0.381 0.349 0.444 0.317 B-Hut 0.254 0.222 0.317 0.190
Structure Type Functionality Factor
Boma Juba Tir Raga CEB 0.123 0.169 0.077 0.077 Adobe 0.123 0.169 0.077 0.077 Hesco 0.111 0.149 0.074 0.074 Soil-Cement 0.123 0.169 0.077 0.077 CMU 0.134 0.180 0.089 0.089 Brick 0.134 0.180 0.089 0.089 Mortarless Brick 0.131 0.177 0.086 0.086 K-Span 0.129 0.157 0.100 0.100 CHU 0.134 0.169 0.100 0.100 Foam 0.140 0.177 0.103 0.103 B-Hut 0.143 0.186 0.100 0.100
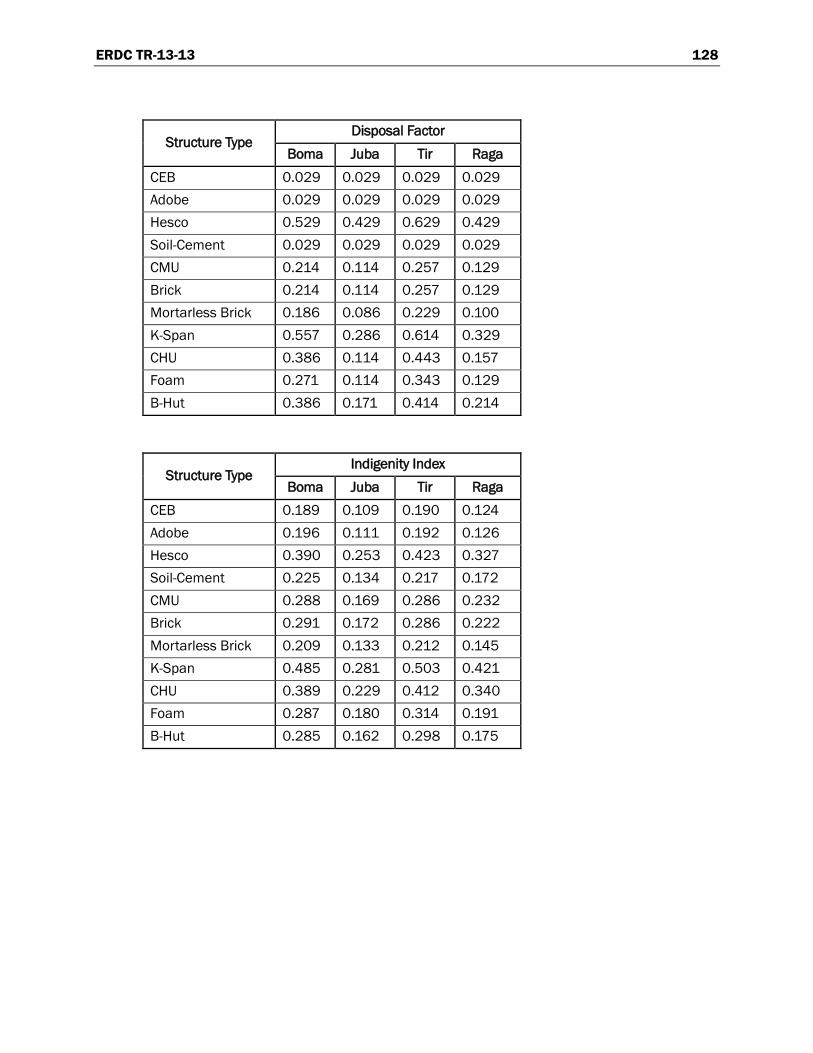
ERDC TR-13-13 128
Structure Type Disposal Factor
Boma Juba Tir Raga CEB 0.029 0.029 0.029 0.029 Adobe 0.029 0.029 0.029 0.029 Hesco 0.529 0.429 0.629 0.429 Soil-Cement 0.029 0.029 0.029 0.029 CMU 0.214 0.114 0.257 0.129 Brick 0.214 0.114 0.257 0.129 Mortarless Brick 0.186 0.086 0.229 0.100 K-Span 0.557 0.286 0.614 0.329 CHU 0.386 0.114 0.443 0.157 Foam 0.271 0.114 0.343 0.129 B-Hut 0.386 0.171 0.414 0.214
Structure Type Indigenity Index
Boma Juba Tir Raga CEB 0.189 0.109 0.190 0.124 Adobe 0.196 0.111 0.192 0.126 Hesco 0.390 0.253 0.423 0.327 Soil-Cement 0.225 0.134 0.217 0.172 CMU 0.288 0.169 0.286 0.232 Brick 0.291 0.172 0.286 0.222 Mortarless Brick 0.209 0.133 0.212 0.145 K-Span 0.485 0.281 0.503 0.421 CHU 0.389 0.229 0.412 0.340 Foam 0.287 0.180 0.314 0.191 B-Hut 0.285 0.162 0.298 0.175
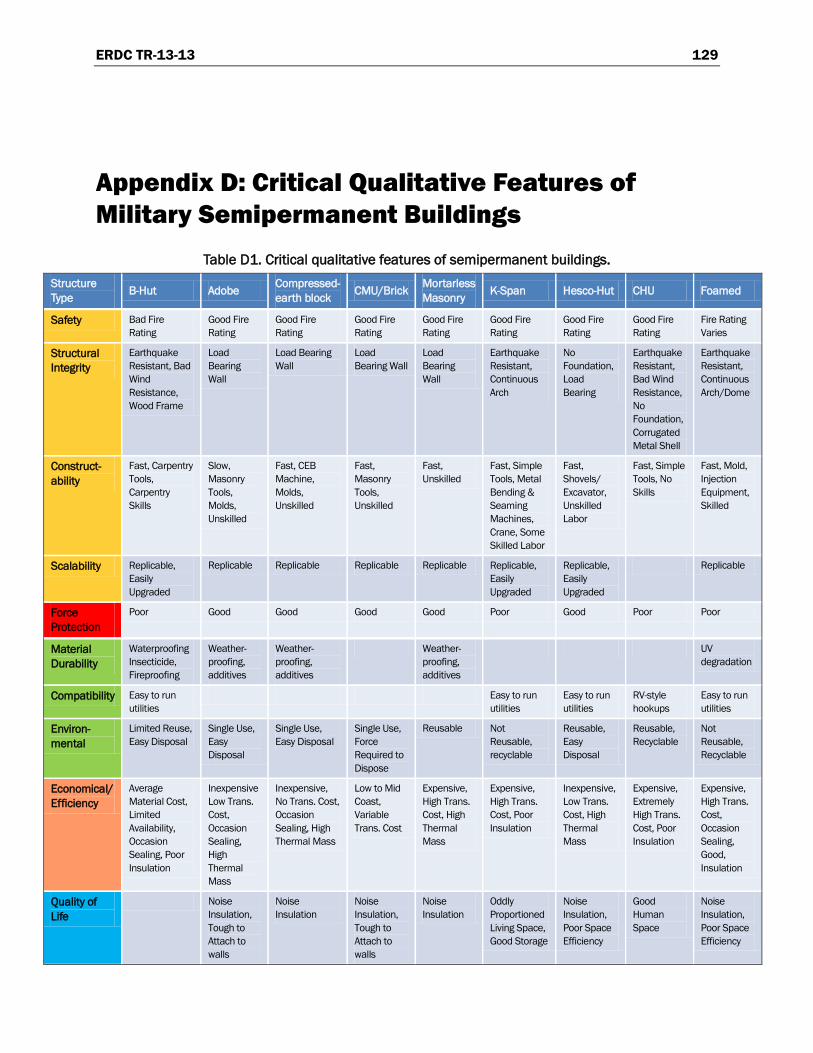
ERDC TR-13-13 129
Appendix D: Critical Qualitative Features of Military Semipermanent Buildings
Table D1. Critical qualitative features of semipermanent buildings. Structure Type B-Hut Adobe Compressed-
earth block CMU/Brick Mortarless Masonry K-Span Hesco-Hut CHU Foamed
Safety Bad Fire Rating
Good Fire Rating
Good Fire Rating
Good Fire Rating
Good Fire Rating
Good Fire Rating
Good Fire Rating
Good Fire Rating
Fire Rating Varies
Structural Integrity
Earthquake Resistant, Bad Wind Resistance, Wood Frame
Load Bearing Wall
Load Bearing Wall
Load Bearing Wall
Load Bearing Wall
Earthquake Resistant, Continuous Arch
No Foundation, Load Bearing
Earthquake Resistant, Bad Wind Resistance, No Foundation, Corrugated Metal Shell
Earthquake Resistant, Continuous Arch/Dome
Construct-ability
Fast, Carpentry Tools, Carpentry Skills
Slow, Masonry Tools, Molds, Unskilled
Fast, CEB Machine, Molds, Unskilled
Fast, Masonry Tools, Unskilled
Fast, Unskilled
Fast, Simple Tools, Metal Bending & Seaming Machines, Crane, Some Skilled Labor
Fast, Shovels/ Excavator, Unskilled Labor
Fast, Simple Tools, No Skills
Fast, Mold, Injection Equipment, Skilled
Scalability Replicable, Easily Upgraded
Replicable Replicable Replicable Replicable Replicable, Easily Upgraded
Replicable, Easily Upgraded
Replicable
Force Protection
Poor Good Good Good Good Poor Good Poor Poor
Material Durability
Waterproofing Insecticide, Fireproofing
Weather-proofing, additives
Weather-proofing, additives
Weather-proofing, additives
UV degradation
Compatibility Easy to run utilities
Easy to run utilities
Easy to run utilities
RV-style hookups
Easy to run utilities
Environ-mental
Limited Reuse, Easy Disposal
Single Use, Easy Disposal
Single Use, Easy Disposal
Single Use, Force Required to Dispose
Reusable Not Reusable, recyclable
Reusable, Easy Disposal
Reusable, Recyclable
Not Reusable, Recyclable
Economical/ Efficiency
Average Material Cost, Limited Availability, Occasion Sealing, Poor Insulation
Inexpensive Low Trans. Cost, Occasion Sealing, High Thermal Mass
Inexpensive, No Trans. Cost, Occasion Sealing, High Thermal Mass
Low to Mid Coast, Variable Trans. Cost
Expensive, High Trans. Cost, High Thermal Mass
Expensive, High Trans. Cost, Poor Insulation
Inexpensive, Low Trans. Cost, High Thermal Mass
Expensive, Extremely High Trans. Cost, Poor Insulation
Expensive, High Trans. Cost, Occasion Sealing, Good, Insulation
Quality of Life
Noise Insulation, Tough to Attach to walls
Noise Insulation
Noise Insulation, Tough to Attach to walls
Noise Insulation
Oddly Proportioned Living Space, Good Storage
Noise Insulation, Poor Space Efficiency
Good Human Space
Noise Insulation, Poor Space Efficiency
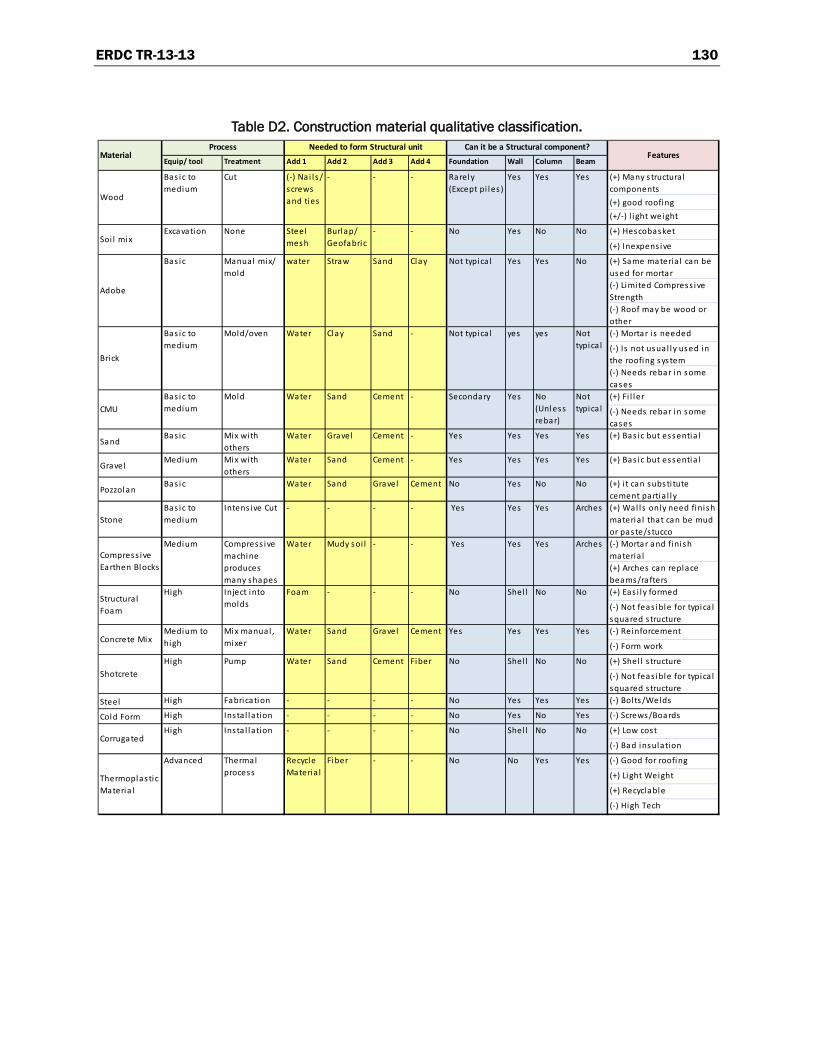
ERDC TR-13-13 130
Table D2. Construction material qualitative classification.
Equip/ tool Treatment Add 1 Add 2 Add 3 Add 4 Foundation Wall Column Beam
(+) Many s tructura l components(+) good roofing(+/-) l ight weight
(+) Hescobasket
(+) Inexpens ive
(+) Same materia l can be used for mortar(-) Limited Compress ive Strength(-) Roof may be wood or other(-) Mortar i s needed
(-) Is not usual ly used in the roofing system (-) Needs rebar in some cases(+) Fi l ler
(-) Needs rebar in some cases
SandBas ic Mix with
othersWater Gravel Cement - Yes Yes Yes Yes (+) Bas ic but essentia l
GravelMedium Mix with
othersWater Sand Cement - Yes Yes Yes Yes (+) Bas ic but essentia l
PozzolanBas ic Water Sand Gravel Cement No Yes No No (+) i t can substi tute
cement partia l ly
StoneBas ic to medium
Intens ive Cut - - - - Yes Yes Yes Arches (+) Wal ls only need finish materia l that can be mud or paste/stucco(-) Mortar and finish materia l(+) Arches can replace beams/rafters (+) Eas i ly formed
(-) Not feas ible for typica l squared s tructure(-) Reinforcement
(-) Form work
(+) Shel l s tructure
(-) Not feas ible for typica l squared s tructure
Steel High Fabrication - - - - No Yes Yes Yes (-) Bol ts/Welds
Cold Form High Insta l lation - - - - No Yes No Yes (-) Screws/Boards
(+) Low cost
(-) Bad insulation
(-) Good for roofing
(+) Light Weight
(+) Recyclable
(-) High Tech
MaterialProcess
No
No No
Yes Yes
Wood
Bas ic to medium
Cut (-) Nai l s / screws and ties
Needed to form Structural unit Can it be a Structural component?
NoneExcavationSoi l mix
YesYesNot typica lClaySandStraw
No-
No
--
Not typica lCMU
Bas ic to medium
Mold Water
Brick
Bas ic to medium
Mold/oven Water Not typica l
Secondary-CementSand
NoShel lNo--
Yes
CorrugatedHigh Insta l lation - No
SandWaterMix manual , mixer
Medium to highConcrete Mix
NoNoShel lNoFiberCementSandWaterPump
YesYesYesYes
Features
YesRarely (Except pi les )
---
Structura l Foam
High Inject into molds
-Foam
ArchesYesYes Yes
yesyesNot typica l-SandClay
Yes
No (Unless rebar)
Yes
-Burlap/ Geofabric
Steel mesh
Adobe
Bas ic Manual mix/ mold
water
Mudy soi lWaterCompress ivemachine produces many shapes
MediumCompress ive Earthen Blocks
CementGravel
Recycle Materia l
YesNoNo--Fiber
HighShotcrete
NoShel lNo---
Thermoplastic Materia l
Advanced Thermal process
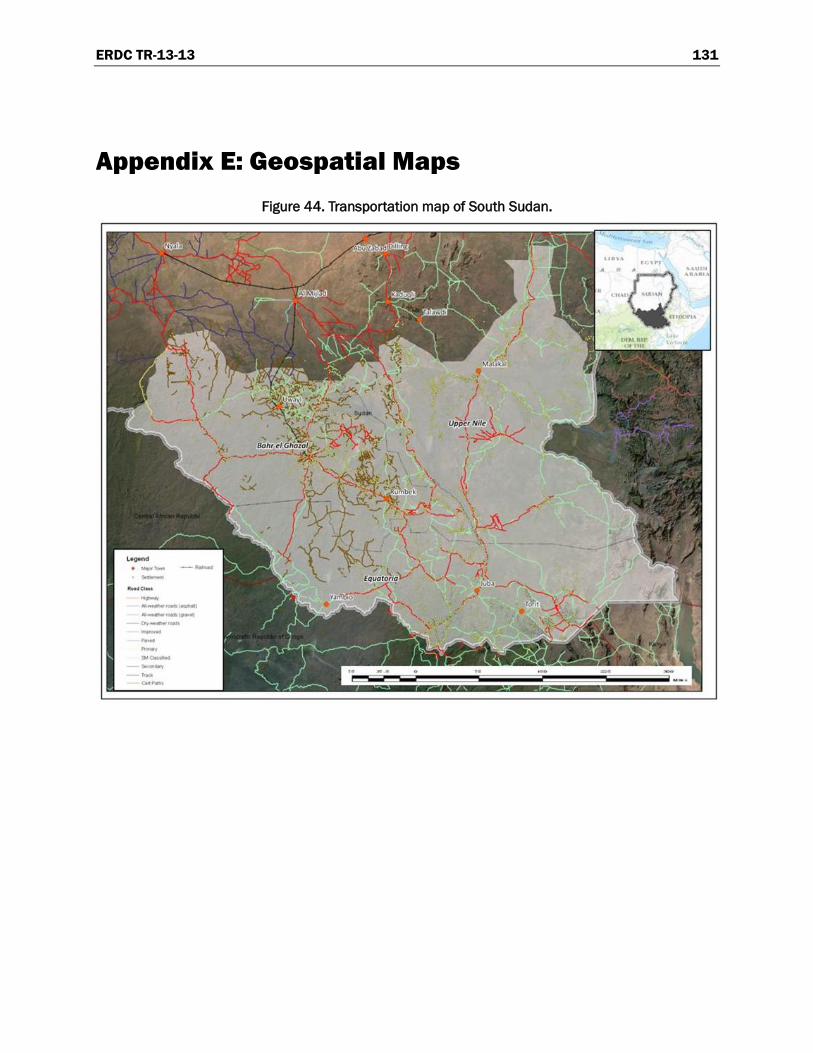
ERDC TR-13-13 131
Appendix E: Geospatial Maps Figure 44. Transportation map of South Sudan.
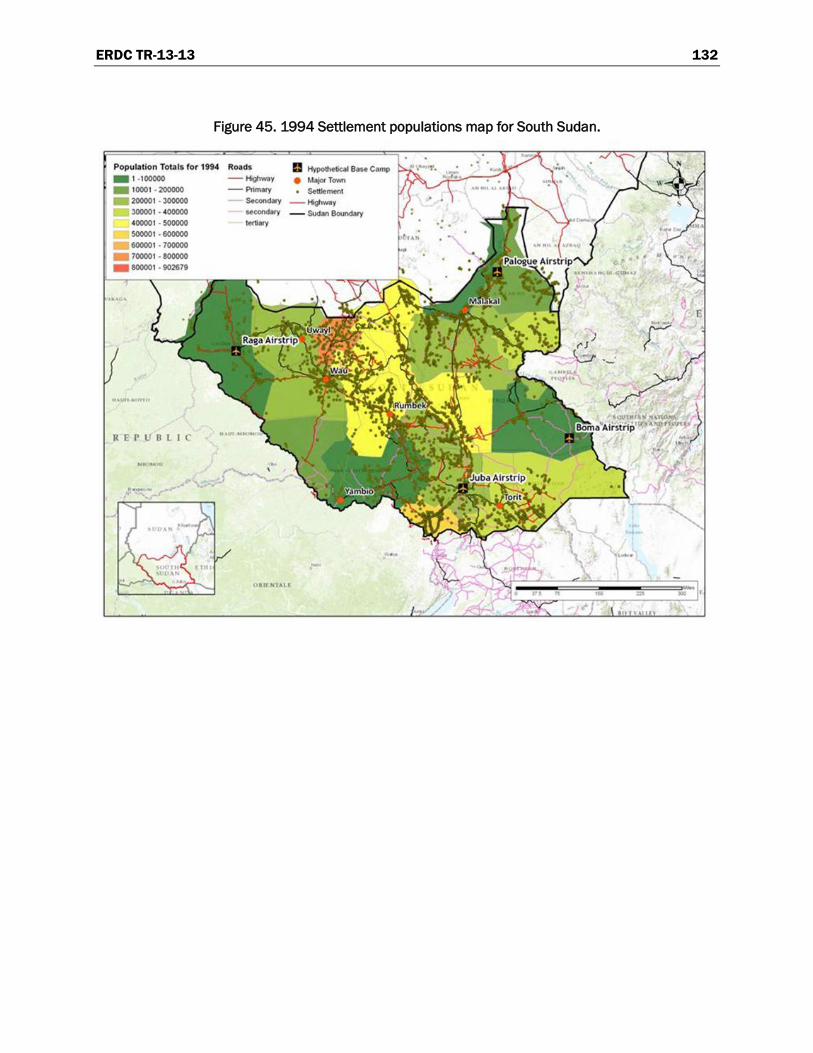
ERDC TR-13-13 132
Figure 45. 1994 Settlement populations map for South Sudan.
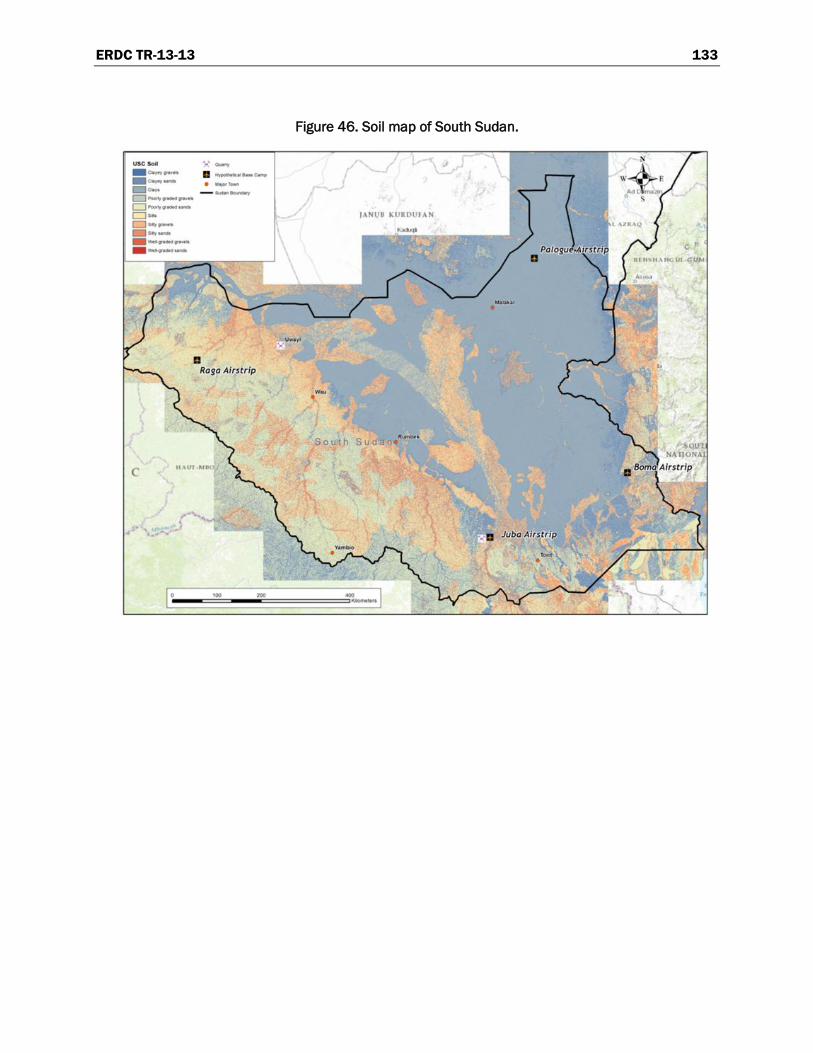
ERDC TR-13-13 133
Figure 46. Soil map of South Sudan.
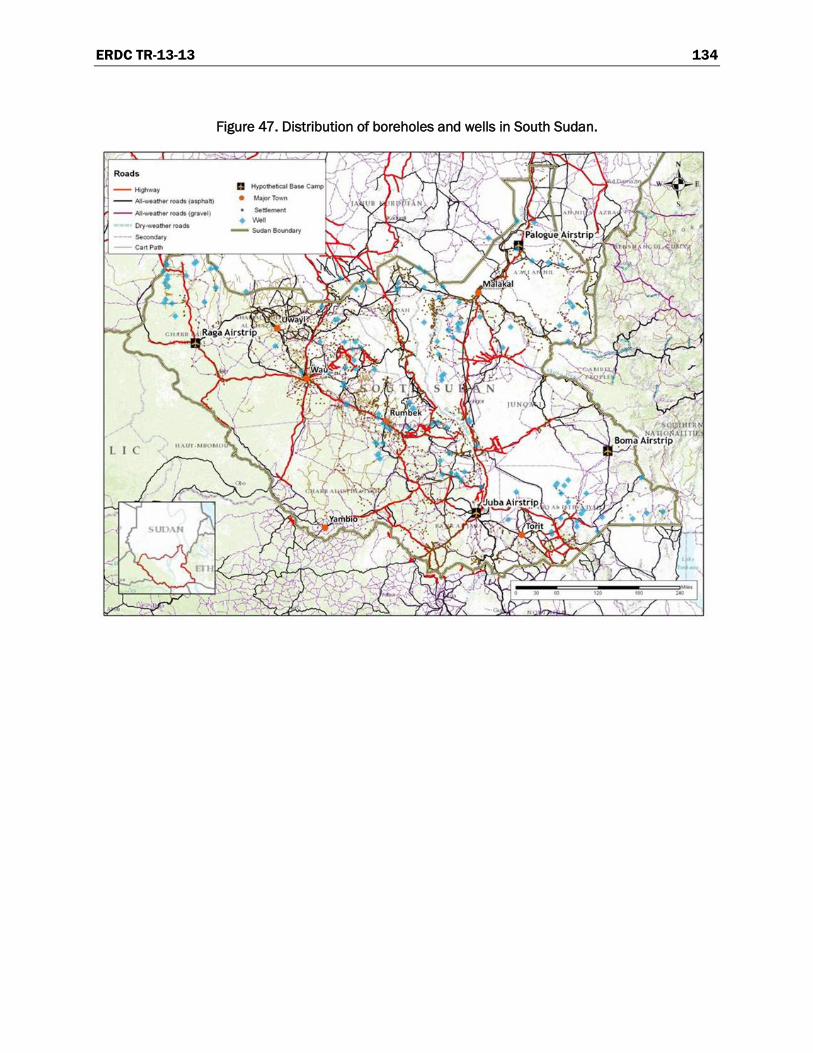
ERDC TR-13-13 134
Figure 47. Distribution of boreholes and wells in South Sudan.
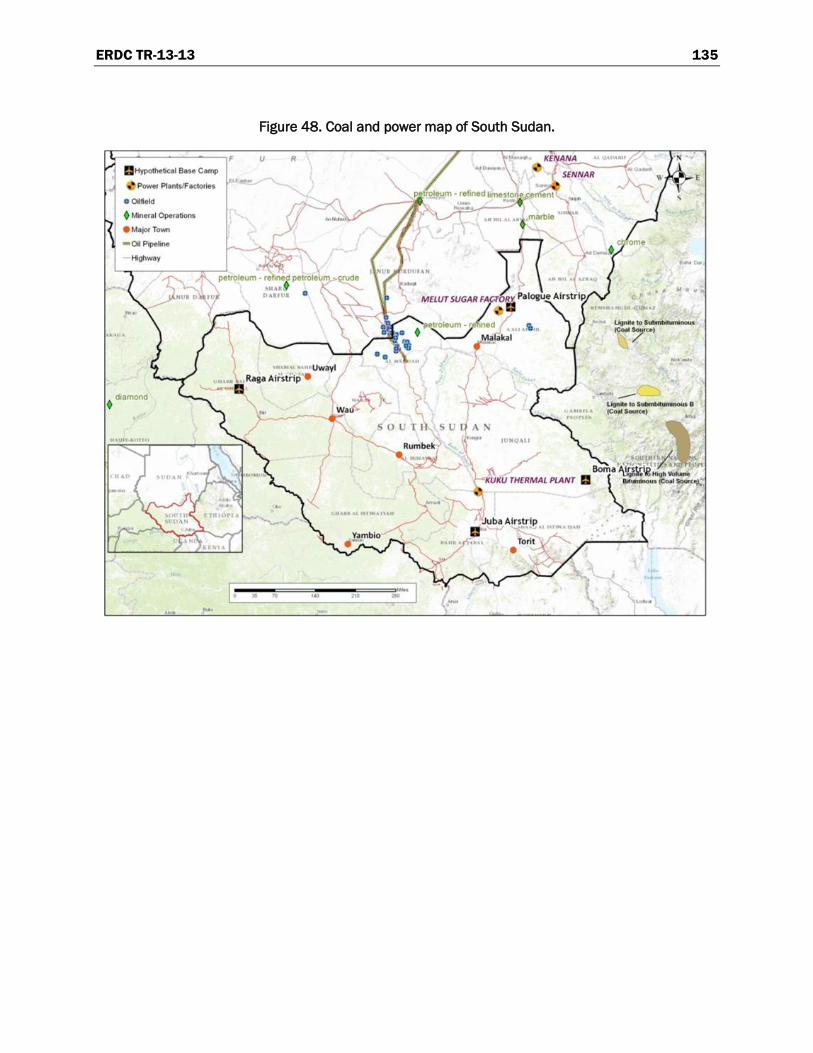
ERDC TR-13-13 135
Figure 48. Coal and power map of South Sudan.
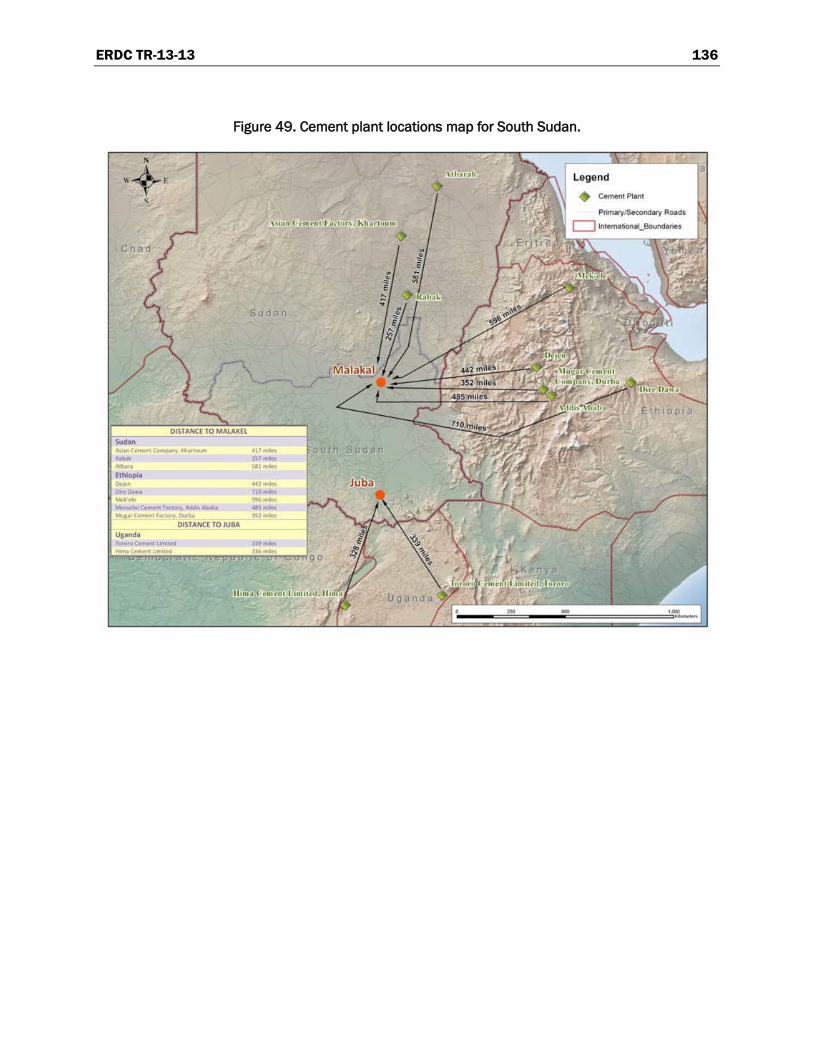
ERDC TR-13-13 136
Figure 49. Cement plant locations map for South Sudan.
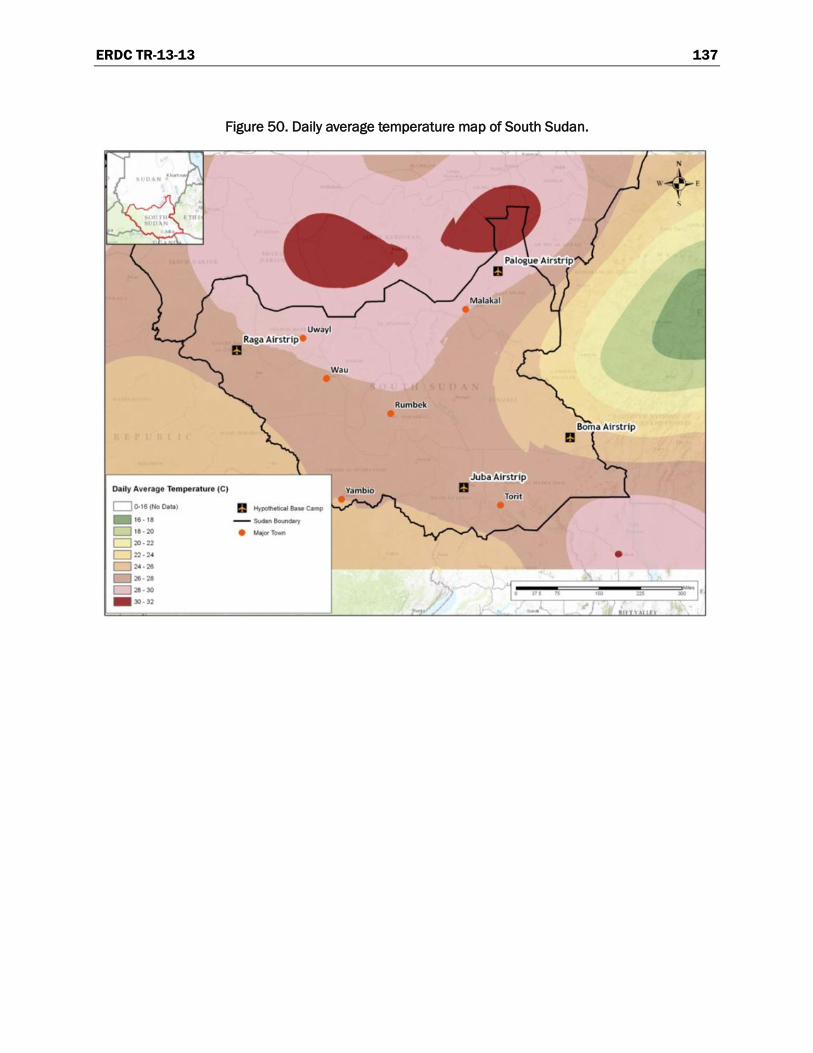
ERDC TR-13-13 137
Figure 50. Daily average temperature map of South Sudan.
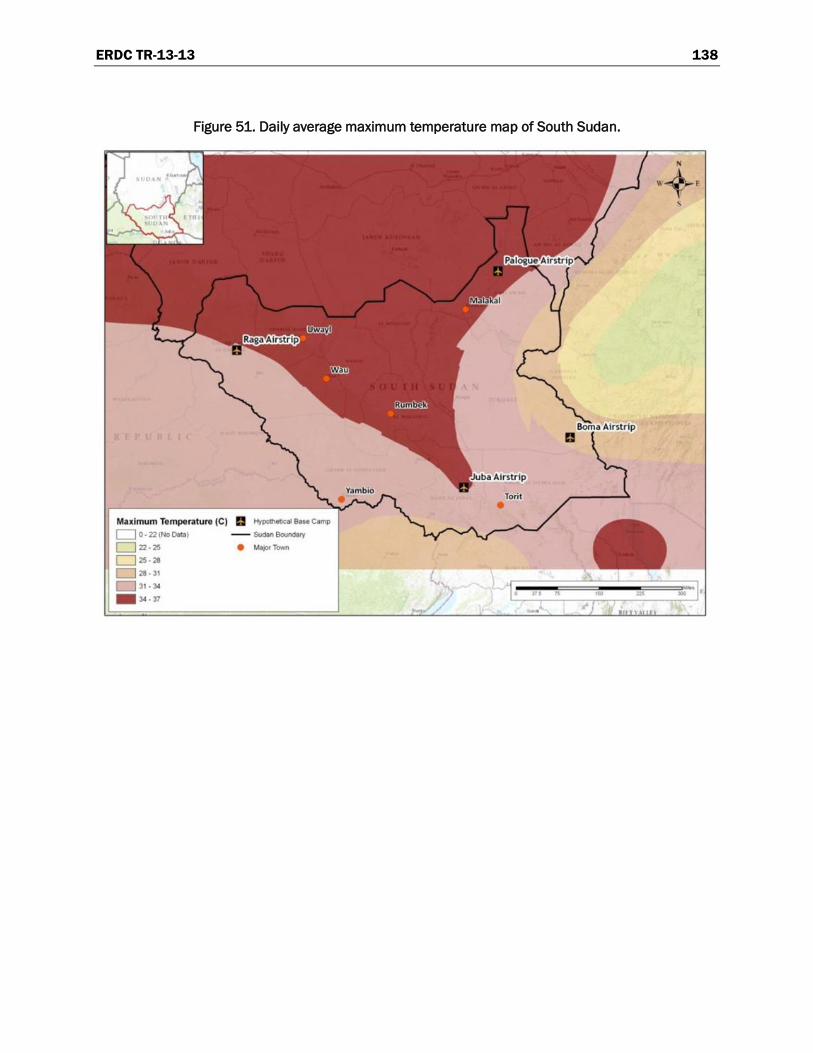
ERDC TR-13-13 138
Figure 51. Daily average maximum temperature map of South Sudan.
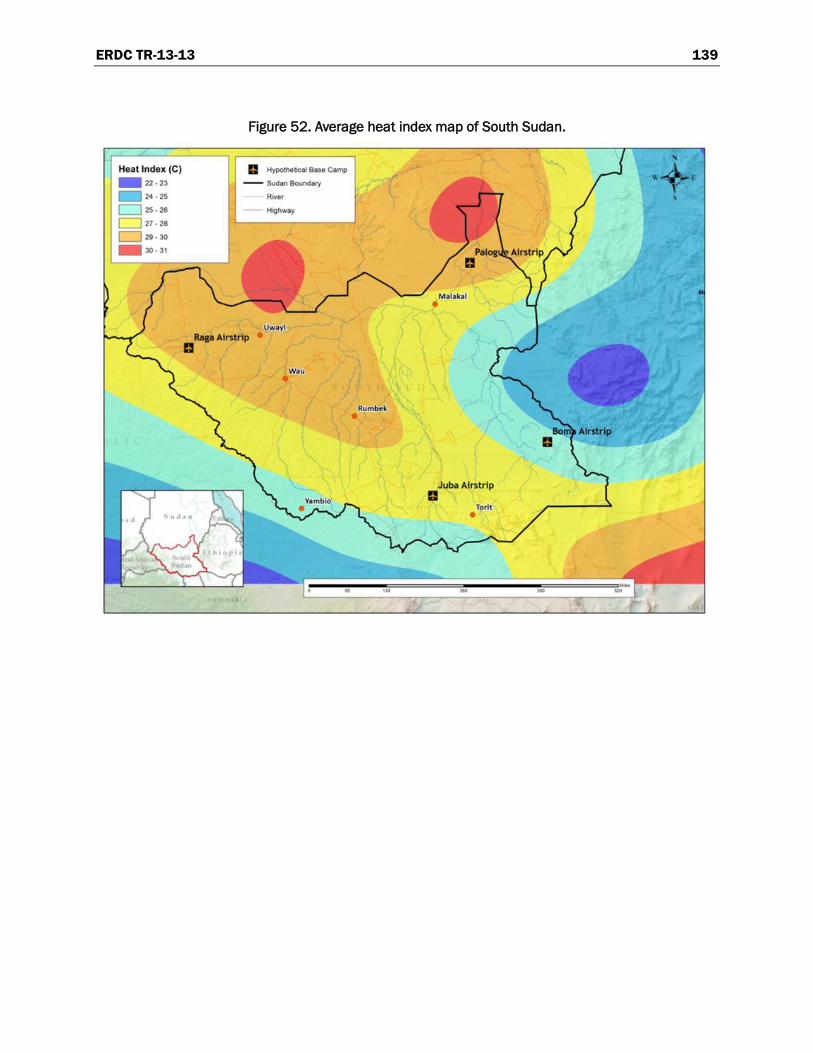
ERDC TR-13-13 139
Figure 52. Average heat index map of South Sudan.
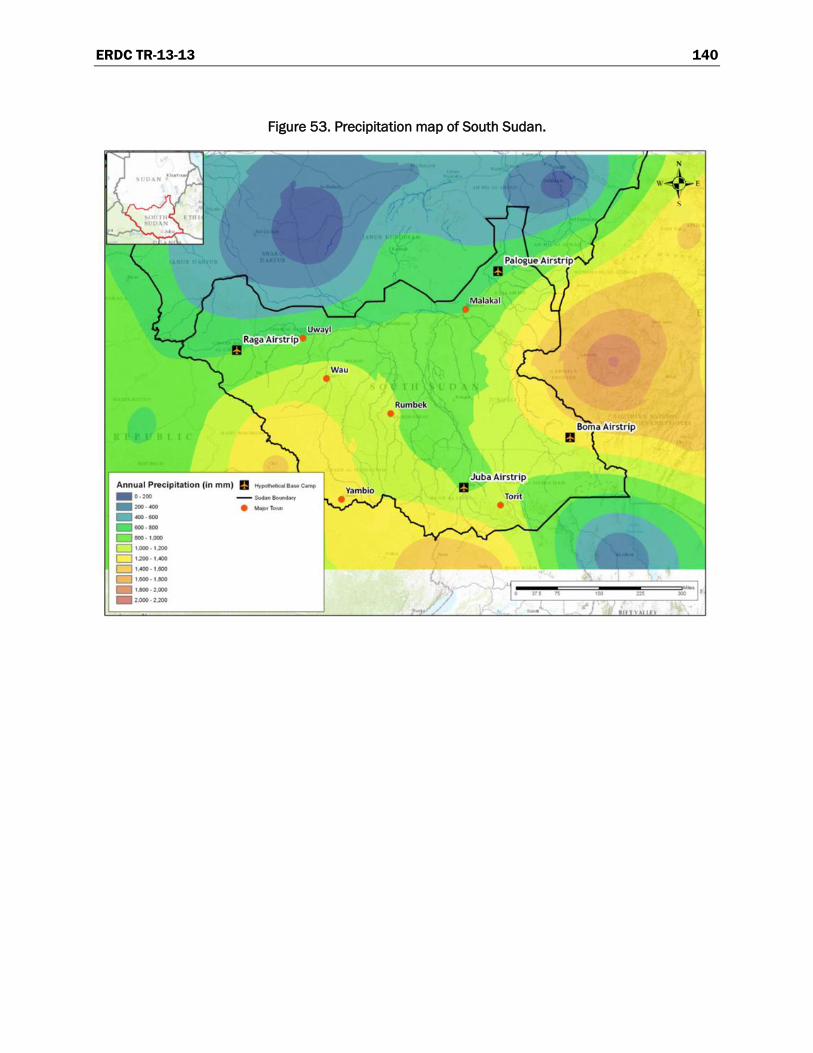
ERDC TR-13-13 140
Figure 53. Precipitation map of South Sudan.
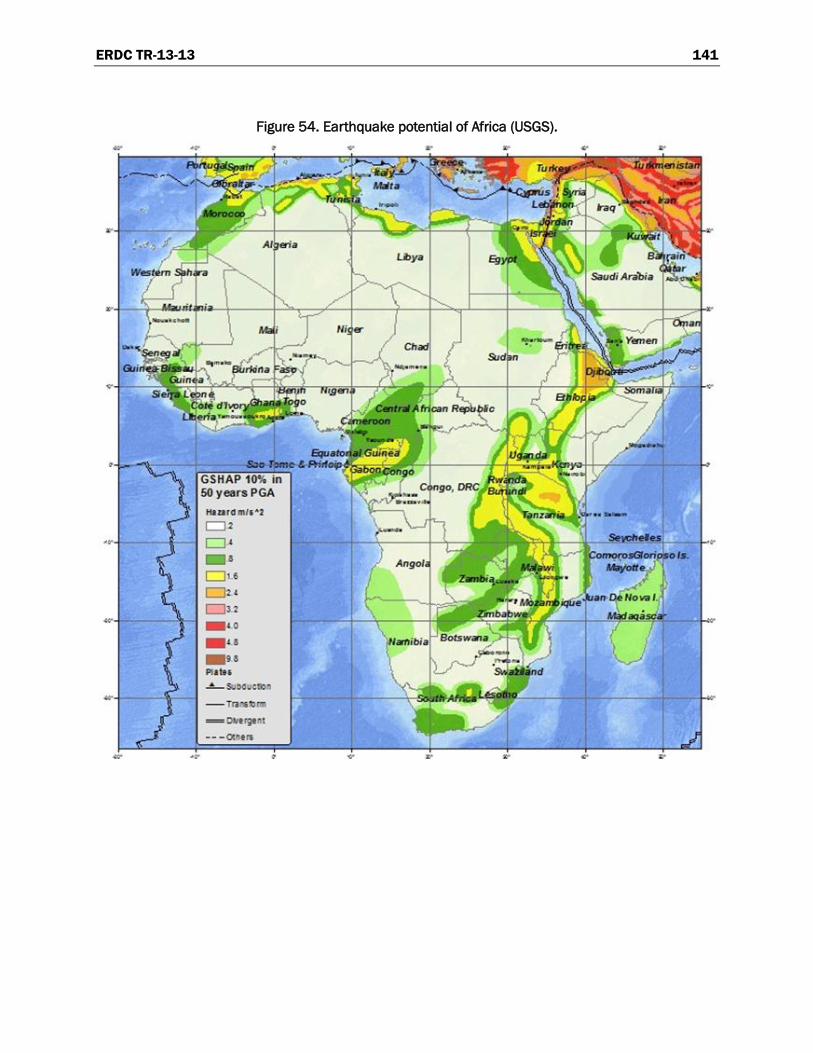
ERDC TR-13-13 141
Figure 54. Earthquake potential of Africa (USGS).
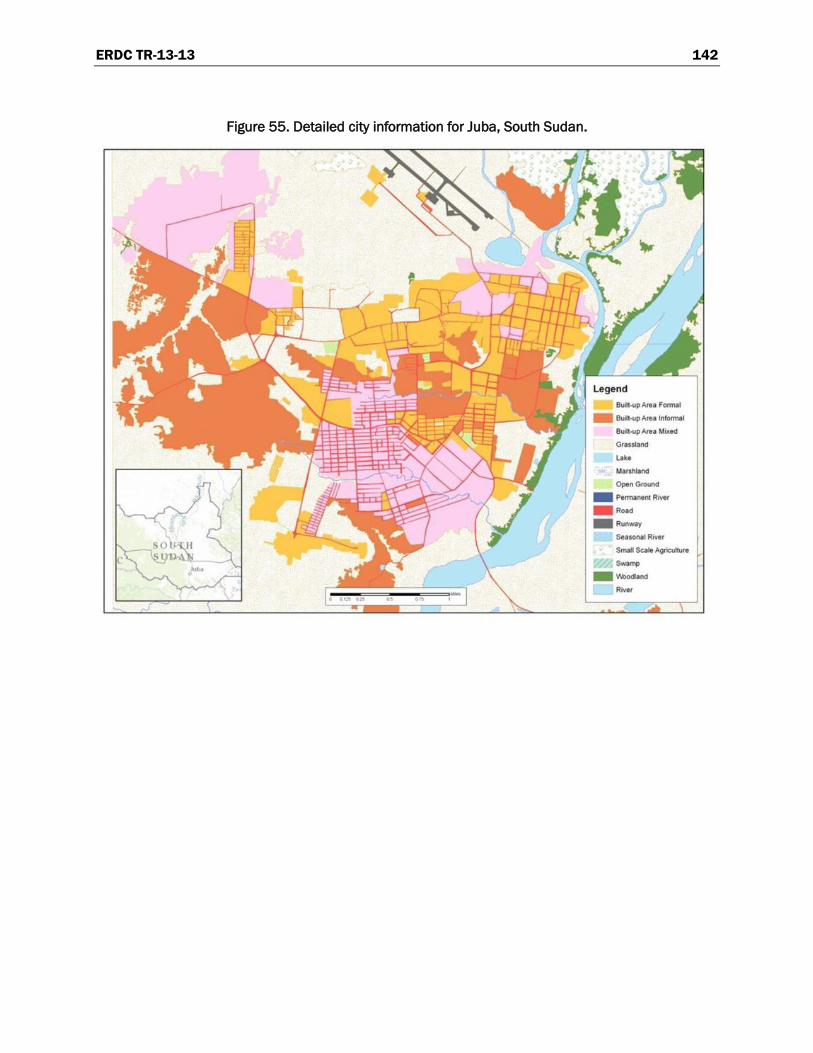
ERDC TR-13-13 142
Figure 55. Detailed city information for Juba, South Sudan.
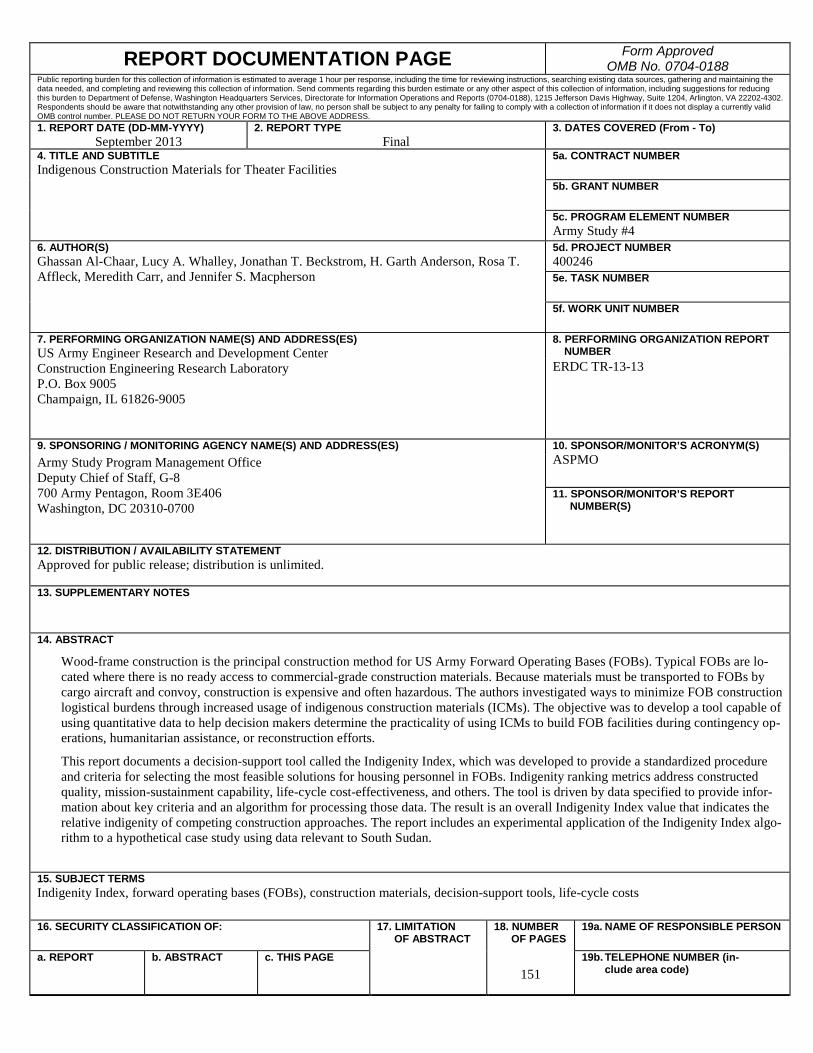
REPORT DOCUMENTATION PAGE Form Approved OMB No. 0704-0188
Public reporting burden for this collection of information is estimated to average 1 hour per response, including the time for reviewing instructions, searching existing data sources, gathering and maintaining the data needed, and completing and reviewing this collection of information. Send comments regarding this burden estimate or any other aspect of this collection of information, including suggestions for reducing this burden to Department of Defense, Washington Headquarters Services, Directorate for Information Operations and Reports (0704-0188), 1215 Jefferson Davis Highway, Suite 1204, Arlington, VA 22202-4302. Respondents should be aware that notwithstanding any other provision of law, no person shall be subject to any penalty for failing to comply with a collection of information if it does not display a currently valid OMB control number. PLEASE DO NOT RETURN YOUR FORM TO THE ABOVE ADDRESS. 1. REPORT DATE (DD-MM-YYYY)
September 2013
2. REPORT TYPE Final
3. DATES COVERED (From - To) 4. TITLE AND SUBTITLE
Indigenous Construction Materials for Theater Facilities 5a. CONTRACT NUMBER 5b. GRANT NUMBER 5c. PROGRAM ELEMENT NUMBER Army Study #4 6. AUTHOR(S)
Ghassan Al-Chaar, Lucy A. Whalley, Jonathan T. Beckstrom, H. Garth Anderson, Rosa T. Affleck, Meredith Carr, and Jennifer S. Macpherson
5d. PROJECT NUMBER 400246 5e. TASK NUMBER 5f. WORK UNIT NUMBER 7. PERFORMING ORGANIZATION NAME(S) AND ADDRESS(ES)
US Army Engineer Research and Development Center Construction Engineering Research Laboratory P.O. Box 9005 Champaign, IL 61826-9005
8. PERFORMING ORGANIZATION REPORT NUMBER
ERDC TR-13-13
9. SPONSORING / MONITORING AGENCY NAME(S) AND ADDRESS(ES) 10. SPONSOR/MONITOR’S ACRONYM(S) ASPMO Army Study Program Management Office
Deputy Chief of Staff, G-8 700 Army Pentagon, Room 3E406 Washington, DC 20310-0700
11. SPONSOR/MONITOR’S REPORT NUMBER(S)
12. DISTRIBUTION / AVAILABILITY STATEMENT Approved for public release; distribution is unlimited.
13. SUPPLEMENTARY NOTES
14. ABSTRACT
Wood-frame construction is the principal construction method for US Army Forward Operating Bases (FOBs). Typical FOBs are lo-cated where there is no ready access to commercial-grade construction materials. Because materials must be transported to FOBs by cargo aircraft and convoy, construction is expensive and often hazardous. The authors investigated ways to minimize FOB construction logistical burdens through increased usage of indigenous construction materials (ICMs). The objective was to develop a tool capable of using quantitative data to help decision makers determine the practicality of using ICMs to build FOB facilities during contingency op-erations, humanitarian assistance, or reconstruction efforts.
This report documents a decision-support tool called the Indigenity Index, which was developed to provide a standardized procedure and criteria for selecting the most feasible solutions for housing personnel in FOBs. Indigenity ranking metrics address constructed quality, mission-sustainment capability, life-cycle cost-effectiveness, and others. The tool is driven by data specified to provide infor-mation about key criteria and an algorithm for processing those data. The result is an overall Indigenity Index value that indicates the relative indigenity of competing construction approaches. The report includes an experimental application of the Indigenity Index algo-rithm to a hypothetical case study using data relevant to South Sudan.
15. SUBJECT TERMS Indigenity Index, forward operating bases (FOBs), construction materials, decision-support tools, life-cycle costs
16. SECURITY CLASSIFICATION OF: 17. LIMITATION OF ABSTRACT
18. NUMBER OF PAGES
19a. NAME OF RESPONSIBLE PERSON
a. REPORT
b. ABSTRACT
c. THIS PAGE
151
19b. TELEPHONE NUMBER (in-clude area code)