Arizona Republican Primary Survey Topline Results 071114
7
Arizona Republican Primary Survey Topline Results Magellan Strategies are pleased to present the topline results for a 593n autodial survey of likely Republican primary voters, and independent and unaffiliated voters that are likely to vote in the Republican primary election in the state of Arizona. The interviews were conducted July 9 th and 10 th , 2014. This survey has a margin of error of +/- 4.02% at the 95 percent confidence interval. This survey was weighted based upon past Republican primary election voting demographics. T1. Are you registered to vote as a Republican, a Democrat or an independent voter? Republican.............................................................. 79% Independent ............................................................ 21% T2. As you may know, independent voters can vote in the August primary election. How likely are you to vote in the August primary election? (Asked only to respondents who self-identified as independent or unaffiliated voters) Extremely likely....................................................... 67% Very likely............................................................... 14% Somewhat likely...................................................... 19% T3. And if the primary election were being held today, would you choose to vote in the Democrat primary or the Republican primary? (Asked only to respondents who self- identified as independent or unaffiliated voters) Republican primary............................................... 100%
-
Upload
lisadepasquale -
Category
Documents
-
view
895 -
download
0
description
Arizona Republican Primary Survey Topline Results 071114
Transcript of Arizona Republican Primary Survey Topline Results 071114

!!!!!Arizona Republican Primary Survey Topline Results Magellan Strategies are pleased to present the topline results for a 593n autodial survey of likely Republican primary voters, and independent and unaffiliated voters that are likely to vote in the Republican primary election in the state of Arizona. The interviews were conducted July 9th and 10th, 2014. This survey has a margin of error of +/- 4.02% at the 95 percent confidence interval. This survey was weighted based upon past Republican primary election voting demographics.
T1. Are you registered to vote as a Republican, a Democrat or an independent voter? Republican .............................................................. 79% Independent ............................................................ 21%
T2. As you may know, independent voters can vote in the August primary election. How likely are you to vote in the August primary election? (Asked only to respondents who self-identified as independent or unaffiliated voters) Extremely likely ....................................................... 67% Very likely ............................................................... 14% Somewhat likely ...................................................... 19%
T3. And if the primary election were being held today, would you choose to vote in the Democrat primary or the Republican primary? (Asked only to respondents who self- identified as independent or unaffiliated voters) Republican primary ............................................... 100%

Magellan ID#: AZREP-070914 Arizona Republican Primary Survey Topline Results Field Dates: 7/9/14 – 7/10/14, MoE +/- 4.02%, 593n, CONFIDENTIAL
Magellan Strategies | 1685 Boxelder St. Suite 300 | Louisville, CO 80027
www.MagellanStrategies.com | (303) 861-8585
2
T4. How likely are you to vote in the August primary election? (Asked only to respondents who self-identified as registered Republicans) Extremely likely ....................................................... 94% Very likely ................................................................. 4% Somewhat likely ........................................................ 2%
T5. Among the following list of issues, which do you think should be the top priority that the Republican nominee for Governor should be talking about the most? Illegal immigration .................................................. 39% Create jobs and grow our economy ........................ 23% Protecting our constitutional rights ........................... 9% Repealing Obamacare’s Medicaid expansion ............ 8% Government spending ............................................... 6% Repealing Common Core .......................................... 6% Energy issues ............................................................. 1% Unsure or no opinion ................................................ 8%
T6. Do you have a favorable or unfavorable opinion of Ken Bennett? Favorable ................................................................ 24% Unfavorable ........................................................... 16% No opinion ............................................................. 34% Never heard of ....................................................... 21% Unsure ...................................................................... 5% Name ID ................................................................ 74% Hard name ID ......................................................... 40%
T7. Do you have a favorable or unfavorable opinion of Doug Ducey? Favorable ................................................................ 44% Unfavorable ........................................................... 25% No opinion ............................................................. 24% Never heard of ......................................................... 4% Unsure ...................................................................... 3% Name ID ................................................................ 93% Hard name ID ......................................................... 69%

Magellan ID#: AZREP-070914 Arizona Republican Primary Survey Topline Results Field Dates: 7/9/14 – 7/10/14, MoE +/- 4.02%, 593n, CONFIDENTIAL
Magellan Strategies | 1685 Boxelder St. Suite 300 | Louisville, CO 80027
www.MagellanStrategies.com | (303) 861-8585
3
T8. Do you have a favorable or unfavorable opinion of Christine Jones?
Favorable ................................................................ 32% Unfavorable ........................................................... 36% No opinion ............................................................. 23% Never heard of ......................................................... 8% Unsure ...................................................................... 1% Name ID ................................................................ 91% Hard name ID ......................................................... 68%
T9. Do you have a favorable or unfavorable opinion of Scott Smith? Favorable ................................................................ 26% Unfavorable ........................................................... 19% No opinion ............................................................. 30% Never heard of ....................................................... 22% Unsure ...................................................................... 3% Name ID ................................................................ 75% Hard name ID ......................................................... 45%
T10. Do you have a favorable or unfavorable opinion of Tom Horne? Favorable ................................................................ 18% Unfavorable ........................................................... 61% No opinion ............................................................. 15% Never heard of ......................................................... 3% Unsure ...................................................................... 3% Name ID ................................................................ 94% Hard name ID ......................................................... 79%

Magellan ID#: AZREP-070914 Arizona Republican Primary Survey Topline Results Field Dates: 7/9/14 – 7/10/14, MoE +/- 4.02%, 593n, CONFIDENTIAL
Magellan Strategies | 1685 Boxelder St. Suite 300 | Louisville, CO 80027
www.MagellanStrategies.com | (303) 861-8585
4
T11. Do you have a favorable or unfavorable opinion of Mark Brnovich? Favorable .................................................................. 7% Unfavorable ............................................................. 9% No opinion ............................................................. 30% Never heard of ....................................................... 51% Unsure ...................................................................... 3% Name ID ................................................................ 46% Hard name ID ......................................................... 16%
T12. If the Republican primary election for Governor were being held today for whom would you vote if the candidates were Ken Bennett, Doug Ducey, Christine Jones, Frank Riggs, Scott Smith, and Andrew Thomas? Doug Ducey ........................................................... 26% Christine Jones ........................................................ 22% Scott Smith .............................................................. 14% Ken Bennett ............................................................ 11% Andrew Thomas ........................................................ 6% Frank Riggs ............................................................... 2% Undecided .............................................................. 19%
T13. If the Republican primary election for Attorney General were being held today for whom would you vote if the candidates were Tom Horne and Mark Brnovich? Mark Brnovich ........................................................ 39% Tom Horne ............................................................. 25% Undecided .............................................................. 36%
T14. If the Republican primary election for Secretary of State were being held today for whom would you vote if the candidates were Wil Cardon, Michele Reagan and Justin Pierce? Michele Reagan ...................................................... 21% Wil Cardon ............................................................. 17% Justin Pierce .............................................................. 9% Undecided ............................................................. 53%
Magellan ID#: AZREP-070914 Arizona Republican Primary Survey Topline Results Field Dates: 7/9/14 – 7/10/14, MoE +/- 4.02%, 593n, CONFIDENTIAL
Magellan Strategies | 1685 Boxelder St. Suite 300 | Louisville, CO 80027
www.MagellanStrategies.com | (303) 861-8585
5
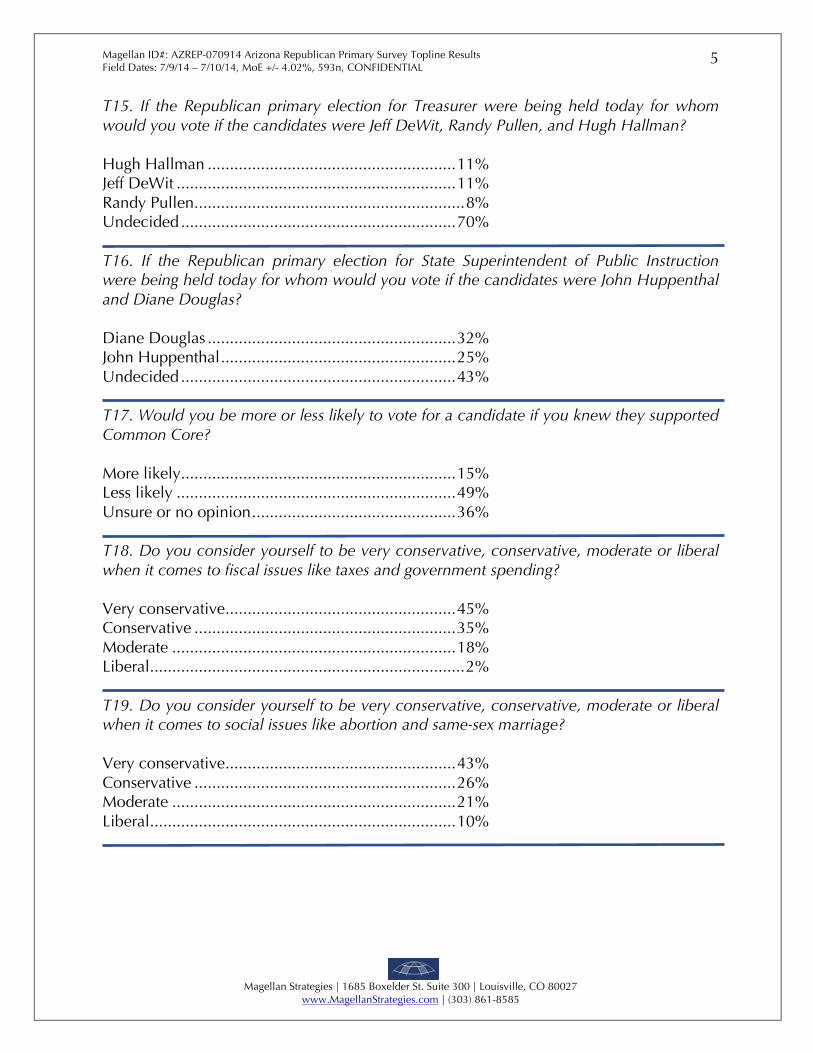
T15. If the Republican primary election for Treasurer were being held today for whom would you vote if the candidates were Jeff DeWit, Randy Pullen, and Hugh Hallman? Hugh Hallman ........................................................ 11% Jeff DeWit ............................................................... 11% Randy Pullen ............................................................. 8% Undecided .............................................................. 70%
T16. If the Republican primary election for State Superintendent of Public Instruction were being held today for whom would you vote if the candidates were John Huppenthal and Diane Douglas? Diane Douglas ........................................................ 32% John Huppenthal ..................................................... 25% Undecided .............................................................. 43%
T17. Would you be more or less likely to vote for a candidate if you knew they supported Common Core? More likely .............................................................. 15% Less likely ............................................................... 49% Unsure or no opinion .............................................. 36%
T18. Do you consider yourself to be very conservative, conservative, moderate or liberal when it comes to fiscal issues like taxes and government spending? Very conservative .................................................... 45% Conservative ........................................................... 35% Moderate ................................................................ 18% Liberal ....................................................................... 2%
T19. Do you consider yourself to be very conservative, conservative, moderate or liberal when it comes to social issues like abortion and same-sex marriage? Very conservative .................................................... 43% Conservative ........................................................... 26% Moderate ................................................................ 21% Liberal ..................................................................... 10%

Magellan ID#: AZREP-070914 Arizona Republican Primary Survey Topline Results Field Dates: 7/9/14 – 7/10/14, MoE +/- 4.02%, 593n, CONFIDENTIAL
Magellan Strategies | 1685 Boxelder St. Suite 300 | Louisville, CO 80027
www.MagellanStrategies.com | (303) 861-8585
6
T20. If you had to choose, would you identify yourself more closely with the traditional Republican Party, or would you identify yourself more closely with the Tea Party Movement? Traditional Republican party ................................... 43% Tea Party Movement ............................................... 47% No opinion ............................................................. 10%
And now I have a couple of questions for statistical purposes only… T21. Are you a man or a woman? Woman ................................................................... 52% Man ........................................................................ 48%
T22. What is your marital status? Married ................................................................... 66% Single and have never been married ......................... 7% Unmarried and living with a partner ......................... 3% Widowed ................................................................ 13% Separated .................................................................. 1% Divorced ................................................................... 8% No opinion ............................................................... 2%
T23. Which of the following age groups applies to you? 18-34 ........................................................................ 7% 35-44 ...................................................................... 10% 45-54 ...................................................................... 19% 55-64 ...................................................................... 23% 65+ ......................................................................... 41%
T24. For statistical purposes only, what is your race? Press 1 if you are white, Press 2 if you are Hispanic or Latino, press 3 if you belong to another ethnic group. White ...................................................................... 87% Hispanic or Latino ..................................................... 6% Another ethnic group ................................................ 7%

Magellan ID#: AZREP-070914 Arizona Republican Primary Survey Topline Results Field Dates: 7/9/14 – 7/10/14, MoE +/- 4.02%, 593n, CONFIDENTIAL
Magellan Strategies | 1685 Boxelder St. Suite 300 | Louisville, CO 80027
www.MagellanStrategies.com | (303) 861-8585
7
Survey Methodology This survey was conducted using automated telephone touchtone technology. The sample used for this survey was randomly drawn from an Arizona voter file. The survey response data was weighted based upon past Republican primary election voting demographics. The interviews were conducted on July 9th and 10th, 2014. Three attempts were made to interview each household in the sample. This survey has a margin of error of 4.02% at the 95 percent confidence interval.