ArduSoar: an Open-Source Thermalling Controller for ... · ArduSoar: an Open-Source Thermalling...
8
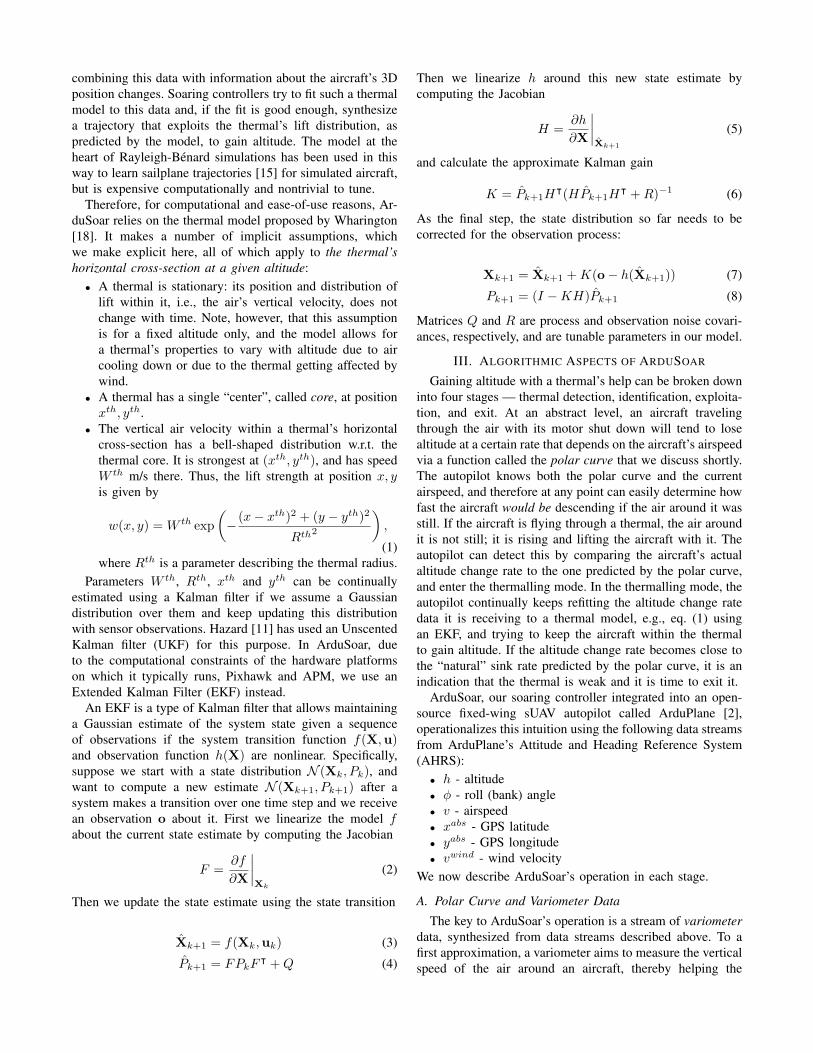
ArduSoar: an Open-Source Thermalling Controller for Resource-Constrained Autopilots Samuel Tabor Glasgow, Scotland [email protected] Iain Guilliard Australian National University Canberra, Australia [email protected] Andrey Kolobov Microsoft Research Redmond, WA-98052 [email protected] Abstract— Autonomous soaring capability has the potential to significantly increase time aloft for fixed-wing UAVs. In this paper, we introduce ArduSoar, the first soaring controller integrated into a major autopilot software suite for small UAVs. We describe ArduSoar from the algorithmic standpoint, outline its integration with the ArduPlane autopilot, discuss parameter tuning for it, and conduct a series of flight tests on real sUAVs that show ArduSoar’s robustness even in highly non- ideal atmospheric conditions. I. I NTRODUCTION Autonomous soaring has long been considered for its promise of extending the range and time in the air for Uninhabited Aerial Vehicles (UAVs). These two UAV char- acteristics are crucial in a range of scenarios from aerial mapping to crop monitoring to package delivery, and are currently constrained by the UAV’s powerplant and the limited energy available onboard. Exploiting the energy of the moving air masses has the potential to increase fixed- wing drone range by many times [4]. While there are many atmospheric phenomena that can help an aircraft gain altitude without the help of a motor, the most ubiquitous of them are thermals, rising plumes of air generated by certain areas on the ground giving up heat. Including the first feasibility study of autonomous ther- malling in 1998 [18], researchers have proposed at least 5 approaches to modeling thermals computationally and soaring in them, evaluating these techniques in simulation [18, 11, 15] and in live tests [5, 8, 7]. Each has a significant number of intricacies related to implementation and param- eter tuning. Since none of the implementations, written in different languages and for different platforms and setups, are publicly available, none of these techniques have been systematically compared against each other. This paper introduces a soaring controller called ArduSoar and describes its implementation as part of a popular open- source small-UAV (sUAV) autopilot system, ArduPilot [1]. ArduPilot can be built for many popular autopilot hardware platforms and run even on the most resource-constrained of them, including Pixhawk [3], APM, and a software-in- the-loop simulation. Being part of an open-source project, ArduSoar’s software components can be reused or inspected to serve as an inspiration, basis or benchmark for other soaring controller designs. We also present a live evalua- tion of ArduSoar showing its robust behavior in different Fig. 1: Rayleigh-B´ enard convection simulation showing two rising thermal plumes (red color indicates hotter air). The lower boundary of the simulation heats the adjacent air hotter than the ambient air temperature. The hotter air gains buoyancy and rises in turbulent plumes to mix with the cooler air above. The small black vertical bars indicate vertical air speed at an altitude and show the typical bell shaped distribution of uplift through the center of a thermal. environmental conditions. II. SOARING,THERMALS,THERMAL ESTIMATION Soaring usually refers to process of using a rising air mass to gain altitude by birds and aircraft. Technically, while in dynamic soaring the source of lift is a wind gradient [14], not rising air, here we focus on static soaring, which always relies on air being pushed upwards in some way. The most commonly encountered type of rising air regions is a thermal. Thermals start immediately above parts of Earth’s surface that accumulate more heat than surrounding areas, e.g. asphalt or plowed fields, and then emit the heat back into the atmosphere, warming up the air above them. They are invisible, but are frequently pictured as air columns, possibly slanted due to wind. Vertical air velocity in the center of such a column is higher, becomes lower towards the column fringes, and eventually turns into sink. In reality and even under realistic simulation models, thermals do not always conform to this idealized concept. Figure 1 is a screenshot from a Rayleigh-B´ enard simulation (see, e.g., Kadanoff [12]), a standard high-fidelity convection model that gives a more accurate idea of thermals’ irregular and chaotic nature. In all existing work on autonomous soaring in thermals, autopilots/soaring controllers use thermal models that can be estimated by observing the aircraft’s vertical air velocity and arXiv:1802.08215v2 [cs.RO] 21 Aug 2018
Transcript of ArduSoar: an Open-Source Thermalling Controller for ... · ArduSoar: an Open-Source Thermalling...

ArduSoar: an Open-Source Thermalling Controllerfor Resource-Constrained Autopilots
Samuel TaborGlasgow, Scotland
Iain GuilliardAustralian National University
Canberra, [email protected]
Andrey KolobovMicrosoft Research
Redmond, [email protected]
Abstract— Autonomous soaring capability has the potentialto significantly increase time aloft for fixed-wing UAVs. Inthis paper, we introduce ArduSoar, the first soaring controllerintegrated into a major autopilot software suite for small UAVs.We describe ArduSoar from the algorithmic standpoint, outlineits integration with the ArduPlane autopilot, discuss parametertuning for it, and conduct a series of flight tests on realsUAVs that show ArduSoar’s robustness even in highly non-ideal atmospheric conditions.
I. INTRODUCTION
Autonomous soaring has long been considered for itspromise of extending the range and time in the air forUninhabited Aerial Vehicles (UAVs). These two UAV char-acteristics are crucial in a range of scenarios from aerialmapping to crop monitoring to package delivery, and arecurrently constrained by the UAV’s powerplant and thelimited energy available onboard. Exploiting the energy ofthe moving air masses has the potential to increase fixed-wing drone range by many times [4]. While there are manyatmospheric phenomena that can help an aircraft gain altitudewithout the help of a motor, the most ubiquitous of them arethermals, rising plumes of air generated by certain areas onthe ground giving up heat.
Including the first feasibility study of autonomous ther-malling in 1998 [18], researchers have proposed at least5 approaches to modeling thermals computationally andsoaring in them, evaluating these techniques in simulation[18, 11, 15] and in live tests [5, 8, 7]. Each has a significantnumber of intricacies related to implementation and param-eter tuning. Since none of the implementations, written indifferent languages and for different platforms and setups,are publicly available, none of these techniques have beensystematically compared against each other.
This paper introduces a soaring controller called ArduSoarand describes its implementation as part of a popular open-source small-UAV (sUAV) autopilot system, ArduPilot [1].ArduPilot can be built for many popular autopilot hardwareplatforms and run even on the most resource-constrainedof them, including Pixhawk [3], APM, and a software-in-the-loop simulation. Being part of an open-source project,ArduSoar’s software components can be reused or inspectedto serve as an inspiration, basis or benchmark for othersoaring controller designs. We also present a live evalua-tion of ArduSoar showing its robust behavior in different
Fig. 1: Rayleigh-Benard convection simulation showing two risingthermal plumes (red color indicates hotter air). The lower boundaryof the simulation heats the adjacent air hotter than the ambient airtemperature. The hotter air gains buoyancy and rises in turbulentplumes to mix with the cooler air above. The small black verticalbars indicate vertical air speed at an altitude and show the typicalbell shaped distribution of uplift through the center of a thermal.
environmental conditions.
II. SOARING, THERMALS, THERMAL ESTIMATION
Soaring usually refers to process of using a rising air massto gain altitude by birds and aircraft. Technically, while indynamic soaring the source of lift is a wind gradient [14],not rising air, here we focus on static soaring, which alwaysrelies on air being pushed upwards in some way.
The most commonly encountered type of rising air regionsis a thermal. Thermals start immediately above parts ofEarth’s surface that accumulate more heat than surroundingareas, e.g. asphalt or plowed fields, and then emit the heatback into the atmosphere, warming up the air above them.They are invisible, but are frequently pictured as air columns,possibly slanted due to wind. Vertical air velocity in thecenter of such a column is higher, becomes lower towardsthe column fringes, and eventually turns into sink. In realityand even under realistic simulation models, thermals donot always conform to this idealized concept. Figure 1 isa screenshot from a Rayleigh-Benard simulation (see, e.g.,Kadanoff [12]), a standard high-fidelity convection modelthat gives a more accurate idea of thermals’ irregular andchaotic nature.
In all existing work on autonomous soaring in thermals,autopilots/soaring controllers use thermal models that can beestimated by observing the aircraft’s vertical air velocity and
arX
iv:1
802.
0821
5v2
[cs
.RO
] 2
1 A
ug 2
018
combining this data with information about the aircraft’s 3Dposition changes. Soaring controllers try to fit such a thermalmodel to this data and, if the fit is good enough, synthesizea trajectory that exploits the thermal’s lift distribution, aspredicted by the model, to gain altitude. The model at theheart of Rayleigh-Benard simulations has been used in thisway to learn sailplane trajectories [15] for simulated aircraft,but is expensive computationally and nontrivial to tune.
Therefore, for computational and ease-of-use reasons, Ar-duSoar relies on the thermal model proposed by Wharington[18]. It makes a number of implicit assumptions, whichwe make explicit here, all of which apply to the thermal’shorizontal cross-section at a given altitude:
• A thermal is stationary: its position and distribution oflift within it, i.e., the air’s vertical velocity, does notchange with time. Note, however, that this assumptionis for a fixed altitude only, and the model allows fora thermal’s properties to vary with altitude due to aircooling down or due to the thermal getting affected bywind.
• A thermal has a single “center”, called core, at positionxth, yth.
• The vertical air velocity within a thermal’s horizontalcross-section has a bell-shaped distribution w.r.t. thethermal core. It is strongest at (xth, yth), and has speedW th m/s there. Thus, the lift strength at position x, yis given by
w(x, y) = W th exp
(− (x− xth)2 + (y − yth)2
Rth2
),
(1)where Rth is a parameter describing the thermal radius.
Parameters W th, Rth, xth and yth can be continuallyestimated using a Kalman filter if we assume a Gaussiandistribution over them and keep updating this distributionwith sensor observations. Hazard [11] has used an UnscentedKalman filter (UKF) for this purpose. In ArduSoar, dueto the computational constraints of the hardware platformson which it typically runs, Pixhawk and APM, we use anExtended Kalman Filter (EKF) instead.
An EKF is a type of Kalman filter that allows maintaininga Gaussian estimate of the system state given a sequenceof observations if the system transition function f(X,u)and observation function h(X) are nonlinear. Specifically,suppose we start with a state distribution N (Xk, Pk), andwant to compute a new estimate N (Xk+1, Pk+1) after asystem makes a transition over one time step and we receivean observation o about it. First we linearize the model fabout the current state estimate by computing the Jacobian
F =∂f
∂X
∣∣∣∣Xk
(2)
Then we update the state estimate using the state transition
Xk+1 = f(Xk,uk) (3)
Pk+1 = FPkFᵀ +Q (4)
Then we linearize h around this new state estimate bycomputing the Jacobian
H =∂h
∂X
∣∣∣∣Xk+1
(5)
and calculate the approximate Kalman gain
K = Pk+1Hᵀ(HPk+1H
ᵀ +R)−1 (6)
As the final step, the state distribution so far needs to becorrected for the observation process:
Xk+1 = Xk+1 +K(o− h(Xk+1)) (7)
Pk+1 = (I −KH)Pk+1 (8)
Matrices Q and R are process and observation noise covari-ances, respectively, and are tunable parameters in our model.
III. ALGORITHMIC ASPECTS OF ARDUSOAR
Gaining altitude with a thermal’s help can be broken downinto four stages — thermal detection, identification, exploita-tion, and exit. At an abstract level, an aircraft travelingthrough the air with its motor shut down will tend to losealtitude at a certain rate that depends on the aircraft’s airspeedvia a function called the polar curve that we discuss shortly.The autopilot knows both the polar curve and the currentairspeed, and therefore at any point can easily determine howfast the aircraft would be descending if the air around it wasstill. If the aircraft is flying through a thermal, the air aroundit is not still; it is rising and lifting the aircraft with it. Theautopilot can detect this by comparing the aircraft’s actualaltitude change rate to the one predicted by the polar curve,and enter the thermalling mode. In the thermalling mode, theautopilot continually keeps refitting the altitude change ratedata it is receiving to a thermal model, e.g., eq. (1) usingan EKF, and trying to keep the aircraft within the thermalto gain altitude. If the altitude change rate becomes close tothe “natural” sink rate predicted by the polar curve, it is anindication that the thermal is weak and it is time to exit it.
ArduSoar, our soaring controller integrated into an open-source fixed-wing sUAV autopilot called ArduPlane [2],operationalizes this intuition using the following data streamsfrom ArduPlane’s Attitude and Heading Reference System(AHRS):
• h - altitude• φ - roll (bank) angle• v - airspeed• xabs - GPS latitude• yabs - GPS longitude• vwind - wind velocity
We now describe ArduSoar’s operation in each stage.
A. Polar Curve and Variometer Data
The key to ArduSoar’s operation is a stream of variometerdata, synthesized from data streams described above. To afirst approximation, a variometer aims to measure the verticalspeed of the air around an aircraft, thereby helping the

autopilot determine whether the aircraft is in a thermal. Inpractice, however, no onboard instrument has direct access tothe true vertical speed of the air. A variometer tries to deduceit from the aircraft’s own vertical speed w.r.t. the ground,which, in the case of a sailplane with its motor turned off,can be imparted by the sailplane being in a thermal or bypitching up or down.
Therefore, instead of measuring the vertical airspeed, weimplement a variometer that measures the rate of change ofa sailplane’s total specific energy. It is obtained by dividingthe total energy of a sailplane in a glide (i.e. with the motoroff, if present),
E = mgh+1
2mv2, (9)
by mg and differentiating w.r.t. time. The result is
e = h+vv
g(10)
Note that the measurement units of e are m/s. Computingvariometer data involves estimating h and v, which can beapproximated by ∆e
∆t computed using successive h and v datapoints from the altitude and airspeed data streams.
To recover the true vertical speed of the air mass sur-rounding the sailplane, we need to further correct e withthe aircraft’s natural sink at its current airspeed v and bankangle φ. This corrected variometer is known as a nettovariometer, and has a value of 0 m/s in a steady glidethrough still air. The sink rate can be derived from thesailplane’s aforementioned drag polar curve and is given by
vz(v, φ) = v
(CD0
CL+
BCL
cos2 φ
), (11)
where
CL =K
v2. (12)
In these expressions, v is the current airspeed, φ the bankangle, and CD0, K, and B are airframe-specific constants.Of these,
K =2mg
ρAwing, (13)
where m is the sUAV’s mass, Awing is its wing area, and ρis the air density for the sUAV’s operating conditions. CD0
and B need to be determined by fitting them to flight datausing Equation 11.
The netto variometer signal can then be defined as:
enet = e+ vz(v, φ) (14)
B. Thermal Detection
ArduSoar constantly monitors a first order low-pass-filtered version of enet:
efiltn = Tcenet + (1−Tc) efiltn−1 (15)
where Tc = 0.03. When efilt exceeds a manually settablethreshold (parameter SOAR VSPEED in ArduSoar’s implemen-tation), ArduSoar switches to the thermalling mode. Usingthis filtered version of the vario signal helps to removeturbulence which might otherwise trigger the algorithm.
C. Thermal Identification and Exploitation
ArduSoar naturally interleaves these two stages: it usesobservation data — variometer readings associated with GPSlocations — to update its distribution over possible thermalparameters, and at the same time chooses its trajectory — acircle centered at a location x0, y0 of radius Rth — basedon the thermal parameter distribution.
Recall from Equation 1 that ArduSoar’s thermal modelhas 4 parameters that need to be estimated: W th, Rth,xth and yth. We make the following simplifying assumption:
Given wind velocity vector ~vwind, aircraft velocity vector~va, and aircraft and thermal center locations ~pa and ~pth inthe Earth reference frame, after time dt their locations inthe Earth reference frame are ~pa = ~pa
′+ (~vwind + ~va)dt
and ~pth′
= ~pth + ~vwinddt respectively.
In other words, we assume that the aircraft and the thermallocation are affected by wind in the same way. This isn’tcompletely accurate [17], because thermals tend to moveslower than the surrounding air mass. Nonetheless, for smalldt, i.e., high re-estimation frequency, it is a very goodapproximation of reality. Moreover, it allows us to easilycarry out all calculations in the aircraft’s reference frame,since, under this assumption, the relative displacement of thethe aircraft and the thermal is entirely due to the aircraft’svelocity vector.
As in Hazard [11], we define the aircraft to be at the originof its own reference frame, which in turn lets us define
Thermal state X =
W th
Rth
xy
=
StrengthRadius
Center dist. north of sUAVCenter dist. east of sUAV
(16)
Recall that state tracking with an EKF involves updatingthe current state distribution’s mean with a linearizationof the transition function f (Equation 2) and observationfunction h (Equation 5). In our case, assuming that theaircraft has travelled distance dx to the north and dy to theeast during a given time step,
Xk+1 = f(Xk) = Xk +
00−dx−dy
. (17)
Note that we have direct access only to the sUAV’s GPSpositions xabs, yabs in the Earth reference frame. Since thesUAV can be affected by wind, dx 6= ∆xabs and dy 6= ∆yabs
for two successive xabs (resp. yabs) measurements. Rather,
dx = ∆xabs − vwindx (18)
dy = ∆yabs − vwindy , (19)
i.e., we need to perform wind correction to obtain thermalmotion w.r.t. the aircraft.
Since f(Xk) effectively has no process dynamics, we get
F =∂f
∂X=∂Xk+1
∂X=
1 0 0 00 1 0 00 0 1 00 0 0 1
= I (20)
For the observation function, the only readings relevant tothe thermal state vector that we get is vertical air velocity wat the aircraft’s position w.r.t. the thermal center, so
o = w = h(X) = W thexp
(−x
2 + y2
Rth2
)(21)
and
Hᵀ =∂h
∂X
ᵀ
=
exp
(−x2+y2
Rth2
)2W th(x2+y2)
Rth3 exp(−x2+y2
Rth2
)2W thxRth2 exp
(−x2+y2
Rth2
)2W thy
Rth2 exp(−x2+y2
Rth2
)
(22)
Note two aspects that make ArduSoar’s EKF update extraefficient:
• Due to Equation 20, covariance update (Equation 4)becomes simply Pk+1 = Pk +Q.
• Since our observation vector has only a single com-ponent, vertical air velocity, and ∂h
∂X is a 1 × 4vector (Equation 22), it follows that in Equation 6(HPk+1H
ᵀ + R) is a scalar value and the inversionduring Kalman gain computation reduces to a singledivision.
ArduSoar’s EKF update runs at 5Hz, giving ArduSoar astream of thermal parameter estimates. In order to use thisinformation to gain height, ArduSoar enters the autopilot intothe LOITER mode (see the next section), in which ArduPlaneensures that the aircraft orbits a specified location in a circleof a specified radius. ArduSoar sets (x, y) from the meanthermal estimate to be the center of this circle, but settingthe radius R is less straightforward.
In theory, using the mean Rth estimate, ArduSoar couldchoose R to strike the optimal balance between estimatedlift R meters away from the thermal center and the lift lossdue to bank angle required to stay in a turn of radius R. Inpractice, however, we made R a manually settable parameterfor ArduSoar, for reasons described in Section V-C.
D. Thermal Exit
ArduSoar constantly monitors the strength of the thermalto decide whether to exit and search for a better thermal. Itis assumed that the sailplane is currently circling the thermal
center at distance R, and a lift estimate at this distance iscalculated using Equation 1. The estimate is then adjustedusing a constant correction factor, Ksink, representing sinkfrom the drag polar and bank angle. Thus, ArduSoar com-putes W thexp
(−x2+y2
R2
)−Ksink, and compares it against
the same SOAR VSPEED threshold as in the thermal entrylogic to determine if the thermal has become too weak tocontinue with. Note that this exit condition doesn’t rely onthe actual lift measurements, only on those predicted by thethermal model. This approach has the advantage over othermethods [5, 8] of not being overly sensitive to the speed ofthe controller’s response to fluctuations in thermal size andposition.
IV. ARDUPLANE INTEGRATION
Although a soaring controller can enable a sUAV tostay aloft by extracting energy from the atmosphere, perse it lacks a lot of the useful functionality of a full-blownautopilot, including an AHRS system for estimating aircraftstate, waypoint following capability, safety mechanisms suchas geofencing, etc. Integrating ArduSoar into ArduPlaneresulted in a flight controller for fixed-wing sUAVs thathas the rich feature set of a major open-source autopilot inaddition to thermalling functionality.
To integrate ArduSoar into ArduPlane, we have augmentedArduPlane with a number of parameters configurable via aground control station. Some of them, such as SOAR VSPEED,pertain to ArduSoar itself, while the rest control ArduSoar’sinteroperation with ArduPlane as shown in Figure 2. Thefull list of ArduSoar’s parameters is given in Table I in theAppendix.
In particular, ArduPlane has two modes relevant to Ardu-Soar, AUTO and LOITER. In AUTO mode, given a set ofwaypoints, a target airspeed, and several other parameters,ArduPlane’s default behavior is to fly the aircraft fullyautonomously, following the specified waypoint course. InLOITER mode, ArduPlane’s default behavior is to orbit apoint with specified GPS coordinates at a specified radius.We modified ArduPlane’s AUTO mode to opportunisticallyuse thermalling functionality as shown in Figure 2. If theaircraft just took off or if it descended to the altitude givenby the new SOAR ALT MIN parameter (segment 1 of the flightin Figure 2), it climbs under motor to SOAR ALT CUTOFF
altitude (segment 2 in Figure 2) while following pre-setwaypoints. Upon reaching SOAR ALT CUTOFF, it turns offthe motor and glides down at ArduPlane’s target airspeed(segment 3). During this stage, ArduSoar keeps monitoringthe aircraft state. If it detects a thermal, it takes overnavigational control and starts thermalling by putting theaircraft into LOITER mode (segment 4 in Figure 2). Thepoint ArduSoar commands the aircraft to orbit is the currentmean of the thermal center estimate, (xth, yth). The radius isgiven by a special ArduPlane parameter for LOITER modecalled WP LOITER RAD. While thermalling, the aircraft doesnot follow its waypoint course and may deviate from it.It may also reach an altitude given by the SOAR ALT MAX
parameter. This safety parameter terminates thermalling to

Fig. 2: A fixed-wing sUAV’s typical flight profile under Ardu-Plane’s control with ArduSoar enabled. The sUAV spends much ofits flight gliding down with its motor off (flight segment #1). If itdescends to a preset minimum altitude specified by ArduPlane’sSOAR ALT MIN parameter, it turns the motor on and climbs toSOAR ALT CUTOFF altitude (segment #2). Then it turns the motor offand resumes the glide (segment #3). If during the glide it detects athermal, it activates ArduSoar to exploit it (segment 4). If it reachesa preset altitude limit SOAR ALT MAX in this way, it quits thermallingand starts gliding again (segment #5).
Fig. 3: Radian Pro with the canopy removed to show the electronicequipment bay.
prevent the aircraft from climbing too high. At that point,ArduSoar stops thermalling, gives navigational control backto ArduPlane, and the aircraft starts another motorless glide(segment 5). This process can repeat many times without anyhuman intervention.
V. FLIGHT TESTING
The goal of flight testing was validation of ArduSoar’sability to gain altitude under a variety of real thermallingconditions. As a preliminary step, we estimated polar curveparameters of a Parkzone Radian Pro, a popular remote-controlled sailplane that served as our sUAV testbed, andtuned parameters affecting ArduSoar’s performance. The filewith all these parameters, whose estimation is outlined be-low, is available at https://github.com/Microsoft/Frigatebird.
0 20 40 60 80 100
Thermal radius, Rth (m)
0.0
0.2
0.4
0.6
0.8
1.0
1.2
1.4
Ver
tica
lsp
eed
(m/s
)
10m
15m
20m
optimal loiter radius
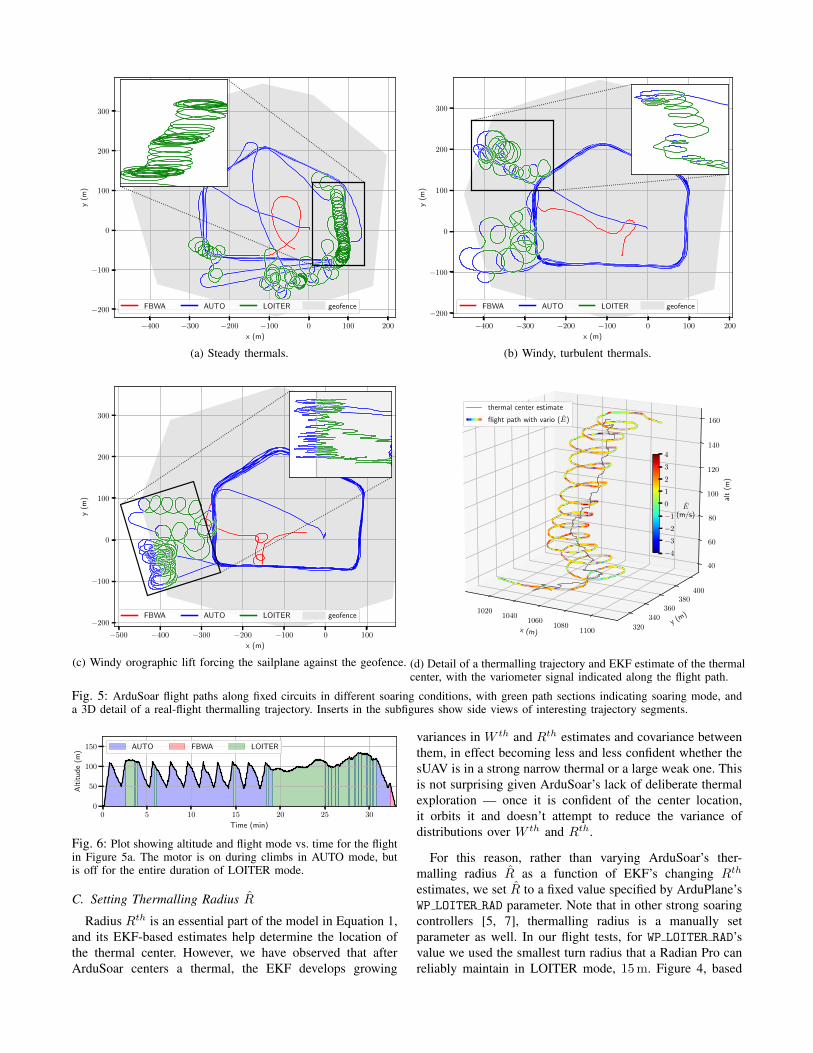
Fig. 4: Soaring performance trade-off for 3 fixed loiter radii overa wide range of thermal sizes (Rth) with W th = 2.5 m/s. Foreach thermal radius Rth, the optimal loiter radius – one that resultsin the highest altitude gain rate rate when taking into account thesUAV’s bank angle – is presented for comparison. Among fixedloiter radii, 15 m offers the best overall performance.
A. Equipment
Our Radian Pro was equipped with a 3DR Pixhawk flightcontroller hardware (32-bit ARM processor, 256KB RAM,2MB flash memory, 168MHz clock speed), a 3DR GPSand compass, a 3DR pitot/static tube and a sensor, a 3DR915MHz telemetry radio, and a FrSky X8R receiver. Theremote pilot could intervene at any point using a FrSkyX9D+ 2.4GHz transmitter. The equipment diagram is shownin Figure 3.
B. Setting ArduSoar’s Parameters
The polar curve was estimated by conducting test glidesin calm air. ArduPlane’s AUTO mode was used to track atarget airspeed around a triangular course, for a range oftarget airspeeds. The descent rate was measured for each, andArduSoar parameters SOAR POLAR B and SOAR POLAR CD0
representing constants B and CD0 in Equation 11 wereestimated from the resulting data using a least squares fit ofthat equation [6]. SOAR POLAR K, corresponding to constantK in Equations 12 and 13, was determined directly fromthe wing measurements and weight of the Radian Pro, andρ = 1.225 kg/m3 was assumed since all flight testing wasconducted near sea level.
Controller tuning required deriving estimates of vari-ometer measurement noise R = [SOAR R2], initial statevalues and variances xinit and Pinit and state processnoise Q = diag(SOAR Q12, SOAR Q22, SOAR Q22, SOAR Q22),where SOAR R, SOAR Q1 and SOAR Q2 are ArduSoar pa-rameters. SOAR R captures variations in vario readings dueto actual measurement noise, unmodelled aircraft dynamicsand turbulence, and was therefore taken as the variance inreadings during circling flight in turbulent air.
The elements of Q are selected to give good filter responsecharacteristics in steady-state thermalling. The strength andradius estimates should change slowly (on the order of theperiod of thermal orbit) relative to the position estimates.
−400 −300 −200 −100 0 100 200
x (m)
−200
−100
0
100
200
300
y(m
)
FBWA AUTO LOITER geofence
(a) Steady thermals.
−400 −300 −200 −100 0 100 200
x (m)
−200
−100
0
100
200
300
y(m
)
FBWA AUTO LOITER geofence
(b) Windy, turbulent thermals.
−500 −400 −300 −200 −100 0 100
x (m)
−200
−100
0
100
200
300
y(m
)
FBWA AUTO LOITER geofence
(c) Windy orographic lift forcing the sailplane against the geofence.
x (m)
10201040
10601080
1100y (m
)
320
340360
380400
alt
(m)
40
60
80
100
120
140
160
thermal center estimate
flight path with vario (E)
−4
−3
−2
−1
0
1
2
3
4
E(m/s)
(d) Detail of a thermalling trajectory and EKF estimate of the thermalcenter, with the variometer signal indicated along the flight path.
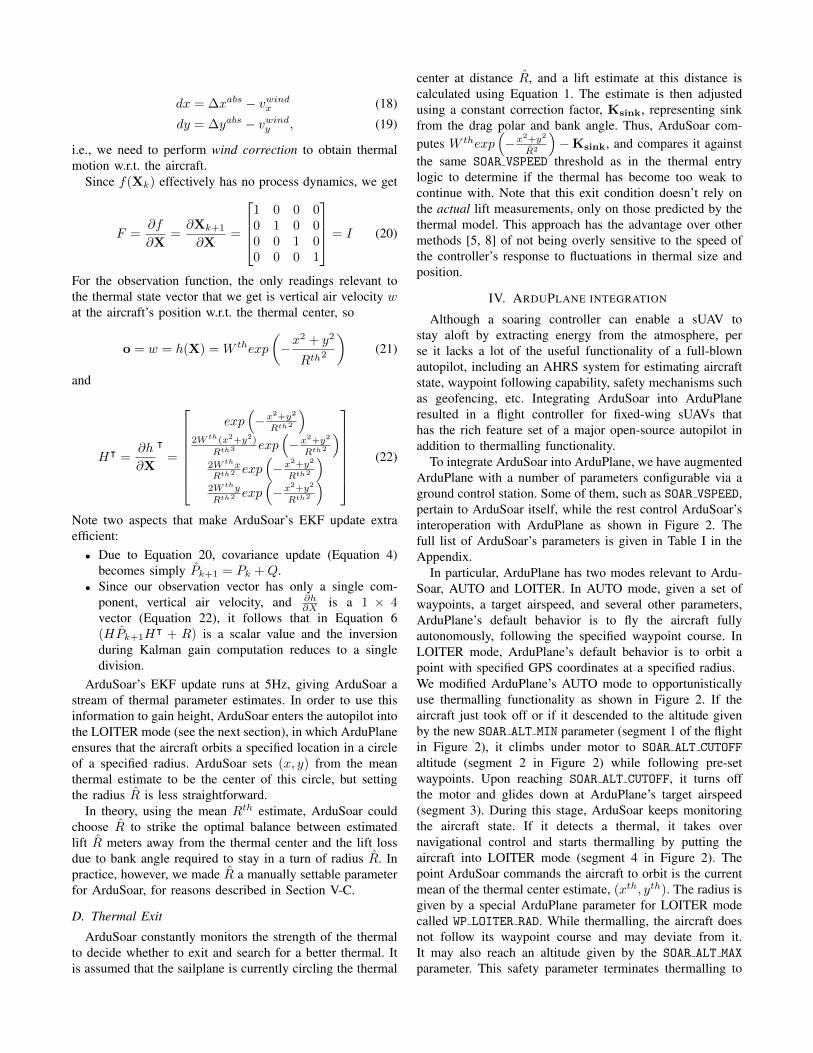
Fig. 5: ArduSoar flight paths along fixed circuits in different soaring conditions, with green path sections indicating soaring mode, anda 3D detail of a real-flight thermalling trajectory. Inserts in the subfigures show side views of interesting trajectory segments.
0 5 10 15 20 25 30
Time (min)
0
50
100
150
Alt
itu
de
(m)
AUTO FBWA LOITER
Fig. 6: Plot showing altitude and flight mode vs. time for the flightin Figure 5a. The motor is on during climbs in AUTO mode, butis off for the entire duration of LOITER mode.
C. Setting Thermalling Radius R
Radius Rth is an essential part of the model in Equation 1,and its EKF-based estimates help determine the location ofthe thermal center. However, we have observed that afterArduSoar centers a thermal, the EKF develops growing
variances in W th and Rth estimates and covariance betweenthem, in effect becoming less and less confident whether thesUAV is in a strong narrow thermal or a large weak one. Thisis not surprising given ArduSoar’s lack of deliberate thermalexploration — once it is confident of the center location,it orbits it and doesn’t attempt to reduce the variance ofdistributions over W th and Rth.
For this reason, rather than varying ArduSoar’s ther-malling radius R as a function of EKF’s changing Rth
estimates, we set R to a fixed value specified by ArduPlane’sWP LOITER RAD parameter. Note that in other strong soaringcontrollers [5, 7], thermalling radius is a manually setparameter as well. In our flight tests, for WP LOITER RAD’svalue we used the smallest turn radius that a Radian Pro canreliably maintain in LOITER mode, 15 m. Figure 4, based

on thermal simulation, demonstrates the trade-off in soaringperformance versus loiter radius and shows that this loiterradius value works well across a wide range of thermals.This is not surprising. Intuitively, using the smallest turnradius a given sUAV supports in LOITER mode maximizesthe sUAV’s chances of exploiting small thermals while onlyinsignificantly affecting its ability to exploit large ones. Forlarge thermals, the sUAV is likely to enter them away fromthe center, in a relatively flat portion of the bell-shaped liftdistribution (Equation 1). In such a case, variometer readingscollected from flying a small-radius circle may look toosimilar, making it difficult to determine where the thermalcenter is and potentially causing ArduSoar to loiter in aregion of the thermal where lift is strong enough to stayin the thermal but that nonetheless is not near the actualthermal center. This results in the sUAV gaining altitude ata lower vertical speed than the thermal allows. Nonetheless,even in these situations the sUAV gains valuable potentialenergy.
D. Qualitative Results
With parameters set as above, we conducted dozens offlights to get a qualitative picture of the behavior of ArduSoarintegrated into ArduPlane in various soaring conditions. Mostof these flights were fully autonomous except landing: weset the Radian to follow fixed geofenced circuits along aset of waypoints in AUTO mode, from which the sailplanecould deviate if it encountered thermals (see Figure 2 andits caption in Section IV). In compliance with US FAAregulations, the flight altitudes were limited to ≈ 120 m (400ft) AGL in locations free of ground structures and to ≈120 m above structure height in the vicinity of structures.The flights took place from October 2017 to January 2018 inthe US Pacific Northwest. When scheduling flights, we didnot purposefully seek out days with favorable thermallingconditions. Indeed, all flights were carried out in at least2 m/s wind and temperatures not exceeding 14°C, with atleast partial cloud cover. At the same time, we avoided flyingduring rain. Overall, 21 flights resulting in catching at leastone thermal.
Figures 5a-5c show examples of resulting trajectories,with the AUTO-mode portion of the track, shown in blue,tracing out the main waypoint sequence, and the geofencedareas in grey. Figure 5a shows a flight in some of the bestconditions we encountered — steady thermals with somewind — where ArduSoar mostly produced stable helix-likethermalling trajectories (green sections of the path). Condi-tions in Figure 5b were significantly more challenging dueto thermals being irregular and turbulent, resulting in messypaths during thermalling that nonetheless yield altitude gains.Finally, conditions such as in Figure 5c’s pushed ArduSoarto the limits. Strong wind repeatedly pushed the sailplaneagainst the geofence, which forced it out of the soaringmode (LOITER), but once back within the geofenced areathe sailplane re-entered the soaring mode again and theprocess started again. In addition, the sailplane was likelyin orographic or even wave lift — note that it managed to
enter the soaring in a large area along the bottom left part ofthe geofence. Thus, ArduSoar’s thermal model was clearlyviolated in the flight in Figure 5c. In spite of this, ArduSoarstill managed to gain altitude in LOITER mode, as the insertin that figure shows.
Figure 6 depicts an example altitude versus time plotfor a flight with ArduSoar enabled. Although true param-eters of real-world thermals are nearly impossible to obtain,precluding definitive statements about ArduSoar’s absolutethermalling efficiency, this plot shows that ArduSoar canextend flight duration simply by using thermals to maintainaltitude, as well as by gaining it if the thermal is strongenough.
VI. RELATED WORK
Besides soaring in thermals, an algorithm closely resem-bling ArduSoar has been used successfully for soaring inorographic lift [9], generated by wind blowing into a verticalobstacle such a tree line or a hill and forcing the air to moveupwards. Although the true shape of a rising air mass inthis case can be almost arbitrary and is certainly far froma column, ArduSoar’s strategy of circling in order to staywithin the air mass is a valid approach to exploiting theseupdrafts.
The thermal model we use is due to Wharington et al[18], who uses it in a simulation-based proof-of-conceptreinforcement learning approach [16]. The same model withminor modification was subsequently used in thermal soaringalgorithms by Allen and Lin [5] and Edwards [8], whichdiffer in their approaches to model estimation. Like Ardu-Soar, both of them were flight-tested, but using a differenthardware platform (Piccolo). While Edwards [8]’s controlleris much too expensive for Pixhawk and ran on a laptop on theground during these tests, transmitting soaring commands viaa telemetry link, it managed to keep a sailplane in the air for5.3 hours continuously. On the other hand, Andersson et al.[7] provide a stability proof for a computationally lightweightcontroller based on Reichmann rules that can potentiallybe implemented on resource-constrained hardware such asPixhawk. Reddy et al. [15], like Wharington [18], present aproof-of-concept RL approach in simulation, but utilize themuch more detailed thermal simulation based on Rayleigh-Benard convection. Guilliard et al. [10] compare ArduSoarto another thermalling controller, POMDSoar, that generatesthermalling trajectories by approximately solving a POMDPand thereby explicitly plans for thermal exploration. Inturbulent conditions of Guilliard et al. [10]’s experimentsPOMDSoar outperformed ArduSoar, but critically relied onaccurate estimates of several additional airframe-specificparameters to do well, making POMDSoar more involvedto use in practice.
An efficient alternative means of thermal identification forsimulated autonomous thermalling is given by Hazard [11].This work derives a UKF-based thermal tracker and evaluatesit assuming various open-loop environment exploration poli-cies, such as flying a horizontal circular or sinusoidal pattern.ArduSoar uses Hazard’s insights regarding thermal tracking

using a KF variant. Another (extended) KF-based thermaltracker [13] uses a more sophisticated state dynamics modelthan ArduSoar, but is computationally more expensive as aresult, and fails to capture uncertainty correlations betweenthermal position and strength estimates, reflected in the off-diagonal terms in the P matrix of our estimator.
VII. CONCLUSIONS
We have presented ArduSoar, an embedded thermalsoaring controller that we implemented and tested in thecodebase of a popular open-source autopilot for fixed-wing sUAVs called ArduPlane. ArduSoar is based on a4-variable EKF-based estimator with simple state dynamicsto achieve a computational cost low enough for ArduSoarto be executable on highly resource-constrained droneautopilot hardware such as Pixhawk or even APM. Theimplementation demonstrates good performance and hasbeen used by several research groups and many individualsfor leisure, research and commercial purposes.
Acknowledgements. We would like to thank Rick Rogahn,Jim Piavis, Peter Braswell, and the ArduPilot developercommunity for their help in designing and testing ArduSoar’simplementation.
REFERENCES
[1] ArduPilot project website. http://www.ardupilot.org, .
[2] ArduPlane project website. http://ardupilot.org/plane/index.html, .
[3] Pixhawk project website. https://pixhawk.org/.
[4] M. Allen. Updraft model for development of au-tonomous soaring uninhabited air vehicles. In AIAA-2006.
[5] M.J. Allen and V. Lin. Guidance and control of anautonomous soaring UAV. Technical report, 2007.
[6] J. D. Anderson. Introduction to flight, 1989.[7] K. Andersson, I. Kaminer, V. Dobrokhodov, and V. Ci-
chella. Thermal centering control for autonomoussoaring; stability analysis and flight test results. Journalof Guidance, Control, and Dynamics, 35(3):963–975,2012.
[8] D. Edwards. Implementation details and flight testresults of an autonomous soaring controller. In AIAA-2008.
[9] A. Fisher, M. Marino, R. Clothier, S. Watkins, L. Peters,and J. L. Palmer. Emulating avian orographic soaringwith a small autonomous glider. Bioinspiration &Biomimetics, 11(1), 2016.
[10] I. Guilliard, R. Rogahn, J. Piavis, and A. Kolobov. Au-tonomous thermalling as a partially observable Markovdecision process. In RSS, 2018. URL https://arxiv.org/pdf/1805.09875.pdf.
[11] M. W. Hazard. Unscented kalman filter for thermalparameter identification. In AIAA-2010.
[12] L. P. Kadanoff. Turbulent heat flow: structures andscaling. Physics Today, 54(8):34–39, 2001.
[13] A. M. Kahn. Atmospheric thermal location estimation.Journal of Guidance, Control and Dynamics, 40, 2017.
[14] N. R. J. Lawrance and S. Sukkarieh. A guidance andcontrol strategy for dynamic soaring with a gliding uav.In ICRA-2009, pages 3632–3637.
[15] G. Reddy, A.Celani, T. J. Sejnowski, and M. Vergassola.Learning to soar in turbulent environments. In Proc. ofthe National Academy of Science (PNAS), 2016.
[16] R. S. Sutton and A. G. Barto. Reinforcement Learning:An Introduction. MIT Press, 1998.
[17] J. W. Telford. Convective plumes in a convective field.Journal of the Atmospheric Sciences, 27(3):347–358,1970.
[18] J. Wharington. Autonomous Control of Soaring Aircraftby Reinforcement Learning. Doctorate thesis, RoyalMelbourne Institute of Technology, Melbourne, Aus-tralia, 1998.
APPENDIX
Parameter name DescriptionSOAR ENABLE Enables or disables ArduSoar functionalitySOAR VSPEED A threshold for vertical air velocity that de-
termines whether the aircraft that observesair moving upwards at SOAR VSPEED shouldenter/exit the thermalling mode.
SOAR Q1 Standard deviation of the process noise forthermal strength
SOAR Q2 Standard deviation of the process noise forthermal position and radius
SOAR R Standard deviation of the observation noiseSOAR DIST AHEAD Initial guess of the distance to the thermal
center along the aircraft headingSOAR MIN THML S Minimum time the aircraft should keep try-
ing to soar once it has entered the ther-malling mode (LOITER), in seconds
SOAR MIN CRSE S Minimum time the aircraft should avoidentering the thermalling mode (LOITER)after it last exited it, in seconds
SOAR POLAR CD0 Polar curve parameter (see Equation 11)SOAR POLAR B Polar curve parameter (see Equation 11)SOAR POLAR K Polar curve parameter (see Equation 12)SOAR ALT MIN The minimum altitude above home position
at which soaring or off-motor gliding isallowed, in meters. If the aircraft descendsto SOAR ALT MIN, it turns on the motor andstarts climbing in AUTO mode.
SOAR ALT CUTOFF The altitude above home position, in meters,at which the aircraft turns off the motor aftera climb from SOAR ALT MIN (or from theground) and starts gliding in AUTO mode,trying to detect thermals.
SOAR ALT MAX The maximum altitude above home posi-tion, in meters, that the aircraft is allowedto reach. Upon reaching it, the aircraft exitsthe thermalling mode if necessary and startsa glide in AUTO mode.
TABLE I: Parameters of the ArduSoar controller settable inArduPlane.