Transforming Business @ the intersection of Marketing & Technology
The Intersection of Funding, Marketing, and Audience Diversity, Equity, and Inclusion
APRIL 2021
Zannie Voss, Glenn Voss, and Young Woong Park
Photo
Kim
Lees
on, c
opyri
ght S
MU M
eado
ws Sc
hool
of the
Arts
2
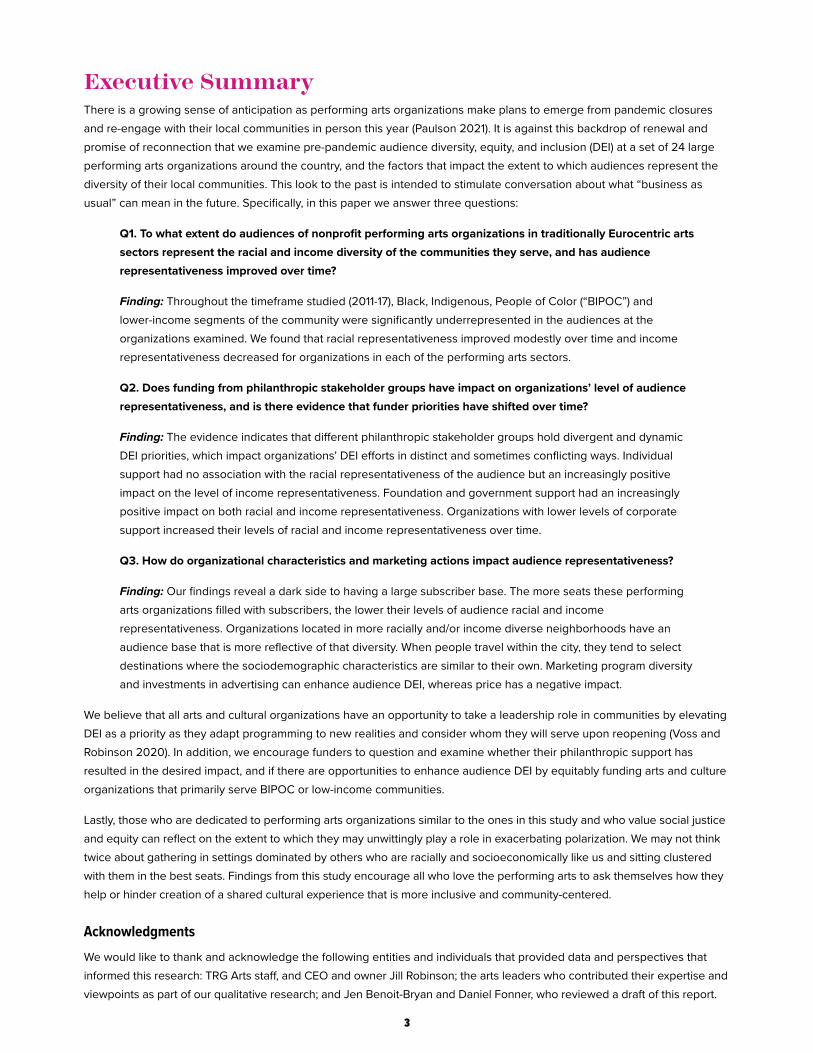
PrefaceThis research examines if and how donor priorities and an organization’s location, subscriber base, and marketing actions affect the extent to which audiences represent the diversity of the organization’s community. It is part of a series of recent publications intended to help arts and cultural organizations contend with the current crisis of systemic racism. It expands on a question raised in our white paper In It for the Long Haul, co-authored with Jill Robinson: “When we re-open, whom will we gather?” Audience diversity, equity, and inclusion (DEI) are anchored in the notion of community orientation, which surfaced as an essential cornerstone for attaining sustainability in the two-part series of reports on The Alchemy of High-Performing Arts Organizations, co-published with The Wallace Foundation.
SMU DataArts recognizes that our society is characterized by a complex web of inequities and we are committed to making research, tools, and resources accessible to all persons regardless of race, age, gender expression, sexual orientation, national origin, disability, and/or socioeconomic status. We strive to conduct our work without bias or preference and we value input and creativity from diverse perspectives. We use data and evidence to shine a light on both excellence and inequities within the arts and culture sector. We are committed to advancing equity, recognizing that it is a continuous process requiring ongoing input from the field, accountability, and evaluation.
Glossary of Key Terms1. Unpacking Diversity, Equity, and Inclusion
Diversity = degree of variety on any dimension
Equity = fair and equal access to participation opportunities
Inclusion = the extent to which participation rates reflect equity
2. Audience DEI = the extent to which the diversity of the served audience base reflects equitable participation
a. Racial representativeness = the extent to which the racial characteristics of the served customer base reflect equitable participation
b. Income representativeness = the extent to which the income characteristics of the served customer base reflect equitable participation
3. Homophily = the sociological principle that people prefer to congregate and share experiences with others whom they perceive to be similar to themselves
3
Executive SummaryThere is a growing sense of anticipation as performing arts organizations make plans to emerge from pandemic closures and re-engage with their local communities in person this year (Paulson 2021). It is against this backdrop of renewal and promise of reconnection that we examine pre-pandemic audience diversity, equity, and inclusion (DEI) at a set of 24 large performing arts organizations around the country, and the factors that impact the extent to which audiences represent the diversity of their local communities. This look to the past is intended to stimulate conversation about what “business as usual” can mean in the future. Specifically, in this paper we answer three questions:
Q1. To what extent do audiences of nonprofit performing arts organizations in traditionally Eurocentric arts sectors represent the racial and income diversity of the communities they serve, and has audience representativeness improved over time?
Finding: Throughout the timeframe studied (2011-17), Black, Indigenous, People of Color (“BIPOC”) and lower-income segments of the community were significantly underrepresented in the audiences at the organizations examined. We found that racial representativeness improved modestly over time and income representativeness decreased for organizations in each of the performing arts sectors.
Q2. Does funding from philanthropic stakeholder groups have impact on organizations’ level of audience representativeness, and is there evidence that funder priorities have shifted over time?
Finding: The evidence indicates that different philanthropic stakeholder groups hold divergent and dynamic DEI priorities, which impact organizations’ DEI efforts in distinct and sometimes conflicting ways. Individual support had no association with the racial representativeness of the audience but an increasingly positive impact on the level of income representativeness. Foundation and government support had an increasingly positive impact on both racial and income representativeness. Organizations with lower levels of corporate support increased their levels of racial and income representativeness over time.
Q3. How do organizational characteristics and marketing actions impact audience representativeness?
Finding: Our findings reveal a dark side to having a large subscriber base. The more seats these performing arts organizations filled with subscribers, the lower their levels of audience racial and income representativeness. Organizations located in more racially and/or income diverse neighborhoods have an audience base that is more reflective of that diversity. When people travel within the city, they tend to select destinations where the sociodemographic characteristics are similar to their own. Marketing program diversity and investments in advertising can enhance audience DEI, whereas price has a negative impact.
We believe that all arts and cultural organizations have an opportunity to take a leadership role in communities by elevating DEI as a priority as they adapt programming to new realities and consider whom they will serve upon reopening (Voss and Robinson 2020). In addition, we encourage funders to question and examine whether their philanthropic support has resulted in the desired impact, and if there are opportunities to enhance audience DEI by equitably funding arts and culture organizations that primarily serve BIPOC or low-income communities.
Lastly, those who are dedicated to performing arts organizations similar to the ones in this study and who value social justice and equity can reflect on the extent to which they may unwittingly play a role in exacerbating polarization. We may not think twice about gathering in settings dominated by others who are racially and socioeconomically like us and sitting clustered with them in the best seats. Findings from this study encourage all who love the performing arts to ask themselves how they help or hinder creation of a shared cultural experience that is more inclusive and community-centered.
AcknowledgmentsWe would like to thank and acknowledge the following entities and individuals that provided data and perspectives that informed this research: TRG Arts staff, and CEO and owner Jill Robinson; the arts leaders who contributed their expertise and viewpoints as part of our qualitative research; and Jen Benoit-Bryan and Daniel Fonner, who reviewed a draft of this report.
4
IntroductionWe live in a time of sociocultural and economic polarization, where structural racism, income inequality, and population diversity lead to intergroup conflict over who attains and retains power (Esteban and Ray 2011). Evidence of racism is pervasive: nearly twice the number of white supremacist propaganda incidents in 2020 compared to 2019 (Anti-Defamation League, 2021); a growing surge in hate crimes against Asian Americans (Anti-Defamation League, 2020); and the callous murders of George Floyd, Breonna Taylor, and Ahmaud Arbery, among many others. Income inequality in the U.S. is now higher than in all other Group of 7 (G7) industrialized countries (Schaeffer 2020). Perceived threats to access and dominance elicit rhetoric that demonizes the “Other,” erode social cohesion and democracy, and reduce quality of life for marginalized and oppressed communities (McCoy, Rahman, and Somer 2018).
The communal nature of the arts, where audience members interact with one another in the course of collectively experiencing performances and events, holds great potential for bringing communities together and for reaffirming existential meaning after prolonged isolation, trauma, and polarization. Shared cultural experiences can attenuate negative perceptions of others, bring together spatially and socially divided citizens, and enhance quality of life for everyone (UNESCO 2001). These interactions can build strong bonds of social identification – i.e., a sense of personal identity based on belonging to a group – among loyal audiences (Bhattacharya, Rao and Glynn 1995).
But human nature can get in the way. According to the principle of homophily, people prefer to congregate and share experiences with others whom they perceive to be similar (McPherson, Smith-Lovin, and Cook 2001). Research has shown that homophilous experiences can translate into stronger brand identification with the service provider (Hanks, Line, and Yang 2017; Karaosmanoğlu, Baş, and Zhang 2011), which creates a dilemma for arts leaders. Do we nurture homophilous experiences for audiences who seek out live, shared cultural experiences with people similar to them, or promote DEI and heterophilous shared experiences among diverse audience members?
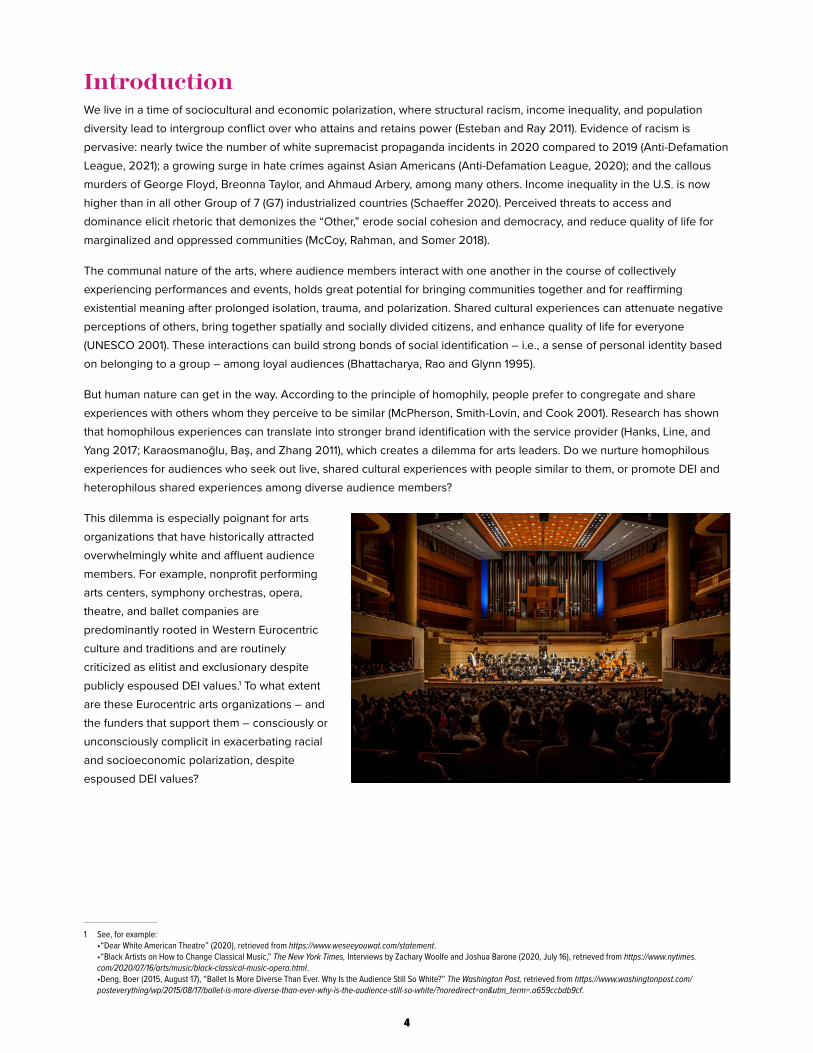
This dilemma is especially poignant for arts organizations that have historically attracted overwhelmingly white and affluent audience members. For example, nonprofit performing arts centers, symphony orchestras, opera, theatre, and ballet companies are predominantly rooted in Western Eurocentric culture and traditions and are routinely criticized as elitist and exclusionary despite publicly espoused DEI values.1 To what extent are these Eurocentric arts organizations – and the funders that support them – consciously or unconsciously complicit in exacerbating racial and socioeconomic polarization, despite espoused DEI values?
1 See, for example: •“Dear White American Theatre” (2020), retrieved from https://www.weseeyouwat.com/statement.•“Black Artists on How to Change Classical Music,” The New York Times, Interviews by Zachary Woolfe and Joshua Barone (2020, July 16), retrieved from https://www.nytimes.com/2020/07/16/arts/music/black-classical-music-opera.html.
•Deng, Boer (2015, August 17), “Ballet Is More Diverse Than Ever. Why Is the Audience Still So White?” The Washington Post, retrieved from https://www.washingtonpost.com/posteverything/wp/2015/08/17/ballet-is-more-diverse-than-ever-why-is-the-audience-still-so-white/?noredirect=on&utm_term=.a659ccbdb9cf.
5
The StudyWe began our exploration by conducting a series of semi-structured conversations with 33 performing arts professionals charged with creating and implementing DEI initiatives. We adopted a theories-in-use approach (Zeithaml et al. 2020) to capture the mental model of how DEI initiatives work from the perspective of individuals who are closest to the problem.2 The first insight from the interviews was a conceptual definition for audience DEI based on its component parts – diversity, equity, and inclusion.
Audience diversity is a basic measure of heterogeneity that can examine any dimension. We focus on race and income because conversations with arts leaders revealed the complexity of diversifying audiences on these dimensions. As one participant commented: “We can attract people of color who have the same income markers [as existing audience members]... The question of ‘how do you define DEI success?’ is a really resonant one with us right now.” Equity equates to fair and equal access to participation opportunities, and inclusion captures the extent to which participation rates reflect equity. Thus, we define audience DEI as the extent to which the diversity of the served audience base reflects equitable participation. By extension, racial representativeness is the extent to which the racial characteristics of the served customer base reflect equitable participation, and income representativeness is the extent to which the income characteristics of the served customer base reflect equitable participation.
The interviews also elicited audience DEI goals; the relevance of funder priorities with respect to DEI goals; and organizational constraints and initiatives that impact DEI goals. We combine insights that emerged in Figure 1, which identifies our three research questions. The first question (Q1 in Figure 1) is the extent to which the racial and income composition of audiences represents the local community. The second question (Q2) is whether philanthropic funder support – especially shifting priorities over time – is linked to audience DEI outcomes. The third question (Q3) is how organizational characteristics and marketing actions affect audience DEI outcomes. The Figure’s arrows indicate relationships between the constructs, and the Trend arrow’s intersection with the arrow between funder support and audience DEI indicates that Trends can change the nature of, or moderate, these relationships.
This conceptual framework guided a quantitative analysis of financial, community, and audience data for 24 performing arts organizations in traditionally Eurocentric arts sectors: nonprofit performing arts centers, symphony orchestras, opera, theatre, and ballet companies. Five are from the Midwest, 10 from the Northeast, one from the Southeast, seven from the Southwest, and one from the Northwest. TRG Arts provided anonymous box office data at the census block group level for the organizations over seven years (FYs 2011-2017). We included transactions for all households located within 30 miles of each organization (Voss, Voss, and Park 2017), which yielded 18 million transactions for 1.9 million households. We used TRG and Census data to estimate audience DEI outcomes. SMU DataArts provided measures of contributed revenue support from each of four key funder groups. Data from TRG and DataArts provided measures of organizational characteristics and marketing actions.
2 Please contact the first author for the set of questions posed as a conversation guide: [email protected].
6
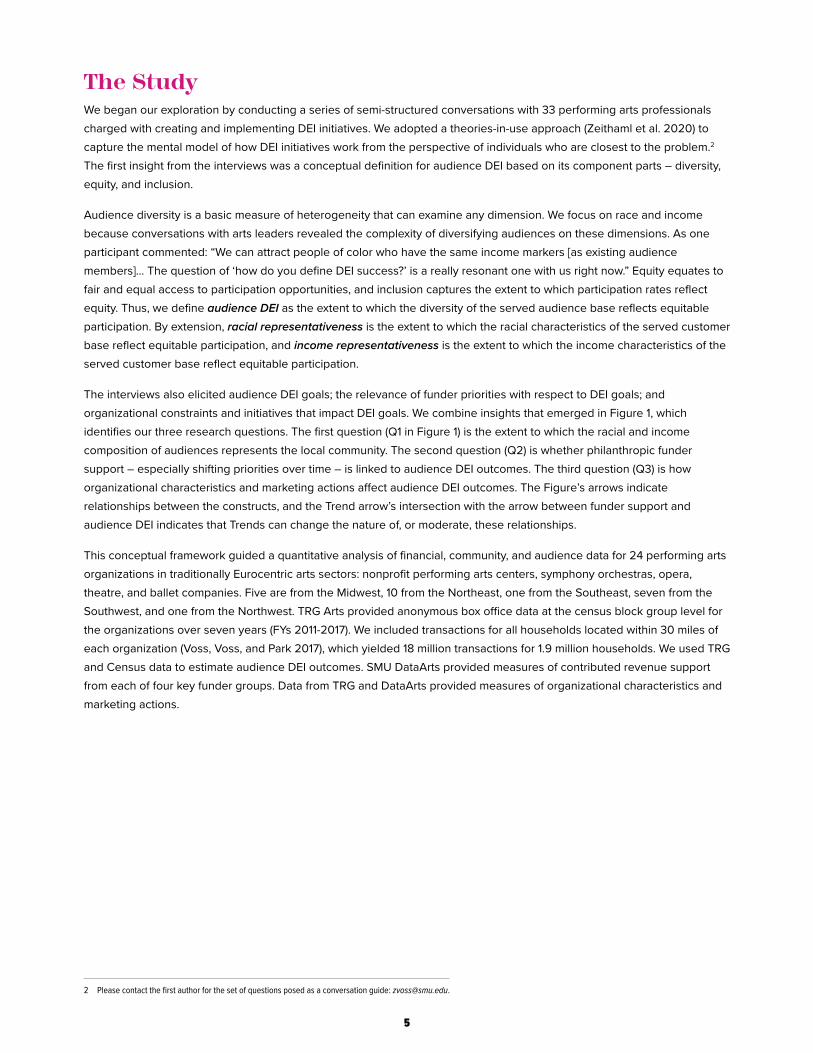
FIGURE 1: Framework Linking Funder Support, Organizational Characteristics, and Marketing Actions to Audience DEI
Q1. Audience representativeness. To what extent do audiences of nonprofit performing arts organizations in traditionally Eurocentric arts sectors represent the racial and income diversity of their communities, and has audience DEI improved over time?
To assess the extent to which audiences represent the diversity of the community, we focused on the percentage of the audience and community that were (1) Black, Indigenous, People of Color (“BIPOC”)3, or (2) living in households earning below $50K per year. To estimate the racial and income characteristics of the audience base, customer households were assigned to census block-groups through geocoding. We used individual transactions and census data for the block group to estimate the racial and household income characteristics of audiences at the census tract level.4 We then compared the racial and income characteristics of audiences to the racial and income characteristics of their communities to create measures of racial and income representativeness.5
Racial (income) representativeness is the percentage of the audience that is BIPOC (annual income less than $50K) divided by the percentage of the population that is BIPOC (annual income less than $50K). We multiplied the representativeness measures by 100, so a value of 100 indicates the audience base perfectly matches the population, less than 100 indicates the audience base skews mostly white or earning more than $50K, and greater than 100 indicates the audience base skews mostly BIPOC or earning less than $50K. Using these two audience DEI outcome measures, we examined the extent to which audiences represent the racial and income diversity of their communities and whether these outcomes have improved over time.
a. Do audiences of these nonprofit performing arts organizations in traditionally Eurocentric arts sectors (i.e., ballet companies, performing arts centers, theatres, orchestras, and opera companies) represent the racial and income diversity of their communities?
Finding: Audiences at these performing arts organizations significantly underrepresent the racial and income diversity of their communities.
3 We acknowledge that the Black, Indigenous, People of Color (BIPOC) terminology is imperfect. It includes individuals who are African American, Native American, Hispanic/Latinx, Asian American, or Arab American. No single word or acronym can capture the diversity of individual identity or artistic and cultural traditions. Acronyms and phrases like “people of color” do not explicitly distinguish important differences, which we honor. As with other studies that utilize the BIPOC acronyms, we encourage individuals to self-identify however they choose.
4 Census block groups are well-defined, small geographic areas that closely approximate a neighborhood and contain, on average, fewer than 1,500 people. The median size of a block group is just over one square kilometer with 39 blocks, but the physical size can be much smaller in dense urban areas such as those examined here. See https://www2.census.gov/geo/pdfs/reference/GARM/Ch11GARM.pdf. A census tract is a small, contiguous geographic area, ideally containing around 4,000 people, with each block group belonging to one and only one census tract. The data includes 13,344 census tracts and 38,667 block groups, where the average, minimum, and maximum number of block groups per census tract is 3, 1, and 9, respectively.
5 For technical details regarding the audience representativeness estimation process, as well as selection model and regression results, please contact the first author at [email protected].
Q2. Funder Support Relative Level of Individual Support t-1
Relative Level of Foundation Support t-1
Relative Level of Corporate Support t-1
Relative Level of Government Support t-1
Q3. Organizational Characteristics and Actions Location Population Characteristics t
Subscription Base t
Marketing Program Diversity t
Investments in Advertising t
Print t
Q1. Audience DEI Outcomes Racial Representativeness t
Income Representativeness t
TREND (2011-2017)
7
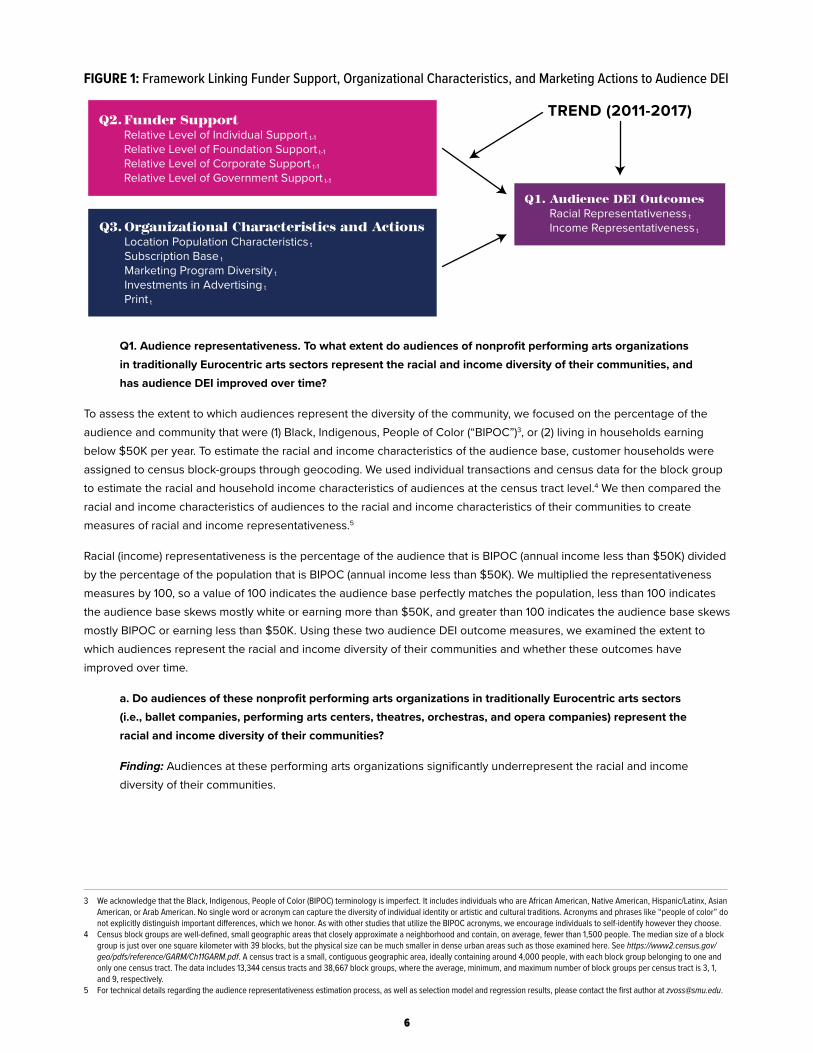
Figure 2 summarizes the extent to which audiences represent the diversity of the communities in which these performing arts organizations reside. Overall, BIPOC community members constitute 44 percent of the population of the surrounding communities, whereas they make up only 17 percent of audience members; therefore, the average racial representativeness index is 39. Income diversity also falls short of the population mark. Forty-two percent of households earn under $50,000 per year. By contrast, only 14 percent of audience members share this characteristic, putting the average income representativeness index at 33.
FIGURE 2: Average Audience Representativeness Estimates
These figures may seem low given the organizational efforts and funder attention devoted to DEI initiatives in recent years. It is important to keep in mind that the data examined in this study relate to audience attendance because the underlying premise of the study is that bringing together diverse audiences to engage in cultural events is a step towards reducing polarization. The data do not capture participation in education or outreach programming that falls outside of ticketed (paid and free) box office activity.
Numerous classical music organizations, for example, shared that: (1) their successful DEI work is done through their education programming, and (2) they attempt to cross over those served through education programming and their families into the core concert/production series, but (3) they have met with limited success in doing so, to their frustration. One arts leader lamented this lack of crossover: “We’ve had predominantly white audiences and predominantly African Americans participating in our education programs…. We’re working on things that will bring those audiences together.”
b. Has audience racial and income representativeness improved over time?
Finding: These performing arts organizations moderately increased racial representativeness, but income representativeness decreased for organizations in each of the performing arts sectors over time. Despite limited progress, they continue to underserve these segments.
In addition to examining overall change, it is useful to consider whether the various performing arts sectors experienced similar versus divergent trends. Figure 3 shows audience representativeness indices by year and sector and reveals several noteworthy observations.
Representativeness: 100*(14%/42%) = 33Representativeness: 100*(17%/44%) = 39
17% of customers
14% of customers
44% of the population
42% of the population
PANEL A: Racial Representativeness(% of Customers Relative to % of the Population BIPOC)
PANEL B: Income Representativeness(% of Customers Relative to % of the Population in
Households Earnings < $50K)
8
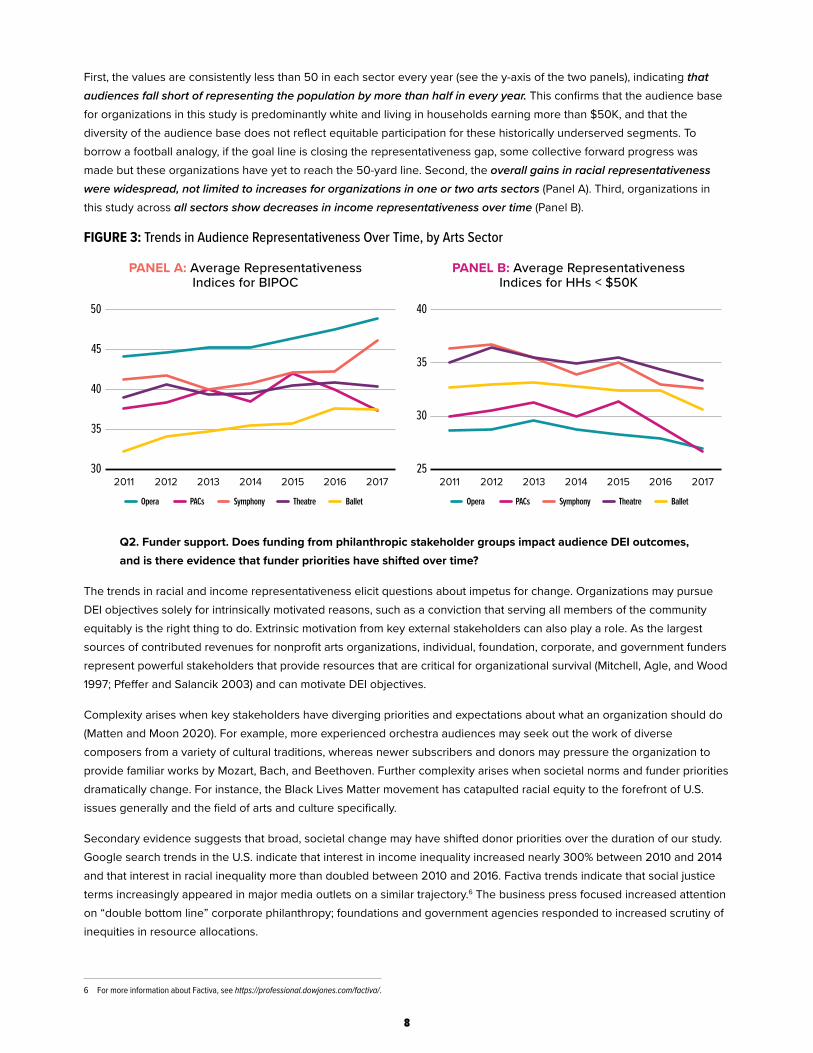
First, the values are consistently less than 50 in each sector every year (see the y-axis of the two panels), indicating that audiences fall short of representing the population by more than half in every year. This confirms that the audience base for organizations in this study is predominantly white and living in households earning more than $50K, and that the diversity of the audience base does not reflect equitable participation for these historically underserved segments. To borrow a football analogy, if the goal line is closing the representativeness gap, some collective forward progress was made but these organizations have yet to reach the 50-yard line. Second, the overall gains in racial representativeness were widespread, not limited to increases for organizations in one or two arts sectors (Panel A). Third, organizations in this study across all sectors show decreases in income representativeness over time (Panel B).
FIGURE 3: Trends in Audience Representativeness Over Time, by Arts Sector
Q2. Funder support. Does funding from philanthropic stakeholder groups impact audience DEI outcomes, and is there evidence that funder priorities have shifted over time?
The trends in racial and income representativeness elicit questions about impetus for change. Organizations may pursue DEI objectives solely for intrinsically motivated reasons, such as a conviction that serving all members of the community equitably is the right thing to do. Extrinsic motivation from key external stakeholders can also play a role. As the largest sources of contributed revenues for nonprofit arts organizations, individual, foundation, corporate, and government funders represent powerful stakeholders that provide resources that are critical for organizational survival (Mitchell, Agle, and Wood 1997; Pfeffer and Salancik 2003) and can motivate DEI objectives.
Complexity arises when key stakeholders have diverging priorities and expectations about what an organization should do (Matten and Moon 2020). For example, more experienced orchestra audiences may seek out the work of diverse composers from a variety of cultural traditions, whereas newer subscribers and donors may pressure the organization to provide familiar works by Mozart, Bach, and Beethoven. Further complexity arises when societal norms and funder priorities dramatically change. For instance, the Black Lives Matter movement has catapulted racial equity to the forefront of U.S. issues generally and the field of arts and culture specifically.
Secondary evidence suggests that broad, societal change may have shifted donor priorities over the duration of our study. Google search trends in the U.S. indicate that interest in income inequality increased nearly 300% between 2010 and 2014 and that interest in racial inequality more than doubled between 2010 and 2016. Factiva trends indicate that social justice terms increasingly appeared in major media outlets on a similar trajectory.6 The business press focused increased attention on “double bottom line” corporate philanthropy; foundations and government agencies responded to increased scrutiny of inequities in resource allocations.
6 For more information about Factiva, see https://professional.dowjones.com/factiva/.
PANEL A: Average RepresentativenessIndices for BIPOC
PANEL B: Average RepresentativenessIndices for HHs < $50K
50
45
40
35
302011 2012 2013 2014 2015 2016 2017
Opera PACs Symphony Theatre Ballet
40
35
30
252011 2012 2013 2014 2015 2016 2017
Opera PACs Symphony Theatre Ballet
9
We expect a time lag to affect the relationship between funding and DEI outcomes. The logic is that last year’s funding from each major philanthropic source impacts the current year’s initiatives and currently attained levels of audience DEI. To capture this time component and examine how the impact of funder support shifted over time, we estimated a time series model using eight years of data.7 Figure 1 identifies the variables that we measure at time t-1 and others measured at time t. SMU DataArts’ Cultural Data Profile (CDP) provided organization-level measures for funder support. The CDP captures operating and financial data for each fiscal year, including contributed revenue levels from individuals, foundations, corporations, and government entities that were received in the same year they were used by the organization for unrestricted operating purposes.8 We divided each contributed revenue source by the organization’s total expenses, so that each measure represents the relative level of support received from each source.
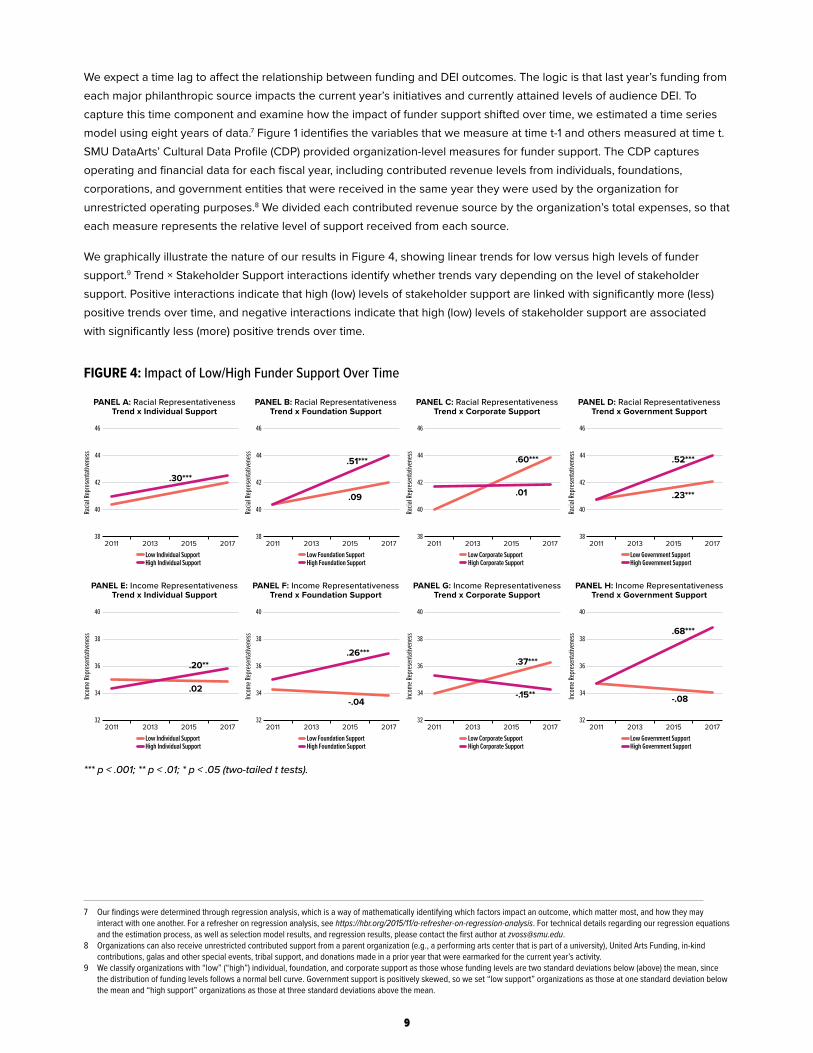
We graphically illustrate the nature of our results in Figure 4, showing linear trends for low versus high levels of funder support.9 Trend × Stakeholder Support interactions identify whether trends vary depending on the level of stakeholder support. Positive interactions indicate that high (low) levels of stakeholder support are linked with significantly more (less) positive trends over time, and negative interactions indicate that high (low) levels of stakeholder support are associated with significantly less (more) positive trends over time.
FIGURE 4: Impact of Low/High Funder Support Over Time
PANEL A: Racial RepresentativenessTrend x Individual Support
46
44
42
40
382011 2013 2015 2017
Low Individual SupportHigh Individual Support
Racia
l Rep
resen
tative
ness
.30***
PANEL B: Racial RepresentativenessTrend x Foundation Support
46
44
42
40
382011 2013 2015 2017
Low Foundation SupportHigh Foundation Support
Racia
l Rep
resen
tative
ness
.51***
.09
PANEL C: Racial RepresentativenessTrend x Corporate Support
46
44
42
40
382011 2013 2015 2017
Low Corporate SupportHigh Corporate Support
Racia
l Rep
resen
tative
ness
.60***
.01
PANEL D: Racial RepresentativenessTrend x Government Support
46
44
42
40
382011 2013 2015 2017
Low Government SupportHigh Government Support
Racia
l Rep
resen
tative
ness
.52***
.23***
PANEL E: Income RepresentativenessTrend x Individual Support
40
38
36
34
322011 2013 2015 2017
Low Individual SupportHigh Individual Support
Incom
e Rep
resen
tative
ness
.20**
.02
PANEL F: Income RepresentativenessTrend x Foundation Support
40
38
36
34
322011 2013 2015 2017
Low Foundation SupportHigh Foundation Support
Incom
e Rep
resen
tative
ness
.26***
-.04
PANEL G: Income RepresentativenessTrend x Corporate Support
40
38
36
34
322011 2013 2015 2017
Low Corporate SupportHigh Corporate Support
Incom
e Rep
resen
tative
ness
.37***
-.15**
PANEL H: Income RepresentativenessTrend x Government Support
40
38
36
34
322011 2013 2015 2017
Low Government SupportHigh Government Support
Incom
e Rep
resen
tative
ness .68***
-.08
*** p < .001; ** p < .01; * p < .05 (two-tailed t tests).
7 Our findings were determined through regression analysis, which is a way of mathematically identifying which factors impact an outcome, which matter most, and how they may interact with one another. For a refresher on regression analysis, see https://hbr.org/2015/11/a-refresher-on-regression-analysis. For technical details regarding our regression equations and the estimation process, as well as selection model results, and regression results, please contact the first author at [email protected].
8 Organizations can also receive unrestricted contributed support from a parent organization (e.g., a performing arts center that is part of a university), United Arts Funding, in-kind contributions, galas and other special events, tribal support, and donations made in a prior year that were earmarked for the current year’s activity.
9 We classify organizations with “low” (“high”) individual, foundation, and corporate support as those whose funding levels are two standard deviations below (above) the mean, since the distribution of funding levels follows a normal bell curve. Government support is positively skewed, so we set “low support” organizations as those at one standard deviation below the mean and “high support” organizations as those at three standard deviations above the mean.
10
We now examine the extent to which cash support from each funding source affected audience DEI outcomes and whether the evidence points to shifting priorities over time. We add insights from our qualitative exploration to shed light on the relationships that emerged in the empirical analyses.
a. Does funding from individual donors impact audience DEI, and is there evidence that individual donor priorities have shifted over time?
Finding: Individual support had no impact on the racial representativeness of the audience but an increasingly positive impact on the level of income representativeness.
Individual support includes donations from all individuals, including trustees. Individuals tend to be both philanthropic supporters and beneficiaries, with roughly 80% of donors also being subscribers (Gaylin 2016). This dual role as customers and philanthropic supporters can result in diverging and even conflicting intra-group motivations. In its purest of forms, donation behavior may be motivated by altruistic goals like increasing access for underserved segments of the community. At the other end of the spectrum, donors may be driven by more self-interested goals such as obtaining exclusive donor benefits. As one executive director observed:
“Our individual donor base in the major gift category rarely engages in this [DEI] conversation with us. Fundraising for us isn’t like in the social services where the person you’re raising money from has no direct relationship to the cause, they do it because they care about the good of the community. That’s different than for theatre fundraising where the argument is, ‘Give us money because you will be the user of our product and you’ll engage and be enlightened.’”
These diverging motivations and the large number of individual donors combined to produce no significant effect on the racial representativeness of the audience. As shown in Figure 4, Panel A, organizations increased racial representativeness over time regardless of whether their individual support was high or low. Individual support had a weak but increasingly positive impact on income representativeness. As shown in Figure 4, Panel E, organizations in our sample with high levels of individual support finished the period with significantly higher levels of income representativeness than did those with lower levels of individual support. This points to an evolution in individual motivations that coincides with growing societal awareness of broader social justice issues and income inequality in particular.
b. Does funding from foundations impact audience DEI, and is there evidence that foundation priorities have shifted over time?
Finding: The impact of foundation support on racial and income representativeness intensified over time, with positive results.
Foundation support includes all grants awarded to organizations from private foundations. These foundations and their national association, Grantmakers in the Arts (GIA), influence broader societal priorities and expectations. As societal interest in issues of social justice rose over the last decade, the foundation community increased its public commitments to make DEI a primary funding focus. An officer at an arts-funding foundation explicitly described this evolution in priorities: “Diversity was articulated in our 2014 mission statement and [our foundation’s] first strategic plan that year, and has since been refined to embrace equity and inclusion and now, social justice.”
We see evidence that the commitment to racial equity was taken seriously by foundations as part of their giving priorities over the period of the study. The growing impact of foundations’ emphasis on access to the arts for BIPOC (Figure 4, Panel B) and lower-income members of the community (Figure 4, Panel F) is unmistakable. Organizations that received higher levels of foundation support increased racial and income representativeness over time, whereas organizations receiving lower levels did not.
11
c. Does funding from corporate donors impact audience DEI and is there evidence that corporate priorities have shifted over time?
Finding: Corporate support was associated with greater audience representativeness early in the period of study but was linked to increasingly lower levels of income diversity over time. In fact, low levels of corporate support were increasingly associated with higher levels of racial and income representativeness.
Corporate support includes all philanthropic contributions from for-profit corporate entities. The collective evidence tells a compelling story of shifting priorities in corporate support for the arts. Over time, corporate philanthropy has become less altruistic in nature and more oriented to strategic philanthropy, which seeks to enhance both business and social value (Carroll 2018; Porter and Kramer 2002). This empirical trend confirms field perceptions that corporate support moved away from philanthropic support towards marketing-related sponsorships that target higher-income audiences. One arts leader offered: “You have to first recognize that since the Great Recession, corporate philanthropy has been going down, down, down. When it is there now, it is for programs that get lots of people and visibility … with a desired demographic.”
Interestingly, there was no significant change in racial representativeness at organizations receiving high levels of corporate support over time (Figure 4, Panel C). By contrast, there was a significant decrease in income representativeness over time in response to high levels of corporate support (Figure 4, Panel G). Collectively, these results suggest that corporate support may be color-blind as long as audiences possess purchasing power. As one arts leader observed, “Corporate giving is tied to brand exposure. Corporations want to reach an audience that has a lot of disposable income.”
In fact, we found an inverse relationship when it came to lower levels of corporate support – i.e., organizations with lower levels of corporate support increased their levels of racial and income representativeness over time. One explanation might be that organizations with lower corporate support are unshackled from pressure to focus on reaching a certain racial and/or income customer demographic desired by corporations. The positive trends for organizations with low levels of corporate support are intriguing and underscore tensions between stakeholder support and audience DEI objectives. These results also beg the question: Is corporate philanthropic behavior focused more on its own double bottom line – i.e., profits and social impact that comes with exposure to high-net-worth individuals – than tackling the stubborn, pernicious societal problems of access inequality and discrimination?
d. Does government funding impact audience DEI, and is there evidence that government priorities have shifted over time?
Finding: Government support had an increasingly positive impact on both racial and income representativeness.
Government support includes all public support from local, state, and national agencies. In 2014, the NEA adopted a strategic plan that listed as its number one cross-cutting objective (p. 7), “Ensure that NEA-funded activities reach Americans throughout the country by making awards for projects that address a diverse spectrum of artistic disciplines, geographic locations, and underserved populations.”10
The results reveal considerable progress on this objective, and they are consistent with the qualitative research pointing to an increasing emphasis on DEI in grantmaking decisions among government funders, leading to more racial inclusion (Figure 4, Panel D) and especially greater access for lower-income segments (Figure 4, Panel H). For instance, an arts leader shared: “Government has become a huge partner in driving DEI. One of the unique things we’ve done is tap into city agencies beyond the cultural affairs group that are now interested in seeing greater access for diverse audiences.”
10 Retrieved from https://www.arts.gov/sites/default/files/NEAStrategicPlan2014-2018.pdf.
12
Q3. Organization influences. How do organization characteristics and marketing actions affect audience DEI?
While funders can effectively influence audience diversity, organizations take actions to achieve DEI objectives that align with their priorities and the funding awarded. The arts leaders with whom we spoke identified the early 2010s as a turning point in audience DEI awareness. Coming out of the recession and struggling to rebuild audiences, arts leaders began paying more attention to shifting demographic patterns and their ability to develop new audiences:
“[My city] is majority minority. We weren’t growing and yet there were about 450,000 African Americans in our community whom we weren’t serving. From a purely business perspective, there’s all those customers we weren’t talking to. We saw DEI as a way of bringing in new audience segments. Then there’s always the balance between that and the civil rights lens, the moral imperative lens.”
There is a communal nature to the arts, where audience members interact with one another in the course of collectively experiencing performances and events in person. The desire to socialize is a primary motivator of live arts attendance (National Endowment for the Arts 2015). Shared cultural experiences occur in context, not in a vacuum, so we investigated the impact of two key contextual factors. First, there is the context of place, which can be considered one of the Four P’s of marketing (Borden 1984). We explored the extent to which an organization’s location and the characteristics of the surrounding community impact audience willingness to become part of the shared experience it offers. Population characteristics around the organization’s physical location are racial and income data reported by the Census Bureau for the organization’s zip code.
Second, there is the context of the make-up of fellow audience members with whom the experience will be shared. Large performing arts organizations tend to have a substantial number of seats occupied by subscribers, so we examine the extent to which the size of the subscriber base has an impact on audience diversity. Box office data from TRG provided a measure for the relative size of the relational customer base – i.e., the percentage of tickets sold as part of a season subscription.
Marketing program offerings can be diversified, advertising investments can be increased to attract more diverse audiences, and price discounts can be targeted to enhance audience DEI outcomes. The CDP provided measures for marketing program diversity (i.e., total number of defined, ticketed offerings) and investments in advertising. We used box office data from TRG to generate a fine-grained measure of the average price paid by customers in each census tract. Insights from our qualitative exploration shed light on general relationships that emerged in the empirical analyses for each of these five influences, described below.
a. How does the organization’s location affect the extent to which the audience represents the racial and income characteristics of its broader community?
Finding: Organizations located in more racially and/or income diverse neighborhoods have an audience base that is more reflective of that diversity.
When consumption requires in-person attendance, the characteristics of the location can act as a welcoming portal or barrier for historically underserved segments. Distance represents an obvious barrier with respect to location, as access is curtailed for people who live further from the organization’s location. But psychological barriers also exist if destination neighborhoods are, or appear to be, racially or economically exclusionary. One arts leader described the challenge as, “When the theatre is surrounded by white communities, getting a diverse audience to see diverse work can be more difficult than providing the work itself.”
Two findings emerged concerning the relationship between the location characteristics of the organization and the racial and income characteristics of the audience. First, the corresponding characteristics of the organization’s neighborhood have positive effects on audience DEI. This implies that when people travel within the city, they tend to select destinations where the sociodemographic characteristics are similar to their own, underscoring the existence of homophily. This finding complements empirical research examining travel patterns using mobile data (Wang et al. 2018). Second, BIPOC households and households with income less than $50k are less likely to travel longer distances to these performing arts venues than their counterparts.
13
b. How does the size of an organization’s subscriber base impact the extent to which the audience represents the racial and income characteristics of its broader community?
Finding: The size of the subscriber base has significant, negative effects on the racial and income representativeness of the audience.
We typically think of a large subscriber base as something desirable. Subscribers represent a base of loyal audience members who provide the security of up-front cash and fill seats throughout the year, and who require less marketing expenditure to attract and retain than single ticket buyers. However, our findings reveal a dark side to having a large subscriber base. The more these performing arts organizations fill seats with subscribers, the lower their levels of audience racial and income representativeness. Homophily comes into play, which can create psychological barriers for historically underserved segments. Subscribers can form an in-group to which non-subscribers do not belong. If the subscriber in-group is predominantly white and affluent, then BIPOC or lower-income people are more likely to self-identify as belonging to a minority out-group in the space (Simon, Glässner-Bayerl and Stratenwerth 1991), which can reduce their identification with and attraction to the organization (Hanks, Line, and Yang 2017; Karaosmanoğlu, Baş, and Zhang 2011).
The larger the subscriber base, the more likely the out-group members will feel like outsiders who do not belong. An arts leader offered: “It’s important to understand, as a predominantly white organization, how it feels to engage as a person of color. Our subscriber base is still an older, whiter base.” One African American arts administrator described her experience with opera as (Venkatraman 2018), “I’ve tried, I’ve gone three times … and I have to tell you that I’ve never felt more uncomfortable because I just didn’t see anyone in those spaces that really looked like me.”
The dilemma that a large subscriber base creates for organizations extends to how seating inventory is managed. Visual cues and physical separation reinforce in-group-out-group dynamics along racial and income lines in performing arts consumption because subscribers typically receive the best seats closest to the stage. Several arts leaders offered examples of challenges similar to the following:
“We did [a play by an African American playwright]. The theatre was half-moon shaped with six seating sections. Sure enough, the subscribers were in the central seats. There were four center sections of white people flanked by two sections of African American people. It was horrifying! We had to release all of the house seats immediately so that we could increase inventory and change the situation.”
c. How do marketing program diversity, investments in advertising, and price impact audience DEI?
Finding: Marketing program diversity and investments in advertising had a positive impact on both racial and income representativeness, while higher prices drive down both audience DEI outcomes.
Marketing program diversity measures the number of distinct offerings per season and decisions related to packaging and promotion that represent an organization’s attempt to attract specific customer segments through differentiation (Andrews and Smith 1996). The simplest marketing program sells individual tickets to each performance, with no attempt to package, price, or promote those performances to different customer segments. Adding multiple, differentiated packages (e.g., Friday night Young Professionals Series with a pre-show mixer, Sunday Matinee Family Series) or promotions (e.g., Pay What You Want, rush tickets, discounts for students or U.S. military personnel) increases the diversity of the marketing program in meaningful ways, with positive impact on both racial and income representativeness.11
Arts leaders provided numerous examples of big annual productions that target a racial or income-specific segment of the community or annual, culturally specific festivals designed to increase audience representativeness with that culture. Others spoke to earmarked performances; for instance, bringing in the families of children that participate in their free public school programs on Tuesday nights. Paradoxically, these efforts to increase audience DEI may exacerbate polarization by
11 Admittedly, we do not directly observe artistic decisions related to the core content of the programs offered (e.g., subject matter of the content, artists hired, artistic interpretation and intent, etc.) that likely have a significant impact on audience representativeness. Their qualitative nature and complexity make them difficult to categorize, but we recognize their importance.
14
providing separate rather than integrated consumption experiences to diverse segments who have their own homophilous tendencies. As one arts leader observed, “There is danger in the practice of segmented marketing and packages also coming off as segregation.”
Investment in advertising – that is, the relative amount of total annual expenses the organization invests in marketing communications to encourage audience engagement – had a positive influence on audience DEI. In the end, we know that it is not only the size of the investment but also the quality of the marketing communications that matters. As we heard in interviews, “DEI success depends on advertising to diverse audiences in a voice that is authentic and targeted.” Organizations that want to close the audience representativeness gap do well to spend more on marketing communications, wisely.
Price is the average price paid by audience members in targeted census tracts. Lower average prices led to higher representativeness along both dimensions. The effect is stronger on income representativeness, consistent with the idea that lower-income individuals will be price sensitive. Our analyses indicate that a 10% targeted price discount can increase income representativeness by nearly 3 percentage points. Targeted pricing plays a key role in achieving audience DEI, but it is not the total solution.
ImplicationsThis research addresses historical inequities that are attracting increased scrutiny within the arts and broader society. The national service organizations for each of these performing arts sectors are committed to advancing DEI as a member organization priority. For example, the League of American Orchestras will soon launch an entirely new version of its DEI Resource Center on its website, OPERA America has its Racial Justice Opera Network, and Theatre Communications Group sponsors an Equity, Diversity, and Inclusion Institute. Of the organizations included in the study, 75% explicitly publicize audience DEI statements on their websites, and the remaining 25% describe on their websites programs that seek to serve targeted demographic or socioeconomic segments of their communities. These organizations did achieve modest increases in DEI over time, but representativeness remained below 50 on racial and income dimensions. There is still considerable work to be done.
Implications for Performing Arts Organizations Similar to Those in This StudyThe results elucidate the challenges and sometimes conflicting stakeholder demands that managers of performing arts organizations similar to those in this study face when attempting to serve audiences that are representative of the diversity of their communities. For them, this research can be used in a variety of ways.
1. To start, staff and board members can engage in honest discussions about whether the organization perpetuates homophilous tendencies. Does it nurture experiences for audiences who seek out shared experiences with people similar to themselves, or promote DEI and collective participation among diverse audience members? For organizations in this study, building a large, loyal (majority white and wealthy) subscriber base undermines audience DEI. One way to cultivate a more inclusive audience environment is to limit the size of the relational customer base if it is largely white. Additionally, organizations should consider the visual message they send based on subscriber seating. If subscription renewals have dropped off during the pandemic, this might be an opportune time to disperse the location of seats assigned to subscribers so they do not form a monolithic and mostly homogeneous cluster.
We recognize that the notion of limiting the number of subscribers and distributing their prime seats to new and diverse single ticket buyers is fraught with perceived tensions and tradeoffs. When asked about her organization’s commitment to increasing audience DEI, a marketing director in our interviews acknowledged: “Always, always. But with limited resources, you have to put your money where you will earn the most revenue.” Another arts leader commented, “Our concern coming out of this crisis will be that we need to focus on revenue-driven projects (since we’re all facing so much financial loss right now) and important EDI missions will be put on hold.” We argue that arts and cultural organizations have an opportunity to take a leadership role in communities by keeping DEI within their sphere of focus in creating revenue-driven projects. In fact, the two are not mutually exclusive.
15
We conducted post hoc analyses to explore the link between success in increasing audience DEI outcomes and subsequent financial performance. Specifically, we regressed future revenue flows from ticket sales and each key stakeholder group on current levels of audience representativeness. The results indicated that increasing racial representativeness had no effect on future revenue. Increasing income representativeness decreased future revenue from ticket sales but increased revenue from foundations and government agencies, with a negligible net effect. Additional examination of the effect of audience DEI outcomes on net income confirmed no significant effects. These results suggest that the managers of the organizations in our study successfully balance tradeoffs between advancing audience DEI efforts and business objectives. Additional research examining this balancing act would be informative.
2. Set goals for audience diversity and measure progress towards achieving them. A key element missing from the measurement and analyses in our study is each organization’s specific commitment to audience DEI. Although our sample organizations have websites featuring audience DEI statements or descriptions of programs that target demographic or socioeconomic segments of the communities, it is difficult to ascertain the extent to which their commitment permeates programming and hiring choices, culture, strategy, and overall decision-making. Our qualitative research failed to uncover a single organization with explicit audience representativeness goals. Without goals, it is unsurprising that the organizations had not made more progress. To quote Yogi Berra, “If you don’t know where you’re going, you might wind up someplace else.” One arts leader shared: “We have prioritized DEI but we haven’t prioritized what our DEI goals are. DEI is owned by a lot of people in different areas and there isn’t a singular objective.” Organizations can start by getting a benchmark of audience demographics once performances resume in person. Then goals can be set for the level of audience representativeness the organization wants to achieve within a specific time frame, and the roadmap it will follow in order to get there.
3. Use available marketing levers. To close the gaps in racial and income representativeness, first increase the number of differentiated packages offered and tailor the marketing mix to target diverse audiences (i.e., content, price, promotion). This will take effort to first conduct research into the preferences and needs of those whom the organization seeks to serve. Second, increase the investment in targeted advertising, as one would with any acquisition campaign, and invest those dollars wisely in communication channels most relevant to the community members you seek to serve. In the advertising, use welcoming, invitational messages and experiences if the goal is greater diversity (Benoit-Bryan, Jenetopulos, Smith, and Linett 2020).
4. Pursue foundation and government support for all audience DEI initiatives, seek individual support for income DEI initiatives, and consider corporate partners carefully. Corporate support generally appears to work against DEI. Annually, the average organization supports only two percent of its total expenses with corporate funding,12 and yet corporate funding showed an outsized, negative impact on racial and especially income representativeness. Organizations interested in increasing income representativeness may want to consider focusing their fundraising efforts on attracting government funding and, to a somewhat lesser extent, individual and foundation support. Those seeking better racial representativeness in their audiences would do well to direct fundraising efforts at government agencies and foundations. Government support produced the most positive effect on audience DEI outcomes that we observe in our data.
5. Pay more attention to those who live nearby if the organization's performance space is located in a diverse neighborhood. Previous research has shown the important role that distance plays in arts attendance. Generally speaking, the arts are radically local, with a significant drop-off in a person’s likelihood of attending if they live beyond one mile from an organization compared with the likelihood of attendance for a person living in the organization’s immediate neighborhood (Voss, Voss, and Park 2017). The arts become even more radically local for those in lower-income communities as costs associated with the hassle of travel compound the financial barriers of attending.
This is a time to recognize that being community-focused and paying close attention to people living nearest to the organization can be an advantage, particularly as people are now accustomed to staying closer to home and have shifted their commuting patterns during the pandemic. The fact that there is a much higher likelihood of purchase among households in an arts and cultural organization’s immediate neighborhood, particularly by lower-income and BIPOC
12 SMU DataArts (2019), The Fundraising Report, retrieved from https://culturaldata.org/learn/data-at-work/2019/breakthrough-study-in-fundraising/.
16
members of the community, means that those living nearby should take on added importance. An opportunity lies in organizations making even greater efforts to be good community citizens.
Another implication of the findings with respect to location pertains to organizations that are not located in diverse neighborhoods. When people travel within the city, they tend to restrict their destinations to neighborhoods where the sociodemographic characteristics are similar to their own. In order to reach more BIPOC or lower-income members of their community, these organizations may want to consider partnering in authentic and equitable ways with existing organizations in neighborhoods that are more diverse.
We recognize that additional factors likely play a role in driving audience DEI. For instance, we do not directly observe artistic decisions related to the core content of the programs offered, content that likely has a strong impact on performing arts organizations’ success in attracting audience members who represent the racial and income diversity of the communities in which they reside. One might hypothesize that racially and economically diverse members of the community simply have little interest in attending the programming these organizations offer. However, recent research suggests that while BIPOC Americans expressed a desire for more reflective and dynamic content, they overwhelmingly prioritized a desire for arts and cultural organizations to change after the pandemic by becoming more inclusive and community-centered, and more casual and enjoyable (Benoit-Bryan, Jenetopulos, Smith, and Linett 2020). During the pandemic, they have missed the social connection and enjoyment that arts and cultural organizations can offer.
Interestingly, Benoit-Bryan and colleagues (2020) also found that lower-income white Americans would like arts and cultural organizations to change after the pandemic to be more relevant to people like them. As the authors point out, this presents an invitation to change with clear directives. It underscores findings from other studies that identify community orientation as a critical cornerstone of success for high-performing arts organizations (Voss and Voss 2021). As in the marketplace as a whole, biases may manifest as a subtle failure to include diverse customers rather than an overt attempt to exclude them (Bennett, Hill, and Oleksiuk 2013).
Implications for FundersImportantly, this research makes a case that individual donors, foundations, corporations, and government agencies seeking to support more inclusive engagement in nonprofit arts and cultural activity by diverse audiences might consider directing more equitable support to those organizations whose core mission lies in primarily serving BIPOC and lower-income communities, alongside continued investment in large performing arts organizations that have concrete commitments to measurably improve DEI. These organizations receive less recognition and attention from funders and society as a whole (Sidford and Frasz 2017; Dao-Shah and Faust 2018; Voss and Voss 2021).
Future research should follow the impact of calls for private and public funders to redirect support from a focus on diversity initiatives by “white” arts organizations (Anderson 2018) towards support for arts organizations that exist to primarily serve BIPOC and lower-income communities (e.g., Bahr 2020; Moynihan 2020). Key questions to address empirically are related to the role played by BIPOC-serving organizations within the overall arts ecology, and the extent to which their audiences represent the diversity of their surrounding communities.
Implications for Those Who Love Attending the Performing ArtsThis study and many others have shown through different approaches that a lack of audience diversity, equity, and inclusion is a long-term, persistent problem for the performing arts in the U.S. Yet do audiences want to be diversified? Do they care about diversity, or are they unaware of the pervasive nature of the sameness of individuals around them? We may not think twice about gathering with others who are racially and socioeconomically like us and sitting clustered with them in the best seats.
We all do well to reflect on times when our behavior negatively impacts others, and this research shows that a large base of subscribers, particularly a largely white and wealthier base, negatively impacts audience racial and income representativeness. Future research might explore whether customers can develop a desire to seek out consumption experiences with people unlike themselves through regular exposure to “others” in a thought-provoking, shared environment. Findings from this study encourage all who love attending the performing arts to ask themselves how they help or hinder creation of a shared cultural experience that is more inclusive and community-centered.
17
ConclusionThe performing arts, where audiences share culturally infused experiences designed to enhance understanding, can play a unique role in uniting us all, creating rich spaces of exchange that build a sense of “we” (Saatcioglu and Ozanne 2013). Indeed, there may be no better context for examining how to foster a better world where diverse audiences come together for shared experiences, breaking down the stereotypes and lack of contact with “Others” that sustain bigotry and polarization in the process. Our findings shed light on how key external stakeholders and marketing actions and constraints can help or hinder organizations’ success in advancing equitable and inclusive access to diverse members of their communities. Our approach to quantifying audience representativeness should be especially valuable to government agencies and policy-makers that prioritize DEI.
Creating heterophilous consumption experiences is increasingly important in today’s world where sociocultural and economic polarization are on the rise (Alvaredo et al. 2018). COVID-19’s toll on lives and well-being has affected everyone, but people of color and low-income individuals have suffered disproportionately in the U.S. The crisis has laid bare racial and socioeconomic divides in society, intensifying pre-crisis inequity, xenophobia, and polarization that were already in a heightened state. Reopening will offer an opportunity to send a signal about the role that organizations want to play in the local community. It represents an opportunity to be part of the solution to healing divided communities at a critical time.
However, our results demonstrate that audience DEI outcomes in the performing arts ultimately may be limited by underlying societal characteristics that evolve gradually at best. The organizations we studied achieved some modest increases in representativeness over time. Audience DEI is difficult to achieve and requires sustained support and effort. Our hope is that this study opens doors for additional, rigorous empirical examination of a significant challenge facing the arts field specifically and a diverse and polarized society more broadly. Can – and do – the performing arts contribute to social integration and harmony in a diverse marketplace? What will it take for arts and cultural organizations of every ilk to not only welcome audiences that reflect the diversity of the communities in which they exist, but also to lead and challenge the institutional racism and inequities that persist?
18
ReferencesAlvaredo, Facundo, Lucas Chancel, Thomas Piketty, Emmanuel Saez, and Gabriel Zucman (2018), World Inequality Report 2018, Cambridge, MA: The Belnap Press of Harvard University Press.
Anderson, Gary (2018), Black Theatre Survey 2016-2017: A Report on the Health of Black Theatre in America, 6/18/2018. Accessed 11/9/20 at https://blacktheatrematters.org/2018/06/18/black-theatre-survey-2016-2017/.
Bahr, Sarah (2020), “Mellon Foundation to Provide $5 Million to Aid Black Theaters,” The New York Times, 10/1/20, Accessed 11/9/20 from https://www.nytimes.com/ 2020/10/01/arts/black-theaters-funding-black-seed.html.
Bennett, Aronté Marie, Ronald Paul Hill, and Daniel Oleksiuk (2013), “The Impact of Disparate Levels of Marketplace Inclusion on Consumer–Brand Relationships,” Journal of Public Policy & Marketing, 32 (Special Issue), 16–31.
Benoit-Bryan, Jen, Matthew Jenetopulos, Madeline Smith, and Peter Linett (2020), Centering the Picture: The Role of Race and Ethnicity in Cultural Engagement During the Pandemic, Slover Linett and LaPlaca Cohen.
Bhattacharya, C. B., Hayagreeva Rao, and Mary Ann Glynn (1995), “Understanding the Bond of Identification: An Investigation of Its Correlates among Art Museum Members,” Journal of Marketing, 59 (4), 46-57.
Borden, Neil (1984), “The Concept of the Marketing Mix,” Harvard Business School Journal, 2, pp.7-12.
Carroll, Archie B. (2018), “Strategic Philanthropy,” In Robert W. Kolb Ed. The SAGE Encyclopedia of Business Ethics and Society, Thousand Oaks, CA: Sage Publications.
Dao-Shah, Ahn Thang and Kate Faust (2018), Mapping Small Arts and Cultural Organizations of Color in Oakland, retrieved from http://mapartscultureoakland.org/.
Esteban, Joan, and Debraj Ray (2011), “Linking Conflict to Inequality and Polarization,” American Economic Review, 101 (June), 1345-1374.
Frey, William H. (2018, June 22), “US White Population Declines and Generation ‘Z-Plus’ Is Minority White, Census Shows,” Brookings Institution, retrieved from https://www.brookings.edu/blog/the-avenue/2018/06/21/us-white-population-declines-and-generation-z-plus-is-minority-white-census-shows/.
Gaylin, David H. (2016), A Profile of the Performing Arts Industry: Culture and Commerce, New York: Business Expert Press.
Hanks, Lydia, Nathan Line, and Wan Yang (2017), “Status Seeking and Perceived Similarity: A Consideration of Homophily in the Social Servicescape,” International Journal of Hospitality Management, 60, 123-132.
Karaosmanoğlu, Elif, Ayse Banu Elmadag Baş, and Jingyun Zhang (2011), “The Role of Other Audience Effect in Corporate Marketing: Its Impact on Corporate Image and Consumer-Company Identification,” European Journal of Marketing, 45 (9/10), 1416-1445.
Matten, Dirk, and Jeremy Moon (2020), “Reflections on the 2018 Decade Award: The Meaning and Dynamics of Corporate Social Responsibility,” Academy of Management Review, 45 (1), 7-28.
McCoy, Jennifer, Tahmina Rahman and Murat Somer (2018), “Polarization and the Global Crisis of Democracy: Common Patterns, Dynamics, and Pernicious Consequences for Democratic Policies,” American Behavioral Scientist, 62 (1), 16-42.
McPherson, Miller, Lynn Smith-Lovin, and James M. Cook (2001), “Birds of a Feather: Homophily In Social Networks, Annual Review of Sociology, 27, 415-444.
Mitchell, Ronald K., Bradley R. Agle, and Donna J. Wood (1997), “Toward a Theory of Stakeholder Identification and Salience: Defining the Principle of Who and What Really Counts,” Academy of Management Review, 22 (4), 853-86.
Moynihan, Colin (2020), “New Initiative Will Grant $156 Million to Arts Groups Run by People of Color,” The New York Times, 9/25/20, Accessed 11/9/20 from https://www.nytimes.com/2020/09/25/arts/ford-foundation-grants-people-of-color.html.
National Endowment for the Arts (2015). When going gets tough: Barriers and motivations affecting arts attendance. NEA Research Report #59. Retrieved July 28, 2020 from https://www.arts.gov/publications/when-going-gets-tough-barriers-and-motivations-affecting-arts-attendance.
Paulson, Michael (2021), “The Arts Are Coming Back This Summer. Just Step Outside,” The New York Times, March 16, retrieved from https://www.nytimes.com/2021/03/16/theater/summer-outdoor-performances.html.
19
Pfeffer, Jeffrey and Gerald R. Salancik (2003), The External Control of Organizations: A Resource Dependence Perspective, Stanford, CA: Stanford University Press.
Porter, Michael E. and Mark R. Kramer (2002), “The Competitive Advantage of Corporate Philanthropy,” Harvard Business Review, 80 (12), 56-59.
Saatcioglu, Bige and Julie L. Ozanne (2013), “A Critical Spatial Approach to Marketplace Exclusion and Inclusion,” Journal of Public Policy & Marketing, 32 (Special Issue), 32–37.
Schaeffer, Katherine (2020), “6 Facts About Economic Inequality in the U.S.,” Pew Research Center, February 7, retrieved from https://www.pewresearch.org/fact-tank/2020/ 02/07/6-facts-about-economic-inequality-in-the-u-s/.
Sidford, Holly and Alexis Frasz (2017), Not Just Money: Equity Issues in Cultural Philanthropy, Helicon Collaborative, July, retrieved from http://www.notjustmoney.us/docs/NotJustMoney_Full_Report_July2017.pdf.
UNESCO (2001), Universal Declaration of Cultural Diversity, November 2, retrieved from http://www.unesco.org/new/fileadmin/MULTIMEDIA/HQ/CLT/pdf/5_Cultural_Diversity_EN.pdf.
Wang, Qi, Nolan Edward Phillips, Mario L. Small, and Robert J. Sampson (2018), “Urban Mobility and Neighborhood Isolation in America’s 50 Largest Cities,” Proceedings of the National Academy of Sciences, 115 (30) 7735-7740.
Voss, Zannie and Glenn Voss (2021), The Alchemy of High Performing Arts Organizations, Part II: A Spotlight on Organizations of Color, SMU DataArts, March, retrieved from https://culturaldata.org/pages/the-alchemy-of-high-performing-arts-organizations-a-spotlight-on-organizations-of-color/.
Voss, Zannie, Glenn Voss, Young Woong Park (2017), At What Cost? How Distance Influences Arts Attendance, National Center for Arts Research, October, retrieved from https://dataarts.smu.edu/artsresearch2014/ncar-arts-activity.
Voss, Zannie and Jill Robinson (2020), In It for the Long Haul, SMU DataArts, July, retrieved from https://culturaldata.org/pages/long-haul/.
Zeithaml, Valarie A., Bernard J. Jaworski, Ajay K. Kohli, Kapil R. Tuli, Wolfgang Ulaga, and Gerald Zaltman (2020) “A Theories-in-Use Approach to Building Marketing Theory,” Journal of Marketing, 84(1) 32–51.
PO Box 750356Dallas, Texas 75275-0356
smu.edu/dataarts
SHARE YOUR THOUGHTS
#ArtsResearch @SMUDataArts