Appendix B: PART I: Demographics - Grand Valley State ... › cms4 › asset ›...
76
Rankin & Associates Consulting Grand Valley Climate Assessment Project Final Report 134 Appendix B: PART I: Demographics Table B1 What is your primary institutional status at Grand Valley State? (Question 1) Primary Position n % Undergraduate student 5171 68.3 Non-degree seeking student 30 0.7 Bachelor-degree seeking student, entered GVSU as first-year student 3208 73.2 Bachelor-degree seeking student, entered GVSU as transfer student 1146 26.1 Graduate student 853 11.3 Graduate student Faculty 705 9.3 Assistant professor/Assistant Librarian 98 23.8 Associate professor/Associate Librarian 121 29.4 Professor/Senior Librarian 42 10.2 Visiting faculty 35 8.5 Affiliate instructor 39 9.5 Instructor 10 2.4 Semester by semester adjunct faculty 67 9.5 Primary Position n % Executive/Administrative/ Professional (EAP) 381 5.0 Regular EAP 338 88.7 Adjunct AP 43 11.3 Clerical/Office/Technical (COT) 157 2.1 Regular COT/ Temporary hourly 157 100.0 Department of Public Safety (DPS) 11 0.1 Regular DPS/ Temporary hourly 11 100.0 Maintenance/Grounds/ Service (MGS) 18 0.2 Regular MGS/ Temporary hourly 18 100.0 Other 275 3.6 Note: There are no missing responses to this question as all respondents were required to provide an answer.
Transcript of Appendix B: PART I: Demographics - Grand Valley State ... › cms4 › asset ›...

Rankin & Associates Consulting Grand Valley Climate Assessment Project
Final Report
134
Appendix B: PART I: Demographics
Table B1 What is your primary institutional status at Grand Valley State? (Question 1)
Primary Position
n
%
Undergraduate student 5171 68.3
Non-degree seeking student 30 0.7
Bachelor-degree seeking student, entered GVSU as first-year student 3208 73.2
Bachelor-degree seeking student, entered GVSU as transfer student 1146 26.1
Graduate student 853 11.3
Graduate student
Faculty 705 9.3
Assistant professor/Assistant Librarian 98 23.8
Associate professor/Associate Librarian 121 29.4
Professor/Senior Librarian 42 10.2
Visiting faculty 35 8.5
Affiliate instructor 39 9.5
Instructor 10 2.4
Semester by semester adjunct faculty 67 9.5
Primary Position
n
%
Executive/Administrative/ Professional (EAP) 381 5.0
Regular EAP 338 88.7
Adjunct AP 43 11.3
Clerical/Office/Technical (COT) 157 2.1
Regular COT/ Temporary hourly 157 100.0
Department of Public Safety (DPS) 11 0.1
Regular DPS/ Temporary hourly 11 100.0
Maintenance/Grounds/ Service (MGS) 18 0.2
Regular MGS/ Temporary hourly 18 100.0
Other 275 3.6
Note: There are no missing responses to this question as all respondents were required to provide an answer.

Rankin & Associates Consulting Grand Valley Climate Assessment Project
Final Report
135
Table B2 Are you full-time or part-time in that primary status? (Question 2)
n
%
Full-time 6650 87.8
Part-time 902 11.9
Missing 19 0.3 Table B3 At which campus/location do you spend the majority of your time? (Question 32) Campus/Location
n
%
Allendale Campus 5380 71.1
Pew Grand Rapids Campus (CHS, EC, etc.) 1999 26.4
Meijer Campus at Holland 27 0.4
At the Regional Center in Traverse City 37 0.5
At the Regional Center in Muskegon 24 0.3
At the Annis Water Resources Institute (AWRI) 16 0.2
Other 67 0.9
Missing 21 0.3 Table B4 What is your gender identity? (Question 33) Gender
n
%
Man 2570 33.9
Woman 4936 65.2
Transgender 24 0.3
Other 17 0.2
Missing 24 0.3

Rankin & Associates Consulting Grand Valley Climate Assessment Project
Final Report
136
Table B5 What is your race/ethnicity? (Mark all that apply) (Question 34) Race/Ethnicity
n
%
African 57 0.8
African American/Black (not Latino/Hispanic) 349 4.6
Alaskan Native 6 0.1
Asian/Asian American 178 2.4
Caribbean/West Indian 18 0.2
European American/White 6472 85.5
Latino(a)/Hispanic 263 3.5
Middle Eastern 81 1.1
Native American Indian 133 1.8
Pacific Islander/Hawaiian Native 56 0.7
Other 130 1.7 Note: Percentages may not sum to 100% due to multiple responses.

Rankin & Associates Consulting Grand Valley Climate Assessment Project
Final Report
137
Table B6
Which term best describes your sexual orientation? (Question 35) Sexual Identity
n
%
Asexual 720 9.5 Bisexual 207 2.7 Gay 117 1.5 Heterosexual 6246 82.5 Lesbian 64 0.8 Queer 33 0.4 Questioning 46 0.6 Pansexual 8 0.1 Other 78 1.0 Missing 98 1.3 Table B7 What is your age? (Question 36) Age
n
%
18-19 1567 20.7 20-21 2062 27.2 22-23 1058 14.0 24-32 1125 14.9 33-42 609 8.0 43-52 547 7.2 53-62 463 6.1 63-72 103 1.4 73 and over 2 0.0 Missing 35 0.5

Rankin & Associates Consulting Grand Valley Climate Assessment Project
Final Report
138
Table B8 What is your current relationship status? (Question 37) Relationship Status
n
%
Single, never married 4451 58.8 Single, divorced 217 2.9 Single, widow (partner/spouse deceased) 19 0.3 Partnered 1025 13.5 Partnered, in civil union 14 0.2 Married or remarried 1769 23.4 Separated 29 0.4 Missing 47 0.6 Table B9 What is your current parental status? (Question 38) Parental Status
n
%
No children 5836 77.1 Children under 18 years of age 1032 13.6 Children over 18 years of age, but still legally dependent 348 4.6 Independent adult children over 18 years of age 513 6.8 Other 57 0.8

Rankin & Associates Consulting Grand Valley Climate Assessment Project
Final Report
139
Table B10 Are you, or have you ever been, a member of the U.S. armed forces? (Question 39) Military/Veteran Status
n
%
I am not in the military 7326 96.8 Active military status 23 0.3 Veteran status 160 2.1 Missing 62 0.8 Table B11 Students Only: What is the highest level of education achieved by your parent(s)/legal guardian(s)? (Question 40)
Level of Education
Parent /Legal Guardian 1
n
%
Parent/Legal Guardian 2
n
%
No high school 121 2.0 126 2.1
High school 1357 22.5 1335 22.1
Some college 1070 17.7 1030 17.0
Business/Technical certificate/degree 295 4.9 401 6.6
Associate’s degree 566 9.4 640 10.6
Bachelor’s degree 1377 22.8 1396 23.1
Some graduate work 133 2.2 153 2.5
Master’s degree 808 13.4 603 10.0
Doctoral degree 193 3.2 101 1.7
Other professional degree 49 0.8 61 1.0
Unknown 25 0.4 73 1.2
Not applicable 16 0.3 45 0.7
Missing 33 0.5 79 1.3 Note: Table includes only those respondents who indicated they were students in Question 1 (n = 6043). 19 respondents that selected “Other” in Question 1 were recoded as students. They did not answer this question, and so are included in the “Missing” row.

Rankin & Associates Consulting Grand Valley Climate Assessment Project
Final Report
140
Table B12 Faculty/Staff Only: What is your highest completed level of education? (Question 41) Level of Education
n
%
Did not complete high school 2 0.1 Completed high school 31 2.0 Business/Technical certificate/degree 11 0.7 Some college 109 7.2 Associate’s degree 50 3.3 Bachelor’s degree 211 13.8 Some graduate work 115 7.5 Master’s degree 469 30.8 Doctoral degree 479 31.4 Terminal Professional degree 22 1.4 Other professional certificate 6 0.4 Missing 19 0.2 Note: Table includes only those respondents who indicated they were faculty or staff in Question 1 (n = 1524).

Rankin & Associates Consulting Grand Valley Climate Assessment Project
Final Report
141
Table B13 Faculty Only: With which college are you primarily affiliated at this time? (Question 42) Academic Department(s)/Program(s)
n
%
College of Liberal Arts and Sciences 404 56.3
Seidman College of Business 51 7.1
College of Community and Public Service 53 7.4
College of Education 54 7.5
Padnos College of Engineering and Computing 29 4.0
College of Health Professions 34 4.7
Brooks College of Interdisciplinary Studies 26 3.6
Kirkof College of Nursing 24 3.3
University Libraries 20 2.8 Note: Table includes only those respondents who indicated they were faculty in Question 1 (n = 718).
Table B14 Staff Only: With which division are you primarily affiliated at this time? (Question 43) Academic Department(s)/Program(s)
n
%
President’s Office 24 3.0
Academic and Student Affairs Division 466 63.1
Finance and Administration Division 158 21.4
University Development Division 31 4.2
University Relations Division 52 7.0
Inclusion and Equity Division 7 0.9
Missing 68 8.4 Note: Table includes only those respondents who indicated they were staff in Question 1 (n = 806).

Rankin & Associates Consulting Grand Valley Climate Assessment Project
Final Report
142
Table B15 Undergraduate Students Only: Please select your declared academic major? (Two choices allowed) (Question 44)
Major
n
%
Non-degree 6 0.1 Undeclared 185 3.6 Accounting 180 3.5 Advertising/Public Relations 135 2.6 Anthropology 48 0.9 Art and Design 62 1.2 Art-Studio 21 0.4 Art Education 13 0.3 Art History 5 0.1 Athletic Training 48 0.9 Behavioral Science 15 0.3 Biology 171 3.3 Biomedical Science 345 6.7 Biopsychology 13 0.3 Broadcasting 45 0.9 Business Economics 19 0.4 Business 211 4.1 Cell and Molecular Biology 19 0.4 Chemistry 52 1.0 Chinese Studies 4 0.1 Classics 14 0.3 Classical Tradition 5 0.1 Clinical Laboratory Science 33 0.6 Communication Studies 51 1.0 Communications 31 0.6 Computer Science 101 2.0 Comprehensive Science and Arts for Teaching 17 0.3 Criminal Justice 169 3.3 Dance 9 0.2 Diagnostic Medical Sonography 23 0.4 Earth Science 8 0.2 Economics 40 0.8 Education 371 7.2
Major
n
%
Group Social Studies 57 1.1 Health Communications 40 0.8 Health Professions 229 4.4 Health Science 6 0.1 History 79 1.5 Hospitality Tourism Management 172 3.3 Information Science 51 1.0 International Business 51 1.0 International Relations 62 1.2 Journalism 29 0.6 Latin 0 0.0 Legal Studies 30 0.6 Liberal Studies 76 1.5 Management 117 2.3 Marketing 130 2.5 Mathematics 137 2.6 Medical Imaging/ Radiation Science 9 0.2 Music 59 1.1 Natural Resources Management 61 1.2 Nursing 333 6.4 Occupational Safety/ Health Management 21 0.4 Philosophy 34 0.7 Photography 30 0.6 Physical Education 60 1.2 Physics 20 0.4 Political Science 75 1.5 Pre-Business 27 0.5 Psychology 373 7.2 Psychology - Special Education 64 1.2 Public Administration 86 1.7 Radiation Therapy 21 0.4

Rankin & Associates Consulting Grand Valley Climate Assessment Project
Final Report
143
Engineering 113 2.2 English 225 4.4 Exercise Science 162 3.1 Film and Video 92 1.8 Finance 130 2.5 French 23 0.4 Geography 19 0.4 Geology 20 0.4 Geology-Chemistry 0 0.0 German 15 0.3 Greek 0 0.0 Group Science 3 0.1
Radiology & Imaging Science 46 0.9 Russian Studies 8 0.2 Social Work 117 2.3 Sociology 50 1.0 Spanish 101 2.0 Statistics 44 0.9 Supply Chain Management 14 0.3 Theatre 13 0.3 Therapeutic Recreation 31 0.6 Women & Gender Studies 36 0.7 Writing 78 1.5
Note: Table includes only those respondents who indicated they were undergraduate students in Question 1 (n = 5171).
Rankin & Associates Consulting Grand Valley Climate Assessment Project
Final Report
144
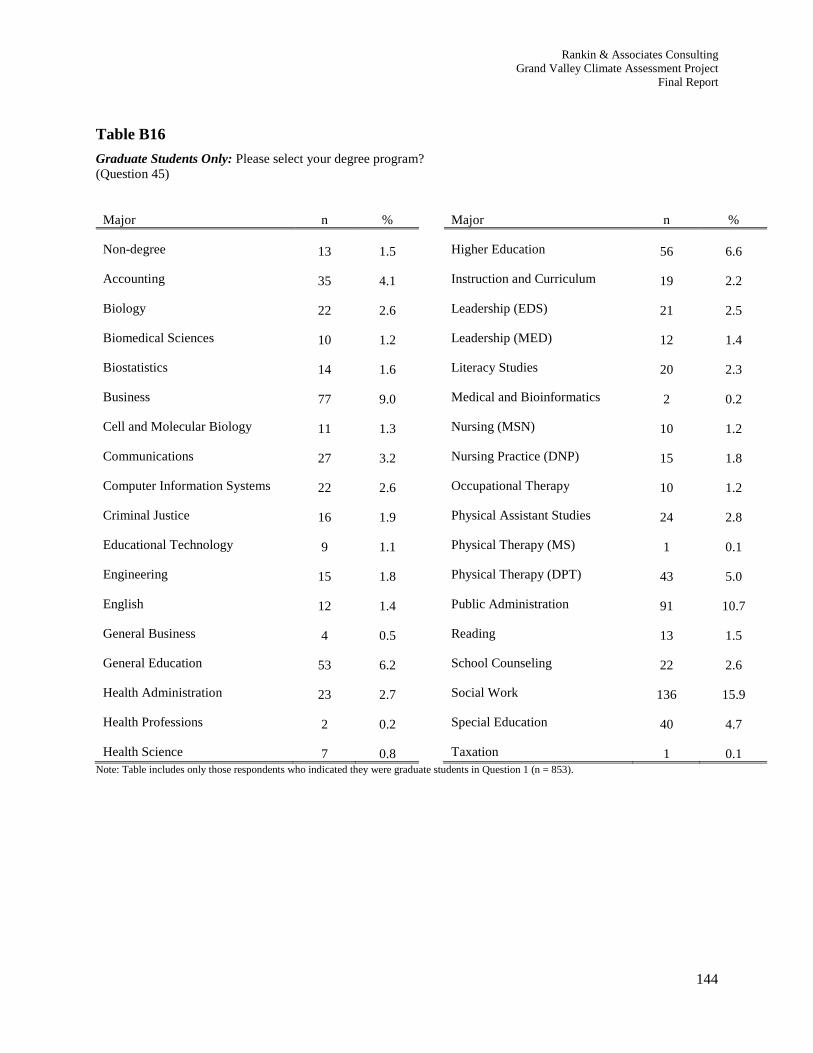
Table B16 Graduate Students Only: Please select your degree program? (Question 45)
Major
n
%
Non-degree 13 1.5
Accounting 35 4.1
Biology 22 2.6
Biomedical Sciences 10 1.2
Biostatistics 14 1.6
Business 77 9.0
Cell and Molecular Biology 11 1.3
Communications 27 3.2
Computer Information Systems 22 2.6
Criminal Justice 16 1.9
Educational Technology 9 1.1
Engineering 15 1.8
English 12 1.4
General Business 4 0.5
General Education 53 6.2
Health Administration 23 2.7
Health Professions 2 0.2
Health Science 7 0.8
Major
n
%
Higher Education 56 6.6
Instruction and Curriculum 19 2.2
Leadership (EDS) 21 2.5
Leadership (MED) 12 1.4
Literacy Studies 20 2.3
Medical and Bioinformatics 2 0.2
Nursing (MSN) 10 1.2
Nursing Practice (DNP) 15 1.8
Occupational Therapy 10 1.2
Physical Assistant Studies 24 2.8
Physical Therapy (MS) 1 0.1
Physical Therapy (DPT) 43 5.0
Public Administration 91 10.7
Reading 13 1.5
School Counseling 22 2.6
Social Work 136 15.9
Special Education 40 4.7
Taxation 1 0.1
Note: Table includes only those respondents who indicated they were graduate students in Question 1 (n = 853).

Rankin & Associates Consulting Grand Valley Climate Assessment Project
Final Report
145
Table B17 Do you have a disability that substantially affects a major life activity? (mark all that apply) (Question 46) Disability
n
%
No disability 6665 88.0
Physical condition 204 2.7
Learning disability 149 2.0
Psychological condition 575 7.6 Note: Percentages do not sum to 100% due to multiple responses.
Table B18 Are you registered with Disability Support Services? (Question 47) Disability
n
%
Yes 184 21.5
No 670 78.5 Note: Table includes only those respondents who indicated they have a disability in Question 46 (n = 854). Table B19 What is your citizenship status? (Question 48) Citizenship Status
n
%
U.S. born citizen 7104 93.8 U.S. citizen - naturalized 162 2.1 Dual citizenship 56 0.7 Permanent resident (immigrant) 105 1.4 Permanent resident (refugee) 0 0.0 International (F-1, J-1, or H1-B, or other visa) 99 1.3 Other 12 0.2 Missing 33 0.4

Rankin & Associates Consulting Grand Valley Climate Assessment Project
Final Report
146
Table B20 What is your religious or spiritual affiliation? (Question 49)
Spiritual Affiliation n %
Animist 3 0.0
Anabaptist 2 0.0
Agnostic 442 5.8
Assembly of God 43 0.6
Atheist 362 4.8
Baha’i 2 0.0
Baptist 306 4.0
Buddhist 42 0.6
Christian and Missionary Alliance 52 0.7
Christian Disciples 119 1.6
Christian Orthodox 151 2.0
Christian Reformed Church of America 459 6.1
Church of God 52 0.7
Confucianist 1 0.0
Druid 4 0.1
Episcopalian 65 0.9
Hindu 21 0.3
Jehovah’s Witness 6 0.1
Jewish 48 0.6
Independent 17 0.2
Latter Day Saints (Mormon) 10 0.1
Lutheran 398 5.3
Mennonite 2 0.0
Methodist 315 4.2
Moravian 1 0.0
Spiritual Affiliation n %
Muslim 39 0.5
Native American Traditional Practitioner 4 0.1
Nondenominational Christian 680 9.0
Pagan 14 0.2
Pentecostal 55 0.7
Presbyterian 176 2.3
Quaker 6 0.1
Reformed Church of America 168 2.2
Roman Catholic 1412 18.7
Seventh Day Adventist 17 0.2
Shamanist 2 0.0
Shinto 0 0.0
Sikh 2 0.0
Taoist 4 0.1
Unitarian Universalist 28 0.4
United Church of Christ 56 0.7
Wiccan 11 0.1
Zoroastrianism 1 0.0
Other Christian 495 6.5
Other non-Christian 3 0.0
Spiritual, but no religious affiliation 489 6.5
No affiliation 782 10.3
Other 102 1.3
Missing 102 1.3

Rankin & Associates Consulting Grand Valley Climate Assessment Project
Final Report
147
Table B21 Faculty/Staff Only: How long have you been employed by Grand Valley State? (Question 50) Time
n
%
Less than 2 years 226 14.8 2-4 years 285 18.7 5-10 years 469 30.8 11-15 years 263 17.3 16-20 years 116 7.6 21-30 years 110 7.2 31+ years 38 2.5 Missing 17 1.1 Note: Table includes only those respondents who indicated they were faculty or staff in Question 1 (n = 1524).
Table B22 Undergraduate Students Only: Where are you in your college career? (Question 51) Place in College Career
n
%
First year student 1051 20.3
Second year student 1005 19.4
Third year student 1313 25.4
Fourth year student 1259 24.3
Fifth year student or beyond 436 8.4
Second degree student 49 0.9
Other 51 1.0
Missing 7 0.1 Note: Table includes only those respondents who indicated they were undergraduate students in Question 1 (n = 5171).

Rankin & Associates Consulting Grand Valley Climate Assessment Project
Final Report
148
Table B23 Students Only: are you currently dependent (family/guardian is assisting with your living/educational expenses) or independent (you are the sole provider for your living/educational expenses)? (Question 52) Status
n
%
Dependent 3871 64.1 Independent 2057 34.0 Missing 115 1.9 Note: Table includes only those respondents who indicated they were students in Question 1 (n = 6043). 19 respondents that selected “Other” in Question 1 were recoded as students. They did not answer this question, and so are included in the “Missing” row. Table B24 Students Only: What is your best estimate of your family’s yearly income (if partnered, married, or a dependent student) or your yearly income (if single or an independent student)? (Question 53) Income
n
%
Below $29,999 1536 25.4 $30,000-$39, 999 481 8.0 $40,000-$59,999 900 14.9 $60,000 - $79,999 914 15.1 $80,000 - $99,999 743 12.3 $100,000 - $129,000 697 11.5 $130,000 - $199,000 368 6.1 $200,000 - $249,000 107 1.8 $250,000 and above 138 2.3 Missing 159 2.6 Note: Table includes only those respondents who indicated they were students in Question 1 (n = 6043). 19 respondents that selected “Other” in Question 1 were recoded as students. They did not answer this question, and so are included in the “Missing” row.

Rankin & Associates Consulting Grand Valley Climate Assessment Project
Final Report
149
Table B25 Students Only: Where do you live? (Question 54) Residence
n
%
On-campus 1731 28.6 Off-campus 4263 70.5 Missing 49 0.8 Note: Table includes only those respondents who indicated they were students in Question 1 (n = 6043). 19 respondents that selected “Other” in Question 1 were recoded as students. They did not answer this question, and so are included in the “Missing” row.
Table B26 Students Only: are you employed while you are enrolled as a student at GVSU? (Question 55) Employed
n
%
No 2330 38.6 Yes, on-campus 1037 17.2 Yes, off-campus 2392 39.6 Yes, both on and off campus 244 4.0 Missing 40 0.7 Note: Table includes only those respondents who indicated they were students in Question 1 (n = 6043). 19 respondents that selected “Other” in Question 1 were recoded as students. They did not answer this question, and so are included in the “Missing” row.

Rankin & Associates Consulting Grand Valley Climate Assessment Project
Final Report
150
Table B27 Students Only: How are you primarily paying for college? (Rank all that apply) (Question 57) Primary Method of Payment
1 2 3 4 5
n % n % n % n % n % Loans 2119 48.4 621 14.2 406 9.3 384 8.8 852 19.4 Pell Grant 626 22.1 926 32.7 370 13.1 468 16.5 442 15.6 Family contribution 1107 27.3 837 20.6 571 14.1 591 14.6 953 23.5 Personal contribution/Job 674 16.5 118 27.3 1106 27.0 810 19.8 383 9.4 Grand Valley State scholarship/grant/ tuition remission 626 17.9 814 23.2 1023 29.2 645 18.4 395 11.3 Note: Table includes only those respondents who answered that they were students in Question 1 (n = 6043).

Rankin & Associates Consulting Grand Valley Climate Assessment Project
Final Report
151
Table B28 Students Only: Do you participate in any of the following organizations at GVSU? (Mark all that apply) (Question 59) Organization
n
%
I do not participate in any organizations 2474 40.9
Academic and Professional 1227 20.3
Cultural 341 5.6
Fraternities and Sororities 510 8.4
Performing Arts 342 5.7
Faith Based 644 10.7
Service & Advocacy 588 9.7
Special Interest 395 6.5
Sports and Recreation 1058 17.5
Student Government 89 1.5
Media 94 1.6
Honorary and Professional Societies 356 5.9
Other 7 0.1 Note: Table includes only those respondents who answered that they were students in Question 1 (n = 6043). Percentages may not sum to 100% due to multiple responses.

Rankin & Associates Consulting Grand Valley Climate Assessment Project
Final Report
152
Table B29 In what environment did you grow up? (Question 60) Environment
n
%
Farm/ranch 396 5.2 Rural, non-farm 939 12.4 Small-town 2022 26.7 Suburban 2808 37.1 Urban 755 10.0 I grew up in multiple types of environments 605 8.0 Other 20 0.3 Missing 26 0.3 Table B30 How would you characterize your political views? (Question 61) Political Views
n
%
Far left 170 2.2 Liberal 2036 26.9 Moderate 2126 28.1 Conservative 1753 23.2 Far right 45 0.6 Non-committal 1069 14.1 Other 257 3.4 Missing 115 1.5

Rankin & Associates Consulting Grand Valley Climate Assessment Project
Final Report
153
Table B31 What is your native language? (Question 62) Native Language
n
%
American Sign Language 9 0.1
Arabic 22 0.3
Armenian 19 0.3
Cambodian, Mon-Khmer 2 0.0
Cantonese 2 0.0
Chinese 22 0.3
English only 6860 90.6
English and other(s) 334 4.4
French 20 0.3
French Creole 1 0.0
German 15 0.2
Greek 2 0.0
Hebrew 3 0.0
Hindi 16 0.2
Hmong 4 0.1
Italian 5 0.1
Japanese 3 0.0
Korean 12 0.2
Laotian 0 0.0
Mandarin 1 0.0
Navajo 0 0.0
Persian 1 0.0
Polish 8 0.1
Portuguese 6 0.1
Russian 6 0.1
Spanish 76 1.0
Urdu 3 0.0
Vietnamese 15 0.2
Tagalog 1 0.0
Yoruba, Kru, Igbo 1 0.0
Other 68 0.9
Rankin & Associates Consulting Grand Valley Climate Assessment Project
Final Report
154
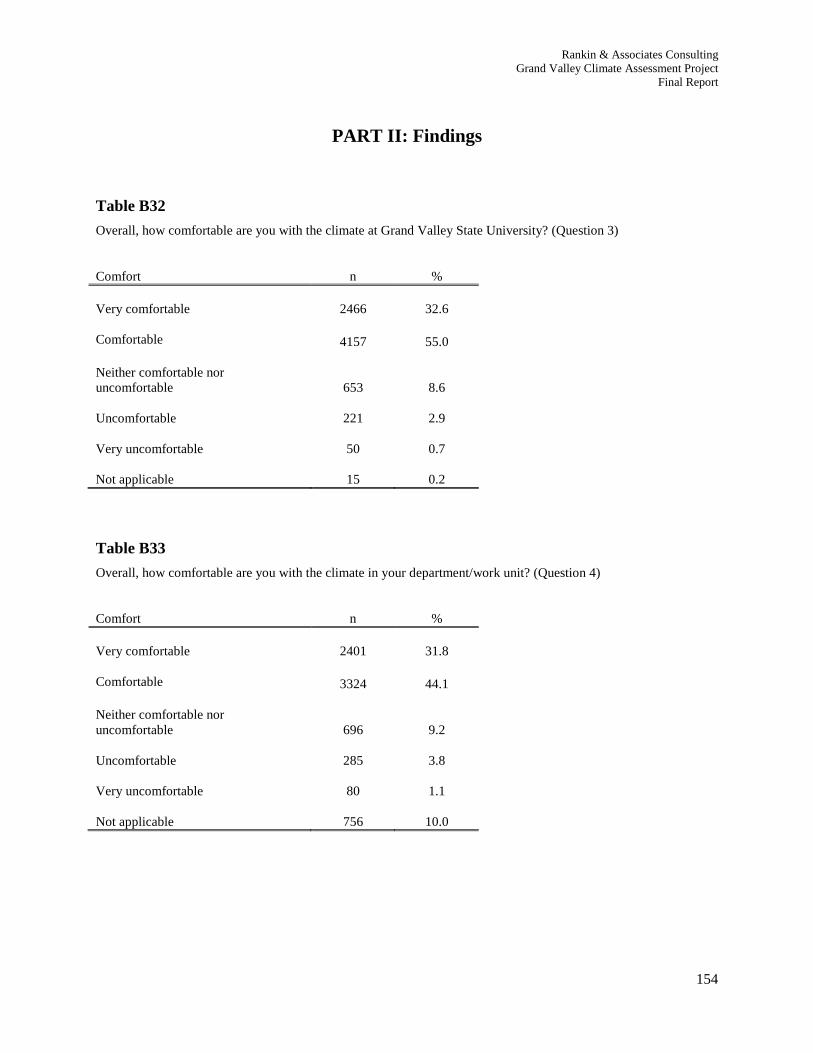
PART II: Findings
Table B32 Overall, how comfortable are you with the climate at Grand Valley State University? (Question 3) Comfort n % Very comfortable 2466 32.6 Comfortable 4157 55.0 Neither comfortable nor uncomfortable 653 8.6 Uncomfortable 221 2.9 Very uncomfortable 50 0.7 Not applicable 15 0.2
Table B33 Overall, how comfortable are you with the climate in your department/work unit? (Question 4) Comfort n % Very comfortable 2401 31.8 Comfortable 3324 44.1 Neither comfortable nor uncomfortable 696 9.2 Uncomfortable 285 3.8 Very uncomfortable 80 1.1 Not applicable 756 10.0
Rankin & Associates Consulting Grand Valley Climate Assessment Project
Final Report
155
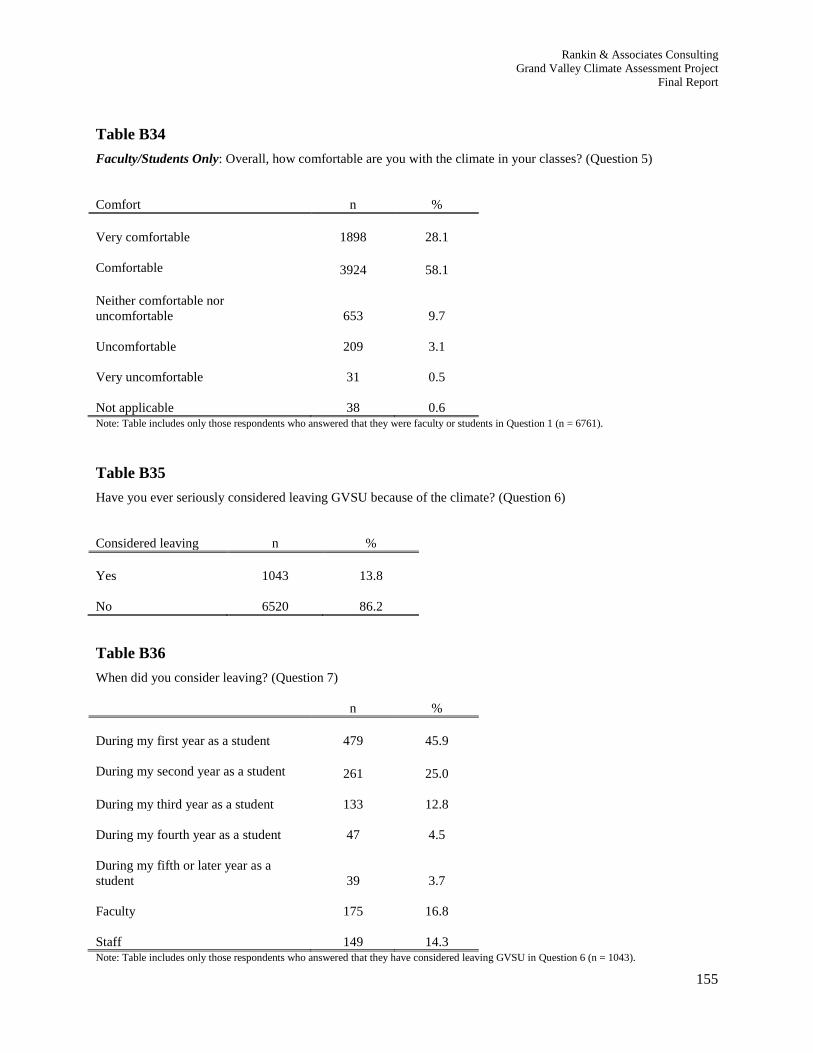
Table B34 Faculty/Students Only: Overall, how comfortable are you with the climate in your classes? (Question 5) Comfort n % Very comfortable 1898 28.1 Comfortable 3924 58.1 Neither comfortable nor uncomfortable 653 9.7 Uncomfortable 209 3.1 Very uncomfortable 31 0.5 Not applicable 38 0.6 Note: Table includes only those respondents who answered that they were faculty or students in Question 1 (n = 6761).
Table B35 Have you ever seriously considered leaving GVSU because of the climate? (Question 6) Considered leaving n % Yes 1043 13.8 No 6520 86.2 Table B36 When did you consider leaving? (Question 7) n % During my first year as a student 479 45.9 During my second year as a student 261 25.0 During my third year as a student 133 12.8 During my fourth year as a student 47 4.5 During my fifth or later year as a student 39 3.7 Faculty 175 16.8 Staff 149 14.3 Note: Table includes only those respondents who answered that they have considered leaving GVSU in Question 6 (n = 1043).

Rankin & Associates Consulting Grand Valley Climate Assessment Project
Final Report
156
Table B37 Within the past year, have you personally experienced any exclusionary (e.g., shunned, ignored) intimidating, offensive, and/or hostile conduct (harassing behavior) that has interfered with your ability to work or learn at GVSU? (Question 9) Experienced n % Yes 859 11.4 No 6704 88.6
Rankin & Associates Consulting Grand Valley Climate Assessment Project
Final Report
157
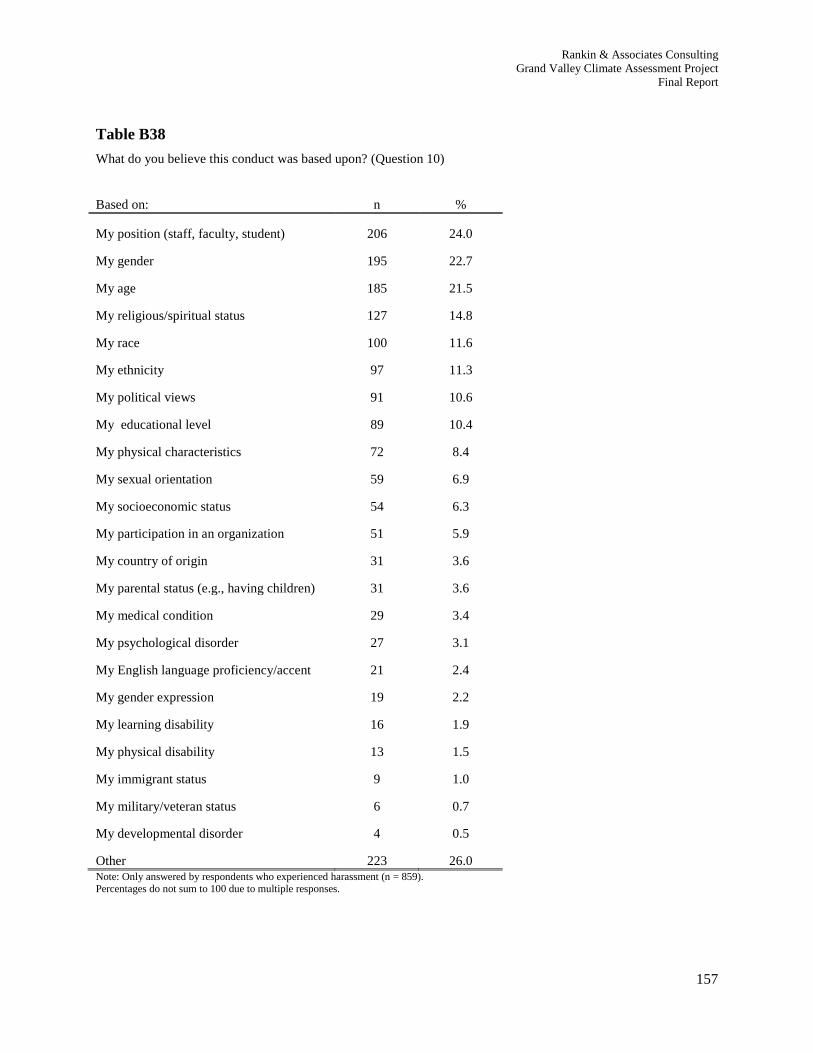
Table B38 What do you believe this conduct was based upon? (Question 10) Based on:
n
%
My position (staff, faculty, student) 206 24.0
My gender 195 22.7
My age 185 21.5
My religious/spiritual status 127 14.8
My race 100 11.6
My ethnicity 97 11.3
My political views 91 10.6
My educational level 89 10.4
My physical characteristics 72 8.4
My sexual orientation 59 6.9
My socioeconomic status 54 6.3
My participation in an organization 51 5.9
My country of origin 31 3.6
My parental status (e.g., having children) 31 3.6
My medical condition 29 3.4
My psychological disorder 27 3.1
My English language proficiency/accent 21 2.4
My gender expression 19 2.2
My learning disability 16 1.9
My physical disability 13 1.5
My immigrant status 9 1.0
My military/veteran status 6 0.7
My developmental disorder 4 0.5
Other 223 26.0 Note: Only answered by respondents who experienced harassment (n = 859). Percentages do not sum to 100 due to multiple responses.

Rankin & Associates Consulting Grand Valley Climate Assessment Project
Final Report
158
Table B39 How did you experience this conduct? (Question 11) Form
n
%
I was deliberately ignored or excluded 399 46.4
Intimidation/bullying 355 41.3
I felt isolated or left out 338 39.3
Stares 164 19.1
Target of derogatory remarks 155 18.0
I felt isolated or left out when working in groups 154 17.9
I feared getting a poor grade because of hostile classroom environment 132 15.4
I received a low performance evaluation 87 10.1
Derogatory/unsolicited e-mails 74 8.6
I feared for my physical safety 67 7.8
Derogatory written comments 57 6.6
I was singled out as the “resident authority” regarding their identity 39 4.5
Target of racial/ethnic profiling 33 3.8
Assumption that I was admitted/hired/ promoted due to my identity 31 3.6
Derogatory phone calls 20 2.3
Threats of physical violence 17 2.0
Graffiti/vandalism 14 1.6
Victim of a crime 14 1.6
I feared for my family’s safety 11 1.3
Assumption that I was not admitted/hired/promoted due to my identity 10 1.2
Target of physical violence 4 0.5
Other 139 16.2 Note: Only answered by respondents who experienced harassment (n = 859). Percentages do not sum to 100 due to multiple responses.

Rankin & Associates Consulting Grand Valley Climate Assessment Project
Final Report
159
Table B40 Where did this conduct occur? (Question 12) Location
n
%
In a class 322 37.5 In a meeting with a group of people 194 22.6 Public space on campus 154 17.9 While working at a campus job 146 17.0 Campus housing 124 14.4 Campus office 115 13.4 Faculty office 97 11.3 Campus event 81 9.4 In a meeting with one other person 79 9.2 While walking on campus 65 7.6 On a social networking site/Facebook/ Twitter/cell phone/other form of technological communication 53 6.2 Off-campus housing 41 4.8 Campus dining facility 40 4.7 Off campus (other than off campus housing) 33 3.8 Athletic facilities 16 1.9 Other 62 7.2 Note: Only answered by respondents who experienced harassment (n = 859). Percentages do not sum to 100 due to multiple responses.

Rankin & Associates Consulting Grand Valley Climate Assessment Project
Final Report
160
Table B41 Who was the source of this conduct? (Question 13) Source
n
%
Faculty member 285 33.2
Administrator 137 15.9
Co-worker 131 15.3
Stranger 127 14.8
Friend 104 12.1
Department head 98 11.4
Staff member 88 10.2
Supervisor 72 8.4
Don’t know source 54 6.3
Campus visitor(s) 24 2.8
Faculty advisor 24 2.8
Social networking site (Facebook, Twitter, etc.) 22 2.6
Public Safety/Security officer 20 2.3
Campus media 15 1.7
Off campus community member 13 1.5
Person that I supervise 10 1.2
Alumni 7 0.8
Teaching Assistant/Writing associate/Lab assistant/Tutor 7 0.8
Athletic coach 4 0.5
Donor 4 0.5
Partner/spouse 3 0.3
Other 205 23.9 Note: Only answered by respondents who experienced harassment (n = 859). Percentages do not sum to 100 due to multiple responses.
Rankin & Associates Consulting Grand Valley Climate Assessment Project
Final Report
161
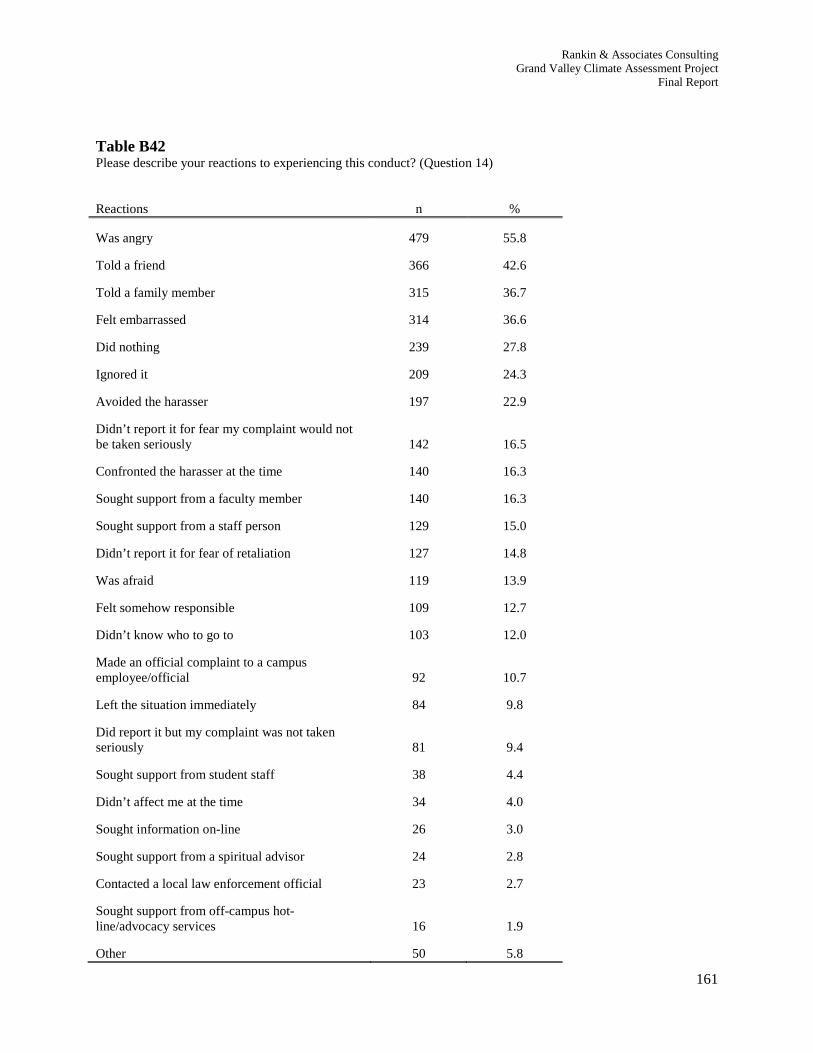
Table B42 Please describe your reactions to experiencing this conduct? (Question 14) Reactions
n
%
Was angry 479 55.8
Told a friend 366 42.6
Told a family member 315 36.7
Felt embarrassed 314 36.6
Did nothing 239 27.8
Ignored it 209 24.3
Avoided the harasser 197 22.9
Didn’t report it for fear my complaint would not be taken seriously 142 16.5
Confronted the harasser at the time 140 16.3
Sought support from a faculty member 140 16.3
Sought support from a staff person 129 15.0
Didn’t report it for fear of retaliation 127 14.8
Was afraid 119 13.9
Felt somehow responsible 109 12.7
Didn’t know who to go to 103 12.0
Made an official complaint to a campus employee/official 92 10.7
Left the situation immediately 84 9.8
Did report it but my complaint was not taken seriously 81 9.4
Sought support from student staff 38 4.4
Didn’t affect me at the time 34 4.0
Sought information on-line 26 3.0
Sought support from a spiritual advisor 24 2.8
Contacted a local law enforcement official 23 2.7
Sought support from off-campus hot-line/advocacy services 16 1.9
Other 50 5.8
Rankin & Associates Consulting Grand Valley Climate Assessment Project
Final Report
162
Note: Only answered by respondents who experienced harassment (n = 859). Percentages do not sum to 100 due to multiple responses.
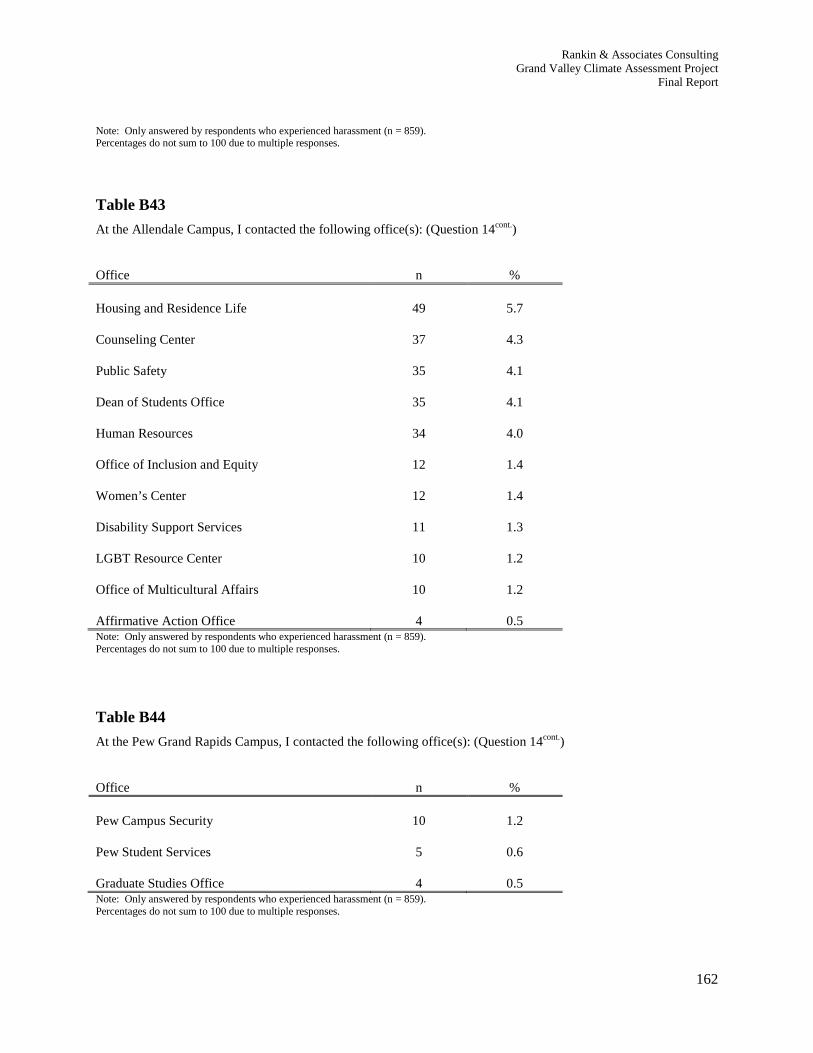
Table B43 At the Allendale Campus, I contacted the following office(s): (Question 14cont.) Office
n
%
Housing and Residence Life 49 5.7
Counseling Center 37 4.3
Public Safety 35 4.1
Dean of Students Office 35 4.1
Human Resources 34 4.0
Office of Inclusion and Equity 12 1.4
Women’s Center 12 1.4
Disability Support Services 11 1.3
LGBT Resource Center 10 1.2
Office of Multicultural Affairs 10 1.2
Affirmative Action Office 4 0.5 Note: Only answered by respondents who experienced harassment (n = 859). Percentages do not sum to 100 due to multiple responses. Table B44 At the Pew Grand Rapids Campus, I contacted the following office(s): (Question 14cont.) Office
n
%
Pew Campus Security 10 1.2
Pew Student Services 5 0.6
Graduate Studies Office 4 0.5 Note: Only answered by respondents who experienced harassment (n = 859). Percentages do not sum to 100 due to multiple responses.

Rankin & Associates Consulting Grand Valley Climate Assessment Project
Final Report
163
Table B45 Have you ever been a victim of sexual assault while at GVSU? (Question 16)
Been a victim of sexual assault n % Yes 154 2.0 No 7411 98.0

Rankin & Associates Consulting Grand Valley Climate Assessment Project
Final Report
164
Table B46 Who was the offender(s)? Mark all that apply. (Question 17) Source
n
%
Student 60 39.0
Friend 56 36.4
Acquaintance 50 32.5
Stranger 23 14.9
Significant other 7 4.5
Co-worker 6 3.9
Partner/spouse 6 3.9
Faculty member 4 2.6
Staff member 2 1.3
Supervisor 2 1.3
Financial donor 1 0.6
Tutor/Graduate assistant/Lab assistant 1 0.6
Administrator 0 0.0
Alumni 0 0.0
Athletic coach 0 0.0
Department chair 0 0.0
Faculty advisor 0 0.0
Person that I supervise 0 0.0
Public Safety/Security officer 0 0.0
Residence life staff 0 0.0
Other 14 9.1 Note: Only answered by respondents who experienced sexual harassment (n = 154). Percentages do not sum to 100 due to multiple responses.
Rankin & Associates Consulting Grand Valley Climate Assessment Project
Final Report
165
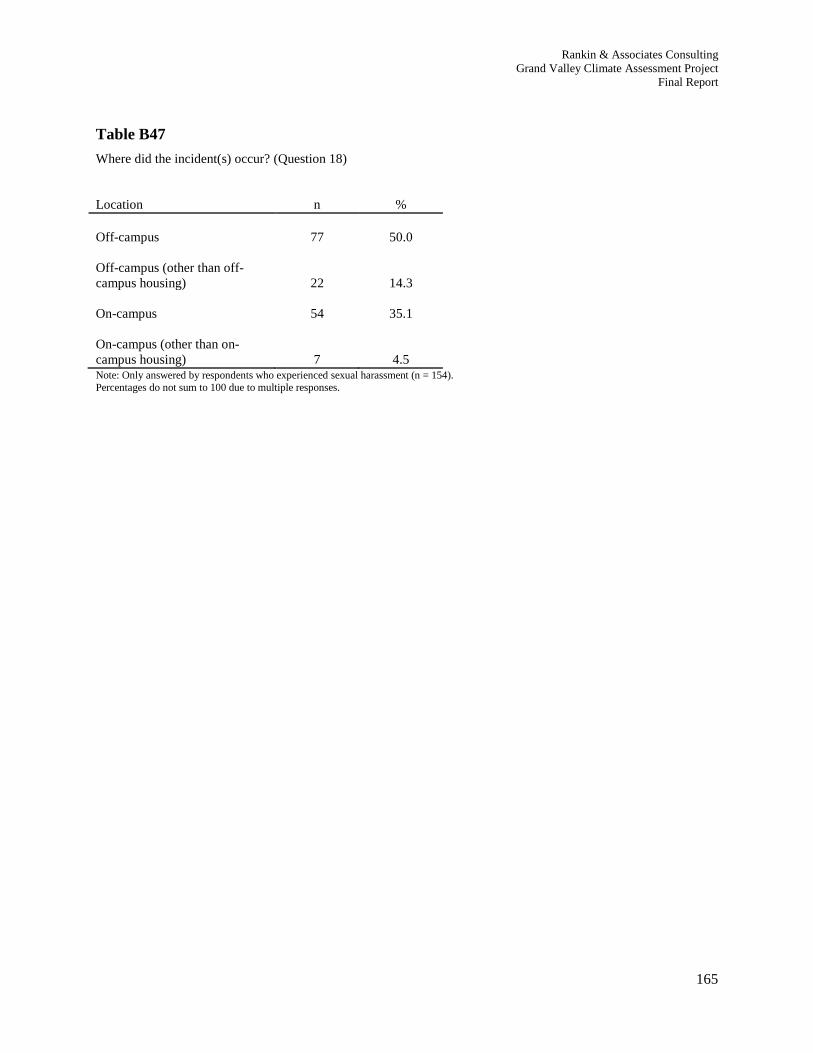
Table B47 Where did the incident(s) occur? (Question 18)
Location n % Off-campus 77 50.0 Off-campus (other than off-campus housing) 22 14.3 On-campus 54 35.1 On-campus (other than on-campus housing) 7 4.5 Note: Only answered by respondents who experienced sexual harassment (n = 154). Percentages do not sum to 100 due to multiple responses.
Rankin & Associates Consulting Grand Valley Climate Assessment Project
Final Report
166
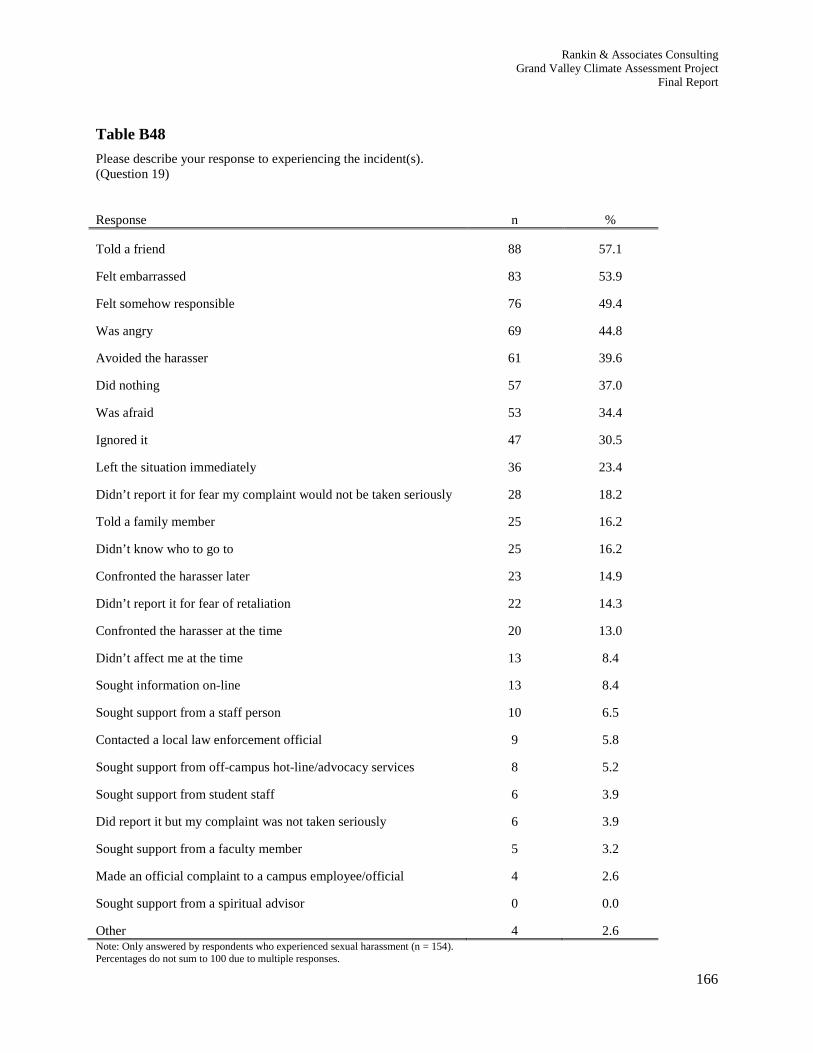
Table B48 Please describe your response to experiencing the incident(s). (Question 19) Response
n
%
Told a friend 88 57.1
Felt embarrassed 83 53.9
Felt somehow responsible 76 49.4
Was angry 69 44.8
Avoided the harasser 61 39.6
Did nothing 57 37.0
Was afraid 53 34.4
Ignored it 47 30.5
Left the situation immediately 36 23.4
Didn’t report it for fear my complaint would not be taken seriously 28 18.2
Told a family member 25 16.2
Didn’t know who to go to 25 16.2
Confronted the harasser later 23 14.9
Didn’t report it for fear of retaliation 22 14.3
Confronted the harasser at the time 20 13.0
Didn’t affect me at the time 13 8.4
Sought information on-line 13 8.4
Sought support from a staff person 10 6.5
Contacted a local law enforcement official 9 5.8
Sought support from off-campus hot-line/advocacy services 8 5.2
Sought support from student staff 6 3.9
Did report it but my complaint was not taken seriously 6 3.9
Sought support from a faculty member 5 3.2
Made an official complaint to a campus employee/official 4 2.6
Sought support from a spiritual advisor 0 0.0
Other 4 2.6 Note: Only answered by respondents who experienced sexual harassment (n = 154). Percentages do not sum to 100 due to multiple responses.

Rankin & Associates Consulting Grand Valley Climate Assessment Project
Final Report
167
Table B49 At the Allendale Campus, I contacted the following office(s): (Question 19cont.) Office
n
%
Counseling Center 17 11.0
Public Safety 7 4.5
Women’s Center 6 3.9
Housing and Residence Life 2 1.3
Dean of Students Office 1 0.6
Office of Inclusion and Equity 0 0.0
Affirmative Action Office 0 0.0
Disability Support Services 0 0.0
LGBT Resource Center 0 0.0
Human Resources 0 0.0
Office of Multicultural Affairs 0 0.0 Note: Only answered by respondents who experienced harassment (n = 154). Percentages do not sum to 100 due to multiple responses. Table B50 At the Pew Grand Rapids Campus, I contacted the following office(s): (Question 19cont.) Office
n
%
Pew Campus Security 1 0.6
Graduate Studies Office 1 0.6
Pew Student Services 0 0.0 Note: Only answered by respondents who experienced harassment (n = 154). Percentages do not sum to 100 due to multiple responses.

Rankin & Associates Consulting Grand Valley Climate Assessment Project
Final Report
168
Table B51 Faculty/Staff Only: As a faculty/staff member… (Question 22)
Issues
Strongly agree n %
Agree
n %
Neither agree nor disagree
n %
Disagree n %
Strongly disagree n %
Not applicable n %
I am reluctant to bring up issues that concern me for fear that it will affect my performance evaluation or tenure decision 124 8.2 251 16.6 230 15.2 476 31.5 375 24.8 56 3.7
I feel that supervisors/managers consistently communicate/interpret/implement/GVSU policies 229 15.2 694 46.1 278 18.4 206 13.7 88 5.8 12 0.8
I am comfortable asking questions about performance expectations with my supervisor 482 31.9 686 45.4 147 9.7 119 7.9 67 4.4 11 0.7
My colleagues/co-workers expect me to represent “the point of view” of my identity 71 4.7 252 16.8 529 35.4 335 22.4 187 12.5 122 8.2
My colleagues/co-workers treat me with less respect than other faculty/staff 35 2.3 152 10.1 191 12.7 532 35.3 581 38.6 16 1.1
I constantly feel under scrutiny by my colleagues 42 2.8 164 10.9 238 15.8 560 37.1 495 32.8 12 0.8
I am reluctant to take leave that I am entitled to for fear that it may affect my career 50 3.3 166 11.0 159 10.5 466 30.9 520 34.4 149 9.9
I have to work harder than I believe my colleagues do in order to achieve the same recognition/rewards 114 7.6 196 13.0 242 16.1 508 33.8 427 28.4 18 1.2
I feel that my workload expectations and requirements are similar to that of my colleagues/co-workers at GVSU 203 13.4 703 46.5 209 13.8 256 16.9 132 8.7 9 0.6
My colleagues have higher expectations of me than of other faculty/staff 44 2.9 237 15.8 421 28.1 523 34.9 255 17.0 20 1.3
I believe that salary determinations are fair 124 8.2 542 35.9 337 22.3 311 20.6 169 11.2 25 1.7
I believe that salary determinations are clear 128 8.5 572 37.9 307 20.4 307 30.4 171 11.3 23 1.5
I think the university understands the value of a diverse faculty 322 21.4 812 54.0 202 13.4 99 6.6 52 3.5 16 1.1
I think the university understands the value of a diverse staff 310 20.7 794 53.0 217 14.5 113 7.5 47 3.1 16 1.1

Rankin & Associates Consulting Grand Valley Climate Assessment Project
Final Report
169
Table B51 (con.) Strongly agree
n %
Agree
n %
Neither agree nor disagree
n %
Disagree n %
Strongly disagree n %
Not applicable n %
I feel that a more flexible work arrangement, as a staff member, would be helpful in my performance here at GVSU 185 12.4 326 21.8 412 27.6 185 12.4 64 4.3 322 21.6
My mental and physical well-being is supported by GVSU 290 19.3 812 54.0 238 15.8 103 6.8 48 3.2 13 0.9
I find that my workload is usually manageable 187 12.4 934 61.8 145 9.6 168 11.1 75 5.0 3 0.2 Note: Table includes only those respondents who indicated they were faculty or staff in Question 1 (n = 1524). Table B52 Faculty Only: As a faculty member… (Question 24)
Issues
Strongly agree n %
Agree
n %
Neither agree nor disagree
n %
Disagree n %
Strongly disagree n %
Not applicable n %
I feel pressured to change my methods of teaching to achieve tenure/be promoted 39 5.6 99 14.3 101 14.6 216 31.1 79 11.4 160 23.1
I feel that staff who do not have children are often burdened with work responsibilities beyond those who do have children 74 10.7 251 36.2 92 13.3 99 14.3 33 4.8 145 20.9
I believe that the promotion process is clear 70 10.1 234 33.9 102 14.8 125 18.1 44 6.4 115 16.7
I would feel supported in requesting a pause in the tenure clock according to GVSU’s policy 24 3.5 98 14.2 162 23.5 62 9.0 29 4.2 315 45.7
I believe that the tenure standards are reasonable 89 12.9 256 37.1 116 16.8 53 7.7 15 2.2 161 23.3
I believe that the promotion standards are reasonable 81 11.9 250 36.7 133 19.5 65 9.5 26 3.8 127 18.6
I feel that my workload expectations and requirements are similar to that of my colleagues/co-workers at GVSU 86 12.5 326 47.2 99 14.3 111 16.1 45 6.5 23 3.3
I feel that I am burdened by service responsibilities (committee membership, advising, student group, etc.) beyond those of my colleagues 39 5.7 106 15.4 146 21.2 228 33.0 77 11.2 94 13.6
Rankin & Associates Consulting Grand Valley Climate Assessment Project
Final Report
170
Table B52 (con.) Strongly agree
n %
Agree
n %
Neither agree nor disagree
n %
Disagree n %
Strongly disagree n %
Not applicable n %
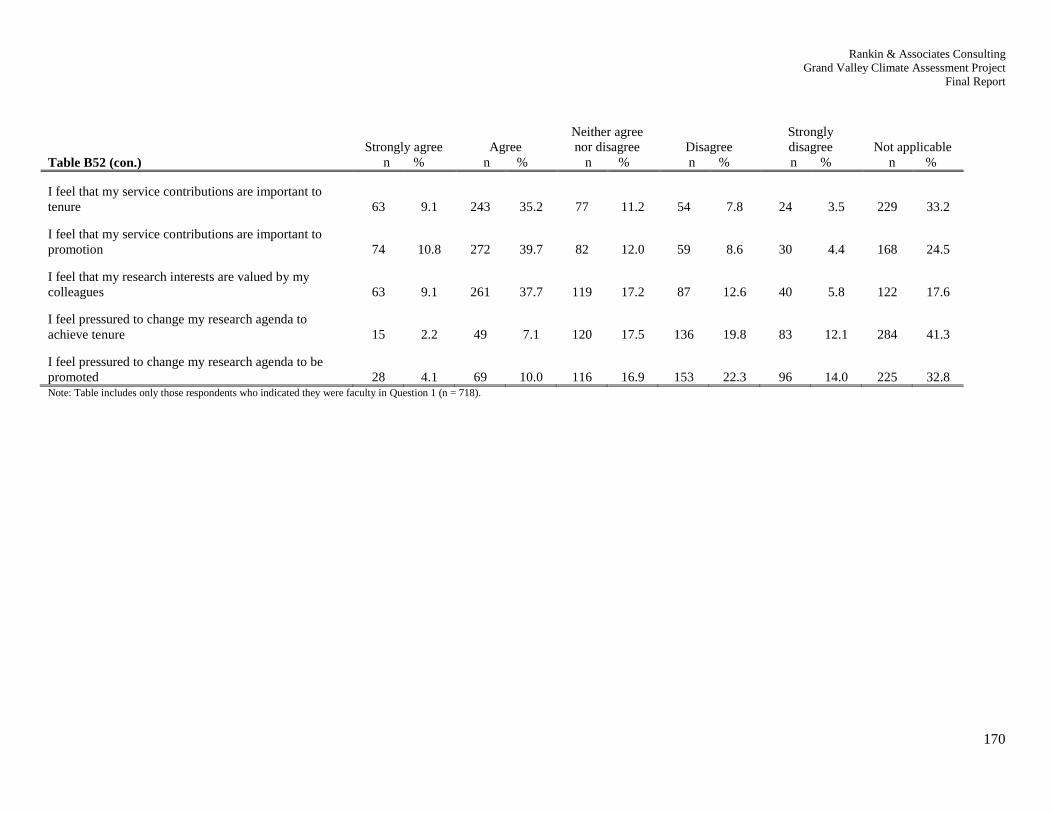
I feel that my service contributions are important to tenure 63 9.1 243 35.2 77 11.2 54 7.8 24 3.5 229 33.2
I feel that my service contributions are important to promotion 74 10.8 272 39.7 82 12.0 59 8.6 30 4.4 168 24.5
I feel that my research interests are valued by my colleagues 63 9.1 261 37.7 119 17.2 87 12.6 40 5.8 122 17.6
I feel pressured to change my research agenda to achieve tenure 15 2.2 49 7.1 120 17.5 136 19.8 83 12.1 284 41.3
I feel pressured to change my research agenda to be promoted 28 4.1 69 10.0 116 16.9 153 22.3 96 14.0 225 32.8 Note: Table includes only those respondents who indicated they were faculty in Question 1 (n = 718).
Rankin & Associates Consulting Grand Valley Climate Assessment Project
Final Report
171
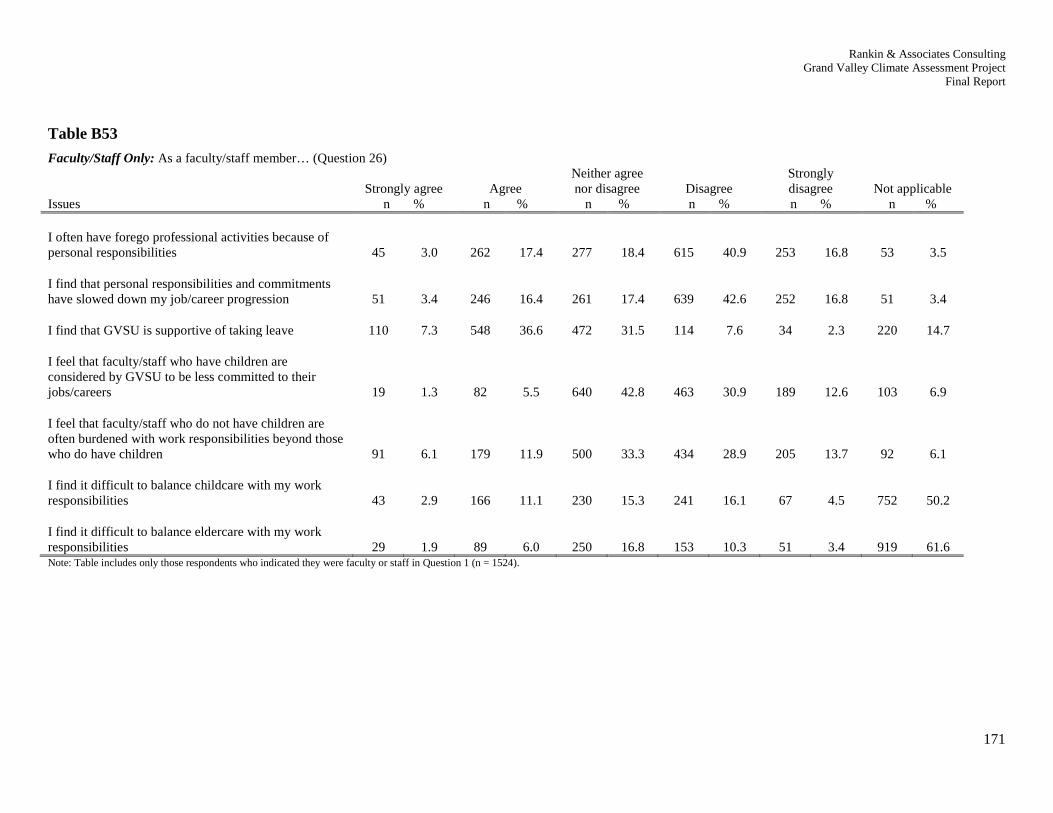
Table B53 Faculty/Staff Only: As a faculty/staff member… (Question 26)
Issues
Strongly agree n %
Agree
n %
Neither agree nor disagree
n %
Disagree n %
Strongly disagree n %
Not applicable n %
I often have forego professional activities because of personal responsibilities 45 3.0 262 17.4 277 18.4 615 40.9 253 16.8 53 3.5
I find that personal responsibilities and commitments have slowed down my job/career progression 51 3.4 246 16.4 261 17.4 639 42.6 252 16.8 51 3.4
I find that GVSU is supportive of taking leave 110 7.3 548 36.6 472 31.5 114 7.6 34 2.3 220 14.7
I feel that faculty/staff who have children are considered by GVSU to be less committed to their jobs/careers 19 1.3 82 5.5 640 42.8 463 30.9 189 12.6 103 6.9
I feel that faculty/staff who do not have children are often burdened with work responsibilities beyond those who do have children 91 6.1 179 11.9 500 33.3 434 28.9 205 13.7 92 6.1
I find it difficult to balance childcare with my work responsibilities 43 2.9 166 11.1 230 15.3 241 16.1 67 4.5 752 50.2
I find it difficult to balance eldercare with my work responsibilities 29 1.9 89 6.0 250 16.8 153 10.3 51 3.4 919 61.6 Note: Table includes only those respondents who indicated they were faculty or staff in Question 1 (n = 1524).
Rankin & Associates Consulting Grand Valley Climate Assessment Project
Final Report
172
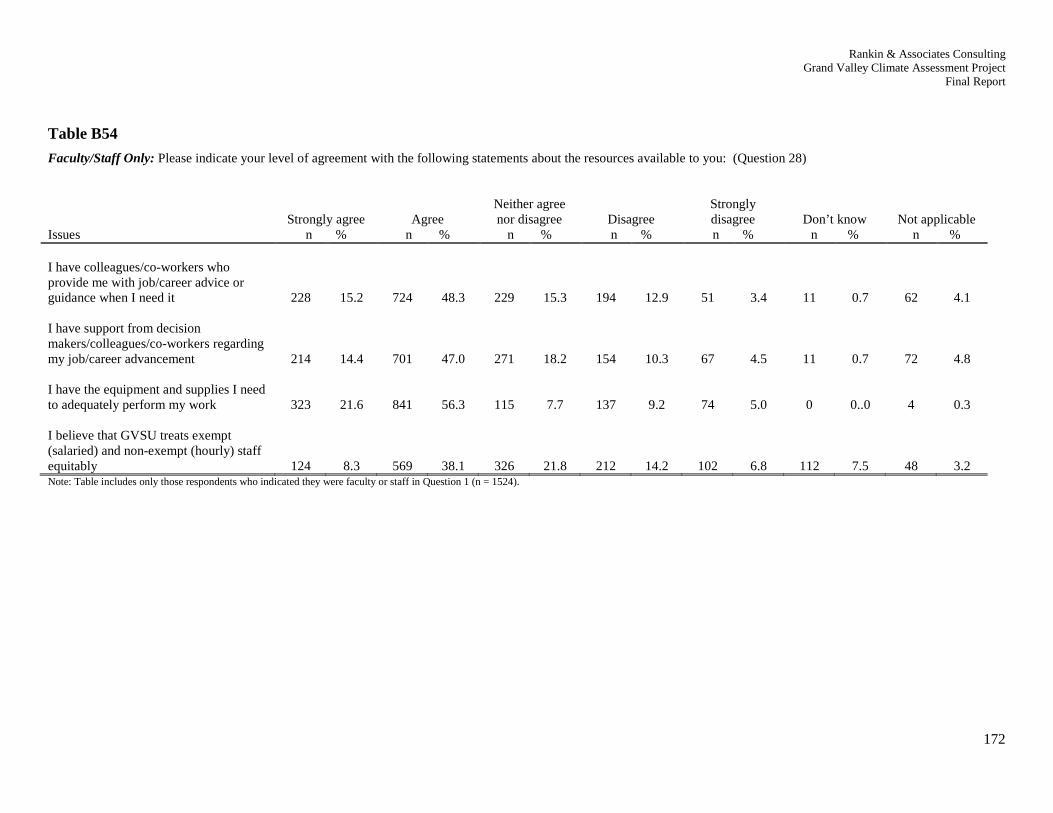
Table B54 Faculty/Staff Only: Please indicate your level of agreement with the following statements about the resources available to you: (Question 28) Issues
Strongly agree
n %
Agree n %
Neither agree nor disagree
n %
Disagree n %
Strongly disagree n %
Don’t know n %
Not applicable n %
I have colleagues/co-workers who provide me with job/career advice or guidance when I need it 228 15.2 724 48.3 229 15.3 194 12.9 51 3.4 11 0.7 62 4.1 I have support from decision makers/colleagues/co-workers regarding my job/career advancement 214 14.4 701 47.0 271 18.2 154 10.3 67 4.5 11 0.7 72 4.8 I have the equipment and supplies I need to adequately perform my work 323 21.6 841 56.3 115 7.7 137 9.2 74 5.0 0 0..0 4 0.3 I believe that GVSU treats exempt (salaried) and non-exempt (hourly) staff equitably 124 8.3 569 38.1 326 21.8 212 14.2 102 6.8 112 7.5 48 3.2 Note: Table includes only those respondents who indicated they were faculty or staff in Question 1 (n = 1524).

Rankin & Associates Consulting Grand Valley Climate Assessment Project
Final Report
173
Table B55 Faculty/Staff Only: How satisfied are you with… (Question 30) Issues
Highly satisfied
n %
Satisfied n %
Neither satisfied nor dissatisfied
n %
Dissatisfied n %
Highly
dissatisfied n %
Don’t know n %
Not applicable n %
Your compensation as compared to that of other GVSU peers with a similar level of experience 132 8.8 592 39.3 247 16.4 284 18.9 110 7.3 135 9.0 5 0.3 Your access to health benefits 395 26.2 754 50.0 129 8.5 89 5.9 34 2.3 6 0.4 102 6.8 Your job/career at GVSU 472 31.4 787 52.3 140 9.3 76 5.0 23 1.5 3 0.2 4 0.3 Your career progression at GVSU 242 16.2 674 45.1 252 16.9 188 12.6 52 3.5 8 0.5 77 5.2 The size and quality of your work space as compared to your departmental colleagues’/co-workers work space 379 25.2 731 48.5 136 9.0 129 8.6 86 5.7 9 0.6 36 2.4 Your access to research support as compared to your colleagues’/co-workers access to research support 173 11.5 521 34.8 257 17.1 80 5.3 34 2.3 27 1.8 407 27.2 Note: Table includes only those respondents who indicated they were faculty or staff in Question 1 (n = 1524).
Rankin & Associates Consulting Grand Valley Climate Assessment Project
Final Report
174
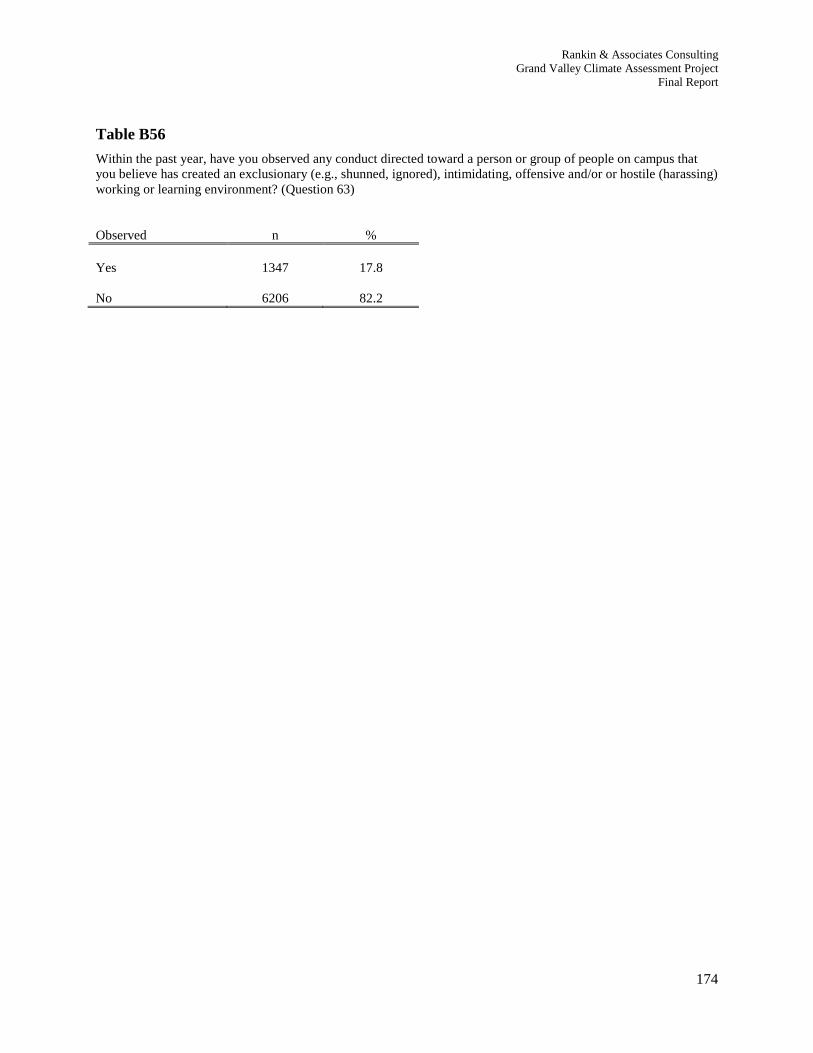
Table B56 Within the past year, have you observed any conduct directed toward a person or group of people on campus that you believe has created an exclusionary (e.g., shunned, ignored), intimidating, offensive and/or or hostile (harassing) working or learning environment? (Question 63) Observed n % Yes 1347 17.8 No 6206 82.2
Rankin & Associates Consulting Grand Valley Climate Assessment Project
Final Report
175
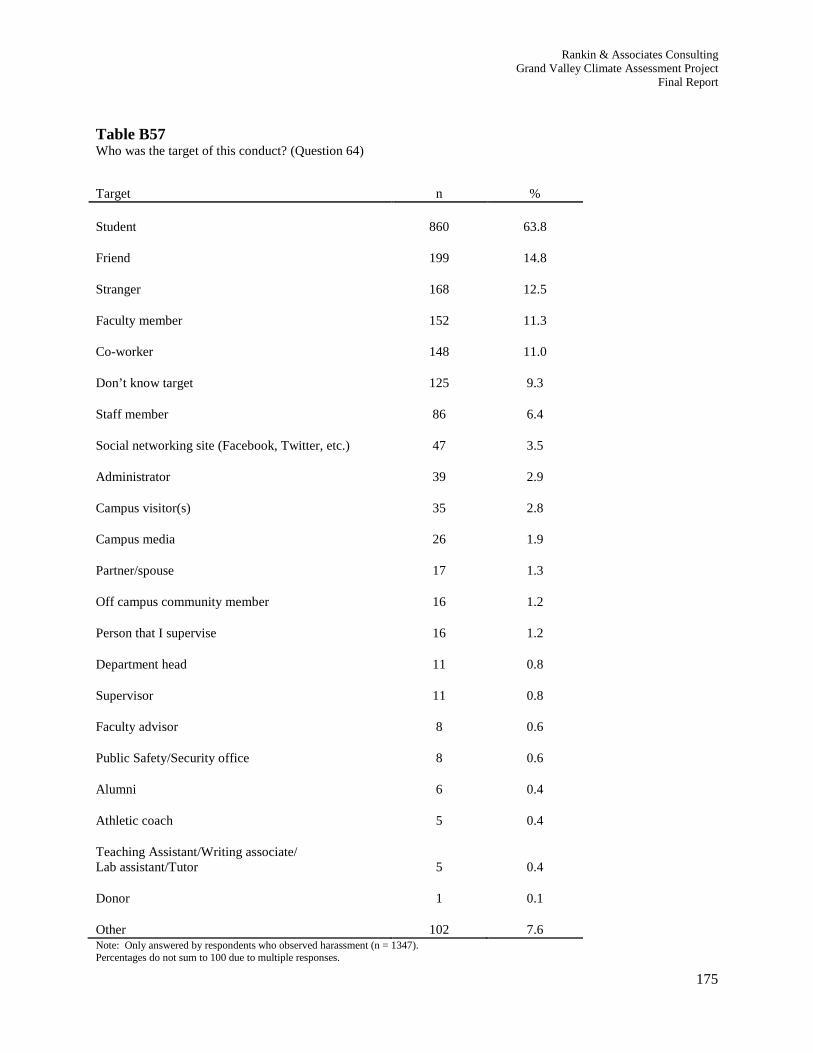
Table B57 Who was the target of this conduct? (Question 64) Target
n
%
Student 860 63.8
Friend 199 14.8
Stranger 168 12.5
Faculty member 152 11.3
Co-worker 148 11.0
Don’t know target 125 9.3
Staff member 86 6.4
Social networking site (Facebook, Twitter, etc.) 47 3.5
Administrator 39 2.9
Campus visitor(s) 35 2.8
Campus media 26 1.9
Partner/spouse 17 1.3
Off campus community member 16 1.2
Person that I supervise 16 1.2
Department head 11 0.8
Supervisor 11 0.8
Faculty advisor 8 0.6
Public Safety/Security office 8 0.6
Alumni 6 0.4
Athletic coach 5 0.4
Teaching Assistant/Writing associate/ Lab assistant/Tutor 5 0.4
Donor 1 0.1
Other 102 7.6 Note: Only answered by respondents who observed harassment (n = 1347). Percentages do not sum to 100 due to multiple responses.
Rankin & Associates Consulting Grand Valley Climate Assessment Project
Final Report
176
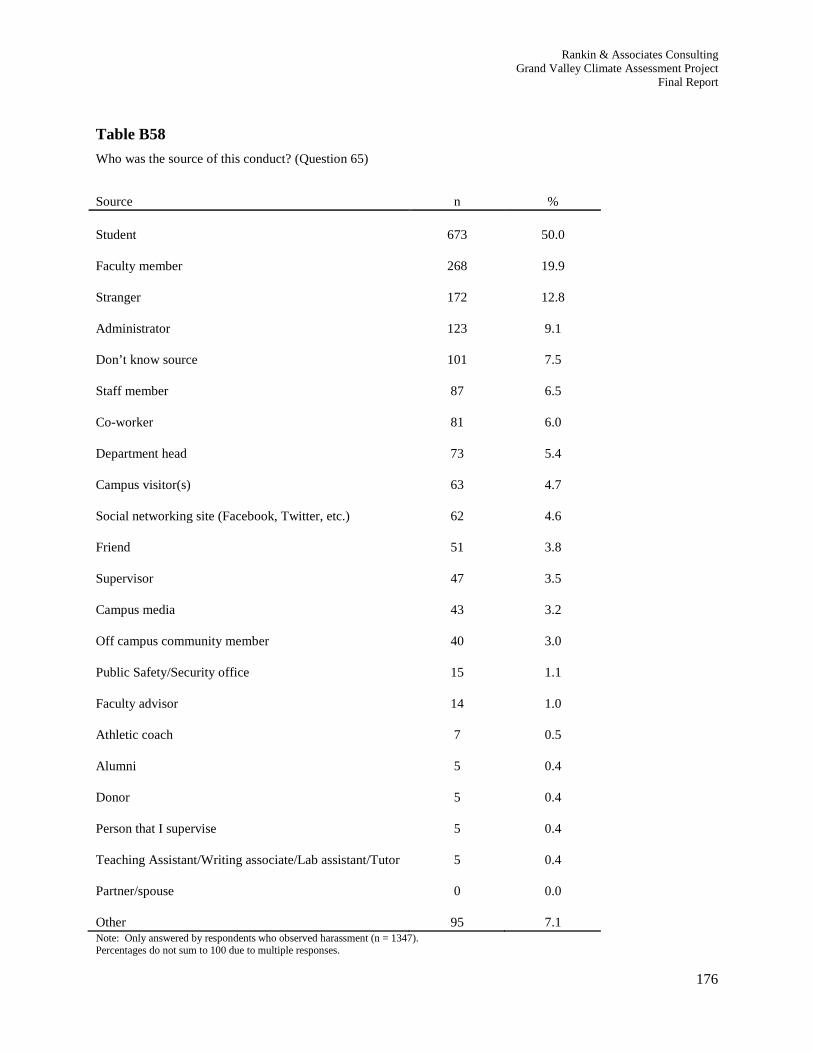
Table B58 Who was the source of this conduct? (Question 65) Source
n
%
Student 673 50.0
Faculty member 268 19.9
Stranger 172 12.8
Administrator 123 9.1
Don’t know source 101 7.5
Staff member 87 6.5
Co-worker 81 6.0
Department head 73 5.4
Campus visitor(s) 63 4.7
Social networking site (Facebook, Twitter, etc.) 62 4.6
Friend 51 3.8
Supervisor 47 3.5
Campus media 43 3.2
Off campus community member 40 3.0
Public Safety/Security office 15 1.1
Faculty advisor 14 1.0
Athletic coach 7 0.5
Alumni 5 0.4
Donor 5 0.4
Person that I supervise 5 0.4
Teaching Assistant/Writing associate/Lab assistant/Tutor 5 0.4
Partner/spouse 0 0.0
Other 95 7.1 Note: Only answered by respondents who observed harassment (n = 1347). Percentages do not sum to 100 due to multiple responses.

Rankin & Associates Consulting Grand Valley Climate Assessment Project
Final Report
177
Table B59 What do you believe were the bases for this conduct? (Question 66) Characteristic
n
%
Sexual orientation 402 29.8
Religious/spiritual views 291 21.6
Gender 249 18.5
Race 249 18.5
Ethnicity 236 17.5
Gender expression 203 15.1
Position (staff, faculty, student) 169 12.5
Political views 158 11.7
Age 130 9.7
Physical characteristics 124 9.2
Country of origin 116 8.6
Educational level 88 6.5
Socioeconomic status 78 5.8
Participation in an organization 75 5.6
English language proficiency/accent 71 5.3
Learning disability 49 3.6
Physical disability 47 3.5
Medical condition 44 3.3
Psychological disorder 43 3.2
Developmental disorder 32 2.4
Immigrant status 28 2.1
Parental status (e.g., having children) 28 2.1
Military/veteran status 12 0.9
Other 174 12.9 Note: Only answered by respondents who observed harassment (n = 1347). Percentages do not sum to 100 due to multiple responses.

Rankin & Associates Consulting Grand Valley Climate Assessment Project
Final Report
178
Table B60 What forms of conduct based on one’s identity have you observed or personally been made aware of? (Question 67) Form
n
%
Derogatory remarks 725 53.8
Someone being deliberately ignored or excluded 437 32.4
Someone isolated or left out 364 27.0
Intimidation/bullying 324 24.1
Racial/ethnic profiling 228 16.9
Assumption that someone was admitted/ hired/promoted based on his/her identity 201 14.9
Someone isolated or left out when working in groups 195 14.5
Derogatory written comments 154 11.4
Derogatory/unsolicited e-mails 141 10.5
Assumption that someone was not admitted/hired/promoted based on his/her identity 119 8.8
Someone receiving a low performance evaluation 95 7.1
Someone singled out as the “resident authority” 91 6.8
Graffiti 89 6.6
Fearing for their physical safety 78 5.8
Someone receiving a poor grade 57 4.2
Derogatory phone calls 42 3.1
Threats of physical violence 38 2.8
Victim of a crime 25 1.9
Physical violence 23 1.7
Fearing for their family’s physical safety 10 0.7
Other 84 6.2 Note: Only answered by respondents who observed harassment (n = 1347). Percentages do not sum to 100 due to multiple responses.

Rankin & Associates Consulting Grand Valley Climate Assessment Project
Final Report
179
Table B61 Where did this conduct occur? (Question 68) Location
n
%
Public space on campus 455 33.8 In a class 418 31.0 In a meeting with a group of people 218 16.2 Campus housing 189 14.0 While walking on campus 183 13.6 Campus event 163 12.1 On a social networking site/Facebook/ Twitter/cell phone/other form of technological communication 137 10.2 Off campus 127 9.4 Campus office 124 9.2 While working at a campus job 121 9.0 Campus dining facility 83 6.2 Off-campus housing 70 5.2 Faculty office 69 5.1 In a meeting with one other person 61 4.5 Athletic facilities 31 2.3 Other 72 5.3 Note: Only answered by respondents who observed harassment (n = 1347). Percentages do not sum to 100 due to multiple responses.

Rankin & Associates Consulting Grand Valley Climate Assessment Project
Final Report
180
Table B62 Please describe your reactions to observing this conduct? (Question 69)
Response
n
%
Was angry 598 44.4
Told a friend 362 26.9
Did nothing 325 24.1
Felt embarrassed 311 23.1
Told a family member 239 17.7
Confronted the harasser at the time 185 13.7
Avoided the harasser 164 12.2
Didn’t know who to go to 147 10.9
Ignored it 143 10.6
Didn’t report it for fear my complaint would not be taken seriously 143 10.6
Confronted the harasser later 126 9.4
Didn’t affect me at the time 99 7.3
Sought support from a staff person 98 7.3
Left the situation immediately 97 7.2
Sought support from a faculty member 94 7.0
Felt somehow responsible 92 6.8
Didn’t report it for fear of retaliation 87 6.5
Made an official complaint to a campus employee/official 73 5.4
Was afraid 72 5.3
Did report it but my complaint was not taken seriously 53 3.9
Sought information on-line 25 1.9
Sought support from off-campus hot-line/advocacy services 12 0.9
Sought support from student staff 12 0.9
Contacted a local law enforcement official 11 0.8
Sought support from a spiritual advisor 10 0.7
Other 54 4.0 Note: Only answered by respondents who observed harassment (n = 1347). Percentages do not sum to 100 due to multiple responses.
Rankin & Associates Consulting Grand Valley Climate Assessment Project
Final Report
181
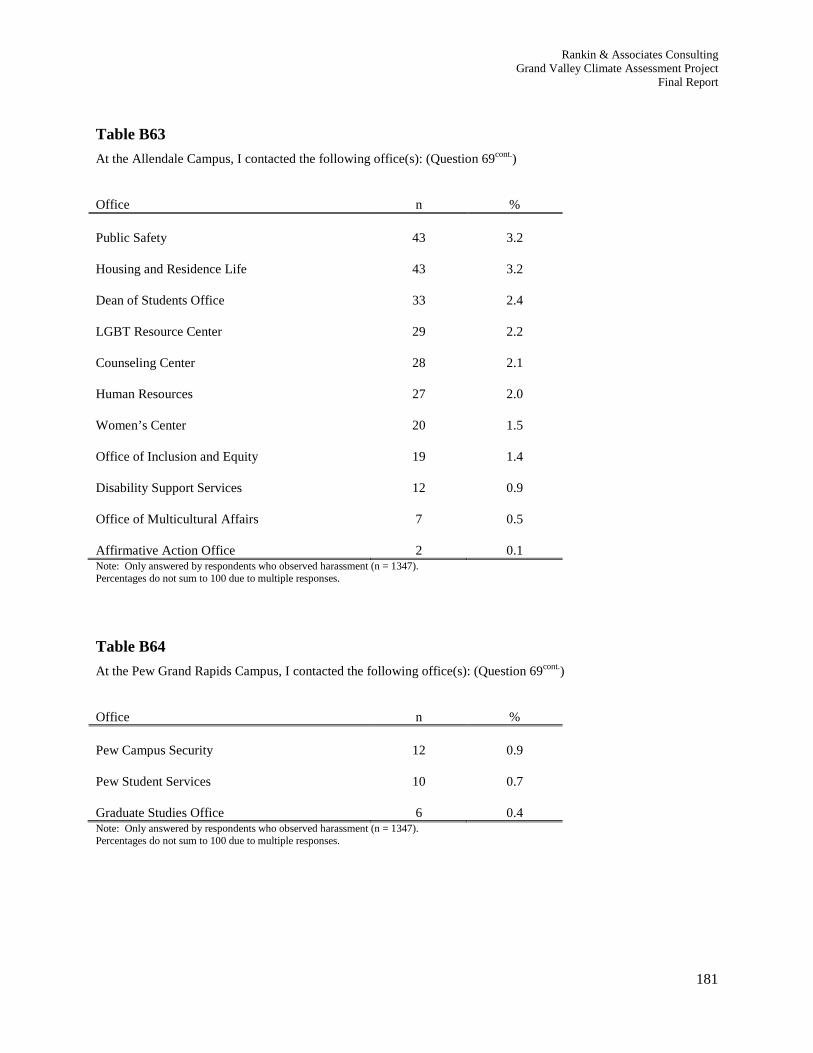
Table B63 At the Allendale Campus, I contacted the following office(s): (Question 69cont.) Office
n
%
Public Safety 43 3.2
Housing and Residence Life 43 3.2
Dean of Students Office 33 2.4
LGBT Resource Center 29 2.2
Counseling Center 28 2.1
Human Resources 27 2.0
Women’s Center 20 1.5
Office of Inclusion and Equity 19 1.4
Disability Support Services 12 0.9
Office of Multicultural Affairs 7 0.5
Affirmative Action Office 2 0.1 Note: Only answered by respondents who observed harassment (n = 1347). Percentages do not sum to 100 due to multiple responses. Table B64 At the Pew Grand Rapids Campus, I contacted the following office(s): (Question 69cont.) Office
n
%
Pew Campus Security 12 0.9
Pew Student Services 10 0.7
Graduate Studies Office 6 0.4 Note: Only answered by respondents who observed harassment (n = 1347). Percentages do not sum to 100 due to multiple responses.
Rankin & Associates Consulting Grand Valley Climate Assessment Project
Final Report
182
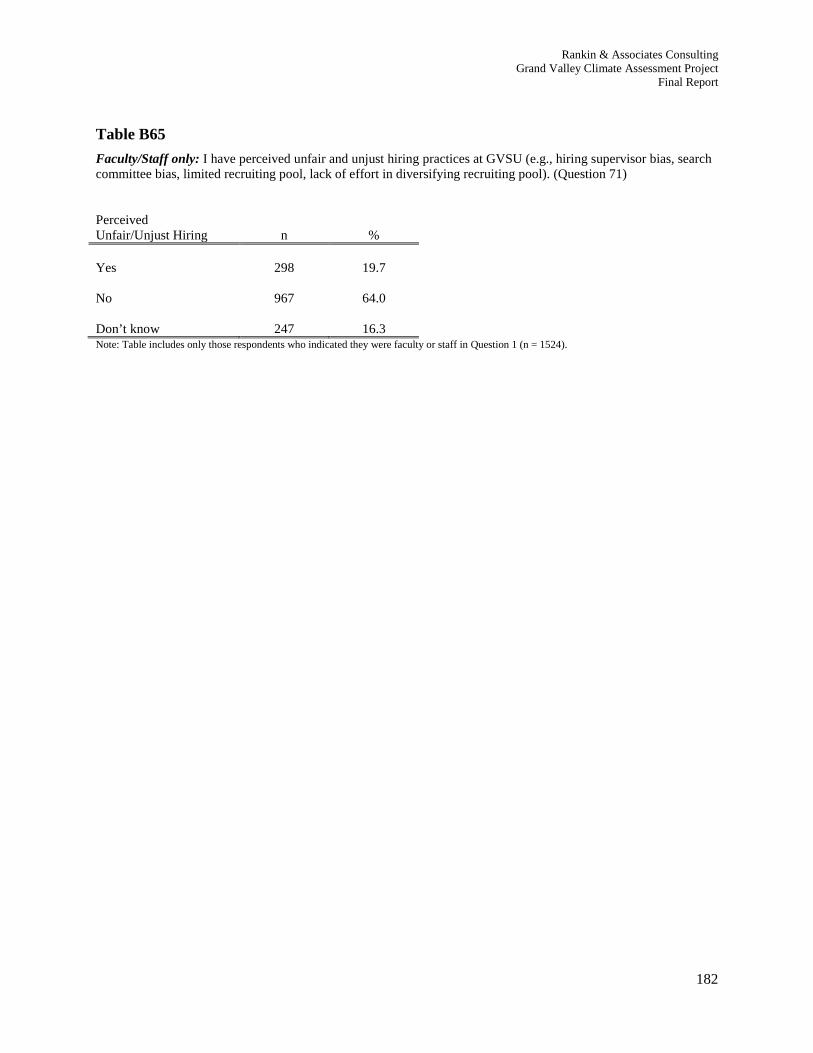
Table B65 Faculty/Staff only: I have perceived unfair and unjust hiring practices at GVSU (e.g., hiring supervisor bias, search committee bias, limited recruiting pool, lack of effort in diversifying recruiting pool). (Question 71) Perceived Unfair/Unjust Hiring n % Yes 298 19.7 No 967 64.0 Don’t know 247 16.3 Note: Table includes only those respondents who indicated they were faculty or staff in Question 1 (n = 1524).
Rankin & Associates Consulting Grand Valley Climate Assessment Project
Final Report
183
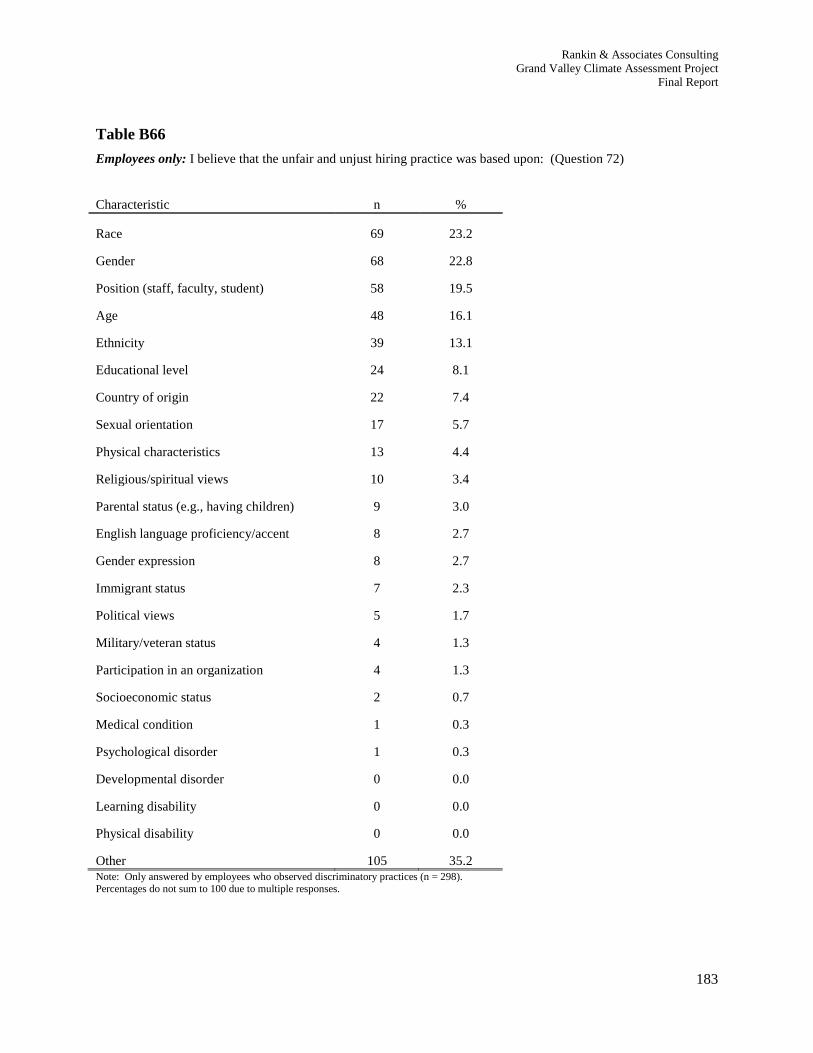
Table B66 Employees only: I believe that the unfair and unjust hiring practice was based upon: (Question 72) Characteristic
n
%
Race 69 23.2
Gender 68 22.8
Position (staff, faculty, student) 58 19.5
Age 48 16.1
Ethnicity 39 13.1
Educational level 24 8.1
Country of origin 22 7.4
Sexual orientation 17 5.7
Physical characteristics 13 4.4
Religious/spiritual views 10 3.4
Parental status (e.g., having children) 9 3.0
English language proficiency/accent 8 2.7
Gender expression 8 2.7
Immigrant status 7 2.3
Political views 5 1.7
Military/veteran status 4 1.3
Participation in an organization 4 1.3
Socioeconomic status 2 0.7
Medical condition 1 0.3
Psychological disorder 1 0.3
Developmental disorder 0 0.0
Learning disability 0 0.0
Physical disability 0 0.0
Other 105 35.2 Note: Only answered by employees who observed discriminatory practices (n = 298). Percentages do not sum to 100 due to multiple responses.
Rankin & Associates Consulting Grand Valley Climate Assessment Project
Final Report
184
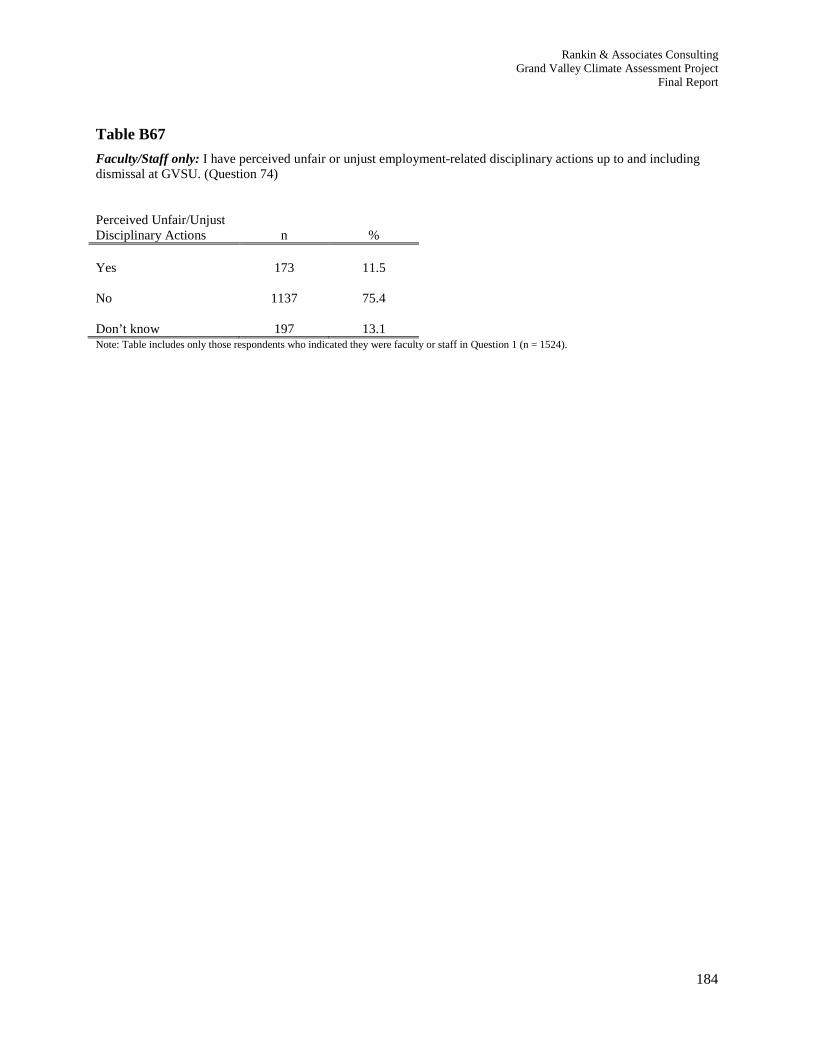
Table B67 Faculty/Staff only: I have perceived unfair or unjust employment-related disciplinary actions up to and including dismissal at GVSU. (Question 74) Perceived Unfair/Unjust Disciplinary Actions n % Yes 173 11.5 No 1137 75.4 Don’t know 197 13.1 Note: Table includes only those respondents who indicated they were faculty or staff in Question 1 (n = 1524).

Rankin & Associates Consulting Grand Valley Climate Assessment Project
Final Report
185
Table B68 Faculty/Staff Only: I believe that the unfair or unjust, employment-related disciplinary actions were based upon: (Question 75) Characteristic
n
%
Position (staff, faculty, student) 50 28.9
Race 28 16.2
Age 26 15.0
Gender 24 13.9
Ethnicity 21 12.1
Political views 15 8.7
Medical condition 14 8.1
Country of origin 9 5.2
Educational level 9 5.2
Sexual orientation 9 5.2
Parental status (e.g., having children) 8 4.6
Psychological disorder 8 4.6
English language proficiency/accent 5 2.9
Religious/spiritual views 4 2.3
Immigrant status 3 1.7
Participation in an organization 3 1.7
Physical characteristics 3 1.7
Gender expression 2 1.2
Physical disability 2 1.2
Socioeconomic status 2 1.2
Developmental disorder 1 0.6
Learning disability 1 0.6
Military/veteran status 1 0.6
Other 55 31.8 Note: Only answered by employees who observed discriminatory practices (n = 173). Percentages do not sum to 100 due to multiple responses.

Rankin & Associates Consulting Grand Valley Climate Assessment Project
Final Report
186
Table B69 Faculty/Staff only: I have perceived unfair or unjust behavior, procedures, or employment practices related to promotion/tenure/reappointment/reclassification at GVSU. (Question 77) Perceived Unfair/Unjust Employment-Related Actions n % Yes 314 20.8 No 940 62.4 Don’t know 253 16.8 Note: Table includes only those respondents who indicated they were faculty or staff in Question 1 (n = 1524).

Rankin & Associates Consulting Grand Valley Climate Assessment Project
Final Report
187
Table B70 Faculty/Staff Only: I believe that the unfair or unjust behavior, procedures, or employment practices related to promotion/tenure/reappointment/reclassification were based upon: (Question 78) Characteristic
n
%
Age 24 7.6
Country of origin 16 5.1
Developmental disorder 1 0.3
Educational level 29 9.2
English language proficiency/accent 10 3.2
Ethnicity 38 12.1
Gender 57 18.2
Gender expression 1 0.3
Immigrant status 3 1.0
Learning disability 0 0.0
Medical condition 3 1.0
Military/veteran status 2 0.6
Parental status (e.g., having children) 7 2.2
Participation in an organization 5 1.6
Psychological disorder 6 1.9
Physical characteristics 10 3.2
Physical disability 1 0.3
Political views 15 4.8
Position (staff, faculty, student) 76 24.2
Race 52 16.6
Religious/spiritual views 7 2.2
Sexual orientation 10 3.2
Socioeconomic status 4 1.3
Other 115 36.6 Note: Only answered by employees who observed discriminatory practices (n = 314). Percentages do not sum to 100 due to multiple responses.

Rankin & Associates Consulting Grand Valley Climate Assessment Project
Final Report
188
Table B71 Using a scale of 1-5, please rate the overall climate on campus on the following dimensions: (Questions 80-81)
1
2 3
4
5 Mean
Standard Deviation
Dimension n % n % n % n % n % n n
Friendly/Hostile 3360 44.7 3287 43.8 717 9.5 130 1.7 15 0.2 1.7 0.7
Cooperative/Uncooperative 2717 36.3 3620 48.4 905 12.1 220 2.9 20 0.3 1.8 0.8
Improving/Regressing 2558 34.3 3209 43.0 1441 19.3 208 2.8 43 0.6 1.9 0.8
Positive for persons with disabilities/Negative for persons with disabilities 2540 34.2 3196 43.0 1410 19.0 247 3.3 39 0.5 1.9 0.8
Positive for people who identify as lesbian, gay, bisexual or transgender/Negative 2165 29.1 2989 40.2 1866 25.1 358 4.8 50 0.7 2.1 0.9
Positive for people of Christian faith/Negative 3462 46.5 2456 33.0 1184 15.9 293 3.9 52 0.7 1.8 0.9
Positive for people of other faith backgrounds/Negative 1572 21.2 2677 36.0 2253 30.3 755 10.2 171 2.3 2.4 1.0
Positive for people who are agnostic/atheist/Negative 1444 19.5 2106 28.4 2737 37.0 836 11.3 283 3.8 2.5 1.0
Positive for people of color/Negative 2304 31.0 3093 41.6 1545 20.8 427 5.7 64 0.9 2.0 0.9
Positive for men/Negative 3396 45.6 2724 36.6 1146 15.4 149 2.0 29 0.4 1.7 0.8
Positive for women/Negative 3328 44.6 2948 39.5 1022 13.7 143 1.9 13 0.5 1.7 0.8
Positive for non-native English speakers/Negative 1569 21.2 2611 35.2 2446 33.0 707 9.5 80 1.1 2.3 1.0
Positive for people who are immigrants/Negative 1602 21.7 2601 35.2 2575 34.9 540 7.3 65 0.9 2.3 0.9
Positive for people who are not U.S. Citizens/Negative 1753 23.7 2647 35.8 2487 33.7 436 5.9 61 0.8 2.2 0.9

Rankin & Associates Consulting Grand Valley Climate Assessment Project
Final Report
189
Table B71cont. Using a scale of 1-5, please rate the overall climate on campus on the following dimensions: (Questions 80-81)
1
2 3
4
5
Mean Standard Deviation Dimension n % n % n % n % n %
Welcoming/Non-welcoming 3424 45.9 3083 41.3 721 9.7 199 2.7 40 0.5 1.7 0.8
Respectful/Disrespectful 3157 42.3 3193 42.8 844 11.3 215 2.9 47 0.6 1.8 0.8
Positive for people of high socioeconomic status/Negative 3579 48.2 2573 34.7 1177 15.9 68 0.9 22 0.3 1.7 0.8
Positive for people of low socioeconomic status/Negative 1826 24.6 2453 33.0 2126 28.6 822 11.1 198 2.7 2.3 1.0
Not racist/Racist 2267 30.3 3336 44.6 1409 18.8 406 5.4 60 0.8 2.0 0.9
Not sexist/Sexist 2395 32.1 3195 42.8 1403 18.8 419 5.6 49 0.7 2.0 0.9
Not homophobic/Homophobic 1969 26.5 2837 38.2 1844 24.8 664 8.9 113 1.5 2.2 1.0
Not age biased/Age biased 2317 31.2 2834 38.1 1560 21.0 612 8.2 110 1.5 2.1 1.0
Not classist (socioeconomic status)/ Classist 1962 26.5 2841 38.4 1719 23.2 734 9.9 146 2.0 2.2 1.0
Not classist (position)/Classist 2027 27.4 2777 37.5 1729 23.4 688 9.3 180 2.4 2.2 1.0
Not ablest/Ablest 2324 31.6 2875 39.1 1860 25.3 258 3.5 33 0.4 2.0 0.9

Rankin & Associates Consulting Grand Valley Climate Assessment Project
Final Report
190
Table B72 Faculty/Students Only: The classroom climate is welcoming for students based on their: (Question 82) Characteristic
Strongly agree n %
Agree
n %
Neither agree nor disagree n %
Disagree n %
Strongly disagree n %
Don’t know n %
Age 2277 34.5 3128 47.5 753 11.4 267 4.1 62 0.9 105 1.6
Country of origin 1956 29.8 3085 47.0 1064 16.2 214 3.3 36 0.5 213 3.2
English language proficiency/accent 1772 27.0 2919 44.6 1185 18.1 426 6.5 63 1.0 187 2.9
Ethnicity 2059 31.5 3106 47.6 930 14.2 256 3.9 46 0.7 135 2.1
Gender 2559 39.1 2939 44.9 754 11.5 164 2.5 39 0.6 93 1.4
Gender expression 1743 26.7 2527 38.7 1406 21.5 456 7.0 84 1.3 309 4.7
Immigrant status 1650 25.2 2506 38.3 1555 23.8 271 4.1 43 0.7 510 7.8
Learning disability 1808 27.7 2652 40.6 1300 19.9 347 5.3 65 1.0 357 5.5
Medical conditions 1884 28.9 2709 41.6 1259 19.3 242 3.7 58 0.9 367 5.6
Military/veteran status 2322 35.6 2492 38.2 1104 16.9 109 1.7 39 0.6 453 6.9
Parental status 1970 30.2 2670 41.0 1163 17.8 298 4.6 70 1.1 348 5.3
Participation in an organization 2427 37.3 2643 40.6 970 14.9 136 2.1 30 0.5 309 4.7
Participation on an athletic team 2656 40.8 2449 37.6 898 13.8 109 1.7 21 0.3 375 5.8
Psychological disorder 1622 24.9 2402 36.9 1540 23.7 333 5.1 71 1.1 539 8.3
Physical characteristics 1897 29.2 2744 42.2 1300 20.0 261 4.0 63 1.0 236 3.6
Physical disability 1882 28.9 2772 42.6 1217 18.7 270 4.2 56 0.9 304 4.7
Political views 1643 25.2 2558 39.3 1384 21.3 555 8.5 154 2.4 216 3.3

Rankin & Associates Consulting Grand Valley Climate Assessment Project
Final Report
191
Table B72 (con.) Strongly agree
n %
Agree
n %
Neither agree nor disagree n %
Disagree n %
Strongly disagree n %
Don’t know n %
Race 2038 31.3 2863 44.0 1071 16.5 316 4.9 72 1.1 141 2.2
Religious/spiritual views 1732 26.6 2597 39.9 1285 19.7 538 8.3 164 2.5 193 3.0
Sexual orientation 1749 26.9 2575 39.6 1398 21.5 412 6.3 95 1.5 271 4.2
Socioeconomic status 1738 26.8 2670 41.1 1350 20.8 431 6.6 100 1.5 208 3.2 Note: Table includes only those respondents who indicated they were faculty or students in Question 1 (n = 6761).

Rankin & Associates Consulting Grand Valley Climate Assessment Project
Final Report
192
Table B73 Students Only: Please indicate your level of agreement with the following statements: (Question 83) Statement
Strongly agree n %
Agree
n %
Neither agree nor disagree n %
Disagree n %
Strongly disagree n %
Don’t know n %
I feel valued by faculty in the classroom 1619 27.2 3056 51.2 895 15.0 324 5.4 60 1.0 9 0.2
I feel valued by other students in the classroom 1034 17.4 2707 45.5 1641 27.6 466 7.8 76 1.3 21 0.3
I think GVSU employees are genuinely concerned with my welfare 1465 24.6 2607 43.8 1214 20.4 495 8.3 121 2.0 50 0.8
I think GVSU administrators are genuinely concerned with my welfare 1260 21.2 2333 39.3 1372 23.1 665 11.2 205 3.5 100 1.7
I think faculty pre-judge my abilities based on my identity/background 571 9.6 1276 21.5 1506 25.4 1735 29.2 698 11.8 152 2.6
I believe the campus climate encourages free and open discussion of difficult topics 1457 24.6 2833 47.8 1007 17.0 445 7.5 148 2.5 39 0.7
I have faculty who I perceive as role models 1978 33.3 2470 41.5 972 16.3 385 6.5 92 1.5 48 0.8
I have staff who I perceive as role models 1318 22.3 1854 31.4 1806 30.6 533 9.0 123 2.1 275 4.7 Note: Table includes only those respondents who answered that they were students in Question 1 (n = 6043). 19 respondents who answered “Other” in Question 1 were recoded as students. They did not have the opportunity to answer this question.

Rankin & Associates Consulting Grand Valley Climate Assessment Project
Final Report
193
Table B74 Students/Faculty Only: I perceive tension in classroom discussions with regard to a person’s: (Question 85) Characteristic
Strongly agree n %
Agree
n %
Neither agree nor disagree n %
Disagree n %
Strongly disagree n %
Don’t know n %
Country of origin 101 1.6 358 5.6 1375 21.5 2821 44.0 1398 21.8 354 5.5
English language proficiency/accent 132 2.1 789 12.3 1451 22.7 2503 39.1 1166 18.2 353 5.5
Ethnicity 207 3.2 1015 15.9 1347 21.1 2374 37.3 1149 18.0 279 4.4
Gender 155 2.4 893 14.0 1368 21.4 2438 38.1 1275 19.9 264 4.1
Gender expression 339 5.3 1614 25.3 1320 20.7 1802 28.2 900 14.1 405 6.3
Immigrant status 182 2.9 883 13.9 1528 24.0 2198 34.5 1062 16.7 522 8.2
Learning disability 93 1.5 515 8.1 1569 24.6 2526 39.6 1224 19.2 454 7.1
Medical conditions 92 1.4 391 6.1 1520 23.9 2587 40.6 1314 20.6 463 7.3
Military/veteran status 84 1.3 285 4.5 1425 22.4 2522 39.6 1578 24.8 480 7.5
Parental status 95 1.5 503 7.9 1448 22.7 2535 39.8 1409 22.1 387 6.1
Participation in a student organization 83 1.3 274 4.3 1356 21.3 2587 40.7 1679 26.4 384 6.0
Participation on an athletic team 88 1.4 274 4.3 1330 20.9 2546 40.0 1702 26.7 426 6.7
Psychological condition 109 1.7 683 10.7 1550 24.3 2290 35.9 1171 18.4 573 9.0
Physical characteristics 134 2.1 661 10.4 1589 25.0 2334 36.7 1221 19.2 422 6.6
Physical disability 116 1.8 578 9.1 1539 24.3 2432 38.4 1263 19.9 409 6.5
Political views 767 12.0 1981 31.0 1207 18.9 1417 22.2 751 11.8 263 4.1

Rankin & Associates Consulting Grand Valley Climate Assessment Project
Final Report
194
Table B74 (con.) Strongly agree
n %
Agree
n %
Neither agree nor disagree n %
Disagree n %
Strongly disagree n %
Don’t know n %
Race 425 6.7 1467 23.0 1304 20.5 1911 30.0 1006 15.8 261 4.1
Religious/spiritual views 786 12.3 1952 30.6 1187 18.6 1436 22.5 762 11.9 266 4.2
Sexual orientation 539 8.4 1725 27.0 1317 20.6 1611 25.2 834 13.1 357 5.6
Socioeconomic status 267 4.2 1010 15.9 1648 25.9 2057 32.3 1016 16.0 367 5.8 Note: Table includes only those respondents who indicated they were faculty or students in Question 1 (n = 6761).

Rankin & Associates Consulting Grand Valley Climate Assessment Project
Final Report
195
Table B75 Students Only: I perceive tension in residence hall discussions with regard to a person’s: (Question 86) Characteristic
Strongly agree n %
Agree
n %
Neither agree or disagree n %
Disagree n %
Strongly disagree n %
Don’t Know n %
Country of origin 66 1.2 222 4.1 908 16.8 1297 24.0 778 14.4 2137 39.5
English language proficiency/accent 68 1.3 298 5.5 891 16.5 1256 23.3 748 13.9 2128 39.5
Ethnicity 101 1.9 403 7.5 862 16.0 1197 22.2 718 13.3 2102 39.0
Gender 95 1.8 328 6.1 874 16.3 1246 23.2 763 14.2 2071 38.5
Gender expression 192 3.6 718 13.3 868 16.1 910 16.9 581 10.8 2113 39.3
Immigrant status 62 1.2 296 5.5 926 17.2 1203 22.4 685 12.7 2206 41.0
Learning disability 70 1.3 274 5.1 925 17.2 1224 22.8 700 13.0 2181 40.6
Medical conditions 65 1.2 252 4.7 925 17.2 1251 23.2 728 13.5 2161 40.2
Military/veteran status 43 0.8 106 2.0 919 17.1 1254 23.3 824 15.3 2227 41.4
Parental status 80 1.5 324 6.0 915 17.0 1119 20.8 678 12.6 2252 42.0
Participation in a student organization 49 0.9 184 3.4 869 16.2 1276 23.8 893 16.6 2098 39.1
Participation on an athletic team 56 1.0 164 3.1 866 16.1 1249 23.3 926 17.3 2106 39.2
Psychological disorder 98 1.8 389 7.2 918 17.1 1129 21.0 653 12.2 2179 40.6
Physical characteristics 112 2.1 477 8.9 910 17.0 1103 20.6 654 12.2 2110 39.3
Physical disability 86 1.6 389 7.3 927 17.3 1146 21.4 674 12.6 2140 39.9
Political views 214 4.0 635 11.8 894 16.6 954 17.7 586 10.9 2092 38.9

Rankin & Associates Consulting Grand Valley Climate Assessment Project
Final Report
196
Table B75 (con.) Strongly agree
n %
Agree
n %
Neither agree or disagree n %
Disagree n %
Strongly disagree n %
Don’t Know n %
Race 166 3.1 546 10.2 892 16.6 1045 19.5 643 12.0 2076 38.7
Religious/spiritual views 246 4.6 697 13.0 882 16.4 912 17.0 559 10.4 2066 38.5
Sexual orientation 304 5.7 811 15.1 852 15.9 812 15.1 510 9.5 2085 38.8
Socioeconomic status 143 2.7 463 8.6 974 18.2 1041 19.4 623 11.6 2109 39.4 Note: Table includes only those respondents who indicated they were faculty or students in Question 1 (n = 6761).
Rankin & Associates Consulting Grand Valley Climate Assessment Project
Final Report
197
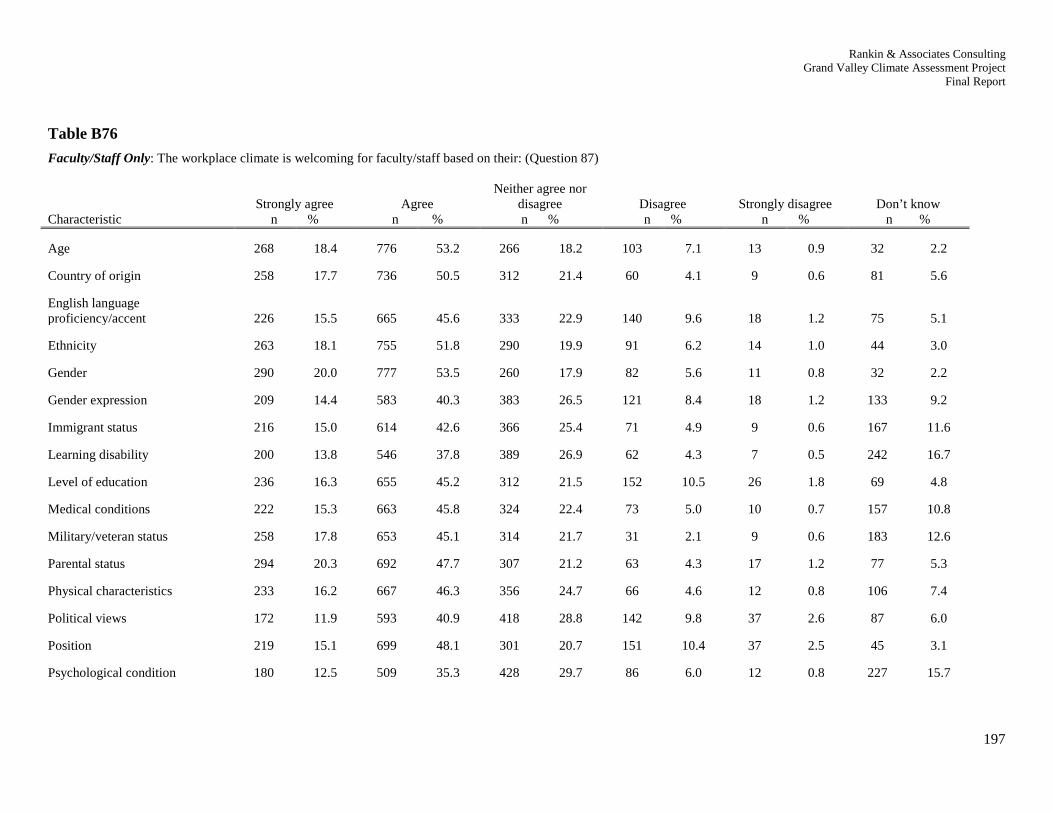
Table B76 Faculty/Staff Only: The workplace climate is welcoming for faculty/staff based on their: (Question 87) Characteristic
Strongly agree n %
Agree
n %
Neither agree nor disagree n %
Disagree n %
Strongly disagree n %
Don’t know n %
Age 268 18.4 776 53.2 266 18.2 103 7.1 13 0.9 32 2.2
Country of origin 258 17.7 736 50.5 312 21.4 60 4.1 9 0.6 81 5.6
English language proficiency/accent 226 15.5 665 45.6 333 22.9 140 9.6 18 1.2 75 5.1
Ethnicity 263 18.1 755 51.8 290 19.9 91 6.2 14 1.0 44 3.0
Gender 290 20.0 777 53.5 260 17.9 82 5.6 11 0.8 32 2.2
Gender expression 209 14.4 583 40.3 383 26.5 121 8.4 18 1.2 133 9.2
Immigrant status 216 15.0 614 42.6 366 25.4 71 4.9 9 0.6 167 11.6
Learning disability 200 13.8 546 37.8 389 26.9 62 4.3 7 0.5 242 16.7
Level of education 236 16.3 655 45.2 312 21.5 152 10.5 26 1.8 69 4.8
Medical conditions 222 15.3 663 45.8 324 22.4 73 5.0 10 0.7 157 10.8
Military/veteran status 258 17.8 653 45.1 314 21.7 31 2.1 9 0.6 183 12.6
Parental status 294 20.3 692 47.7 307 21.2 63 4.3 17 1.2 77 5.3
Physical characteristics 233 16.2 667 46.3 356 24.7 66 4.6 12 0.8 106 7.4
Political views 172 11.9 593 40.9 418 28.8 142 9.8 37 2.6 87 6.0
Position 219 15.1 699 48.1 301 20.7 151 10.4 37 2.5 45 3.1
Psychological condition 180 12.5 509 35.3 428 29.7 86 6.0 12 0.8 227 15.7
Rankin & Associates Consulting Grand Valley Climate Assessment Project
Final Report
198
Table B76 (con.) Strongly agree
n %
Agree
n %
Neither agree nor disagree n %
Disagree n %
Strongly disagree n %
Don’t know n %
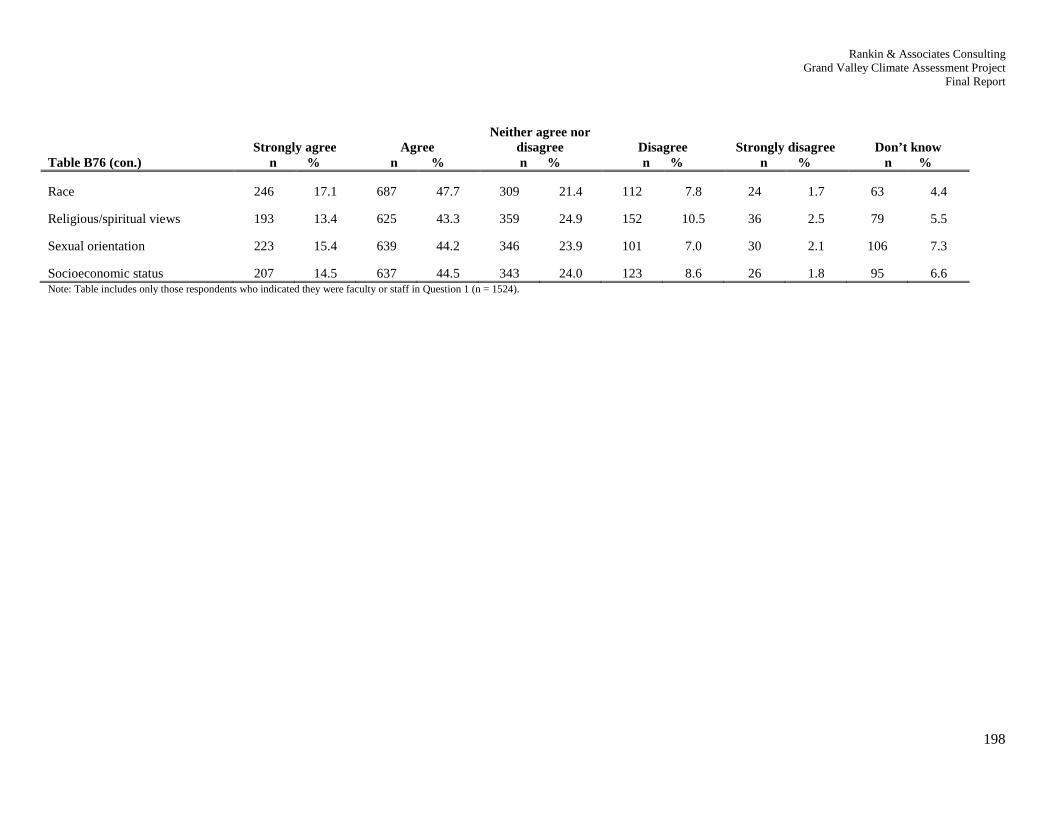
Race 246 17.1 687 47.7 309 21.4 112 7.8 24 1.7 63 4.4
Religious/spiritual views 193 13.4 625 43.3 359 24.9 152 10.5 36 2.5 79 5.5
Sexual orientation 223 15.4 639 44.2 346 23.9 101 7.0 30 2.1 106 7.3
Socioeconomic status 207 14.5 637 44.5 343 24.0 123 8.6 26 1.8 95 6.6 Note: Table includes only those respondents who indicated they were faculty or staff in Question 1 (n = 1524).

Rankin & Associates Consulting Grand Valley Climate Assessment Project
Final Report
199
Table B77
How would you rate the accessibility on campus for people with physical, learning, psychological, or medical disabilities? (Question 88)
Fully accessible
Accessible with assistance or intervention
Not accessible Don’t know
n % n % n % n %
Physical Accessibility
Athletic facilities (stadiums, arena, etc.) 2570 36.5 1816 25.8 113 1.6 2546 36.1
Classroom Buildings 3922 55.5 1894 26.8 123 1.7 1129 16.0
Classrooms, labs 3511 49.7 2048 29.0 170 2.4 1333 18.9
University housing 2527 35.9 1466 20.8 221 3.1 2826 40.1
Computer labs 3530 50.1 1827 25.9 192 2.7 1501 21.3
Dining Facilities 3620 51.6 1334 19.0 86 1.2 1980 28.2
Elevators 4724 67.1 929 13.2 71 1.0 1315 18.7
Health & Wellness Center 2796 39.8 1078 15.3 89 1.3 3061 43.6
Library 3732 53.1 1460 20.8 140 2.0 1697 24.1
On-campus transportation/parking 3294 46.9 1788 25.4 256 3.6 1690 24.0
Other campus buildings 2955 42.2 1415 20.2 87 1.2 2546 36.4
Recreational facilities 2860 40.8 1333 19.0 101 1.4 2714 38.7
Restrooms 4187 59.6 1426 20.3 149 2.1 1265 18.0
Studios/Performing Arts Spaces 2506 35.8 941 13.4 69 1.0 3484 49.8
Kirkhof Center 3884 55.3 1361 19.4 99 1.4 1675 23.9
Walkways and pedestrian paths 4073 58.1 1511 21.5 190 2.7 1239 17.7
Braille signage 2219 31.7 809 11.6 176 2.5 3795 54.2
Hearing loops 1840 26.5 765 11.0 140 2.0 4198 60.5

Rankin & Associates Consulting Grand Valley Climate Assessment Project
Final Report
200
Table B77 (con.) Fully accessible
Accessible with assistance or intervention
Not accessible Don’t know
n % n % n %
n
%
Course Instruction/Materials
Information in Alternative Formats 2180 31.2 1414 20.3 223 3.2 3161 45.3
Instructors 2806 40.2 1482 21.2 140 2.0 2555 36.6
Instructional materials 2593 37.1 1486 21.3 143 2.0 2758 39.5
GVSU Website
GVSU Website 3417 49.2 1100 15.8 118 1.7 2315 33.3

Rankin & Associates Consulting Grand Valley Climate Assessment Project
Final Report
201
Table B78 How would you rate the climate on campus for people who are: (Question 90)
Very
Respectful
Moderately respectful Not respectful or
disrespectful Moderately
disrespectful Very disrespectful
Don’t know Group n % n % n % n % n % n %
Affected by psychological health issues 1208 17.3 2847 40.8 1212 17.4 302 4.3 27 0.4 1386 19.9
Affected by physical health issues 1491 21.4 3401 48.9 952 13.7 152 2.2 19 0.3 947 13.6
Female 2162 30.9 3541 50.6 801 11.5 164 2.3 19 0.3 305 4.4
From religious affiliations other than Christian 1319 18.9 2913 41.7 1440 20.6 598 8.6 107 1.5 614 8.8
From Christian affiliations 2175 31.2 3189 45.7 871 12.5 265 3.8 37 0.5 443 6.3
Gay, lesbian, bisexual, transgender 1224 17.5 2864 41.0 1549 22.2 584 8.4 90 1.3 666 9.5
Immigrants 1264 18.2 2863 41.2 1402 20.2 353 5.1 30 0.4 1042 15.0
International students, staff, or faculty 1620 23.3 3309 47.5 1071 15.4 282 4.0 33 0.5 649 9.3
Learning disabled 1395 20.1 3033 43.6 1193 17.2 248 3.6 27 0.4 1054 15.2
Male 2464 35.4 3278 47.0 731 10.5 89 1.3 22 0.3 386 5.5
Non-native English speakers 1282 18.5 2953 42.6 1445 20.8 435 6.3 34 0.5 790 11.4
Parents/guardians 1893 27.2 3212 46.1 1002 14.4 108 1.6 15 0.2 732 10.5
People of Color 1693 24.3 3463 49.6 983 14.1 296 4.2 49 0.7 492 7.1
Physically disabled 1602 23.1 3369 48.5 1002 14.4 195 2.8 23 0.3 757 10.9
Providing care for other than a child 1436 20.6 2676 38.5 1080 15.5 107 1.5 13 0.2 1646 23.7
Socioeconomically disadvantaged 1336 19.2 2789 40.2 1313 18.9 565 8.1 72 1.0 869 12.5
Socioeconomically advantaged 1993 28.7 3116 44.9 943 13.6 66 1.0 18 0.3 804 11.6
Veterans/active military status 2028 29.3 2939 42.4 898 13.0 71 1.0 5 0.1 990 14.3
Other 367 14.9 685 27.9 365 14.9 37 1.5 24 1.0 979 39.8

Rankin & Associates Consulting Grand Valley Climate Assessment Project
Final Report
202
Table B79 How would you rate the climate on campus for persons from the following racial/ethnic backgrounds? (Question 91)
Very
Respectful
Moderately respectful
Not respectful or disrespectful
Moderately disrespectful
Not at all respectful
Don’t know Group n % n % n % n % n % n % African 1617 23.2 3452 49.5 812 11.6 239 3.4 30 0.4 827 11.9 African American/Black 1659 23.8 3462 49.6 858 12.3 343 4.9 47 0.7 614 8.8 Alaskan Native 1488 21.4 2715 39.1 730 10.5 36 0.5 10 0.1 1966 28.3 Asian 1738 25.0 3521 50.7 771 11.1 134 1.9 10 0.1 768 11.1 Caribbean/West Indian 1547 22.3 2964 42.8 744 10.7 85 1.2 15 0.2 1571 22.7 European American/White 2780 39.8 3217 46.1 560 8.0 47 0.7 9 0.1 369 5.3 Latino(a)/Hispanic 1612 23.2 3401 49.0 918 13.2 244 3.5 28 0.4 738 10.6 Middle Eastern 1456 21.0 3079 44.3 1029 14.8 396 5.7 89 1.3 896 12.9 Native American Indian 1564 22.6 3073 44.3 830 12.0 104 1.5 23 0.3 1336 19.3 Pacific Islanders/Hawaiian Natives 1519 22.0 2954 42.8 752 10.9 54 0.8 14 0.2 1616 23.4 Multiracial, multiethnic, or multicultural persons 1632 23.5 3331 48.0 847 12.2 121 1.7 16 0.2 987 14.2 Other 299 15.5 565 29.3 267 13.8 12 0.6 7 0.4 781 40.4

Rankin & Associates Consulting Grand Valley Climate Assessment Project
Final Report
203
Table B80 Students Only: Before I enrolled, I expected that the campus climate would be ________________ for people who are: (Question 92)
Very
Respectful
Moderately respectful Not respectful or
disrespectful Moderately
disrespectful Very disrespectful
Don’t know Group n % n % n % n % n % n %
Affected by psychological health issues 1562 29.1 2690 50.2 492 9.2 68 1.3 3 0.1 544 10.2
Affected by physical health issues 1631 30.5 2726 51.0 440 8.2 45 0.8 5 0.1 503 9.4
Female 1900 35.5 2713 50.7 355 6.6 35 0.7 3 0.1 348 6.5
From religious affiliations other than Christian 1550 29.0 2623 49.1 541 10.1 204 3.8 34 0.6 395 7.4
From Christian affiliations 1907 35.7 2565 48.0 424 7.9 65 1.2 19 0.4 367 6.9
Gay, lesbian, bisexual, transgender 1433 26.8 2481 46.4 660 12.4 295 5.5 55 1.0 418 7.8
Immigrants 1484 27.8 2593 48.5 602 11.3 149 2.8 21 0.4 498 9.3
International students, staff, or faculty 1644 30.8 2704 50.6 503 9.4 56 1.0 8 0.1 430 8.0
Learning disabled 1625 30.4 2688 50.3 492 9.2 80 1.5 10 0.2 446 8.4
Male 1998 37.4 2594 48.5 379 7.1 11 0.2 6 0.1 360 6.7
Non-native English speakers 1544 28.9 2661 49.8 559 10.5 121 2.3 6 0.1 448 8.4
Parents/guardians 1782 33.3 2607 48.8 467 8.7 32 0.6 6 0.1 452 8.5
People of Color 1704 31.9 2711 50.7 449 8.4 91 1.7 11 0.2 380 7.1
Providing care for other than a child 1589 29.8 2537 47.5 520 9.7 28 0.5 4 0.1 661 12.4
Physically disabled 1720 32.2 2684 50.3 441 8.3 45 0.8 5 0.1 441 8.3
Socioeconomically disadvantaged 1579 29.6 2622 49.1 510 9.6 165 3.1 24 0.4 436 8.2
Socioeconomically advantaged 1821 34.2 2606 49.0 427 8.0 25 0.5 6 0.1 435 8.2
Veterans/active military status 1918 36.1 2511 47.2 399 7.5 10 0.2 5 0.1 477 9.0
Other 391 21.2 756 41.0 191 10.4 7 0.4 4 0.2 493 26.8 Note: Table includes only those respondents who indicated they were students in Question 1 (n = 6,024).

Rankin & Associates Consulting Grand Valley Climate Assessment Project
Final Report
204
Table B81 Students Only: Do you experience financial hardship at GVSU? (Question 93)
Experience Financial Hardship
n
% Yes 3331 57.1 No 2498 42.9
Table B82 Students Only: How do you experience the financial hardship? (Question 94) Way(s) Experienced
n
%
Difficulty affording tuition 2574 77.3
Difficulty purchasing my books 2305 69.2
Difficulty in affording housing 1858 55.8
Difficulty affording university meal plan/food 1371 41.2
Difficulty participating in co-curricular events or activities 1295 38.9
Difficulty participating in social events 1241 37.3
Difficulty in affording health care 937 28.1
Difficulty traveling home during university breaks 755 22.7
Difficulty in traveling to campus 705 21.2
Difficulty in affording child care 147 4.4
Other 212 6.4 Note: Table includes only those respondents who students who answered that they experienced financial hardship in Question 93 (n = 3331).

Rankin & Associates Consulting Grand Valley Climate Assessment Project
Final Report
205
Table B83 Faculty/Students Only: The curriculum at GVSU includes materials, perspectives, and/or experiences of people based on their: (Question 98)
Characteristic
Strongly agree n %
Agree
n %
Neither agree nor disagree
n %
Disagree
n %
Strongly disagree n %
Don’t know n %
Age 992 17.4 2352 41.2 1165 20.4 338 5.9 70 1.2 791 13.9
Country of origin 939 16.5 2234 39.4 1289 22.7 309 5.4 59 1.0 845 14.9
English language proficiency/accent 939 16.6 2199 38.8 1245 22.0 323 5.7 53 0.9 904 16.0
Ethnicity 983 17.4 2381 42.1 1208 21.4 245 4.3 62 1.1 777 13.7
Gender 1054 18.6 2409 42.6 1138 20.1 229 4.1 71 1.3 751 13.3
Gender expression 891 15.8 1988 35.2 1338 23.7 402 7.1 108 1.9 913 16.2
Immigrant status 800 14.2 1874 33.2 1472 26.1 373 6.6 71 1.3 1047 18.6
Learning disability 802 14.3 2021 35.9 1359 24.2 363 6.5 71 1.3 1008 17.9
Medical conditions 821 14.6 1962 34.9 1410 25.1 323 5.7 67 1.2 1044 18.6
Levels of education 979 17.4 2313 41.1 1139 20.2 288 5.1 68 1.2 846 15.0
Military/veteran status 836 14.9 1839 32.7 1433 25.5 328 5.8 78 1.4 1102 19.6
Parental status 827 14.7 1948 34.7 1381 24.6 367 6.5 84 1.5 1013 18.0
Physical characteristics 820 14.6 1888 33.7 1476 26.3 344 6.1 87 1.6 994 17.7
Physical disability 833 14.9 2062 36.8 1363 24.3 319 5.7 62 1.1 961 17.2
Psychological condition 804 14.3 1929 34.4 1425 25.4 305 5.4 74 1.3 1067 19.0
Political views 927 16.5 2187 39.0 1252 22.3 319 5.7 94 1.7 834 14.9
Position 941 16.8 2175 38.8 1286 22.9 204 3.6 70 1.2 936 16.7
Race 973 17.4 2293 40.9 1199 21.4 246 4.4 72 1.3 818 14.6
Religious/spiritual views 899 16.0 2139 38.1 1280 22.8 339 6.0 127 2.3 825 14.7
Sexual orientation 856 15.3 2029 36.2 1321 23.6 380 6.8 104 1.9 909 16.2
Socioeconomic status 842 15.2 2049 36.9 1323 23.8 331 6.0 104 1.9 904 16.3 Note: Table includes only those respondents who indicated they were faculty or students in Question 1 (n = 6761).

Rankin & Associates Consulting Grand Valley Climate Assessment Project
Final Report
206
Table B84 Faculty/Staff Only: What is the influence of each on campus climate? (Question 99)
Positively influences campus climate
Has no influence on campus climate
Negatively influences campus
climate Not offered at
GVSU Don’t know n % n % n % n % n %
Providing tenure clock options with more flexibility for promotion/tenure for faculty 541 38.6 89 6.4 19 1.4 21 1.5 731 52.2
Providing recognition and rewards for including diversity issues in courses across the curriculum 607 43.9 163 11.8 53 3.8 39 2.8 522 37.7
Providing diversity education for staff 995 70.9 154 11.0 36 2.6 6 0.4 212 15.1
Providing diversity education for faculty 934 67.0 144 10.3 39 2.8 11 0.8 267 19.1
Providing diversity education for students 997 71.7 94 6.8 25 1.8 3 0.2 271 19.5
Providing, promoting and improving access to counseling for people who have experienced harassment 1065 76.2 62 4.4 10 0.7 12 0.9 249 17.8
Providing more effective mentorship for new faculty 970 69.6 72 5.2 9 0.6 22 1.6 320 23.0
Providing more effective mentorship for new staff 988 71.1 80 5.8 10 0.7 45 3.2 267 19.2
Providing a clear and fair process to resolve conflicts 1046 74.9 65 4.7 8 0.6 34 2.4 243 17.4
Increasing funding to support campus climate change efforts 787 56.9 148 10.7 43 3.1 9 0.7 396 28.6

Rankin & Associates Consulting Grand Valley Climate Assessment Project
Final Report
207
Table B84 (con.)
Positively influences campus
climate Has no influence on
campus climate
Negatively influences campus
climate Not offered at
GVSU Don’t know n % n % n % n % n %
Including diversity-related professional experiences as one of the criteria for hiring of staff/faculty 581 42.1 192 13.9 171 12.4 48 3.5 389 28.2
Including diversity-related professional experiences as one of the criteria for evaluation of staff/faculty 619 45.0 185 13.4 176 12.8 40 2.9 357 25.9
Providing diversity and equity training to search and tenure committees 807 58.4 148 10.7 77 5.6 15 1.1 336 24.3
Increasing the diversity of the faculty and staff 1011 72.6 133 9.6 46 3.3 4 0.3 198 14.2
Increasing the diversity of the administration 983 70.5 142 10.2 43 3.1 9 0.6 217 15.6
Increasing the diversity of the student body 1046 74.9 104 7.4 33 2.4 6 0.4 207 14.8 Note: Table includes only those respondents who indicated they were faculty or staff in Question 1 (n = 1524).

Rankin & Associates Consulting Grand Valley Climate Assessment Project
Final Report
208
Table B85 Students Only: What is the influence of each of the following on campus climate? (Question 102)
Positively influences campus climate
Has no influence on campus climate
Negatively influences campus climate Don’t know
n % n % n % n %
Providing diversity training for all students 4153 77.7 655 12.3 72 1.3 463 8.7
Providing diversity training for all staff 3891 72.9 623 11.7 68 1.3 754 14.1
Providing diversity training for all faculty 3886 73.1 627 11.8 55 1.0 750 14.1
Providing a person to address student complaints of classroom inequity 3854 72.5 658 12.4 43 0.8 760 14.3
Increasing the diversity of the faculty and staff 3618 68.0 945 17.8 209 3.9 546 10.3
Increasing the diversity of the student body 3925 73.8 819 15.4 117 2.2 457 8.6
Increasing opportunities for cross-cultural dialogue among students 4074 76.8 635 12.0 60 1.1 538 10.1
Increasing opportunities for cross-cultural dialogue between faculty, staff, and students 4023 75.8 645 12.2 62 1.2 575 10.8
Incorporating issues of diversity and cross-cultural competence more effectively into the curriculum 3934 74.3 707 13.4 117 2.2 535 10.1
Providing more effective faculty mentorship of students 4158 78.4 550 10.4 33 0.6 563 10.6
Participation of faculty/staff in co-curricular activities and programs 3884 73.6 665 12.6 31 0.6 695 13.2 Note: Table includes only those respondents who indicated they were students in Question 1 (n = 6,043).

Rankin & Associates Consulting Grand Valley Climate Assessment Project
Final Report
209
Table B86 Do you believe that GVSU is committed to diversity? (Question 97)
GVSU is Committed to Diversity
n
%
Yes 6427 89.5 No 755 10.0 Table B87 Have you attended multicultural events on campus? (Question 103)
Attended Events
n
% Yes 4491 59.3 No 3003 39.7