Appendix 2 Ontario™s Nuclear Generating Facilities: A ... Nuclear Stations 1.2. Bruce Nuclear...
33
Power for the Future Towards a Sustainable Electricity System for Ontario Appendix 2 Ontarios Nuclear Generating Facilities: A History and Estimate of Unit Lifetimes and Refurbishment Costs
-
Upload
duongthuan -
Category
Documents
-
view
217 -
download
0
Transcript of Appendix 2 Ontario™s Nuclear Generating Facilities: A ... Nuclear Stations 1.2. Bruce Nuclear...
Power for the Future Towards a Sustainable Electricity System for Ontario
Appendix 2Ontario�s Nuclear Generating Facilities:A History and Estimate of Unit Lifetimes
and Refurbishment Costs
Power for the Future / 101 Appendix 2 -- Ontario’s Nuclear Generating Facilities: A History and Estimate of Unit Lifetimes and Refurbishment Costs
Appendix 2: Ontario’s Nuclear Generating Facilities: A History and Estimate of Unit Lifetimes and
Refurbishment Costs Contents 1. Background 1.1. Pickering Nuclear Stations 1.2. Bruce Nuclear Stations 1.3. Darlington Nuclear Station 1.4. Ontario’s Demand-Supply Plan Hearing 1.5. 1997 Ontario Hydro Reactor Shutdown 1.6. Nuclear Power & Electricity Sector Restructuring in Ontario 2. CANDU Nuclear Performance in Ontario 3. Expected CANDU Lifetimes 4. CANDU Rehabilitation: Unjustifiable Risk 4.1. The Pickering “A” Refurbishment Fiasco 4.2. Bruce “A”: Risky Restart 4.3. Estimated Cost of Refurbishment 4.4. Regulatory Opposition to Point Lepreau Refurbishment Tables Table 1. Ontario Power Generation CANDU Reactors: “A” Plant Phaseout Schedule Table 2. Ontario Power Generation CANDU Reactors: “B” Plant Phaseout Schedule Table 3. Ontario Power Generation Nuclear Capacity (March 2004*) Table 4. CANDU Performance at Ontario Hydro / Ontario Power Generation 1997 - 2003 (Capacity Factor) Table 5. Fuel Channel & Steam Generator Replacement times (March 31, 1999) Table 6. Estimated Refurbishment Costs for Ontario Nuclear Power Plants (Current Dollars) Figures
Power for the Future / 102 Appendix 2 -- Ontario’s Nuclear Generating Facilities: A History and Estimate of Unit Lifetimes and Refurbishment Costs
Figure 1 Ontario Nuclear Capacity (Actual 1971-2003, Projected 2004-2019 Figure 2 Lifetime Performance Vs. Age for Ontario Nuclear Power Plants Figure 3 Average Cumulative Availability Vs. Reactor Age for Ontario Nuclear Program Figure 4 Annual Energy from Ontario Nuclear Program (Actual 1971-2001, Projected 2002-2020)
Power for the Future / 103 Appendix 2 -- Ontario’s Nuclear Generating Facilities: A History and Estimate of Unit Lifetimes and Refurbishment Costs
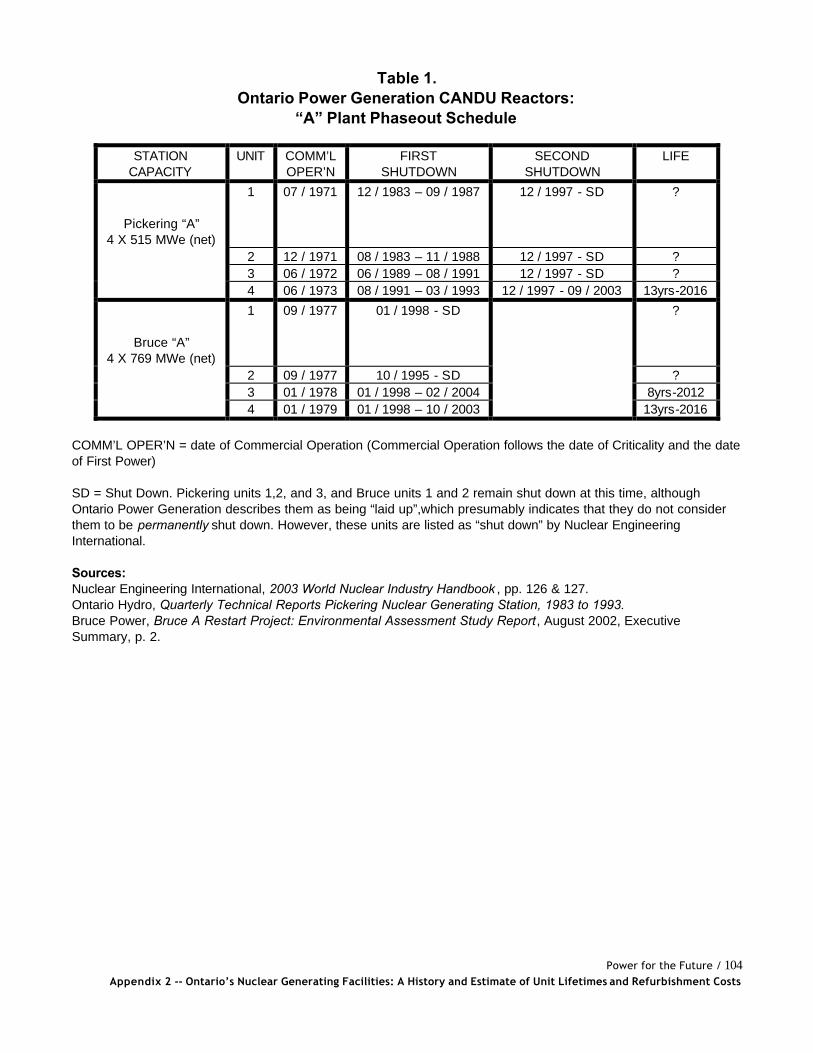
1. Background CANDU is a registered trademark of Atomic Energy of Canada Limited (AECL) which stands for CANadian Deuterium Uranium reactor. Its generic name is Pressurized Heavy Water Reactor (PHWR), and it uses heavy water (deuterium oxide) as both moderator and coolant. CANDU reactors need about one metric tonne of heavy water for every megawatt of capacity. Heavy water is very expensive to manufacture, making CANDU reactors more expensive than other reactor designs. The CANDU core is a cylindrical reactor vessel called a calandria, which encloses hundreds of horizontal fuel channels. Each fuel channel consists of a pressure tube inside a calandria tube. Heavy water coolant under pressure runs through the pressure tubes containing the fuel bundles to remove the heat. The heavy water moderator is in the calandria outside of the calandria tubes. Light Water Reactors (both Pressurized Water Reactors and Boiling Water Reactors) require enriched uranium fuel and use a relatively poor moderator (ordinary ‘light’ water); whereas CANDU reactors use un-enriched uranium, but have a more effective moderator (heavy water) to slow down neutrons and sustain a chain reaction. CANDU reactors can remain operating while spent fuel bundles are pushed out of a fuel channel on one side of the reactor, and new fuel bundles are loaded in the other. After ten to twenty years, the fuel channels face an increasing risk of catastrophic failure leading to a major Loss of Coolant Accident (LOCA). This occurred in 1983 in a pressure tube of Reactor #2 at the Pickering station in Ontario, when a meter-long rupture forced the shutdown and retubing of all four reactors at Pickering A over a period of ten years. A prototype CANDU reactor, the Nuclear Power Demonstration (NPD), built at Rolphton, Ontario, began operation in 1962. It was followed by the 220 MW Douglas Point reactor at the Bruce site on Lake Huron. Douglas Point was intended to be the first commercial nuclear plant, when it began operation in 1968, but it was a technological and financial failure that was permanently shut down in 1984, having had a lifetime capacity factor of only about 50% over a lifetime of less than 18 years1. In addition to the NPD and Douglas Point reactors, 20 large reactors came into commercial operation in Ontario between 1971 and 1993 (see Tables 1 and 2). As of March 2004, 15 of these reactors were operating (see Table 3). The five other reactors have been shut down for seven years or more
1 International Atomic Energy Agency, Operating Experience with Nuclear Power Stations in Member States in 1984, Vienna, 1986, p. 67.
Power for the Future / 104 Appendix 2 -- Ontario’s Nuclear Generating Facilities: A History and Estimate of Unit Lifetimes and Refurbishment Costs
Table 1.
Ontario Power Generation CANDU Reactors: “A” Plant Phaseout Schedule
STATION CAPACITY
UNIT COMM’L OPER’N
FIRST SHUTDOWN
SECOND SHUTDOWN
LIFE
Pickering “A” 4 X 515 MWe (net)
1 07 / 1971 12 / 1983 – 09 / 1987 12 / 1997 - SD ?
2 12 / 1971 08 / 1983 – 11 / 1988 12 / 1997 - SD ? 3 06 / 1972 06 / 1989 – 08 / 1991 12 / 1997 - SD ? 4 06 / 1973 08 / 1991 – 03 / 1993 12 / 1997 - 09 / 2003 13yrs-2016
Bruce “A” 4 X 769 MWe (net)
1 09 / 1977 01 / 1998 - SD ?
2 09 / 1977 10 / 1995 - SD ? 3 01 / 1978 01 / 1998 – 02 / 2004 8yrs-2012 4 01 / 1979 01 / 1998 – 10 / 2003 13yrs-2016
COMM’L OPER’N = date of Commercial Operation (Commercial Operation follows the date of Criticality and the date of First Power) SD = Shut Down. Pickering units 1,2, and 3, and Bruce units 1 and 2 remain shut down at this time, although Ontario Power Generation describes them as being “laid up”,which presumably indicates that they do not consider them to be permanently shut down. However, these units are listed as “shut down” by Nuclear Engineering International. Sources: Nuclear Engineering International, 2003 World Nuclear Industry Handbook , pp. 126 & 127. Ontario Hydro, Quarterly Technical Reports Pickering Nuclear Generating Station, 1983 to 1993. Bruce Power, Bruce A Restart Project: Environmental Assessment Study Report, August 2002, Executive Summary, p. 2.
Power for the Future / 105 Appendix 2 -- Ontario’s Nuclear Generating Facilities: A History and Estimate of Unit Lifetimes and Refurbishment Costs
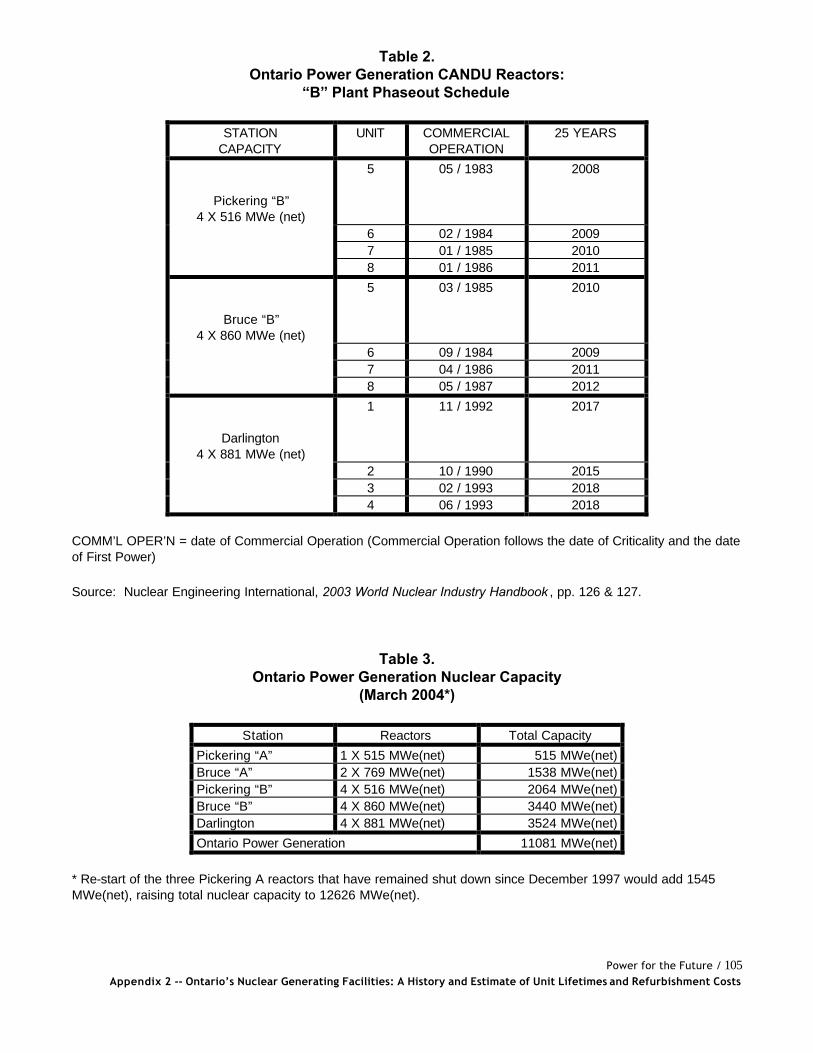
Table 2. Ontario Power Generation CANDU Reactors:
“B” Plant Phaseout Schedule
STATION
CAPACITY UNIT COMMERCIAL
OPERATION 25 YEARS
Pickering “B” 4 X 516 MWe (net)
5 05 / 1983 2008
6 02 / 1984 2009 7 01 / 1985 2010 8 01 / 1986 2011
Bruce “B” 4 X 860 MWe (net)
5 03 / 1985 2010
6 09 / 1984 2009 7 04 / 1986 2011 8 05 / 1987 2012
Darlington 4 X 881 MWe (net)
1 11 / 1992 2017
2 10 / 1990 2015 3 02 / 1993 2018 4 06 / 1993 2018
COMM’L OPER’N = date of Commercial Operation (Commercial Operation follows the date of Criticality and the date of First Power)
Source: Nuclear Engineering International, 2003 World Nuclear Industry Handbook , pp. 126 & 127.
Table 3. Ontario Power Generation Nuclear Capacity
(March 2004*)
Station Reactors Total Capacity
Pickering “A” 1 X 515 MWe(net) 515 MWe(net) Bruce “A” 2 X 769 MWe(net) 1538 MWe(net) Pickering “B” 4 X 516 MWe(net) 2064 MWe(net) Bruce “B” 4 X 860 MWe(net) 3440 MWe(net) Darlington 4 X 881 MWe(net) 3524 MWe(net)
Ontario Power Generation 11081 MWe(net)
* Re-start of the three Pickering A reactors that have remained shut down since December 1997 would add 1545 MWe(net), raising total nuclear capacity to 12626 MWe(net).
Power for the Future / 106 Appendix 2 -- Ontario’s Nuclear Generating Facilities: A History and Estimate of Unit Lifetimes and Refurbishment Costs
1.1. The Pickering Nuclear Stations In August 1964, AECL and Ontario Hydro reached an agreement to build two 500 MW CANDU reactors at Pickering, Ontario, just east of Toronto on Lake Ontario.2 This was Canada’s first large-scale nuclear power plant. Ontario Hydro chose to build nuclear stations with four reactors each, in order to reduce costs by sharing safety systems and other infrastructure. AECL and Ontario Hydro were engaging in technological leap-frogging, as the Douglas Point reactor did not even reach criticality until November 1966. Many of the mistakes made at Douglas Point had to be corrected while construction was underway at Pickering. The federal and Ontario governments not only provided most of the financing for Pickering reactors 1 and 2, but also provided Ontario Hydro with what amounted to a performance guarantee. The total cost of the two Pickering reactors (to both the federal government and Ontario Hydro) was reported at $393 to $420 million (dollars of the year).3 Ontario Hydro has reported that the release estimate for all four reactors in 1965 was $508 million (dollars of the year)4, and that the total cost for all four Pickering A units was $716 million (dollars of the year).5 The four Pickering A reactors maintained reasonable performance until August 1983, when a disastrous pressure tube rupture occurred in Pickering Reactor 2, and all four reactors were shut down in succession to have their pressure tubes replaced. The retubing of the four reactors cost about $1 billion (dollars of the year)6 -- more than their original capital cost. The shutdown of the four Pickering A reactors was staggered over a ten-year period 1983-1993 (see Table 1, “First Shutdown”). In 1974, construction started on the four Pickering B reactors immediately beside Pickering A. All eight reactors eventually shared common safety systems, including containment and vacuum building, as well as the emergency core cooling system, resulting in a higher risk of accident than at other facilities. The 1974 release estimate for the four Pickering B reactors was $1.585 billion, and the final cost in 1986 was $3.846 billion.7 ~~~~~~~~~~~~~~~~~~~~~~~~~~
2Wilfrid Eggleston, Canada’s Nuclear Story, Clarke Irwin, Toronto, 1965, p. 340.
3Robin Ann Cantor, An Analysis of Public Costs and Risks in the Canadian Nuclear Industry, PhD Dissertation, Department of Economics, Duke University, 1985, p. 69.
4Ontario Hydro, Demand Supply Plan Hearing Interrogatory No. 9.7.62., February 1991, p. 1.
5Ontario Hydro, A Journalist’s Guide to Nuclear Power, 1988, p.2.
6Ontario Hydro, A Journalist’s Guide to Nuclear Power, 1988, p.2.
7Ontario Hydro, Demand Supply Plan Hearing Interrogatory No. 9.7.62., February 1991, Attachment 1, p. 1-1.
Power for the Future / 107 Appendix 2 -- Ontario’s Nuclear Generating Facilities: A History and Estimate of Unit Lifetimes and Refurbishment Costs
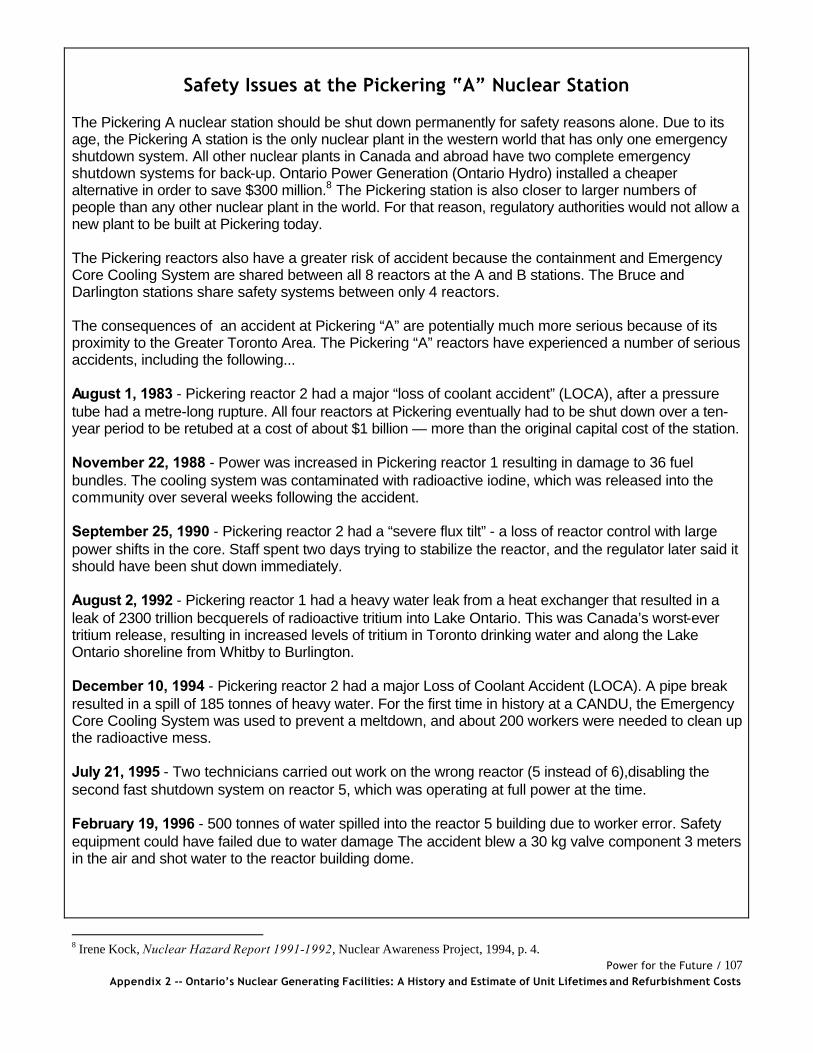
Safety Issues at the Pickering “A” Nuclear Station
The Pickering A nuclear station should be shut down permanently for safety reasons alone. Due to its age, the Pickering A station is the only nuclear plant in the western world that has only one emergency shutdown system. All other nuclear plants in Canada and abroad have two complete emergency shutdown systems for back-up. Ontario Power Generation (Ontario Hydro) installed a cheaper alternative in order to save $300 million.8 The Pickering station is also closer to larger numbers of people than any other nuclear plant in the world. For that reason, regulatory authorities would not allow a new plant to be built at Pickering today. The Pickering reactors also have a greater risk of accident because the containment and Emergency Core Cooling System are shared between all 8 reactors at the A and B stations. The Bruce and Darlington stations share safety systems between only 4 reactors. The consequences of an accident at Pickering “A” are potentially much more serious because of its proximity to the Greater Toronto Area. The Pickering “A” reactors have experienced a number of serious accidents, including the following... August 1, 1983 - Pickering reactor 2 had a major “loss of coolant accident” (LOCA), after a pressure tube had a metre-long rupture. All four reactors at Pickering eventually had to be shut down over a ten-year period to be retubed at a cost of about $1 billion — more than the original capital cost of the station. November 22, 1988 - Power was increased in Pickering reactor 1 resulting in damage to 36 fuel bundles. The cooling system was contaminated with radioactive iodine, which was released into the community over several weeks following the accident. September 25, 1990 - Pickering reactor 2 had a “severe flux tilt” - a loss of reactor control with large power shifts in the core. Staff spent two days trying to stabilize the reactor, and the regulator later said it should have been shut down immediately. August 2, 1992 - Pickering reactor 1 had a heavy water leak from a heat exchanger that resulted in a leak of 2300 trillion becquerels of radioactive tritium into Lake Ontario. This was Canada’s worst-ever tritium release, resulting in increased levels of tritium in Toronto drinking water and along the Lake Ontario shoreline from Whitby to Burlington. December 10, 1994 - Pickering reactor 2 had a major Loss of Coolant Accident (LOCA). A pipe break resulted in a spill of 185 tonnes of heavy water. For the first time in history at a CANDU, the Emergency Core Cooling System was used to prevent a meltdown, and about 200 workers were needed to clean up the radioactive mess. July 21, 1995 - Two technicians carried out work on the wrong reactor (5 instead of 6),disabling the second fast shutdown system on reactor 5, which was operating at full power at the time. February 19, 1996 - 500 tonnes of water spilled into the reactor 5 building due to worker error. Safety equipment could have failed due to water damage The accident blew a 30 kg valve component 3 meters in the air and shot water to the reactor building dome.
8 Irene Kock, Nuclear Hazard Report 1991-1992, Nuclear Awareness Project, 1994, p. 4.
Power for the Future / 108 Appendix 2 -- Ontario’s Nuclear Generating Facilities: A History and Estimate of Unit Lifetimes and Refurbishment Costs
April 15, 1996 - Pickering reactor 4 had a heavy water leak from a heat exchanger that released 50 trillion becquerels of tritium into Lake Ontario. The level of tritium in local drinking water peaked at about 100 times the usual level. October 11, 1996 - Drug paraphernalia were found in the operating islands at the both Pickering nuclear stations. This was one of 5 significant event reports relating to illicit drug and alcohol use at Pickering in 1996. May 17, 1997 - It was disclosed that Ontario Hydro failed to report the dumping of more than 1000 tonnes of copper, zinc and other metals into Lake Ontario, due to corrosion of brass steam condensers. 1.2. The Bruce Nuclear Stations Prior to the operation of Pickering Units 1 & 2, Ontario Hydro and Atomic Energy of Canada Limited (AECL) were negotiating construction of larger reactors at the Bruce site, adjacent to the Douglas Point reactor. AECL agreed to finance and construct a heavy water plant at the site, and Ontario Hydro was to be responsible for the nuclear plants.9 The 1969 release estimate when construction began on the four Bruce A reactors was $930 million (dollars of the year).10 The final cost was $1.8 billion (dollars of the year).11 Performance was reasonable until the late 1980s when problems with steam generators and ‘fretting’ of pressure tubes by fuel bundles began to occur.12 By 1993, Bruce A performance had decayed to an abysmal load factor of less than 40%. Unlike the Pickering A and B stations, the four reactors at the Bruce B station are totally separate from Bruce A. The initial release estimate for Bruce B in 1976 was $3.929 billion and the final cost was $5.994 billion (dollars of the year).13 1.3. Darlington Nuclear Station The Darlington nuclear station, with four 881 MWe(net) reactors, is located in the municipality of Clarington, east of Oshawa. Shortly after work began on Darlington in 1978, the partial meltdown at Three Mile Island occurred in 1979. For the first time in Ontario, construction of a nuclear station prompted large protests and construction of the nuclear plant remained highly controversial during the 1980s and early 1990s. Darlington is infamous
9Robin Ann Cantor, An Analysis of Public Costs and Risks in the Canadian Nuclear Industry, PhD Dissertation, Department of Economics, Duke University, 1985, p. 71.
10Ontario Hydro, Demand Supply Plan Hearing Interrogatory No. 9.7.62., February 1991, p. 1.
11Ontario Hydro, A Journalist’s Guide to Nuclear Power, 1988, p. 4.
12Canada Enters the Nuclear Age: A Technical History of Atomic Energy of Canada Limited, AECL, 1997, pp. 201-202.
13Ontario Hydro, Demand Supply Plan Hearing Interrogatory No. 9.7.62., February 1991, Attachment 2, p. 2-1.
Power for the Future / 109 Appendix 2 -- Ontario’s Nuclear Generating Facilities: A History and Estimate of Unit Lifetimes and Refurbishment Costs
for its massive capital cost overruns. An early cost estimate for Darlington in 1973 was $2.5 billion,14 and the initial release estimate in 1978 was $3.950 billion.15 The final cost in 1993 escalated to $14.4 billion (dollars of the year). Darlington experienced serious technical problems in its early years. Start-up was initially delayed by problems with the validation of the shutdown system software. In 1990, reactor 2 experienced a three- month delay when a crack in the rotor of the generator was discovered. In 1991, fuel damage and pressure tube damage was discovered which caused major delays. It was eventually determined that this was caused by excessive vibrations from the main heat transport pumps on all four reactors, which were modified.16 1.4. Ontario’s Demand-Supply Plan Hearing In December 1989, Ontario Hydro released its Demand Supply Plan, which identified options for the 25-year period 1990-2014.17 The plan called for construction of up to 15 reactors at four stations, and cost estimates for the plan, including additional fossil and hydro-electric generating stations, ranged from $61 billion to $200 billion.18 The plan unraveled under scrutiny at environmental assessment hearings and was withdrawn by Ontario Hydro in January 1993. 1.5. The 1997 Nuclear Asset Optimization Plan On August 13, 1997, Ontario Hydro announced that it would temporarily shut down its oldest seven reactors. The oldest four reactors at Pickering A were shut down at the end of 1997.19 The three remaining Bruce A reactors were shut down on March 31, 1998. Bruce reactor 2 had already been closed in October 1995. It was the largest single shutdown in the international history of nuclear power -- over 5,000 MW of nuclear capacity. Ontario Hydro’s Nuclear Asset Optimization Plan (NAOP) called for the “phased recovery” of its nuclear reactors, including first, “extensive upgrades” to the operating stations: Pickering B, Bruce B, and Darlington. Next, it would bring back into operation the four Pickering A reactors, and
14Brief by J. McCredie, Project Manager Darlington Generating Station, Demand Supply Plan Hearing Exhibit 539, March 20, 1992, p. 1.
15Ontario Hydro, Demand Supply Plan Hearing Interrogatory No. 9.7.62., February 1991.
16Brief by J. McCredie, Project Manager Darlington Generating Station, Demand Supply Plan Hearing Exhibit 539, March 20, 1992, p. 3.
17Ontario Hydro, Providing the Balance of Power, 1989. The report contained four main sections: Overview; Demand Supply Plan Report; Plan Analysis; and Environmental Analysis.
18“Ontario Hydro Wants up to 15 Nukes”, Nuclear Awareness News, Winter 1989/1990, pp. 1-4.
19“Ontario Hydro Moving Ahead on Major Overhaul of its Production Facilities”, Ontario Hydro News Release, August 13, 1997. See also: “Results of the Nuclear Performance Advisory Group’s Independent Integrated Performance Assessment and their recommended Nuclear Asset Optimization Strategy”, Ontario Hydro Advice of Decision of Board of Directors, August 12, 1997.
Power for the Future / 110 Appendix 2 -- Ontario’s Nuclear Generating Facilities: A History and Estimate of Unit Lifetimes and Refurbishment Costs
then the four reactors at Bruce A. This was also called the “12/16/20 Plan” after the number of reactors sequentially in operation. 1.6. Nuclear Power & Electricity Sector Restructuring in Ontario In October 1998 the Conservative government of former Premier Mike Harris passed the Energy Competition Act splitting Ontario Hydro into five publicly owned entities. The government’s plan was to restructure the electricity sector, eliminating Ontario Hydro’s historic monopoly, and introducing competition at both the wholesale and retail levels. Ontario Hydro ceased operation on April 1, 1999, and Ontario Power Generation (OPG), which owns all of the nuclear, fossil and hydraulic generating stations, began operation. The transmission grid and Ontario Hydro’s rural retail division were transferred to Hydro One. At the time of its dissolution, Ontario Hydro had $38.1 billion in debt and liabilities -- largely debt for nuclear projects, including $2.3 billion in nuclear liabilities for decommissioning and radioactive waste management. It was generally recognized that with this debt and its huge burden of expensive and poorly performing nuclear capacity, OPG would go bankrupt in the competitive electricity market. Thus the nuclear plants were said to be ‘stranded’ assets, and the debt incurred for their construction and rehabilitation was said to be ‘stranded’ debt. The Ontario government relieved Ontario Hydro’s successor companies of most of this stranded debt. OPG was assigned a value of $8.5 billion and a debt of only $3.4 billion. Ontario Hydro negotiated a very high level of stranded debt ($20.9 billion)20 to improve its position going into competition. This was in effect the world’s biggest nuclear bailout, subsidizing the rehabilitation of Ontario Hydro’s ailing nuclear fleet, and facilitating re-start of the eight Pickering A and Bruce A reactors. As part of the restructuring process in Ontario, the government recognized that the effective monopoly of OPG (85% of the market in 2000) was a major impediment to the introduction of competition. Therefore a ‘Market Power Mitigation Agreement’ was negotiated, which specified that OPG would “within ten years of market opening, [...] reduce its market share of total generating capacity servicing Ontario demand to no more than 35 percent”.21 However this did not necessarily imply divestiture. On July 11, 2000, OPG announced that it had entered a “leasing agreement” with Bruce Power Partnership for the Bruce A and Bruce B nuclear stations. At the time, Bruce Power was owned 80% by British Energy plc, 15% by Cameco Corporation (a Canadian company mainly conducting uranium mining and refining) and 5% by the unions at the stations.22 The lease agreement runs until 2018, with an option to extend for 25 years. The detailed terms of the agreement have not been made public, however, it has been stated that OPG will receive an initial payment of $625 million with supplementary payments for the management of high level radioactive waste (spent
20Ontario Ministry of Finance, Stranded Debt Fact Sheet , April 1, 1999.
21Market Design Committee, Third Interim Report, October 8, 1998, p. 1-5.
22Bruce Power: About Us, downloaded February 27, 2001, http://www.brucepower.com/aboutus.htm
Power for the Future / 111 Appendix 2 -- Ontario’s Nuclear Generating Facilities: A History and Estimate of Unit Lifetimes and Refurbishment Costs
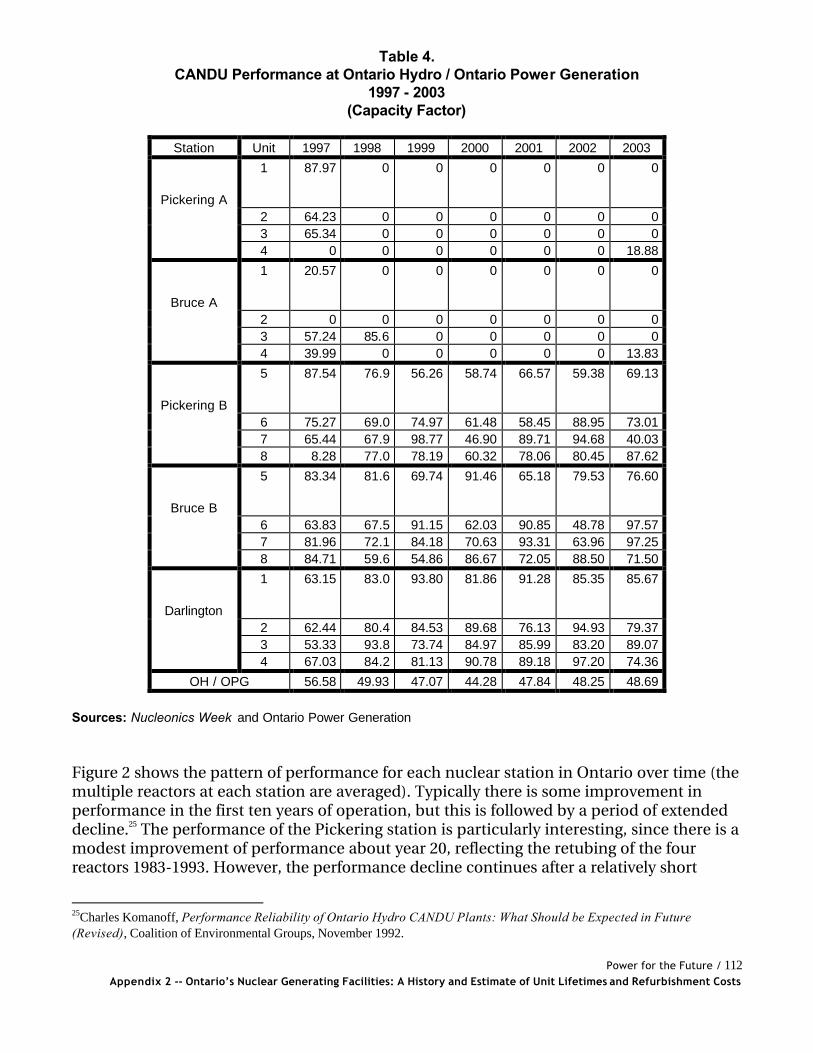
fuel), and a share of net revenue.23 A major concern is that Bruce Power will not bear the full cost of long-term liabilities for decommissioning and radioactive waste management. These liabilities will rest with Ontario Power Generation and ultimately the Government of Ontario and provincial taxpayers. After repeated delays, the Ontario government finally opened the Ontario electricity market on May 1, 2002. However, faced with volatile and rising electricity prices under the competitive market, the Ontario Government retreated from its commitment to electricity sector competition. It passed the Electricity Pricing, Conservation and Supply Act in December 2002, which capped electricity prices at 4.3 cents per kilowatt hour for consumers using up to 250,000 kWh annually. Large customers remained in the competitive market and received rebates under the Market Power Mitigation Agreement for the 12 months ending April 30, 2003. As of May 1, 2003, rebates to the large customers were fixed at 50% of the amount by which the average spot market price exceeded 3.8 cents per kilowatt hour. Following their election in October 2003, the Liberal government of Premier Dalton McGuinty passed the Ontario Energy Board Amendment Act in December 2003. As of April 1, 2004, the fixed price of 4.3 cents/kWh rose to 4.7 cents for the first 750 kWh consumed each month. Above 750 kWh each month, the price rises to5.5 cents. The rules were not amended for customers above 250,000 kWh/yr. While electricity has been subsidized by capping rates, the reason for high electricity costs has undoubtedly been nuclear power. When Ontario Hydro last publicly acknowledged the price of nuclear power in 1999, it cost 7.721 cents per kilowatt hour.24 At the time, the cost of hydroelectric electricity was 1.098 cents per kilowatt hour, and the price of fossil-generated electricity was 4.293 cents per kilowatt hour. Since that time, the cost of nuclear power has unquestionably risen. 2. CANDU Nuclear Performance in Ontario In 2003, the 20 operable reactors owned by Ontario Power Generation ran at an average net capacity factor of 48.69% (See: Table 4). Capacity factor is actual electricity production expressed as a percentage of 100% perfect output. When the Ontario Hydro Board of Directors approved the Nuclear Asset Optimization Plan in 1997, it was assumed that shutdown of the 8 Pickering A and Bruce A reactors would allow Ontario Hydro to concentrate on the restoration of the remaining reactors in the nuclear fleet to a capacity factor of 86%. However, as can be seen in Table 4, instead of improving, nuclear performance has stagnated at historically low levels, below 50% average capacity factor, despite a massive investment of funds for refurbishment.
23Ontario Power Generation & Bruce Power, “Ontario Power Generation and Bruce Power Announce Agreement at Bruce Nuclear”, News Release, July 11, 2001.
24Ontario Hydro Final Annual Report January 1998-March 1999, p. 67.
Power for the Future / 112 Appendix 2 -- Ontario’s Nuclear Generating Facilities: A History and Estimate of Unit Lifetimes and Refurbishment Costs
Table 4. CANDU Performance at Ontario Hydro / Ontario Power Generation
1997 - 2003 (Capacity Factor)
Station Unit 1997 1998 1999 2000 2001 2002 2003
Pickering A
1 87.97 0 0 0 0 0 0
2 64.23 0 0 0 0 0 0 3 65.34 0 0 0 0 0 0 4 0 0 0 0 0 0 18.88
Bruce A
1 20.57 0 0 0 0 0 0
2 0 0 0 0 0 0 0 3 57.24 85.6 0 0 0 0 0 4 39.99 0 0 0 0 0 13.83
Pickering B
5 87.54 76.9 56.26 58.74 66.57 59.38 69.13
6 75.27 69.0 74.97 61.48 58.45 88.95 73.01 7 65.44 67.9 98.77 46.90 89.71 94.68 40.03 8 8.28 77.0 78.19 60.32 78.06 80.45 87.62
Bruce B
5 83.34 81.6 69.74 91.46 65.18 79.53 76.60
6 63.83 67.5 91.15 62.03 90.85 48.78 97.57 7 81.96 72.1 84.18 70.63 93.31 63.96 97.25 8 84.71 59.6 54.86 86.67 72.05 88.50 71.50
Darlington
1 63.15 83.0 93.80 81.86 91.28 85.35 85.67
2 62.44 80.4 84.53 89.68 76.13 94.93 79.37 3 53.33 93.8 73.74 84.97 85.99 83.20 89.07 4 67.03 84.2 81.13 90.78 89.18 97.20 74.36
OH / OPG 56.58 49.93 47.07 44.28 47.84 48.25 48.69
Sources: Nucleonics Week and Ontario Power Generation Figure 2 shows the pattern of performance for each nuclear station in Ontario over time (the multiple reactors at each station are averaged). Typically there is some improvement in performance in the first ten years of operation, but this is followed by a period of extended decline.25 The performance of the Pickering station is particularly interesting, since there is a modest improvement of performance about year 20, reflecting the retubing of the four reactors 1983-1993. However, the performance decline continues after a relatively short
25Charles Komanoff, Performance Reliability of Ontario Hydro CANDU Plants: What Should be Expected in Future (Revised), Coalition of Environmental Groups, November 1992.
Power for the Future / 113 Appendix 2 -- Ontario’s Nuclear Generating Facilities: A History and Estimate of Unit Lifetimes and Refurbishment Costs
period despite the billion-dollar investment. The pattern of nuclear performance decline can be seen more clearly on the composite graph in Figure 3, which averages all nuclear performance in Ontario over time. It should be noted that good CANDU performance is not guaranteed even during the early years of operation. Ontario Power Generation’s newest reactors at the Darlington Nuclear Generating Station experienced severe performance problems during their early years of operation. Reactors 2 (which was started first) had a three-year average capacity (load) factor of 11%, while the first year capacity factor of reactor 1 was 33%. Initial problems included the cracking of the generator rotors. All original rotors had to be replaced with a new design.26 These first two reactors at the four unit station were also kept closed for extended periods because of unexplained fuel bundle damage in the reactor core.27 The fuel damage problem, known as “shake and break” was eventually traced to the design of the primary heat transport pumps in relation to the size and shape of the fuel channels at Darlington. The particular equipment chosen resulted in vibrations inside the fuel channels which caused rapid breakdown of the fuel bundles and damage to the pressure tubes. The design of the heat transport pumps had to be changed to stop the resonance of the fuel channels.28 CANDU performance world-wide compares poorly to dominant world types of power reactors. According to Nucleonics Week,29 a nuclear industry trade journal, the 2003 average capacity (load) factors for the major competitive reactor types were as follows: Pressurized Water Reactors (259 PWRs) = 82.62%; Boiling Water Reactors (92 BWRs) = 70.23; Pressurized Heavy Water Reactors 30 (41 PHWRs) = 63.28%. While CANDU performance has declined over the last 20 years, nuclear reactors in the United States have been steadily improving from an average capability factor of 62.7% in 1980 to an average of 88.7% in 1999.31 While aging is the broad factor associated with declining CANDU performance over time, there are a few specific technical problems that have contributed to worsening performance. The single greatest problem relates to fuel channels — the calandria and pressure tubes that are a unique feature of the CANDU reactor. After only 12 years of operation, Pickering reactor 2 was shut down in 1983 following a rupture in one of its 390 pressure tubes. Reactor 1 was shut down shortly after and reactors 3 and 4 were eventually shut down as well (see “First Shutdown”, Table 1). The rupture was due to embrittlement caused by hydrogen absorption in the tube alloy. Although the outage time for each subsequent retubing was reduced through experience at the four Pickering reactors from 5 years to just under two
26Atomic Energy Control Board, AECB Annual Staff Report for 1992, AECB BMD 93-138, July 27, 1993.
27Atomic Energy Control Board, AECB Annual Staff Report for 1991, AECB BMD 92-145, July 28, 1992.
28Irene Kock, Nuclear Hazard Report 1991-1992, Nuclear Awareness Project, 1994, p. 9.
29“Gross Generation by Reactor Type and Vendor”, Nucleonics Week , February 12, 2004, pp. 6-7.
30Pressurized Heavy Water Reactor , PHWR, is te generic name for the CANDU reactor design. Not all of these reactors were built by Ontario Hydro/OPG, or AECL. However, the Ontario Hydro/OPG/AECL 2003 average Capacity Factor of 62.11 was even lower than the overall PHWR average of 63.28%.
31“Nuclear power in the U.S. stays on improvement track”, Nuclear News, May 2000, p. 27.
Power for the Future / 114 Appendix 2 -- Ontario’s Nuclear Generating Facilities: A History and Estimate of Unit Lifetimes and Refurbishment Costs
years, this still represents a major performance problem. The problem has not been limited to Pickering A. In 1986 there was tube rupture in Bruce A reactor 2, and other tubes at Bruce A have leaked, causing shutdowns for replacement. The Bruce reactors, however, have not been completely retubed. Although some technical solutions have allowed continued operation without Large Scale Fuel Channel Replacement, the issue of whether reactors should be completely retubed remains a primary factor in the performance, cost effectiveness and safety of all CANDU reactors. Steam generator problems are the second most serious contributor to performance problems, although these problems are not unique to CANDU reactors. Fouling, corrosion, pitting, and fretting due to vibration are the major causes of tube failure in steam generators. These problems necessitate various expensive and technically difficult remedial programs, and will likely require the eventual replacement of some steam generators. Remedial programs include: improved chemistry control of feedwater; high pressure water jet cleaning; chemical cleaning; increased monitoring of tubes; and computer prediction and modeling of problems. The Bruce A station has had the most steam generator problems, including leaks caused by corrosion fatigue cracking and stress corrosion cracking. The steam generators of Bruce reactor 2 are in the worst condition. 32 In order of priority, other causes of CANDU performance problems have been identified as turbines, reactors controls, primary heat transport, moderators, fuel handling, containment, emergency cooling, feed water systems, pump motor sets, and a mixture of problems associated with the balance of plant.33 3. Expected CANDU Lifetimes Traditionally, Ontario Hydro and Ontario Power Generation have depreciated nuclear power plants assuming that their life expectancy was 40 years.34 However, because of the demonstrated need for retubing and major rehabilitation at much earlier dates, this study has assumed that a reasonable estimate of CANDU lifetime is no more than 25 years, in the absence of major rehabilitation expenditures (see Tables 1 and 2). This estimate is consistent with the position of the Canadian Nuclear Association, which has stated...
It is [...] assumed that all [CANDU] nuclear power plants will have to undergo one major rehabilitation program after 25 years in service to get to the full 40 years. Hence the forecast on availability depends on whether or not a decision is made to rehabilitate a nuclear plant after 25 years in service.35
32Dave Turner, “Pulling CANDUs Back from the Brink”, Nuclear Engineering International, May 1994, pp. 40-41.
33Ontario Hydro, Demand-Supply Plan Hearing, Response to Interrogatory 9.7.148 from the Coalition of Environmental Groups, October 31, 1991.
34See for example: Ontario Hydro Final Annual Report January 1988-March 1999, pp. 44-45.
35Canadian Nuclear Association, The Value of Nuclear Power to Canada’s CO2 emissions trading system, October 2003, p. 12.
Power for the Future / 115 Appendix 2 -- Ontario’s Nuclear Generating Facilities: A History and Estimate of Unit Lifetimes and Refurbishment Costs
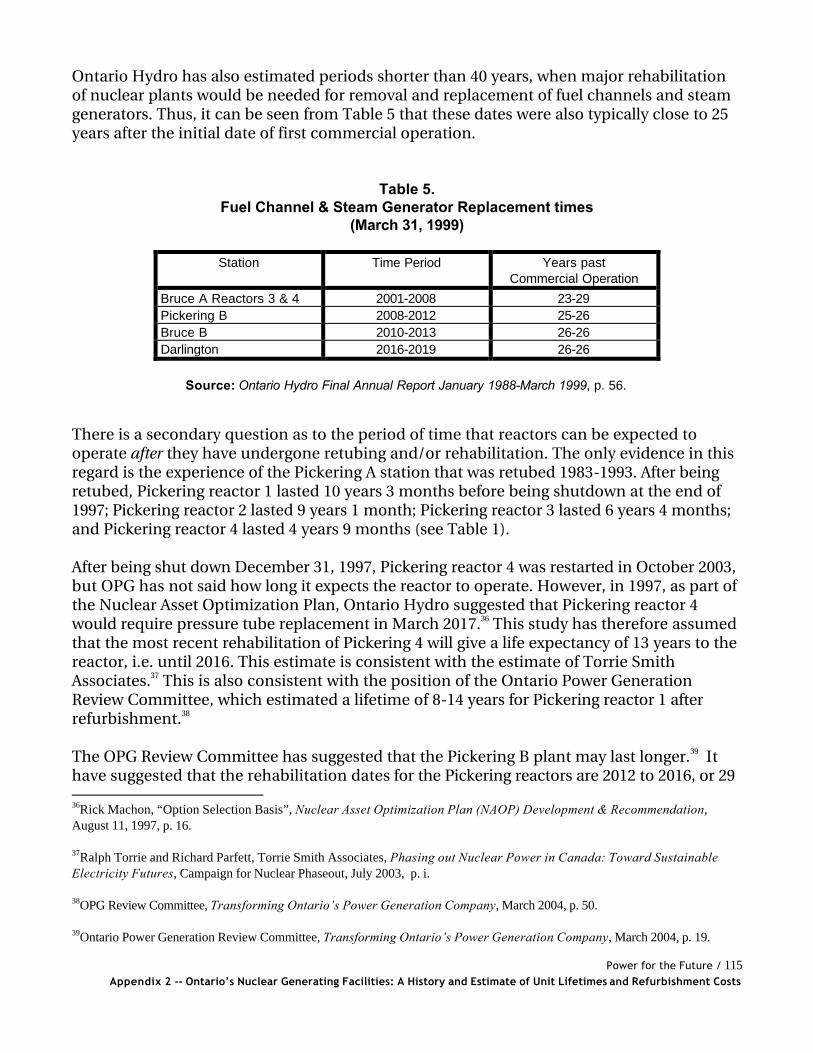
Ontario Hydro has also estimated periods shorter than 40 years, when major rehabilitation of nuclear plants would be needed for removal and replacement of fuel channels and steam generators. Thus, it can be seen from Table 5 that these dates were also typically close to 25 years after the initial date of first commercial operation.
Table 5. Fuel Channel & Steam Generator Replacement times
(March 31, 1999)
Station Time Period Years past Commercial Operation
Bruce A Reactors 3 & 4 2001-2008 23-29 Pickering B 2008-2012 25-26 Bruce B 2010-2013 26-26 Darlington 2016-2019 26-26
Source: Ontario Hydro Final Annual Report January 1988-March 1999, p. 56.
There is a secondary question as to the period of time that reactors can be expected to operate after they have undergone retubing and/or rehabilitation. The only evidence in this regard is the experience of the Pickering A station that was retubed 1983-1993. After being retubed, Pickering reactor 1 lasted 10 years 3 months before being shutdown at the end of 1997; Pickering reactor 2 lasted 9 years 1 month; Pickering reactor 3 lasted 6 years 4 months; and Pickering reactor 4 lasted 4 years 9 months (see Table 1). After being shut down December 31, 1997, Pickering reactor 4 was restarted in October 2003, but OPG has not said how long it expects the reactor to operate. However, in 1997, as part of the Nuclear Asset Optimization Plan, Ontario Hydro suggested that Pickering reactor 4 would require pressure tube replacement in March 2017.36 This study has therefore assumed that the most recent rehabilitation of Pickering 4 will give a life expectancy of 13 years to the reactor, i.e. until 2016. This estimate is consistent with the estimate of Torrie Smith Associates.37 This is also consistent with the position of the Ontario Power Generation Review Committee, which estimated a lifetime of 8-14 years for Pickering reactor 1 after refurbishment.38 The OPG Review Committee has suggested that the Pickering B plant may last longer.39 It have suggested that the rehabilitation dates for the Pickering reactors are 2012 to 2016, or 29 36Rick Machon, “Option Selection Basis”, Nuclear Asset Optimization Plan (NAOP) Development & Recommendation, August 11, 1997, p. 16.
37Ralph Torrie and Richard Parfett, Torrie Smith Associates, Phasing out Nuclear Power in Canada: Toward Sustainable Electricity Futures, Campaign for Nuclear Phaseout, July 2003, p. i.
38OPG Review Committee, Transforming Ontario’s Power Generation Company, March 2004, p. 50.
39Ontario Power Generation Review Committee, Transforming Ontario’s Power Generation Company, March 2004, p. 19.
Power for the Future / 116 Appendix 2 -- Ontario’s Nuclear Generating Facilities: A History and Estimate of Unit Lifetimes and Refurbishment Costs
to 30 years after the start of commercial operation. The committee’s estimates for Bruce B and Darlington are not inconsistent with the estimates of this study. The OPG Review Committee suggests that rehabilitation dates for Bruce B are 2009-2017 (24 to 30 years post-commercial operation); and for Darlington are 2013-2020 (21 to 27 years post-commercial operation). Two other reactors have undergone major rehabilitation — Bruce A reactors 3 and 4. Bruce Power has stated that it expects Bruce reactor 3 to operate for 8 years — until 2012, and that Bruce 4 will operate for 13 years, until 2016.40 4. CANDU Rehabilitation Risks As CANDU reactors in Ontario have aged, they have experienced increasing technical problems and poor performance -- typically worsening dramatically after about ten years of operation. Although it was originally assumed that CANDU reactors would last for forty years, they are experiencing serious operational problems much earlier. Ontario Hydro’s decision in August 1997 to temporarily shut down its oldest seven reactors was dramatic proof that the early aging of CANDU reactors leads to poor performance and safety problems.41 The four Bruce "A" reactors lasted less than half of their expected 40-year lifetimes, before being shut down for long-term repair work. The Pickering "A" reactors lasted only 25 years, despite having been re-tubed 1983-1993. 4.1. The Pickering “A” Refurbishment In August 1983 a disastrous pressure tube rupture occurred in Pickering Reactor 2, and all four reactors at the Pickering A station were shut down. The pressure tubes of each reactor were replaced in succession over a ten year period. The retubing of the four reactors cost about $1 billion (dollars of the year)42 -- more than their original capital cost. As noted above, despite this enormous investment, the reactors were shut down just a few years later at the end of 1997 because of technical and performance problems. The second major refurbishment of the four Pickering reactors began shortly after they were shut down at the end of 1997. This began even while a screening level environmental assessment on the restart project was being conducted by the Canadian Nuclear Safety Commission from 1999-2000. That environmental assessment was widely condemned by environmental and community groups for failing to deal with vital issues such as the possibility of severe accidents, the need for restart, and financial cost. 40Bruce Power, Bruce A Restart Project: Environmental Assessment Study Report, August 2002, Executive Summary, p. 2.
41Ontario Hydro, “Ontario Hydro moving ahead on major overhaul of its production facilities”, News Release, August 13, 1997.
42Ontario Hydro, A Journalist’s Guide to Nuclear Power, 1988, p.2.
Power for the Future / 117 Appendix 2 -- Ontario’s Nuclear Generating Facilities: A History and Estimate of Unit Lifetimes and Refurbishment Costs
The Pickering A restart project had experienced significant delays. When the four old Pickering A reactors were first shut down on December 31, 1997, the first reactor (Unit 4) was supposed to restart in June 2000,43 with the remaining three to be restarted at six month intervals (to be completely operational by June 2002). After repeated delays, reactor 4 only restarted commercial operation in October 2003 — three years and 4 months late. No public commitment has been made for the restart of reactors 1, 2, and 3. If they are restarted at all, it has been suggested that reactors 1, 2, and 3 would be restarted at one-year intervals.44 The cost of the Pickering A restart was estimated in 1999 at $780 million for all 4 reactors.45 However, by September 2002, Ontario Power Generation reported that costs for the project had escalated to $1.025 billion.46 At that time, OPG estimated that the start-up of Reactor 4 would cost another $230 million, and the other three reactors would cost an additional $300 to $400 million each.47 Thus the cost for restarting reactor 4 alone was then estimated to be $1.255 billion, with a likely additional $1.2 billion for the other three reactors, totaling $2.455 billion -- three times the original cost estimate. On May 30, 2003, the Ontario government of former Premier Ernie Eves announced the creation of a review panel on the refurbishment of the Pickering “A” nuclear station. The Sierra Club of Canada labeled the review a “whitewash” because it was had pro-nuclear leadership and because the terms of reference were restricted to determining the conditions for restarting the four reactors, rather than comparing the cost of energy alternatives and the risks of restarting the reactors.48 The review was headed by a former federal energy minister under the Mulroney government, Jake Epp, well known for his support of nuclear power. The second member of the review was Robin Jeffrey, a nuclear industry insider, formerly head of British Energy in Norther America (British Energy is the British company that created the American nuclear company Amergen and the Canadian nuclear company Bruce Power). The Epp review panel released its report on December 4, 2003. The panel focused blame on management practices at Ontario Power Generation, almost completely ignoring the antiquated Pickering nuclear technology.49 The review stated that $1.25 billion had been spent in order restart reactor 4 by September 2003. Astoundingly, OPG had failed to provide a hard estimate of the cost of completion.
43Ontario Hydro, 1998-200 Ontario Hydro Corporate Business Plan, February 17 1998, p. 22.
44Richard Brennan, “Shake-up at hand over nuclear plant”, Toronto Star, Novemb er 27, 2002, p. A8.
45KPMG, Ontario Power Generation Inc. Financial Review of Operations, March 15 2004, p. 20.
46Ontario Power Generation, Third Quarter 2002 Results, October 28, 2002, p. 12.
47Ontario Power Generation, Third Quarter 2002 Results, October 28, 2002.
48Sierra Club of Canada, “Eves Government Pickering Nuclear Review: A One-sided Whitewash”, News Release, June 3, 2003.
49Pickering Review Panel, Report of the Pickering “A” Review Panel, December 4, 2003. The three panel members were Jake Epp, Chair, Peter Barnes and Dr. Robin Jeffrey.

Power for the Future / 118 Appendix 2 -- Ontario’s Nuclear Generating Facilities: A History and Estimate of Unit Lifetimes and Refurbishment Costs
The Epp panel guessed that the total cost would be $3 to $4 billion — an incremental amount of $1.75 to $2.75 billion to restart reactors 1, 2, and 3.50 More than anything else, the $1 billion range of uncertainty about the final cost indicated the enormity and high risk of the Pickering restart project. The report identified 11 increases of the cost estimate between August 1999 and May 2003, 13 revisions of the return-to-service date in the same period.51 Little or nothing had changed in management practices at the plant since disastrous problems had been identified in 1997. All of the final recommendations of the panel related to improving corporate governance and managerial practices. Only one sentence in the entire report, entitled “Complexity of the Project” mentioned the role that the technology might play...
It should be recognized that the return of the remaining units remains a large, complex project with corresponding cost involving the reconditioning , rebuilding, replacing or adding of equipment at a 30-year-old station.52
The Epp panel implicitly supported the continued refurbishment of the other three reactors at Pickering A. However the government of Premier McGuinty was not prepared to make an immediate decision. On December 16, 2003, another panel, known as the Ontario Power Generation Review Committee, was mandated to examine the role, structure and governance of OPG, as well as the proposed restart of reactors 1, 2, and 3 at the Pickering “A” nuclear station. The Committee was headed by former federal Finance Minister John Manley, and again recruited Jake Epp. The third member of the tribunal was Peter Godsoe, Chairman and former CEO of Scotiabank. No energy or environmental experts were appointed to the committee. The OPG Review Committee released its report on March 18 2004. Similar to the Pickering “A” Review Panel, the OPG review committee placed blame for the problems at OPG’s nuclear facilities on management practices. Despite the obvious financial, performance and safety problems of the last 30 years, they found no fault with the nuclear power technology itself. In the case of the restart of Pickering A reactors 1, 2, and 3, Manley supported the restart project strongly, suggesting that the project be done sequentially, with approval dependent on whether “OPG will be able to succeed at the Unit 1 project”.53 Manley did not even stipulate that OPG should finish the Unit 1 project on budget.
50Report of the Pickering “A” Review Panel, December 4, 2003, p. 4.
51Report of the Pickering “A” Review Panel, December 4, 2003, pp. 11 - 12.
52Report of the Pickering “A” Review Panel, December 4, 2003, p. 15.
53Ontario Power Generation Review Committee, Transforming Ontario’s Power Generation Company, March 2004, p. 47.
Power for the Future / 119 Appendix 2 -- Ontario’s Nuclear Generating Facilities: A History and Estimate of Unit Lifetimes and Refurbishment Costs
Manley argued that the Pickering restart project would be cheaper than a Combined Cycle Gas Turbine fired by natural gas. However, the full details of this plan have not been revealed, and the economic analysis of the business case is extremely narrow and limited in a number of respects...
• The comparison of nuclear power is against a Combined Cycle Gas Turbine fired
by natural gas. There is no comparison of a CCGT in a Combined Heat and Power (cogeneration) application, in which efficiency could be doubled and costs reduced dramatically.
• The Manley study compares nuclear costs against a gas-fired CCGT, but does not
compare costs against a range of conservation/efficiency measures, or renewable energy sources. These green energy alternatives were the basis of the McGuinty government’s election promises for the electricity sector.
• There is no discussion about the risk the refurbishment project taking longer than
the expected 20 months. Restart of the Pickering 4 reactor was three years and four months late. Late restart will push up the base cost, as well as increasing replacement power costs.
• The sensitivity analysis for plant life does not take into account the risk of much
worse performance than the 75 to 90% capacity factor suggested. As noted in Table 4, average performance of the nuclear fleet in 2003 was 49%.
• The study makes no mention of replacement generating costs while the Pickering
reactors and others have outages for refurbishment. These costs will likely be extremely large.
• The sensitivity analysis in the business case for plant life after refurbishment does
not take into account the risk that lifetimes may be far less than the 8 to 14 years suggested in the analysis.
• The cost of natural gas is condemned as “high and volatile” but absolutely no
analysis is provided on natural gas prices, forecasts or possible resource strategies.
• The study does not take into account the possibility that Operation, Maintenance and Administration (OM&A) costs will be much more than the $77 to $108 million per year budgeted.
The Manley Committee not only supported the restart of the Pickering A reactors, but strongly recommended that nuclear power be supported and expanded in Ontario...
...we have concluded that Ontario must begin planning now to supplement and ultimately replace its ageing nuclear assets with new and better generations of nuclear technology.54
54Ontario Power Generation Review Committee, Transforming Ontario’s Power Generation Company, March 2004, pp. 19-20.

Power for the Future / 120 Appendix 2 -- Ontario’s Nuclear Generating Facilities: A History and Estimate of Unit Lifetimes and Refurbishment Costs
This recommendation was based on no analysis -- only a number of incorrect, meaningless, unjustified and/or implausible claims... “nuclear plants can be a cost-effective source of base-load generation”55
In fact, nuclear power in Ontario has been spectacularly expensive, and NOT cost-effective. This was confirmed by OPG’s own auditors on March 16, 2004.
“the price of power they [nuclear plants] generate is stable over time.”56
In fact, the only reliable aspect of the price of nuclear generated electricity in Ontario has been its dramatic increase over time as nuclear performance plummeted and nuclear costs skyrocketed.
“Relying heavily on gas to provide base load would push up the level of Ontario’s
electricity prices and make them unstable.”57
The major source of volatility in the electricity market has without question come from nuclear plants that on today and gone tomorrow. The shutdown of 8 reactors (5000 MW) from 1995 to 1998 was an unprecedented example of volatility and unreliability.
“Renewable energy sources, conservation and co-generation are all important, but
cannot fully bridge the supply gap.”58
Manley provided absolutely no evidence to this effect. Evidence provided by intervenors, demonstrated conclusively just the opposite.
“Nuclear power does not contribute to air emissions the way coal and gas do, and does not involve the complex watershed management issues of hydro projects.”59
Nuclear power plants release a variety of radiologically and chemically toxic chemicals into the air and water. Notable amongst these emissions is radioactive tritium, which is released in large quantities by the CANDU reactor and is known to cause cancer and birth defects.
“While safe long-term disposal of spent fuel is vital, there is a cooperative process under
way between the federal and provincial governments to ensure this will be done.”60
55Ontario Power Generation Review Committee, Transforming Ontario’s Power Generation Company, March 2004, p. 20.
56Ontario Power Generation Review Committee, Transforming Ontario’s Power Generation Company, March 2004, p. 20.
57Ontario Power Generation Review Committee, Transforming Ontario’s Power Generation Company, March 2004, p. 20.
58Ontario Power Generation Review Committee, Transforming Ontario’s Power Generation Company, March 2004, p. 20.
59Ontario Power Generation Review Committee, Transforming Ontario’s Power Generation Company, March 2004, p. 20.

Power for the Future / 121 Appendix 2 -- Ontario’s Nuclear Generating Facilities: A History and Estimate of Unit Lifetimes and Refurbishment Costs
OPG’s reactors had produced about 35,000 tonnes of high level radioactive waste (about 1.5 million spent fuel bundles) by the end of 2002. If these reactors are refurbished and allowed to operate for 40 years, this amount will roughly double. OPG has assessed the cost of disposing of this waste and decommissioning its reactors at $18.2 billion. Independent observers believe that this amount may be significantly underestimated. The Nuclear Waste Management Organization has been mandated to provide a recommendation on long-term management of high-level radioactive waste by November 2005. Because this organization is dominated and governed by the nuclear industry, its ability to make a credible or objective decision has been challenged.
4.2. The Bruce A Restart In May 2001, Ontario Power Generation (OPG) finalized a deal with Bruce Power (then a subsidiary of British Energy, a nuclear power plant operator in the United Kingdom) for an eighteen-year lease to operate the Bruce nuclear complex on the shore of Lake Huron in Ontario.61 The details of the agreement were kept secret, but it was clearly a sweetheart deal for Bruce Power.62 Among other things, Bruce Power had no long-term responsibility for radioactive waste management and reactor decommissioning, responsibility for which remained with OPG, and ultimately with OPG’s sole shareholder, the Government of Ontario. Costs for radioactive waste management and decommissioning have yet to be demonstrated, however, Ontario Power Generation has estimated that it will cost about $18.2 billion and take until 2070. About $10 billion of this amount is for radioactive waste management, assuming that deep geological disposal is used, and about $7.4 billion is for decommissioning of the 20 OPG owned reactors (including Bruce A and B).63 OPG set aside $6.2 billion in 2003, and plans to increase that amount to $8 billion in 2007 and $10 billion by 2010. Yves Giroux, a member of the Canadian Nuclear Safety Commission has expressed doubt about whether the amounts set aside by OPG will be adequate.64 The agreement between Bruce Power and OPG was a cash cow for British Energy, earning $120 million profit in its first year of operation.65 The Bruce complex includes four 769 MW (net) reactors at the Bruce A station and four 860 MW (net) reactors at the Bruce B station.
60Ontario Power Generation Review Committee, Transforming Ontario’s Power Generation Company, March 2004, p. 20.
61Ontario Power Generation, Bruce Power, “Ontario Power Generation and Bruce Power Complete Lease Agreement for Bruce Nuclear Stations”, News Release, May 12, 2001.
62Sierra Club of Canada, “Bruce Deal a Disaster for Ontario”, News Release, April 17, 2001.
63Ontario Power Generation, Application by OPG & Bruce Power to amend the operating licences for the Class 1 nuclear facilities to include conditions on decommissioning plans and related financial guarantees, CNSC CMD 03-H11.1A, April 10, 2003.
64Peter Calamai, “Nuclear cleanup to cost billions”, Toronto Star, April 11, 2003, p. A6.
65Peter Calamai, “Nuclear panel gives Bruce Power reprieve”, Toronto Star, September 13, 2002, pp. E1 & E11.

Power for the Future / 122 Appendix 2 -- Ontario’s Nuclear Generating Facilities: A History and Estimate of Unit Lifetimes and Refurbishment Costs
While the four Bruce B reactors continued to operate, reactor 2 at the Bruce A nuclear station was shut down in October 1995, and reactors 1, 3 and 4 were shut down in early 1998 because of technical problems and poor performance. In November 2000, Bruce Power selected AECL as the general contractor to lead an internal “inspection and condition assessment” of 70 fuel channels66 as well as steam generators for Bruce A reactors 3 and 4. The assessment cost $30 million and was intended to determine if the re-commissioning of the reactors was economically justified.67 With the guaranteed profit from the Bruce B station through its lease agreement with OPG, there was little doubt that Bruce Power would have ready cash to proceed with the Bruce A restart project. On April 6, 2001, Bruce Power announced that it intended to restart reactors 3 and 4 at the Bruce A station. At that time, Bruce Power expected that the reactors would be restarted in the summer of 2003 at a total cost of about $340 million (CDN).68 The schedule was subsequently speeded up to restart reactor 4 in April 2003, and reactor 3 shortly afterwards.69 However, there were repeated problems and delays and reactor 4 did not start up until October 2003. Reactor 3 did not restart until February 2004. The cost of refurbishing the two reactors also more than doubled to $720 million.70
66There are 480 fuel channels in each Bruce A reactor, so AECL is making a safety judgement based on an examination of only 7% of the 960 channels in reactors 3 and 4.
67Bruce Power, “Bruce A Re-start Evaluation in the Works”, Open Line, Issue 9, November 24, 2000. Http://www.brucepower.com/whatsnew/pdfs/Issue_9.pdf
68Bruce Power, “Bruce Power Forges Ahead on Bruce A Restart”, News Release, April 6, 2001.
69Pearl Marshall, “Bruce Power said to be planning return of final Bruce A units”, Nucleonics Week , October 24, 2003, pp. 1, 14-15.
70John Spears, “Nuclear power key to future: Bruce chief”, Toronto Star, January 30, 2004, p. A4.
Power for the Future / 123 Appendix 2 -- Ontario’s Nuclear Generating Facilities: A History and Estimate of Unit Lifetimes and Refurbishment Costs
CANDU Fuel Channel Problems
Problems with fuel channels in CANDU reactors have historically been the single largest cause of outages at CANDU reactors. The 480 fuel channels in each Bruce reactor core are prone to age-related problems due to the weight of the fuel bundles, as well as high temperatures, pressures and radiation fields in the reactor cores. Fuel channels in CANDU reactors consist of an outer calandria tube, and an inner pressure tube. The inner pressure tube holds uranium fuel bundles, and heavy water coolant is pumped through at high pressure to draw off the heat released by the fission process. Pressure tube problems include ‘creep’ and ‘sag’, where the metal thins out over time and the tubes become wider and longer, bending under the strain. Various design changes were made in later stations to try to accommodate this problem, but eventual tube replacement (‘retubing’) is anticipated on a schedule dictated by the extent of the problem in each reactor core. When the pressure tubes sag they can come into contact with the outer ‘calandria tube’. This increases the chance of pressure tube rupture caused by ‘embrittlement’, where the metal becomes brittle due to absorption of hydrogen. This ‘metal hydriding’ process happens faster where the sagging pressure tubes make contact with the cooler calandria tubes. The space or annulus between the calandria and pressure tubes is maintained by spacers or ‘garter springs’. However, at Bruce reactors 3 and 4 (as well as at Pickering reactors 5 and 6), the garter springs are not locked into place and have to be periodically checked and moved back into position to keep the two tubes from touching. AECL has argued that pressure tubes will always leak before rupturing, allowing time to shut the reactor down before a loss of coolant accident occurs -- an assumption they call ‘leak before break’. However, there have been at least two cases of catastrophic pressure tube ruptures in Ontario reactors: August 1983 at Pickering 2 and March 1986 at Bruce 2. All fuel channels at the Pickering A station reactors were subsequently replaced. Bruce reactors 1 and 2 will likely require complete retubing if they are ever to be restarted. Some individual tubes at Bruce reactors have been replaced in the past, but Bruce Power is taking a calculated risk, trading off safety against profit by arguing that complete replacement of fuel channels is not necessary at Bruce reactors 3 and 4. Bruce Power has taken this controversial position despite having inspected only 7% of tubes. Complete retubing of the reactors would likely more than double the estimated $720 million restart cost of reactors 3 and 4 as well as extending the outage time. After the four Pickering A reactors, the Bruce A nuclear station has the oldest commercial reactors in Canada. In addition to pressure tube problems , there are other serious ongoing problems at Bruce. On June 11, 2002, an electrical arc burned a hole through a pressure tube and calandria tube during maintenance at Reactor 6 of the Bruce B station. This resulted in the reactor being shut down until early September. Bruce Power said only that a pressure tube had been “slightly damaged” and “the operational impact is not expected to be significant”.71 The incident was kept secret on the basis that public knowledge of the shutdown of the reactor would have commercial implications for British Energy. Because of concerns about nuclear safety and the public’s right-to-know, secrecy about nuclear shutdowns has prompted public protest.72
71John Spears, “Shutdown hits Bruce reactor while Ontario had heat wave”, Toronto Star, September 26, 2002, pp. A1 & A21.
72See: “Secrecy at Bruce”, Toronto Star Editorial, September 27, 2002, p. A26.

Power for the Future / 124 Appendix 2 -- Ontario’s Nuclear Generating Facilities: A History and Estimate of Unit Lifetimes and Refurbishment Costs
Problems with steam generators have been the second largest cause of outages at CANDU reactors. All of the Bruce steam generators have been identified as being “high risk”.73 Past problems with steam generators have included clogging due to mineral deposits, ‘fretting’ or breakage of the internal pipes due to excessive vibration, and stress corrosion cracking of the metal. Steam generators incorporate thin-walled pipes where coolant from the reactor core circulates to transfer heat to the turbine side of the station. The steam generators at Bruce reactor 2 were damaged beyond repair after a lead shielding blanket was left inside the system during a maintenance procedure years earlier. Bruce reactor 2 was subsequently closed in 1995. The Canadian Nuclear Safety Commission (CNSC) conducted a screening level environmental assessment on the restart of the Bruce A reactors 3 and 4. This was a low-level environmental assessment, and the CNSC maintained control over the process by ignoring public requests to ask the federal Environment Minister to appoint an independent assessment panel. As the “Responsible Authority” for federal nuclear matters, CNSC is in charge of all lower level environmental assessments (Screenings and Comprehensive Studies) unless it refers an assessment to the Minister of Environment for a hearing by an independent panel. A panel is more independent, since its members would be specially appointed by the Minister, and funding would be provided for intervenors. On April 12, 2002, the CNSC approved the Environmental Assessment Guidelines for the screening assessment. Bruce Power issued its Environmental Study Assessment Report in August 2002, and CNSC released its screening report in October 2002.74 On December 12, 2002, the CNSC held a hearing on the environmental assessment screening report for the return to service of Units 3 & 4 of the Bruce Nuclear Generating Station (NGS) ‘A’. The Board ignored the concerns of environmental groups, and decided that the Screening Report had met all of the requirements of the Canadian Environmental Assessment Act.75 Citizens for Renewable Energy (CFRE) and other groups had expressed concern about: the limited scope of the hearing; the CNSC’s failure to request a bump up of the assessment to a full panel review; poor management of the assessment process; the need to expand the study area boundaries; delegation of technical environmental assessment studies to the proponent; and the failure of the CNSC to select a realistic range of severe accidents and malfunctions for consideration. The Chippewas of Nawash First Nation raised many concerns about the impacts of the reactor restart project on their fishing business near the nuclear plant.
73Ontario Hydro, Rick Machon, Nuclear Asset Optimization Plan: Development & Recommendation, “Option Selection Basis”, p. 16.
74Canadian Nuclear Safety Commission, Screening Report on Environmental Assessment of the Proposed Restart of Units 3 and 4 Bruce A Nuclear Generating Station, Kincardine, Ontario, October 2002.
75CNSC, Record of Proceedings, Including Reasons for Decision, In the Matter of Applicant: Bruce Power Inc,., Subject: “Environmental Assessment Screening Report for the Return to Service of Units 3 & 4 of the Bruce Nuclear Generating Station (NGS) ‘A’”, January 6, 2003.
Power for the Future / 125 Appendix 2 -- Ontario’s Nuclear Generating Facilities: A History and Estimate of Unit Lifetimes and Refurbishment Costs
On January 6, 2003, the CNSC allowed Bruce Power to load fuel into reactors three and four in advance of the actual reactor start-up, delegating actual approval to CNSC staff without any need for a public hearing review.76 Bruce Power has also announced that it is conducing a feasibility study on the restart of the Bruce A reactors 1 and 2.77 As part of its feasibility study, Bruce Power is also looking at a major refurbishment of the Bruce B reactors. In the absence of a large-scale refurbishment project, this study estimates that Bruce B will be forced to shut down after 25 years of operation, i.e. between 2010 and 2012 (see Table 2). The Bruce Power feasibility study and a corporate decision on these matters are expected before the end of 2004.78 Because reactors 1 and 2 are in far worse shape than reactors 3 and 4, it is expected that the cost of their refurbishment could be more than double the $720 million cost of restarting reactors 3 and 4. This study estimates a range of $1.5 to $2.5 billion as the possible cost of the refurbishment project (see Table 6). Bruce Power has also raised the possibility of building one or two new reactors that have yet to be designed by Atomic Energy of Canada Limited, known as the Advanced CANDU Reactor (ACR). Construction of a demonstration reactor for an untested design would be extremely risky. Bruce Power has undoubtedly been buoyed by windfall profits under its agreement with the Government of Ontario. In 2003, Bruce Power’s profit increased to $286 million, compared to $106 million in 2002.79 Following a financial crisis at British Energy in the fall of 2002, it was announced on December 24, 2002, that a new Canadian group would purchase Bruce Power. The group consisted of Cameco Corporation, TransCanada Pipelines Ltd., and BPC Generation Income Trust, part of the OMERS pension fund. The three major partners held 31.6%, while the Power Workers Union had 4% and the Society of Energy Professionals 1.2%. 4.3. The Estimated Costs of Nuclear Refurbishment Refurbishment of nuclear plants can involve a wide range of potential work, but in CANDU reactors, the most serious aspect of refurbishment is replacement of all the fuel channels in the reactor (see above: “CANDU Fuel Channel Problems”). This is known a Large Scale Fuel Channel Replacement (LSFCR), and has been characterized as ‘heart transplant’ for a CANDU reactor -- essentially the reactor core is re-built, requiring an extended outage of at least two years for the plant, at an extremely high cost.
76CNSC, Record of Proceedings, Including Reasons for Decision, In the Matter of Applicant: Bruce Power Inc,., Subject: “Referral to a CNSC Designated Officer - Application to load fuel at Bruce ‘A’ NGS unit 3 and 4 reactors”, January 6, 2003.
77Bruce Power, “Bruce Power to explore restart of Bruce A Units 1 and 2", News Release, January 29, 2004.
78“Bruce Power Ponders Additional Nuke Restarts”, Electricity Daily, February 6, 2004.
79John Spears, “Bruce Power profit more than doubles; idle reactors powered up”, Toronto Star, January 24, 2004, p. C3.

Power for the Future / 126 Appendix 2 -- Ontario’s Nuclear Generating Facilities: A History and Estimate of Unit Lifetimes and Refurbishment Costs
Table 6.
Estimated Refurbishment Costs for Ontario Nuclear Power Plants (Current Dollars)
Station Cost Range
Bruce 3 & 4 $720 million* Bruce 1 & 2 $1.5 to $2.5 billion Pickering A $3 to $4 billion Pickering B $3 to $4 billion Bruce B $3 to $4 billion Darlington $3 to $4 billion
Total $14.2 to $19.2 billion
Midpoint $16.7 billion
*Actual cost. Source: John Spears, “Nuclear power key to future: Bruce chief”, Toronto Star, January 30, 2004, p. A4. This study estimates that the cost of refurbishment for all 20 Ontario Power Generation Reactors will be in the range of $14.2 billion to $19.2 billion, with a midpoint of $16.7 billion (see Table 6). This assumes complete fuel channel replacement of all reactors except for Pickering A (which was already re-tubed 1983-1993) and Bruce reactors 3 and 4. This is consistent with other recent estimates of refurbishment costs. Torrie Smith Associates has suggested that the cost of refurbishing OPG’s nuclear fleet would be “...on the order of $15 to $20 billion...”.80 The Pickering “A” review Panel has suggested that the total cost of refurbishing all four reactors and common systems at the Pickering A station ranges from $3 to $4 billion. This range is based on figures prepared by OPG for financial modeling purposes.81 The low end of the cost range ($14.2 billion) assumes that there will be no major surprises, and the high end of the range ($19.2 billion) assumes that there will be some significant additions to the estimated costs. Every nuclear power plant built by Ontario Hydro had significant cost overruns. This history demonstrates that there is severe economic risk in nuclear construction projects because of their technological complexity and high capital costs. The cost estimates in Table 6 are conservative insofar as they do not make allowance for a number of significant hidden costs...
• There is major uncertainty about how long the reactors will continue to operate
after refurbishment has taken place. For example, Pickering reactor 4 was shut down in 1997 less than 5 years after undergoing a complete fuel channel
80Ralph Torrie and Richard Parfett, Torrie Smith Associates, Phasing out Nuclear Power in Canada: Toward Sustainable Electricity Futures, Campaign for Nuclear Phaseout, July 2003, p. ii.
81Pickering Review Panel, Report of the Pickering “A” Review Panel, December 4, 2003, p. 4.
Power for the Future / 127 Appendix 2 -- Ontario’s Nuclear Generating Facilities: A History and Estimate of Unit Lifetimes and Refurbishment Costs
replacement. OPG has refused to say how long the refurbished Pickering A reactors should last.
• Replacement power costs are a major expense for the utility during the extended
outages required for refurbishment (at least 18 to 20 months per reactor). This is typically not included as a cost of refurbishment.
• Nuclear utilities generally assume that plants will have excellent performance after
refurbishment, for example 89% capacity factor in the case of the Point Lepreau refurbishment proposal (see below). By contrast, the capacity factor of the Pickering A nuclear station in 1997 (the year before it was shut down for the second time) was about 54%, despite having been retubed 1983-1993.
• The labour costs of utility staff working on the refurbishment project may not be
counted as part of overall costs since ‘they are on staff already’. There have been several reports of refurbishment costs, but Ontario Hydro/OPG has made no rigorous reporting available to the general public, so these figures must be understood as approximate at best. The Pickering A station was retubed 1983 to 1993, following the disastrous 1983 pressure tube rupture in reactor 2. However, Ontario Hydro never provided an accurate accounting of the cost of that massive refurbishment exercise. In 1988, Hydro stated that...
The cost of retubing units 1 and 2 [at Pickering “A”] cost $450 million (dollars of the year, 1984-1988) and work on the last two units is expected to cost about $500 million in dollars of the year, 1989-1993.82
As noted above, the cost of the Pickering A restart was estimated in 1999 at $780 million for all 4 reactors.83 However, by September 2002, Ontario Power Generation reported that costs for the project had escalated to $1.025 billion.84 At that time, OPG estimated that the start-up of Reactor 4 would cost another $230 million, and the other three reactors would cost an additional $300 to $400 million each.85 Thus the cost for restarting reactor 4 alone was then estimated to be $1.255 billion, with a likely additional $1.2 billion for the other three reactors, totaling $2.455 billion -- three times the original cost estimate. The OPG Review Committee confirmed on March 18, 2004, that the cost of the restart of Pickering reactor 4 had escalated to $1.25 billion at the time of its restart in October 2003. The Committee estimated that the cost of restarting reactor 1 would be $775 to $925 million, of which $325 million has already been spent.86 It is not clear whether this $325 million is 82Ontario Hydro, A Journalist’s Guide to Nuclear Power, 1988, p. 2.
83KPMG, Ontario Power Generation Inc. Financial Review of Operations, March 15 2004, p. 20.
84Ontario Power Generation, Third Quarter 2002 Results, October 28, 2002, p. 12.
85Ontario Power Generation, Third Quarter 2002 Results, October 28, 2002.
86Ontario Power Generation Review Committee, Transforming Ontario’s Power Generation Company, March 2004, p. 51.
Power for the Future / 128 Appendix 2 -- Ontario’s Nuclear Generating Facilities: A History and Estimate of Unit Lifetimes and Refurbishment Costs
included in the $1.25 billion cost of reactor 4 or is in addition to it. The Committee also failed to provide any estimate of the cost of restarting reactors 2 and 3. As we have seen above, the reported cost of the refurbishment of Bruce reactors 3 and 4 is $720 million.87 It is not clear, however, what this cost includes. It has been suggested that the cost of refurbishing Bruce reactors 1 and 2 might be twice the cost of reactors 3 and 4. This study accepts that estimate as the low end of the range for their refurbishment. 4.4. Regulatory Opposition to Point Lepreau Refurbishment The most publicly studied example of a proposed nuclear refurbishment project is the Point Lepreau Nuclear Generating Station. It is a single “CANDU 6" reactor (635 MWe) that began commercial operation in February 1983. The plant is owned and operated by New Brunswick Power, and was designed by AECL. Like other reactors of the period, the Point Lepreau plant was intended to run for 40 years, however, after less than twenty years, the reactor experienced serious performance and safety problems. In 1998, an NB Power consultant decided that the plant would require total replacement of all 380 fuel channels in the 2006-2008 period.88 This schedule , however, has already slipped. According to the retube and refurbishment schedule, the work would take almost 5 years, and the plant would be shut down for 18 months.89 The total estimated cost of the project was $845 million.90 On January 8, 2002, New Brunswick Power filed an application to the New Brunswick Board of Commissioners of Public Utilities (known as the Public Utilities Board or PUB) to hold a public hearing on the refurbishment of the Point Lepreau nuclear generating station. The hearing began on May 27, 2002, with final arguments in June. The PUB released its decision on September 24, 2002, noting that its review was made from an economic perspective, but with a public interest viewpoint. The decision was a stunning rejection of AECL’s refurbishment proposal as put forward by NB Power...
The Board, as a result of its review of the evidence in relation to the capacity factor and the cost of capital, finds that there is no significant economic advantage to the proposed refurbishment project. In addition, the Board considers that there are other significant aspects of the refurbishment option for which the economic impact is uncertain. These aspects create additional economic risk which leads the Board to conclude that the refurbishment of Point Lepreau, as outlined in the evidence, is not in the public interest. The Board, therefore, will
87John Spears, “Nuclear power key to future: Bruce chief”, Toronto Star, January 30, 2004, p. A4.
88New Brunswick Power, Road to Refurbishment at Point Lepreau Generating Station, April 2001.
89NB Power, Project Execution Plan, Appendix A-4, February 2002, Table 4-1, p. 17.
90NB Power, Project Execution Plan, Appendix A-4, February 2002, Table 1-1. p. 1. This includes an ’overnight’ cost of $633 million with escalation and interest during construction of $211million.
Power for the Future / 129 Appendix 2 -- Ontario’s Nuclear Generating Facilities: A History and Estimate of Unit Lifetimes and Refurbishment Costs
recommend to the Board of Directors of NB Power that it not proceed with the refurbishment of Point Lepreau.91
• The PUB rejected many of the basic assumptions underlying the agreements of the
proposed contractor, Atomic Energy of Canada Limited (AECL), and NB Power. The following are some of the conclusions reached by the PUB...an 80% capacity factor should be assumed for the refurbished plant instead of 89% as proposed by AECL and NB Power; 92
• a discount rate of 9.33% should be used instead of 7.15% for the cost of capital for the project; 93
(N.B. These two adjustments alone make the cost of Point Lepreau refurbishment approximately equal to the cost of a new natural gas-fired generating plant 94)
• the stipulated liquidated damages payable by AECL may not be sufficient; 95 • there is a significant risk from delay of the project (a four-month delay would
increase the cost by $63 million plus $5 million per month in interest charges.); 96 and
• there is a “regulatory risk” that the federal regulator, the Canadian Nuclear
Safety Commission, may require significant changes to the refurbishment plan as proposed.97
The PUB decision was only a recommendation to the Board of Directors of NB Power, and it is not clear at this time, whether the refurbishment proposal will proceed despite the PUB decision. NB Power has attempted unsuccessfully to find a purchaser or equity partners for Point Lepreau. 91Decision of the New Brunswick Board of Commissioners of Public Utilities on the Proposed Refurbishment of the Point Lepreau nuclear Generating Facility, September 24, 2002, p. 16.
92Decision of the New Brunswick Board of Commissioners of Public Utilities on the Proposed Refurbishment of the Point Lepreau nuclear Generating Facility, September 24, 2002, p. 5.
93Decision of the New Brunswick Board of Commissioners of Public Utilities on the Proposed Refurbishment of the Point Lepreau nuclear Generating Facility, September 24, 2002, p. 6.
94Decision of the New Brunswick Board of Commissioners of Public Utilities on the Proposed Refurbishment of the Point Lepreau nuclear Generating Facility, September 24, 2002, p. 6.
95Decision of the New Brunswick Board of Commissioners of Public Utilities on the Proposed Refurbishment of the Point Lepreau nuclear Generating Facility, September 24, 2002, p. 8.
96Decision of the New Brunswick Board of Commissioners of Public Utilities on the Proposed Refurbishment of the Point Lepreau nuclear Generating Facility, September 24, 2002, p. 10.
97Decision of the New Brunswick Board of Commissioners of Public Utilities on the Proposed Refurbishment of the Point Lepreau nuclear Generating Facility, September 24, 2002, p. 13.
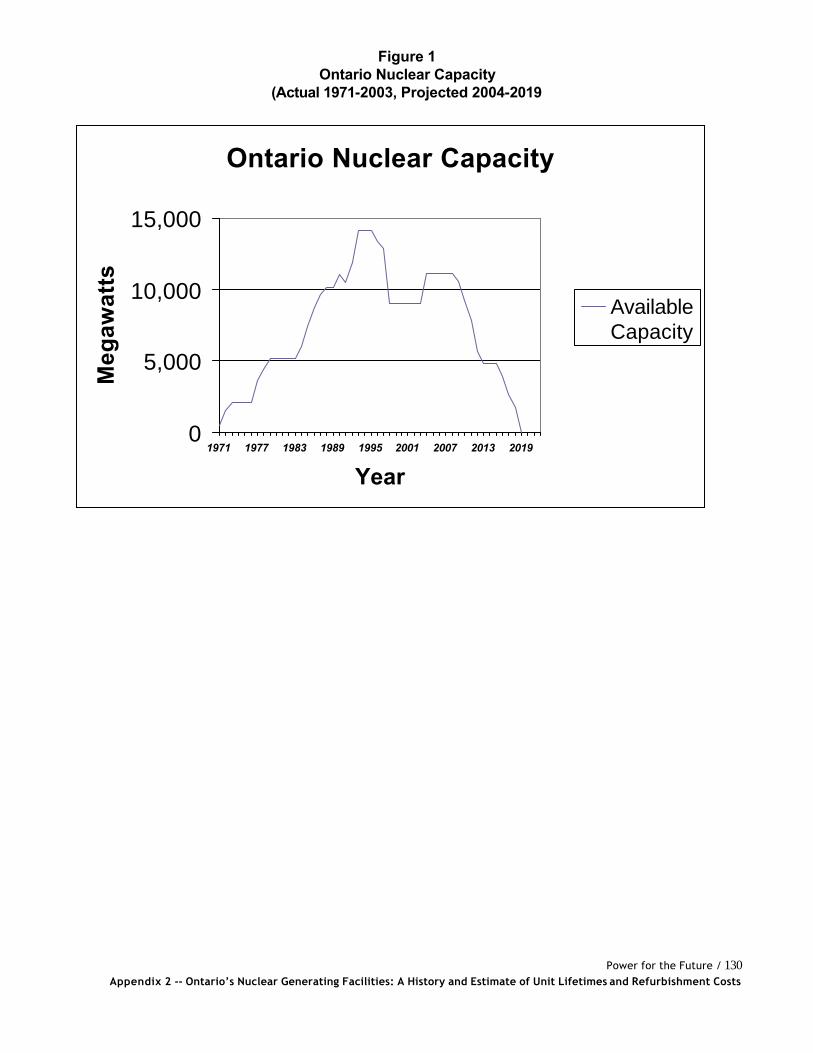
Power for the Future / 130 Appendix 2 -- Ontario’s Nuclear Generating Facilities: A History and Estimate of Unit Lifetimes and Refurbishment Costs
Figure 1 Ontario Nuclear Capacity
(Actual 1971-2003, Projected 2004-2019
Ontario Nuclear Capacity
0
5,000
10,000
15,000
1971 1977 1983 1989 1995 2001 2007 2013 2019
Year
Meg
awat
ts
AvailableCapacity
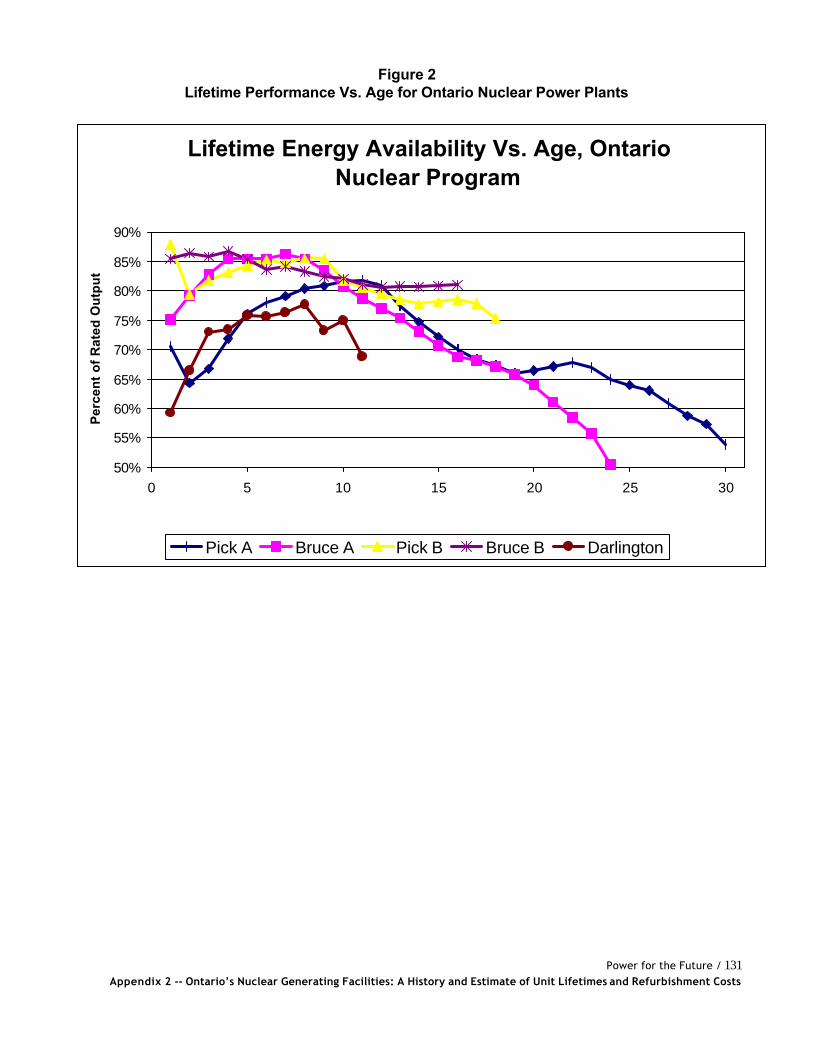
Power for the Future / 131 Appendix 2 -- Ontario’s Nuclear Generating Facilities: A History and Estimate of Unit Lifetimes and Refurbishment Costs
Figure 2
Lifetime Performance Vs. Age for Ontario Nuclear Power Plants
Lifetime Energy Availability Vs. Age, Ontario Nuclear Program
50%
55%
60%
65%
70%
75%
80%
85%
90%
0 5 10 15 20 25 30
Per
cen
t o
f R
ated
Ou
tpu
t
Pick A Bruce A Pick B Bruce B Darlington
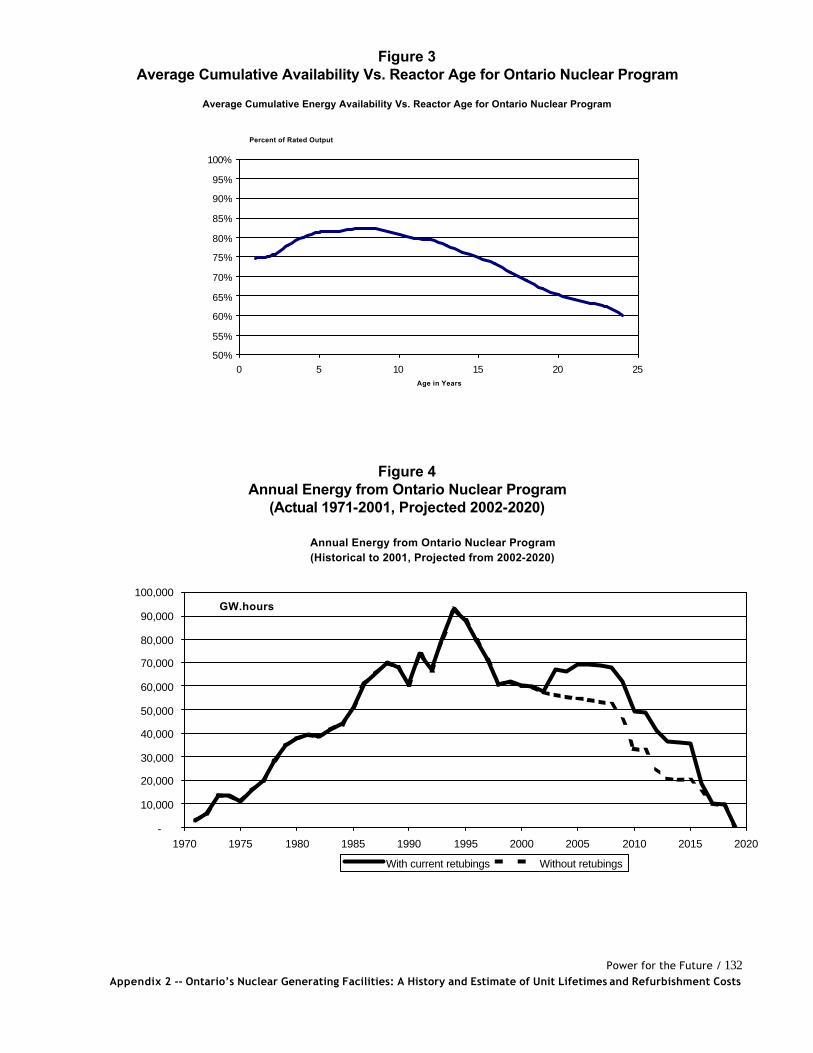
Power for the Future / 132 Appendix 2 -- Ontario’s Nuclear Generating Facilities: A History and Estimate of Unit Lifetimes and Refurbishment Costs
Figure 3 Average Cumulative Availability Vs. Reactor Age for Ontario Nuclear Program
Average Cumulative Energy Availability Vs. Reactor Age for Ontario Nuclear Program
50%
55%
60%
65%
70%
75%
80%
85%
90%
95%
100%
0 5 10 15 20 25Age in Years
Percent of Rated Output
Figure 4 Annual Energy from Ontario Nuclear Program
(Actual 1971-2001, Projected 2002-2020)
Annual Energy from Ontario Nuclear Program(Historical to 2001, Projected from 2002-2020)
-
10,000
20,000
30,000
40,000
50,000
60,000
70,000
80,000
90,000
100,000
1970 1975 1980 1985 1990 1995 2000 2005 2010 2015 2020
GW.hours
With current retubings Without retubings