NUREG/CR-7175, "Susceptibility of Nuclear Stations of External ...

Title here in 8pt Arial (change text colour to black) i
Chemical discharges from nuclear power stations: historical releases and implications for Best Available Techniques
Annex Report – SC090012/R2

The Environment Agency is the leading public body protecting and improving the environment in England and Wales.
It’s our job to make sure that air, land and water are looked after by everyone in today’s society, so that tomorrow’s generations inherit a cleaner, healthier world.
Our work includes tackling flooding and pollution incidents, reducing industry’s impacts on the environment, cleaning up rivers, coastal waters and contaminated land, and improving wildlife habitats.
This report is the result of research commissioned and funded by the Environment Agency.
Author(s): Nigel Pacey Ian Beadle Anna Heaton Laura Newsome (Environment Agency) Dissemination Status: Publicly available Keywords: Nuclear power stations, chemical discharges, historical data, best available techniques, BAT Research Contractor: AMEC Consulting and Engineering The Renaissance Centre, 601 Faraday Street, Birchwood Park, Birchwood, Warrington WA3 6GN. 01925 67500. Environment Agency’s Project Manager: Laura Newsome Richard Fairclough House, Knutsford Road, Warrington, WA4 1HT Science Project Number: SC090012/R2 Product Code: SCHO0911BUBX-E-E
Published by: Environment Agency, Horizon House, Deanery Road, Bristol, BS1 5AH www.environment-agency.gov.uk ISBN: 978-1-84911-240-6 © Environment Agency – September, 2011 All rights reserved. This document may be reproduced with prior permission of the Environment Agency. The views and statements expressed in this report are those of the author alone. The views or statements expressed in this publication do not necessarily represent the views of the Environment Agency and the Environment Agency cannot accept any responsibility for such views or statements. Further copies of this report are available from: The Environment Agency’s National Customer Contact Centre by emailing: [email protected] or by telephoning 08708 506506.
ii Chemical discharges from nuclear power stations (Annex)

Evidence at the Environment Agency Evidence underpins the work of the Environment Agency. It provides an up-to-date understanding of the world about us, helps us to develop tools and techniques to monitor and manage our environment as efficiently and effectively as possible. It also helps us to understand how the environment is changing and to identify what the future pressures may be.
The work of the Environment Agency’s Evidence Directorate is a key ingredient in the partnership between research, guidance and operations that enables the Environment Agency to protect and restore our environment.
This report was produced by the Research, Monitoring and Innovation team within Evidence. The team focuses on four main areas of activity:
• Setting the agenda, by providing the evidence for decisions;
• Maintaining scientific credibility, by ensuring that our programmes and projects are fit for purpose and executed according to international standards;
• Carrying out research, either by contracting it out to research organisations and consultancies or by doing it ourselves;
• Delivering information, advice, tools and techniques, by making appropriate products available.
Miranda Kavanagh
Director of Evidence
Chemical discharges from nuclear power stations (Annex) iii

Executive summary A survey of non-radioactive chemical discharges from nuclear power stations in the UK, USA, France and Germany has been carried out. Plants were selected to represent the two candidate designs for the new nuclear build programme for England and Wales, and also to include plants located on the coast. The candidate designs are the EPR™ supplied by AREVA (joint submission with EDF) and the AP1000™ supplied by Westinghouse. Both are based on pressurised water reactor (PWR) technology.
The survey and results are presented in two sections:
This separate Annex presents data on chemical discharges from selected PWR power plants in England (Sizewell B PWR), the USA, France and Germany. It contains information on:
• the nuclear power plants and site conditions;
• the chemical discharges and the routes these follow;
• aspects of the design and operation of the plants that govern chemical discharges;
• the regulatory limits in force.
The Annex also contains tables of actual discharge data and graphical presentations of the data over time. Discharges from the different PWR power plants within each country (but not across different countries) are compared.
The main report draws on the information contained in this Annex. It provides an overview of the regulatory regimes in each country governing chemical discharges from nuclear power plants and the discharges from the PWR power plants included in this Annex. It describes the use of Best Available Techniques (BAT), the zero discharge concept, and how chemical discharges compare with those from a fossil fuel power plant. It also includes a generic ecotoxicological assessment.
iv Chemical discharges from nuclear power stations (Annex)

Acknowledgements The following personnel and organisations are thanked for the supply of information and data. None are responsible for any views or interpretation of data supplied to AMEC during the preparation of the report.
Sizewell B
Colin Taylor, Marine Ecologist, Planning & External Affairs, EDF New Nuclear Development, Barnwood
US plants
Beaver Valley: Mike Banko. First Energy Corporation
Byron: Paul Dempsey, Communications Manager, Exelon Corporation. Also Zoe Cox, Plant Chemist
Calvert Cliffs: John McGillen, Department of the Environment, Maryland
Comanche Peak: Steve Dixon, Staff Licensing Analyst, CPNPP Licensing/Regulatory Affairs Department. Also Fred W Madden, Director Oversight & Regulatory Affairs, Luminant Power
Millstone: Edward L. Wilds, Director, Radiation Division, Connecticut Department of Environmental Protection. Also: Larry Comstock, Senior Internet Communications Coordinator, Dominion Power
Salem: Edward Keating, PSEG Nuclear
Seabrook: Al Legendre, Principal Engineer, NextEra Energy, Seabrook
USEPA website data sets with assistance from Julie Melro, US Environmental Protection Agency
French plant data
Laurent Bourdonneau, Geraldine Benoit, Sebastien Freal-Saison. EDF Energy. EDF – Direction Production Ingénierie, CEIDRE Département Etudes
German plant data
Harry Neder, Head of Chemistry, E.ON Kernkraft GmbH
Other data
John Fuoto, AMEC, USA
John Jepson, ELGA Process Water
Ian Forrester, Derwent Water Services Ltd
Jason McLoughlin, Christ Kennicott Water Technology Ltd
Al Tavares, Graver Water System LLC
Jon Hunt, GE Water and Process Technologies
Chemical discharges from nuclear power stations (Annex) v

Contents A1 Introduction 1 A1.1 Report objectives 1 A1.2 PWR power plants included in the survey 2
A2 UK’s Sizewell B 5 A2.1 Sizewell B permit and background chemical data 5 A2.2 Sizewell B chemical discharge data 8
A3 US PWR power plants 11 A3.1 Collation and treatment of chemical discharge data 11 A3.2 Beaver Valley (inland site) 11 A3.3 Byron (inland site) 15 A3.4 Comanche Peak (inland site) 21 A3.5 Seabrook (coastal site) 24 A3.6 Salem (coastal site) 28 A3.7 San Onofre Units 2 and 3 (coastal site) 31 A3.8 Diablo Canyon (coastal site) 34 A3.9 Millstone (coastal site) 38 A3.10 St Lucie (coastal site) 43 A3.11 Calvert Cliffs (estuarine site) 45
A4 Detailed data sets for the US PWR power plants 48
A5 French PWR power plants 95 A5.1 Overview of French PWR plants in the survey 95 A5.2 Overview of limits for the French sites of Chooz, Civaux, Golfech (inland
sites) and Flamanville, Paluel, Penly and Gravelines (coastal sites) 100 A5.3 Cooling water chemical treatments for the French plants 113 A5.4 Comparison of discharge data across the French sites at Chooz, Civaux,
Golfech (inland) and Flamanville, Paluel, Penly, Gravelines (coastal) 116 A5.5 Environmental monitoring data for the French plants 126
A6 Raw discharge data for the French PWR plants 127
A7 German PWR plants 139 A7.1 Neckarwestheim (EPR™ predecessor) 139 A7.2 Isar 2 (EPR™ predecessor) 140
A8 Chemical data in support of the ecotoxicity assessment 143
vi Chemical discharges from nuclear power stations (Annex)

Tables Table A1.1 AP1000™ predecessors and others in the UK and USA 2 Table A1.2 UK EPR™ predecessors and others in France and Germany 3 Table A2.1 Summary of discharge data (mg/l) for Sizewell B, January 2004 to September 2009 9 Table A3.1 Overview of Beaver Valley permit parameters and limits 13 Table A3.2 Overview of Byron permit parameters and limits 19 Table A3.3 Summary of chemicals and breakdown products from Seabrook NPDES fact sheet 26 Table A3.4 Trace metal data (µg/l) for San Onofre Units 2 and 3 once through cooling water (and comparison with
Comanche Peak) 33 Table A3.5 Trace metal data (mg/l) for Diablo Canyon 38 Table A3.6 Parameters included in the permit for Millstone 1 40 Table A3.7 Internal outfalls and limits for St Lucie 43 Table A3.8 Trace metal data (µg/l) for Calvert Cliffs 47 Table A4.1 Data fields for the US plants downloaded from the USEPA website 48 Table A4.2 Discharge data for Beaver Valley Units 1 and 2 50 Table A4.3 Discharge data for Byron 58 Table A4.4 Discharge data for Comanche Peak 61 Table A4.5 Trace metal data for Comanche Peak 64 Table A4.6 Discharge data for Seabrook 65 Table A4.7 Discharge data for Salem 67 Table A4.8 Discharge data for San Onofre Unit 2 71 Table A4.9 Discharge data for San Onofre Unit 3 74 Table A4.10 Discharge data for Diablo Canyon 76 Table A4.11 Discharge data for Millstone 85 Table A4.12 Discharge data for St Lucie 91 Table A4.1 Discharge data for Calvert Cliffs 93 3Table A5.1 Summary of gross electrical outputs of sites 101 Table A5.2 Limits (kg) for boric acid discharges from French PWR sites (annual reports and permits) 101 Table A5.3 Limits (kg) for lithium hydroxide discharges from French PWR sites (annual reports and permits) 103 Table A5.4 Limits (kg) for hydrazine discharges from French PWR sites (annual reports and permits) 104 Table A5.5 Limits (kg) for nitrogen species in discharges from French PWR sites (annual reports and permits) 106 Table A5.6 Annual discharges (kg) estimated for breakdown products of morpholine (estimated for the UK EPR™)107 Table A5.7 Limits (kg) for detergents and phosphates in discharges from French PWR sites (annual reports and
permits) 108 Table A5.8 Limits (kg) for heavy metals in discharges from French PWR sites (annual reports and permits) 109 Table A5.9 Assumed proportions of heavy metals in final hold-up tanks for UK EPR™ 110 Table A5.10 Limits (kg) for suspended solids in discharges from French PWR sites (annual reports and permits) 111 Table A5.11 Limits (kg) for COD in discharges from French PWR sites (annual reports and permits) 113 Table A5.12 Limits and fluxes for chemicals associated with once-through seawater cooling for the French plants 114 Table A5.13 Discharges of sulphate from Chooz and Golfech due to anti-scale treatments 120 Table A5.1 Discharge (tonnes) of sulphate from demineralisation plant at Civaux 120 4Table A6.1 Raw data supplied by EDF for Golfech, Civaux, Chooz and Penly 128 Table A7.1 Discharge routes, limits and 2008 discharges for Isar 2 1,2 141 Table A8.1 Chemical listing, List I and List II and EQS data 144 Table A8.2 Chemical listing, ecotoxicity and PBT data 146 Figures Figure A1.1 Map of plants in the USA (AP1000™ predecessor plants and ones at inland and coastal locations) 4 Figure A1.2 Map of predecessor and other PWRs in the EU (Sizewell is AP1000™, the remainder are French and
German designs) 4 Figure A2.1 View of Sizewell B PWR showing the North Sea, which is the source of once-through cooling water. A
small structure visible offshore is one of the intake structures. Tanks visible are for water, fuel for the diesel generators etc. (by permission of EDF Energy) 5
Figure A2.2 Total residual oxidants in Sizewell B main cooling water 9 Figure A2.3 Boron in Sizewell B main cooling water discharge 10 Figure A2.4 Ammonia as nitrogen in Sizewell B main cooling water discharge 10 Figure A3.1 Byron power plant showing the main hyperbolic, wet, natural draft cooling towers fed from the Rock
River and the cooling tower ‘drift’ (by permission of Byron plant) 16 Figure A3.2 Byron water flow and balance diagram (by permission of Byron Plant) 17 Figure A3.3 Comanche Peak Power Plant showing Squaw Creek (by permission of Comanche Peak Power Plant) 22 Figure A3.4 Seabrook Plant on Browns River (by permission of Seabrook Plant) 25 Figure A3.5 Salem dual reactor site (right) and neighbouring single reactor Hope Creek with cooling tower and
associated plume (left) (by permission of Salem Power Plant) 29 Figure A3.6 Diablo Canyon showing the cooling water intake cove and discharge in the background (by permission
of California EPA) 35 Figure A4.1 Beaver Valley: free chlorine (mean, mg/l) in main cooling water outfall discharge 52 Figure A4.2 Beaver Valley: residual chlorine (mean, mg/l) in main cooling water discharge 52 Figure A4.3 Beaver Valley: pH (maximum) in main cooling water discharge 53 Figure A4.4 Beaver Valley: aluminium (maximum, mg/l) in main cooling water discharge 53 Figure A4.5 Beaver Valley: oil and grease (mean, mg/l) in outfall from cooling water pump house 54 Figure A4.6 Beaver Valley: total suspended solids (maximum, mg/l) in outfall from cooling water pump house 54 Figure A4.7 Beaver Valley: copper (maximum, mg/l) in outfall from heating, ventilation and air conditioning (HVAC)
units 55 Figure A4.8 Beaver Valley: zinc (mean, mg/l) in outfall from HVAC units 55 Figure A4.9 Beaver Valley: suspended solids (maximum, mg/l) in discharge from chemical waste treatment 56 Figure A4.10 Beaver Valley: suspended solids (maximum, mg/l) in discharge from intake screen backwash 56
Chemical discharges from nuclear power stations (Annex) vii

Figure A4.11 Beaver Valley: suspended solids (maximum, mg/l) in discharge from sludge settling basin 57 Figure A4.12 Byron: residual chlorine (mean, mg/l) in the main cooling water outfall discharge 58 Figure A4.13 Byron: copper (maximum, mg/l) in the main cooling water discharge 59 Figure A4.14 Byron: oil and grease (maximum, mg/l) in the main cooling water discharge 59 Figure A4.15 Byron: pH (maximum) in the main cooling water discharge 60 Figure A4.16 Byron: zinc (maximum, mg/l) in the main cooling water discharge 60 Figure A4.17 Comanche Peak: biochemical oxygen demand (mean, mg/l) in sanitary waste discharge 62 Figure A4.18 Comanche Peak: faecal coliforms in sanitary waste discharge 62 Figure A4.19 Comanche Peak: oil and grease (maximum, mg/l) in low volume waste discharge 63 Figure A4.20 Seabrook: total residual oxidants (mean, mg/l) in main cooling water discharge 66 Figure A4.21 Seabrook: total suspended solids (mean, mg/l) in discharge from the turbine hall sumps 66 Figure A4.22 Salem: total residual chlorine (maximum, mg/l) in main cooling water discharge 68 Figure A4.23 Salem: ammonia (maximum, mg/l as nitrogen) in discharge from liquid waste system 68 Figure A4.24 Salem: total hydrocarbons (maximum, mg/l) in discharge from liquid waste system 69 Figure A4.25 Salem: total organic carbon (maximum, mg/l) in discharge from liquid waste system 69 Figure A4.26 Salem: total hydrocarbons (maximum, mg/l) in discharge from yard drains 70 Figure A4.27 Salem: total organic carbon (maximum, mg/l) in discharge from yard drains 70 Figure A4.28 San Onofre Unit 2: total residual chlorine (maximum, µg/l) in discharge of main cooling water 72 Figure A4.29 San Onofre Unit 2: pH (maximum) of discharge of main cooling water 72 Figure A4.30 San Onofre Unit 2: oil and grease (maximum, mg/l) in discharge of low level waste water 73 Figure A4.31 San Onofre Unit 3: total residual chlorine (maximum, µg/l) in main cooling water discharge 75 Figure A4.32 San Onofre Unit 3: pH (maximum) of discharge of main cooling water 75 Figure A4.33 Diablo Canyon: chlorine (mean, µg/l) in once through cooling water discharge 78 Figure A4.34 Diablo Canyon: arsenic (maximum, µg/l) in once through cooling water discharge 78 Figure A4.35 Diablo Canyon: cadmium (maximum, mg/l) in once through cooling water discharge 79 Figure A4.36 Diablo Canyon: lead (maximum, mg/l) in once through cooling water discharge 79 Figure A4.37 Diablo Canyon: nickel (maximum, µg/l) in once through cooling water discharge 80 Figure A4.38 Diablo Canyon: boron (maximum, mg/l) in discharge from the liquid radioactive waste system 80 Figure A4.39 Diablo Canyon: copper(maximum, mg/l) in discharge from the liquid radioactive waste system 81 Figure A4.40 Diablo Canyon: mercury (maximum, mg/l) in discharge from the liquid radioactive waste system 81 Figure A4.41 Diablo Canyon: zinc (maximum, mg/l) in discharge from the liquid waste system 82 Figure A4.42 Diablo Canyon: chromium (maximum, mg/l) in discharge from regeneration of the condensate polishing
plant 82 Figure A4.43 Diablo Canyon: copper (maximum, mg/l) in discharge from regeneration of the condensate polishing
plant 83 Figure A4.44 Diablo Canyon: mercury (maximum, mg/l) in discharge from regeneration of the condensate polishing
plant 83 Figure A4.45 Diablo Canyon: nickel (maximum, mg/l) in discharge from regeneration of the condensate polishing
plant 84 Figure A4.46 Diablo Canyon: zinc (maximum, mg/l) in discharge from regeneration of the condensate polishing plant84 Figure A4.47 Millstone: free chlorine (maximum, mg/l) in discharge from main cooling water system 86 Figure A4.48 Millstone: zinc (maximum, mg/l) in discharge from main cooling water system 86 Figure A4.49 Millstone: residual chlorine (maximum, mg/l) in discharge from floor drains 87 Figure A4.50 Millstone: copper (maximum, mg/l) in discharge from floor drains 87 Figure A4.51 Millstone: zinc (maximum, mg/l) in discharge from floor drains 88 Figure A4.52 Millstone: hydrazine (maximum, mg/l) in discharge from steam generator blowdown tank 88 Figure A4.53 Millstone: iron (maximum, mg/l) in discharge from steam generator blowdown tank 89 Figure A4.54 Millstone: solids (maximum, mg/l) in discharge from steam generator blowdown tank 89 Figure A4.55 Millstone: lithium (maximum, mg/l) in discharge from steam generator blowdown tank 90 Figure A4.56 St Lucie: total residual oxidants (mean, mg/l) in discharge of main cooling water 91 Figure A4.57 St Lucie: boron (maximum, mg/l) in discharge from radioactive waste system 92 Figure A4.58 St Lucie: hydrazine (maximum, mg/l) in steam generator blowdown 92 Figure A4.59 Calvert Cliffs: residual chlorine (maximum, mg/l) in discharge from main cooling water 94 Figure A4.6 Calvert Cliffs: copper (maximum, mg/l) in main cooling water discharge 94 0Figure A5.1 Four P4 reactors at Paluel (EDF annual report) 99 Figure A5.2 Discharges from selected French sites (annual) as percentage of annual limits 117 Figure A5.3 Discharges from selected French sites (daily mean values) as percentage of daily limits 118 Figure A5.4 Discharges from selected French sites (daily maximum values) as percentage of daily limits 118 Figure A5.5 Detailed data for discharges of hydrazine 119 Figure A5.6 Discharge data from French inland sites (EDF annual reports) 122 Figure A5.7 Discharge data from French coastal sites (EDF annual reports) 122 Figure A5.8 Discharge data for Flamanville plotted by year (normalised to site limit) 123 Figure A5.9 Discharge data for Flamanville plotted by parameter (normalised to site limit) 124 Figure A5.10 Suspended solids and metals from Gravelines 2004–2006 (normalised to site limit) 125 Figure A5.11 Discharges of boron and lithium from Gravelines, 2001–2009 (normalised to site limit) 125 Figure A5.12 Discharges of morpholine, ammonia, phosphates and hydrazine from Gravelines 2004–2009
(normalised to site limits) 126 Figure A6.1 Boric acid, ammonia, ammonium and total nitrogen associated with liquid radioactive effluents from the
nuclear island and turbine hall discharge (KER-SEK) 130 Figure A6.2 Chemical oxygen demand, detergents, hydrazine and lithium associated with liquid radioactive effluents
from the nuclear island and turbine hall discharge (KER-SEK) 131 Figure A6.3 Suspended solids, metals and morpholine associated with liquid radioactive effluents from the nuclear
island and turbine hall discharge (KER-SEK) 132 Figure A6.4 Phosphates, nitrite and sulphate associated with liquid radioactive effluents from the nuclear island and
turbine hall discharge (KER-SEK) 133 Figure A6.5 Ammonium, AOX, chlorides and total residual chlorine in discharges associated with biocide treatment
at Chooz and Golfech 134
viii Chemical discharges from nuclear power stations (Annex)

Figure A6.6 Nitrates, nitrites and sodium in effluents associated with biocide treatment, Chooz and Golfech 135 Figure A6.7 Bromoform, injected chlorine and residual oxidants in effluents associated with electrochlorination
(Penly only) 136 Figure A6.8 Chloride, iron and suspended solid discharges from demineralisation plants 137 Figure A6.9 Sodium, sulphates and calcium discharges from demineralisation plants 138 Figure A6.10 Sulphate discharges due to anti-scale treatments at Chooz and Golfech 138
Chemical discharges from nuclear power stations (Annex) ix


A1 Introduction
A1.1 Report objectives The Environment Agency is engaged in a joint project with the Health and Safety Executive1 to complete a Generic Design Assessment (GDA) of the candidate nuclear power station designs proposed to be built in England and Wales. These new generation nuclear power stations designs include the nuclear reactors and associated power plant systems such as turbines, generators and support systems. An important part of the GDA will be to determine if the candidate designs include the use of Best Available Techniques (BAT) for reducing radioactive and non-radioactive chemical discharges to a minimum. This process will support the eventual licensing of individual plants at specific locations, if and when they are constructed.
To support these activities and the assessments of BAT in the candidate designs, three major pieces of work were commissioned by the Environment Agency. The first project (Environment Agency 2010a) collated and reviewed radiological discharge data. The second (Environment Agency 2010b) reviewed options for cooling water systems. This report is the result of the third project, and is an analogous collation and assessment of non-radioactive chemical discharges.
The projects involved collating data from a range of nuclear power stations currently operating across the world, including those with design characteristics similar to or incorporated into the candidate designs. The reactors included in these surveys therefore include ‘predecessor’ designs to the newer ‘candidate’ designs, although the terms ‘Generation II’ and ‘Generation III+’ are more usually applied.
The report is separated into two main volumes. This Annex report describes the pressurised water reactor (PWR) power plants in England, the USA, France and Germany surveyed and their chemical discharges, and provides a detailed analysis of the discharge data. This forms the basis for the interpretive analysis given in the main report which includes issues of BAT, comparison with fossil fuel plants and an ecotoxicological assessment.
At the time of writing (2011) there are two candidate designs in the GDA process, both of which are PWRs:
• The AP1000™ – a PWR from Westinghouse Electric Company LLC with a net electrical output of 1,117 megawatt electrical [MW(e)]. Net output represents the output to the grid after electrical load in the power plant itself is taken into account.
• The AREVA European Pressurised Water Reactor (EPR™ ) for the UK – a PWR submitted for GDA jointly by Electricité de France (EDF) and AREVA. The reactor system design is from AREVA, but for construction in the UK, other aspects such as the civil design are based on those of EDF. It is referred to as the UK EPR™ for the rest of this report. It has a net electrical output of approximately 1,600 MW(e).
Because both candidate designs are PWRs, the current survey was confined to power stations with this generic reactor design.
1 This report refers to the Health and Safety Executive (HSE). In April 2011 HSE’s Nuclear Directorate became the Office for Nuclear Regulation (ONR).
Chemical discharges from nuclear power stations (Annex) 1

A1.2 PWR power plants included in the survey PWR power plants were selected for this study based on four main criteria. These are described in detail in the main report, but in summary were:
• They should include the PWRs from which the main design features of the AP1000™ and UK EPR™ were derived. For the AP1000™, this means including Westinghouse PWRs currently operating in the USA and Sizewell B in England. For the UK EPR™, it implies including the latest N4 reactors operating in France and the Konvoi reactors in Germany.
• There was a need to establish any pro-rata relationship of chemical discharges with the numbers of reactors on a single site or reactors with different electrical power outputs. Therefore, sites where two or more reactors are operating were included.
• Additional PWR power plants in the USA and Europe were selected to include those located on coastal sites, where once-through seawater cooling is used. This is because coastal sites are likely to be favoured by vendors planning to build new nuclear plants in England and Wales.
• They should include the PWRs covered in the earlier survey of radiological discharges (Environment Agency 2010a).
A list of the AP1000™ predecessor plants and the others included in this survey is provided in Table A1.1. A map showing the location of those in the USA is shown in Figure A1.1. A list of the UK EPR™ predecessor plants and other French sites included in this survey is provided in Table A1.2. A map showing the location of these in France and Germany is shown in Figure A1.2. For convenience, the location of Sizewell B (AP1000™ predecessor) in England is shown in Figure A1.2.
Documents referenced in this Annex report are listed in the References section of the main report.
Table A1.1 AP1000™ predecessors and others in the UK and USA
Plant Site overview Basis for inclusion Annex section
Sizewell B PWR
Single reactor at coastal site
UK Westinghouse predecessor design with once through seawater cooling
A2
Beaver Valley, Pennsylvania
Inland site with twin reactors
Westinghouse three-loop design with cooling towers
A3.2
Byron, Illinois Inland site with twin reactors
Westinghouse four-loop design with cooling towers
A3.3
Comanche Peak, Texas
Inland site with twin reactors
Westinghouse four-loop design with inland cooling reservoir
A3.4
Seabrook, New Hampshire
Single reactor site Westinghouse four-loop design, seawater cooling via 3 km culverts to the Atlantic Ocean
A3.5
Salem, New Jersey
Twin reactor site Westinghouse four-loop design, seawater cooling from Delaware Bay, Eastern Atlantic seaboard
A3.6
San Onofre Units 2 & 3, California
Twin reactor site (but with individual plant permits)
Combustion Engineering two-loop design with seawater cooling from the Pacific Ocean
A3.7
2 Chemical discharges from nuclear power stations (Annex)

Plant Site overview Basis for inclusion Annex section
Diablo Canyon, California
Twin reactor site Westinghouse four-loop design, seawater cooling from Diablo Creek and Pacific Ocean
A3.8
Millstone, Connecticut
Twin reactor site Reactor 2 is Combustion Engineering two-loop design. Reactor 3 is Westinghouse four-loop design. Both use seawater cooling from Long Island Sound connected to Eastern Atlantic seaboard.
A3.9
St Lucie, Florida
Twin reactor site Combustion Engineering two-loop designs with seawater cooling from eastern Atlantic seaboard
A3.10
Calvert Cliffs, Maryland
Twin reactor site Combustion Engineering two-loop designs with seawater cooling from Chesapeake Bay, eastern Atlantic seaboard.
A3.11
Table A1.2 UK EPR™ predecessors and others in France and Germany
Plant Site overview Basis for inclusion Annex section
Civaux Twin N4 site. Cooling tower with make-up from Vienne River.
UK EPR™ predecessor A5.1.1
Chooz Twin N4 site. Cooling tower with make-up from Meuse River.
UK EPR™ predecessor A5.1.2
Golfech Twin P′4 site. Cooling tower with make-up from Tarn River.
1,300 MW(e) four-loop plant
A5.1.3
Penly Twin P′4 site. Seawater cooling from the English Channel.
1,300 MW(e) four-loop plant
A5.1.4
Flamanville Twin reactor P4 site. Seawater cooling from the Bay of Biscay.
Coastal site with 1,300 MW(e) four-loop plants
A5.1.5
Paluel Four reactor P4 site. Seawater cooling from the English Channel.
Larger coastal reactor site with 1,300 MW(e) four-loop plants
A5.1.6
Gravelines Six reactor CPY site. Seawater cooling from the English Channel.
Multiple reactor coastal site. Earlier plants
A5.1.7
Neckarwestheim, Germany
Inland site with cooling tower. Make up from the River Neckar.
Konvoi design and UK EPR™ predecessor
A7.1
Isar 2, Germany
Inland site with dry hybrid cooling tower. Make-up from River Isar.
Konvoi design and UK EPR™ predecessor
A7.2
Chemical discharges from nuclear power stations (Annex) 3

Figure A1.1 Map of plants in the USA (AP1000™ predecessor plants and ones at inland and coastal locations)
Figure A1.2 Map of predecessor and other PWRs in the EU (Sizewell is AP1000™, the remainder are French and German designs)
4 Chemical discharges from nuclear power stations (Annex)

A2 UK’s Sizewell B
A2.1 Sizewell B permit and background chemical data Sizewell B is the only nuclear power station in the UK using PWR technology. It is based on a Westinghouse design developed in the late 1970s but incorporating several additional safety features and a new design for the primary containment. Construction started in 1987 with connection to the grid in 1995. The electrical output of the plant is 1,250 MW(e) of which about 62 MW(e) is used internally (mostly for the main reactor coolant pumps), giving a net output of about 1,188 MW(e). The electrical output can increase considerably when the inlet temperature of the main cooling water falls in the winter months. This is because, like all thermal power plants, the thermal efficiency depends partly on the relative difference of temperature between the inlet of the main cooling water and its outlet.
The discharges of chemicals are controlled under the Water Resources Act under a consent to discharge (PRECS/3962C dated March 1996).
Figure A2.1 View of Sizewell B PWR showing the North Sea, which is the source of once-through cooling water. A small structure visible offshore is one
of the intake structures. Tanks visible are for water, fuel for the diesel generators etc. (by permission of EDF Energy)
The plant uses two turbine generators with once-through seawater cooling, which is drawn from and then discharged to the North Sea via separate intake and discharge
Chemical discharges from nuclear power stations (Annex) 5

culverts. Control of biofouling in this main cooling water circuit is carried out by dosing the cooling water with chlorine generated in a set of electrolysis cells (so-called electro-chlorination). British Energy advises that biofouling is controlled across its fleet of nuclear power plants via a single Operational Memorandum (BEOM/006) which provides a more consistent approach to this process than in some other European countries. The main objectives of the guidance (British Energy 2006) are that:
• dosing should be based on a site-specific understanding of the risks of biofouling;
• the dose itself should be constrained at low levels within the cooling water circuit on a more or less continuous basis (to limit initial colonisation by shellfish larvae, etc).
This largely avoids the need for more occasional so-called ‘shock treatments’ such as using chlorine at higher dosing levels or thermal back-flushing.
Chlorine dosing of cooling water causes organic chlorination by-products (CBPs) to be generated from organic carbon naturally present in the cooling water. The presence of CBPs in effluents from coastal power plants (including Sizewell) has been investigated extensively (Jenner et al. 1997). Bromoform (CHBr3) is the most abundant CBP, with concentrations of up to 16.3 µg/l (micrograms per litre) at a standard chlorine dosing rate of cooling water between 0.5 and 1.5 mg/l (milligrams per litre). The second most abundant is dibromoacetonitrile with concentrations up to 1.48 µg/l. Concentrations of other CBPs (such as dibromochloromethane, bromodichloromethane and 2,4,6-trichlorophenol) are typically below 1 µg/l. In general, investigations show that CBPs have no detectable environmental impacts over and above those due to thermal and flow effects in the discharges or those due to the chlorine itself. The AP1000™ Environmental Report gives a detailed breakdown of the CBPs resulting from chlorination of seawater (Westinghouse 2010a; Table 4.2-4), though without indicating the expected concentrations. Further information on CBPs is given in the cooling water report (Environment Agency 2010b).
The main secondary steam circuit at Sizewell B currently uses a standard all volatile treatment (AVT) with ammonia and hydrazine dosing for oxygen and pH control. To ensure the purity and quality of the water in this circuit is maintained in the event of any in-leakage of seawater via the main condenser, the design includes a large condensate polishing plant (CPP) that can accommodate 100 per cent of the total flow through the main steam circuit (so called 100 per cent condensate polishing). However, the main condenser was fitted with titanium condenser tubes and, as a result, any such leakages of seawater into the main steam circuit have turned out to be negligible. In addition, levels of ammonia dosing in the main steam circuit have been increased (typically to 10 mg/l) to increase the pH and so reduce the transport of iron corrosion products into the steam generators. For these reasons, the large condensate polishing plant is routinely by-passed or operated at reduced throughput. In other words, the condensate from the condensers is of sufficient quality to allow it to be chemically dosed and then returned directly to the steam generators without the need for intermediate treatment and purification in the condensate polishing plant. This has had the effect of reducing requirements to regenerate the ion exchange resins in the condensate polishing plant, so reducing the chemical effluents due to this operation.
The radioactive waste system at Sizewell B is supplied with two separate evaporators for aqueous wastes, one specifically for primary circuit let-down and one for various streams taken from different plant areas. The evaporator for the primary circuit let-down could allow for the recovery of boric acid concentrates (7,000 mg/l boron) and purified distillates for reuse in the primary circuit. However, the levels of tritium in recovered distillates and the maintenance of the evaporators could increase the dose received by workers on the plant which would not be in accordance with principles of
6 Chemical discharges from nuclear power stations (Annex)
ALARP (maintaining doses As Low as Reasonably Practical). Build-up of impurities such as chloride in the boric acid concentrates could also prevent their reuse in the primary circuit. For these reasons, the evaporators are not currently used and general practice is to treat the primary circuit let-down and other aqueous streams by ion exchange and filtration in the radioactive waste system (to remove radioactive constituents) and then discharge through the main cooling water culvert (see Section 4.3.1 of the main report).
Assuming a primary circuit volume of 250 cubic metres (m3) and a concentration of 2,000 mg/l of boron (the typical ‘shutdown’ value), the total inventory of boron in the primary circuit is about 500 kg. If the let-down containing this level of boron was discharged over a 12-month fuel cycle into a cooling water flow of 5 million m3 per day (as in the permit), the concentration of boron expected in the final outfall is only about 0.0002 mg/l. The typical natural background concentration of boron in seawater is about 4.5 mg/l (Mance et al. 1988). Tritium that accompanies the boric acid in this discharge route has very low radiological impacts.
The sources of potentially contaminated water listed in the permit for Sizewell B are:
• cooling water from the main condensers and/or auxiliary cooling water condensers and/or essential cooling water condensers;
• liquors containing boron derived from the reactivity control system and cooling water corrosion inhibitors;
• other cooling water corrosion inhibitors;
• liquors derived from the water treatment plant;
• liquors derived from the condensate polishing plant;
• site drainage.
The permit states these pass through a single outlet (main cooling water culvert) to the North Sea at a maximum flow of just over five million m3 in any 24 hours at a maximum discharge rate of 58 m3 per second. This is similar to cooling water flows of about five million m3 per day quoted for similar plants in the USA.
The permit for Sizewell was developed in several stages, initially for discharges during construction and commissioning and then covering parameters from specific plant systems (equivalent to the internal outfalls specified for the US plants. However, it was recognised that once these relatively small volumes of effluent joined the main cooling water flow, the concentrations would fall to very low levels, and on this basis a single permit for the main cooling water outfall was developed and remains in force.
The permit includes a requirement that the total residual level of oxidants in the discharge does not exceed 0.3 mg/l. Total residual oxidants (TRO) is an ‘umbrella’ parameter that includes a wide range of individual species, but in chlorinated cooling water flows, it is almost entirely dominated by residual chlorine. Further details are given in Section A2.2.
For other parameters, the permit limits are given in terms of comparing the cooling water outflow with the composition of the water at the cooling water inlet (essentially that of seawater). The concentrations in the outflow must not exceed those of the inlet by more than the following values:
• 1 mg/l boron;
• 0.2 mg/l nitrite (as nitrogen, N);
• 5 mg/l total hydrocarbon oils;
Chemical discharges from nuclear power stations (Annex) 7

• 1 mg/l ammonia (as N);
• by greater or less than 1 pH unit.
There are also requirements to avoid the presence of films of oil and to carry out environmental sampling and other surveys in the area of the sea into which the discharges take place. Sizewell states that apart from the residual chlorine in cooling water, no other List I or II substances or chemicals are added to the effluent that could result in their exceeding one per cent of the relevant Environmental Quality Standard (EQS) in the final discharge.
Sizewell has four standby diesel generators that operate under a Pollution Prevention and Control (PPC) permit, with limits for sulphur and nitrogen oxides, and for particulates that are discharged to air during routine testing. There are also emissions to air from the oil-fired auxiliary boilers which produce steam for heating various plant areas and for frost protection of outside tanks and pipelines. No data on discharges to air (or any to water) are available for these. Any such discharges would be expected to be small and in accordance with permit requirements. The diesel generators only operate during occasional testing and use low sulphur fuel.
A2.2 Sizewell B chemical discharge data Data were supplied for the period 2004–2009 for the parameters:
• Temperature of the discharges and cooling water flow (per second, daily and cumulative with averages and totals).
• Results of the DPD (N,N-diethyl-p-phenylenediamine) tests. The DPD colorimetric method (ferrous titrimetric/colorimetric or Palin test) is the most widely used for total residual oxidants in cooling water outfalls. It uses a colorimetric reaction between DPD and residual chlorine or the minor residual oxidants that occur due to chlorination (such a hypobromous acid, HOBr). The test gives a value equivalent to free residual chlorine, which indicates the likely overall net impacts of the oxidising species remaining in the cooling water without the need to analyse each individually.
• Concentrations of ammonia, nitrite and boron, and the numbers of final hold-up/monitoring tanks emptied through the cooling water culverts.
The temperature of the discharge water changes seasonally due to the seasonal changes in cooling water temperatures in the inlet. Cooling water flow shows two main flow regimes – one at about 3.9 million m3/day and one at for shorter periods of operation at about 4.8 million m3/day. These reflect overall changes in reactor power and station electrical output.
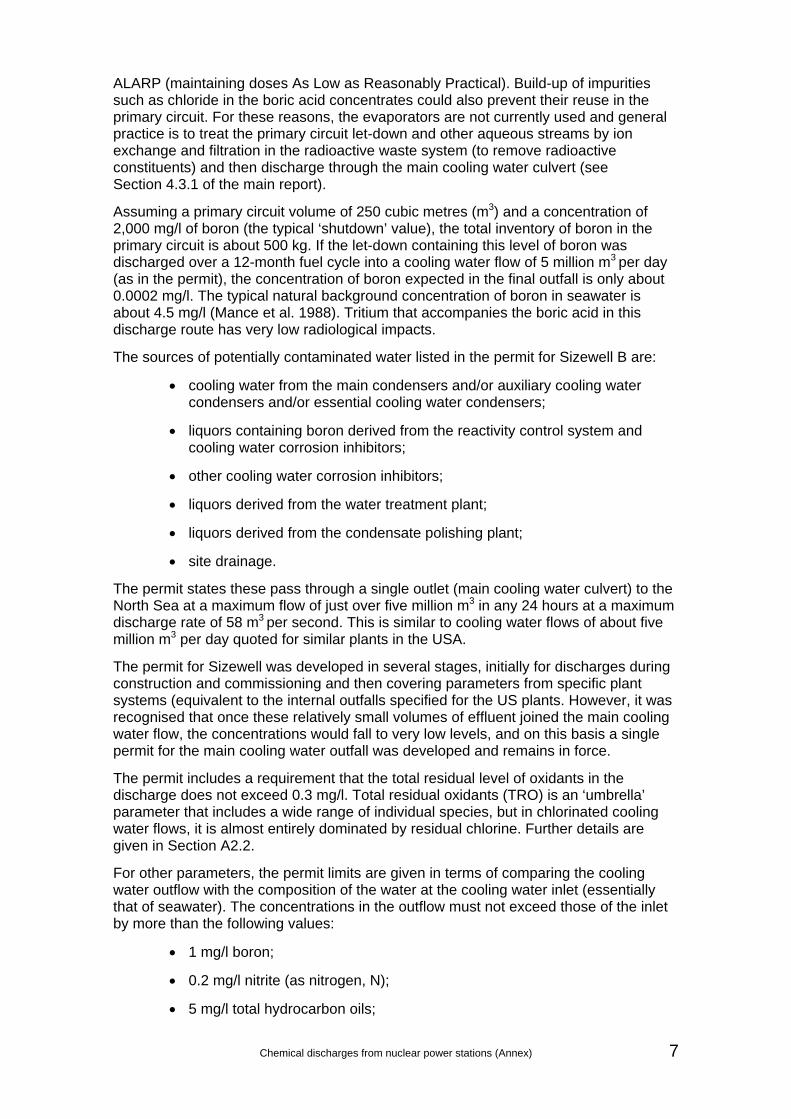
A summary of the results for the chemical parameters against the relevant limits is shown in Table A2.1.
A plot for the total residual oxidants over time is shown in Figure A2.2. Results are consistently around 0.2 mg/l. This reflects close control exercised by operators when using the chlorine dosing system, in accordance with the Operational Memorandum. Gaps with no data reflect either periods when the reactor is shutdown and no chlorination is being carried out or, in a few cases, instances with non-availability of the electro-chlorination system.
Figure A2.3 shows concentrations of boron in the final cooling water discharge. It shows some intermittent peaks that may represent batch discharges of boric acid from the final hold-up tanks (originating from let-down of primary circuit coolant over each
8 Chemical discharges from nuclear power stations (Annex)
annual fuel cycle). The concentrations reported are small compared with the background concentration of boron in seawater (4.5 mg/l).
Data for ammonia have shown a downward trend over time (Figure A2.4), but with data gaps in 2007 and 2008, this trend is far from clear. The concentrations are relatively low (mean 0.23 mg/l, maximum 0.89 mg/l) compared with the permit value of 1 mg/l as total nitrogen. However, they are higher than would be routinely acceptable for free ammonia in water (levels toxic to fish vary from 0.2 to 2 mg/l, depending on the species). The method of analysing and expressing the data suggests that the reported results include both ammonia and ammonium. Ammonium is less toxic than ammonia, and would be expected to be the dominant ammonia species at pHs around 7 to 9.
The mean concentration for nitrite is 6.9 µg/l, although a few maximum values of 100 µg/l were reported recently. This may reflect some rounding of results obtained using an updated method of analysis. Notwithstanding this, all the reported concentrations are all significantly lower than the permit limit of 200 µg/l.
The permit also has limits for pH and hydrocarbon oils, for which no data were available.
Table A2.1 Summary of discharge data (mg/l) for Sizewell B, January 2004 to September 2009
Maximum Minimum Mean Limit Total residual oxidants 0.3 0.0 0.15 0.3 Ammonia (as N) 0.89 0.00 0.23 1.0 Nitrite (as N) 0.1 0.00 0.0069 0.2 Boron (as B) 0.9 0.0 0.14 1.0
Figure A2.2 Total residual oxidants in Sizewell B main cooling water
Chemical discharges from nuclear power stations (Annex) 9

Figure A2.3 Boron in Sizewell B main cooling water discharge
Figure A2.4 Ammonia as nitrogen in Sizewell B main cooling water discharge
10 Chemical discharges from nuclear power stations (Annex)

A3 US PWR power plants
A3.1 Collation and treatment of chemical discharge data
Data for the US plants were obtained in the form of the fact sheets and plant discharge permits issued under the National Pollutant Discharge Elimination System (NPDES). These are available on the internet from either the regulator or the plant operator websites. Additional information was obtained from the site operators and plant personnel. The numerical chemical discharge data were obtained from the USEPA website. Details of the method of downloading and processing this data are given in Section A4.
A3.2 Beaver Valley (inland site)
A3.2.1 Permit and background chemical data
Beaver Valley is an inland US plant situated close to Shippingport Borough in Western Pennsylvania. It consists of two reactors, Beaver Valley 1 and 2, each with a capacity of about 850 MW(e). Both plants are of Westinghouse design and both are covered by a single NPDES permit, reference number PA0025615. The site is regulated by the Pennsylvania Department of Environmental Protection (Water Quality). The plants are currently operated by FirstEnergy Corporation.
Main cooling for the condensers in the turbine generators uses two wet, natural draft cooling towers. To control the build-up of solids and sediments in the cooling tower collection basins, there is continuous blowdown of a proportion of the water circulating in the circuit back to the Ohio River. To compensate for this and the losses due to the evaporative cooling process, make-up is drawn from the Ohio River, upstream of where the blowdown is discharged.
Biofouling in the main cooling water circuit is controlled by dosing with sodium hypochlorite (a source of free chlorine), sodium bromide (which forms hypobromous acid in the presence of chlorine) and sodium sulphite. Build-up of hard scales on pipework and the condenser tubes is controlled using proprietary anti-scale chemicals and anti-foams. This dosing regime reflects the much greater complexity of controlling the chemical and biological conditions in recirculating cooling water systems than in those employing once-through seawater.
Purified make-up for the primary circuit and secondary steam system is produced using a reverse osmosis unit rather than an ion exchange system. The plant operators advised that, as well as reduced running costs, this produces less chemical waste effluent than conventional treatment plants and a higher quality feed for the primary and secondary steam circuits.
The flow diagram for the secondary circuit included in the permit suggests only limited requirements for condensate polishing with a single ion exchange system serving the condensers on both plants. This is typical for plants at inland sites where there tend to be fewer problems with ingress of main cooling water into the steam circuit than at coastal ones.
Chemical discharges from nuclear power stations (Annex) 11

The list of chemicals in the permit for Beaver Valley suggests that hydrazine, boric acid and lithium hydroxide are purchased mainly as single named chemical types, whereas many others are purchased as proprietary mixtures. These may include several active ingredients to improve overall performance as well as preservatives, dyes and tracers. For example, corrosion inhibitors may also include anti-scale chemicals and flocculating agents. The anti-scale chemicals prevent the build-up of deposits on pipework. Flocculants ensure that any corrosion products that do appear are retained in suspension; this ensures that they can be easily flushed out and do not accumulate in dead legs where localised corrosion might otherwise occur.
Treatment systems for effluents on the Beaver Valley site include the radioactive waste systems, downstream sumps and neutralising basins, clarifiers, oil separators and a portable ion exchange unit that can be transferred around the site and plumbed into different plant systems on an ‘as needed basis’.
As in the permits for all US plants, there are limits applying to internal outfalls (that is, ones that discharge to specific points and drains within the plant site) and separate limits for external outfalls (where discharges pass into the environment).
• Internal outfalls. These include:
- discharges from chemical waste treatment systems;
- auxiliary boiler blowdown;
- backwash water that has been used to clean the steam generator blowdown filters and ion exchangers in the condensate polishing plant;
- backwash water that has been used to clean the intake screens (which filter the river water prior to its being used in the main cooling water circuit);
- water from a settling basin;
- discharges from a sewage plant;
- water treated in oil separators serving the turbine hall and standby diesel generators.
• External outfalls to the Ohio River. The main external outfall is the blowdown from the main cooling towers. This also serves as the main route for most of the internal plant outfalls described above. However, the operators advise that the plant was designed prior to the US Clean Water Act and that therefore some smaller waste streams discharge directly to the Ohio River and a smaller tributary as a matter of convenience, rather than being directed to the main blowdown line where greater dilution and lower impacts would accrue. These smaller external outfalls include once-through cooling water serving plant heat exchangers and storm water from open areas of the site.
A range of parameters with either limits or requirements to monitor and report are specified across the internal and external outfalls. A simplified summary to illustrate these parameters and limits is provided in Table A3.1.
12 Chemical discharges from nuclear power stations (Annex)

Table A3.1 Overview of Beaver Valley permit parameters and limits
Parameter Typical range of limits in internal and external outfalls
Suspended solids 20–100 mg/l Oil and grease 15–20 mg/l
Hydrazine Limit is ‘not detectable when analysed using ASTM D1385’ (about 5 µg/l)
Ammonia 10 mg/l Free chlorine (in main outfall 001 only) 0.2 mg/l (average); 0.5 mg/l (maximum)
Total residual chlorine (in main outfall only) 0.5 mg/l (average) 1.25 mg/l instantaneous maximum.
Proprietary control for zebra mussels (‘Clamcontrol’)
Limit (when applied) in outfall is ‘not detectable’.
Copper 0.05 mg/ (average monthly) 0.1 mg/l (daily maximum)
Chromium 0.2 mg/l Zinc 1.0 mg/l pH 6–9 Ammonia, iron, aluminium, manganese, cyanides, chlorobenzene, biochemical oxygen demand, nitrite and nitrate, phsophorus, phenols, total dissolved solids
All specified as requiring monitoring and reporting only
The permit covers standard parameters included in CFR 40 Part 423 (see Section 2.2 of the main report for details) – notably oil and grease, hydrazine, and free and residual chlorine. It also contains a range of others agreed to jointly by the plant operator and regulator. Limits are set for some parameters but for others only monitoring and reporting is required. The permit contains a wide range of other requirements and obligations on the plant. A few generic examples, which also apply to other US plants covered in the survey, include:
• no net increase in the levels of other pollutants in non-contact cooling waters over and above those present at the intake;
• optimised use of biocides at the minimum concentration and times required for control of biofouling – chlorination is limited for either Units 1 or 2 to two hours per day;
• limits on thermal impacts on the flow in the Ohio River;
• USEPA 126 priority pollutants and polychlorinated biphenyls (PCBs) must be reported as ‘not detected’ when analysed using specified EPA methods;
• pre-authorisation for the use of other chemical additives, especially in the main cooling tower system.
Discharges from the primary reactor circuit and then from the radioactive waste treatment systems would be expected to include boric acid and lithium hydroxide. However, these are not covered by limits in the permit. The fact sheet shows that boric acid is used in the primary circuit but stated as being in a ‘closed loop system, not normally discharged’, so is presumably recycled or directed to a solid waste stream. One US plant operator has noted that, even if it is discharged in to the aqueous
Chemical discharges from nuclear power stations (Annex) 13

environment, sampling for boric acid requires workers to enter active areas and be exposed to potentially radioactive samples. The low environmental hazards associated with the discharges may therefore not warrant the risks and hazards to workers associated with the sampling and analysis. In other words, sampling and analysis for boric acid in discharges may not be consistent with maintaining radiation doses to workers to as low as reasonably practicable (ALARP).
There are only minor discharges of chemicals to air due to intermittent testing of the standby diesel generators and auxiliary boilers. The site is also required to operate under the Emergency Planning and Community Right-to-Know laws. These cover US sites where larger amounts of specific chemicals are stored or used; they involve community liaison and require the site and state emergency services to have a co-ordinated emergency plan in place in case of accidents. The requirements are similar to the UK Control of Major Accident Hazards Regulations (COMAH) under which the Environment Agency regulates sites that store and handle chemicals in excess of specified quantities.
A3.2.2 Beaver Valley discharge data
A summary of the data for discharges from the internal and external outfalls for Beaver Valley is given in Annex Table A4.2.
The main discharges of cooling water are the blowdown from the cooling towers serving each of the Units 1 and 2. Most data available are for free and total residual chlorine and pH. The averages of the mean and daily maximum values are all within the relevant permit limits. Plots over time for free and total residual chlorine (Figures A4.1 and A4.2) show some higher values in 2002 that may indicate temporary issues with biofouling that needed to be addressed. Figure A4.3 shows that the maximum pH lies consistently between 8.0 and 9.0. The concentrations of zinc in discharges from the cooling towers (blowdown or overflow) are below the permit limit (1.0 mg/l). Discharges of ammoniacal nitrogen (0.25 mg/l average of daily means and 0.39 mg/l average of maximum daily values) are also well below the permit limit (10 mg/l). These will include free ammonia and ammonium, but under the pH and temperature conditions of the discharge, the less toxic ammonium is likely to be the dominant form present (see Section 4.3.4 of the main report).
The concentrations of hydrazine in the cooling tower blowdown are between 4.5 and 6.7 µg/l – consistent with the requirements of the permit that states they should be below the analytical detection limit, which is about 5 µg/l hydrazine.
Data for the blowdown from the cooling towers include parameters where only monitoring and reporting of data is required. This includes discharges of aluminium and iron. Between 2002 and 2003 the average concentration of aluminium was 1.64 mg/l. This is higher than in discharges from several of the internal plant outfalls and may be due to periodic use of additives in the cooling tower system (for example, coagulants). Figure A4.4 suggests there is no pattern in the levels of aluminium in this discharge over time. The plant operators have stated that discharges of blowdown from the cooling tower into the Ohio River are diluted and timed to ensure that relevant water quality standards in the river are not exceeded.
The data for Beaver Valley cover discharges from internal plant outfalls, mostly for the CFR 40 parameters of pH, chlorine, zinc, and oil and grease. The mean and the mean of the daily maximum values are consistently below the CFR 40 limits. Examples of plots for oil and grease and for suspended solids from the cooling tower pump house (Figures A4.5 and A4.6) show oil and grease are consistently around the detection limit of 5 mg/l. Suspended solids show some upward trend which may be due to gradual accumulation of solids in pipework with periodic flushing from the systems during
14 Chemical discharges from nuclear power stations (Annex)

maintenance. Mean levels of suspended solids from this outfall (11 mg/l) are well below the CFR 40 limit of 30 mg/l but with occasional excursions to about 80 mg/l.
Discharges of effluents from the plant area are expected to potentially be impacted by oil and grease (the plant area contains the diesel generator building, bulk fuel storage drain and storm water run-off). However, levels of oil and grease are well below CFR 40 limits, reflecting a combination of good housekeeping (such as bunds around tanks) and the use of oil–water separators to treat effluents prior to discharge.
USEPA priority pollutants are only reported as being detected in the stormwater run-off, with concentrations of antimony up to 0.65 mg/l and cyanides up to 0.02 mg/l. These discharges also contain the highest levels of copper in any of the outfalls (mean 0.67 mg/l). Other US PWR plants have implemented stormwater management plans to deal with the presence of these priority pollutants and the difficulties associated with managing the diffuse sources associated with stormwater run-off.
There are also relatively high levels of zinc and copper in some discharges from the Beaver Valley heating and plant ventilation systems. The plant operators advise this is due to leaching of the extensive areas of zinc galvanising and copper present in the heat exchangers and chiller units. Levels of zinc in the discharges were between 6.4 (mean of daily values, 2002–2006) and 11.0 mg/l (mean of the maximum daily values), resulting in the site breaching its limit for zinc in the final outfall. To overcome this problem, most of the galvanised components in the units and chillers have been replaced by stainless steel. The plots of copper and zinc in discharges from these systems (Figures A4.7 and A4.8) suggest that since 2004 the maximum concentrations of these metals have been decreasing. Discharges from this internal outfall contain the highest levels of dissolved solids (up to 1,300 mg/l) which is probably due to periodic discharge of the corrosion inhibitors used in these systems.
Figures A4.9 and A4.10 show maximum concentrations of suspended solids from two internal outfalls – one serving the chemical waste treatment system and one serving the intake screen backwash. Solids in the chemical waste treatment system are fairly constant over time and reflect routine treatment of plant effluents with a fairly constant composition. Solids in the intake screen backwash show an upward trend that probably reflects gradual fouling of the intake screens with debris that then increasingly affects effluent from the periodic backwash operations. Figure A4.11 suggests a similar effect may be affecting the levels of solids being discharged in effluents from a sludge settling basin.
A3.3 Byron (inland site)
A3.3.1 Permit and background chemical data
Byron is an inland plant situated in northern Illinois about 90 miles from Chicago. It consists of two reactors, Units 1 and 2, each with a capacity of 1,140 MW(e). The NPDES reference is IL0048313. The regulator is the Illinois Environmental Protection Agency. This permit covers discharges from both plants, both of which are of Westinghouse design.
The main condensers serving the steam turbines are cooled using two wet, natural draft cooling towers (as at Beaver Valley) with make-up and blowdown to the near-by Rock River. Flow around this circuit is about 5,700 m3 per minute. This is a total flow around the circuits of both plants of about 8.2 million m3 per day. This is comparable to the total flow expected for a once-through system serving a twin reactor site of similar capacity (such as the total of nine million m3 per day passing through the once-through
Chemical discharges from nuclear power stations (Annex) 15

system at San Onofre). The picture of the Bryon site in Figure A3.1 shows the visible drift from the cooling towers due to the evaporative cooling process (described in Section 1.6.2 of the main report).
To help control build-up of scale and sediments in the cooling tower collection basins, the cooling water circuits are purged continuously at about 55 m3 per minute in addition to chemical dosing. The resultant blowdown is discharged to the Rock River by a single pump house. To minimise the impacts of the blowdown on the river, it is discharged into the river via a ‘rip rap’ ramp, which improves aeration, cooling and mixing. To compensate for the losses via evaporation and blowdown, make-up to the cooling water circuit is drawn from the Rock River via a separate pump house and intake screen. The make-up volume is about 116 m3 per minute and equivalent to roughly nine per cent of the river flow. This is equivalent to about 166,000 m3 per day. This is therefore significantly less than the total flow required for a once-through system of about 8–10 million m3 per day. The net difference in these two flows represents the cooling capacity supplied by the cooling towers.
Figure A3.1 Byron power plant showing the main hyperbolic, wet, natural draft cooling towers fed from the Rock River and the cooling tower ‘drift’ (by
permission of Byron plant)
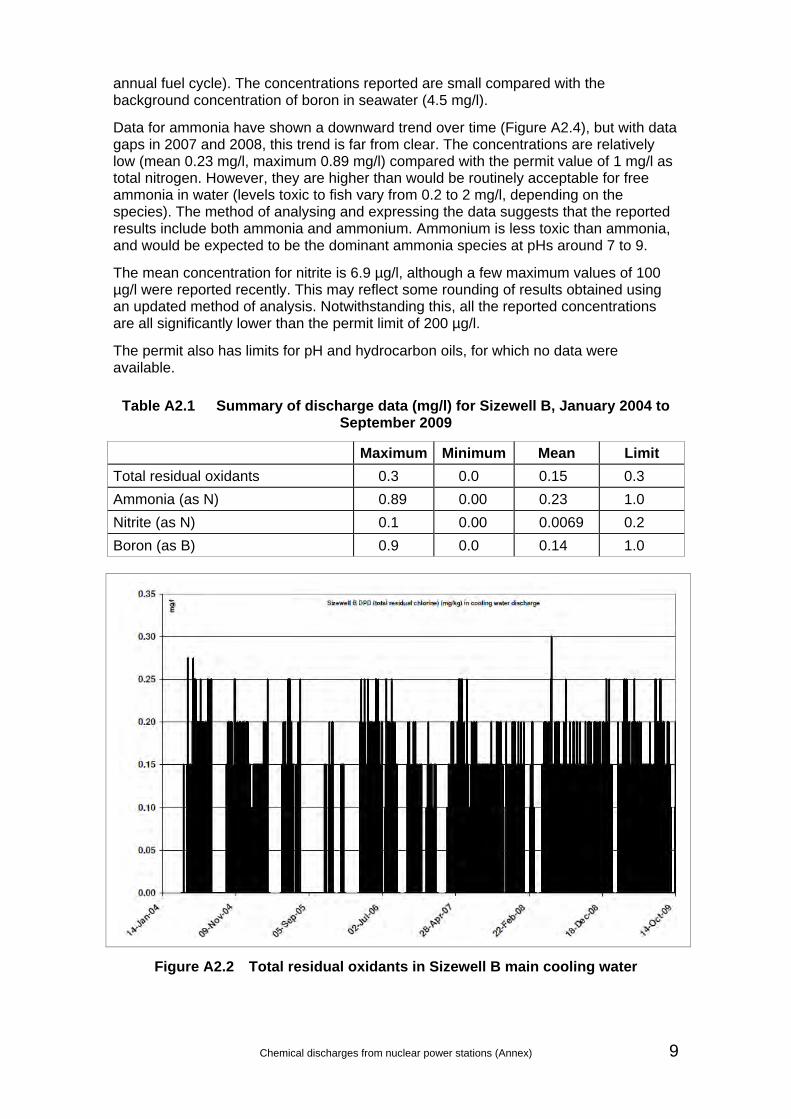
A diagram of the cooling water circuits showing the inflows and outflows from these, which reflects the overall layout for most inland sites using cooling towers, is shown in Figure A3.2.
The permit notes a wide range of chemicals for use or potential use in the main cooling tower circuits that again illustrate the greater complexity of maintaining these than once-through seawater cooling systems. The chemicals include:
• Chlorine to control biofouling. Chlorination is limited to two hours per day. The plant claims that this and limitations in the capacity of the system have also ensured that levels of residual oxidants in the blowdown lines have always remained below 0.2 mg/l.
16 Chemical discharges from nuclear power stations (Annex)
• Tolytriazoles and sulphuric acid to control build-up of scale (sulphuric acid is also applied in the cooling tower circuits at some of the French inland plants).
• Dispersants to prevent settling of solids in the cooling tower basins and ensure these remain in suspension so they can be continuously removed in the blowdown line. These include polymers, polyacrylates and polyacrylic acid.
• Phosphorus and phosphonate corrosion inhibitors. The main impact of these in blowdown reaching the Rock River is reported to be potential increased phosphorus loadings in the river water and associated algal growth. Organic phosphonates or phosphonic acids contain C-PO(OH)2 or C-PO(OR)2 groups (where R represents organic alkyl groups), with a wide range being available for corrosion inhibitors and also acting as scale inhibitors. These retard the precipitation of salts that have exceeded their solubility products. Zinc is also added to minimise corrosion of the main condenser tubes. The exact corrosion issue is not described in the permit, but the zinc is probably used as part of a cathodic protection system in which sacrificial anodes of zinc preferentially corrode and dissolve in response to an applied current between them and the condenser tubes.
Figure A3.2 Byron water flow and balance diagram (by permission of Byron Plant)
On the primary (river) side of the main cooling system at Byron, there have been increased problems with zebra mussels (Dreissena polymorpha). To control these there is an additional ‘electrolytic copper dissolution system’ that can maintain a maximum concentration of 10 µg/l copper in the condensers and service water systems, and 10 µg/l aluminium to control the levels of solids in the system. This system is used between March and October. This additional biocide dosing is also required because the cooling towers at the Byron have concrete internal supports and plastic splash slats. These do not have the biocide effects that come from the use of
Chemical discharges from nuclear power stations (Annex) 17

timber supports and splash slats that have been treated with a copper (or copper arsenic) fungicide/timber preservative. Calculations in support of the use of the system show that the maximum concentration of copper accumulating in the blowdown discharged to the river would be 35 µg/l, which is below a relevant water quality objective of 53 µg/l.
The complex biocide treatments applied at Byron reflect the difficulties some US sites are having with alien species and especially zebra mussels (and Asiatic clams at some sites).
Raw water is drawn from groundwater wells on the Byron site. Demineralisers treat this for use in the secondary (main steam) and primary reactor circuits. The permit notes the possible option of improving the quality of feedwater and reducing chemical discharges by using a reverse osmosis unit for raw water treatment (as already employed by Beaver Valley).
The secondary steam system at Byron uses a combination of ammonia and hydrazine for controlling dissolved oxygen and pH. The fact sheet also notes carbohydrazide (as a proprietary preparation called NALCO 1250) as an alternative to hydrazine because it presents a lower hazard to workers handling it and to the environment as a whole in any discharges. However, it may not be as efficient as hydrazine for removing oxygen from feedwater flowing through the lower temperature parts of the steam circuit (that is, after the main condenser and prior to the condensate being returned to the steam generators). The possibility of its use probably depends on a range of plant factors such as the rate of loss of feedwater from the main steam circuit (due to blowdown from the steam generators), the amount of oxygen present in fresh feedwater required to replenish these losses and the point in the steam circuit where chemical dosing is carried out.
PWRs situated at inland sites, such as Byron, frequently have relatively small condensate polishing plants. These are only used intermittently or at low flow through rates, usually during reactor start-up when significant volumes of fresh feedwater have been introduced into the steam circuit and need to be brought up to required purity levels before the reactor and turbines are run at full power.
The main internal sources of aqueous waste within the Byron site include:
• Waste from the demineraliser systems (492 m3/day). This consists of the neutralised acids and alkalis, and wash water used to regenerate ion exchange beds in the raw water treatment and condensate polishing plants. These effluents may also contain traces of surfactants.
• Wastes from the non-active waste treatment plant (150 m3/day). These are treated using cationic and anionic polymers to aid coagulation and flocculation (solids are separated out and disposed of separately). Caustic or citric acids are also used to control the pH to between about 6 and 9.
• Sewage effluent that is treated using sodium bicarbonate.
• Rainwater and water from, for example, the areas where the main station transformers are housed. This is treated in oil–water separators prior to discharge.
• The active laundry discharges into the liquid radioactive waste treatment plant. Discharges from this internal outfall would contain low levels of boric acid, lithium hydroxide associated with primary circuit let-down and from drains serving active areas of the plant (for example, those where boric acid solutions are stored and prepared).
18 Chemical discharges from nuclear power stations (Annex)

The plant flow diagram shows that, apart from stormwater run-off, all these internal outfalls discharge into the main cooling water basins and are therefore finally discharged via the blowdown from the cooling towers back to the Rock River. Given a total volume of effluent from the internal outfalls of about 500 m3 per day (mainly from the demineraliser and non-active waste treatment plant) and blowdown of about 80,000 m3 per day, internal outfalls will be diluted by a factor of about 150 prior to final discharge. The blowdown will therefore be dominated by the chemicals added to control biofouling, scale build-up and sediment dispersal in the main cooling water circuit, rather than by any additives used in the reactor or steam circuits.
A simplified summary to illustrate the main features of the permit, in terms of limits and parameters in the internal and external outfalls, is provided in Table A3.2:
Table A3.2 Overview of Byron permit parameters and limits
Parameters Typical range of limits in internal and external outfalls
pH 6.0–9.0 Total residual chlorine 0.2 mg/l (average); 0.5 mg/l (maximum) Total residual oxidants 0.05 mg/l Zinc 1 mg/l Hydrazine 0.031 mg/l
Copper 0.071 mg/l (main outfall); 0.5 mg/l (average) to 1.0 mg/l (maximum) in internal outfalls
Suspended solids 15–60 mg/l (in sewage outfall only) Chromium 1.0 mg/l (average) to 2.0 mg/l (maximum) Iron 1.0 mg/l Lead 0.2–0.4 mg/l (internal outfalls only) Nickel 1.0–2.0 mg/l (internal outfalls only) Biochemical oxygen demand (BOD) 30–60 mg/l Oil and grease 15–20 mg/l There are special allowances for when decontamination and cleaning of the secondary side of the steam generators is carried out. This is necessary because feedwater from the turbines and main condensers tends to carry forward suspended iron into the steam generators and deposit it there as a sludge. Some of this is removed by continuous blowdown from the steam generators during operation, but a portion cannot be removed in this way and requires specific periodic removal, either chemically or mechanically by jet washing (so-called ‘sludge lancing’). Additional parameters and limits to cover this activity include hexavalent and total chromium, copper, iron, nickel, lead and zinc. There are also additional limits for the chemical cleaning agents used in the process, such as EDTA and reagents used to control dissolved oxygen in the cleaning solutions (carbohydrazide or hydrazine).
Boric acid is not included in the permit for Byron, but fact sheet for the plant it is noted as being discharged from the radioactive waste treatment system. This discharges to the cooling tower collection basins and then to the main outfall and the Rock River. Radioactive discharges via this route are under regulated by the US Nuclear Regulatory Commission (NRC) rather than by the environmental regulator. Calculations in support of the permitting of this discharge show that the worst case scenario could involve the emptying of three hold-up tanks full of primary circuit let-down containing 2,500 mg/l boron in a single day. After dilution with the cooling tower blowdown,
Chemical discharges from nuclear power stations (Annex) 19

concentrations of boron in the final discharge would still remain below 15 mg/l. After further dilution along the rip rap and in the mixing zone of the Rock River, this would not impact on a water quality objective of 1 mg/l boron specified for this river by the state environmental protection agency (EPA).
Plant operators at Byron plan to implement the addition of zinc to the primary coolant. This is a relatively recent development that has been found to reduce the corrosion of the stainless steels used in the primary circuit pipework systems of PWRs, especially primary water stress corrosion cracking of welds and other sensitive areas (see Section 4.3.10 of the main report). In the permit application, it is stated that the very low levels of zinc added to the coolant (less than 100 µg/l) would be removed in the ion exchange beds in the radioactive waste system. Therefore the zinc would follow the radioactive components of the primary circuit let-down into the solid waste streams (in exhausted ion exchange resins) rather than by an aqueous discharge route. This means there would be no requirement to apply to increase the limits for zinc in the discharge permit.
The permit and supporting documents note extensive discussion between the operators and the state regulators on the use and discharge of hydrazine at Byron. The original permit described hydrazine being used for cleaning of the steam generators and being discharged on an intermittent basis. However, more frequent discharges would be associated with routine operation of the secondary steam circuit and regeneration of the ion exchange reins in the condensate polishing plant. There was regulatory concern over these more routine discharges due to chronic and acute effects on water biota. The state regulator specified that the plant operators make more detailed assessments and implement a detailed monitoring regime.
The permit describes obligations on the Byron plant to implement a stormwater prevention plan. Data for the plant at Beaver Valley suggest these discharges can be a dominant source of USEPA priority pollutants such as antimony, although these are not noted in the discharge data for stormwater discharges from Byron. At Byron the requirement reflected regulatory concerns over the age and design of the drains serving site areas, an increased likelihood of extreme storm events and greater risks of the discharge of oily water during such events. It also reflected the fact the oil–water interceptors at Byron had only a limited capacity, leaving little opportunity take remedial action should oily water produced in heavy storms present a particular hazard.
A3.3.2 Byron discharge data
A summary of the data for discharges from the internal and external outfalls for Byron is given in Annex Table A4.3.
The main discharge is the blowdown from the cooling tower collection basins. The averages of the daily means and maximum values of total residual chlorine, pH, suspended solids, copper and zinc are all less than the relevant plant permit limits and CFR 40 guidelines.
A plot for mean total residual chlorine (Figure A4.12) shows some upward trend that may indicate that the plant has needed to increase dosing to combat problems of biofouling in the main cooling water circuit, possibly culminating in the additional dosing with copper. Some annual patterns in the data reflect changes in dosing required between winter and summer seasons.
Figure A4.13 shows the start-up of the electrolytic copper dosing system in 2000 to control zebra mussels, but with seasonal usage only as and when required. The mean of the daily maximums in the discharge is 0.01 mg/l, which is compliant with the permit limit for copper from this system (0.01 mg/l). Copper is already present in the Rock
20 Chemical discharges from nuclear power stations (Annex)

River at a concentration of between 3 and 4 µg/l due to discharges from other industrial complexes up-river. After dilution along the rip rap, copper added to control biofouling in the cooling circuits at Byron does not impact on the background levels already present in the river.
Figure A4.14 suggests that there is some upward trend in levels of oil and grease in discharges from the cooling towers, but the mean value of 3.1 mg/l is well below permit and CFR 40 limits. Suspended solids in the main outfall show a similar pattern. Maximum pH (Figure A4.15) values are consistently around 8.5.
The average of the daily mean and maximum concentrations of hydrazine vary significantly (between 621 and 1,940 µg/l), but because there are only 10 data points, it is not possible to determine any trend over time. The relatively wide range of concentrations may reflect some samples being collected during routine operation and others taken when additional monitoring is required such as during cleaning of the steam generators (discharges contain up to 2,000 µg/l hydrazine) or when drainage from the condensate plant is discharged (containing about 200 µg/l hydrazine).
Figure A4.16 shows that the maximum concentrations of zinc in the cooling water discharges have decreased over time. This may reflect galvanised plant systems becoming covered in a passive film of insoluble zinc carbonate (so called passivation), which over time reduces leaching of zinc. This is in contrast to the trend observed at Beaver Valley, where concentrations of zinc in discharges increased over time, eventually requiring the operators to replace galvanised plant (associated with heating and ventilation systems) with stainless steel systems. The differences between these two sites may be due to raw water chemistry or the use of corrosion inhibitors.
The rest of the available data are for the internal plant outfalls and are confined to CFR 40 parameters of pH, oil and grease, suspended solids and, for that from the stormwater run-off basin, chlorine and zinc. Concentrations are all below CFR 40 and plant permit limits, but the number of data points is not sufficient to show any trends over time.
A3.4 Comanche Peak (inland site)
A3.4.1 Comanche Peak permit and background chemical data
Comanche Peak is an inland plant situated in north Texas about 40 miles southwest of Fort Worth. It consists of two reactors, Units 1 and 2, each of Westinghouse design and with a capacity of 1,150 MW(e). The NPDES reference is TX0065854. The most recent version of the permit available has a renewal date of August 2003. The site is regulated by the Texas Commission on Environmental Quality.
Main cooling water is drawn from and then discharged to a freshwater lake called Squaw Creek Reservoir (1,325 hectares and about 14 m deep). This was constructed specifically for the plant in 1979 and is shown in Figure A3.3. The discharges eventually pass from the reservoir to the Paluxy River (part of the Brazos River Basin).
The maximum total cooling water flow is six million m3 per day for each reactor. This is larger than the average of about five million m3/day for other plants (such as Sizewell) using once-through cooling. This is probably because, when using surface water in a warm climate, there will be only a small difference in temperatures between the inlet to the main condensers and the outlet at flow rates usually employed. This would limit the thermal efficiency of the plant and reduce the output capacity. To compensate for this effect at sites like Comanche Peak, it is necessary increase the flow of once-through
Chemical discharges from nuclear power stations (Annex) 21

cooling water through the main condensers. The possibility of adding cooling towers to the once-through system at Comanche Peak has been considered in order to improve cooling.
Raw water is drawn from groundwater supplies and the nearby Lake Granbury. To make it suitable for use in the primary circuit and other plant systems, it is treated by microfiltration to remove particulates, then by reverse osmosis with final treatment (or polishing) by a small ion exchange system. The plant chemist states this produces higher quality water with less waste than standard large scale ion exchange systems.
The once-through cooling water system uses chlorine to control biofouling. Discharge limits for free available chlorine are consistent with standard CFR 40 vales of 0.2 mg/l (daily average) and 0.5 mg/l (daily maximum). According to the permit, in future this may be supplemented by using a proprietary system called Bulab 6002, a 60 per cent polymeric quaternary ammonium compound, which is effective against zebra mussels (Dreissena polymorpha).
Figure A3.3 Comanche Peak Power Plant showing Squaw Creek (by permission of Comanche Peak Power Plant)
The main condenser in the steam circuit uses titanium tubes, which have minimised leakage of main cooling water into the main steam circuit. This has reduced the need for 100 per cent condensate polishing (although it is available as an option).
Comanche Peak’s fact sheet contains a list of over 1,500 separate chemicals used on the site (mostly given as proprietary names). The permit only gives a detailed breakdown of the main ones used. These include additives used in the main steam circuit (hydrazine and morpholine) and in the once-through cooling system (sodium hypochlorite and sodium bromide). The permit also notes that the quality of the water in the Squaw Creek reservoir is poor, with high levels of suspended solids and a tendency for algal growth so it requires additional dosing with two proprietary chemicals:
• Bulab 7016 (1-hydroxy-ethylidene-1,1-diphosphonic acid) is an example of one of the many types of organic phosphonates used at US inland plants in cooling circuits to prevent the build-up and deposition of scale;
22 Chemical discharges from nuclear power stations (Annex)

• Bulab 7034 – a polyacrylic acid, (C3H4O2)n – acts as a polyelectrolyte and ensures that sediments in the cooling water do not settle out in stagnant or low flow areas of the circuit.
The non-radioactive wastes include those from the raw water treatment system, a reverse osmosis plant, the condensate polishing plant and the backwashing filters (which will therefore contain suspended solids and iron). Generic abatement systems for the waste liquids include:
• neutralising chemicals used in the regeneration of ion exchange resins (using acid or caustic);
• separating solids in the condensate polisher decant basin and a clarifier basin (may involve simple gravity settling or addition of flocculant);
• oil–water separation.
Low level radioactive wastes containing chemical additives originate from plant drains and active plant systems. These are collected in holding tanks for processing in order to meet NRC limits for off-site dose criteria.
After treatment, the aqueous effluents to the main cooling water pass to the outfall leading to Squaw Creek reservoir. The flows are balanced and timed so that the discharges do not breach the water quality objectives at the edge of the mixing zone in the reservoir.
Effluents containing boric acid from the reactor system are treated in an evaporator to recover boric acid concentrates. These are either reused or, if not suitable, directed to a solid waste stream. Therefore there are no requirements to discharge boron to the Squaw Creek Reservoir (which as a freshwater environment would have more stringent water quality objectives for boron than those permitted for seawater).
In summary, the main features of the permit for Comanche Peak are free and residual chlorine, suspended solids, oil and grease, biochemical oxygen demand (BOD), faecal coliforms, iron, copper and total dissolved solids. Daily maximum values and monthly limits are all consistent with those in the CFR 40 guidelines. There is a longer list of chemicals to be included in the monitoring reports including trace/heavy metals and USEPA priority pollutants, and requirements for whole effluent toxicity tests. There are also requirements to avoid floating materials and foam and visible films of oil or grease.
A3.4.2 Comanche Peak discharge data
A summary of the data for discharges from the internal and external outfalls for Comanche Peak is given in Annex Table A4.4.
Levels of total free and residual chlorine in the final discharges (up to about 0.001 mg/l) are lower than for other US inland plants discussed so far, even though limits in force for the plant are consistent with the standard CFR 40 guidelines. The original NRC construction licence (in 1978) specified a limit of 0.1 mg/l chlorine in the discharge and, in response, the plant initiated an early chlorine minimisation programme. This may have reduced chlorine dosing to levels well below those that would achieve the CFR 40 limits, while still ensuring adequate control over biofouling. However, the plant operators advised that the cooling water from the Squaw Creek reservoir is alkaline, has a relatively high algal loading and is discharged along a relatively long culvert. This means that only low levels of total residual oxidants remain in the final discharge to the reservoir despite a high chlorine demand.
Chemical discharges from nuclear power stations (Annex) 23

Plots for BOD and faecal coliforms in sanitary waste (Figures A4.17 and A4.18) show peak values at varying intervals, although there are no operational data to indicate the source or reason. Concentrations of oil and grease in low volume waste discharges (prior to being mixed with the main cooling water, Figure A4.19) are around the detection limit of 5 mg/l, well below the relevant CFR 40 limit of 15 mg/l.
The permit application containing a standalone monitoring report (TPDES Permit 01854 dated 26 August 2003) was supplied by the plant operators, which included data for trace and heavy metals in four samples taken from the main cooling water outflow. These data therefore represent the net chemical content of cooling water that has passed through the main condensers and the contributions from smaller internal plant outfalls. The metals analysed include corrosion products (such as chromium, nickel and iron) and trace heavy metals (such as antimony, arsenic and lead) that are not used in main structural materials and so would only be expected as impurities (so-called ‘tramp’ constituents).
The monitoring results (from the 2003 monitoring report) are summarised in Annex Table A4.5. The only metals reported consistently above the analytical detection limits are aluminium, barium and zinc. The source of aluminium and zinc is corrosion of structural materials; it is not possible to determine any likely source for barium. The detection limits for some metals such as nickel (10 µg/l) or chromium (5 µg/l) may be too high to detect the low levels of these metals expected in the main cooling water flows. In addition, the 2003 monitoring report makes no mention of any sample collection procedures (such as field filtration) that can significantly affect trace metal data. These data are discussed in further detail in the section dealing with a similar set of data collated for the plant at San Onofre (Annex A3.7).
The 2003 monitoring report also included results for selected volatile hydrocarbons, especially chlorination by-products. Chloroform, dichlorobromomethane, dibromomethane, dichloroethane and trichlorophenols are all reported as less than the detection limit of 10 µg/l. These ‘non-detect’ results are consistent with CFR 40 requirements (providing analysis was carried out according to recognised protocols).
A3.5 Seabrook (coastal site)
A3.5.1 Seabrook permit and background chemical data
Seabrook is situated on an estuarine marsh on Browns River near the coast of southern New Hampshire and about 40 miles north of Boston. It consists of a single PWR unit of Westinghouse design with an output of 1,245 MW(e). Two units are shown in some pictures of the site, but due to delays and financing, only one was built. Commercial operation began in 1990. The USEPA regulates the site because New Hampshire is not a delegated state. The NPDES reference is NH0020338. A view of the site is shown in Figure A3.4.
Although situated on Browns River, the main cooling water flow of 2.7 million m3 per day is drawn from the Gulf of Maine on the North Atlantic seaboard via a 5-km long underground intake culvert. It is discharged via a separate culvert which also serves as the main route for internal discharges from site drains and plant systems. In the event of any loss of cooling due to blockages along the culverts, the reactor is shut down and any additional cooling required is carried out using a small emergency cooling tower.
Chlorine is used to control biofouling in the once-through cooling system, with the option of a proprietary system called EVAC (which is related to endothall herbicides but was recently found to be effective for controlling zebra mussels). If despite these
24 Chemical discharges from nuclear power stations (Annex)

measures, surveys shows colonisation by the mussels has started, thermal back-flushing may be applied. In this, warm water at about 49°C is pumped back from the plant into the culverts. Use of all these measures is restricted and the plant is required to submit a chlorine minimisation report detailing how dosing by sodium hypochlorite has been maintained at the minimum level required to achieve the necessary biofouling control. Chlorination is not generally required from December to February.
The limits in the main outfall include average monthly and daily maximum values for pH and total residual oxidants and, if used, EVAC. There are also requirements to carry out whole effluent toxicity tests on samples representing an average 24-hour discharge (a so-called composite sample) taken every three months. Tests are carried out to determine acute impacts (using mysid shrimp and silverside minnow) and chronic effects (using sea urchins and silverside minnow). There are also requirements to avoid oil films, foam or other floating material in the discharge.
Figure A3.4 Seabrook Plant on Browns River (by permission of Seabrook Plant)
The plant takes water from municipal (towns water) supplies. This is treated in a reverse osmosis/ultrafiltration and electro-deionisation plant, which produces 40 litres per minute of treated water and 23 litres per minute of waste concentrate. The concentrate contains common anions and cations about three times the concentration in raw water (200 mg/l sodium, 11.4 mg/l nitrate, 250 mg/l chloride). Flow through the reverse osmosis plant is dosed continuously with an anti-scale and flocculant at low levels (typically 20 mg/l). These pass through the separation membrane and therefore appear in the concentrate waste stream.
Because the raw water is taken from municipal supplies that have already been chlorinated, further dosing by sodium hypochlorite for control of biofouling in the reverse osmosis and deionisation plant is only required on a periodic basis (about six times per year). Any effluent from this operation is treated using sodium sulphite to destroy free chlorine prior to discharge. As at Beaver Valley, using reverse osmosis has improved feedwater quality to the plant systems and avoided the need to
Chemical discharges from nuclear power stations (Annex) 25

regenerate large-scale ion exchange systems (and the associated discharges of acid and caustic).
The plant uses all volatile treatment (AVT) in the secondary steam circuit. Instead of using ammonia to control pH, Seabrook uses methoxypropylamine, a so-called alternative amine (some sites choose to use alternative amines to minimise corrosion according to their specific requirements). The discharge limit for methoxypropylamine in the final cooling water outfall (5 mg/l) is based on the results of toxicity tests.
The fact sheet for Seabrook provides a detailed breakdown of the chemicals used. Those used in the main steam circuit are emphasised, together with potential breakdown products that may appear in discharges. A summary is shown in Table A3.3.
Table A3.3 Summary of chemicals and breakdown products from Seabrook NPDES fact sheet
Chemical Main use on-plant Sodium hydroxide Condensate polishing plant. Hydrochloric acid Water make-up system, treatment of steam
generator blowdown and cleaning of the electro-deionisation plant
Sulphuric acid Condensate polishing plant regenerant Bulab 9328/6002 Corrosion inhibitor and biocide for freshwater
systems Cresols and phenols Certain cleaning products Morpholine and ethanolamine Secondary circuit additives, steam generator soak
agents, hot-well discharges Acetaldehyde, acetic acid, diethylamine, dimethylamine, monoethylamine, monomethylamine, trimethylamine, acrylonitrile
Potential breakdown products of ethanolamine present in turbine hall sumps
Sodium thiosulphate Chlorine removal in the waste water treatment plant
Pyrrolidine (tetrahydropyrrole) Secondary circuit additive Carbohydrazide Secondary and closed loop cooling systems
additive (oxygen control). Alternative to hydrazine Methoxypropylamine Neutralising amine used with hydrazine to prevent
corrosion in steam condensate systems Dimethylamine, 5-aminopentanol, 1,2-di-aminoethane, 3-hydroxyquinuclidine, 2-amino-2-methylpropanol, diethylhydroxylamine
Secondary circuit additives (potential future use). Advanced amines
EDTA Agent for periodic cleaning of steam generators EVAC biocide and H-130M Mollusc control in cooling systems Thruguard 300 Chlorination systems to reduce scale build-up Hypersperse Flocculant/anti scale used in make-up water
system BetzDearborn Cold sterilant Reverse osmosis plant biocide Permatreat 191 Anti-scale for reverse osmosis plant Sodium sulphite Chlorine removal in water feed to the reverse
osmosis unit
26 Chemical discharges from nuclear power stations (Annex)

In summary, the main internal plant outfalls described in the permit include:
• steam generator blowdown and blowdown rinse water;
• waste water from hold-up sumps and test tanks;
• metal cleaning wastes;
• blowdown from the back-up/emergency cooling tower (if used);
• water from three oil–water separators serving different plant areas;
• waste water from the raw water treatment and make-up plants, secondary plant systems and drains that collect spills and leaks from different plant areas.
Parameters and limits specified for discharges from these internal outfalls cover those in CFR 40 (oil and grease, suspended solids, pH, copper and iron but not chromium or zinc). It also specifies whole effluent toxicity tests every three months, but if the results are consistently negative, the frequency of testing can be reduced to twice per year.
The permit also specifies requirements for a ‘chlorine transit study’ at times when chlorination is being carried out but when chlorine demand is likely to be low. Samples are taken at strategic points in the flow path of the main cooling water and analysed for free and total available chlorine. The objective is to determine the fate and decomposition of active chlorine from the point where it is injected into the circuit at the entry to the culverts to the point where the cooling water is finally discharged to the Atlantic Ocean.
The permit notes the use of boric acid in the primary circuit. The concentration of boric acid in the internal outfall from the final hold-up tanks must be less than 1,500 mg/l and the main final outfall must contain less than 5 mg/l boron. The permit states that dilution of the discharge from the holding tanks into the final cooling water will ensure that the final limit for boron is never breached. The limit of 5 mg/l represents an older EPA ‘Gold Book’ background concentration for boron in marine water bodies. The fact sheet for the Seabrook plant states that the total quantity of boric acid discharged annually is about 2,500 kg. This is generally consistent with the expected discharge of boric acid from the UK EPR™ of 2,000 kg per year, although the quoted maximum is about 7,000 kg per year.
A3.5.2 Seabrook discharge data
A summary of the data for discharges from the internal and external outfalls for Seabrook is given in Annex Table A4.6.
Concentrations of total residual oxidants in the main cooling water outfall due to chlorination are up to 0.085 mg/l (mean of daily maximum values). Figure A4.20 shows changes in mean residual oxidants over time and illustrates a clear seasonal trend where no chlorination is required in winter. This probably reflects the northerly latitude of the plant, where during winter the temperatures of cooling waters are low enough for biofouling not to be a routine problem (usually below 10°C).
The rest of the available data are for pH in the main outfall and CFR 40 parameters (mostly grease and total suspended solids) across a range of internal plant outfalls. All calculated average mean daily and maximum concentrations are below the relevant permit and CFR limits. Figure A4.21 shows levels of suspended solids in discharges from the turbine hall sump (likely to represent routine internal plant discharges with the
Chemical discharges from nuclear power stations (Annex) 27
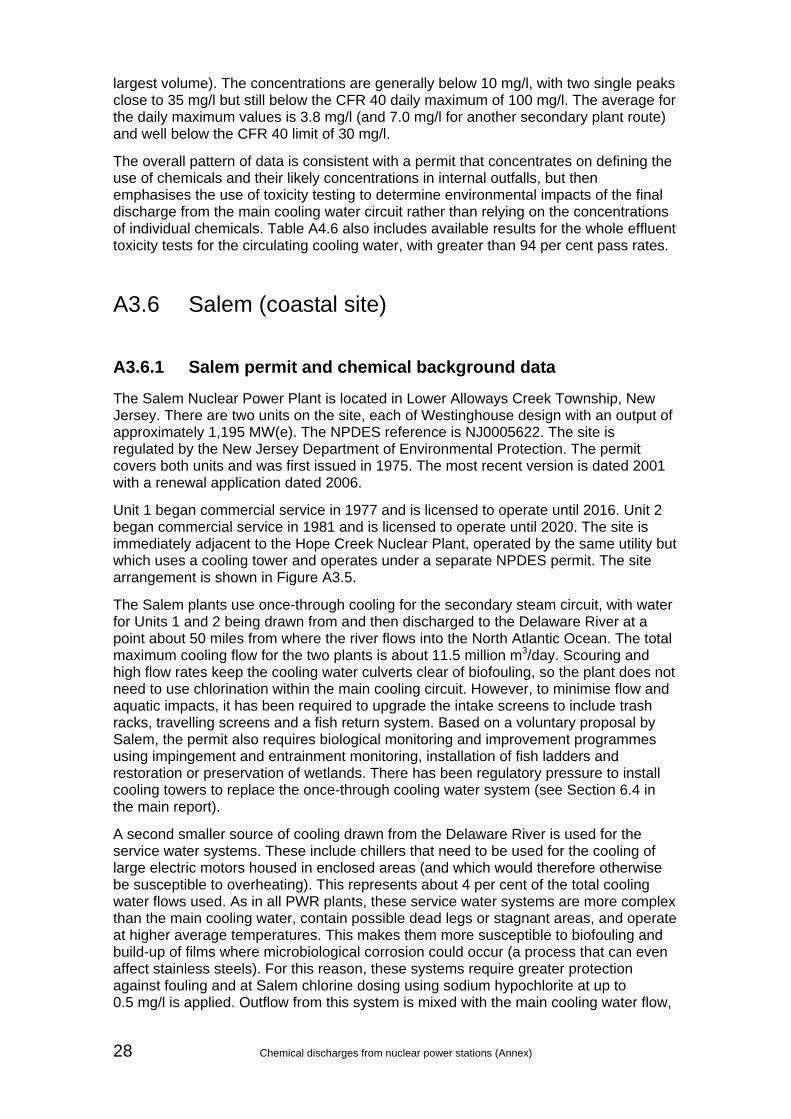
largest volume). The concentrations are generally below 10 mg/l, with two single peaks close to 35 mg/l but still below the CFR 40 daily maximum of 100 mg/l. The average for the daily maximum values is 3.8 mg/l (and 7.0 mg/l for another secondary plant route) and well below the CFR 40 limit of 30 mg/l.
The overall pattern of data is consistent with a permit that concentrates on defining the use of chemicals and their likely concentrations in internal outfalls, but then emphasises the use of toxicity testing to determine environmental impacts of the final discharge from the main cooling water circuit rather than relying on the concentrations of individual chemicals. Table A4.6 also includes available results for the whole effluent toxicity tests for the circulating cooling water, with greater than 94 per cent pass rates.
A3.6 Salem (coastal site)
A3.6.1 Salem permit and chemical background data
The Salem Nuclear Power Plant is located in Lower Alloways Creek Township, New Jersey. There are two units on the site, each of Westinghouse design with an output of approximately 1,195 MW(e). The NPDES reference is NJ0005622. The site is regulated by the New Jersey Department of Environmental Protection. The permit covers both units and was first issued in 1975. The most recent version is dated 2001 with a renewal application dated 2006.
Unit 1 began commercial service in 1977 and is licensed to operate until 2016. Unit 2 began commercial service in 1981 and is licensed to operate until 2020. The site is immediately adjacent to the Hope Creek Nuclear Plant, operated by the same utility but which uses a cooling tower and operates under a separate NPDES permit. The site arrangement is shown in Figure A3.5.
The Salem plants use once-through cooling for the secondary steam circuit, with water for Units 1 and 2 being drawn from and then discharged to the Delaware River at a point about 50 miles from where the river flows into the North Atlantic Ocean. The total maximum cooling flow for the two plants is about 11.5 million m3/day. Scouring and high flow rates keep the cooling water culverts clear of biofouling, so the plant does not need to use chlorination within the main cooling circuit. However, to minimise flow and aquatic impacts, it has been required to upgrade the intake screens to include trash racks, travelling screens and a fish return system. Based on a voluntary proposal by Salem, the permit also requires biological monitoring and improvement programmes using impingement and entrainment monitoring, installation of fish ladders and restoration or preservation of wetlands. There has been regulatory pressure to install cooling towers to replace the once-through cooling water system (see Section 6.4 in the main report).
A second smaller source of cooling drawn from the Delaware River is used for the service water systems. These include chillers that need to be used for the cooling of large electric motors housed in enclosed areas (and which would therefore otherwise be susceptible to overheating). This represents about 4 per cent of the total cooling water flows used. As in all PWR plants, these service water systems are more complex than the main cooling water, contain possible dead legs or stagnant areas, and operate at higher average temperatures. This makes them more susceptible to biofouling and build-up of films where microbiological corrosion could occur (a process that can even affect stainless steels). For this reason, these systems require greater protection against fouling and at Salem chlorine dosing using sodium hypochlorite at up to 0.5 mg/l is applied. Outflow from this system is mixed with the main cooling water flow,
28 Chemical discharges from nuclear power stations (Annex)

which therefore requires monitoring for total residual oxidants despite there being no dosing of the main circuit itself.
The main non-radioactive effluents originate from the secondary steam system. They are dominated by those from the periodic regeneration of ion exchange units in the condensate polishing plant, from the reverse osmosis unit used to treat raw well water and the steam generator blowdown. These are collected in an equalisation basin, for neutralisation to between pH 6 and 9 and, if required, treatment using sodium hypochlorite or hydrogen peroxide to oxidise small amounts of organic matter or hydrazine. There are also facilities for adding coagulants and settling in clarifier tanks, primarily to remove iron, trace metals and suspended solids. This final part of the treatment train ensures that all effluents from the various non-radioactive plant sources are collected together, checked and monitored prior to being discharged via the main cooling water outfalls to the Delaware River.
Figure A3.5 Salem dual reactor site (right) and neighbouring single reactor Hope Creek with cooling tower and associated plume (left) (by permission of
Salem Power Plant)
Radioactive effluents originate from primary circuit let-down, leakages and floor drains in active areas. As at several US plants, there is no mention of effluents from any active laundry. This suggests that potentially contaminated clothing from active plant areas is sent off-site to a specialised contractor (a practice also adopted at some UK nuclear sites). Chemicals present in radioactive effluents include boric acid, hydrazine and chromate (which remains in use as a corrosion inhibitor in some plant systems). There may also be intermittent discharges of chemicals from decontamination of plant areas, laboratory chemicals, and general housekeeping and cleaning products. The waste systems ensure these effluents are segregated at source and treated by appropriate methods (primarily for removal of dissolved and particulate radionuclides) before being directed to hold-up tanks and then to an internal plant discharge (regulated separately by the NRC). They are then directed to the main cooling water flow path for dilution; after monitoring and recording, they then pass to the Delaware River.
Chemical discharges from nuclear power stations (Annex) 29
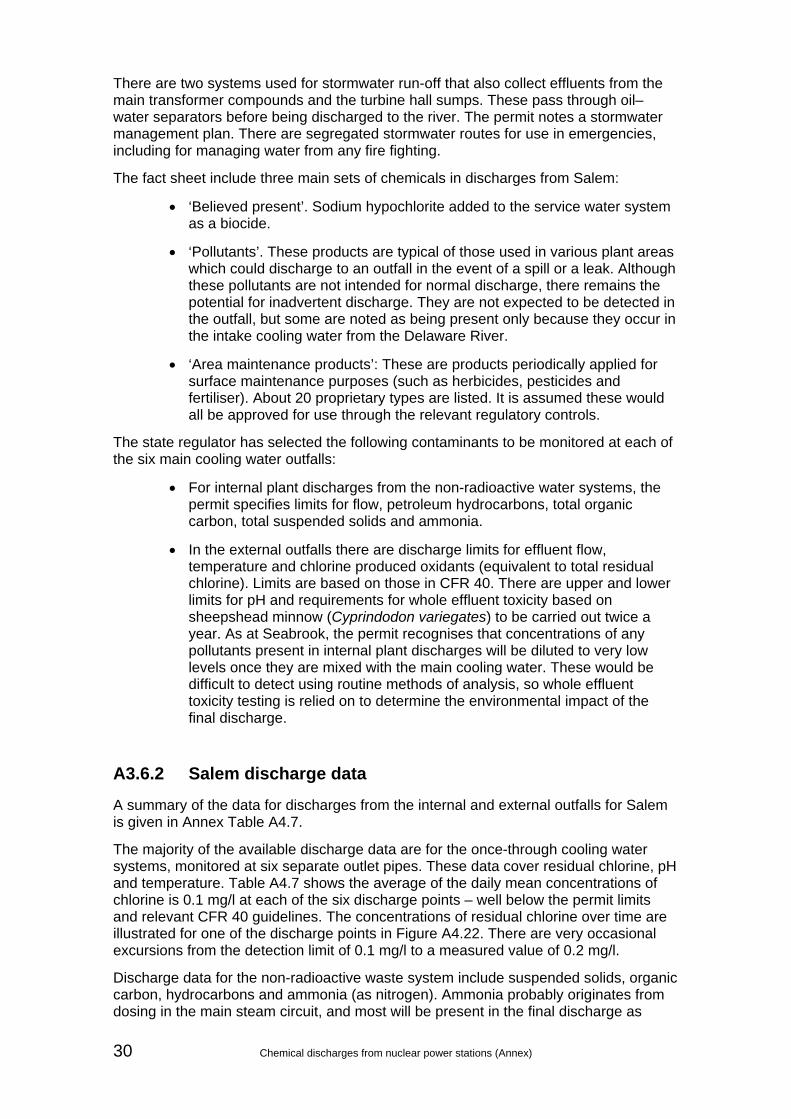
There are two systems used for stormwater run-off that also collect effluents from the main transformer compounds and the turbine hall sumps. These pass through oil–water separators before being discharged to the river. The permit notes a stormwater management plan. There are segregated stormwater routes for use in emergencies, including for managing water from any fire fighting.
The fact sheet include three main sets of chemicals in discharges from Salem:
• ‘Believed present’. Sodium hypochlorite added to the service water system as a biocide.
• ‘Pollutants’. These products are typical of those used in various plant areas which could discharge to an outfall in the event of a spill or a leak. Although these pollutants are not intended for normal discharge, there remains the potential for inadvertent discharge. They are not expected to be detected in the outfall, but some are noted as being present only because they occur in the intake cooling water from the Delaware River.
• ‘Area maintenance products’: These are products periodically applied for surface maintenance purposes (such as herbicides, pesticides and fertiliser). About 20 proprietary types are listed. It is assumed these would all be approved for use through the relevant regulatory controls.
The state regulator has selected the following contaminants to be monitored at each of the six main cooling water outfalls:
• For internal plant discharges from the non-radioactive water systems, the permit specifies limits for flow, petroleum hydrocarbons, total organic carbon, total suspended solids and ammonia.
• In the external outfalls there are discharge limits for effluent flow, temperature and chlorine produced oxidants (equivalent to total residual chlorine). Limits are based on those in CFR 40. There are upper and lower limits for pH and requirements for whole effluent toxicity based on sheepshead minnow (Cyprindodon variegates) to be carried out twice a year. As at Seabrook, the permit recognises that concentrations of any pollutants present in internal plant discharges will be diluted to very low levels once they are mixed with the main cooling water. These would be difficult to detect using routine methods of analysis, so whole effluent toxicity testing is relied on to determine the environmental impact of the final discharge.
A3.6.2 Salem discharge data
A summary of the data for discharges from the internal and external outfalls for Salem is given in Annex Table A4.7.
The majority of the available discharge data are for the once-through cooling water systems, monitored at six separate outlet pipes. These data cover residual chlorine, pH and temperature. Table A4.7 shows the average of the daily mean concentrations of chlorine is 0.1 mg/l at each of the six discharge points – well below the permit limits and relevant CFR 40 guidelines. The concentrations of residual chlorine over time are illustrated for one of the discharge points in Figure A4.22. There are very occasional excursions from the detection limit of 0.1 mg/l to a measured value of 0.2 mg/l.
Discharge data for the non-radioactive waste system include suspended solids, organic carbon, hydrocarbons and ammonia (as nitrogen). Ammonia probably originates from dosing in the main steam circuit, and most will be present in the final discharge as
30 Chemical discharges from nuclear power stations (Annex)

ammonium sulphate rather than free ammonia. A plot over time of ammonia (Figure A4.23, probably as total nitrogen) shows a downward trend after 1999, although there are no operational data to explain this. Concentrations of total hydrocarbons (oil and grease) in this outfall (Figure A4.24) fluctuate up to 2008; more recently they are constantly at 5 mg/l, probably reflecting a change in the method of analysis with values reported at the detection limit. The plot for maximum total organic carbon (Figure A4.25) shows a variable trend that is not related to the levels of hydrocarbons in the previous figure.
Data for surface water discharges from the site drains include measurements of oil and grease and total organic carbon. The maximum concentrations of oil and grease from the yard drains (Figure A4.26) are of the order of 2–3 mg/l with a few excursions to about 20 mg/l (close to CFR 40 limit of 20 mg/l). They then show a constant value of less than 5 mg/l (shown in the plot as 5 mg/l), reflecting a change in analysis method. Effluents from the yard drains would be expected to contain the highest levels of oil and grease and the levels reported in the final discharge indicate the high efficiency of separation of oil and water achieved by the oil–water separators. The concentration of total organic carbon in this discharge (Figure A4.27) shows no correlation with oil and grease but probably significant contributions from other types of organic materials normally present in run-off such as biological debris.
Suspended solids in the internal outfalls are below CFR 40 guidelines of 100 mg/l (daily maximum) or 30 mg/l (monthly average).
A3.7 San Onofre Units 2 and 3 (coastal site)
A3.7.1 San Onofre permit and chemical background data
San Onofre Nuclear Generating Station consists of three nuclear reactors, Units 1, 2 and 3, located next to the San Onofre state beach, south of San Clemente, California. Unit 1 was permanently shutdown in November 1992 for decommissioning. Unit 2 has a net capacity of 1,070 MW(e) and operates under its own permit CA0108073. Unit 3 has a net capacity of 1,080 MW(e) and operates under a separate permit CA0108181. The effluent limitations, provisions and prohibitions in the NPDES permit for Units 2 and 3 are in all important respects identical. A separate permit covers small discharges associated with the decommissioning of Unit 1 (mainly from plant cooling and domestic systems) and is not discussed further. The site is regulated by the California Environmental Protection Agency. The latest permits are dated June 2005 and supported by a permit fact sheet (covering both sites).
Units 2 and 3 are both of Combustion Engineering design and use two heat transfer loops and steam generators. Both use once-through cooling for the main steam circuits drawn through culverts from intake structures set about 900 m offshore. The discharge culverts are positioned 1 km apart to ensure maximum mixing of discharges with the ocean water and to avoid thermal interference between them. Chlorination of the cooling water systems is used to control biofouling, although the permits also allow for possible use of bromine or other oxidising biocides. The cooling water flow is about 4.5 million m3 per day for each plant.
Units 2 and 3 have identical low volume discharge internal outfalls. Some of these discharges are periodic and only occur during, for example, maintenance outages. The internal outfalls are listed below, with the percentage volume the internal outfalls make to the final cooling water outfall in brackets:
Chemical discharges from nuclear power stations (Annex) 31

• Processing of effluents from the steam generator blowdown lines (5 per cent).
• Discharges from a demineraliser plant used to produce purified make-up water from the reactor and steam circuits (6 per cent).
• Effluents from the radioactive waste system. There is no information on whether this includes an evaporator for effluents containing boric acid or whether these are simply treated to remove radioactive material and then discharged (3 per cent).
• Effluents from the condensate polishing plant (16 per cent).
• Effluents from metal cleaning and future cutting of concrete (to cover future decommissioning work). Metal cleaning is not described in detail but presumably includes decontamination of the steam generators and wastes from decontamination of plant components (such as pumps and valves) in a workshop (1 per cent).
• Yard drains and dewatering of low lying sumps and drains around the site.
• Hot-well overboard and plant drains.
• Intake structure sump.
All are mixed with the main cooling water outfall prior to final discharge. The once-through cooling water makes up 69 per cent of the total volume. Parameters and limits specified include:
• For the individual internal outfalls: pH, suspended solids, oil and grease, copper and iron. Limits are generally consistent with those in CFR 40.
• For internal plant outfalls there are also mass limits for a wider range of parameters than in CFR 40. These are grouped under two main headings ‘For the protection of marine aquatic life’ and ‘For the protection of human health (carcinogens and non-carcinogens)’. The list covers trace metals, herbicides, phenols, volatile organic hydrocarbons and semi-volatile hydrocarbons such as polyaromatic hydrocarbons (PAHs).
• For discharges of the main cooling water flows from each plant, the list of parameters and limits also includes whole effluent chronic toxicity (using sheepshead minnow) and total residual chlorine.
• For the final discharge there are further limits on a wide range of parameters, again under the main headings of ‘For the protection of marine aquatic life’ and ‘For protection of human health (carcinogens and non-carcinogens)’ but based on concentration limits rather than mass discharges (that are applied to the internal outfalls). The range of parameters specified is wider than for other US plants and reflects the specific California state requirements for meeting offshore water quality objectives. The limits are calculated using the following relationship:
Ce = Co + Dm (Co – Cs)
where:
Ce is the limit for each parameter in the cooling water discharge
Co is the water quality limit that must be achieved after allowing for dilution.
Cs is the background concentration of the pollutant in Pacific seawater
32 Chemical discharges from nuclear power stations (Annex)

Dm is the dilution factor.
• Discharge prohibitions. This contains generic information banning discharges of polychlorinated biphenyls (PCBs), chemical or biological warfare agents or high-level radioactive waste or sludge.
A3.7.2 San Onofre Units 2 and 3 discharge data
Summaries of the data from the USEPA website for Units 2 and 3 are tabulated in Annex Tables A4.8 and A4.9 respectively.
Data for discharges from the main cooling water systems are similar for both plants. Daily mean values of total residual chlorine concentrations in both outfalls are about 8 µg/l which is compliant with achieving the water quality objective of 8 µg/l and below the limit in the permit (six-month mean of 22 µg/l). Daily maximum values for each plant are about 90 µg/l, which is marginally above the daily maximum permit limit of 88 µg/l. Figures A4.28 and A4.31 suggest that that chlorine dosing at both plants is intermittent and therefore in accordance with the requirement to carry out dosing only when necessary. The peak maximum values are above the limits in the permit, but they represent chlorination being carried out for only fractions of a day so do not cause daily and monthly average limits to be exceeded.
Maximum pH in the outfalls from both plants (Figures A4.29 and A4.32) shows the usual consistent value around 8.0, within the range specified in the permit of 6.0 to 9.0.
Table A3.4 provides a summary of concentrations of selected metals, with the permit limits and background levels against which these limits were established to allow for mixing and dilution. Missing background values for some of these metals were not provided in the permit or fact sheet.
Table A3.4 Trace metal data (µg/l) for San Onofre Units 2 and 3 once through cooling water (and comparison with Comanche Peak)
As Cd Cr Cu CN- Pb Hg Ni Se Zn Limit in discharge 850 110 220 310 110 220 4.4 550 1,700 2,100
Background 3 n/s n/s 2 n/s n/s 0.0005 n/s n/s 8 Mean in Unit 2 discharge
53 4 12 16 10 10 0.5 24 39 17
Mean in Unit 3 discharge
55 4 11 16 10 8 0.4 26 41 15
Data for discharge from Comanche Peak
<10 <1 <5 <10 <20 <5 <0.2 <10 <5 ~10
Note n/s = not specified Table A3.4 suggests that relatively high concentrations are allowed for some metals in the final cooling water discharge. Dilution in the mixing zone around the outlet diffuser is relied on to reduce these so that they do not impact on the background
Chemical discharges from nuclear power stations (Annex) 33

concentrations in the surrounding ocean water. However, the table shows that, even with the conservative method of treating the ‘not detected’ values as being at the detection limit, the average concentrations of the metals in the final cooling water discharge from Units 2 and 3 are well below the end-of-pipe limits in force.
Table A3.4 also includes available data for the cooling water outfall from Comanche Peak (taken from Table A4.5). The differences in reported concentrations may be due to some real differences but shortcomings and errors in sampling and analysis must also be considered likely, especially in view of the different detection limits that are implied in the two data sets.
San Onofre Units 2 and 3 both report hydrazine concentrations of about 30–60 µg/l in the final discharges. This may originate from continuous low level chemical dosing, but as only a couple of data points are given, is more likely to represent specific sampling and monitoring associated with intermittent discharges of effluents containing higher concentrations of hydrazine used for the wet lay-up of plant systems during maintenance. In contrast to several other US plants covered in the survey, the plant permits and fact sheets for San Onofre make no specific mention of issues or regulatory concerns over the discharge of this hydrazine or of any procedures to reduce discharges. There are no limits for hydrazine in the permits for the two units.
For the other plant internal outfalls in San Onofre Units 2 and 3, data from the USEPA website are confined to CFR 40 parameters – mainly oil and grease. Concentrations are below the relevant plant limits or CFR 40 guidance values. An example plot of maximum concentrations of oil and grease in the outfall from the waste system in Unit 2 (Figure A4.30) shows there is generally no pattern in discharges over time.
A3.8 Diablo Canyon (coastal site)
A3.8.1 Diablo Canyon permit and chemical background data
Diablo Canyon Power is situated at Avila Beach on the Pacific coast, San Luis Obispo County, California. The plant has two Westinghouse-designed four-loop pressurised-water nuclear reactors, each of about 1,100 MW(e). The plants are covered by a single NPDES permit, CA0003751 dated July 2003. The site is regulated by the California Environmental Protection Agency.
34 Chemical discharges from nuclear power stations (Annex)

Figure A3.6 Diablo Canyon showing the cooling water intake cove and discharge in the background (by permission of California EPA)
Both plants use once-through cooling water systems with water drawn from the Pacific Ocean at up to a total of about 10 million m3 per day via an intake cove (shown in the foreground of Figure A3.6) and then discharged directly to the ocean via a separate point (in the background of Figure A3.6). Sodium hypochlorite is used to control biofouling in combination with sodium bromide; dosing is limited to two hours per day per unit. The concentration at the condenser inlet is maintained at 0.2 mg/l as total residual oxidant so that, at the final cooling water outfall, total residual chlorine always remains below the CFR 40 guideline of 0.2 mg/l.
The permit contains extensive information on the engineering and management procedures used to minimise entrainment and thermal impacts on marine biota due to the once-through cooling water system. The commentary describes options such as reduced cooling water flows or adding cooling towers, all of which are rejected on the basis of BAT-type arguments. These include environmental impacts, cost, maintenance requirements and potential additional chemical discharges.
The discharge route for the main cooling water also serves as the discharge route for a range of internal plant outfalls. These correspond to the usual PWR waste systems and include:
• service and auxiliary plant cooling water (continuous discharge);
• liquid radioactive waste system (batch discharge);
• turbine building sump (intermittent discharge);
• effluents from the regeneration of the ion exchange resins in the condensate polishing plant (intermittent discharge);
• condensate pumps and other condensate plant systems (batch or intermittent discharge);
• steam generator blowdown (intermittent and representing treated effluent that cannot be returned to the main cooling water circuit);
• sanitary and other waste water systems;
Chemical discharges from nuclear power stations (Annex) 35

• reverse osmosis units (used to treat seawater for make-up and feedwater to the plant systems).
The permit describes a set of four generic groups of pollutants that could occur in each of the discharges from these plant systems and areas:
• Chemicals used in the feed water system and/or the steam generators may be present in this discharge due to operation, testing and maintenance activities. They include:
- corrosion inhibitors such as neutralising amines, pH control agents such as ethanolamine or dimethylamine, lithium hydroxide and ammonia. Also advanced secondary circuit amines such as 3-methoxypropyl amine, 2-amino, 2-methyl propanol, or 5-aminopentanol;
- reagents from the regeneration of the ion exchange resins (sulphuric acid and sodium hydroxide);
- oxygen scavengers such as hydrazine, or hydrazine substitutes with lower toxicity such as diethylhydroxylamine and carbohydrazide;
• Chemicals used in metal cleaning activities during maintenance for the removal of scale and sludge or chelating metals. In particular those used during chemical cleaning of the steam generators. These include EDTA, triethanolamine, ethanoldiamine, ascorbic acid, dipyridyl, phenanthroline and methanol.
• Discharges due to maintenance of the service cooling water systems and including the biocides gluteraldehyde (up to 250 mg/l) and isothiazolin (at up to 6 mg/l) and also suspended solids and oil and grease.
• Other miscellaneous chemicals used during maintenance or in internal plant systems:
- corrosion inhibitors – potassium molybdate, potassium nitrite, tolytriazole, potassium tetraborate, sodium hydroxide, potassium dichromate, potassium hydroxide and boric acid;
- biocide agents possibly including glutaraldehyde and isothiazolin;
- dispersants such as polyglycol and acrylic acids, and sulphonated or carboxylated polymers;
- antifoaming agents including polyglycol ester (used in conjunction with biocides).
However, permit limits for effluents from the internal outfalls are confined to the much narrower suite represented by CFR 40, that is, oil and grease, suspended solids, copper and iron (but not chromium or zinc).
The internal outfalls discharge into the main cooling water outfall either prior to or after the cooling water has passed through the main condensers. Discharging prior to cooling water entering the condensers may be either for operational convenience or designed to provide some additional biocidal effect over and above that achieved by chlorination alone.
The permit states that under normal operating conditions only sodium hypochlorite, sodium bromide, sodium bisulphite and surfactants will be routinely present in the main cooling water outfall at detectable concentrations. Sodium bisulphite and surfactants are not noted at other US plants using once-through seawater cooling (although there
36 Chemical discharges from nuclear power stations (Annex)
are limits for detergents containing surfactants in permits for the French PWR plants). The reason for adding sodium bisulphate is not described.
Limits for parameters in discharges of once-through cooling water cover the same generic suites as applied at San Onofre, that is, covering those limited ‘For the protection of Marine Aquatic Life’ and ‘For the protection of Human Health (Non-carcinogens and carcinogens)’. Together they including for a wide range of metals, volatile hydrocarbons and semi-volatile hydrocarbons mostly based on the USEPA lists of priority pollutants. There are also requirements to avoid visible films of oil, a pH range of 7.0–8.5, and no effects on the colour or odour of the receiving water.
The permit for Diablo Canyon suggests that the analyses are carried out at the inlet and outlet of the cooling water system; the former provides baseline values against which impacts of the outflow can be estimated against permit limits (much in the manner of Sizewell).
A3.8.2 Diablo Canyon discharge data
A summary of the data from the USEPA website for Diablo Canyon is given in Annex Table A4.10.
Figure A4.33 shows mean total residual chlorine over time. It has some data gaps that might reflect seasonal changes with periods when chlorine dosing was not required (and in accordance with any chlorine minimisation programme in force at the plant). The average for the daily maximum values is 0.06 mg/l; all the values (bar a single one of 0.21 mg/l) are below the permit limit of 0.2 mg/l instantaneous maximum for total residual chlorine. The average of the daily means (0.02 mg/l) is well below the CFR 40 guidance value. pH values are around 7.8–7.9, marginally closer to neutral than in the discharges from some other US PWR plants included in the survey (where pH values are more routinely towards 8–9 such as at San Onofre).
Figures A4.34 to A4.37 show plots over time of maximum concentrations of trace metals (arsenic, cadmium, lead and nickel) in the discharge from the once-through cooling water system. The plots include the baseline values established during sampling programmes outside the area where the cooling water is discharged. The data suggest that, in passing through the main cooling water system, there is negligible addition of arsenic and only very small additions of cadmium, lead and nickel (of the order of 0.02 mg/l for each metal). Additions of nickel might come from alloy steels in the cooling circuit, but lead and cadmium would probably only come from leaching of impurities. However, it is important to stress that some of the data plotted assume non-detected values at the detection limit. Separate information in the 2009 annual report for the site (PG&E Letter DCL-2009-507 dated 27 February 2009) suggests that, in the majority of cases, the concentrations of chromium, copper, nickel and zinc in the main cooling water discharge are below the analytical detection limit of 0.01 mg/l.
Figures A4.38 to A4.41 show plots over time for boron, copper, mercury and zinc in discharges from the internal outfall serving the liquid radioactive waste treatment system. Boron concentrations are between 500 and 2,500 mg/l, consistent with treatment then discharge of borated reactor coolant, rather than recycling. The pattern of discharges suggests they are stored then discharged annually. Lithium in this discharge (0.078 mg/l) will also originate from the reactor coolant. The trace metals with the highest concentrations in this internal liquid radioactive waste treatment system discharge are those that are more abundant in plant components or more soluble (see Table A3.5). Their concentrations show no pattern over time.
Chemical discharges from nuclear power stations (Annex) 37

Figures A4.42 to A4.46 show plots over time of chromium, copper, mercury, nickel and zinc in discharges produced during the regeneration of the ion exchange resins in the condensate polishing plant.
Table A3.5 compares the average trace metals reported in discharges from the internal outfalls for Diablo Canyon taken from Annex Table 4.10.
Table A3.5 Trace metal data (mg/l) for Diablo Canyon
As Cd Cu Cr Pb Hg Ni Zn Liquid radioactive waste
n/d 0.0020 0.019 0.0033 0.010 0.00058 0.017 0.21
Turbine sump n/d 0.0010 0.031 0.024 0.048 0.00027 0.029 0.043
Condensate demineraliser n/d 0.0046 0.080 0.022 0.030 0.025 0.026 0.044
Steam generator blowdown
n/d 0.0011 0.072 0.0030 0.0020 0.00060 0.047 0.036
Sewage 1.5 0.74 0.3 0.2 0.3 0.0034 8.4 14.6 Mercury is notably higher in the waste from the regeneration of the ion exchange resins in the condensate polishing plant. This may be due to mercury being present as an impurity in chemicals used in the regeneration process, especially in caustic soda (although manufacture of this in mercury cells is now largely discontinued). Zinc appears to be higher in the effluent from the liquid radioactive waste system, possibly due to leaching from galvanised pipework or from impurities in chemical additives.
The averages of the daily maximum concentrations of oil and grease in discharges from the various internal plant outfalls range up to 11 mg/l (most around 5.0 mg/l) and are within the permit limit of 20 mg/l daily instantaneous maximum. The averages of the daily maximum concentrations of total suspended solids in the internal outfalls range from 10 to about 40 mg/l, within the permit limit of 100 mg/l daily instantaneous maximum.
Several incidents involving releases of oil or problems with the operation of oil water separators were reported by Diablo Canyon in 2008. These included aqueous effluents by-passing the oil-water separators, the release of hydraulic oil from a gear box on an electric motor and the release of hydrocarbon oils due to a fire in a electrical transformer (there was no mention of whether these were PCB-based).
A3.9 Millstone (coastal site)
A3.9.1 Millstone permit and chemical background data
Millstone nuclear power station is located in Waterford, Connecticut. There are three reactors on this site, Units 2 and 3 are operational while Unit 1 is being decommissioned. Unit 2 was built in the 1970s. It is a Combustion Engineering design, uses two steam generators and has an output of 870 MW(e). Unit 3 is a Westinghouse four-loop design with an output of 1,150 MW(e). The site is regulated by the Connecticut Department of Environmental Protection. Discharges from Unit 2, Unit 3
38 Chemical discharges from nuclear power stations (Annex)

and from the decommissioning of Unit 1 are all regulated under a single permit (CT0003263).
Both operational plants use once-through cooling water drawn from and then returned to Niantic Bay (which is connected to Long Island Sound and the Atlantic Ocean). Total cooling water intake for both units is about 8.4 million m3 per day. Chlorination is used to control biofouling but is limited to one condenser per day for two hours. The permit and fact sheet describe precautions to minimise the entrainment of larger fish on the intakes to the cooling water culverts. There is less emphasis on thermal impacts of the discharge because the tidal flow gives a rapid dispersion of the thermal load.
The permit covers the main cooling water discharge and a series of separate internal wastewater outfalls. Effluents from some of the internal plant outfalls flow into the main cooling water flow but others follow a separate external route to the Niantic Bay (about 1.9 million m3 per day). These include the intake screen backwash water, pump seal and lubrication systems, process waste, steam generator blowdown, cleaning wastes, stormwater and fire suppression water.
The permit classifies the internal and external outfalls and discharges in terms of treatments that are applied prior to final discharge. In summary, the treatments are (in order of increasing complexity):
• No treatment: No treatments are applied to the once-through cooling water or to effluents coming from some internal plant discharges, either because they are intermittent and of low volume or because of low inherent toxicity and/or the effects of dilution with main cooling water discharges prior to their reaching the environment.
• Oil–water separators: Used for stormwater and also turbine hall waters and those from diesel generators and oil storage compounds.
• Settling in a fractionation tank: Used for water from flushing the fire systems (if used).
• Hydrogen peroxide treatment: Used to treat water from the wet lay-up of plant systems that contains hydrazine (discussed in more detail below).
• Demineralisation, filtration, charcoal adsorption, coagulation, pH control, batch discharge. Used for waters from the radiological controlled areas (these are standard treatments in all PWR radioactive waste treatment systems). There is no specific mention of any evaporation of let-down from the primary circuit. However, the specification for analysis of the discharges includes a detection limit of 1 mg/l boron; this implies discharge of at least some portion of the primary circuit let-down (and other sources of borated coolant) rather than recovery and reuse.
• Filtration through various media (that remove suspended solids with different particle sizes), pH control, demineralisation by ion exchange, oxygenation using air sparging or addition of hydrogen peroxide: Used to treat waste water from a range of sources, including the effluents produced during the regeneration of the ion exchange units in the condensate polishing plants.
• Treatments using smaller portable treatment skids. These are brought onto site at intervals by external contractors and used to treat the more problematical acids and complexing agents that arise during periodic chemical cleaning of the steam generators. A separate portable treatment skid is used to treat small volumes of effluents that originate from decommissioning of the Unit 1 plant.
Chemical discharges from nuclear power stations (Annex) 39

An overview of the parameters and limits applied for the plant internal and external outfalls is shown in Table A3.6.
Table A3.6 Parameters included in the permit for Millstone 1
Parameter Typical limits
Typical instantaneous limit Comments
Invertebrate toxicity
n/s NOAEL 2 >100%
Vertebrate toxicity
n/s As above
Free available chlorine
Dosing limited to 2 hours/day
0.25 mg/l
Total residual chlorine
n/s 0.1 mg/l (more stringent than CFR 40 limit)
Specified for main cooling water outfall (containing small volumes of effluents from internal plant outfalls.
pH 6–9 6–9 Applied across all outfalls. Turbidity Monitor only Monitor only Applied across most outfalls. Suspended solids 20 mg/l 30 mg/l Applied across most outfalls
and more stringent than CFR 40.
Oil and grease 10–15 mg/l 30 mg/l Applied across most outfalls. Ethanolamine Not specified Monitor only Applied to outfalls from
secondary plant and condensate polishing plant.
Halomethanes (CFCs)
Monitor only Monitor only Applied to several outfalls (source not specified).
Hydrazine Not specified Varies across outfalls and up to 125 mg/l
Limit varies across several internal plant outfalls. For details see text below.
Boron Monitor only Monitor only A minimum analysis limit of 1 mg/l is specified.
Copper 1 mg/l 1.5 mg/l Iron 1 mg/l 1.5 mg/l Lead 0.1–0.5 mg/l 0.75 mg/l Cadmium 0.1–0.5 mg/l 0.75 mg/l Nickel 1–2 mg/l n/s
Most are specified with limits in only a single internal outfall consisting of the effluents from chemical cleaning of the steam generators that appear every few years only . Limits consistent with CFR 40 values.
Zinc 1–2 mg/l 1 to 3 mg/l Varies across routes. Molybdenum Not specified Monitored during drainage of
closed cooling system only if molybdenum is being used as a corrosion inhibitor.
Ammonia Monitor only Monitor only Nitrate Monitor only Monitor only Nitrite Monitor only Monitor only Kjeldahl nitrogen Monitor only Monitor only
Most nitrogen species are specified for internal outfalls serving the secondary steam circuit and condensate polishing plant.
Notes: 1This is a summary only of the permit data for the Millstone Plant. 2 No observable acute effect level
40 Chemical discharges from nuclear power stations (Annex)

There are requirements to ensure the final cooling water discharges to Niantic Bay do not produce films of oil or significantly alter the background colour, turbidity, taste, odour or levels of coliform bacteria in the receiving water or reduce the dissolved oxygen content of the receiving waters to below 6.0 mg/l. These are consistent with general requirements applying to other US PWR plants.
The permit for Millstone makes special reference to hazards to workers due to the use and handling of hydrazine and minimising impacts on the environment due to its discharge. This is because of its toxicity and because it is a suspect carcinogen and therefore included in relevant lists prepared by the US National Institute for Occupational Safety and Health (NIOSH) and the Occupational Safety and Health Administration (OSHA).
Most of the hydrazine in the Millstone plant is stated to be used for low level and continuous dosing in the main steam circuit. It appears in discharges of blowdown from the steam generators if they cannot be reused in the main steam circuit. Higher levels of hydrazine (up to 150 mg/l) are used in the wet lay-up of plant systems and appear in discharges when these are drained down and returned to service. These effluents are mostly discharged into the sumps serving the condensate polishing plant (normally used for neutralisation of caustic and acid from the ion exchange regeneration process) and are then monitored and discharged.
In response to the hazards due to hydrazine from use in these systems and its discharge, the Millstone plant operators have initiated a comprehensive hydrazine usage minimisation and treatment programme. The options considered for reducing use at source and then treating the discharges include:
• Substituting hydrazine with molybdenum-based chemicals for controlling corrosion. These, however, pose their own environmental hazards and especially cost issues (due to the greatly increased cost of molybdenum in recent years).
• Use of other proprietary organic reagents for controlling corrosion. Those considered by Millstone in their programme include methoxypropylamine (Conquor 3585), dimethylamine (Bulab 8007) and dimethyldithiocarbamate (Bulab 6013).
• Reuse of wet lay-up solutions containing hydrazine. However, this requires extensive storage of large volumes of water and during storage the hydrazine decomposes and losses its ability to remove oxygen and reduce corrosion. The stored solutions are then not effective if reused.
• Improved operational control over leakage of air into systems where oxygen needs to be minimised. Only small amounts of hydrazine then need to be added to effect final mopping up of the small levels of oxygen that remain.
• More precise control on dosing to minimise initial addition of hydrazine.
• Using hydrogen peroxide in the condensate polishing plant neutralisation sumps to destroy the hydrazine prior to discharge.
Destruction of hydrazine in the sumps using hydrogen peroxide has proved the most effective method of reducing the concentrations of hydrazine in the final effluent by at least 50 per cent prior to discharge. This has allowed the limits in the permit for the discharges from this internal outfall to be reduced from 75 mg/l to 37.5 mg/l prior to their reaching the final cooling water outfall, although retaining an upper instantaneous limit of 125 mg/l for occasional discharges from wet lay-up of plant systems.
Chemical discharges from nuclear power stations (Annex) 41

Millstone is also a plant where the operators (in conjunction with suppliers) have carried out extensive investigations into the use of alternative and new resins in the deep bed demineralisers in the condensate polishing plant. Being a coastal site and of older design, the secondary plant is fitted with large deep bed demineralisers capable of accommodating 100 per cent of the flow of condensate from the main condensers prior to this being returned via the feedtrain and then back to the steam generators. There are seven vessels on each unit with total volumes of resin in each vessel of about 6 m3, totalling about 72 m3 of ion exchange resins. These originally consisted of standard resins used in most PWRs, but required frequent regeneration. In addition, as they were mixed beds, the cation and anion resins in each vessel required separation prior to regeneration (this is achieved by backwashing that separates the cation and anion resins on the basis of their different densities). Since about 2008 the plant has moved to the use of ‘ultra low chloride and high purity’ cation and anion resins (Yarnell 2008). This has had the following beneficial effects:
• lower levels of impurities leached from the new forms of resins;
• reduction in levels of iron in the feedwater (that can otherwise be carried forward and accumulate as sludge in the steam generators);
• longer time between regeneration cycles and much longer overall resin life (specifically noted as reducing chemical discharges).
A3.9.2 Millstone discharge data
A summary of the data from the USEPA web site for Millstone is given in Annex Table A4.11. It was not possible to interpret the data fully, because while data points for raw sewage effluent were filtered out during data processing, some results still showed concentrations of certain parameters that suggested sanitary or foul water effluents – despite being labelled as ‘gross effluent discharge’.
The averages of the daily maximum values for free available chlorine and total residual oxidants in the main cooling water outfall (0.09 mg/l and 0.045 mg/l respectively) are both well below relevant CFR 40 and permit limits. Figure A4.47 shows rather irregular discharges of chlorine over time, although with some annual peaks that may represent summer periods requiring increased dosing.
The maximum concentration of zinc (16.5 mg/l) appears anomalous and the plot over time (Figure A4.48) suggests inclusion of intermittent discharges of perhaps sewage or other foul water sources containing high levels of zinc (although the source for zinc in these may also be potentially unknown).
There are a range of data showing trends for parameters in internal outfalls and final discharges. Main features of the plots presented in the Annex are summarised below:
• The outfall serving the non-radioactive contaminated floor drains appears to be chlorinated; concentrations of chlorine have fallen over time (Figure A4.49). Figure A4.50 shows concentrations of copper in this internal outfall are all around the detection limit of 0.02 mg/l. Figure A4.51 shows a consistent downward trend in concentrations of zinc in this outfall from about 0.5 mg/l in the mid-1990s to more recent values of below 0.1 mg/l. This may be due to passivation of galvanised pipework or heat exchangers (that, with use, become coated in an insoluble layer of zinc carbonate or zinc oxide and as seen in the discharges from Byron, Figure A4.16).
• Figure A4.52 shows that there are occasional high levels of hydrazine up to 70 mg/l in the lines from the steam generator blowdown prior to them
42 Chemical discharges from nuclear power stations (Annex)

reaching the blowdown treatment system or discharge tanks. They are accompanied by higher than usual levels of iron and suspended solids (Figures A4.53 and A4.54). There was no separate information available on discharges from the condensate polishing plant treatment sumps, although these are the main source of discharges containing hydrazine and the focus of the treatment of effluents containing hydrazine (using hydrogen peroxide).
Millstone is one of the few plants that reports on discharges of lithium, which is used in the primary reactor circuit to control the pH of the coolant. The data are given only for its presence in the blowdown from the steam generators, where it may appear and concentrate due to very small leakages that always occur from the primary to secondary circuits of PWR plants. The concentrations reported are very low (less than 0.06 mg/l, Figure A4.55). The monitoring may be carried out to quantify leakage of primary coolant through the steam generators and into the secondary circuit. However, measurement of radioactivity in the steam circuit (especially of tritium) would be expected to give a more sensitive indication of leakage, and is the more routine method of measuring primary to secondary side leaks through the steam generator U-tubes.
A3.10 St Lucie (coastal site)
A3.10.1 Permit and background data
St Lucie is a twin reactor plant situated on Hutchinson Island, near Fort Peirce in Florida. Both reactors are Combustion Engineering design with capacities of about 840 MW(e) each. The NPDES reference is FL 0002208 and covers both plants. The site is regulated by the Florida Department of Environmental Protection. The latest permit available from the USEPA website is dated December 2005. Unit 1 came on line in 1976 and due to operate until 2036. Unit 2 came on line in 1983 and is due to operate until 2043.
Both plants on the site use once-through seawater cooling from the Atlantic Ocean which is drawn into the plants via a single large canal (about 100 m wide). The cooling water is discharged through a second canal, which is located at a sufficient distance from the intake canal to avoid thermal effects between them. The plants use chlorination to control biofouling.
The permit contains limits for a relatively small set of five internal plant outfalls which then discharge to the main once-through cooling water system. The limits are consistent with those given in CFR 40 and summarised in Table A3.7.
Table A3.7 Internal outfalls and limits for St Lucie
Internal outfalls and parameters Daily average Daily maximum Liquid radioactive waste pH 8.0 (maximum value) Oil and grease 15.0 mg/l 20.0 mg/l Suspended solids 30.0 mg/l 100.0 mg/l Steam generator blowdown pH 8.0 (maximum value) Oil and grease 15.0 mg/l 20.0 mg/l
Chemical discharges from nuclear power stations (Annex) 43

Internal outfalls and parameters Daily average Daily maximum Suspended solids Boron Not specified 4.0 mg/l Hydrazine Not specified 0.3 mg/l Dimethylamine Not specified Monitor and report Carbohydrazide1 Not specified Monitor and report Oil storage area Suspended solids Monitor and report Monitor and report Oil and grease Monitor and report Monitor and report Stormwater and evaporation basin Oil and grease Monitor and report Monitor and report Suspended solids Monitor and report Monitor and report Notes: 1 Carbohydrazide is a volatile oxygen scavenger which contributes no solids
to the systems being treated, and reacts readily with oxygen at low temperatures and pressures. It is an alternative to hydrazine and used mainly in outages for the wet lay-up of systems when they are out-of-service.
Limits and monitoring requirements for the main once-through cooling water discharge focus on the use of chlorine for control of biofouling and therefore cover:
• Total residual oxidants. The instantaneous limit is 0.1 mg/l (with no daily average). This is slightly more stringent than the CFR 40 guideline.
• Free available oxidants. The daily average is given as 0.2 mg/l with an instantaneous maximum of 0.5 mg/l (consistent with CFR 40 guidance for free available chlorine). There are also limits for the time over which residual oxidants may be discharged in each day.
• Results from whole effluent toxicity testing. Once the internal outfalls pass into the main cooling water flow, the concentrations of any of the chemicals would fall to very low levels that would be below the detection limit of most routine analysis methods. The impacts of these on the receiving water, plus those of any other additions to the once-through cooling water, are monitored via whole effluent toxicity tests (on shrimps and silverside).
The permit also allows for use of other chemicals when pre-arranged with the regulator. This includes alternative corrosion inhibitors used in copper-based systems (tolytriazole) and alternative biocides (gluteraldehyde and isothiazolin), although there is no information on systems or internal outfalls where these might appear.
A3.10.2 St Lucie discharge data
A summary of the data from the USEPA website for St Lucie is given in Annex Table A4.12.
The average of the daily mean concentration of total residual oxidants in the final cooling water flow (0.018 mg/l) and the average of the daily maximum values (0.029 mg/l) are both well below the relevant CFR 40 guideline. The average of the daily mean concentration of free available chlorine (0.062 mg/l) and the average of the daily maximum values (0.10 mg/l) are also well below the corresponding CFR 40 guidelines.
44 Chemical discharges from nuclear power stations (Annex)

A plot of the daily mean total free oxidants over time (Figure A4.56) shows some regular peaks and troughs but on a longer than seasonal basis. Results of toxicity testing on the once-through cooling water suggest 100 per cent pass rates.
The average concentrations of boron in the internal outfall serving the steam generator blowdown are very low (less than 0.001 mg/l) but, for unknown reasons, are not reported in discharges from the radioactive waste system (where discharges of boron are more likely to be expected). Figure A4.57 suggests that the discharges take place on an intermittent and approximately annual basis, consistent with accumulation and then discharge of used boric acid solutions over a 12-month fuel cycle. There are also reported low concentrations (up to 0.005 mg/l) of hydrazine and dimethylamine in the steam generator blowdown. Figure A4.58 shows that hydrazine is well below the permit limit of 0.3 mg/l (Table A3.7). The average of the maximum daily concentrations of copper (0.027 mg/l) and of iron (0.12 mg/l) in the blowdown are both below the relevant CFR40 guidelines for ‘low volume internal plant waste streams’.
Data for discharges from other internal outfalls are confined to oil and grease and total suspended solids, and are below the relevant CFR 40 guideline values.
One of the permit revision documents for St Lucie (L-2006-258 dated 27 November 2006) notes that historical and accidental releases of lubricating oils, diesel fuel and solvents in various plant areas have impacted groundwater. To address this, there is an ongoing groundwater remediation programme involving purging wells at intervals. The oily effluents from this were originally disposed of by an off-site contractor. However, due to the presence of small amounts of tritium, the small volumes of effluents from this source have had to be directed to the liquid radioactive waste system for treatment and discharge. Although not noted in the permit or fact sheet, the treatment for this presumably includes oil–water separation.
A3.11 Calvert Cliffs (estuarine site)
A3.11.1 Calvert Cliffs permit and chemical background data
The Calvert Cliffs nuclear power plant is located on the western shores of Chesapeake Bay in Lusby, Calvert County, Maryland. It consists of two units both of Combustion Engineering design with twin heat transfer loops, each with an electrical output of about 850 MW(e).
Unit 1 went into commercial service in 1975 and Unit 2 in 1977. In 2000, NRC extended the plant licence for 20 additional years after recent programmes to replace the steam generators in each plant. The latest permit available is dated May 2008. The NPDES reference is MD0002399. The site is regulated by the Maryland Department of the Environment.
The plants uses once-through cooling drawn from the Patuxenet River (12.5 million m3 per day). They have to meet performance standards for impingement mortality (minimum 80 per cent reduction) and entrainment (minimum 60 per cent reduction). Chlorination is used to control biofouling. Limits in the permit for total residual chlorine are 0.013 mg/l (daily maximum) and 0.0075 mg/l (monthly average) and are more stringent than for other US plants included in the survey.
The main internal outfalls producing aqueous effluents are listed as:
• Waste water from a reverse osmosis plant that treats the raw water for use in the reactor and steam systems. This waste stream contains impurities
Chemical discharges from nuclear power stations (Annex) 45

removed from the raw water plus small amounts of chemical additives used to stop fouling of the membranes in the reverse osmosis unit.
• Wastes from a small sewage treatment plant.
• Waste from the condensate plant and a series of pre-coat filters that are used in the plant. These filters consist of a permanent support or mesh that is coated with a slurry of the working filter medium (for example, silica or diatomaceous earth). When this becomes blocked, it is washed from the support using a backwash flow. The resultant waste slurry is then allowed to settle to produce a small volume of solid waste and a separate aqueous waste stream which is discharged. The filter itself then receives a fresh ‘pre-coat’ ready for the next cycle of operation. The pre-coat can provide ion exchange capacity as well as a filter function.
• Effluents from the steam generator blowdown.
• Effluents from the radioactive waste treatment plant.
• Back-wash that is used to clean solids and entrapped fish from the cooling water intake screens.
The total daily volume of effluents from these internal plant outfalls is given as about 1,500 m3. These are mixed with the main cooling water outflow prior before being discharged to the environment.
A3.11.2 Calvert Cliffs discharge data
A summary of the data from the USEPA website for Calvert Cliffs is given in Annex Table A4.13.
Data for the main cooling water outfall covers total residual chlorine, dissolved oxygen, copper, salinity and temperature. Calculated concentrations residual chlorine (0.1mg/l) are above the limits for the daily maximum and 30 day averages in the permit. However, Table A4.13 shows that the majority of data are actually reported as ‘less than’ values. Visual inspection of the dataset shows that the plant complies with the permit requirements for discharges of residual chlorine. The plot of maximum total residual chlorine over time (Figure A4.59) shows values reported at the detection limit. The sampling frequency suggests seasonal application of chlorine dosing. There is a step change in reported ‘less than’ values after 2004, from 0.05 mg/l to 0.1mg/l. This is probably due to a change in analysis method or detection limit.
Concentrations of dissolved oxygen in the outfalls are close to normal saturation values (8 mg/l). Parameters in the other internal plant outfalls are confined to the CFR 40 parameters of oil and grease and suspended solids. All are below the relevant guideline values and there are no trends with time.
A separate monitoring report accompanying the fact sheet for Comanche Peak (Permit 02-DP-0187 (MD0002399) dated 1 June 2004) provides data for trace metals in the discharge from the main cooling water outfall. These data are summarised in Table A3.8.
46 Chemical discharges from nuclear power stations (Annex)

Table A3.8 Trace metal data (µg/l) for Calvert Cliffs
Sb As Be Cd Cr Cu Pb Hg Ni Se Ag Zn CN-Once-through cooling water
<5 <2 <2.5 <0.5 4.7 50 <2 <0.2 8.2 130 <1 22 22
Sumps and stormwater <5 <50 <2.5 <0.5 5.4 630 6.6 <0.2 3.2 6.1 <1 32 14
The plant operators noted that a number of the results for trace metals in the final cooling water outfall are above the relevant state derived acute or chronic water quality criteria. The main points made in their commentary regarding this issue include:
• The methods for collecting the samples may not have been in accordance with best practice.
• With respect to the relatively high levels of copper, the older copper tubes in the main condensers were replaced with stainless steel ones and an improved monitoring programme found levels of copper consistently below 2 µg/l (compared with a previous average of 50 µg/l). Figure A4.60 shows measured levels of copper around the average value of 50 µg/l falling to zero around 2000, presumably the date when this change was implemented.
• Selenium is twice the chronic criterion of 71 µg/l, but the plant operators stated they were not aware of any instances where selenium is used (nor would any be expected for any PWR). The concentration is an order of magnitude higher than reported from once-through cooling at the coastal sites of San Onofre and suggests sampling or analytical issues.
• Cyanide (22 µg/l) is well above the acute and chronic criteria of 1 µg/l. The plant operators stated there are no known sources or uses of cyanide to account for this (nor would any be expected). Despite this, the regulator requested a more specific tailored programme to confirm that water quality objectives were not being challenged. Any subsequent outcomes from this programme were not available.
Table A3.8 suggests that trace metals in the main and internal outfalls are corrosion products from the main plant construction materials (chromium and nickel from steel and alloy steels), plus those from condensers, cooling systems and auxiliary plant items (copper and zinc). The sources of selenium and cyanide cannot be identified.
The cooling water trace metal data for Calvert Cliffs suggest there may be some difficulties in achieving the very stringent standards required to obtain reliable data at the low concentrations. These problems have also been encountered at other plants such as San Onofre (Annex A3.7). They are compounded by difficulties of analysing metals in the presence of the high levels of dissolved solids present in seawater.
Chemical discharges from nuclear power stations (Annex) 47

A4 Detailed data sets for the US PWR power plants
Data for the US plants were obtained mainly from the USEPA website downloaded using the ‘customised query form’. The fields on the form were as shown in Table A4.1.
Table A4.1 Data fields for the US plants downloaded from the USEPA website
Customised form fields Column heading Pcs_Dmr_Measurement.Npdes NPDES Site Reference Pcs_Dmr_Measurement.Concentration_Unit_Code Concentration code Code Expansion For Unit Code For Concentration Concentration units Pcs_Dmr_Measurement.Concentr_Avg Average daily concentrations Pcs_Dmr_Measurement.Concentr_Max Maximum daily measured
concentrations Pcs_Dmr_Measurement.Concentr_Min Minimum daily concentrations Pcs_Dmr_Measurement.Discharge_Num Discharge pipe number for
internal and external outfalls Pcs_Dmr_Measurement.Monitoring_Loc Code for type of discharge Code Expansion For Monitoring Location Details of type of discharge (gross
effluent, inflow, sewage, sludge stream)
Pcs_Dmr_Measurement.Monitoring_Period_End_Date
Date of discharge
Pcs_Dmr_Measurement.No_Discharge_Ind Code for ‘no discharge’ Code Expansion For No Discharge Indicator Details of reasons for no
discharge or no measurements being carried out.
Pcs_Dmr_Measurement.Param_Code Parameter code Code Expansion For Parameter Code Details of measurement
parameter (pH, copper etc) Code Expansion For Qncr Measurements Violation Detection Code
Indicates if not detected
Use of the customised query form produces a comma separated file (CSV). These raw data were subject to a number of sorting and filter steps in a Microsoft® Excel spreadsheet as follows:
• The data were sorted by pipe identifier to separate the different and individual internal and external outfalls. A separate part of the USEPA website for each plant was used to work out what the pipe identifiers referred to (for example, ‘cooling tower blowdown’, ‘main cooling water’, screen backwash water’). These were included in the sorted data sets. In some cases, full details of the pipe identifiers were not available.
• The initial sorted data were then sorted again to order the parameters in each discharge route alphabetically.
• Subtotals were then obtained for each parameter within each discharge route. These sub-totals included:
48 Chemical discharges from nuclear power stations (Annex)

- The averages under the separate columns listing the daily mean, daily maximum and daily minimum concentrations over the entire period for which data were available. In some cases, the downloaded data give only ‘daily mean’ or even only ‘daily maximum’ values. Missing data are indicated with a dash (-). In some cases, a significant number of data points are reported as less than the method detection limit (<). The presence of these ‘less than’ values would make data processing in Excel difficult, and they would create a bias towards the higher values reported. It would also not be possible to plot ‘less than’ values. For this reason, all the ‘less than’ values were taken as the values reported (that is, at the assumed detection limit).2
- The start and end dates covered by the data for each parameter.
- The numbers of date points. Not all date points are accompanied by actual data and for this reason separate subtotals are supplied for the actual numbers of data points/measurements in the date range covered. Sub-totals for the numbers of date points where there are no data (such as blanks) and ‘less than’ values are also provided. This indicates the overall quality of the data.
• The data were filtered to create the summary tables in this Annex report. Unless otherwise stated, the values in the tables are presented in mg/l and expressed to two significant figures. For some data, there were no indication of the concentration units and in these cases judgment was used in establishing the likely units (mg/l or µg/l).
• Where sufficient data points were available, the data were plotted over time and selected plots are included in this Annex. Plots were selected on the basis of their showing useful trends over time or including a reasonable number of data points. The data plotted are for the daily maximum values, unless otherwise stated. Again, this choice was based on the availability of data and a judgement of which showed the most useful illustrative trends.
Additional data were also used and obtained from the fact sheets and the NPDES permits for each site.
2 The decision was taken that the averages of each the ‘daily mean’, ‘daily maximum’ and ‘daily minimum’ columns in the downloaded data for each US plant would provide the most useful summary data to include in these Annex tables. Averages for each column (over the time period for which the data were available) could then be compared with relevant CFR 40 or IPPC guidance values. Actual maximum (or minimum values) over several years of data would highlight only single individual outliers – these would be better identified from the plotted data. Very occasionally this resulted in inconsistencies in the averages obtained, such as the average daily maximum being lower than the average daily mean. When this occurred, the actual individual maximum values from the ‘daily maximum’ (or daily minimum) column are given in the summary tables. Only about eight instances of such inconsistency occurred and these are indicated in the summary tables with an asterisk (*).
Chemical discharges from nuclear power stations (Annex) 49

Table A4.2 Discharge data for Beaver Valley Units 1 and 2
50 Chemical discharges from nuclear power stations (Annex)

Table A4.2 (continued) Discharge data for Beaver Valley Units 1 and 2
Chemical discharges from nuclear power stations (Annex) 51

Figure A4.1 Beaver Valley: free chlorine (mean, mg/l) in main cooling water outfall discharge
Figure A4.2 Beaver Valley: residual chlorine (mean, mg/l) in main cooling water discharge
52 Chemical discharges from nuclear power stations (Annex)

Figure A4.3 Beaver Valley: pH (maximum) in main cooling water discharge
Figure A4.4 Beaver Valley: aluminium (maximum, mg/l) in main cooling water discharge
Chemical discharges from nuclear power stations (Annex) 53

Figure A4.5 Beaver Valley: oil and grease (mean, mg/l) in outfall from cooling water pump house
Figure A4.6 Beaver Valley: total suspended solids (maximum, mg/l) in outfall from cooling water pump house
54 Chemical discharges from nuclear power stations (Annex)
Figure A4.7 Beaver Valley: copper (maximum, mg/l) in outfall from heating, ventilation and air conditioning (HVAC) units
Figure A4.8 Beaver Valley: zinc (mean, mg/l) in outfall from HVAC units
Chemical discharges from nuclear power stations (Annex) 55
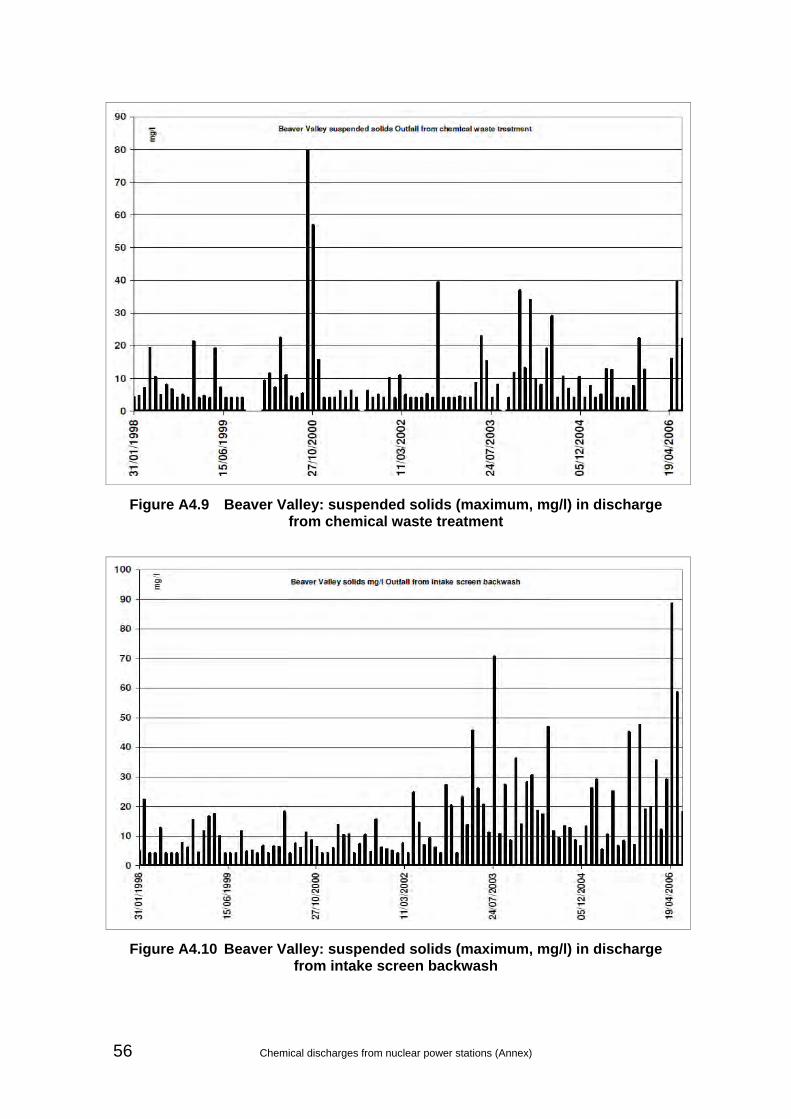
Figure A4.9 Beaver Valley: suspended solids (maximum, mg/l) in discharge from chemical waste treatment
Figure A4.10 Beaver Valley: suspended solids (maximum, mg/l) in discharge from intake screen backwash
56 Chemical discharges from nuclear power stations (Annex)
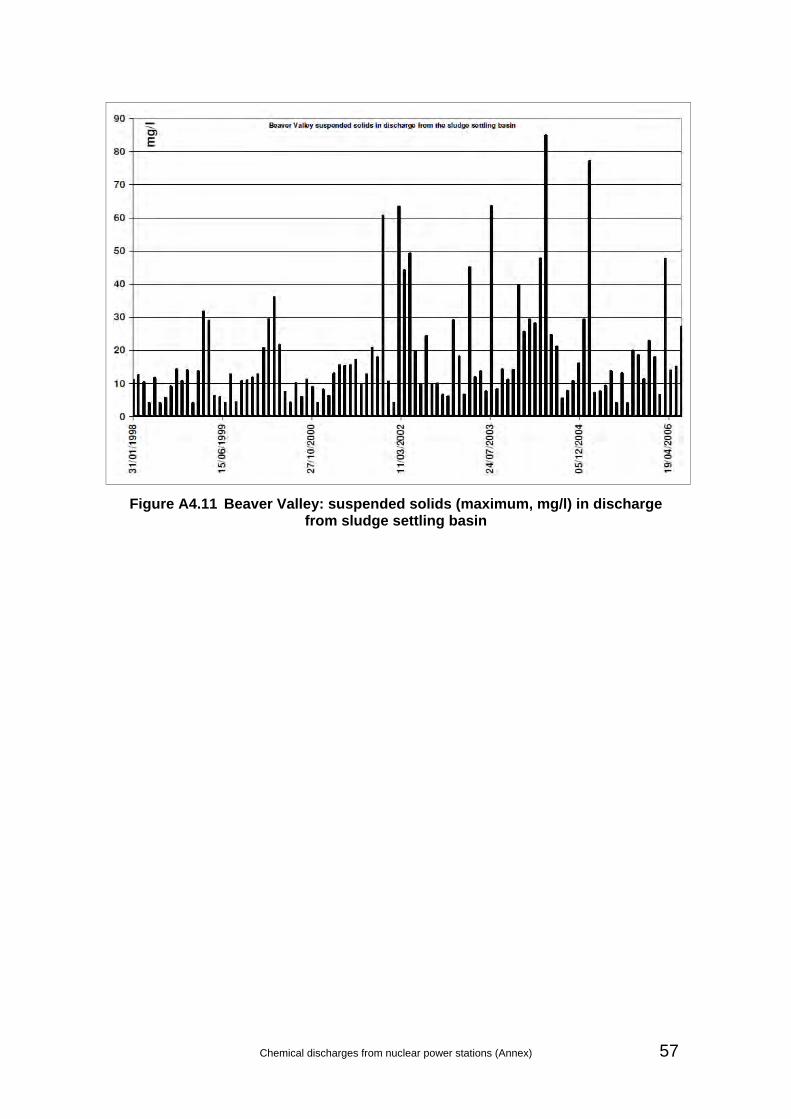
Figure A4.11 Beaver Valley: suspended solids (maximum, mg/l) in discharge from sludge settling basin
Chemical discharges from nuclear power stations (Annex) 57

Table A4.3 Discharge data for Byron
Figure A4.12 Byron: residual chlorine (mean, mg/l) in the main cooling water outfall discharge
58 Chemical discharges from nuclear power stations (Annex)
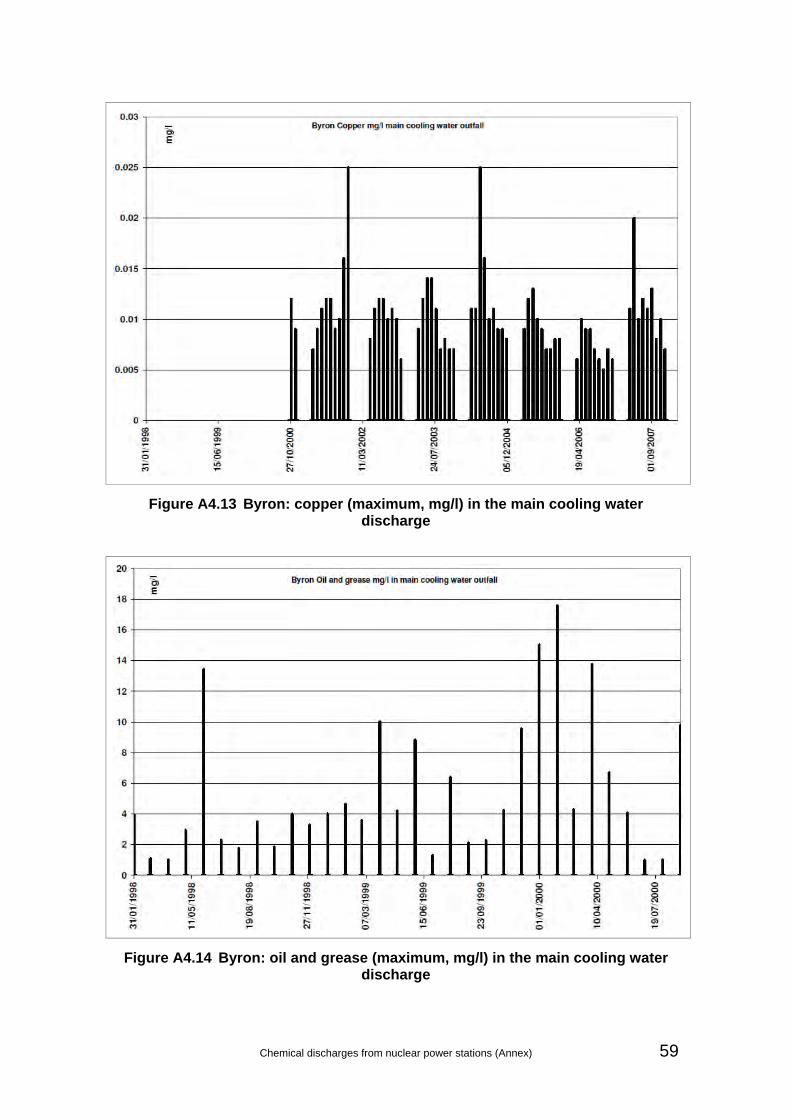
Figure A4.13 Byron: copper (maximum, mg/l) in the main cooling water discharge
Figure A4.14 Byron: oil and grease (maximum, mg/l) in the main cooling water discharge
Chemical discharges from nuclear power stations (Annex) 59

Figure A4.15 Byron: pH (maximum) in the main cooling water discharge
Figure A4.16 Byron: zinc (maximum, mg/l) in the main cooling water discharge
60 Chemical discharges from nuclear power stations (Annex)
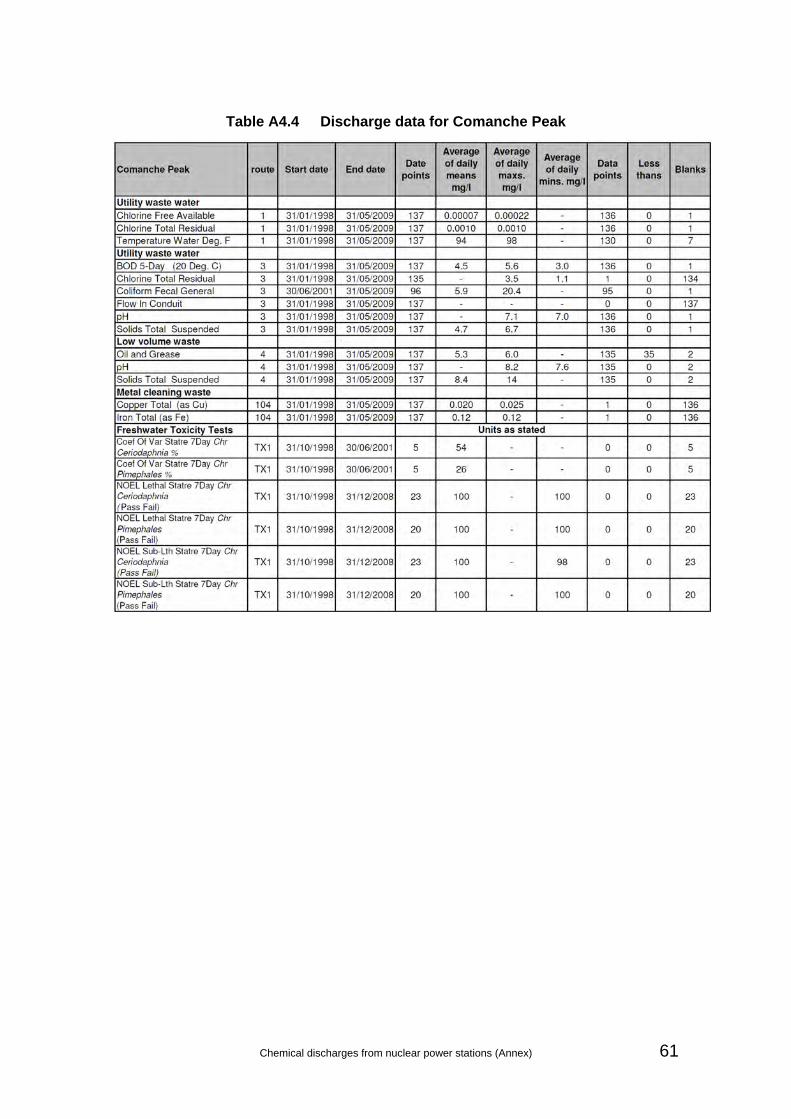
Table A4.4 Discharge data for Comanche Peak
Chemical discharges from nuclear power stations (Annex) 61

Figure A4.17 Comanche Peak: biochemical oxygen demand (mean, mg/l) in sanitary waste discharge
Figure A4.18 Comanche Peak: faecal coliforms in sanitary waste discharge
62 Chemical discharges from nuclear power stations (Annex)
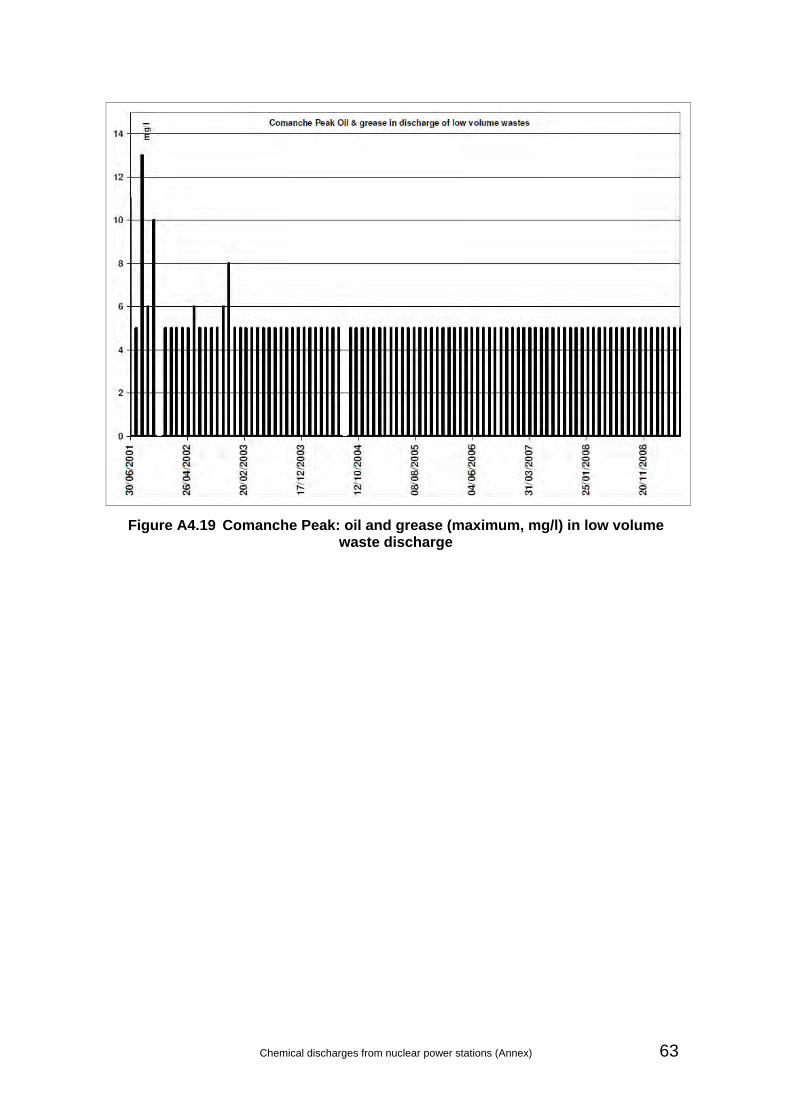
Figure A4.19 Comanche Peak: oil and grease (maximum, mg/l) in low volume waste discharge
Chemical discharges from nuclear power stations (Annex) 63

Table A4.5 Trace metal data for Comanche Peak
(summarised from permit application, see Section A3.4.2)
Notes: BOD = biochemical oxygen demand
COD = chemical oxygen demand
TOC = total organic carbon
TDS = total dissolved solids
64 Chemical discharges from nuclear power stations (Annex)

Table A4.6 Discharge data for Seabrook
Chemical discharges from nuclear power stations (Annex) 65

Figure A4.20 Seabrook: total residual oxidants (mean, mg/l) in main cooling water discharge
Figure A4.21 Seabrook: total suspended solids (mean, mg/l) in discharge from the turbine hall sumps
66 Chemical discharges from nuclear power stations (Annex)

Table A4.7 Discharge data for Salem
Chemical discharges from nuclear power stations (Annex) 67

Figure A4.22 Salem: total residual chlorine (maximum, mg/l) in main cooling water discharge
Figure A4.23 Salem: ammonia (maximum, mg/l as nitrogen) in discharge from liquid waste system
68 Chemical discharges from nuclear power stations (Annex)

Figure A4.24 Salem: total hydrocarbons (maximum, mg/l) in discharge from liquid waste system
Figure A4.25 Salem: total organic carbon (maximum, mg/l) in discharge from liquid waste system
Chemical discharges from nuclear power stations (Annex) 69
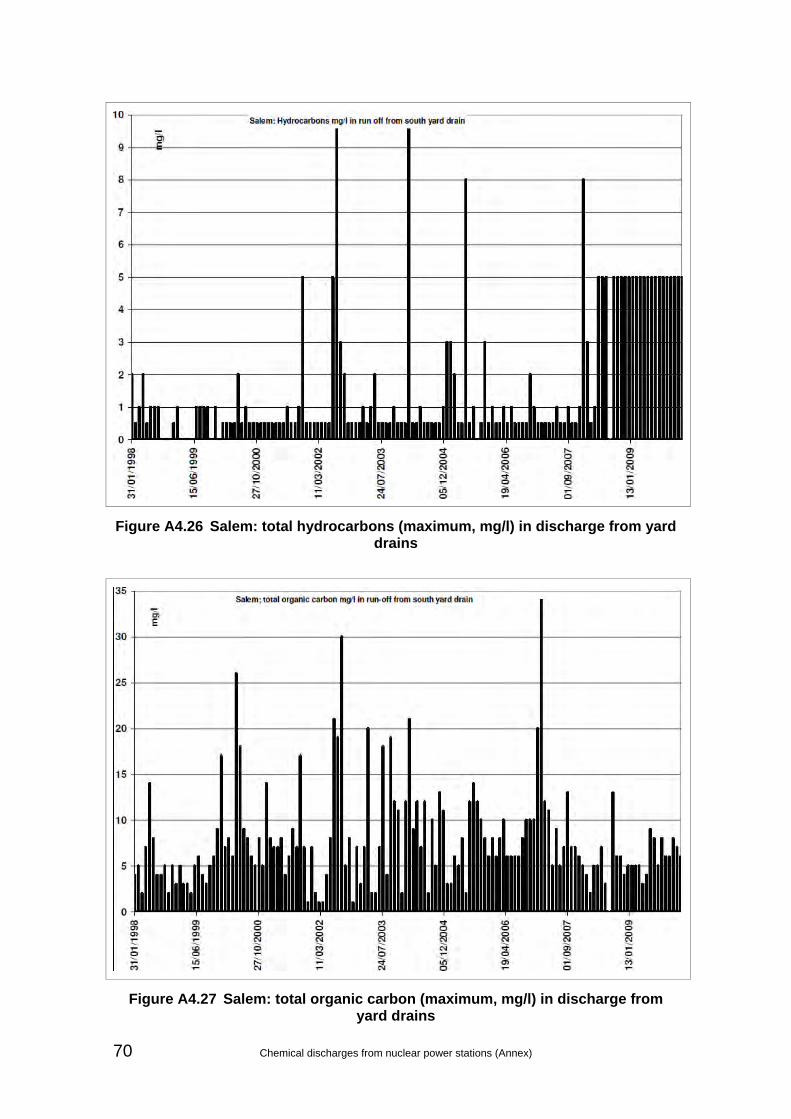
Figure A4.26 Salem: total hydrocarbons (maximum, mg/l) in discharge from yard drains
Figure A4.27 Salem: total organic carbon (maximum, mg/l) in discharge from yard drains
70 Chemical discharges from nuclear power stations (Annex)

Table A4.8 Discharge data for San Onofre Unit 2
Chemical discharges from nuclear power stations (Annex) 71

Figure A4.28 San Onofre Unit 2: total residual chlorine (maximum, µg/l) in discharge of main cooling water
Figure A4.29 San Onofre Unit 2: pH (maximum) of discharge of main cooling water
72 Chemical discharges from nuclear power stations (Annex)

Figure A4.30 San Onofre Unit 2: oil and grease (maximum, mg/l) in discharge of low level waste water
Chemical discharges from nuclear power stations (Annex) 73

Table A4.9 Discharge data for San Onofre Unit 3
74 Chemical discharges from nuclear power stations (Annex)

Figure A4.31 San Onofre Unit 3: total residual chlorine (maximum, µg/l) in main cooling water discharge
Figure A4.32 San Onofre Unit 3: pH (maximum) of discharge of main cooling water
Chemical discharges from nuclear power stations (Annex) 75
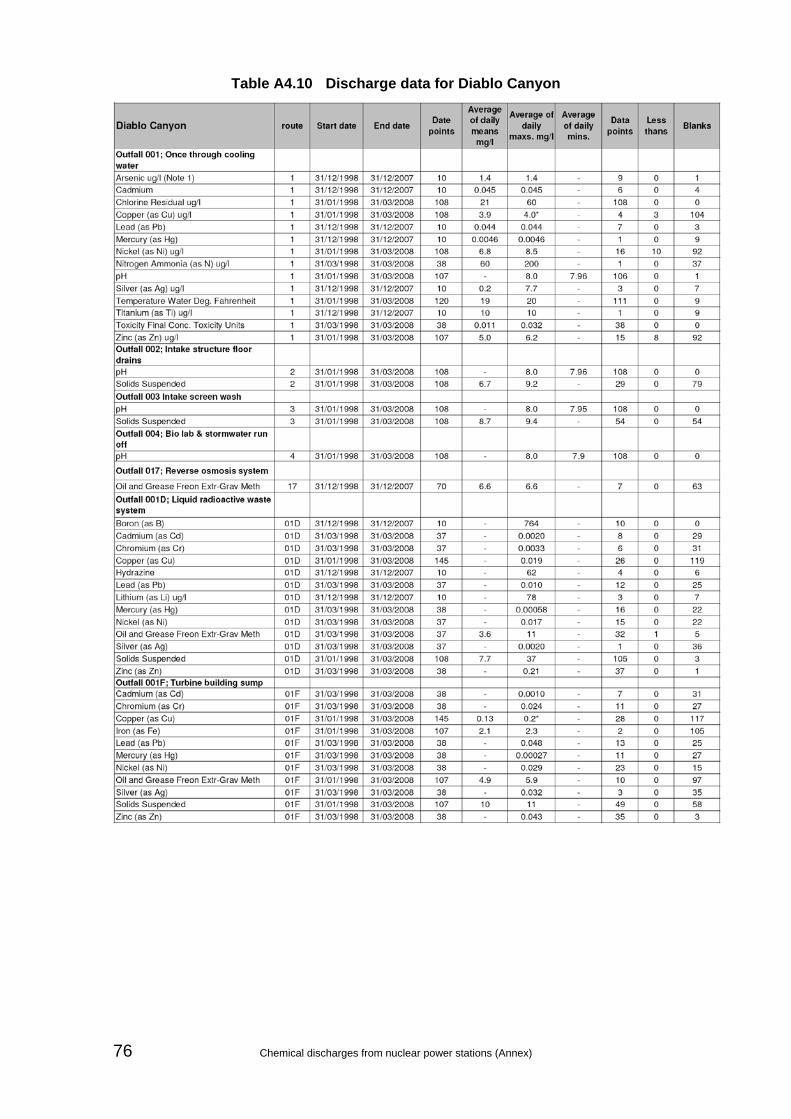
Table A4.10 Discharge data for Diablo Canyon
76 Chemical discharges from nuclear power stations (Annex)

Table A4.10 (continued) Discharge data for Diablo Canyon
Chemical discharges from nuclear power stations (Annex) 77
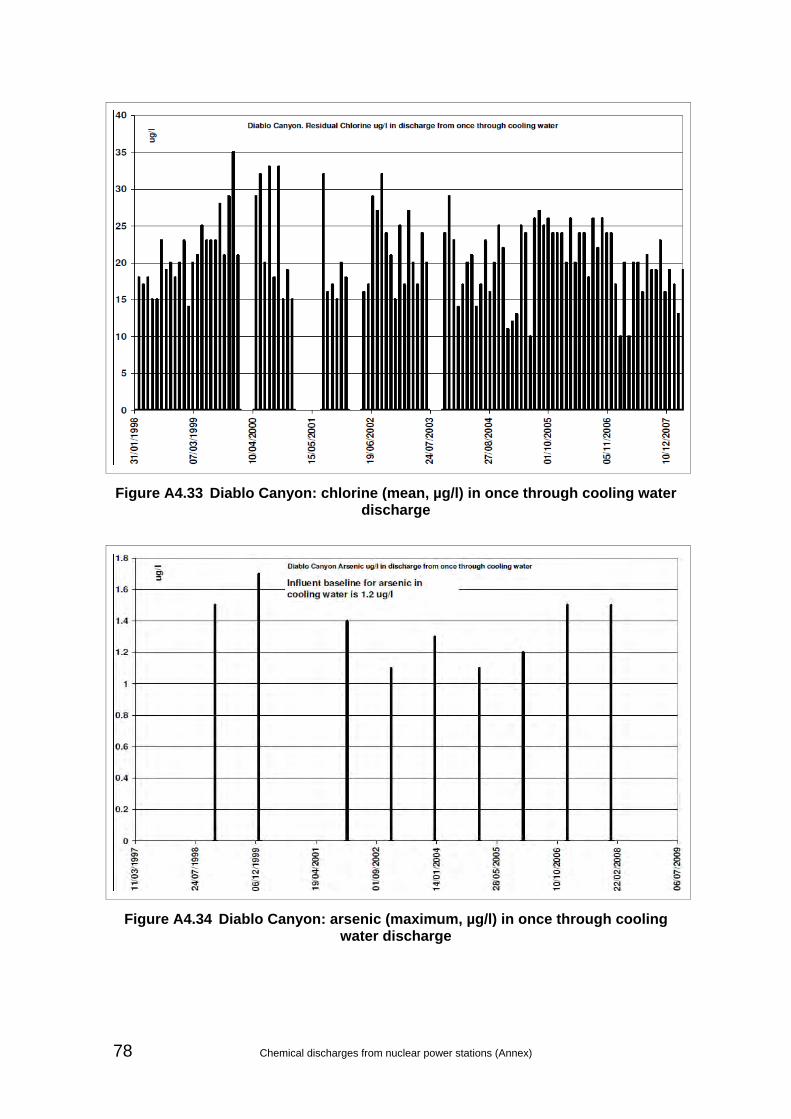
Figure A4.33 Diablo Canyon: chlorine (mean, µg/l) in once through cooling water discharge
Figure A4.34 Diablo Canyon: arsenic (maximum, µg/l) in once through cooling water discharge
78 Chemical discharges from nuclear power stations (Annex)

Figure A4.35 Diablo Canyon: cadmium (maximum, mg/l) in once through cooling water discharge
Figure A4.36 Diablo Canyon: lead (maximum, mg/l) in once through cooling water discharge
Chemical discharges from nuclear power stations (Annex) 79

Figure A4.37 Diablo Canyon: nickel (maximum, µg/l) in once through cooling water discharge
Figure A4.38 Diablo Canyon: boron (maximum, mg/l) in discharge from the liquid radioactive waste system
80 Chemical discharges from nuclear power stations (Annex)

Figure A4.39 Diablo Canyon: copper(maximum, mg/l) in discharge from the liquid radioactive waste system
Figure A4.40 Diablo Canyon: mercury (maximum, mg/l) in discharge from the liquid radioactive waste system
Chemical discharges from nuclear power stations (Annex) 81

Figure A4.41 Diablo Canyon: zinc (maximum, mg/l) in discharge from the liquid waste system
Figure A4.42 Diablo Canyon: chromium (maximum, mg/l) in discharge from regeneration of the condensate polishing plant
82 Chemical discharges from nuclear power stations (Annex)
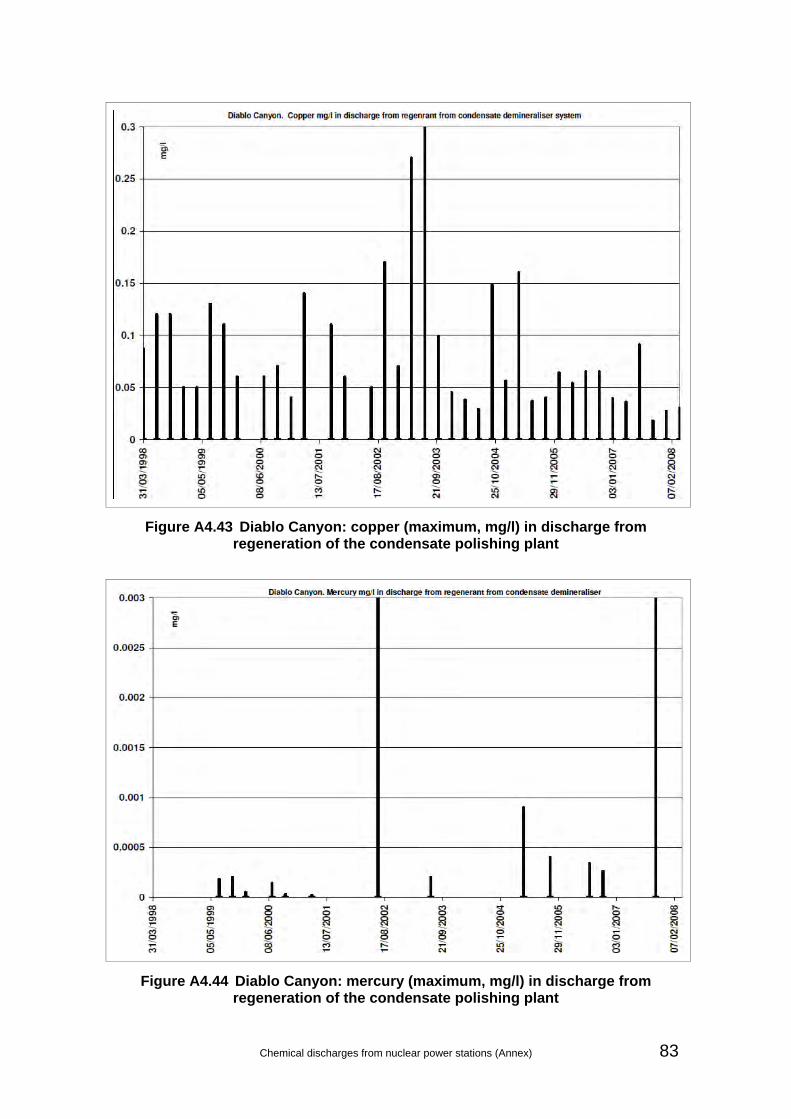
Figure A4.43 Diablo Canyon: copper (maximum, mg/l) in discharge from regeneration of the condensate polishing plant
Figure A4.44 Diablo Canyon: mercury (maximum, mg/l) in discharge from regeneration of the condensate polishing plant
Chemical discharges from nuclear power stations (Annex) 83
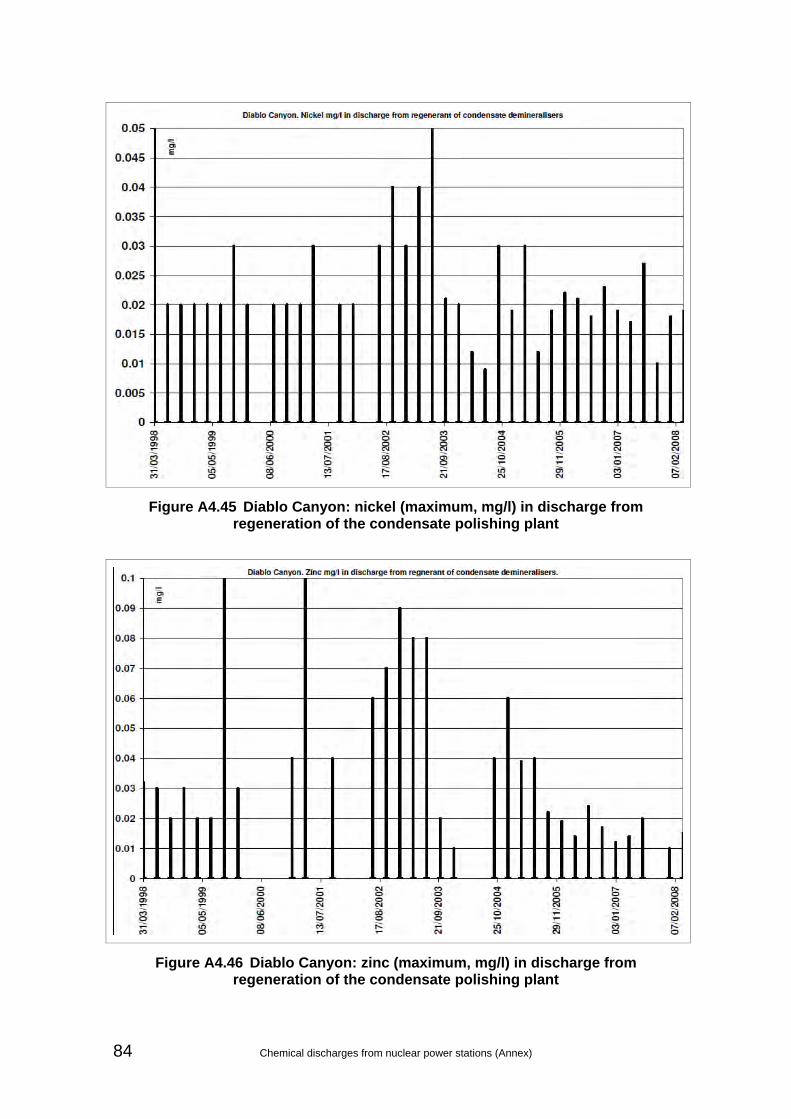
Figure A4.45 Diablo Canyon: nickel (maximum, mg/l) in discharge from regeneration of the condensate polishing plant
Figure A4.46 Diablo Canyon: zinc (maximum, mg/l) in discharge from regeneration of the condensate polishing plant
84 Chemical discharges from nuclear power stations (Annex)

Table A4.11 Discharge data for Millstone
Chemical discharges from nuclear power stations (Annex) 85

Figure A4.47 Millstone: free chlorine (maximum, mg/l) in discharge from main cooling water system
Figure A4.48 Millstone: zinc (maximum, mg/l) in discharge from main cooling water system
86 Chemical discharges from nuclear power stations (Annex)
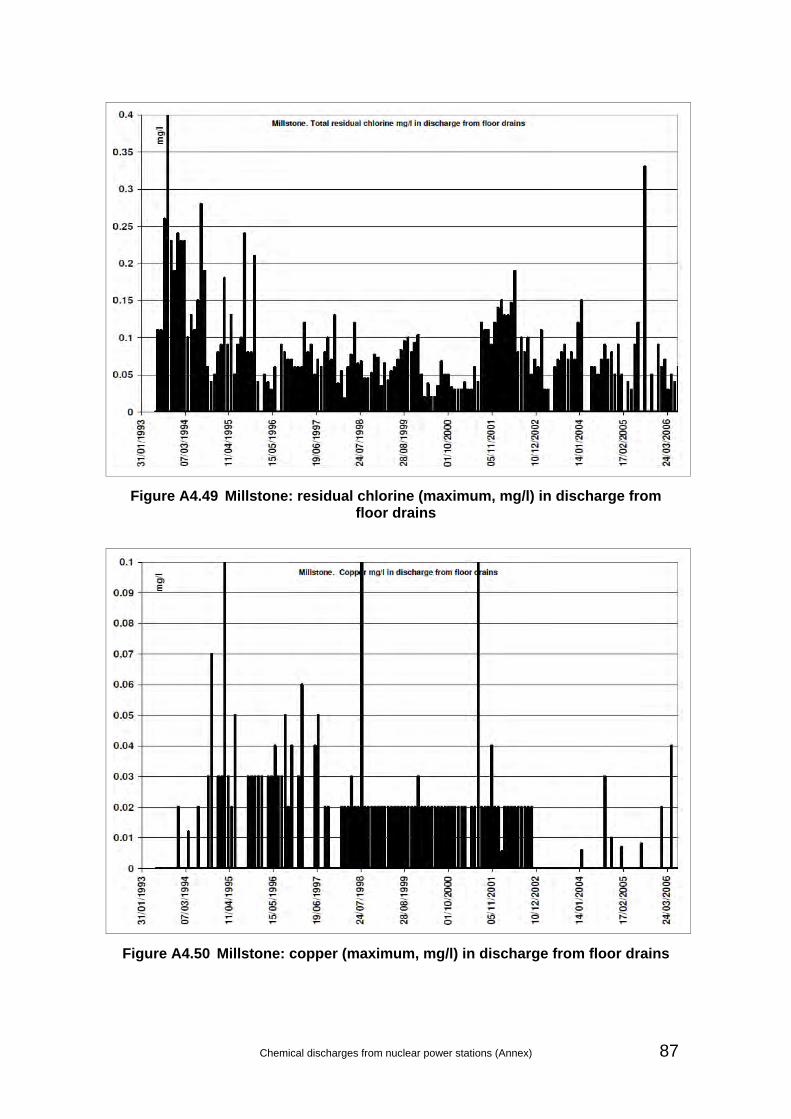
Figure A4.49 Millstone: residual chlorine (maximum, mg/l) in discharge from floor drains
Figure A4.50 Millstone: copper (maximum, mg/l) in discharge from floor drains
Chemical discharges from nuclear power stations (Annex) 87

Figure A4.51 Millstone: zinc (maximum, mg/l) in discharge from floor drains
Figure A4.52 Millstone: hydrazine (maximum, mg/l) in discharge from steam generator blowdown tank
88 Chemical discharges from nuclear power stations (Annex)

Figure A4.53 Millstone: iron (maximum, mg/l) in discharge from steam generator blowdown tank
Figure A4.54 Millstone: solids (maximum, mg/l) in discharge from steam generator blowdown tank
Chemical discharges from nuclear power stations (Annex) 89

Figure A4.55 Millstone: lithium (maximum, mg/l) in discharge from steam generator blowdown tank
90 Chemical discharges from nuclear power stations (Annex)

Table A4.12 Discharge data for St Lucie
Figure A4.56 St Lucie: total residual oxidants (mean, mg/l) in discharge of main cooling water
Chemical discharges from nuclear power stations (Annex) 91

Figure A4.57 St Lucie: boron (maximum, mg/l) in discharge from radioactive waste system
Figure A4.58 St Lucie: hydrazine (maximum, mg/l) in steam generator blowdown
92 Chemical discharges from nuclear power stations (Annex)

Table A4.13 Discharge data for Calvert Cliffs
Chemical discharges from nuclear power stations (Annex) 93
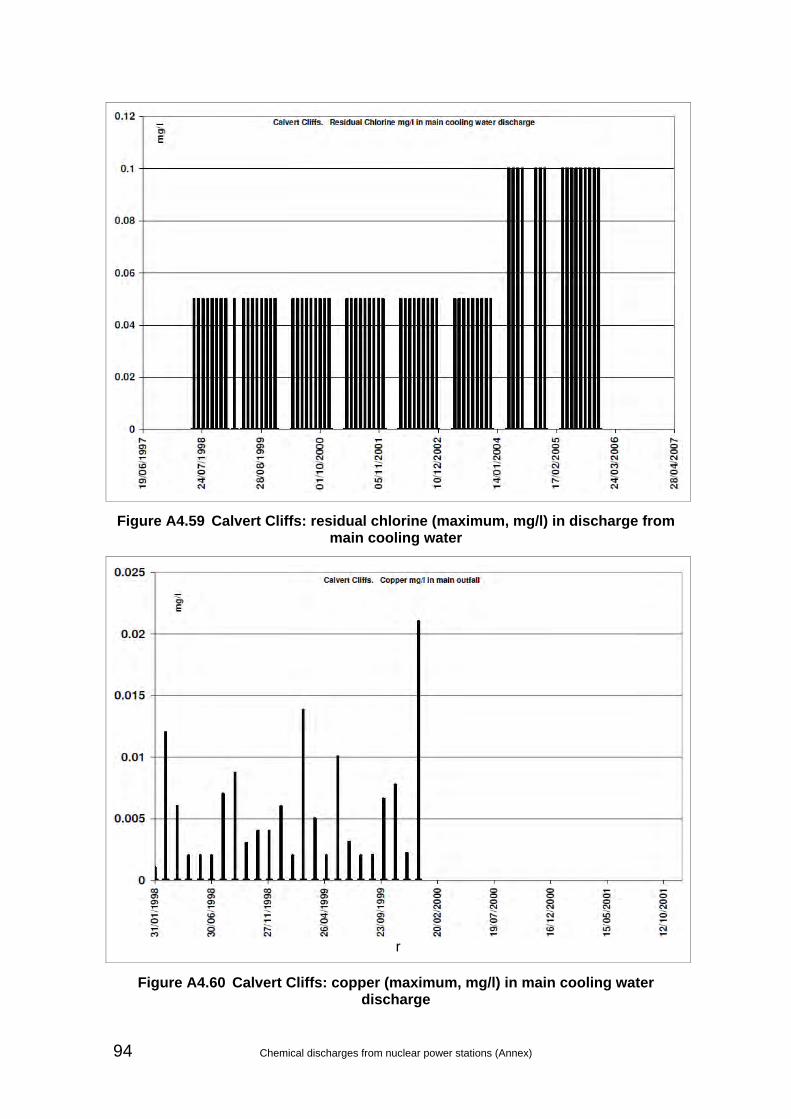
Figure A4.59 Calvert Cliffs: residual chlorine (maximum, mg/l) in discharge from main cooling water
r
Figure A4.60 Calvert Cliffs: copper (maximum, mg/l) in main cooling water discharge
94 Chemical discharges from nuclear power stations (Annex)

A5 French PWR power plants
A5.1 Overview of French PWR plants in the survey
A5.1.1 Civaux (inland site with two N4 reactors, UK EPR™ predecessor)
The Civaux nuclear plant is situated in Vienne, on the Vienne river in western France. It has two identical N4 reactors, each with a single turbine generator with an electrical output of 1,450 MW(e). The latest available permit is 2009.
Main cooling for the secondary steam circuit in each plant uses a natural draft, wet cooling tower. Make-up to the cooling towers is withdrawn from the River Vienne and the river also receives the blowdown from the cooling tower collection basins. However, to minimise thermal impacts on the river, the temperature of the blowdown is reduced prior to discharge by using a set of air-cooled heat exchangers. A series of dams upstream of Civaux on the rivers Vienne, Tauron and Maulde act as a reservoir to ensure cooling water is available during periods of drought (Druelle 2001).
The cooling tower circuits are dosed with sulphuric acid to control the build-up of hard scale on the metal pipework or in the main condensers, where microbiological corrosion of underlying metal could otherwise occur. Due to the sensitivity of the River Vienne, dosing the main cooling water circuit with biocides has been limited. Consequently, the potential use of ultraviolet (UV) light to disinfect cooling tower discharges is being investigated in order to avoid hazards associated with potential discharge of waterborne pathogens in to the Vienne. Dosing by chlorine is only applied to control biological activity in certain plant systems (such as the service cooling water system).
Titanium tubes are used in the main condensers, which compared with copper ones, will minimise leakage of the main cooling water into the steam circuit. This improves the quality of the water in the steam circuit and reduces the need for condensate polishing and associated discharges of chemicals from the regeneration of ion exchange resins.
The liquid effluents are segregated at source and directed through one or more treatment systems using filtration, ion exchange and evaporation to achieve optimum clean-up (for both radioactive and chemical constituents). The treated effluents are stored in dedicated tanks for hold-up and checking prior to final discharge to the environment. These tanks have the same names in all the N4 reactors and also in the UK EPR™ design:
• Tanks serving the liquid radioactive waste monitoring and discharge system (KER tanks). These handle liquid effluents from the nuclear island (primary circuit effluents, chemical effluents from active drains) prior to monitoring and discharge.
• Tanks serving the additional liquid waste discharge system (TER tanks). These are alternative back-up tanks for liquids from active plant areas and from the liquid radioactive waste treatment system.
• Tanks serving the conventional island liquid waste discharges (SEK tanks). These receive aqueous wastes mainly from the turbine hall, including those
Chemical discharges from nuclear power stations (Annex) 95

from the operation of the main steam circuit and condensate polishing plant.
The discharges are sampled and monitored before being discharged to the River Vienne via two dispersal ramps installed across the width of the river. These ramps ensure that dilution with the river water takes place as soon as possible after discharge.
As well as limits for the generic parameters applied to all the French plants, the permit for Civaux also has limits for emissions of certain volatile hydrocarbons and refrigerants. Best Available Techniques must also be used to find suitable substitutes for these chemicals (in accordance with the requirements of the EU Solvent Emissions Directive 1999/13/EC).
For Civaux and all other French inland plants using wet, natural draft cooling towers, there will be additional chemical emissions to air associated with the cooling tower drift. N4 reactors like Civaux are all equipped with two 8 MW(e) standby diesel generators as well as a 7MW(e) gas turbine for longer term operation in emergencies. These fossil fuel plants are a source of non-radioactive gaseous discharges to the atmosphere, mainly sulphur oxides, nitrogen oxides and particulates. Given their intermittent use (mainly for testing a few times per year), any atmospheric discharges will be relatively small and quickly dispersed by local weather conditions.
A5.1.2 Chooz (inland site with two N4 reactors, UK EPR™ predecessor)
Chooz (Centrale nucléaire de Chooz) lies in the municipality of Chooz in the Département Ardennes on the River Meuse. There are two identical units each with an output of 1,450 MW(e). The primary circuit of each plant is based on a standard N4, four-loop design. The designs of the primary and secondary circuits closely resemble those of the N4 plants at Civaux. The latest available permit is 2009.
The secondary and main steam circuits for both plants at Chooz use natural draft wet cooling towers with make-up and blowdown from the cooling tower basins to the River Meuse. Biofouling in the cooling tower circuits is controlled using monochloramine. The permit suggests that this is mainly used to control the build-up of pathogenic amoebae (Naegleria fowleri and Naegleria) and to minimise the risks associated with these pathogens in blowdown and cooling tower drift, rather than any effects of biofouling on the plant itself (such as blocking of tubes or microbiological corrosion).
The latest permit available is dated November 2009. Holding tanks from which plant discharges take place have the same designation as for the N4 plants at Civaux. An additional hold-up tank collects effluent from a set of drum filters which are used to screen water taken from the River Meuse prior to its use in the cooling circuit.
A5.1.3 Golfech (inland site with two P′4 reactors)
Golfech Nuclear Power Plant is located in the commune of Golfech (Tarn-et-Garonne) on the Tarn River. The site has two operating reactors of P′4 design with outputs of 1,300 MW(e). One of the units has been the subject of the ‘Duo’ programme where elevated concentrations of 7LiOH have been added to the primary coolant to increase the coolant pH. The objective of this is to reduce the movement of activated corrosion products (especially cobalt-60) around the primary circuit and therefore reduce radiation fields around the plant and minimise discharges of activity into the environment. Because the changes in concentrations of lithium hydroxide from those
96 Chemical discharges from nuclear power stations (Annex)
normally applied are relatively small (a few mg/l at most), there would be no impact on chemical discharges over and above those due to variations due to other operational factors. The programme is only experimental because the high levels of lithium in the coolant can have some adverse effects on the performance of the reactor fuel.
The latest permit available is dated September 2006. The main sources of aqueous effluents and routes for discharges of these from various areas of the plant (covering Units 1 and 2) include:
• Main discharges from the hold-up tanks serving the nuclear plant systems and secondary steam systems. A range of treatments are used prior to these reaching the final hold-up tanks, including oil–water separators.
• Discharges from the main cooling tower collection basins. These include effluents containing monochloramine used for preventing biofouling in the cooling towers. There is a significant commentary on the limits and how the impacts on final discharges to the River Garonne are minimised.
• Run-off from parking zones and other peripheral areas of the site.
• Effluents from the raw water treatment and demineralisation plant.
A5.1.4 Penly (coastal site with two P′4 reactors)
Penly (Centrale nucléaire de Penly) is located on the French North Sea coast about 10 km northeast of Dieppe. There are two P′4, four-loop reactors with electrical outputs of 1,300 MW(e). The latest available permit is 2008. In contrast to the inland plants at Civaux, Chooz and Golfech, the condensers in the secondary steam circuits at Penly use once-through seawater cooling. Chlorine dosing is used to control biofouling. Limits applied to cooling water discharge cover total residual oxidants and bromoform (the main by-product of chlorination).
Effluents from the radioactive waste treatment systems and secondary steam circuits are treated and stored in hold-up tanks prior to batch discharge with the main cooling water. There are limits for maximum allowable mass discharges from these tanks (two hourly, 24 hourly and annual) and also concentration limits in the discharge route leading to the sea (see Table 2.3 in the main report). In addition, there are separate limits that apply to discharges from a demineralisation plant that treats raw water for use in the reactor systems (limits apply to sodium, chlorides, suspended solids, iron, copper, pH) and from open plant areas (dissolved hydrocarbons).
A5.1.5 Flamanville (coastal site with two P4 reactors)
The Flamanville Nuclear Power Plant is located at Manche on the Cotentin Peninsula. There are currently two P4 reactors, each with an electrical output of 1,300 MW(e). The primary circuit of each plant is based on a standard four-loop design. The condensers serving the secondary steam circuits use once-through seawater cooling. The latest permit available is dated 2000. The main sources of aqueous effluents listed are:
• Effluents from the reactor plant areas and the secondary steam circuits. These include borated coolant that cannot be recycled in the primary circuit (via the radioactive waste systems and evaporators), active and inactive plant drains, decontamination solutions, those from the back-flushing of resin beds, and non-recyclable effluents from the steam generator blowdown system. Potentially oily effluents that originate mainly from the
Chemical discharges from nuclear power stations (Annex) 97

turbine areas are treated using oil–water separators. These are all directed to holding tanks for testing prior to final discharge to the main cooling water.
• Effluents from auxiliary plant systems, including raw water treatment and demineralisation plants.
• Outside plant and parking areas, divided into eleven separate zones.
Limits on discharges from most of these sources are given for total masses discharged in two and 24 hours, and also annually. For some parameters discharged from the reactor and secondary steam systems, there are additional annual mass limits to cover periodic discharges associated with reactor refuelling and maintenance. There are also limits on the concentrations of the main parameters allowed in the final hold-up tanks prior to these being discharged and a daily average limit on the concentration that can occur in the sea around the final cooling water outfall during discharge. Plant operators have to balance carefully not only how the hold-up tanks are filled by effluents from different plant sources, but also how the discharges from these are co-ordinated and timed to ensure that limits in the discharge route and final environment are not exceeded.
Separate limits are given for chemical discharges from water treatment systems outside the nuclear island:
• From the main raw water demineralisation plant: Limits for discharges from this plant cover sulphates (due to use of sulphuric acid to regenerate the ion exchange resins), suspended solids and suspended iron oxides. The limit on the volume of effluents from this large auxiliary plant, including chemicals produced during the regeneration of the ion exchange resins, is 900 m3 per day.
• Other foul and domestic waste water treatment plants at opposite ends of the site: Effluents from these plants carry limits for biochemical and chemical oxygen demand, suspended solids, total nitrogen and phosphorus – reflecting a standard suite for treatment systems dealing with these forms of waste. The volumes discharged from these are limited to between 3 and 5 m3 per day (compared with about 50 m3 per second of once-through cooling water discharged from the main outfall).
A5.1.6 Paluel (coastal site with four P4 reactors)
Paluel (Centrale nucléaire de Paluel) is roughly 40 km from Dieppe and lies on the coast of Normandy in the Département Seine-Maritime. It has four identical P4 reactors (Figure A5.1) with outputs of 1,330 MW(e) each and a site area of about 160 hectares. It has the second largest electrical output of any PWR site in France and seventh in the world. The primary circuit of each plant is based on a standard four-loop design. The secondary steam circuits use once-through cooling drawn from the English Channel. Freshwater is also drawn from the nearby River Durdent for make-up supplies and other smaller scale purposes. The latest permit available was dated 2000.
Sources and treatment of effluents are in all respects similar and equivalent to those arising on the Flamanville reactor site. To accommodate the larger volumes of aqueous wastes generated on the site, the total volumes of the hold-up tanks serving the nuclear island and secondary steam circuits are about double the capacity of those installed on the twin reactor site at Flamanville. The discharges from these, together with the main cooling water, take place via the outlet culvert discharging 6 m below the sea and about 800 m offshore.
98 Chemical discharges from nuclear power stations (Annex)

Figure A5.1 Four P4 reactors at Paluel (EDF annual report)
Parameters covered in the permit cover the same chemicals as those discharged from Flamanville and are summarised in the main report in Table 2.3. Mass limits are given covering discharges in two hours, 24 hours and annually with additional allowances for shutdown of one or more reactors on the site. Any relationship between the mass limits for discharges from the twin reactor site at Flamanville and the four reactor site at Paluel is discussed below. There are also separate limits for discharges from a number of auxiliary systems (see Section 1.6.4 of the main report).
A5.1.7 Gravelines (coastal site with six CPY/CP1 reactors)
Gravelines is situated on the North Sea coast of France approximately 20 km (12 miles) from Dunkerque and Calais (Département du Nord). The site consists of six CPY/CP1 type PWR reactors that were built and commissioned during the early to mid 1980s and are based on a design with three heat transfer loops. Each plant has an electrical output of about 900 MW(e). The site has a single permit dated January 2004 which covers discharges from all six reactors.
All six plants on the site use once-through cooling water drawn from and then discharged to the English Channel. The cooling water is dosed with chlorine to control biofouling. The permit states this is only allowed when the temperature of the inlet water rises above 10°C and is limited to a maximum of 1 mg/l. In the cooling water discharge, total residual oxidants are limited to 0.3 mg/l and bromoform (the main trihalomethane produced by chlorination) is limited to 0.05 mg/l.
Aqueous effluents arising in each plant are treated in a range of systems and then directed to a series of hold-up and delay tanks that each serve different combinations of the six reactors on the site. The treated effluents are directed to a series of hold-up tanks and discharged along two separate routes. Separate limits are applied to these routes, depending on the source of effluent:
• Route 1 (serving the TER and KER tanks for all six rectors and the SEK tanks for reactors 1 to 4). There are mass limits for the discharges of: boric acid, lithium, hydrazine, detergents, ammonium, phosphates, chemical
Chemical discharges from nuclear power stations (Annex) 99

oxygen demand, metals and suspended solids. There are additional allowances for discharges when any of the six reactors are shutdown for refuelling. There are also separate limits on the maximum concentrations allowed to accumulate in the tanks and in the discharge route prior to this reaching the sea.
• Route 2. This route serves only the SEK tanks for reactors 5 and 6 and therefore only those effluents arising from the turbine halls on these two reactors. The limits are therefore confined to chemicals arising specifically from this source and cover hydrazine, ammonia, phosphates, chemical oxygen demand, metals and suspended solids. There are additional annual mass limits for discharges of these chemicals during shutdowns when the steam circuit may be emptied or when the secondary side of the steam generators is subject to wet-lay-up.
Discharges along both routes are first directed to a common harbour-type facility (or coastal pool) and then to the North Sea at a minimum dilution ratio of 1:500. Sewage discharges and stormwater follow the same route. The site has several demineralisation plants that treat raw water in order to allow it to be used in the reactors and steam systems; effluents from the operation of these plants (mainly acid and caustic from the regeneration of the ion exchange resins) are treated in two 600 m3 neutralisation pits prior to discharge into the coastal pool.
Different combinations of ethanolamine and morpholine are used to control the pH of the water in the steam circuits in the different plants on the Gravelines site. Because of this there are complex equations in the permit for calculating the limits that should apply to these two chemicals in the discharges, depending on what dosing regime is being applied across the different reactors. Ammonia may be avoided on some plants due to use of copper systems.
There are separate limits for the discharges from the sewage works serving the Gravelines site and covering biochemical and chemical oxygen demand, total nitrogen, suspended solids, phosphates and hydrocarbons.
A5.2 Overview of limits for the French sites of Chooz, Civaux, Golfech (inland sites) and Flamanville, Paluel, Penly and Gravelines (coastal sites)
This section provides an overview of the limits that apply to the main parameters listed in the permits for the French reactor sites covered in the survey. It does not list or compare all the limits in the permits, nor is it meant to be a basis for setting limits. The objective is to provide an overview and indicate which limits might depend on the number of reactors on each site, overall site electrical power output or factors related to location. The limits for the AP1000™ and UK EPR™ also noted and based on the following publicly available information:
• For the UK EPR™ : the Generic Design Assessment (notably in Table 3 of Sub-chapter 3.4; UKEPR™ 2010a).
• For the Westinghouse AP1000™ : the AP1000™ Environment Report (notably in Table 4.2-2 in Chapter 4; Westinghouse 2010a).
The comparison is based on the latest available permits for each plant, though permits may be updated at intervals. Where significant changes in limits over time have been recognised, these are highlighted. The approximate net electrical output of the sites is
100 Chemical discharges from nuclear power stations (Annex)

provided in Table A5.1 and was used to determine any pro-rata relationship between limits and site capacity:
Table A5.1 Summary of gross electrical outputs of sites
Cho
oz
Civ
aux
Gol
fech
Penl
y
Palu
el
Gra
velin
es
Flam
anvi
lle
Output per plant GW(e) 1.45 1.45 1.36 1.36 1.30 0.9 1.3
Plants on site 2 2 2 2 4 6 2 Gross electrical output of site GW(e)
2.9 2.9 2.72 2.72 5.2 5.4 2.6
A5.2.1 Limits for discharges of boric acid
Table A5.2 summarises the annual discharge limits for boric acid. Fuel enrichment refers to the amount of the fissile uranium-235 present in the fuel used in the reactors. Higher fuel enrichment allows increased fuel burn-up and use, and increases the time the reactor can remain at power before it needs refuelling (increasing the cycle from 12 to about 18 months). However, there are cost and other issues associated with increased use of highly enriched fuel.
Table A5.2 Limits (kg) for boric acid discharges from French PWR sites (annual reports and permits)
Cho
oz
Civ
aux
Gol
fech
Penl
y
Palu
el
Gra
velin
es
Flam
anvi
lle
Annual limits Minimum due to normal fuel enrichment
2 × 6,000
2 × 7,500 25,000 2 ×
8,200 n/s n/s n/s
Maximum due to high fuel enrichment
2 × 8,300
2 × 9,000 31,000 2 ×
10,200 n/s n/s n/s
Allowance for draining boric acid store tanks
6,000 6,000 6,000 5,600 n/s n/s n/s
Site limit n/s n/s 25,000 n/s 58,000 43,500 40,000 Limit (no shutdown) n/s n/s n/s n/s 36,000 n/s 18,000
Shutdown n/s n/s n/s n/s 22,000 n/s 22,000
Chemical discharges from nuclear power stations (Annex) 101

Cho
oz
Civ
aux
Gol
fech
Penl
y
Palu
el
Gra
velin
es
Flam
anvi
lle
allowance Other time limits Daily 3,700 3,200 5,600 3,300 7,000 10,000 7,000 Allowance for draining boric acid store tanks
5,770 5,000 n/s 5,600 n/s n/s n/s
Two hourly 310 275 900 1,320 2,500 1,500 2,500 Allowance for draining boric acid store tanks
485 425 900 2,600 n/s n/s n/s
Notes: n/s indicates a limit is not specified in the permit.
The main features of the table and limits are as follows:
• In the more recent permits for the plants at Chooz, Civaux and Penly (2008–2009), limits for discharges of boron are given per reactor and depend on the fuel enrichment used. There are separate additional allowances for the emptying of boric acid from storage tanks used for boric acid solutions in the reactor make-up system and the fuel storage system. These allow for discharge of surplus boric acid that, for any operational reason, cannot be recycled through the plant. Note that the maximum annual discharges from all sources at Chooz (22,600 kg) and Civaux (24,000 kg) are more stringent than the previous site gross limit of 70,000 kg per year which appears in earlier annual reports for these plants.
• Limits for boric acid at Paluel and Flamanville are from permits dated 2000 and are based on a simple gross site limit. However, there are still allowances for additional discharges needed to allow for reactor shutdown. The gross annual limits for discharges do not indicate a simple relationship between the number of reactors on site or with installed capacity.
• The limits for the twin reactor coastal site at Penly have been updated to include additional allowances for discharges from the various boric acid storage tanks. The limits are more stringent than for the coastal site at Flamanville but are consistent with the limits in place at the inland sites of Chooz and Golfech.
• The daily and annual limits for discharges of boric acid from the multi-reactor site at Gravelines are generally higher than for the other coastal sites, although not on a pro-rata basis with the number of reactors or site capacity.
• When normalised to the installed capacity (and ignoring allowances for shutdowns or discharges from boric acid storage tanks), the annual limits for discharge of boric acid per gigawatt electrical [GW(e)) installed capacity vary between about 4,200 kg per year per GW(e) to 7,900 kg per year per GW(e) depending on the site and fuel enrichment. At Golfech, higher pro-rata values for discharges of boric acid apply – between 9,000 and 11,000
102 Chemical discharges from nuclear power stations (Annex)
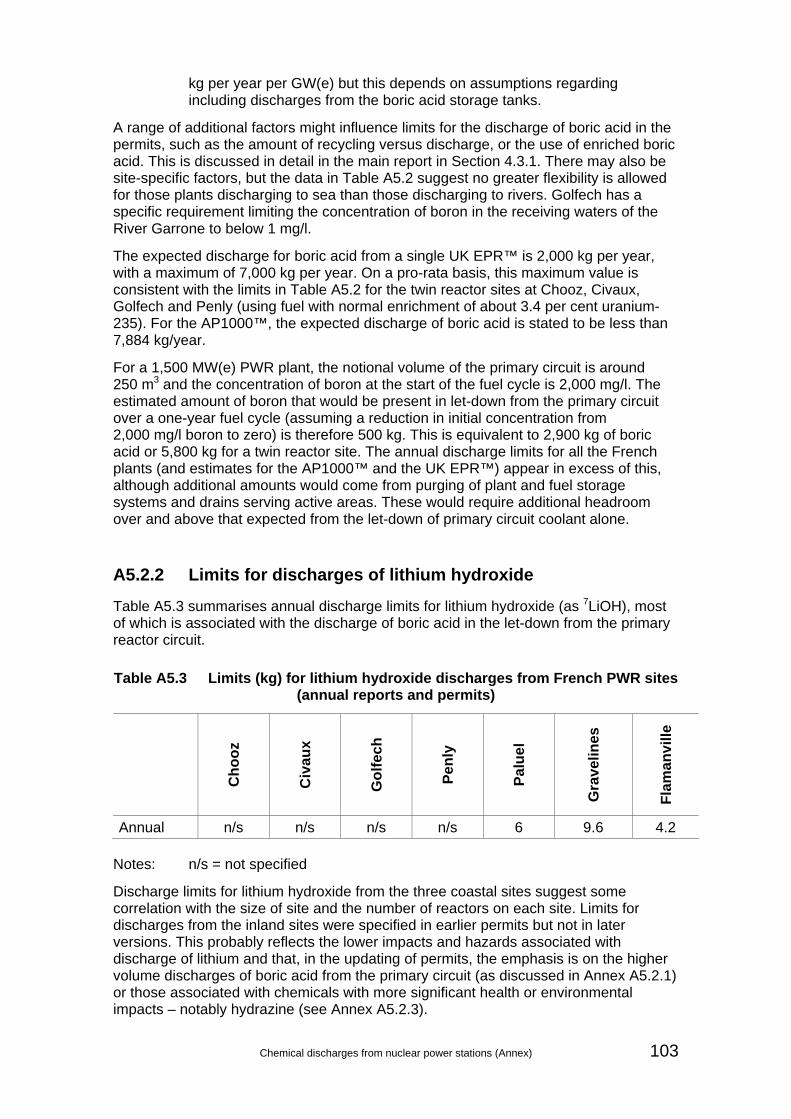
kg per year per GW(e) but this depends on assumptions regarding including discharges from the boric acid storage tanks.
A range of additional factors might influence limits for the discharge of boric acid in the permits, such as the amount of recycling versus discharge, or the use of enriched boric acid. This is discussed in detail in the main report in Section 4.3.1. There may also be site-specific factors, but the data in Table A5.2 suggest no greater flexibility is allowed for those plants discharging to sea than those discharging to rivers. Golfech has a specific requirement limiting the concentration of boron in the receiving waters of the River Garrone to below 1 mg/l.
The expected discharge for boric acid from a single UK EPR™ is 2,000 kg per year, with a maximum of 7,000 kg per year. On a pro-rata basis, this maximum value is consistent with the limits in Table A5.2 for the twin reactor sites at Chooz, Civaux, Golfech and Penly (using fuel with normal enrichment of about 3.4 per cent uranium-235). For the AP1000™, the expected discharge of boric acid is stated to be less than 7,884 kg/year.
For a 1,500 MW(e) PWR plant, the notional volume of the primary circuit is around 250 m3 and the concentration of boron at the start of the fuel cycle is 2,000 mg/l. The estimated amount of boron that would be present in let-down from the primary circuit over a one-year fuel cycle (assuming a reduction in initial concentration from 2,000 mg/l boron to zero) is therefore 500 kg. This is equivalent to 2,900 kg of boric acid or 5,800 kg for a twin reactor site. The annual discharge limits for all the French plants (and estimates for the AP1000™ and the UK EPR™) appear in excess of this, although additional amounts would come from purging of plant and fuel storage systems and drains serving active areas. These would require additional headroom over and above that expected from the let-down of primary circuit coolant alone.
A5.2.2 Limits for discharges of lithium hydroxide
Table A5.3 summarises annual discharge limits for lithium hydroxide (as 7LiOH), most of which is associated with the discharge of boric acid in the let-down from the primary reactor circuit.
Table A5.3 Limits (kg) for lithium hydroxide discharges from French PWR sites (annual reports and permits)
Cho
oz
Civ
aux
Gol
fech
Penl
y
Palu
el
Gra
velin
es
Flam
anvi
lle
Annual n/s n/s n/s n/s 6 9.6 4.2 Notes: n/s = not specified
Discharge limits for lithium hydroxide from the three coastal sites suggest some correlation with the size of site and the number of reactors on each site. Limits for discharges from the inland sites were specified in earlier permits but not in later versions. This probably reflects the lower impacts and hazards associated with discharge of lithium and that, in the updating of permits, the emphasis is on the higher volume discharges of boric acid from the primary circuit (as discussed in Annex A5.2.1) or those associated with chemicals with more significant health or environmental impacts – notably hydrazine (see Annex A5.2.3).
Chemical discharges from nuclear power stations (Annex) 103

The expected discharge for lithium from the UK EPR™ is less than 1 kg per year with a maximum of 4.4 kg per year. Discharges of lithium hydroxide from the AP1000™ are estimated to be less than 6.4 kg/year. These are generally consistent with current site limits for the French plants in Table A5.3.
A5.2.3 Limits for discharges of hydrazine
Table A5.4 summarises limits for the discharge of hydrazine and includes values from earlier EDF annual reports (EDF 2010b):
Table A5.4 Limits (kg) for hydrazine discharges from French PWR sites (annual reports and permits)
Cho
oz
Civ
aux
Gol
fech
Penl
y
Palu
el
Gra
velin
es
Flam
anvi
lle
Annual Site limit (2008 annual reports)
150 150 160 65 210 198 150
Limit (no shutdown) n/s n/s n/s n/s 120 44 50
Shutdown allowance n/s n/s n/s n/s 45 22 50
Updated (2009) limit 25 25 80 25 n/s n/s n/s
Other times Daily (updated) 1 1 23
(4) 3 20 54+34 9
Other daily allowances 4 4 n/s 3.8 n/s n/s n/s
Two hourly (updated) n/s n/s 8
(n/s) n/s 7.2 15+15 7.2
Notes: n/s = not specified
The limits for the discharge of hydrazine are higher for the larger multi-reactor sites at Paluel and Gravelines, although not on a simple pro-rata basis with the number of reactors (or total site electrical output). Sites with more reactors or reactors with a larger capacity will have more secondary side plant requiring protection against oxygen ingress. They will also have more or larger systems that require wet lay-up when hydrazine is applied to minimise corrosion (see Section 4.3.3 of the main report). However, there will be individual plant-specific issues of corrosion that operators need to address. These will require additional headroom in site limits, masking any simple pro-rata relationship between discharge of hydrazine with power or number of reactors.
In 2009, limits on the discharge of hydrazine from the inland sites at Chooz, Civaux and Golfech became more stringent. There were also additional requirements that discharges of hydrazine must be timed to coincide with periods of high flow in the receiving water to ensure maximum dilution in the mixing zone. This reflects the environmental hazards associated with hydrazine and is consistent with regulatory
104 Chemical discharges from nuclear power stations (Annex)

pressures on discharges of hydrazine identified at some of the US plants included in the study (such as at Millstone, Section A3.9).
Daily limits for some French PWR sites include allowances for maintenance operations and, for the coastal sites, reactor shutdowns and refuelling. The permit for Penly specifically states that this is to allow wet-lay-up of the steam generators. Again, the amount of maintenance and wet-lay up may vary on a site-by-site basis and will mask any pro-rata relationships of the use or subsequent discharge of hydrazine with plant size or capacity.
The expected discharge of hydrazine from the UK EPR™ is 7 kg per year with a maximum of 14 kg per year. On a pro-rata basis, this is consistent with the most recent 2009 limits of 25 kg per year for discharges of hydrazine from the twin reactor sites at Chooz, Civaux and Penly. The GDA for the UK EPR™ specifically notes that, as far as possible, surplus used solutions of hydrazine will be treated to minimise the concentrations of hydrazine finally discharged (see Chapter 6.3 in UK EPR™ 2010d).
The GDA for the AP1000™ gives a significantly larger predicted annual discharge of hydrazine of 370 kg per year but it is not clear if this allows for any on-site treatments that could potentially reduce this figure (Table 4.2-2 in Westinghouse 2010a).
A5.2.4 Discharges of ammonium and amines used for pH control (and other nitrogen species)
Ammonia (NH3) is used as a pH control agent in the main steam circuits as part of the all volatile treatment (AVT) with hydrazine (see Section 1.6.2 of the main report). Small amounts of ammonia may also come from decomposition of hydrazine used in the steam circuit and from wet lay-up. Ammonia is converted predominantly to ammonium (NH4
+) in the treatment systems or during regeneration of ion exchange resins in the condensate polishers, and most is discharged as ammonium sulphate (see Section 4.3.4 of the main report). Limits to cover the use and discharge of ammonia are based on ammonium for some of the French plants and are usually given as ‘total nitrogen’. The method of analysis is not stated, but assuming a Kjeldahl method, it would cover NH4
+ and any smaller amounts of free NH3. On this basis, limits are more stringent for the inland sites than the coastal ones. However, the difference might also reflect increased stringency on discharges of ammonia and/or ammonium in the more recent permits for the inland sites.
The limits applied to amines in discharges from the nuclear island reflect the use of these chemicals for controlling pH in the secondary steam circuit. The limits given in Table A5.5 suggest that amines are used to control pH at Golfech and Penly, while a combination of ammonia and amines is used at Chooz and Civaux (with morpholine only used at Gravelines). The absence of limits for discharge of amines from Paluel and Flamanville, together with larger allowances for discharges of ammonium, suggests that these sites used ammonia for controlling secondary circuit pH.
In some permits, there are additional methods for determining limits on the discharge of ammonium, morpholine and/or ethanolamine, when different combinations of these are used for controlling the pH in the steam circuits of different plants on the same site.
Table A5.5 summarises discharge limits for ammonium (NH4+ as distinct from free
ammonia, NH3), amines and total nitrogen from the tanks serving the nuclear islands on the French sites covered in the current study.
Chemical discharges from nuclear power stations (Annex) 105

Table A5.5 Limits (kg) for nitrogen species in discharges from French PWR sites (annual reports and permits)
Cho
oz
Civ
aux
Gol
fech
Penl
y
Palu
el
Gra
velin
es
Flam
anvi
lle
Ammonium annual 4 4,500 1 1,100 1 n/s 2 n/s 8,200 23,210 20,000
Daily 68 100 n/s n/s 200 145+111 100 Two hourly n/s 50 n/s n/s 80 50+55 80 Morpholine annual 1,100 1,000 1,000 1,150 n/s 3,150 n/s
Daily 17 15 80 78 n/s n/s n/s Ethanolamine annual 590 540 600 620 n/s n/s n/s
Daily 10 10 16 22 n/s n/s n/s Total nitrogen annual 1,100 1 1,100 1 4,500 2 18,200 3 n/s n/s n/s
Daily n/s n/s 124 190 175 n/s 175 Two hourly n/s n/s n/s 150 70 n/s 70
Notes: n/s = not specified 1 Limits at Civaux and Chooz are given as ammonium in the permit but as
nitrogen in the annual reports. For Chooz, they differ between the two sources.
2 Golfech limits are given only as total nitrogen in both the permit and annual report.
3 The 18,200 kg annual limit (total nitrogen) for Penly assumes use of ammonia for secondary circuit pH control and is reduced to 9,900 kg per year (and a maximum of 80 kg per day and 60 kg per two hours) when ammonia is replaced by other amines.
4 For discussion on the relationship between ammonium and ammonia (which is more environmentally toxic), see Section 4.3.4 of the main report and USEPA (1989).
At inland sites, any treatment of the cooling towers with monochloramine involves dosing with ammonia (see Section 4.3.9 in the main report). Therefore for inland sites there are separate limits for discharges of ammonium from cooling tower blowdown (such as 36 kg per day for Chooz and 73 kg per day at Golfech), plus additional allowances for when dosing needs to be increased. The presence of ammonia and nitrite-oxidising bacteria in the circuits also results in the formation of nitrite (NO2
-) and nitrate (NO3
-), which are also covered by discharge limits (up to 3,035 kg nitrate per day and up to 1,130 kg nitrite per day for the plants surveyed in this report). The limits on nitrate and nitrite include allowances to cover the fact that differing proportions of monochloramine may be converted to nitrates or nitrites depending on conditions in the cooling circuit.
The expected discharge of morpholine from the UK EPR™ is 354 kg per year with a maximum of 840 kg per year. The corresponding figures for ethanolamine (if it is used) are 250 kg per year and 460 kg per year. On a pro-rata basis, these predicted discharges are generally consistent with limits currently applied for the twin reactor sites at Chooz, Civaux, Golfech and Penly (morpholine up to 1,150 kg per year and ethanolamine up to 620 kg per year).
106 Chemical discharges from nuclear power stations (Annex)
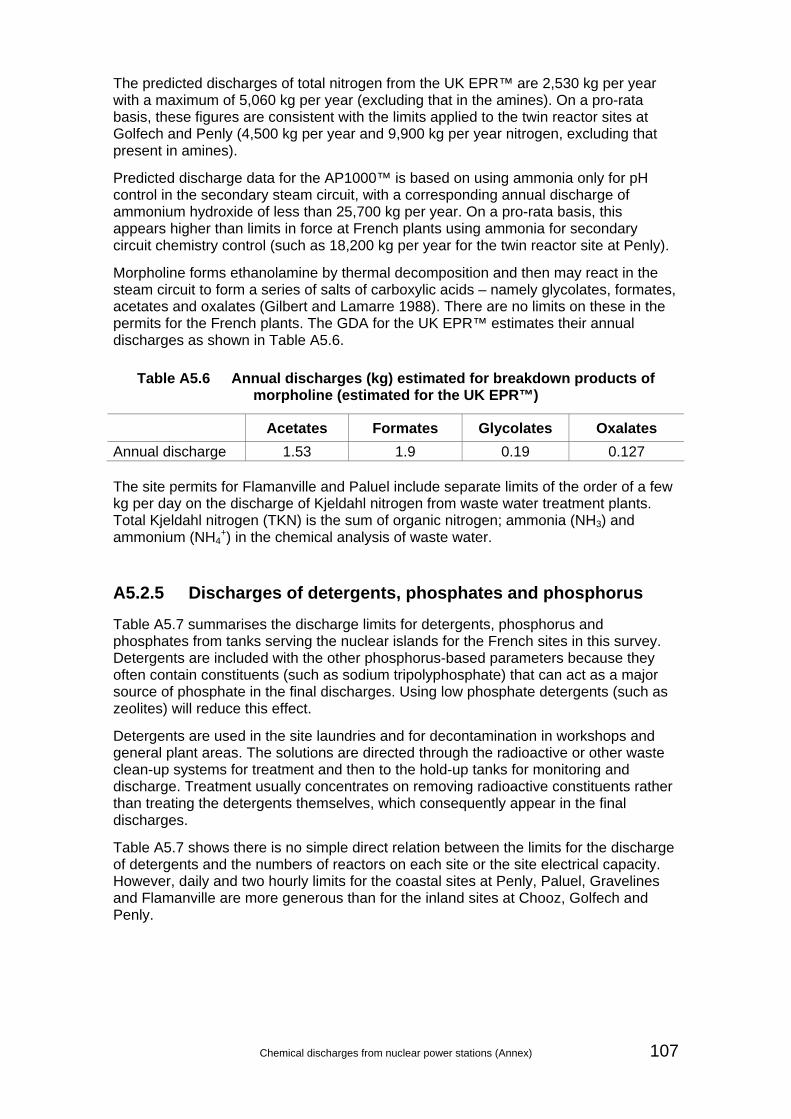
The predicted discharges of total nitrogen from the UK EPR™ are 2,530 kg per year with a maximum of 5,060 kg per year (excluding that in the amines). On a pro-rata basis, these figures are consistent with the limits applied to the twin reactor sites at Golfech and Penly (4,500 kg per year and 9,900 kg per year nitrogen, excluding that present in amines).
Predicted discharge data for the AP1000™ is based on using ammonia only for pH control in the secondary steam circuit, with a corresponding annual discharge of ammonium hydroxide of less than 25,700 kg per year. On a pro-rata basis, this appears higher than limits in force at French plants using ammonia for secondary circuit chemistry control (such as 18,200 kg per year for the twin reactor site at Penly).
Morpholine forms ethanolamine by thermal decomposition and then may react in the steam circuit to form a series of salts of carboxylic acids – namely glycolates, formates, acetates and oxalates (Gilbert and Lamarre 1988). There are no limits on these in the permits for the French plants. The GDA for the UK EPR™ estimates their annual discharges as shown in Table A5.6.
Table A5.6 Annual discharges (kg) estimated for breakdown products of morpholine (estimated for the UK EPR™)
Acetates Formates Glycolates Oxalates Annual discharge 1.53 1.9 0.19 0.127 The site permits for Flamanville and Paluel include separate limits of the order of a few kg per day on the discharge of Kjeldahl nitrogen from waste water treatment plants. Total Kjeldahl nitrogen (TKN) is the sum of organic nitrogen; ammonia (NH3) and ammonium (NH4
+) in the chemical analysis of waste water.
A5.2.5 Discharges of detergents, phosphates and phosphorus
Table A5.7 summarises the discharge limits for detergents, phosphorus and phosphates from tanks serving the nuclear islands for the French sites in this survey. Detergents are included with the other phosphorus-based parameters because they often contain constituents (such as sodium tripolyphosphate) that can act as a major source of phosphate in the final discharges. Using low phosphate detergents (such as zeolites) will reduce this effect.
Detergents are used in the site laundries and for decontamination in workshops and general plant areas. The solutions are directed through the radioactive or other waste clean-up systems for treatment and then to the hold-up tanks for monitoring and discharge. Treatment usually concentrates on removing radioactive constituents rather than treating the detergents themselves, which consequently appear in the final discharges.
Table A5.7 shows there is no simple direct relation between the limits for the discharge of detergents and the numbers of reactors on each site or the site electrical capacity. However, daily and two hourly limits for the coastal sites at Penly, Paluel, Gravelines and Flamanville are more generous than for the inland sites at Chooz, Golfech and Penly.
Chemical discharges from nuclear power stations (Annex) 107

Table A5.7 Limits (kg) for detergents and phosphates in discharges from French PWR sites (annual reports and permits)
Cho
oz
Civ
aux
Gol
fech
Penl
y
Palu
el
Gra
velin
es
Flam
anvi
lle
Detergents annual 2,200 1,700 3,100 4,700 2,700 3,900 1,800
Daily 115 140 120 520 200 180 200 Two hourly 10 20 20 210 160 60 160 Allowance for shutdowns n/s n/s n/s n/s 450 400 450
Phosphates annual 620 600 1,000 840 4,200 1,404 2,000
Daily 61 61 160 200 300 162+71 150 Shutdown n/s n/s n/s n/s 300 90+71 400 Total phosphorus annual
800 800 326 n/s 1,400 n/s 700
Notes: n/s = not specified The sites at Paluel, Gravelines and Flamanville include an additional allowance for the discharge of detergents during shutdown of the reactors. This allows for the increased numbers of workers involved in maintaining active plant areas during these periods, with an associated increased amount of potentially contaminated clothing that needs to be washed in the active laundry. Some nuclear sites in the UK and Europe make use of off-site contractors for this service and have no on-site laundry.
Expected discharges of detergents from the UK EPR™ are 630 kg per year with a maximum of 1,600 kg per year. On a pro-rata basis, these are consistent with the limits for discharges of detergents in force at the twin reactor sites in Table A5.7. There are no current data for predicted discharges of detergents from the AP1000™.
Phosphate originates as sodium phosphate used to control pH during the wet lay-up of plant systems where, because of unavoidable ingress of oxygen, hydrazine cannot be used. Like detergents, more stringent limits are applied to the discharges of phosphate from inland sites. At the coastal sites, there are additional allowances for discharge of phosphate dosed water due to periodic shutdown of the reactors for refuelling.
The predicted discharge of phosphate from the UK EPR™ is 155 kg per year with a maximum value of 400 kg per year. On a pro-rata basis these are consistent with current limits in force for the twin reactor sites (for example, Chooz) in Table A5.7.
Total phosphorus will include that present in phosphates and in other organic forms such as organic phosphonate corrosion inhibitors. There is a larger allowance for the four reactor site at Paluel but otherwise no clear correlation with the number of plants. Several permits give separate limits for phosphorus in discharges from water effluent treatment plants (accompanied by those for Kjeldahl nitrogen and biochemical oxygen demand – typical of foul water treatment).
108 Chemical discharges from nuclear power stations (Annex)

A5.2.6 Discharges of heavy metals
Table A5.8 summarises the site limits for the discharge of heavy metals from tanks serving the nuclear islands on the French sites covered in the current study. All the permits state that the limits cover the total mass discharged for a common suite of metals: zinc, copper, manganese, nickel, chromium, iron, titanium, aluminium and lead.
Table A5.8 Limits (kg) for heavy metals in discharges from French PWR sites (annual reports and permits)
Cho
oz
Civ
aux
Gol
fech
Penl
y
Palu
el
Gra
velin
es
Flam
anvi
lle
Annual site limit 300 100 145 230 260 1,720 190
Limit no Shutdowns n/s n/s n/s n/s 220 n/s 130
Daily limit 21 5 4.5 3.6 3 16+7.5 3 Notes: n/s = not specified These discharge limits need to accommodate site-specific problems of corrosion and associated discharges of metals, especially of iron. Corrosion products mainly originate from the secondary and auxiliary plant systems rather than the reactor circuit.
The permits for Flamanville, Paluel and Penly give separate limits for discharges of metals from raw water treatment plants. These limits are considerably higher than those for metals from the hold-up tanks serving the nuclear island (in Table A5.8). Discharge of iron from raw water treatment is limited to 6,500 kg per year at Flamanville, 900 kg per year at Paluel, and 2,000 kg per year at Penly. Discharges of copper from raw water treatment are limited to 100 kg per year at Penly. Differences between the site discharge limits will be due to the different types or sources of raw water, and specific corrosion issues. Iron will precipitate in ion exchange beds or in filters and will be removed from these during periodic backwashing. It may also precipitate when effluents of sulphuric acid (used to regenerate the ion exchange resins) are neutralised with caustic. In both bases, the bulk of the iron should be removed in settling basins but finer particulates will be carried over into the final discharges.
The permit for Flamanville has a separate limit for the discharge of titanium (50 kg per year) reflecting its use of titanium condenser tubes. However, there are no discharge limits for titanium at other sites which are known to use titanium tubes in the main condensers (for example, Civaux). Titanium is resistant to corrosion, and any corrosion products that do form have very low solubility. Only extremely low concentrations of titanium would be expected in any once-through cooling water passing through titanium tube condensers.
For Gravelines and Civaux there are separate limits for aluminium (124.9 kg per year and 50 kg per year respectively). This may reflect their use of aluminium sulphate as a flocculant in water treatment.
The permits for several sites state that, of the heavy metals discharged, the sum of copper, zinc, nickel, chromium and lead must not exceed 30 per cent of the total. The remaining 70 per cent is due to iron and manganese (the main structural metals in the
Chemical discharges from nuclear power stations (Annex) 109

plant) and aluminium (a minor structural metal). Table A5.9 shows the ratio of metals that could be present in discharges from the final hold-up tanks from the UK EPR™.
Table A5.9 Assumed proportions of heavy metals in final hold-up tanks for UK EPR™
Al Cu Cr Fe Mn Ni Pb Zn 8.95% 0.7% 14.1% 59.3% 5.6% 0.75% 0.5% 10.1%
Notes: From UK EPR™ (2010a) The total amount of copper, zinc, nickel, chromium and lead expected in discharges from the UK EPR™ represents 26 per cent of the total metals discharged, with iron, manganese and aluminium making up the balance of 74 per cent.
The estimated and maximum discharge of metals from the final hold-up tanks serving the nuclear island for the UK EPR™ are 16 and 27.5 kg per year (for a single reactor). These are lower than current limits for twin reactor sites such as Chooz (300 kg per year, Table A5.8).
The estimated discharge of iron from a water treatment plant serving the UK EPR™ is 848 kg per year. This is consistent with that from the treatment plant at Paluel, but the limits required would clearly depend on the type of water being treated at any particular site in the UK.
Bulk liquid raw materials used as conditioning products in any PWR, such as sulphuric acid or caustic soda, may contain impurities such as mercury, cadmium and arsenic. In France, EDF specifies the maximum level of impurities in dosing chemicals that suppliers must comply with, and cadmium and arsenic are prohibited by EDF as basic product components or in reactor water to prevent corrosion and activation. For the UK EPR™, EDF concludes that any cadmium and arsenic introduced as minute traces in the circuits will be found only as traces in any final discharges after they have passed through filters and ion exchange beds in the radioactive waste and other plant systems.
The estimated discharges of iron and trace metals in aqueous effluents from the AP1000™ are 3.4 kg per year. This estimate is based solely on the presence of a total of 1 mg/kg trace metal impurities in dosing chemicals. The GDA for the AP1000™ states that iron and trace metal corrosion products will be removed by filters and ion exchange systems in the waste treatment plants prior to discharge.
A5.2.7 Limits for suspended solids
Table A5.10 summarises the site limits for discharges of suspended solids from the tanks serving the nuclear island.
The highest daily limit is for the multi-reactor site at Gravelines, but otherwise there is no simple direct relationship between discharge limits and the number of reactors on each site. For the sites at Paluel and Flamanville, there are additional allowances for plant shutdowns when flushing and movement of suspended solids from plant systems in to discharges might occur. Overall discharges of suspended solids from the nuclear island may depend on a range of plant and site-specific factors, including the presence of corrosion products and the types and grades of filters used in treatment systems.
110 Chemical discharges from nuclear power stations (Annex)

Table A5.10 Limits (kg) for suspended solids in discharges from French PWR sites (annual reports and permits)
Cho
oz
Civ
aux
Gol
fech
Penl
y
Palu
el
Gra
velin
es
Flam
anvi
lle
Annual site limit, no shutdown n/s 3,800 n/s n/s 33,200 58,480 17,000
Allowance per shutdown n/s n/s n/s n/s 1,200 n/s 1,200
Daily limit 111 53 180 170 120 544+255 120 Demineralisation plant (annual) n/s n/s n/s 1,800 14,000 n/s 14,000
Notes: n/s – not specified The expected discharge of suspended solids from the nuclear island of the UK EPR™ is 655 kg per year with a maximum of 1,400 kg per year. On a pro-rata basis, these values are consistent with limits applied at Civaux. The UK EPR™ description notes that any suspended solids or particulates that pass though the filters and ion exchange beds in the treatment systems and enter the final hold-up tanks will be removed from the final discharge by filters fitted to the final discharge lines from the tanks.
Permits for the French plants also include limits on suspended solids from demineralisation plants and other water treatment systems. Examples of these are included in Table A5.10. These will depend on the raw water being treated and the treatment processes used such as flocculation or coagulation. The expected discharge of solids from a water treatment plant serving the UK EPR™ is 1,621 kg per year, though the limit required at a specific site will depend on the type of raw water being treated. No data are given for expected discharges from the AP1000™.
A5.2.8 Limits for hydrocarbons
Hydrocarbons are not expected to occur in aqueous effluents from the reactor systems of a PWR, so there are no limits specified for hydrocarbons in effluents from hold-up tanks serving the nuclear island. Limits for hydrocarbons are specified for aqueous effluents from other site sources. The main features for the French sites covered in this survey are as follows:
• Flamanville: For each of 11 site zones, there are annual (100–500 kg), daily (0.5–2.5 kg) and two-hourly (0.05–0.3 kg) mass limits for discharges of hydrocarbons in run-off or from other plant sources. The concentration limit is 0.35 mg/l for 10 site zones and, for the one zone that receives discharges from an oil–water separator, it is 1.2 mg/l.
• Paluel: There are annual (450–600 kg) and daily and two-hourly (both 6–8 kg) mass limits and concentration limits (5 mg/l) for hydrocarbons in stormwater run-off from the site. There are separate limits for hydrocarbons in the main cooling water outfall (2,200 kg per year; 6 kg per 24 hours, 0.5 kg per two hours, 0.025 mg/l) with a final concentration limit for the mixing zone in the receiving water of 0.005 mg/l.
Chemical discharges from nuclear power stations (Annex) 111
• Gravelines and Penly: Concentration limits for selected discharge points of 5 mg/l.
• Chooz and Civaux: Both have the same concentration limit of 5 mg/l for effluents from the secondary and main cooling water circuits.
• Golfech: For discharge points for rainwater and run-off, and for drains serving conventional plants, there is a concentration limit for hydrocarbons of 5 mg/l. For a separate discharge from an oil water separator, there is an additional limit of 10 mg/l.
The permits also specify that there must be no visible oil films on the final discharges.
The GDA for AP1000™ and UK EPR™ do not provide estimates of mass discharges of hydrocarbons, although both provide extensive information on avoiding discharges of oils from tank bunds or accidental spillages (see Section 4.3.7 in the main report).
A5.2.9 Limits for sulphate
There are no limits specified for sulphate in discharges from the hold-up tanks serving the nuclear islands in the permits for the French plants covered in this survey. Limits for sulphate are applied to a range of effluents from different sources on a site by site basis.
The main features for the sites covered in the survey are as follows:
• Flamanville and Paluel: There is a limit for sulphate in effluents produced by the regeneration of the ion exchange resins in the raw water treatment plant of 250,000 kg per year with a maximum concentration in the discharge route leading to the sea of between 2,700 and 3,000 mg/l.
• Gravelines: Discharges of sulphate from the demineralisation plant are limited to 7,200 kg per year, with a concentration limit of 6,000 mg/l in the discharge route.
• Penly: No limits for sulphate are noted in the available permit.
• Civaux: Discharges are limited to 3,000 kg per year associated with the demineralisation plant, but also covering purges from the service water system.
• Chooz and Golfech. Discharge limits are significantly larger, with mass limits of, respectively 40,000 and 24,000 kg per day respectively. These reflect the use of sulphuric acid for anti-scaling in the recirculating main cooling water systems/cooling towers. The concentration limits in the discharge are 750 and 56 mg/l respectively. The limit for Chooz also allows for an extra headroom for 25 per cent of discharges up to 60,000 kg per day. Chooz also has a separate smaller limit for sulphates from a set of hold-up tanks (18,000 kg per year) but the source is not stated.
For raw water treatment, limits on the discharge of sulphate may depend on the type of water being treated, the amount of make-up that needs to be prepared each year and the frequency of regenerating the ion exchange beds (using sulphuric acid).
For cooling tower systems, discharge limits will depend on the amounts of sulphuric acid used for de-scaling, the amount of make-up and blowdown from the cooling tower and the chemistry of the make-up used to replenish losses from the cooling tower circuit.
112 Chemical discharges from nuclear power stations (Annex)

The discharge of sulphate from a raw water treatment plant serving the UK EPR™ is 11,725 kg per year but this would depend on the site location and chemistry of water being treated. No data are given for expected discharges of sulphate from the AP1000™.
A5.2.10 Limits for chemical oxygen demand
Table A5.11 summarises limits in the permits for the discharge of chemical oxygen demand (COD) in effluents from the main hold-up tanks serving the nuclear islands on the French PWR sites included in the survey:
Table A5.11 Limits (kg) for COD in discharges from French PWR sites (annual reports and permits)
Cho
oz
Civ
aux
Gol
fech
Penl
y
Palu
el
Gra
velin
es
Flam
anvi
lle
Annual n/s n/s n/s n/s n/s 27,200 n/s 24 hours 120 180 450 210 150 640 + 300 150 2 hours n/s n/s n/s n/s 120 140 + 120 120 Notes: n/s = not specified Several of the permits give separate limits of the order of tens of kg per day for chemical oxygen demand due to discharges from water treatment plants (such as at Flamanville and Paluel). There are also significantly larger limits (up to about 1,800 kg per day) applied at some inland plants to cover the use and discharge of polyacrylates from cooling tower systems (polyacrylates act as dispersants to prevent build up of sediments in the cooling tower collection basins).
The expected discharge of chemical oxygen demand from the UK EPR™ is 1,490 kg per year with a maximum of 2,525 kg per year. No data are given for expected discharges from the AP1000™.
A5.3 Cooling water chemical treatments for the French plants
A5.3.1 Coastal sites (once-through seawater cooling)
Table A5.12 summarises the limits for discharges of chemicals associated with the dosing of once-through seawater cooling systems at the French PWR sites covered in the current survey.
Chemical discharges from nuclear power stations (Annex) 113

Table A5.12 Limits and fluxes for chemicals associated with once-through seawater cooling for the French plants
Penly Paluel Gravelines Flamanville Free chlorine mg/l <1 n/s <1 n/s Bromoform Annual (tonnes) n/s 175 230 110 24 hours (kg) 230 715 950 120 2 hours (kg) n/s 65 85 10 In discharge canal (mg/l) 0.03 0.05 0.05 0.05 In sea mixing zone (mg/l) n/s 0.01 n/s 0.01 Residual oxidants Annual (tonnes) n/s 1,400 1,370 110 24 hours (kg) 3,900 5,700 5,700 1,200 2 hours (kg) n/s 520 520 100 In discharge canal (mg/l) 0.5 0.4 0.3 0.3 In sea mixing zone (mg/l) n/s 0.08 n/s 0.06 Notes: n/s = not specified Limits for the total mass discharges of total oxidants and trihalomethanes (mainly bromoform) from these coastal sites are generally related to plant size. This reflects increased levels of chlorination required in larger capacity sites with greater once-through cooling water flows. However, the concentration limits in the main cooling water discharges are consistent across the different sites.
The concentration limits for residual oxidants in discharges from these French coastal sites are consistent with the value applied to Sizewell B (0.3 mg/l). They are also consistent with the range considered to demonstrate BAT (0.1–0.5 mg/l) in the IPPC BREF for large combustion plants (European Commission 2001a), and the equivalent value for total residual chlorine in the US CFR 40 guidelines (0.2 mg/l).
Actual discharges of total oxidants and bromoform will be lower than the limits in Table A5.12 and depend on a range of site-specific factors, including the following:
• The biofouling that needs to be controlled (specific species).
• Seasonal effects especially water temperature. For example, the permit for Gravelines states that chlorination is permitted only when the water temperature rises above 10°C. Some permits also give details on the time duration when chlorination can be applied and the numbers of plants on any one site to be treated at any one time. This is all consistent with similar restrictions in place on US coastal sites using chlorine dosing.
• Power output of the plant and any decision by the plant operator to load follow (that is, adjust the electrical output to accommodate changes in demand from the grid, rather than provide a single constant base load).
• Research at UK sites shows that, for a given level of chlorination, the levels of bromoform and other trihalomethanes formed depend on the abundance and types of nature of organic carbon present in the seawater, which will be site-specific (Jenner et al. 1997).
114 Chemical discharges from nuclear power stations (Annex)

Environmental reports for the AP1000™ and the UK EPR™ give extensive information on the use of chlorination for controlling biofouling in the main once-through cooling water systems assumed for a generic UK site. They also describe the use of chlorination in smaller service water systems, where complex pipework and lower flows can make biofouling a more significant problem and therefore requiring more dosing. Details are given in Section 4.3.9 of the main report.
A5.3.2 Inland sites
At Chooz and Golfech, dosing by monochloramine is used in the cooling tower circuits. It prevents biofouling and limits the populations of pathogenic amoebas (Legionella) present in blowdown returned to surface watercourses or discharged to air in drift from the towers. However, there are occasions when using monochloramine alone is not sufficient to achieve the required level of control. In these circumstances, the permits for Golfech and Chooz state that, with permission of the relevant regulatory authorities, ‘mass chlorination’ can take place but this limited to four times per year and the discharges can be made from only one reactor at a time. For Chooz, there are also specific limits on the use of monochloramine and mass chlorination when the flow rates in the River Meuse fall below certain values.
The data available for Civaux suggest that the use of monochloramine is constrained by low flow in the River Vienne and that chlorine is used. Disinfection using UV lamps is being considered to treat blowdown water.
Parameters in the permits for these three inland plants and associated with use of monochloramine and/or mass chlorination are summarised as follows:
• Free chlorine: Limits of 15 kg per 24 hours and 7.7 kg per hour in discharges from the main cooling systems for Golfech. The concentration limit in the discharge at Civaux is 0.1 mg/l.
• Total residual chlorine: Limits in discharges from Golfech and Chooz of 0.2–0.3 mg/l.
• Organohalogens adsorbable on activated charcoal (AOX): Specified with limits in the permits for all three plants. Between 13 and 75 kg per day in discharges from Golfech and Chooz (using monochloramine), but 300 kg per day for Civaux (using chlorination). These limits reflect the higher levels of trihalomethanes formed when dosing with chlorine compared with monochloramine. For Chooz and Civaux, there are additional allowances for when mass chlorination takes place.
• Trihalomethanes: Specified in permits for all three plants but without specific reference to bromoform. Fluxes are limited to 1.5 kg per day for Golfech and Chooz, and 15 kg per day at Civaux.
• Ammonium, nitrite and nitrates: Specified for monochloramine treatments at Golfech and Chooz with limits over and above those due to discharges of these parameters from the nuclear island alone.
The permits for the plants at Chooz and Golfech note the use of polyacrylates to control build-up of sediments in the cooling tower collection basins and biological slimes in pipework. At Golfech, the use of polyacrylates is limited to when flow in the River Garonne is above 100 metres per second, and to 50 days per year.
The environmental reports for the AP1000™ and UK EPR™ are based on once-through cooling and do not discuss chemicals used in large-scale cooling towers.
Chemical discharges from nuclear power stations (Annex) 115

A5.4 Comparison of discharge data across the French sites at Chooz, Civaux, Golfech (inland) and Flamanville, Paluel, Penly, Gravelines (coastal) This section examines discharge data for the French plants. The data are compared with the discharge limits to:
• normalise the data for each plant;
• illustrate trends over time;
• indicate parameters that tend to come close to exceeding the discharge limits.
A5.4.1 Discharge data for Chooz, Civaux, Golfech and Penly
The raw data supplied by EDF is provided in Annex report Section A.6 and consists of:
• annual and daily discharges of the main chemicals from the nuclear islands of the plants, that is, from the various tanks serving the primary circuit, waste systems and turbine hall (daily data included the mean and maximum of the daily values, but excluded any days with zero discharge);
• discharges from the chemical dosing of the cooling tower circuits at Chooz and Golfech (using monochloramine and sulphuric acid).
• discharges of chlorine and residual oxidants from the coastal plant at Penly;
• discharges from the raw water demineralisation plants at each site.
Discharges from the nuclear island
Figures A5.2 to A5.4 summarise the annual, mean daily and maximum daily discharges from the hold-up tanks on the nuclear islands on each site, normalised to the most recent available limits.
The plot for annual discharges (Figure A5.2) suggests the following:
• Total nitrogen and to a lesser extent phosphates are consistently closer to the limits for each site than most other parameters (especially for Penly).
• Discharges of morpholine are up to about 30 per cent of the annual limits in discharges from Chooz, Civaux and Golfech. There will be complex relationships between discharge of morpholine and how the secondary circuit and any condensate polishing plants are designed and operated, or how morpholine is used in combination with ammonia (see Annex report Section A5.2.4 and Section 4.3.4 in the main report).
• Discharges of boric acid are mostly below about 40 per cent of the annual limits. The discharges that come closest to the limit are those from the coastal site at Penly. Variations in discharges reflect differences in the amount of boric acid recycled versus that discharged (see Section 4.3.1 of the main report).
• Discharges of hydrazine as percentages of the annual limits are more variable. Those from Chooz in 2007 approach 90 per cent of the current
116 Chemical discharges from nuclear power stations (Annex)
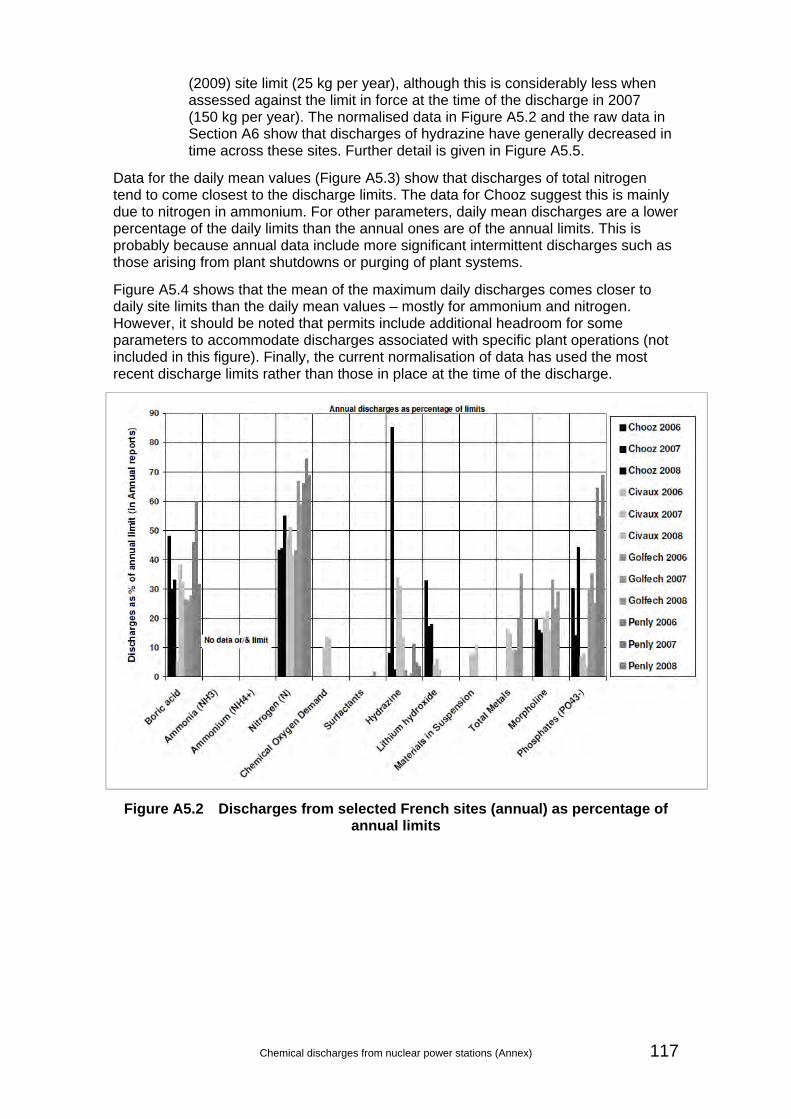
(2009) site limit (25 kg per year), although this is considerably less when assessed against the limit in force at the time of the discharge in 2007 (150 kg per year). The normalised data in Figure A5.2 and the raw data in Section A6 show that discharges of hydrazine have generally decreased in time across these sites. Further detail is given in Figure A5.5.
Data for the daily mean values (Figure A5.3) show that discharges of total nitrogen tend to come closest to the discharge limits. The data for Chooz suggest this is mainly due to nitrogen in ammonium. For other parameters, daily mean discharges are a lower percentage of the daily limits than the annual ones are of the annual limits. This is probably because annual data include more significant intermittent discharges such as those arising from plant shutdowns or purging of plant systems.
Figure A5.4 shows that the mean of the maximum daily discharges comes closer to daily site limits than the daily mean values – mostly for ammonium and nitrogen. However, it should be noted that permits include additional headroom for some parameters to accommodate discharges associated with specific plant operations (not included in this figure). Finally, the current normalisation of data has used the most recent discharge limits rather than those in place at the time of the discharge.
Figure A5.2 Discharges from selected French sites (annual) as percentage of annual limits
Chemical discharges from nuclear power stations (Annex) 117
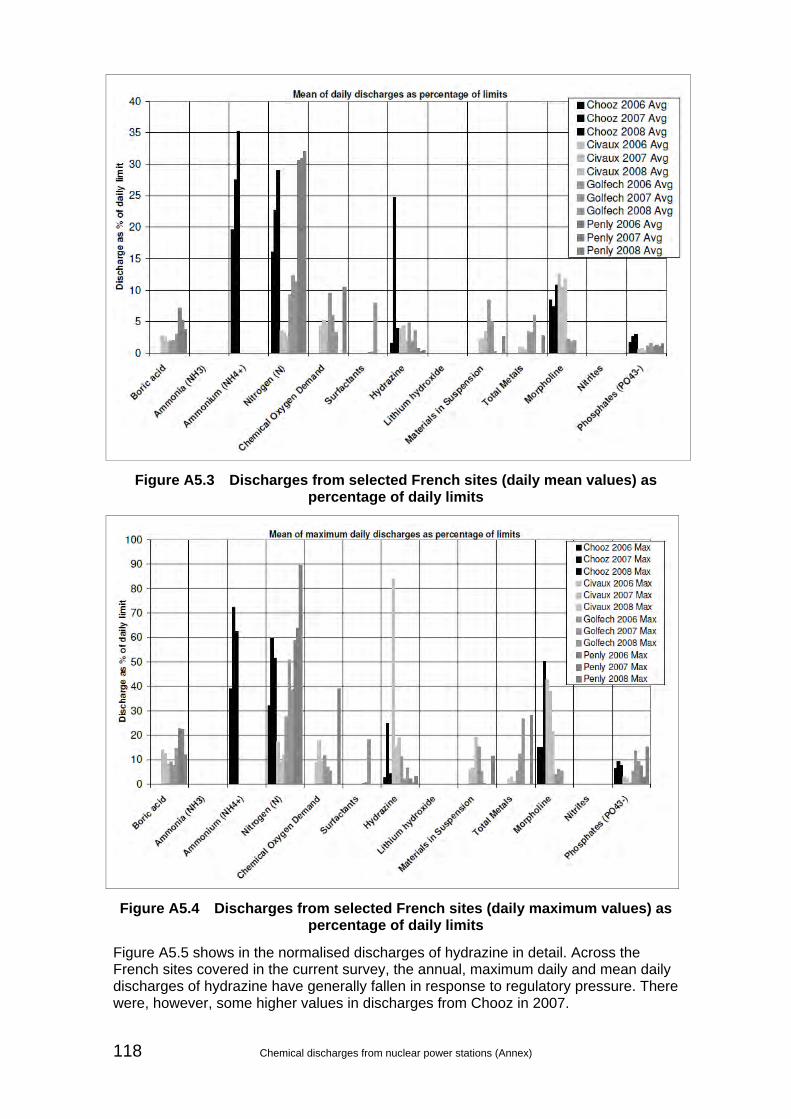
Figure A5.3 Discharges from selected French sites (daily mean values) as percentage of daily limits
Figure A5.4 Discharges from selected French sites (daily maximum values) as percentage of daily limits
Figure A5.5 shows in the normalised discharges of hydrazine in detail. Across the French sites covered in the current survey, the annual, maximum daily and mean daily discharges of hydrazine have generally fallen in response to regulatory pressure. There were, however, some higher values in discharges from Chooz in 2007.
118 Chemical discharges from nuclear power stations (Annex)

Annual, mean daily and maximum daily discharges of hydrazine as percentage of 2009 limits
0
5
10
15
20
25
30
35
Hydrazine annual Hydrazine mean daily Hydrazine max daily
Hyd
razi
ne a
s %
of l
imit
Chooz 2006Chooz 2007Chooz 2008Civaux 2006Civaux 2007Civaux 2008Golfech 2006Golfech 2007Golfech 2008Penly 2006Penly 2007Penly 2008
Figure A5.5 Detailed data for discharges of hydrazine
Discharges of chemicals from chlorination
Penly is the only coastal plant in this data set using once-through seawater cooling and standard chlorination to control biofouling. Annual and daily data were supplied for 2008 for the mass of chlorine used, and for the total residual oxidants and bromoform in the discharge. The permit specifies 24-hour flux limits for residual oxidants of 3,900 kg and for bromoform of 230 kg. There is no mass limit for chlorine dosing, only a concentration limit of 1 mg/l at the entry to the condensers.
The raw data (Section A6) suggest that, for 2008, the daily discharges of bromoform were 3–6 per cent of the daily mass limit while total residual oxidants were 8–14 per cent of the limit. As the mass discharges of these chlorination by-products are well below the discharge limits, this implies operators are able to control biofouling using lower levels of chlorine dosing than are allowed in the permit.
Discharges of sulphates from anti-scale treatment.
The data for Chooz and Golfech include discharges of sulphate from the use of sulphuric acid in cooling towers to prevent the build-up of hard scales. Table A5.13 summarises the data normalised to the site limits. It also includes total annual masses of sulphate discharged (there are no limits in the permits to normalise this data to).
Table A5.13 suggests that greater quantities of sulphate, and higher levels of sulphate relative to the site limit, are discharged from Chooz compared to Golfech. This suggests more regular and intensive dosing by sulphuric acid at Chooz to control build-up of hard scales, probably relating to the chemistry of the make-up to the cooling towers.
Chemical discharges from nuclear power stations (Annex) 119

Table A5.13 Discharges of sulphate from Chooz and Golfech due to anti-scale treatments
Chooz Golfech
2006 2007 2008 2006 2007 2008 Avg.1 Max.2 Avg. Max. Avg. Max. Avg. Max. Avg. Max. Avg. Max.Sulphate as % daily limit
48 80 50 69 55 83 17 43 20 65 19 54
Annual discharge (tonnes)
6,940 7,400 8,180 491 1,000 480
Notes: 1 The average daily discharges are normalised against a daily normal limit
of 40,000 kg. 2 The maximum daily discharges are normalised against the limit that
includes the additional headroom of 60,000 kg in 24 hours.
Discharge from site demineralisation facilities
Data for discharges of calcium, chlorides, iron, suspended solids, sodium and sulphates from the raw water treatment plants on each site were supplied. Daily and annual discharges were given, though not for all parameters at all four sites. Table A5.14 summarises of the discharges of sulphate from the demineralisation plant at Civaux.
Table A5.14 Discharge (tonnes) of sulphate from demineralisation plant at Civaux
Discharge 2006 2007 2008 Annual 2.8 19.0 1.30 Daily average 0.019 0.013 0.015 Daily maximum 0.093 0.029 0.061 Annual discharges of sulphate from the demineralisation plant at Civaux were significantly higher in 2007 than in 2006 or 2008. The mass discharges of sulphate due to demineralisation at Civaux are at least two orders of magnitude lower than those from the use of sulphuric acid for anti-scale treatments in the cooling towers at Chooz and Golfech.
The data for other parameters associated with discharges from the raw water and demineralisation plants on these four sites can be summarised as follows:
• The daily discharges of chloride from demineralisation plants at the inland plants of Chooz, Civaux and Golfech range from 5 to 72 per cent of the daily limit, the highest percentages being for chloride in discharges from Civaux (which has the most stringent limit for chloride of 1,080 kg per day). Discharges from the treatment plant at the coastal site at Penly are 38 percent (daily average) and 91 percent (daily maximum) of the limit.
• The daily discharges of sodium from demineralisation plants at the inland sites range from 6 to 67 per cent of the daily limit, the highest being at Civaux (which has the most stringent limit for sodium of 760 kg per day). Discharges from the treatment plant at the coastal site at Penly are 20 per cent (daily average) and 43 per cent (daily maximum) of the limit.
120 Chemical discharges from nuclear power stations (Annex)

• The mean and maximum daily discharges of iron from the demineralisation plant at Penly correspond to 37 and 100 per cent of the respective limits. Mean and maximum daily discharges of suspended solids are 29 and 83 per cent of the respective daily limits. No data were supplied for these parameters from the raw water treatment plants at Chooz or Civaux.
Overall, discharges from the demineralisation plants at these sites are dominated by components:
• present in the original feedwater;
• associated with the operation of the plants themselves (including corrosion products);
• from regeneration of the treatment media (such as resins and filters).
The components from regeneration of the treatment media will be accompanied by discharges of calcium and magnesium taken up on the ion exchange beds from the raw water and then released during the regeneration cycle.
A5.4.2 Discharge data from EDF annual reports (2007 and 2008)
This section deals with data from the 2007 and 2008 annual reports published by EDF (EDF 2010b3). These data, normalised to annual site limits for each parameter, are summarised for the inland sites (Golfech, Chooz, Civaux) in Figure A5.6 and for the coastal sites (Flamanville, Gravelines, Paluel, Penly) in Figure A5.7. Annual reports provide only simplified summaries of data and do not include all the parameters specified in the permits. Nevertheless, they provide useful additional data for the coastal sites.
Again the discharges of species associated with total nitrogen and phosphates tend to come closer to the discharge limits. There is no significant difference in the extent to which this occurs in discharges from the inland or coastal sites. Discharges of boric acid appear higher relative to the limit at Penly compared with the other sites, but operational reasons for this are not known.
3 More recent data for chemical discharges from the EDF plants have been published since this Annex report was compiled. Inspection of these data shows no significant new features from those observed using the older data available at the time of the writing.
Chemical discharges from nuclear power stations (Annex) 121
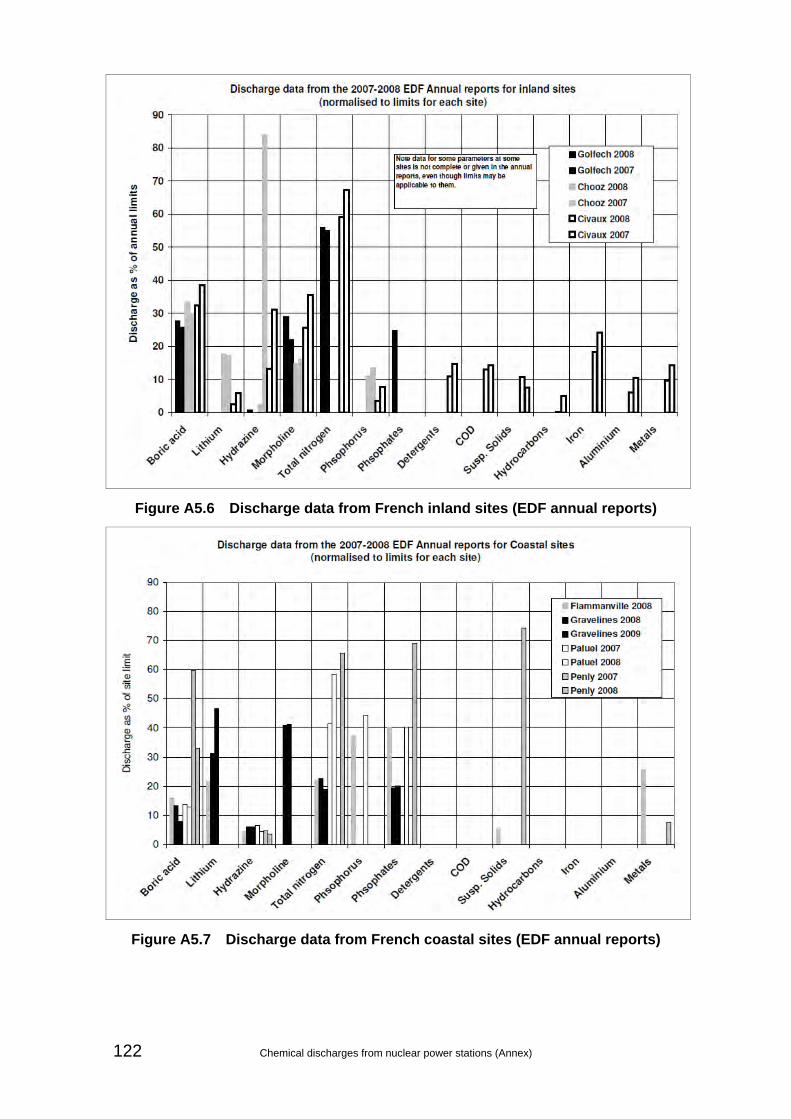
Figure A5.6 Discharge data from French inland sites (EDF annual reports)
Figure A5.7 Discharge data from French coastal sites (EDF annual reports)
122 Chemical discharges from nuclear power stations (Annex)

A5.4.3 Discharge data for 2001–2008 for Flamanville and Gravelines
EDF supplied a separate set of data for annual discharges from Flamanville from 2001 to 2008. A data set from a similar time period, but for a different range of parameters, was obtained from a publication about Gravelines (Drire and Diren 2008).
Data for Flamanville are shown plotted by year in Figure A5.8 and by parameter in Figure A5.9. All data are normalised to the 2008 discharge limits.
The main features shown in the figures are as follows:
• The plot by parameter shows that discharges of ammonium and phosphates come closer to the site limits than other parameters.
• The plot by parameter shows that discharges of boric acid, lithium, hydrazine, suspended solids, metals and detergents are mostly less than 20 per cent of the discharge limits.
Figure A5.8 Discharge data for Flamanville plotted by year (normalised to site limit)
• The plot by parameter shows that discharges of hydrazine have fallen significantly between 2006 and 2008. This is consistent with the trends for other plants (Figure A5.5). There are also some downward trends in the discharges of detergents, ammonium and suspended solids.
• Discharges of boron are all around 20 per cent of the limit, suggesting a consistent approach to the recycling and discharge of boric acid originating from coolant in let-down from the reactor circuit.
• Lithium and metals show no significant trends in discharges.
Chemical discharges from nuclear power stations (Annex) 123
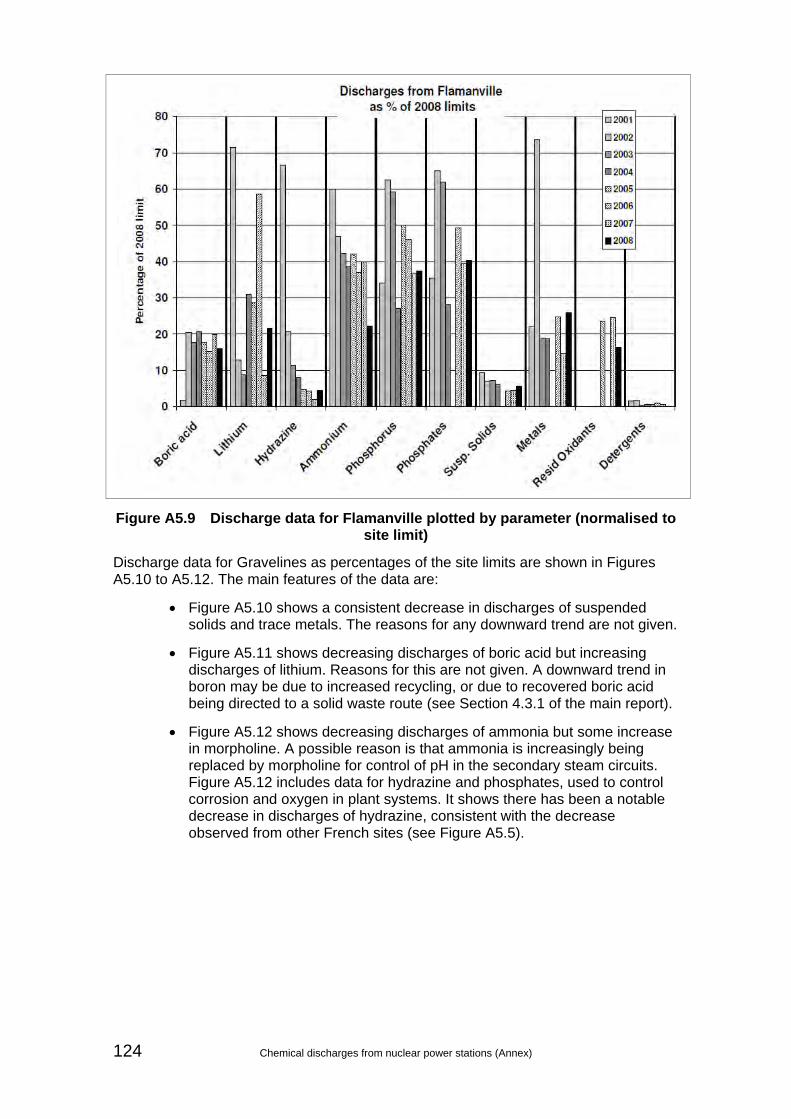
Figure A5.9 Discharge data for Flamanville plotted by parameter (normalised to site limit)
Discharge data for Gravelines as percentages of the site limits are shown in Figures A5.10 to A5.12. The main features of the data are:
• Figure A5.10 shows a consistent decrease in discharges of suspended solids and trace metals. The reasons for any downward trend are not given.
• Figure A5.11 shows decreasing discharges of boric acid but increasing discharges of lithium. Reasons for this are not given. A downward trend in boron may be due to increased recycling, or due to recovered boric acid being directed to a solid waste route (see Section 4.3.1 of the main report).
• Figure A5.12 shows decreasing discharges of ammonia but some increase in morpholine. A possible reason is that ammonia is increasingly being replaced by morpholine for control of pH in the secondary steam circuits. Figure A5.12 includes data for hydrazine and phosphates, used to control corrosion and oxygen in plant systems. It shows there has been a notable decrease in discharges of hydrazine, consistent with the decrease observed from other French sites (see Figure A5.5).
124 Chemical discharges from nuclear power stations (Annex)

Figure A5.10 Suspended solids and metals from Gravelines 2004–2006 (normalised to site limit)
Figure A5.11 Discharges of boron and lithium from Gravelines, 2001–2009 (normalised to site limit)
Chemical discharges from nuclear power stations (Annex) 125
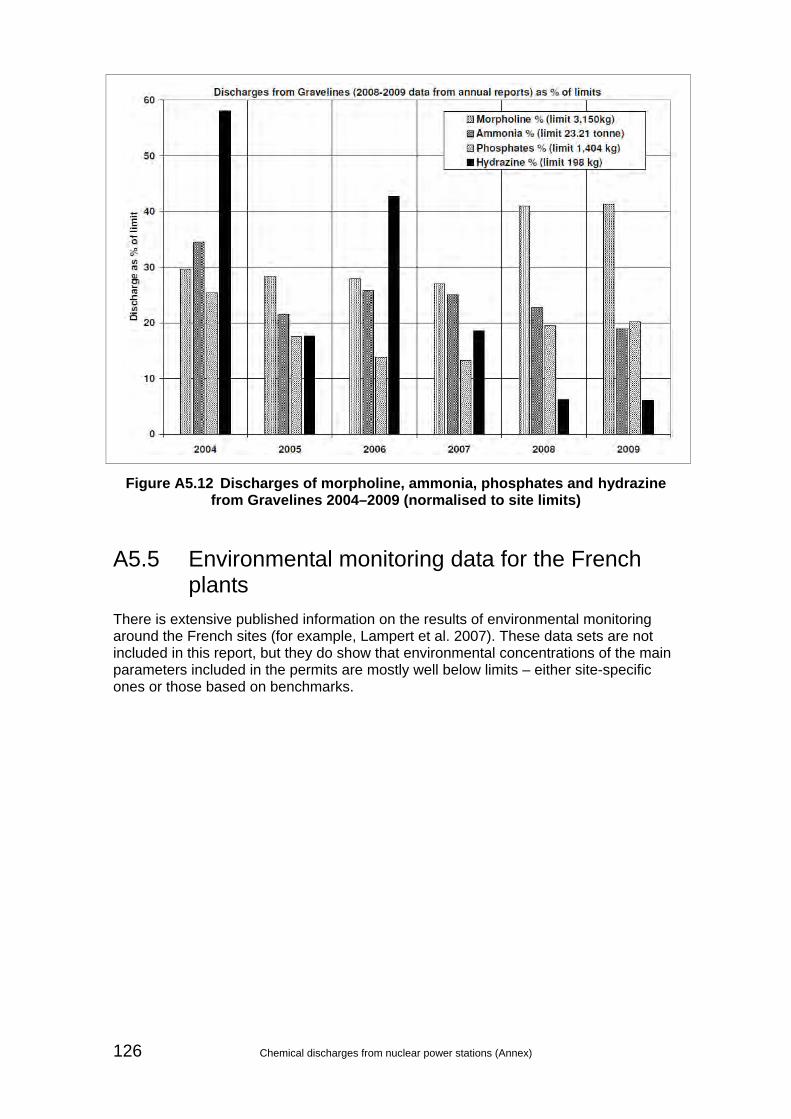
Figure A5.12 Discharges of morpholine, ammonia, phosphates and hydrazine from Gravelines 2004–2009 (normalised to site limits)
A5.5 Environmental monitoring data for the French plants
There is extensive published information on the results of environmental monitoring around the French sites (for example, Lampert et al. 2007). These data sets are not included in this report, but they do show that environmental concentrations of the main parameters included in the permits are mostly well below limits – either site-specific ones or those based on benchmarks.
126 Chemical discharges from nuclear power stations (Annex)

A6 Raw discharge data for the French PWR plants
Data for the selected French plants were obtained in several stages:
i. The initial list of selected plants was confined to Penly, Chooz, Civaux and Golfech. Data for these sites were supplied by EDF.
ii. As the assessment developed the need to include more coastal sites from France was recognised. Additional data were therefore obtained from EDF annual reports (2007 and 2008, and for Gravelines, 2009).
iii. Data were also obtained from separate sources for Flamanville and Gravelines.
This section contains only the raw data originally supplied by EDF for the initial set of PWR power station sites (item i in the list above) (Table A6.1). Figures A6.1 to A6.4 present data on various chemical substances associated with liquid radioactive effluents from the nuclear island and turbine hall discharge (KER-SEK) at the four plants. Figures A6.5 and A6.6 present data on various chemical substances present in discharges associated with biocide treatment at Chooz and Golfech.
Items ii and iii are described in Annex Section A5.
Chemical discharges from nuclear power stations (Annex) 127

Table A6.1 Raw data supplied by EDF for Golfech, Civaux, Chooz and Penly
128 Chemical discharges from nuclear power stations (Annex)

Table A6.1 (continued)
Chemical discharges from nuclear power stations (Annex) 129

Figure A6.1 Boric acid, ammonia, ammonium and total nitrogen associated with liquid radioactive effluents from the nuclear island and turbine hall discharge
(KER-SEK)
130 Chemical discharges from nuclear power stations (Annex)

Figure A6.2 Chemical oxygen demand, detergents, hydrazine and lithium associated with liquid radioactive effluents from the nuclear island and turbine
hall discharge (KER-SEK)
Chemical discharges from nuclear power stations (Annex) 131
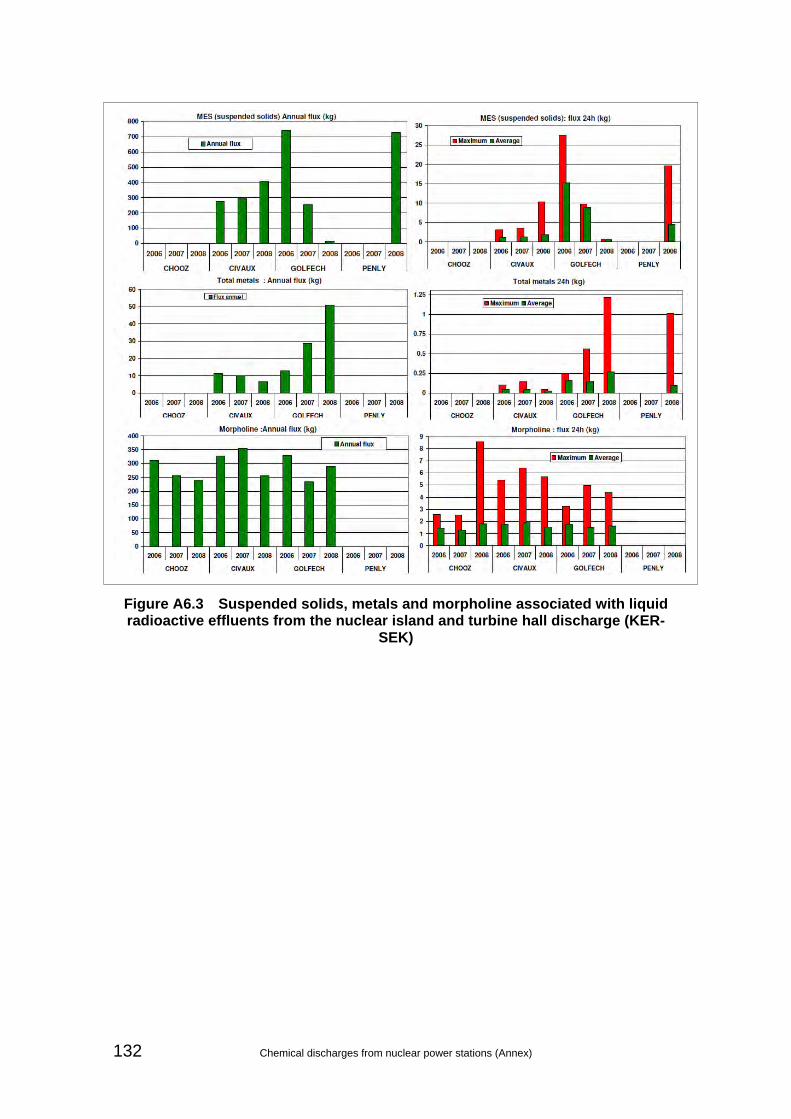
Figure A6.3 Suspended solids, metals and morpholine associated with liquid radioactive effluents from the nuclear island and turbine hall discharge (KER-
SEK)
132 Chemical discharges from nuclear power stations (Annex)

Figure A6.4 Phosphates, nitrite and sulphate associated with liquid radioactive effluents from the nuclear island and turbine hall discharge (KER-SEK)
Chemical discharges from nuclear power stations (Annex) 133

Figure A6.5 Ammonium, AOX, chlorides and total residual chlorine in discharges associated with biocide treatment at Chooz and Golfech
134 Chemical discharges from nuclear power stations (Annex)

Figure A6.6 Nitrates, nitrites and sodium in effluents associated with biocide treatment, Chooz and Golfech
Chemical discharges from nuclear power stations (Annex) 135

Figure A6.7 Bromoform, injected chlorine and residual oxidants in effluents associated with electrochlorination (Penly only)
136 Chemical discharges from nuclear power stations (Annex)

Figure A6.8 Chloride, iron and suspended solid discharges from demineralisation plants
Chemical discharges from nuclear power stations (Annex) 137

Figure A6.9 Sodium, sulphates and calcium discharges from demineralisation plants
Figure A6.10 Sulphate discharges due to anti-scale treatments at Chooz and Golfech
138 Chemical discharges from nuclear power stations (Annex)

A7 German PWR plants
A7.1 Neckarwestheim (EPR™ predecessor) The Neckarwestheim site is located on the Neckar River in the far southwest corner of Germany. It has two PWR power plants. The largest and most recently built (Unit 2) is a 1,400 MW(e) PWR operated by EnBW Kernkraft GmbH. The site also has a smaller PWR of 840 MW(e), which was commissioned in 1976 and is used to produce power for the local rail network.
The main cooling water for Unit 2 was originally to be supplied using a standard natural draft, wet cooling tower with make-up and blowdown to the River Neckar. However the design was changed to a dry hybrid cooling tower (with a reduced height of 51 m) to reduce thermal impacts on the river and the visual impact of a large tower and its plume. The smaller Unit 1 PWR uses nests of smaller mechanical draft towers, again to minimise thermal impacts on the river. Using these types of cooling towers will reduce discharges of cooling circuit biocides, either in blowdown or entrained in the aerial plume. This may be at the expense of increased capital costs and reduced plant operating efficiency.
Unit 2 uses enriched boric acid (EBA, enriched in boron-10) in the primary reactor circuit. This is recycled, as far as possible, to reduce the cost of buying fresh supplies of this chemical and to reduce discharges (see Section 4.3.1 of the main report). Solutions of EBA that cannot be recycled are concentrated by evaporation and the concentrates are converted to a solid waste form.
In the secondary circuit of Unit 2, standard all volatile treatments were applied until the 1980s, with the pH of steam generator feedwater being around 9.5. However, the plant now uses a modified method – so-called ‘high’ all volatile treatment. This involves injecting high levels of hydrazine to maintain strongly reducing conditions in the steam generators. It achieves a higher pH of around 10.0 through decomposition of hydrazine into ammonia. This has reduced the concentrations of iron in feedwater reaching the steam generators from around 10 µg/l to less than 5 µg/l. Because of this reduction in iron concentrations, the need for sludge lancing and cleaning of the steam generators has reduced from annually to about once every three years.
Using high all volatile treatment causes high levels of ammonia in blowdown water from the steam generators. The ammonia is then taken up in the ion exchange resins used to treat the blowdown prior to its discharge. When these ion exchange resins are regenerated, this ammonia appears in the final effluent (see Section 4.3.4 of the main report). For this reason, dedicated plant is used at Neckarwestheim to reduce discharges of ammonia from this source and also from any effluents produced by the regeneration of the ion exchange resins used in the condensate polishing plant.
The treatment plant consists of a two part stripping column, a chemical reactor and associated feed pumps. The strippers remove ammonia from the water and then heat it to 300°C to convert it to nitrogen gas and water. This reduces concentrations of ammonia species in waste process liquor from 1,400 mg/l to less than 12 mg/l, allowing it to be discharged to the Neckar River.
Chemical discharges from nuclear power stations (Annex) 139

A7.2 Isar 2 (EPR™ predecessor) Isar is the site of two nuclear plants. Isar 1 is a boiling water reactor that is shutdown in preparation for decommissioning. Isar 2 is a 1,400 MW(e) PWR operated by E.ON which uses a standard four-loop primary circuit and a single turbine generator. The secondary steam circuit uses cooling via a natural draft wet cooling tower, with make-up water drawn from the nearby Isar River. Cooling tower blowdown and smaller treated plant waste streams are discharged to the Isar River. The river is a high quality water resource with no other discharges from heavy industry. Discharge limits in the permit are therefore especially stringent.
The plant operators advise that the chemicals used at Isar 2 are similar to those used in other German PWRs, the main bulk chemicals used being:
• sulphuric acid, hydrochloric acid and caustic soda (for the regeneration of ion exchange resins);
• iron sulphate and lime flour (used as flocculants for treating waste water);
• hardness stabiliser and hydrogen peroxide (used for controlling water chemistry in the wet cooling towers (no mention is made of use of stronger proprietary biocides);
• hydrazine and ammonia (secondary circuit chemistry control);
• boric acid and lithium hydroxide (primary circuit chemistry control).
The main liquid effluents produced by the plant are:
• effluents from the regeneration of ion exchange resins used in the condensate polishing plant;
• back wash water from regeneration of the ion exchange resins in the raw water treatment plant;
• make-up and discharge from the cooling water towers in the secondary steam circuit;
• effluents from the auxiliary boiler plant and sampling systems;
• back-flushing of electromagnetic filters used in the primary circuit.
The electromagnetic filters use electromagnets to remove magnetic corrosion products of iron and nickel from the primary reactor coolant. They are different from the more conventional passive cartridge filters, which rather than being back-flushed are directed to a solid intermediate level radioactive waste stream. The main advantage of the magnetic filters is that they avoid the need to handle and then treat cartridge filters that can be a source of high doses of radiation to plant operatives due to high levels of coblalt-60 present.
The plant operators advise that water from the conventional side of the plant (such as the turbine generators) is treated in two 600 m3 neutralisation basins. In these, pH is adjusted and solids are removed by settling and using oil–water separators.
A7.2.1 Discharge data for Isar 2
The permit lists five separate discharge routes with discharge limits for a range of parameters. The plant supplied discharge data for 2008 and stated that these are similar to other years. Table A7.1 summarises the data supplied for the four main
140 Chemical discharges from nuclear power stations (Annex)

discharge routes. The permit bans any discharge of dispersing agents, oils and grease, corrosion inhibitors and biocides (other than hydrogen peroxide) without prior permission. There are also specific requirements for sampling, monitoring and analysis.
Table A7.1 Discharge routes, limits and 2008 discharges for Isar 2 1,2
Parameter Limit Mean discharge
Maximum discharge
Main discharge water pH 6.5–9.0 8.4 8.6 Conductivity (μS/cm) - 1,402 1,614 Sulphate 900 510 601 Chemical oxygen demand 30 17.0 28.0 Total phosphorus 1 0.31 0.42 Suspended solids 50 9.2 31.2 Chloride - 68 101 Calcium - 204 226 Chromium - 0.001 0.002 Nickel - 0.006 0.009 Iron - 2.4 3.9 Ammonia (as N) - 0.05 0.12 Hardness - 14.4 17.0 Scrubber water pH 5.0–10.0 8.1 9.8 Chemical oxygen demand 50 13.0 37.0 Hydrazine 2 0.1 1.3 Total phosphorus 0.8 0.16 0.35 Ammonia (as N) 10 1.18 7.3 Nitrogen 10 1.18 7.3 Suspended solids 30 10.4 27 Special process water pH 6.0–10.5 8.3 8.7 Chemical oxygen demand 25 3.6 4.0 Nitrogen 10 10 9.8 Suspended solids 30 <0.1 <0.1 Hydrazine 2 0.23 5.3 Neutralisation waste water pH 4.0–10.0 7.8 9.2 Chemical oxygen demand 50 18.6 48.0 Nitrogen 10 0.7 4.0 Notes: 1 Blanks indicate not specified. 2 All units are mg/l unless otherwise stated. Limits for the parameters in the main discharge (cooling tower blowdown) are generally consistent with those for the US and French plants. Scrubber water, special process water and waste water from neutralisation are all internal outfalls and concentrations of hydrazine in these are similar to those reported for internal discharges at Byron (where there has been regulatory emphasis on this chemical). Concentrations of suspended
Chemical discharges from nuclear power stations (Annex) 141

solids are consistent and similar to those reported for the US plants, that is, within CFR 40 limits of 30 or 100 mg/l.
There appears no specific information on use or discharges of biocides. Plant operators state that there is greater emphasis on the volumes of water extracted from the river and thermal impacts of the discharges of cooling tower blowdown on the river.
142 Chemical discharges from nuclear power stations (Annex)

Chemical discharges from nuclear power stations (Annex) 143
A8 Chemical data in support of the ecotoxicity assessment
Table A8.1 lists the main chemicals identified from the operating PWR nuclear power stations included in the survey (summarised in Table 3.1 in the main report). For each chemical it includes:
• Chemical Abstracts Service (CAS) number;
• whether the chemical is included in List I or List II of the EU Dangerous Substances Directive;
• whether it is included in Annex VIII of the Water Framework Directive;
• an overview of likely stability;
• relevant Environmental Quality Standard data.
Table A8.2 covers the same listing of chemicals and includes:
• lowest acute and chronic ecotoxicity data;
• whether the material is considered persistent, toxic and/or bio-accumulative (PBT);
• any relevant risk phrases;
• references.
This section of the Annex report supports the assessments carried out in Section 7 of the main report but is by no means an exhaustive treatment of all the ecotoxicity data available or of those data that might be required to support or demonstrate safe use of these chemicals at any particular power station site.
In addition, many chemicals used at any site will consist of proprietary mixtures. While some of these (for example, an anti-corrosion additive) may be dominated by one or two of the individual species in the following listings, such mixtures may contain a wide range of other additives to enhance their overall performance or, for example, to extend their shelf life. Full ecotoxicological data and human health impacts would need to be established from the relevant Material Safety Data Sheets.

Fresh water EQS
Marine EQS
Other fresh water criteria (not
drinking water standards)
Other marine criteria
Boric acid 10043-35-3 11113-50-1
CMR & metals and compounds
List II - metals and compounds inorganic 2 7 no no Environment Agency Chemical Standards Database - UK
Statutory Guidance
Lithium hydroxide 1310-65-2 54251-08-0
Metals & their compounds no inorganic no no no no
Hydrazine 302-01-2 CMR no some degraded in plant and after discharge no no no no
Carbohydrazide 497-18-7 no no degraded in plant and after discharge no no no no
Ammonia 7664-41-7 Effect on oxygen balance
List II - effect on oxygen balance
equilibrium between ammonia and ammonium
is important0.021 0.005 - 0.025 no
UK Environmental Standard for un-ionised ammonia as nitrogen (annual mean transistional and coastal waters) / Freshwater Fish Directive
Hydrogen peroxide 7722-84-1 no no degraded in plant and after discharge no no no no
Ethanolamine 141-43-5 if PBT no some degredation in plant and after discharge no no no no
Morpholine 110-91-8 if PBT no some degredation in plant and after discharge no no no no
Sarcosine (2-(methylamino)acetic acid) 107-97-1 if PBT no some degredation in plant and after discharge no no no no
5-aminopentanol 2508-29-4 if PBT no some degredation in plant and after discharge no no no no
Aminomethylpropanol 68298-05-5 if PBT no some degredation in plant and after discharge no no no no
3-Methoxypropylamine 5332-73-0 if PBT no some degredation in plant and after discharge no no no no
Pyrrolidine 123-75-1 if PBT no unknown no no no noSulphuric acid 7664-93-9 no no forms neutral salts no no pH pHSodium hydroxide 1310-73-2 no no forms neutral salts no no pH pHHydrochloric acid 7647-01-0 no no forms neutral salts no no pH pHSurfactants group n/a n/a vary in biodegradability n/a n/a n/a n/a
Complexing agents e.g. EDTA 60-00-4 (EDTA) if PBT no vary in biodegradability 0.4 0.4 no no UK Non-Statutory EQS (annual average freshwater and
saltwater)Citric acid 77-92-9 if PBT no unknown no no no noOxalic acid 144-62-7 if PBT no unknown no no no noSodium carbonate 497-19-8 no no forms neutral salts no no no no
Sodium phosphate (Na3PO4) 96337-98-3 Contributes to eutrophication
List II - inorganic compounds P inorganic no no no no
Sodium hexametaphosphate (NaPO 3)6 10124-56-8 Contributes to eutrophication
List II - inorganic compounds P inorganic no no no no
Trisodium phosphate 7601-54-9 Contributes to eutrophication
List II - inorganic compounds P inorganic no no no no
Sodium nitrate 7631-99-4 Contributes to eutrophication no neutral salt no no no no
Sodium nitrite 7632-00-0 Effect on oxygen balance
List II - effect on oxygen balance neutral salt no no 0.01 - 0.03 no Freshwater Fish Directive
Borax (sodium tetraborate, or disodium tetraborate) 1330-43-4 Metals & their
compoundsList II - metals and
compounds neutral salt no no no no
Potassium chromate 7789-00-6 Metals & their compounds
List II - metals and compounds neutral salt no no no no
Sodium molybdate Na2MoO4 7631-95-0 Metals & their compounds
List II - metals and compounds neutral salt no no no no
Benzotriazole 95-14-7 if PBT no not biodegradable no no no no
Triazole 37306-44-8 (group) n/a n/a triazoles are generally
persistent n/a n/a n/a n/a
Tolytriazole 29385-43-1 if PBT no triazoles are generally persistent no no no no
Amino trimethylene phosphonic acid (ATMP) N(CH2PO3H2)3
6419-19-8 if PBT no unknown no no no no
2-Hydroxyphosphonocarboxylic Acid (HPAA) 23783-26-8 if PBT no unkown no no no no
Polyacrylic acid 9003-01-4 if PBT no unknown no no no no
Chemical Dangerous substance?
Breakdown or reaction products? EQS Reference / Other Reference
Surface water quality standards (mg/l)Specific Pollutant
(Annex VIII of WFD)?
CAS number

Fresh water EQS
Marine EQS
Other fresh water criteria (not
drinking water standards)
Other marine criteria
Chemical Dangerous substance?
Breakdown or reaction products? EQS Reference / Other Reference
Surface water quality standards (mg/l)Specific Pollutant
(Annex VIII of WFD)?
CAS number
Brine group n/a n/a neutral salt no no no 10% Shellfish Directive (discharge must not cause salinity of receiving water to increase by 10%)
Ferric chloride 7705-08-010025-77-1
Metals & compounds / materials in suspsension
no inorganic no no no no
Aluminium chloride 7446-70-0
Metals & compounds / materials in suspsension
no inorganic no no no no
Chlorine (data for free available chlorine, hypochlorous acid and hypochlorite)
7782-50-5 Biocide List II - biocide trihalo-methanes 0.002 0.01 0.005 noUK Environmental Standard for chlorine (annual mean freshwater, 95% TRO for transistional and coastal waters) / Freshwater Fish Directive for total residual chlorine
Chlorine dioxide (data for chlorine dioxide, chlorate and chlorite) 10049-04-4 Biocide List II - biocide trihalo-methanes no no no no
Bromoform / bromine compounds (data for free available bromine, hypobromous acid, hypobromite)
75-25-2 (bromoform) 7726-95-6 (bromine)
Biocide List II - biocide trihalo-methanes 0.002 0.01 no no UK Non-Statutory EQS total residual oxidant (freshwater annual average, saltwater MAC)
Copper 7440-50-8 Metals & their compounds
List II - metals and compounds
may adsorb or precipitate to solid forms
0.001 - 0.028 0.005 0.005 - 0.112 no
UK Environmental Standard for copper (annual mean freshwater - hardness dependent, annual mean transistional and coastal waters) / Freshwater Fish Directive (95% of annual average).
Zinc 7440-66-6 Metals & their compounds
List II - metals and compounds
may adsorb or precipitate to solid forms
0.008 - 0.125 0.04 0.03 - 2 no
UK Environmental Standard for zinc (annual mean freshwater - hardness dependent, annual mean transistional and coastal waters) / Freshwater Fish Directive (95% of annual average).
Nickel 7440-02-0 Metals & their compounds
List II - metals and compounds
may adsorb or precipitate to solid forms 0.02 0.02 no no EU Priority Substance EQS
Manganese 7439-96-5 Metals & their compounds no may adsorb or precipitate
to solid forms 0.03 no no no Environment Agency Chemical Standards Database - Non-Statutory EQS
Iron 7439-89-6 Metals & their compounds no may adsorb or precipitate
to solid forms 1 1 no no UK Environmental Standard for iron (annual mean freshwater, annual mean transistional and coastal water)
Chromium (VI and III) 7440-47-3 Metals & their compounds
List II - metals and compounds
may adsorb or precipitate to solid forms
0.0034 Cr(VI) 0.0047 Cr(III)
0.0006 Cr (VI) no no UK Environmental Standard for chromium (annual mean
freshwater, annual mean transistional and coastal water)
Lead 7439-92-1 Metals & their compounds
List II - metals and compounds inorganic 0.0072 0.0072 no no EU Priority Substance EQS
Chlorinated hydrocarbons group if PBT List I - organohalogens
various degradation mechanisms n/a n/a n/a n/a
Leaching from antifouling coatings group n/a n/a vary n/a n/a n/a n/a
pH parameter no no changes with buffering 6 - 9 6.0 - 8.5 6 - 9 7 - 9UK Environmental Standard for acid conditions (5% to 95% freshwater rivers) / Freshwater Fish Directive / Shellfish Directive
COD parameter n/a n/a n/a no no no no
BOD parameter n/a n/a n/a 3 - 5 no 3 - 6 no UK Environmental Standard for biochemical oxygen demand for rivers / Freshwater Fish Directive
Suspended solids parameter Materials in suspension no
settle out or may remain in suspension depending
on conditionsno no 25 30%
Freshwater Fish Directive / Shellfish Directive (discharge must not cause the suspended solid content of the receiving water to increase by 30%)
Oil group If persistent List I if persistent, List II if not
vary according to molecular weight and
typeno no
no visible sheen or harmful
effects
no visible sheen or
harmful effectsFreshwater Fish Directive / Shellfish Directive
Herbicides group Biocide List I or List II modern types generally biodegradable n/a n/a n/a n/a
Pesticides group Biocide List I or List II modern types generally biodegradable n/a n/a n/a n/a
EU Priority Substance EQS - 2008/115/ECUK Environmental Standards from The River Basin Districts Typology, Standards and Groundwater Threshold Values (Water Framework Directive) (England and Wales) Directions 2009UK Non-Statutory EQS from H1 Annex D (Environment Agency 2011)
CAS - Chemicals Abstracts Service; EQS - Environmental Quality Standard; MAC - Maximum Allowable Concentration; PBT - Persistent Bioaccumulative and Toxic; WFD - Water Framework Directive
ReferencesDangerous substances - those listed in Annex I of Directive 2006/11/EC
Water Framework Directive 2000/60/ECAcronyms

Table A8.2 Chemical listing, ecotoxicity and PBT data
146 Chemical discharges from nuclear power stations (Annex)

Chemical discharges from nuclear power stations (Annex) 147
Table A8.2 (continued.) Chemical listing, ecotoxicity and PBT data

We are The Environment Agency. It's our job to look after your environment and make it a better place – for you, and for future generations.
Your environment is the air you breathe, the water you drink and the ground you walk on. Working with business, Government and society as a whole, we are making your environment cleaner and healthier.
The Environment Agency. Out there, making your environment a better place.
Published by: Environment Agency Horizon House Deanery Road Bristol, BS1 5AH Tel: 0870 8506506 Email: [email protected] www.environment-agency.gov.uk © Environment Agency All rights reserved. This document may be reproduced with prior permission of the Environment Agency.