AppDNA Effort Calculator Report
21
AppDNA Effort Calculator Report Prepared for Citrix Customer 10-Dec-12 01:36:41 PM
Transcript of AppDNA Effort Calculator Report

AppDNA Effort Calculator Report Prepared for Citrix Customer
10-Dec-12 01:36:41 PM
Page 2
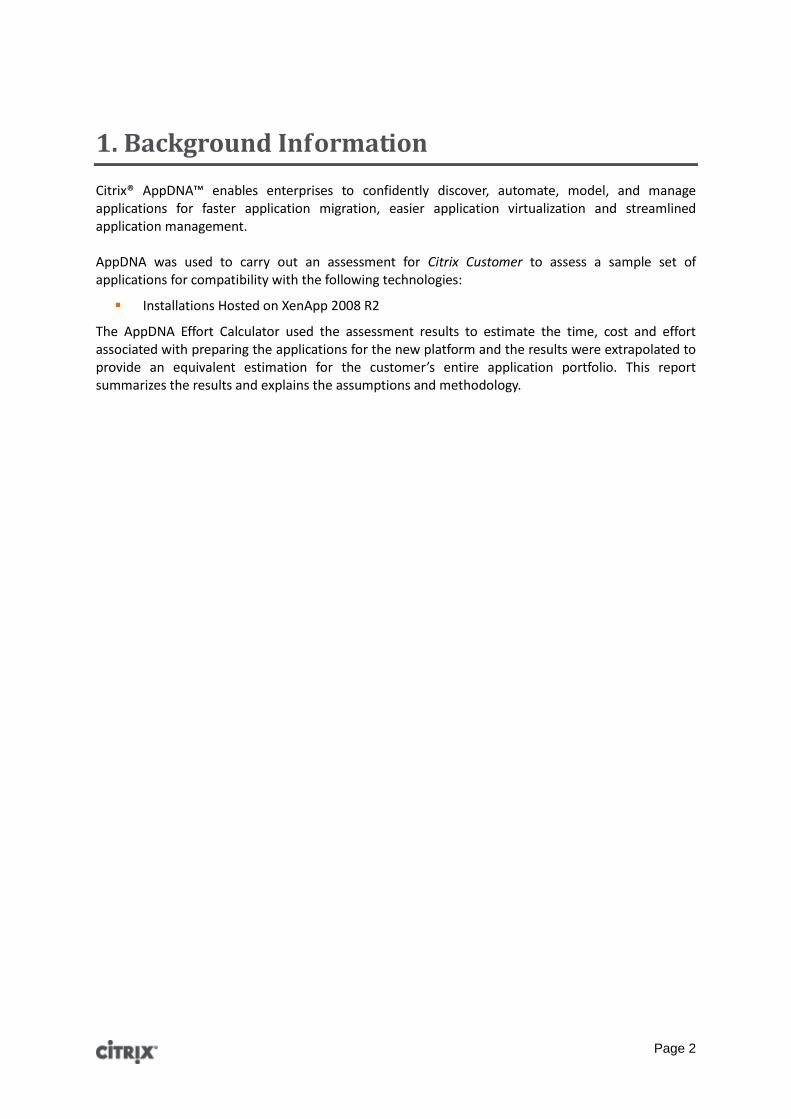
1. Background Information
Citrix® AppDNA™ enables enterprises to confidently discover, automate, model, and manage applications for faster application migration, easier application virtualization and streamlined application management. AppDNA was used to carry out an assessment for Citrix Customer to assess a sample set of applications for compatibility with the following technologies:
Installations Hosted on XenApp 2008 R2
The AppDNA Effort Calculator used the assessment results to estimate the time, cost and effort associated with preparing the applications for the new platform and the results were extrapolated to provide an equivalent estimation for the customer’s entire application portfolio. This report summarizes the results and explains the assumptions and methodology.
Page 3
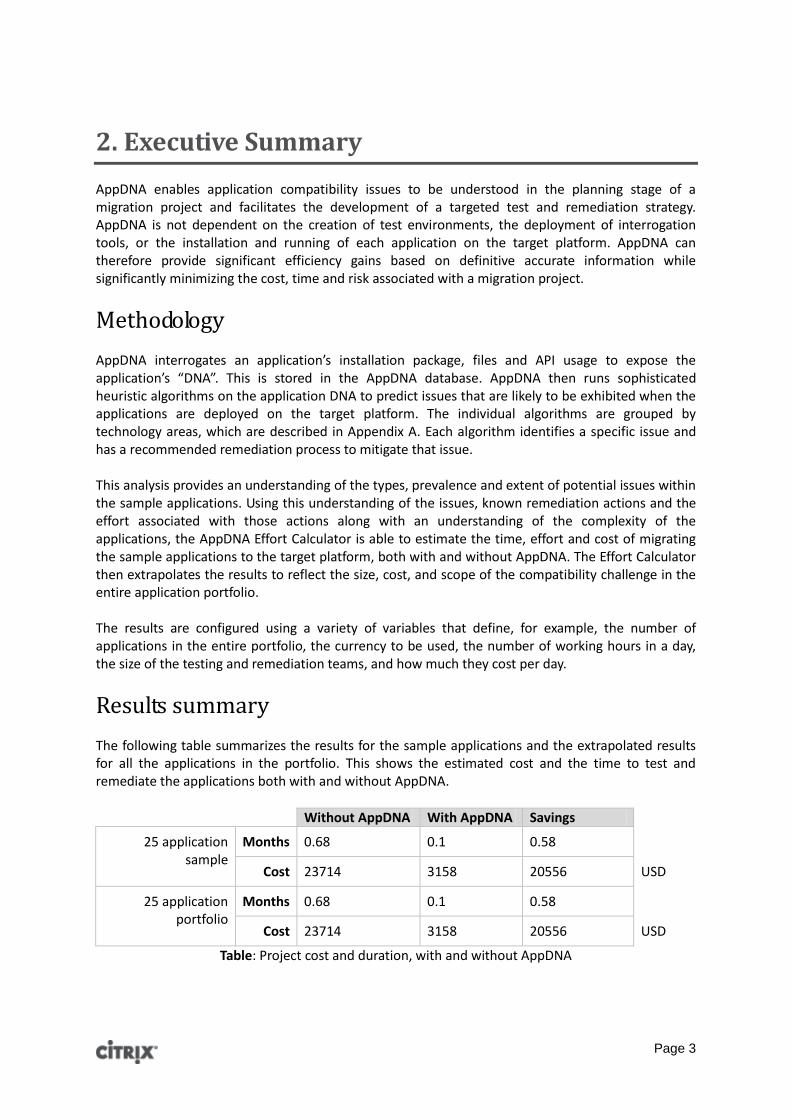
2. Executive Summary
AppDNA enables application compatibility issues to be understood in the planning stage of a migration project and facilitates the development of a targeted test and remediation strategy. AppDNA is not dependent on the creation of test environments, the deployment of interrogation tools, or the installation and running of each application on the target platform. AppDNA can therefore provide significant efficiency gains based on definitive accurate information while significantly minimizing the cost, time and risk associated with a migration project.
Methodology AppDNA interrogates an application’s installation package, files and API usage to expose the application’s “DNA”. This is stored in the AppDNA database. AppDNA then runs sophisticated heuristic algorithms on the application DNA to predict issues that are likely to be exhibited when the applications are deployed on the target platform. The individual algorithms are grouped by technology areas, which are described in Appendix A. Each algorithm identifies a specific issue and has a recommended remediation process to mitigate that issue. This analysis provides an understanding of the types, prevalence and extent of potential issues within the sample applications. Using this understanding of the issues, known remediation actions and the effort associated with those actions along with an understanding of the complexity of the applications, the AppDNA Effort Calculator is able to estimate the time, effort and cost of migrating the sample applications to the target platform, both with and without AppDNA. The Effort Calculator then extrapolates the results to reflect the size, cost, and scope of the compatibility challenge in the entire application portfolio. The results are configured using a variety of variables that define, for example, the number of applications in the entire portfolio, the currency to be used, the number of working hours in a day, the size of the testing and remediation teams, and how much they cost per day.
Results summary The following table summarizes the results for the sample applications and the extrapolated results for all the applications in the portfolio. This shows the estimated cost and the time to test and remediate the applications both with and without AppDNA.
Without AppDNA With AppDNA Savings
25 application sample
Months 0.68 0.1 0.58
Cost 23714 3158 20556 USD
25 application portfolio
Months 0.68 0.1 0.58
Cost 23714 3158 20556 USD
Table: Project cost and duration, with and without AppDNA

Page 4
Without AppDNA and based on the currently available resources and best effort estimation, the effort associated with the project can be summarized as follows:
25 applications are in scope On average, each application costs 948.56 USD to test and remediate On average, each application takes 1.91 days to test and remediate The project team has 8 people The project will take 0.68 months to complete
With AppDNA, the effort associated with the project can be summarized as follows:
The cost per application will reduce to 126.32 USD The average time to test and remediate an application will reduce to 0.33 days The project can be completed in 0.1 months, a reduction of 0.58 months. This represents a saving of 20,556 USD
Figure: Relative project durations with and without AppDNA
Page 5
3. Installations Hosted on XenApp 2008 R2 compatibility assessment
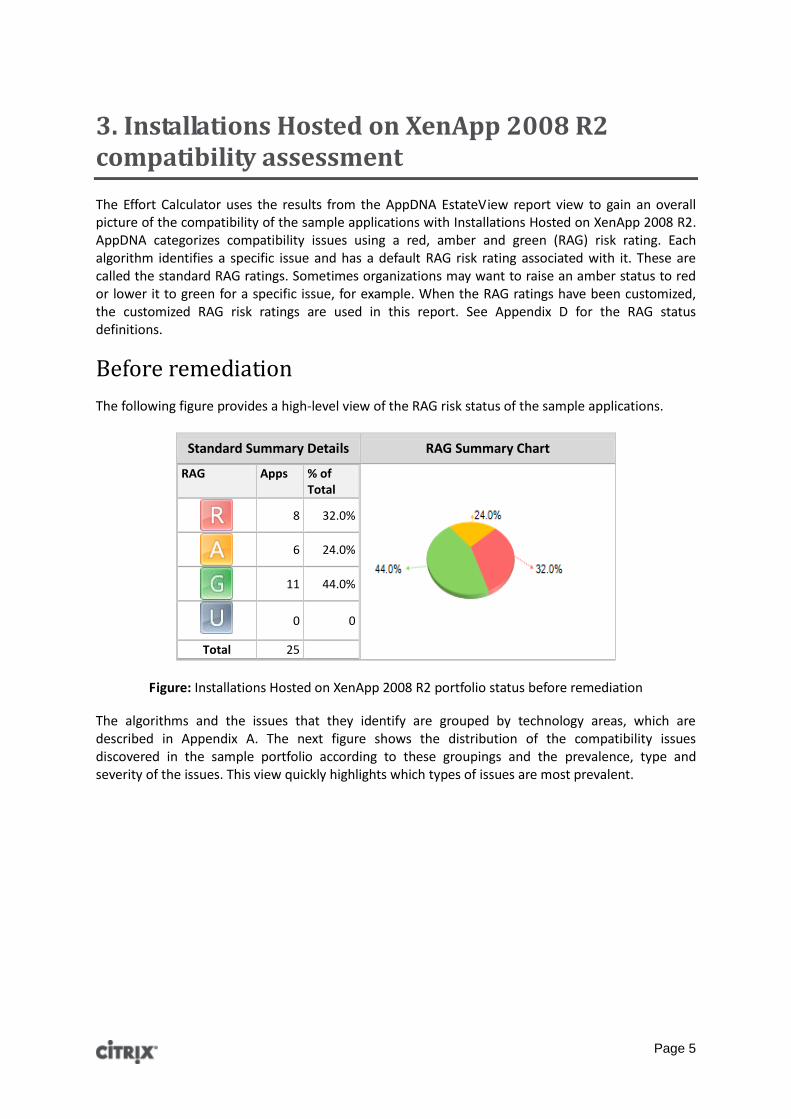
The Effort Calculator uses the results from the AppDNA EstateView report view to gain an overall picture of the compatibility of the sample applications with Installations Hosted on XenApp 2008 R2. AppDNA categorizes compatibility issues using a red, amber and green (RAG) risk rating. Each algorithm identifies a specific issue and has a default RAG risk rating associated with it. These are called the standard RAG ratings. Sometimes organizations may want to raise an amber status to red or lower it to green for a specific issue, for example. When the RAG ratings have been customized, the customized RAG risk ratings are used in this report. See Appendix D for the RAG status definitions.
Before remediation
The following figure provides a high-level view of the RAG risk status of the sample applications.
Standard Summary Details RAG Summary Chart
RAG Apps % of Total
8 32.0%
6 24.0%
11 44.0%
0 0
Total 25
Figure: Installations Hosted on XenApp 2008 R2 portfolio status before remediation
The algorithms and the issues that they identify are grouped by technology areas, which are described in Appendix A. The next figure shows the distribution of the compatibility issues discovered in the sample portfolio according to these groupings and the prevalence, type and severity of the issues. This view quickly highlights which types of issues are most prevalent.

Page 6
Figure: Installations Hosted on XenApp 2008 R2 issue distribution

Page 7
After remediation One of the significant benefits of AppDNA is that each compatibility issue that is identified has a remediation activity (called an action) associated with it. Each action has an associated “action RAG”, which indicates the compatibility status after the action has been performed. Some actions may leave the application in a red state, which indicates an exception. This means that the application may need to be redeveloped or decommissioned. Where an issue can be resolved through the suggested action, the action RAG is green. Some issues may require testing before a remediation can be decided. The action RAG is then amber, which indicates that further testing is required. After the implementation of the recommended remediation actions, the application states and testing methodologies can be summarized as:
Applications that transition from an incompatible state to a compatible state (green) can be progressed to light user acceptance testing (UAT)
Applications that have a partial remediation require additional targeted testing (these are shown as amber)
Applications that have severe compatibility issues are treated as exceptions and are shown as red
The following figure provides a view of the sample application portfolio’s compatibility status as it will be after the suggested remediation activities have been applied to the sample applications.
Standard Summary Details Action RAG Summary Chart RAG Apps % of
Total
7 28.0%
1 4.0%
17 68.0%
Total 25
Figure: Installations Hosted on XenApp 2008 R2 portfolio status after remediation
The before remediation assessment summary indicates that the sample portfolio is 44.0% green. This can be transformed to 68.0% green after remediation. Applications that have issues for which there are known remediations will shift from amber or red into the green category. The 4.0% of applications making up the amber category after remediation carry issues for which the remediation action is further testing. Some issues cannot be remediated with certainty and applications with these types of issues may require further testing before a remediation strategy can be applied. This amber category then has no associated remediation but is targeted for more direct analysis and testing. The remaining 28.0% of applications classified as red indicate exceptions; these are applications with underlying compatibility issues that will not be remediated via the current process. Applications that are defined as exceptions should be escalated to the vendor for a compatible version of the application or an alternative application provisioning technology should be utilized. The amount of effort required to remediate the issues identified above is determined by a combination of the following:
Page 8
Application complexity - This is determined by the number of registry entries and files in the application
Remediation complexity – This is determined by the complexity of the issue and remediation activity
For more information about application and remediation complexity, see Appendix C.
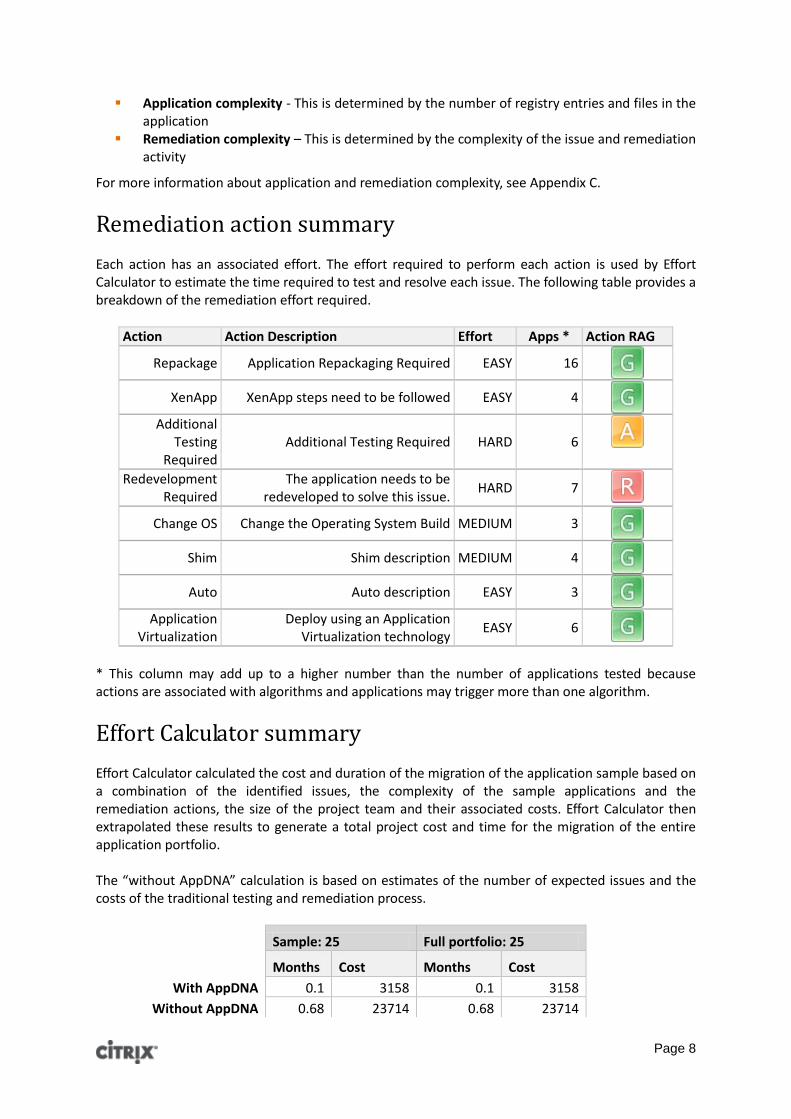
Remediation action summary Each action has an associated effort. The effort required to perform each action is used by Effort Calculator to estimate the time required to test and resolve each issue. The following table provides a breakdown of the remediation effort required.
Action Action Description Effort Apps * Action RAG
Repackage Application Repackaging Required EASY 16
XenApp XenApp steps need to be followed EASY 4
Additional Testing
Required Additional Testing Required HARD 6
Redevelopment Required
The application needs to be redeveloped to solve this issue.
HARD 7
Change OS Change the Operating System Build MEDIUM 3
Shim Shim description MEDIUM 4
Auto Auto description EASY 3
Application Virtualization
Deploy using an Application Virtualization technology
EASY 6
* This column may add up to a higher number than the number of applications tested because actions are associated with algorithms and applications may trigger more than one algorithm.
Effort Calculator summary Effort Calculator calculated the cost and duration of the migration of the application sample based on a combination of the identified issues, the complexity of the sample applications and the remediation actions, the size of the project team and their associated costs. Effort Calculator then extrapolated these results to generate a total project cost and time for the migration of the entire application portfolio. The “without AppDNA” calculation is based on estimates of the number of expected issues and the costs of the traditional testing and remediation process.
Sample: 25 Full portfolio: 25
Months Cost Months Cost
With AppDNA 0.1 3158 0.1 3158
Without AppDNA 0.68 23714 0.68 23714

Page 9
Savings 0.58 20556 0.58 20556
For information about the variables used in the calculations, see Appendix C.
Page 10
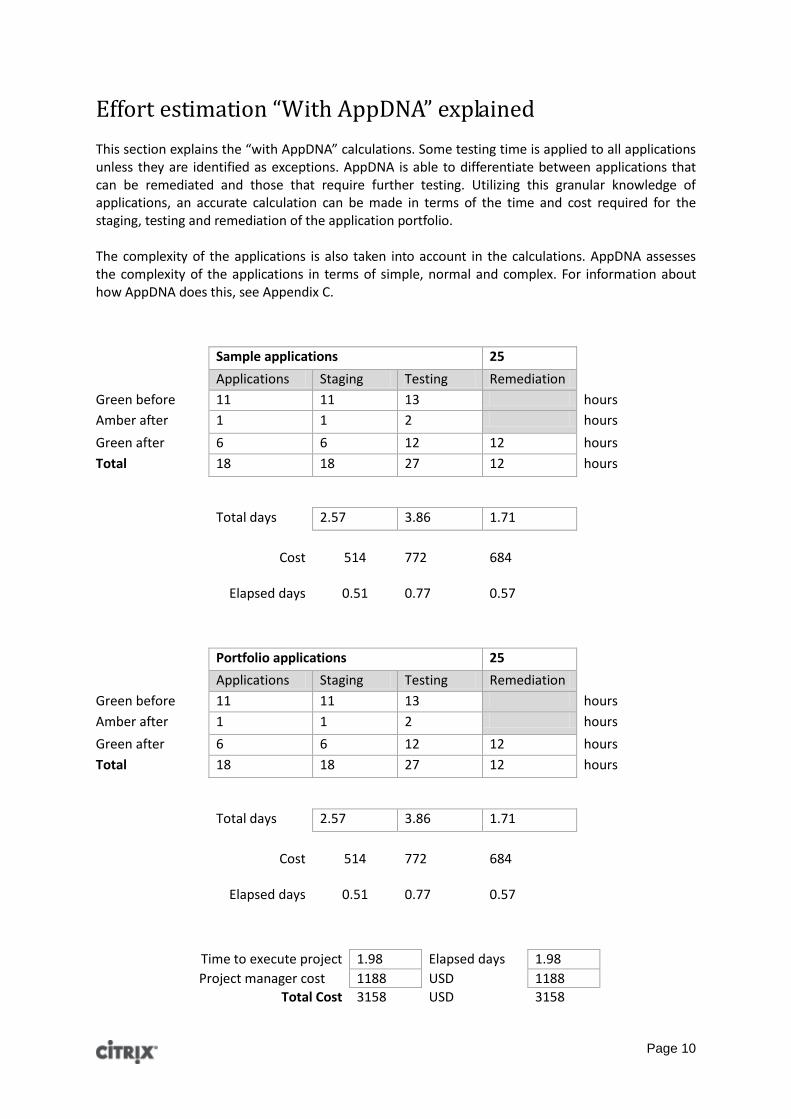
Effort estimation “With AppDNA” explained This section explains the “with AppDNA” calculations. Some testing time is applied to all applications unless they are identified as exceptions. AppDNA is able to differentiate between applications that can be remediated and those that require further testing. Utilizing this granular knowledge of applications, an accurate calculation can be made in terms of the time and cost required for the staging, testing and remediation of the application portfolio. The complexity of the applications is also taken into account in the calculations. AppDNA assesses the complexity of the applications in terms of simple, normal and complex. For information about how AppDNA does this, see Appendix C.
Sample applications 25
Applications Staging Testing Remediation
Green before 11 11 13 hours
Amber after 1 1 2 hours
Green after 6 6 12 12 hours
Total 18 18 27 12 hours
Total days 2.57 3.86 1.71
Cost
514
772
684
Elapsed days
0.51
0.77
0.57
Portfolio applications 25
Applications Staging Testing Remediation
Green before 11 11 13 hours
Amber after 1 1 2 hours
Green after 6 6 12 12 hours
Total 18 18 27 12 hours
Total days 2.57 3.86 1.71
Cost
514
772
684
Elapsed days
0.51
0.77
0.57
Time to execute project 1.98 Elapsed days 1.98
Project manager cost 1188 USD 1188
Total Cost 3158 USD 3158

Page 11
Cost per app 126.32
Duration per app 0.33
Effort estimation “Without AppDNA” explained This section provides more information about the “without AppDNA” calculations. Without prior knowledge of the application portfolio in terms of compatibility, complexity, potential resolutions and targeted testing, it is not possible to create an accurate estimation of project time and cost. In order to create a reasonable estimate, the variables defined in Appendix C were used. The calculation assumes that all applications will be staged and tested and that a percentage of applications will require some form of remediation identification and actions.
Sample applications: 25 Portfolio applications:
25
% Apps Hours % Apps Hours
Staging 100 25 25 100 25 25
Testing 100 25 100 100 25 100
Identify and fix
35 8.75 210 35 8.75 210
Staging Testing Identify and fix
Staging Testing Indentify and fix
Days 3.57 14.29 30 3.57 14.29 30
Cost 714 2858 12000 714 2858 12000
Time to execute project 13.57 Elapsed days 13.57
Project manager cost 8142 USD 8142
Total Cost 23714 USD 23714
Cost per application 948.56
Time per application 1.91

Page 12
Appendix A: Installations Hosted on XenApp 2008 R2 algorithm groups
Anomolous Behaviours
Unusual aspects of an application that may result in unexpected behaviour.
Best Practice Violations
The detection and reporting of applications that violate some established best practices.
Applications co-existence issues
Applications that may not work well on the same machine in a TS environment due to resource clashes.
Unsuitable Terminal Services applications
Applications with potential Terminal Services / Citrix PS compatibility issues.
Deprecated Components
Specific technologies present in previous releases of Windows have been deprecated from Windows Server 2008 R2. These technologies represent a varied risk of incompatibility.
Drivers
New releases of Windows are provided with new driver specification. As a result certain driver types are no longer compatible and represent a varied risk of incompatibility.
Environment Settings
Improvements to security can result in components that previously worked in protected locations no longer working.
Hardcoded paths
Page 13
Hardcoded paths can result in failure on Windows Server 2008 R2 given the change in the paths in the environment. It is also highly likely that a migration could result in a change in the environment and as such would require a change. Hard-coded paths are detected in vairous msi tables, file contents and registry keys. The algorithms look for hard coded UNC paths, drive letters and certain Windows XP folder paths.
Obsolete Components
Improvements to native operating system technologies inevitably result in components previously available becoming obsolete. The absence of these obsolete components represents a significant risk to compatibility.
Operating System Versioning
Technologies checking the operating system version may react in an undesirable way. These reactions represent a varied risk of incompatibility.
Performance considerations
Applications that may affect performance on a terminal server.
Applications permission errors
Applications that may not be correctly installed for all users or applications that may not function well for standard users in a TS environment
Applications runtime errors
Applications that may not run correctly for all users in a TS environment
Session 0 Isolation
The attack surface of Windows has been reduced by initiatives such as Session 0 Isolation. Technologies unaware of this change represent a significant risk of incompatibility.
Server Core Considerations
Server Core is a scaled down version of Windows Server 2008 and as a consequence certain applications may not work on a core server build.
Server Considerations
Server Considerations.
Page 14
Windows shell compatibility
Certain applications may have shell extentions that are not 64bit compatible.
Terminal Services
The reporting of applications that are Terminal services aware
User Account Control
Microsoft have improved their adoption of the principal of least privilege. As a direct result applications are at varying degrees of risk, if they are not developed to operate according to this principal.
Windows Resource Protection
Microsoft have extended Windows File Protection to include registry keys and integrated the Windows Installer Service. These changes represent a medium to low risk of incompatibilities.
x16 Bit Applications
Potential 16bit COM References
Page 15
Appendix B: AppDNA product overview
AppDNA can interrogate large portfolios of applications to identify potential installation and runtime compatibility issues. This is achieved by interrogating both the installer and the associated binaries to gather key information about the behavior of the application. This gathered data or “application DNA” is loaded into the AppDNA database. AppDNA then runs sophisticated heuristic algorithms on the application DNA to predict issues that are likely to be exhibited when the applications are deployed on the target platform or technology. The algorithms take a number of data sets into consideration over and above the application’s internal state, including external data from application compatibility lists, the Windows Program Compatibility Assistant (PCA) database and, when relevant, the operating systems you are migrating from and to, and other applications and their dependencies. In this way AppDNA produces a multi-dimensional view of the application and how it interacts with the target platform and sibling applications. In terms of the AppDNA process, all Windows application types (internally developed or ISV applications) and all formts (MSI or any installable format) can be processed. In addition, AppDNA can capture Web applications, by importing their static Web source files or capturing their run-time Web pages (or both). AppDNA directly analyses the application and its files and does not require agent-based data collection from the live network environment. This “light touch” approach makes AppDNA easy to adopt and makes for rapid analysis of large volumes of applications. Depending on which stage the project is at and how much detail is required, AppDNA produces reporting with the appropriate level of detail to facilitate planning, estimation or actual remediation activity. AppDNA can integrate application and operating system DNA data with infrastructure and deployment information from Microsoft System Centre Configuration Manager (SCCM) and Active Directory. AppDNA also integrates with Lakeside SysTrack, which audits and tracks actual application use within the enterprise. This enables AppDNA to provide information about which applications are used across your enterprise and by how many users and on how many machines. AppDNA covers a wide spectrum of operating systems and technology platforms in a modular architecture:
Desktop Compatibility Manager – Compatibility for Windows client operating systems Server Compatibility manager – Compatibility for Windows server operating systems 64bit Manager – Compatibility for x64 operating system platforms Virtualisation Manager – Suitability for Microsoft App-V or Citrix XenApp streaming Server Based Computing (SBC) Manager – Compatibility for Citrix XenApp hosted Quality manager – Identification of application-to-application interoperability conflicts WebApp Compatibility Manager – Compatibility with Internet Explorer and Firefox
Page 16
Custom Reports Manager – Enables you to define new algorithms and algorithm groups either based on existing algorithms and algorithm groups or new ones you write yourself
Page 17
Appendix C: Assumptions
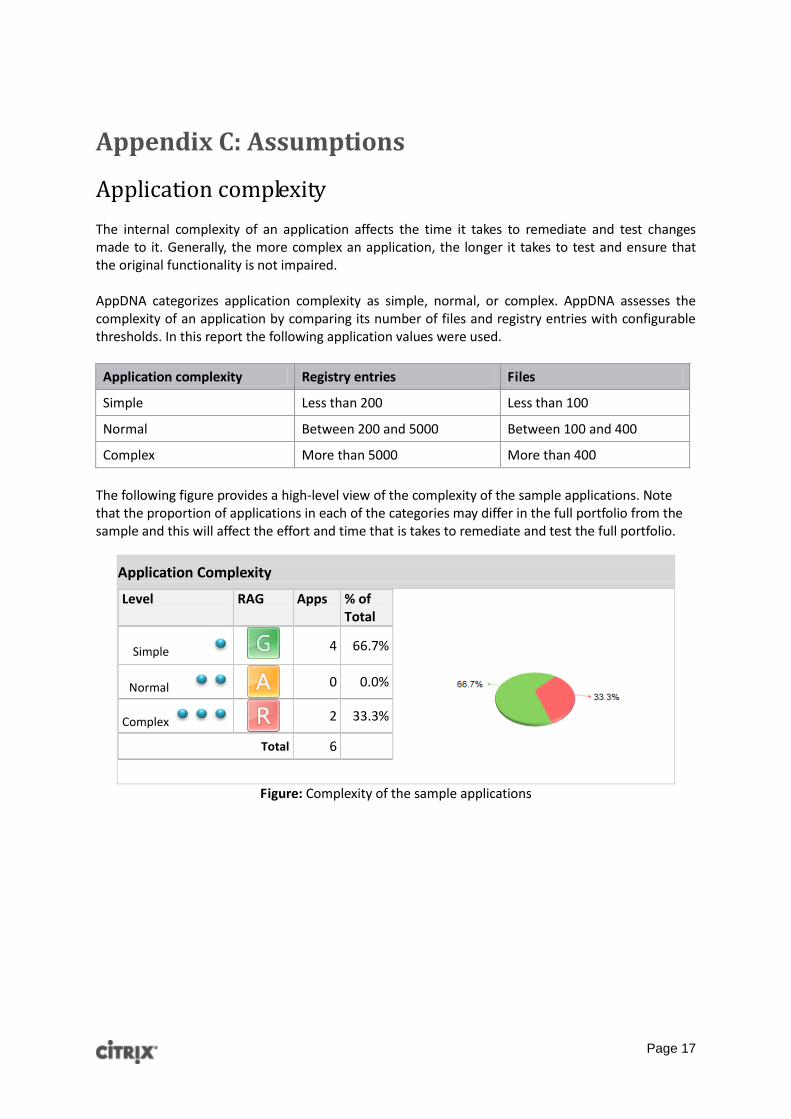
Application complexity The internal complexity of an application affects the time it takes to remediate and test changes made to it. Generally, the more complex an application, the longer it takes to test and ensure that the original functionality is not impaired. AppDNA categorizes application complexity as simple, normal, or complex. AppDNA assesses the complexity of an application by comparing its number of files and registry entries with configurable thresholds. In this report the following application values were used.
Application complexity Registry entries Files
Simple Less than 200 Less than 100
Normal Between 200 and 5000 Between 100 and 400
Complex More than 5000 More than 400
The following figure provides a high-level view of the complexity of the sample applications. Note that the proportion of applications in each of the categories may differ in the full portfolio from the sample and this will affect the effort and time that is takes to remediate and test the full portfolio.
Application Complexity Level RAG Apps % of
Total
Simple 4 66.7%
Normal 0 0.0%
Complex 2 33.3%
Total 6
Figure: Complexity of the sample applications
Page 18
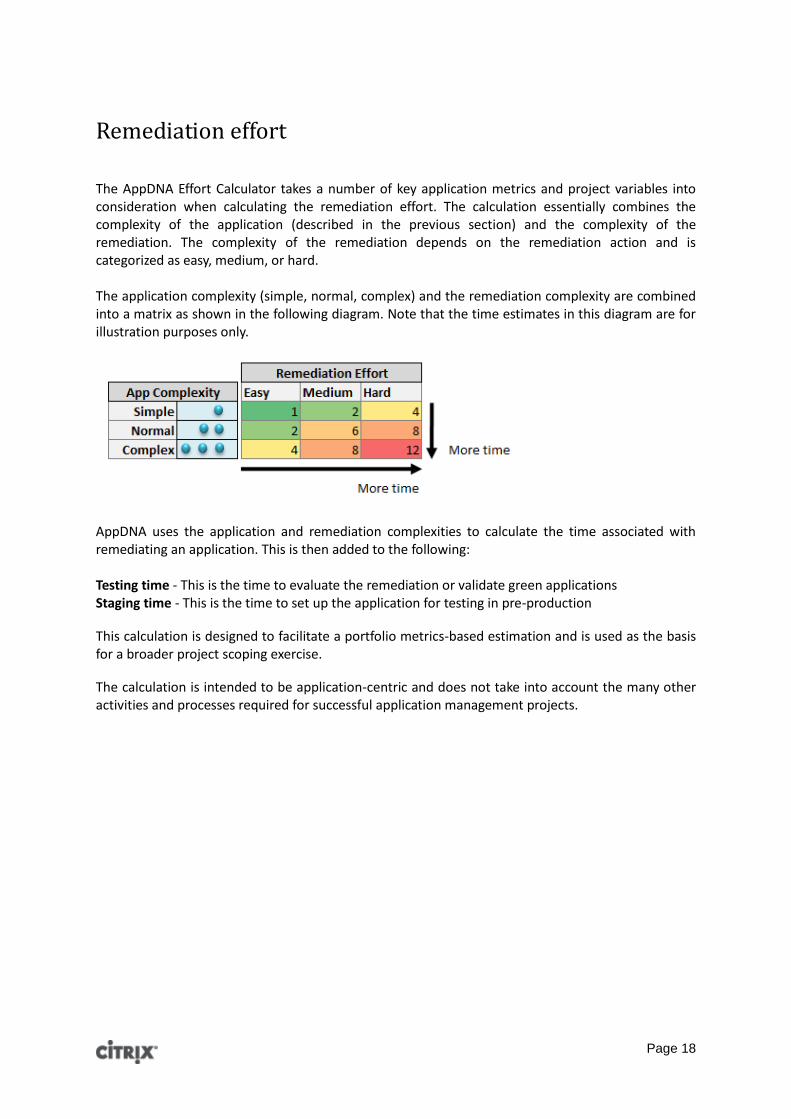
Remediation effort The AppDNA Effort Calculator takes a number of key application metrics and project variables into consideration when calculating the remediation effort. The calculation essentially combines the complexity of the application (described in the previous section) and the complexity of the remediation. The complexity of the remediation depends on the remediation action and is categorized as easy, medium, or hard. The application complexity (simple, normal, complex) and the remediation complexity are combined into a matrix as shown in the following diagram. Note that the time estimates in this diagram are for illustration purposes only.
AppDNA uses the application and remediation complexities to calculate the time associated with remediating an application. This is then added to the following: Testing time - This is the time to evaluate the remediation or validate green applications Staging time - This is the time to set up the application for testing in pre-production
This calculation is designed to facilitate a portfolio metrics-based estimation and is used as the basis for a broader project scoping exercise.
The calculation is intended to be application-centric and does not take into account the many other activities and processes required for successful application management projects.
Page 19
Variables
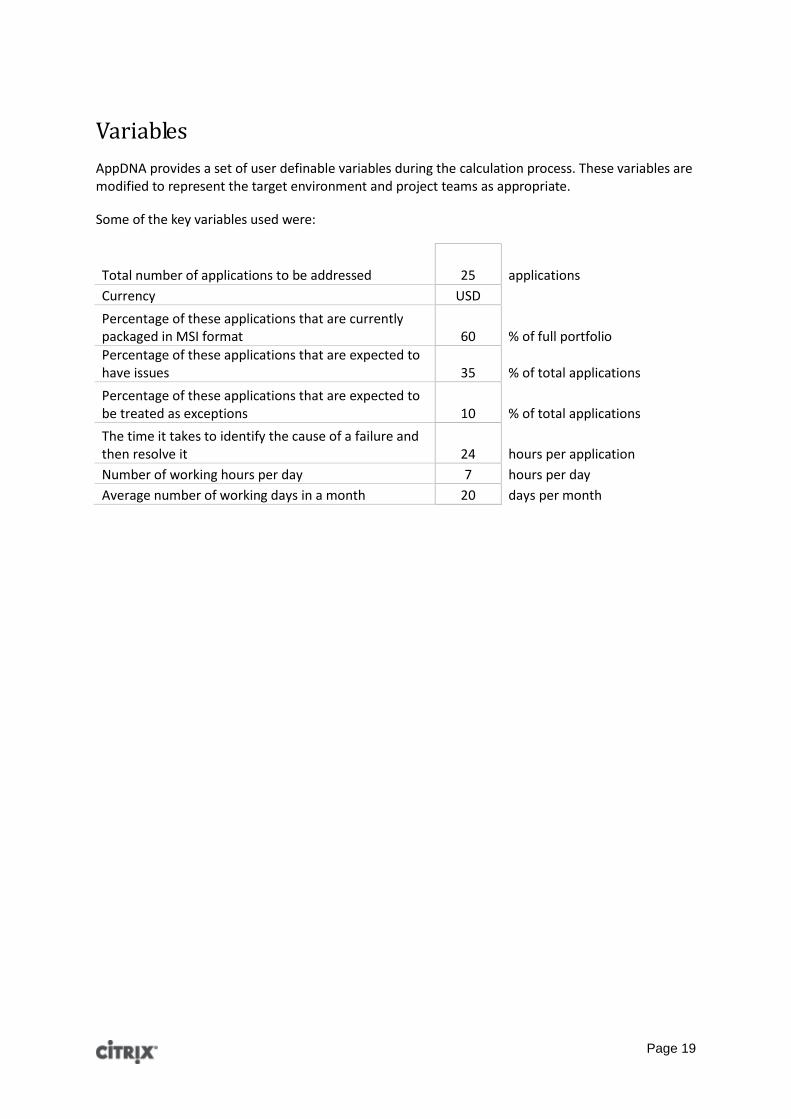
AppDNA provides a set of user definable variables during the calculation process. These variables are modified to represent the target environment and project teams as appropriate.
Some of the key variables used were:
Total number of applications to be addressed 25 applications
Currency USD
Percentage of these applications that are currently packaged in MSI format 60 % of full portfolio
Percentage of these applications that are expected to have issues 35 % of total applications
Percentage of these applications that are expected to be treated as exceptions 10 % of total applications
The time it takes to identify the cause of a failure and then resolve it 24 hours per application
Number of working hours per day 7 hours per day
Average number of working days in a month 20 days per month
Page 20
Appendix D: RAG status definitions
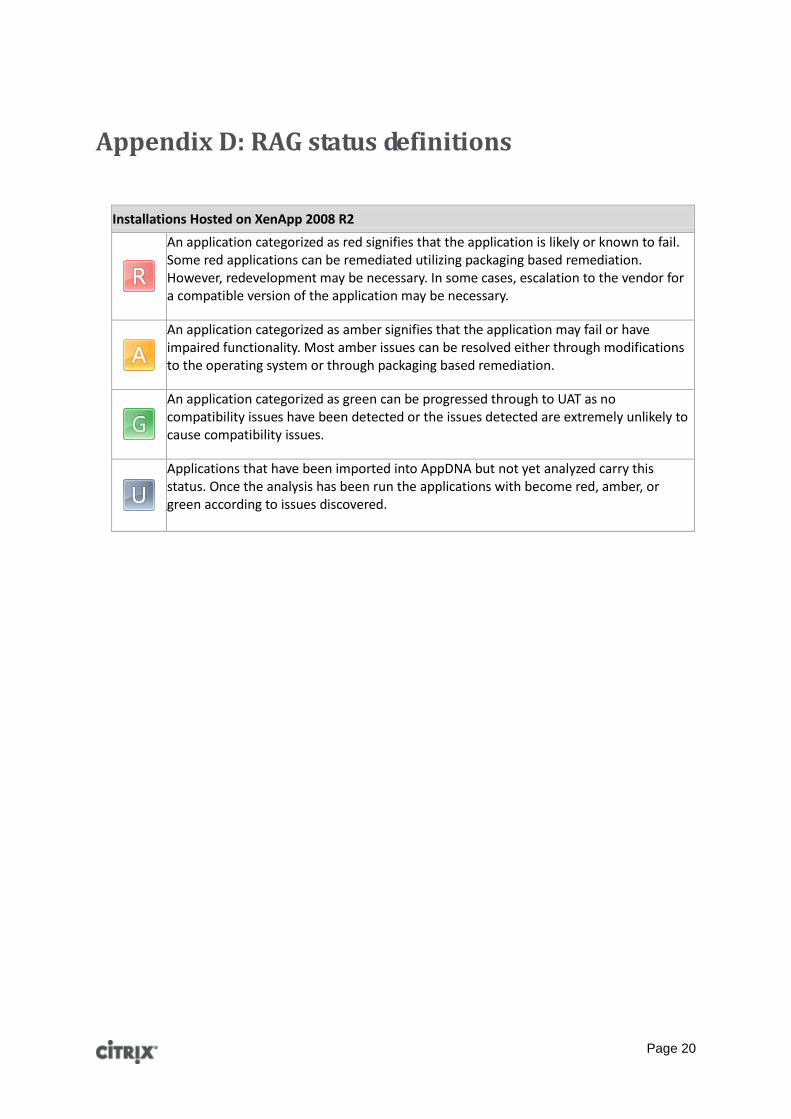
Installations Hosted on XenApp 2008 R2
An application categorized as red signifies that the application is likely or known to fail. Some red applications can be remediated utilizing packaging based remediation. However, redevelopment may be necessary. In some cases, escalation to the vendor for a compatible version of the application may be necessary.
An application categorized as amber signifies that the application may fail or have impaired functionality. Most amber issues can be resolved either through modifications to the operating system or through packaging based remediation.
An application categorized as green can be progressed through to UAT as no compatibility issues have been detected or the issues detected are extremely unlikely to cause compatibility issues.
Applications that have been imported into AppDNA but not yet analyzed carry this status. Once the analysis has been run the applications with become red, amber, or green according to issues discovered.

Page 21
Copyright ©2012 Citrix Systems, Inc. All rights reserved. Citrix® and AppDNA™ are trademarks of Citrix Systems, Inc. and/or one or more of its subsidiaries, and may be registered in the United States Patent and Trademark Office and in other countries. All other trademarks and registered trademarks are property of their respective owners.


![AppDNA 7 - Citrix Docs · In the AppDNA web client, it is not possible to log on with a six character password. [# AppDNA-183] Incorrect formatting showing on report tables. [# AppDNA-111]](https://static.fdocuments.us/doc/165x107/5f0f2bba7e708231d442d636/appdna-7-citrix-docs-in-the-appdna-web-client-it-is-not-possible-to-log-on-with.jpg)