Investment Calculator Pro - My Money Calculator
112
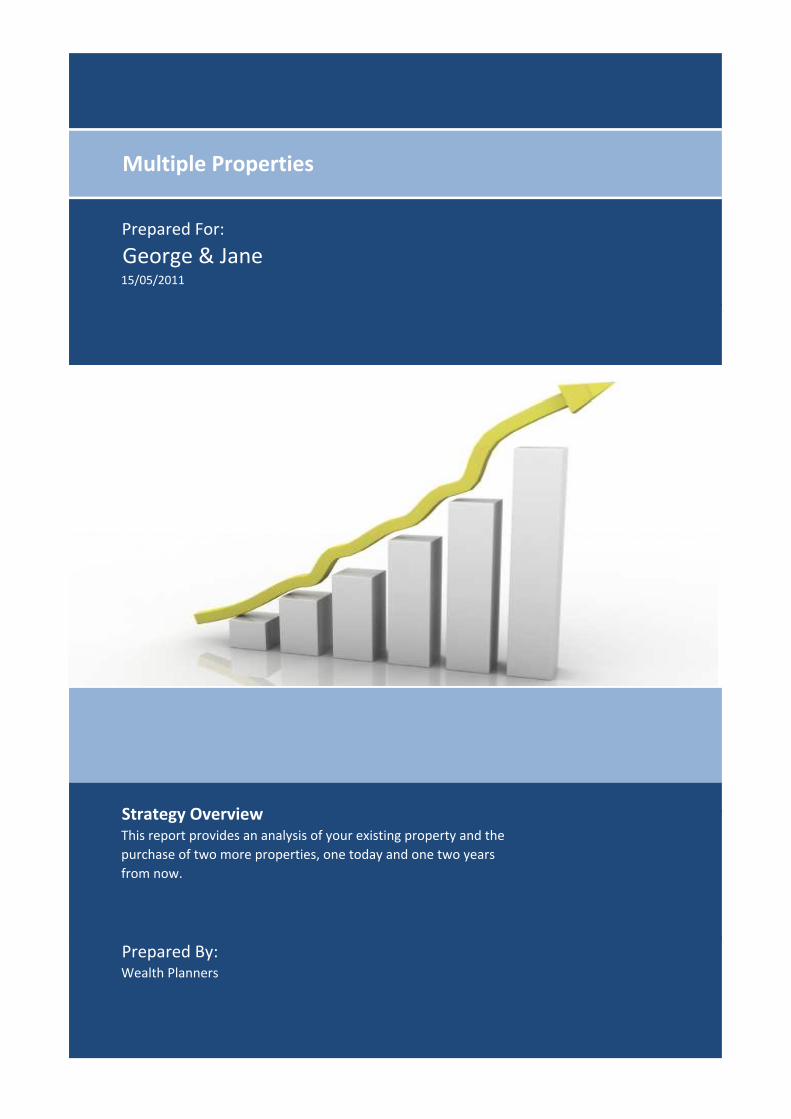
Multiple Properties Prepared For: George & Jane 15/05/2011 Strategy Overview Strategy Overview This report provides an analysis of your existing property and the purchase of two more properties, one today and one two years from now. Prepared By: Wealth Planners
Transcript of Investment Calculator Pro - My Money Calculator
Multiple PropertiesMultiple Properties
Prepared For:
George & Jane15/05/2011
Strategy OverviewStrategy OverviewThis report provides an analysis of your existing property and the
purchase of two more properties, one today and one two years
from now.
Prepared By:Wealth Planners
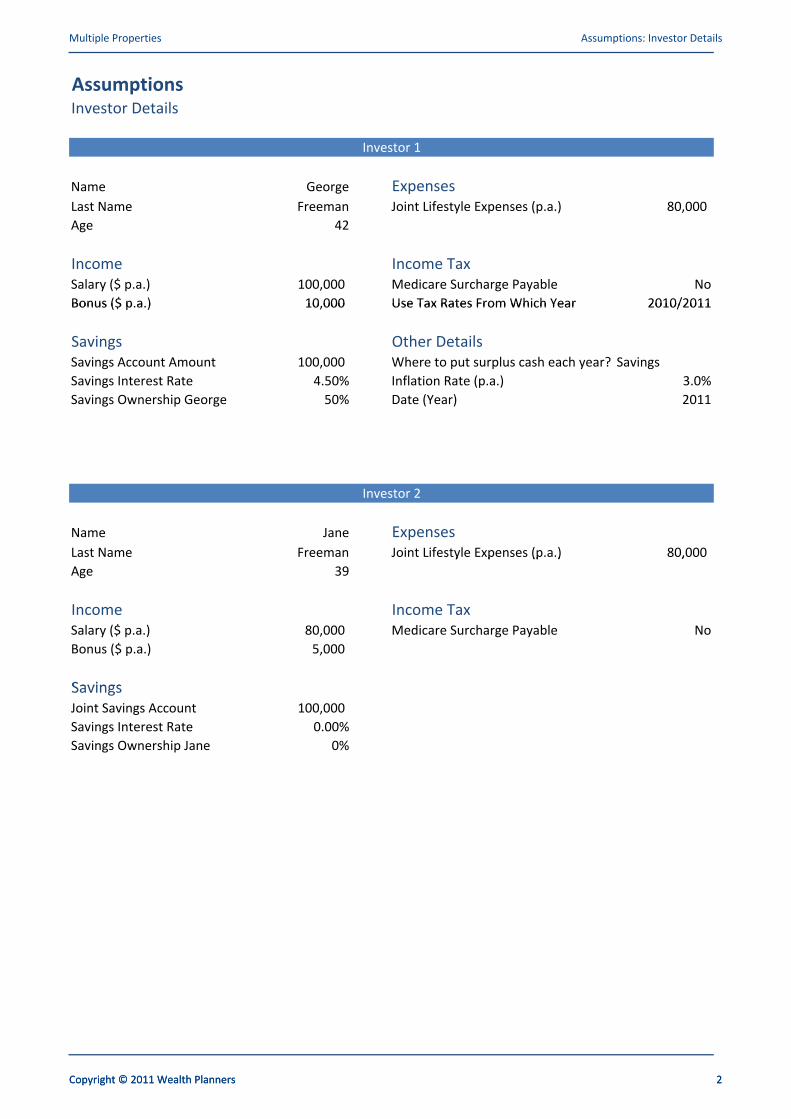
Multiple Properties Assumptions: Investor Details
AssumptionsInvestor Details
Name George Expenses
Investor 1
Copyright © 2011 Wealth Planners 2
Name George Expenses
Last Name Freeman Joint Lifestyle Expenses (p.a.) 80,000
Age 42
Income Income Tax
Salary ($ p.a.) 100,000 Medicare Surcharge Payable No
Bonus ($ p.a.) 10,000 Use Tax Rates From Which Year 2010/2011Bonus ($ p.a.) 10,000 Use Tax Rates From Which Year 2010/2011
Savings Other Details
Savings Account Amount 100,000 Where to put surplus cash each year? Savings
Savings Interest Rate 4.50% Inflation Rate (p.a.) 3.0%
Savings Ownership George 50% Date (Year) 2011
Name Jane Expenses
Last Name Freeman Joint Lifestyle Expenses (p.a.) 80,000
Investor 2
Last Name Freeman Joint Lifestyle Expenses (p.a.) 80,000
Age 39
Income Income Tax
Salary ($ p.a.) 80,000 Medicare Surcharge Payable No
Bonus ($ p.a.) 5,000
SavingsSavings
Joint Savings Account 100,000
Savings Interest Rate 0.00%
Savings Ownership Jane 0%
Copyright © 2011 Wealth Planners 2
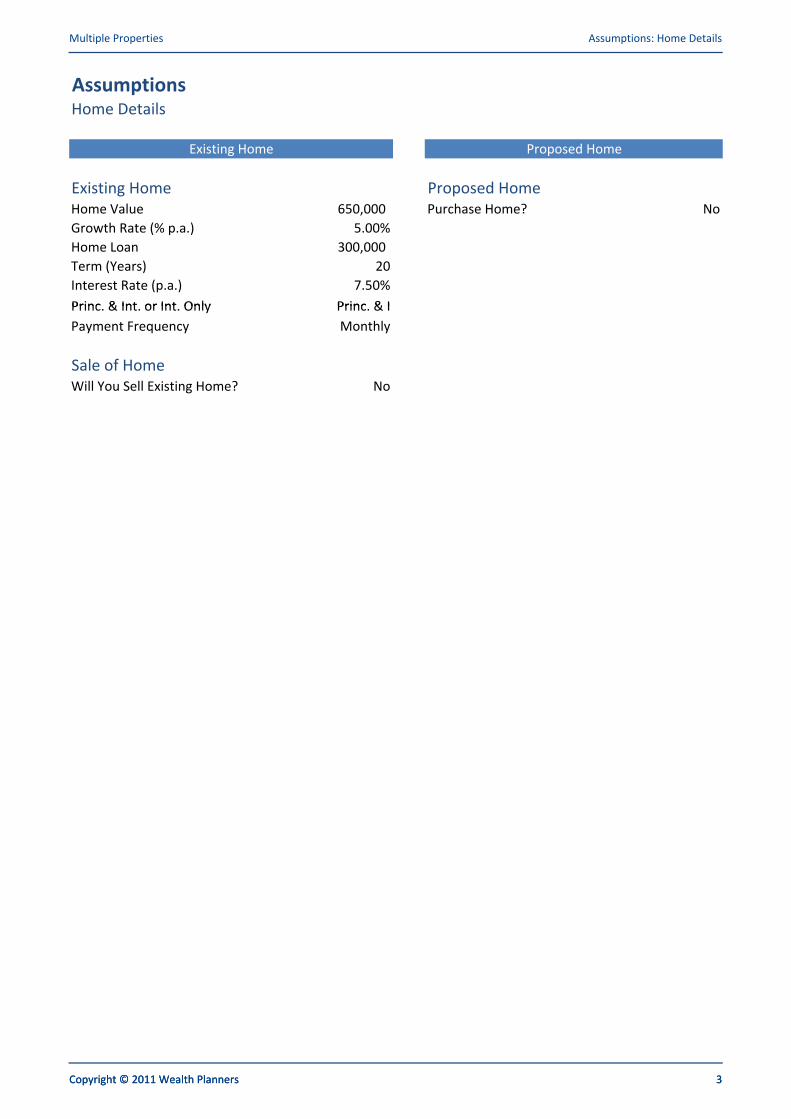
Multiple Properties Assumptions: Home Details
AssumptionsHome Details
Existing Home Proposed Home
Existing Home Proposed Home
Copyright © 2011 Wealth Planners 3
Existing Home Proposed Home
Home Value 650,000 Purchase Home? No
Growth Rate (% p.a.) 5.00%
Home Loan 300,000
Term (Years) 20
Interest Rate (p.a.) 7.50%
Princ. & Int. or Int. Only Princ. & IPrinc. & Int. or Int. Only Princ. & I
Payment Frequency Monthly
Sale of Home
Will You Sell Existing Home? No
Copyright © 2011 Wealth Planners 3
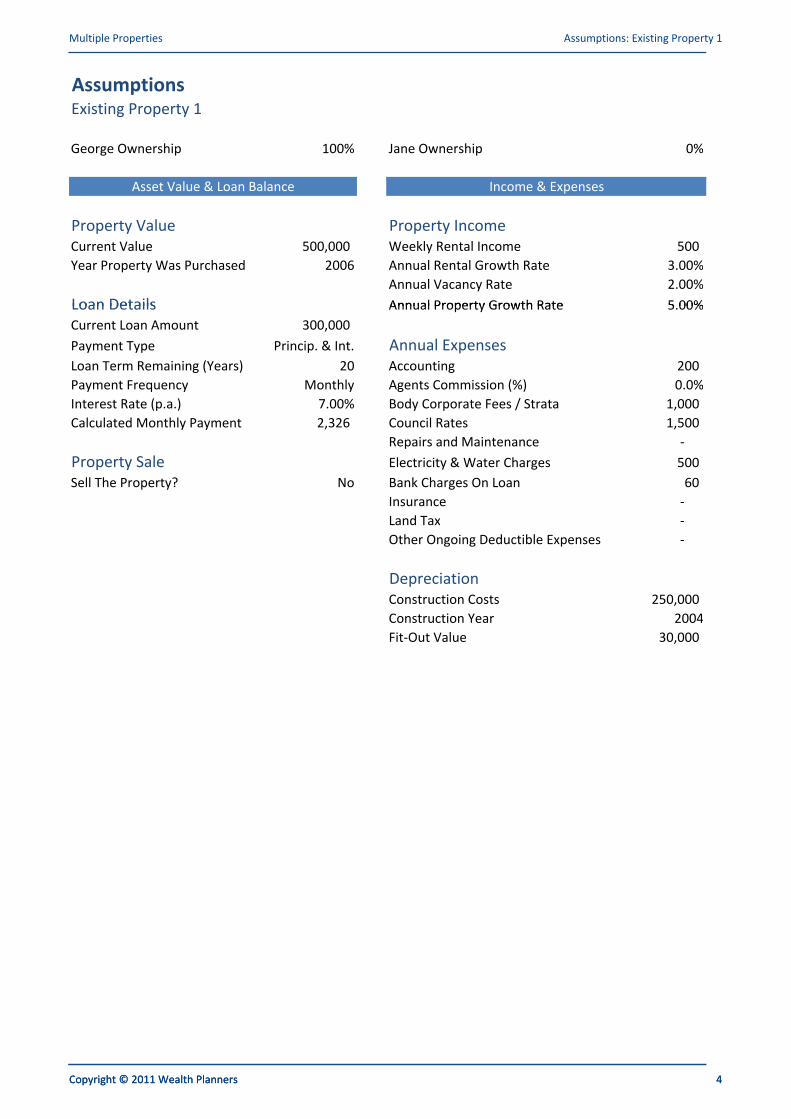
Multiple Properties Assumptions: Existing Property 1
AssumptionsExisting Property 1
George Ownership 100% Jane Ownership 0%
Asset Value & Loan Balance Income & Expenses
Copyright © 2011 Wealth Planners 4
Property Value Property Income
Current Value 500,000 Weekly Rental Income 500
Year Property Was Purchased 2006 Annual Rental Growth Rate 3.00%
Annual Vacancy Rate 2.00%
Loan Details Annual Property Growth Rate 5.00%
Asset Value & Loan Balance Income & Expenses
Loan Details Annual Property Growth Rate 5.00%
Current Loan Amount 300,000
Payment Type Princip. & Int. Annual Expenses
Loan Term Remaining (Years) 20 Accounting 200
Payment Frequency Monthly Agents Commission (%) 0.0%
Interest Rate (p.a.) 7.00% Body Corporate Fees / Strata 1,000
Calculated Monthly Payment 2,326 Council Rates 1,500
Repairs and Maintenance -
Calculated Monthly Payment 2,326 Council Rates 1,500
Repairs and Maintenance -
Property Sale Electricity & Water Charges 500
Sell The Property? No Bank Charges On Loan 60
Insurance -
Land Tax -
Other Ongoing Deductible Expenses -
Depreciation
Construction Costs 250,000
Construction Year 2004
Fit-Out Value 30,000
Copyright © 2011 Wealth Planners 4
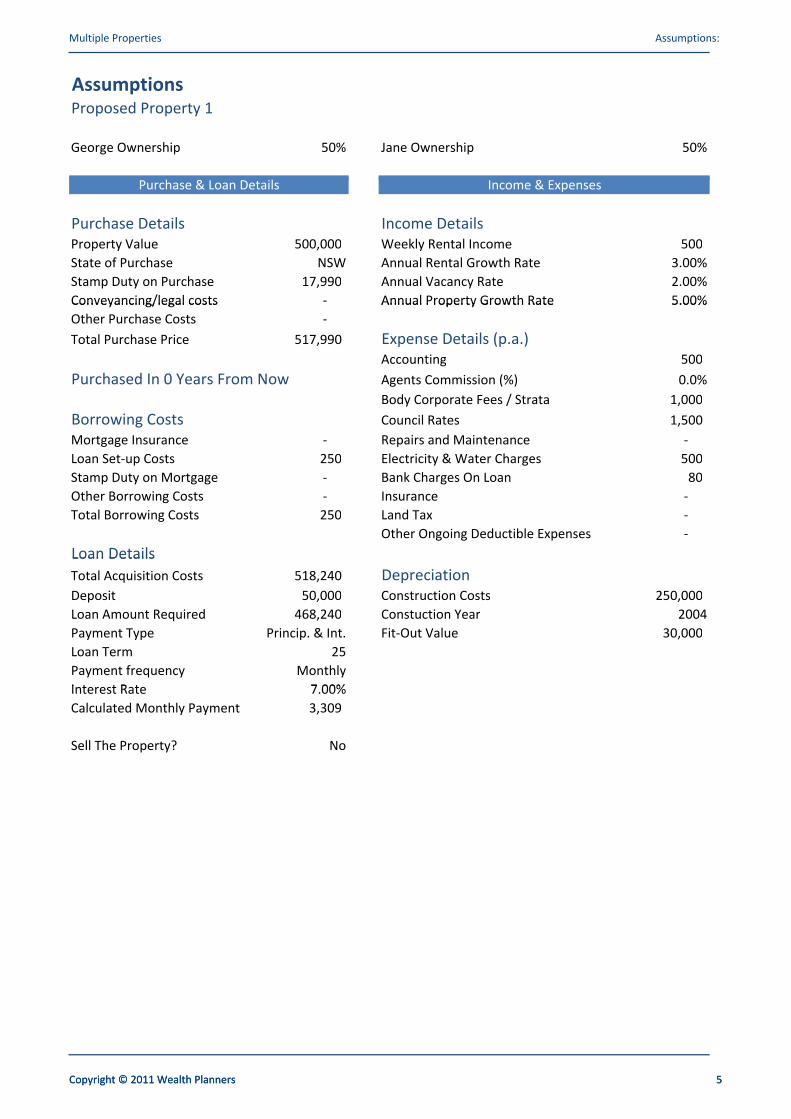
Multiple Properties Assumptions:
AssumptionsProposed Property 1
George Ownership 50% Jane Ownership 50%
Purchase & Loan Details Income & Expenses
Copyright © 2011 Wealth Planners 5
Purchase Details Income Details
Property Value 500,000 Weekly Rental Income 500
State of Purchase NSW Annual Rental Growth Rate 3.00%
Stamp Duty on Purchase 17,990 Annual Vacancy Rate 2.00%
Conveyancing/legal costs - Annual Property Growth Rate 5.00%
Purchase & Loan Details Income & Expenses
Conveyancing/legal costs - Annual Property Growth Rate 5.00%
Other Purchase Costs -
Total Purchase Price 517,990 Expense Details (p.a.)
Accounting 500
Purchased In 0 Years From Now Agents Commission (%) 0.0%
Body Corporate Fees / Strata 1,000
Borrowing Costs Council Rates 1,500
Mortgage Insurance - Repairs and Maintenance - Mortgage Insurance - Repairs and Maintenance -
Loan Set-up Costs 250 Electricity & Water Charges 500
Stamp Duty on Mortgage - Bank Charges On Loan 80
Other Borrowing Costs - Insurance -
Total Borrowing Costs 250 Land Tax -
Other Ongoing Deductible Expenses -
Loan DetailsLoan Details
Total Acquisition Costs 518,240 Depreciation
Deposit 50,000 Construction Costs 250,000
Loan Amount Required 468,240 Constuction Year 2004
Payment Type Princip. & Int. Fit-Out Value 30,000
Loan Term 25
Payment frequency Monthly
Interest Rate 7.00%Interest Rate 7.00%
Calculated Monthly Payment 3,309
Sell The Property? No
Copyright © 2011 Wealth Planners 5
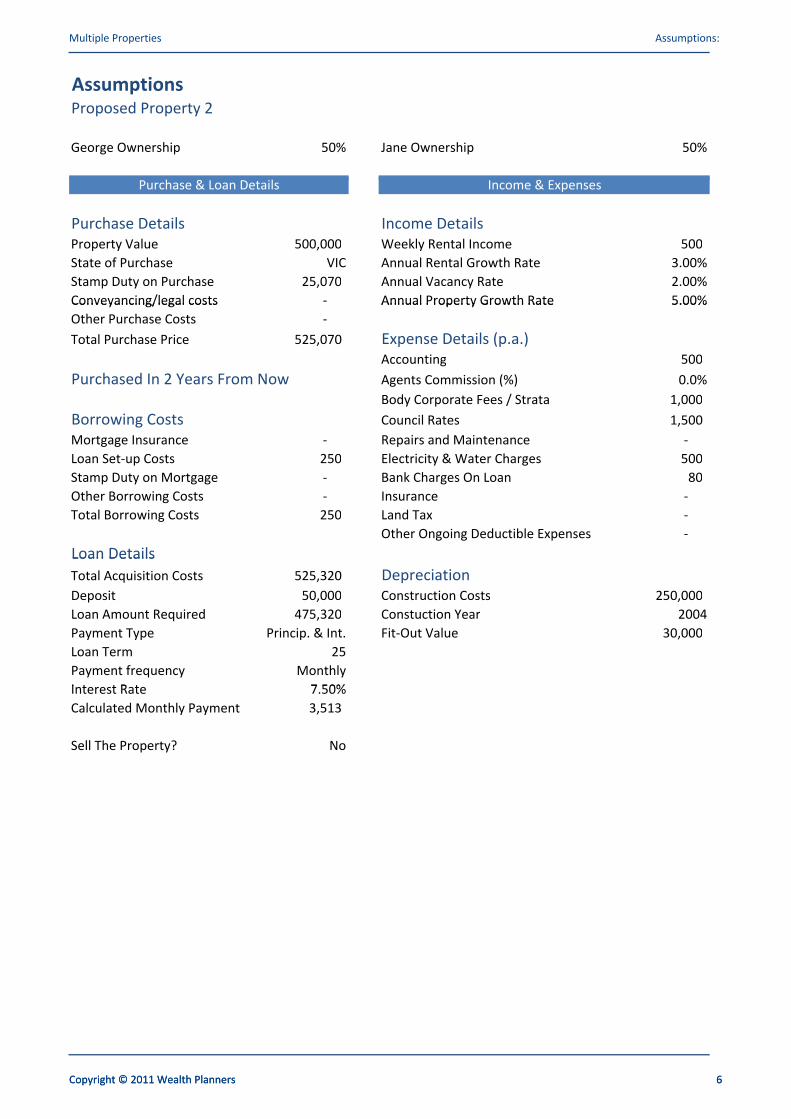
Multiple Properties Assumptions:
AssumptionsProposed Property 2
George Ownership 50% Jane Ownership 50%
Purchase & Loan Details Income & Expenses
Copyright © 2011 Wealth Planners 6
Purchase Details Income Details
Property Value 500,000 Weekly Rental Income 500
State of Purchase VIC Annual Rental Growth Rate 3.00%
Stamp Duty on Purchase 25,070 Annual Vacancy Rate 2.00%
Conveyancing/legal costs - Annual Property Growth Rate 5.00%
Purchase & Loan Details Income & Expenses
Conveyancing/legal costs - Annual Property Growth Rate 5.00%
Other Purchase Costs -
Total Purchase Price 525,070 Expense Details (p.a.)
Accounting 500
Purchased In 2 Years From Now Agents Commission (%) 0.0%
Body Corporate Fees / Strata 1,000
Borrowing Costs Council Rates 1,500
Mortgage Insurance - Repairs and Maintenance - Mortgage Insurance - Repairs and Maintenance -
Loan Set-up Costs 250 Electricity & Water Charges 500
Stamp Duty on Mortgage - Bank Charges On Loan 80
Other Borrowing Costs - Insurance -
Total Borrowing Costs 250 Land Tax -
Other Ongoing Deductible Expenses -
Loan DetailsLoan Details
Total Acquisition Costs 525,320 Depreciation
Deposit 50,000 Construction Costs 250,000
Loan Amount Required 475,320 Constuction Year 2004
Payment Type Princip. & Int. Fit-Out Value 30,000
Loan Term 25
Payment frequency Monthly
Interest Rate 7.50%Interest Rate 7.50%
Calculated Monthly Payment 3,513
Sell The Property? No
Copyright © 2011 Wealth Planners 6
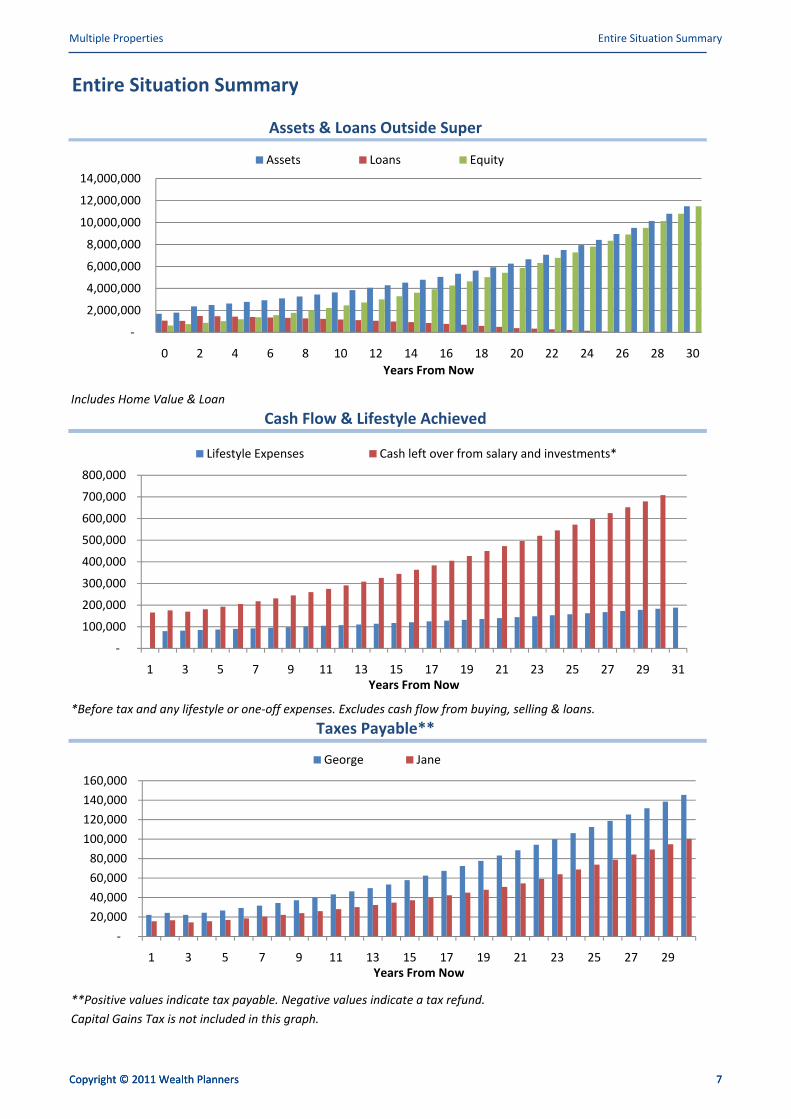
Multiple Properties Entire Situation Summary
Entire Situation Summary
Assets & Loans Outside Super
12,000,000
14,000,000
Assets Loans Equity
Copyright © 2011 Wealth Planners 7
2,000,000
4,000,000
6,000,000
8,000,000
10,000,000
12,000,000
14,000,000
Assets Loans Equity
Includes Home Value & Loan
Cash Flow & Lifestyle Achieved
-
2,000,000
4,000,000
6,000,000
0 2 4 6 8 10 12 14 16 18 20 22 24 26 28 30
Years From Now
Lifestyle Expenses Cash left over from salary and investments*
400,000
500,000
600,000
700,000
800,000
Lifestyle Expenses Cash left over from salary and investments*
-
100,000
200,000
300,000
400,000
500,000
600,000
1 3 5 7 9 11 13 15 17 19 21 23 25 27 29 31
Years From Now
*Before tax and any lifestyle or one-off expenses. Excludes cash flow from buying, selling & loans.
Taxes Payable**
1 3 5 7 9 11 13 15 17 19 21 23 25 27 29 31
Years From Now
120,000
140,000
160,000
George Jane
-
20,000
40,000
60,000
80,000
100,000
120,000
140,000
160,000
1 3 5 7 9 11 13 15 17 19 21 23 25 27 29
**Positive values indicate tax payable. Negative values indicate a tax refund.
Capital Gains Tax is not included in this graph.
-
20,000
1 3 5 7 9 11 13 15 17 19 21 23 25 27 29
Years From Now
Copyright © 2011 Wealth Planners 7
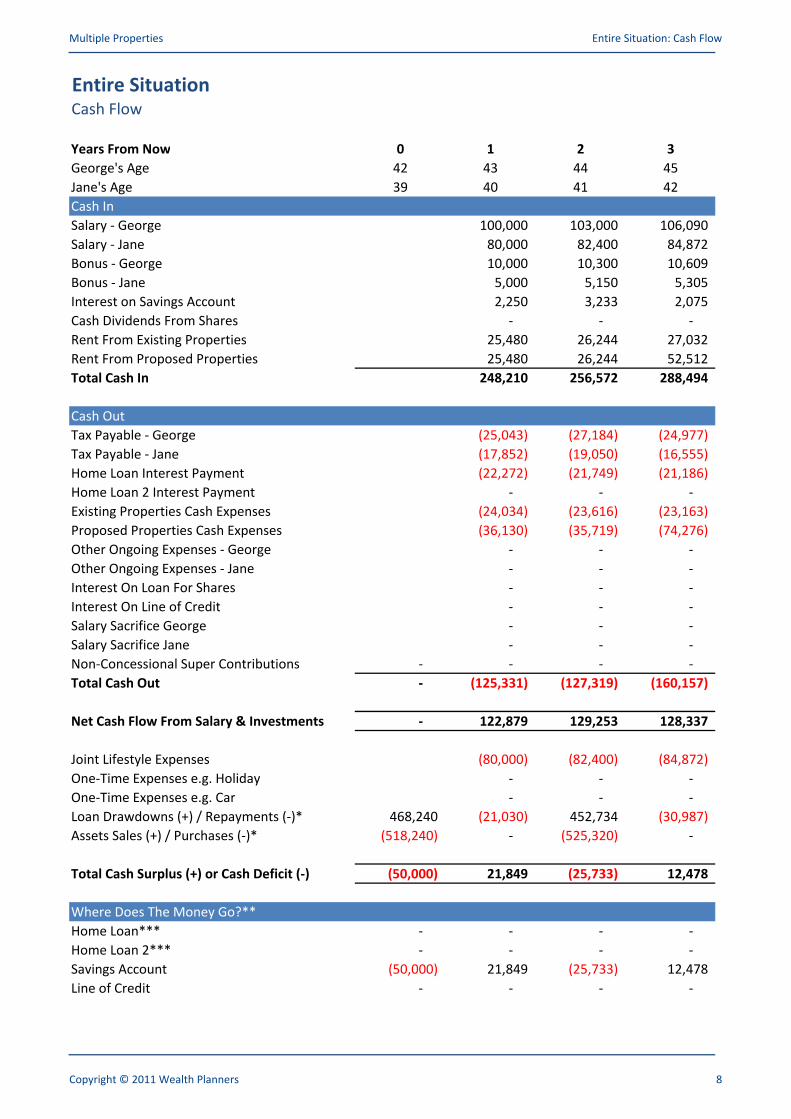
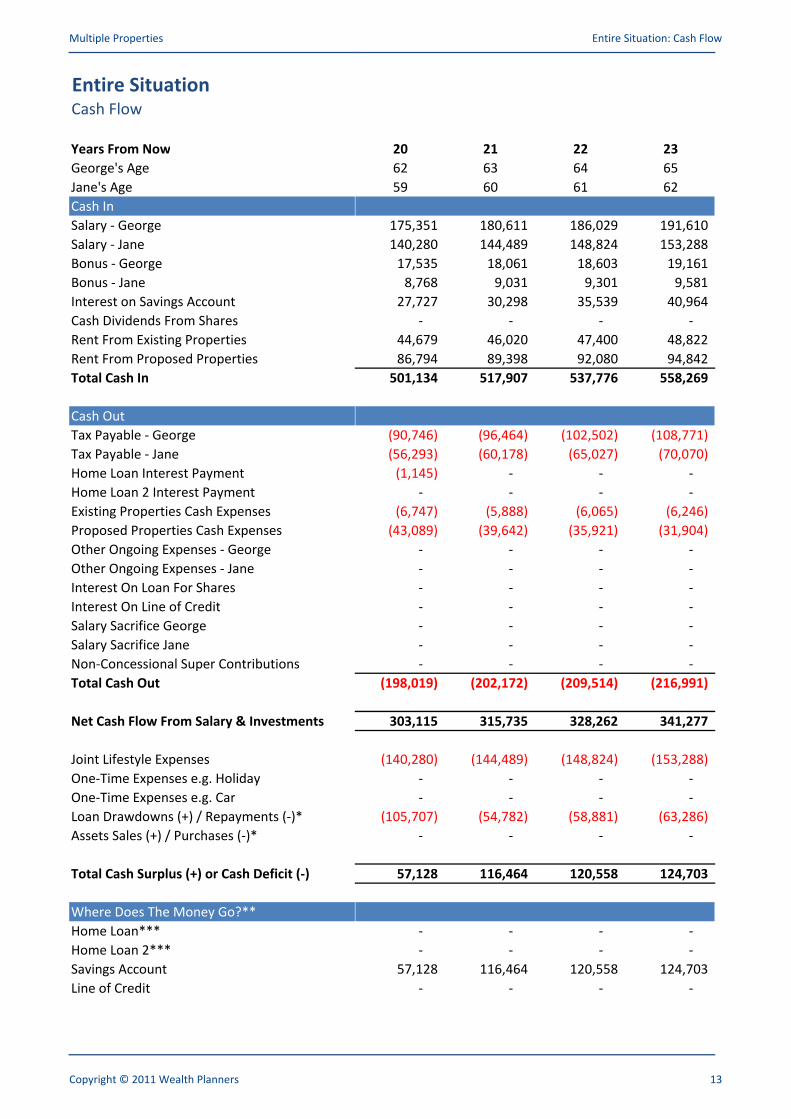
Multiple Properties Entire Situation: Cash Flow
Entire SituationCash Flow
Years From Now 0 1 2 3
George's Age 42 43 44 45
Jane's Age 39 40 41 42Jane's Age 39 40 41 42
Cash In
Salary - George 100,000 103,000 106,090
Salary - Jane 80,000 82,400 84,872
Bonus - George 10,000 10,300 10,609
Bonus - Jane 5,000 5,150 5,305
Interest on Savings Account 2,250 3,233 2,075 Interest on Savings Account 2,250 3,233 2,075
Cash Dividends From Shares - - -
Rent From Existing Properties 25,480 26,244 27,032
Rent From Proposed Properties 25,480 26,244 52,512
Total Cash In 248,210 256,572 288,494
Cash Out
Tax Payable - George (25,043) (27,184) (24,977)Tax Payable - George (25,043) (27,184) (24,977)
Tax Payable - Jane (17,852) (19,050) (16,555)
Home Loan Interest Payment (22,272) (21,749) (21,186)
Home Loan 2 Interest Payment - - -
Existing Properties Cash Expenses (24,034) (23,616) (23,163)
Proposed Properties Cash Expenses (36,130) (35,719) (74,276)
Other Ongoing Expenses - George - - -
Other Ongoing Expenses - Jane - - -
Interest On Loan For Shares - - -
Interest On Line of Credit - - -
Salary Sacrifice George - - -
Salary Sacrifice Jane - - -
Non-Concessional Super Contributions - - - -
Total Cash Out - (125,331) (127,319) (160,157)Total Cash Out - (125,331) (127,319) (160,157)
Net Cash Flow From Salary & Investments - 122,879 129,253 128,337
Joint Lifestyle Expenses (80,000) (82,400) (84,872)
One-Time Expenses e.g. Holiday - - -
One-Time Expenses e.g. Car - - -
Loan Drawdowns (+) / Repayments (-)* 468,240 (21,030) 452,734 (30,987)Loan Drawdowns (+) / Repayments (-)* 468,240 (21,030) 452,734 (30,987)
Assets Sales (+) / Purchases (-)* (518,240) - (525,320) -
Total Cash Surplus (+) or Cash Deficit (-) (50,000) 21,849 (25,733) 12,478
Where Does The Money Go?**
Home Loan*** - - - - Home Loan*** - - - -
Home Loan 2*** - - - -
Savings Account (50,000) 21,849 (25,733) 12,478
Line of Credit - - - -
Copyright © 2011 Wealth Planners 8

Multiple Properties Entire Situation: Cash Flow
Entire SituationCash Flow
Years From Now
George's Age
Jane's Age
4 5 6 7
46 47 48 49
43 44 45 46Jane's Age
Cash In
Salary - George
Salary - Jane
Bonus - George
Bonus - Jane
Interest on Savings Account
43 44 45 46
109,273 112,551 115,927 119,405
87,418 90,041 92,742 95,524
10,927 11,255 11,593 11,941
5,464 5,628 5,796 5,970
2,637 3,312 4,100 4,996 Interest on Savings Account
Cash Dividends From Shares
Rent From Existing Properties
Rent From Proposed Properties
Total Cash In
Cash Out
Tax Payable - George
2,637 3,312 4,100 4,996
- - - -
27,843 28,678 29,538 30,424
54,087 55,710 57,381 59,102
297,648 307,174 317,077 327,363
(27,409) (29,952) (32,620) (35,397)Tax Payable - George
Tax Payable - Jane
Home Loan Interest Payment
Home Loan 2 Interest Payment
Existing Properties Cash Expenses
Proposed Properties Cash Expenses
Other Ongoing Expenses - George
(27,409) (29,952) (32,620) (35,397)
(17,885) (19,395) (21,187) (23,049)
(20,580) (19,926) (19,221) (18,462)
- - - -
(22,674) (22,145) (21,573) (20,955)
(73,379) (72,406) (71,349) (70,203)
- - - -
Other Ongoing Expenses - Jane
Interest On Loan For Shares
Interest On Line of Credit
Salary Sacrifice George
Salary Sacrifice Jane
Non-Concessional Super Contributions
Total Cash Out
- - - -
- - - -
- - - -
- - - -
- - - -
- - - -
(161,927) (163,824) (165,950) (168,066)Total Cash Out
Net Cash Flow From Salary & Investments
Joint Lifestyle Expenses
One-Time Expenses e.g. Holiday
One-Time Expenses e.g. Car
Loan Drawdowns (+) / Repayments (-)*
(161,927) (163,824) (165,950) (168,066)
135,722 143,350 151,128 159,297
(87,418) (90,041) (92,742) (95,524)
- - - -
- - - -
(33,305) (35,797) (38,474) (41,353)Loan Drawdowns (+) / Repayments (-)*
Assets Sales (+) / Purchases (-)*
Total Cash Surplus (+) or Cash Deficit (-)
Where Does The Money Go?**
Home Loan***
(33,305) (35,797) (38,474) (41,353)
- - - -
14,998 17,513 19,911 22,420
- - - - Home Loan***
Home Loan 2***
Savings Account
Line of Credit
- - - -
- - - -
14,998 17,513 19,911 22,420
- - - -
Copyright © 2011 Wealth Planners 9

Multiple Properties Entire Situation: Cash Flow
Entire SituationCash Flow
Years From Now
George's Age
Jane's Age
8 9 10 11
50 51 52 53
47 48 49 50Jane's Age
Cash In
Salary - George
Salary - Jane
Bonus - George
Bonus - Jane
Interest on Savings Account
47 48 49 50
122,987 126,677 130,477 134,392
98,390 101,342 104,382 107,513
12,299 12,668 13,048 13,439
6,149 6,334 6,524 6,720
6,005 7,130 8,376 9,748 Interest on Savings Account
Cash Dividends From Shares
Rent From Existing Properties
Rent From Proposed Properties
Total Cash In
Cash Out
Tax Payable - George
6,005 7,130 8,376 9,748
- - - -
31,337 32,277 33,246 34,243
60,875 62,702 64,583 66,520
338,043 349,129 360,635 372,575
(38,306) (41,336) (44,500) (47,806)Tax Payable - George
Tax Payable - Jane
Home Loan Interest Payment
Home Loan 2 Interest Payment
Existing Properties Cash Expenses
Proposed Properties Cash Expenses
Other Ongoing Expenses - George
(38,306) (41,336) (44,500) (47,806)
(25,006) (27,041) (29,167) (31,389)
(17,644) (16,762) (15,812) (14,788)
- - - -
(20,287) (19,566) (18,789) (17,949)
(68,960) (67,614) (66,155) (64,574)
- - - -
Other Ongoing Expenses - Jane
Interest On Loan For Shares
Interest On Line of Credit
Salary Sacrifice George
Salary Sacrifice Jane
Non-Concessional Super Contributions
Total Cash Out
- - - -
- - - -
- - - -
- - - -
- - - -
- - - -
(170,204) (172,319) (174,423) (176,508)Total Cash Out
Net Cash Flow From Salary & Investments
Joint Lifestyle Expenses
One-Time Expenses e.g. Holiday
One-Time Expenses e.g. Car
Loan Drawdowns (+) / Repayments (-)*
(170,204) (172,319) (174,423) (176,508)
167,839 176,810 186,212 196,067
(98,390) (101,342) (104,382) (107,513)
- - - -
- - - -
(44,447) (47,773) (51,349) (55,192)Loan Drawdowns (+) / Repayments (-)*
Assets Sales (+) / Purchases (-)*
Total Cash Surplus (+) or Cash Deficit (-)
Where Does The Money Go?**
Home Loan***
(44,447) (47,773) (51,349) (55,192)
- - - -
25,002 27,695 30,482 33,362
- - - - Home Loan***
Home Loan 2***
Savings Account
Line of Credit
- - - -
- - - -
25,002 27,695 30,482 33,362
- - - -
Copyright © 2011 Wealth Planners 10

Multiple Properties Entire Situation: Cash Flow
Entire SituationCash Flow
Years From Now
George's Age
Jane's Age
12 13 14 15
54 55 56 57
51 52 53 54Jane's Age
Cash In
Salary - George
Salary - Jane
Bonus - George
Bonus - Jane
Interest on Savings Account
51 52 53 54
138,423 142,576 146,853 151,259
110,739 114,061 117,483 121,007
13,842 14,258 14,685 15,126
6,921 7,129 7,343 7,563
11,249 12,884 14,657 16,559 Interest on Savings Account
Cash Dividends From Shares
Rent From Existing Properties
Rent From Proposed Properties
Total Cash In
Cash Out
Tax Payable - George
11,249 12,884 14,657 16,559
- - - -
35,270 36,328 37,418 38,541
68,516 70,571 72,689 74,869
384,961 397,807 411,128 424,924
(51,260) (54,869) (58,929) (63,684)Tax Payable - George
Tax Payable - Jane
Home Loan Interest Payment
Home Loan 2 Interest Payment
Existing Properties Cash Expenses
Proposed Properties Cash Expenses
Other Ongoing Expenses - George
(51,260) (54,869) (58,929) (63,684)
(33,711) (36,137) (38,671) (41,316)
(13,685) (12,496) (11,214) (9,833)
- - - -
(17,044) (16,067) (15,015) (13,880)
(62,864) (61,013) (59,010) (56,844)
- - - -
Other Ongoing Expenses - Jane
Interest On Loan For Shares
Interest On Line of Credit
Salary Sacrifice George
Salary Sacrifice Jane
Non-Concessional Super Contributions
Total Cash Out
- - - -
- - - -
- - - -
- - - -
- - - -
- - - -
(178,564) (180,582) (182,839) (185,558)Total Cash Out
Net Cash Flow From Salary & Investments
Joint Lifestyle Expenses
One-Time Expenses e.g. Holiday
One-Time Expenses e.g. Car
Loan Drawdowns (+) / Repayments (-)*
(178,564) (180,582) (182,839) (185,558)
206,397 217,225 228,289 239,366
(110,739) (114,061) (117,483) (121,007)
- - - -
- - - -
(59,323) (63,764) (68,537) (73,669)Loan Drawdowns (+) / Repayments (-)*
Assets Sales (+) / Purchases (-)*
Total Cash Surplus (+) or Cash Deficit (-)
Where Does The Money Go?**
Home Loan***
(59,323) (63,764) (68,537) (73,669)
- - - -
36,335 39,401 42,269 44,690
- - - - Home Loan***
Home Loan 2***
Savings Account
Line of Credit
- - - -
- - - -
36,335 39,401 42,269 44,690
- - - -
Copyright © 2011 Wealth Planners 11
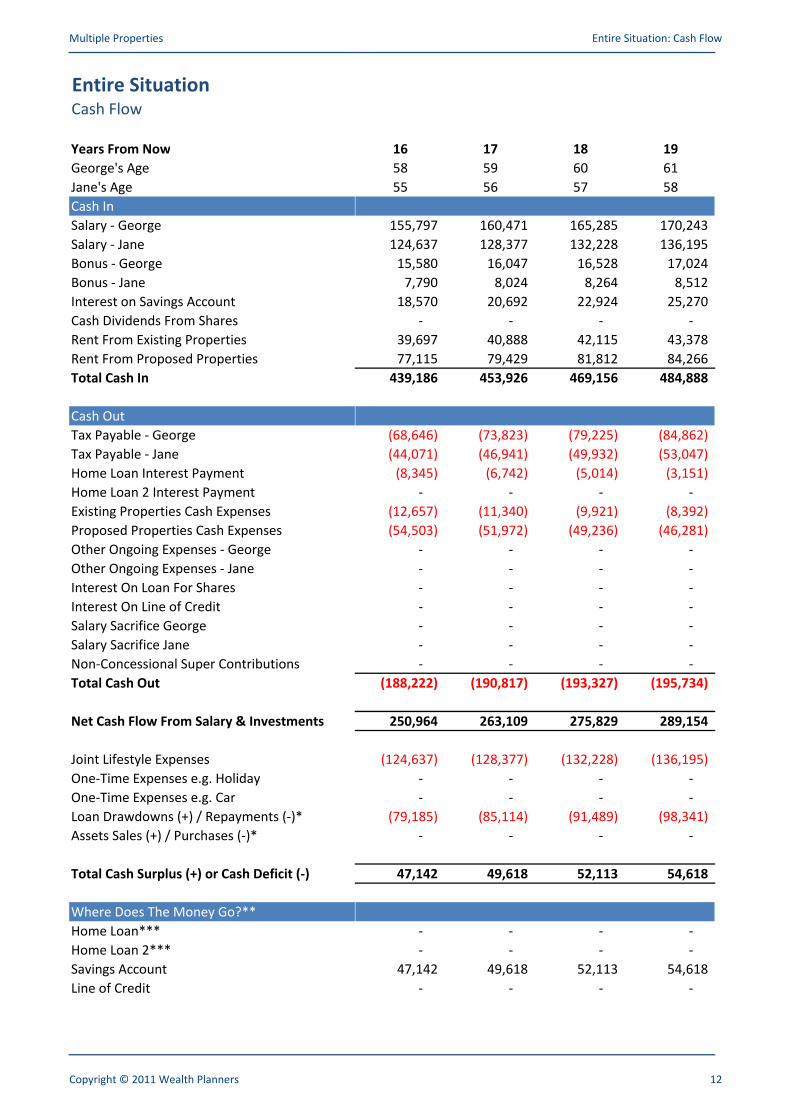
Multiple Properties Entire Situation: Cash Flow
Entire SituationCash Flow
Years From Now
George's Age
Jane's Age
16 17 18 19
58 59 60 61
55 56 57 58Jane's Age
Cash In
Salary - George
Salary - Jane
Bonus - George
Bonus - Jane
Interest on Savings Account
55 56 57 58
155,797 160,471 165,285 170,243
124,637 128,377 132,228 136,195
15,580 16,047 16,528 17,024
7,790 8,024 8,264 8,512
18,570 20,692 22,924 25,270 Interest on Savings Account
Cash Dividends From Shares
Rent From Existing Properties
Rent From Proposed Properties
Total Cash In
Cash Out
Tax Payable - George
18,570 20,692 22,924 25,270
- - - -
39,697 40,888 42,115 43,378
77,115 79,429 81,812 84,266
439,186 453,926 469,156 484,888
(68,646) (73,823) (79,225) (84,862)Tax Payable - George
Tax Payable - Jane
Home Loan Interest Payment
Home Loan 2 Interest Payment
Existing Properties Cash Expenses
Proposed Properties Cash Expenses
Other Ongoing Expenses - George
(68,646) (73,823) (79,225) (84,862)
(44,071) (46,941) (49,932) (53,047)
(8,345) (6,742) (5,014) (3,151)
- - - -
(12,657) (11,340) (9,921) (8,392)
(54,503) (51,972) (49,236) (46,281)
- - - -
Other Ongoing Expenses - Jane
Interest On Loan For Shares
Interest On Line of Credit
Salary Sacrifice George
Salary Sacrifice Jane
Non-Concessional Super Contributions
Total Cash Out
- - - -
- - - -
- - - -
- - - -
- - - -
- - - -
(188,222) (190,817) (193,327) (195,734)Total Cash Out
Net Cash Flow From Salary & Investments
Joint Lifestyle Expenses
One-Time Expenses e.g. Holiday
One-Time Expenses e.g. Car
Loan Drawdowns (+) / Repayments (-)*
(188,222) (190,817) (193,327) (195,734)
250,964 263,109 275,829 289,154
(124,637) (128,377) (132,228) (136,195)
- - - -
- - - -
(79,185) (85,114) (91,489) (98,341)Loan Drawdowns (+) / Repayments (-)*
Assets Sales (+) / Purchases (-)*
Total Cash Surplus (+) or Cash Deficit (-)
Where Does The Money Go?**
Home Loan***
(79,185) (85,114) (91,489) (98,341)
- - - -
47,142 49,618 52,113 54,618
- - - - Home Loan***
Home Loan 2***
Savings Account
Line of Credit
- - - -
- - - -
47,142 49,618 52,113 54,618
- - - -
Copyright © 2011 Wealth Planners 12
Multiple Properties Entire Situation: Cash Flow
Entire SituationCash Flow
Years From Now
George's Age
Jane's Age
20 21 22 23
62 63 64 65
59 60 61 62Jane's Age
Cash In
Salary - George
Salary - Jane
Bonus - George
Bonus - Jane
Interest on Savings Account
59 60 61 62
175,351 180,611 186,029 191,610
140,280 144,489 148,824 153,288
17,535 18,061 18,603 19,161
8,768 9,031 9,301 9,581
27,727 30,298 35,539 40,964 Interest on Savings Account
Cash Dividends From Shares
Rent From Existing Properties
Rent From Proposed Properties
Total Cash In
Cash Out
Tax Payable - George
27,727 30,298 35,539 40,964
- - - -
44,679 46,020 47,400 48,822
86,794 89,398 92,080 94,842
501,134 517,907 537,776 558,269
(90,746) (96,464) (102,502) (108,771)Tax Payable - George
Tax Payable - Jane
Home Loan Interest Payment
Home Loan 2 Interest Payment
Existing Properties Cash Expenses
Proposed Properties Cash Expenses
Other Ongoing Expenses - George
(90,746) (96,464) (102,502) (108,771)
(56,293) (60,178) (65,027) (70,070)
(1,145) - - -
- - - -
(6,747) (5,888) (6,065) (6,246)
(43,089) (39,642) (35,921) (31,904)
- - - -
Other Ongoing Expenses - Jane
Interest On Loan For Shares
Interest On Line of Credit
Salary Sacrifice George
Salary Sacrifice Jane
Non-Concessional Super Contributions
Total Cash Out
- - - -
- - - -
- - - -
- - - -
- - - -
- - - -
(198,019) (202,172) (209,514) (216,991)Total Cash Out
Net Cash Flow From Salary & Investments
Joint Lifestyle Expenses
One-Time Expenses e.g. Holiday
One-Time Expenses e.g. Car
Loan Drawdowns (+) / Repayments (-)*
(198,019) (202,172) (209,514) (216,991)
303,115 315,735 328,262 341,277
(140,280) (144,489) (148,824) (153,288)
- - - -
- - - -
(105,707) (54,782) (58,881) (63,286)Loan Drawdowns (+) / Repayments (-)*
Assets Sales (+) / Purchases (-)*
Total Cash Surplus (+) or Cash Deficit (-)
Where Does The Money Go?**
Home Loan***
(105,707) (54,782) (58,881) (63,286)
- - - -
57,128 116,464 120,558 124,703
- - - - Home Loan***
Home Loan 2***
Savings Account
Line of Credit
- - - -
- - - -
57,128 116,464 120,558 124,703
- - - -
Copyright © 2011 Wealth Planners 13
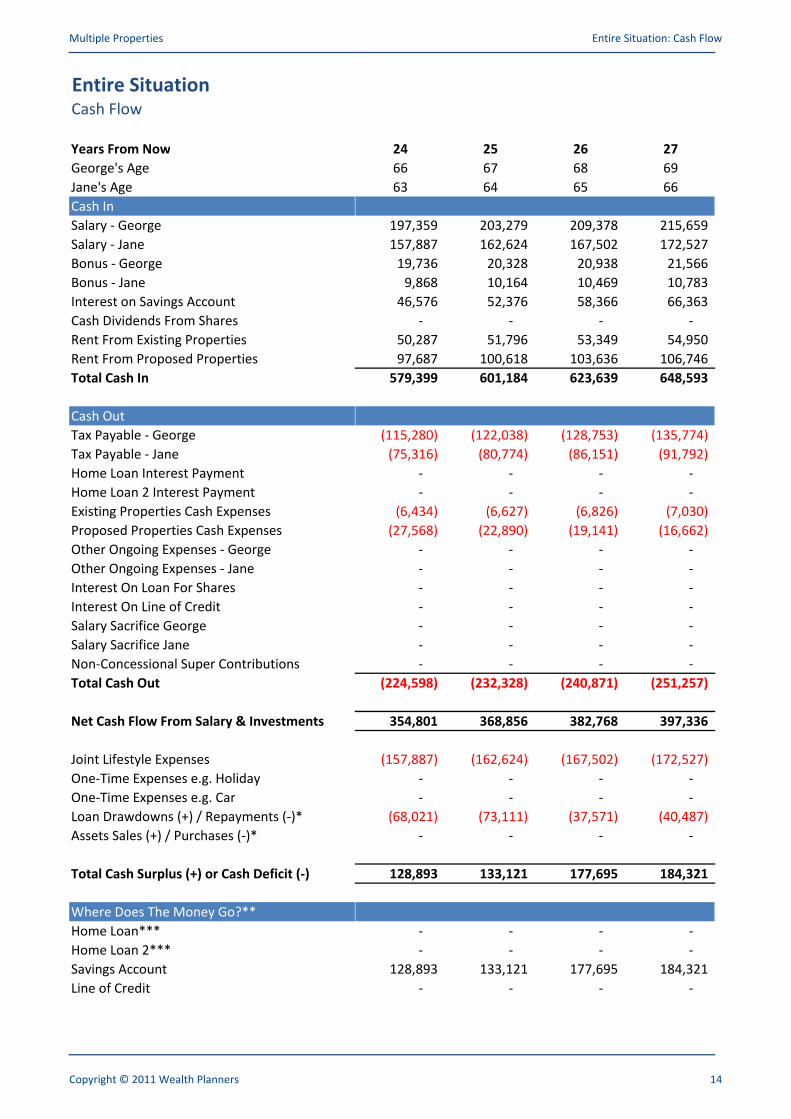
Multiple Properties Entire Situation: Cash Flow
Entire SituationCash Flow
Years From Now
George's Age
Jane's Age
24 25 26 27
66 67 68 69
63 64 65 66Jane's Age
Cash In
Salary - George
Salary - Jane
Bonus - George
Bonus - Jane
Interest on Savings Account
63 64 65 66
197,359 203,279 209,378 215,659
157,887 162,624 167,502 172,527
19,736 20,328 20,938 21,566
9,868 10,164 10,469 10,783
46,576 52,376 58,366 66,363 Interest on Savings Account
Cash Dividends From Shares
Rent From Existing Properties
Rent From Proposed Properties
Total Cash In
Cash Out
Tax Payable - George
46,576 52,376 58,366 66,363
- - - -
50,287 51,796 53,349 54,950
97,687 100,618 103,636 106,746
579,399 601,184 623,639 648,593
(115,280) (122,038) (128,753) (135,774)Tax Payable - George
Tax Payable - Jane
Home Loan Interest Payment
Home Loan 2 Interest Payment
Existing Properties Cash Expenses
Proposed Properties Cash Expenses
Other Ongoing Expenses - George
(115,280) (122,038) (128,753) (135,774)
(75,316) (80,774) (86,151) (91,792)
- - - -
- - - -
(6,434) (6,627) (6,826) (7,030)
(27,568) (22,890) (19,141) (16,662)
- - - -
Other Ongoing Expenses - Jane
Interest On Loan For Shares
Interest On Line of Credit
Salary Sacrifice George
Salary Sacrifice Jane
Non-Concessional Super Contributions
Total Cash Out
- - - -
- - - -
- - - -
- - - -
- - - -
- - - -
(224,598) (232,328) (240,871) (251,257)Total Cash Out
Net Cash Flow From Salary & Investments
Joint Lifestyle Expenses
One-Time Expenses e.g. Holiday
One-Time Expenses e.g. Car
Loan Drawdowns (+) / Repayments (-)*
(224,598) (232,328) (240,871) (251,257)
354,801 368,856 382,768 397,336
(157,887) (162,624) (167,502) (172,527)
- - - -
- - - -
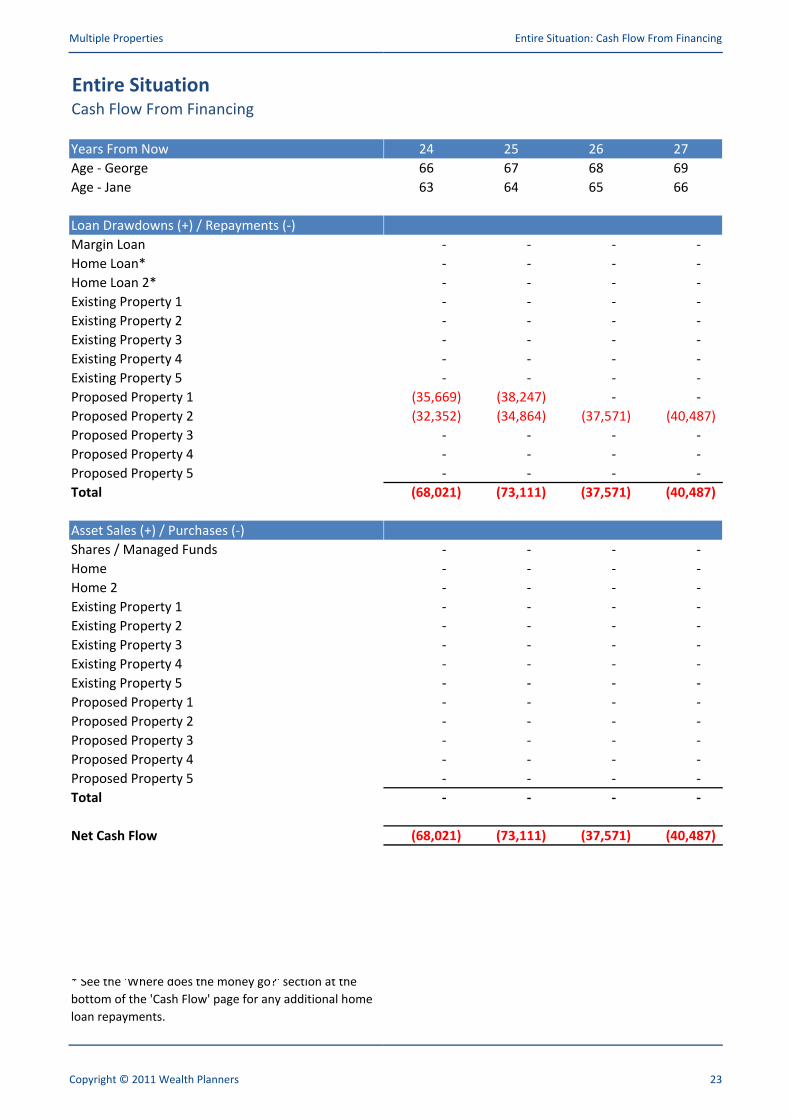
(68,021) (73,111) (37,571) (40,487)Loan Drawdowns (+) / Repayments (-)*
Assets Sales (+) / Purchases (-)*
Total Cash Surplus (+) or Cash Deficit (-)
Where Does The Money Go?**
Home Loan***
(68,021) (73,111) (37,571) (40,487)
- - - -
128,893 133,121 177,695 184,321
- - - - Home Loan***
Home Loan 2***
Savings Account
Line of Credit
- - - -
- - - -
128,893 133,121 177,695 184,321
- - - -
Copyright © 2011 Wealth Planners 14
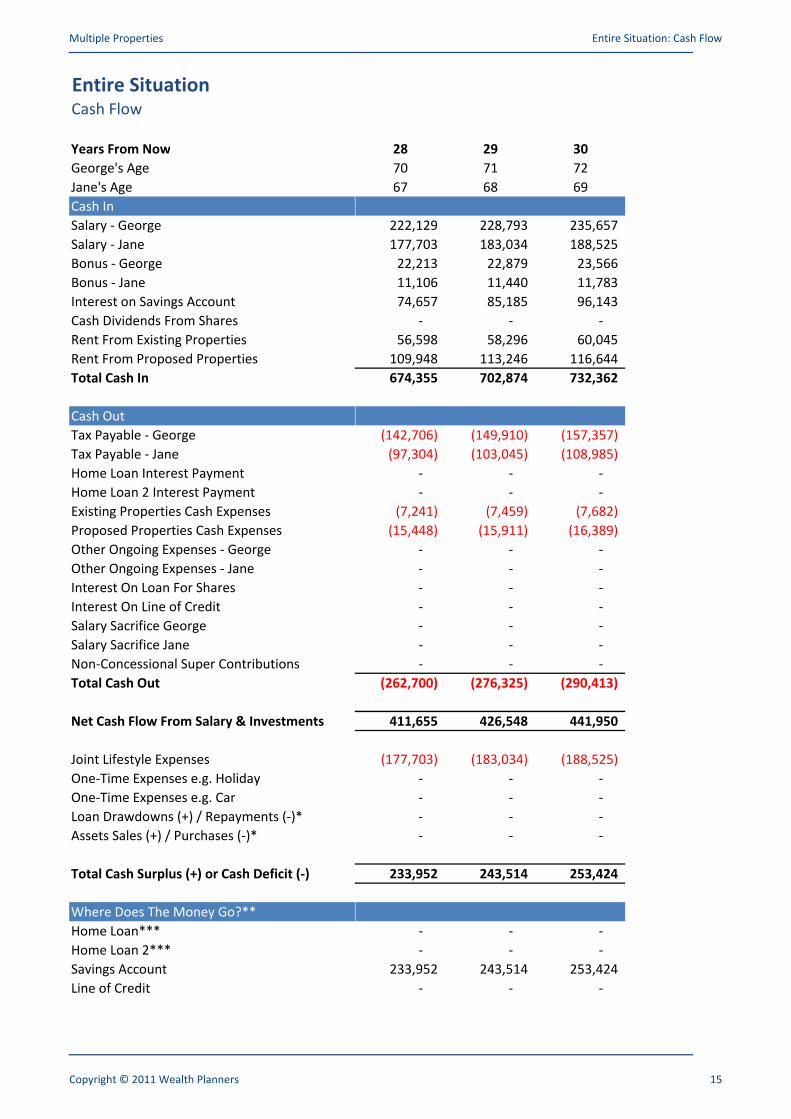
Multiple Properties Entire Situation: Cash Flow
Entire SituationCash Flow
Years From Now
George's Age
Jane's Age
28 29 30
70 71 72
67 68 69Jane's Age
Cash In
Salary - George
Salary - Jane
Bonus - George
Bonus - Jane
Interest on Savings Account
67 68 69
222,129 228,793 235,657
177,703 183,034 188,525
22,213 22,879 23,566
11,106 11,440 11,783
74,657 85,185 96,143 Interest on Savings Account
Cash Dividends From Shares
Rent From Existing Properties
Rent From Proposed Properties
Total Cash In
Cash Out
Tax Payable - George
74,657 85,185 96,143
- - -
56,598 58,296 60,045
109,948 113,246 116,644
674,355 702,874 732,362
(142,706) (149,910) (157,357)Tax Payable - George
Tax Payable - Jane
Home Loan Interest Payment
Home Loan 2 Interest Payment
Existing Properties Cash Expenses
Proposed Properties Cash Expenses
Other Ongoing Expenses - George
(142,706) (149,910) (157,357)
(97,304) (103,045) (108,985)
- - -
- - -
(7,241) (7,459) (7,682)
(15,448) (15,911) (16,389)
- - -
Other Ongoing Expenses - Jane
Interest On Loan For Shares
Interest On Line of Credit
Salary Sacrifice George
Salary Sacrifice Jane
Non-Concessional Super Contributions
Total Cash Out
- - -
- - -
- - -
- - -
- - -
- - -
(262,700) (276,325) (290,413)Total Cash Out
Net Cash Flow From Salary & Investments
Joint Lifestyle Expenses
One-Time Expenses e.g. Holiday
One-Time Expenses e.g. Car
Loan Drawdowns (+) / Repayments (-)*
(262,700) (276,325) (290,413)
411,655 426,548 441,950
(177,703) (183,034) (188,525)
- - -
- - -
- - - Loan Drawdowns (+) / Repayments (-)*
Assets Sales (+) / Purchases (-)*
Total Cash Surplus (+) or Cash Deficit (-)
Where Does The Money Go?**
Home Loan***
- - -
- - -
233,952 243,514 253,424
- - - Home Loan***
Home Loan 2***
Savings Account
Line of Credit
- - -
- - -
233,952 243,514 253,424
- - -
Copyright © 2011 Wealth Planners 15
Multiple Properties Entire Situation: Cash Flow
Entire Situation: Cash Flow
Entire SituationCash Flow
*To see the full breakdown of these amounts see the 'cash flow from buying, selling and loans' page.
** Positive menas paid to, negative means taken from.
Copyright © 2011 Wealth Planners 16
*** These payments are made in addition to the compulsory Home Loan payments that can be seen in the 'Cash flow from buying,
selling and loans' page?
Copyright © 2011 Wealth Planners 16
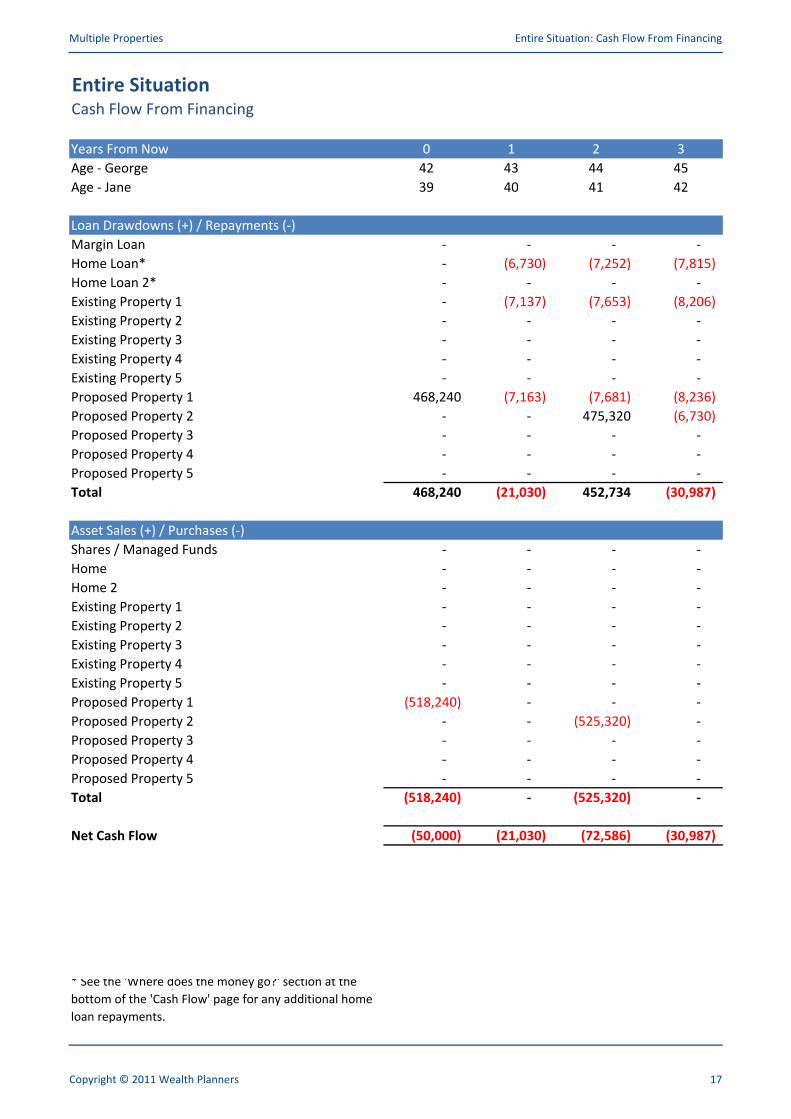
Multiple Properties Entire Situation: Cash Flow From Financing
Entire SituationCash Flow From Financing
Years From Now 0 1 2 3
Age - George 42 43 44 45
Age - Jane 39 40 41 42Age - Jane 39 40 41 42
Loan Drawdowns (+) / Repayments (-)
Margin Loan - - - -
Home Loan* - (6,730) (7,252) (7,815)
Home Loan 2* - - - -
Existing Property 1 - (7,137) (7,653) (8,206)Existing Property 1 - (7,137) (7,653) (8,206)
Existing Property 2 - - - -
Existing Property 3 - - - -
Existing Property 4 - - - -
Existing Property 5 - - - -
Proposed Property 1 468,240 (7,163) (7,681) (8,236)
Proposed Property 2 - - 475,320 (6,730)
Proposed Property 3 - - - - Proposed Property 3 - - - -
Proposed Property 4 - - - -
Proposed Property 5 - - - -
Total 468,240 (21,030) 452,734 (30,987)
Asset Sales (+) / Purchases (-)
Shares / Managed Funds - - - -
Home - - - -
Home 2 - - - -
Existing Property 1 - - - -
Existing Property 2 - - - -
Existing Property 3 - - - -
Existing Property 4 - - - -
Existing Property 5 - - - - Existing Property 5 - - - -
Proposed Property 1 (518,240) - - -
Proposed Property 2 - - (525,320) -
Proposed Property 3 - - - -
Proposed Property 4 - - - -
Proposed Property 5 - - - -
Total (518,240) - (525,320) -
Net Cash Flow (50,000) (21,030) (72,586) (30,987)
* See the 'Where does the money go?' section at the
bottom of the 'Cash Flow' page for any additional home
loan repayments.
Copyright © 2011 Wealth Planners 17
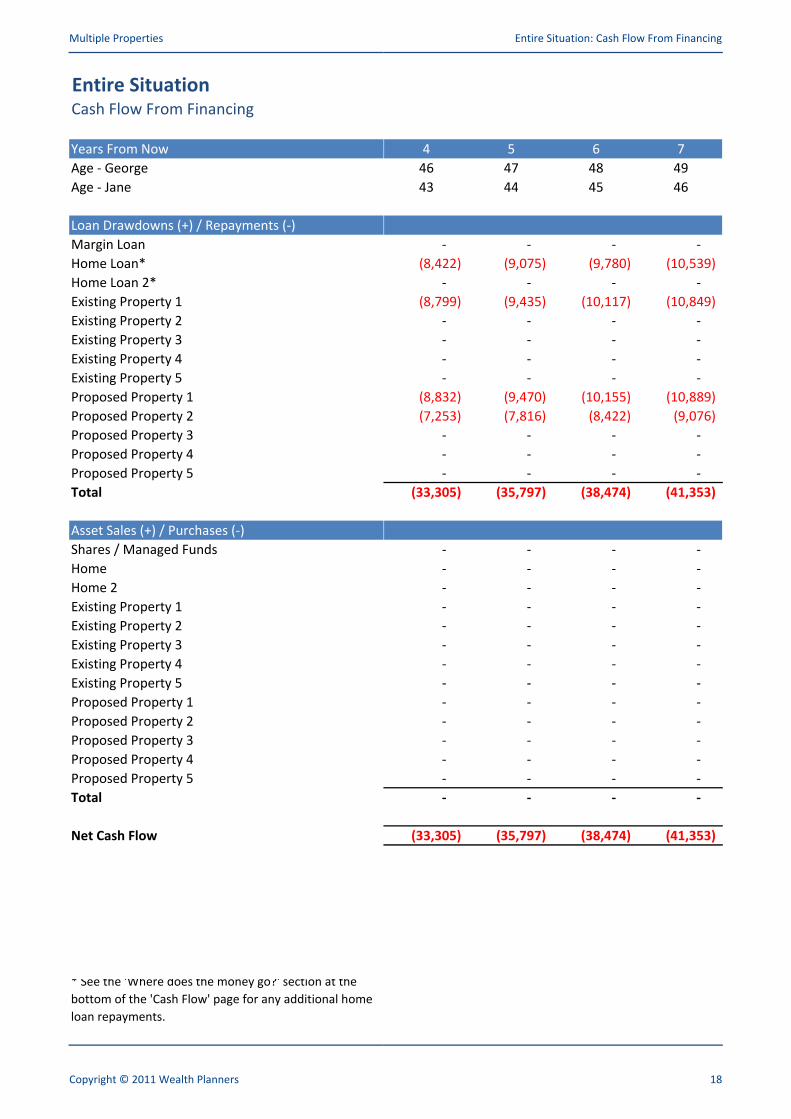
Multiple Properties Entire Situation: Cash Flow From Financing
Entire SituationCash Flow From Financing
Years From Now
Age - George
Age - Jane
4 5 6 7
46 47 48 49
43 44 45 46Age - Jane
Loan Drawdowns (+) / Repayments (-)
Margin Loan
Home Loan*
Home Loan 2*
Existing Property 1
43 44 45 46
- - - -
(8,422) (9,075) (9,780) (10,539)
- - - -
(8,799) (9,435) (10,117) (10,849)Existing Property 1
Existing Property 2
Existing Property 3
Existing Property 4
Existing Property 5
Proposed Property 1
Proposed Property 2
Proposed Property 3
(8,799) (9,435) (10,117) (10,849)
- - - -
- - - -
- - - -
- - - -
(8,832) (9,470) (10,155) (10,889)
(7,253) (7,816) (8,422) (9,076)
- - - - Proposed Property 3
Proposed Property 4
Proposed Property 5
Total
Asset Sales (+) / Purchases (-)
Shares / Managed Funds
- - - -
- - - -
- - - -
(33,305) (35,797) (38,474) (41,353)
- - - -
Home
Home 2
Existing Property 1
Existing Property 2
Existing Property 3
Existing Property 4
Existing Property 5
- - - -
- - - -
- - - -
- - - -
- - - -
- - - -
- - - - Existing Property 5
Proposed Property 1
Proposed Property 2
Proposed Property 3
Proposed Property 4
Proposed Property 5
Total
- - - -
- - - -
- - - -
- - - -
- - - -
- - - -
- - - -
Net Cash Flow (33,305) (35,797) (38,474) (41,353)
* See the 'Where does the money go?' section at the
bottom of the 'Cash Flow' page for any additional home
loan repayments.
Copyright © 2011 Wealth Planners 18

Multiple Properties Entire Situation: Cash Flow From Financing
Entire SituationCash Flow From Financing
Years From Now
Age - George
Age - Jane
8 9 10 11
50 51 52 53
47 48 49 50Age - Jane
Loan Drawdowns (+) / Repayments (-)
Margin Loan
Home Loan*
Home Loan 2*
Existing Property 1
47 48 49 50
- - - -
(11,357) (12,239) (13,189) (14,213)
- - - -
(11,633) (12,474) (13,376) (14,343)Existing Property 1
Existing Property 2
Existing Property 3
Existing Property 4
Existing Property 5
Proposed Property 1
Proposed Property 2
Proposed Property 3
(11,633) (12,474) (13,376) (14,343)
- - - -
- - - -
- - - -
- - - -
(11,676) (12,520) (13,425) (14,396)
(9,781) (10,540) (11,358) (12,240)
- - - - Proposed Property 3
Proposed Property 4
Proposed Property 5
Total
Asset Sales (+) / Purchases (-)
Shares / Managed Funds
- - - -
- - - -
- - - -
(44,447) (47,773) (51,349) (55,192)
- - - -
Home
Home 2
Existing Property 1
Existing Property 2
Existing Property 3
Existing Property 4
Existing Property 5
- - - -
- - - -
- - - -
- - - -
- - - -
- - - -
- - - - Existing Property 5
Proposed Property 1
Proposed Property 2
Proposed Property 3
Proposed Property 4
Proposed Property 5
Total
- - - -
- - - -
- - - -
- - - -
- - - -
- - - -
- - - -
Net Cash Flow (44,447) (47,773) (51,349) (55,192)
* See the 'Where does the money go?' section at the
bottom of the 'Cash Flow' page for any additional home
loan repayments.
Copyright © 2011 Wealth Planners 19
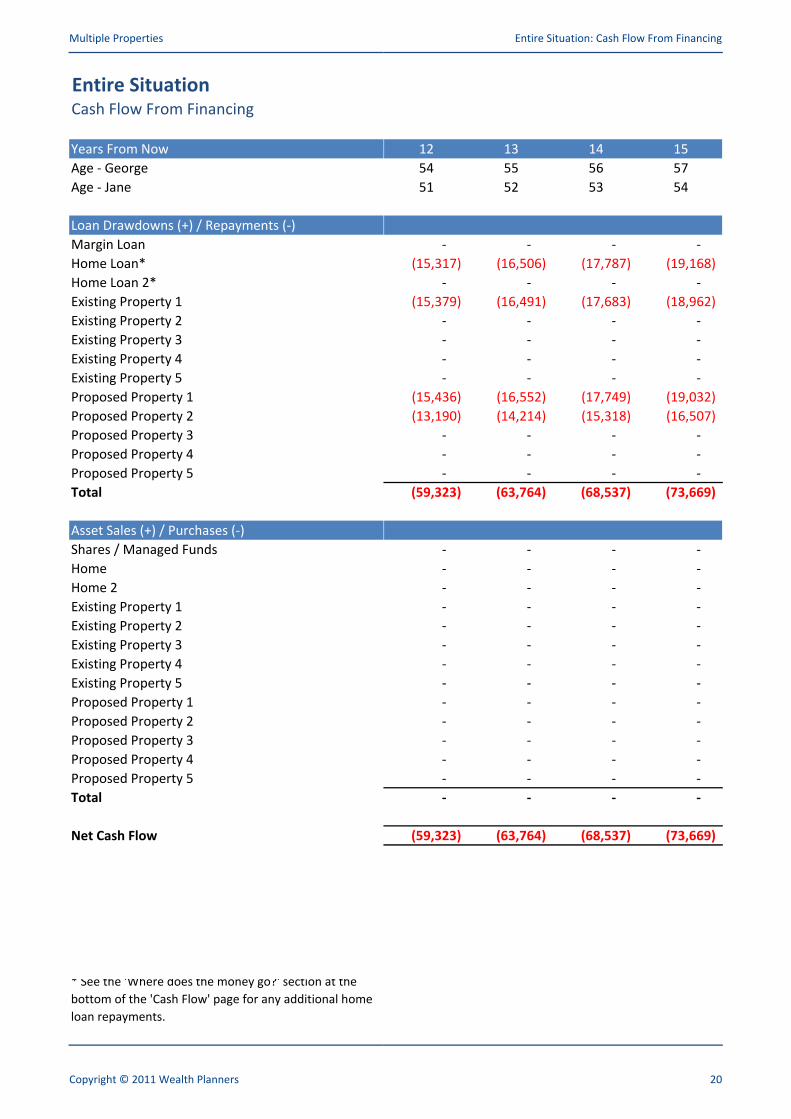
Multiple Properties Entire Situation: Cash Flow From Financing
Entire SituationCash Flow From Financing
Years From Now
Age - George
Age - Jane
12 13 14 15
54 55 56 57
51 52 53 54Age - Jane
Loan Drawdowns (+) / Repayments (-)
Margin Loan
Home Loan*
Home Loan 2*
Existing Property 1
51 52 53 54
- - - -
(15,317) (16,506) (17,787) (19,168)
- - - -
(15,379) (16,491) (17,683) (18,962)Existing Property 1
Existing Property 2
Existing Property 3
Existing Property 4
Existing Property 5
Proposed Property 1
Proposed Property 2
Proposed Property 3
(15,379) (16,491) (17,683) (18,962)
- - - -
- - - -
- - - -
- - - -
(15,436) (16,552) (17,749) (19,032)
(13,190) (14,214) (15,318) (16,507)
- - - - Proposed Property 3
Proposed Property 4
Proposed Property 5
Total
Asset Sales (+) / Purchases (-)
Shares / Managed Funds
- - - -
- - - -
- - - -
(59,323) (63,764) (68,537) (73,669)
- - - -
Home
Home 2
Existing Property 1
Existing Property 2
Existing Property 3
Existing Property 4
Existing Property 5
- - - -
- - - -
- - - -
- - - -
- - - -
- - - -
- - - - Existing Property 5
Proposed Property 1
Proposed Property 2
Proposed Property 3
Proposed Property 4
Proposed Property 5
Total
- - - -
- - - -
- - - -
- - - -
- - - -
- - - -
- - - -
Net Cash Flow (59,323) (63,764) (68,537) (73,669)
* See the 'Where does the money go?' section at the
bottom of the 'Cash Flow' page for any additional home
loan repayments.
Copyright © 2011 Wealth Planners 20

Multiple Properties Entire Situation: Cash Flow From Financing
Entire SituationCash Flow From Financing
Years From Now
Age - George
Age - Jane
16 17 18 19
58 59 60 61
55 56 57 58Age - Jane
Loan Drawdowns (+) / Repayments (-)
Margin Loan
Home Loan*
Home Loan 2*
Existing Property 1
55 56 57 58
- - - -
(20,656) (22,260) (23,988) (25,850)
- - - -
(20,333) (21,802) (23,378) (25,068)Existing Property 1
Existing Property 2
Existing Property 3
Existing Property 4
Existing Property 5
Proposed Property 1
Proposed Property 2
Proposed Property 3
(20,333) (21,802) (23,378) (25,068)
- - - -
- - - -
- - - -
- - - -
(20,408) (21,883) (23,465) (25,161)
(17,789) (19,170) (20,658) (22,261)
- - - - Proposed Property 3
Proposed Property 4
Proposed Property 5
Total
Asset Sales (+) / Purchases (-)
Shares / Managed Funds
- - - -
- - - -
- - - -
(79,185) (85,114) (91,489) (98,341)
- - - -
Home
Home 2
Existing Property 1
Existing Property 2
Existing Property 3
Existing Property 4
Existing Property 5
- - - -
- - - -
- - - -
- - - -
- - - -
- - - -
- - - - Existing Property 5
Proposed Property 1
Proposed Property 2
Proposed Property 3
Proposed Property 4
Proposed Property 5
Total
- - - -
- - - -
- - - -
- - - -
- - - -
- - - -
- - - -
Net Cash Flow (79,185) (85,114) (91,489) (98,341)
* See the 'Where does the money go?' section at the
bottom of the 'Cash Flow' page for any additional home
loan repayments.
Copyright © 2011 Wealth Planners 21
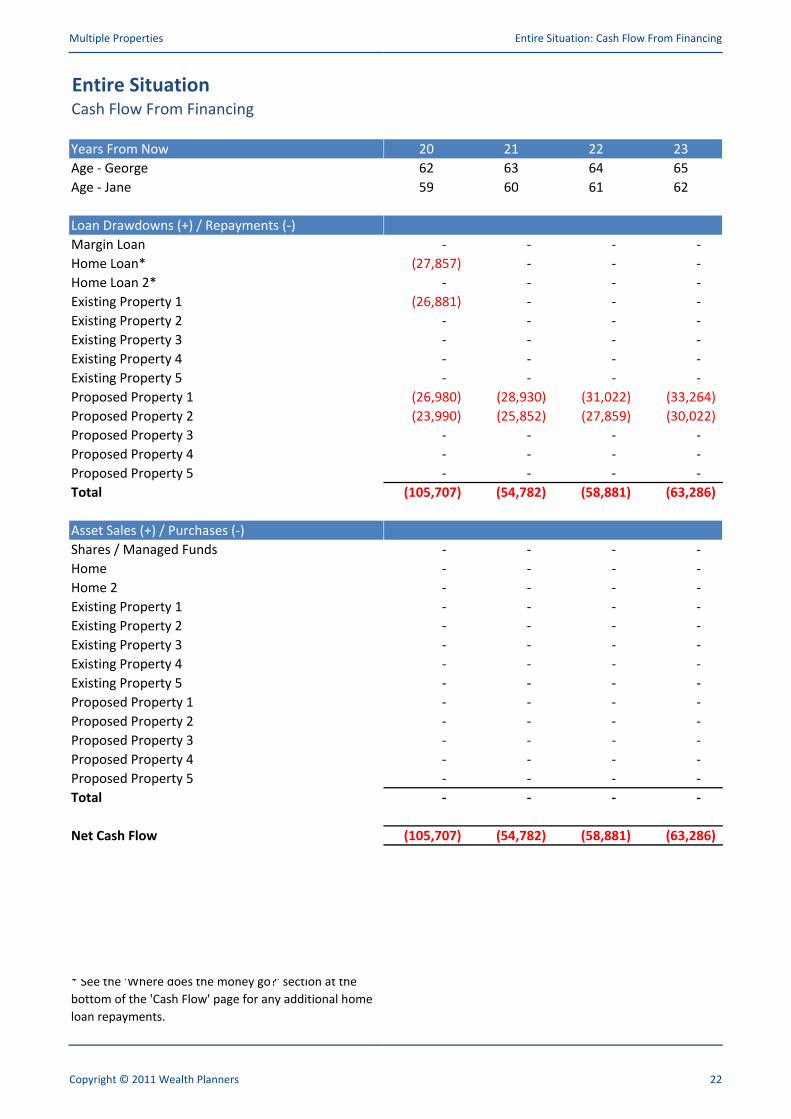
Multiple Properties Entire Situation: Cash Flow From Financing
Entire SituationCash Flow From Financing
Years From Now
Age - George
Age - Jane
20 21 22 23
62 63 64 65
59 60 61 62Age - Jane
Loan Drawdowns (+) / Repayments (-)
Margin Loan
Home Loan*
Home Loan 2*
Existing Property 1
59 60 61 62
- - - -
(27,857) - - -
- - - -
(26,881) - - - Existing Property 1
Existing Property 2
Existing Property 3
Existing Property 4
Existing Property 5
Proposed Property 1
Proposed Property 2
Proposed Property 3
(26,881) - - -
- - - -
- - - -
- - - -
- - - -
(26,980) (28,930) (31,022) (33,264)
(23,990) (25,852) (27,859) (30,022)
- - - - Proposed Property 3
Proposed Property 4
Proposed Property 5
Total
Asset Sales (+) / Purchases (-)
Shares / Managed Funds
- - - -
- - - -
- - - -
(105,707) (54,782) (58,881) (63,286)
- - - -
Home
Home 2
Existing Property 1
Existing Property 2
Existing Property 3
Existing Property 4
Existing Property 5
- - - -
- - - -
- - - -
- - - -
- - - -
- - - -
- - - - Existing Property 5
Proposed Property 1
Proposed Property 2
Proposed Property 3
Proposed Property 4
Proposed Property 5
Total
- - - -
- - - -
- - - -
- - - -
- - - -
- - - -
- - - -
Net Cash Flow (105,707) (54,782) (58,881) (63,286)
* See the 'Where does the money go?' section at the
bottom of the 'Cash Flow' page for any additional home
loan repayments.
Copyright © 2011 Wealth Planners 22
Multiple Properties Entire Situation: Cash Flow From Financing
Entire SituationCash Flow From Financing
Years From Now
Age - George
Age - Jane
24 25 26 27
66 67 68 69
63 64 65 66Age - Jane
Loan Drawdowns (+) / Repayments (-)
Margin Loan
Home Loan*
Home Loan 2*
Existing Property 1
63 64 65 66
- - - -
- - - -
- - - -
- - - - Existing Property 1
Existing Property 2
Existing Property 3
Existing Property 4
Existing Property 5
Proposed Property 1
Proposed Property 2
Proposed Property 3
- - - -
- - - -
- - - -
- - - -
- - - -
(35,669) (38,247) - -
(32,352) (34,864) (37,571) (40,487)
- - - - Proposed Property 3
Proposed Property 4
Proposed Property 5
Total
Asset Sales (+) / Purchases (-)
Shares / Managed Funds
- - - -
- - - -
- - - -
(68,021) (73,111) (37,571) (40,487)
- - - -
Home
Home 2
Existing Property 1
Existing Property 2
Existing Property 3
Existing Property 4
Existing Property 5
- - - -
- - - -
- - - -
- - - -
- - - -
- - - -
- - - - Existing Property 5
Proposed Property 1
Proposed Property 2
Proposed Property 3
Proposed Property 4
Proposed Property 5
Total
- - - -
- - - -
- - - -
- - - -
- - - -
- - - -
- - - -
Net Cash Flow (68,021) (73,111) (37,571) (40,487)
* See the 'Where does the money go?' section at the
bottom of the 'Cash Flow' page for any additional home
loan repayments.
Copyright © 2011 Wealth Planners 23
Multiple Properties Entire Situation: Cash Flow From Financing
Entire SituationCash Flow From Financing
Years From Now
Age - George
Age - Jane
28 29 30
70 71 72
67 68 69Age - Jane
Loan Drawdowns (+) / Repayments (-)
Margin Loan
Home Loan*
Home Loan 2*
Existing Property 1
67 68 69
- - -
- - -
- - -
- - - Existing Property 1
Existing Property 2
Existing Property 3
Existing Property 4
Existing Property 5
Proposed Property 1
Proposed Property 2
Proposed Property 3
- - -
- - -
- - -
- - -
- - -
- - -
- - -
- - - Proposed Property 3
Proposed Property 4
Proposed Property 5
Total
Asset Sales (+) / Purchases (-)
Shares / Managed Funds
- - -
- - -
- - -
- - -
- - -
Home
Home 2
Existing Property 1
Existing Property 2
Existing Property 3
Existing Property 4
Existing Property 5
- - -
- - -
- - -
- - -
- - -
- - -
- - - Existing Property 5
Proposed Property 1
Proposed Property 2
Proposed Property 3
Proposed Property 4
Proposed Property 5
Total
- - -
- - -
- - -
- - -
- - -
- - -
- - -
Net Cash Flow - - -
* See the 'Where does the money go?' section at the
bottom of the 'Cash Flow' page for any additional home
loan repayments.
Copyright © 2011 Wealth Planners 24
Multiple Properties Entire Situation: Assets Loans
Entire SituationAssets & Loans
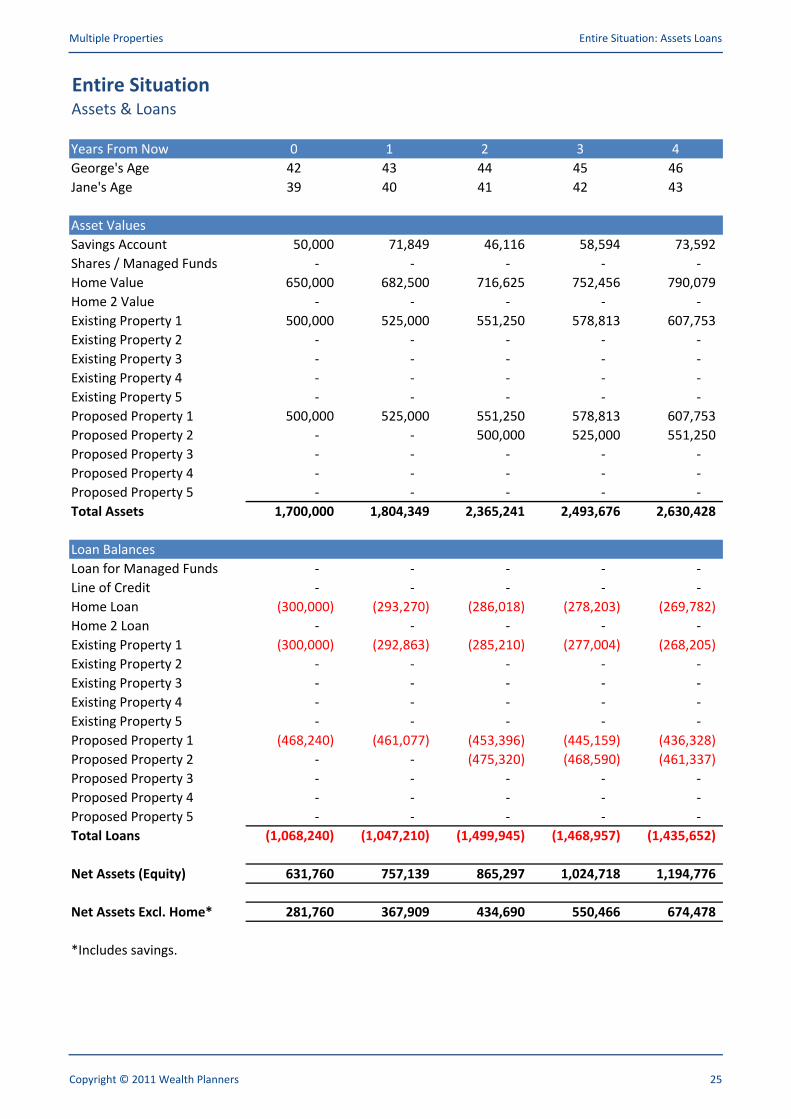
Years From Now 0 1 2 3 4
George's Age 42 43 44 45 46
Jane's Age 39 40 41 42 43Jane's Age 39 40 41 42 43
Asset Values
Savings Account 50,000 71,849 46,116 58,594 73,592
Shares / Managed Funds - - - - -
Home Value 650,000 682,500 716,625 752,456 790,079
Home 2 Value - - - - - Home 2 Value - - - - -
Existing Property 1 500,000 525,000 551,250 578,813 607,753
Existing Property 2 - - - - -
Existing Property 3 - - - - -
Existing Property 4 - - - - -
Existing Property 5 - - - - -
Proposed Property 1 500,000 525,000 551,250 578,813 607,753
Proposed Property 2 - - 500,000 525,000 551,250 Proposed Property 2 - - 500,000 525,000 551,250
Proposed Property 3 - - - - -
Proposed Property 4 - - - - -
Proposed Property 5 - - - - -
Total Assets 1,700,000 1,804,349 2,365,241 2,493,676 2,630,428
Loan Balances
Loan for Managed Funds - - - - -
Line of Credit - - - - -
Home Loan (300,000) (293,270) (286,018) (278,203) (269,782)
Home 2 Loan - - - - -
Existing Property 1 (300,000) (292,863) (285,210) (277,004) (268,205)
Existing Property 2 - - - - -
Existing Property 3 - - - - - Existing Property 3 - - - - -
Existing Property 4 - - - - -
Existing Property 5 - - - - -
Proposed Property 1 (468,240) (461,077) (453,396) (445,159) (436,328)
Proposed Property 2 - - (475,320) (468,590) (461,337)
Proposed Property 3 - - - - -
Proposed Property 4 - - - - -
Proposed Property 5 - - - - - Proposed Property 5 - - - - -
Total Loans (1,068,240) (1,047,210) (1,499,945) (1,468,957) (1,435,652)
Net Assets (Equity) 631,760 757,139 865,297 1,024,718 1,194,776
Net Assets Excl. Home* 281,760 367,909 434,690 550,466 674,478
*Includes savings.
Copyright © 2011 Wealth Planners 25
Multiple Properties Entire Situation: Assets Loans
Entire SituationAssets & Loans
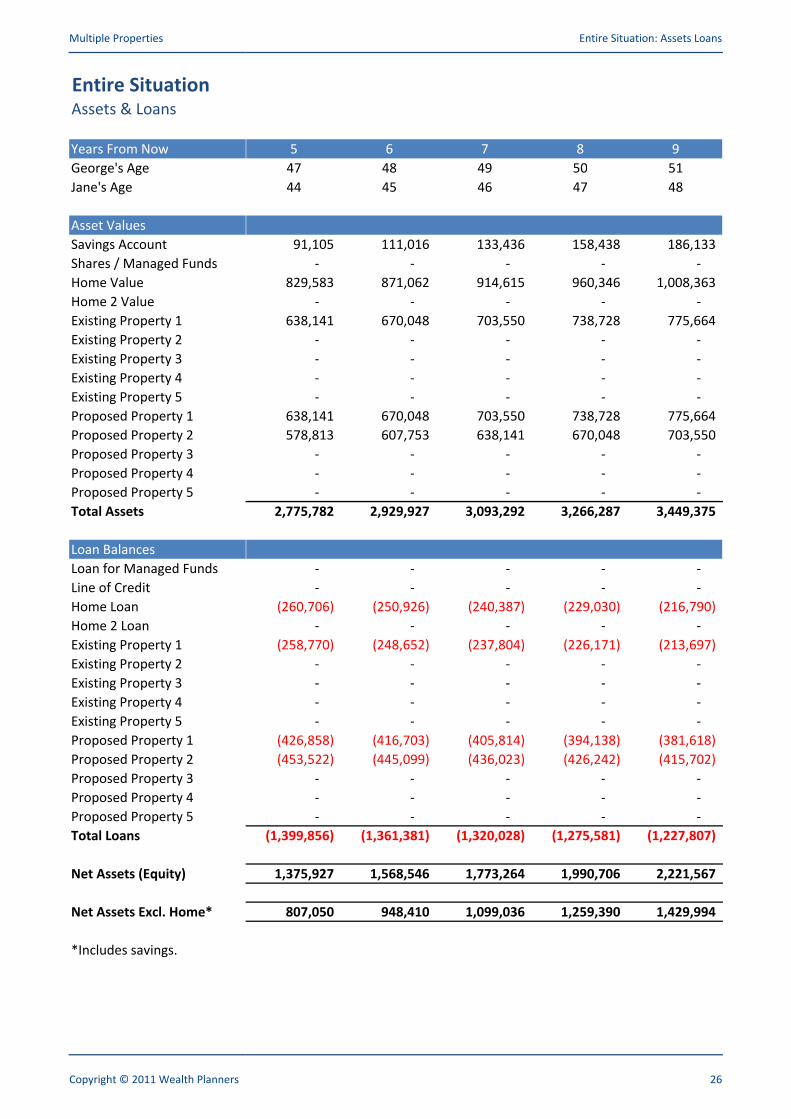
Years From Now
George's Age
Jane's Age
5 6 7 8 9
47 48 49 50 51
44 45 46 47 48Jane's Age
Asset Values
Savings Account
Shares / Managed Funds
Home Value
Home 2 Value
44 45 46 47 48
91,105 111,016 133,436 158,438 186,133
- - - - -
829,583 871,062 914,615 960,346 1,008,363
- - - - - Home 2 Value
Existing Property 1
Existing Property 2
Existing Property 3
Existing Property 4
Existing Property 5
Proposed Property 1
Proposed Property 2
- - - - -
638,141 670,048 703,550 738,728 775,664
- - - - -
- - - - -
- - - - -
- - - - -
638,141 670,048 703,550 738,728 775,664
578,813 607,753 638,141 670,048 703,550 Proposed Property 2
Proposed Property 3
Proposed Property 4
Proposed Property 5
Total Assets
Loan Balances
578,813 607,753 638,141 670,048 703,550
- - - - -
- - - - -
- - - - -
2,775,782 2,929,927 3,093,292 3,266,287 3,449,375
Loan for Managed Funds
Line of Credit
Home Loan
Home 2 Loan
Existing Property 1
Existing Property 2
Existing Property 3
- - - - -
- - - - -
(260,706) (250,926) (240,387) (229,030) (216,790)
- - - - -
(258,770) (248,652) (237,804) (226,171) (213,697)
- - - - -
- - - - - Existing Property 3
Existing Property 4
Existing Property 5
Proposed Property 1
Proposed Property 2
Proposed Property 3
Proposed Property 4
Proposed Property 5
- - - - -
- - - - -
- - - - -
(426,858) (416,703) (405,814) (394,138) (381,618)
(453,522) (445,099) (436,023) (426,242) (415,702)
- - - - -
- - - - -
- - - - - Proposed Property 5
Total Loans
Net Assets (Equity)
Net Assets Excl. Home*
- - - - -
(1,399,856) (1,361,381) (1,320,028) (1,275,581) (1,227,807)
1,375,927 1,568,546 1,773,264 1,990,706 2,221,567
807,050 948,410 1,099,036 1,259,390 1,429,994
*Includes savings.
Copyright © 2011 Wealth Planners 26
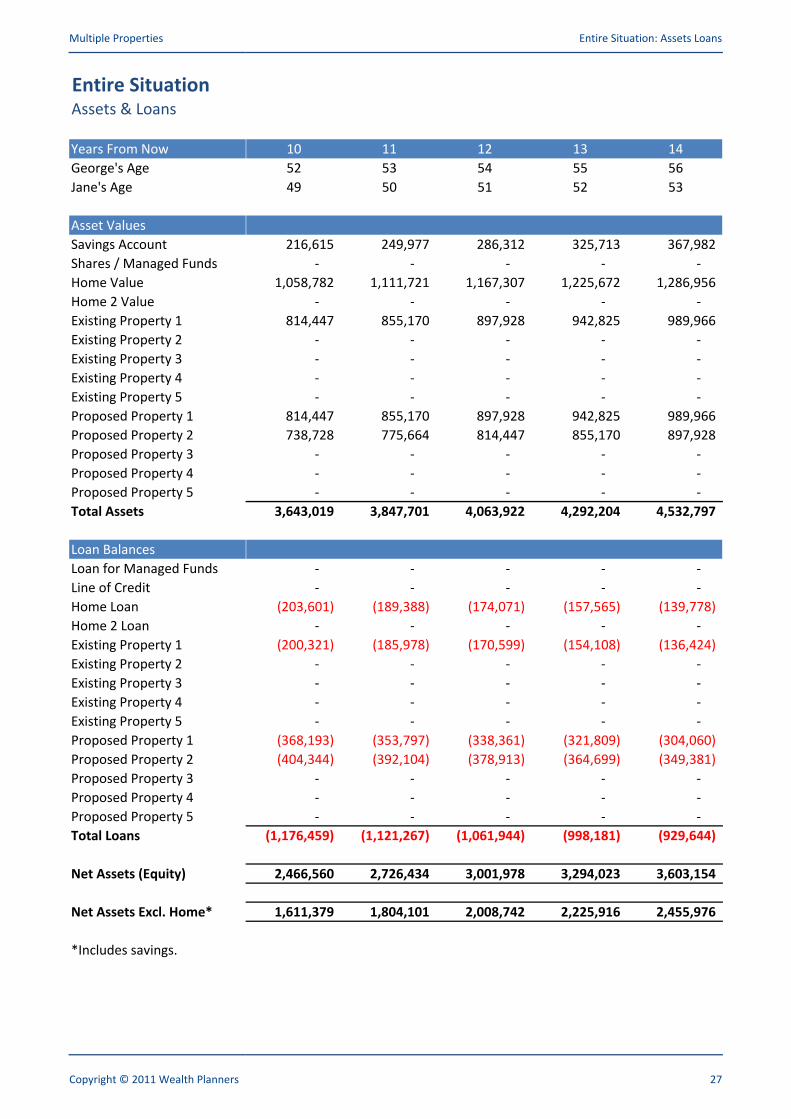
Multiple Properties Entire Situation: Assets Loans
Entire SituationAssets & Loans
Years From Now
George's Age
Jane's Age
10 11 12 13 14
52 53 54 55 56
49 50 51 52 53Jane's Age
Asset Values
Savings Account
Shares / Managed Funds
Home Value
Home 2 Value
49 50 51 52 53
216,615 249,977 286,312 325,713 367,982
- - - - -
1,058,782 1,111,721 1,167,307 1,225,672 1,286,956
- - - - - Home 2 Value
Existing Property 1
Existing Property 2
Existing Property 3
Existing Property 4
Existing Property 5
Proposed Property 1
Proposed Property 2
- - - - -
814,447 855,170 897,928 942,825 989,966
- - - - -
- - - - -
- - - - -
- - - - -
814,447 855,170 897,928 942,825 989,966
738,728 775,664 814,447 855,170 897,928 Proposed Property 2
Proposed Property 3
Proposed Property 4
Proposed Property 5
Total Assets
Loan Balances
738,728 775,664 814,447 855,170 897,928
- - - - -
- - - - -
- - - - -
3,643,019 3,847,701 4,063,922 4,292,204 4,532,797
Loan for Managed Funds
Line of Credit
Home Loan
Home 2 Loan
Existing Property 1
Existing Property 2
Existing Property 3
- - - - -
- - - - -
(203,601) (189,388) (174,071) (157,565) (139,778)
- - - - -
(200,321) (185,978) (170,599) (154,108) (136,424)
- - - - -
- - - - - Existing Property 3
Existing Property 4
Existing Property 5
Proposed Property 1
Proposed Property 2
Proposed Property 3
Proposed Property 4
Proposed Property 5
- - - - -
- - - - -
- - - - -
(368,193) (353,797) (338,361) (321,809) (304,060)
(404,344) (392,104) (378,913) (364,699) (349,381)
- - - - -
- - - - -
- - - - - Proposed Property 5
Total Loans
Net Assets (Equity)
Net Assets Excl. Home*
- - - - -
(1,176,459) (1,121,267) (1,061,944) (998,181) (929,644)
2,466,560 2,726,434 3,001,978 3,294,023 3,603,154
1,611,379 1,804,101 2,008,742 2,225,916 2,455,976
*Includes savings.
Copyright © 2011 Wealth Planners 27
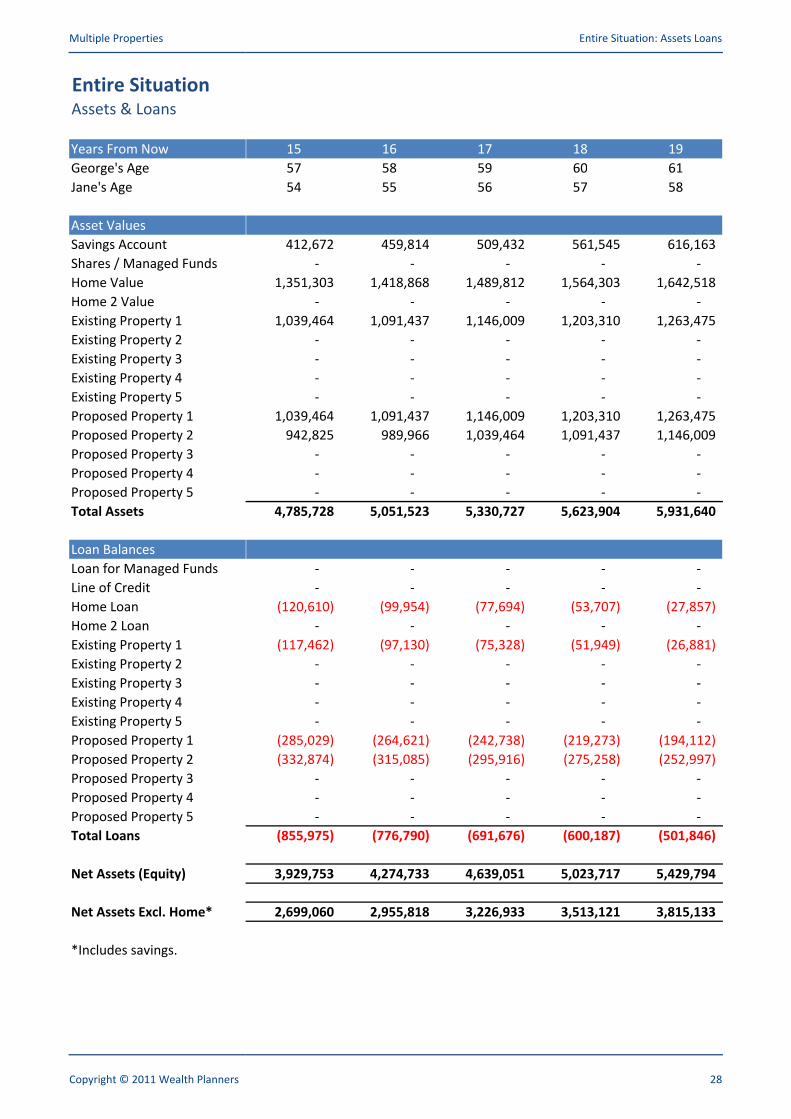
Multiple Properties Entire Situation: Assets Loans
Entire SituationAssets & Loans
Years From Now
George's Age
Jane's Age
15 16 17 18 19
57 58 59 60 61
54 55 56 57 58Jane's Age
Asset Values
Savings Account
Shares / Managed Funds
Home Value
Home 2 Value
54 55 56 57 58
412,672 459,814 509,432 561,545 616,163
- - - - -
1,351,303 1,418,868 1,489,812 1,564,303 1,642,518
- - - - - Home 2 Value
Existing Property 1
Existing Property 2
Existing Property 3
Existing Property 4
Existing Property 5
Proposed Property 1
Proposed Property 2
- - - - -
1,039,464 1,091,437 1,146,009 1,203,310 1,263,475
- - - - -
- - - - -
- - - - -
- - - - -
1,039,464 1,091,437 1,146,009 1,203,310 1,263,475
942,825 989,966 1,039,464 1,091,437 1,146,009 Proposed Property 2
Proposed Property 3
Proposed Property 4
Proposed Property 5
Total Assets
Loan Balances
942,825 989,966 1,039,464 1,091,437 1,146,009
- - - - -
- - - - -
- - - - -
4,785,728 5,051,523 5,330,727 5,623,904 5,931,640
Loan for Managed Funds
Line of Credit
Home Loan
Home 2 Loan
Existing Property 1
Existing Property 2
Existing Property 3
- - - - -
- - - - -
(120,610) (99,954) (77,694) (53,707) (27,857)
- - - - -
(117,462) (97,130) (75,328) (51,949) (26,881)
- - - - -
- - - - - Existing Property 3
Existing Property 4
Existing Property 5
Proposed Property 1
Proposed Property 2
Proposed Property 3
Proposed Property 4
Proposed Property 5
- - - - -
- - - - -
- - - - -
(285,029) (264,621) (242,738) (219,273) (194,112)
(332,874) (315,085) (295,916) (275,258) (252,997)
- - - - -
- - - - -
- - - - - Proposed Property 5
Total Loans
Net Assets (Equity)
Net Assets Excl. Home*
- - - - -
(855,975) (776,790) (691,676) (600,187) (501,846)
3,929,753 4,274,733 4,639,051 5,023,717 5,429,794
2,699,060 2,955,818 3,226,933 3,513,121 3,815,133
*Includes savings.
Copyright © 2011 Wealth Planners 28
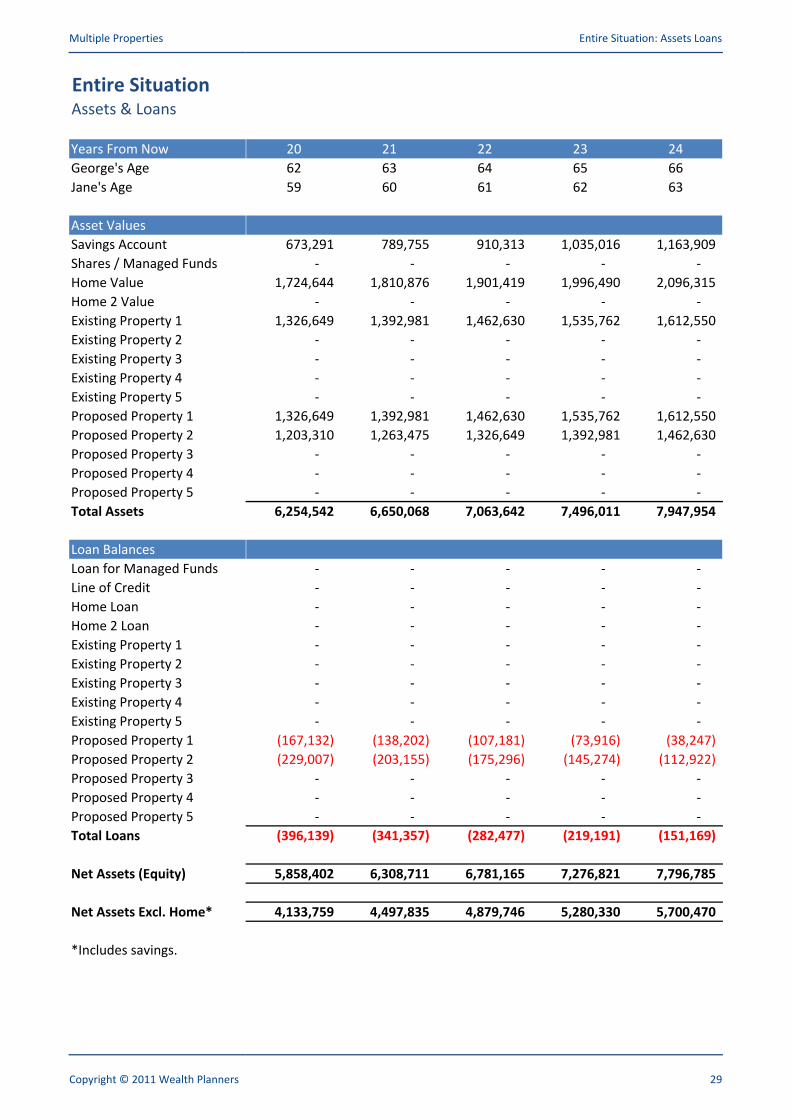
Multiple Properties Entire Situation: Assets Loans
Entire SituationAssets & Loans
Years From Now
George's Age
Jane's Age
20 21 22 23 24
62 63 64 65 66
59 60 61 62 63Jane's Age
Asset Values
Savings Account
Shares / Managed Funds
Home Value
Home 2 Value
59 60 61 62 63
673,291 789,755 910,313 1,035,016 1,163,909
- - - - -
1,724,644 1,810,876 1,901,419 1,996,490 2,096,315
- - - - - Home 2 Value
Existing Property 1
Existing Property 2
Existing Property 3
Existing Property 4
Existing Property 5
Proposed Property 1
Proposed Property 2
- - - - -
1,326,649 1,392,981 1,462,630 1,535,762 1,612,550
- - - - -
- - - - -
- - - - -
- - - - -
1,326,649 1,392,981 1,462,630 1,535,762 1,612,550
1,203,310 1,263,475 1,326,649 1,392,981 1,462,630 Proposed Property 2
Proposed Property 3
Proposed Property 4
Proposed Property 5
Total Assets
Loan Balances
1,203,310 1,263,475 1,326,649 1,392,981 1,462,630
- - - - -
- - - - -
- - - - -
6,254,542 6,650,068 7,063,642 7,496,011 7,947,954
Loan for Managed Funds
Line of Credit
Home Loan
Home 2 Loan
Existing Property 1
Existing Property 2
Existing Property 3
- - - - -
- - - - -
- - - - -
- - - - -
- - - - -
- - - - -
- - - - - Existing Property 3
Existing Property 4
Existing Property 5
Proposed Property 1
Proposed Property 2
Proposed Property 3
Proposed Property 4
Proposed Property 5
- - - - -
- - - - -
- - - - -
(167,132) (138,202) (107,181) (73,916) (38,247)
(229,007) (203,155) (175,296) (145,274) (112,922)
- - - - -
- - - - -
- - - - - Proposed Property 5
Total Loans
Net Assets (Equity)
Net Assets Excl. Home*
- - - - -
(396,139) (341,357) (282,477) (219,191) (151,169)
5,858,402 6,308,711 6,781,165 7,276,821 7,796,785
4,133,759 4,497,835 4,879,746 5,280,330 5,700,470
*Includes savings.
Copyright © 2011 Wealth Planners 29
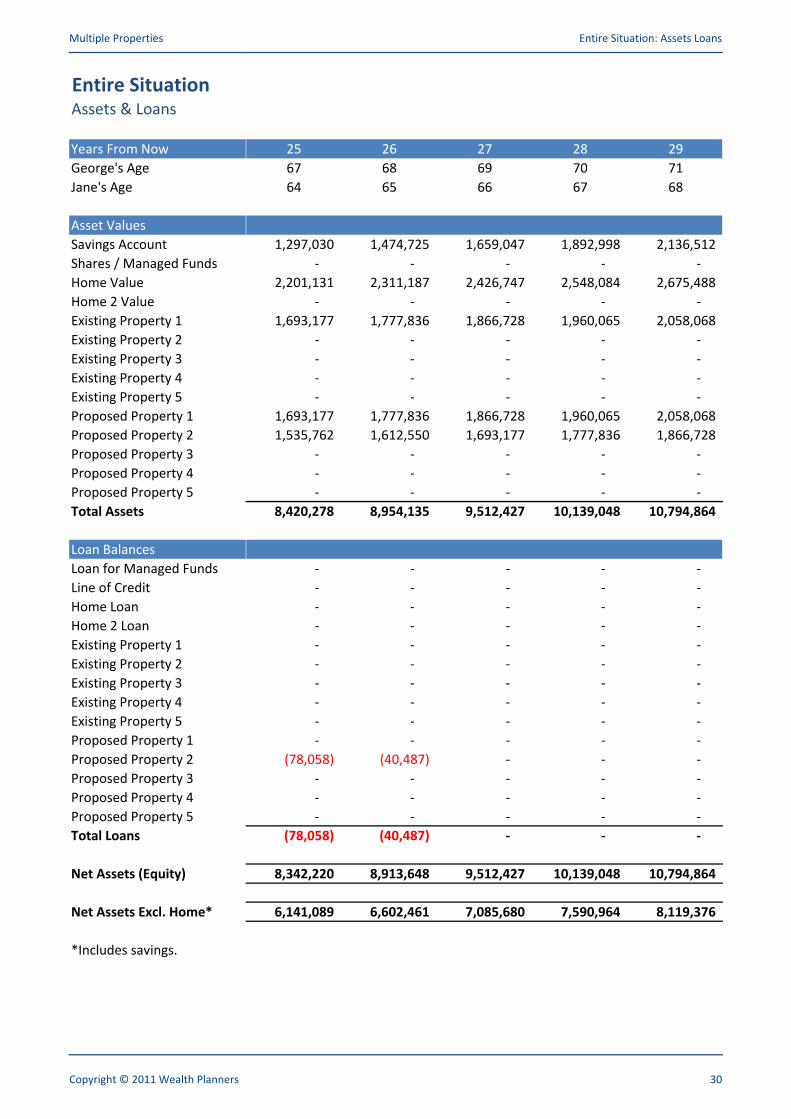
Multiple Properties Entire Situation: Assets Loans
Entire SituationAssets & Loans
Years From Now
George's Age
Jane's Age
25 26 27 28 29
67 68 69 70 71
64 65 66 67 68Jane's Age
Asset Values
Savings Account
Shares / Managed Funds
Home Value
Home 2 Value
64 65 66 67 68
1,297,030 1,474,725 1,659,047 1,892,998 2,136,512
- - - - -
2,201,131 2,311,187 2,426,747 2,548,084 2,675,488
- - - - - Home 2 Value
Existing Property 1
Existing Property 2
Existing Property 3
Existing Property 4
Existing Property 5
Proposed Property 1
Proposed Property 2
- - - - -
1,693,177 1,777,836 1,866,728 1,960,065 2,058,068
- - - - -
- - - - -
- - - - -
- - - - -
1,693,177 1,777,836 1,866,728 1,960,065 2,058,068
1,535,762 1,612,550 1,693,177 1,777,836 1,866,728 Proposed Property 2
Proposed Property 3
Proposed Property 4
Proposed Property 5
Total Assets
Loan Balances
1,535,762 1,612,550 1,693,177 1,777,836 1,866,728
- - - - -
- - - - -
- - - - -
8,420,278 8,954,135 9,512,427 10,139,048 10,794,864
Loan for Managed Funds
Line of Credit
Home Loan
Home 2 Loan
Existing Property 1
Existing Property 2
Existing Property 3
- - - - -
- - - - -
- - - - -
- - - - -
- - - - -
- - - - -
- - - - - Existing Property 3
Existing Property 4
Existing Property 5
Proposed Property 1
Proposed Property 2
Proposed Property 3
Proposed Property 4
Proposed Property 5
- - - - -
- - - - -
- - - - -
- - - - -
(78,058) (40,487) - - -
- - - - -
- - - - -
- - - - - Proposed Property 5
Total Loans
Net Assets (Equity)
Net Assets Excl. Home*
- - - - -
(78,058) (40,487) - - -
8,342,220 8,913,648 9,512,427 10,139,048 10,794,864
6,141,089 6,602,461 7,085,680 7,590,964 8,119,376
*Includes savings.
Copyright © 2011 Wealth Planners 30
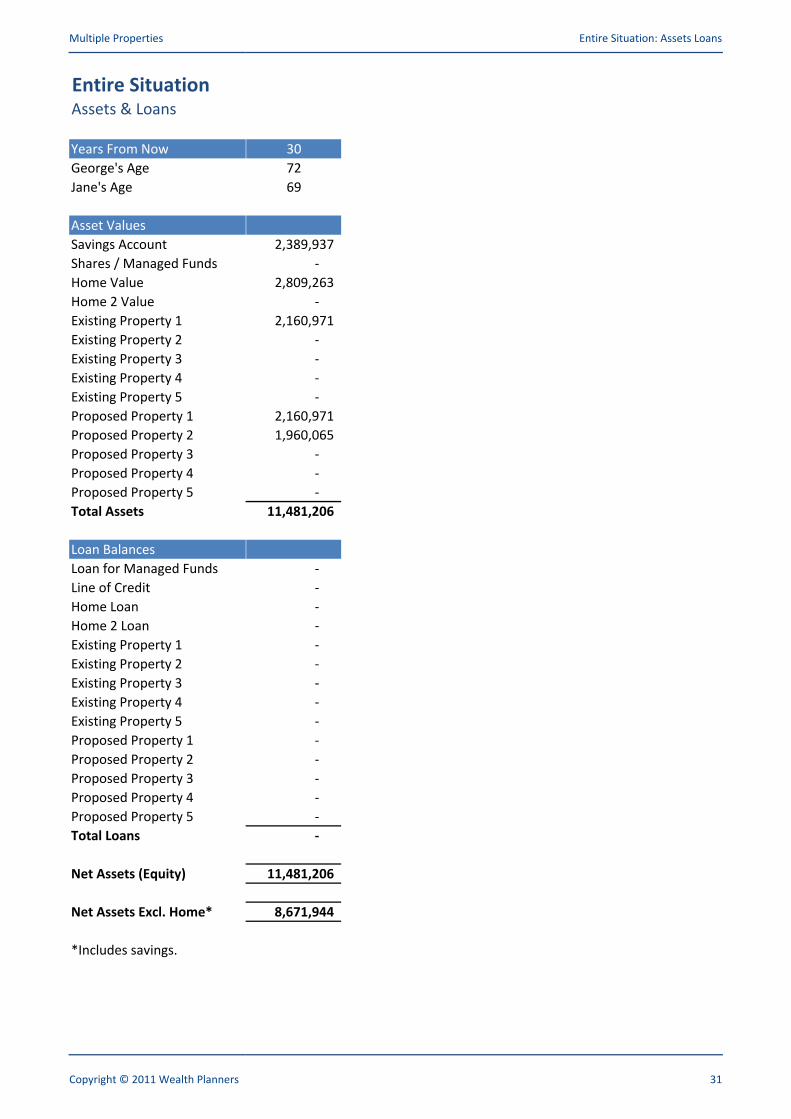
Multiple Properties Entire Situation: Assets Loans
Entire SituationAssets & Loans
Years From Now
George's Age
Jane's Age
30
72
69Jane's Age
Asset Values
Savings Account
Shares / Managed Funds
Home Value
Home 2 Value
69
2,389,937
-
2,809,263
- Home 2 Value
Existing Property 1
Existing Property 2
Existing Property 3
Existing Property 4
Existing Property 5
Proposed Property 1
Proposed Property 2
-
2,160,971
-
-
-
-
2,160,971
1,960,065 Proposed Property 2
Proposed Property 3
Proposed Property 4
Proposed Property 5
Total Assets
Loan Balances
1,960,065
-
-
-
11,481,206
Loan for Managed Funds
Line of Credit
Home Loan
Home 2 Loan
Existing Property 1
Existing Property 2
Existing Property 3
-
-
-
-
-
-
- Existing Property 3
Existing Property 4
Existing Property 5
Proposed Property 1
Proposed Property 2
Proposed Property 3
Proposed Property 4
Proposed Property 5
-
-
-
-
-
-
-
- Proposed Property 5
Total Loans
Net Assets (Equity)
Net Assets Excl. Home*
-
-
11,481,206
8,671,944
*Includes savings.
Copyright © 2011 Wealth Planners 31
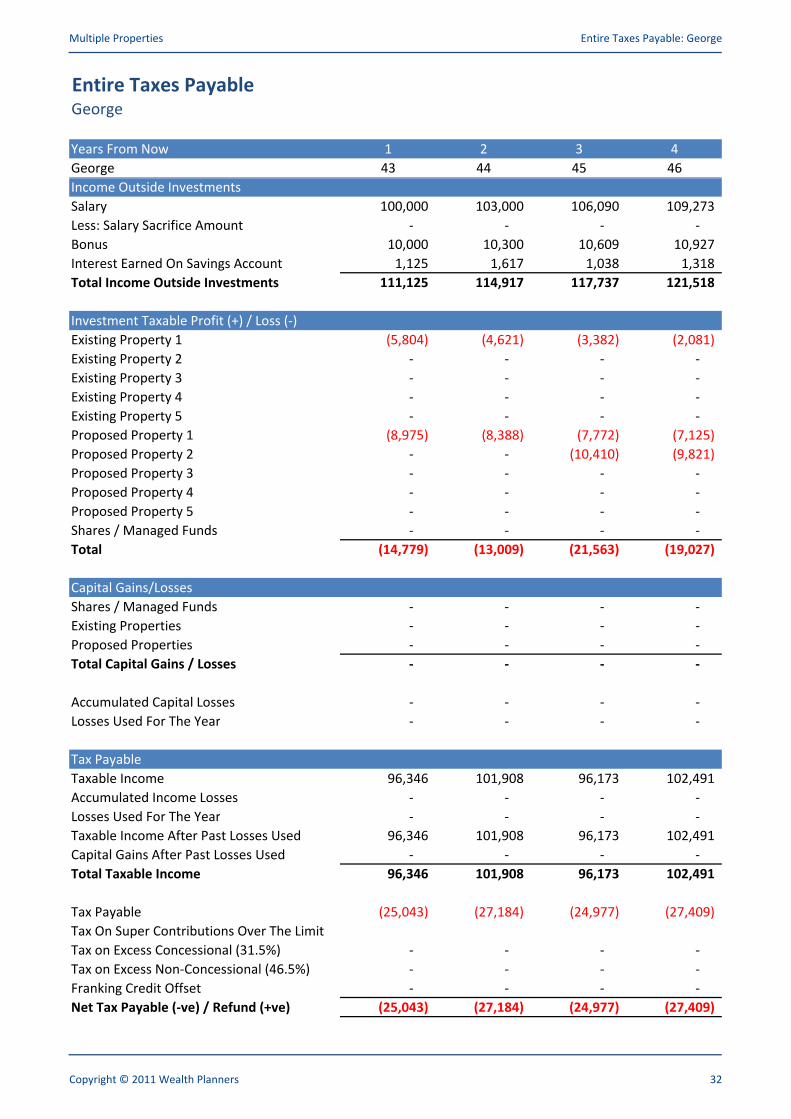
Multiple Properties Entire Taxes Payable: George
Entire Taxes PayableGeorge
Years From Now 1 2 3 4
George 43 44 45 46
Income Outside InvestmentsIncome Outside Investments
Salary 100,000 103,000 106,090 109,273
Less: Salary Sacrifice Amount - - - -
Bonus 10,000 10,300 10,609 10,927
Interest Earned On Savings Account 1,125 1,617 1,038 1,318
Total Income Outside Investments 111,125 114,917 117,737 121,518
Investment Taxable Profit (+) / Loss (-)
Existing Property 1 (5,804) (4,621) (3,382) (2,081)
Existing Property 2 - - - -
Existing Property 3 - - - -
Existing Property 4 - - - -
Existing Property 5 - - - -
Proposed Property 1 (8,975) (8,388) (7,772) (7,125)Proposed Property 1 (8,975) (8,388) (7,772) (7,125)
Proposed Property 2 - - (10,410) (9,821)
Proposed Property 3 - - - -
Proposed Property 4 - - - -
Proposed Property 5 - - - -
Shares / Managed Funds - - - -
Total (14,779) (13,009) (21,563) (19,027)
Capital Gains/Losses
Shares / Managed Funds - - - -
Existing Properties - - - -
Proposed Properties - - - -
Total Capital Gains / Losses - - - -
Accumulated Capital Losses - - - -
Losses Used For The Year - - - -
Tax Payable
Taxable Income 96,346 101,908 96,173 102,491
Accumulated Income Losses - - - -
Losses Used For The Year - - - - Losses Used For The Year - - - -
Taxable Income After Past Losses Used 96,346 101,908 96,173 102,491
Capital Gains After Past Losses Used - - - -
Total Taxable Income 96,346 101,908 96,173 102,491
Tax Payable (25,043) (27,184) (24,977) (27,409)
Tax On Super Contributions Over The LimitTax On Super Contributions Over The Limit
Tax on Excess Concessional (31.5%) - - - -
Tax on Excess Non-Concessional (46.5%) - - - -
Franking Credit Offset - - - -
Net Tax Payable (-ve) / Refund (+ve) (25,043) (27,184) (24,977) (27,409)
Copyright © 2011 Wealth Planners 32

Multiple Properties Entire Taxes Payable: George
Entire Taxes PayableGeorge
Years From Now
George
Income Outside Investments
5 6 7 8
47 48 49 50
Income Outside Investments
Salary
Less: Salary Sacrifice Amount
Bonus
Interest Earned On Savings Account
Total Income Outside Investments
112,551 115,927 119,405 122,987
- - - -
11,255 11,593 11,941 12,299
1,656 2,050 2,498 3,002
125,462 129,570 133,844 138,288
Investment Taxable Profit (+) / Loss (-)
Existing Property 1
Existing Property 2
Existing Property 3
Existing Property 4
Existing Property 5
Proposed Property 1
(717) 716 2,220 3,800
- - - -
- - - -
- - - -
- - - -
(6,447) (5,710) (4,962) (4,176)Proposed Property 1
Proposed Property 2
Proposed Property 3
Proposed Property 4
Proposed Property 5
Shares / Managed Funds
Total
(6,447) (5,710) (4,962) (4,176)
(9,201) (8,549) (7,863) (7,116)
- - - -
- - - -
- - - -
- - - -
(16,365) (13,543) (10,605) (7,492)
Capital Gains/Losses
Shares / Managed Funds
Existing Properties
Proposed Properties
Total Capital Gains / Losses
- - - -
- - - -
- - - -
- - - -
Accumulated Capital Losses
Losses Used For The Year
Tax Payable
Taxable Income
Accumulated Income Losses
Losses Used For The Year
- - - -
- - - -
109,097 116,027 123,238 130,796
- - - -
- - - - Losses Used For The Year
Taxable Income After Past Losses Used
Capital Gains After Past Losses Used
Total Taxable Income
Tax Payable
Tax On Super Contributions Over The Limit
- - - -
109,097 116,027 123,238 130,796
- - - -
109,097 116,027 123,238 130,796
(29,952) (32,620) (35,397) (38,306)
Tax On Super Contributions Over The Limit
Tax on Excess Concessional (31.5%)
Tax on Excess Non-Concessional (46.5%)
Franking Credit Offset
Net Tax Payable (-ve) / Refund (+ve)
- - - -
- - - -
- - - -
(29,952) (32,620) (35,397) (38,306)
Copyright © 2011 Wealth Planners 33
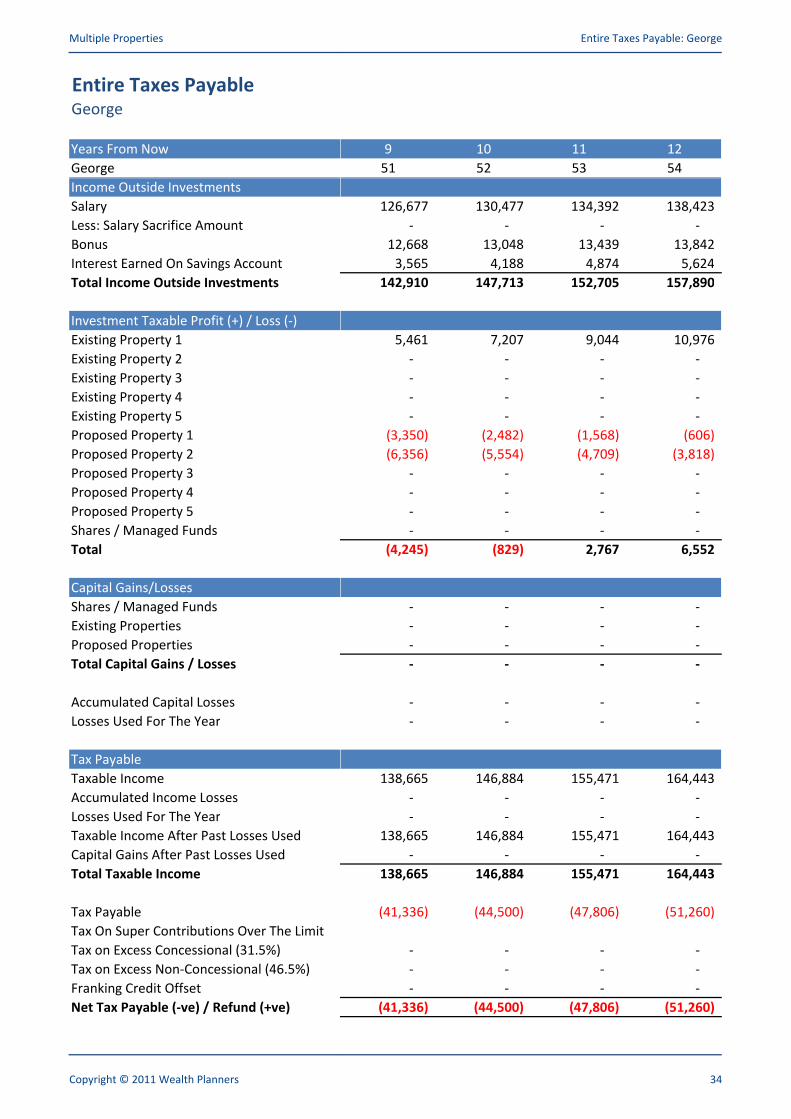
Multiple Properties Entire Taxes Payable: George
Entire Taxes PayableGeorge
Years From Now
George
Income Outside Investments
9 10 11 12
51 52 53 54
Income Outside Investments
Salary
Less: Salary Sacrifice Amount
Bonus
Interest Earned On Savings Account
Total Income Outside Investments
126,677 130,477 134,392 138,423
- - - -
12,668 13,048 13,439 13,842
3,565 4,188 4,874 5,624
142,910 147,713 152,705 157,890
Investment Taxable Profit (+) / Loss (-)
Existing Property 1
Existing Property 2
Existing Property 3
Existing Property 4
Existing Property 5
Proposed Property 1
5,461 7,207 9,044 10,976
- - - -
- - - -
- - - -
- - - -
(3,350) (2,482) (1,568) (606)Proposed Property 1
Proposed Property 2
Proposed Property 3
Proposed Property 4
Proposed Property 5
Shares / Managed Funds
Total
(3,350) (2,482) (1,568) (606)
(6,356) (5,554) (4,709) (3,818)
- - - -
- - - -
- - - -
- - - -
(4,245) (829) 2,767 6,552
Capital Gains/Losses
Shares / Managed Funds
Existing Properties
Proposed Properties
Total Capital Gains / Losses
- - - -
- - - -
- - - -
- - - -
Accumulated Capital Losses
Losses Used For The Year
Tax Payable
Taxable Income
Accumulated Income Losses
Losses Used For The Year
- - - -
- - - -
138,665 146,884 155,471 164,443
- - - -
- - - - Losses Used For The Year
Taxable Income After Past Losses Used
Capital Gains After Past Losses Used
Total Taxable Income
Tax Payable
Tax On Super Contributions Over The Limit
- - - -
138,665 146,884 155,471 164,443
- - - -
138,665 146,884 155,471 164,443
(41,336) (44,500) (47,806) (51,260)
Tax On Super Contributions Over The Limit
Tax on Excess Concessional (31.5%)
Tax on Excess Non-Concessional (46.5%)
Franking Credit Offset
Net Tax Payable (-ve) / Refund (+ve)
- - - -
- - - -
- - - -
(41,336) (44,500) (47,806) (51,260)
Copyright © 2011 Wealth Planners 34

Multiple Properties Entire Taxes Payable: George
Entire Taxes PayableGeorge
Years From Now
George
Income Outside Investments
13 14 15 16
55 56 57 58
Income Outside Investments
Salary
Less: Salary Sacrifice Amount
Bonus
Interest Earned On Savings Account
Total Income Outside Investments
142,576 146,853 151,259 155,797
- - - -
14,258 14,685 15,126 15,580
6,442 7,329 8,280 9,285
163,276 168,867 174,664 180,662
Investment Taxable Profit (+) / Loss (-)
Existing Property 1
Existing Property 2
Existing Property 3
Existing Property 4
Existing Property 5
Proposed Property 1
13,011 15,153 17,411 19,790
- - - -
- - - -
- - - -
- - - -
407 1,473 2,597 3,782 Proposed Property 1
Proposed Property 2
Proposed Property 3
Proposed Property 4
Proposed Property 5
Shares / Managed Funds
Total
407 1,473 2,597 3,782
(2,877) (1,884) (835) 274
- - - -
- - - -
- - - -
- - - -
10,540 14,743 19,173 23,846
Capital Gains/Losses
Shares / Managed Funds
Existing Properties
Proposed Properties
Total Capital Gains / Losses
- - - -
- - - -
- - - -
- - - -
Accumulated Capital Losses
Losses Used For The Year
Tax Payable
Taxable Income
Accumulated Income Losses
Losses Used For The Year
- - - -
- - - -
173,816 183,610 193,838 204,508
- - - -
- - - - Losses Used For The Year
Taxable Income After Past Losses Used
Capital Gains After Past Losses Used
Total Taxable Income
Tax Payable
Tax On Super Contributions Over The Limit
- - - -
173,816 183,610 193,838 204,508
- - - -
173,816 183,610 193,838 204,508
(54,869) (58,929) (63,684) (68,646)
Tax On Super Contributions Over The Limit
Tax on Excess Concessional (31.5%)
Tax on Excess Non-Concessional (46.5%)
Franking Credit Offset
Net Tax Payable (-ve) / Refund (+ve)
- - - -
- - - -
- - - -
(54,869) (58,929) (63,684) (68,646)
Copyright © 2011 Wealth Planners 35

Multiple Properties Entire Taxes Payable: George
Entire Taxes PayableGeorge
Years From Now
George
Income Outside Investments
17 18 19 20
59 60 61 62
Income Outside Investments
Salary
Less: Salary Sacrifice Amount
Bonus
Interest Earned On Savings Account
Total Income Outside Investments
160,471 165,285 170,243 175,351
- - - -
16,047 16,528 17,024 17,535
10,346 11,462 12,635 13,864
186,864 193,275 199,902 206,749
Investment Taxable Profit (+) / Loss (-)
Existing Property 1
Existing Property 2
Existing Property 3
Existing Property 4
Existing Property 5
Proposed Property 1
22,298 24,944 27,736 30,683
- - - -
- - - -
- - - -
- - - -
5,031 6,350 7,741 9,209 Proposed Property 1
Proposed Property 2
Proposed Property 3
Proposed Property 4
Proposed Property 5
Shares / Managed Funds
Total
5,031 6,350 7,741 9,209
1,447 2,688 4,002 5,393
- - - -
- - - -
- - - -
- - - -
28,777 33,982 39,478 45,285
Capital Gains/Losses
Shares / Managed Funds
Existing Properties
Proposed Properties
Total Capital Gains / Losses
- - - -
- - - -
- - - -
- - - -
Accumulated Capital Losses
Losses Used For The Year
Tax Payable
Taxable Income
Accumulated Income Losses
Losses Used For The Year
- - - -
- - - -
215,640 227,257 239,381 252,035
- - - -
- - - - Losses Used For The Year
Taxable Income After Past Losses Used
Capital Gains After Past Losses Used
Total Taxable Income
Tax Payable
Tax On Super Contributions Over The Limit
- - - -
215,640 227,257 239,381 252,035
- - - -
215,640 227,257 239,381 252,035
(73,823) (79,225) (84,862) (90,746)
Tax On Super Contributions Over The Limit
Tax on Excess Concessional (31.5%)
Tax on Excess Non-Concessional (46.5%)
Franking Credit Offset
Net Tax Payable (-ve) / Refund (+ve)
- - - -
- - - -
- - - -
(73,823) (79,225) (84,862) (90,746)
Copyright © 2011 Wealth Planners 36
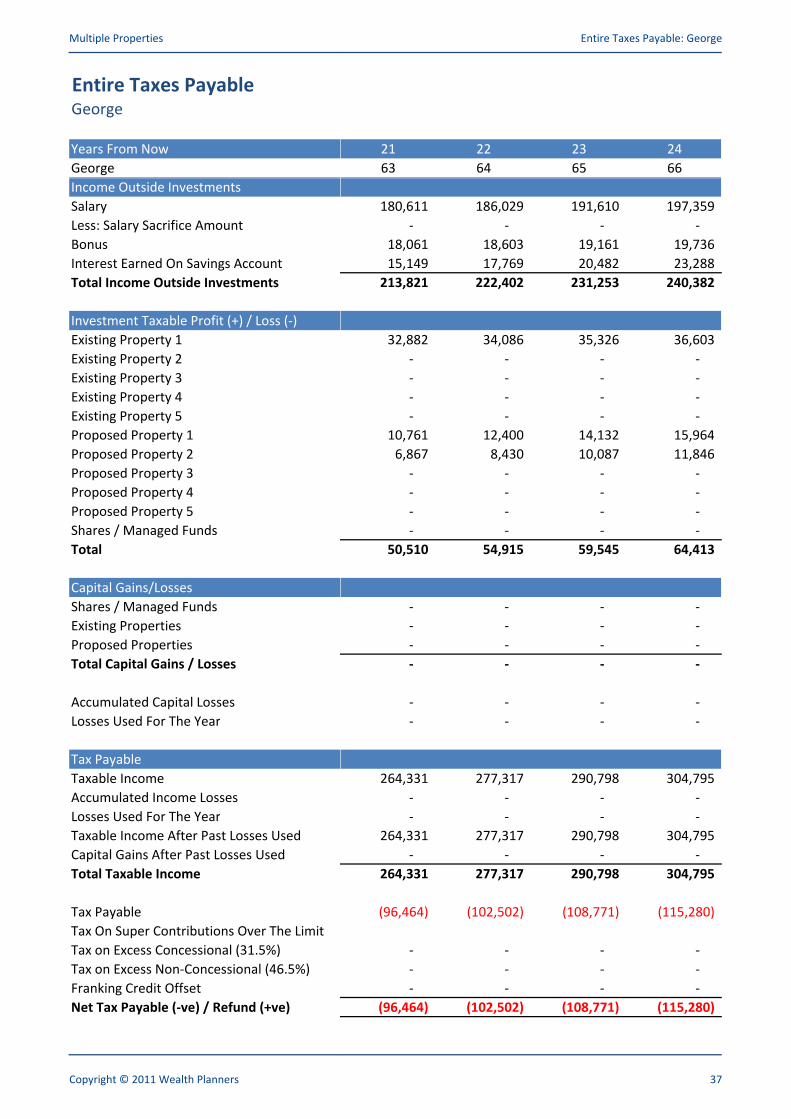
Multiple Properties Entire Taxes Payable: George
Entire Taxes PayableGeorge
Years From Now
George
Income Outside Investments
21 22 23 24
63 64 65 66
Income Outside Investments
Salary
Less: Salary Sacrifice Amount
Bonus
Interest Earned On Savings Account
Total Income Outside Investments
180,611 186,029 191,610 197,359
- - - -
18,061 18,603 19,161 19,736
15,149 17,769 20,482 23,288
213,821 222,402 231,253 240,382
Investment Taxable Profit (+) / Loss (-)
Existing Property 1
Existing Property 2
Existing Property 3
Existing Property 4
Existing Property 5
Proposed Property 1
32,882 34,086 35,326 36,603
- - - -
- - - -
- - - -
- - - -
10,761 12,400 14,132 15,964 Proposed Property 1
Proposed Property 2
Proposed Property 3
Proposed Property 4
Proposed Property 5
Shares / Managed Funds
Total
10,761 12,400 14,132 15,964
6,867 8,430 10,087 11,846
- - - -
- - - -
- - - -
- - - -
50,510 54,915 59,545 64,413
Capital Gains/Losses
Shares / Managed Funds
Existing Properties
Proposed Properties
Total Capital Gains / Losses
- - - -
- - - -
- - - -
- - - -
Accumulated Capital Losses
Losses Used For The Year
Tax Payable
Taxable Income
Accumulated Income Losses
Losses Used For The Year
- - - -
- - - -
264,331 277,317 290,798 304,795
- - - -
- - - - Losses Used For The Year
Taxable Income After Past Losses Used
Capital Gains After Past Losses Used
Total Taxable Income
Tax Payable
Tax On Super Contributions Over The Limit
- - - -
264,331 277,317 290,798 304,795
- - - -
264,331 277,317 290,798 304,795
(96,464) (102,502) (108,771) (115,280)
Tax On Super Contributions Over The Limit
Tax on Excess Concessional (31.5%)
Tax on Excess Non-Concessional (46.5%)
Franking Credit Offset
Net Tax Payable (-ve) / Refund (+ve)
- - - -
- - - -
- - - -
(96,464) (102,502) (108,771) (115,280)
Copyright © 2011 Wealth Planners 37
Multiple Properties Entire Taxes Payable: George
Entire Taxes PayableGeorge
Years From Now
George
Income Outside Investments
25 26 27 28
67 68 69 70
Income Outside Investments
Salary
Less: Salary Sacrifice Amount
Bonus
Interest Earned On Savings Account
Total Income Outside Investments
203,279 209,378 215,659 222,129
- - - -
20,328 20,938 21,566 22,213
26,188 29,183 33,181 37,329
249,795 259,499 270,406 281,670
Investment Taxable Profit (+) / Loss (-)
Existing Property 1
Existing Property 2
Existing Property 3
Existing Property 4
Existing Property 5
Proposed Property 1
37,919 39,274 40,669 42,107
- - - -
- - - -
- - - -
- - - -
17,901 19,302 19,990 20,698 Proposed Property 1
Proposed Property 2
Proposed Property 3
Proposed Property 4
Proposed Property 5
Shares / Managed Funds
Total
17,901 19,302 19,990 20,698
13,713 15,696 17,802 19,302
- - - -
- - - -
- - - -
- - - -
69,533 74,271 78,461 82,107
Capital Gains/Losses
Shares / Managed Funds
Existing Properties
Proposed Properties
Total Capital Gains / Losses
- - - -
- - - -
- - - -
- - - -
Accumulated Capital Losses
Losses Used For The Year
Tax Payable
Taxable Income
Accumulated Income Losses
Losses Used For The Year
- - - -
- - - -
319,328 333,770 348,868 363,777
- - - -
- - - - Losses Used For The Year
Taxable Income After Past Losses Used
Capital Gains After Past Losses Used
Total Taxable Income
Tax Payable
Tax On Super Contributions Over The Limit
- - - -
319,328 333,770 348,868 363,777
- - - -
319,328 333,770 348,868 363,777
(122,038) (128,753) (135,774) (142,706)
Tax On Super Contributions Over The Limit
Tax on Excess Concessional (31.5%)
Tax on Excess Non-Concessional (46.5%)
Franking Credit Offset
Net Tax Payable (-ve) / Refund (+ve)
- - - -
- - - -
- - - -
(122,038) (128,753) (135,774) (142,706)
Copyright © 2011 Wealth Planners 38
Multiple Properties Entire Taxes Payable: George
Entire Taxes PayableGeorge
Years From Now
George
Income Outside Investments
29 30
71 72
Income Outside Investments
Salary
Less: Salary Sacrifice Amount
Bonus
Interest Earned On Savings Account
Total Income Outside Investments
228,793 235,657
- -
22,879 23,566
42,592 48,072
294,265 307,294
Investment Taxable Profit (+) / Loss (-)
Existing Property 1
Existing Property 2
Existing Property 3
Existing Property 4
Existing Property 5
Proposed Property 1
43,588 45,113
- -
- -
- -
- -
21,428 22,179 Proposed Property 1
Proposed Property 2
Proposed Property 3
Proposed Property 4
Proposed Property 5
Shares / Managed Funds
Total
21,428 22,179
19,990 20,698
- -
- -
- -
- -
85,005 87,990
Capital Gains/Losses
Shares / Managed Funds
Existing Properties
Proposed Properties
Total Capital Gains / Losses
- -
- -
- -
- -
Accumulated Capital Losses
Losses Used For The Year
Tax Payable
Taxable Income
Accumulated Income Losses
Losses Used For The Year
- -
- -
379,270 395,284
- -
- - Losses Used For The Year
Taxable Income After Past Losses Used
Capital Gains After Past Losses Used
Total Taxable Income
Tax Payable
Tax On Super Contributions Over The Limit
- -
379,270 395,284
- -
379,270 395,284
(149,910) (157,357)
Tax On Super Contributions Over The Limit
Tax on Excess Concessional (31.5%)
Tax on Excess Non-Concessional (46.5%)
Franking Credit Offset
Net Tax Payable (-ve) / Refund (+ve)
- -
- -
- -
(149,910) (157,357)
Copyright © 2011 Wealth Planners 39
Multiple Properties Entire Taxes Payable: Jane
Entire Taxes PayableJane
Years From Now 1 2 3 4
Jane 40 41 42 43
Income Outside InvestmentsIncome Outside Investments
Salary 80,000 82,400 84,872 87,418
Less: Salary Sacrifice Amount - - - -
Bonus 5,000 5,150 5,305 5,464
Interest Earned On Savings Account 1,125 1,617 1,038 1,318
Total Income Outside Investments 86,125 89,167 91,214 94,200
Investment Taxable Profit (+) / Loss (-)
Existing Property 1 - - - -
Existing Property 2 - - - -
Existing Property 3 - - - -
Existing Property 4 - - - -
Existing Property 5 - - - -
Proposed Property 1 (8,975) (8,388) (7,772) (7,125)Proposed Property 1 (8,975) (8,388) (7,772) (7,125)
Proposed Property 2 - - (10,410) (9,821)
Proposed Property 3 - - - -
Proposed Property 4 - - - -
Proposed Property 5 - - - -
Shares / Managed Funds - - - -
Total (8,975) (8,388) (18,182) (16,946)
Capital Gains/Losses
Shares / Managed Funds - - - -
Existing Properties - - - -
Proposed Properties - - - -
Total Capital Gains / Losses - - - -
Accumulated Capital Losses - - - -
Losses Used For The Year - - - -
Tax Payable
Taxable Income 77,150 80,779 73,032 77,254
Accumulated Income Losses - - - -
Losses Used For The Year - - - - Losses Used For The Year - - - -
Taxable Income After Past Losses Used 77,150 80,779 73,032 77,254
Capital Gains After Past Losses Used - - - -
Total Taxable Income 77,150 80,779 73,032 77,254
Tax Payable (17,852) (19,050) (16,555) (17,885)
Tax On Super Contributions Over The LimitTax On Super Contributions Over The Limit
Tax on Excess Concessional (31.5%) - - - -
Tax on Excess Non-Concessional (46.5%) - - - -
Franking Credit Offset - - - -
Net Tax Payable (-ve) / Refund (+ve) (17,852) (19,050) (16,555) (17,885)
Copyright © 2011 Wealth Planners 40

Multiple Properties Entire Taxes Payable: Jane
Entire Taxes PayableJane
Years From Now
Jane
Income Outside Investments
5 6 7 8
44 45 46 47
Income Outside Investments
Salary
Less: Salary Sacrifice Amount
Bonus
Interest Earned On Savings Account
Total Income Outside Investments
90,041 92,742 95,524 98,390
- - - -
5,628 5,796 5,970 6,149
1,656 2,050 2,498 3,002
97,324 100,588 103,992 107,542
Investment Taxable Profit (+) / Loss (-)
Existing Property 1
Existing Property 2
Existing Property 3
Existing Property 4
Existing Property 5
Proposed Property 1
- - - -
- - - -
- - - -
- - - -
- - - -
(6,447) (5,710) (4,962) (4,176)Proposed Property 1
Proposed Property 2
Proposed Property 3
Proposed Property 4
Proposed Property 5
Shares / Managed Funds
Total
(6,447) (5,710) (4,962) (4,176)
(9,201) (8,549) (7,863) (7,116)
- - - -
- - - -
- - - -
- - - -
(15,648) (14,259) (12,825) (11,292)
Capital Gains/Losses
Shares / Managed Funds
Existing Properties
Proposed Properties
Total Capital Gains / Losses
- - - -
- - - -
- - - -
- - - -
Accumulated Capital Losses
Losses Used For The Year
Tax Payable
Taxable Income
Accumulated Income Losses
Losses Used For The Year
- - - -
- - - -
81,676 86,329 91,167 96,249
- - - -
- - - - Losses Used For The Year
Taxable Income After Past Losses Used
Capital Gains After Past Losses Used
Total Taxable Income
Tax Payable
Tax On Super Contributions Over The Limit
- - - -
81,676 86,329 91,167 96,249
- - - -
81,676 86,329 91,167 96,249
(19,395) (21,187) (23,049) (25,006)
Tax On Super Contributions Over The Limit
Tax on Excess Concessional (31.5%)
Tax on Excess Non-Concessional (46.5%)
Franking Credit Offset
Net Tax Payable (-ve) / Refund (+ve)
- - - -
- - - -
- - - -
(19,395) (21,187) (23,049) (25,006)
Copyright © 2011 Wealth Planners 41

Multiple Properties Entire Taxes Payable: Jane
Entire Taxes PayableJane
Years From Now
Jane
Income Outside Investments
9 10 11 12
48 49 50 51
Income Outside Investments
Salary
Less: Salary Sacrifice Amount
Bonus
Interest Earned On Savings Account
Total Income Outside Investments
101,342 104,382 107,513 110,739
- - - -
6,334 6,524 6,720 6,921
3,565 4,188 4,874 5,624
111,240 115,094 119,107 123,284
Investment Taxable Profit (+) / Loss (-)
Existing Property 1
Existing Property 2
Existing Property 3
Existing Property 4
Existing Property 5
Proposed Property 1
- - - -
- - - -
- - - -
- - - -
- - - -
(3,350) (2,482) (1,568) (606)Proposed Property 1
Proposed Property 2
Proposed Property 3
Proposed Property 4
Proposed Property 5
Shares / Managed Funds
Total
(3,350) (2,482) (1,568) (606)
(6,356) (5,554) (4,709) (3,818)
- - - -
- - - -
- - - -
- - - -
(9,706) (8,036) (6,277) (4,424)
Capital Gains/Losses
Shares / Managed Funds
Existing Properties
Proposed Properties
Total Capital Gains / Losses
- - - -
- - - -
- - - -
- - - -
Accumulated Capital Losses
Losses Used For The Year
Tax Payable
Taxable Income
Accumulated Income Losses
Losses Used For The Year
- - - -
- - - -
101,534 107,058 112,830 118,860
- - - -
- - - - Losses Used For The Year
Taxable Income After Past Losses Used
Capital Gains After Past Losses Used
Total Taxable Income
Tax Payable
Tax On Super Contributions Over The Limit
- - - -
101,534 107,058 112,830 118,860
- - - -
101,534 107,058 112,830 118,860
(27,041) (29,167) (31,389) (33,711)
Tax On Super Contributions Over The Limit
Tax on Excess Concessional (31.5%)
Tax on Excess Non-Concessional (46.5%)
Franking Credit Offset
Net Tax Payable (-ve) / Refund (+ve)
- - - -
- - - -
- - - -
(27,041) (29,167) (31,389) (33,711)
Copyright © 2011 Wealth Planners 42
Multiple Properties Entire Taxes Payable: Jane
Entire Taxes PayableJane
Years From Now
Jane
Income Outside Investments
13 14 15 16
52 53 54 55
Income Outside Investments
Salary
Less: Salary Sacrifice Amount
Bonus
Interest Earned On Savings Account
Total Income Outside Investments
114,061 117,483 121,007 124,637
- - - -
7,129 7,343 7,563 7,790
6,442 7,329 8,280 9,285
127,632 132,154 136,850 141,712
Investment Taxable Profit (+) / Loss (-)
Existing Property 1
Existing Property 2
Existing Property 3
Existing Property 4
Existing Property 5
Proposed Property 1
- - - -
- - - -
- - - -
- - - -
- - - -
407 1,473 2,597 3,782 Proposed Property 1
Proposed Property 2
Proposed Property 3
Proposed Property 4
Proposed Property 5
Shares / Managed Funds
Total
407 1,473 2,597 3,782
(2,877) (1,884) (835) 274
- - - -
- - - -
- - - -
- - - -
(2,471) (411) 1,762 4,056
Capital Gains/Losses
Shares / Managed Funds
Existing Properties
Proposed Properties
Total Capital Gains / Losses
- - - -
- - - -
- - - -
- - - -
Accumulated Capital Losses
Losses Used For The Year
Tax Payable
Taxable Income
Accumulated Income Losses
Losses Used For The Year
- - - -
- - - -
125,161 131,743 138,612 145,769
- - - -
- - - - Losses Used For The Year
Taxable Income After Past Losses Used
Capital Gains After Past Losses Used
Total Taxable Income
Tax Payable
Tax On Super Contributions Over The Limit
- - - -
125,161 131,743 138,612 145,769
- - - -
125,161 131,743 138,612 145,769
(36,137) (38,671) (41,316) (44,071)
Tax On Super Contributions Over The Limit
Tax on Excess Concessional (31.5%)
Tax on Excess Non-Concessional (46.5%)
Franking Credit Offset
Net Tax Payable (-ve) / Refund (+ve)
- - - -
- - - -
- - - -
(36,137) (38,671) (41,316) (44,071)
Copyright © 2011 Wealth Planners 43

Multiple Properties Entire Taxes Payable: Jane
Entire Taxes PayableJane
Years From Now
Jane
Income Outside Investments
17 18 19 20
56 57 58 59
Income Outside Investments
Salary
Less: Salary Sacrifice Amount
Bonus
Interest Earned On Savings Account
Total Income Outside Investments
128,377 132,228 136,195 140,280
- - - -
8,024 8,264 8,512 8,768
10,346 11,462 12,635 13,864
146,746 151,954 157,342 162,912
Investment Taxable Profit (+) / Loss (-)
Existing Property 1
Existing Property 2
Existing Property 3
Existing Property 4
Existing Property 5
Proposed Property 1
- - - -
- - - -
- - - -
- - - -
- - - -
5,031 6,350 7,741 9,209 Proposed Property 1
Proposed Property 2
Proposed Property 3
Proposed Property 4
Proposed Property 5
Shares / Managed Funds
Total
5,031 6,350 7,741 9,209
1,447 2,688 4,002 5,393
- - - -
- - - -
- - - -
- - - -
6,479 9,038 11,742 14,602
Capital Gains/Losses
Shares / Managed Funds
Existing Properties
Proposed Properties
Total Capital Gains / Losses
- - - -
- - - -
- - - -
- - - -
Accumulated Capital Losses
Losses Used For The Year
Tax Payable
Taxable Income
Accumulated Income Losses
Losses Used For The Year
- - - -
- - - -
153,224 160,992 169,084 177,514
- - - -
- - - - Losses Used For The Year
Taxable Income After Past Losses Used
Capital Gains After Past Losses Used
Total Taxable Income
Tax Payable
Tax On Super Contributions Over The Limit
- - - -
153,224 160,992 169,084 177,514
- - - -
153,224 160,992 169,084 177,514
(46,941) (49,932) (53,047) (56,293)
Tax On Super Contributions Over The Limit
Tax on Excess Concessional (31.5%)
Tax on Excess Non-Concessional (46.5%)
Franking Credit Offset
Net Tax Payable (-ve) / Refund (+ve)
- - - -
- - - -
- - - -
(46,941) (49,932) (53,047) (56,293)
Copyright © 2011 Wealth Planners 44
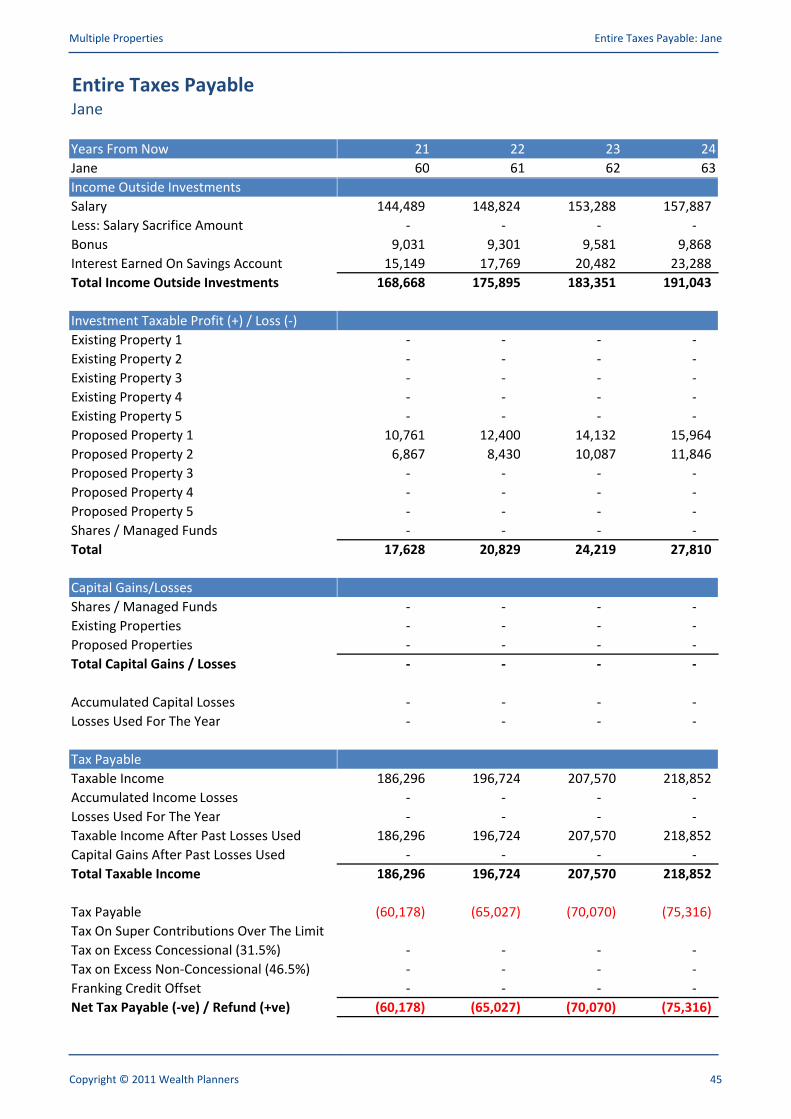
Multiple Properties Entire Taxes Payable: Jane
Entire Taxes PayableJane
Years From Now
Jane
Income Outside Investments
21 22 23 24
60 61 62 63
Income Outside Investments
Salary
Less: Salary Sacrifice Amount
Bonus
Interest Earned On Savings Account
Total Income Outside Investments
144,489 148,824 153,288 157,887
- - - -
9,031 9,301 9,581 9,868
15,149 17,769 20,482 23,288
168,668 175,895 183,351 191,043
Investment Taxable Profit (+) / Loss (-)
Existing Property 1
Existing Property 2
Existing Property 3
Existing Property 4
Existing Property 5
Proposed Property 1
- - - -
- - - -
- - - -
- - - -
- - - -
10,761 12,400 14,132 15,964 Proposed Property 1
Proposed Property 2
Proposed Property 3
Proposed Property 4
Proposed Property 5
Shares / Managed Funds
Total
10,761 12,400 14,132 15,964
6,867 8,430 10,087 11,846
- - - -
- - - -
- - - -
- - - -
17,628 20,829 24,219 27,810
Capital Gains/Losses
Shares / Managed Funds
Existing Properties
Proposed Properties
Total Capital Gains / Losses
- - - -
- - - -
- - - -
- - - -
Accumulated Capital Losses
Losses Used For The Year
Tax Payable
Taxable Income
Accumulated Income Losses
Losses Used For The Year
- - - -
- - - -
186,296 196,724 207,570 218,852
- - - -
- - - - Losses Used For The Year
Taxable Income After Past Losses Used
Capital Gains After Past Losses Used
Total Taxable Income
Tax Payable
Tax On Super Contributions Over The Limit
- - - -
186,296 196,724 207,570 218,852
- - - -
186,296 196,724 207,570 218,852
(60,178) (65,027) (70,070) (75,316)
Tax On Super Contributions Over The Limit
Tax on Excess Concessional (31.5%)
Tax on Excess Non-Concessional (46.5%)
Franking Credit Offset
Net Tax Payable (-ve) / Refund (+ve)
- - - -
- - - -
- - - -
(60,178) (65,027) (70,070) (75,316)
Copyright © 2011 Wealth Planners 45

Multiple Properties Entire Taxes Payable: Jane
Entire Taxes PayableJane
Years From Now
Jane
Income Outside Investments
25 26 27 28
64 65 66 67
Income Outside Investments
Salary
Less: Salary Sacrifice Amount
Bonus
Interest Earned On Savings Account
Total Income Outside Investments
162,624 167,502 172,527 177,703
- - - -
10,164 10,469 10,783 11,106
26,188 29,183 33,181 37,329
198,975 207,154 216,492 226,138
Investment Taxable Profit (+) / Loss (-)
Existing Property 1
Existing Property 2
Existing Property 3
Existing Property 4
Existing Property 5
Proposed Property 1
- - - -
- - - -
- - - -
- - - -
- - - -
17,901 19,302 19,990 20,698 Proposed Property 1
Proposed Property 2
Proposed Property 3
Proposed Property 4
Proposed Property 5
Shares / Managed Funds
Total
17,901 19,302 19,990 20,698
13,713 15,696 17,802 19,302
- - - -
- - - -
- - - -
- - - -
31,614 34,997 37,792 40,000
Capital Gains/Losses
Shares / Managed Funds
Existing Properties
Proposed Properties
Total Capital Gains / Losses
- - - -
- - - -
- - - -
- - - -
Accumulated Capital Losses
Losses Used For The Year
Tax Payable
Taxable Income
Accumulated Income Losses
Losses Used For The Year
- - - -
- - - -
230,590 242,152 254,284 266,138
- - - -
- - - - Losses Used For The Year
Taxable Income After Past Losses Used
Capital Gains After Past Losses Used
Total Taxable Income
Tax Payable
Tax On Super Contributions Over The Limit
- - - -
230,590 242,152 254,284 266,138
- - - -
230,590 242,152 254,284 266,138
(80,774) (86,151) (91,792) (97,304)
Tax On Super Contributions Over The Limit
Tax on Excess Concessional (31.5%)
Tax on Excess Non-Concessional (46.5%)
Franking Credit Offset
Net Tax Payable (-ve) / Refund (+ve)
- - - -
- - - -
- - - -
(80,774) (86,151) (91,792) (97,304)
Copyright © 2011 Wealth Planners 46
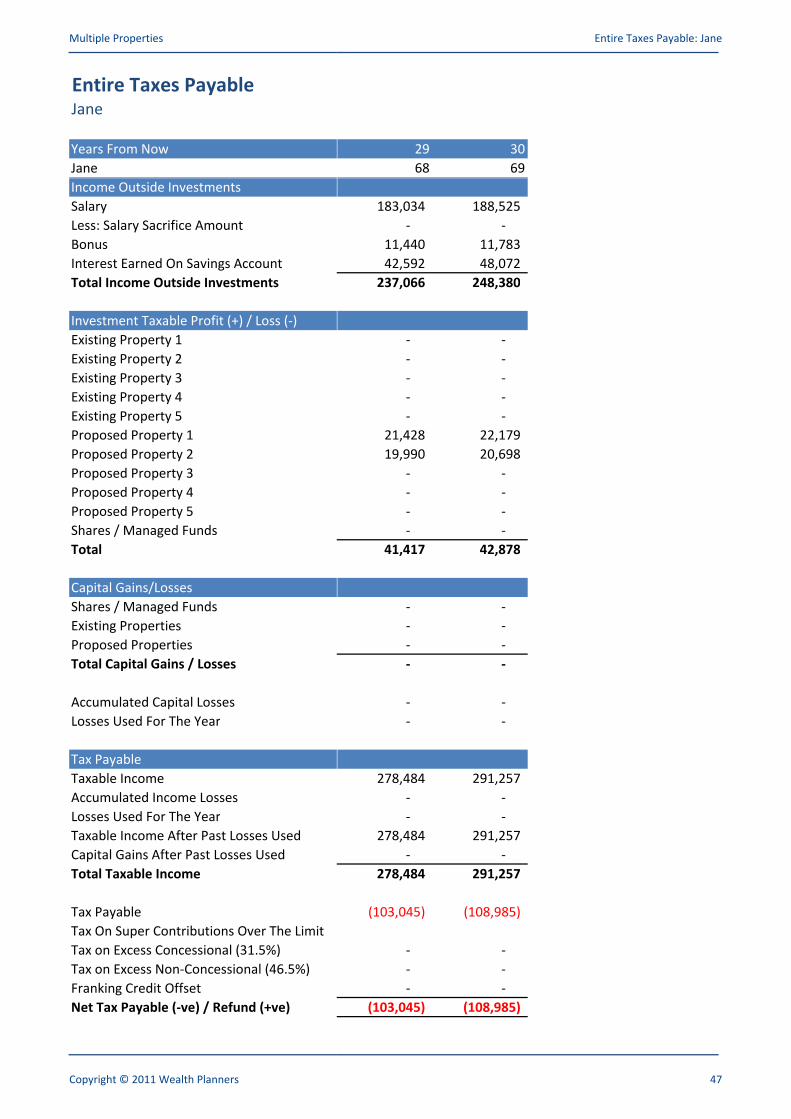
Multiple Properties Entire Taxes Payable: Jane
Entire Taxes PayableJane
Years From Now
Jane
Income Outside Investments
29 30
68 69
Income Outside Investments
Salary
Less: Salary Sacrifice Amount
Bonus
Interest Earned On Savings Account
Total Income Outside Investments
183,034 188,525
- -
11,440 11,783
42,592 48,072
237,066 248,380
Investment Taxable Profit (+) / Loss (-)
Existing Property 1
Existing Property 2
Existing Property 3
Existing Property 4
Existing Property 5
Proposed Property 1
- -
- -
- -
- -
- -
21,428 22,179 Proposed Property 1
Proposed Property 2
Proposed Property 3
Proposed Property 4
Proposed Property 5
Shares / Managed Funds
Total
21,428 22,179
19,990 20,698
- -
- -
- -
- -
41,417 42,878
Capital Gains/Losses
Shares / Managed Funds
Existing Properties
Proposed Properties
Total Capital Gains / Losses
- -
- -
- -
- -
Accumulated Capital Losses
Losses Used For The Year
Tax Payable
Taxable Income
Accumulated Income Losses
Losses Used For The Year
- -
- -
278,484 291,257
- -
- - Losses Used For The Year
Taxable Income After Past Losses Used
Capital Gains After Past Losses Used
Total Taxable Income
Tax Payable
Tax On Super Contributions Over The Limit
- -
278,484 291,257
- -
278,484 291,257
(103,045) (108,985)
Tax On Super Contributions Over The Limit
Tax on Excess Concessional (31.5%)
Tax on Excess Non-Concessional (46.5%)
Franking Credit Offset
Net Tax Payable (-ve) / Refund (+ve)
- -
- -
- -
(103,045) (108,985)
Copyright © 2011 Wealth Planners 47
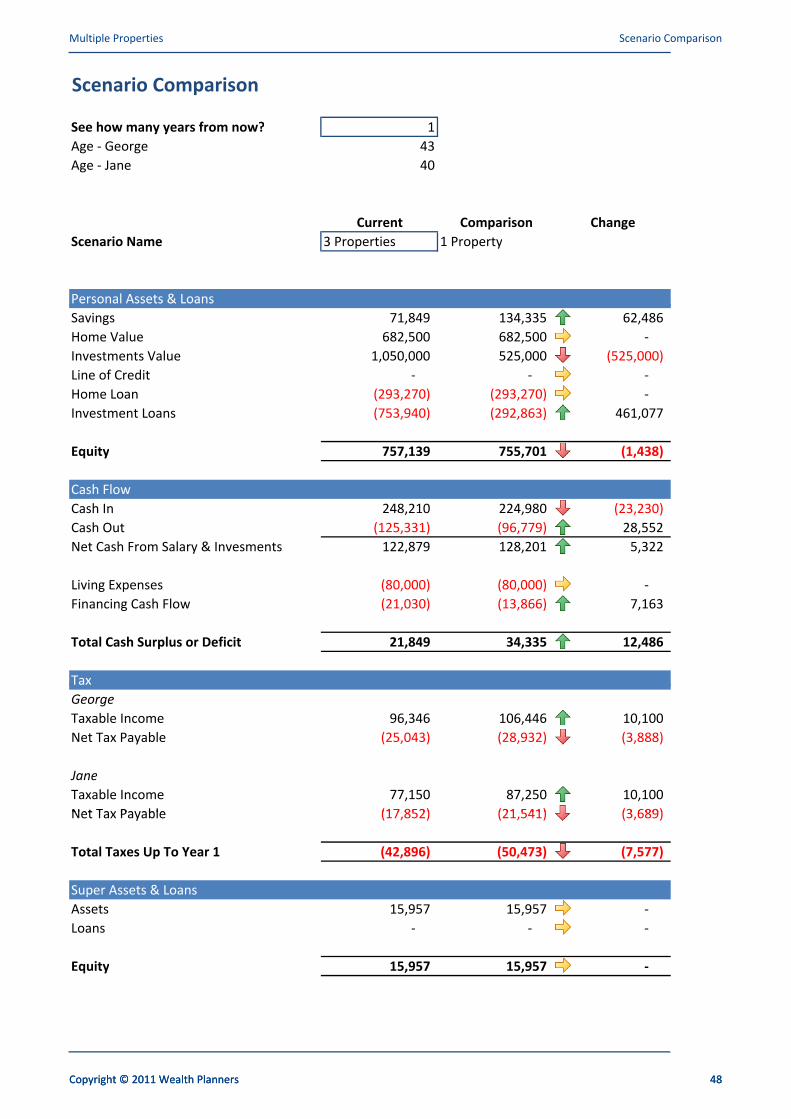
Multiple Properties Scenario Comparison
Scenario Comparison
See how many years from now? 1
Age - George 43
Age - Jane 40
Copyright © 2011 Wealth Planners 48
Current Comparison Change
Scenario Name 3 Properties 1 Property
Personal Assets & LoansPersonal Assets & Loans
Savings 71,849 134,335 62,486
Home Value 682,500 682,500 -
Investments Value 1,050,000 525,000 (525,000)
Line of Credit - - -
Home Loan (293,270) (293,270) -
Investment Loans (753,940) (292,863) 461,077
Equity 757,139 755,701 (1,438)
Cash Flow
Cash In 248,210 224,980 (23,230)
Cash Out (125,331) (96,779) 28,552
Net Cash From Salary & Invesments 122,879 128,201 5,322
Living Expenses (80,000) (80,000) -
Financing Cash Flow (21,030) (13,866) 7,163
Total Cash Surplus or Deficit 21,849 34,335 12,486
TaxTax
George
Taxable Income 96,346 106,446 10,100
Net Tax Payable (25,043) (28,932) (3,888)
Jane
Taxable Income 77,150 87,250 10,100
Net Tax Payable (17,852) (21,541) (3,689)Net Tax Payable (17,852) (21,541) (3,689)
Total Taxes Up To Year 1 (42,896) (50,473) (7,577)
Super Assets & Loans
Assets 15,957 15,957 -
Loans - - -
Equity 15,957 15,957 -
Copyright © 2011 Wealth Planners 48
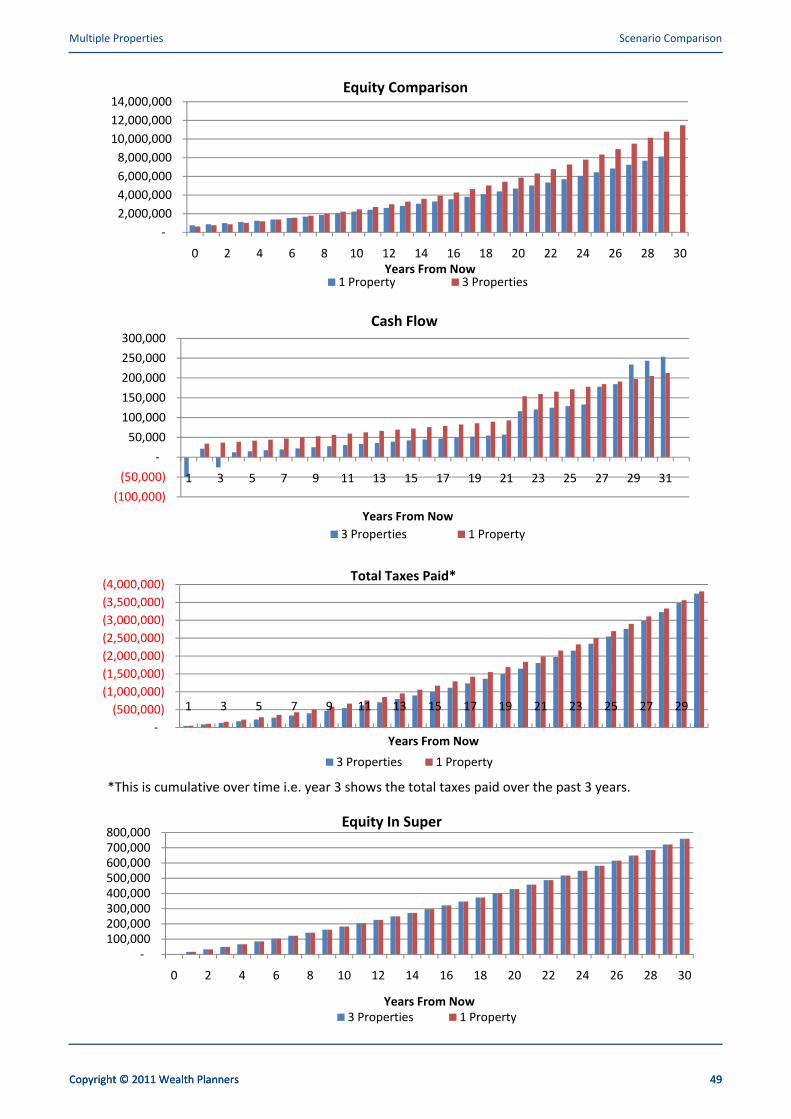
Multiple Properties Scenario Comparison
6,000,000
8,000,000
10,000,000
12,000,000
14,000,000 Equity Comparison
Copyright © 2011 Wealth Planners 49
-
2,000,000
4,000,000
6,000,000
8,000,000
10,000,000
0 2 4 6 8 10 12 14 16 18 20 22 24 26 28 30
Years From Now1 Property 3 Properties
Cash Flow
1 Property 3 Properties
50,000
100,000
150,000
200,000
250,000
300,000
Cash Flow
(100,000)
(50,000)
-
50,000
100,000
150,000
1 3 5 7 9 11 13 15 17 19 21 23 25 27 29 31
Years From Now
3 Properties 1 Property
Total Taxes Paid*
3 Properties 1 Property
(4,000,000)
(3,500,000)
(3,000,000)
(2,500,000)
(2,000,000)
(1,500,000)
(1,000,000) 1 3 5 7 9 11 13 15 17 19 21 23 25 27 29
Total Taxes Paid*
*This is cumulative over time i.e. year 3 shows the total taxes paid over the past 3 years.
(2,000,000)
(1,500,000)
(1,000,000)
(500,000)
-
1 3 5 7 9 11 13 15 17 19 21 23 25 27 29
Years From Now
3 Properties 1 Property
Equity In Super
-100,000 200,000 300,000 400,000 500,000 600,000 700,000 800,000
Equity In Super
-100,000 200,000 300,000
0 2 4 6 8 10 12 14 16 18 20 22 24 26 28 30
Years From Now
3 Properties 1 Property
Copyright © 2011 Wealth Planners 49

Multiple Properties Individual Investment Summary: Existing Property 1
Individual Investment SummaryExisting Property 1
1 Year From Now
You can see the full breakdown of how these figures are calculated by seeing the appropriate
report.
Copyright © 2011 Wealth Planners 50
How much will my investment be worth?
Ages - Investor 1 & 2 43 & 40
Asset Value 525,000
You can see the full breakdown of how these figures are calculated by seeing the appropriate
report.
2,000,000
2,500,000
Asset Loan Equity
Asset Value 525,000
Loan Balance (292,863)
Equity 232,137
Capital Growth 25,000
(From Last Year)
-
500,000
1,000,000
1,500,000
2,000,000
2,500,000
Asset Loan Equity
What is my profit or loss?
-
500,000
0 2 4 6 8 10 12 14 16 18 20 22 24 26 28 30
Years From Now
50,000
60,000 Cash Profit / Loss Tax Profit / Loss
Ages - Investor 1 & 2 43 & 40
Rent 25,480
Interest Payments (20,774)
Other Cash Expenses (3,260)
Cash Profit / Loss** 1,446 -
10,000
20,000
30,000
40,000
50,000
60,000 Cash Profit / Loss Tax Profit / Loss
Cash Profit / Loss** 1,446
Tax Profit / Loss (5,804)
How much will my investment cost me?
Ages - Investor 1 & 2 43 & 40
(10,000)
-
10,000
20,000
1 3 5 7 9 11 13 15 17 19 21 23 25 27 29
Years From Now
-12%Ages - Investor 1 & 2 43 & 40
Add Principal Pmts (7,137)
Total Cost (31,171)
Rent 25,480
Tax Saving / Extra 2,060
6%
-12%
Rent
Tax Saving / Extra
Actual Cost / Profit
Actual Cost / Profit (3,630)
Per Week (70)
**Excludes any principal payments.
82%
Actual Cost / Profit
Copyright © 2011 Wealth Planners 50

Multiple Properties Individual Investment Summary: Existing Property 1
Individual Investment SummaryExisting Property 1
5 Years From Now
You can see the full breakdown of how these figures are calculated by seeing the appropriate
report.
Copyright © 2011 Wealth Planners 51
How much will my investment be worth?
Ages - Investor 1 & 2 47 & 44
Asset Value 638,141
You can see the full breakdown of how these figures are calculated by seeing the appropriate
report.
2,000,000
2,500,000
Asset Loan Equity
Asset Value 638,141
Loan Balance (258,770)
Equity 379,371
Capital Growth 30,388
(From Last Year)
-
500,000
1,000,000
1,500,000
2,000,000
2,500,000
Asset Loan Equity
What is my profit or loss?
-
500,000
0 2 4 6 8 10 12 14 16 18 20 22 24 26 28 30
Years From Now
50,000
60,000 Cash Profit / Loss Tax Profit / Loss
Ages - Investor 1 & 2 47 & 44
Rent 28,678
Interest Payments (18,475)
Other Cash Expenses (3,669)
Cash Profit / Loss** 6,533 -
10,000
20,000
30,000
40,000
50,000
60,000 Cash Profit / Loss Tax Profit / Loss
Cash Profit / Loss** 6,533
Tax Profit / Loss (717)
How much will my investment cost me?
Ages - Investor 1 & 2 47 & 44
(10,000)
-
10,000
20,000
1 3 5 7 9 11 13 15 17 19 21 23 25 27 29
Years From Now
1%
-8%Ages - Investor 1 & 2 47 & 44
Add Principal Pmts (9,435)
Total Cost (31,580)
Rent 28,678
Tax Saving / Extra 254
1%
-8%
Rent
Tax Saving / Extra
Actual Cost / Profit
Actual Cost / Profit (2,648)
Per Week (51)
**Excludes any principal payments.
91%
Actual Cost / Profit
Copyright © 2011 Wealth Planners 51
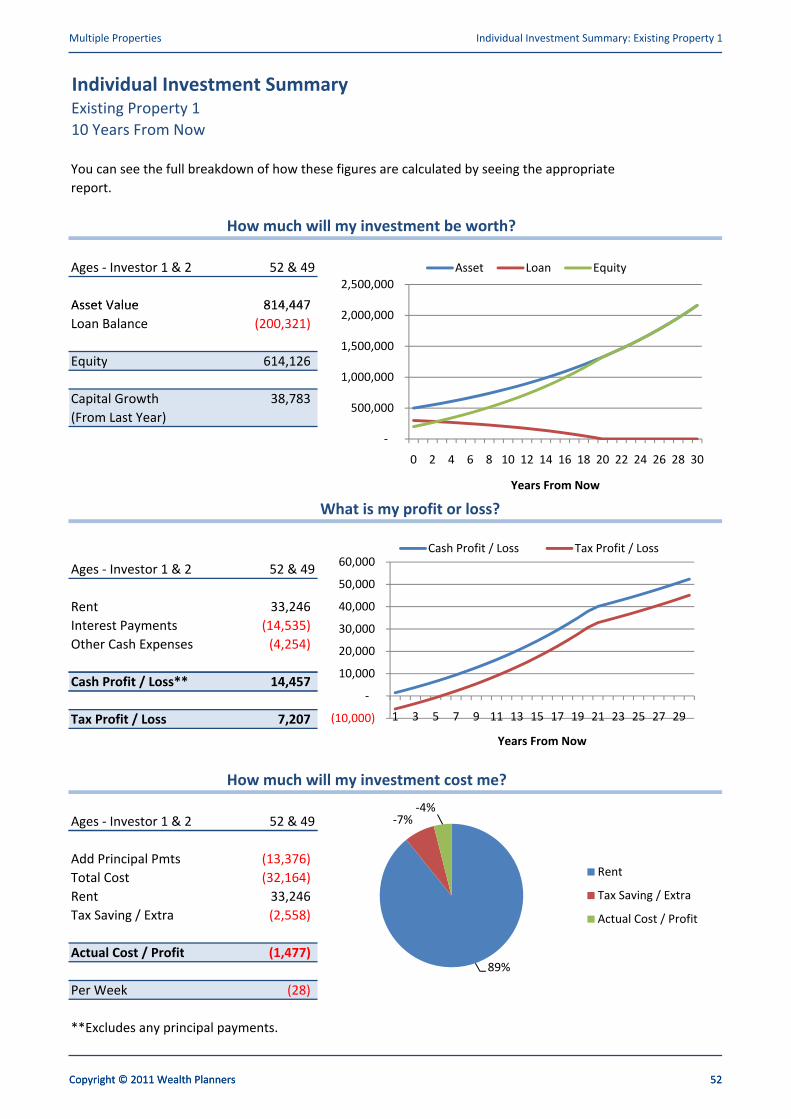
Multiple Properties Individual Investment Summary: Existing Property 1
Individual Investment SummaryExisting Property 1
10 Years From Now
You can see the full breakdown of how these figures are calculated by seeing the appropriate
report.
Copyright © 2011 Wealth Planners 52
How much will my investment be worth?
Ages - Investor 1 & 2 52 & 49
Asset Value 814,447
You can see the full breakdown of how these figures are calculated by seeing the appropriate
report.
2,000,000
2,500,000
Asset Loan Equity
Asset Value 814,447
Loan Balance (200,321)
Equity 614,126
Capital Growth 38,783
(From Last Year)
-
500,000
1,000,000
1,500,000
2,000,000
2,500,000
Asset Loan Equity
What is my profit or loss?
-
500,000
0 2 4 6 8 10 12 14 16 18 20 22 24 26 28 30
Years From Now
50,000
60,000 Cash Profit / Loss Tax Profit / Loss
Ages - Investor 1 & 2 52 & 49
Rent 33,246
Interest Payments (14,535)
Other Cash Expenses (4,254)
Cash Profit / Loss** 14,457 -
10,000
20,000
30,000
40,000
50,000
60,000 Cash Profit / Loss Tax Profit / Loss
Cash Profit / Loss** 14,457
Tax Profit / Loss 7,207
How much will my investment cost me?
Ages - Investor 1 & 2 52 & 49
(10,000)
-
10,000
20,000
1 3 5 7 9 11 13 15 17 19 21 23 25 27 29
Years From Now
-7%-4%
Ages - Investor 1 & 2 52 & 49
Add Principal Pmts (13,376)
Total Cost (32,164)
Rent 33,246
Tax Saving / Extra (2,558)
-7%-4%
Rent
Tax Saving / Extra
Actual Cost / Profit
Actual Cost / Profit (1,477)
Per Week (28)
**Excludes any principal payments.
89%
Actual Cost / Profit
Copyright © 2011 Wealth Planners 52
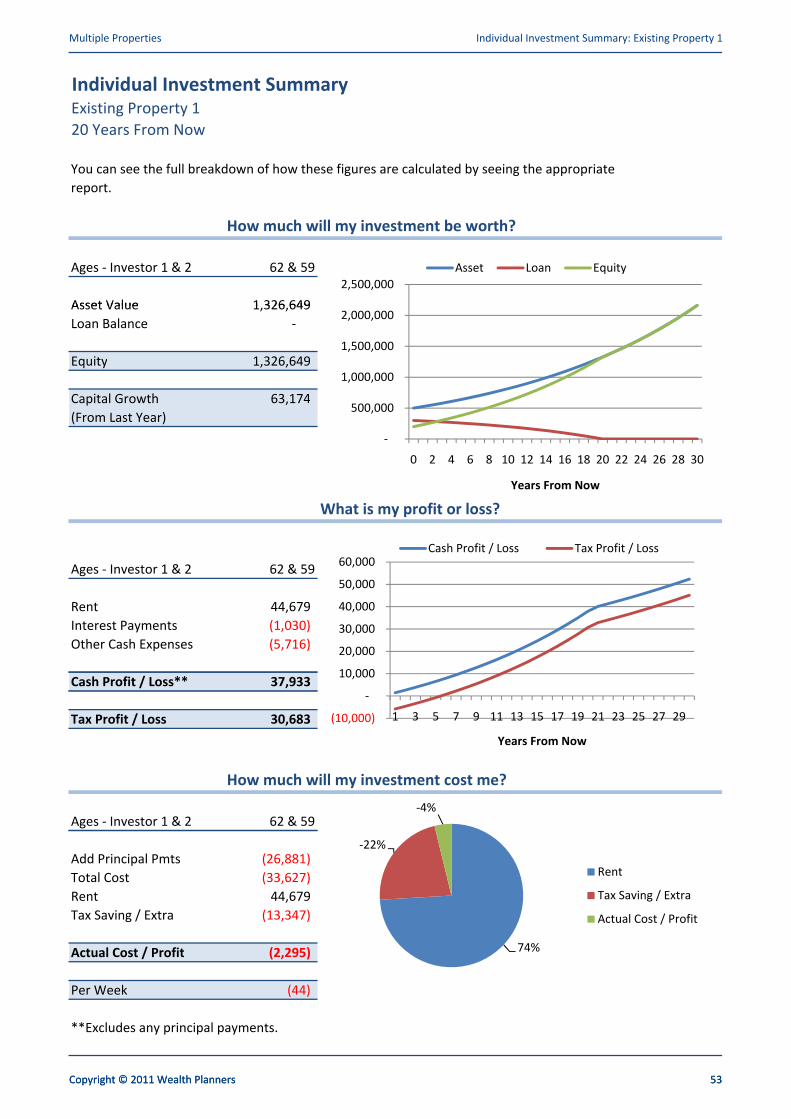
Multiple Properties Individual Investment Summary: Existing Property 1
Individual Investment SummaryExisting Property 1
20 Years From Now
You can see the full breakdown of how these figures are calculated by seeing the appropriate
report.
Copyright © 2011 Wealth Planners 53
How much will my investment be worth?
Ages - Investor 1 & 2 62 & 59
Asset Value 1,326,649
You can see the full breakdown of how these figures are calculated by seeing the appropriate
report.
2,000,000
2,500,000
Asset Loan Equity
Asset Value 1,326,649
Loan Balance -
Equity 1,326,649
Capital Growth 63,174
(From Last Year)
-
500,000
1,000,000
1,500,000
2,000,000
2,500,000
Asset Loan Equity
What is my profit or loss?
-
500,000
0 2 4 6 8 10 12 14 16 18 20 22 24 26 28 30
Years From Now
50,000
60,000 Cash Profit / Loss Tax Profit / Loss
Ages - Investor 1 & 2 62 & 59
Rent 44,679
Interest Payments (1,030)
Other Cash Expenses (5,716)
Cash Profit / Loss** 37,933 -
10,000
20,000
30,000
40,000
50,000
60,000 Cash Profit / Loss Tax Profit / Loss
Cash Profit / Loss** 37,933
Tax Profit / Loss 30,683
How much will my investment cost me?
Ages - Investor 1 & 2 62 & 59
(10,000)
-
10,000
20,000
1 3 5 7 9 11 13 15 17 19 21 23 25 27 29
Years From Now
-4%Ages - Investor 1 & 2 62 & 59
Add Principal Pmts (26,881)
Total Cost (33,627)
Rent 44,679
Tax Saving / Extra (13,347)
74%
-22%
-4%
Rent
Tax Saving / Extra
Actual Cost / Profit
Actual Cost / Profit (2,295)
Per Week (44)
**Excludes any principal payments.
74%
Actual Cost / Profit
Copyright © 2011 Wealth Planners 53
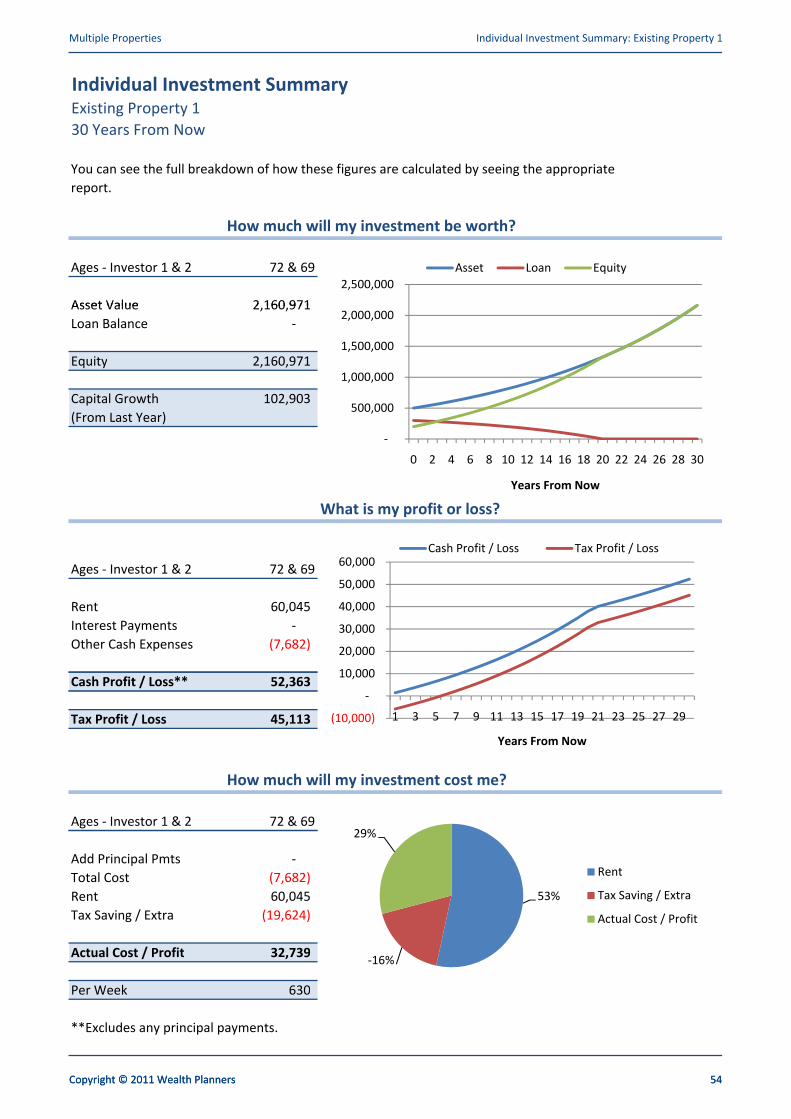
Multiple Properties Individual Investment Summary: Existing Property 1
Individual Investment SummaryExisting Property 1
30 Years From Now
You can see the full breakdown of how these figures are calculated by seeing the appropriate
report.
Copyright © 2011 Wealth Planners 54
How much will my investment be worth?
Ages - Investor 1 & 2 72 & 69
Asset Value 2,160,971
You can see the full breakdown of how these figures are calculated by seeing the appropriate
report.
2,000,000
2,500,000
Asset Loan Equity
Asset Value 2,160,971
Loan Balance -
Equity 2,160,971
Capital Growth 102,903
(From Last Year)
-
500,000
1,000,000
1,500,000
2,000,000
2,500,000
Asset Loan Equity
What is my profit or loss?
-
500,000
0 2 4 6 8 10 12 14 16 18 20 22 24 26 28 30
Years From Now
50,000
60,000 Cash Profit / Loss Tax Profit / Loss
Ages - Investor 1 & 2 72 & 69
Rent 60,045
Interest Payments -
Other Cash Expenses (7,682)
Cash Profit / Loss** 52,363 -
10,000
20,000
30,000
40,000
50,000
60,000 Cash Profit / Loss Tax Profit / Loss
Cash Profit / Loss** 52,363
Tax Profit / Loss 45,113
How much will my investment cost me?
Ages - Investor 1 & 2 72 & 69
(10,000)
-
10,000
20,000
1 3 5 7 9 11 13 15 17 19 21 23 25 27 29
Years From Now
29%Ages - Investor 1 & 2 72 & 69
Add Principal Pmts -
Total Cost (7,682)
Rent 60,045
Tax Saving / Extra (19,624)
53%
29%
Rent
Tax Saving / Extra
Actual Cost / Profit
Actual Cost / Profit 32,739
Per Week 630
**Excludes any principal payments.
-16%
Actual Cost / Profit
Copyright © 2011 Wealth Planners 54
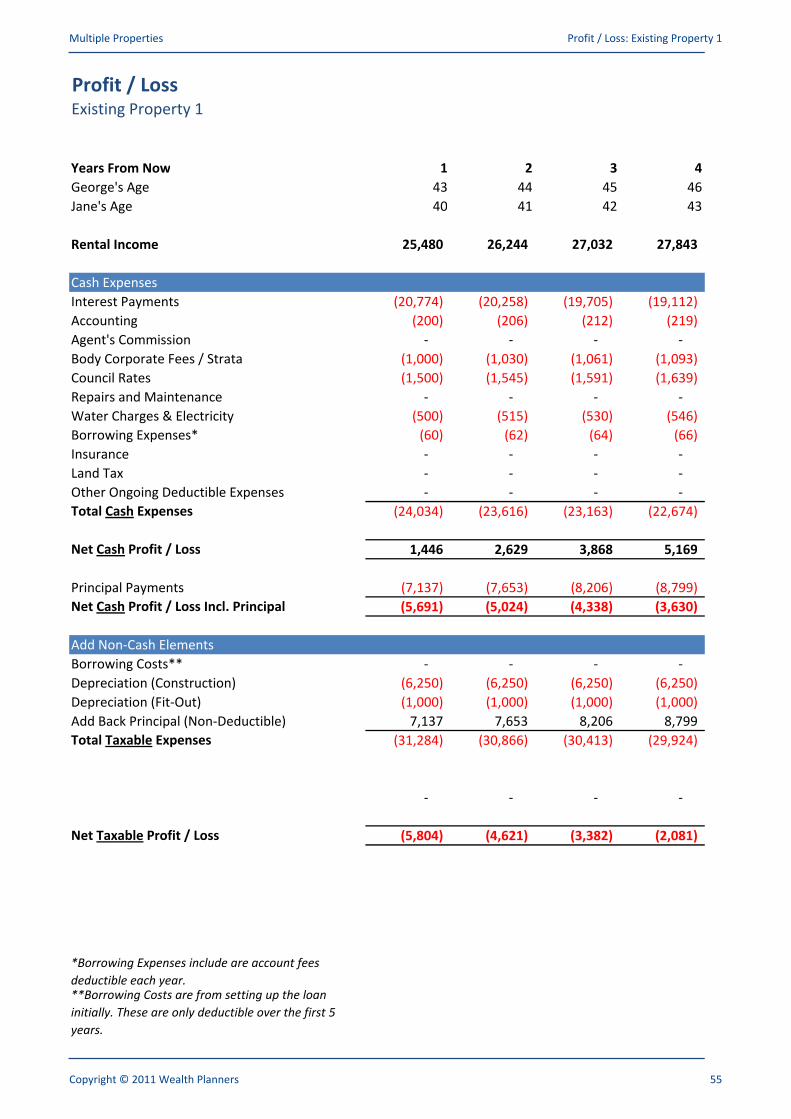
Multiple Properties Profit / Loss: Existing Property 1
Profit / LossExisting Property 1
Years From Now 1 2 3 4
George's Age 43 44 45 46George's Age 43 44 45 46
Jane's Age 40 41 42 43
Rental Income 25,480 26,244 27,032 27,843
Cash Expenses
Interest Payments (20,774) (20,258) (19,705) (19,112)Interest Payments (20,774) (20,258) (19,705) (19,112)
Accounting (200) (206) (212) (219)
Agent's Commission - - - -
Body Corporate Fees / Strata (1,000) (1,030) (1,061) (1,093)
Council Rates (1,500) (1,545) (1,591) (1,639)
Repairs and Maintenance - - - -
Water Charges & Electricity (500) (515) (530) (546)
Borrowing Expenses* (60) (62) (64) (66)Borrowing Expenses* (60) (62) (64) (66)
Insurance - - - -
Land Tax - - - -
Other Ongoing Deductible Expenses - - - -
Total Cash Expenses (24,034) (23,616) (23,163) (22,674)
Net Cash Profit / Loss 1,446 2,629 3,868 5,169
Principal Payments (7,137) (7,653) (8,206) (8,799)
Net Cash Profit / Loss Incl. Principal (5,691) (5,024) (4,338) (3,630)
Add Non-Cash Elements
Borrowing Costs** - - - -
Depreciation (Construction) (6,250) (6,250) (6,250) (6,250)Depreciation (Construction) (6,250) (6,250) (6,250) (6,250)
Depreciation (Fit-Out) (1,000) (1,000) (1,000) (1,000)
Add Back Principal (Non-Deductible) 7,137 7,653 8,206 8,799
Total Taxable Expenses (31,284) (30,866) (30,413) (29,924)
- - - -
Net Taxable Profit / Loss (5,804) (4,621) (3,382) (2,081)
*Borrowing Expenses include are account fees
deductible each year.**Borrowing Costs are from setting up the loan
initially. These are only deductible over the first 5
years.
Copyright © 2011 Wealth Planners 55
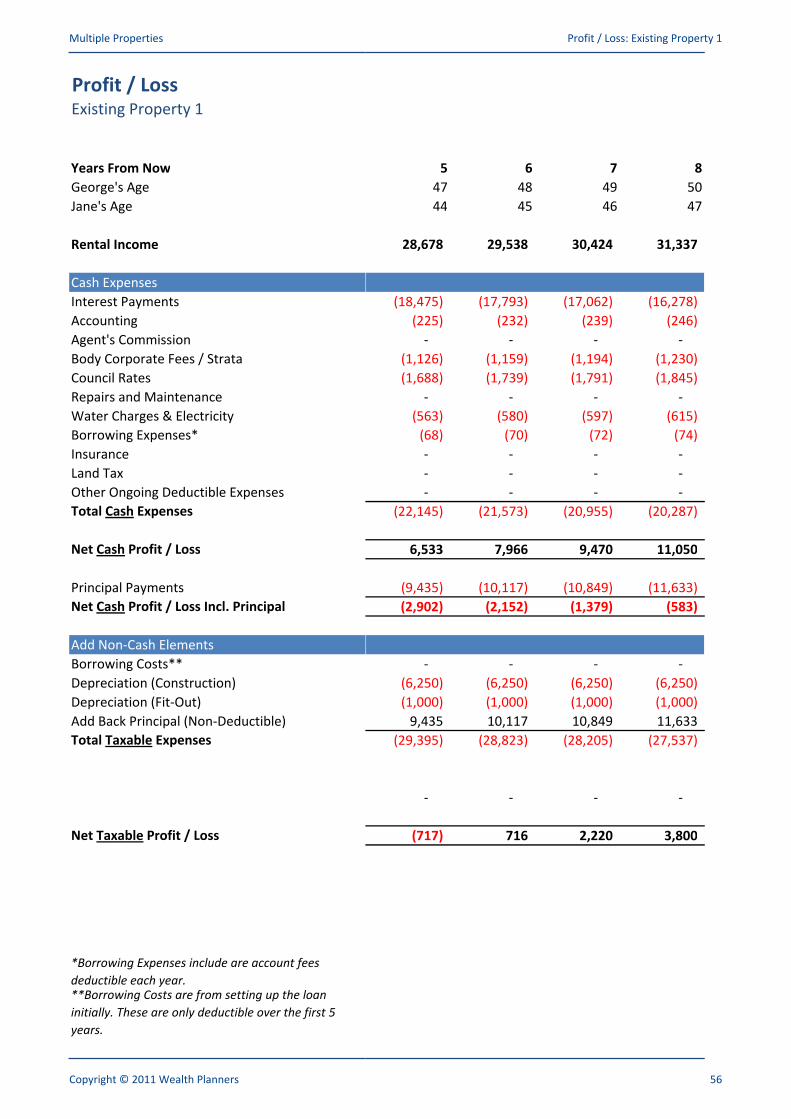
Multiple Properties Profit / Loss: Existing Property 1
Profit / LossExisting Property 1
Years From Now
George's Age
5 6 7 8
47 48 49 50George's Age
Jane's Age
Rental Income
Cash Expenses
Interest Payments
47 48 49 50
44 45 46 47
28,678 29,538 30,424 31,337
(18,475) (17,793) (17,062) (16,278)Interest Payments
Accounting
Agent's Commission
Body Corporate Fees / Strata
Council Rates
Repairs and Maintenance
Water Charges & Electricity
Borrowing Expenses*
(18,475) (17,793) (17,062) (16,278)
(225) (232) (239) (246)
- - - -
(1,126) (1,159) (1,194) (1,230)
(1,688) (1,739) (1,791) (1,845)
- - - -
(563) (580) (597) (615)
(68) (70) (72) (74)Borrowing Expenses*
Insurance
Land Tax
Other Ongoing Deductible Expenses
Total Cash Expenses
Net Cash Profit / Loss
(68) (70) (72) (74)
- - - -
- - - -
- - - -
(22,145) (21,573) (20,955) (20,287)
6,533 7,966 9,470 11,050
Principal Payments
Net Cash Profit / Loss Incl. Principal
Add Non-Cash Elements
Borrowing Costs**
Depreciation (Construction)
(9,435) (10,117) (10,849) (11,633)
(2,902) (2,152) (1,379) (583)
- - - -
(6,250) (6,250) (6,250) (6,250)Depreciation (Construction)
Depreciation (Fit-Out)
Add Back Principal (Non-Deductible)
Total Taxable Expenses
(6,250) (6,250) (6,250) (6,250)
(1,000) (1,000) (1,000) (1,000)
9,435 10,117 10,849 11,633
(29,395) (28,823) (28,205) (27,537)
- - - -
Net Taxable Profit / Loss (717) 716 2,220 3,800
*Borrowing Expenses include are account fees
deductible each year.**Borrowing Costs are from setting up the loan
initially. These are only deductible over the first 5
years.
Copyright © 2011 Wealth Planners 56
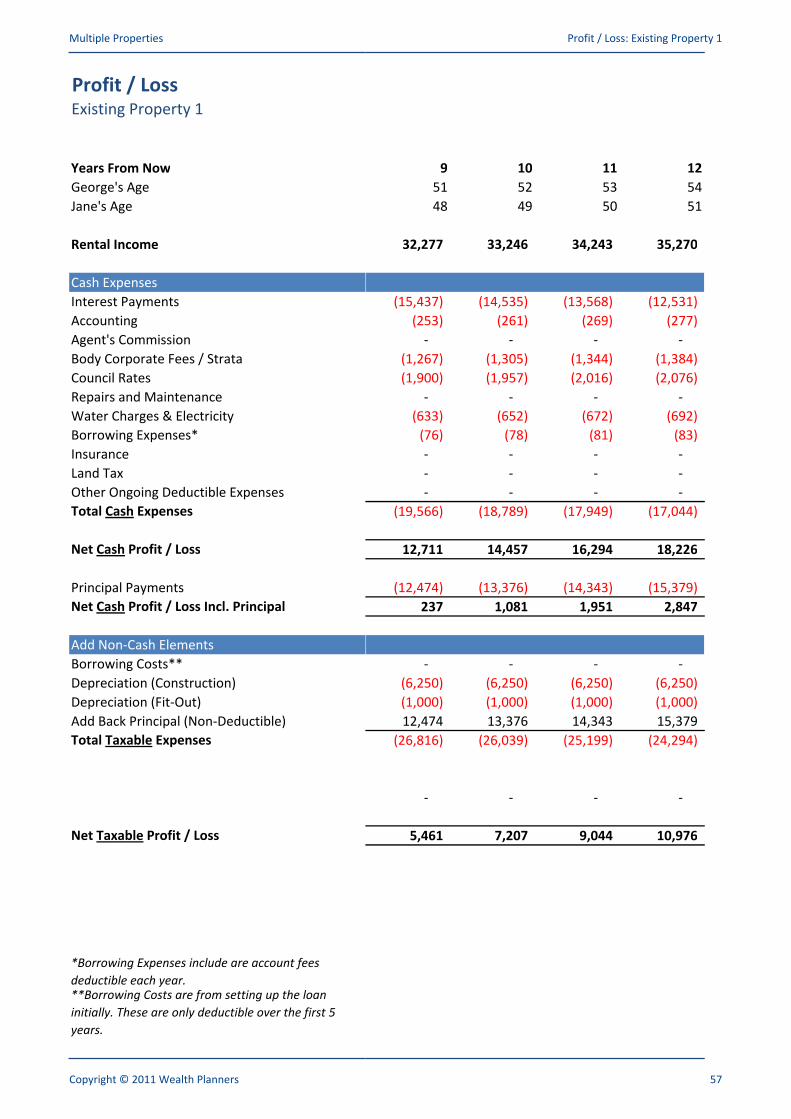
Multiple Properties Profit / Loss: Existing Property 1
Profit / LossExisting Property 1
Years From Now
George's Age
9 10 11 12
51 52 53 54George's Age
Jane's Age
Rental Income
Cash Expenses
Interest Payments
51 52 53 54
48 49 50 51
32,277 33,246 34,243 35,270
(15,437) (14,535) (13,568) (12,531)Interest Payments
Accounting
Agent's Commission
Body Corporate Fees / Strata
Council Rates
Repairs and Maintenance
Water Charges & Electricity
Borrowing Expenses*
(15,437) (14,535) (13,568) (12,531)
(253) (261) (269) (277)
- - - -
(1,267) (1,305) (1,344) (1,384)
(1,900) (1,957) (2,016) (2,076)
- - - -
(633) (652) (672) (692)
(76) (78) (81) (83)Borrowing Expenses*
Insurance
Land Tax
Other Ongoing Deductible Expenses
Total Cash Expenses
Net Cash Profit / Loss
(76) (78) (81) (83)
- - - -
- - - -
- - - -
(19,566) (18,789) (17,949) (17,044)
12,711 14,457 16,294 18,226
Principal Payments
Net Cash Profit / Loss Incl. Principal
Add Non-Cash Elements
Borrowing Costs**
Depreciation (Construction)
(12,474) (13,376) (14,343) (15,379)
237 1,081 1,951 2,847
- - - -
(6,250) (6,250) (6,250) (6,250)Depreciation (Construction)
Depreciation (Fit-Out)
Add Back Principal (Non-Deductible)
Total Taxable Expenses
(6,250) (6,250) (6,250) (6,250)
(1,000) (1,000) (1,000) (1,000)
12,474 13,376 14,343 15,379
(26,816) (26,039) (25,199) (24,294)
- - - -
Net Taxable Profit / Loss 5,461 7,207 9,044 10,976
*Borrowing Expenses include are account fees
deductible each year.**Borrowing Costs are from setting up the loan
initially. These are only deductible over the first 5
years.
Copyright © 2011 Wealth Planners 57

Multiple Properties Profit / Loss: Existing Property 1
Profit / LossExisting Property 1
Years From Now
George's Age
13 14 15 16
55 56 57 58George's Age
Jane's Age
Rental Income
Cash Expenses
Interest Payments
55 56 57 58
52 53 54 55
36,328 37,418 38,541 39,697
(11,419) (10,227) (8,949) (7,578)Interest Payments
Accounting
Agent's Commission
Body Corporate Fees / Strata
Council Rates
Repairs and Maintenance
Water Charges & Electricity
Borrowing Expenses*
(11,419) (10,227) (8,949) (7,578)
(285) (294) (303) (312)
- - - -
(1,426) (1,469) (1,513) (1,558)
(2,139) (2,203) (2,269) (2,337)
- - - -
(713) (734) (756) (779)
(86) (88) (91) (93)Borrowing Expenses*
Insurance
Land Tax
Other Ongoing Deductible Expenses
Total Cash Expenses
Net Cash Profit / Loss
(86) (88) (91) (93)
- - - -
- - - -
- - - -
(16,067) (15,015) (13,880) (12,657)
20,261 22,403 24,661 27,040
Principal Payments
Net Cash Profit / Loss Incl. Principal
Add Non-Cash Elements
Borrowing Costs**
Depreciation (Construction)
(16,491) (17,683) (18,962) (20,333)
3,770 4,720 5,699 6,707
- - - -
(6,250) (6,250) (6,250) (6,250)Depreciation (Construction)
Depreciation (Fit-Out)
Add Back Principal (Non-Deductible)
Total Taxable Expenses
(6,250) (6,250) (6,250) (6,250)
(1,000) (1,000) (1,000) (1,000)
16,491 17,683 18,962 20,333
(23,317) (22,265) (21,130) (19,907)
- - - -
Net Taxable Profit / Loss 13,011 15,153 17,411 19,790
*Borrowing Expenses include are account fees
deductible each year.**Borrowing Costs are from setting up the loan
initially. These are only deductible over the first 5
years.
Copyright © 2011 Wealth Planners 58

Multiple Properties Profit / Loss: Existing Property 1
Profit / LossExisting Property 1
Years From Now
George's Age
17 18 19 20
59 60 61 62George's Age
Jane's Age
Rental Income
Cash Expenses
Interest Payments
59 60 61 62
56 57 58 59
40,888 42,115 43,378 44,679
(6,108) (4,532) (2,842) (1,030)Interest Payments
Accounting
Agent's Commission
Body Corporate Fees / Strata
Council Rates
Repairs and Maintenance
Water Charges & Electricity
Borrowing Expenses*
(6,108) (4,532) (2,842) (1,030)
(321) (331) (340) (351)
- - - -
(1,605) (1,653) (1,702) (1,754)
(2,407) (2,479) (2,554) (2,630)
- - - -
(802) (826) (851) (877)
(96) (99) (102) (105)Borrowing Expenses*
Insurance
Land Tax
Other Ongoing Deductible Expenses
Total Cash Expenses
Net Cash Profit / Loss
(96) (99) (102) (105)
- - - -
- - - -
- - - -
(11,340) (9,921) (8,392) (6,747)
29,548 32,194 34,986 37,933
Principal Payments
Net Cash Profit / Loss Incl. Principal
Add Non-Cash Elements
Borrowing Costs**
Depreciation (Construction)
(21,802) (23,378) (25,068) (26,881)
7,746 8,816 9,917 11,052
- - - -
(6,250) (6,250) (6,250) (6,250)Depreciation (Construction)
Depreciation (Fit-Out)
Add Back Principal (Non-Deductible)
Total Taxable Expenses
(6,250) (6,250) (6,250) (6,250)
(1,000) (1,000) (1,000) (1,000)
21,802 23,378 25,068 26,881
(18,590) (17,171) (15,642) (13,997)
- - - -
Net Taxable Profit / Loss 22,298 24,944 27,736 30,683
*Borrowing Expenses include are account fees
deductible each year.**Borrowing Costs are from setting up the loan
initially. These are only deductible over the first 5
years.
Copyright © 2011 Wealth Planners 59
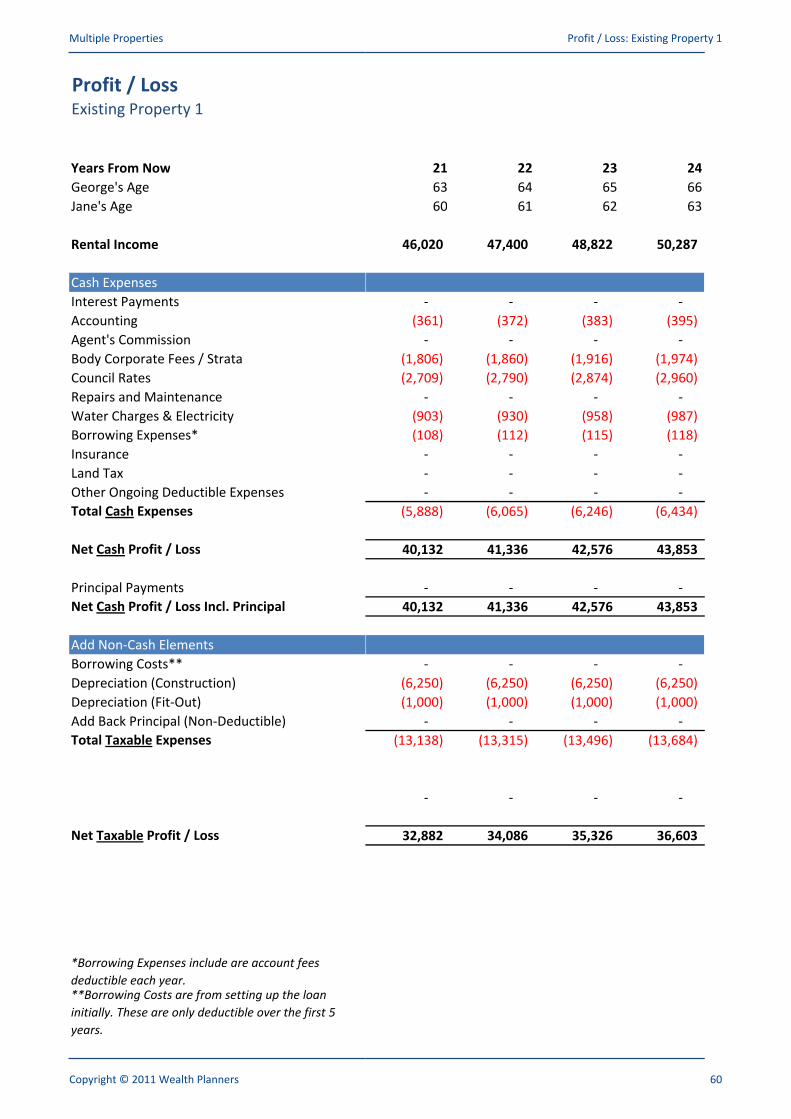
Multiple Properties Profit / Loss: Existing Property 1
Profit / LossExisting Property 1
Years From Now
George's Age
21 22 23 24
63 64 65 66George's Age
Jane's Age
Rental Income
Cash Expenses
Interest Payments
63 64 65 66
60 61 62 63
46,020 47,400 48,822 50,287
- - - - Interest Payments
Accounting
Agent's Commission
Body Corporate Fees / Strata
Council Rates
Repairs and Maintenance
Water Charges & Electricity
Borrowing Expenses*
- - - -
(361) (372) (383) (395)
- - - -
(1,806) (1,860) (1,916) (1,974)
(2,709) (2,790) (2,874) (2,960)
- - - -
(903) (930) (958) (987)
(108) (112) (115) (118)Borrowing Expenses*
Insurance
Land Tax
Other Ongoing Deductible Expenses
Total Cash Expenses
Net Cash Profit / Loss
(108) (112) (115) (118)
- - - -
- - - -
- - - -
(5,888) (6,065) (6,246) (6,434)
40,132 41,336 42,576 43,853
Principal Payments
Net Cash Profit / Loss Incl. Principal
Add Non-Cash Elements
Borrowing Costs**
Depreciation (Construction)
- - - -
40,132 41,336 42,576 43,853
- - - -
(6,250) (6,250) (6,250) (6,250)Depreciation (Construction)
Depreciation (Fit-Out)
Add Back Principal (Non-Deductible)
Total Taxable Expenses
(6,250) (6,250) (6,250) (6,250)
(1,000) (1,000) (1,000) (1,000)
- - - -
(13,138) (13,315) (13,496) (13,684)
- - - -
Net Taxable Profit / Loss 32,882 34,086 35,326 36,603
*Borrowing Expenses include are account fees
deductible each year.**Borrowing Costs are from setting up the loan
initially. These are only deductible over the first 5
years.
Copyright © 2011 Wealth Planners 60
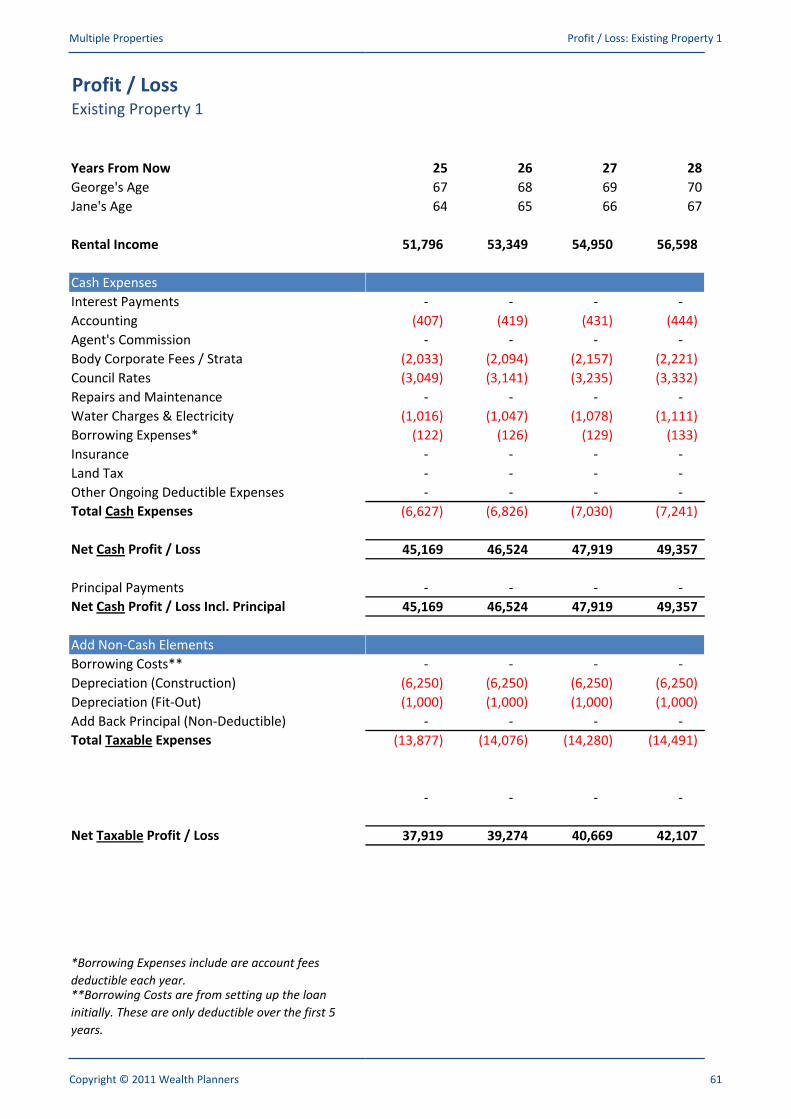
Multiple Properties Profit / Loss: Existing Property 1
Profit / LossExisting Property 1
Years From Now
George's Age
25 26 27 28
67 68 69 70George's Age
Jane's Age
Rental Income
Cash Expenses
Interest Payments
67 68 69 70
64 65 66 67
51,796 53,349 54,950 56,598
- - - - Interest Payments
Accounting
Agent's Commission
Body Corporate Fees / Strata
Council Rates
Repairs and Maintenance
Water Charges & Electricity
Borrowing Expenses*
- - - -
(407) (419) (431) (444)
- - - -
(2,033) (2,094) (2,157) (2,221)
(3,049) (3,141) (3,235) (3,332)
- - - -
(1,016) (1,047) (1,078) (1,111)
(122) (126) (129) (133)Borrowing Expenses*
Insurance
Land Tax
Other Ongoing Deductible Expenses
Total Cash Expenses
Net Cash Profit / Loss
(122) (126) (129) (133)
- - - -
- - - -
- - - -
(6,627) (6,826) (7,030) (7,241)
45,169 46,524 47,919 49,357
Principal Payments
Net Cash Profit / Loss Incl. Principal
Add Non-Cash Elements
Borrowing Costs**
Depreciation (Construction)
- - - -
45,169 46,524 47,919 49,357
- - - -
(6,250) (6,250) (6,250) (6,250)Depreciation (Construction)
Depreciation (Fit-Out)
Add Back Principal (Non-Deductible)
Total Taxable Expenses
(6,250) (6,250) (6,250) (6,250)
(1,000) (1,000) (1,000) (1,000)
- - - -
(13,877) (14,076) (14,280) (14,491)
- - - -
Net Taxable Profit / Loss 37,919 39,274 40,669 42,107
*Borrowing Expenses include are account fees
deductible each year.**Borrowing Costs are from setting up the loan
initially. These are only deductible over the first 5
years.
Copyright © 2011 Wealth Planners 61

Multiple Properties Profit / Loss: Existing Property 1
Profit / LossExisting Property 1
Years From Now
George's Age
29 30
71 72George's Age
Jane's Age
Rental Income
Cash Expenses
Interest Payments
71 72
68 69
58,296 60,045
- - Interest Payments
Accounting
Agent's Commission
Body Corporate Fees / Strata
Council Rates
Repairs and Maintenance
Water Charges & Electricity
Borrowing Expenses*
- -
(458) (471)
- -
(2,288) (2,357)
(3,432) (3,535)
- -
(1,144) (1,178)
(137) (141)Borrowing Expenses*
Insurance
Land Tax
Other Ongoing Deductible Expenses
Total Cash Expenses
Net Cash Profit / Loss
(137) (141)
- -
- -
- -
(7,459) (7,682)
50,838 52,363
Principal Payments
Net Cash Profit / Loss Incl. Principal
Add Non-Cash Elements
Borrowing Costs**
Depreciation (Construction)
- -
50,838 52,363
- -
(6,250) (6,250)Depreciation (Construction)
Depreciation (Fit-Out)
Add Back Principal (Non-Deductible)
Total Taxable Expenses
(6,250) (6,250)
(1,000) (1,000)
- -
(14,709) (14,932)
- -
Net Taxable Profit / Loss 43,588 45,113
*Borrowing Expenses include are account fees
deductible each year.**Borrowing Costs are from setting up the loan
initially. These are only deductible over the first 5
years.
Copyright © 2011 Wealth Planners 62
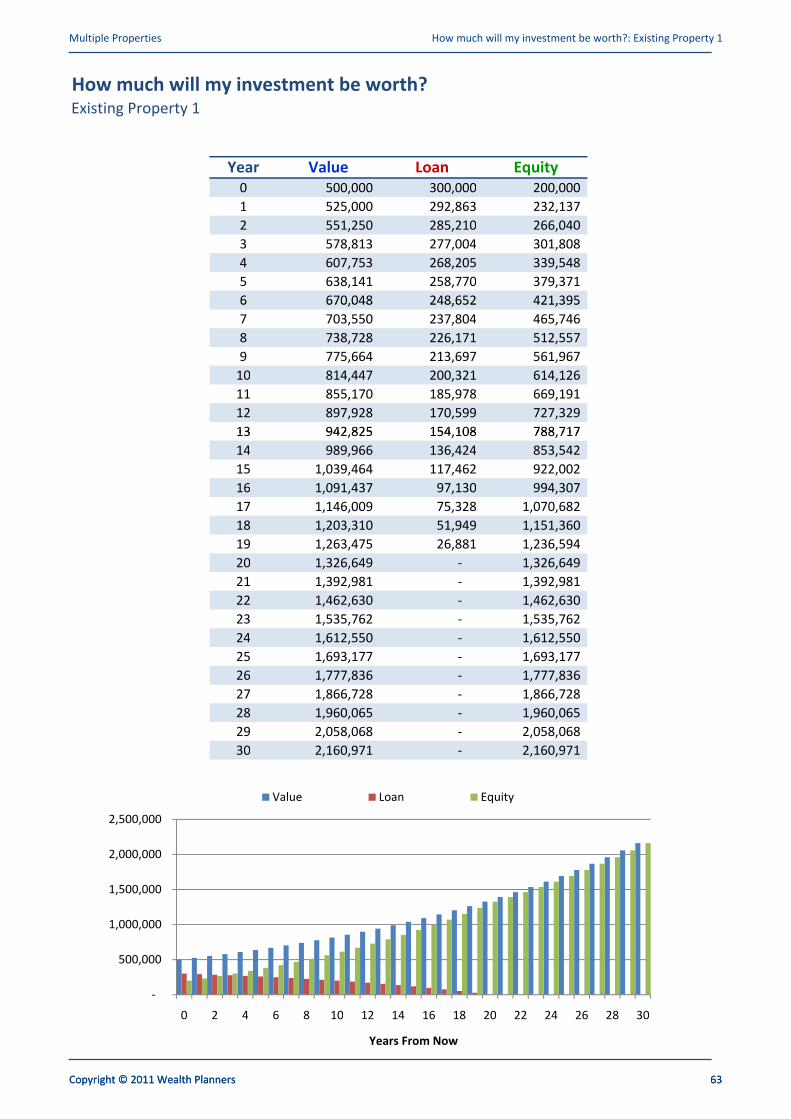
Multiple Properties How much will my investment be worth?: Existing Property 1
How much will my investment be worth?Existing Property 1
Year Value Loan Equity
0 500,000 300,000 200,000
Copyright © 2011 Wealth Planners 63
0 500,000 300,000 200,000
1 525,000 292,863 232,137
2 551,250 285,210 266,040
3 578,813 277,004 301,808
4 607,753 268,205 339,548
5 638,141 258,770 379,371
6 670,048 248,652 421,395 6 670,048 248,652 421,395
7 703,550 237,804 465,746
8 738,728 226,171 512,557
9 775,664 213,697 561,967
10 814,447 200,321 614,126
11 855,170 185,978 669,191
12 897,928 170,599 727,329
13 942,825 154,108 788,717 13 942,825 154,108 788,717
14 989,966 136,424 853,542
15 1,039,464 117,462 922,002
16 1,091,437 97,130 994,307
17 1,146,009 75,328 1,070,682
18 1,203,310 51,949 1,151,360
19 1,263,475 26,881 1,236,594
20 1,326,649 - 1,326,649 20 1,326,649 - 1,326,649
21 1,392,981 - 1,392,981
22 1,462,630 - 1,462,630
23 1,535,762 - 1,535,762
24 1,612,550 - 1,612,550
25 1,693,177 - 1,693,177
26 1,777,836 - 1,777,836
27 1,866,728 - 1,866,728
26 1,777,836 - 1,777,836
27 1,866,728 - 1,866,728
28 1,960,065 - 1,960,065
29 2,058,068 - 2,058,068
30 2,160,971 - 2,160,971
2,500,000
Value Loan Equity
1,000,000
1,500,000
2,000,000
2,500,000
Value Loan Equity
-
500,000
1,000,000
0 2 4 6 8 10 12 14 16 18 20 22 24 26 28 30
Years From Now
Copyright © 2011 Wealth Planners 63

Multiple Properties How much will it cost me?: Existing Property 1
How much will it cost me?Existing Property 1
1 Year From Now
This page shows you how much the investment will actually cost you or how much profit you will make
Copyright © 2011 Wealth Planners 64
George Jane Total
Existing Property 1 Ownership 100% 0% 100%
Without Existing Property 1 George Jane Total
This page shows you how much the investment will actually cost you or how much profit you will make
when the tax saving or extra tax payable due to the investment is taken into account.
Without Existing Property 1 George Jane Total
Salary Less Salary Sacrifice 100,000 80,000 180,000
Bonus 10,000 5,000 15,000
Interest Earned On Savings 1,125 1,125 2,250
Taxable Profit / Loss On Other Properties (8,975) (8,975) (17,950)
Shares / Managed Funds Profit / Loss - - -
Taxable Income 102,150 77,150 179,300
Tax Payable (24,213) (15,538) (39,751)
With Existing Property 1 George Jane Total
Taxable Profit/Loss On Existing Property 1 (5,804) - (5,804)
New Taxable Income 96,346 77,150 173,496
New Tax Payable (22,153) (15,538) (37,691)New Tax Payable (22,153) (15,538) (37,691)
Tax Saving (+) / Extra Tax (-) 2,060 - 2,060
How Much Existing Property 1 Costs You Yearly Monthly Weekly
Principal Repayments (7,137) (595) (137)Principal Repayments (7,137) (595) (137)
Interest Repayments (20,774) (1,731) (399)
Other Existing Property 1 Cash Expenses (3,260) (272) (63)
Total Cost (31,171) (2,598) (599)
How The Costs Will Be Paid Yearly Monthly Weekly
Rent 25,480 2,123 490
Tax Saving (+) / Extra Tax (-) 2,060 172 40 Tax Saving (+) / Extra Tax (-) 2,060 172 40
Out Of Pocket Profit (+) / Cost (-) (3,630) (303) (70)
82%
6%
-12%
Rent
Tax Saving (+) / Extra Tax (-)
Out Of Pocket Profit (+) / Cost (-)
82%
Tax Saving (+) / Extra Tax (-)
Out Of Pocket Profit (+) / Cost (-)
Copyright © 2011 Wealth Planners 64
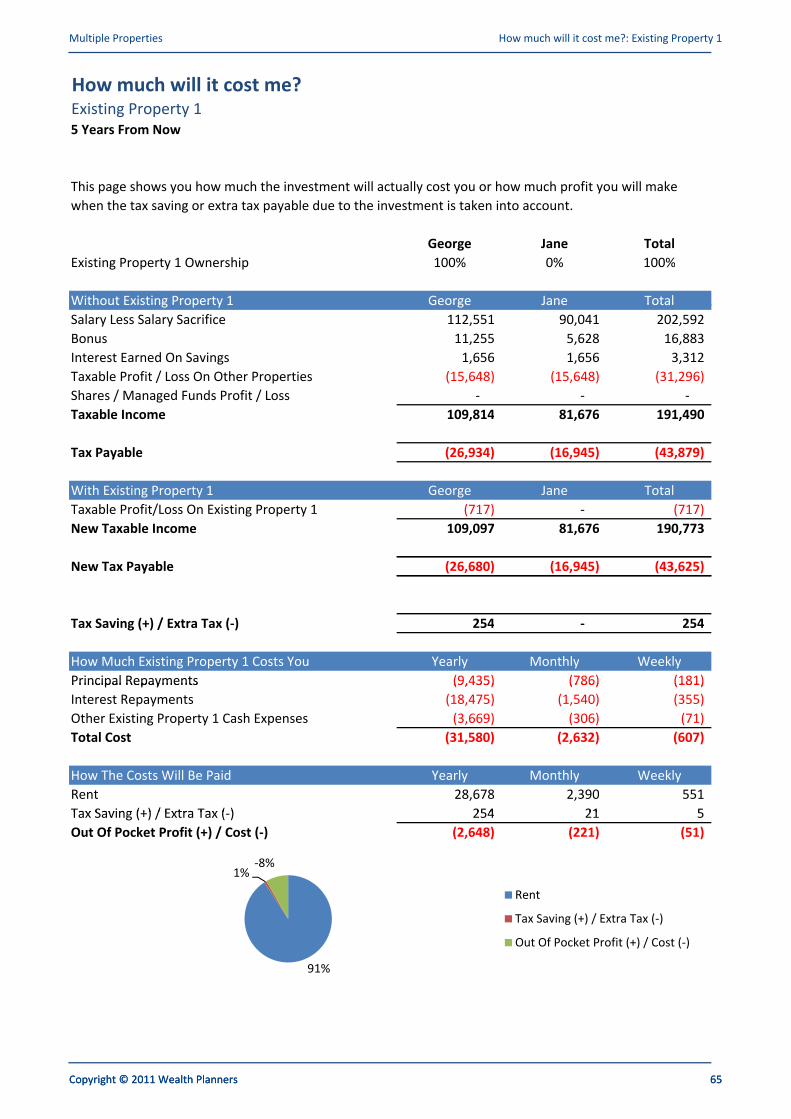
Multiple Properties How much will it cost me?: Existing Property 1
How much will it cost me?Existing Property 1
5 Years From Now
This page shows you how much the investment will actually cost you or how much profit you will make
Copyright © 2011 Wealth Planners 65
George Jane Total
Existing Property 1 Ownership 100% 0% 100%
Without Existing Property 1 George Jane Total
This page shows you how much the investment will actually cost you or how much profit you will make
when the tax saving or extra tax payable due to the investment is taken into account.
Without Existing Property 1 George Jane Total
Salary Less Salary Sacrifice 112,551 90,041 202,592
Bonus 11,255 5,628 16,883
Interest Earned On Savings 1,656 1,656 3,312
Taxable Profit / Loss On Other Properties (15,648) (15,648) (31,296)
Shares / Managed Funds Profit / Loss - - -
Taxable Income 109,814 81,676 191,490
Tax Payable (26,934) (16,945) (43,879)
With Existing Property 1 George Jane Total
Taxable Profit/Loss On Existing Property 1 (717) - (717)
New Taxable Income 109,097 81,676 190,773
New Tax Payable (26,680) (16,945) (43,625)New Tax Payable (26,680) (16,945) (43,625)
Tax Saving (+) / Extra Tax (-) 254 - 254
How Much Existing Property 1 Costs You Yearly Monthly Weekly
Principal Repayments (9,435) (786) (181)Principal Repayments (9,435) (786) (181)
Interest Repayments (18,475) (1,540) (355)
Other Existing Property 1 Cash Expenses (3,669) (306) (71)
Total Cost (31,580) (2,632) (607)
How The Costs Will Be Paid Yearly Monthly Weekly
Rent 28,678 2,390 551
Tax Saving (+) / Extra Tax (-) 254 21 5 Tax Saving (+) / Extra Tax (-) 254 21 5
Out Of Pocket Profit (+) / Cost (-) (2,648) (221) (51)
1%-8%
Rent
Tax Saving (+) / Extra Tax (-)
Out Of Pocket Profit (+) / Cost (-)
91%
Tax Saving (+) / Extra Tax (-)
Out Of Pocket Profit (+) / Cost (-)
Copyright © 2011 Wealth Planners 65
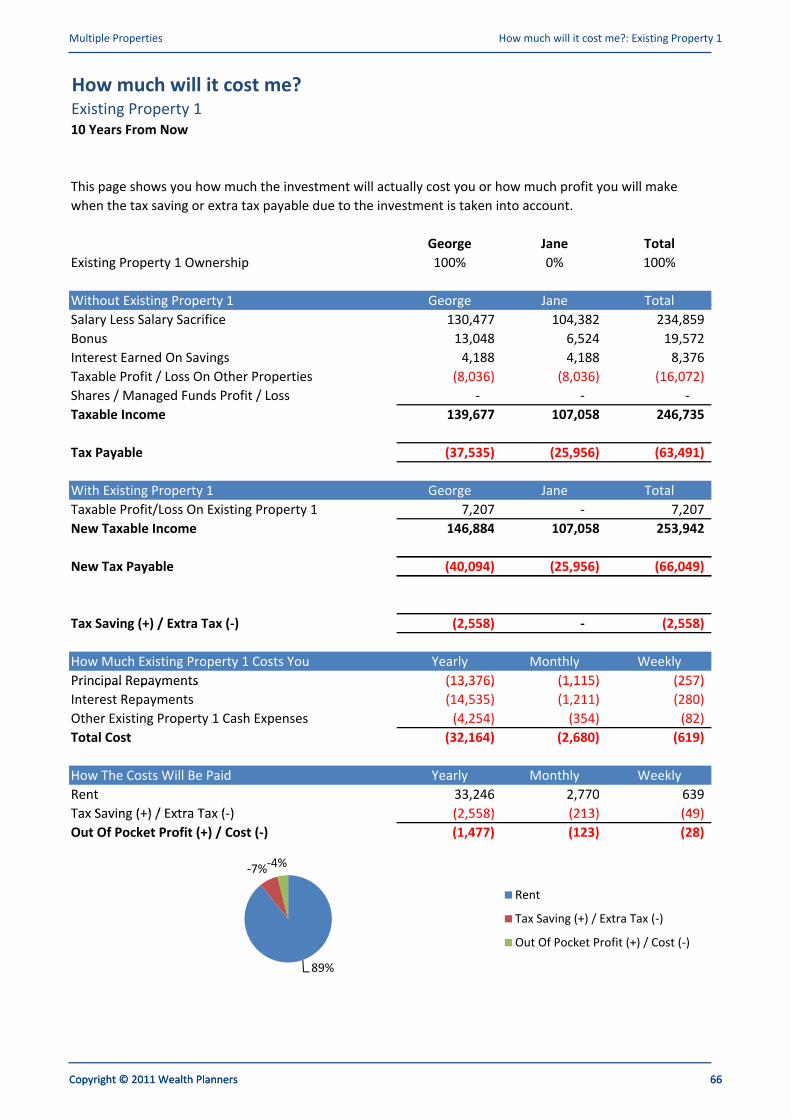
Multiple Properties How much will it cost me?: Existing Property 1
How much will it cost me?Existing Property 1
10 Years From Now
This page shows you how much the investment will actually cost you or how much profit you will make
Copyright © 2011 Wealth Planners 66
George Jane Total
Existing Property 1 Ownership 100% 0% 100%
Without Existing Property 1 George Jane Total
This page shows you how much the investment will actually cost you or how much profit you will make
when the tax saving or extra tax payable due to the investment is taken into account.
Without Existing Property 1 George Jane Total
Salary Less Salary Sacrifice 130,477 104,382 234,859
Bonus 13,048 6,524 19,572
Interest Earned On Savings 4,188 4,188 8,376
Taxable Profit / Loss On Other Properties (8,036) (8,036) (16,072)
Shares / Managed Funds Profit / Loss - - -
Taxable Income 139,677 107,058 246,735
Tax Payable (37,535) (25,956) (63,491)
With Existing Property 1 George Jane Total
Taxable Profit/Loss On Existing Property 1 7,207 - 7,207
New Taxable Income 146,884 107,058 253,942
New Tax Payable (40,094) (25,956) (66,049)New Tax Payable (40,094) (25,956) (66,049)
Tax Saving (+) / Extra Tax (-) (2,558) - (2,558)
How Much Existing Property 1 Costs You Yearly Monthly Weekly
Principal Repayments (13,376) (1,115) (257)Principal Repayments (13,376) (1,115) (257)
Interest Repayments (14,535) (1,211) (280)
Other Existing Property 1 Cash Expenses (4,254) (354) (82)
Total Cost (32,164) (2,680) (619)
How The Costs Will Be Paid Yearly Monthly Weekly
Rent 33,246 2,770 639
Tax Saving (+) / Extra Tax (-) (2,558) (213) (49)Tax Saving (+) / Extra Tax (-) (2,558) (213) (49)
Out Of Pocket Profit (+) / Cost (-) (1,477) (123) (28)
-7%-4%
Rent
Tax Saving (+) / Extra Tax (-)
Out Of Pocket Profit (+) / Cost (-)
89%
Tax Saving (+) / Extra Tax (-)
Out Of Pocket Profit (+) / Cost (-)
Copyright © 2011 Wealth Planners 66
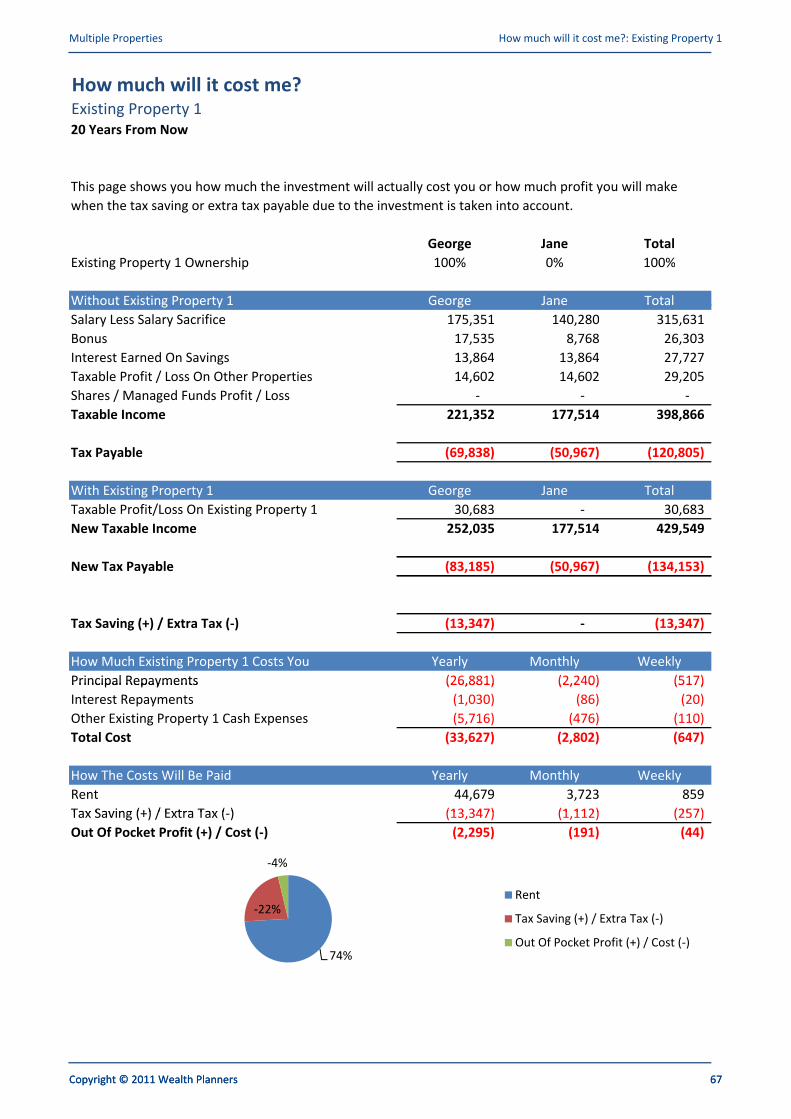
Multiple Properties How much will it cost me?: Existing Property 1
How much will it cost me?Existing Property 1
20 Years From Now
This page shows you how much the investment will actually cost you or how much profit you will make
Copyright © 2011 Wealth Planners 67
George Jane Total
Existing Property 1 Ownership 100% 0% 100%
Without Existing Property 1 George Jane Total
This page shows you how much the investment will actually cost you or how much profit you will make
when the tax saving or extra tax payable due to the investment is taken into account.
Without Existing Property 1 George Jane Total
Salary Less Salary Sacrifice 175,351 140,280 315,631
Bonus 17,535 8,768 26,303
Interest Earned On Savings 13,864 13,864 27,727
Taxable Profit / Loss On Other Properties 14,602 14,602 29,205
Shares / Managed Funds Profit / Loss - - -
Taxable Income 221,352 177,514 398,866
Tax Payable (69,838) (50,967) (120,805)
With Existing Property 1 George Jane Total
Taxable Profit/Loss On Existing Property 1 30,683 - 30,683
New Taxable Income 252,035 177,514 429,549
New Tax Payable (83,185) (50,967) (134,153)New Tax Payable (83,185) (50,967) (134,153)
Tax Saving (+) / Extra Tax (-) (13,347) - (13,347)
How Much Existing Property 1 Costs You Yearly Monthly Weekly
Principal Repayments (26,881) (2,240) (517)Principal Repayments (26,881) (2,240) (517)
Interest Repayments (1,030) (86) (20)
Other Existing Property 1 Cash Expenses (5,716) (476) (110)
Total Cost (33,627) (2,802) (647)
How The Costs Will Be Paid Yearly Monthly Weekly
Rent 44,679 3,723 859
Tax Saving (+) / Extra Tax (-) (13,347) (1,112) (257)Tax Saving (+) / Extra Tax (-) (13,347) (1,112) (257)
Out Of Pocket Profit (+) / Cost (-) (2,295) (191) (44)
74%
-22%
-4%
Rent
Tax Saving (+) / Extra Tax (-)
Out Of Pocket Profit (+) / Cost (-)74%
-22%Tax Saving (+) / Extra Tax (-)
Out Of Pocket Profit (+) / Cost (-)
Copyright © 2011 Wealth Planners 67
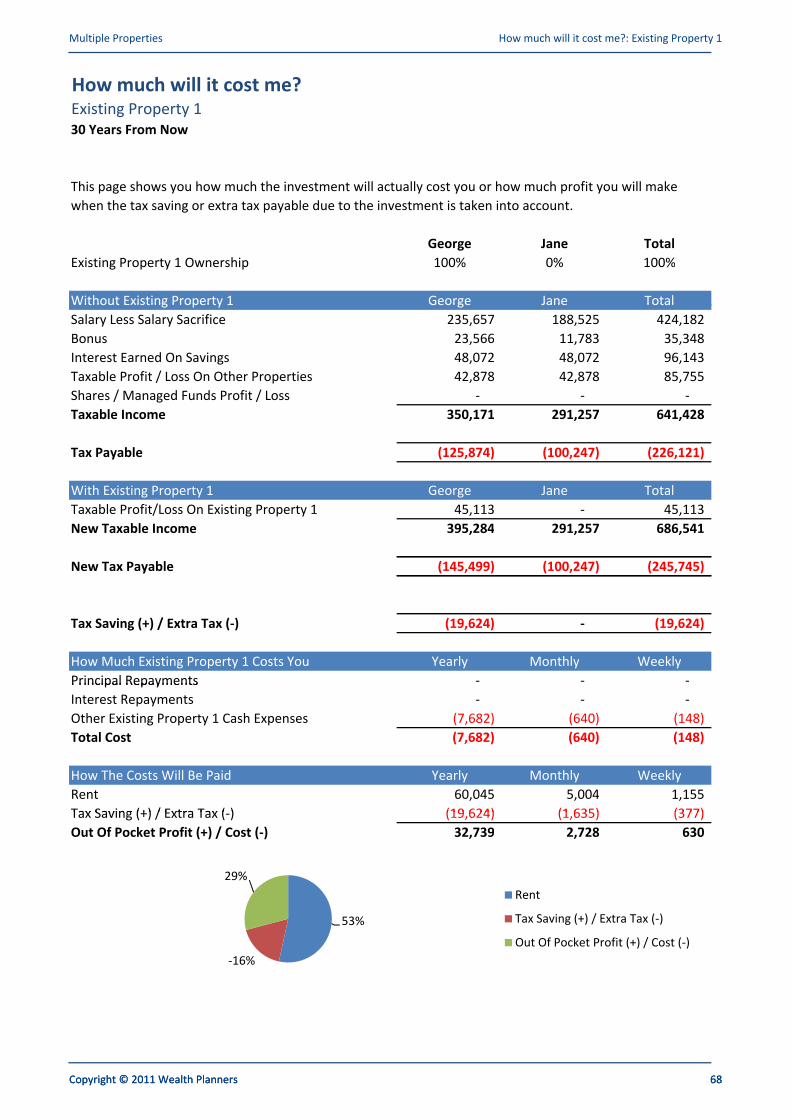
Multiple Properties How much will it cost me?: Existing Property 1
How much will it cost me?Existing Property 1
30 Years From Now
This page shows you how much the investment will actually cost you or how much profit you will make
Copyright © 2011 Wealth Planners 68
George Jane Total
Existing Property 1 Ownership 100% 0% 100%
Without Existing Property 1 George Jane Total
This page shows you how much the investment will actually cost you or how much profit you will make
when the tax saving or extra tax payable due to the investment is taken into account.
Without Existing Property 1 George Jane Total
Salary Less Salary Sacrifice 235,657 188,525 424,182
Bonus 23,566 11,783 35,348
Interest Earned On Savings 48,072 48,072 96,143
Taxable Profit / Loss On Other Properties 42,878 42,878 85,755
Shares / Managed Funds Profit / Loss - - -
Taxable Income 350,171 291,257 641,428
Tax Payable (125,874) (100,247) (226,121)
With Existing Property 1 George Jane Total
Taxable Profit/Loss On Existing Property 1 45,113 - 45,113
New Taxable Income 395,284 291,257 686,541
New Tax Payable (145,499) (100,247) (245,745)New Tax Payable (145,499) (100,247) (245,745)
Tax Saving (+) / Extra Tax (-) (19,624) - (19,624)
How Much Existing Property 1 Costs You Yearly Monthly Weekly
Principal Repayments - - - Principal Repayments - - -
Interest Repayments - - -
Other Existing Property 1 Cash Expenses (7,682) (640) (148)
Total Cost (7,682) (640) (148)
How The Costs Will Be Paid Yearly Monthly Weekly
Rent 60,045 5,004 1,155
Tax Saving (+) / Extra Tax (-) (19,624) (1,635) (377)Tax Saving (+) / Extra Tax (-) (19,624) (1,635) (377)
Out Of Pocket Profit (+) / Cost (-) 32,739 2,728 630
53%
-16%
29%
Rent
Tax Saving (+) / Extra Tax (-)
Out Of Pocket Profit (+) / Cost (-)
53%
-16%
Tax Saving (+) / Extra Tax (-)
Out Of Pocket Profit (+) / Cost (-)
Copyright © 2011 Wealth Planners 68
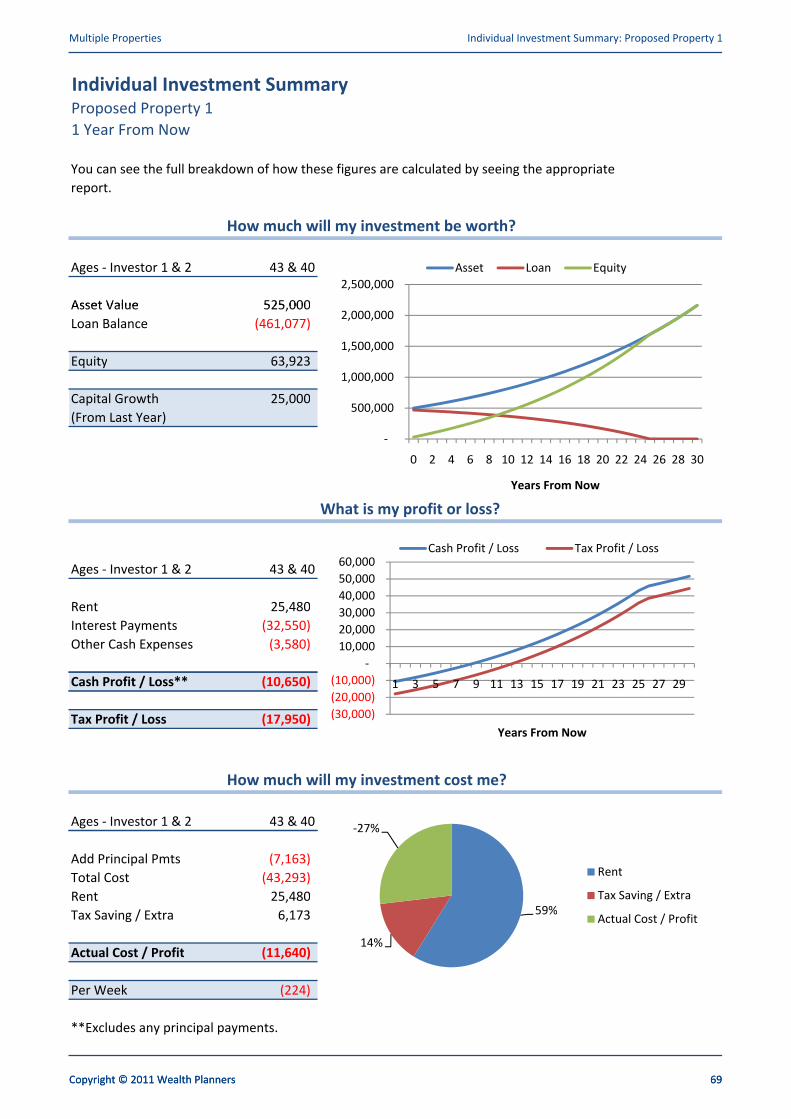
Multiple Properties Individual Investment Summary: Proposed Property 1
Individual Investment SummaryProposed Property 1
1 Year From Now
You can see the full breakdown of how these figures are calculated by seeing the appropriate
report.
Copyright © 2011 Wealth Planners 69
How much will my investment be worth?
Ages - Investor 1 & 2 43 & 40
Asset Value 525,000
You can see the full breakdown of how these figures are calculated by seeing the appropriate
report.
2,000,000
2,500,000
Asset Loan Equity
Asset Value 525,000
Loan Balance (461,077)
Equity 63,923
Capital Growth 25,000
(From Last Year)
-
500,000
1,000,000
1,500,000
2,000,000
2,500,000
Asset Loan Equity
What is my profit or loss?
-
500,000
0 2 4 6 8 10 12 14 16 18 20 22 24 26 28 30
Years From Now
50,000
60,000 Cash Profit / Loss Tax Profit / Loss
Ages - Investor 1 & 2 43 & 40
Rent 25,480
Interest Payments (32,550)
Other Cash Expenses (3,580)
Cash Profit / Loss** (10,650)(20,000)
(10,000)
-
10,000
20,000
30,000
40,000
50,000
60,000
1 3 5 7 9 11 13 15 17 19 21 23 25 27 29
Cash Profit / Loss Tax Profit / Loss
Cash Profit / Loss** (10,650)
Tax Profit / Loss (17,950)
How much will my investment cost me?
Ages - Investor 1 & 2 43 & 40
(30,000)
(20,000)
(10,000)
-
10,000
1 3 5 7 9 11 13 15 17 19 21 23 25 27 29
Years From Now
-27%Ages - Investor 1 & 2 43 & 40
Add Principal Pmts (7,163)
Total Cost (43,293)
Rent 25,480
Tax Saving / Extra 6,173 59%
14%
-27%
Rent
Tax Saving / Extra
Actual Cost / Profit
Actual Cost / Profit (11,640)
Per Week (224)
**Excludes any principal payments.
59%
14%
Actual Cost / Profit
Copyright © 2011 Wealth Planners 69
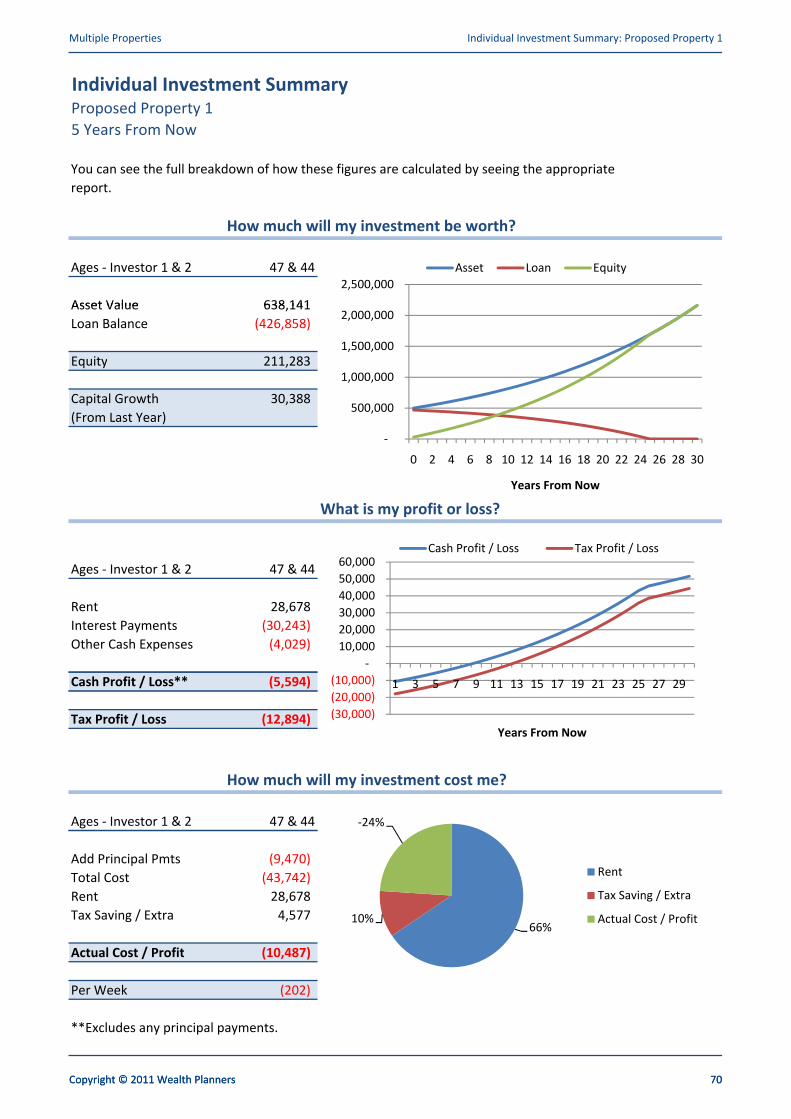
Multiple Properties Individual Investment Summary: Proposed Property 1
Individual Investment SummaryProposed Property 1
5 Years From Now
You can see the full breakdown of how these figures are calculated by seeing the appropriate
report.
Copyright © 2011 Wealth Planners 70
How much will my investment be worth?
Ages - Investor 1 & 2 47 & 44
Asset Value 638,141
You can see the full breakdown of how these figures are calculated by seeing the appropriate
report.
2,000,000
2,500,000
Asset Loan Equity
Asset Value 638,141
Loan Balance (426,858)
Equity 211,283
Capital Growth 30,388
(From Last Year)
-
500,000
1,000,000
1,500,000
2,000,000
2,500,000
Asset Loan Equity
What is my profit or loss?
-
500,000
0 2 4 6 8 10 12 14 16 18 20 22 24 26 28 30
Years From Now
50,000
60,000 Cash Profit / Loss Tax Profit / Loss
Ages - Investor 1 & 2 47 & 44
Rent 28,678
Interest Payments (30,243)
Other Cash Expenses (4,029)
Cash Profit / Loss** (5,594)(20,000)
(10,000)
-
10,000
20,000
30,000
40,000
50,000
60,000
1 3 5 7 9 11 13 15 17 19 21 23 25 27 29
Cash Profit / Loss Tax Profit / Loss
Cash Profit / Loss** (5,594)
Tax Profit / Loss (12,894)
How much will my investment cost me?
Ages - Investor 1 & 2 47 & 44
(30,000)
(20,000)
(10,000)
-
10,000
1 3 5 7 9 11 13 15 17 19 21 23 25 27 29
Years From Now
-24%Ages - Investor 1 & 2 47 & 44
Add Principal Pmts (9,470)
Total Cost (43,742)
Rent 28,678
Tax Saving / Extra 4,577 66%
10%
-24%
Rent
Tax Saving / Extra
Actual Cost / Profit
Actual Cost / Profit (10,487)
Per Week (202)
**Excludes any principal payments.
66%10% Actual Cost / Profit
Copyright © 2011 Wealth Planners 70
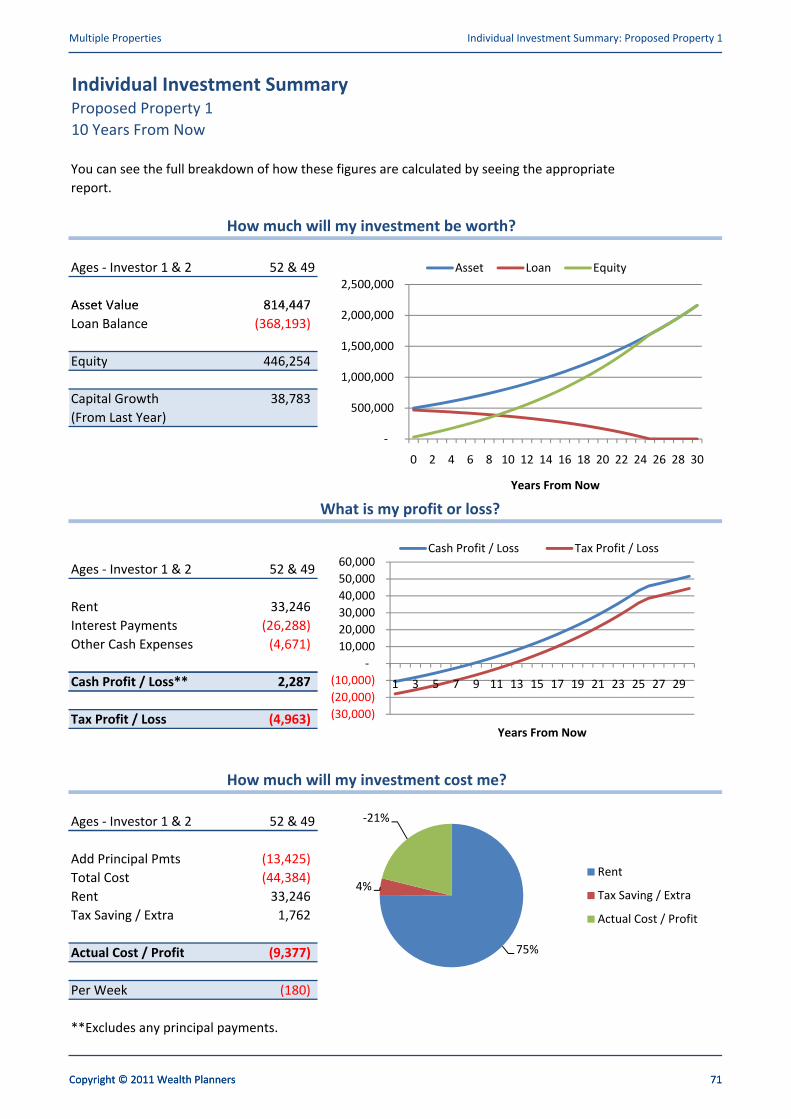
Multiple Properties Individual Investment Summary: Proposed Property 1
Individual Investment SummaryProposed Property 1
10 Years From Now
You can see the full breakdown of how these figures are calculated by seeing the appropriate
report.
Copyright © 2011 Wealth Planners 71
How much will my investment be worth?
Ages - Investor 1 & 2 52 & 49
Asset Value 814,447
You can see the full breakdown of how these figures are calculated by seeing the appropriate
report.
2,000,000
2,500,000
Asset Loan Equity
Asset Value 814,447
Loan Balance (368,193)
Equity 446,254
Capital Growth 38,783
(From Last Year)
-
500,000
1,000,000
1,500,000
2,000,000
2,500,000
Asset Loan Equity
What is my profit or loss?
-
500,000
0 2 4 6 8 10 12 14 16 18 20 22 24 26 28 30
Years From Now
50,000
60,000 Cash Profit / Loss Tax Profit / Loss
Ages - Investor 1 & 2 52 & 49
Rent 33,246
Interest Payments (26,288)
Other Cash Expenses (4,671)
Cash Profit / Loss** 2,287 (20,000)
(10,000)
-
10,000
20,000
30,000
40,000
50,000
60,000
1 3 5 7 9 11 13 15 17 19 21 23 25 27 29
Cash Profit / Loss Tax Profit / Loss
Cash Profit / Loss** 2,287
Tax Profit / Loss (4,963)
How much will my investment cost me?
Ages - Investor 1 & 2 52 & 49
(30,000)
(20,000)
(10,000)
-
10,000
1 3 5 7 9 11 13 15 17 19 21 23 25 27 29
Years From Now
-21%Ages - Investor 1 & 2 52 & 49
Add Principal Pmts (13,425)
Total Cost (44,384)
Rent 33,246
Tax Saving / Extra 1,762
75%
4%
-21%
Rent
Tax Saving / Extra
Actual Cost / Profit
Actual Cost / Profit (9,377)
Per Week (180)
**Excludes any principal payments.
75%
Actual Cost / Profit
Copyright © 2011 Wealth Planners 71
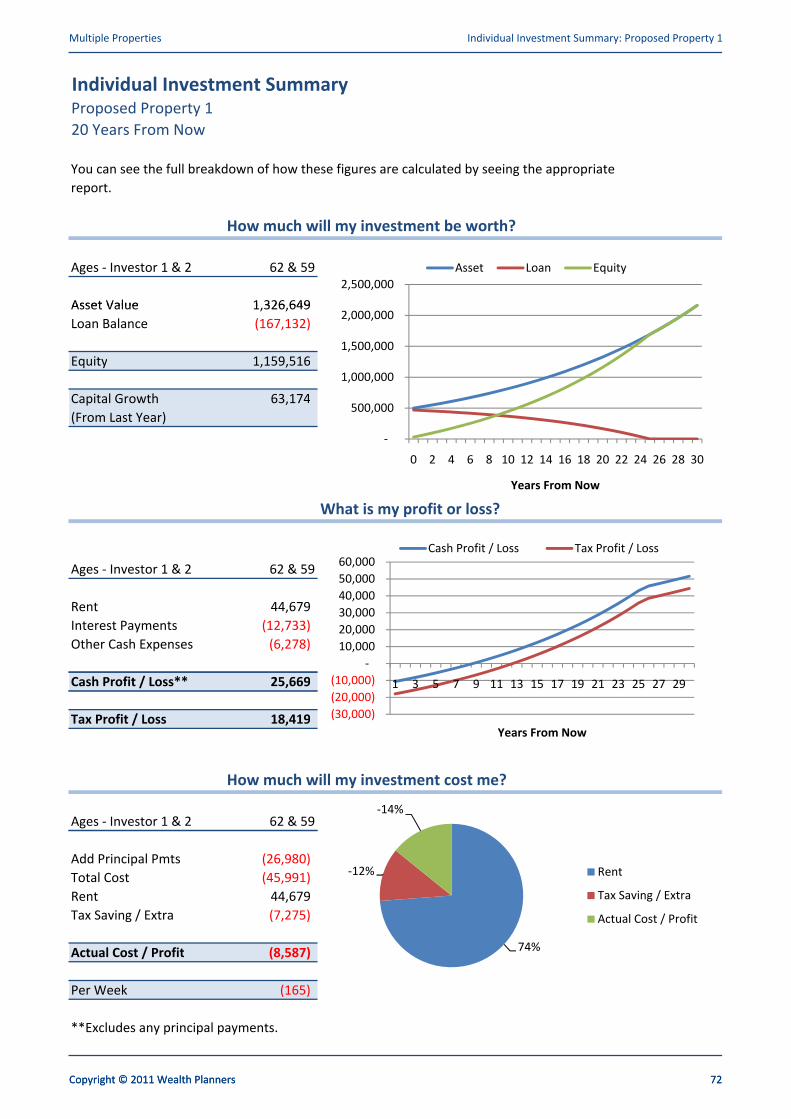
Multiple Properties Individual Investment Summary: Proposed Property 1
Individual Investment SummaryProposed Property 1
20 Years From Now
You can see the full breakdown of how these figures are calculated by seeing the appropriate
report.
Copyright © 2011 Wealth Planners 72
How much will my investment be worth?
Ages - Investor 1 & 2 62 & 59
Asset Value 1,326,649
You can see the full breakdown of how these figures are calculated by seeing the appropriate
report.
2,000,000
2,500,000
Asset Loan Equity
Asset Value 1,326,649
Loan Balance (167,132)
Equity 1,159,516
Capital Growth 63,174
(From Last Year)
-
500,000
1,000,000
1,500,000
2,000,000
2,500,000
Asset Loan Equity
What is my profit or loss?
-
500,000
0 2 4 6 8 10 12 14 16 18 20 22 24 26 28 30
Years From Now
50,000
60,000 Cash Profit / Loss Tax Profit / Loss
Ages - Investor 1 & 2 62 & 59
Rent 44,679
Interest Payments (12,733)
Other Cash Expenses (6,278)
Cash Profit / Loss** 25,669 (20,000)
(10,000)
-
10,000
20,000
30,000
40,000
50,000
60,000
1 3 5 7 9 11 13 15 17 19 21 23 25 27 29
Cash Profit / Loss Tax Profit / Loss
Cash Profit / Loss** 25,669
Tax Profit / Loss 18,419
How much will my investment cost me?
Ages - Investor 1 & 2 62 & 59
(30,000)
(20,000)
(10,000)
-
10,000
1 3 5 7 9 11 13 15 17 19 21 23 25 27 29
Years From Now
-14%Ages - Investor 1 & 2 62 & 59
Add Principal Pmts (26,980)
Total Cost (45,991)
Rent 44,679
Tax Saving / Extra (7,275)
74%
-12%
-14%
Rent
Tax Saving / Extra
Actual Cost / Profit
Actual Cost / Profit (8,587)
Per Week (165)
**Excludes any principal payments.
74%
Actual Cost / Profit
Copyright © 2011 Wealth Planners 72
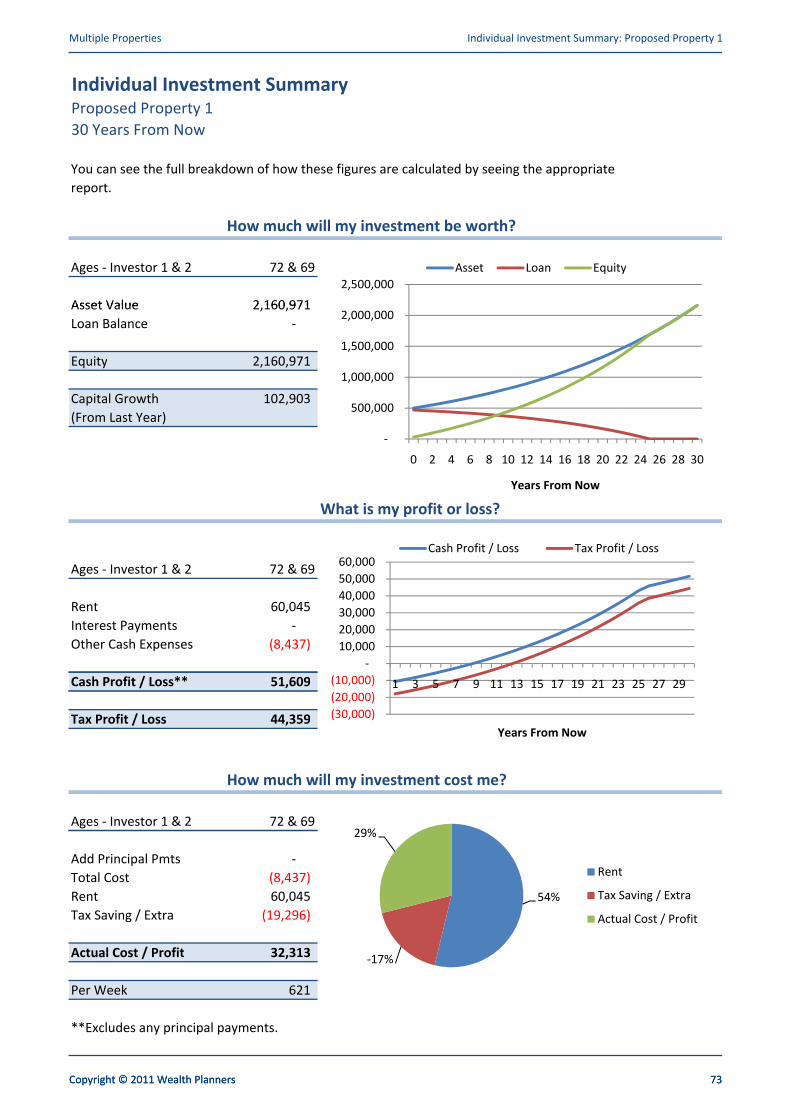
Multiple Properties Individual Investment Summary: Proposed Property 1
Individual Investment SummaryProposed Property 1
30 Years From Now
You can see the full breakdown of how these figures are calculated by seeing the appropriate
report.
Copyright © 2011 Wealth Planners 73
How much will my investment be worth?
Ages - Investor 1 & 2 72 & 69
Asset Value 2,160,971
You can see the full breakdown of how these figures are calculated by seeing the appropriate
report.
2,000,000
2,500,000
Asset Loan Equity
Asset Value 2,160,971
Loan Balance -
Equity 2,160,971
Capital Growth 102,903
(From Last Year)
-
500,000
1,000,000
1,500,000
2,000,000
2,500,000
Asset Loan Equity
What is my profit or loss?
-
500,000
0 2 4 6 8 10 12 14 16 18 20 22 24 26 28 30
Years From Now
50,000
60,000 Cash Profit / Loss Tax Profit / Loss
Ages - Investor 1 & 2 72 & 69
Rent 60,045
Interest Payments -
Other Cash Expenses (8,437)
Cash Profit / Loss** 51,609 (20,000)
(10,000)
-
10,000
20,000
30,000
40,000
50,000
60,000
1 3 5 7 9 11 13 15 17 19 21 23 25 27 29
Cash Profit / Loss Tax Profit / Loss
Cash Profit / Loss** 51,609
Tax Profit / Loss 44,359
How much will my investment cost me?
Ages - Investor 1 & 2 72 & 69
(30,000)
(20,000)
(10,000)
-
10,000
1 3 5 7 9 11 13 15 17 19 21 23 25 27 29
Years From Now
29%Ages - Investor 1 & 2 72 & 69
Add Principal Pmts -
Total Cost (8,437)
Rent 60,045
Tax Saving / Extra (19,296)
54%
29%
Rent
Tax Saving / Extra
Actual Cost / Profit
Actual Cost / Profit 32,313
Per Week 621
**Excludes any principal payments.
54%
-17%
Actual Cost / Profit
Copyright © 2011 Wealth Planners 73

Multiple Properties Profit / Loss: Proposed Property 1
Profit / LossProposed Property 1
Years From Now 1 2 3 4
George's Age 43 44 45 46George's Age 43 44 45 46
Jane's Age 40 41 42 43
Rental Income 25,480 26,244 27,032 27,843
Cash Expenses
Interest Payments (32,550) (32,032) (31,477) (30,881)Interest Payments (32,550) (32,032) (31,477) (30,881)
Accounting (500) (515) (530) (546)
Agent's Commission - - - -
Body Corporate Fees / Strata (1,000) (1,030) (1,061) (1,093)
Council Rates (1,500) (1,545) (1,591) (1,639)
Repairs and Maintenance - - - -
Water Charges & Electricity (500) (515) (530) (546)
Borrowing Expenses* (80) (82) (85) (87)Borrowing Expenses* (80) (82) (85) (87)
Insurance - - - -
Land Tax - - - -
Other Ongoing Deductible Expenses - - - -
Total Cash Expenses (36,130) (35,719) (35,275) (34,793)
Net Cash Profit / Loss (10,650) (9,475) (8,243) (6,951)
Principal Payments (7,163) (7,681) (8,236) (8,832)
Net Cash Profit / Loss Incl. Principal (17,813) (17,156) (16,479) (15,782)
Add Non-Cash Elements
Borrowing Costs** (50) (50) (50) (50)
Depreciation (Construction) (6,250) (6,250) (6,250) (6,250)Depreciation (Construction) (6,250) (6,250) (6,250) (6,250)
Depreciation (Fit-Out) (1,000) (1,000) (1,000) (1,000)
Add Back Principal (Non-Deductible) 7,163 7,681 8,236 8,832
Total Taxable Expenses (43,430) (43,019) (42,575) (42,093)
- - - -
Net Taxable Profit / Loss (17,950) (16,775) (15,543) (14,251)
*Borrowing Expenses include are account fees
deductible each year.**Borrowing Costs are from setting up the loan
initially. These are only deductible over the first 5
years.
Copyright © 2011 Wealth Planners 74
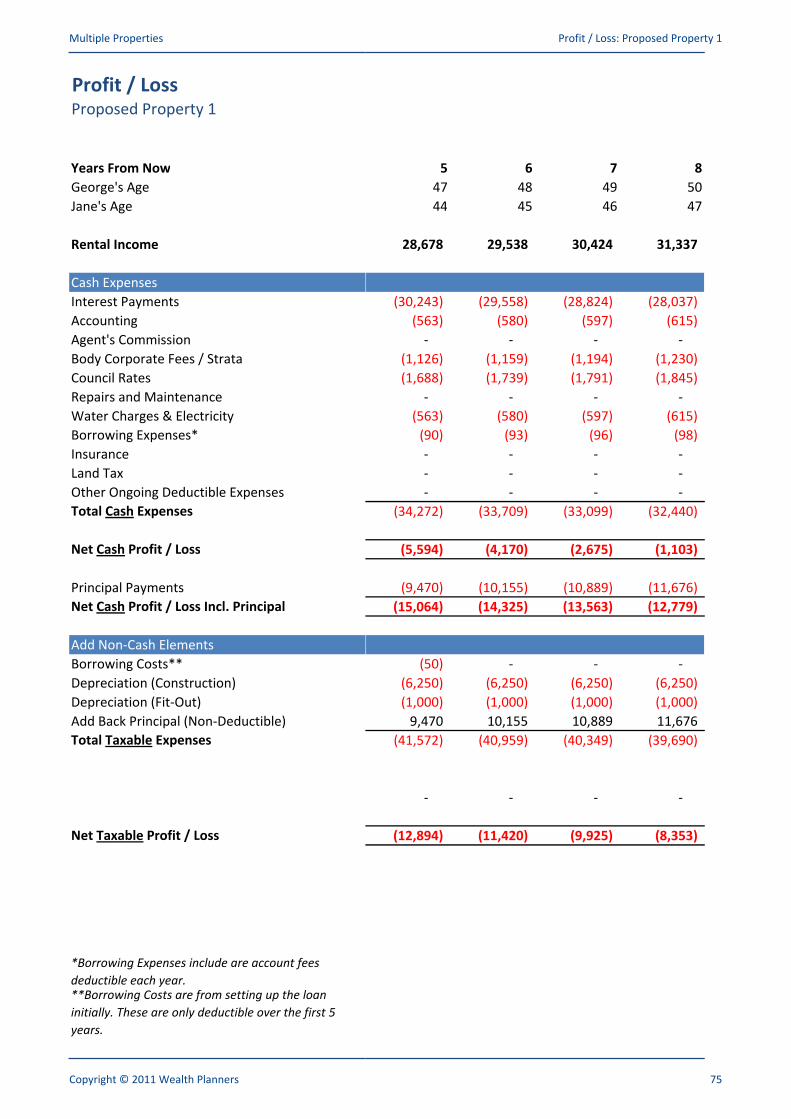
Multiple Properties Profit / Loss: Proposed Property 1
Profit / LossProposed Property 1
Years From Now
George's Age
5 6 7 8
47 48 49 50George's Age
Jane's Age
Rental Income
Cash Expenses
Interest Payments
47 48 49 50
44 45 46 47
28,678 29,538 30,424 31,337
(30,243) (29,558) (28,824) (28,037)Interest Payments
Accounting
Agent's Commission
Body Corporate Fees / Strata
Council Rates
Repairs and Maintenance
Water Charges & Electricity
Borrowing Expenses*
(30,243) (29,558) (28,824) (28,037)
(563) (580) (597) (615)
- - - -
(1,126) (1,159) (1,194) (1,230)
(1,688) (1,739) (1,791) (1,845)
- - - -
(563) (580) (597) (615)
(90) (93) (96) (98)Borrowing Expenses*
Insurance
Land Tax
Other Ongoing Deductible Expenses
Total Cash Expenses
Net Cash Profit / Loss
(90) (93) (96) (98)
- - - -
- - - -
- - - -
(34,272) (33,709) (33,099) (32,440)
(5,594) (4,170) (2,675) (1,103)
Principal Payments
Net Cash Profit / Loss Incl. Principal
Add Non-Cash Elements
Borrowing Costs**
Depreciation (Construction)
(9,470) (10,155) (10,889) (11,676)
(15,064) (14,325) (13,563) (12,779)
(50) - - -
(6,250) (6,250) (6,250) (6,250)Depreciation (Construction)
Depreciation (Fit-Out)
Add Back Principal (Non-Deductible)
Total Taxable Expenses
(6,250) (6,250) (6,250) (6,250)
(1,000) (1,000) (1,000) (1,000)
9,470 10,155 10,889 11,676
(41,572) (40,959) (40,349) (39,690)
- - - -
Net Taxable Profit / Loss (12,894) (11,420) (9,925) (8,353)
*Borrowing Expenses include are account fees
deductible each year.**Borrowing Costs are from setting up the loan
initially. These are only deductible over the first 5
years.
Copyright © 2011 Wealth Planners 75
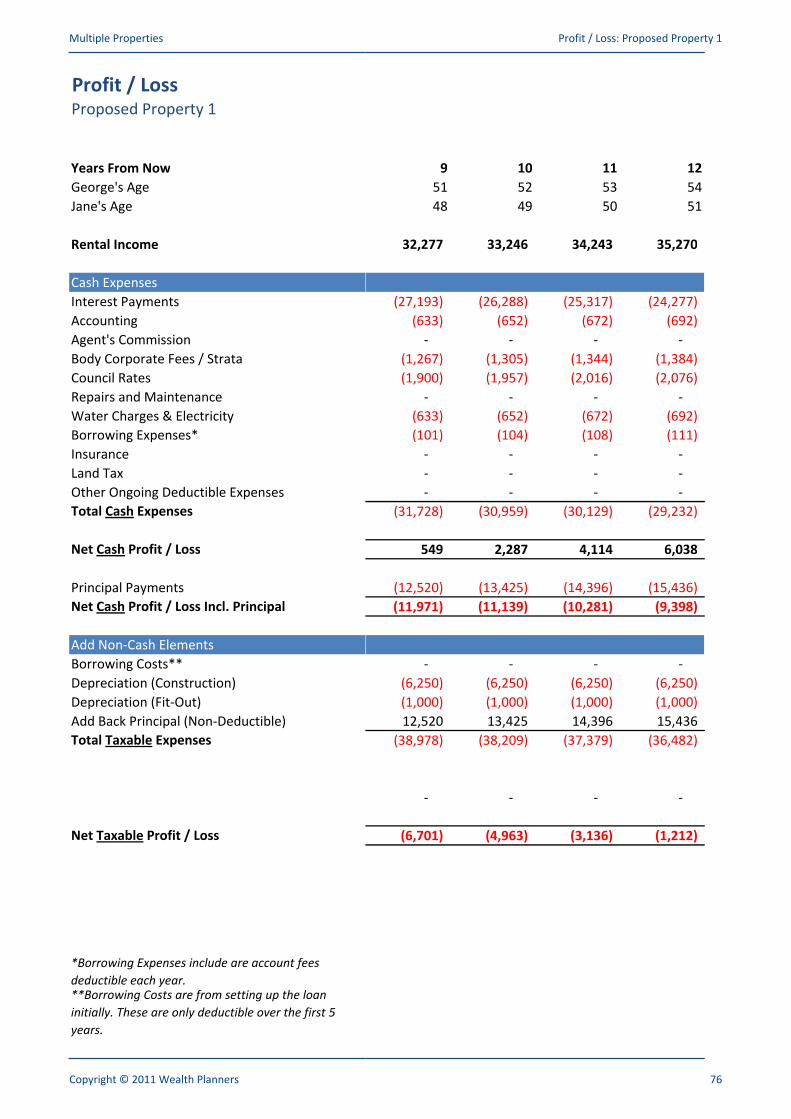
Multiple Properties Profit / Loss: Proposed Property 1
Profit / LossProposed Property 1
Years From Now
George's Age
9 10 11 12
51 52 53 54George's Age
Jane's Age
Rental Income
Cash Expenses
Interest Payments
51 52 53 54
48 49 50 51
32,277 33,246 34,243 35,270
(27,193) (26,288) (25,317) (24,277)Interest Payments
Accounting
Agent's Commission
Body Corporate Fees / Strata
Council Rates
Repairs and Maintenance
Water Charges & Electricity
Borrowing Expenses*
(27,193) (26,288) (25,317) (24,277)
(633) (652) (672) (692)
- - - -
(1,267) (1,305) (1,344) (1,384)
(1,900) (1,957) (2,016) (2,076)
- - - -
(633) (652) (672) (692)
(101) (104) (108) (111)Borrowing Expenses*
Insurance
Land Tax
Other Ongoing Deductible Expenses
Total Cash Expenses
Net Cash Profit / Loss
(101) (104) (108) (111)
- - - -
- - - -
- - - -
(31,728) (30,959) (30,129) (29,232)
549 2,287 4,114 6,038
Principal Payments
Net Cash Profit / Loss Incl. Principal
Add Non-Cash Elements
Borrowing Costs**
Depreciation (Construction)
(12,520) (13,425) (14,396) (15,436)
(11,971) (11,139) (10,281) (9,398)
- - - -
(6,250) (6,250) (6,250) (6,250)Depreciation (Construction)
Depreciation (Fit-Out)
Add Back Principal (Non-Deductible)
Total Taxable Expenses
(6,250) (6,250) (6,250) (6,250)
(1,000) (1,000) (1,000) (1,000)
12,520 13,425 14,396 15,436
(38,978) (38,209) (37,379) (36,482)
- - - -
Net Taxable Profit / Loss (6,701) (4,963) (3,136) (1,212)
*Borrowing Expenses include are account fees
deductible each year.**Borrowing Costs are from setting up the loan
initially. These are only deductible over the first 5
years.
Copyright © 2011 Wealth Planners 76

Multiple Properties Profit / Loss: Proposed Property 1
Profit / LossProposed Property 1
Years From Now
George's Age
13 14 15 16
55 56 57 58George's Age
Jane's Age
Rental Income
Cash Expenses
Interest Payments
55 56 57 58
52 53 54 55
36,328 37,418 38,541 39,697
(23,161) (21,964) (20,681) (19,306)Interest Payments
Accounting
Agent's Commission
Body Corporate Fees / Strata
Council Rates
Repairs and Maintenance
Water Charges & Electricity
Borrowing Expenses*
(23,161) (21,964) (20,681) (19,306)
(713) (734) (756) (779)
- - - -
(1,426) (1,469) (1,513) (1,558)
(2,139) (2,203) (2,269) (2,337)
- - - -
(713) (734) (756) (779)
(114) (117) (121) (125)Borrowing Expenses*
Insurance
Land Tax
Other Ongoing Deductible Expenses
Total Cash Expenses
Net Cash Profit / Loss
(114) (117) (121) (125)
- - - -
- - - -
- - - -
(28,265) (27,222) (26,096) (24,883)
8,063 10,197 12,444 14,814
Principal Payments
Net Cash Profit / Loss Incl. Principal
Add Non-Cash Elements
Borrowing Costs**
Depreciation (Construction)
(16,552) (17,749) (19,032) (20,408)
(8,489) (7,552) (6,587) (5,594)
- - - -
(6,250) (6,250) (6,250) (6,250)Depreciation (Construction)
Depreciation (Fit-Out)
Add Back Principal (Non-Deductible)
Total Taxable Expenses
(6,250) (6,250) (6,250) (6,250)
(1,000) (1,000) (1,000) (1,000)
16,552 17,749 19,032 20,408
(35,515) (34,472) (33,346) (32,133)
- - - -
Net Taxable Profit / Loss 813 2,947 5,194 7,564
*Borrowing Expenses include are account fees
deductible each year.**Borrowing Costs are from setting up the loan
initially. These are only deductible over the first 5
years.
Copyright © 2011 Wealth Planners 77

Multiple Properties Profit / Loss: Proposed Property 1
Profit / LossProposed Property 1
Years From Now
George's Age
17 18 19 20
59 60 61 62George's Age
Jane's Age
Rental Income
Cash Expenses
Interest Payments
59 60 61 62
56 57 58 59
40,888 42,115 43,378 44,679
(17,830) (16,248) (14,552) (12,733)Interest Payments
Accounting
Agent's Commission
Body Corporate Fees / Strata
Council Rates
Repairs and Maintenance
Water Charges & Electricity
Borrowing Expenses*
(17,830) (16,248) (14,552) (12,733)
(802) (826) (851) (877)
- - - -
(1,605) (1,653) (1,702) (1,754)
(2,407) (2,479) (2,554) (2,630)
- - - -
(802) (826) (851) (877)
(128) (132) (136) (140)Borrowing Expenses*
Insurance
Land Tax
Other Ongoing Deductible Expenses
Total Cash Expenses
Net Cash Profit / Loss
(128) (132) (136) (140)
- - - -
- - - -
- - - -
(23,575) (22,166) (20,647) (19,011)
17,313 19,949 22,731 25,669
Principal Payments
Net Cash Profit / Loss Incl. Principal
Add Non-Cash Elements
Borrowing Costs**
Depreciation (Construction)
(21,883) (23,465) (25,161) (26,980)
(4,570) (3,516) (2,430) (1,311)
- - - -
(6,250) (6,250) (6,250) (6,250)Depreciation (Construction)
Depreciation (Fit-Out)
Add Back Principal (Non-Deductible)
Total Taxable Expenses
(6,250) (6,250) (6,250) (6,250)
(1,000) (1,000) (1,000) (1,000)
21,883 23,465 25,161 26,980
(30,825) (29,416) (27,897) (26,261)
- - - -
Net Taxable Profit / Loss 10,063 12,699 15,481 18,419
*Borrowing Expenses include are account fees
deductible each year.**Borrowing Costs are from setting up the loan
initially. These are only deductible over the first 5
years.
Copyright © 2011 Wealth Planners 78
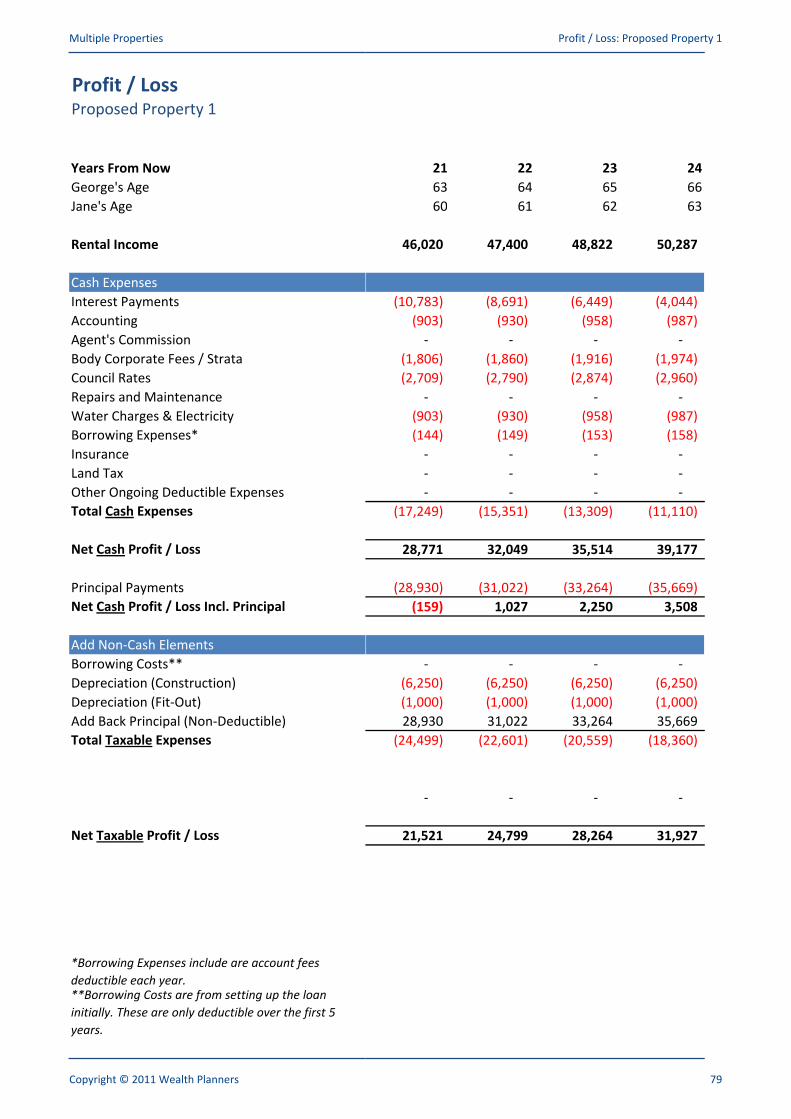
Multiple Properties Profit / Loss: Proposed Property 1
Profit / LossProposed Property 1
Years From Now
George's Age
21 22 23 24
63 64 65 66George's Age
Jane's Age
Rental Income
Cash Expenses
Interest Payments
63 64 65 66
60 61 62 63
46,020 47,400 48,822 50,287
(10,783) (8,691) (6,449) (4,044)Interest Payments
Accounting
Agent's Commission
Body Corporate Fees / Strata
Council Rates
Repairs and Maintenance
Water Charges & Electricity
Borrowing Expenses*
(10,783) (8,691) (6,449) (4,044)
(903) (930) (958) (987)
- - - -
(1,806) (1,860) (1,916) (1,974)
(2,709) (2,790) (2,874) (2,960)
- - - -
(903) (930) (958) (987)
(144) (149) (153) (158)Borrowing Expenses*
Insurance
Land Tax
Other Ongoing Deductible Expenses
Total Cash Expenses
Net Cash Profit / Loss
(144) (149) (153) (158)
- - - -
- - - -
- - - -
(17,249) (15,351) (13,309) (11,110)
28,771 32,049 35,514 39,177
Principal Payments
Net Cash Profit / Loss Incl. Principal
Add Non-Cash Elements
Borrowing Costs**
Depreciation (Construction)
(28,930) (31,022) (33,264) (35,669)
(159) 1,027 2,250 3,508
- - - -
(6,250) (6,250) (6,250) (6,250)Depreciation (Construction)
Depreciation (Fit-Out)
Add Back Principal (Non-Deductible)
Total Taxable Expenses
(6,250) (6,250) (6,250) (6,250)
(1,000) (1,000) (1,000) (1,000)
28,930 31,022 33,264 35,669
(24,499) (22,601) (20,559) (18,360)
- - - -
Net Taxable Profit / Loss 21,521 24,799 28,264 31,927
*Borrowing Expenses include are account fees
deductible each year.**Borrowing Costs are from setting up the loan
initially. These are only deductible over the first 5
years.
Copyright © 2011 Wealth Planners 79
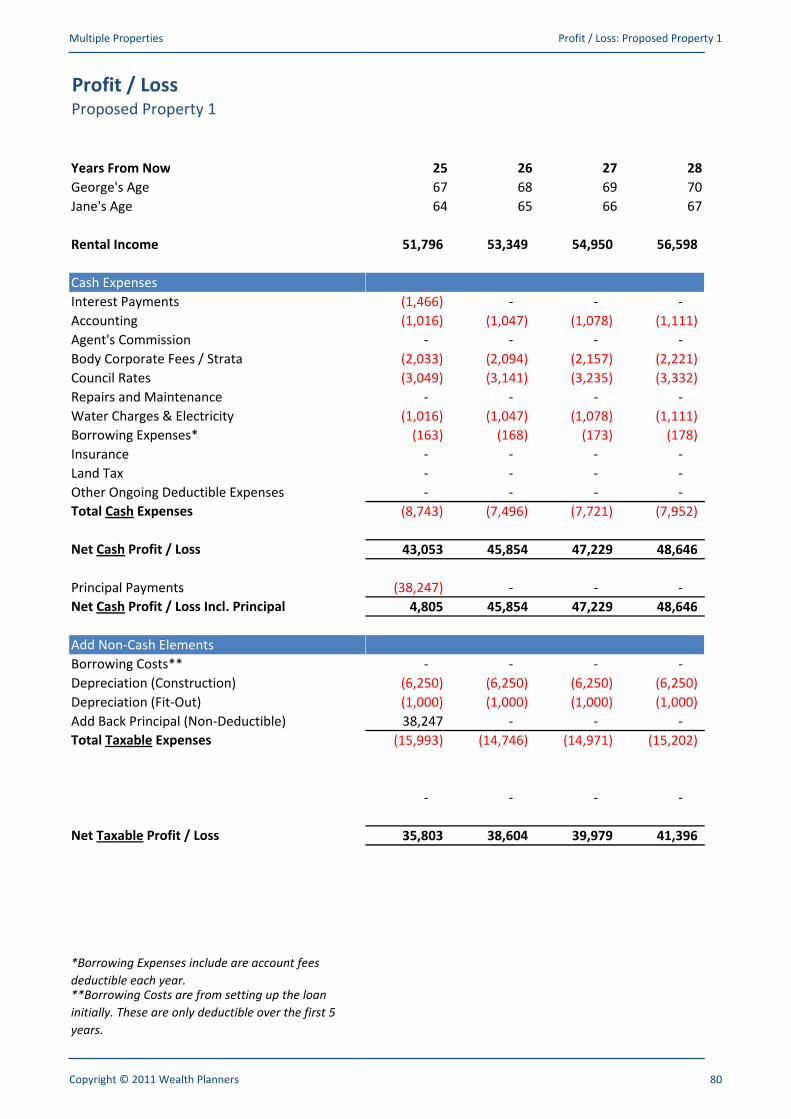
Multiple Properties Profit / Loss: Proposed Property 1
Profit / LossProposed Property 1
Years From Now
George's Age
25 26 27 28
67 68 69 70George's Age
Jane's Age
Rental Income
Cash Expenses
Interest Payments
67 68 69 70
64 65 66 67
51,796 53,349 54,950 56,598
(1,466) - - - Interest Payments
Accounting
Agent's Commission
Body Corporate Fees / Strata
Council Rates
Repairs and Maintenance
Water Charges & Electricity
Borrowing Expenses*
(1,466) - - -
(1,016) (1,047) (1,078) (1,111)
- - - -
(2,033) (2,094) (2,157) (2,221)
(3,049) (3,141) (3,235) (3,332)
- - - -
(1,016) (1,047) (1,078) (1,111)
(163) (168) (173) (178)Borrowing Expenses*
Insurance
Land Tax
Other Ongoing Deductible Expenses
Total Cash Expenses
Net Cash Profit / Loss
(163) (168) (173) (178)
- - - -
- - - -
- - - -
(8,743) (7,496) (7,721) (7,952)
43,053 45,854 47,229 48,646
Principal Payments
Net Cash Profit / Loss Incl. Principal
Add Non-Cash Elements
Borrowing Costs**
Depreciation (Construction)
(38,247) - - -
4,805 45,854 47,229 48,646
- - - -
(6,250) (6,250) (6,250) (6,250)Depreciation (Construction)
Depreciation (Fit-Out)
Add Back Principal (Non-Deductible)
Total Taxable Expenses
(6,250) (6,250) (6,250) (6,250)
(1,000) (1,000) (1,000) (1,000)
38,247 - - -
(15,993) (14,746) (14,971) (15,202)
- - - -
Net Taxable Profit / Loss 35,803 38,604 39,979 41,396
*Borrowing Expenses include are account fees
deductible each year.**Borrowing Costs are from setting up the loan
initially. These are only deductible over the first 5
years.
Copyright © 2011 Wealth Planners 80
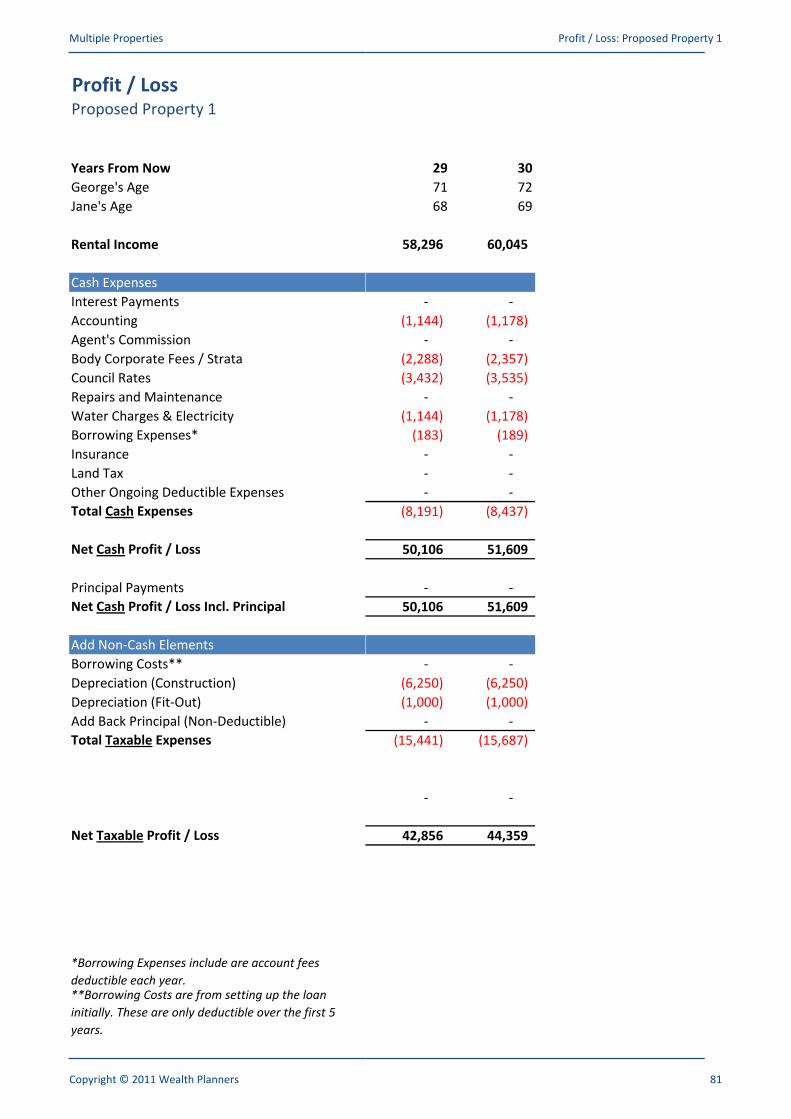
Multiple Properties Profit / Loss: Proposed Property 1
Profit / LossProposed Property 1
Years From Now
George's Age
29 30
71 72George's Age
Jane's Age
Rental Income
Cash Expenses
Interest Payments
71 72
68 69
58,296 60,045
- - Interest Payments
Accounting
Agent's Commission
Body Corporate Fees / Strata
Council Rates
Repairs and Maintenance
Water Charges & Electricity
Borrowing Expenses*
- -
(1,144) (1,178)
- -
(2,288) (2,357)
(3,432) (3,535)
- -
(1,144) (1,178)
(183) (189)Borrowing Expenses*
Insurance
Land Tax
Other Ongoing Deductible Expenses
Total Cash Expenses
Net Cash Profit / Loss
(183) (189)
- -
- -
- -
(8,191) (8,437)
50,106 51,609
Principal Payments
Net Cash Profit / Loss Incl. Principal
Add Non-Cash Elements
Borrowing Costs**
Depreciation (Construction)
- -
50,106 51,609
- -
(6,250) (6,250)Depreciation (Construction)
Depreciation (Fit-Out)
Add Back Principal (Non-Deductible)
Total Taxable Expenses
(6,250) (6,250)
(1,000) (1,000)
- -
(15,441) (15,687)
- -
Net Taxable Profit / Loss 42,856 44,359
*Borrowing Expenses include are account fees
deductible each year.**Borrowing Costs are from setting up the loan
initially. These are only deductible over the first 5
years.
Copyright © 2011 Wealth Planners 81
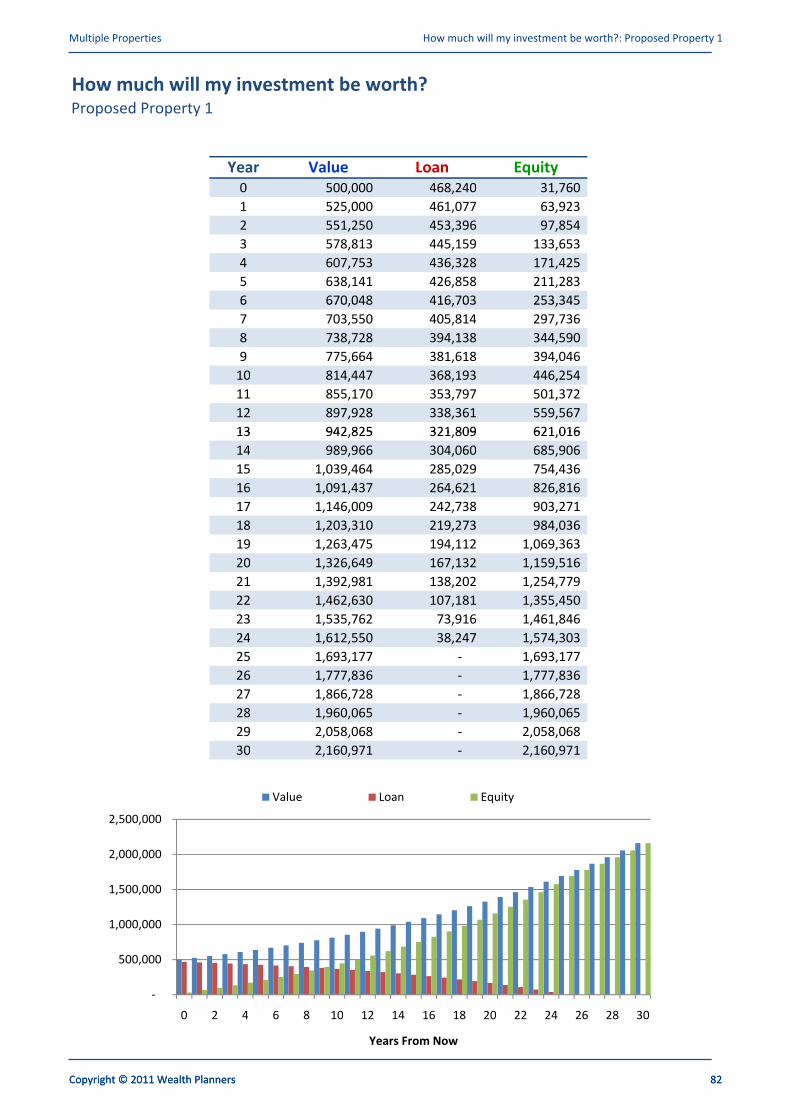
Multiple Properties How much will my investment be worth?: Proposed Property 1
How much will my investment be worth?Proposed Property 1
Year Value Loan Equity
0 500,000 468,240 31,760
Copyright © 2011 Wealth Planners 82
0 500,000 468,240 31,760
1 525,000 461,077 63,923
2 551,250 453,396 97,854
3 578,813 445,159 133,653
4 607,753 436,328 171,425
5 638,141 426,858 211,283
6 670,048 416,703 253,345 6 670,048 416,703 253,345
7 703,550 405,814 297,736
8 738,728 394,138 344,590
9 775,664 381,618 394,046
10 814,447 368,193 446,254
11 855,170 353,797 501,372
12 897,928 338,361 559,567
13 942,825 321,809 621,016 13 942,825 321,809 621,016
14 989,966 304,060 685,906
15 1,039,464 285,029 754,436
16 1,091,437 264,621 826,816
17 1,146,009 242,738 903,271
18 1,203,310 219,273 984,036
19 1,263,475 194,112 1,069,363
20 1,326,649 167,132 1,159,516 20 1,326,649 167,132 1,159,516
21 1,392,981 138,202 1,254,779
22 1,462,630 107,181 1,355,450
23 1,535,762 73,916 1,461,846
24 1,612,550 38,247 1,574,303
25 1,693,177 - 1,693,177
26 1,777,836 - 1,777,836
27 1,866,728 - 1,866,728
26 1,777,836 - 1,777,836
27 1,866,728 - 1,866,728
28 1,960,065 - 1,960,065
29 2,058,068 - 2,058,068
30 2,160,971 - 2,160,971
2,500,000
Value Loan Equity
1,000,000
1,500,000
2,000,000
2,500,000
Value Loan Equity
-
500,000
1,000,000
0 2 4 6 8 10 12 14 16 18 20 22 24 26 28 30
Years From Now
Copyright © 2011 Wealth Planners 82

Multiple Properties How much will it cost me?: Proposed Property 1
How much will it cost me?Proposed Property 1
1 Year From Now
This page shows you how much the investment will actually cost you or how much profit you will make
Copyright © 2011 Wealth Planners 83
George Jane Total
Proposed Property 1 Ownership 50% 50% 100%
Without Proposed Property 1 George Jane Total
This page shows you how much the investment will actually cost you or how much profit you will make
when the tax saving or extra tax payable due to the investment is taken into account.
Without Proposed Property 1 George Jane Total
Salary Less Salary Sacrifice 100,000 80,000 180,000
Bonus 10,000 5,000 15,000
Interest Earned On Savings 1,125 1,125 2,250
Taxable Profit / Loss On Other Properties (5,804) - (5,804)
Shares / Managed Funds Profit / Loss - - -
Taxable Income 105,321 86,125 191,446
Tax Payable (25,339) (18,524) (43,863)
With Proposed Property 1 George Jane Total
Taxable Profit/Loss On Proposed Property 1 (8,975) (8,975) (17,950)
New Taxable Income 96,346 77,150 173,496
New Tax Payable (22,153) (15,538) (37,691)New Tax Payable (22,153) (15,538) (37,691)
Tax Saving (+) / Extra Tax (-) 3,186 2,987 6,173
How Much Proposed Property 1 Costs You Yearly Monthly Weekly
Principal Repayments (7,163) (597) (138)Principal Repayments (7,163) (597) (138)
Interest Repayments (32,550) (2,712) (626)
Other Proposed Property 1 Cash Expenses (3,580) (298) (69)
Total Cost (43,293) (3,608) (833)
How The Costs Will Be Paid Yearly Monthly Weekly
Rent 25,480 2,123 490
Tax Saving (+) / Extra Tax (-) 6,173 514 119 Tax Saving (+) / Extra Tax (-) 6,173 514 119
Out Of Pocket Profit (+) / Cost (-) (11,640) (970) (224)
59%
14%
-27%
Rent
Tax Saving (+) / Extra Tax (-)
Out Of Pocket Profit (+) / Cost (-)59%
14%
Tax Saving (+) / Extra Tax (-)
Out Of Pocket Profit (+) / Cost (-)
Copyright © 2011 Wealth Planners 83
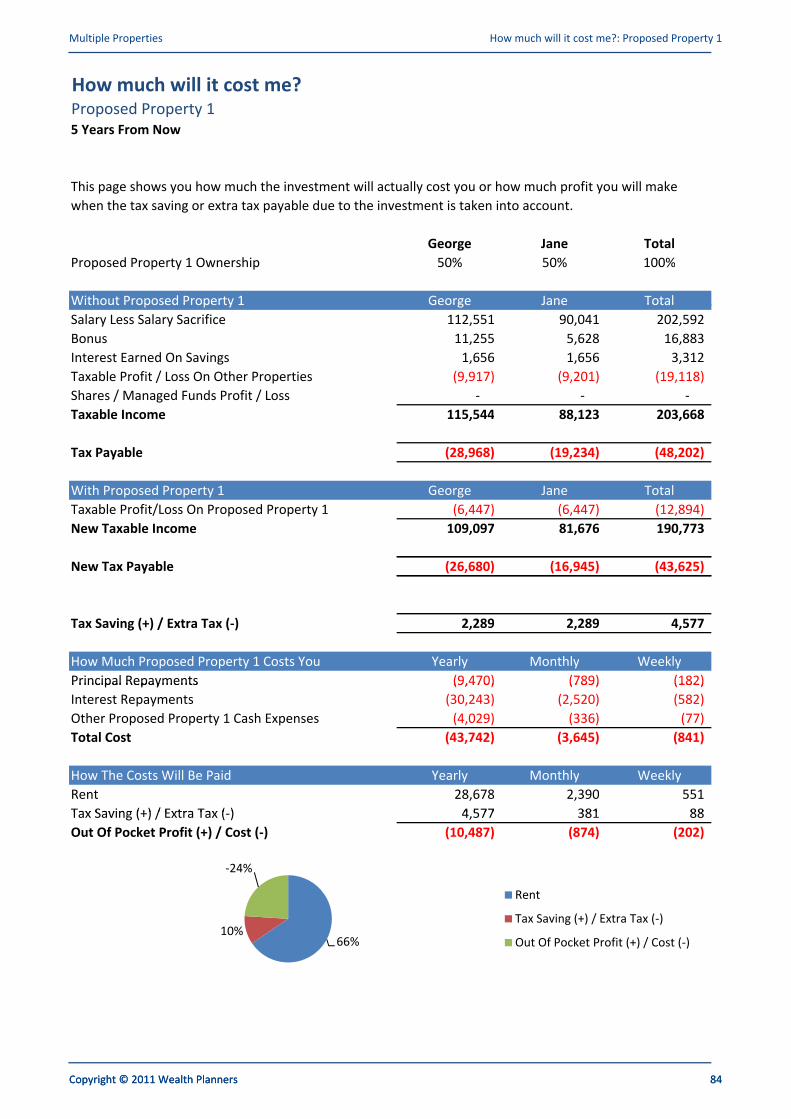
Multiple Properties How much will it cost me?: Proposed Property 1
How much will it cost me?Proposed Property 1
5 Years From Now
This page shows you how much the investment will actually cost you or how much profit you will make
Copyright © 2011 Wealth Planners 84
George Jane Total
Proposed Property 1 Ownership 50% 50% 100%
Without Proposed Property 1 George Jane Total
This page shows you how much the investment will actually cost you or how much profit you will make
when the tax saving or extra tax payable due to the investment is taken into account.
Without Proposed Property 1 George Jane Total
Salary Less Salary Sacrifice 112,551 90,041 202,592
Bonus 11,255 5,628 16,883
Interest Earned On Savings 1,656 1,656 3,312
Taxable Profit / Loss On Other Properties (9,917) (9,201) (19,118)
Shares / Managed Funds Profit / Loss - - -
Taxable Income 115,544 88,123 203,668
Tax Payable (28,968) (19,234) (48,202)
With Proposed Property 1 George Jane Total
Taxable Profit/Loss On Proposed Property 1 (6,447) (6,447) (12,894)
New Taxable Income 109,097 81,676 190,773
New Tax Payable (26,680) (16,945) (43,625)New Tax Payable (26,680) (16,945) (43,625)
Tax Saving (+) / Extra Tax (-) 2,289 2,289 4,577
How Much Proposed Property 1 Costs You Yearly Monthly Weekly
Principal Repayments (9,470) (789) (182)Principal Repayments (9,470) (789) (182)
Interest Repayments (30,243) (2,520) (582)
Other Proposed Property 1 Cash Expenses (4,029) (336) (77)
Total Cost (43,742) (3,645) (841)
How The Costs Will Be Paid Yearly Monthly Weekly
Rent 28,678 2,390 551
Tax Saving (+) / Extra Tax (-) 4,577 381 88 Tax Saving (+) / Extra Tax (-) 4,577 381 88
Out Of Pocket Profit (+) / Cost (-) (10,487) (874) (202)
66%10%
-24%
Rent
Tax Saving (+) / Extra Tax (-)
Out Of Pocket Profit (+) / Cost (-)66%10%
Tax Saving (+) / Extra Tax (-)
Out Of Pocket Profit (+) / Cost (-)
Copyright © 2011 Wealth Planners 84

Multiple Properties How much will it cost me?: Proposed Property 1
How much will it cost me?Proposed Property 1
10 Years From Now
This page shows you how much the investment will actually cost you or how much profit you will make
Copyright © 2011 Wealth Planners 85
George Jane Total
Proposed Property 1 Ownership 50% 50% 100%
Without Proposed Property 1 George Jane Total
This page shows you how much the investment will actually cost you or how much profit you will make
when the tax saving or extra tax payable due to the investment is taken into account.
Without Proposed Property 1 George Jane Total
Salary Less Salary Sacrifice 130,477 104,382 234,859
Bonus 13,048 6,524 19,572
Interest Earned On Savings 4,188 4,188 8,376
Taxable Profit / Loss On Other Properties 1,653 (5,554) (3,901)
Shares / Managed Funds Profit / Loss - - -
Taxable Income 149,366 109,540 258,906
Tax Payable (40,975) (26,837) (67,811)
With Proposed Property 1 George Jane Total
Taxable Profit/Loss On Proposed Property 1 (2,482) (2,482) (4,963)
New Taxable Income 146,884 107,058 253,942
New Tax Payable (40,094) (25,956) (66,049)New Tax Payable (40,094) (25,956) (66,049)
Tax Saving (+) / Extra Tax (-) 881 881 1,762
How Much Proposed Property 1 Costs You Yearly Monthly Weekly
Principal Repayments (13,425) (1,119) (258)Principal Repayments (13,425) (1,119) (258)
Interest Repayments (26,288) (2,191) (506)
Other Proposed Property 1 Cash Expenses (4,671) (389) (90)
Total Cost (44,384) (3,699) (854)
How The Costs Will Be Paid Yearly Monthly Weekly
Rent 33,246 2,770 639
Tax Saving (+) / Extra Tax (-) 1,762 147 34 Tax Saving (+) / Extra Tax (-) 1,762 147 34
Out Of Pocket Profit (+) / Cost (-) (9,377) (781) (180)
75%
4%
-21%
Rent
Tax Saving (+) / Extra Tax (-)
Out Of Pocket Profit (+) / Cost (-)75%
4% Tax Saving (+) / Extra Tax (-)
Out Of Pocket Profit (+) / Cost (-)
Copyright © 2011 Wealth Planners 85
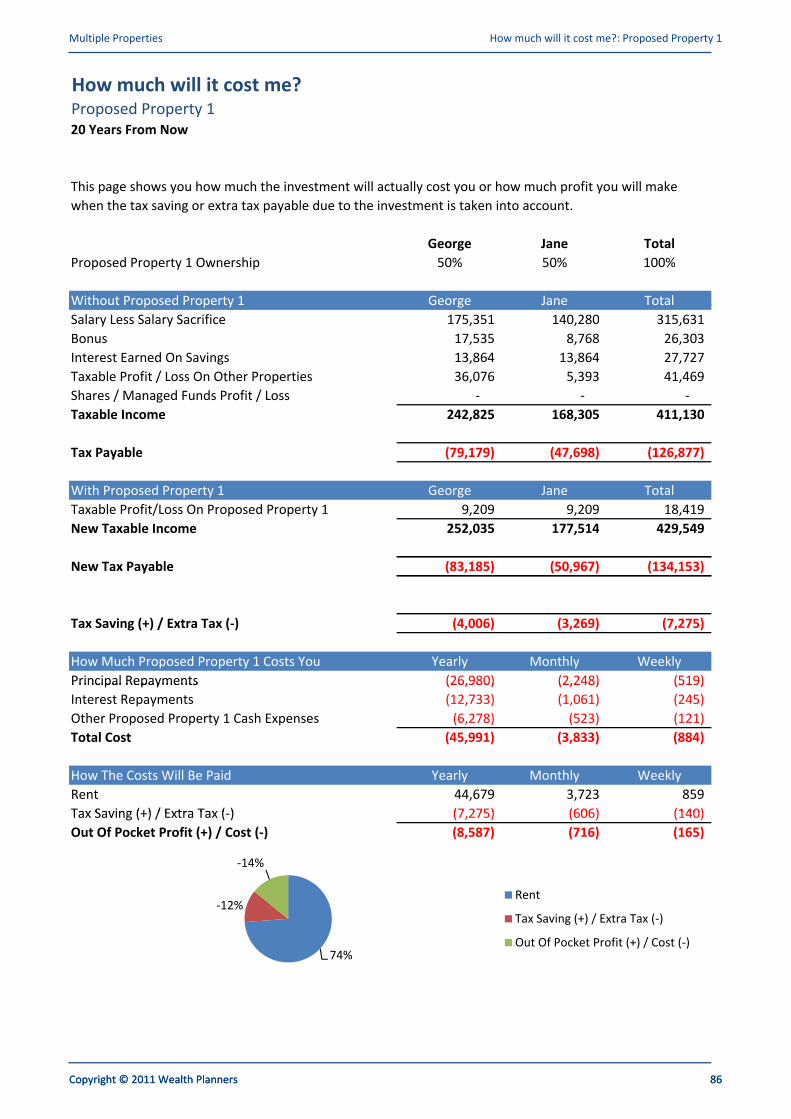
Multiple Properties How much will it cost me?: Proposed Property 1
How much will it cost me?Proposed Property 1
20 Years From Now
This page shows you how much the investment will actually cost you or how much profit you will make
Copyright © 2011 Wealth Planners 86
George Jane Total
Proposed Property 1 Ownership 50% 50% 100%
Without Proposed Property 1 George Jane Total
This page shows you how much the investment will actually cost you or how much profit you will make
when the tax saving or extra tax payable due to the investment is taken into account.
Without Proposed Property 1 George Jane Total
Salary Less Salary Sacrifice 175,351 140,280 315,631
Bonus 17,535 8,768 26,303
Interest Earned On Savings 13,864 13,864 27,727
Taxable Profit / Loss On Other Properties 36,076 5,393 41,469
Shares / Managed Funds Profit / Loss - - -
Taxable Income 242,825 168,305 411,130
Tax Payable (79,179) (47,698) (126,877)
With Proposed Property 1 George Jane Total
Taxable Profit/Loss On Proposed Property 1 9,209 9,209 18,419
New Taxable Income 252,035 177,514 429,549
New Tax Payable (83,185) (50,967) (134,153)New Tax Payable (83,185) (50,967) (134,153)
Tax Saving (+) / Extra Tax (-) (4,006) (3,269) (7,275)
How Much Proposed Property 1 Costs You Yearly Monthly Weekly
Principal Repayments (26,980) (2,248) (519)Principal Repayments (26,980) (2,248) (519)
Interest Repayments (12,733) (1,061) (245)
Other Proposed Property 1 Cash Expenses (6,278) (523) (121)
Total Cost (45,991) (3,833) (884)
How The Costs Will Be Paid Yearly Monthly Weekly
Rent 44,679 3,723 859
Tax Saving (+) / Extra Tax (-) (7,275) (606) (140)Tax Saving (+) / Extra Tax (-) (7,275) (606) (140)
Out Of Pocket Profit (+) / Cost (-) (8,587) (716) (165)
74%
-12%
-14%
Rent
Tax Saving (+) / Extra Tax (-)
Out Of Pocket Profit (+) / Cost (-)74%
Tax Saving (+) / Extra Tax (-)
Out Of Pocket Profit (+) / Cost (-)
Copyright © 2011 Wealth Planners 86
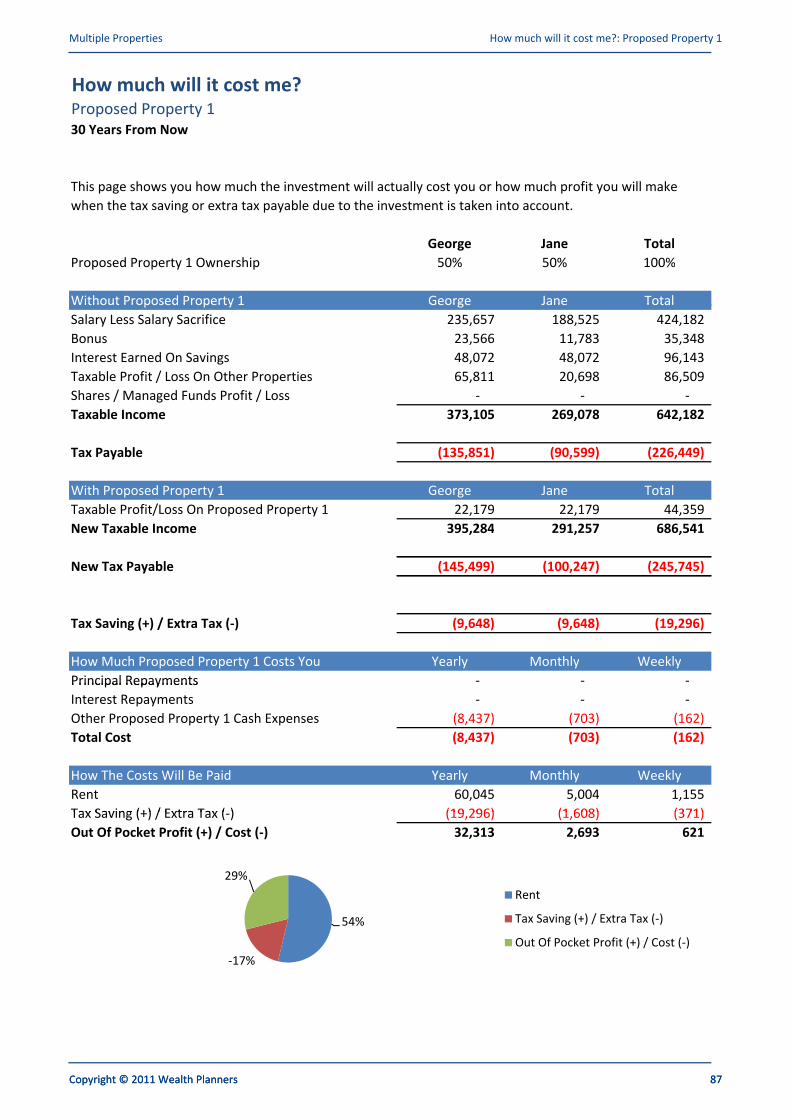
Multiple Properties How much will it cost me?: Proposed Property 1
How much will it cost me?Proposed Property 1
30 Years From Now
This page shows you how much the investment will actually cost you or how much profit you will make
Copyright © 2011 Wealth Planners 87
George Jane Total
Proposed Property 1 Ownership 50% 50% 100%
Without Proposed Property 1 George Jane Total
This page shows you how much the investment will actually cost you or how much profit you will make
when the tax saving or extra tax payable due to the investment is taken into account.
Without Proposed Property 1 George Jane Total
Salary Less Salary Sacrifice 235,657 188,525 424,182
Bonus 23,566 11,783 35,348
Interest Earned On Savings 48,072 48,072 96,143
Taxable Profit / Loss On Other Properties 65,811 20,698 86,509
Shares / Managed Funds Profit / Loss - - -
Taxable Income 373,105 269,078 642,182
Tax Payable (135,851) (90,599) (226,449)
With Proposed Property 1 George Jane Total
Taxable Profit/Loss On Proposed Property 1 22,179 22,179 44,359
New Taxable Income 395,284 291,257 686,541
New Tax Payable (145,499) (100,247) (245,745)New Tax Payable (145,499) (100,247) (245,745)
Tax Saving (+) / Extra Tax (-) (9,648) (9,648) (19,296)
How Much Proposed Property 1 Costs You Yearly Monthly Weekly
Principal Repayments - - - Principal Repayments - - -
Interest Repayments - - -
Other Proposed Property 1 Cash Expenses (8,437) (703) (162)
Total Cost (8,437) (703) (162)
How The Costs Will Be Paid Yearly Monthly Weekly
Rent 60,045 5,004 1,155
Tax Saving (+) / Extra Tax (-) (19,296) (1,608) (371)Tax Saving (+) / Extra Tax (-) (19,296) (1,608) (371)
Out Of Pocket Profit (+) / Cost (-) 32,313 2,693 621
54%
-17%
29%
Rent
Tax Saving (+) / Extra Tax (-)
Out Of Pocket Profit (+) / Cost (-)
54%
-17%
Tax Saving (+) / Extra Tax (-)
Out Of Pocket Profit (+) / Cost (-)
Copyright © 2011 Wealth Planners 87

Multiple Properties Individual Investment Summary: Proposed Property 2
Individual Investment SummaryProposed Property 2
1 Year From Now
You can see the full breakdown of how these figures are calculated by seeing the appropriate
report.
Copyright © 2011 Wealth Planners 88
How much will my investment be worth?
Ages - Investor 1 & 2 43 & 40
Asset Value -
You can see the full breakdown of how these figures are calculated by seeing the appropriate
report.
2,000,000
2,500,000
Asset Loan Equity
Asset Value -
Loan Balance -
Equity -
Capital Growth -
(From Last Year)
-
500,000
1,000,000
1,500,000
2,000,000
2,500,000
Asset Loan Equity
What is my profit or loss?
-
500,000
0 2 4 6 8 10 12 14 16 18 20 22 24 26 28 30
Years From Now
50,000
60,000 Cash Profit / Loss Tax Profit / Loss
Ages - Investor 1 & 2 43 & 40
Rent -
Interest Payments -
Other Cash Expenses -
Cash Profit / Loss** - (20,000)
(10,000)
-
10,000
20,000
30,000
40,000
50,000
60,000
1 3 5 7 9 11 13 15 17 19 21 23 25 27 29
Cash Profit / Loss Tax Profit / Loss
Cash Profit / Loss** -
Tax Profit / Loss -
How much will my investment cost me?
Ages - Investor 1 & 2 43 & 40
(30,000)
(20,000)
(10,000)
-
10,000
1 3 5 7 9 11 13 15 17 19 21 23 25 27 29
Years From Now
0%0%0%Ages - Investor 1 & 2 43 & 40
Add Principal Pmts -
Total Cost -
Rent -
Tax Saving / Extra -
0%0%0%
Rent
Tax Saving / Extra
Actual Cost / Profit
Actual Cost / Profit -
Per Week -
**Excludes any principal payments.
Actual Cost / Profit
Copyright © 2011 Wealth Planners 88
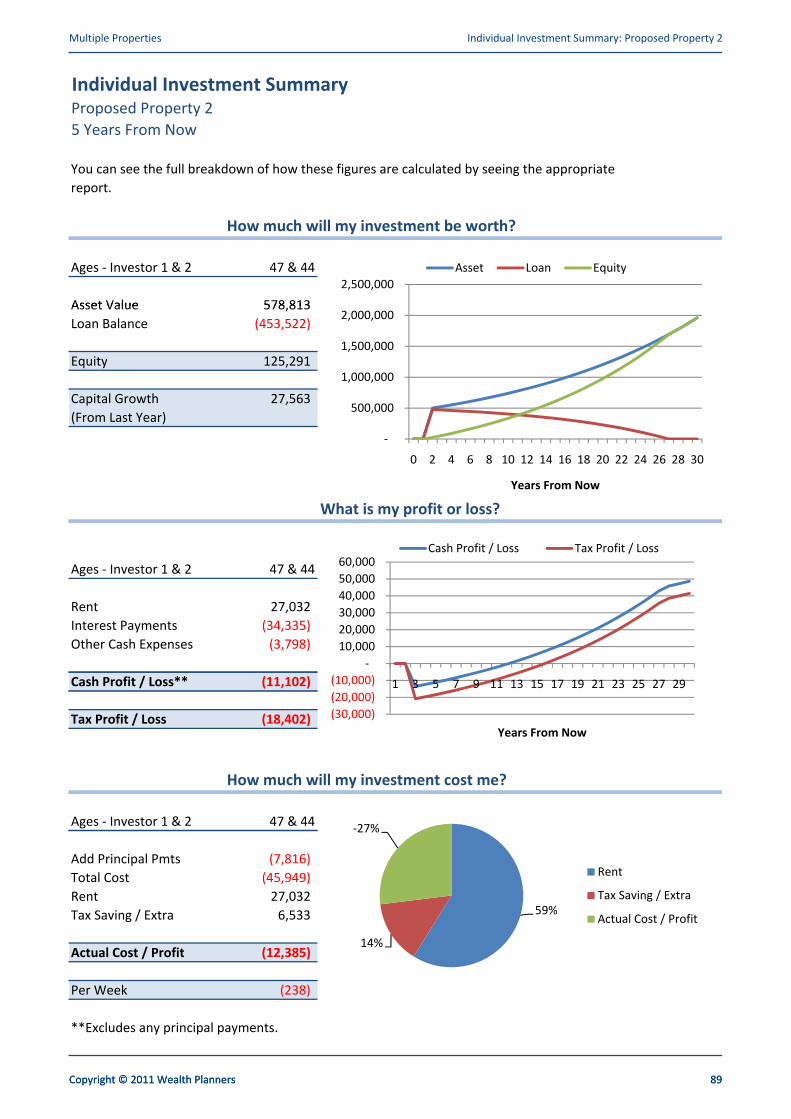
Multiple Properties Individual Investment Summary: Proposed Property 2
Individual Investment SummaryProposed Property 2
5 Years From Now
You can see the full breakdown of how these figures are calculated by seeing the appropriate
report.
Copyright © 2011 Wealth Planners 89
How much will my investment be worth?
Ages - Investor 1 & 2 47 & 44
Asset Value 578,813
You can see the full breakdown of how these figures are calculated by seeing the appropriate
report.
2,000,000
2,500,000
Asset Loan Equity
Asset Value 578,813
Loan Balance (453,522)
Equity 125,291
Capital Growth 27,563
(From Last Year)
-
500,000
1,000,000
1,500,000
2,000,000
2,500,000
Asset Loan Equity
What is my profit or loss?
-
500,000
0 2 4 6 8 10 12 14 16 18 20 22 24 26 28 30
Years From Now
50,000
60,000 Cash Profit / Loss Tax Profit / Loss
Ages - Investor 1 & 2 47 & 44
Rent 27,032
Interest Payments (34,335)
Other Cash Expenses (3,798)
Cash Profit / Loss** (11,102)(20,000)
(10,000)
-
10,000
20,000
30,000
40,000
50,000
60,000
1 3 5 7 9 11 13 15 17 19 21 23 25 27 29
Cash Profit / Loss Tax Profit / Loss
Cash Profit / Loss** (11,102)
Tax Profit / Loss (18,402)
How much will my investment cost me?
Ages - Investor 1 & 2 47 & 44
(30,000)
(20,000)
(10,000)
-
10,000
1 3 5 7 9 11 13 15 17 19 21 23 25 27 29
Years From Now
-27%Ages - Investor 1 & 2 47 & 44
Add Principal Pmts (7,816)
Total Cost (45,949)
Rent 27,032
Tax Saving / Extra 6,533 59%
14%
-27%
Rent
Tax Saving / Extra
Actual Cost / Profit
Actual Cost / Profit (12,385)
Per Week (238)
**Excludes any principal payments.
59%
14%
Actual Cost / Profit
Copyright © 2011 Wealth Planners 89

Multiple Properties Individual Investment Summary: Proposed Property 2
Individual Investment SummaryProposed Property 2
10 Years From Now
You can see the full breakdown of how these figures are calculated by seeing the appropriate
report.
Copyright © 2011 Wealth Planners 90
How much will my investment be worth?
Ages - Investor 1 & 2 52 & 49
Asset Value 738,728
You can see the full breakdown of how these figures are calculated by seeing the appropriate
report.
2,000,000
2,500,000
Asset Loan Equity
Asset Value 738,728
Loan Balance (404,344)
Equity 334,384
Capital Growth 35,178
(From Last Year)
-
500,000
1,000,000
1,500,000
2,000,000
2,500,000
Asset Loan Equity
What is my profit or loss?
-
500,000
0 2 4 6 8 10 12 14 16 18 20 22 24 26 28 30
Years From Now
50,000
60,000 Cash Profit / Loss Tax Profit / Loss
Ages - Investor 1 & 2 52 & 49
Rent 31,337
Interest Payments (30,792)
Other Cash Expenses (4,403)
Cash Profit / Loss** (3,858)(20,000)
(10,000)
-
10,000
20,000
30,000
40,000
50,000
60,000
1 3 5 7 9 11 13 15 17 19 21 23 25 27 29
Cash Profit / Loss Tax Profit / Loss
Cash Profit / Loss** (3,858)
Tax Profit / Loss (11,108)
How much will my investment cost me?
Ages - Investor 1 & 2 52 & 49
(30,000)
(20,000)
(10,000)
-
10,000
1 3 5 7 9 11 13 15 17 19 21 23 25 27 29
Years From Now
-24%Ages - Investor 1 & 2 52 & 49
Add Principal Pmts (11,358)
Total Cost (46,554)
Rent 31,337
Tax Saving / Extra 3,943 67%
9%
-24%
Rent
Tax Saving / Extra
Actual Cost / Profit
Actual Cost / Profit (11,273)
Per Week (217)
**Excludes any principal payments.
67%
9% Actual Cost / Profit
Copyright © 2011 Wealth Planners 90

Multiple Properties Individual Investment Summary: Proposed Property 2
Individual Investment SummaryProposed Property 2
20 Years From Now
You can see the full breakdown of how these figures are calculated by seeing the appropriate
report.
Copyright © 2011 Wealth Planners 91
How much will my investment be worth?
Ages - Investor 1 & 2 62 & 59
Asset Value 1,203,310
You can see the full breakdown of how these figures are calculated by seeing the appropriate
report.
2,000,000
2,500,000
Asset Loan Equity
Asset Value 1,203,310
Loan Balance (229,007)
Equity 974,303
Capital Growth 57,300
(From Last Year)
-
500,000
1,000,000
1,500,000
2,000,000
2,500,000
Asset Loan Equity
What is my profit or loss?
-
500,000
0 2 4 6 8 10 12 14 16 18 20 22 24 26 28 30
Years From Now
50,000
60,000 Cash Profit / Loss Tax Profit / Loss
Ages - Investor 1 & 2 62 & 59
Rent 42,115
Interest Payments (18,161)
Other Cash Expenses (5,917)
Cash Profit / Loss** 18,036 (20,000)
(10,000)
-
10,000
20,000
30,000
40,000
50,000
60,000
1 3 5 7 9 11 13 15 17 19 21 23 25 27 29
Cash Profit / Loss Tax Profit / Loss
Cash Profit / Loss** 18,036
Tax Profit / Loss 10,786
How much will my investment cost me?
Ages - Investor 1 & 2 62 & 59
(30,000)
(20,000)
(10,000)
-
10,000
1 3 5 7 9 11 13 15 17 19 21 23 25 27 29
Years From Now
-18%Ages - Investor 1 & 2 62 & 59
Add Principal Pmts (23,990)
Total Cost (48,068)
Rent 42,115
Tax Saving / Extra (4,261)
74%
-8%
-18%
Rent
Tax Saving / Extra
Actual Cost / Profit
Actual Cost / Profit (10,214)
Per Week (196)
**Excludes any principal payments.
74%
Actual Cost / Profit
Copyright © 2011 Wealth Planners 91

Multiple Properties Individual Investment Summary: Proposed Property 2
Individual Investment SummaryProposed Property 2
30 Years From Now
You can see the full breakdown of how these figures are calculated by seeing the appropriate
report.
Copyright © 2011 Wealth Planners 92
How much will my investment be worth?
Ages - Investor 1 & 2 72 & 69
Asset Value 1,960,065
You can see the full breakdown of how these figures are calculated by seeing the appropriate
report.
2,000,000
2,500,000
Asset Loan Equity
Asset Value 1,960,065
Loan Balance -
Equity 1,960,065
Capital Growth 93,336
(From Last Year)
-
500,000
1,000,000
1,500,000
2,000,000
2,500,000
Asset Loan Equity
What is my profit or loss?
-
500,000
0 2 4 6 8 10 12 14 16 18 20 22 24 26 28 30
Years From Now
50,000
60,000 Cash Profit / Loss Tax Profit / Loss
Ages - Investor 1 & 2 72 & 69
Rent 56,598
Interest Payments -
Other Cash Expenses (7,952)
Cash Profit / Loss** 48,646 (20,000)
(10,000)
-
10,000
20,000
30,000
40,000
50,000
60,000
1 3 5 7 9 11 13 15 17 19 21 23 25 27 29
Cash Profit / Loss Tax Profit / Loss
Cash Profit / Loss** 48,646
Tax Profit / Loss 41,396
How much will my investment cost me?
Ages - Investor 1 & 2 72 & 69
(30,000)
(20,000)
(10,000)
-
10,000
1 3 5 7 9 11 13 15 17 19 21 23 25 27 29
Years From Now
29%Ages - Investor 1 & 2 72 & 69
Add Principal Pmts -
Total Cost (7,952)
Rent 56,598
Tax Saving / Extra (18,007)
54%
29%
Rent
Tax Saving / Extra
Actual Cost / Profit
Actual Cost / Profit 30,639
Per Week 589
**Excludes any principal payments.
54%
-17%
Actual Cost / Profit
Copyright © 2011 Wealth Planners 92
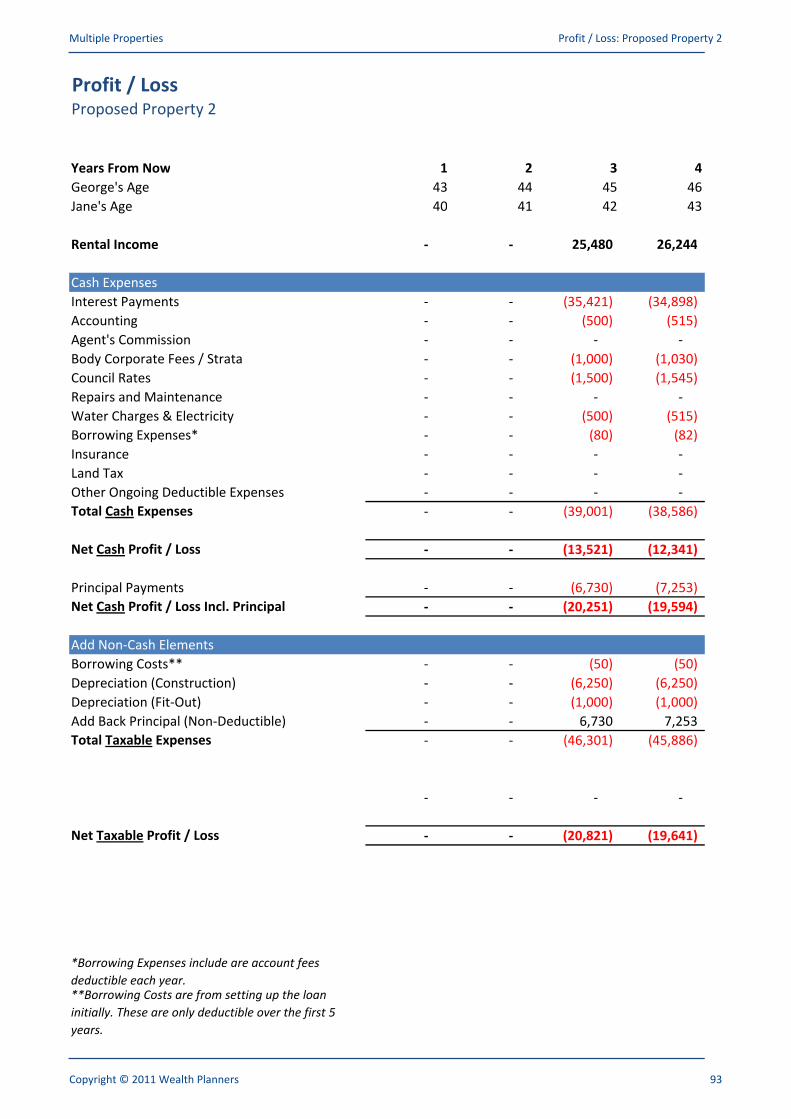
Multiple Properties Profit / Loss: Proposed Property 2
Profit / LossProposed Property 2
Years From Now 1 2 3 4
George's Age 43 44 45 46George's Age 43 44 45 46
Jane's Age 40 41 42 43
Rental Income - - 25,480 26,244
Cash Expenses
Interest Payments - - (35,421) (34,898)Interest Payments - - (35,421) (34,898)
Accounting - - (500) (515)
Agent's Commission - - - -
Body Corporate Fees / Strata - - (1,000) (1,030)
Council Rates - - (1,500) (1,545)
Repairs and Maintenance - - - -
Water Charges & Electricity - - (500) (515)
Borrowing Expenses* - - (80) (82)Borrowing Expenses* - - (80) (82)
Insurance - - - -
Land Tax - - - -
Other Ongoing Deductible Expenses - - - -
Total Cash Expenses - - (39,001) (38,586)
Net Cash Profit / Loss - - (13,521) (12,341)
Principal Payments - - (6,730) (7,253)
Net Cash Profit / Loss Incl. Principal - - (20,251) (19,594)
Add Non-Cash Elements
Borrowing Costs** - - (50) (50)
Depreciation (Construction) - - (6,250) (6,250)Depreciation (Construction) - - (6,250) (6,250)
Depreciation (Fit-Out) - - (1,000) (1,000)
Add Back Principal (Non-Deductible) - - 6,730 7,253
Total Taxable Expenses - - (46,301) (45,886)
- - - -
Net Taxable Profit / Loss - - (20,821) (19,641)
*Borrowing Expenses include are account fees
deductible each year.**Borrowing Costs are from setting up the loan
initially. These are only deductible over the first 5
years.
Copyright © 2011 Wealth Planners 93
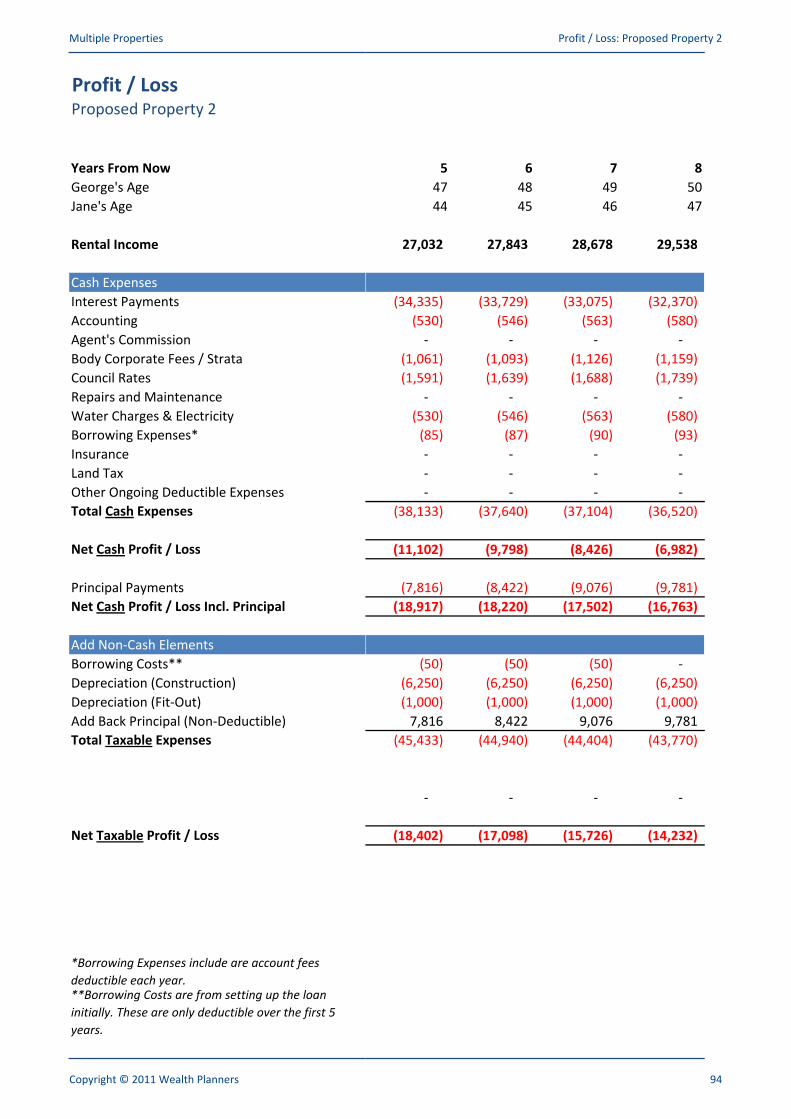
Multiple Properties Profit / Loss: Proposed Property 2
Profit / LossProposed Property 2
Years From Now
George's Age
5 6 7 8
47 48 49 50George's Age
Jane's Age
Rental Income
Cash Expenses
Interest Payments
47 48 49 50
44 45 46 47
27,032 27,843 28,678 29,538
(34,335) (33,729) (33,075) (32,370)Interest Payments
Accounting
Agent's Commission
Body Corporate Fees / Strata
Council Rates
Repairs and Maintenance
Water Charges & Electricity
Borrowing Expenses*
(34,335) (33,729) (33,075) (32,370)
(530) (546) (563) (580)
- - - -
(1,061) (1,093) (1,126) (1,159)
(1,591) (1,639) (1,688) (1,739)
- - - -
(530) (546) (563) (580)
(85) (87) (90) (93)Borrowing Expenses*
Insurance
Land Tax
Other Ongoing Deductible Expenses
Total Cash Expenses
Net Cash Profit / Loss
(85) (87) (90) (93)
- - - -
- - - -
- - - -
(38,133) (37,640) (37,104) (36,520)
(11,102) (9,798) (8,426) (6,982)
Principal Payments
Net Cash Profit / Loss Incl. Principal
Add Non-Cash Elements
Borrowing Costs**
Depreciation (Construction)
(7,816) (8,422) (9,076) (9,781)
(18,917) (18,220) (17,502) (16,763)
(50) (50) (50) -
(6,250) (6,250) (6,250) (6,250)Depreciation (Construction)
Depreciation (Fit-Out)
Add Back Principal (Non-Deductible)
Total Taxable Expenses
(6,250) (6,250) (6,250) (6,250)
(1,000) (1,000) (1,000) (1,000)
7,816 8,422 9,076 9,781
(45,433) (44,940) (44,404) (43,770)
- - - -
Net Taxable Profit / Loss (18,402) (17,098) (15,726) (14,232)
*Borrowing Expenses include are account fees
deductible each year.**Borrowing Costs are from setting up the loan
initially. These are only deductible over the first 5
years.
Copyright © 2011 Wealth Planners 94
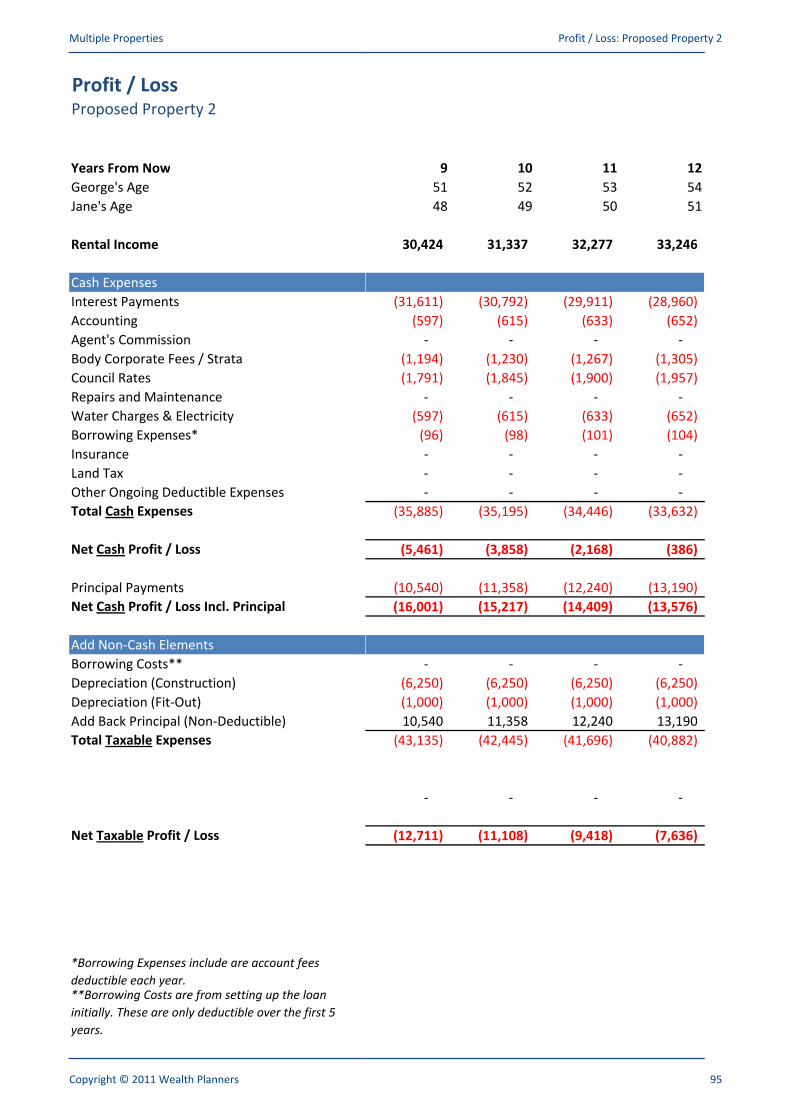
Multiple Properties Profit / Loss: Proposed Property 2
Profit / LossProposed Property 2
Years From Now
George's Age
9 10 11 12
51 52 53 54George's Age
Jane's Age
Rental Income
Cash Expenses
Interest Payments
51 52 53 54
48 49 50 51
30,424 31,337 32,277 33,246
(31,611) (30,792) (29,911) (28,960)Interest Payments
Accounting
Agent's Commission
Body Corporate Fees / Strata
Council Rates
Repairs and Maintenance
Water Charges & Electricity
Borrowing Expenses*
(31,611) (30,792) (29,911) (28,960)
(597) (615) (633) (652)
- - - -
(1,194) (1,230) (1,267) (1,305)
(1,791) (1,845) (1,900) (1,957)
- - - -
(597) (615) (633) (652)
(96) (98) (101) (104)Borrowing Expenses*
Insurance
Land Tax
Other Ongoing Deductible Expenses
Total Cash Expenses
Net Cash Profit / Loss
(96) (98) (101) (104)
- - - -
- - - -
- - - -
(35,885) (35,195) (34,446) (33,632)
(5,461) (3,858) (2,168) (386)
Principal Payments
Net Cash Profit / Loss Incl. Principal
Add Non-Cash Elements
Borrowing Costs**
Depreciation (Construction)
(10,540) (11,358) (12,240) (13,190)
(16,001) (15,217) (14,409) (13,576)
- - - -
(6,250) (6,250) (6,250) (6,250)Depreciation (Construction)
Depreciation (Fit-Out)
Add Back Principal (Non-Deductible)
Total Taxable Expenses
(6,250) (6,250) (6,250) (6,250)
(1,000) (1,000) (1,000) (1,000)
10,540 11,358 12,240 13,190
(43,135) (42,445) (41,696) (40,882)
- - - -
Net Taxable Profit / Loss (12,711) (11,108) (9,418) (7,636)
*Borrowing Expenses include are account fees
deductible each year.**Borrowing Costs are from setting up the loan
initially. These are only deductible over the first 5
years.
Copyright © 2011 Wealth Planners 95
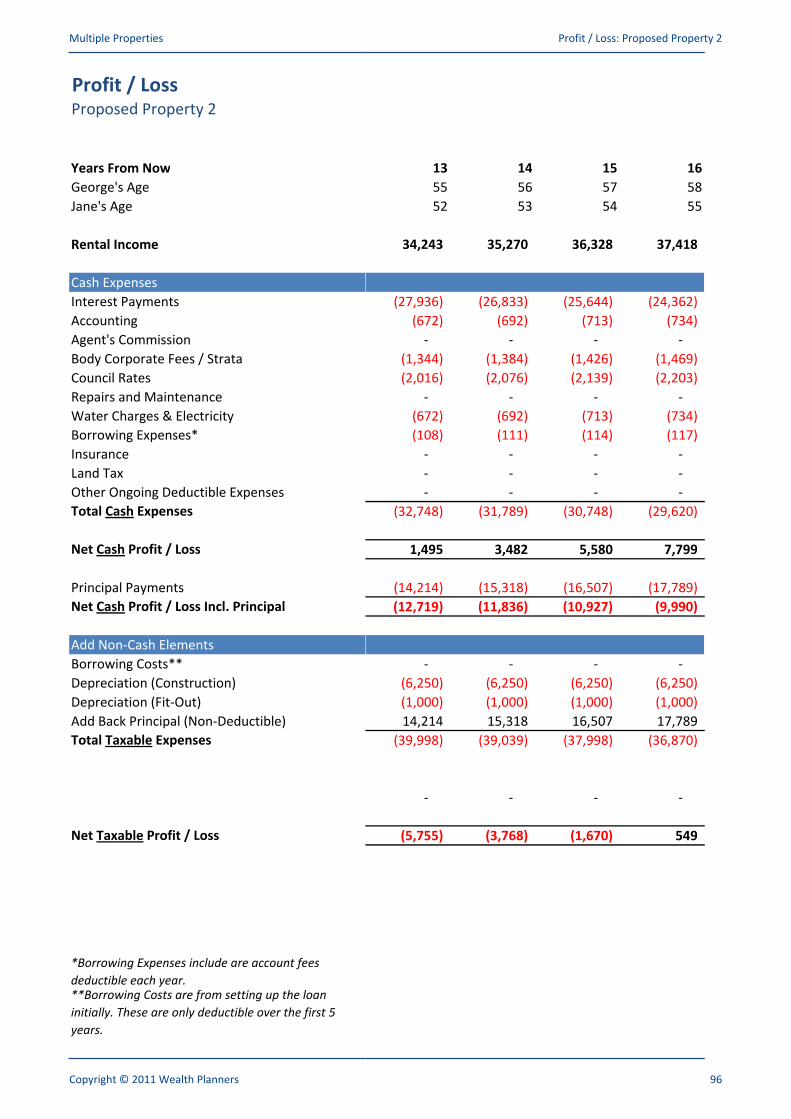
Multiple Properties Profit / Loss: Proposed Property 2
Profit / LossProposed Property 2
Years From Now
George's Age
13 14 15 16
55 56 57 58George's Age
Jane's Age
Rental Income
Cash Expenses
Interest Payments
55 56 57 58
52 53 54 55
34,243 35,270 36,328 37,418
(27,936) (26,833) (25,644) (24,362)Interest Payments
Accounting
Agent's Commission
Body Corporate Fees / Strata
Council Rates
Repairs and Maintenance
Water Charges & Electricity
Borrowing Expenses*
(27,936) (26,833) (25,644) (24,362)
(672) (692) (713) (734)
- - - -
(1,344) (1,384) (1,426) (1,469)
(2,016) (2,076) (2,139) (2,203)
- - - -
(672) (692) (713) (734)
(108) (111) (114) (117)Borrowing Expenses*
Insurance
Land Tax
Other Ongoing Deductible Expenses
Total Cash Expenses
Net Cash Profit / Loss
(108) (111) (114) (117)
- - - -
- - - -
- - - -
(32,748) (31,789) (30,748) (29,620)
1,495 3,482 5,580 7,799
Principal Payments
Net Cash Profit / Loss Incl. Principal
Add Non-Cash Elements
Borrowing Costs**
Depreciation (Construction)
(14,214) (15,318) (16,507) (17,789)
(12,719) (11,836) (10,927) (9,990)
- - - -
(6,250) (6,250) (6,250) (6,250)Depreciation (Construction)
Depreciation (Fit-Out)
Add Back Principal (Non-Deductible)
Total Taxable Expenses
(6,250) (6,250) (6,250) (6,250)
(1,000) (1,000) (1,000) (1,000)
14,214 15,318 16,507 17,789
(39,998) (39,039) (37,998) (36,870)
- - - -
Net Taxable Profit / Loss (5,755) (3,768) (1,670) 549
*Borrowing Expenses include are account fees
deductible each year.**Borrowing Costs are from setting up the loan
initially. These are only deductible over the first 5
years.
Copyright © 2011 Wealth Planners 96
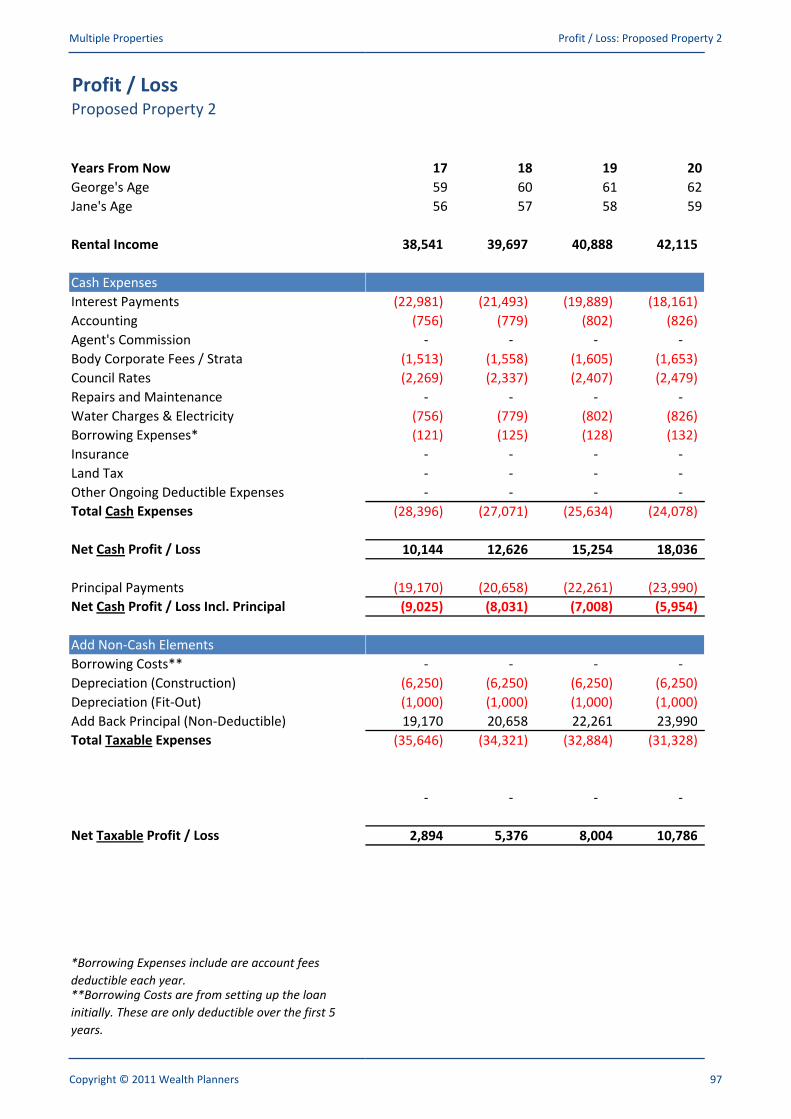
Multiple Properties Profit / Loss: Proposed Property 2
Profit / LossProposed Property 2
Years From Now
George's Age
17 18 19 20
59 60 61 62George's Age
Jane's Age
Rental Income
Cash Expenses
Interest Payments
59 60 61 62
56 57 58 59
38,541 39,697 40,888 42,115
(22,981) (21,493) (19,889) (18,161)Interest Payments
Accounting
Agent's Commission
Body Corporate Fees / Strata
Council Rates
Repairs and Maintenance
Water Charges & Electricity
Borrowing Expenses*
(22,981) (21,493) (19,889) (18,161)
(756) (779) (802) (826)
- - - -
(1,513) (1,558) (1,605) (1,653)
(2,269) (2,337) (2,407) (2,479)
- - - -
(756) (779) (802) (826)
(121) (125) (128) (132)Borrowing Expenses*
Insurance
Land Tax
Other Ongoing Deductible Expenses
Total Cash Expenses
Net Cash Profit / Loss
(121) (125) (128) (132)
- - - -
- - - -
- - - -
(28,396) (27,071) (25,634) (24,078)
10,144 12,626 15,254 18,036
Principal Payments
Net Cash Profit / Loss Incl. Principal
Add Non-Cash Elements
Borrowing Costs**
Depreciation (Construction)
(19,170) (20,658) (22,261) (23,990)
(9,025) (8,031) (7,008) (5,954)
- - - -
(6,250) (6,250) (6,250) (6,250)Depreciation (Construction)
Depreciation (Fit-Out)
Add Back Principal (Non-Deductible)
Total Taxable Expenses
(6,250) (6,250) (6,250) (6,250)
(1,000) (1,000) (1,000) (1,000)
19,170 20,658 22,261 23,990
(35,646) (34,321) (32,884) (31,328)
- - - -
Net Taxable Profit / Loss 2,894 5,376 8,004 10,786
*Borrowing Expenses include are account fees
deductible each year.**Borrowing Costs are from setting up the loan
initially. These are only deductible over the first 5
years.
Copyright © 2011 Wealth Planners 97
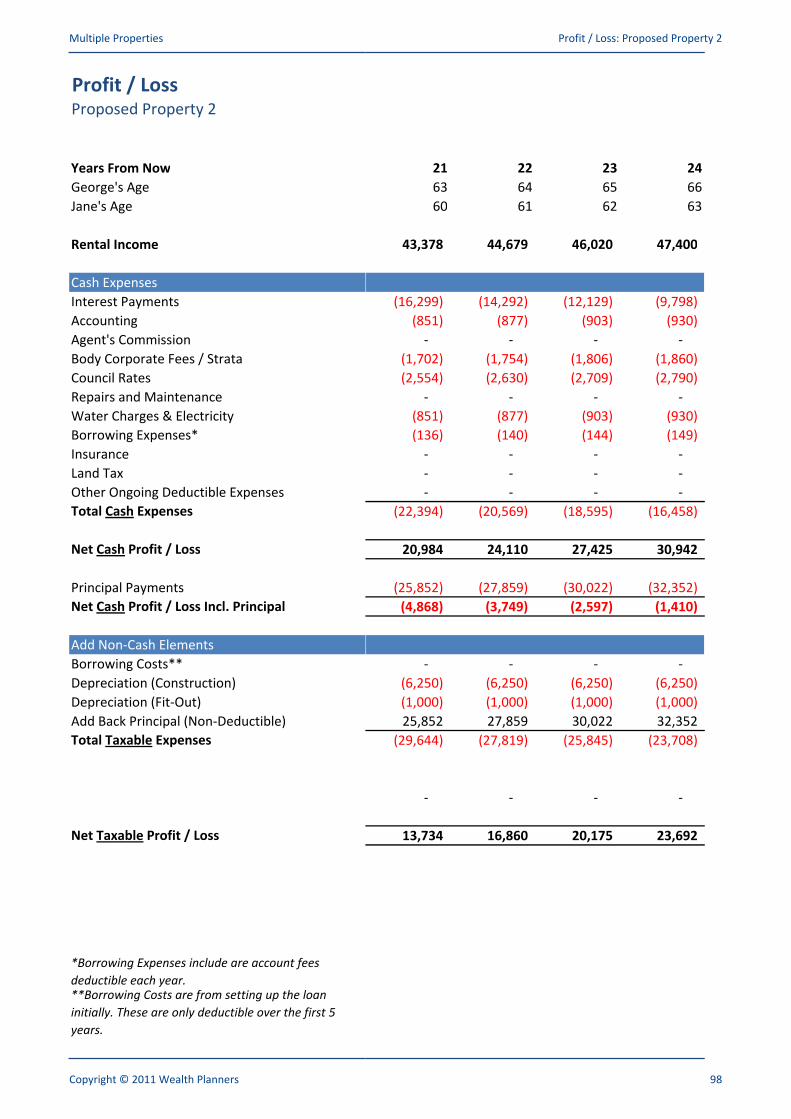
Multiple Properties Profit / Loss: Proposed Property 2
Profit / LossProposed Property 2
Years From Now
George's Age
21 22 23 24
63 64 65 66George's Age
Jane's Age
Rental Income
Cash Expenses
Interest Payments
63 64 65 66
60 61 62 63
43,378 44,679 46,020 47,400
(16,299) (14,292) (12,129) (9,798)Interest Payments
Accounting
Agent's Commission
Body Corporate Fees / Strata
Council Rates
Repairs and Maintenance
Water Charges & Electricity
Borrowing Expenses*
(16,299) (14,292) (12,129) (9,798)
(851) (877) (903) (930)
- - - -
(1,702) (1,754) (1,806) (1,860)
(2,554) (2,630) (2,709) (2,790)
- - - -
(851) (877) (903) (930)
(136) (140) (144) (149)Borrowing Expenses*
Insurance
Land Tax
Other Ongoing Deductible Expenses
Total Cash Expenses
Net Cash Profit / Loss
(136) (140) (144) (149)
- - - -
- - - -
- - - -
(22,394) (20,569) (18,595) (16,458)
20,984 24,110 27,425 30,942
Principal Payments
Net Cash Profit / Loss Incl. Principal
Add Non-Cash Elements
Borrowing Costs**
Depreciation (Construction)
(25,852) (27,859) (30,022) (32,352)
(4,868) (3,749) (2,597) (1,410)
- - - -
(6,250) (6,250) (6,250) (6,250)Depreciation (Construction)
Depreciation (Fit-Out)
Add Back Principal (Non-Deductible)
Total Taxable Expenses
(6,250) (6,250) (6,250) (6,250)
(1,000) (1,000) (1,000) (1,000)
25,852 27,859 30,022 32,352
(29,644) (27,819) (25,845) (23,708)
- - - -
Net Taxable Profit / Loss 13,734 16,860 20,175 23,692
*Borrowing Expenses include are account fees
deductible each year.**Borrowing Costs are from setting up the loan
initially. These are only deductible over the first 5
years.
Copyright © 2011 Wealth Planners 98
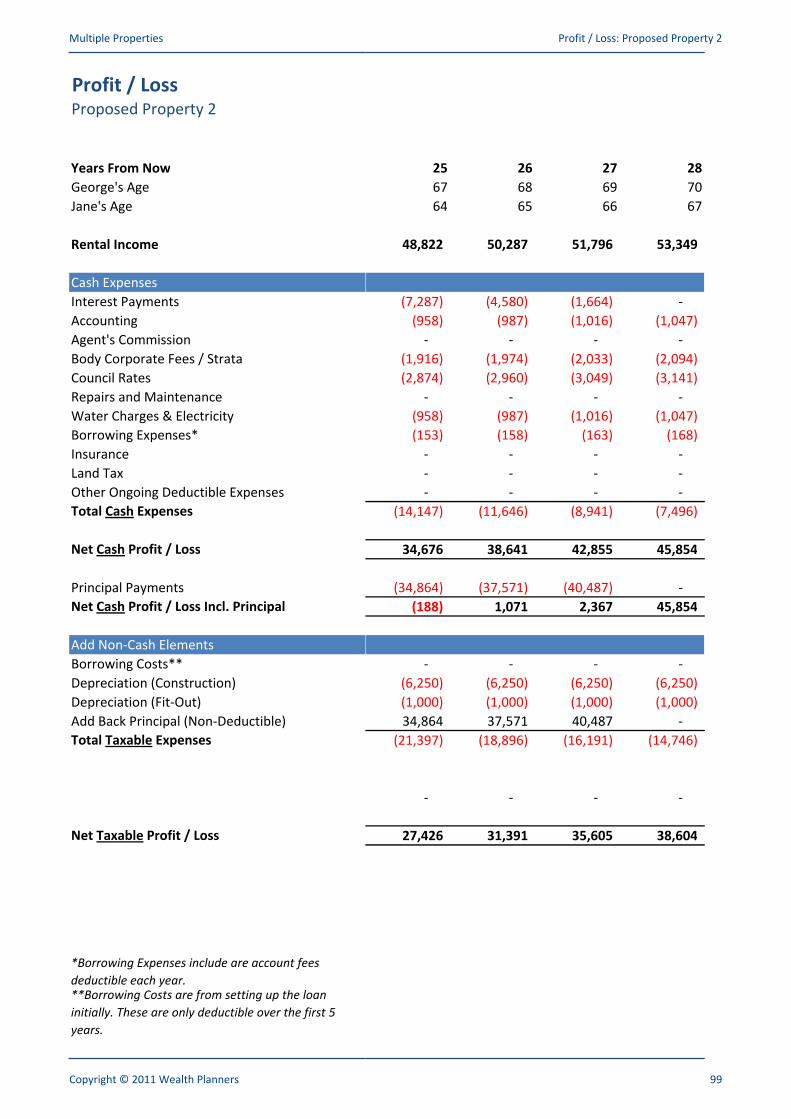
Multiple Properties Profit / Loss: Proposed Property 2
Profit / LossProposed Property 2
Years From Now
George's Age
25 26 27 28
67 68 69 70George's Age
Jane's Age
Rental Income
Cash Expenses
Interest Payments
67 68 69 70
64 65 66 67
48,822 50,287 51,796 53,349
(7,287) (4,580) (1,664) - Interest Payments
Accounting
Agent's Commission
Body Corporate Fees / Strata
Council Rates
Repairs and Maintenance
Water Charges & Electricity
Borrowing Expenses*
(7,287) (4,580) (1,664) -
(958) (987) (1,016) (1,047)
- - - -
(1,916) (1,974) (2,033) (2,094)
(2,874) (2,960) (3,049) (3,141)
- - - -
(958) (987) (1,016) (1,047)
(153) (158) (163) (168)Borrowing Expenses*
Insurance
Land Tax
Other Ongoing Deductible Expenses
Total Cash Expenses
Net Cash Profit / Loss
(153) (158) (163) (168)
- - - -
- - - -
- - - -
(14,147) (11,646) (8,941) (7,496)
34,676 38,641 42,855 45,854
Principal Payments
Net Cash Profit / Loss Incl. Principal
Add Non-Cash Elements
Borrowing Costs**
Depreciation (Construction)
(34,864) (37,571) (40,487) -
(188) 1,071 2,367 45,854
- - - -
(6,250) (6,250) (6,250) (6,250)Depreciation (Construction)
Depreciation (Fit-Out)
Add Back Principal (Non-Deductible)
Total Taxable Expenses
(6,250) (6,250) (6,250) (6,250)
(1,000) (1,000) (1,000) (1,000)
34,864 37,571 40,487 -
(21,397) (18,896) (16,191) (14,746)
- - - -
Net Taxable Profit / Loss 27,426 31,391 35,605 38,604
*Borrowing Expenses include are account fees
deductible each year.**Borrowing Costs are from setting up the loan
initially. These are only deductible over the first 5
years.
Copyright © 2011 Wealth Planners 99
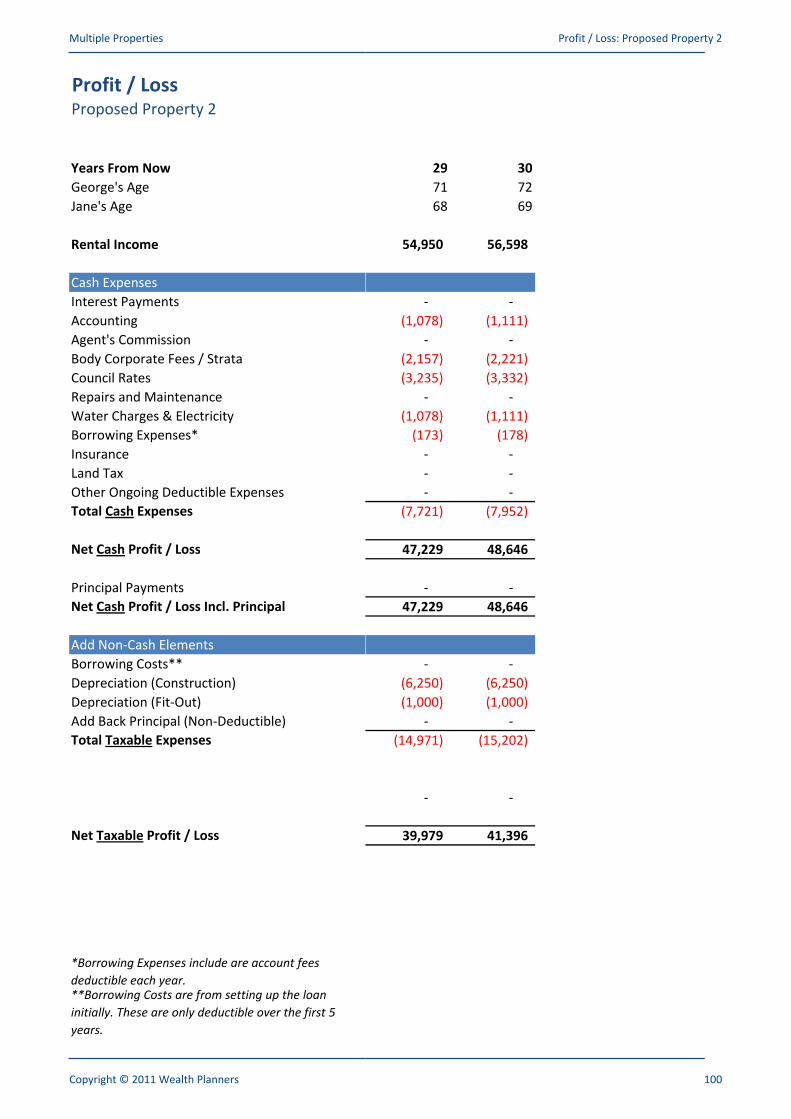
Multiple Properties Profit / Loss: Proposed Property 2
Profit / LossProposed Property 2
Years From Now
George's Age
29 30
71 72George's Age
Jane's Age
Rental Income
Cash Expenses
Interest Payments
71 72
68 69
54,950 56,598
- - Interest Payments
Accounting
Agent's Commission
Body Corporate Fees / Strata
Council Rates
Repairs and Maintenance
Water Charges & Electricity
Borrowing Expenses*
- -
(1,078) (1,111)
- -
(2,157) (2,221)
(3,235) (3,332)
- -
(1,078) (1,111)
(173) (178)Borrowing Expenses*
Insurance
Land Tax
Other Ongoing Deductible Expenses
Total Cash Expenses
Net Cash Profit / Loss
(173) (178)
- -
- -
- -
(7,721) (7,952)
47,229 48,646
Principal Payments
Net Cash Profit / Loss Incl. Principal
Add Non-Cash Elements
Borrowing Costs**
Depreciation (Construction)
- -
47,229 48,646
- -
(6,250) (6,250)Depreciation (Construction)
Depreciation (Fit-Out)
Add Back Principal (Non-Deductible)
Total Taxable Expenses
(6,250) (6,250)
(1,000) (1,000)
- -
(14,971) (15,202)
- -
Net Taxable Profit / Loss 39,979 41,396
*Borrowing Expenses include are account fees
deductible each year.**Borrowing Costs are from setting up the loan
initially. These are only deductible over the first 5
years.
Copyright © 2011 Wealth Planners 100
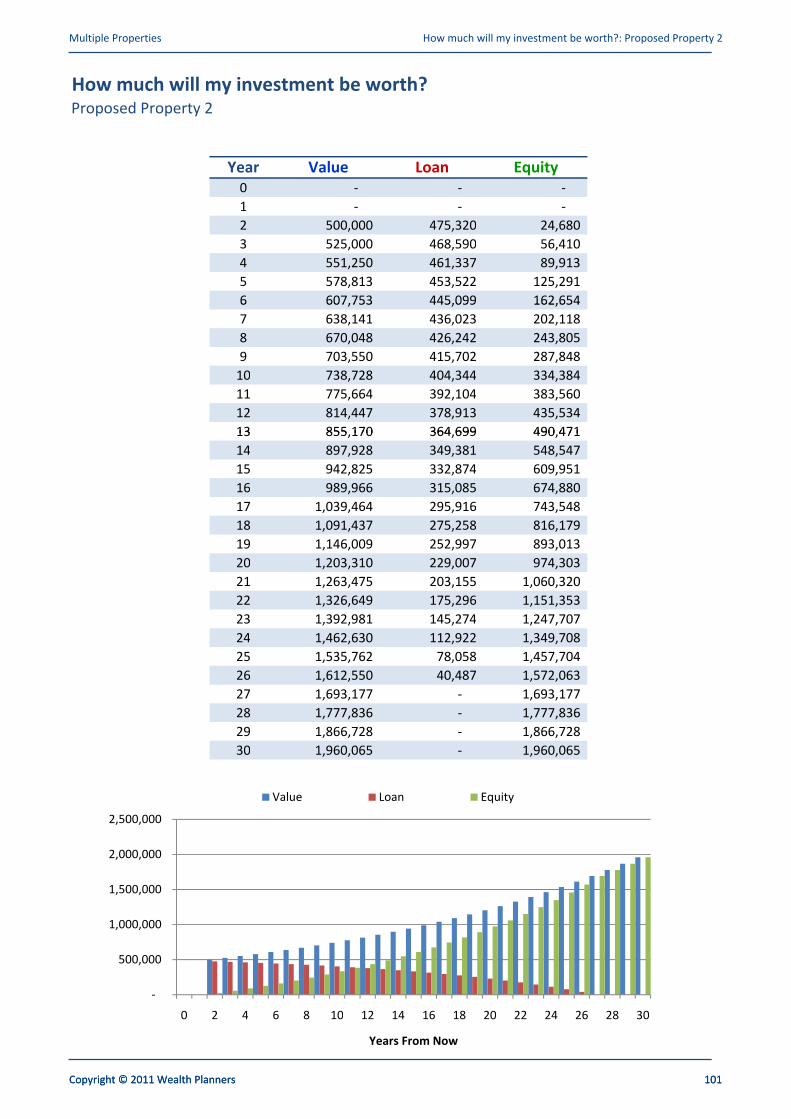
Multiple Properties How much will my investment be worth?: Proposed Property 2
How much will my investment be worth?Proposed Property 2
Year Value Loan Equity
0 - - -
Copyright © 2011 Wealth Planners 101
0 - - -
1 - - -
2 500,000 475,320 24,680
3 525,000 468,590 56,410
4 551,250 461,337 89,913
5 578,813 453,522 125,291
6 607,753 445,099 162,654 6 607,753 445,099 162,654
7 638,141 436,023 202,118
8 670,048 426,242 243,805
9 703,550 415,702 287,848
10 738,728 404,344 334,384
11 775,664 392,104 383,560
12 814,447 378,913 435,534
13 855,170 364,699 490,471 13 855,170 364,699 490,471
14 897,928 349,381 548,547
15 942,825 332,874 609,951
16 989,966 315,085 674,880
17 1,039,464 295,916 743,548
18 1,091,437 275,258 816,179
19 1,146,009 252,997 893,013
20 1,203,310 229,007 974,303 20 1,203,310 229,007 974,303
21 1,263,475 203,155 1,060,320
22 1,326,649 175,296 1,151,353
23 1,392,981 145,274 1,247,707
24 1,462,630 112,922 1,349,708
25 1,535,762 78,058 1,457,704
26 1,612,550 40,487 1,572,063
27 1,693,177 - 1,693,177
26 1,612,550 40,487 1,572,063
27 1,693,177 - 1,693,177
28 1,777,836 - 1,777,836
29 1,866,728 - 1,866,728
30 1,960,065 - 1,960,065
2,500,000
Value Loan Equity
1,000,000
1,500,000
2,000,000
2,500,000
Value Loan Equity
-
500,000
1,000,000
0 2 4 6 8 10 12 14 16 18 20 22 24 26 28 30
Years From Now
Copyright © 2011 Wealth Planners 101
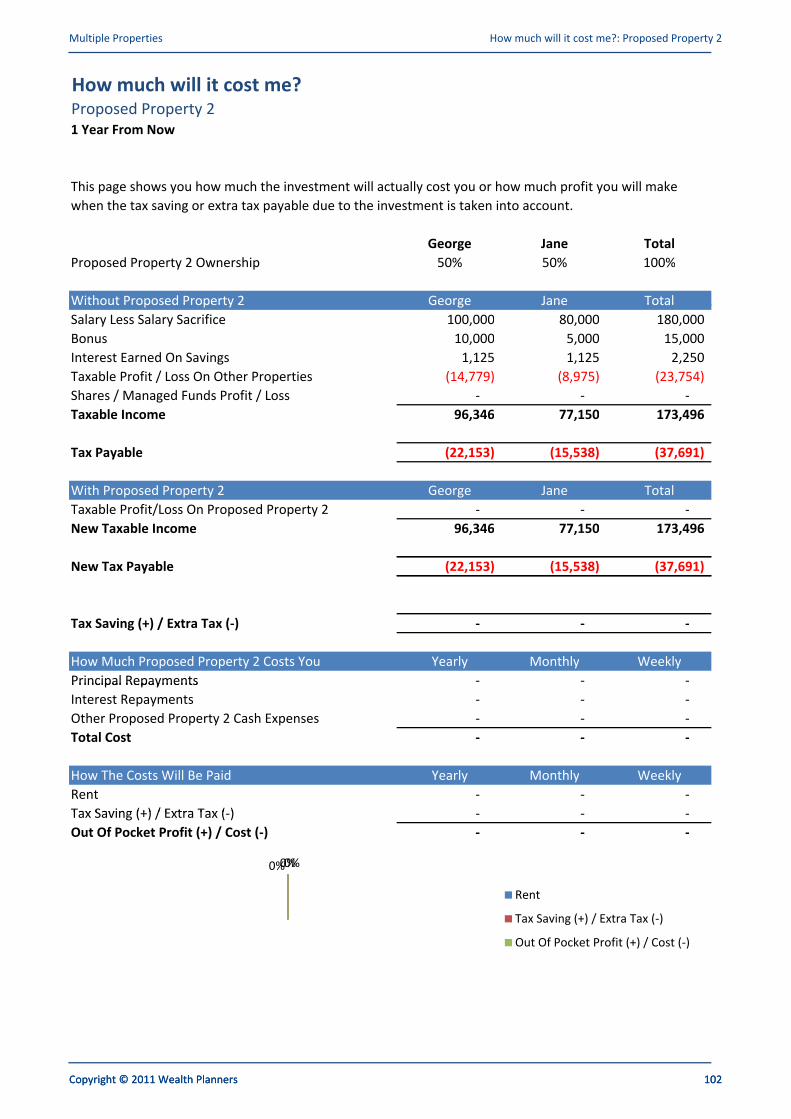
Multiple Properties How much will it cost me?: Proposed Property 2
How much will it cost me?Proposed Property 2
1 Year From Now
This page shows you how much the investment will actually cost you or how much profit you will make
Copyright © 2011 Wealth Planners 102
George Jane Total
Proposed Property 2 Ownership 50% 50% 100%
Without Proposed Property 2 George Jane Total
This page shows you how much the investment will actually cost you or how much profit you will make
when the tax saving or extra tax payable due to the investment is taken into account.
Without Proposed Property 2 George Jane Total
Salary Less Salary Sacrifice 100,000 80,000 180,000
Bonus 10,000 5,000 15,000
Interest Earned On Savings 1,125 1,125 2,250
Taxable Profit / Loss On Other Properties (14,779) (8,975) (23,754)
Shares / Managed Funds Profit / Loss - - -
Taxable Income 96,346 77,150 173,496
Tax Payable (22,153) (15,538) (37,691)
With Proposed Property 2 George Jane Total
Taxable Profit/Loss On Proposed Property 2 - - -
New Taxable Income 96,346 77,150 173,496
New Tax Payable (22,153) (15,538) (37,691)New Tax Payable (22,153) (15,538) (37,691)
Tax Saving (+) / Extra Tax (-) - - -
How Much Proposed Property 2 Costs You Yearly Monthly Weekly
Principal Repayments - - - Principal Repayments - - -
Interest Repayments - - -
Other Proposed Property 2 Cash Expenses - - -
Total Cost - - -
How The Costs Will Be Paid Yearly Monthly Weekly
Rent - - -
Tax Saving (+) / Extra Tax (-) - - - Tax Saving (+) / Extra Tax (-) - - -
Out Of Pocket Profit (+) / Cost (-) - - -
0%0%0%
Rent
Tax Saving (+) / Extra Tax (-)
Out Of Pocket Profit (+) / Cost (-)
Tax Saving (+) / Extra Tax (-)
Out Of Pocket Profit (+) / Cost (-)
Copyright © 2011 Wealth Planners 102
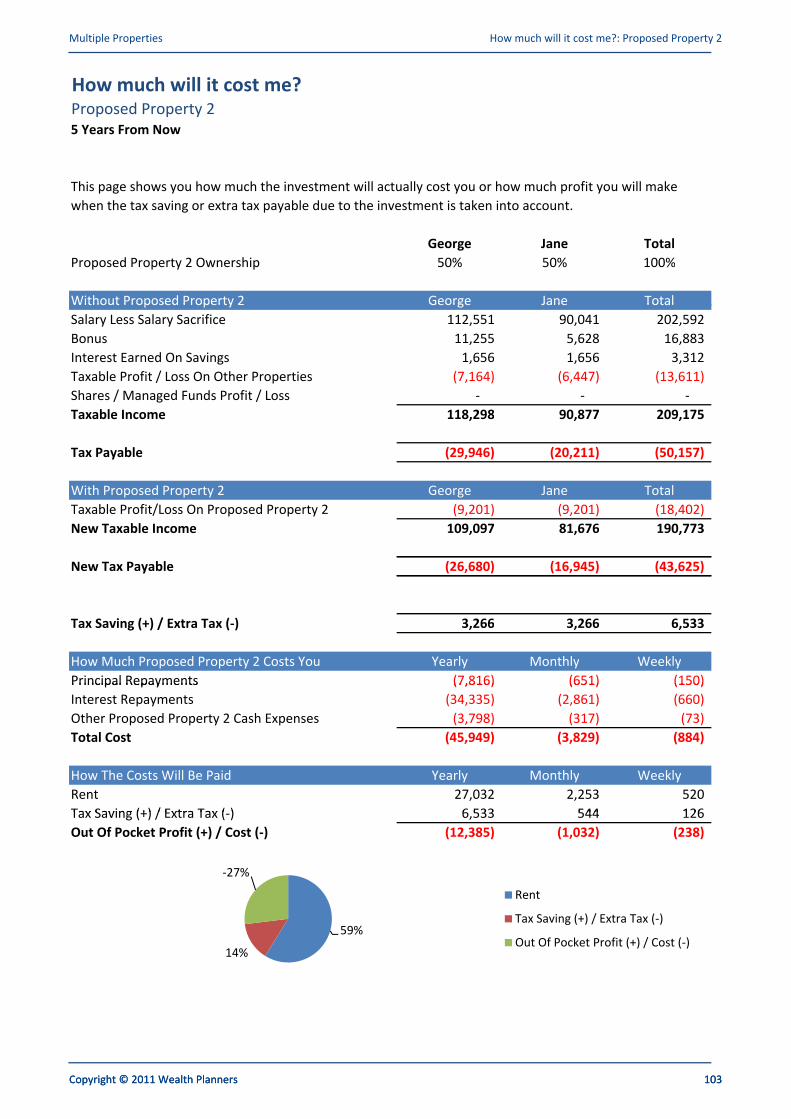
Multiple Properties How much will it cost me?: Proposed Property 2
How much will it cost me?Proposed Property 2
5 Years From Now
This page shows you how much the investment will actually cost you or how much profit you will make
Copyright © 2011 Wealth Planners 103
George Jane Total
Proposed Property 2 Ownership 50% 50% 100%
Without Proposed Property 2 George Jane Total
This page shows you how much the investment will actually cost you or how much profit you will make
when the tax saving or extra tax payable due to the investment is taken into account.
Without Proposed Property 2 George Jane Total
Salary Less Salary Sacrifice 112,551 90,041 202,592
Bonus 11,255 5,628 16,883
Interest Earned On Savings 1,656 1,656 3,312
Taxable Profit / Loss On Other Properties (7,164) (6,447) (13,611)
Shares / Managed Funds Profit / Loss - - -
Taxable Income 118,298 90,877 209,175
Tax Payable (29,946) (20,211) (50,157)
With Proposed Property 2 George Jane Total
Taxable Profit/Loss On Proposed Property 2 (9,201) (9,201) (18,402)
New Taxable Income 109,097 81,676 190,773
New Tax Payable (26,680) (16,945) (43,625)New Tax Payable (26,680) (16,945) (43,625)
Tax Saving (+) / Extra Tax (-) 3,266 3,266 6,533
How Much Proposed Property 2 Costs You Yearly Monthly Weekly
Principal Repayments (7,816) (651) (150)Principal Repayments (7,816) (651) (150)
Interest Repayments (34,335) (2,861) (660)
Other Proposed Property 2 Cash Expenses (3,798) (317) (73)
Total Cost (45,949) (3,829) (884)
How The Costs Will Be Paid Yearly Monthly Weekly
Rent 27,032 2,253 520
Tax Saving (+) / Extra Tax (-) 6,533 544 126 Tax Saving (+) / Extra Tax (-) 6,533 544 126
Out Of Pocket Profit (+) / Cost (-) (12,385) (1,032) (238)
59%
14%
-27%
Rent
Tax Saving (+) / Extra Tax (-)
Out Of Pocket Profit (+) / Cost (-)59%
14%
Tax Saving (+) / Extra Tax (-)
Out Of Pocket Profit (+) / Cost (-)
Copyright © 2011 Wealth Planners 103
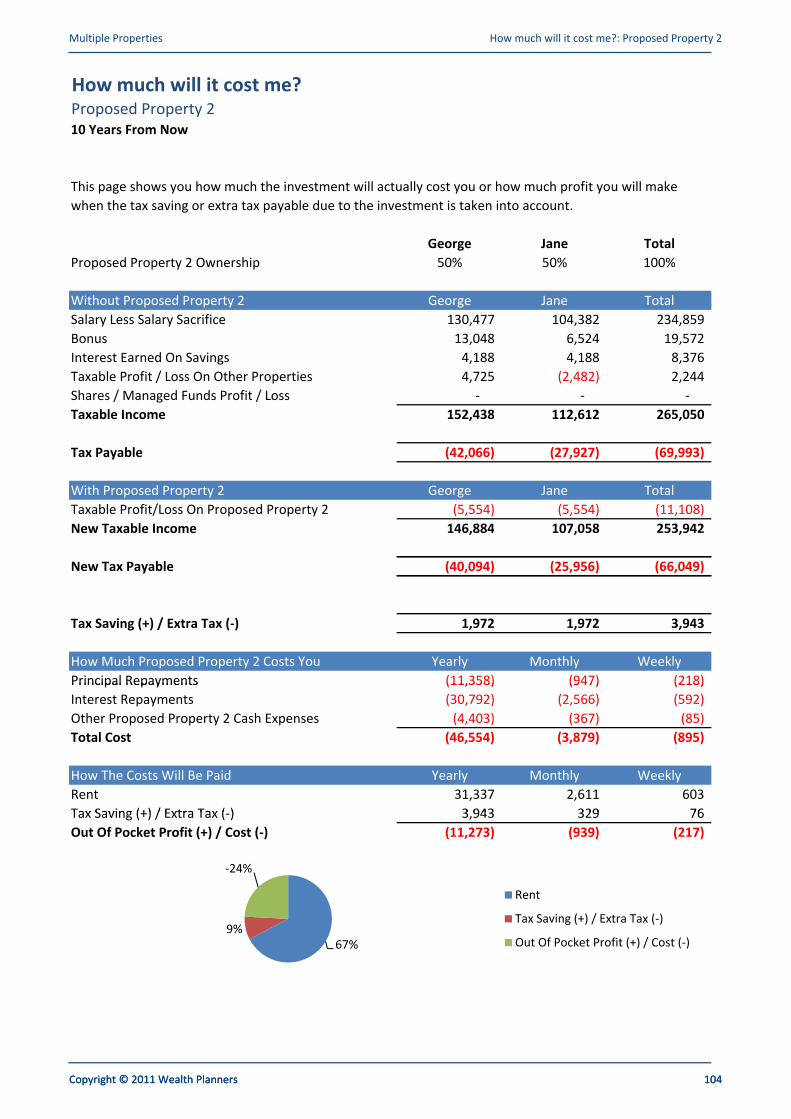
Multiple Properties How much will it cost me?: Proposed Property 2
How much will it cost me?Proposed Property 2
10 Years From Now
This page shows you how much the investment will actually cost you or how much profit you will make
Copyright © 2011 Wealth Planners 104
George Jane Total
Proposed Property 2 Ownership 50% 50% 100%
Without Proposed Property 2 George Jane Total
This page shows you how much the investment will actually cost you or how much profit you will make
when the tax saving or extra tax payable due to the investment is taken into account.
Without Proposed Property 2 George Jane Total
Salary Less Salary Sacrifice 130,477 104,382 234,859
Bonus 13,048 6,524 19,572
Interest Earned On Savings 4,188 4,188 8,376
Taxable Profit / Loss On Other Properties 4,725 (2,482) 2,244
Shares / Managed Funds Profit / Loss - - -
Taxable Income 152,438 112,612 265,050
Tax Payable (42,066) (27,927) (69,993)
With Proposed Property 2 George Jane Total
Taxable Profit/Loss On Proposed Property 2 (5,554) (5,554) (11,108)
New Taxable Income 146,884 107,058 253,942
New Tax Payable (40,094) (25,956) (66,049)New Tax Payable (40,094) (25,956) (66,049)
Tax Saving (+) / Extra Tax (-) 1,972 1,972 3,943
How Much Proposed Property 2 Costs You Yearly Monthly Weekly
Principal Repayments (11,358) (947) (218)Principal Repayments (11,358) (947) (218)
Interest Repayments (30,792) (2,566) (592)
Other Proposed Property 2 Cash Expenses (4,403) (367) (85)
Total Cost (46,554) (3,879) (895)
How The Costs Will Be Paid Yearly Monthly Weekly
Rent 31,337 2,611 603
Tax Saving (+) / Extra Tax (-) 3,943 329 76 Tax Saving (+) / Extra Tax (-) 3,943 329 76
Out Of Pocket Profit (+) / Cost (-) (11,273) (939) (217)
67%
9%
-24%
Rent
Tax Saving (+) / Extra Tax (-)
Out Of Pocket Profit (+) / Cost (-)67%
9%Tax Saving (+) / Extra Tax (-)
Out Of Pocket Profit (+) / Cost (-)
Copyright © 2011 Wealth Planners 104

Multiple Properties How much will it cost me?: Proposed Property 2
How much will it cost me?Proposed Property 2
20 Years From Now
This page shows you how much the investment will actually cost you or how much profit you will make
Copyright © 2011 Wealth Planners 105
George Jane Total
Proposed Property 2 Ownership 50% 50% 100%
Without Proposed Property 2 George Jane Total
This page shows you how much the investment will actually cost you or how much profit you will make
when the tax saving or extra tax payable due to the investment is taken into account.
Without Proposed Property 2 George Jane Total
Salary Less Salary Sacrifice 175,351 140,280 315,631
Bonus 17,535 8,768 26,303
Interest Earned On Savings 13,864 13,864 27,727
Taxable Profit / Loss On Other Properties 39,892 9,209 49,101
Shares / Managed Funds Profit / Loss - - -
Taxable Income 246,641 172,121 418,762
Tax Payable (80,839) (49,053) (129,892)
With Proposed Property 2 George Jane Total
Taxable Profit/Loss On Proposed Property 2 5,393 5,393 10,786
New Taxable Income 252,035 177,514 429,549
New Tax Payable (83,185) (50,967) (134,153)New Tax Payable (83,185) (50,967) (134,153)
Tax Saving (+) / Extra Tax (-) (2,346) (1,915) (4,261)
How Much Proposed Property 2 Costs You Yearly Monthly Weekly
Principal Repayments (23,990) (1,999) (461)Principal Repayments (23,990) (1,999) (461)
Interest Repayments (18,161) (1,513) (349)
Other Proposed Property 2 Cash Expenses (5,917) (493) (114)
Total Cost (48,068) (4,006) (924)
How The Costs Will Be Paid Yearly Monthly Weekly
Rent 42,115 3,510 810
Tax Saving (+) / Extra Tax (-) (4,261) (355) (82)Tax Saving (+) / Extra Tax (-) (4,261) (355) (82)
Out Of Pocket Profit (+) / Cost (-) (10,214) (851) (196)
74%
-8%
-18%
Rent
Tax Saving (+) / Extra Tax (-)
Out Of Pocket Profit (+) / Cost (-)74%
-8%Tax Saving (+) / Extra Tax (-)
Out Of Pocket Profit (+) / Cost (-)
Copyright © 2011 Wealth Planners 105
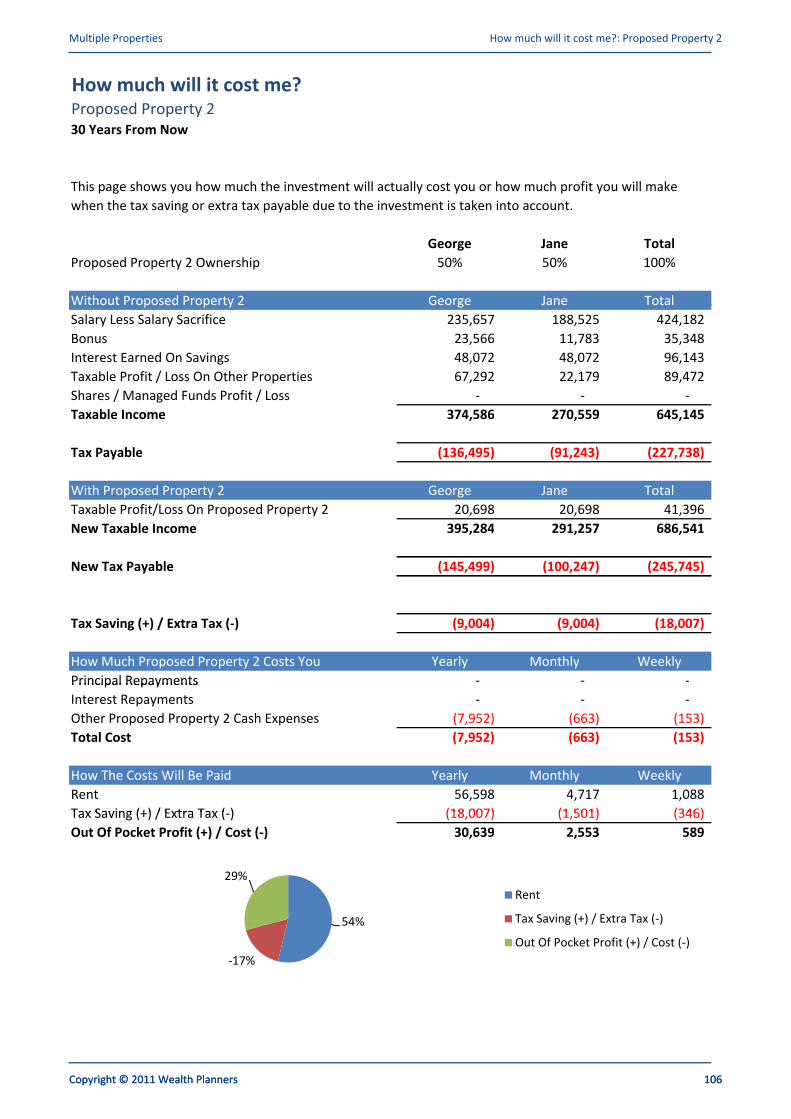
Multiple Properties How much will it cost me?: Proposed Property 2
How much will it cost me?Proposed Property 2
30 Years From Now
This page shows you how much the investment will actually cost you or how much profit you will make
Copyright © 2011 Wealth Planners 106
George Jane Total
Proposed Property 2 Ownership 50% 50% 100%
Without Proposed Property 2 George Jane Total
This page shows you how much the investment will actually cost you or how much profit you will make
when the tax saving or extra tax payable due to the investment is taken into account.
Without Proposed Property 2 George Jane Total
Salary Less Salary Sacrifice 235,657 188,525 424,182
Bonus 23,566 11,783 35,348
Interest Earned On Savings 48,072 48,072 96,143
Taxable Profit / Loss On Other Properties 67,292 22,179 89,472
Shares / Managed Funds Profit / Loss - - -
Taxable Income 374,586 270,559 645,145
Tax Payable (136,495) (91,243) (227,738)
With Proposed Property 2 George Jane Total
Taxable Profit/Loss On Proposed Property 2 20,698 20,698 41,396
New Taxable Income 395,284 291,257 686,541
New Tax Payable (145,499) (100,247) (245,745)New Tax Payable (145,499) (100,247) (245,745)
Tax Saving (+) / Extra Tax (-) (9,004) (9,004) (18,007)
How Much Proposed Property 2 Costs You Yearly Monthly Weekly
Principal Repayments - - - Principal Repayments - - -
Interest Repayments - - -
Other Proposed Property 2 Cash Expenses (7,952) (663) (153)
Total Cost (7,952) (663) (153)
How The Costs Will Be Paid Yearly Monthly Weekly
Rent 56,598 4,717 1,088
Tax Saving (+) / Extra Tax (-) (18,007) (1,501) (346)Tax Saving (+) / Extra Tax (-) (18,007) (1,501) (346)
Out Of Pocket Profit (+) / Cost (-) 30,639 2,553 589
54%
-17%
29%
Rent
Tax Saving (+) / Extra Tax (-)
Out Of Pocket Profit (+) / Cost (-)
54%
-17%
Tax Saving (+) / Extra Tax (-)
Out Of Pocket Profit (+) / Cost (-)
Copyright © 2011 Wealth Planners 106
Multiple Properties Assumptions
Assumptions
Assumptions
How does the timing work?
The projection period begins at Year 0. This symbolises today, or now.
Example: purchase a property in year 0.Example: purchase a property in year 0.
This is saying purchase the property now. The property value will come in now, you will start receiving any
rent now, and you will have to start making any repayments now.
Any deposit required will be taken from your savings account or line of credit that you have entered as your
existing balance.
Year 1 represents the end of the 1st year. Year 2 represents the end of the 2nd year etc.
Example: purchase shares at the end of year 3 for $10,000 with 5% p.a. capital growth
At the end of year 3 the value of the shares will be $10,000. At the end of year 4 the value will have grown
by 5% ($500) so you will see the year 4 value of $10,500.
Example: purchase a property in 3 years.
The property will be purchased at the very end of the 3rd year. Because it was not held from the very start
of year 3. no cash flows will occur in year 3.of year 3. no cash flows will occur in year 3.
In year 4 you will a full years cash flows will occur; a full year of rent will be received, a full years worth of
expenses will be paid etc. because the property was owned from the very beginning of year 4.
Cash Flows
Cash Flows are separated into 2 sections:
1. Cash from salary and investments (Ongoing Cash in and Cash out relating to your investments & job)
2. Cash from financing (Money coming in or out from drawing down loans, repaying loans, purchasing assets
or selling assets)
These 2 sections are added together to give the total cash flow. If the total cash flow is positive it is paid to
your savings account, home loan, or line of credit depending on what which you have chosen in the personal
details section. If the total cash flow is negative the amount will instead be taken from one of the above details section. If the total cash flow is negative the amount will instead be taken from one of the above
accounts.
How is the money allocated?
You can choose where to put the money that is left over in the personal details section. You can either add it
to your savings account or pay down your home loan. Note that if you choose the home loan option once
your home loan reaches 0 any surpluses will automatically be added to your savings account.your home loan reaches 0 any surpluses will automatically be added to your savings account.
What if my cash flow goes negative?
The calculator will first drawdown any savings that you have. When your savings reach 0 a line of credit will
be drawn from. The line of credit can be seen as drawing on any equity you may have such as your home,
your investments, or drawing from a credit card.
Interest will be charged at the same interest rate chosen for savings.
If you begin to see increasingly large amounts in the line of credit account it is a good indication that you
can't afford the investment strategy.
Super
Compulsory Contributions
Copyright © 2011 Wealth Planners 107
Multiple Properties Assumptions
Assumptions
9% of your salary and bonuses is added to super. Using a percentage ensures any changes to your salary or
bonuses also work into your super.
Example: you enter a salary of $95,000 and a bonus of $5,000 to make a total of $100,000. $9,000 will be
contributed to super and you will be paid the full $100,000 making a total of $109,000 in super, salary, and
bonuses.
Contributions Caps
For people older than or equal to 50 there is a 50,000 cap for financial years 2010/2011 and 2011/2012 (2
more financial years)
this 50,000 is static.
For people under 50 there is a 25,000 cap that increases with the inflation level chosen
Bring-forwards are not capable for people =>65
Income Tax
Where possible the tax calculations performed in the calculators have been checked and verified correct
with the ATO.
Income Losses are carried forward and are used to offset future tax payable on income only. They cannot be
used to offset future capital losses.used to offset future capital losses.
Tax concessions and offsets such as LITO, Family Tax Benefits etc. are not included. The only tax offset that is
included is franking credits.
The Money Calculator allows you to choose the tax rates used in the personal details section. These rates
will be used throughout the calculations. Tax rates cannot be varied into future years as the ATO does not
release tax rates for more than 2 years into the future.
You can enter custom tax rates from the personal details section.You can enter custom tax rates from the personal details section.
The Medicare Levy is calculated as 1.5% of taxable income. There is no Medicare Levy reduction for low
income earners applied.
Depreciation
1. Construction - aka Building & Foundations
The following formula is used:
Deduction = Construction Cost * Deduction RateDeduction = Construction Cost * Deduction Rate
Note that depreciation for construction depends on the year of construction chosen.
If purchased before 1979 there is no period over which a deduction can be made.
If purchased between 1979 and 1983, or after 1986 there is a 40 year period
over which a deduction can be made at rate of 2.5% each year.
If purchased between 1984 and 1986 there is a 25 year period over which a deduction can be made at a rate
of 4% each year.of 4% each year.
The construction depreciation is counted as 'capital works' by the ATO and so reduces the cost base for the
property for capital gains tax calculations.
This follows the ATO guidelines.
2. Depreciation for Fit-Out
These items relate to fixtures and fittings such as fridges, furniture, and TV.
The 'prime cost' method is used as specified by the ATO.The 'prime cost' method is used as specified by the ATO.
The formula used to calculate the deduction is:
Deduction = Fit-out Cost * (100% / Asset's Effective Life)
Where the fit-out cost is the value chosen in the properties page.
The Asset's Effective Life is 30 years from the date of property purchase for proposed properties and from
today for existing properties (for simplicity purposes).
What happens to the fit-out when I sell the property?
Copyright © 2011 Wealth Planners 108
Multiple Properties Assumptions
Assumptions
The fit-out is no longer used for investment purposes once the property is sold and so is no longer
deductible.
It is assumed that the Fit-Out will also be sold when the property is sold either with the property or
separately. The Fit-Out value comprises part of the property value.
There are no tax effects on what happens to the fit-out because the fit-out depreciation claimed every year There are no tax effects on what happens to the fit-out because the fit-out depreciation claimed every year
means that no tax will be payable or refundable on the sale.
Fit-Out does not affect capital gains.
Franking Credits & Dividends
Franking Credits are calculated according to the following formula:
Div * [Tc / (1 - Tc)] * fp
Tc = company tax rate. fp = franking percentage, Div = Cash Dividend ReceivedTc = company tax rate. fp = franking percentage, Div = Cash Dividend Received
The cash dividend is treated as a cash flow if not re-invested. If re-invested the value is used to purchase
more shares / units at the share / unit price at that time.
The grossed-up dividend amount is what is used to determine your taxable income from shares / managed
funds.
Franking Credits are added to the cash dividend figure to give the grossed-up dividend amount.Franking Credits are added to the cash dividend figure to give the grossed-up dividend amount.
They are then used to offset your tax payable.
If the franking credit offset is greater than your tax payable you will receive a refund equal to the difference.
Capital Gains Tax
You can choose the year a property was purchased for any existing properties. If the property was You can choose the year a property was purchased for any existing properties. If the property was
purchased before 1985 no capital gains tax is payable. If the property was purchased before 1999 the capital
gain is calculated using both the indexation method and the discount method. The lessor of both is used.
For any purchase after 1999 the discount method is used since the indexation method is not allowed.
The cost base adds selling costs and purchase costs and subtracts construction depreciation claimed in The cost base adds selling costs and purchase costs and subtracts construction depreciation claimed in
previous years.
Capital Losses are carried forward and are used to offset future capital gains tax payable only. Capital losses
cannot be used to offset future tax payable on income.
The calculations used have been fully confirmed with the ATO.
Shares / Managed Funds
The average price paid method is used. Shares / units are purchased at a price that increases each year at
the chosen capital growth rate.
Inflation
The rate of inflation can be chosen.
The inflation rate will not change any investment values or income from investments. Investment value The inflation rate will not change any investment values or income from investments. Investment value
growth rates and income rates are chosen separately.
The following items increase automatically with the chosen rate of inflation each year:
Ongoing property expenses including: Accounting, Body Corporate Fees, Council Rates, Repairs and
Maintenance, Electricity & Water Charges, Borrowing Expenses, Insurance, Land Tax, Other Ongoing
Deductible Expenses.
Lifestyle Expenses
Copyright © 2011 Wealth Planners 109
Multiple Properties Assumptions
Assumptions
Salaries
Bonuses
Ongoing Super Fund Fees ($ p.a.)
Ongoing Non-concessional Contributions
You have the option as to whether the following items automatically increase with the chosen rate of
inflation:inflation:
Other ongoing expenses
Reports
There are different sections available in the reports page depending on the calculator you are using. For the
Money Calculator you will see the following reporting sections;
1. Entire situation
2. Individual Investments2. Individual Investments
3. Super
Your entire situation will give the full overview of all your investments combined with your salary, bonuses,
living expenses etc. It shows you everything you have put into the calculator. Only totals for each
investment is shown.
The individual investments section is for viewing each investment in-depth. You can see how all the totals The individual investments section is for viewing each investment in-depth. You can see how all the totals
for the entire situation reports are calculated. Click on a heading to be taken to that report then simply
choose the investment you would like to see in the drop down list under which 'investment would you like
to see?'
Entire Situation Reports
Cash from salary and investments
These are the ongoing cash in and ongoing cash out income and expenses relating to your investments and These are the ongoing cash in and ongoing cash out income and expenses relating to your investments and
job.
The net cash flow from salary & Investments figure here will give you the best estimate of your regular cash
left over each year from all your investments and salary.
Note that the net cash flow from salary and investments does not include lifestyle expenses and other one-Note that the net cash flow from salary and investments does not include lifestyle expenses and other one-
time expenses in order to give a full idea of how much you have left to spend on your lifestyle.
The Total Cash Surplus (+) or Cash Deficit (-) includes the lifestyle expenses and one-time expenses as well as
2 more amounts:
1. Net Loan Drawdowns (+) / Repayments (-)
Any loans you have created or repaid (includes principal payments on your home or investments
2. Sale of Assets (+) / Purchases of Assets (-)
Money coming in from selling an investment or money being used to purchase an asset These 2 items come
from the Cash Flow From Buying, Selling, & Loans Section < a href>.
The Where does the money go? Section shows where the Total Cash Surplus / Deficit will be paid to or taken
from. If the Total Cash Surplus / Deficit is positive it represents a cash surplus and will be paid to one of the from. If the Total Cash Surplus / Deficit is positive it represents a cash surplus and will be paid to one of the
accounts listed. If it is negative it is a deficit and must be taken from one of the accounts.
Cash flow from Buying, Selling & Loans
These items relate to money coming in and going out from any purchases, sales, or principal repayments. A
full breakdown is below
Copyright © 2011 Wealth Planners 110
Multiple Properties Assumptions
Assumptions
Example: you purchase a $500,000 investment property using $400,000 borrowed from the bank and
$100,000 of your own money.
You receive the $400,000 from the bank (+).
You pay out $500,000 for the investment property (-)
The -$100,000 shortfall will appear as the Net Cash Flow From Buying, Selling & Loans.
Where does this figure go?
The net cash flow from financing feeds is combined with the cash flow from salary and investments to
produce the total cash flow figure.
If the total cash flow is positive and you have no line of credit drawn down it is paid to either your savings
account or home loan depending on what which you have chosen in the personal details section. If you have
a line of credit drawn down the cash will first be used to pay down the line of credit. If the total cash flow is a line of credit drawn down the cash will first be used to pay down the line of credit. If the total cash flow is
negative the amount will instead be taken from one of the above accounts.
Using the example above:
You have $80,000 left over from your salary and expenses and $20,000 in the bank from last year. The
$100,000 shortfall will be covered by the $80,000 left over and $20,000 will be taken from your bank
account.
Assets, Loans, Net Worth
Year 0 shows today or now. Year 1 shows balances at the end of year 1. For a break-down of individual
investment loan repayments or the equity in individual loans please see the Individual investments reports
or Cash flow from financing report.
Taxes
To see a full breakdown of how the Net Taxable Profit or Loss is calculated for each investment see the To see a full breakdown of how the Net Taxable Profit or Loss is calculated for each investment see the
Profit / Loss page in the Individual Investments section.
For all the assumptions relating to tax click here.
Individual Investments Reports
Profit / Loss
Total Taxable Expenses and Total Cash Expenses will differ by the amount of the non-cash elements.
Borrowing Costs and Depreciation are tax deductible but are not actual ongoing cash payments. Borrowing
costs are paid at the outset of the loan.
If you want to see a graph of cash or tax profit and loss see the Investment Summary Report.
How much your investment will cost youHow much your investment will cost you
Tax savings from losses in previous years are not included in this page.
Copyright © 2011 Wealth Planners 111
Multiple Properties Disclaimer
Disclaimer
Disclaimer
This report has been prepared as is by Wealth Planners (“The Company”).
Disclaimer and Limitation of Liability
The Content on this Report is derived from sources believed to be accurate and current. However, neither The Content on this Report is derived from sources believed to be accurate and current. However, neither
The Company nor The Company directors, officers, agents, employees or contractors ("The Company
Personnel"):
(a) give any representation or warranty as to the reliability, accuracy or completeness of the Content.
Neither The Company nor The Company Personnel shall be liable in any way for any loss or damage,
howsoever arising (whether in negligence or otherwise) out of or in connection with the Content and/or
any omissions from the Content, except where liability is made non-excludable by legislation.
In the case of goods or services supplied or offered by The Company or The Company Personnel, liability
for breach of any implied warranty or condition which cannot be excluded is limited at The Company's for breach of any implied warranty or condition which cannot be excluded is limited at The Company's
option to either:
(a) the supply of the goods (or equivalent goods) or services again; or (b) the payment of the cost of having
the goods (or equivalent goods) or services supplied again.
Indemnity
You must indemnify and hold harmless The Company and The Company Personnel and keep them You must indemnify and hold harmless The Company and The Company Personnel and keep them
indemnified, against all loss, actions, proceedings, costs, expenses (including legal fees), claims and
damages arising from: (a) any breach by you of the Disclaimer Conditions; or (b) reliance by you on any
information obtained through the Content; or (c) your Access to the report; or (d) reliance upon or use of
any Content by any person accessing Content in the report.
Not Investment AdviceNot Investment Advice
The Content on in this Report provides general information only. It is not intended as investment advice
and must not be relied upon as such. You should obtain professional investment advice tailored to your
specific circumstances prior to making any investment decisions.
Some Content in the Report provides general information about certain financial products. The Report Some Content in the Report provides general information about certain financial products. The Report
does not provide, and must not be construed as providing, recommendations in relation to any financial
products. Prior to any action or investment you should seek independent professional advice.
Governing Law
These General Conditions are governed by, construed and enforced in accordance with the laws of New
South Wales, Australia. Disputes arising from these General Conditions are subject to the exclusive
jurisdiction of the courts in New South Wales, Australia.jurisdiction of the courts in New South Wales, Australia.
Copyright © 2011 Wealth Planners 112