ANNUAL REPORT 2004 solid. In this operating environment, Sumitomo Bakelite made every effort to...
36
ANNUAL REPORT 2004
Transcript of ANNUAL REPORT 2004 solid. In this operating environment, Sumitomo Bakelite made every effort to...

A N N U A L R E P O R T 2 0 0 4
S-c1c4 0820 04.9.7 7:16 PM ページ 2
1 Financial Highl ights
2 President’s Message
4 Major Developments
6 Consol idated Balance Sheets
8 Consol idated Statements of Income
9 Consol idated Statements of Shareholders’ Equity
10 Consol idated Statements of Cash Flows
11 Notes to Consol idated Financial Statements
30 Independent Auditors’ Report
31 Environmental Accounting
33Board of Directors, Executive Off icers and Corporate Auditors/Corporate Data
The phenolic resin Bakelite, one of the oldest plastics in use today, was devel-
oped about 100 years ago by a Belgian-American, Dr. Leo H. Baekeland. Shortly
thereafter, Sumitomo Bakelite became the first Japanese company to succeed in
the industrial production of the material. Ever since, the Company has led the
plastics processing field, providing customers with an ever-widening variety of
superior products and technologies. Today, Sumitomo Bakelite is moving deci-
sively to develop more sophisticated technologies that will provide current and
future generations with the highest quality products available.
Prof i le
Contents
S-c2c3 0820 color 04.9.7 7:11 PM ページ 1

page 1Financia l Highl ights
Net Sales(Millions of yen)
Net Income(Millions of yen)
Net Income per Share(Yen)
50,000
0
100,000
150,000
200,000
00 01 02 03 04
3,000
0
6,000
9,000
12,000
00 01 02 03 04
20
10
0
30
40
50
00 01 02 03 04
Thousands ofU.S. dollars
Years ended March 31 Millions of yen (Note)
2004 2003 2002 2004
Net Sales ¥ 170,249 ¥ 160,379 ¥ 154,771 $ 1,610,681
Net Income 7,702 255 3,122 72,867
Total Assets 244,712 198,320 209,512 2,315,156
Shareholders’ Equity 117,433 114,442 121,978 1,111,003
U.S. dollars
Yen (Note)
Net Income per Share ¥ 32.14 ¥ 0.87 ¥ 13.18 $ 0.30
Diluted Net Income per Share 29.28 – 12.33 0.28
Cash Dividends per Share 10.00 10.00 10.00 0.09
Note: U.S. dollar amounts are translated from yen at the rate of ¥105.7 to US$1, the approximate exchange rate prevailing at March 31, 2004.
S-FH04 0825 04.9.7 7:23 PM ページ 1

page 2 President’s Message
During fiscal 2004, ended March 31, 2004, the Japanese
economy showed clear signs of a recovery in the sec-
ond half, owing to increased capital investment driven
by demand for digital home electronics and cellular
phones, as well as by a rebound in stock prices and a
pickup in consumer spending. The global economy was
favorable with firm growth in the United States and
Asian economies.
In Sumitomo Bakelite Co., Ltd.’s main businesses
and related industries, semiconductors showed vigor-
ous activity throughout the fiscal year, backed by
demand so strong that supply could not keep up with
demand for some types of digital home electronics and
cellular phones. Production of automobiles in Japan
remained solid.
In this operating environment, Sumitomo Bakelite
made every effort to promote restructuring while bol-
stering and expanding core businesses. As a result,
consolidated net sales amounted to ¥170,249 million
(US$1,611 million), an increase of ¥9,870 million (US$93
million) from the previous fiscal year. Operating income
rose ¥8,565 million (US$81 million) to ¥14,928 million
(US$141 million). Recurring profit grew ¥8,508 million
(US$80 million) to ¥13,731 million (US$130 million). Net
Tomitaro OgawaPresident
S-FH04 0825 04.9.7 7:23 PM ページ 2
page 3
income totaled ¥7,702 mil l ion (US$73 mil l ion), an
increase of ¥7,447 million (US$70 million) year on year.
Despite the cause for concern in the global econo-
my, such as worsened conditions in the Middle East, we
expect the U.S. economy to strongly recover and China
to continue growing as the world’s main export region.
The Japanese economy is expected to remain on a path
to recovery overall, as conditions bottom out.
Under these circumstances, Sumitomo Bakelite is
focusing management efforts on the following four
issues of paramount importance.
First, Sumitomo Bakelite aims to strengthen its core
businesses, which are: semiconductor, information and
telecommunication applications; high-performance
plastic applications; and quality-of-life applications. At
the end of the fiscal year under review, Sumitomo
Bakelite made Tsutsunaka Plastic Industry Co., Ltd. into
a subsidiary. We intend to pursue synergistic effects in
the quality-of-life applications business through stronger
collaboration with this subsidiary.
Second, we will further promote cost reductions by
continuing to emphasize overseas production of preci-
sion molded products, medical devices, flexible printed
circuit boards, epoxy resin copper-clad laminates, and
other products. We will strive to build a rock-solid man-
agement foundation that is more immune to the eco-
nomic vagaries of any given geographical region by
raising the ratio of overseas production to over 50%.
Third, we aim to develop a higher responsiveness to
customer demands from the perspective of quality,
delivery, and cost by leveraging our global network of
production bases.
Lastly, we aim to maintain our high level of commit-
ment to contributing to society and protecting the envi-
ronment.
While pursuing these measures, Sumitomo Bakelite
plans to reform the Board of Directors by reducing the
number of directors. As a part of this effort, we have
introduced an Executive Officer system. Sumitomo
Bakelite is reforming overall management in an aim to
clarify the separation of decision-making and business-
execution oversight from business execution.
On behalf of Sumitomo Bakelite, I thank you for your
ongoing support.
June 2004
Tomitaro OgawaPresident
S-FH04 0825 04.9.7 7:23 PM ページ 3
Environmentally friendly flexible printed circuit bo
SUMILITE RESIN® PR environmentally friendly phenolic r
page 4
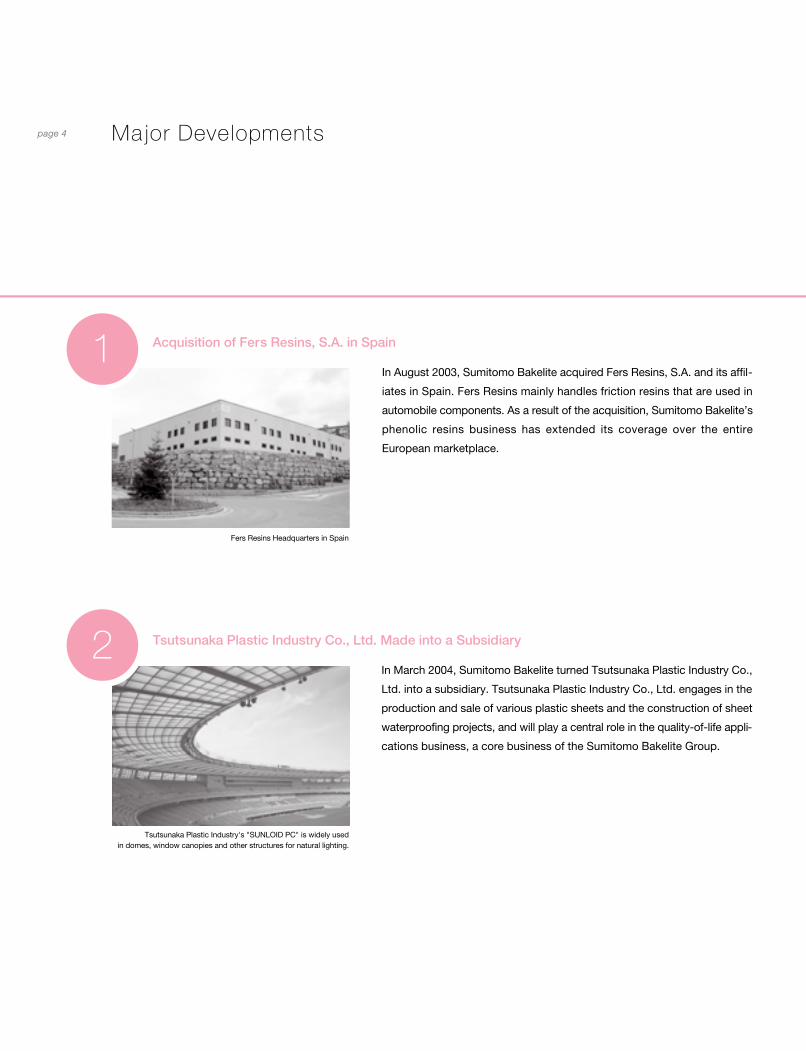
In August 2003, Sumitomo Bakelite acquired Fers Resins, S.A. and its affil-
iates in Spain. Fers Resins mainly handles friction resins that are used in
automobile components. As a result of the acquisition, Sumitomo Bakelite’s
phenolic resins business has extended its coverage over the entire
European marketplace.
Major Developments
Acquisition of Fers Resins, S.A. in Spain
In March 2004, Sumitomo Bakelite turned Tsutsunaka Plastic Industry Co.,
Ltd. into a subsidiary. Tsutsunaka Plastic Industry Co., Ltd. engages in the
production and sale of various plastic sheets and the construction of sheet
waterproofing projects, and will play a central role in the quality-of-life appli-
cations business, a core business of the Sumitomo Bakelite Group.
Tsutsunaka Plastic Industry Co., Ltd. Made into a Subsidiary
1
2
Fers Resins Headquarters in Spain
Tsutsunaka Plastic Industry's "SUNLOID PC" is widely used in domes, window canopies and other structures for natural lighting.
S-FH04 0825 04.9.7 7:23 PM ページ 4
Environmentally friendly flexible printed circuit boards
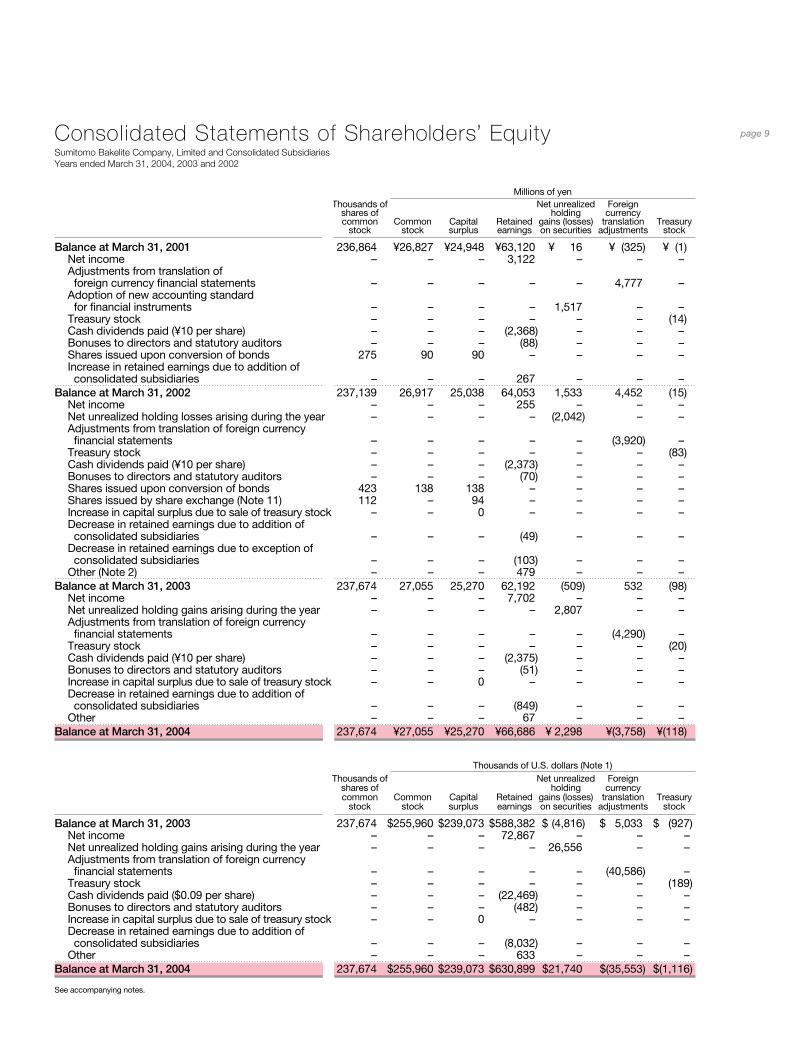
SUMILITE RESIN® PR environmentally friendly phenolic resins
page 5
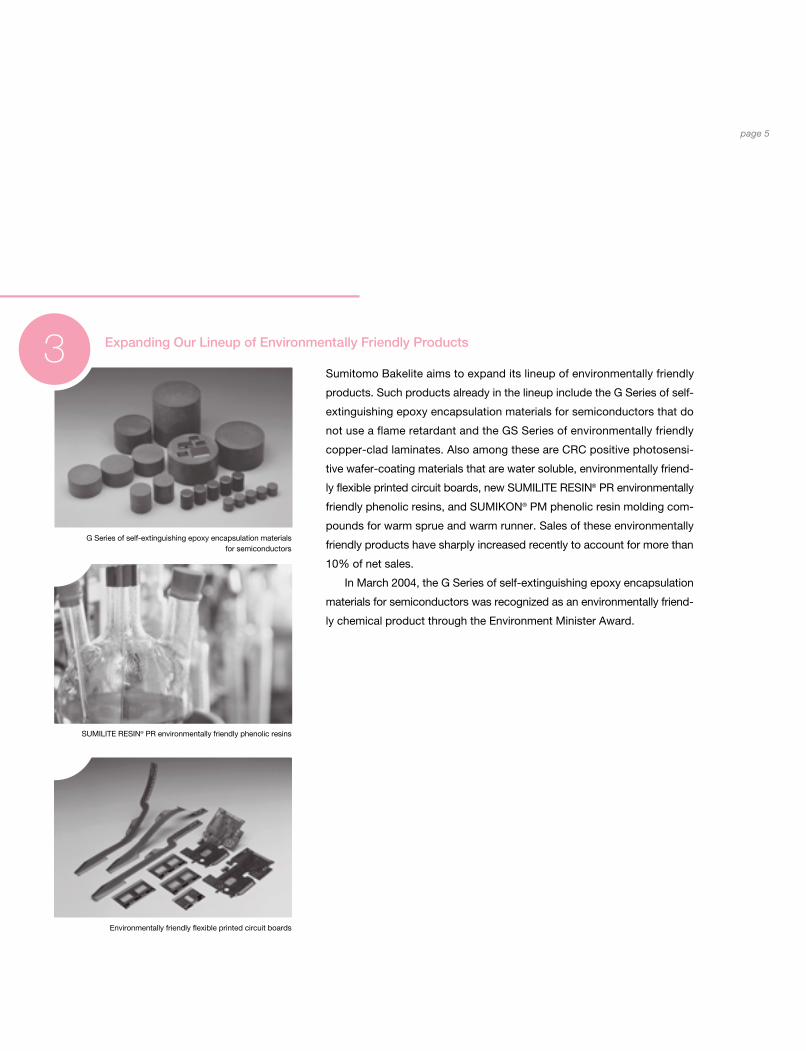
Sumitomo Bakelite aims to expand its lineup of environmentally friendly
products. Such products already in the lineup include the G Series of self-
extinguishing epoxy encapsulation materials for semiconductors that do
not use a flame retardant and the GS Series of environmentally friendly
copper-clad laminates. Also among these are CRC positive photosensi-
tive wafer-coating materials that are water soluble, environmentally friend-
ly flexible printed circuit boards, new SUMILITE RESIN® PR environmentally
friendly phenolic resins, and SUMIKON® PM phenolic resin molding com-
pounds for warm sprue and warm runner. Sales of these environmentally
friendly products have sharply increased recently to account for more than
10% of net sales.
In March 2004, the G Series of self-extinguishing epoxy encapsulation
materials for semiconductors was recognized as an environmentally friend-
ly chemical product through the Environment Minister Award.
Expanding Our Lineup of Environmentally Friendly Products3
G Series of self-extinguishing epoxy encapsulation materialsfor semiconductors
S-FH04 0825 04.9.7 7:23 PM ページ 5

page 6
Thousands ofU.S. dollars
Millions of yen (Note 1)
ASSETS 2004 2003 2004
Current assets:Cash and cash equivalents ¥ 37,966 ¥ 29,361 $ 359,186Trade receivables:
Notes 11,589 6,548 109,640Accounts 46,712 31,980 441,930Allowance for doubtful accounts (458) (462) (4,333)
Inventories (Notes 3 and 7) 24,698 22,246 233,661Deferred tax assets (Note 9) 2,039 1,403 19,290Other current assets 4,631 3,348 43,814
Total current assets 127,177 94,424 1,203,188
Property, plant and equipment (Note 8):Land 12,160 7,539 115,043Buildings and structures 69,177 57,177 654,465Machinery and equipment 129,758 104,288 1,227,606Construction in progress 2,578 2,793 24,390
213,673 171,797 2,021,504Accumulated depreciation (124,502) (95,871) (1,177,881)
Net property, plant and equipment 89,171 75,926 843,623
Goodwill 3,118 1,629 29,499
Investments and other assets:Investment securities (Note 5):
Unconsolidated subsidiaries and affiliates 4,658 15,399 44,068Other 14,161 3,268 133,974
Long-term loans receivable:Unconsolidated subsidiaries and affiliates 1,149 1,194 10,870Employees and other 143 189 1,353
Deferred tax assets (Note 9) 947 2,132 8,959Other assets 5,103 4,968 48,279Allowance for doubtful accounts (915) (809) (8,657)
Total investments and other assets 25,246 26,341 238,846¥ 244,712 ¥198,320 $ 2,315,156
See accompanying notes.
Consolidated Balance SheetsSumitomo Bakelite Company, Limited and Consolidated SubsidiariesMarch 31, 2004 and 2003
ベークライト財務 color 04.9.7 6:55 PM ページ 6

page 7
Thousands ofU.S. dollars
Millions of yen (Note 1)
LIABILITIES AND SHAREHOLDERS’ EQUITY 2004 2003 2004
Current liabilities:Short-term debt (Note 8) ¥ 22,090 ¥ 16,308 $ 208,988Long-term debt due within one year (Note 8) 522 270 4,939Trade payables:
Notes 8,048 5,195 76,140Accounts 30,783 20,927 291,230
Accrued expenses 6,546 5,278 61,930Income taxes payable (Note 9) 1,917 1,699 18,136Deferred tax liabilities (Note 9) – 74 –Other current liabilities 5,704 2,811 53,963
Total current liabilities 75,610 52,562 715,326
Long-term liabilities:Long-term debt due after one year (Note 8) 21,061 20,587 199,253Deferred tax liabilities (Note 9) 2,945 914 27,862Retirement benefits:
Employees (Note 10) 4,931 4,861 46,651Directors and statutory auditors 719 485 6,802
Other long-term liabilities 2,104 152 19,905Total long-term liabilities 31,760 26,999 300,473
Contingent liabilities (Note 14)
Minority interests 19,909 4,317 188,354
Shareholders’ equity (Note 11):Common stock:
Authorized —800,000,000 sharesIssued —237,673,694 shares in 2004 and 2003 27,055 27,055 255,960
Capital surplus 25,270 25,270 239,073Retained earnings 66,686 62,192 630,899Net unrealized holding gains (losses) on securities 2,298 (509) 21,740Foreign currency translation adjustments (3,758) 532 (35,553)Treasury stock, at cost (118) (98) (1,116)
Total shareholders’ equity 117,433 114,442 1,111,003¥244,712 ¥198,320 $2,315,156
ベークライト財務 color 04.9.7 6:55 PM ページ 7

page 8 Consolidated Statements of IncomeSumitomo Bakelite Company, Limited and Consolidated SubsidiariesYears ended March 31, 2004, 2003 and 2002
Thousands ofU.S. dollars
Millions of yen (Note 1)
2004 2003 2002 2004
Net sales (Note 13) ¥170,249 ¥160,379 ¥154,771 $1,610,681Costs and expenses:
Cost of sales (Note 13) 119,834 117,276 115,557 1,133,718Selling, general and administrative expenses (Note 13) 35,487 36,740 33,893 335,733
155,321 154,016 149,450 1,469,451Operating income (Note 13) 14,928 6,363 5,321 141,230
Other income (expenses):Interest and dividend income 406 299 711 3,841Interest expense (403) (393) (736) (3,813)Equity in losses of affiliated companies (886) (738) (260) (8,382)Loss on sale/disposal of property (273) (243) (161) (2,583)Gain on sale of investment securities – 182 1,996 –Loss on devaluation of investment securities (373) (393) (539) (3,529)Foreign exchange gain (loss), net 41 (458) 548 388Cost of business acquisition (Note 4) (144) – (1,018) (1,362)Lawsuit expense (2,468) – – (23,349)Retirement benefit expenses – (4,212) (3,014) –Gain on securities contributed to employees’ retirement benefit trust (Note 2) – 904 2,035 –
Gain on termination of employees’ retirement benefit trust (Note 2) 1,217 – – 11,514
Other, net (380) (190) (205) (3,595)(3,263) (5,242) (643) (30,870)
Income before income taxes and minority interests 11,665 1,121 4,678 110,360
Income taxes (Note 9):Current 1,845 2,410 1,612 17,455Deferred 1,542 (1,546) (209) 14,589
3,387 864 1,403 32,044
Minority interests (576) (2) (153) (5,449)Net income ¥ 7,702 ¥ 255 ¥ 3,122 $ 72,867
U.S. dollarsYen (Note 1)
Amounts per share of common stock:Net income ¥32.14 ¥ 0.87 ¥13.18 $0.30Diluted net income 29.28 – 12.33 0.28Cash dividends applicable to the year 10.00 10.00 10.00 0.09
See accompanying notes.
ベークライト財務 color 04.9.7 6:55 PM ページ 8
Millions of yenThousands of Net unrealized Foreign
shares of holding currencycommon Common Capital Retained gains (losses) translation Treasury
stock stock surplus earnings on securities adjustments stock
Balance at March 31, 2001 236,864 ¥26,827 ¥24,948 ¥63,120 ¥ 16 ¥ (325) ¥ (1)Net income – – – 3,122 – – –Adjustments from translation of foreign currency financial statements – – – – – 4,777 –
Adoption of new accounting standardfor financial instruments – – – – 1,517 – –
Treasury stock – – – – – – (14)Cash dividends paid (¥10 per share) – – – (2,368) – – –Bonuses to directors and statutory auditors – – – (88) – – –Shares issued upon conversion of bonds 275 90 90 – – – –Increase in retained earnings due to addition of consolidated subsidiaries – – – 267 – – –
Balance at March 31, 2002 237,139 26,917 25,038 64,053 1,533 4,452 (15)Net income – – – 255 – – –Net unrealized holding losses arising during the year – – – – (2,042) – –Adjustments from translation of foreign currency financial statements – – – – – (3,920) –
Treasury stock – – – – – – (83)Cash dividends paid (¥10 per share) – – – (2,373) – – –Bonuses to directors and statutory auditors – – – (70) – – –Shares issued upon conversion of bonds 423 138 138 – – – –Shares issued by share exchange (Note 11) 112 – 94 – – – –Increase in capital surplus due to sale of treasury stock – – 0 – – – –Decrease in retained earnings due to addition of consolidated subsidiaries – – – (49) – – –
Decrease in retained earnings due to exception of consolidated subsidiaries – – – (103) – – –
Other (Note 2) – – – 479 – – –Balance at March 31, 2003 237,674 27,055 25,270 62,192 (509) 532 (98)
Net income – – – 7,702 – – –Net unrealized holding gains arising during the year – – – – 2,807 – –Adjustments from translation of foreign currency financial statements – – – – – (4,290) –
Treasury stock – – – – – – (20)Cash dividends paid (¥10 per share) – – – (2,375) – – –Bonuses to directors and statutory auditors – – – (51) – – –Increase in capital surplus due to sale of treasury stock – – 0 – – – –Decrease in retained earnings due to addition of consolidated subsidiaries – – – (849) – – –
Other – – – 67 – – –Balance at March 31, 2004 237,674 ¥27,055 ¥25,270 ¥66,686 ¥ 2,298 ¥(3,758) ¥(118)
Thousands of U.S. dollars (Note 1)Thousands of Net unrealized Foreign
shares of holding currencycommon Common Capital Retained gains (losses) translation Treasury
stock stock surplus earnings on securities adjustments stock
Balance at March 31, 2003 237,674 $255,960 $239,073 $588,382 $ (4,816) $ 5,033 $ (927)Net income – – – 72,867 – – –Net unrealized holding gains arising during the year – – – – 26,556 – –Adjustments from translation of foreign currency financial statements – – – – – (40,586) –
Treasury stock – – – – – – (189)Cash dividends paid ($0.09 per share) – – – (22,469) – – –Bonuses to directors and statutory auditors – – – (482) – – –Increase in capital surplus due to sale of treasury stock – – 0 – – – –Decrease in retained earnings due to addition of consolidated subsidiaries – – – (8,032) – – –
Other – – – 633 – – –Balance at March 31, 2004 237,674 $255,960 $239,073 $630,899 $21,740 $(35,553) $(1,116)
See accompanying notes.
page 9Consolidated Statements of Shareholders’ EquitySumitomo Bakelite Company, Limited and Consolidated SubsidiariesYears ended March 31, 2004, 2003 and 2002
ベークライト財務 color 04.9.7 6:55 PM ページ 9

page 10 Consolidated Statements of Cash FlowsSumitomo Bakelite Company, Limited and Consolidated SubsidiariesYears ended March 31, 2004, 2003 and 2002
Thousands ofU.S. dollars
Millions of yen (Note 1)
2004 2003 2002 2004
Cash flows from operating activities:Net income ¥ 7,702 ¥ 255 ¥ 3,122 $ 72,867Adjustments to reconcile net income to net cash provided by operating activities:
Depreciation and amortization 9,746 10,650 10,074 92,204Loss on sale/disposal of property, plant and equipment 273 243 161 2,583Gain on sale of investment securities – (182) (1,996) –Minority interests 576 2 153 5,449Gain on termination of employees’ retirement benefit trust (1,217) – – (11,514)Loss on devaluation of investment securities 373 393 539 3,529Equity in losses of affiliated companies 886 738 260 8,382Deferred income taxes 1,542 (1,546) (209) 14,589Decrease (increase) in notes and accounts receivable (1,113) 5,568 11,486 (10,530)Decrease (increase) in inventories 2,165 (2,050) 2,118 20,482Decrease in other current assets 427 763 1,154 4,040Decrease in notes and accounts payable (2,267) (564) (9,840) (21,447)(Decrease) increase in income taxes payable (210) 143 (2,319) (1,987)(Decrease) increase in other current liabilities 250 (350) (1,643) 2,365(Decrease) increase in retirement benefits (2,182) 2,602 (28) (20,643)Other, net 1,072 868 670 10,142
Net cash provided by operating activities 18,023 17,533 13,702 170,511Cash flows from investing activities:
Purchases of investment securities (Note 4) (3,582) (1,389) (2,739) (33,888)Proceeds from sale of marketable securities and investment securities 0 330 8,023 0
Purchases of property, plant and equipment (6,489) (10,576) (12,080) (61,391)Proceeds from sale of property, plant and equipment 199 451 760 1,883Payment for business acquisition (Note 4) (517) – (2,484) (4,891)Proceeds from purchase of investment securities with change in scope of consolidation (Note 4) 4,076 – (69) 38,562
Increase in short-term loans receivable (Note 4) (3,893) – – (36,831)Decrease (increase) in long-term loans receivable 64 (155) 657 605Other 328 (710) 88 3,103
Net cash used in investing activities (9,814) (12,049) (7,844) (92,848)Cash flows from financing activities:
Increase in short-term debt 4,221 1,974 1,836 39,934Repayments of long-term debt (292) (634) (1,116) (2,763)Cash dividends paid (2,852) (2,851) (2,434) (26,982)Proceeds from issuance of stock to minority interests 500 – 666 4,730Other (20) (86) (14) (189)
Net cash provided by (used in) financing activities 1,557 (1,597) (1,062) 14,730Effect of exchange rate changes on cash and cash equivalents (1,557) (525) 1,105 (14,730)Net increase in cash and cash equivalents 8,209 3,362 5,901 77,663Cash and cash equivalents at beginning of year 29,361 27,224 20,420 277,777Increase in cash and cash equivalents due to addition of consolidated subsidiaries 539 154 903 5,099
Decrease in cash and cash equivalents due to exception of consolidated subsidiaries – (288) – –
Other (Note 2) (143) (1,091) – (1,353)Cash and cash equivalents at end of year ¥37,966 ¥29,361 ¥27,224 $359,186
Supplemental information on cash flows:Cash paid during the year for:
Interest ¥ 390 ¥ 399 ¥ 771 $ 3,690Income taxes 2,054 2,266 3,931 19,432
Non-cash investing and financing activities:Conversion of convertible bonds into common stock and capital surplus – 276 180 –
Increase in capital surplus due to share exchange – 94 – –
See accompanying notes.
ベークライト財務 color 04.9.7 6:55 PM ページ 10
page 11Notes to Consolidated Financial StatementsSumitomo Bakelite Company, Limited and Consolidated Subsidiaries
1. Basis of presenting consolidated financial statements
Sumitomo Bakelite Company, Limited (the “Company”) is a Japanese corporation, one of the affiliated companies ofSumitomo Chemical Co., Ltd., which directly owns 20.7% (at March 31, 2004) of the Company’s voting shares. TheCompany and its consolidated domestic subsidiaries maintain their accounts and records in accordance with theprovisions set forth in the Japanese Commercial Code (the “Code”) and accounting principles and practicesgenerally accepted in Japan (“Japanese GAAP”). The accounts of consolidated overseas subsidiaries are based ontheir accounting records maintained in conformity with generally accepted accounting principles and practicesprevailing in the respective countries of domicile. Certain Japanese GAAP are different from International AccountingStandards and standards in other countries in certain respects, as to application and disclosure requirements.
The accompanying consolidated financial statements are the translation of the audited consolidated financialstatements of the Company which were prepared in accordance with Japanese GAAP and were filed with theappropriate Local Finance Bureau of the Ministry of Finance as required by the Securities and Exchange Law.
In preparing the accompanying consolidated financial statements, certain reclassifications have been made in theconsolidated financial statements issued domestically in order to present them in a form which is more familiar toreaders outside Japan. The consolidated statements of shareholders’ equity for 2004, 2003 and 2002 have beenprepared for the purpose of inclusion in the accompanying consolidated financial statements, although suchstatements were not required for domestic purposes and were not filed with the regulatory authorities.
The translations of the Japanese yen amounts into U.S. dollars are included solely for the convenience of readers,using the prevailing exchange rate at March 31, 2004, which was ¥105.7 to US$1. The convenience translationsshould not be construed as representations that the Japanese yen amounts have been, could have been, or could inthe future be, converted into U.S. dollars at this or any other rate of exchange.
2. Summary of significant accounting policies
ConsolidationThe consolidated financial statements include the accounts of the Company and its significant subsidiaries (44 subsidiaries in 2004, 31 subsidiaries in 2003 and 32 subsidiaries in 2002). All significant intercompany balancesand transactions have been eliminated in consolidation.
Investments in significant affiliated companies (7 affiliates in 2004, 8 affiliates in 2003 and 2002, generally 20%-50% owned), over which the Company has the ability to exercise significant influence over operating and financialpolicies are stated at cost adjusted for equity in undistributed earnings and losses since acquisition.
Investments in the other unconsolidated subsidiaries and affiliated companies are stated at cost, because theCompany’s equity in the income or losses of these companies is not significant.
In the elimination of investments in subsidiaries, the assets and liabilities of the subsidiaries, including the portionattributable to minority shareholders, are evaluated using the fair value at the time the Company acquired control ofthe respective subsidiaries.
The excess of the cost over underlying net equity of investments in consolidated subsidiaries and othercompanies accounted for by the equity method at the date of acquisition is charged to income as incurred.However, when it is significant, it is deferred and amortized on a straight-line basis over a period of five years fromthe date of acquisition.
The fiscal year of the Company begins on April 1 and ends at March 31. On the other hand, all consolidatedoverseas subsidiaries and some domestic subsidiaries have fiscal years ending mainly at December 31.
Up to the fiscal year ended March 31, 2002, the consolidated financial statements had included their financialstatements for the year ended December 31, and certain adjustments had been made for the effects of significanttransactions or other events that had occurred from January 1 to March 31.
ベークライト財務 color 04.9.7 6:55 PM ページ 11
page 12
At the beginning of the fiscal year ended March 31, 2003, the Companies changed the consolidated closingdate for all consolidated overseas subsidiaries and one domestic subsidiary as of that date from December 31 toMarch 31.
As a result of this change, net income for these companies for the three-month period ended March 31, 2002,amounting to ¥479 million, was not reflected in the consolidated statement of income but in the consolidatedstatement of shareholders’ equity for the year ended March 31, 2003. In addition, this change also gave effect to thestatement of cash flows and decreased cash and cash equivalents by ¥1,091 million for the year ended March31, 2003.
Cash and cash equivalentsIn preparing the consolidated statements of cash flows, cash on hand, readily-available deposits and short-termhighly liquid investments with maturities not exceeding three months at the time of purchase are considered to becash and cash equivalents.
SecuritiesSecurities are classified into one of the following categories based on the intent of holding, resulting in the differentmeasurement and accounting for the changes in fair value. Held-to-maturity debt securities are stated at amortizedcost. Equity securities issued by subsidiaries and affiliated companies, which are not consolidated or accounted forusing the equity method, are stated at moving-average cost. Available-for-sale securities with available fair marketvalues are stated at fair market value. Unrealized gains and unrealized losses on these securities are reported, net ofapplicable income taxes, as a separate component of shareholders’ equity. Other available-for-sale securities withno available fair market values are stated at moving-average cost.
Significant declines in fair market value or the net asset value of held-to-maturity debt securities, equity securities,not on the equity method, issued by unconsolidated subsidiaries and affiliated companies, and available-for-salesecurities, judged to be other than temporary, are charged to income.
Derivatives and hedge accountingThe Companies are required to state derivative financial instruments at fair value and to recognize changes in thefair value as gains or losses unless derivative financial instruments are used for hedging purposes.
If derivative financial instruments are used as hedges and meet certain hedging criteria, the Companies deferrecognition of gains or losses resulting from changes in fair value of derivative financial instruments until the relatedlosses or gains on the hedged items are recognized.
However, in cases where forward foreign exchange contracts are used as hedges and meet certain hedgingcriteria, hedging instruments and hedged items are accounted for in the following manner:1. If a forward foreign exchange contract is executed to hedge an existing foreign currency receivable,
(a) the difference, if any, between the Japanese yen amount of the hedged foreign currency receivable translatedusing the spot rate at the inception date of the contract and the book value of the receivable is recognized inthe income statement in the period, which includes the inception date, and
(b) the discount or premium on the contract (that is, the difference between the Japanese yen amount of thecontract translated using the contracted forward rate and that translated using the spot rate at the inceptiondate of the contract) is recognized over the term of the contract.
2. If a forward foreign exchange contract is executed to hedge a future transaction denominated in a foreigncurrency, the future transaction will be recorded using the contracted forward rate, and no gains or losses on theforward foreign exchange contract will be recognized.
ベークライト財務 color 04.9.7 6:55 PM ページ 12

page 13
Allowance for doubtful accountsThe allowance for doubtful accounts is determined by adding the uncollectible amounts, individually estimated fordoubtful accounts, to the amount calculated by a certain rate, based on past collection experience.
InventoriesInventories are accounted for mainly at cost determined by the moving-average method.
Property, plant and equipmentProperty, plant and equipment are carried at cost. The Company and its consolidated domestic subsidiariescalculate depreciation principally by the declining-balance method at rates based on the estimated useful lives ofassets. Buildings and structures of the Company’s head office and other buildings, excluding building fixtures,acquired after March 31, 1998 are depreciated using the straight-line method. The consolidated overseassubsidiaries calculate depreciation principally by the straight-line method over estimated useful lives.
Effective April 1, 2003, some consolidated overseas subsidiaries changed the estimated useful lives of buildings,machinery and equipment. This change was made in order to conform their estimated useful lives to actual operat-ing level. The effect of this change was to increase operating income and income before income taxes and minorityinterests by ¥397 million ($3,756 thousand) for the year ended March 31, 2004 as compared to the prior useful lives.
In the year ended March 31, 2004, the Company did not adopt early the new accounting standard for impairmentof fixed Assets (“Opinion Concerning Establishment of Accounting Standard for Impairment of Fixed Assets” issuedby the Business Accounting Deliberation Council on August 9, 2002) and the implementation guidance for theaccounting standard for impairment of fixed assets (the Financial Accounting Standard Implementation GuidanceNo. 6 issued by the Accounting Standards Board of Japan on October 31, 2003). The new accounting standard isrequired to be adopted in periods beginning on or after April 1, 2005, but the standard does not prohibit earlieradoption. The Company will adopt these standards effective April 1, 2005.
The Company has begun its analysis of possible impairment of fixed assets. The Company cannot currentlyestimate the effect of adoption of the new standard, because the Company has not yet completed its analysis.However, adoption of the new standard could have a certain effect on the Company’s financial statements.
Accounting for certain lease transactionsFinance leases, which do not transfer ownership, or those which do not have a bargain purchase option provisionare accounted for in the same manner as operating leases in accordance with Japanese GAAP.
Accrued employees’ bonusesThe Company and its consolidated domestic subsidiaries accrue the amounts of employees’ bonuses based onestimated amounts to be paid in the subsequent period.
Bonuses to directors and statutory auditorsBonuses to directors and statutory auditors, which are subject to shareholders’ approval at the annual shareholders’meeting, are accounted for as an appropriation of retained earnings.
Employees’ severance and retirement benefitsThe Company and certain consolidated subsidiaries provide two types of post-employment benefit plans, unfundedlump-sum payment plans and funded non-contributory pension plans, under which all eligible employees are enti-tled to benefits based on the level of wages and salaries at the time of retirement or termination, length of serviceand certain other factors.
ベークライト財務 color 04.9.7 6:55 PM ページ 13
page 14
The liabilities and expenses for severance and retirement benefits are determined based on the amountsactuarially calculated using certain assumptions.
The Company and certain consolidated subsidiaries provided an allowance for employees’ severance and retire-ment benefits at March 31, 2004 and 2003 based on the estimated amounts of projected benefit obligation and thefair value of the plan assets at these dates.
The Company and certain consolidated subsidiaries contributed investment securities worth ¥2,066 million and¥2,545 million to the employees’ retirement benefit trust, and the resulting gains amounting to ¥904 million and¥2,035 million were recognized in the years ended March 31, 2003 and 2002, respectively. Prior service costs andactuarial gains and losses are mainly recognized in the statements of income when they are determined actuarially.
In fiscal 2004, the Company terminated a certain portion of the employees’ retirement benefit trust, and theresulting gain amounting to ¥1,217 million ($11,514 thousand) was recognized in the year ended March 31, 2004.
Research and developmentResearch and development expenses are charged to income when incurred. The amounts for the years endedMarch 31, 2004, 2003 and 2002 were ¥10,139 million ($95,922 thousand), ¥10,234 million and ¥9,775 million,respectively.
Income taxesThe Companies recognize tax effects of temporary differences between the carrying amounts of assets and liabili-ties for tax and financial reporting. The provision for income taxes is computed based on the pretax income includedin the consolidated statements of income. The asset and liability approach is used to recognize deferred tax assetsand liabilities for the expected future tax consequences of temporary differences between the carrying amounts ofassets and liabilities for financial reporting purposes and the amounts used for income tax purposes.
Translation of foreign currenciesMonetary assets and liabilities denominated in foreign currencies are translated into Japanese yen at year-end rates.
Translation of foreign currency financial statementsFinancial statements of consolidated overseas subsidiaries are translated into Japanese yen at the year-end ratesfor balance sheets and at the annual average rates for statements of income, except that shareholders’ equityaccounts are translated at historical rates and income statement items relating to transactions with the Company atthe rates used by the Company.
Amounts per share of common stockThe computations of net income per share are based on the weighted average number of shares outstanding duringthe relevant year.
Diluted net income per share is computed based on the average number of shares of common stock and contin-gent issuances of common stock from convertible bonds. Diluted net income per share in 2003 is not disclosed,because there was no latent stock that diluted net income per share at March 31, 2003.
Cash dividends per share represent the cash dividends approved by the shareholders and paid in the respectiveyear, including payment after the year-end.
Effective April 1, 2002, the Company adopted the new accounting standard for earnings per share and relatedguidance (Accounting Standards Board Statement No.2, “Accounting Standard for Earnings Per Share” andFinancial Standards Implementation Guidance No.4, “Implementation Guidance for Accounting Standard forEarnings Per Share,” issued by the Accounting Standards Board of Japan on September 25, 2002).
ベークライト財務 color 04.9.7 6:55 PM ページ 14
page 15
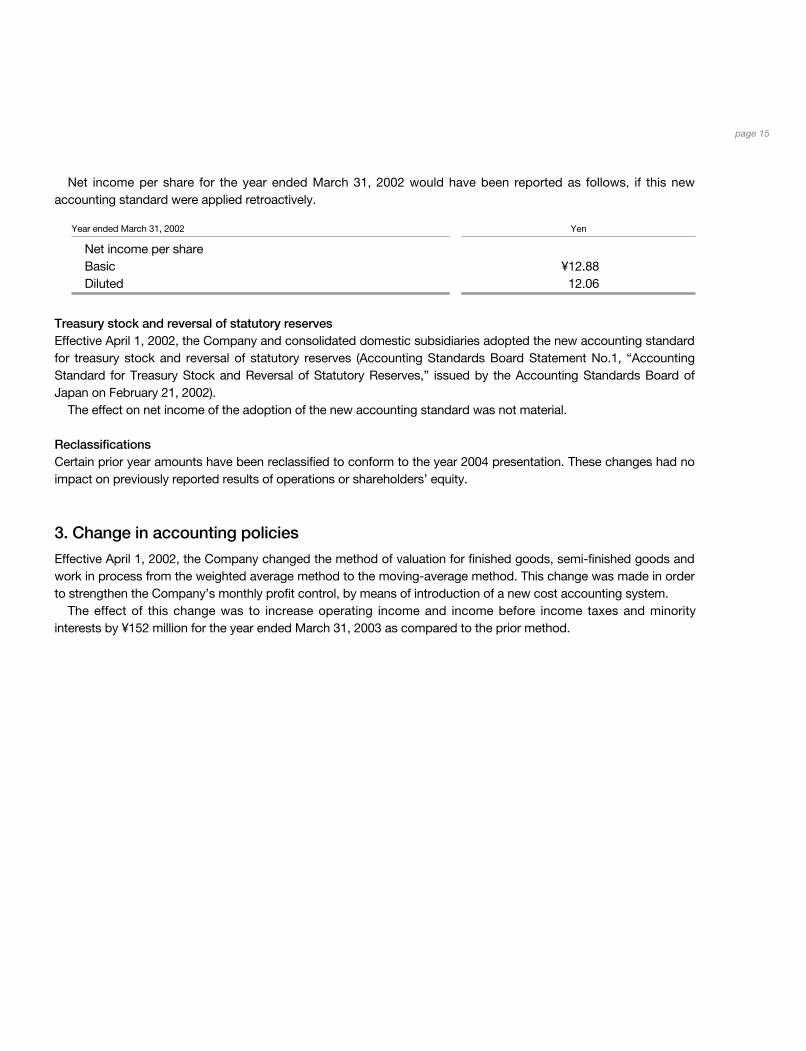
Net income per share for the year ended March 31, 2002 would have been reported as follows, if this newaccounting standard were applied retroactively.
Year ended March 31, 2002 Yen
Net income per shareBasic ¥12.88Diluted 12.06
Treasury stock and reversal of statutory reservesEffective April 1, 2002, the Company and consolidated domestic subsidiaries adopted the new accounting standard for treasury stock and reversal of statutory reserves (Accounting Standards Board Statement No.1, “Accounting Standard for Treasury Stock and Reversal of Statutory Reserves,” issued by the Accounting Standards Board ofJapan on February 21, 2002).
The effect on net income of the adoption of the new accounting standard was not material.
ReclassificationsCertain prior year amounts have been reclassified to conform to the year 2004 presentation. These changes had noimpact on previously reported results of operations or shareholders’ equity.
3. Change in accounting policies
Effective April 1, 2002, the Company changed the method of valuation for finished goods, semi-finished goods andwork in process from the weighted average method to the moving-average method. This change was made in orderto strengthen the Company’s monthly profit control, by means of introduction of a new cost accounting system.
The effect of this change was to increase operating income and income before income taxes and minorityinterests by ¥152 million for the year ended March 31, 2003 as compared to the prior method.
ベークライト財務 color 04.9.7 6:55 PM ページ 15

page 16
4. Business acquisition
(1) In the year ended March 31, 2002, the Companies acquired the research and development department, relatedto electronics materials, of Goodrich Corporation, and paid ¥2,484 million. In the accompanying statement ofincome for the year ended March 31, 2002, the Companies recognized related expenses amounting to ¥1,018million as cost of business acquisition.
In the year ended March 31, 2004, the Companies acquired Fers Resins, S.A. and its subsidiaries, (“FersGroup”), which manufacture the industrial phenolic resins mainly used for friction materials, and an epoxy resinmolding compounds business for encapsulation of semiconductor devices and related assets of TorayIndustries Inc.
Components of these purchases were as follows:Thousands of
Millions of yen U.S. dollars
Purchase of shares of Fers Group ¥4,907 $46,424Purchase of properties and equipment 373 3,529Various expenses related with the acquisitions 144 1,362
¥5,424 $51,315
In the statement of income for the year ended March 31, 2004, the Companies recognized the related expens-es amounting to ¥144 million ($1,362 thousand) as cost of business acquisition. In addition, in the statement ofcash flows for the year ended March 31, 2004, payment for purchase of shares of Fers Group was included inpurchases of investment securities and increase in short-term receivables, amounting to ¥1,059 million ($10,019thousand) and ¥3,848 million ($36,405 thousand), respectively.
(2) Assets and liabilities of the subsidiaries newly consolidated in 2004 by means of a tender offer at the inception ofconsolidation are as follows. (Tsutsunaka Plastic Industry Co., Ltd. and its 7 subsidiaries)
Thousands of Millions of yen U.S. dollars
Current assets ¥36,330 $343,709Fixed assets 20,275 191,816Total assets ¥56,605 $535,525
Current liabilities ¥21,942 $207,588Long-term liabilities 1,891 17,890Total liabilities ¥23,833 $225,478
ベークライト財務 color 04.9.7 6:55 PM ページ 16
page 17
5. Securities
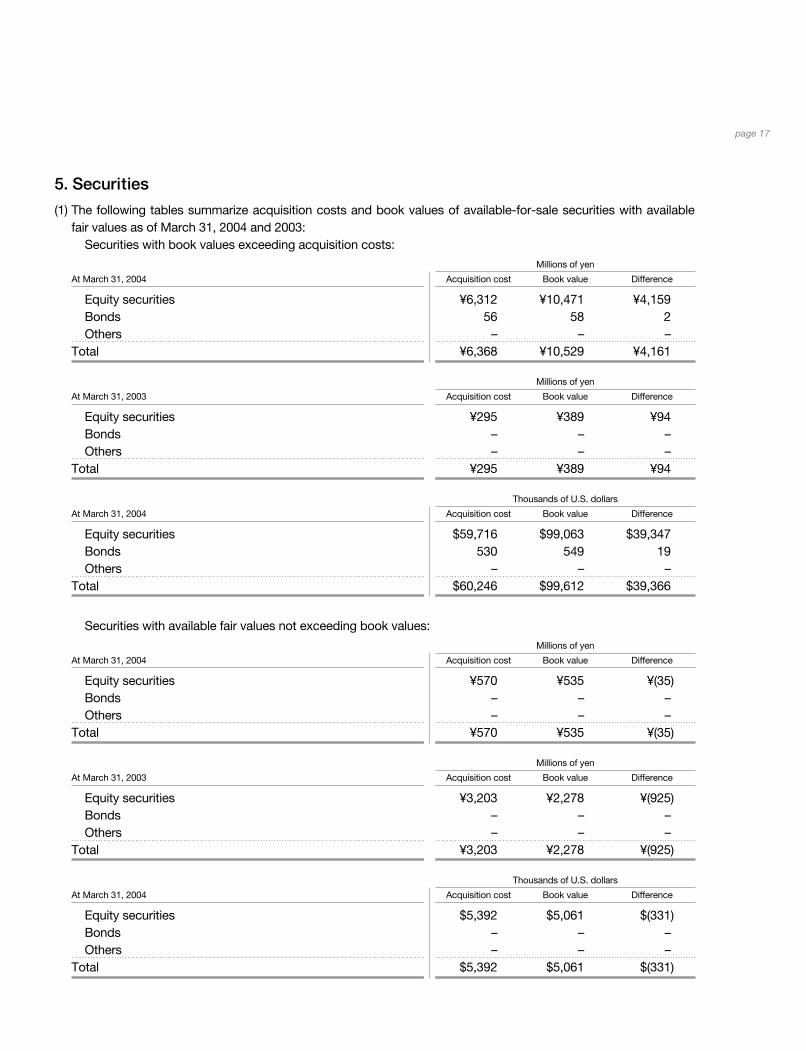
(1) The following tables summarize acquisition costs and book values of available-for-sale securities with availablefair values as of March 31, 2004 and 2003:
Securities with book values exceeding acquisition costs:
Millions of yen
At March 31, 2004 Acquisition cost Book value Difference
Equity securities ¥6,312 ¥10,471 ¥4,159Bonds 56 58 2Others – – –
Total ¥6,368 ¥10,529 ¥4,161
Millions of yen
At March 31, 2003 Acquisition cost Book value Difference
Equity securities ¥295 ¥389 ¥94Bonds – – –Others – – –
Total ¥295 ¥389 ¥94
Thousands of U.S. dollars
At March 31, 2004 Acquisition cost Book value Difference
Equity securities $59,716 $99,063 $39,347Bonds 530 549 19Others – – –
Total $60,246 $99,612 $39,366
Securities with available fair values not exceeding book values:
Millions of yen
At March 31, 2004 Acquisition cost Book value Difference
Equity securities ¥570 ¥535 ¥(35)Bonds – – –Others – – –
Total ¥570 ¥535 ¥(35)
Millions of yen
At March 31, 2003 Acquisition cost Book value Difference
Equity securities ¥3,203 ¥2,278 ¥(925)Bonds – – –Others – – –
Total ¥3,203 ¥2,278 ¥(925)
Thousands of U.S. dollars
At March 31, 2004 Acquisition cost Book value Difference
Equity securities $5,392 $5,061 $(331)Bonds – – –Others – – –
Total $5,392 $5,061 $(331)
ベークライト財務 color 04.9.7 6:55 PM ページ 17

page 18
The Companies recognize impairment loss for the securities, whose available fair values significantly declinemore than 50% of the carrying amount. In addition, the Companies also recognize impairment loss, when theavailable fair values decline more than 30% to 50% of the carrying amount and such situation continues twice atthe end of each semi-annual period. The amounts of impairment loss for the years ended March 31, 2004 and2003 were ¥73 million ($691 thousand) and ¥393 million, respectively. As impairment loss was recognized in thestatements of income, the above tables of available-for-sale securities exclude such securities written down tofair values.
(2) Total sales of held-to-maturity debt securities sold and the related gains and losses in the year ended March 31,2002 were as follows:
Year ended March 31, 2002 Millions of yen
Book value ¥4,027Sales of held-to-maturity debt securities 4,644Gain on sale 617
The Companies sold all held-to-maturity debt securities in the year ended March 31, 2002, to appropriatefinancing for the establishment of subsidiaries.
(3) Total sales of available-for-sale securities sold and the related gains and losses in the years ended March 31,2004, 2003 and 2002 were as follows:
Thousands of Millions of yen U.S. dollars
2004 2003 2002 2004
Sales of available-for-sale securities ¥0 ¥330 ¥2,878 $0Gains on sales of available-for-sale securities 0 182 1,554 0Losses on sales of available-for-sale securities – – 175 –
(4) The following table summarizes book values of available-for-sale securities with no available fair values as of March 31, 2004 and 2003:
Thousands of Millions of yen U.S. dollars
At March 31 2004 2003 2004
Non-listed equity securities ¥2,783 ¥585 $26,329Non-listed convertible bonds 300 – 2,838Others 13 16 123
Total ¥3,096 ¥601 $29,290
ベークライト財務 color 04.9.7 6:55 PM ページ 18
page 19
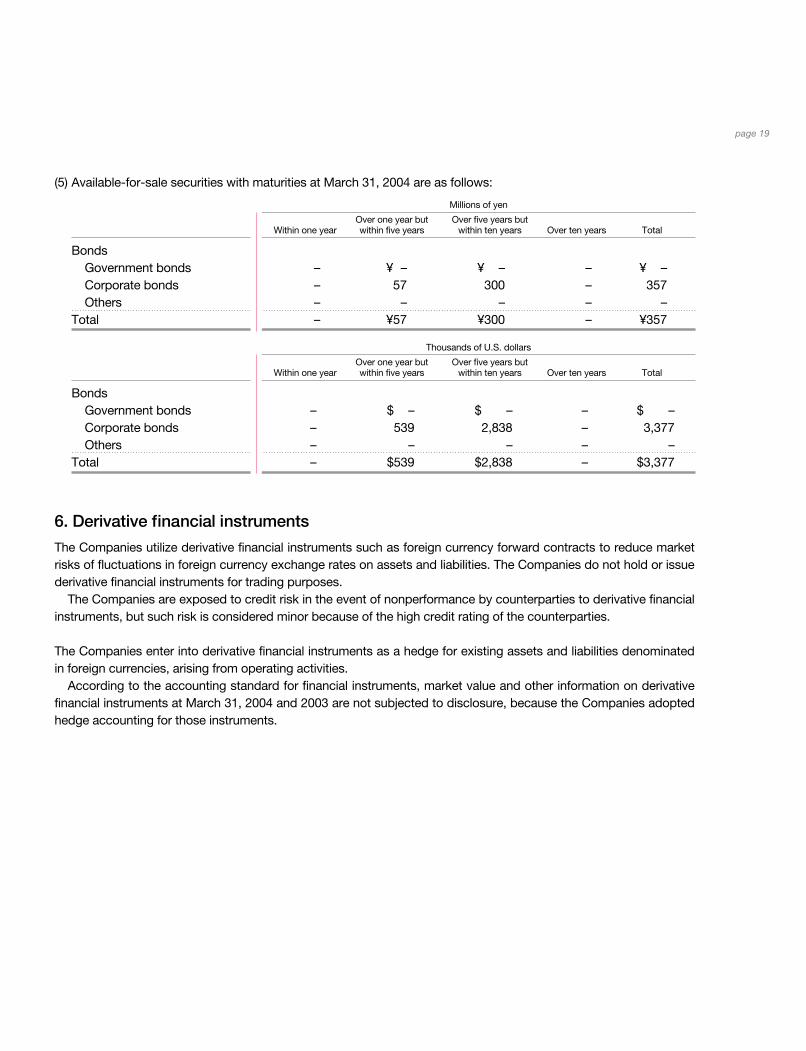
(5) Available-for-sale securities with maturities at March 31, 2004 are as follows:
Millions of yen
Over one year but Over five years butWithin one year within five years within ten years Over ten years Total
BondsGovernment bonds – ¥ – ¥ – – ¥ –Corporate bonds – 57 300 – 357Others – – – – –
Total – ¥57 ¥300 – ¥357
Thousands of U.S. dollars
Over one year but Over five years butWithin one year within five years within ten years Over ten years Total
BondsGovernment bonds – $ – $ – – $ –Corporate bonds – 539 2,838 – 3,377Others – – – – –
Total – $539 $2,838 – $3,377
6. Derivative financial instruments
The Companies utilize derivative financial instruments such as foreign currency forward contracts to reduce marketrisks of fluctuations in foreign currency exchange rates on assets and liabilities. The Companies do not hold or issuederivative financial instruments for trading purposes.
The Companies are exposed to credit risk in the event of nonperformance by counterparties to derivative financialinstruments, but such risk is considered minor because of the high credit rating of the counterparties.
The Companies enter into derivative financial instruments as a hedge for existing assets and liabilities denominatedin foreign currencies, arising from operating activities.
According to the accounting standard for financial instruments, market value and other information on derivativefinancial instruments at March 31, 2004 and 2003 are not subjected to disclosure, because the Companies adoptedhedge accounting for those instruments.
ベークライト財務 color 04.9.7 6:55 PM ページ 19

page 20
7. Inventories
Inventories at March 31, 2004 and 2003 consisted of the following:Thousands of
Millions of yen U.S. dollars
2004 2003 2004
Finished goods ¥12,732 ¥11,152 $120,454Semi-finished goods 2,332 1,876 22,062Work in process 1,356 1,704 12,829Raw materials and supplies 8,278 7,514 78,316
¥24,698 ¥22,246 $233,661
8. Short-term debt and long-term debt
Short-term debt consists of bank loans and commercial paper. The composition of short-term debt and its interestrates at March 31, 2004 and 2003 was as follows:
Thousands ofAt March 31, 2004 Millions of yen U.S. dollars Interest rates
Bank loans ¥10,090 $ 95,459 0.30%–4.63%Commercial paper 12,000 113,529 0.01%
¥22,090 $208,988
At March 31, 2003 Millions of yen Interest rates
Bank loans ¥11,308 0.30%–6.90%Commercial paper 5,000 0.04%
¥16,308
Long-term debt at March 31, 2004 and 2003 consisted of the following:Thousands of
Millions of yen U.S. dollars
2004 2003 2004
1.2% domestic convertible bonds convertible into common stock at ¥716 ($7) per share due 2006 ¥20,183 ¥20,183 $190,946
Secured loans from banks due through 2006 with interest rates ranging from 2.08% to 2.20% at March 31, 2004 377 641 3,567
Unsecured loans from a bank and organizations due through 2011 with interest rates ranging from 1.85% to 2.96% at March 31, 2004 1,023 33 9,679
21,583 20,857 204,192Less amount due within one year (522) (270) (4,939)
¥21,061 ¥20,587 $199,253
ベークライト財務 color 04.9.7 6:55 PM ページ 20

page 21
The indentures relating to the 1.2% domestic convertible bonds place a limitation on the payment of cash divi-dends which shall not exceed, on a cumulative basis, ¥3,800 million ($35,951 thousand) plus the aggregate amountof earnings of the Company (as defined in the indentures) during the years, for which the bonds are outstanding. Inthis connection interim cash dividends are regarded as a part of the cash dividends made in the previous period.
At March 31, 2004, the number of common stock issuable upon full conversion of outstanding convertible bondswas 28,188 thousand shares.
The annual maturities of long-term debt at March 31, 2004 were as follows:
Thousands of Year ending March 31 Millions of yen U.S. dollars
2005 ¥ 522 $ 4,9392006 534 5,0522007 20,513 194,0692008 3 282009 3 282010 and thereafter 8 76
At March 31, 2004, assets pledged as collateral were as follows:Thousands of
Millions of yen U.S. dollars
Buildings ¥2,233 $21,126Land 139 1,315
At March 31, 2004, obligations with collateral pledged were as follows:Thousands of
Millions of yen U.S. dollars
Short-term debt ¥ 10 $ 95Long-term debt 377 3,567
387 3,662Contingent liability 389 3,680
¥776 $7,342
ベークライト財務 color 04.9.7 6:55 PM ページ 21

page 22
9. Income taxes
The Companies are subject to several taxes based on income, which are corporation tax, inhabitants’ tax and enter-prise tax. The aggregate statutory tax rates on income before income taxes were approximately 42% for the yearsended March 31, 2004, 2003 and 2002.
Significant components of the Companies’ deferred tax assets and liabilities as of March 31, 2004 and 2003 wereas follows:
Thousands of Millions of yen U.S. dollars
2004 2003 2004
Deferred tax assets:Retirement benefits of employees ¥ 4,666 ¥ 4,310 $ 44,144Amortization of prior service cost of the pension plan 4,284 3,974 40,530Excess depreciation in overseas subsidiaries 2,686 – 25,412Tax loss carryforwards 1,392 1,124 13,169Excess bonuses accrued 1,047 661 9,905Cost of business acquisition 369 444 3,491Provision for doubtful accounts 316 369 2,990Retirement benefits of directors and statutory auditors 283 192 2,677Unrealized gains on property, plant and equipment 247 365 2,337Loss on devaluation of securities 215 341 2,034Net unrealized holding losses on securities – 337 –Others 1,858 1,588 17,578Total deferred tax assets 17,363 13,705 164,267
Valuation allowance (2,808) (1,315) (26,566)
Net deferred tax assets ¥ 14,555 ¥12,390 $ 137,701
Deferred tax liabilities:Additional depreciation in overseas subsidiaries ¥ (3,014) ¥ (728) $ (28,515)Gain on securities contributed to employees’ retirement benefit trust (2,883) (3,229) (27,275)
Contribution to funded non-contributory pension plan (2,637) (2,061) (24,948)Deferred gains on property, plant and equipment (2,506) (2,295) (23,709)Net unrealized holding gains on securities (1,672) – (15,818)Gain on dissolution of employees’ retirement benefit trust (927) – (8,770)Others (875) (1,530) (8,279)Total deferred tax liabilities ¥(14,514) ¥ (9,843) $(137,314)Net deferred tax assets ¥ 41 ¥ 2,547 $ 387
ベークライト財務 color 04.9.7 6:55 PM ページ 22

page 23
10. Employees’ severance and pension benefits
As explained in Note 2 (Employees’ severance and retirement benefits), the liabilities and expenses for severanceand retirement benefits are determined based on the amounts obtained by actuarial calculations.
The liabilities for severance and retirement benefits included in the liabilities section of the consolidated balancesheets as of March 31, 2004 and 2003 consisted of the following:
Thousands of Millions of yen U.S. dollars
At March 31 2004 2003 2004
Projected benefit obligation ¥ 28,689 ¥ 23,413 $ 271,419Less fair value of pension assets (23,555) (19,058) (222,847)Less unrecognized actuarial differences (1,009) (468) (9,546)Unrecognized prior service costs 708 886 6,698Prepaid benefit expenses 98 88 927Liability for severance and retirement benefits ¥ 4,931 ¥ 4,861 $ 46,651
Severance and retirement benefit expenses, included in the consolidated statements of income for the yearsended March 31, 2004, 2003 and 2002 are comprised of the following:
Thousands of Millions of yen U.S. dollars
2004 2003 2002 2004
Service costs—benefits earned during the year ¥ 1,003 ¥ 963 ¥ 984 $ 9,489Interest cost on projected benefit obligation 814 837 858 7,701Expected return on plan assets (144) (402) (431) (1,362)Amortization of actuarial differences (601) 4,631 3,014 (5,686)Amortization of prior service costs (76) (27) – (719)Severance and retirement benefit expenses ¥ 996 ¥6,002 ¥4,425 $ 9,423
Reversal of severance and retirement benefit expenses upon dissolution of the employee retirement benefit trust (1,065) – – (10,076)
Net ¥ (69) ¥6,002 ¥4,425 $ (653)
The differences between the statutory tax rate and the Companies’ actual effective tax rate for financial statementpurposes for the years ended March 31, 2004, 2003 and 2002 were as follows:
2004 2003 2002
Statutory tax rate 42.0% 42.0% 42.0%Permanently non-deductible expenses 2.4 10.8 2.7Permanently non-taxable income (5.3) (34.5) (4.8)Deficits of consolidated subsidiaries 1.9 64.7 3.4Dividend income eliminated in consolidation 8.7 67.4 –Equity in losses of affiliated companies 3.2 27.6 –Tax credit (7.1) (14.3) –Effect of differences between tax rates in Japan and in other countries (16.6) (87.3) (12.2)
Other, net (0.2) 0.6 (1.1)Actual effective tax rate 29.0% 77.0% 30.0%
ベークライト財務 color 04.9.7 6:55 PM ページ 23

page 24
11. Shareholders’ equity
Under the Code, at least 50% of the issue price of new shares is required to be designated as stated capital. Theportion that is to be designated as stated capital is determined by resolution of the Board of Directors. Proceeds inexcess of the amounts designated as stated capital are credited to additional paid-in capital, which is included incapital surplus.
The Code provides that an amount equal to at least 10% of cash dividends and other cash appropriations shallbe appropriated and set aside as a legal reserve until the total amount of legal reserve and additional paid-in capitalequals 25% of common stock. The legal reserve and additional paid-in capital may be used to eliminate or reduce adeficit by resolution of the shareholders’ meeting or may be capitalized by resolution of the Board of Directors. Oncondition that the total amount of legal reserve and additional paid-in capital remains equal to or exceeds 25% ofcommon stock, it is available for distribution by resolution of the shareholders’ meeting. At March 31, 2004 and2003, legal reserves of the Company amounting to ¥4,137 million ($39,139 thousand) were included in retainedearnings in the accompanying consolidated financial statements.
The maximum amount that the Company can distribute as dividends is calculated based on the non-consolidatedfinancial statements of the Company in accordance with the Code.
In the year ended March 31, 2003, the Company issued shares relating to a share exchange with minority share-holders of Yamaroku Kasei Industry Co., Ltd.
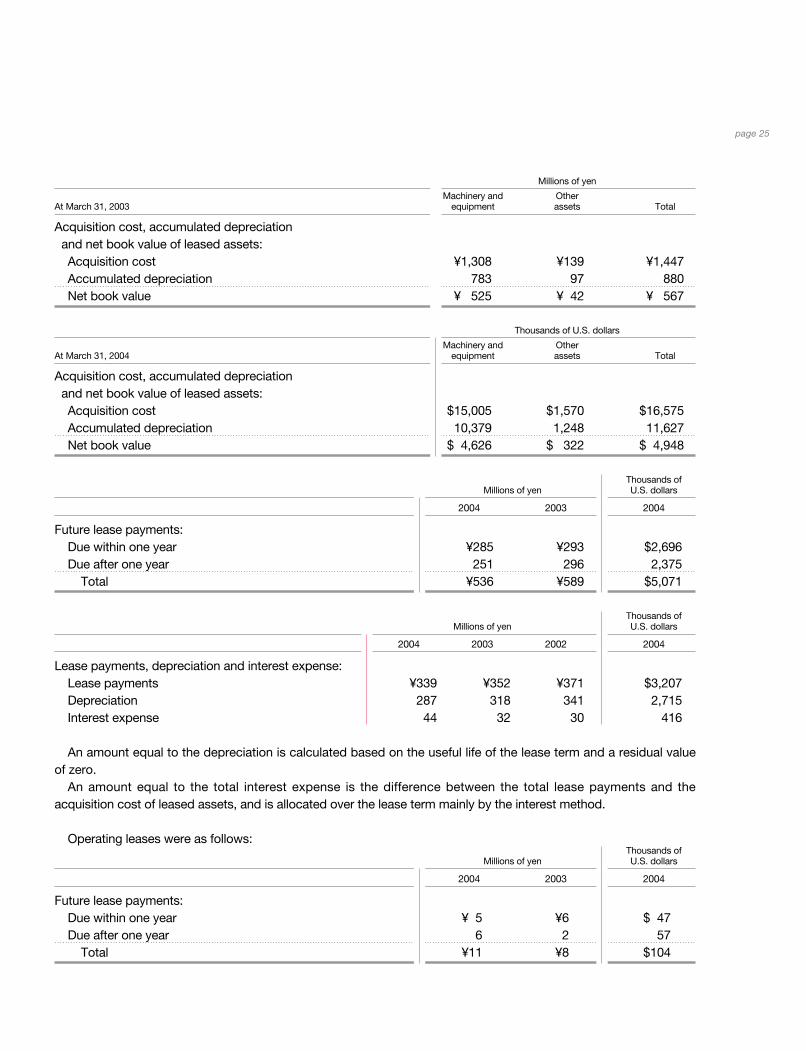
12. Information on lease transactions
The following proforma amounts present the acquisition cost, accumulated depreciation and net book value of theproperty leased to the companies as of March 31, 2004 and 2003, which would have been reflected in the balancesheets if finance leases other than those that transfer the ownership of the leased property to the companies (whichare currently accounted for in the same manner as operating leases) were capitalized.
Millions of yen
Machinery and OtherAt March 31, 2004 equipment assets Total
Acquisition cost, accumulated depreciation and net book value of leased assets:Acquisition cost ¥1,586 ¥166 ¥1,752Accumulated depreciation 1,097 132 1,229Net book value ¥ 489 ¥ 34 ¥ 523
The discount rates and rates of expected return on plan assets used by the Companies are as follows:
2004 2003 2002
Discount rate:Domestic companies 2.0% 3.0% 3.0%Overseas companies 6.5%–7.3% 6.5% 7.3%–7.5%
Expected return on plan assets 0.0% 1.5% 1.5%
The estimated amount of all retirement benefits to be paid at the future retirement date is allocated equally toeach service year using the estimated number of total service years. Prior service cost and actuarial gains/losses aremainly recognized in the statements of income when they are determined actuarially.
ベークライト財務 color 04.9.7 6:55 PM ページ 24
page 25
Millions of yen
Machinery and OtherAt March 31, 2003 equipment assets Total
Acquisition cost, accumulated depreciation and net book value of leased assets:Acquisition cost ¥1,308 ¥139 ¥1,447Accumulated depreciation 783 97 880Net book value ¥ 525 ¥ 42 ¥ 567
Thousands of U.S. dollars
Machinery and OtherAt March 31, 2004 equipment assets Total
Acquisition cost, accumulated depreciation and net book value of leased assets:Acquisition cost $15,005 $1,570 $16,575Accumulated depreciation 10,379 1,248 11,627Net book value $ 4,626 $ 322 $ 4,948
Thousands of Millions of yen U.S. dollars
2004 2003 2004
Future lease payments:Due within one year ¥285 ¥293 $2,696Due after one year 251 296 2,375
Total ¥536 ¥589 $5,071
Thousands ofMillions of yen U.S. dollars
2004 2003 2002 2004
Lease payments, depreciation and interest expense:Lease payments ¥339 ¥352 ¥371 $3,207Depreciation 287 318 341 2,715Interest expense 44 32 30 416
An amount equal to the depreciation is calculated based on the useful life of the lease term and a residual valueof zero.
An amount equal to the total interest expense is the difference between the total lease payments and theacquisition cost of leased assets, and is allocated over the lease term mainly by the interest method.
Operating leases were as follows:Thousands of
Millions of yen U.S. dollars
2004 2003 2004
Future lease payments:Due within one year ¥ 5 ¥6 $ 47Due after one year 6 2 57
Total ¥11 ¥8 $104
ベークライト財務 color 04.9.7 6:55 PM ページ 25

page 26
13. Segment information
Information by business segment for the years ended March 31, 2004 and 2003 is as follows :
Millions of yen
Circuits andSemiconductor electronic High Quality Eliminations
and display component performance of life orYear ended March 31, 2004 materials materials plastics products Others Total corporate Consolidated
Sale:Outside customers ¥55,494 ¥40,221 ¥44,395 ¥29,457 ¥682 ¥170,249 ¥ – ¥170,249Inter-segment 25 – 1,136 418 66 1,645 (1,645) –
Total sales 55,519 40,221 45,531 29,875 748 171,894 (1,645) 170,249
Operating expenses 43,517 37,359 44,033 27,907 503 153,319 2,002 155,321Operating income ¥12,002 ¥ 2,862 ¥ 1,498 ¥ 1,968 ¥245 ¥ 18,575 ¥ (3,647) ¥ 14,928
Identifiable assets ¥50,661 ¥47,364 ¥53,334 ¥75,261 ¥756 ¥227,376 ¥17,336 ¥244,712Depreciation and amortization 2,659 2,743 2,635 1,189 83 9,309 324 9,633Capital expenditures 1,702 1,400 1,946 1,238 100 6,386 228 6,614
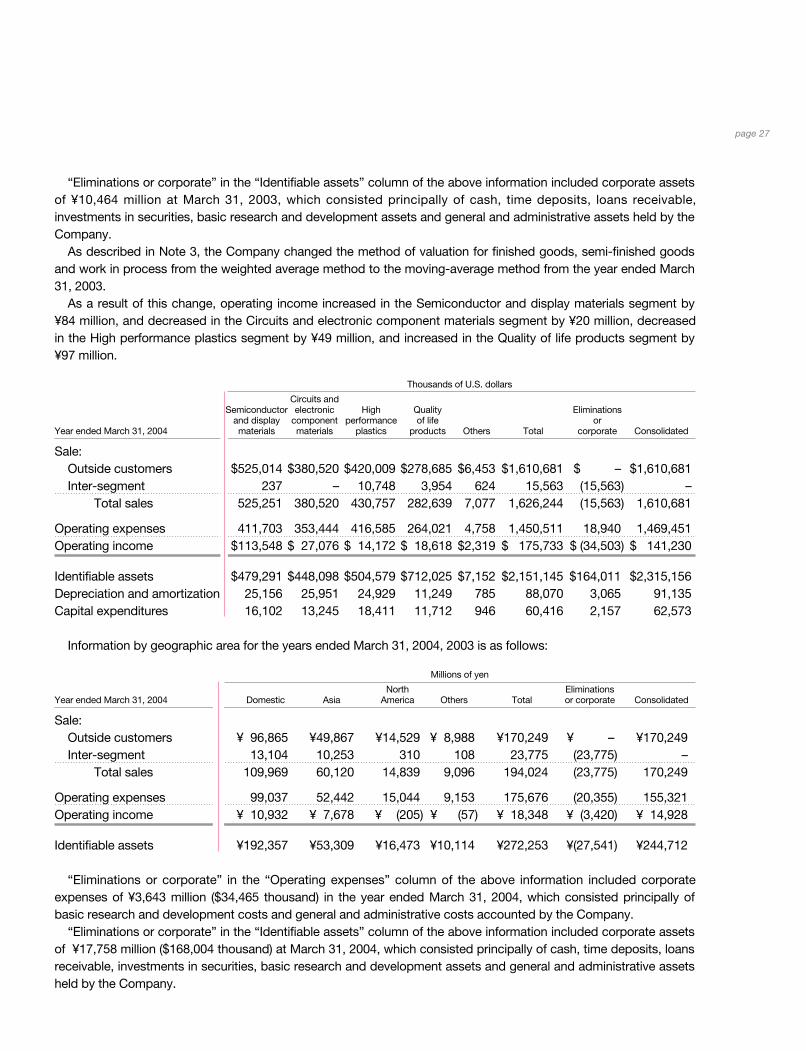
“Eliminations or corporate” in the “Operating expenses” column of the above information included corporateexpenses of ¥3,643 million ($34,465 thousand) in the year ended March 31, 2004, which consisted principally ofbasic research and development costs and general and administrative costs accounted by the Company.
“Eliminations or corporate” in the “Identifiable assets” column of the above information included corporate assetsof ¥17,758 million ($168,004 thousand) at March 31, 2004, which consisted principally of cash, time deposits, loansreceivable, investments in securities, basic research and development assets and general and administrative assetsheld by the Company.
As described in Note 2, some consolidated overseas subsidiaries changed the estimated useful lives of buildings,machinery and equipment from the year ended March 31, 2004.
As a result of this change, operating income increased in the High performance plastics segment by ¥397 million($3,756 thousand).
Millions of yen
Circuits andSemiconductor electronic High Quality Eliminations
and display component performance of life orYear ended March 31, 2003 materials materials plastics products Others Total corporate Consolidated
Sale:Outside customers ¥49,229 ¥38,310 ¥42,829 ¥29,386 ¥625 ¥160,379 ¥ – ¥160,379Inter-segment 26 – 980 467 332 1,805 (1,805) –
Total sales 49,255 38,310 43,809 29,853 957 162,184 (1,805) 160,379
Operating expenses 40,653 38,349 42,517 28,918 801 151,238 2,778 154,016Operating income (loss) ¥ 8,602 ¥ (39) ¥ 1,292 ¥ 935 ¥156 ¥ 10,946 ¥ (4,583) ¥ 6,363
Identifiable assets ¥50,909 ¥49,896 ¥50,709 ¥35,905 ¥688 ¥188,107 ¥10,213 ¥198,320Depreciation and amortization 2,877 3,077 2,984 1,119 94 10,151 350 10,501Capital expenditures 1,987 3,149 2,498 684 65 8,383 290 8,673
“Eliminations or corporate” in the “Operating expenses” column of the above information included corporateexpenses of ¥4,577 million in the year ended March 31, 2003, which consisted principally of basic research anddevelopment costs and general and administrative costs accounted by the Company.
ベークライト財務 color 04.9.7 6:55 PM ページ 26
page 27
“Eliminations or corporate” in the “Identifiable assets” column of the above information included corporate assetsof ¥10,464 million at March 31, 2003, which consisted principally of cash, time deposits, loans receivable,investments in securities, basic research and development assets and general and administrative assets held by theCompany.
As described in Note 3, the Company changed the method of valuation for finished goods, semi-finished goodsand work in process from the weighted average method to the moving-average method from the year ended March31, 2003.
As a result of this change, operating income increased in the Semiconductor and display materials segment by¥84 million, and decreased in the Circuits and electronic component materials segment by ¥20 million, decreasedin the High performance plastics segment by ¥49 million, and increased in the Quality of life products segment by¥97 million.
Thousands of U.S. dollars
Circuits andSemiconductor electronic High Quality Eliminations
and display component performance of life orYear ended March 31, 2004 materials materials plastics products Others Total corporate Consolidated
Sale:Outside customers $525,014 $380,520 $420,009 $278,685 $6,453 $1,610,681 $ – $1,610,681Inter-segment 237 – 10,748 3,954 624 15,563 (15,563) –
Total sales 525,251 380,520 430,757 282,639 7,077 1,626,244 (15,563) 1,610,681
Operating expenses 411,703 353,444 416,585 264,021 4,758 1,450,511 18,940 1,469,451Operating income $113,548 $ 27,076 $ 14,172 $ 18,618 $2,319 $ 175,733 $ (34,503) $ 141,230
Identifiable assets $479,291 $448,098 $504,579 $712,025 $7,152 $2,151,145 $164,011 $2,315,156Depreciation and amortization 25,156 25,951 24,929 11,249 785 88,070 3,065 91,135Capital expenditures 16,102 13,245 18,411 11,712 946 60,416 2,157 62,573
Information by geographic area for the years ended March 31, 2004, 2003 is as follows:
Millions of yen
North EliminationsYear ended March 31, 2004 Domestic Asia America Others Total or corporate Consolidated
Sale:Outside customers ¥ 96,865 ¥49,867 ¥14,529 ¥ 8,988 ¥170,249 ¥ – ¥170,249Inter-segment 13,104 10,253 310 108 23,775 (23,775) –
Total sales 109,969 60,120 14,839 9,096 194,024 (23,775) 170,249
Operating expenses 99,037 52,442 15,044 9,153 175,676 (20,355) 155,321Operating income ¥ 10,932 ¥ 7,678 ¥ (205) ¥ (57) ¥ 18,348 ¥ (3,420) ¥ 14,928
Identifiable assets ¥192,357 ¥53,309 ¥16,473 ¥10,114 ¥272,253 ¥(27,541) ¥244,712
“Eliminations or corporate” in the “Operating expenses” column of the above information included corporateexpenses of ¥3,643 million ($34,465 thousand) in the year ended March 31, 2004, which consisted principally ofbasic research and development costs and general and administrative costs accounted by the Company.
“Eliminations or corporate” in the “Identifiable assets” column of the above information included corporate assetsof ¥17,758 million ($168,004 thousand) at March 31, 2004, which consisted principally of cash, time deposits, loansreceivable, investments in securities, basic research and development assets and general and administrative assetsheld by the Company.
ベークライト財務 color 04.9.7 6:55 PM ページ 27

page 28
As described in Note 2, some consolidated overseas subsidiaries changed the estimated useful lives of buildings,machinery and equipment from the year ended March 31, 2004.
As a result of this change, operating income increased in the Asia segment by ¥10 million ($95 thousand) and inthe North America segment by ¥380 million ($3,595 thousand) and in the Others segment by ¥7 million ($66thousand).
Millions of yen
North EliminationsYear ended March 31, 2003 Domestic Asia America Others Total or corporate Consolidated
Sale:Outside customers ¥ 93,445 ¥44,793 ¥15,790 ¥6,351 ¥160,379 ¥ – ¥160,379Inter-segment 12,477 4,738 460 71 17,746 (17,746) –
Total sales 105,922 49,531 16,250 6,422 178,125 (17,746) 160,379
Operating expenses 99,529 45,581 15,967 6,410 167,487 (13,471) 154,016Operating income ¥ 6,393 ¥ 3,950 ¥ 283 ¥ 12 ¥ 10,638 ¥ (4,275) ¥ 6,363
Identifiable assets ¥154,427 ¥47,365 ¥18,694 ¥3,935 ¥224,421 ¥(26,101) ¥198,320
“Eliminations or corporate” in the “Operating expenses” column of the above information included corporateexpenses of ¥4,577 million in the year ended March 31, 2003, which consisted principally of basic research anddevelopment costs and general and administrative costs accounted by the Company.
“Eliminations or corporate” in the “Identifiable assets” column of the above information included corporate assetsof ¥10,464 million at March 31, 2003, which consisted principally of cash, time deposits, loans receivable,investments in securities, basic research and development assets and general and administrative assets held bythe Company.
As described in Note 3, the Company changed the method of valuation for finished goods, semi-finished goodsand work in process from the weighted average method to the moving-average method from the year ended March31, 2003.
As a result of this change, operating income increased in the Domestic segment by ¥152 million.
Thousands of U.S. dollars
North EliminationsYear ended March 31, 2004 Domestic Asia America Others Total or corporate Consolidated
Sale:Outside customers $ 916,414 $471,779 $137,455 $85,033 $1,610,681 $ – $1,610,681Inter-segment 123,974 97,001 2,933 1,022 224,930 (224,930) –
Total sales 1,040,388 568,780 140,388 86,055 1,835,611 (224,930) 1,610,681
Operating expenses 936,963 496,140 142,328 86,594 1,662,025 (192,574) 1,469,451Operating income $ 103,425 $ 72,640 $ (1,940) $ (539) $ 173,586 $ (32,356) $ 141,230
Identifiable assets $1,819,839 $504,342 $155,847 $95,686 $2,575,714 $(260,558) $2,315,156
ベークライト財務 color 04.9.7 6:55 PM ページ 28
page 29
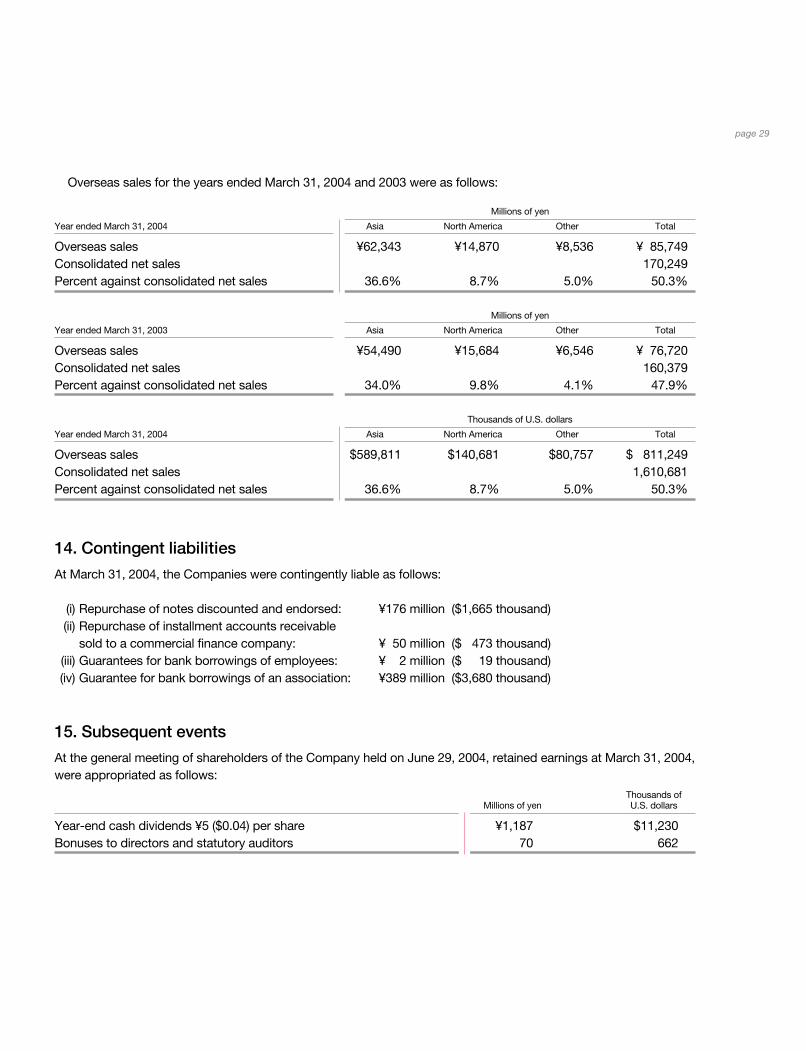
Overseas sales for the years ended March 31, 2004 and 2003 were as follows:
Millions of yen
Year ended March 31, 2004 Asia North America Other Total
Overseas sales ¥62,343 ¥14,870 ¥8,536 ¥ 85,749Consolidated net sales 170,249Percent against consolidated net sales 36.6% 8.7% 5.0% 50.3%
Millions of yen
Year ended March 31, 2003 Asia North America Other Total
Overseas sales ¥54,490 ¥15,684 ¥6,546 ¥ 76,720Consolidated net sales 160,379Percent against consolidated net sales 34.0% 9.8% 4.1% 47.9%
Thousands of U.S. dollars
Year ended March 31, 2004 Asia North America Other Total
Overseas sales $589,811 $140,681 $80,757 $ 811,249Consolidated net sales 1,610,681Percent against consolidated net sales 36.6% 8.7% 5.0% 50.3%
14. Contingent liabilities
At March 31, 2004, the Companies were contingently liable as follows:
(i) Repurchase of notes discounted and endorsed: ¥176 million ($1,665 thousand)(ii) Repurchase of installment accounts receivable
sold to a commercial finance company: ¥ 50 million ($ 473 thousand)(iii) Guarantees for bank borrowings of employees: ¥ 2 million ($ 19 thousand)(iv) Guarantee for bank borrowings of an association: ¥389 million ($3,680 thousand)
15. Subsequent events
At the general meeting of shareholders of the Company held on June 29, 2004, retained earnings at March 31, 2004,were appropriated as follows:
Thousands of Millions of yen U.S. dollars
Year-end cash dividends ¥5 ($0.04) per share ¥1,187 $11,230Bonuses to directors and statutory auditors 70 662
ベークライト財務 color 04.9.7 6:55 PM ページ 29

page 30
To the Board of Directors ofSumitomo Bakelite Company, Limited:
We have audited the accompanying consolidated balance sheets of Sumitomo Bakelite Company,Limited (a Japanese corporation) and consolidated subsidiaries as of March 31, 2004 and 2003, and therelated consolidated statements of income, shareholders' equity and cash flows for each of the threeyears in the period ended March 31, 2004, expressed in Japanese yen. These consolidated financialstatements are the responsibility of the Company’s management. Our responsibility is to independentlyexpress an opinion on these consolidated financial statements based on our audits.
We conducted our audits in accordance with auditing standards generally accepted in Japan. Thosestandards require that we plan and perform the audit to obtain reasonable assurance about whether thefinancial statements are free of material misstatement. An audit includes examining, on a test basis,evidence supporting the amounts and disclosures in the financial statements. An audit also includesassessing the accounting principles used and significant estimates made by management, as well asevaluating the overall financial statement presentation. We believe that our audits provide a reasonablebasis for our opinion.
In our opinion, the consolidated financial statements referred to above present fairly, in all materialrespects, the consolidated financial position of Sumitomo Bakelite Company, Limited and consolidatedsubsidiaries as of March 31, 2004 and 2003, and the consolidated results of their operations and theircash flows for each of the three years in the period ended March 31, 2004, in conformity with accountingprinciples generally accepted in Japan.
Without qualifying our opinion, we draw attention to the following.As explained in Note 3 to the consolidated financial statements, effective April 1, 2002, SumitomoBakelite Company, Limited changed the method of valuation for finished goods, semi-finished goods andwork in process.
The U.S. dollar amounts in the accompanying consolidated financial statements with respect to the yearended March 31, 2004 are presented solely for convenience. Our audit also included the translation ofyen amounts into U.S. dollar amounts and, in our opinion, such translation has been made on the basisdescribed in Note 1 to the consolidated financial statements.
KPMG AZSA & Co.
Tokyo, JapanJune 29, 2004
Independent Auditors’ ReportSumitomo Bakelite Company, Limited and Consolidated SubsidiariesYears ended March 31, 2004, 2003 and 2002
ベークライト財務 color 04.9.7 6:55 PM ページ 30

page 31Environmental Account ingSumitomo Bakelite Company, Limited
In fiscal 2000, Sumitomo Bakelite introduced environmental accounting as an effective tool to implement businessactivities in line with environment conservation. Environmental accounting quantifies the cost and effect associatedwith environmental conservation activities. It is an excellent tool to promote environmentally conscious businessactivities more efficiently and enhance the understanding of our efforts through disclosure to our stakeholders.
With reference to “Environmental Accounting Guidelines 2000, 2002” released by the Ministry of the Environment,we established a framework for quantitatively measuring progress to reduce environmental burden. Under theframework, we continuously make efforts to evaluate environmental conservation activities based on our owncompilation methods and enhance the effectiveness of our compilation methods through ongoing reviews andreassessment.
In fiscal 2000, we introduced environmental accounting at our five plants and two laboratories and subsequently,expanded its scope to all of our domestic business establishments including our affiliated companies (listed below).
Environmental Conservation Costs for Fiscal 2003
Period: April 2003 to March 2004Scope of Compilation: Sumitomo Bakelite Co., Ltd.
Amagasaki Plant, including subsidiaries and affiliated companies on the premise; Shizuoka Plant, includingsubsidiaries and affiliated companies on the premise; Utsunomiya Plant and Tsu Plant; FundamentalResearch Laboratory and Kobe Fundamental Research Laboratory of Sumitomo Bakelite Co., Ltd.; AkitaSumitomo Bakelite Co., Ltd.; Artlite Kogyo Co., Ltd.; Tokyo Kakohin Co., Ltd.; Hokkai Taiyo Plastic Co.,Ltd.; Yamaroku Kasei Industry Co., Ltd.; Kyushu Bakelite Industry Co., Ltd.
Activity Investment Expenses Description(Millions of yen) (Millions of yen)
(A) Reduction of environmentally hazardous emissions
(B) Energy conservation
(C) Reduction of industrial waste, promotion of recycling, and waste treatment
(D) Product evaluation at R&D stage
(E) Reduction of the up/downstream environmental burden
(F) Environmental management activities
(G) Contributions to social activities
(H) Response to environmental damage
Total
¥57 ¥ 187 • Renovation of waste-water treatment equipment• Installation of drainage
28 27 • Installation of cogeneration system• Equipment of air conditioners
10 560 • Removal of incinerator• Waste treatment
– 1,173 • R&D for environmentally friendly products
– 17 • Consignment fee to the Japan Containers andPackaging Recycling Association
0 258 • Personnel cost for environmental management activities
• Greening activities and maintenance for greenspace
– 1 • Activities for external communications
– –
¥95 ¥2,223
ベークライト財務 color 04.9.7 6:55 PM ページ 31
page 32
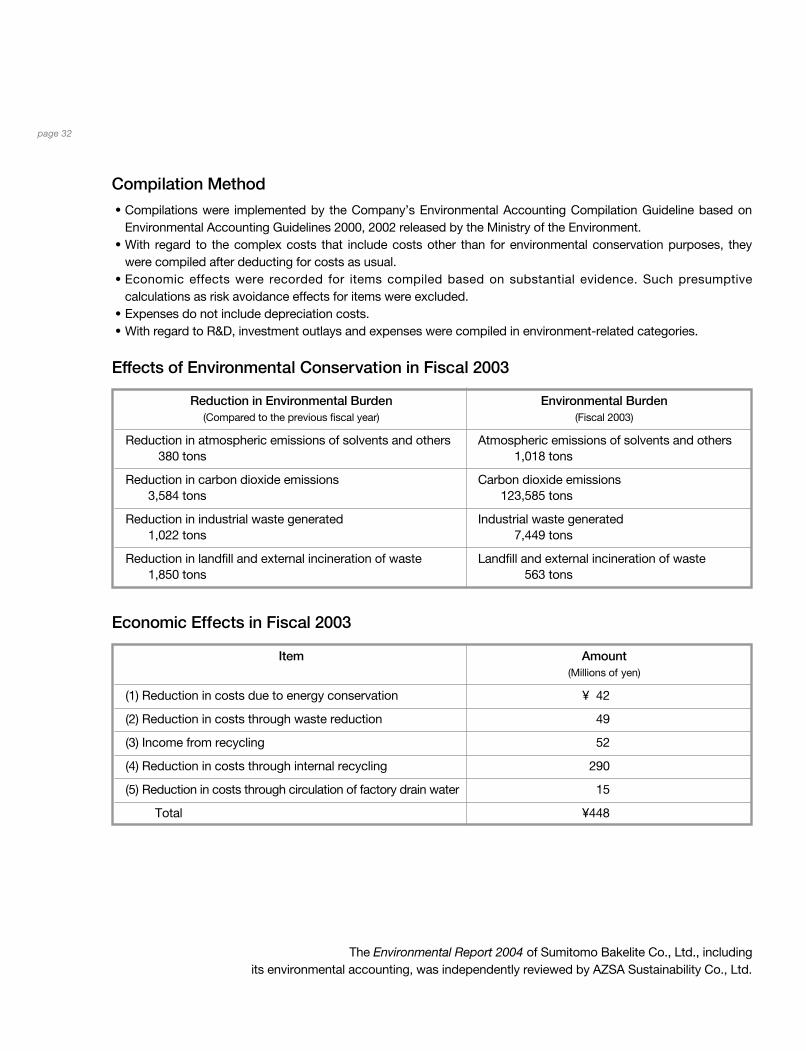
Compilation Method
• Compilations were implemented by the Company’s Environmental Accounting Compilation Guideline based onEnvironmental Accounting Guidelines 2000, 2002 released by the Ministry of the Environment.
• With regard to the complex costs that include costs other than for environmental conservation purposes, theywere compiled after deducting for costs as usual.
• Economic effects were recorded for items compiled based on substantial evidence. Such presumptivecalculations as risk avoidance effects for items were excluded.
• Expenses do not include depreciation costs. • With regard to R&D, investment outlays and expenses were compiled in environment-related categories.
Effects of Environmental Conservation in Fiscal 2003
Economic Effects in Fiscal 2003
The Environmental Report 2004 of Sumitomo Bakelite Co., Ltd., including its environmental accounting, was independently reviewed by AZSA Sustainability Co., Ltd.
Reduction in Environmental Burden Environmental Burden(Compared to the previous fiscal year) (Fiscal 2003)
Reduction in atmospheric emissions of solvents and others Atmospheric emissions of solvents and others380 tons 1,018 tons
Reduction in carbon dioxide emissions Carbon dioxide emissions3,584 tons 123,585 tons
Reduction in industrial waste generated Industrial waste generated1,022 tons 7,449 tons
Reduction in landfill and external incineration of waste Landfill and external incineration of waste1,850 tons 563 tons
Item Amount(Millions of yen)
(1) Reduction in costs due to energy conservation ¥ 42
(2) Reduction in costs through waste reduction 49
(3) Income from recycling 52
(4) Reduction in costs through internal recycling 290
(5) Reduction in costs through circulation of factory drain water 15
Total ¥448
ベークライト財務 color 04.9.7 6:55 PM ページ 32

page 33
ChairmanTsuneo Moriya
PresidentTomitaro Ogawa
Senior Managing DirectorIwao Yamaguchi
Managing DirectorsShigeru HayashiTakeichi HigashiguchiHideaki Ezaki
DirectorsAkio KosaiOsamu Kono
Managing Executive OfficersTakeshi UchimuraAtsumi Okayama
Executive OfficersToyoji OkunishiNobuaki SugimotoTamotsu YahataMasuo MizunoTsuneo Terasawa
Koichiro SekineMasaei YamadaShinichiro ItoKazuhisa HiranoShigeki Muto
Corporate AuditorsTakaharu HayashiShoji KosakaYamato MatoFumio Ogawa
(As of June 29, 2004)
Head Office:Tennoz Parkside Building, 2-5-8Higashishinagawa, Shinagawa-ku,Tokyo 140-0002, JAPAN
General Affairs Dept.Phone: +81-(0)3-5462-3434Facsimile: +81-(0)3-5462-4873
Corporate Finance & Planning Div.Phone: +81-(0)3-5462-3449Facsimile: +81-(0)3-5462-4876
Offices:Osaka Office2-3-47 Higashi-tsukaguchi-cho,Amagasaki, Hyogo 661-8588, JAPANPhone: +81-(0)6-6429-6941Facsimile: +81-(0)6-6427-8055
Nagoya Office87 Choda-cho, Meito-ku,Nagoya, Aichi 465-0027, JAPAN Phone: +81-(0)52-726-8351Facsimile: +81-(0)52-726-8396
Laboratories:Fundamental Research Laboratory495 Akiba-cho, Totsuka-ku, Yokohama, Kanagawa 245-0052,JAPANPhone: +81-(0)45-811-1661Facsimile: +81-(0)45-812-4898
Kobe Fundamental ResearchLaboratory1-1-5 Murotani, Nishi-ku, Kobe, Hyogo 651-2241, JAPANPhone: +81-(0)78-992-3900Facsimile: +81-(0)78-992-3919
Thermoplastic Products ResearchLaboratory(Located at Amagasaki Plant)
Circuitry Materials ResearchLaboratory(Located at Shizuoka Plant)
Molding Compound & Molding PartsResearch Laboratory (Located at Shizuoka Plant)
Industrial Resin Research Laboratory (Located at Shizuoka Plant)
Corporate Research CenterInformation & CommunicationsMaterialsElectronic Device Materials ResearchLaboratory IElectronic Device Materials ResearchLaboratory IIElectronic Device Materials ResearchLaboratory III (Located at Utsunomiya Plant)
Plants:Amagasaki Plant2-3-47 Higashi-tsukaguchi-cho,Amagasaki, Hyogo 661-8588, JAPANPhone: +81-(0)6-6429-6941Facsimile: +81-(0)6-6427-8055
Shizuoka Plant2100 Takayanagi, Fujieda, Shizuoka 426-0041, JAPANPhone: +81-(0)54-635-2420Facsimile: +81-(0)54-636-0294
Utsunomiya Plant20-7, Kiyohara-Kogyodanchi, Utsunomiya, Tochigi 321-3231, JAPANPhone: +81-(0)28-667-6211Facsimile: +81-(0)28-667-5519
Tsu Plant5-7-1 Takachaya, Tsu, Mie 514-0819, JAPANPhone: +81-(0)59-234-2181Facsimile: +81-(0)59-234-8728
Incorporated:January 25, 1932
Number of Employees:2,349
Major Subsidiaries and Affiliates:** Advanced Plastics Compound Company* Akita Sumitomo Bakelite Co., Ltd.* Artlite Kogyo Co., Ltd.* Bakelite Precision Molding (Shanghai) Co., Ltd.
Bakelite Shoji (Thailand) Co., Ltd.Bakelite Trading (Shanghai) Co., Ltd.
* BASEC Hong Kong LimitedCMK Europe N.V.
** CMK Singapore (Pte.) Ltd.** CMKS (Malaysia) Sdn. Bhd. * Decolanitto Corporation* Durez Corporation* Durez Canada Co., Ltd.* Fenocast, S.A.* Fers Resins, S.A.* Hokkai Taiyo Plastic Co., Ltd.
Japan Communication AccessoriesManufacturing Co., Ltd.
* Kyushu Bakelite Industry Co., Ltd.** Nippon Denkai Co., Ltd.
Otomo Chemical Co., Ltd.* P.T. Indopherin Jaya
** P.T. Pamolite Adhesive Industry* Promerus, Llc.* Rigidtex Sdn. Bhd.* SB Durez Holding, Inc.* SB Flex Philippines, Inc.
S.B. Information System Co., Ltd.S.B. Recycle Co., Ltd.
* S.B. Techno-Research Co., Ltd.SBTEG Co., Ltd.
* SNC Industrial Laminates Sdn. Bhd.SPD Co., Ltd.
* ST Film Sheet Co., Ltd.Sumibe Service Co., Ltd.
* Sumicarrier Singapore Pte. Ltd.* Sumicarrier (Thailand) Co., Ltd.* SumiDurez Singapore Pte. Ltd.* N.V. Sumitomo Bakelite Europe S.A.* Sumitomo Bakelite Europe (Barcelona), S.L.* Sumitomo Bakelite Hong Kong Co., Ltd.
Sumitomo Bakelite Macau Co., Ltd.* Sumitomo Bakelite Singapore Pte. Ltd.* Sumitomo Bakelite (Suzhou) Co., Ltd.* Sumitomo Bakelite (Taiwan) Co., Ltd.* Sumitomo Bakelite Vietnam Co., Ltd.* Sumitomo Plastics America, Inc.
** Sunbake Co., Ltd.* Tokyo Kakohin Co., Ltd.* Tsu-Kong Co., Ltd.* Tsutsunaka Plastic Industry Co., Ltd.* Yamaroku Kasei Industry Co., Ltd.
* Consolidated Subsidiaries** Affiliates to which the equity method is applied
(As of June 29, 2004)
Board of Directors, Executive Officers and Corporate Auditors
Corporate Data
S-c2c3 0820 color 04.9.7 7:11 PM ページ 2
Printed in Japan on recycled paper
S-c1c4 0820 04.9.7 7:15 PM ページ 1