ANNUAL REPORT - ECB Reports/ECB... · 2017-10-18 · 2015 ANNUAL REPORT ELECTRICITY CONTROL BOARD...
78
2015 ANNUAL REPORT
Transcript of ANNUAL REPORT - ECB Reports/ECB... · 2017-10-18 · 2015 ANNUAL REPORT ELECTRICITY CONTROL BOARD...

2015
ANNUAL REPORT
ELECT
RICIT
Y C
ON
TRO
L BOA
RD | A
NN
UA
L REPORT
2015

VISION“To be recognised as a leading regulator for achieving optimum viability and competition in
the Namibian energy industry.”
MISSION“To regulate and control the Namibian Electricity Supply Industry in the interest of all
stakeholders with regard to price, quality and reliability.”
CORE VALUES
ProfessionalismTo conduct every task to a standard of excellence and maintain the highest level of
technical competence and personal integrity/efficiency so as to ensure the satisfaction of all stakeholders.
IntegrityTo be accountable and act in accordance with government policy and accept full
responsibility for all outcomes; to be transparent, open, honest and fair in all dealings and communications with stakeholders.
InnovationTo innovate through learning, teamwork and knowledge sharing in order to remain
competitive in the market and to continue to deliver excellent service.
SustainabilityTo ensure the endowment of Namibia’s energy resources are available to present and
future generations by considering our economic, environmental and social responsibility.
Vision, Mission Statements and Corporate Values

2
Vision, Mission Statement and Corporate Values 1
Abbreviations/Acronyms 6
Board Members 7
ECB Management 8
Board Chairperson’s Report 9
Chief Executive Officer’s Report 10
1.1 Corporate Governance 1.1.1 Governance and Performance Agreements 12 1.1.2 Codes of Practice and Conduct 12 1.1.3 Appointment and Information about the Board Members 12 1.1.4 Constitution of Board Committee 14
1.2 Legislative Mandate 1.2.1 Future Legislative Reforms 14 1.2.2 Legal Instruments 14 1.2.3 Legal Projects 16 1.3 Human Capital Management 1.3.1 Appointments 16 1.3.2 Promotions 16 1.3.3 Staff Turnover 17 1.3.4 Training & Development 18 1.3.5 Employee Wellness 19 1.4 Public Relations & Stakeholder Management 1.4.1 Public Relations 19 1.4.2 Stakeholder Management 19 1.4.3 Public Awareness and Sensitisation 19 1.4.4 Impact of Stakeholder Engagement and Public Awareness Initiatives 19 1.4.5 Corporate Social Responsibility 20 1.4.6 Future Outlook 20
1.5 Information Technology (IT) 1.5.1 Activities Carried out 20 1.5.2 Future Outlook 20
2. Economic Regulation 2.1 Tariff Setting and Methodology 22 2.2 Approved Tariffs 22 2.3 Cost Reflectivity of Tariffs 25 2.4 Local Authority Surcharge 25 2.5 Modified Single Buyer Model 26 2.6 Economic Regulation Projects 26 2.7 Economic Regulatory Tools 27 2.8 Future Outlook 28
Table of Contents

3
3. Technical Regulation 3.1 Quality of Supply Standards 28 3.2 Quality of Service Standards 29 3.3 Demand Side Management and Energy Efficiency 29 3.4 Technical Regulation Projects 29 3.5 Technical Regulatory Tools 32 3.6 Future Outlook 32
4. Regulatory Support Services 4.1 Licensing Status and Update 33 4.2 Licensing Compliance 36 4.3 Compliance Audits Conducted 37 4.4 License Complaints 37 4.5 ESI Capacity Building 37 4.6 Regulatory Support Service Projects 37 4.7 Future Outlook 40
5. Industrial Analysis 5.1 Electricity Sector Performance Results 40 5.2 Key ESI Statistics 43
6. Regional and International Activities 6.1 Regional Electricity Association of Southern Africa (RERA) Activities 48 6.2 African Forum for Utility Regulators (AFUR) 48 6.3 International Electrotechnical Commission (IEC) and the African Electrotechnical Standardization Commission (AFSEC) 48 6.4 World Enengy Council (WEC) 48
7. Overview of ECB Performance 49
8. Annual Financial Statements 54

4
Tables
Table 1: Board Members 13
Table 2: Board Meetings 13
Table 3: Board Committees 14
Table 4: Legal Instruments 15
Table 5: Selection of Training Interventions, Workshops and Seminars attended 19
Table 6: Statistics on Quality of Supply Logger Placement 28
Table 7: List of Licensed Independent Power Producers 34-35
Table 8: List of Customer Complaints Reported 37
Table 9: Performance of REDs 41
Table 10: Performance of Distribution Companies Outside RED Area 42
Figures
Figure 1: Filled vs Vacant Positions 17
Figure 2: Gender Distribution 18
Figure 3: Wholesale Electricity Price Path 23
Figure 4: Share of energy sources (GWh and percentage) 23
Figure 5: Percentage share of Local Generation vs Import - Energy 24
Figure 6: Impact of Imports and Electricity Tariffs in Namibia - Energy Cost Component 24
Figure 7: Impact of Imports on Electricity Tariffs in Namibia - Average Generation Tariff 24
Figure 8: Electricity Sector Value Chain 41
Figure 9: Namibian Electricity Generation vs Demand 43
Figure 10: Units into the System and Units Consumed 43
Figure 11: NamPower Losses 44
Figure 12: Retail Tariffs Increase Over Time 44
Figure 13: Average Annual Tariffs Per Customer Category 45
Figure 14: Total Number of Customers Per Customer Category 45
Figure 15: Total Electricity Consumption 46
Figure 16: Total Electricity Revenue from Customers 46

5

Abbreviations/Acronyms
6
AFSEC African Electrotechnical Standardisation Commission
AFUR African Forum for Utility Regulators
CEO Chief Executive Officer
CFL Compact Fluorescent Lamp
CSP Concentrated Solar Power (Solar Thermal)
DSM Demand Side Management
DSMEE Demand Side Management and Energy Efficiency
ECB Electricity Control Board
EDI Electricity Distribution Industry
EIA Environmental Impact Assessment
ELECTRICITY ACT Electricity Act 2007 (Act No. 4 of 2007)
ER Economic Regulation
ERP Enterprise Resource Planning
ESI Electricity Supply Industry
Gx Generation
HR Human Resources
IPP Independent Power Producer
IEC International Electrotechnical Commission
IT Information Technology
LA Local Authority
LAS Local Authority Surcharge
LRMC Long Run Marginal Cost
M&V Measurement and Verification
MME Ministry of Mines and Energy
MRLGHRD Ministry of Regional and Local Government, Housing and Rural Development
MURD Ministry of Urban and Rural Development
NIRP National Integrated Resource Plan
NQA Namibia Qualifications Authority
NTA Namibia Training Authority
PPA Power Purchase Agreement
RC Regional Council
RED Regional Electricity Distributor
RERA Regional Electricity Regulators Association
RET Renewable Energy Technology
RSS Regulatory Support Services
SOE Act State-Owned Enterprises Governance Act (Act No. 2 of 2006)
SWH Solar Water Heater
TRD Technical Regulation Department
Tx Transmission
WEC World Energy Council

Board Members
7
Mr. Gottlieb Hinda Mr. Fritz Jeske Mr. Gerson Katjimune
Mr. Jason NandagoChairperson
Ms. Panduleni N. ShimutwikeniDeputy Chairperson

8
ECB Management
Mrs. Foibe L. NameneCEO
Mr. Rojas ManyameGeneral Manager Regulation
Ms. Mara UazengaGeneral Manager Finance and
Administration
Mr. Johann MalanManager Corporate
Communications and Legal Services
Mr. Kenneth !GaosebManager Human Resources
Mr. Pinehas MutotaManager Economic Regulation
Dr. Maxwell MuyamboManager Technical Regulation
Mr. Francois RobinsonManager Regulatory
Support Services
Ms. Rachel BooisManager Finance

9
Board Chairperson’s Report
“The future outlook is to ensure the completion of the EDI restructuring process.”
In the year under review, the corporate outlook of
electricity regulation in Namibia and the SADC region was
characterised by increasing consumer pressure to shift the
focus from exclusive utility sustainability to
consumer protection. In this regard, the ECB continuously
revised and updated its procedures and processes, among
which included the revision of the tariff methodology and
other regulatory instruments to ensure best practices in
the industry. The restructuring of the Namibian energy
sector, particularly the revision of its energy regulatory
framework, has reached an advanced stage and the
supporting legislative pieces have been drafted.
To ensure the optimisation of the electricity generation
resources mix, the ECB proposed a review of the National
Integrated Resource Plan (NIRP). The rationale is to
ensure that electricity infrastructure investments are
done in a coordinated manner and in line with the NIRP.
The private sector will have a role to play in contributing
to the energy mix. The energy mix for Namibia comprises
both the traditional fuel base and renewable energy such
as solar, wind, bio-fuels etc.
The EDI restructuring process is ongoing. This will ad-
dress the issue of service delivery and quality of supply,
especially in those areas falling outside established REDs.
To date, networks in many municipalities are in a poor
state, with substantial investment required to maintain
and rehabilitate these assets. The upgrade and
maintenance of distribution networks will be done in
accordance with an asset management strategy,
sufficient investment in planned and existing networks,
and the coordination of efforts to address national
distribution issues.
Going forward, the ECB will work on its transformation
into a multi sectoral energy regulatory body. The
transformed ECB will regulate downstream gas,
petroleum pipelines and renewable energy, in addition to
electricity. This transformation will be facilitated by
relevant bills developed by the ECB, which are awaiting
final approval. In the meantime, the ECB will remain
focused on undertaking sustainable regulatory
interventions to the benefit of its stakeholders.

10
Chief Executive Officer’s ReportThe country’s electricity industry has undergone various
changes in attempting to address specific goals set in its
energy policy, the White Paper on Energy Policy of 1998.
The industry has since been split in separate license
entities responsible for different sectors of the industry,
such as generation, transmission and distribution and
trading. While generation, transmission and trading
sections are still operated by the national utility
NamPower, the ECB believes that a monopoly is not
sustainable. Efforts are therefore ongoing to finalise and
implement the Modified Single Buyer Market Structure.
In addition to generation, an Independent Power Producer
(IPP) Investment Framework has been developed by the
Regulator to encourage IPP participation in the industry.
Apart from the fact that a number of licenses have been
issued in accordance with the IPP Framework the issue of
risk allocation between the IPPs and the off-taker remains
a stumbling block in the realisation of the licenced IPPs.
Lack of IPPs and other local generation capacity coming
into operation has perpetuated the country’s reliance on
electricity imports of up to 60% at times. This is a serious
risk and an impediment to the achievement of the
country’s development goals.
During the reporting year, the ECB performed regulatory
oversight over the Omburu Power Purchase Agreement
for a 4.5MW solar PV power plant near Omaruru.
Construction commenced in 2014 and should be
completed early in the new financial year. This is the first
renewable energy generating plant in Namibia procured
on an IPP basis.
The ECB, in conjunction with NamPower and the Ministry
of Mines and Energy, commenced with the interim REFIT
Programme, with 27 IPPs comprising solar PV, CSP,
biomass and wind-being invited to tender for 70MW
of renewal energy to be added to the national grid. The
capacity of each IPP under the programme is limited to
5MW and NamPower will be the off taker under the
power purchase agreements. The ECB approved
Renewable Energy Feed-In Tariffs (REFIT) for the
Programme. The deadline for financial close for the
Programme is 15 June 2016.
In a further development, NamPower, NEI, MME and the
ECB completed bid documents for a 3x10MW solar PV
tender. The tender will be issued in June 2015. The closing
date will be in the third quarter of the next
financial year.
The successful implementation of these programmes
would substantially increase the uptake of renewable en-
ergy into the generation mix as well as the involvement of
the private sector in generation.
The distribution industry is partially restructured. In some
areas, local authorities and other previous distributors
have been combined into Regional Electricity
Distributor utilities or REDs as they are commonly known.
This arrangement has realised benefits such as economies
of scale, equal regional focus (expertise and manpower),
harmonised tariffs, improved quality of supply and
services, customer focus and many more. The
restructuring however, brought with it some challenges
such as the reduced ability of the local authorities to

11
generate a surplus from electricity sales, since electricity
was and is used to subsidise other non-revenue
generating services. It is therefore imperative that a
solution on the funding and revenue of local authorities
be found.
Finally, Government at independence in 1990 identified
rural electrification as a priority, with the extension of the
grid to rural areas, enabling the connected communities
to participate in the mainstream economy and
accelerate the achievement of set socio-economic
development targets.
In order to improve access to electricity in urban and rural
areas the Regulator is developed a National
Support Mechanism that will enable electricity
distribution licensees to systematically improve access to
electricity in their areas of responsibility. The mechanism
is intended to complement the current rural electrification
efforts and deal specifically with urban areas that do not
have access to electricity.
Finally, electricity prices are expected to continue to
increase in the foreseeable future, due to increasing costs
of supply. Escalating prices are particularly felt by those
who scarcely make ends meet. It is important that
electricity remains affordable, to ensure the country’s
ongoing development and to protect low income
households. To this end, the ECB together with the
Ministry of Mines and Energy has developed a Support
Mechanism devised to make electricity more afford-
able for low electricity consuming households. The draft
mechanism is submitted to the Cabinet Committee on
Trade and Economic Development (CCTED) for
endorsement before submission to Cabinet for approval.
It is therefore important that efforts are focussed on
making a success of this noble idea. A vibrant and
stable electricity industry is a pre-requisite for a
developing economy, as society, businesses, industries
and manufacturers are dependent on it for growth.

12
Corporate Information and Development
1.1 Corporate Governance
Introduction The ECB is committed to complying with the principles
of good corporate governance and applicable legislation;
most notably the Electricity Act and the State-Owned
Enterprises Governance (SOE) Act. In its quest to adhere
to best practices and sound governance principles, the
ECB is continuously evaluating itself and its effectiveness
through appropriate mechanisms.
Board members are required by the Electricity Act to
disclose any private interests they may have in matters
that are under consideration by the Board and to withdraw
from any discussion thereof. In addition, board members
are required to disclose their interest on matters that are
decided on a round robin basis.
Complementary to the instruments above, the ECB is
investigating the potential application of the Corporate
Governance Code for Namibia and its guidance on best
practice principles.
1.1.1 Governance and Performance Agreements
In line with sections 17 and 18 of the SOE Act, the ECB
has prepared a governance agreement to be concluded
between the portfolio Minister and the Board in relation to
the issues stipulated in the above-mentioned section 17,
and prepared performance agreements to be concluded
between the portfolio Minister and individual Board
members as anticipated in section 18. These agreements
are subject to approval by the Board, the line Ministry and
the SOE Governance Council.
As the term of the current Board is expiring in December
2015, these agreements will be presented to the new
Board once constituted. Key performance indicators will
ensure that performance of the Board is measured against
set targets, in line with the Strategic Plan of the ECB.
1.1.2 Codes of Practice and ConductIn 2010, the ECB established a Board Charter. The Board
Charter provides guidance to Board and Board Committee
members on the conduct required of them in the execution
of their duties. The Board Charter covers key aspects
such as the roles and responsibilities and duties of the
Board members, the composition of the Board and Board
committees, procedural matters regarding Board and
committee meetings, delegations, disclosure of interest
and annual performance evaluations. The Board Charter
is currently under review in order to ensure that it takes
cognisance of developments in this area.
1.1.3 Appointment and Information about the Board MembersBelow is a table indicating the appointment dates and
current terms of the Board Members:
Table 1: Board Members
Board Member Status Date of First
Appointment
Date of Current
Appointment
Current Term
Mr Jason Nandago Chair 15 March 2000 14 December 2011 4 years
Ms Panduleni N. Shimutwikeni Deputy Chair 14 December 2007 14 December 2011 4 years
Ms Foibe L. Namene Ex-officio member* 1 June 2014 1 June 2014 5 Years
Mr Gottlieb Hinda Member 17 March 2011 14 December 2011 4 years
Mr Fritz Jeske Member 4 November 2002 14 December 2011 4 years
Mr Gersom Katjimune Member 4 November 2002 14 December 2011 4 years
*In terms of section 11(2)(a) of the Electricity Act, the ECB’s CEO is an ex officio member of the Board but has no right
to vote.
In terms of section 7(1) of the Electricity Act, the Board is required to meet at least once every three months. During the
period under review, nine Board meetings were held of which four were ordinary meetings and five were special meetings.
During the reporting period, the Board members and their attendance at Board meetings of the ECB were as follows:
Table 2: Board Meetings
ELECTRICITY CONTROL BOARD MEETINGS 2014/15
Board Member Status Meetings Attended
Mr Jason Nandago Chair 6
Ms Panduleni N. Shimutwikeni Deputy Chair 4
Ms Foibe L. Namene CEO* 6
Mr Gottlieb Hinda Member 7
Mr Fritz Jeske Member 8
Mr Gersom Katjimune Member 7
Mr Rojas Manyame General Manager Regulation (Acting CEO)+ 2
*Mr Manyame was acting CEO from 31 March 2014 to 31 May 2014 until the appointment of Ms Namene as CEO on 1
June 2014.

14
1.1.4 Constitution of Board Committees
The ECB has established Board Committees and appointed thereto the Board members indicated in the table below:
Table 3: Board Committees
ELECTRICITY CONTROL BOARD COMMITTEES
Finance, Audit and Risk Committee Regulation Committee Human Resources and Remuneration
Committee
Mr Gersom Katjimune (Chair) Mr Fritz Jeske (Chair) Ms Panduleni N. Shimutwikeni (Chair)
Mr Gottlieb Hinda Mr Gottlieb Hinda Mr Gersom Katjimune
Mr Fritz Jeske Mr Jason Nandago Mr Jason Nandago
Ms Foibe L. Namene Ms Foibe L. Namene Ms Foibe L. Namene
* The CEO of the ECB is an ex-officio member of all the Committees.
1.2 Legislative Mandate
There has been no significant changes in the ECB’s
legislative mandate during the reporting period, which
is provided for in the Electricity Act No 4 of 2007. The
Act establishes a national regulatory framework for the
electricity supply industry and provides for licensing
of operators in the electricity supply industry (import,
export, generation, trading, transmission, distribution and
supply) as well as for independent tariff regulation by the
ECB. The ECB further continues to build on and extend its
regulatory mandate by means of appropriate regulatory
instruments.
1.2.1 Future Legislative ReformsThe Electricity Act is currently under revision. A new
Energy Regulatory Authority Bill is being finalised which
would see the transformation of the Electricity Control
Board into the Energy Regulatory Authority which in
addition to the regulation of electricity, would also be
responsible for the regulation of downstream gas and
petroleum.
i. The Namibia Energy Regulatory Authority Bill
In terms of this Bill, the ECB will be transformed into an
Energy Regulator whose duty will be to oversee electricity,
downstream gas and downstream petroleum in
accordance with energy-specific legislation. A major new
aspect to be introduced by the Bill is the establishment of
a specialised Energy Tribunal in the energy sector. The
objective of the Energy Tribunal would be to deal with
disputes and appeals lodged under the energy-specific
legislation.
ii. The Electricity Bill
This Bill will deal exclusively with the ESI, including
licensing and tariffs subject to Government policy. Specific
attention is paid to effective and efficient enforcement
mechanisms. The new Bill will broaden the scope for both
voluntary and compulsory enforcement mechanisms so
as to enable the Energy Regulator to ensure compliance
with the Bill and supplementary instruments such as rules,
codes and standards. The Bill will further create a more
formalised foundation for market reform to ensure the
growth and modernisation of the ESI.
iii. Gas Bill
The Gas Bill which is being developed provides for the
establishment of a regulatory and licensing framework for
gas transportation and distribution networks, licensing for
the downstream gas industry to ensure safety, efficiency
and environmental responsibility in the transportation and
distribution of natural gas, and will create the framework
to encourage investment in the sector and to promote
competition.
1.2.2 Legal InstrumentsIn the table below a summary is provided of past, current
and anticipated legal instruments through which the ECB
and the electricity industry are regulated:

15
Table 4: Legal Instruments
No NAME OF INSTRUMENT NATURE STATUS
A National Legislation
A1 Electricity Act, 2 of 2000 Statute Repealed
A2 Electricity Act, 4 of 2007 Statute In operation
A3 Namibia Energy Regulatory Authority Bill,
2014
Statute Draft Bill
A4 Electricity Bill, 2014 Statute Draft Bill
A5 Gas Bill National statute Under consideration
B Government Gazette Notices
B1 Imposition of Levy on Electricity under Elec-
tricity Act
Notice by Minister in
Government Gazette
Current operational ECB levy on
electricity
C Regulations
C1 Electricity Regulations: Administrative, 2000 Ministerial regulations Repealed
C2 Electricity Regulations: Administrative, 2011 Ministerial regulations In operation
D ECB Rules, Codes and Standards
D1 Technical Rules ECB rules Awaiting promulgation by Ministry
of Justice
D2 Economic Rules ECB rules Awaiting promulgation by Ministry
of Justice
D3 Resale Rules ECB rules Under development
D4 Safety Code ECB code In operation
D5 Quality of Supply and Services Standards Standard In operation
D6 Connection Charge Policy ECB rules In operation
D7 Transmission Grid Code ECB Code Approved by line Minister. Awaiting
promulgation by Ministry of Justice
D8 Distribution Grid Code ECB Code Approved by line Minister. Awaiting
promulgation by Ministry of Justice
D9 Net Metering Rules ECB rules Approved by line Minister. Awaiting
promulgation by Ministry of Justice
D11 REFIT Rules ECB rules Draft format
D12 Distribution Infrastructure Standards Standards Approved by line Minister. Awaiting
promulgation by Ministry of Justice
D13 Maintenance Guidelines Guidelines Awaiting promulgation
E ECB Internal Rules
E1 ECB Complaints Procedure (November
2010)
Internal ECB procedure Approved by means of ECB Board
resolution
E2 Mediation Procedures Internal ECB procedure Approved by means of ECB Board
resolution
E3 Public Hearing Procedural Rules Internal ECB procedure Approved by means of ECB Board
resolution
E4 Confidentiality Procedures Internal ECB Procedure Initial drafting stage

16
1.2.3 Legal ProjectsDuring the reporting period, work on the Farmers Schemes
Project and the Enforcement Mechanism Project, which
commenced in 2013, did not make significant progress
because there was a vacancy in the Legal Office, which
was only filled in November 2014.
The Farmers Schemes Project will investigate problems
experienced with existing farmer electricity distribution
schemes, and will provide recommendations for setting
up new schemes, while the Enforcement Mechanisms
Project is aimed at improving compliance with licensing
conditions and other regulatory tools.
The Farmers Schemes Project and the Enforcement
Mechanism Project will be completed during the next
reporting period.
1.3 Human Capital Management
IntroductionThe human resource function at the ECB encompasses
recruitment and selection, employee wellness, employee
relations, and training and development. This report
addresses all the areas of responsibility.
The ECB’s Human Resource Strategy is fully aligned to its
corporate strategy and therefore aims to attract and retain
key talent in order to build organisational competencies
and leadership capacity for long-term growth, and to
cement the ECB’s reputation as an employer of choice. It
is directed towards good levels of remuneration (which is
regularly benchmarked against its peers) and a concerted
effort to retain and manage the ECB’s talent pool.
1.3.1 AppointmentsDuring the reporting period, the number of staff members
employed by the ECB increased to 30, which is a good
indication of the substantial job creation opportunities
created by the organisation, with the following
appointments made:
Name Position
Mrs. F.L. Namene Chief Executive Officer
Mr. L.A.T. Amuanyena Senior Engineer
Mr. L. Namupala 2x Compliance
Mr. M.V. Shuudeni Monitoring Engineers
Mr. J. Malan Manager : Corporate & Legal
Services
Ms. D. Wakudumo Receptionist
1.3.2 PromotionsAs a result of the expansion of the organisational structure,
new positions were created with new staff members
appointed as well as existing staff members having been
promoted to higher positions during the reporting period.

17
The following staff members were promoted as indicated hereunder:
Name Promoted from: Promoted to:
Mrs. R Boois Accountant Manager: Finance
Mrs. C. Katjimune Assistant Account Accountant
Mr. F. Kooper Cleaner/Driver Assistant Accountant
Ms. V. Ethingo Receptionist Human Resource Officer
1.3.3 Staff Turnover
During the reporting period, only one staff member terminated employment with the ECB, resulting in a staff turnover of a
mere 3.23%; much lower than the industry norm of 10%.
COMPARATIVE ANALYSIS OF FILLED VS VACANT POSITIONS FOR 2014/2015
Figure 1: Filled vs. Vacant Positions

18
GENDER DISTRIBUTION AT DIFFERENT EMPLOYMENT LEVELS
Figure 2: Gender Distribution
VACANCIES EXPECTED TO BE FILLED IN THE 2015/2016 FINANCIAL YEAR
Legal Assistant
Public Relations Assistant
Modeller
Project Management Officer
IT Technician
1.3.4 Training and Development The Electricity Supply Industry (ESI) is a dynamic
environment and therefore our structured employee
training and development interventions are aimed at
raising the competency levels of our staff members,
encourage engagement and productivity, and to retain
key talent. Our leadership development programmes
develop skills and competence in specific areas. These
include business acumen, developing a global perspective,
leveraging diversity for high performance, and nurturing
and developing talent. For the period under review,
employees had attended training programs, workshops
and seminars locally, regionally and abroad. Some of the
training interventions, workshops and seminars attended
are listed hereunder:

19
Course/Workshop/Seminar Service Provider
Executive Development Program (EDP) University of Cape Town, SA
Operating Regulations for High/Medium Voltage Systems
Workshop
Amabhubesi
Managing Competitive Commercial Tenders Corporate Training and Events Management Division
International Training Program on Utility Regulation and
Strategy
University of Florida, USA
Africa Energy Indaba South African National Energy Association (SANEA), SA
1.3.5 Employee Wellness A number of key employee wellness initiatives
implemented during the reporting period included
improving employee awareness about health issues,
such as high cholesterol, diabetes and hypertension,
stress, anxiety and/or depression, and health and safety
awareness. A team building activity was held to improve
employee morale and cohesion.
1.4 Public Relations & Stakeholder Management
IntroductionThe ECB has for many years reflected on various Corporate
Social Responsibility initiatives in its Annual Report, but
not its Public Relations and Stakeholder Management.
The inclusion of this important aspect will enrich the
ECB’s reporting obligations.
1.4.1 Public RelationsThe Public Relations Department serves as the central
source of information to the ECB’s internal and external
stakeholders, as well as the public, on current and future
initiatives. Its key role is to enhance the image of the
ECB through developing and maintaining sound media
relations and to spearhead public education initiatives
in order to raise public awareness using various media
channels and tools.
1.4.2 Stakeholder ManagementStakeholder Engagement and Stakeholder Management
are relevant to any type of organization, especially in the
context of a regulatory authority.
The ECB identified the following groups as its stakeholders:
Government and other regulatory bodies; electricity
consumers; advocacy groups and representative bodies;
licencees; media; other electricity regulators and regional
bodies, and investors. Its stakeholder engagement and
stakeholder management strategies were extended to
these entities during the reporting period.
1.4.3 Public Awareness and SensitisationDuring the reporting period, the ECB deployed various
public awareness and sensitisation initiatives using the
mass media. Press conferences, radio and television
interviews on regulatory matters of the Namibian ESI
formed part of the strategies. The interviews conducted
were broadcast on NBC TV, NBC National Radio and its
Current Affairs Programme, Base FM, Radio Energy and
published articles in leading local magazines including the
internationally acclaimed TIME Magazine.
The ECB participated in the Windhoek Industrial and
Agricultural Show and the Ongwediva Annual Trade Fair.
The information disseminated answered questions on the
duties and functions of the ECB, rights and obligations
of various stakeholders and complaints handling and
resolution. Information was disseminated face-to-face
by ECB officials and through publicity materials such as
pamphlets, flyers, newsletters, the Annual Report and the
ECB’s Statistical Bulletin.
1.4.4 Impact of Stakeholder Engagement and Public Awareness Initiatives
The strategies and initiatives deployed improved
understanding of the ECB’s role in the Namibian ESI,
improved compliance on the part of regulated entities as
well as raising awareness through an increased number
of enquiries and consultations on regulatory matters from
consumers and potential investors.
Table 5: Selection of Training Interventions, Workshops and Seminars attended

20
1.4.5 Corporate Social Responsibility Cognisant of its Corporate Social Responsibility, the
ECB sponsored nine social and community development
initiatives to the value of N$270,000.00. The Hifikepunye
Pohamba Foundation and Hindjou Gardening received
the lion’s share of N$100,000.00 and N$79,000.00
respectively.
The ECB also offered bursaries and financial assistance,
worth more than N$310,000.00 to ten deserving students
from previously disadvantaged backgrounds for studies in
Engineering, Accounting and Law, amongst others.
1.4.6 Future OutlookSince efficient and effective communication is key for the
success of any institution, the Department will strive to
implement strategies geared towards improving the way
the ECB presents itself and communicates its mission,
vision, core values and functions with its internal and
external stakeholders and the public, as well as create
awareness and positive perception of the ECB as a brand.
1.5 Information Technology (IT)
IntroductionThe Information Technology function at the ECB serves
to support business processes, enhance communication
and to store organisational information. While IT is
used primarily for communicating and storing data
electronically, it is also used for more specialised
functions such as tariff determination, financial modelling
and enterprise resource planning.
1.5.1 Activities Carried Out
IT Procurement took precedence at the beginning of the
reporting period. Obsolete computer equipment was
replaced and new hardware & software was purchased for
new staff members. Furthermore, the network bandwidth
was doubled in order to increase the internet speed
and the accessibility to rich media content. In addition,
the internal Stock Control system was redeveloped. In
addition, IT support was extended beyond the main office
and now also caters to the ECB satellite office at Bismarck
Village.
A tender process was initiated to select a consultant
to implement an Electronic Document and Records
Management System (EDRMS). 13 companies submitted
bids, and subsequent to a thorough evaluation process, a
successful company was awarded the tender. The EDRMS
will be implemented in the 2015/2016 financial year. The
key deliverables of the project are:
• Development of a global file plan that complies with
the National Archives Act of 1992 and the Archives
Code of the National Archives of Namibia
• Development of document and record management
policies
• Training of ECB staff on filing principles
• Installation of a customisable EDRMS
Since 2010, the IT functions have primarily been
undertaken by one person, the IT Specialist. This posed a
risk to the organisation in terms of capacity and continuity,
and therefore to alleviate the risk, an IT Technician was
appointed in August 2014, initially on a contract basis and
then permanently as from March 2015. This appointment
was important as it has significantly improved the ECB’s
IT capacity.
1.5.2 Future OutlookThe main emphasis of IT will remain on maintaining the
operational functionality of the ECB’s IT infrastructure
and systems, and deliberate actions will be taken to look
at governance issues as well.
IT Governance (ITG) is defined as the processes that
ensure the effective and efficient use of IT in enabling
an organisation to achieve its goals. IT governance adds
structure to the process of aligning IT with business
strategies, producing measurable results, meeting
regulatory and legal obligations, and ensuring that
investments result in positive gains. Establishing an
IT Governance Framework will involve reviewing IT
practices, policies and procedures.
Operationally, the ECB’s IT setup is functional and sound.
It is now time for the focus to shift to a higher level. Going
forward IT will focus on aligning IT Strategy more closely
to the organisation’s fundamental strategic goal which is
to be “a leading regulator for achieving optimum viability
and competition in the Namibian energy industry.”.

21

22
2. Economic Regulation
IntroductionThe Economic Regulation Department is responsible for
the regulation of the ESI through the provision of efficient
economic and financial guidelines and advice to the Board
and stakeholders, the development of the industry’s tariff
systems and methodologies in line with Government
Policies and Legislation. The Department determines
generation, transmission and distribution tariffs and the
approval of revenue requirements for all licencees. The
Department further evaluates and assesses the impact of
the ESI on the economy and the end consumers.
2.1 Tariff Setting and Methodology
Tariff setting is conducted in accordance with the White
Paper on Energy Policy of 1998, which states that tariffs
should be cost reflective, reflect the long-run marginal cost
of supply, and be based on sound economic principles.
The tariff methodology applied by the ECB is known as
a “cost plus” methodology. This implies that the revenue
requirement (i.e. the cost) of a utility plus a regulated
return (i.e. the weighted average cost of capital)
determines the end-user tariff. The revenue requirement
includes all allowable costs of the utilities to cover the cost
of supply including the primary energy, energy imports,
bulk energy purchases, operating and maintenance costs,
customer service cost, overheads, asset-related costs and
investment costs.
In determining the Namibian electricity tariff levels, the
ECB consults and takes into consideration the expectations
of key stakeholders including the Government, private
sector and consumers. Before approving a tariff the
Regulator conducts an assessment of the likely impacts
that tariffs may have on the end-consumers and the
Namibian economy at large. Each licensee needs to have
its tariff levels approved by the ECB Board before they
may be implemented, and this process repeats itself on
an annual basis.
2.2 Approved tariffsFor the financial period 2014/2015, the ECB granted
NamPower an effective average tariff increase of 13.22%.
In order to relieve the impact of a high tariff increase
on customers, the Ministry of Mines and Energy made
available to NamPower an amount of N$150 million and
an additional N$20 million from the National Energy Fund
– Electricity Levy, to subsidise fuel costs for the thermal
power stations (Van Eck and Anixas).
Accordingly, NamPower was awarded a tariff increase
that is sufficient to cover the allowed revenue requirement
for the financial period 2014/2015 which translates into
cost reflective tariffs allowed for NamPower.
Distribution utilities which include Regional Electricity
Distributors (REDs) and Local Authorities were granted
tariff increases according to their specific revenue
requirements. Over the past years, the ECB has ensured
that electricity tariffs are consistent with and reflective of
the following three main regulatory objectives:
• equitably rewarding of investors (recovery of
allowable cost of supply plus the regulated rate of
return) while keeping prices affordable to consumers;
• ensuring quality of supply and service, taking
cognisance of different quality standards and
associated costs; and
• maximizing operational efficiency through
restructuring and performance evaluation and
monitoring.
Figure 3 depicts the projected NamPower electricity price
path between 2013/2014 and 2019/2020.

23
Figure 3: Wholesale Electricity Price Path
In general, once tariffs have reached cost reflectivity they
will reflect the long-run marginal cost of supply. The LRMC
includes the cost of introducing new generation projects
into the Namibian electricity mix and is to incentivise
additional investments in the sector.
During the year under review, Namibia continued to be
a net importer of electricity. Namibia imported 58% of
its electrical energy requirements from countries in the
SADC region. A breakdown of the share of energy sources
is provided in figure 4. The required level of imports
depends heavily on the availability of water at NamPower’s
Ruacana Hydro Power Station. Figure 5 depicts the trend
of imported and locally generated energy over the period
2010/2011 - 2014/2015
Figure 4: Share of energy sources (GWh and percentage)
Source: ECB NamPower Gx Tx Model
Source: ECB NamPower Gx Tx Model

24
Figure 5: Percentage share of Local Generation vs Import - Energy
Figure 6: Impact of Imports and Electricity Tariffs in Namibia – Energy cost component
Figure 7: Impact of Imports on Electricity Tariffs in Namibia – Average Generation Tariff
Source: ECB NamPower Gx Tx Model
Source: ECB NamPower Gx Tx Model
Source: ECB NamPower Gx Tx Model

25
Figure 6 above indicates the contribution of local
generation and imports as a percentage of tariffs to the
cost component of tariffs in Namibia, while figure 7 shows
a breakdown of the cost of imports and local generation
on the average generation tariff.
During that period, the average tariff of imports was
higher than the Namibian local bulk generation tariff.
This implies that the generation tariff is substantially
determined by imports which the ECB has little influence
over. In addition to the cost of imported electricity, local
tariffs are driven by following factors:
• the need for NamPower tariffs to remain cost
reflective;
• the need for additional investments in the generation
sector;
• increases in the prices of commodities and primary
energy sources such as oil and coal.
2.3 Cost Reflectivity of TariffsDuring the reporting period, NamPower was granted a
cost reflective tariff as per the Cabinet directive which
states that the utility tariffs should reach cost reflectivity
by 2010/2011 and remain so thereafter.
Due to shortage of electricity supply in the country and
the region, it is projected that the tariff in Namibia will
keep increasing in order to meet and cover the high import
costs of electricity. In order to contain the high increases,
efforts such as the contribution from the National Energy
Fund will go a long way in cushioning high tariff increases
to the consumers.
The ECB has allowed tariff increases of distribution utilities
to remain cost reflective in those cases where cost
reflectivity has already been reached, and to enable others
to reach cost reflectivity. This presented a particular
challenge to the ECB, mainly because of the high local
authority surcharges in some areas as well as the
different levels of tariffs which still exist amongst different
distribution utilities. This is mainly due to the fact that
some smaller utilities are unable to implement the correct
approved tariffs hence charging artificially low tariffs.
2.4 Local Authority SurchargeThe introduction of the REDs and the resultant handover
of the electricity distribution function to such REDs had the
potential to significantly impact on the financial positions
of Local Authorities (LAs) and Regional Councils (RCs).
Previously, LAs utilised revenues from electricity sales
not only to cover the cost of electricity purchases and
distribution but also to cross-subsidise other municipal
services. The surplus contributed some N$213 million
per year to the revenues of local government and was a
significant source of income to the LAs/RCs.
The Local Authority Surcharge was created to financially
support LAs/RCs after they handed over the electricity
supply function to the newly formed REDs. The initial
charge was based on the actual difference between
revenue and costs as reflected in the ring-fenced
electricity accounts. This is consistent with Government
policy that LAs and RCs should not be adversely affected
when they join a RED.
As agreed with relevant ESI stakeholders, the original
LA Surcharge is a fixed dollar amount per year, and has
remained so over the past eight years. Currently, the LA
Surcharge is added to the electricity tariffs and collected
by the REDs on behalf of the relevant LA or RC.
During the reporting period, some distribution licencees
approached the ECB to convert the LA Surcharge to a cent
per kWh charge which means that the total amount will
be based on sales volumes in a particular LA area. The
REDs have also introduced minimum LA surcharges as a
measure of fairness for those areas that originally did not
qualify for a fixed LA surcharge.
The Regulator intends to review the LA Surcharge
methodology in the next reporting period.
26
2.5 Modified Single Buyer ModelThe Modified Single Buyer Model is aimed at securing
energy supply security and private sector participation in
the electricity generation sector. During the reporting period,
NamPower remained Namibia’s Single Buyer, and is the only
utility licenced to import, export and trade electricity. This
also implies that NamPower is the only off taker of electricity
sourced from any Independent Power Producer (IPP).
The proposed Modified Single Buyer Model will allow IPPs
to sell electricity to large power users and distributors such
as REDs, Local Authorities and Mines. This is envisaged to
increase IPP participation in the industry.
The process of finalising and implementing the “Modified”
Single Buyer Model is on-going. During the reporting
period, little progress was made in implementing this
new market model. This was mainly due to the structural
changes that are still required to transform the ECB into
a multi-sectoral energy regulator. It is envisaged that the
market model will be defined as part of the new regulatory
legislation, which will also make it easier to implement.
2.6 Economic Regulation Projects During the reporting period, the following projects
as identified in the ECB’s current Strategic Plan were
implemented:
• Development of Net Metering Rules
In 2013, the ECB developed draft Net Metering Rules to
allow small solar photovoltaic (solar PV) and micro-wind
generators to be connected to the local distribution grids
(less than 500kW).
Due to the likely financial impact of the Rules on the
distribution utilities, the Regulator embarked on an
analysis to assess the impact that the rules might have
on distribution utilities. The project was completed during
the reporting period and no adverse financial impact was
identified. The Rules were approved by the Minister of
Mines and Energy for endorsement and submitted to the
Ministry of Justice for promulgation. It is expected that
the Rules will be published during the last half of 2015.
• Renewable Energy Feed-In Tariffs (REFIT)
The USAID continued with its technical assistance
to develop Feed-in-tariffs and draft REFIT levels and
associated rules for renewable energy technologies from
500kW to 5MW capacity.
Draft Rules await finalisation of the interim REFIT Program
before approval will be sought.
• Study on a National Electricity Support Mechanism
The project identified and assessed regional and
international options used to shield low income
households against rising electricity prices.
The analysis included a review of the relevant legal,
regulatory, technical, financial and economic constraints
and implications of introducing electricity support tariffs,
and development of scenarios on how such mechanisms
could be funded. The study also quantified the impact
that the introduction of an electricity support mechanism
has on the country’s economy, the electricity sector as a
whole, and low income end-users.
The project was approved by the Minister of Mines and
Energy and has been submitted to the Cabinet Committee
on Trade and Economic Development for endorsement
before implementation can proceed in the next reporting
period.
• Development of a Support Mechanism to Improve
the Electrification of Households in Urban and
Rural Namibia
While the established residential areas of towns and
villages are largely fully electrified, there is still a significant
number of un-electrified households and businesses in
peri-urban/informal areas where mostly low-income
urban households are found.
The project involves identification of different options
and development of the support mechanism to improve
electrification rates of the households. The project is
expected to be completed during the first half of 2015.
• Development of a Tariff Model for Kudu Power
Project
The ECB has developed a tariff model specifically to
assess the tariff for the Kudu Power Project. The project
entails documenting the tariff review process, assessment
of different funding options and an assessment of the
impact on the national bulk electricity tariffs.
The project is expected to continue until a final investment
decision is taken on the project.

• Review of NamPower Assets Revaluation
The project was aimed at reviewing NamPower’s
transmission assets revaluation report to provide an
independent opinion and recommendations to the ECB
regarding the submitted value, methodology and the
applicable revaluation adjustments necessary between
the revaluation periods. The project involved visiting
all major transmission sub-stations around the country
to validate information in the reports. The project was
successfully completed.
2.7 Economic Regulatory Tools
2.7.1 Rules
(a) Economic rules (undergoing promulgation)
The objects of the Economic Rules are:
(i) to ensure the efficient functioning and
development of the electricity industry, efficient
electricity provision; and security of electricity
provision;
(ii) to ensure that electricity tariffs and charges allow
licencees a reasonable rate of return in accordance
with these Economic Rules and the Board’s tariff
methodologies in order to assure that licencees
are able to finance the electricity services and
activities of their licenced undertakings;
(iii) to establish an environment where the Board can
effectively exercise control over, monitor and
enforce the economic regulation of electricity.
(b) The Resellers Rules
The objects of these Rules are:
(i) to establish a regulated environment within which
currently un-licenced redistribution and resale of
electricity can take place in order to ensure the
efficient conveyance and delivery of electricity
under exempted circumstances;
(ii) to ensure that the interests of clients, supplying
licencees and other electricity licencees operating
in the same area as a redistributor are sufficiently
protected as regards pricing, safety and standards
on quality of electricity provision and service of
electricity so delivered;
(c) Net Metering Rules (undergoing promulgation)
The objects of Net Metering Rules are:
(i) the generation of additional power into the national
grid, reducing the investment requirements of
utilities and conventional independent power
producers;
(ii) to allow customer-generators to reduce their
energy purchases from distribution networks
through generating for own consumption;
(iii) to allow customer-generators to export to
distribution networks up to the customer-
generators’ imports from distribution networks,
and limiting capacity of installation to below
500kW.
(iv) the promotion of sustainable renewable energy
sources, small scale investments, value addition
and electricity market development;
27

28
(d) Renewable Energy Feed in Tariff (REFIT) Rules:
The objective of the Rules is to set REFIT tariffs and the
conditions under which renewable energy would be
purchased. This only applies to RE technologies from
500kW to 5MW capacity.
2.7.2 Policies
National Connection Charge Policy
The overall objective of the National Connection Charge
Policy is to establish a standardized approach to dealing
with power network connections and associated
connection charges.
The Connection Charge Policy was endorsed by the
Minister of Mines and Energy and is effective as from
November 2012.
2.8 Future outlookThe substantial shortage of energy in the country is putting
pressure on energy tariffs. This situation will prevail until
sufficient new generation capacity is built locally and/or
regionally. The key challenge for the Economic Regulation
Department has been and still remains that of balancing
the interests and protection of the producers / suppliers
on the one hand, and the consumers on the other. The
Department will continue to monitor the impact of the
tariffs on the economy and to ensure that cost reflectivity
is maintained and electricity is supplied at affordable and
viable tariffs in a sustainable manner.
3. Technical Regulation
IntroductionThe Technical Regulation Department is responsible for
all engineering services required for regulatory oversight
or compliance and involves the development and
implementation of regulatory tools comprising technical
standards, regulations, rules and codes governing the
electricity network infrastructure design, operation
and maintenance. The Department focuses on quality
of supply and service issues, enforcing standards,
conducting technical audits, routine inspections and
accident/incident investigations.
3.1 Quality of Supply Standards The Namibian Quality of Supply standards were developed
in 2004 and their implementation commenced in 2006.
The implementation phase is to date still ongoing. Several
licencees have Power Quality Management Systems in
place and report to the ECB on an annual basis. As a result
of successful rolling out of the quality of supply project
from 2006 to date, through procurement and installation
of power quality data capturing, processing devices and
generation of power quality reports, the ESI has a relatively
good appreciation of what is involved in monitoring power
quality and managing potential risks linked to it.
Table 6 below illustrates the level of penetration of power
quality management systems based on the quantity of
functional monitoring devices procured and deployed by
licencees.
Table 6: Statistics on Quality of Supply logger placement
Licensee Power Quality
Devices - Vecto Graphs
Power Quality
Devices - Impedo Graphs
Functional
NORED 9 6 Yes
CENORED 0 5 Yes
ERONGO RED 19 3 Yes
OPE 5 2 Yes
City of Windhoek 25 10 Yes
NamPower 73 4 Yes
TOTAL 131 30

3.2 Quality of Service Standards The quality of service standards outline various service
activities and focuses on the minimum (guaranteed)
standards for measuring the quality-of-service provided
to customers by electricity distribution licencees in
Namibia. These standards are needed for evaluating
quality of service when granting distribution licences,
monitoring the performance of licencees on an ongoing
basis and when dealing with customer complaints.
The Namibian Quality of Service standards were
developed in 2004 and their implementation commenced
in 2006. The implementation phase is still ongoing.
3.3 Demand Side Management and Energy Efficiency
A study initially commissioned by the ECB to assess the
DSM status for Namibia was finalised in 2006. After
completion, a DSM Steering Committee (SC) was
established to facilitate the implementation of the findings
& recommendations of the study report. With passage of
time, activities of the SC slowed down, as a result of which
the committee was again revived at the beginning of 2015.
A stakeholder meeting to reaffirm consensus and discuss
the way forward was convened to revive DSM activities
during the reporting period.
The SC is the main body that oversees the implementation
of DSM Projects and creates a platform for DSM project
execution through policy making, technical support and
change agents to ensure that all the DSM projects become
a national success.
The key outcome of the 2006 DSM study report is the
implementation of specific DSM options identified for
Namibia using cost effective programs through:
• Consumer education;
• Dissemination of Compact Fluorescent Lights (CFLs)
and LED Lights;
• Time of Use (ToU) Tariffs;
• Installation of Ripple Control Systems for Electric
Water Heaters;
• Promotion of Solar Water Heaters;
• Promotion of energy audits.
A project to review the 2006 DSM study was
commissioned and advertised in the local media. The
process to evaluate the successful tenderer is underway.
3.4 Technical Regulation Projects
3.4.1 Wiremen’s Licensing Project
The focus of the project was to establish a national
institutional legal and regulatory framework for electrical
workers and electrical contractors in Namibia.
Through a broad consultative process, stakeholders
agreed to establish a National Stakeholder Working
Committee (SWC) to drive the process, chaired by
the ECB, with NamPower as the provider of secretarial
services.
The SWC objectives are to manage stakeholder relations,
secure resources required to drive the process, develop
the legal and regulatory framework, develop training,
certification and accreditation support mechanisms,
establish the Regulatory Body and implement
transformational change.
One of the project’s key milestones for the period under
review was the development of key road map documents
which include the Bill (for electrical workers and electrical
contractors), the electrical Installation Regulations, and
guidelines (Certificate of Compliance and Test Report)
and the registration criteria.
30
3.4.2 Enhancing Electricity Supply with the
National Integrated Resource Plan (NIRP)
The NIRP outlines and addresses the appropriate mix
of technologies and electrical energy requirements
needed for Namibia to achieve the aspiration of
sustainable economic growth. It further describes the
role of Government, ECB, Utilities, IPPs and other key ESI
stakeholders in meeting the country’s electrical energy
needs whilst building a sustainable industry.
The NIRP was developed between 2011 and 2013 under
the auspices of the Ministry of Mines and Energy. A
review process to summarise key outcomes of the NIRP
was undertaken during the reporting period as requested
by the Ministry of Mines and Energy. It was also
recommended that the NIRP be reviewed and updated to
be adequately responsive to new key developments with
respect to prioritised supply options and revised delivery
timelines.
3.4.3 Contestable Customers Project
The ECB commissioned a project to address a dispute
concerning the right to supply large power users, between
NamPower and REDs, particularly Erongo RED.
The project investigated all possible options and
extensively consulted with NamPower and Erongo RED
on the way forward. Key outcomes and conclusions have
been outlined in the final report.
3.4.4 Measurement and Verification Guidelines
Development Project
In order to credibly assess the impact of DSM and energy
efficiency measures being implemented by industry
stakeholders, the ECB commissioned a project on the
development of measurement and verification (M&V)
guidelines/protocols.
Four workshops took place. Key outcomes were:
• Introduction of Measurement and Verification
(M&V) general guidelines;
• Capacity building training on specific M&V
guidelines;
• Recommendations to initiate the process of
developing national standards on M&V;
• Practical M&V examples from participants.
On recommendations from industry stakeholders, the
Namibian Standards Institution (NSI) was formally
engaged to commence and lead the process of developing/
adopting M&V standards for Namibia.
3.4.5 Compliance Audits and Inspections
The Electricity Audit Manual and Inspection Guidelines
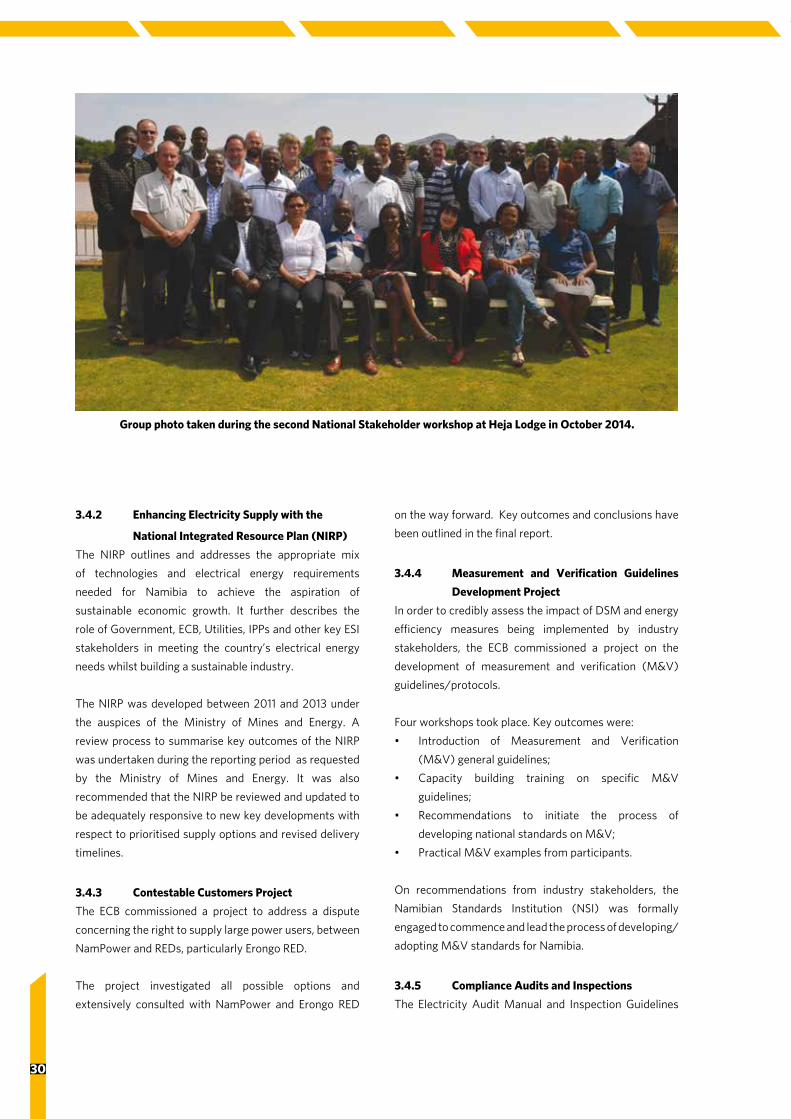
Group photo taken during the second National Stakeholder workshop at Heja Lodge in October 2014.
32
were developed and approved by both the ECB and the
Ministry of Mines and Energy. In line with the Audit
Manual and provisions of Section 37 of the Electricity
Act, Act 4 of 2007, the Electricity Control Board (ECB)
carried out technical compliance audits at the end of
2014 and at the beginning of 2015 on all licencees. The
ECB Audit Manual recommends that every licencee be
audited at least once every year. The objective of the
compliance audits is to establish the extent to which an
audited facility is complying with the stipulated licence
conditions, codes, standards and regulations.
Large licencees (such as NamPower and the REDs) were
generally found to be technically compliant, while small
licencees (such as village councils and regional councils)
were largely not compliant. Non-compliant issues ranged
from dilapidated electrical infrastructure to lack of proper
maintenance and safety concerns. Feedback letters were
prepared for licencees to address non-compliant issues
and follow up visits are being done regularly.
3.4.6 The state of affairs in smaller entities
(Okahandja, Maltahöhe and Berg-Aukas
Electricity supply at Okahandja, Maltahohe and
Beg-Aukas are a grave concern. The major concerns
include unsafe and illegal connections, aging electrical
infrastructure and live ABC cables lying on the ground.
These concerns were raised to respective stakeholders
for information and action.
3.4.7 Inspection of Hospitals and other Facilities
The project was initiated and commissioned by the ECB
to assess the status of availability and reliability of power
supply to Namibian hospitals and other critical service
facilities. This was partially necessitated by the tragic loss
of lives reported in the media and alleged to be a result
of unavailability of life support systems to designated
patients as a result of power supply failure.
Major critical facilities such as public and private hospitals,
airports and water pumping stations in all the 14 regions
were inspected at the end of 2014 and at the beginning of
2015 to assess the status and reliability of power supply.
Standby power supply at private hospitals and airports
was found to be reliable and servicing and maintenance
of standby generators is carried out adequately. Standby
power supply at public hospitals was generally found not
to be reliable and servicing and maintenance of standby
generators is not carried out adequately. Standby power
supply at water pumping stations is non-existent due to
the “no power no water” policy of Namwater. Feedback
letters were prepared for stakeholders to address non-
compliant issues.
3.5 Technical Regulatory ToolsIn line with provisions of Section 3 (4) (a) of the Electricity
Act; the Electricity Control Board (ECB), in consultation
with relevant industry stakeholders, developed several
regulatory tools for implementation to enhance the
regulatory processes.
3.6 Future OutlookWhile large distribution and supply entities such as
REDs and the City of Windhoek can be characterised
by satisfactory overall performance levels, the non-
compliance risk for smaller entities is high and it
would perhaps require a combination of appropriate
transformational and political interventions to address
these challenges.
Disillusioned by perceived perpetual mediocrity, electricity
consumers in some parts of Namibia are increasingly
frustrated by the mismatch between cost of service and
quality of supply and service. The regulatory challenge is
how to effectively enforce compliance in order to sustain
safety, consumer confidence and regulatory credibility.
There is no doubt that the impact of compliance auditing
will significantly enhance overall risk management efforts.
4. Regulatory Support Services
IntroductionThe main functions of the Regulatory Support Services
(RSS) Department are to research, plan, co-ordinate and
provide expert advice to the ECB on Namibia ESI issues as
well as to render support in the areas that are not clearly
economic or technical in nature.
The objectives of the Regulatory Support Services
Department are to ascertain that regulated aspects within
the Electricity Industry are operating according to set
objectives and performance frameworks and monitoring
these areas to ensure growth and financial health,
within the sector. Technical and economic compliance
of licencees and the enforcement of rules and codes
of conduct in the ESI remain a priority objective for the
Department.

33
4.1 Licensing Status and UpdateAmongst others, the ECB’s mandate according to the
Electricity Act of 2007, is to make recommendations
to the Minister with regard to the issuing of licences
and their conditions. The ECB is managing licences
for suppliers in the ESI by means of issuing, transfer,
amendment, renewal and/or cancellation. One of the
main task of the RSS Department, is the management
of licences and monitoring licencee performance
to ensure compliance with licence conditions and
requirements.
The licencing activities undertaken during the review
period are summarised in this section.
4.1.1 New Licences issued
• Aloe Investment (Pty) Ltd: A Generation Licence was
issued to Aloe Investment (Pty) Ltd at Rosh Pinah.
The plant will use solar PV technology with 4.9MW
capacity and the licence is valid for 25 years.
• Orange Hydro Falls (Pty) Ltd: A Generation Licence
was issued to Orange Hydro Falls (Pty) Ltd at
Velloorsdrift, the plant will be a mini hydro with a
20MW capacity and the licence is valid for 25 years.
• Camelthorn Business Venture (Pty) Ltd: A Generation
Licence was issued to Camelthorn Business Venture
(Pty) Ltd at Outapi, the plant will use solar PV
technology with 4.9MW capacity and the licence is
valid for 25 years.
• Sunchem Alpha Investment (Pty) Ltd: A Generation
Licence was issued to Sunchem Alpha Investment
(Pty) Ltd at Otjiwarongo. The plant will use biomass
technology with 5MW capacity and the licence is
valid for 25 years.
• Phatsimo Solar Power (Pty) Ltd: A Generation
Licence was issued to Phatsimo Solar Power (Pty)
Ltd at Otjiwarongo. The plant will use solar PV with
5MW capacity and the licence is valid for 25 years.
1.8.2.2 Licences amended
• OKA Investment (Pty) Ltd,
• Africa Energy Cooperation (Pty) Ltd
• Erongo Diagram Investment (Pty) Ltd
• Arandis Power (Pty) Ltd
• Ark Industries Namibia (Pty) Ltd
• Diaz Wind Power (Pty) Ltd
• GreeNam Electricity (Pty) Ltd for Mariental site,
• GreeNam Electricity (Pty) Ltd for Keetmanshoop
• GreeNam Electricity (Pty) Ltd for Rehoboth site
These amendments were necessitated, amongst
other reasons, to extend validity periods, and to meet
requirements under the interim REFIT programme.
4.1.2 Licences renewed
The distribution and supply licences in areas initially
earmarked for the Southern RED and Central RED were
renewed to local authorities for another year, as both
REDs have not been established yet.
4.1.3 Licences cancelled
Khomas Power (Pty) Ltd’s distribution and supply licences
were cancelled. The permission to distribute electricity in
the area in the interim was granted to Millennium Energy
until such time that the distribution business would be
taken over by NamPower.

34
4.1.4 Licences under review
• Kudu Power Company (Pty) Ltd applied for a
new generation licence for the development of an
884MW gas-fired power plant. The application was
subjected to both internal and external due diligence
processes. A recommendation was submitted to the
Minister of Mines and Energy and the ECB is awaiting
his final approval.
• Xaris Energy (Pty) Ltd applied for licence amendment
to increase capacity from the licenced 200MW up to
300MW. The ECB is busy finalising the application.
• Diaz Wind Power (Pty) Ltd applied for a licence
amendment to increase capacity from the licenced
44MW up to 72MW. The ECB is considering the
application.
Licensee Location Capacity
(MW)
Technology Date issued Duration
(Years)
Status
Diaz Wind Power Sperrgebiet near Luderitz 44 Wind 01-Apr-07 22 Valid
GreenNam Electricity Keetmanshoop 10 Solar PV 01-Jun-11 25 Valid
GreenNam Electricity Mariental 10 Solar PV 01-Jul-11 25 Valid
GreenNam Electricity Rehoboth 10 Solar PV 01-Jul-11 25 Valid
Arandis Power Arandis 120 HFO 01-Nov-11 30 Valid
Namibia Solar World Quinta, Omaheke Region 5 Solar PV 01-May-12 25 Valid
NamEnergy Solar Arandis 5 Solar PV 01-May-12 25 Valid
Momentous Energy Keetmanshoop 5 Solar PV 01-May-12 25 Valid
Uprise Investment Keetmanshoop 5 Solar PV 01-May-12 25 Valid
Ark Industries Namibia Rehoboth 16 Biogas 01-Jan-13 30 Valid
OKA Investment Ondangwa 20 Solar PV 01-Aug-13 25 Valid
Erongo Diagram
Investment
Arandis 5 Solar PV 01-Aug-13 25 Valid
Africa Energy
Corporation
Walvis Bay 5 Solar PV 01-Aug-13 25 Valid
Camelthorn
Business Venture
Outapi 4.9 Solar PV 01-Jul-14 25 Valid
Paramount
Infrastructure Dev
Khorixas 22 CSP 01-Sep-13 25 Valid
Osona Sun Energy Osona 4.5 Solar PV 01-Nov-13 25 Valid
Omburu Sun Energy Omburu 4.5 Solar PV 01-Nov-13 25 Valid
AFRES Okakarara 0.680 Solar PV 01-Apr-14 25 Valid
Phatsimo Solar Power Otjiwarongo 5 Solar PV 01-Jan-15 25 Valid
Table 7: List of Licenced independent Power Producers
• Metdecci Energy Investment (Pty) Ltd, Unisun
Energy (Pty) Ltd, FTN Investment (Pty) Ltd, Namib
Carbon Fertilizer (Pty) Ltd, Ombepo Energy (Pty)
Ltd, Alcon (Pty) Ltd and Tandii Investment (Pty)
Ltd applied for new generation licences to take part
in the interim REFIT programme. The ECB is busy
finalising the applications.
4.1.6 Independent Power Producers (IPPs)
The ECB issued licences to Independent Power Producers
as per Table 7 below. Diaz Wind Power, GreeNam
Electricity, Xaris Energy and Arandis Power are separately
negotiating with NamPower for a PPA since their licences
were issued before the interim REFIT process. The rest of
the licencees are designated to take part in the interim
REFIT Programme.

35
Licensee Location Capacity
(MW)
Technology Date issued Duration
(Years)
Status
Sertum Energy Trekkopje, Erongo Re-
gion
27 Solar PV 01-Apr-14 25 Valid
Xaris Energy Walvis Bay 200 Gas/OCGT 01-Apr-14 25 Valid
Aloe Investment No 27 Rosh Pinah 4.9 Solar PV 01-Oct-14 25 Valid
Alten Holdings
Namibia
Tsumeb 4.98 Solar PV 01-Jan-15 25 Valid
Alten Holdings
Namibia
Gerus 4.98 Solar PV 01-Jan-15 25 Valid
Sunchem Alpha
Investment
Cleveland, Otjozondjupa
Region
5 Biomass 01-Mar-15 25 Valid
Benzel Partners
Investment
Tsumeb 5 Solar PV 01-Mar-15 25 Valid
Hopsol Grootfontein 5 Solar PV Under con-
sideration
25 Under con-
sideration
Hopsol Otjiwarongo 5 Solar PV 01-Mar-15 25 Valid
Namibia International
Mining
Walvis Bay 210 Oil CCGT 01-Jun-07 20 Licence
lapsed
Vizion Energy
Resources
Walvis Bay 300 Coal 01-Apr-08 25 Licence
lapsed
VTB Capital Namibia Aussenkehr, !Kharas
Region
30 Hydro 15-Jul-07 20 Licence
lapsed
Electrawind Walvis Bay 50 Wind 01-Nov-09 20 Licence
lapsed
Innowind Walvis Bay 60 Wind 01-Mar-10 20 Licence
lapsed
CBEND Farm Pierre,
Otjozondjupa Region
0.250 Biomass 01-May-10 5 Licence
lapsed
EcoNam Energy Rehoboth 10 Solar PV 01-May-12 25 Licence
lapsed
Evofield Energy
Holdings
Farm Safier, Erongo
Region
10 Solar PV 01-Oct-12 25 Licence
lapsed
Atlantic Coast
Energy Co
Walvis Bay 700 Coal 01-Nov-07 25 Licence
lapsed
Table 7: List of Licenced independent Power Producers (continued)

36
The ESI is following the recommendations that were made
by a study carried out on how renewable energy must be
procured in Namibia. One such recommendation is that
any power plant with an installed capacity above 5MW
should be procured through competitive bidding and
all capacities less than 5MW, but should be larger than
500kW, procured through the Renewable Energy Feed in
Tariff (REFIT) programme. A total of 27 companies have
been shortlisted for the interim REFIT Programme and
once licenced will fill a capacity of 70MW reserved for
this Programme.
4.1.7 Challenges of IPPs to realise their projects
To date, the ECB licenced IPPs on an unsolicited basis. It
has become evident that most licensees wish to procure
financing on a finance basis, and their lenders have
demanded to see evidence of Government support in the
form of guarantees that the IPP will be able to operate
in Namibia during the full term of the PPA (average 20
years), and be able to service its debt and generate profits
for the investors.
The IPP requires certainty that the revenues from the Power
Project as per the PPA will not be deliberately eroded over
the term of the PPA through amongst others, Government
actions. IPPs need confidence in the investment climate
of the country, and require the Government to provide
certainty and stability guarantees on the risks related to
investing in Namibia, especially where the off-taker is a
wholly government owned institution, such as NamPower.
Government is investigating the need for such support.
Other challenges that IPPs are facing include: :
• Acceptable Tariffs
• Transmission connection charges
• Renewable energy mapping
Although NamPower is the official buyer and seller of
electricity on national level, instances are cropping up
of smaller IPPs wanting to sell their electricity to, for
example, REDs. The price at which the power would be
bought by NamPower or another off-taker is mutually
agreed upon and subject to approval by the ECB before
the IPP establishes its power plant. Under the proposed
Modified Single Buyer Model, NamPower retains the
exclusive right to import and/or export electricity across
Namibia’s borders.
4.2 Licensing ComplianceThe ECB continued to receive six monthly reports from
licensees during the reporting period in line with an
instruction given by the ECB Board in the 2009/10 period.
Regular reporting improves the monitoring process
by increasing the frequency of obligatory contact with
the ECB through feedback reports. Even in cases where
applicants failed to comply with stipulated conditions,
reports enabled the ECB to assess the level of practical
commitment demonstrated by the licensees through the
efforts made to overcome barriers. It also shed some light
on other non-commercial but equally important factors
hindering private sector participation.
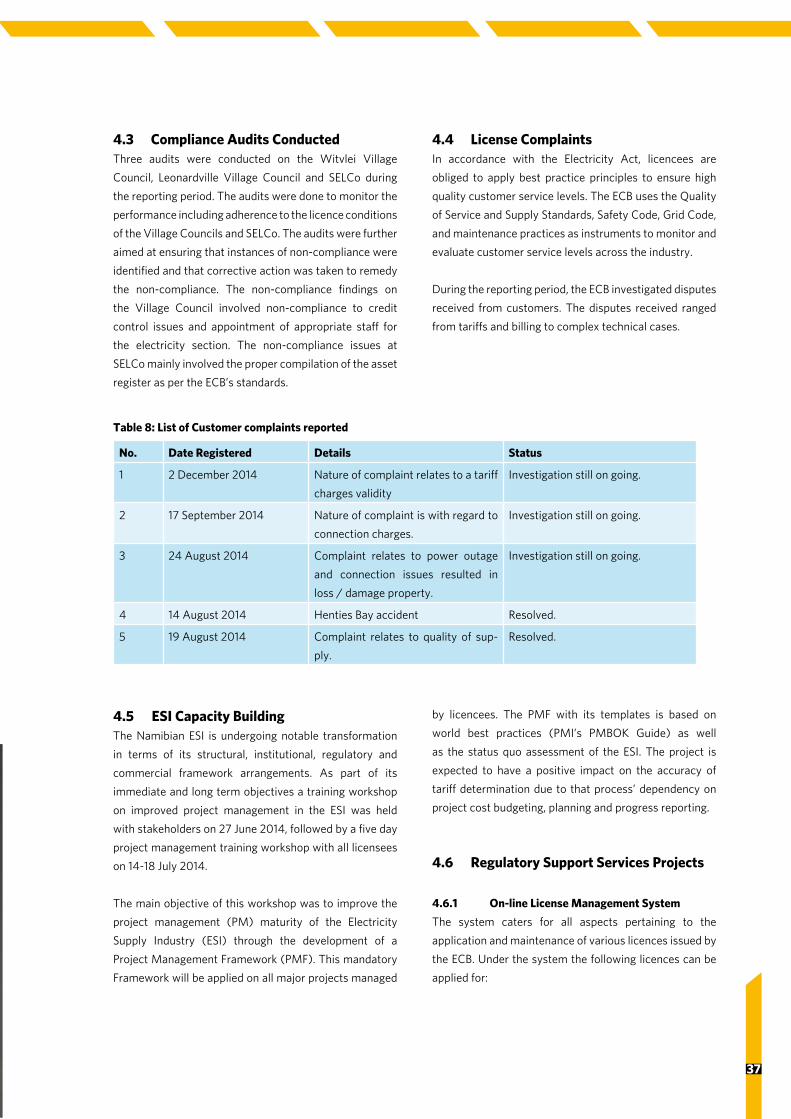
37
4.3 Compliance Audits ConductedThree audits were conducted on the Witvlei Village
Council, Leonardville Village Council and SELCo during
the reporting period. The audits were done to monitor the
performance including adherence to the licence conditions
of the Village Councils and SELCo. The audits were further
aimed at ensuring that instances of non-compliance were
identified and that corrective action was taken to remedy
the non-compliance. The non-compliance findings on
the Village Council involved non-compliance to credit
control issues and appointment of appropriate staff for
the electricity section. The non-compliance issues at
SELCo mainly involved the proper compilation of the asset
register as per the ECB’s standards.
4.4 License ComplaintsIn accordance with the Electricity Act, licencees are
obliged to apply best practice principles to ensure high
quality customer service levels. The ECB uses the Quality
of Service and Supply Standards, Safety Code, Grid Code,
and maintenance practices as instruments to monitor and
evaluate customer service levels across the industry.
During the reporting period, the ECB investigated disputes
received from customers. The disputes received ranged
from tariffs and billing to complex technical cases.
No. Date Registered Details Status
1 2 December 2014 Nature of complaint relates to a tariff
charges validity
Investigation still on going.
2 17 September 2014 Nature of complaint is with regard to
connection charges.
Investigation still on going.
3 24 August 2014 Complaint relates to power outage
and connection issues resulted in
loss / damage property.
Investigation still on going.
4 14 August 2014 Henties Bay accident Resolved.
5 19 August 2014 Complaint relates to quality of sup-
ply.
Resolved.
4.5 ESI Capacity BuildingThe Namibian ESI is undergoing notable transformation
in terms of its structural, institutional, regulatory and
commercial framework arrangements. As part of its
immediate and long term objectives a training workshop
on improved project management in the ESI was held
with stakeholders on 27 June 2014, followed by a five day
project management training workshop with all licensees
on 14-18 July 2014.
The main objective of this workshop was to improve the
project management (PM) maturity of the Electricity
Supply Industry (ESI) through the development of a
Project Management Framework (PMF). This mandatory
Framework will be applied on all major projects managed
by licencees. The PMF with its templates is based on
world best practices (PMI’s PMBOK Guide) as well
as the status quo assessment of the ESI. The project is
expected to have a positive impact on the accuracy of
tariff determination due to that process’ dependency on
project cost budgeting, planning and progress reporting.
4.6 Regulatory Support Services Projects
4.6.1 On-line License Management System
The system caters for all aspects pertaining to the
application and maintenance of various licences issued by
the ECB. Under the system the following licences can be
applied for:
Table 8: List of Customer complaints reported

38
• Transmission
• Distribution/Supply
• Import
• Export
• Generation
The system allows the applicant to log into the ECB
website using his/her username and password and
complete the forms online. The system will enable the
user to partially complete the forms, save and continue
at a later stage. Mandatory requirements prevent
incomplete applications.
Due to the high volume of documents both internally and
externally, the system will improve efficiency in licence
and application processing, and will reduce the use of
paper.
4.6.2 Electricity Distribution Industry Reform
This project was initiated by the Ministry of Mines and
Energy in consultation with the Ministry of Regional and
Local Government, Housing and Rural Development, and
commissioned by the Electricity Control Board. It aims to
inform Namibian Electricity Distribution Industry (EDI)
stakeholders about the options to advance the reform of
the industry, and the implications of such reform options,
thereby facilitating the process leading to the conclusion
of the EDI consolidation process that commenced in 2001.
An EDI Summit was held from 1 - 3 October 2014, and was
hosted by the Ministry of Mines and Energy, the Ministry
of Regional and Local Government, Housing and Rural
Development as well as the ECB. With more than 200
participants, most of Namibia’s EDI actors and entities
were represented at the Summit. The project report and
outcomes were discussed at the Summit.
The Summit’s conclusions included;
i. There was consensus amongst all EDI stakeholders
that the EDI reform initiative has to proceed and be
finalised;
ii. Delegates pronounced themselves in favour of the
establishment of a Central RED, and a Southern RED;
iii. A sustainable local authority funding approach was
urgently required, and is seen as a pre-requisite to
completing reforms taking place in the EDI;
iv. Government had to consider the replacement of the
existing local authority surcharges in order to create
a more equitable and adequate funding approach for
all local authorities and regional councils, and also to
provide further relief to electricity consumers;
v. Government had to create further legal and statutory
supporting provisions to ensure that the REDs that
were already in operation as well as the to-be-created
REDs are enabled to comprehensively undertake all
electricity distribution functions in the country;
vi. NamPower’s continued shareholding in the REDs
remained a concern to most stakeholders, and needs
to be re-assessed and placed on a different footing
The Summit recommended the following initiatives:
i. Development of a Cabinet submission, to be
submitted by the Minister of MME to the appropriate
Cabinet forums, for their deliberation and approval.
ii. The MME and the Ministry of Urban and Rural
Development (MURD, formally MRLGHRD) to further
drive the EDI reforms.
iii. The ECB to initiate consultations to enhance the
statutory provisions to facilitate the creation of the
remaining REDs and ease concerns regarding the legal
basis of REDs.
iv. The MURD to look into local authority and regional
council funding with a view to improving their
sustainability.
4.6.3 Review of the Performance Management
Framework for the Namibian ESI
In 2014 the ECB commissioned a study to review the
“Financial and Technical Performance Management and
Monitoring Framework for Namibia”.
Subsequent to the completion of the project, the ECB
embarked on a follow-up project to develop a regulatory
database which was to be used to store and analyse
performance data and associated indicators.
The project reviewed the initial Framework as well as the
regulatory database, considering how effectively they
were used and how well they served the needs of both the
ECB and industry.

39

40
4.6.4 Development of a Technical, Financial and
Economic (Model) Toolkit for evaluating Renewable En-
ergy (RE) projects
The Regulatory Support Services Department has the
mandate to manage licences and make recommendations
with regard to the issue of licences.
In view of the above the ECB decided to engage a consultant
to develop a financial and economic performance model
to allow the Regulator to assess the financial viability
of project proposals to ensure the financial viability of
licence applicants through proposed tariffs.
The project commenced during the 2014/2015 financial
year and will be finalised during the next financial year.
4.6.5 Development of an Improved Project Manage-
ment System for the ESI
The ECB identified a need to develop guidelines for
improved project management (PM) procedures for the
Electricity Supply Industry stakeholders and the need to
ensure that Licensees apply good Project Management
principals within their organisations, based on sound and
effective project management guidelines. The Electricity
Act states that it is the role of the ECB to regulate the
various electricity activities in the country, which includes
among others guiding licencees to effective project
management practices. It is in the above context in
which the ECB decided to develop project management
guidelines for the Namibian ESI.
4.7 Future OutlookThe electricity sector is expected to see continued
interest in the development of supply options for Namibia.
The Regulatory Support Services Department intends to
focus its attention on implementing strategies to improve
the licencing and compliance functionality, ensuring
improvements in the overall sector performance and
ensuring that the sector remains viable. Through actual
data analysis clear signals would be sent to the industry
and to investors on the sector’s long-term sustainability.
5. Industry AnalysisNamibia’s electricity market is undergoing significant
transformation, through changing patterns of demand
and supply, developments in international markets and
technological change. To help plan for this future and to
make sound policy and investment decisions, Namibia
needs accurate, comprehensive and readily-accessible
energy data.
Namibia’s system hourly demand peaked at 629MW
including Scorpion Zinc Mine, during the 2013/2014
financial period. Units into the system have been relatively
stagnant over the past financial period, increasing
merely by 3.4% from 4,238GWh to 4,384GWh during
2013/2014 financial period. Notably, demand forecasts
in the NIRP reference case show that peak demand was
expected to have been at a capacity level of 614MW, in
energy terms 4,010GWh.
Unit sales declined from 3,861GWh in 2012/2013 to
3,831GWh in 2013/2014, mainly as a result of increased
transmission losses. This reflects lower demand for
electricity, caused by increased energy efficiency
practices in residential and non-residential sectors, and
consumer responses to higher retail electricity prices.
The most notable energy efficient practices include
increased rooftop solar PV installations by commercial
and residential customers, as well as off-grid installations.
Reforms of the modified single buyer model are slowly
taking shape with the implementation of the procurement
mechanisms, allowing for greater competition in the
generation of electricity. Namibia, like most of the region,
is embarking on developing new generation capacities in
both conventional and renewable technologies, aimed at
energy supply security and private sector participation.
The electricity sector is an engine of growth, both in terms
of driving economic growth and poverty eradication.
The correlation of adequate energy consumption and
economic development shows that GDP per capita
increases as per capita electricity consumption increases.
Namibia has the third highest household electricity
consumption per capita at 1,665.25kWh, against a SADC
regional average of 893.62 kWh. There is however still
room for further growth if we compare ourselves against
countries like South Africa at a household consumption of
4,818.82kWh and Seychelles at 2,817.21kWh per capita.

41
5.1 Electricity Sector Performance Results (Licensees performance)
Figure 8: A look at the value chain of the electricity sector
5.1.5 RED Areas
Table 9: Performance of REDs
>66kv <66kv <400kv
ESI Value Chain
-Installed capacity approx. 487 MW at the end of 2014 -Namibia's First Solar PV IPP under construction
-42% on average Produced locally -58% on average imported Import contract with: -ZPC -Eskom Supplementary -Eskom Off-Peak -Aggreko -Emergency energy -Zesco
-Namibia is characterized by long transmission lines -Transmission Network is 11 122 km Long -N$ 40 billion investment required over the next 5 years
-3 Operational REDs -establishment of 2 remaining REDs for Central and Southern Namibia -Distribution Network is 21 944 km long
-Contestable customers
KEY PERFORMANCE INDICATORS BENCHMARK 2011/12 2012/13 2013/14 3yr Average 2011/12 2012/13 2013/14 3yr Average 2011/12 2012/13 2013/14 3yr AverageFINANCIAL INDICATORS
ROA 1% - 7% 5.9% 3.5% 6.4% 5.3% 1.1% 2.6% 5.1% 2.9% 7.53% 7.10% 11.14% 8.6%Operating Margin 17% 18% 8% 12% 12.5% 2% 5% 8% 5.2% 16% 9% 12% 12.5%Current Ratio >1 2.37 1.39 1.30 1.68 1.14 1.56 1.82 1.50 2.37 2.01 2.06 2.15Quick Ratio >1 2.27 1.29 1.26 1.61 0.94 1.35 1.65 1.31 2.27 1.85 2.05 2.06TECHNICAL INDICATORSNetwork Losses 11% - 3% 14% 8% 6% 9.3% 15% 15% 18% 15.9% 8% 8% 8% 7.7%COMMERCIAL INDICATORSDebtor days 32days - 70days 63 65 59 62 42 47 44 44 55 74 75 68Operating Cost/ Sales 25%-40% 26% 35% 29% 29.8% 36% 26% 34% 31.8% 42% 28% 19% 30.0%Bad debts (%) 0.3% - 1.3% 0.0% 0.0% 0.0% 0.0% 0.3% 0.2% 0.1% 0.2% 0.4% 0.0% 0.0% 0.1%EFFICIENCY INDICATORSCustomers/ Employee 137 - 555 364 371 316 350 114 155 153 140 286 136 152 191Energy Sold/ Employee kWh 2400 - 9600 1620 1721 1856 1732 891 964 979 945 1371 1600 1689 1554
REGIONAL ELECTRICITY DISTRIBUTORS PERFORMANCE AGAINST IDENTIFIED BENCHMARKS FOR THE YEAR ENDED JUNE 2012,2013 & 2014
NORED CENORED ERONGO RED
-Costumer complaints handling-Peak demand 629MW
Source: Electricity Distributor’s Annual Report 2014

42
Regional electricity distribution licensees in Namibia have
been in existence for over 11 years now. In recent years,
the ECB has put increased attention on the measurement
of the performance of utilities. This trend is in line with
the overall regulatory directive that significant efficiency
improvements must be achieved in the power sector.
Over the years the ECB has measured the performance of
the distribution sector against set benchmarks comparing
the utilities to help assess the performance of individual
utilities in relation to their peers, and in this way identify
improvement measures or flaws.
NOREDs recorded headline results, were attributed to
growth of its asset base to just over a billion Namibian
dollars, a remarkable achievement, bolstered by its high
connection levels, with connection fees being 4% of total
revenue. ERONGO RED on the other hand connected
337 households, at a cost of N$ 3.1 million, which is a
meaningful contribution to the national electrification
initiative that is estimated to cost N$ 3.4 billion over the
next 10 years.
Notable performance gains by CENORED, from previous
years are evident on the financial indicators, displaying
improved signs of financial health, and sustainability,
through liquidity improvements. Network losses remained
worrisome, high at 18%, with no improvement from the
previous year’s performance.
These results continue to render the regional electricity
distribution sector financially viable for the financial
period 2013/2014.
SELCo’s operations has had a positive economic impact
on the communities it has provided services to over the
past couple of years, in comparison to challenges faced by
other local authorities that operate their own distribution
services. The service contracts within its area of operation
will remain in force until the establishment of the two
remaining REDs and completion of the EDI Reform.
Performance in all areas under review has reduced,
according to current performance trends, SELCo recorded
a net loss of N$ 1.4 million during the 2013/2014 financial
period, down from N$ 2.1 million profit from the previous
period.
Table 10: Performance of distribution companies outside RED area
OPE recorded positive performance results year on
year, with key performance indicator levels within the
benchmark levels.
These results continue to render the electricity distribution
companies outside the RED area financially viable for the
financial period 2013/2014.
5.1.3 Other Licensees outside the RED areas
The ECB reported in its 2013/2014 annual report on the
performance of distribution licencees outside the RED
areas, however the results was based on estimated figures
from the operating and reporting manuals. Due to actual
5.1.2 Non RED Areas
KEY PERFORMANCE INDICATORS BENCHMARK 2011/12 2012/13 2013/14 3yr Average 2011/12 2012/13 2013/14 3yr AverageFINANCIAL INDICATORS
ROA 1% - 7% -4.1% 10.2% 7.9% 4.7% 7.84% 10.77% 10.65% 9.8%Operating Margin 17% -2% 4% 3% 2.0% 8% 10% 9% 8.9%Current Ratio >1 2.72 1.84 2.15 2.24 1.73 2.00 1.92 1.88Quick Ratio >1 2.09 1.65 1.87 1.87 1.63 1.90 1.81 1.78TECHNICAL INDICATORSNetwork Losses 11% - 3% 10% 11% 7.9% 9.6% 9% 10% 7.7% 8.9%COMMERCIAL INDICATORSDebtor days 32days - 70days 54 57 52 54 31 36 31 33Operating Cost/ Sales 25%-40% 40% 21% 28% 29.5% 31% 20% 12% 21%Bad debts (%) 0.3% - 1.3% 1.2% 0.1% 0.2% 0.5% 0.2% 0.1% 0.0% 0.1%EFFICIENCY INDICATORSCustomers/ Employee 137 - 555 260 241 211 237 111 105 124 113Energy Sold/ Employee kWh 2400 - 9600 1956 1822 1647 1808 1333 1274 1336 1315
ELECTRICITY DISTRIBUTORS PERFORMANCE AGAINST IDENTIFIED BENCHMARKS FOR THE YEAR ENDED JUNE 2012, 2013 & 2014
Oshakati Premier Electric (Pty) Ltd
Southern Electricity Company (Pty) Ltd
Source: Electricity Distributor’s Annual Report 2014

43
data shortages from a majority of these licencees, the
ECB has not published their performance results, and will
embark on an outreach programme to educate licencees
on the performance framework, to populate data sheets
with actual data.
5.2 Key ESI StatisticsThe following section of the report contains a brief
overview of key ESI statistics. More detailed analyses are
available in the ESI statistical bulletin 2014/2015. The
information presented here is based on the three types of
customer categories namely Domestic, Commercial and
Large power users. The data used for this report is collected
by the ECB through tariff application requirements.
The Namibian local generation capacity has been
outstripped by the local demand (excluding Skorpion
Mine) since 2006, as shown in figure 9 above. The
installed generation capacity cannot meet the local
electricity demand of the country and therefore the
country relies heavily on imports from neighbouring
countries. According to NamPower 2014 Annual Report
it is stated that “power supply situation will remain
constrained until Kudu Gas Power, a new base load
power station of 800MW projected for 2019/2020 is
commissioned” therefore electricity tariffs increases are
expected until the Kudu Gas Power comes on board,
only then would tariffs stabilise, making Namibia a net
exporter of electricity .
Figure 10: Units into the system and units consumed
Figure 9: Namibian electricity generation vs demand
Source: ECB Statistical Bulletin 2014
Source: ECB Statistical Bulletin 2014

44
More than half of the units into the system are imported
from Eskom and other regional markets as shown in figure
2; this shows a higher ratio of dependency on imports.
The total units consumed continue to increase despite
shortage of generation capacity and high imports, this
has a major impact on pricing with high tariffs to recover
the costs of supply. As shown in figure 2, the electricity
supply from Eskom has reduced significantly over the
years since South Africa is experiencing electricity
shortage. Therefore, Namibia has increased her sourcing
of electricity from other markets within the region.
Figure 11: NamPower Losses
NamPower has managed to cap their electricity losses to figures below 15%. The highest percentage loss of 13% was
recorded in 2013/2014.
Figure 12: Retail Tariffs Increase over time
Source: NamPower Annual Report 2014
Source: ECB Operating Reporting Manual 2014

45
Figure 13 shows the average electricity tariffs trend from
2006/07 to 2014/15, characterised by gradual increments
over the years. A smooth curve graph indicates that there
were no tariff shocks experienced in Namibia thus far; this
indicates that the national electricity regulator has been
hard at work making sure that customers are protected
from tariff shocks.
Steep tariff increases were driven by persistent general
electricity shortage in the region since 2009/10 to cover
the high costs of electricity generation and imports. The
average retail price of electricity has more than doubled in
the last eight years in Namibia from 69 cents per kWh to
186 cents per kWh in 2014/15.
Figure 13: Average annual tariffs per customer category
The average annual tariffs have increased consistently
over the years; this is mainly due to the high costs of
electricity supply. Sharp increases were observed since
2010/11 for commercial customers and these increases
building up to the highest tariff paying customers in
2014/15 with an average of 211 cents per kWh compared
to the other customer categories.
Figure 14: Total number of customers per customer category
Source: ECB Operating Reporting Manual 2014
Source: ECB Operating Reporting Manual 2014

46
Figure 14 shows the total number of customers per each
customer category. The domestic customers are the
highest in numbers, followed by the commercial and
the least number of customers are Large Power Users
(LPU). There has been a gradual increase in the number
of customers over the years, the high increase has been
observed in the domestic and commercial customers
while the LPU has been constant with just below 2 200
customers in 2014/15.
Figure 15: Total Electricity Consumption
The total consumption of electricity has increased gradually over the years; LPU customers having the highest share of
consumption, followed by domestic customers and the least consumption of electricity are the commercial customers. The
total consumption of electricity has slightly increased in 2014/15. This was mainly due to the increase in new connections
for new domestic customers.
Figure 16: Total Electricity Revenue from Customers
Total Revenue collection per customer category - 2014/2015
Half of the total electricity revenue came from the LPU as shown in figure 16 in 2014/15 with 50%, followed by the
domestic customers with 31% and the commercial customers with 19%.
Source: ECB Operating Reporting Manual 2014
Source: ECB Operating Reporting Manual 2014

47
48
6. Regional and International
Activities
6.1 (Regional Electricity Association of Southern
Africa (RERA) Activities
The ECB continued to actively participate in all scheduled
RERA events and activities, including subcommittee
meetings held in Mbabane, Swaziland in August 2014
and the Annual General Meeting held in Victoria Falls,
Zimbabwe in November 2014.
RERA continued to benefit from ECB support on
administrative and operational matters. Within the
auspices of RERA, the ECB hosted technical staff from
the Energy Regulation Board (ERB) of Zambia and the
Zimbabwe Energy Regulation Authority (ZERA). The
two visiting teams benefitted from practical information
exchange on the ECB roll out of power quality management
systems and other relevant fields of interest.
6.2 African Forum for Utility Regulators (AFUR)
The ECB was represented at the African Forum for Utility
Regulators (AFUR) five-day international 11th annual
conference and general assembly under the theme :
“A Decade of Infrastructure Regulation on the African
Continent: Experiences, Challenges, Prospects”.The
conference was organized by African Forum for Utility
Regulators (AFUR) and hosted by Energy Regulatory
Commission (ERC), Kenya. The conference drew a wide
range of participants from: regulatory agencies in Africa,
consultants and non-governmental organisations. In all, 11
presentations and one panel discussion session were held
at the conference.
This forum brought regulators together to discuss what
they can do to improve their performance and hence
institute appropriate clarity of the relationship amongst
different role players, utilities, government and regulator
which is crucial to minimize investor risks and at the same
time to protect consumer’s interests.
6.3 International Electrotechnical Commission
(IEC) and the African Electrotechnical Standardization
Commission (AFSEC)
Namibia is a member of the African Electrotechnical
Standardization Commission (AFSEC) through the
Namibia National Electrotechnical Committee (NaEC).
The ECB holds Chairmanship of NaEC. During the period
under review the ECB attended the AFSEC General
Assembly (GA) in Kinshasa, Democratic Republic of
Congo (DRC). During the GA, Namibia was nominated
and selected first Vice President of AFSEC.
Namibia, through the National Electrotechnical
Committee (NaEC), is also an Affiliate member of the
International Electrotechnical Commission (IEC). The
IEC is a not-for-profit, non-governmental organisation,
founded in 1906 to develop international electrotechnical
standards. The IEC’s members are National Committees,
and they appoint experts and delegates coming from
industry, government bodies, associations and academia
to participate in the technical and conformity assessment
work of the IEC. Through the NaEC, Namibia adopts
IEC standards. During the period under review, the ECB
participated in the 78th IEC Annual General Meeting held
in Tokyo, Japan where developments on international
standards were discussed.
6.4 World Energy Council (WEC)
ECB attended the annual Executive Assembly of the WEC
meeting, hosted in Colombia, by the Colombian Member
Committee of the WEC. The Executive Assembly was
attended by participants from over sixty (60) countries.
The WEC community and representatives from Colombia
and energy sectors from around the world gathered for a
series of open and private discussion sessions on energy
issues, and to find options for delivering sustainable
energy system on national, regional and global level.
The event also hosted the WEC’s major governance
meetings, the World Energy Leaders; the Future Energy
Leaders and Energy Trilemma Summit, culminating in the
full Executive Assembly Plenary.
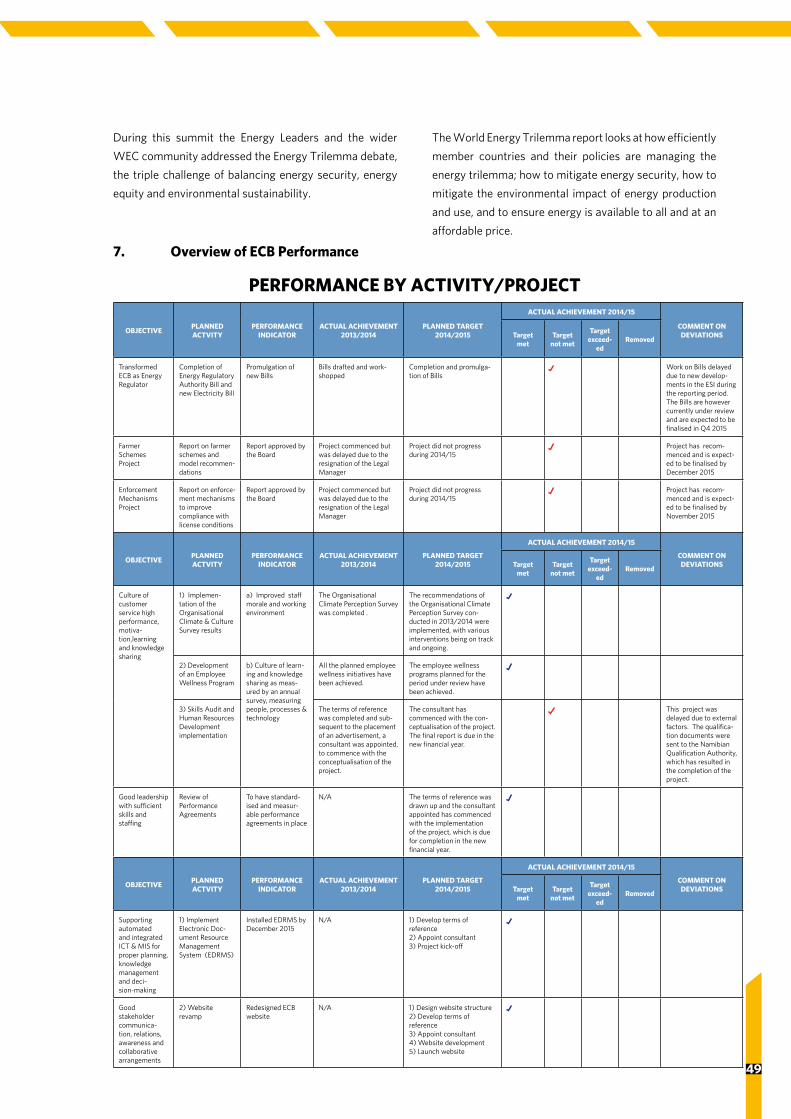
49
During this summit the Energy Leaders and the wider
WEC community addressed the Energy Trilemma debate,
the triple challenge of balancing energy security, energy
equity and environmental sustainability.
The World Energy Trilemma report looks at how efficiently
member countries and their policies are managing the
energy trilemma; how to mitigate energy security, how to
mitigate the environmental impact of energy production
and use, and to ensure energy is available to all and at an
affordable price.
PERFORMANCE BY ACTIVITY/PROJECT
7. Overview of ECB Performance
OBJECTIVEPLANNED ACTVITY
PERFORMANCEINDICATOR
ACTUAL ACHIEVEMENT2013/2014
PLANNED TARGET2014/2015
ACTUAL ACHIEVEMENT 2014/15
COMMENT ON DEVIATIONSTarget
metTarget
not met
Target exceed-
edRemoved
Transformed ECB as Energy Regulator
Completion of Energy Regulatory Authority Bill and new Electricity Bill
Promulgation of new Bills
Bills drafted and work-shopped
Completion and promulga-tion of Bills
a Work on Bills delayed due to new develop-ments in the ESI during the reporting period. The Bills are however currently under review and are expected to be finalised in Q4 2015
Farmer Schemes Project
Report on farmer schemes and model recommen-dations
Report approved by the Board
Project commenced but was delayed due to the resignation of the Legal Manager
Project did not progress during 2014/15
a Project has recom-menced and is expect-ed to be finalised by December 2015
Enforcement Mechanisms Project
Report on enforce-ment mechanisms to improve compliance with license conditions
Report approved by the Board
Project commenced but was delayed due to the resignation of the Legal Manager
Project did not progress during 2014/15
a Project has recom-menced and is expect-ed to be finalised by November 2015
OBJECTIVEPLANNED ACTVITY
PERFORMANCEINDICATOR
ACTUAL ACHIEVEMENT2013/2014
PLANNED TARGET2014/2015
ACTUAL ACHIEVEMENT 2014/15
COMMENT ON DEVIATIONSTarget
metTarget
not met
Target exceed-
edRemoved
Culture of customer service high performance, motiva-tion,learning and knowledge sharing
1) Implemen-tation of the Organisational Climate & Culture Survey results
a) Improved staff morale and working environment
The Organisational Climate Perception Survey was completed .
The recommendations of the Organisational Climate Perception Survey con-ducted in 2013/2014 were implemented, with various interventions being on track and ongoing.
a
2) Development of an Employee Wellness Program
b) Culture of learn-ing and knowledge sharing as meas-ured by an annual survey, measuring people, processes & technology
All the planned employee wellness initiatives have been achieved.
The employee wellness programs planned for the period under review have been achieved.
a
3) Skills Audit and Human Resources Development implementation
The terms of reference was completed and sub-sequent to the placement of an advertisement, a consultant was appointed, to commence with the conceptualisation of the project.
The consultant has commenced with the con-ceptualisation of the project. The final report is due in the new financial year.
a This project was delayed due to external factors. The qualifica-tion documents were sent to the Namibian Qualification Authority, which has resulted in the completion of the project.
Good leadership with sufficient skills and staffing
Review of Performance Agreements
To have standard-ised and measur-able performance agreements in place
N/A The terms of reference was drawn up and the consultant appointed has commenced with the implementation of the project, which is due for completion in the new financial year.
a
OBJECTIVEPLANNED ACTVITY
PERFORMANCEINDICATOR
ACTUAL ACHIEVEMENT2013/2014
PLANNED TARGET2014/2015
ACTUAL ACHIEVEMENT 2014/15
COMMENT ON DEVIATIONSTarget
metTarget
not met
Target exceed-
edRemoved
Supporting automated and integrated ICT & MIS for proper planning, knowledge management and deci-sion-making
1) Implement Electronic Doc-ument Resource Management System (EDRMS)
Installed EDRMS by December 2015
N/A 1) Develop terms of reference 2) Appoint consultant 3) Project kick-off
a
Good stakeholder communica-tion, relations, awareness and collaborative arrangements
2) Website revamp
Redesigned ECB website
N/A 1) Design website structure 2) Develop terms of reference 3) Appoint consultant 4) Website development 5) Launch website
a

50
OBJECTIVEPLANNED ACTVITY
PERFORMANCEINDICATOR
ACTUAL ACHIEVEMENT2013/2014
PLANNED TARGET2014/2015
ACTUAL ACHIEVEMENT 2014/15
COMMENT ON DEVIATIONSTarget
metTarget
not met
Target exceed-
edRemoved
Good stakeholder communica-tion, relations, awareness and collaborative arrangements
1) Undertake a Stakeholder Survey
a) Report with clear recommendations.
Stakeholder Survey was completed .
Implementation of recom-mendations of the survey conducted.
a
OBJECTIVEPLANNED ACTVITY
PERFORMANCEINDICATOR
ACTUAL ACHIEVEMENT2013/2014
PLANNED TARGET2014/2015
ACTUAL ACHIEVEMENT 2014/15
COMMENT ON DEVIATIONSTarget
metTarget
not met
Target exceed-
edRemoved
More sus-tainable use of natural re-sources through increased use of renewable energy for generation
Investigation of Net Metering and developing relevant rules
Net Metering rules Draft rules developed Net Metering - Financial impact assessment
a Rules submitted to the Ministry of Justice for promulgation
Transparent and supportive tariff system
Study balance between quality and affordability
a) Tariff system operational b) Communi-ties connected c) Percentage of tariff utilised
None None a Implementation of the supportive tariff mech-anism being awaited
Improved access to all ur-ban, peri-urban and rural areas
Rural Electrifica-tion: Support rural electrification efforts with MME and others
a) Rural 19% b) Peri-urban 40% (estimates)
None Project incorporated with the Peri Urban and Rural Electrification Support Mechanism
a Project moved to the development of the support mechanism in the interim while awaiting a response to the letter sent to the MME seeking support
Transparent cost-reflective tariffs
Investigate actual costs and cost reflective tariff structures interna-tionally
Implementation of cost reflective tariffs (80%)
Produced a draft RERA tariff publication 2011
Produced a RERA tariff publication 2011 and 2014
a
Improved access to all ur-ban, peri-urban and rural areas
Improved meth-ods: Recommend methods of im-proving electricity access to relevant utilities
a) Rural 19% b) Peri-urban 40% (estimates)
Project commenced Project completion and Support developed
a
Improved access to all ur-ban, peri-urban and rural areas
Peri-urban support systems: Develop together with MRLGHRD and MME, support systems for utilities to improve access to peri-urban areas
a) Rural 19% b) Peri-urban 40% (estimates)
Project commenced Project completion and support developed
a
Transparent cost-reflective tariffs
Investigate Incentive Based Regulations - 2015
None None a The country still relies on imports and much of the generation cost is determined from outside the country.
Designed and implemented Modified Single Buyer
Implement modi-fied Single Buyer
Ensure that the MSBM is included in the Electricity Bill
a Promulgation of the Electricity Bill being awaited
Designed and implemented Modified Single Buyer
Develop and Implement Market Rules
None None a Depends on the approval of the Market Model
Promoted cross-border transmission gateways
Develop a na-tional Connection Charge Policy
Policy approved and adopted
a
Economic growth equita-bly distributed
Assess PPP models suitable for Namibia
a) Per capita consump-tion of power annually [1.54 MWh], b) Electricity contribution to GDP [N$ 4,929 million] c) Number of new jobs created in ESI (during construction, operation)
a Project put on hold due to the establishment of the PPP Office in the Ministry of Finance, with a PPP policy being developed for the country.
Transparent cost-reflective tariffs
Update Tariff Study (Cost of Supply Study)
Transparent cost-reflective tariffs
Review of the NamPower trans-mission assets revaluation
Review report produced
Project completed a

51
More sus-tainable use of natural re-sources through increased use of renewable energy for generation
Review tariff mechanisms for renewable energy for implemen-tation
Develop REFIT rules Draft REFIT rules Interim REFIT commenced a
Transparent and supportive tariff system
Conduct a com-prehensive study for a national supportive tariff system in Namibia
Development of the ST Mechanism
Implementation of the ST Mechanism
a
New Develop and de-sign a tariff model for the Kudu Power Project and Independent Power Producers
Kudu Power Project license reviewed and tariff determined
a
New Reconciliation of NamPower RR
Reconciliation conducted and implemented for the period 2011 - 2013
a
OBJECTIVEPLANNED ACTVITY
PERFORMANCEINDICATOR
ACTUAL ACHIEVEMENT2013/2014
PLANNED TARGET2014/2015
ACTUAL ACHIEVEMENT 2014/15
COMMENT ON DEVIATIONSTarget
metTarget
not met
Target exceed-
edRemoved
To establish the extent to which an audited facility complies with the stip-ulated license conditions, safety codes, standards and regulations
Development of an Audit and Inspections Manual
Feedback letters, audit reports and compliance monitoring tracking forms
N/A Completion, management and board approval of Audit and Inspections Manual - First ever technical audits
a
To review the existing meth-odology used to determine total transmission losses
Reduction of transmission Losses
Significantly reduce existing and future technical and non-technical losses.
N/A Development of the terms of reference. The project , being jointly carried out with NamPower is ongoing and will continue into the new financial year.
a
To address iden-tified gaps in the operational environment of electrical workers and contractors
Wiremen’s licensing
Effective implemen-tation of the frame-work and developed guidelines
None Development of: - The Electrical Installation Regulations - The Electrical Workers and Contractors Bill - The Electrical Workers and Contractors Regulation Guidelines - The Electrical Workers and Contractors Licensing Board guidelines
a
To independent-ly analyse and report on Demand Side Management (DSM) and En-ergy Efficiency saving impacts
Development and implementation of Measurement and Verification (M&V) guidelines
Quantification of DSM initiatives
N/A Project introduction to stakeholders and presenta-tion of an overview and general showcase of the M&V guidelines. The project is continuing in the new financial year.
a
To review and update the outcomes of the existing draft National Inte-grated Resource Plan (NIRP) in order to accom-modate all new development projects
Review, update and summary of NIRP
A comprehensive plan, modelling tools, capacity building training and skills transfer
N/A Development of the terms of reference. The project is continuing in the new finan-cial year and a consultant will be appointed.
a
OBJECTIVEPLANNED ACTVITY
PERFORMANCEINDICATOR
ACTUAL ACHIEVEMENT2013/2014
PLANNED TARGET2014/2015
ACTUAL ACHIEVEMENT 2014/15
COMMENT ON DEVIATIONSTarget
metTarget
not met
Target exceed-
edRemoved
Licensee com-pliance through inspections, enforcement, incentives and penalties
1) Licensing process: Development of a computerised license application and evaluation process
a) Improved quality license application submissions
Appointment of a consultant
The final project report submitted
a
2) Development of an Employee Wellness Program
b) Improved timely license application evaluations
User acceptance testing and production set-up
System on-line
a
3) Skills Audit and Human Resources Development Implementation
Training Provided to ECB Staff
There is an urgent need to update and review latest developments

52
Better Management by Distribution Utilities
REDs establish-ment
To have both the two remaining REDs established
Consultant appointed to determine how the remaining REDs be established
Final Report to be presented to all key stakeholders
a Cabinet submission to be finalised
Performance Management Sytem in place with Performance Contracts and Service Charters developed
Develop an ESI Performance Management Framework
Improved Licensee Performance
Appointment of a consultant
Final report to be presented to all key stakeholders
a
Increased electricity gen-eration through improved private sector involvement and investment
Development of a Technical, Finan-cial and Economic (Model) Toolkit for evaluating Renewable Energy (RE) projects
Develop a model to evaluate the sustainability of RE projects
Appointment of a consultant
Final model to use during RE license application reviews
a Project delayed due to time extension request by consultant. Project to be finalised during the next financial year
Improved project manage-ment
Develop an ESI Project Manage-ment Framework
Licensees to be trained in Project Management
Licensees applying good project man-agement practices
Appointment of a con-sultant and stakeholder / licensee visits
Final report to be presented to all key stakeholders
a Project enforcement and compliance adher-ence to start during the next financial year
OBJECTIVEPLANNED ACTVITY
PERFORMANCEINDICATOR
ACTUAL ACHIEVEMENT2013/2014
PLANNED TARGET2014/2015
ACTUAL ACHIEVEMENT 2014/15
COMMENT ON DEVIATIONSTarget
metTarget
not met
Target exceed-
edRemoved

53

ele
ctr
icity
co
ntro
l bo
ard
54
CONTENTS PAGE
Board members’ responsibility for financial reporting 55
Board members’ approval of the annual financial statements 55
Independent auditor’s report 56 - 57
Report of the Board members 58
Statement of profit or loss and other comprehensive income 59
Statement of financial position 60
Statement of changes in equity 61
Statement of cash flows 62
Notes to the annual financial statements 63 - 73
Detailed statement of profit and loss and other comprehensive income 74
8. Contents - Annual Financial Statements

55
BOARD MEMBERS’ RESPONSIBILITY FOR FINANCIAL REPORTING
The members of the Board are responsible for the maintenance of adequate accounting records and the preparation and
integrity of the annual financial statements and related financial information. The annual financial statements are prepared
in accordance with International Financial Reporting Standards. The Board’s independent external auditors have audited
the financial statements and their report appears on pages 56 to 57.
The Board members are also responsible for the systems of internal financial control. These are designed to provide rea-
sonable but not absolute assurance as to the reliability of the financial statements, and to adequately safeguard, verify and
maintain accountability of assets, and to prevent and detect material misstatement and loss. The systems are implemented
and monitored by suitably trained personnel with an appropriate segregation of authority and duties. Nothing has come
to the attention of the Board members to indicate that any material breakdown in the functioning of these controls, proce-
dures and systems has occurred during the year under review.
The annual financial statements are prepared on a going concern basis. Please refer to page 58 of the Members’ report
where the appropriateness of the going concern assumption is discussed in detail.
BOARD MEMBERS’ APPROVAL OF THE ANNUAL FINANCIAL STATEMENTS
The annual financial statements set out on pages 58 to 73 were approved by the Board members on 20 August 2015 and
are signed on their behalf by:

INDEPENDENT AUDITOR’S REPORT
TO THE MEMBERS OF ELECTRICITY CONTROL BOARD
We have audited the annual financial statements of Electricity Control Board, which comprise the statement of financial
position as at 31 March 2015, the statement of profit and loss and other comprehensive income, the statement of changes
in equity, the statement of cash flows for the year then ended, the report of the Members, and a summary of significant
accounting policies and other explanatory notes, as set out on pages 58 to 73.
Members’ responsibility for the annual financial statements
The members are responsible for the preparation and fair presentation of these annual financial statements in accordance
with International Financial Reporting Standards and as required by the Electricity Act (No 4 of 2007), and for such internal
control as the directors determine is necessary to enable the preparation of financial statements that are free from material
misstatement, whether due to fraud or error.
Auditor’s responsibility
Our responsibility is to express an opinion on these annual financial statements based on our audit. We conducted our
audit in accordance with International Standards on Auditing. Those standards require that we comply with ethical require-
ments and plan and perform the audit to obtain reasonable assurance whether the annual financial statements are free
from material misstatement.
An audit involves performing procedures to obtain audit evidence about the amounts and disclosures in the annual financial
statements. The procedures selected depend on the auditor’s judgement, including the assessment of the risks of material
misstatement of the annual financial statements, whether due to fraud or error. In making those risk assessments, the audi-
tor considers internal control relevant to the entity’s preparation and fair presentation of the annual financial statements in
order to design audit procedures that are appropriate in the circumstances, but not for the purpose of expressing an opinion
on the effectiveness of the entity’s internal control. An audit also includes evaluating the appropriateness of accounting
policies used and the reasonableness of accounting estimates made by management, as well as evaluating the overall pre-
sentation of the financial statements.
We believe that the audit evidence we have obtained is sufficient and appropriate to provide a basis for our audit opinion.
Opinion
In our opinion, the annual financial statements present fairly, in all material respects, the financial position of the Electricity
Control Board as at 31 March 2015, and of its financial performance and its cash flows for the year then ended in accordance
with International Financial Reporting Standards and as required by the Electricity Act (No 4 of 2007).
56

57
INDEPENDENT AUDITOR’S REPORT
TO THE MEMBERS OF ELECTRICITY CONTROL BOARD (continued)
Other matter
Without qualifying our opinion we draw attention to the fact that the supplementary information set out on page 74 does
not form part of the annual financial statements and is presented as additional information. We have not audited this
schedule and accordingly we do not express an opinion on it.
Deloitte & ToucheRegistered Accountants and Auditors
Chartered Accountants (Namibia)
Per AA Akayombokwa
Partner
Windhoek
20 August 2015
58
ELECTRICITY CONTROL BOARD
4
REPORT OF THE BOARD MEMBERS for the year ended 31 March 2015 The Board members have pleasure in presenting their report on the activities of the Board for the year ended 31 March 2015. BACKGROUND AND OPERATIONS The Electricity Control Board was established by the Government of the Republic of Namibia in terms of the Electricity Act No 2 of 2000 (repealed by Electricity Act No 4 of 2007), to exercise control over the electricity supply industry and to regulate the generation, transmission, distribution, use, import and export of electricity in accordance with prevailing Government policy so as to ensure order in the efficient supply of electricity. RESULTS The results of the Board are fully set out in the attached annual financial statements. DIVIDENDS No dividends have been paid or declared during the year (2014: Nil). BOARD MEMBERS AND SECRETARY The members of the Electricity Control Board during the year and at the date of this report were as follows: Mr. Jason Nandago (Chairperson) Mr. Gersom Katjimune Ms. Panduleni Shimutwikeni Mr. Fritz Jeske Mr. Gottlieb Hinda Board Secretary Mr Johann Malan Business address: Postal address: No 8 Bismarck Street P O Box 2923 Windhoek Windhoek NAMIBIA NAMIBIA SUBSEQUENT EVENTS The Board members are not aware of any fact or circumstance, which occurred between the date of the financial statements and the date of this report, which might influence an assessment of the Board’s state of affairs and require disclosure in these financial statements. GOING CONCERN The Board earned a surplus of N$ 9 945 488 (2014: N$ 13 190 214) and a surplus of N$ 11 468 958 is forecasted for the 2015/16 financial year. The Board has also accumulated sufficient surplus to absorb any future losses and together with future revision to the levies, these will ensure the operational existence of the Electricity Control Board and this confirms the appropriateness of the going concern basis in the preparation of the annual financial statements.
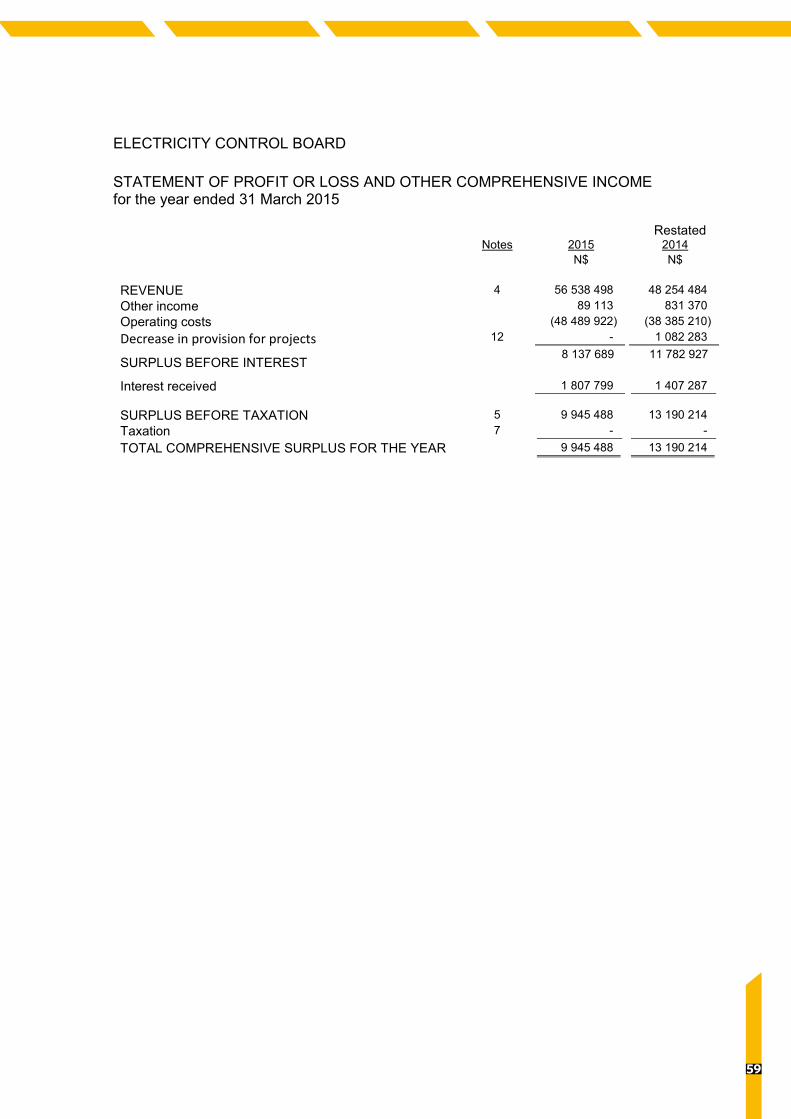
59
ELECTRICITY CONTROL BOARD
5
STATEMENT OF PROFIT OR LOSS AND OTHER COMPREHENSIVE INCOME for the year ended 31 March 2015 Restated Notes 2015 2014 N$ N$
REVENUE 4 56 538 498 48 254 484 Other income 89 113 831 370 Operating costs (48 489 922) (38 385 210) Decrease in provision for projects 12 - 1 082 283
SURPLUS BEFORE INTEREST 8 137 689 11 782 927
Interest received 1 807 799 1 407 287 SURPLUS BEFORE TAXATION 5 9 945 488 13 190 214 Taxation 7 - - TOTAL COMPREHENSIVE SURPLUS FOR THE YEAR 9 945 488 13 190 214

60
ELECTRICITY CONTROL BOARD
6
STATEMENT OF FINANCIAL POSITION as at 31 March 2015 Restated Restated Notes 2015 2014 2013 N$ N$ N$
ASSETS NON-CURRENT ASSETS Property, plant and equipment 8 9 360 084 8 354 446 7 526 406 CURRENT ASSETS 62 059 217 50 339 110 38 107 741 Trade and other receivables 9 5 838 630 6 404 855 4 021 741 Bank balances and cash 10 56 220 587 43 934 255 34 085 957
TOTAL ASSETS 71 419 301 58 693 556 45 634 104 RESERVES AND LIABILITIES RESERVES 61 556 414 51 610 926 38 420 712 Revaluation reserve 4 137 025 4 137 025 4 137 025 Accumulated funds 57 419 389 47 473 901 34 283 687
CURRENT LIABILITIES 9 862 887 7 082 630 7 213 392 Trade and other payables 11 9 862 887 7 082 630 4 781 088 Finance lease - - 35 879 Trust funds – MME projects - - 2 396 425
TOTAL RESERVES AND LIABILITIES 71 419 301 58 693 556 45 634 104

61
ELECTRICITY CONTROL BOARD
7
STATEMENT OF CHANGES IN EQUITY for the year ended 31 March 2015
Note Revaluation
Reserve Accumulated
Funds
Total N$ N$ N$
Balance at 1 April 2013 - 29 363 139 29 363 139 Prior year adjustment 12 - 4 920 548 4 920 548 Other comprehensive income for the year 4 137 025 - 4 137 025 Balance restated at 31 March 2013 4 137 025 34 283 687 38 420 712 Surplus restated 13 190 214 13 190 214 Surplus previously stated - 12 107 931 Prior year adjustment 12 - 1 082 283 Balance at 31 March 2014 4 137 025 47 473 901 51 610 926 Surplus for the year - 9 945 488 9 945 488
Balance at 31 March 2015 4 137 025 57 419 389 61 556 414
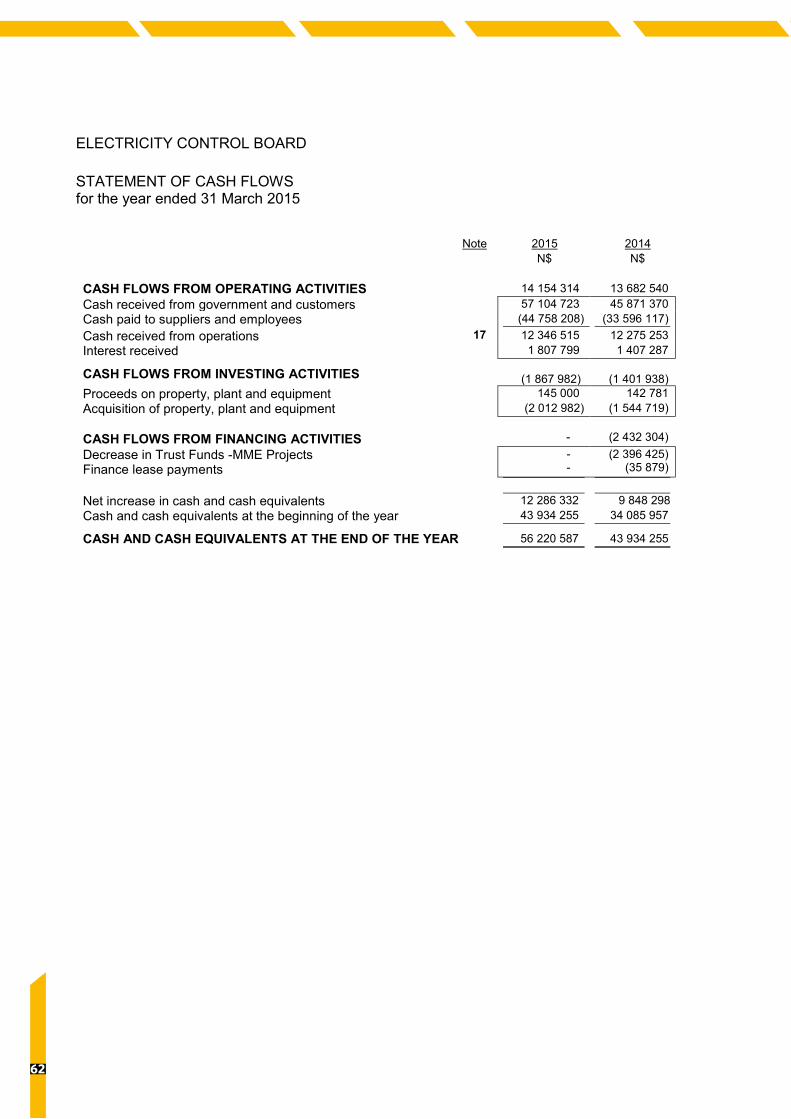
62
ELECTRICITY CONTROL BOARD
8
STATEMENT OF CASH FLOWS for the year ended 31 March 2015 Note 2015 2014 N$ N$
CASH FLOWS FROM OPERATING ACTIVITIES 14 154 314 13 682 540 Cash received from government and customers 57 104 723 45 871 370 Cash paid to suppliers and employees (44 758 208) (33 596 117) Cash received from operations 17 12 346 515 12 275 253 Interest received 1 807 799 1 407 287
CASH FLOWS FROM INVESTING ACTIVITIES (1 867 982)
(1 401 938)
Proceeds on property, plant and equipment 145 000 142 781 Acquisition of property, plant and equipment (2 012 982) (1 544 719) CASH FLOWS FROM FINANCING ACTIVITIES
-
(2 432 304)
Decrease in Trust Funds -MME Projects Finance lease payments
- -
(2 396 425) (35 879)
Net increase in cash and cash equivalents 12 286 332 9 848 298 Cash and cash equivalents at the beginning of the year 43 934 255 34 085 957
CASH AND CASH EQUIVALENTS AT THE END OF THE YEAR 56 220 587 43 934 255
63
ELECTRICITY CONTROL BOARD
9
NOTES TO THE ANNUAL FINANCIAL STATEMENTS for the year ended 31 March 2015 1. BASIS OF PREPARATION The annual financial statements are prepared on the historical cost basis, except for financial
instruments which are carried at fair value. The principal accounting policies, which have been consistently applied in all material respects, comply in all material respects with International Financial Reporting Standards (“IFRS”) adopted by the International Accounting Standard Board (IASB) and interpretations issued by the International Financial Reporting Interpretations Committee (IFRIC) of the IASB.
1.1 STANDARDS, INTERPRETATIONS AND AMENDMENTS TO PUBLISHED STANDARDS THAT
ARE NOT YET EFFECTIVE
The Board has adopted all the new and revised Standards and Interpretations issued by the International Accounting Standards Board (the IASB) and the International Financial Reporting Committee (IFRIC) of the IASB that are relevant to its operations and effective for accounting years beginning on 1 April 2014. However, the adoption of the standards and interpretations did not result in any material adjustments to the reported figures.
IFRS 7 Financial Instruments: Disclosures IFRS 13 Fair Value Measurement IAS 16 Property, Plant and Equipment IAS 19 Employee Benefits IAS 27 Separate Financial Statements IAS 31 Amendments arising from Recoverable Amount Disclosure for Non-Financial Assets IAS 32 Financial Instruments: Presentation IAS 36 Impairment of Assets
None of the standards, as indicated above that were effective for the current accounting year, had
an impact on the results or financial position of the Board.
At the date of authorisation of these financial statements, the following Standards and Interpretations were issued but not yet effective:
New/Revised International Financial Reporting Standards and interpretations Effective Date
IFRS 7 Financial Instruments: Disclosure Deferral of Mandatory Amendments to Transition Disclosure 1 January 2015
IFRS 15 Revenue from Contract with Customers 1 January 2017
IFRS 19 Defined Benefit Plans: Employee Contributions 1 January 2015 IAS 36 Recoverable Amount Disclosures for Non-Financial Assets 1 January 2015 IAS 39 Novation of Derivatives and Continuation of Hedge Accounting 1 January 2015 IFRIC 21 Levies 1 January 2015
The Board members anticipate that the adoption of these statements and interpretations will have no material impact on the financial statements in future periods.

64
ELECTRICITY CONTROL BOARD
10
NOTES TO THE ANNUAL FINANCIAL STATEMENTS (continued) for the year ended 31 March 2015 2. SIGNIFICANT ACCOUNTING POLICIES
2.1 Revenue Revenue comprises levies, licence and registration fees collected in terms of the Electricity Act No 2
of 2000 (repealed by Electricity Act No 4 of 2007) to defray costs necessarily incurred by the Control Board and are recognised on an accrual basis.
2.2 Property, plant and equipment Land and buildings held for use in the production or supply of goods or services, or for administrative
purposes, are stated in the statement of financial position at their revalued amounts, being the fair value at the date of revaluation, less any subsequent accumulated depreciation and subsequent accumulated impairment losses. Revaluations are performed with sufficient regularity such that the carrying amounts do not differ materially from those that would be determined using fair values at the end of each reporting period.
Any revaluation increase arising on the revaluation of such land and buildings is recognised in other
comprehensive income and accumulated in equity, except to the extent that it reverses a revaluation decrease for the same asset previously recognised in profit or loss, in which case the increase is credited to profit or loss to the extent of the decrease previously expensed. A decrease in the carrying amount arising on the revaluation of such land and buildings is recognised in profit or loss to the extent that it exceeds the balance, if any, held in the properties revaluation reserve relating to a previous revaluation of that asset.
Depreciation on revalued buildings is recognised in profit or loss. On the subsequent sale or
retirement of a revalued property, the attributable revaluation surplus remaining in the properties revaluation reserve is transferred directly to retained earnings.
Freehold land is not depreciated. Fixtures and equipment are stated at cost less accumulated depreciation and accumulated
impairment losses. Depreciation is recognised so as to write off the cost or valuation of assets (other than freehold land
and properties under construction) less their residual values over their useful lives, using the straight-line method. The estimated useful lives, residual values and depreciation method are reviewed at the end of each reporting period, with the effect of any changes in estimate accounted for on a prospective basis.
Assets held under finance leases are depreciated over their expected useful lives on the same basis
as owned assets. However, when there is no reasonable certainty that ownership will be obtained by the end of the lease term, assets are depreciated over the shorter of the lease term and their useful lives.
Depreciation is calculated on a straight-line basis to write off assets to their estimated residual values
over their anticipated useful lives as follows: - Buildings 25 years (4% p.a.) - Furniture and equipment 5 years (20% p.a.) - Computer equipment 3 years (33.3% p.a.) - Motor vehicles 4 years (25% p.a.)

65
ELECTRICITY CONTROL BOARD
11
NOTES TO THE ANNUAL FINANCIAL STATEMENTS (continued) for the year ended 31 March 2015 2. SIGNIFICANT ACCOUNTING POLICIES (continued) 2.3 Retirement benefits
Contributions to retirement funds are charged against income in the year in which they become payable.
2.4 Provisions
Provisions for liabilities are recognised when the Board has a present legal or constructive obligation as a result of past events, for which it is probable that an outflow of economic benefits will occur, and where a reliable estimate can be made of the amount of the obligation.
2.5 Impairment of assets
At each reporting date, the Board reviews the carrying amounts of its assets to determine whether there is any indication that those assets have suffered an impairment loss. If any such indication exists, the recoverable amount of the asset is estimated in order to determine the extent of the impairment loss, if any. If the recoverable amount of an asset is estimated to be less than its carrying amount, its carrying amount is reduced to its recoverable amount and the impairment losses are recognised as an expense immediately.
If an impairment loss subsequently reverses, the carrying amount of the asset is increased to the revised estimate of its recoverable amount but limited to the carrying amount that would have been determined had no impairment loss been recognised in prior years. A reversal of an impairment loss is recognised in the statement of comprehensive income.
2.6 Cash and cash equivalents
Cash and cash equivalents are measured at fair value and comprise cash on hand, deposits held on call with banks and investments in money market instruments, net of bank overdrafts and call loans. In the statement of financial position, bank overdrafts are included in current liabilities. Interest-bearing bank overdrafts and other short-term borrowings are recorded at the proceeds received, net of direct issue costs.
For the purpose of the statement of cash flows, the Board considers all bank balances and cash with
a maturity of less than one year and bank overdrafts to be cash and cash equivalents. 2.7 Financial instruments
Initial measurement Financial assets and financial liabilities are recognised on the statement of financial position when the Board has become a party to the contractual provisions of the instrument. Financial instruments carried on the statement of financial position include bank and cash balances, trade and other receivables and trade and other payables.
Subsequent measurement Fair values and the recognition methods of the different financial instruments are disclosed in the notes to the annual financial statements. Fair value represents an approximation of the year end value, which may differ from the value that will be finally realised. De-recognition Financial instruments are offset when the Board has a legally enforceable right to offset and intends to settle either on a net basis or to realise the asset and settle the liability simultaneously.

66
ELECTRICITY CONTROL BOARD
12
NOTES TO THE ANNUAL FINANCIAL STATEMENTS (continued) for the year ended 31 March 2015 2. SIGNIFICANT ACCOUNTING POLICIES (continued) 2.7 Financial instruments (continued) Trade and other receivables
Trade receivables are measured at initial recognition at fair value, and are subsequently measured at amortised cost using effective interest rate method. Appropriate allowances for estimated irrecoverable amounts are recognised in the statement of comprehensive income when there is objective evidence that the asset is impaired. The allowance recognised is measured as the difference between the asset’s carrying amount and the present value of estimated future cash flows discounted at the effective interest rate computed at initial recognition.
Trade and other payables
Trade payables are initially measured at fair value, and are subsequently measured at amortised cost, using the effective interest rate method.
2.8 Leasing
Leases are classified as finance leases whenever the terms of the lease transfer substantially all the rights and rewards of ownership to the lessee. All other leases are classified as operating leases and rentals are charged against trading profit as they become due.
The Board as a lessee Assets held under finance lease are recognised as assets of the Board at fair value at the date of acquisition. The corresponding liability to the lessor is included in the statement of financial position as a finance lease obligation. Finance costs, which represent the difference between the total leasing commitments and the fair value of the assets acquired, are charged to the statement of comprehensive income over the term of the relevant lease so as to produce a constant periodic rate of interest on the remaining balance of the obligations for each period.
Rentals payable under operating leases are charged to income on a straight-line basis over the term of the relevant lease.
3.1 Judgements by management
There were no material judgements made by management that could have a significant effect on the amounts recognised in the financial statements.
3.2 Key sources of estimation uncertainty There are no key assumptions concerning the future and other key sources of estimation uncertainty at the reporting date that could have a significant risk of causing material adjustment to the carrying amounts of the assets and liabilities within the next financial year.
3.3 Trust Funds-Ministry of Mines and Energy Project The Board undertakes a project on behalf of the Ministry of Mines and Energy (“MME”). The funds received are accounted for as monies held in trust and all expenditure incurred on this project are accounted for separately from the Board’s transactions.

67
ELECTRICITY CONTROL BOARD
13
NOTES TO THE ANNUAL FINANCIAL STATEMENTS (continued) for the year ended 31 March 2015
7. TAXATION The Board is exempt from income tax in terms of section 16(1) (e) (i) of the Namibian Income Tax Act.
2015 2014 N$ N$ 4. REVENUE Revenue comprises the following: - Levies income 55 750 998 47 697 984 - Licence fees 787 500 556 500 5.
SURPLUS / DEFICIT BEFORE TAXATION
56 538 498 48 254 484
Interest received 1 807 799 1 407 287
Insurance proceeds Loss on foreign exchange Gain on disposal of fixed assets
145 000 (9 327)
126 775
142 782 (18 930) 46 089
Expenditure: Auditor's remuneration: - audit fees - current year 120 780 133 458 - prior year 11 144 4 793 Depreciation 989 118 619 987 - land and buildings 359 228 359 228 - motor vehicles 350 874 72 430 - computer equipment 146 389 102 736 - furniture and equipment 132 627 85 593 Staff costs 25 755 604 18 432 645 Operating leases - office equipment 295 864 237 279 6. BOARD MEMBERS EMOLUMENTS - service members 331 571 334 426 - other services 44 416 162 361 375 987 496 787

6868
ELECTRICITY CONTROL BOARD
14
NOTES TO THE ANNUAL FINANCIAL STATEMENTS (continued) for the year ended 31 March 2015
8. PROPERTY, PLANT AND EQUIPMENT
Land & buildings
Motor Vehicles
Computer equipment
Furniture & equipment
Total
N$ N$ N$ N$ N$ 2015 Cost At 01 April 2014 7 864 965 1 749 010 680 806 1 343 731 11 638 512 Disposals
Revaluation - -
(570 649) -
(8 970) -
(17 797) -
(597 417) -
Additions - 1 350 800 310 456 351 726 2 012 982
At 31 March 2015 7 864 965 2 529 161 982 291 1 677 660 13 054 077
Accumulated depreciation At 01 April 2014 1 206 474 570 649 508 338 998 605 3 284 066 Disposals - (570 649) (5 731) (2 811) (579 191) Depreciation 359 228 350 874 146 389 132 627 989 118
At 31 March 2015 1 565 702 350 874 648 996 1 128 421 3 693 993
Net book value at 01 April 2014 6 658 491 1 178 361 172 468 345 126 8 354 446 Net book value at 31 March 2015 6 299 263 2 178 287 333 295 549 239 9 360 084
2014 Cost At 01 April 2013 7 864 965 761 362 580 723 1 168 527 10 375 577 Disposals
Revaluation - -
(190 712) -
(19 533) -
(71 539) -
(281 784) -
Additions - 1 178 360 119 616 246 743 1 544 719 At 31 March 2014 7 864 965 1 749 010 680 806 1 343 731 11 638 512
Accumulated depreciation At 01 April 2013 847 246 649 199 419 405 933 321 2 849 171 Disposals - (150 980) (13 803) (20 309) (185 092) Depreciation 359 228 72 430 102 736 85 593 619 987 At 31 March 2014 1 206 474 570 649 508 338 998 605 3 284 066
Net book value at 01 April 2013
7 017 719
112 163
161 318
235 206
7 526 406
Net book value at 31 March 2014 6 658 491 1 178 361 172 468 345 126 8 354 446
Land and buildings comprises Erf 714, on 8 Bismarck Street, Windhoek.

69
ELECTRICITY CONTROL BOARD
15
NOTES TO THE ANNUAL FINANCIAL STATEMENTS (continued) for the year ended 31 March 2015
The Board’s main customer is Nampower, for which the credit terms are 30 days and no interest is charged on the trade receivable balance at year end. The Board, therefore, believes that the trade receivables are not impaired and the above provision for doubtful debt sufficiently covers the risk of default.
10. BANK BALANCES AND CASH 2015 2014
N$ N$ Cash on hand 3 000 66
Current accounts 8 357 060 28 643 834 Short-term investments 47 860 527 15 290 355 56 220 587 43 934 255
Restated
Restated 11. TRADE AND OTHER PAYABLES 2015 2014 2013
N$ N$ N$
Trade creditors 2 684 533 767 156 530 802 Accruals 7 178 354 6 315 474 4 250 286 9 862 887 7 082 630 4 781 088
The average credit period on purchases of goods is 30 days and no interest is charged on the trade payables balance as at year end. The Board has financial risk management policies in place to ensure that all payables are paid within the credit timeframe.
2015 2014 N$ N$ 9. TRADE AND OTHER RECEIVABLES Trade receivables 5 797 432 4 880 832 Sundry debtors 123 865 1 648 023 Staff loans and advances 7 333 - Provision for doubtful debt (90 000) (124 000)
5 838 630 6 404 855 Past due but not impaired Past due for 1 – 30 days - - Past due for 31 – 60 days - - Past due for 61 – 90 days - - Past due for more than 90 days 90 000 124 000
90 000 124 000 Movement in provision for doubtful debt
Balance at the beginning of the year 124 000 54 000 (Decrease)/Increase in provision recognised in comprehensive income.
(24 000)
70 000
Amounts written off during the year (10 000) -
90 000 124 000

70
ELECTRICITY CONTROL BOARD
16
NOTES TO THE ANNUAL FINANCIAL STATEMENTS (continued) for the year ended 31 March 2015
13. RETIREMENT BENEFITS FOR EMPLOYEES
Retirement benefits are provided for employees through an
independent retirement fund known as Namflex Provident Fund. The retirement fund is governed by the Namibian Pension Funds Act and is a defined contribution plan. All permanent employees qualify for the retirement benefits. Current year contributions to retirement benefits amounted to N$ 2 161 866 (2014: N$ 1 358 830).
The total value of contributions to the fund during the year
amounted to:
Employee contributions 745 159 467 525 Employer contributions 1 416 707 6 315 474
2 161 866 7 082 630
891 305 6 315 474 1 358 830 7 082 630
According to Alexander Forbes, the value of the fund as at 31 March 2015 is N$ 9 918 272.
Restated Restated 2015 2014 2013 N$ N$ N$ 12. PRIOR PERIOD ERRORS
During the current year the board discovered that expenses for future project costs were incorrectly provided for in the prior years. The error has been rectified restrospectively and prior period restated.
The Board also discovered an error in the determination of the provision for performance bonus. The calculation of provision for bonus was based on the full year, instead of the months (five months) for which the employment services have been rendered as at reporting date. To ensure compliance with the criteria of IAS 37, the error has been rectified retrospectively and prior period restated.
The correction of the error(s) results in adjustment as follows:
Statement of Financial Position
Decrease in provision for Projects - 1 084 931 3 273 784
(Increase)/Decrease in provision for Bonus - (2 648) 1 646 764 Profit or loss Decrease/(increase) in provision for Projects - 1 084 941 3 273 784 Decrease/(increase) in provision for Bonus - (2 648) 1 646 764 - 1 082 283 4 920 548
2015 2014 N$ N$

71
ELECTRICITY CONTROL BOARD
17
NOTES TO THE ANNUAL FINANCIAL STATEMENTS (continued) for the year ended 31 March 2015 14. FINANCIAL INSTRUMENTS AND RISK MANAGEMENT
14.2 Interest rate management As part of the process of managing the Board’s interest rate risk, interest rate characteristics of new
borrowings and the refinancing of existing borrowings are positioned according to expected movements in interest rates. The Board currently has no exposure to interest rate risk as it does not have any interest bearing borrowings.
14.3 Credit risk management The Board only deposits cash surpluses with major banks and investment houses of high quality
credit standing.
At year-end the Board did not consider there to be any significant concentration of credit risk which has not been adequately provided for.
14.4 Liquidity risk management The Board has minimised its liquidity risk by ensuring adequate facilities and reserve borrowing
capacity. 14.5 Liquidity and interest risk tables
The table below summaries the Board’s exposure to liquidity and interest rate risk:
2015 Average
effective Interest rate
1-3 months
N$
3 months – 1 year
N$
1 – 5 years
N$
Total N$
Financial Assets Trade and other receivables 0% 5 838 630 - - 5 838 630 Bank balances and cash 3.61% 56 220 587 - - 56 220 587 62 059 217 - - 62 059 217 Financial Liabilities Trade and other payables 0% 9 862 887 - - 9 862 887 Trust funds 0% - - - - 9 862 887 - - 9 862 887
2015 2014 N$ N$ 14.1 Categories of financial instruments Financial assets Trade and other receivables 5 838 630 6 404 855 Bank balances and cash 56 220 587 43 934 255 62 059 217 50 339 110
Financial liabilities Trade and other payables 9 862 887 7 082 630 Liabilities at amortised cost 9 862 887 7 082 630

72
ELECTRICITY CONTROL BOARD
18
NOTES TO THE ANNUAL FINANCIAL STATEMENTS (continued) for the year ended 31 March 2015 14. FINANCIAL INSTRUMENTS AND RISK MANAGEMENT (continued) 14.5 Liquidity and interest risk tables (continued) 2014
Average effective
1-3 moths
3 months – 1 year
1-5 years
Total
Interest rate N$ N$ N$ N$ Financial Assets Trade and other receivables 0% 6 404 855 - - 6 404 855 Bank balances and cash 3.61% 43 934 255 - - 43 934 255 50 339 110 - - 50 339 110 Financial Liabilities Trade and other payables 0% 7 082 630 - - 7 082 630 Trust funds 0% - - - - 7 082 630 - - 7 082 630
Fair value The directors are of the opinion that the book value of financial instruments approximates their fair value, as the items are of a short-term nature.
14.6 Capital risk management
The Board manages its capital to ensure that it will be able to continue as a going concern while maximising the return to stakeholders by ensuring that economic value is added throughout. The capital structure consists of accumulated funds and cash and cash equivalents.
14.7 Market risk management
The Board’s activities expose it primarily to the financial risks of changes in interest rates. Refer to note 14.2 for detail on how the Board manages interest rate risk. There has been no change to the Board’s exposure to market risks or the manner in which it manages and measures risk.
2015 2014 N$ N$ 15. COMMITMENTS
At the reporting date, the Board had outstanding lease commitments under non-cancellable operating lease for its office equipment, which fall due as follows;
Within one year 29 730 29 730 Within two to five years 22 119 51 849 51 849 81 579 As at year end, the Board made commitments to pay a total amount
of N$3,379 706 to various consultants in respect of professional services to be rendered on various projects.

73
ELECTRICITY CONTROL BOARD
19
NOTES TO THE ANNUAL FINANCIAL STATEMENTS (continued) for the year ended 31 March 2015
16. RELATED PARTIES
The Board regards RERA, Government and other parastatals as
related parties. The following were the transactions entered into during the year:
Regional Electricity Regulator of Southern Africa (RERA) Subscription fees (membership)
Nampower (Levy income) (518 774)
55 750 998 (448 349)
47 697 984 55 232 224 47 249 635 Compensation of key management personnel Short-term benefits 5 000 330 8 970 421 Post-employment 489 743 472 459 5 490 073 9 442 880
17.
RECONCILIATION OF SURPLUS BEFORE TAXATION TO CASH UTILISED BY OPERATIONS
Surplus before taxation 9 945 488 13 190 214 Adjusted for: (Gain) / Loss on disposal of fixed assets (126 775) (46 089) Depreciation 989 118 619 987 Insurance proceeds - - Interest received (1 807 799) (1 407 287) 9 000 032 12 356 825 Working capital changes 3 346 483 (81 572) Increase / (decrease) in trade and other receivables 566 225 (2 383 114) Increase in trade and other payables 2 780 258 2 301 542
CASH RECEIVED FROM OPERATIONS 12 346 515 12 275 253
2015 2014 N$ N$

74
ELECTRICITY CONTROL BOARD
20
DETAILED STATEMENT OF PROFIT OR LOSS AND OTHER COMPREHENSIVE INCOME for the year ended 31 March 2015 2015 2014 N$ N$ INCOME Levies received 55 750 998 47 697 984 Licence fees 787 500 556 500 Interest received 1 807 799 1 407 287 Other income 89 113 831 370
TOTAL INCOME 58 435 410 50 493 141 EXPENDITURE Advertising 688 316 309 906 Audit fees- current year - prior year
120 780 11 144
133 458 4 793
Provision for doubtful debt 132 325 70 000 Bank charges Bursaries
37 028 313 391
50 420 -
Computer expenses 109 662 63 553 Computer software expenses 161 524 189 273 Conference and seminar expenses 1 642 758 2 778 640 Depreciation 989 118 619 987 Members’ fees 375 987 496 787 Donations 267 768 276 566 Entertainment 433 433 215 513 Foreign exchange losses 9 327 18 930 Insurance 223 191 137 332 Legal and professional fees 1 059 409 1 439 819 Licences and permits 4 083 1 212 Light, heat and water 226 733 180 738 (Profit)/Loss on disposal of fixed assets (126 975) 96 693 Maintenance 376 476 406 379 Office expenses 194 228 117 769 Penalties - - Postage and couriers 7 669 17 327 Printing and stationary 392 258 318 852 Project costs 9 847 240 6 231 934 Recruitment and staff training 2 535 502 1 786 164 Reference and resource material - - Rent – equipment Rent - office
295 864 299 070
237 279 80 291
Salaries and other staff costs Staff welfare
25 755 604 119 450
18 432 645 -
Security services 164 476 109 861 Subscriptions 702 725 674 745 Subsistence and travelling – staff members 537 506 1 146 293 – Board members 150 939 224 781 Telephone and fax 274 265 218 298 Vehicle expenses 157 648 216 689 TOTAL EXPENDITURE 48 489 922 37 302 927 SURLPUS FOR THE YEAR 9 945 488 13 190 214 Other comprehensive income - - TOTAL COMPREHENSIVE SURPLUS FOR THE YEAR 9 945 488 13 190 214

75
Notes

76
Notes