Annual report 2017 - Uponor · Uponor Annual Report 2017 – 10 years at a glance • 5. 10 years...
110
Annual report 2017
Transcript of Annual report 2017 - Uponor · Uponor Annual Report 2017 – 10 years at a glance • 5. 10 years...

Annual report 2017

Important dates in 2018Annual General MeetingUponor Corporation’s Annual General Meeting will be held on Tuesday, 13 March 2018 at 15:00 EET at the Helsinki Exhibition and Convention Centre, Messuaukio 1, Helsinki, Finland.
Financial accounts bulletin for 2017 15 February 08:00 EET
Financial statements for 2017 15 February -
Annual General Meeting 13 March 15:00 EET
Record date for dividend payment 1st instalment: 15 March*2nd instalment: 6 September*
-
Date for dividend payment 1st instalment: 22 March*2nd instalment: 13 September*
-
Interim report: January–March 3 May 14:00 EET
Interim report: January–June 25 July 08:00 EET
Interim report: January–September 24 October 08:00 EET
* Proposal of the Board of Directors
Investor Relations at [email protected]
Meeting requestsPäivi Dahlqvist, Executive AssistantTel. +358 (0)20 129 [email protected]
Other IR contactsMaija Strandberg, CFO Tel. +358 (0)20 129 [email protected]
Tarmo Anttila, Vice President, CommunicationsTel. +358 (0)20 129 [email protected]
Shareholder [email protected]
Reetta Härkki, General CounselTel. +358 (0)20 129 [email protected]
Change of addressShareholders are requested to notify their custodian bank, their brokerage firm, or any other financial institution responsible for maintaining their book-entry securities account of any changes in their mailing address.
Disclosure policyInformation on Uponor’s disclosure policy is available on our investor website at investors.uponor.com > Governance > Disclosure Policy
Contact Group Communications Uponor Corporation, Group Communications P.O. Box 37, Äyritie 20 FI-01511 Vantaa, Finland Tel. +358 (0)20 129 2854 [email protected]
Follow usOn social media:
Via our IR app:
Analysts covering UponorCarnegie Investment Bank AB Tommy Ilmoni
Danske Bank Plc Ari Järvinen
HandelsbankenMika Karppinen
Nordea Bank Finland PlcJohannes Grasberger
Pohjola Bank Plc Matias Rautionmaa
SEB EquitiesAnssi Kiviniemi
Further contact details available at investors.uponor.com
Uponor assumes no responsibility for the presented analyses.
Uponor Annual Report 2017 – Uponor in brief • 3
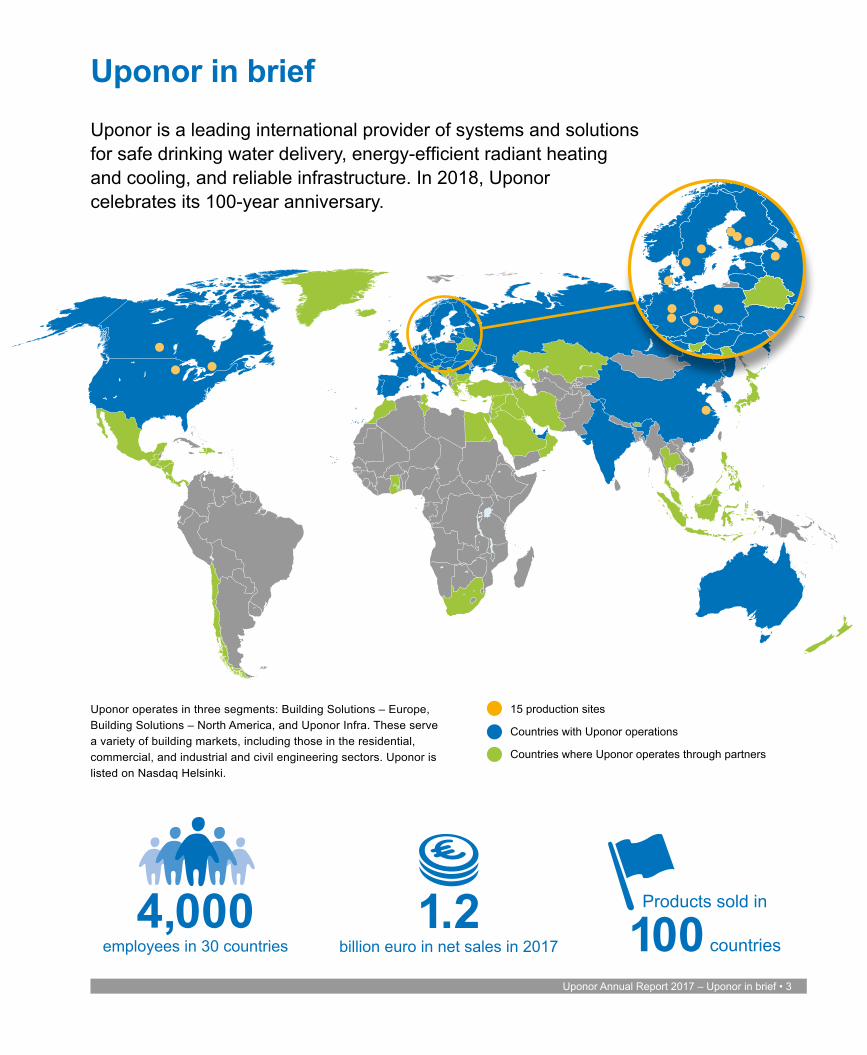
Uponor in brief
Products sold in
100 countries1.2
billion euro in net sales in 20174,000
employees in 30 countries
15 production sites
Countries with Uponor operations
Countries where Uponor operates through partners
Uponor is a leading international provider of systems and solutions for safe drinking water delivery, energy-efficient radiant heating and cooling, and reliable infrastructure. In 2018, Uponor celebrates its 100-year anniversary.
Uponor operates in three segments: Building Solutions – Europe, Building Solutions – North America, and Uponor Infra. These serve a variety of building markets, including those in the residential, commercial, and industrial and civil engineering sectors. Uponor is listed on Nasdaq Helsinki.

4 • Uponor Annual Report 2017 – Contents
Contents
Parent company financial statements (FAS) 97Notes to the parent company financial statements 100
■■ Auditor’s report 104■■ Quarterly data 107
■■ Uponor in brief 3■■ 10 years at a glance 5■■ Investor information 6■■ Milestones of our history 8■■ The year 2017 in brief 11■■ Uponor’s strategic approach 17■■ Sustainability at Uponor 21■■ Letter to investors 34■■ Board of Directors 1 January 2018 36■■ Executive Committee 1 January 2018 37■■ Review by the Board of Directors 38■■ Proposal of the Board of Directors 46■■ Group key financial figures 47■■ Share-specific key figures 48■■ Shares and shareholders 49■■ Corporate governance 51■■ Financial statements 59
Consolidated statement of comprehensive income 59Consolidated balance sheet 60Consolidated cash flow statement 62Consolidated statement of changes in shareholders’ equity 63Definitions of key ratios 64Notes to the consolidated financial statements 65
1. Accounting principles 652. Segment information 753. Business combinations 774. Other operating income and expenses 785. Employee benefits 786. Depreciation and impairment 787. Financial income and expenses
and currency exchange differences 788. Income taxes 799. Earnings per share 8010. Intangible assets 8011. Tangible assets 8212. Financial assets and liabilities by measurement category 8313. Investment in joint ventures and associated companies 8514. Other shares and holdings 8515. Non-current receivables 8516. Inventories 85
17. Current receivables 8518. Cash and cash equivalents 8619. Shareholders’ equity 8620. Deferred taxes 8621. Employee benefit obligations 8722. Provisions 8823. Interest-bearing liabilities 8824. Current liabilities 8925. Commitments, contingent assets and liabilities 9026. Operating lease commitments 9027. Financial risk management 9028. Derivative contracts and hedge accounting 9329. Capital management 9330. Management incentive programmes and share based payments 9431. Interests in subsidiaries and non-controlling interests 9432. Related party transactions 9533. Events after the balance sheet date 96

Uponor Annual Report 2017 – 10 years at a glance • 5
10 years at a glance
0
200
400
600
800
1,000
1,200
Net sales
171615141312111009080
40
80
120
160
200
240
Operating profit (rhs)
M€ M€
Comparable operating profit (rhs)
Net sales and operating profit 2008–2017
0.00
0.25
0.50
0.75
1.00
1.25
1.50
Earnings per share
171615141312111009080.00
0.25
0.50
0.75
1.00
1.25
1.50
Dividend per share (rhs)
€ €
EPS and DPS 2008–2017
-60
-30
0
30
60
90
120
150
Cash flow before financing
17161514131211100908-1.0
-0.5
0.0
0.5
1.0
1.5
2.0
2.5
Cash flow per share (rhs)
M€ €
Cash flow before financing 2008–2017
0
10
20
30
40
50
60
70
Investment (excl. acquisitions)
171615141312111009080
10
20
30
40
50
60
70
Depreciation (rhs)
M€ M€
Investment and depreciation 2008–2017
0
50
100
150
200
250
300
350
400
Equity
17161514131211100908 0
5
10
15
20
25
30
35
40
ROE (rhs)
M€ %
Equity and ROE 2008–2017
0
20
40
60
80
100
120
140
160
Net interest-bearing liabilities
171615141312111009080
20
40
60
80
100
120
140
160
Gearing, avg across quarters (rhs)
M€ %
Net interest-bearing liabilities and gearing 2008–2017

6 • Uponor Annual Report 2017 – Investor information
Investor information
Annual General Meeting
Uponor Corporation’s Annual General Meeting will be held on Tuesday, 13 March 2018 at 15:00 EET at the Helsinki Exhibition and Convention Centre, Messuaukio 1, Helsinki, Finland.
A shareholder who is registered in the shareholders’ register of the company and who wants to participate in the general meeting, shall register for the meeting no later than Thursday 8 March 2018 at 10:00 EET (Finnish time), by which time the registration shall arrive at the company. The registration can be made: • via the company’s website at investors.uponor.com or• by telephone +358 20 770 6883 on week days from 09:00 to
16:00 EET (Finnish time) or• by mail addressed to Uponor Corporation, Legal Services,
P.O. Box 37, FI-01511 Vantaa, Finland.
Payment of dividends
The Board of Directors proposes to the Annual General Meeting that for the financial year 2017 a dividend of €0.49 will be paid. The dividend shall be paid in two instalments. The first instalment of €0.24 per share shall be paid to a shareholder registered as a shareholder on the dividend record date, 15 March 2018. The first instalment will be paid on 22 March 2018.
The second instalment of €0.25 per share shall be paid in Sep-tember 2018. In its meeting scheduled for 4 September 2018, the Board of Directors will decide the dividend record date for the second instalment. Initially it is planned to be 6 September 2018 and the dividend payment date 13 September 2018.
2017 2016Market value of share capital at year-end, M€ 1,228.4 1,208.6Earnings per share (fully diluted), € 0.83 0.58Dividend, total, M€ 1) 35.8 33.6Dividend per share, € 1) 0.49 0.46Effective share yield, % 1) 2.9 2.8Issue-adjusted share prices- highest, € 17.79 17.35- lowest, € 13.30 11.13Number of shareholders 19,191 16,113
1) proposal of the Board of DirectorsThe definitions of key ratios are presented in the financial statements.
Target 2017 2016
Organic net sales growth*) 2017E: 5.4% 6.5% 2.0%EBIT margin >10% 8.2% 6.5%Return on investment (ROI) >20% 16.3% 14.1%Gearing (annual average of quarters) 30–70 43.5 56.7
Dividend payout> 50% of earnings 59.0% 79.3%
*) > GDP +3ppts (GDP growth based on a weighted average growth in the top 10 countries)
Long-term financial targets (since 12 Feb 2013)
More information on shares and shareholders, page 49–50.
Share-specific key figures
Financial impact on stakeholders
CustomersNet sales €1,170.4 million
InvestorsDividends paid
€33.6 million
PersonnelSalaries and
remunerations €214.4 million
Product and service suppliers
Purchases €855.4 million
SocietyTaxes and
social costs paid €54.1 million

Uponor Annual Report 2017 – Investor information • 7
Shareholder value development 1999–2017
Share performance and volumes in 2017
0
400
800
1,200
1,600
2,000
2,400
171615141312111009080706050403*02*01*00*99
Total Shareholder Return (rhs)DividendsMarket Cap
M€ %
*FAS
-60
-30
0
30
60
90
120
*
Listing of Uponor shares
Uponor Corporation is listed as a large cap enterprise on Nasdaq Helsinki. The shares are registered at Euroclear Finland Ltd.
Why invest in Uponor?
Uponor aims to be an attractive investment and increase its share-holders’ wealth long-term, based on a combination of professional and ethical management, stable and competitive dividend policy and growing value of the Uponor share.• Strong company brand which is recognised within the industry
internationally• Proven historic growth organically and through acquisitions
• Stable business with a track record of profitable performance even during down times
• Committed long-term ownership with a clear understanding of the industry dynamics
• Actively tapping into new business possibilities emerging through prefabrication and digitalisation (IoT)
How to follow Uponor?
Keep yourself up to date with Uponor’s latest share prices, company announcements, financial performance and events by downloading the Uponor IR app.
For more information, please visit investors.uponor.com
Uponor OMXHCAP rebased Volume (rhs)
20
16
12
8
4
0
4
3,2
2,4
1,6
0,8
0
Millions
1 2 3 4 5 6 7 8 9 10 11 12
€
8 • Uponor Annual Report 2017 – Milestones of our history
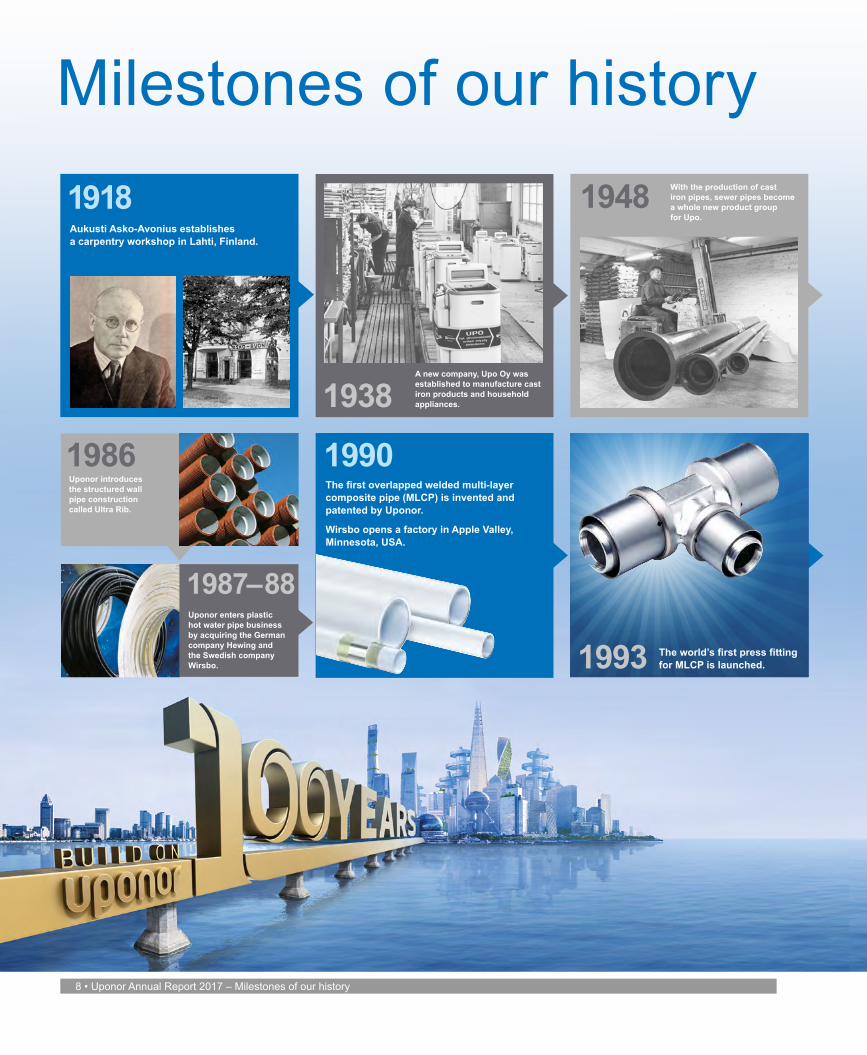
1918
1987–88
1938
1986
1948
1993
1990
Aukusti Asko-Avonius establishes a carpentry workshop in Lahti, Finland.
Uponor enters plastic hot water pipe business by acquiring the German company Hewing and the Swedish company Wirsbo.
A new company, Upo Oy was established to manufacture cast iron products and household appliances.
With the production of cast iron pipes, sewer pipes become a whole new product group for Upo.
Uponor introduces the structured wall pipe construction called Ultra Rib.
The world’s first press fitting for MLCP is launched.
The first overlapped welded multi-layer composite pipe (MLCP) is invented and patented by Uponor.
Wirsbo opens a factory in Apple Valley, Minnesota, USA.
Milestones of our history

Uponor Annual Report 2017 – Milestones of our history • 9
1965
1972
2018
1994
2013
1982
2017
1984The first plastic factory, Upo-Muovi, starts up in Nastola, Finland, and launches its first plastic pipes and fittings.
First in the world, Wirsbo in Sweden starts to manufacture the innovative PEX pipe for heating and plumbing applications.
1997 1999
During 1997–99 Uponor acquires the German company Unicor, and became a leader in multilayer composite pipe.
Oras becomes the largest shareholder in Uponor as it acquires the majority of the shareholding of Fortum (former Neste).
Development of the Weholite® technology by KWH.
Uponor celebrates its 100-year anniversary.
2000Merger with parent company Asko, which is renamed Uponor Corporation on 1 Jan 2000. Since 2006, the business trades under one brand.
Through a merger with KWH Pipe on 1 July 2013, Uponor Infra is established.
Asko and Neste establish Oy Uponor Ab.
Uponor launches the unique and revolutionary Quick & Easy fitting system.
2016
2016
Uponor acquires KaMo and Delta in Germany and expands its competence in drinking water hygiene.
Uponor and Belkin International Inc. establish the joint venture Phyn. Phyn develops water-sensing and conservation technology both for consumers and to the building industry.
Uponor acquires a new manufacturing site in Hutchinson, Minnesota, to meet continued strong growth in the USA.
The year 2018 marks Uponor’s 100th anniversary. Uponor’s story began in 1918, when Aukusti Asko-Avonius established a carpentry workshop in Lahti, Finland. The workshop quickly grew into the largest furniture supplier in the Nordic countries. In the 1960s, the company expanded its business further into the plastics industry.
Today, we are building a bridge from a successful past to a sustainable future. With the same innovative spirit that brought next-generation alter-natives to concrete, iron and copper as piping materials, we are moving forward into ever-more intelligent solutions. With a focus on sustainability, we promote innovation in energy saving and smarter water usage for the benefit of our customers and the world we live in.
2015UWater, a start-up company, that specialises in water quality monitoring was acquired.

10 • Uponor Annual Report 2017 – Milestones of our history
In May 2017, Uponor strengthened its foothold in Asian building markets by officially opening its first manufacturing facility in Taicang, China, as well as a sales office in Shanghai.

Uponor Annual Report 2017 – The year 2017 in brief • 11
Building Solutions – Europe
The last two years have been years of change in the Building Solu-tions – Europe segment. The Europe-wide transformation programme, which started at the end of 2015, was successfully finalised in 2017. After significant changes, our manufacturing footprint in Europe offers us capabilities and capacity which is more robust than ever before. As a result, cost competitiveness, product features and availability will be geared to satisfy an increasing customer demand both in the traditional residential as well as in the commercial segments of the market.
As part of the programme, the segment improved manufacturing efficiency throughout Europe. A new high-speed technology was implemented in PEX-a pipe production at the same time its manufac-turing was concentrated in Virsbo, Sweden and the Móstoles, Spain factory was closed. The final initiative in the programme involved closing the offices in Badia Polesine, Italy, in December.
Overall, the transformation programme met its set targets. The segment’s net sales growth continued to be moderate, while operating profit improved as a result of the savings achieved. During the year,
we continued to strengthen our marketing & sales organisations. Today, our organisation is leaner and more agile and we are in line with the execution of our strategy towards profitable growth.
In our key markets, demand continued to improve in the residential sector in particular. The segment was also able to increase sales of prefabricated solutions in the commercial sector. Prefabrication fulfils the key needs of the commercial building environment very well: it will alleviate the constant shortage of qualified installers, industrially manufactured solutions are safe, easy and quick to install, while the costs for the customer are lower and quality is higher. Future development of prefabricated solutions was enhanced by centralising all initiatives under one management.
The segment continued to strengthen its competencies in smart, hygienic water installations, which drove demand and helped to increase net sales. Increasing interest in our new offerings, especially hygienic and prefabricated solutions, has been encouraging and has enforced our chosen strategy.
In 2017, Building Solutions – Europe launched many new products, such as the Uponor Smatrix Style, our ultra-flat underfloor heating thermostat; the Uponor Comfort E, our electric underfloor
The year 2017 in brief
Net sales by business group
Net sales by country
Others
Russia
Norway
Spain
Netherlands
Denmark
Canada
Sweden
Finland
Germany
�USA
Others 16.3
Sweden 9.7
Germany 13.2
USA 26.3Russia 2.0
Norway 2.6Spain 3.2Netherlands 3.5Denmark 4.3
Canada 8.6
Plumbing Solutions 49
Indoor Climate Solutions 24
Infrastructure Solutions 27
Finland 10.3
Net sales by segment
Building Solutions – Europe 45
Building Solutions – North America28
Uponor Infra 27
% % %

12 • Uponor Annual Report 2017 – The year 2017 in brief
heating; the Uponor Ecoflex Thermo Pro, our pre-insulated local heat distribution pipes; and our entire prefabrication portfolio across the major markets of the business area in Europe. Work will continue over the forthcoming years, with a defined and agreed innovation pipeline reaching into 2020. The new organisational setup, with a common Group Technology and Corporate Development function, helped to accelerate the impact, by combining product requirements across Europe and North America.
Demand in the Chinese building market remained stable in 2017. Reported as part of the Building Solutions – Europe segment, Uponor has been manufacturing pipes for the plumbing market in Taicang, China, for slightly over a year. While the Asian business represents a minor share of Uponor’s current global business, net sales there are developing in the right direction and demand in the market continues to offer growth opportunities.
Building Solutions – North America
Building Solutions – North America realised healthy growth in 2017, by following its strategy and refocusing its efforts beyond its residen-tial roots towards emerging commercial opportunities. Supported by training, on-site support, and design and engineering services, Uponor’s proven PEX-a/Propex® product solution allowed the segment to remain the true market leader.
In March 2017, Uponor was present at the ISH exhibition in Germany, which is the world’s leading trade fair for the combined topic of water and energy. Uponor’s 620m² booth focused on hygiene, comfort and energy efficiency. The biannual exhibition has on average around 200,000 visitors and over 2,000 exhibitors.
The sales of Uponor’s prefabricated solutions increased in 2017. These prefabricated solutions are fully customised, individually
developed and pre-tested, meeting the highest hygiene, energy and cost efficiency requirements. They can reduce energy
consumption by up to 40% and installation time by up to 30%.

Uponor Annual Report 2017 – The year 2017 in brief • 13
The segment reported another successful year, despite some major challenges such as increasing competitive pressure, production and capacity complexities, an ongoing skilled-labour deficit and volatile metal prices. These issues were addressed head on, however, and the segment made significant progress in the supply chain, while focusing other efforts on increasing and improving capacity and productivity, as well as integrating systems and processes.
In response to growing demand for capacity, the segment announced two major expansion projects in 2017. First, there was the construction of a 5,400 square-metre (58,000 square-foot) manu-facturing facility and the tenth expansion in Apple Valley, Minnesota. Forecasting continued long-term growth in commercial and residential construction in North America, Uponor announced in July 2017 the purchase of a 22,000 square-metre (237,000 square-foot) factory in Hutchinson, Minnesota. Operations will begin there in the summer of 2018. The headcount also grew over the prior year, primarily in support of expanding plant and distribution needs.
Building Solutions – North America aims to solidify its position as the market leader focusing on innovations in materials, mechanical and smart-connection features, and digitalisation related to pipe, fitting and installation solutions. As part of this process, Phyn Plus was introduced to the U.S. markets in early 2018. Phyn Plus is a residential smart water monitoring and shut-off device, developed in partnership with Belkin. This represents another major step into the digital smart water technology market.
During the last half of 2017, Uponor spent a great deal of time and energy on internal change leadership, intended to strengthen its focus on the customer experience, while encouraging employees to develop innovative, new practices which would help to differentiate the company.
Uponor elevated its value proposition beyond product offerings and created a customer segment focused business model. The sales, marketing and R&D teams will leverage insights in order to deepen customer experiences and knowledge in each customer segment, and enhance innovation pipelines with offerings that better respond to customer needs.
Forecasting continued long-term growth in commercial and residential construction in the U.S., Uponor acquired the 22,000m² facility in Hutchinson, Minnesota. The new location provides access to a large pool of manufacturing talent and remains close enough to the company’s existing operations in Apple Valley to enable the use of shared services.
“In response to growing demand for capacity, the segment announced
two major expansion projects in 2017.”

14 • Uponor Annual Report 2017 – The year 2017 in brief
Uponor Infra
The infrastructure pipe markets in the Nordic countries, which are the largest market for Uponor Infra, had moderate market growth. This growth mainly resulted from the active Swedish infrastructure markets. Furthermore, after a couple of years of market decline in Canada, double-digit market growth was seen in 2017. Uponor Infra increased its share of this growing market. Combined with efficiency improvements, changes in market conditions led to a significant improvement in Uponor’s performance in Canada.
Since its establishment in 2013, Uponor Infra has executed several restructuring programmes to streamline its production footprint and increase its operational efficiency. The latest initiative in the Europe-wide transformation programme, involving the moving of plastic pipe produc-tion from Vaasa to Nastola, Finland, was finalised during the first half of 2017.
The completion of these internal streamlining programmes has provided the opportunity for increasing the focus even more on custom-ers and executing our growth strategy. The segment has succeeded in growing project sales in our main market in central and northern Europe, in line with our strategy of providing designed solutions for customers with more complex needs. Uponor Infra’s 360° Project Services concept, which includes services ranging from design to project management and field services, has been well received by customers.
Uponor Infra will continue to focus on customer needs, with the aim of creating new solutions and services for the infrastructure markets. By focusing on value-based solutions, the segment can provide added value that goes beyond the products themselves.
Uponor Infra has now consolidated its production footprint to ensure the appropriate capacity utilisation based on anticipated market needs. The focus is on increasing efficiency and automation in all processes. The segment is well positioned to continue with the execution of our growth strategy and further improve our financial performance to meet the targets set for the coming years.
30m long Weholite® tanks were installed at a wastewater treatment plant in Riihimäki, Finland in late 2016. The tanks, each with an inner diameter of 3m and a volume of over 200m³, were installed to ensure that the plant can keep running even during emergencies.

Uponor Annual Report 2017 – The year 2017 in brief • 15
Group Technology and Corporate Development
Group Technology and Corporate Development was established as a global function in 2016 and is engaged in research, technology and product development. The function serves all three business seg-ments and allocates the most appropriate resources to key opportuni-ties in areas such as innovation and digitalisation.
Key development projects during 2017 focused on our intelligent water solutions, with extended capabilities built into water installa-tions for the monitoring and prevention of water quality issues and water damage, while improving construction efficiency. A develop-ment programme typically begins with the design phase, before proceeding through extended BIM (Building Information Modelling) functionalities to the installation and use phase. The new Phyn technology, developed alongside Belkin, has successfully passed the beta tests and was introduced to the North American market in early 2018. This will reshape the way plumbing installations are monitored.
In addition, Uponor announced the acquisition of NWater, a new water analytics technology, in 2016. In 2017, the technology, renamed UWater, uses online analysis to help users detect sudden changes in water quality.
Dedicated efforts were made to develop Uponor’s offering and processes. Digitalisation is a key element in our strategy of achiev-ing short-term growth in markets we are currently existing, and ones in which we are seeking further growth. In the longer term, digitalisation will help us to enhance the customer experience and add value to their businesses.
Among Indoor Climate product launches in 2017, the new room thermostat, Uponor Smatrix Style, received the international Plus X Award in the categories High Quality, Design, Ease of Use and Ecology. The jury was convinced by the Uponor Smatrix Style’s clean and attractive design, in addition to its intelligent control technology with outstanding energy efficiency and high levels of room comfort. In the opinion of the experts, the Uponor Smatrix Style is easy to operate – particularly due to its simple setting via the Smatrix application.
“In the longer term, digitalisation will help us to enhance the customer
experience and add value to their businesses.”
Phyn Plus, the world’s most comprehensive intelligent water solution, was launched in the U.S. in January 2018. The product monitors and measures fluctuations in water pressure, alerts homeowners of changes in their normal water usage, and, in the event of a major leak, turns off water automatically with its built-in shut-off valve. Introduction to European markets is planned for 2019.

16 • Uponor Annual Report 2017 – The year 2017 in brief
• Everything we do, we do for the customer• We are curious and always look for better ways to perform
Our valuesConnect. Build. Inspire.
Our visionThroughout the world, our solutions
enrich people’s way of life
We behave according to these values to demonstrate our customer focus and expertise
• We are committed to and accountable for achieving results• We collaborate, listen and learn• We trust, respect and have fun• We seek and provide constructive feedback
In 2017, Uponor supplied a highly efficient and comfortable indoor climate solution at the new 50 Hertz headquarters in Berlin, Germany. For its sustainable and spectacular architecture, this high-rise building received the Diamond and Gold awards from the German Sustain-able Building Council (DGNB).

Uponor Annual Report 2017 – Uponor’s strategic approach • 17
Uponor’s strategic approachMarkets where we operate
Uponor is in the business of manufacturing and selling solutions for hygienic drinking water delivery, energy efficient heating and cooling, and reliable infrastructure for handling fluids. Uponor products are available to customers in over 100 countries and we have manufac-turing operations on three continents.
Main trends that may affect future development
Demand for Uponor’s products is closely tied to the cycles of the construction industry. New build is strongly cyclical, which is partly balanced by more consistent and upward-trending demand for renovation construction.
Urbanisation is a key trend, which is visible in the fact that multi-family housing is increasing its share of overall residential construction. Urbanisation, combined with a lack of skilled labour,
the need for improved quality and more efficient construction processes call for a shift in the value chain, whereby a higher share of value is added outside the construction site. This represents an opportunity for construction materials companies to provide pre-fab-ricated solutions, digital product information and compatible Building Information Modelling (BIM) tools.
Uponor’s in-depth knowledge of plastics and extrusion technolo-gies has traditionally been a core competence. While these will also remain important going forward, the basis of competition is shifting towards improved understanding of customer needs and the capabil-ity to supply complete solutions.
Uponor’s strategic approach
Although Uponor’s business segments cover a range of geographies and target different customer groups, they share similar challenges and a common strategic direction.
TIME
VALU
E We build options for future growth: e.g. sustainable hygienic solutions,
advanced product and production technologies
We defend our strong position in distribution business and residential markets
We expand in commercial markets with an aim to significantly grow designed solution sales
Three horizons of profitable growth

18 • Uponor Annual Report 2017 – Uponor’s strategic approach
The first horizon represents our current business, where standard components are delivered through wholesalers. In terms of building solutions, our products are mainly supplied to the residential construc-tion sector of the market. For Uponor Infra, the first horizon business model represents systems in stock and standard project sales. This business segment is highly competed and commoditisation is acceler-ating. Operational efficiencies and innovative offerings continue to be the keys to sustaining Uponor’s high market share.
The second horizon represents the growth of business through expansion into the commercial segment, i.e. commercial buildings and multi-family housing. For Uponor Infra, the commercial segment equals sales of designed solutions. A higher degree of pre-fabrication and a more customised and complete solution delivery are character-istic of this business.
The third horizon consists of options with the potential to reshape the business Uponor is in. For example, we view digitalisation as a key enabler of extending business from pipes and fittings to services related to water monitoring. The sustainability and hygiene aspects continue to be important. Due to greater uncertainty related to these initiatives, Uponor is proceeding on multiple fronts.
“Through innovation and partnerships, we are committed to long-term value
creation and to creating a more sustainable world that delivers
the ultimate goal of shared sustained success.”

Uponor Annual Report 2017 – Uponor’s strategic approach • 19
Value chain
Uponor’s value chain starts with sourcing, where we leverage economies of scale within a continent. In-house manufacturing with the capability to produce a wide variety of pipes and fittings provides a competitive advantage and ensures the quality of Uponor products.
In our customer-facing operations, we partner with professionals. Uponor has long term relationships with wholesalers and we have trained over 10,000 professional plumbers. The role of architects, designers and investors is growing as we progress with our com-mercial strategy. Partnering with professionals is also central in the development and operation of digital services. We select partners with not only complementary skills, but also the capability to accelerate Uponor’s digital transformation.
Organisation
Uponor is organised into three segments with business responsibility and proximity to customers. People, brand and technology topics are managed at Group level in order to benefit from our global presence and maximise the return from long term R&D projects.
Building Solutions – Europe
Building Solutions
– North America
Uponor Infra
Human Resources and Communication
Technology and Corporate Development
Finance and Information Technology
Customer

20 • Uponor Annual Report 2017 – Uponor’s strategic approach
Uponor’s sustainability statementUponor is committed to addressing the key issues of our time through innovations that help to reduce environ-mental impact. Through partnerships, we strive to provide leadership in sustainable solutions for the mutual well-being of both people and the planet, while ensuring the long-term viability of our operations.

Uponor Annual Report 2017 – Sustainability at Uponor • 21
Sustainability at Uponor
Operating in an industry with a strong influence on sustainable living, Uponor’s objective is to enrich people’s way of life by offering high quality indoor climate, plumbing and infrastructure solutions that enhance the wellbeing of our customers and the communities we all live and work in. Sustainability plays a key role in fulfilling this objec-tive. At Uponor, we embrace sustainability in its broadest form, taking account of the delicate balance between environmental stewardship, social responsibility and a commitment to long-term profitable growth. Through innovation and partnerships, we are committed to long-term value creation and to creating a more sustainable world that delivers the ultimate goal of shared sustained success.
In 2017, as part of our commitment to creating a more sustainable world, Uponor completed its first materiality assessment to determine our key environmental, social, and governance (ESG) impacts and opportunities. Using the results of this assessment, Uponor is in the process of renewing its Group-wide sustainability strategy and goals, which align with our most material ESG topics and will enable us to maximise our positive impacts in these focus areas.
Sustainability governanceUponor’s strategy recognises sustainability as a potential and clear demand driver: our target is therefore to include sustainability in all key business processes. A dedicated Corporate Responsibility and Sustainability team is responsible for driving the Group sustainability programme, with a particular emphasis on identifying, planning and executing initiatives with the aim of simultaneously improving our environmental and social performance and reducing operational costs. The Executive Committee and the Board oversee the sustain-ability programme.
Uponor’s four pillars of sustainability
Uponor’s current approach to corporate responsibility and sustain-ability is based on four pillars, which are derived from the triple bottom line (i.e. the environmental, social and financial pillars). These pillars support the achievement of our objective and provide a framework for our sustainability endeavours. The four pillars are:
CULTURE: Strongly integrating sustainability into our corporate mindsetTo succeed in our journey towards a sustainable future, we will develop a corporate culture of sustainability with the full commitment and engagement of all of our employees.
CARE: Driving down our environmental impactThroughout our manufacturing and non-manufacturing facilities, we are committed to minimising resource utilisation and waste, and implementing renewable energy sources.
CUSTOMER: Enriching lives through our innovative solutionsThrough our innovative and sustainable solutions, we will help to achieve zero carbon emissions while creating comfortable and healthy built environments.
PARTNER: Engaging stakeholders in our sustainable journeyWe will collaborate with all of our stakeholders to create sustainable communities for future generations.
Our four pillars will become the context of how we manage corporate responsibility. From the pillars, we have defined five focus areas for driving our sustainability programme further.

22 • Uponor Annual Report 2017 – Sustainability at Uponor
Sustainability focus areas
Uponor’s sustainability work focuses on the following focus areas: Corporate citizenship, Environment, Health & Safety, Partnerships, and Building on people. The focus areas help manage and advance our goal fulfilment and commitment, as outlined in our four pillars of sustainability.
Corporate citizenship
Being a global company with a presence in 30 countries and products sold in close to 100 countries, Uponor takes the utmost care to main-tain its corporate ethics and integrity, and fair employment practices across its entire value chain. We want to be known and respected for transparency, fairness and equal opportunities among our employees, our future talent pool, and our customers, partners and investors.
Code of ConductUponor’s Code of Conduct is a practical guideline for all Uponor employees on dealing with issues regarding ethics, laws and regula-tions, conflicts of interest, gifts and bribes, confidential information, the environment, politics and, of course, employees, customers and suppliers. The Code of Conduct promotes moral behaviour and acts as a guideline for ethical decision-making. The Code of Conduct has been approved by the company’s Board of Directors.
The Code of Conduct requires all Uponor companies, employees and suppliers to comply with the relevant international and national laws and regulations wherever Uponor conducts business. Among these are laws and regulations promoting fair competition; govern- ing publicly traded securities; addressing corporate governance; protection of individual privacy; safeguarding against corruption; and dealing with product safety as well as labour laws. Any breaches of the Code of Conduct are subject to disciplinary action. Uponor’s Code of Conduct can be found on the company’s website at https://www.uponor.com/legal-information/code-of-conduct.
To ensure awareness and knowledge of the Code of Conduct among its employees, Uponor conducts training on a regular basis. In 2017, our Internal Controls and Group Legal functions conducted an Ethics, Compliance & Controls survey to analyse and increase employees’ awareness of the Code of Conduct. A link to the ques-tionnaire was sent to all employees with an email address (around 2,100 employees) and the response rate was 50%. The survey was administered by a third party, to keep it fully anonymous.
Bribery/Anti-corruptionBribery or corruption matters are covered by the Fraud Prevention Policy. The purpose of this policy is to set out Uponor’s attitude to fraud and its intention to prevent it, as well as the responsibilities of all Uponor employees regarding fraud prevention. Uponor does not tolerate fraud of any level.
Shared sustained success
CULTURE
Integrating sustainability into our
corporate mindset
CARE
Driving down our environmental impact
CUSTOMER
Enriching lives through our innovative
solutions
Corporate responsibility
PARTNER
Engaging external stakeholder in our
sustainability journey
A more sustainable world

Uponor Annual Report 2017 – Sustainability at Uponor • 23
The policy is approved and overseen by the Board of Directors of Uponor Corporation. The CEO and Executive Committee are responsible for the evaluation of this policy on an annual basis. This policy applies to all Uponor employees worldwide, as well as to all of Uponor’s associates (representatives, consultants, vendors, contractors, outside agencies, and/or any other parties in a business relationship with Uponor).
All fraud and allegations (anonymous or otherwise) are investi-gated thoroughly, regardless of the suspected fraudster’s position, length of service, or relationship with Uponor. Employees who violate this policy are subject to disciplinary action. Associates who violate the policy are subject to the termination of all commercial relation-ships with Uponor, to liability for damages, and to taking criminal responsibility for their actions.
Fair employment practicesUponor respects human rights and follows the guidelines of the United Nations’ Universal Declaration of Human Rights. Uponor is a responsible employer and supports equal opportunities for its employees. No discrimination is allowed. Uponor does not allow child or forced labour or engage suppliers that do so. Uponor strives to provide fair compensation as well as a safe and healthy workplace for all employees. An anonymous whistleblower channel is under preparation and should be in place by 2018, replacing the current non-anonymous system. For more information on Uponor’s commit-ment to fair employment practices, please visit https://www.uponor.com/legal-information/code-of-conduct.
DiversityUponor aims to have a diverse workforce that creates the best pos-sible environment for an innovative and efficient way of working, in order to build a successful business performance. Uponor is committed to its Equal Opportunity policy and strives to provide an environment where every employee and customer feels respected and valued, regardless of race, colour, religion, sex, language, politi-cal or other opinions, national or social origin, property, birth or other status.
Apart from following up on the agreed criteria at Uponor Group, segment and country levels on a regular basis, the Uponor Executive Committee discusses diversity and its status annually, on its People Day, and reports its conclusions to the Board of Directors. If a cause for concern is noted, corrective actions are taken immediately. For more information on Uponor’s Diversity Statement, please visit https://www.uponor.com/legal-information/diversity-statement.
Board diversityThe company intends its Board of Directors to represent diverse expertise in various industries and markets, a diverse range of professional and educational backgrounds, a diverse age distribution and both genders. Uponor Corporation does not have employee representation on the Board. For more information on the diversity of the Board of Directors, please visit https://investors.uponor.com/governance/board-directors.
Supply chain managementUponor is an industrial company that offers products and services to business clients in international markets. Our offering consists of high-quality products that have a long-service life both in commercial or domestic applications. Therefore we put emphasis on quality, safety and reliability, among other things.
As set forth in the Code of Conduct and the frame purchase agreements, Uponor’s suppliers are also expected to meet Uponor’s ethical, social, environmental and quality standards, and comply with the applicable international and national laws and regulations. Uponor evaluates and audits existing and new suppliers according to these principles. Uponor’s Corporate Responsibility principles require that all products and services sold under the Uponor brand are sourced according to practices which uphold internationally accepted standards. Our aim is to ensure that environmental, ethical, social, and health and safety issues, as well as labour practices, are not separate add-on features, but are embedded within all of our sourcing processes. For more information regarding Uponor’s Supplier Policy, please visit https://www.uponor.com/legal-information/supplier-policy.
Environment
Uponor aspires to harmonise the interests of people, the environ-ment and the economy. Uponor considers the environmental aspects of its product offering and continuously aims to reduce the overall environmental impact of its business operations. We pursue a certified environmental management system according to ISO 14001 and an energy management system according to ISO 50001, in order to reach our environmental and energy targets systematically. For more information on Uponor’s Environmental Policy, please visit https://www.uponor.com/legal-information/quality-environmental-management-policy.
“Uponor’s suppliers are expected to meet our ethical, social, environmental
and quality standards, and comply with the applicable international and
national laws and regulations.”

24 • Uponor Annual Report 2017 – Sustainability at Uponor
Measure Unit 2017 2016 2015 2014 2013Environmental indicatorsTotal energy consumption 1,000 MWh 198.5 198.5 185.1 184.2 149.3- Electricity purchased 1,000 MWh 157.3 149.6 138.3 130.6 101.7 - of which, certified green electricity 1,000 MWh 20.7 14.5 11.5 11.1 2.2- Self-generated electricity 1,000 MWh 0.4 0.9 1.1 1.0 1.2- Fossil fuels used 1,000 MWh 41.0 48.9 46.8 53.6 47.6- Heating 1,000 MWh 26.5 33.7 31.6 35.9 33.1 - of which renewable % 17.1 14.7 13.4 12.9 3.5- Own fleet vehicles (including leasing) 1,000 MWh 14.6 15.2 15.2 17.7 14.5Raw materials used 1,000 tonnes 140.8 132.7 127.1 122.5 84.6Water consumption 1,000 m3 156.4 168.4 190.9 190.0 111.4
Total GHG emissions (Scope 1) 1,000 tonnes 7.5 8.7 8.5 9.6 9.3Total GHG emissions (Scope 2) 1,000 tonnes 32.1 32.2 33.5 31.1 24.3
Total waste 1,000 tonnes 18.8 16.4 16.4 15.1 11.1- Waste recycled % 92.4 97.4 97.5 95.3 95.9- Waste to landfills % 7.6 2.6 2.5 4.7 4.1Hazardous waste, of total waste % 4.5 1.5 1.1 1.1 1.5
Total number of manufacturing sites 15 15 14 14 10ISO 14001 certified sites 13 10 10 12 8- sites certified % 87 67 71 86 80ISO 50001 certified sites 4 3 2- sites certified % 20 20 14
The overall data accuracy level is at >95%.
In 2017, our sustainability performance was improved by major operational streamlining, including the closure of pipe production in Móstoles, Spain, and its relocation to Virsbo, Sweden, as well as the relocation of pre-insulated pipe production from Nastola, Finland, to Virsbo, Sweden, which was completed in 2017. The amount of fossil fuels used declined groupwide, while the amount of certified green energy increased. Water consumption also decreased as a result of process modernisations. Overall greenhouse gas emissions also fell. We report a Scope 2, market-based figure where information is available, and a location-based figure elsewhere. The aim is to report a scope 2, market-based figure for all sites, wherever such information is available for 2018. While the total amount of waste developed rather stably, the amount of waste delivered to landfills increased markedly. The main reason for this was the dismantling of an unused process water installation and nearby contaminated soil, which had been jointly used by Uponor and two businesses divested in the 1990s. This is also the reason why the amount of hazardous waste clearly exceeded our normal annual level. Some figures for previous years have changed due to newly installed measurement techniques and improved accuracy in the data. The data does not yet include information for the manufacturing sites in Canada, Russia and China, where the setting up of environmental reporting is ongoing and which will be included in 2018. Nor does it include the factory building acquired in 2017 in Hutchinson, Minnesota, in the USA, which is not yet operational.
GHG emissions [Scope 1+2/net sales] Target Linear (GHG emissions [Scope 1+2/net sales])
70
60
50
40
30
20
10
0
kg /
1,00
0 eu
ros
2009 2010 2011 2012 2013 2014 2015 2016 2017
GHG emissions relative to targetGreenhouse gas emissionsGlobal warming and the desire to minimise greenhouse gas (GHG) emissions is a key driver of Uponor’s efforts to address its own energy usage. We have set ourselves the goal of reducing our scope 1 and scope 2 GHG emissions by 20% per net sales by 2020, from our 2015 levels. We also have the goal of using 100% renewable, green energy, wherever possible, by 2020. To advance our green energy mix, Uponor signed a 10-year agreement in 2017, to obtain ca 40% of the power needed for its Apple Valley, Minnesota (U.S.) site from 100% renewable sources (wind and solar). Uponor’s site in Germany has been sourcing 100% green electricity since 2014.

Uponor Annual Report 2017 – Sustainability at Uponor • 25
With a strong emphasis on driving down its environmental impact, Uponor is striving to increase its internal energy efficiency and reduce costs by focusing on employee behaviour, production processes and the supply chain. As of 2017, 13 of our 15 production sites have been ISO 14001 certified and four sites ISO 50001 certified, thereby provid-ing a strategic advantage in terms of direct internal benefits from a robust environmental management system, as well as establishing recognition of the company’s sustainability credentials by external stakeholders. The plan is to have all sites certified under ISO 14001 and ISO 50001 by 2020.
WaterUponor is working continuously to reduce its overall environmental footprint. The companywide Environmental and Energy programme includes several projects and initiatives to improve the efficiency of operations, including water efficiency. All of Uponor’s production sites use a closed-loop water circulation system for extrusion cooling purposes.
The environment and one of our most precious commodities – water – are also central to the innovative solutions we develop. For example, Phyn Plus (launched in the U.S. in January 2018), the new smart home device resulting from the joint venture between Uponor and the consumer electronics company, Belkin, alerts homeowners the moment a leak is detected and mitigates damage by shutting off the water. For more information on our product offering, please visit https://www.uponor.com/products.
Hazardous wasteWaste from Uponor production sites and our use of materials have low potential for generating “hazardous waste”. In a typical year, less than 1.5% of Uponor’s total waste is hazardous. We have been able to decrease this share over the years due to implementation of our environmental programme (e.g. our water treatment plant for oily water emulsion). Hazardous waste is recycled by Uponor’s con-tracted, certified disposal companies, making the total waste quantity low at the end of the life-cycle.
In 2017, however, the amount of hazardous waste increased markedly. The main reason for this was the dismantling of an unused process water installation and nearby contaminated soil, which had been jointly used by Uponor and two businesses divested in the 1990s.
Chemical managementBased on information provided by suppliers, all Uponor products and systems comply with the requirements of the European REACH (Registration, Evaluation, Authorisation and Restriction of Chemicals) regulation. The Declaration of Conformity can be found at https://www.uponor.com/legal-information/reach. While North America does not have a REACH regulation of its own, Uponor follows the EU regulation throughout the company, when appropriate.
Uponor has established a REACH team, where specialists regularly analyse changes in legislation, production etc. The team performs quarterly follow-ups of activities and defined measures and, if the relevant changes occur, Uponor’s REACH team investigates the effects on its products internally. If needed, the team contacts the suppliers involved and evaluates the situation internally with Development/Production teams.
Via a mobile app, Phyn Plus alerts homeowners
of changes in their normal water usage. In the event of
a major leak, the product turns off water automatically
with its built-in shut-off valve. Phyn Plus is aligned with
Uponor’s strategic goals in terms of digitalisation and
sustainability, helping to conserve water and enhance
our way of using water.

26 • Uponor Annual Report 2017 – Sustainability at Uponor
Circular economyUponor believes that it is crucial to embrace the transition from a take-make-waste economy to a circular economy. To do this, we will focus on innovation. Our key projects based on circular economy thinking are related to recycled, returnable, recyclable packaging systems, alternative resins, as well as re-integrating production scrap and post-consumer recyclate back into the value stream.
Product innovation and development Uponor has a strategy based on generating sustainable growth, where innovation is one way of fulfilling our ambitions and achieving our stated growth objectives. Uponor utilises a web-based platform for idea management, with the related funnelling process. At a minimum, an idea must support one innovation driver and one of our corporate commitments, e.g. sustainability, health and comfort, to qualify for further consideration in the innovation pipeline.
We continuously strive to create innovative solutions that help to create more comfortable, safe and eco-efficient buildings. Our environmentally friendly systems for underfloor heating and cooling, wall heating and cooling, and for the thermal activation of building structures, ensure excellent living and working climates. With low operating temperatures and comfortable room ambiance, radiant heating systems represent a highly energy-efficient method of heat distribution in buildings. Due to higher system temperatures in cooling mode and lower system temperatures in heating mode, radiant systems are perfectly suited for renewable energy sources. This allows a major reduction in the primary energy consumption and CO2 emissions of buildings. For more information, please visit https://www.uponor.com/products.
Uponor’s lightweight and durable Weholite® is increasingly often selected for tank solutions requiring high capacity, such as waterworks, storm water, fire water and chemical tanks, alkalisation plants and attenuation basins. The product’s ready-to-install feature saves approximately 5.5 weeks at the work site and more than 110 tonnes of CO2 emissions.
Soil contamination comes from a variety of sources. Many of the substances found
in contaminated soil permeate standard polyethylene potable water pipes, causing water contamination. The Uponor Barrier
PLUS provides a new, sustainable way of keeping potable water clean in contami-
nated soil, and can be completely recycled.

Uponor Annual Report 2017 – Sustainability at Uponor • 27
Health & Safety
The safety and well-being of our employees and customers is of paramount importance to Uponor.
Employee health & safetyThe health and safety of our employees is a management priority and always takes precedence over financial considerations. We also expect our employees to contribute to our occupational safety and health goals in a manner that aligns with their responsibilities. Employee health and safety topics are covered by the Quality Environmental Management Policy, which can be found on the company’s website at https://www.uponor.com/legal-information/quality-environmental-management-policy.
As part of the World Class Operations methodology, Uponor has been implementing a zero accident target for all Uponor production sites since 2008. The system is built on unit-specific safety teams that drive a safer workplace through training and regular meetings focusing on risk assessment and accident prevention, including
incident reporting and root cause analysis. The teams also perform internal and external benchmarking. The initiatives implemented have resulted in a generally improving trend for accidents. In 2017, largely due to the ongoing, extensive transformation programme, the trend weakened, driven by an increase in reported accidents in Uponor Infra. In general, accidents that result in sick leave are caused by slips or falls, handling errors, or contact with machinery or a vehicle.
Installer health & safetyRealising that construction work can be dangerous, Uponor strives to ensure installer health & safety at the work site. Uponor’s plastic pipe systems offer solutions that make it safer for the installers who help to create the structures we live and work in every day. For example, the PEX pipe offers installers a durable but lightweight solution that is much easier to carry than metal pipes and eliminates the risk of fire at a worksite. Uponor’s patented fitting systems enable connections to be made in seconds, eliminating dangerous solvents and joining chemicals so that installers can breathe freely without inhaling toxic fumes.
Measure Unit 2017 2016 2015 2014 2013Social indicatorsNumber of employees (FTE) 4,075 3,868 3,735 3,982 4,141Employee turnover % 11.2 4.5 5.0 3.3 7.8Total working hours 1,000 hours 7,172 6,808 6,574 7,008 7,288Workforce accidents 64 54 86 74 45Incident rate (LTIF) per million work hours 9 8 13 11 6
The overall data accuracy level is at >95%.

28 • Uponor Annual Report 2017 – Sustainability at Uponor
Occupant health & safetyAs well as being environmentally friendly, our products create healthy and comfortable built environments, and safe and resilient infrastruc-tures. Our radiant heating and cooling solutions help to keep buildings energy-efficient, while improving indoor air quality and ensuring the comfort of occupants all year long.
The key factor in drinking water hygiene is preventing the growth of unwanted substances and living organisms. This can be achieved by ensuring a continuous flow of water, the right water temperature and no storage of hot water. Uponor’s closed loop installations and automatic flushing units keep water flowing and avoid stagnation at all times. Our pipe technology and design methods help to keep the water temperature below 25°C and prevent cold water delivery pipes from warming up. Our heat interface units generate hot drinking water on demand.
In step with urbanisation, paved areas are increasing in number, resulting in the reduction of natural storm water run-off areas. The problem of flooding is affecting our way of life and is extremely costly for communities. But it is not just the amount of water that is increasing; floodwater brings polluted sediments, chemicals and loose objects. Collecting water sediment also protects the environment. At Uponor, we have been actively working on the challenges present-ed by storm water for many years. Uponor Smart Trap collects 100% more sediment than traditional sand trap chambers. Its renovation module can be installed in existing chambers, thereby avoiding the use of additional resources.
Uponor announced the acquisition of a budding water analytics technology in 2016. In 2017, the technology was commercialised for its first application in the infrastructure segment. Through online
analysis, users of the technology can detect sudden changes in water quality, signalling an event in a drinking water distribution network. The early online warning system enables water utilities to both locate the source and mitigate the problem much faster – which will lower health hazards and their related costs. The system can provide major help in making drinking water distribution systems safer and healthier. For more information, please visit https://www.uponor.com/products.

Uponor Annual Report 2017 – Sustainability at Uponor • 29
Partnerships
The starting point of Uponor’s operations is to provide value for our customers and partners. We focus on long-term cooperation, providing a reliable partnership, and offering solutions that enable customers to thrive in their businesses. The ultimate goal is to partner with other professionals in creating better human environments. Collaboration and forming partnerships is also the basis of our approach to promoting sustainability.
Uponor works with branch and trade organisations to influence local and international policy makers on topics related to energy, health and water. Such organisations include The European Plastic Pipe and Fittings Association (TEPPFA), Plastic Pipe and Fittings Association (PPFA) in North America and REHVA (Federation of European Heating, Ventilation and Air Conditioning Associations). We also work with the U.S. organisations Residential Energy Services
Network (RESNET), National Association of Home Builders (NAHB), Leading Suppliers Council, Minnesota Sustainable Growth Coalition and Earthshare, as well as national Green Building Councils and the globally operating World Wildlife Fund (WWF), to name a few. An Uponor employee currently holds a board position on the World Green Building Council. In 2017, Uponor Corporation became a member of FIBS, a corporate responsibility network for businesses and organisations in Finland.
Uponor strongly supports the development of legislation and policy that reduce the environmental impact of products and technologies used in the construction industry, thereby mitigating the effects of climate change. In 2016, Uponor became a member of the Finnish Climate Leadership Council established to influence Finnish busi-nesses and research organisations in their response to the threats posed by climate change, and to improve their ability to benefit from the related business opportunities. Uponor has been a Founder
Ilari Aho, VP, New Business Development and CSR, speaking at Uponor Future Building event in Stockholm, Sweden in May 2017. The event brought together many professionals of the construction industry, providing ideas and inspiration on the future of the building industry.

30 • Uponor Annual Report 2017 – Sustainability at Uponor
member of the Stockholm Water Prize since 1995. Through participa-tion in national, European and global standardisation work, Uponor is helping to drive local and international legislation in this direction.
Furthermore, Uponor annually organises congresses and events at which planners, architects and other professionals discuss various sustainability-related themes. For example, in 2016/2017, the Uponor Tap Water Expert Forum was organised in Germany to educate people about drinking water hygiene in general and Uponor’s specific solutions. In North America, Uponor organises a convention every two years to educate customers about its systems offering. This conven-tion is attended by around 1,000 visitors. In Central Europe, Uponor organises an annual Uponor Kongress for German-speaking plumb-ing and heating industry professionals. The next congress in March 2018 will be the 40th of its kind.
Uponor partners with professionals through various different congresses and exhibitions around the world. From top left to right: ISH exhibition 2017 in Germany; Uponor Kongress 2017 in Austria; launch of Phyn Plus at Consumer Electronics Show (CES) 2018 in the U.S.; Uponor Infra at Rørcenterdagene 2017 in Denmark.
“We focus on long-term cooperation, providing a reliable partnership,
and offering solutions that enable customers to thrive in their businesses.”

Uponor Annual Report 2017 – Sustainability at Uponor • 31
Building on our people
We acknowledge the importance of an organisational culture in supporting the Uponor strategy in creating value and driving profit-able growth. Uponor’s People strategy consists of three key building blocks: fostering great leadership, strengthening our strategic competencies, and equipping employees to take the initiative and have an impact. Uponor provides each employee with a variety of opportunities to support their continued development through on-the-
job learning, learning from others and more traditional methods such as classroom-based studies and eLearning. In 2017, we began to offer global virtual English language training for all our employees.
We strive to provide unique career paths and offer leadership development programmes. Competent leaders are the key to the successful execution of Uponor’s strategy. We continue to foster great leadership and strengthen our strategic competencies through four global flagship leadership development programmes, focusing on the critical areas of leading business, leading people and leading oneself.
Uponor has received several external recognitions for its human resource management. In 2017, the Dakota-Scott Workforce Development Board recognised Uponor North America as one of three Employer of Excellence award winners. Strong employer image is an asset in an area such as Minnesota, U.S., where employers are challenged with low unemployment.
Employees by gender 31.12.2017
%Female 24 Male 76
Employment by country (FTE) 31.12.2017
Sweden 13
Poland 6
Canada 4Spain 3
Denmark 3Russia 2China 2Others 9
Germany 23
USA 20
Finland 15
Employees by occupation 31.12.2017
Blue Collars
43
White Collars54
Executives 3
%%

32 • Uponor Annual Report 2017 – Sustainability at Uponor
These programmes run every year with invitation-based participation. During 2017, 106 persons – 29% females and 71% males – partici-pated in the programmes. In addition, a global Leadership Event was held in March 2017, bringing together close to 150 leaders across the company to discuss strategic leadership topics such as the customer experience, employee engagement and business growth opportuni-ties. During 2017, we also began to pilot a new cross-segment mentoring programme.
Uponor has had international trainee programmes since 2011, which have been very successful and well-liked. Many of the trainees join Uponor in permanent positions. During 2016–2017, there were 10 trainees, 3 females and 7 males from Finland, Sweden, Germany and the U.S. The fourth trainee programme started in mid-January 2018. For more information about the programme and participant experience, please visit https://www.uponor.com/company/careers/trainee-programme.
Employee engagementThe cornerstone for becoming an employer of choice is that our employees are engaged and perform in order to achieve the Uponor goals. One of the ways in which we equip employees to have an impact is through our biennial Our Voice engagement survey and periodic Our Voice pulse surveys. Our Voice provides all Uponor employees with an easy channel for giving feedback on our ways of working and ideas for a better working environment. The response rate of Our Voice survey in 2017 was ca 74%.
Uponor’s risk environment
Risk management is an integrated part of all Uponor operations, not a separate function. It is incorporated into the existing Uponor manage-ment and planning procedures and key performance indicators.
Uponor’s Risk Management is governed by Uponor Group Risk Management Policy and its guidelines, which include the Business Continuity Guideline, Crisis management Guideline and Security Management Guideline. Financial risks are covered by the Group Treasury.
All commercial activities include risks, some of which can be nega-tive while others may offer opportunities. At Uponor, Risk Management focuses on the identification, assessment and mitigation of negative risks, or threats. Positive risks, or opportunities, are handled as part of normal business and strategy development.
Uponor has zero tolerance of risks in the following areas: Health & Safety, Compliance & Laws, and Financial resilience.
ThreatsUponor conducts a Group-wide Risk Identification and Assessment process (RIA) twice a year. As a result, twenty core risks are identi-fied, assessed, scored and ranked, and a Mitigation Plan is drawn up for all named risks.
While the top core risks have remained fairly stable through recent years, newer risks include issues such as digitalisation and other emerging technologies. In addition, increasing attention is paid to risks concerning sustainability issues.
Uponor has had trainee programmes since 2011. Build on Uponor: International Trainee Programme offers young graduates valuable work experience, the opportunity to develop their leadership skills and to collaborate and network globally.
Total headcount (FTE) 31.12.2017
4,000
3,000
2,000
1,000
02013 2014 2015 2016 2017
Total working hours (1,000 hours)
8,000
7,000
6,000
5,000
4,000
3,000
2,000
1,000
02013 2014 2015 2016 2017

Uponor Annual Report 2017 – Sustainability at Uponor • 33
Uponor’s 2017 top core risks are as follows:1. Greater competitive pressure, e.g. growing and diversifying competitor landscape2. Restrictive changes in regulation affecting Uponor products, applications or core materials for health, environmental or other reason3. Mass quality problems or serial defects in products 4. Digitalisation and other emerging technologies, i.e. Uponor’s ability and speed to adopt new technologies or business models5. A business interruption due to a supply chain interruption 6. Tax risks7. Geopolitical risks8. A business interruption due to a critical IT system failure or cyber crime9. Zero-energy houses which reduce the need for heating solutions10. The risk appetite of General Product Liability (GPL) insurance markets
OpportunitiesGlobal megatrends such as climate change and resource scarcity, continuing urbanisation, demographic and social change, as well as technological breakthroughs and disruptions, potentially pose global long term threats or negative risks. For Uponor, they may also create
opportunities because the environment, clean water, water saving and energy saving are directly linked to many of them. It has been forecast that a growing middle class and rising living standards will, by 2030, lead demand for food to rise by 35%, water by 40%, and energy by 50%.
In the 2017 report of the World Economic Forum, the top global risks included issues such as the water crises, extreme weather events, the failure of climate change mitigation and adaptation, large-scale involuntary migration and major natural disasters, which can be viewed as providing Uponor with potential opportunities.
“Uponor has zero tolerance of risks in the following areas:
Health & Safety, Compliance & Laws, and Financial resilience.”
Uponor partners with Habitat for Humanity to help rebuild homes in areas affected by national disasters. In 2017, local Uponor employees and partners donated and helped to install plumbing products for 160 Habitat homes, saving the organisation over USD 1,600 per home.

34 • Uponor Annual Report 2017 – Letter to investors
Letter to investors
Dear reader,
In 2017, we began our 100th year of operation, which will culminate in our 100th anniversary in August 2018. We can look back on a huge number of changes that have impacted on our company. Many were externally driven, but several – particularly those with the most positive impact – were proactively initiated by Uponor.
A company is not an island, living in solitude and unaffected by its surroundings. Rather, it is a boat that is actively steered, being equipped with instruments for gauging the wind. This is what we kept in mind when we led Uponor forwards in 2017.
In our company strategy, we have chosen to examine our business on the basis of three horizons, each of which is tailored to different businesses and offers us different ways of achieving growth.
The first horizon focuses on remaining competitive and achieving growth in our traditional distribution channel business, which mainly consists of our business serving the residential markets. This is the most mature part of our operations, in which the roads have been well-trodden and the entry barriers have been lowering for decades, attracting the most competition. The second horizon, which more or less builds on the same technology platforms as the first, represents our entry into the commercial markets, where we need to combine technology with planning know-how and installation methods, in order to create a differentiated competitive advantage. The third horizon, which is somewhat bolder and represents a longer leap ahead than the others, offers longer-term opportunities created through digitalisa-tion, new manufacturing technologies such as 3D printing, and the use of renewable materials.
In 2017, we forged ahead on all three fronts.
In our traditional business, i.e. the first horizon, we continue to see the growth of competitive pressures. These partly originate from familiar competitors within our own industry, as well as among our distribu-tion partners, many of whom are entering the market with their own private label offerings. This is a clear indication of maturing markets, where not all of the auxiliary services Uponor is known for are valued anymore. Hence, through our transformation programmes, completed in 2017, we worked hard to regain our competitiveness by reallocating customer support activities from the traditional residential business to our growing commercial business. We also invested in technol-ogy renewal, in order to introduce new features and improve our cost position so as to continue growing in this segment. In addition, our prefabrication initiatives have been supporting our residential growth, even if they are more relevant to the commercial construction segment.
For the commercial building segment, or the second horizon, we have continued to invest heavily in our competencies and offering capabilities. Much of our current product and technology development is directed towards supporting growth in the commercial segment, in a similar manner to our talent management activities. The commercial segment is where we see the biggest opportunities for our prefabri-cated solutions. In an environment where installation resources are scarce in many key markets, moving work phases from the construc-

Uponor Annual Report 2017 – Letter to investors • 35
tion site to a controlled industrial environment, and thereby delivering more consistent quality and speed of installation, is providing us with a clear competitive edge. Simultaneously, we need to remember that the complexity of on-site installations will continue to grow, mainly due to energy efficiency and hygiene requirements.
Our third growth horizon is about creating and shaping future options and possibilities, such as those presented by digitalisation. The most visible, digitisation initiatives within Uponor are Phyn and UWater, two pilots we began in 2016. With Phyn, our joint venture with the U.S. company Belkin International, we aim to address the issue of costly water leaks and damage, and bring our contribution to managing clean water, our most precious natural resource. Water is also in focus when we discuss UWater, our second digital spearhead initiative. UWater technology detects foreign particles such as bacteria from flowing water. Health issues caused by the presence of legionella or E.coli in potable water are a major issue in most of our geographies. With smart technology, we believe that we can contrib-ute to managing these risks more effectively.
With these three growth horizons in focus, we were able to grow Uponor organically by 6.5% in 2017 – while also somewhat expanding our operating profit margin, in spite of our major investments intended to generate short-term growth and our exploration of our future options. This is a good platform to continue with into 2018 – growing our business and continuing to invest in its renewal.
Change has been a buzzword in the corporate world over the last decade or so, referring to the increasing speed and nature of change. Our era has been termed an era of change. Today, however, ques-tions are also being raised about the sustainability of our lifestyles and habits. Our take-make-waste way of life is facing pressure for redirection towards the circular economy. In this respect, we are witnessing a change of era in terms of the megatrends that change societies fundamentally over time.
These trends are bringing new requirements and opportunities to organisations like Uponor, which are committed to enhancing living environments. In addition to providing sustainable operations, solutions and products, Uponor is committed to improving the world by being a strong corporate citizen in the communities in which we live and work. By aligning our sustainability activities with our core business model and leveraging our resources to create partnerships and value in our community, we are seeking to create true, shared value for our business and society.
Very much linked to this evolution, the EU has passed legislation requiring companies to disclose more than just financial information.
In our annual report 2017, you will therefore find a section in which we try to cover the essentials of such non-financial information as it relates to Uponor. For this purpose, and to ensure the proper focus, we completed our first-ever materiality analysis in 2017.
Sustainability is a key, positive business driver for Uponor. Almost all of our offerings are related to energy or water in one form or another. With our systems and solutions, we can help to secure clean water, save energy and reduce harmful emissions. Naturally, as a company we will try to serve as a good corporate citizen, fostering a positive work environment of engaged employees, enhancing stakeholder trust, and creating brand differentiation in support of this. Our work in this respect is one illustration of our values – Connect, Build, Inspire – in action.
I would like to express my thanks to all of you – our employees, customers, other stakeholders and shareholders – for your continued support for our company, most of all in 2017 and beyond. We are building on our 100-year heritage, i.e. everything we have learned and accomplished together with you.
Jyri LuomakoskiPresident and CEO
“These trends are bringing new requirements and opportunities
to organisations like Uponor, which are committed to enhancing
living environments.“

36 • Uponor Annual Report 2017 – Board of Directors
Jorma Elorantab. 1951, Finnish citizen, M.Sc. (Tech.), Doctor of Science in Technology h.c. • Chair of the Board, Uponor
Corporation, 19 March 2014–• Member of the Board, Uponor
Corporation, 15 March 2005–• Chair of the Personnel and
Remuneration Committee• Uponor shareholdings: 37,455
Markus Lengauerb. 1965, Austrian citizen, M.Sc. (Eng.), Doctorate in Mechanical Engineering, CEO, Oras Ltd• Member of the Board, Uponor
Corporation, 17 March 2015–• Member of the Audit Committee• Uponor shareholdings: 3,412
Annika Paasikivib. 1975, Finnish citizen, B.A, M.Sc. (global politics), Chief Operating Officer, Oras Invest Ltd and CEO, Finow Ltd• Deputy Chair of the Board, Uponor
Corporation, 19 March 2014–• Member of the Board, Uponor
Corporation, 19 March 2014–• Chair of the Audit Committee• Member of the Personnel and
Remuneration Committee• Uponor shareholdings: 39,377
Eva Nygrenb. 1955, Swedish citizen, Architect• Member of the Board, Uponor
Corporation, 15 March 2011–• Uponor shareholdings: 9,384
Pia Aaltonen-Forsellb. 1974, Finnish citizen, M. Soc.Sc. in Economics, CFO, Ahlstrom-Munksjö Oyj• Member of the Board, Uponor
Corporation, 20 March 2017–• Uponor shareholdings: 1,060
Jari Rosendalb. 1965, Finnish citizen, M. Sc. (Eng.), President and CEO, Kemira Oyj• Member of the Board, Uponor
Corporation, 15 March 2012–• Member of the Audit Committee• Uponor shareholdings: 8,053
Board of Directors 1 January 2018

Uponor Annual Report 2017 – Executive Committee • 37
Jyri Luomakoskib. 1967, Finnish citizen, MBA, President and CEO• Employed by Uponor Corporation
since 1996• Member of the Executive Committee
since 1 October 1999• President and CEO, Uponor Corporation,
since 27 October 2008 • Uponor shareholdings: 35,547
Minna Blomqvistb. 1969, Finnish citizen, M. Sc. (Eng), Executive Vice President, Human Resources • Employed by Uponor since 2017• Member of the Executive Committee
since 1 September 2017• Uponor shareholdings: 0
Sebastian Bondestamb. 1962, Finnish citizen, M.Sc. (Eng.), President, Uponor Infra • Employed by Uponor since 2007• Member of the Executive Committee
since 1 April 2007• Uponor shareholdings: 16,889
Bill Grayb. 1965, Canadian and British citizen, B. Com. (Finance and Marketing) & B.A., President, Uponor North America• Employed by Uponor since 2008• Member of the Executive Committee
since 15 February 2012 • Uponor shareholdings: 19,317
Fernando Rosesb. 1970, Spanish citizen, M.Sc. (Marketing), eMBA, B.Sc. (Eng.) (Ingeniero Técnico en Química Industrial), Executive Vice President, Group Technology and Corporate Development• Employed by Uponor since 1994• Member of the Executive Committee
since 26 October 2007• Uponor shareholdings: 17,788
Maija Strandbergb. 1969, Finnish citizen, M. Sc. (Econ), CFO• Employed by Uponor since 2017• Member of the Executive Committee
since 21 March 2017• Uponor shareholdings: 0
Jan Peter Tewesb. 1968, German citizen, M.Sc. (Bus.) (Diplom-Kaufmann), MBA, President, Building Solutions – Europe • Employed by Uponor since 2015• Member of the Executive Committee
since 1 September 2015• Uponor shareholdings: 13,519
Further up to date details at investors.uponor.com
Executive Committee
Executive Committee (from left to right): Sebastian Bondestam, Jan Peter Tewes, Minna Blomqvist, Fernando Roses, Maija Strandberg, Bill Gray and Jyri Luomakoski
1 January 2018

38 • Uponor Annual Report 2017 – Review by the Board of Directors
Review by the Board of Directors
Markets
Construction activity developed favourably in 2017, supported by strong macroeconomic tailwinds. In North America and Europe, confidence on the part of both consumers and businesses, strong labour markets, and accommodative monetary policies drove growth across most residential and non-residential building segments.
In Central Europe, record-high employment levels and high levels of immigration in Germany fuelled growth in multi-family residential projects, while the significantly larger residential renovation seg-ment was flat. Despite consistently positive measures of business confidence, non-residential construction remained steady, expanding only marginally overall. Builders throughout the industry also reported an increasingly severe lack of skilled labour, which probably hindered growth. In the Netherlands, both the residential and non-residential market grew from 2016.
In Southwest Europe, Spain saw a marked increase in construc-tion activity, albeit from a low base. The significantly larger French market also made notable gains, while the Italian market remained depressed, yet stable. Meanwhile, fallout from the “Brexit” negotia-tions was muted in the UK, with building activity remaining steady, in general, to the end of the year.
Construction activity in the Nordic countries grew from 2016. In Finland, the number of multi-family projects in urban growth centres increased, while non-residential activity was largely on a par with 2016. In Sweden, the number of multi-family projects remained at elevated levels not seen since the early 1990s, while businesses also initiated non-residential projects in significantly larger numbers than the previous year. In both Denmark and Norway, residential seg-ments generated modest growth, while non-residential markets grew marginally.
In Eastern Europe, the Russian market has stabilised, but remains rather weak. In East-Central European countries such as the Czech Republic, Hungary and Poland, residential investments rose, while non-residential activity was more mixed. Construction spending in the Baltic countries expanded.
In North America, residential and non-residential markets grew at a moderate overall rate. While many employment and confidence measures remained at exceptionally strong levels in the USA, market
growth was tempered by a persistent lack of skilled labour and, to a lesser extent, cost inflation. In Canada, construction activity remained at a high level, but moderated in some building segments.
With regard to Uponor’s infrastructure solutions, demand in the Nordic markets was stable on the whole, with demand in Sweden improving notably. The markets in Poland and other East Central European countries remained subdued, with the exception of a few notable EU funded projects, while civil engineering spending rose significantly in the Baltic countries. In Canada, a pickup in business investments impacted positively on demand.
Net sales
Uponor’s 2017 consolidated net sales amounted to €1,170.4 (2016: €1,099.4) million, up 6.5% year-on-year. The currency impact totalled €-10.9 million, bringing the 2017 full-year growth in constant currency to 7.4%. The negative currency effect was mainly due to the USD and SEK, while the RUB had a small positive influence.
Building Solutions – Europe’s net sales amounted to €521.7 (511.0) million, showing growth of 2.1% year-over-year. Growth of net sales was prevalent in most European key markets. Two exceptions included Germany, where the satisfactory development in prefabri-cated solutions was not enough to cover the lower sales in the ceiling cooling business, where Uponor turned down projects due to low mar-gins, and Finland, where net sales declined due to the fact that the markets grew most in building types and in urban areas which offer less value for Uponor. In addition, the UK business clearly declined, partly due to earlier internal reorganisation measures, and partly as a result of the rising costs of exports into the UK. The markets in Spain, Austria, Russia and Norway showed the most positive trends in terms of net sales.
Building Solutions – North America reported full-year net sales at €328.2 (305.6) million, up 7.4%. In U.S. dollar terms, net sales climbed to $373.2 (337.2) million, representing growth of 10.7%, exactly the same as the growth reported for full-year 2016. Through-out the year, sales of the PEX plumbing offering have developed steadily, aside from the temporary production issue experienced in April. Now that the shortage of plastic fittings resin has been overcome, plastic fittings sales are also recovering to earlier sales
Net sales by segment for 1 January–31 December 2017:
M€ 1–12/2017 1–12/2016 Reported change (%)Building Solutions – Europe 521.7 511.0 2.1%Building Solutions – North America 328.2 305.6 7.4%(Building Solutions – North America (M$) 373.2 337.2 10.7%)Uponor Infra 323.4 287.9 12.3%Eliminations -2.9 -5.1Total 1,170.4 1,099.4 6.5%

Uponor Annual Report 2017 – Review by the Board of Directors • 39
patterns. Overall, the building solutions business in North America, with its increasing number of new market entrants, has become more competitive, slowing net sales growth in certain sectors of the market.
Uponor Infra’s net sales for 2017 came to €323.4 (287.9) million, which represents growth of 12.3%. Most of this growth came from North America and Sweden, where the markets were flourishing through most of the year, and from Poland where large projects began towards the end of the year in particular.
Within the business groups, the share of Plumbing Solutions represented 49% (49%), Indoor Climate Solutions 24% (25%), while Infrastructure Solutions represented 27% (26%) of Group net sales.
Measured in terms of reported net sales, and their respective share of Group net sales, the 10 largest countries were as follows (2016 figures in brackets): the USA 26.3% (25.1%), Germany 13.2% (14.7%), Finland 10.3% (11.2%), Sweden 9.7% (9.1%), Canada 8.6% (7.3%), Denmark 4.3% (4.5%), the Netherlands 3.5% (3.6%), Spain 3.2% (3.2%), Norway 2.6% (2.7%), and Russia 2.0% (1.7%).
Results
The consolidated full-year gross profit ended at €394.1 (376.0) million, a change of €18.1 million. The gross profit margin came to 33.7% (34.2%). Comparable gross profit came to €395.1 (383.9) million, or 33.8% (34.9%). Gross profit was burdened by a tight competitive situ-ation and product mix issues in Building Solutions – Europe, despite improvements in production efficiency, as well as an increase in costs and weaker production yield than anticipated in Building Solutions – North America.
Consolidated operating profit came to €95.9 (71.0) million, a clear improvement from the previous year, mainly due to transformation programme costs in 2016. The operating profit margin ended at 8.2% (6.5%) of net sales.
Comparable operating profit, i.e. excluding any items affecting comparability relating to the transformation programmes in Building Solutions – Europe and in Uponor Infra, reached €97.2 (90.7) million, an increase of 7.2%. Comparable operating profit margin came to 8.3% (8.2%). The net total amount of items affecting comparability was €1.3 (19.7) million, of which €2.8 (12.4) million was reported in Building Solutions – Europe and €-1.5 (7.2) million in Uponor Infra.
Building Solutions – Europe reported an improvement in full-year comparable operating profit, which came to €42.8 (37.8) million. This growth was the result of an increase in net sales and the savings achieved by the transformation programme, mainly relating to the
enhanced production network. The transformation programme was completed during 2017. The segment’s profitability was also burdened by the continuing tight competitive situation, which affected both the indoor climate and plumbing markets, as well as challenges within the distribution channel.
Building Solutions – North America is briskly expanding its capacity and building up and training the organisation in order to respond to growth in demand and to return capacity utilisation to a long-term sustainable level. For the above reasons, the segment’s operating profit dropped slightly, and came to €49.7 (50.0) million, or $56.5 (55.2) in USD. Managing the repercussions of the temporary produc-tion challenge in the spring of 2017 also had an effect on the full year figures.
Uponor Infra reported a brisk improvement in comparable operat-ing profit which reached €10.5 (6.4) million. The main contributor to this was the North American infrastructure solutions business, which experienced a boost in net sales and an improvement in margins.
Other operating income in 2017 includes a gain of €1.9 million from the sale of Uponor Infra’s real estate premises in Vaasa, Finland.
Uponor’s net financial expenses declined to €5.4 (€10.0) million, including a positive impact of €3.6 million from the Finnish Supreme Administrative Court tax resolution. Net currency exchange differ-ences in 2017 totalled €-3.2 (-3.9) million.
The share of the result in associated companies, €-2.3 (-0.6) million, includes product development and other start-up costs related to Phyn, the joint venture company with Belkin International, Inc. established in 2016.
Profit before taxes was €88.2 (60.4) million. The effective tax rate of 25.8% (31.3%) was affected by the Finnish Supreme Administra-tive Court tax resolution, in Uponor’s favour, which had an impact of -2.6ppts, or €2.3 million, and the U.S. tax reform whose impact was -2.6ppts, or €2.3 million. The change impact of the U.S. tax reform is due to a mandatory repatriation and revaluation of the net deferred taxes with the new, lower federal tax rate. Both the U.S. and Finnish elements affecting the effective tax rate in 2017 are viewed as one-time impacts. Income taxes totalled €22.8 (18.9) million.
Profit for the period totalled €65.4 (41.9) million. Return on equity reached 19.4% (13.1%).
Return on investment increased to 16.3% (14.1%). Return on investment, adjusted for items affecting comparability, came to 16.6% (18.3%).
Operating profit by segment for 1 January–31 December 2017:
M€ 1–12/2017 1–12/2016 Reported change (%)Building Solutions – Europe 40.0 25.4 57.3%Building Solutions – North America 49.7 50.0 -0.7%(Building Solutions – North America (M$) 56.5 55.2 2.3%)Uponor Infra 12.0 -0.8 1,538.0%Others -4.2 -2.0Eliminations -1.6 -1.6Total 95.9 71.0 35.2%

40 • Uponor Annual Report 2017 – Review by the Board of Directors
Earnings per share were €0.83 (0.58). Equity per share was €3.83 (3.60). For other share-specific information, please see the Tables section.
Consolidated cash flow from operations amounted to €101.5 (59.9) million, while cash flow before financing came to €42.0 (-31.9) million. In 2016, cash flow before financing was burdened by the German acquisitions in January 2016 and the $15 million investment in the joint venture company Phyn in July 2016.
Key figures are reported for a five-year period in the key financial figures section.
Investment, research and development, and financing
For the last decade or so, Uponor has focused on maintaining a care-ful balance between targeting resources at the most viable opportuni-ties and keeping overall investment modest, and this policy continues to be valid. However, in 2016, capital expenditure, including R&D, had already grown from its longer-term historic levels and a similar trend continued in 2017. A significant element of this expenditure was on forward-looking strategic investments, such as the digitalisation efforts announced during the years 2016–2017. These initiatives will help to ensure that we remain at the forefront of development in our industry, and will help us to safeguard the competitiveness of our offering in the digital age.
In addition, two capacity expansion investments were launched in Building Solutions – North America. The first, announced on 4 May 2017, was Uponor, Inc.’s plan to expand its manufacturing facility in Apple Valley, Minnesota with a €16.3 million ($17.4 million) invest-ment. The second investment, was intended to safeguard future pipe manufacturing capacity and meet expected longer-term growth: on 20 July 2017 Uponor announced the purchase of a manufacturing facility and real estate in Hutchinson, Minnesota. The €5.6 million ($6.3 mil-lion) deal was closed on 3 August 2017. It is estimated that the total investment in the Hutchinson facility will reach circa $30 million by the end of 2018. Of this sum, $8.6 million had already been used by year end 2017. Uponor, Inc. is a U.S. subsidiary and part of Building Solutions – North America.
In addition to new initiatives, a considerable amount of funds was again used for selected productivity improvements, maintenance and the modernisation of technology in our manufacturing operations, maintaining their competitiveness with regard to both cost-efficiency and quality.
In 2017, gross investment in fixed assets totalled €63.4 (50.7) million. Net investments totalled €61.8 (48.4) million.
Research and development costs, which were at a historically high level, grew to €23.2 (21.4) million, or 2.0% (1.9%) of net sales. Driven by the new and expanded Group Technology and Corporate Develop-ment function established in 2016, Uponor channelled further funds into digitalisation and Internet of Things (IoT) initiatives, the develop-ment and finalisation of new-generation indoor climate controls and plumbing fittings, as well as pipe material technology and production process improvements.
The main existing long-term funding programme on 31 December 2017 was the 5-year bilateral loan agreement of €100 million, signed in 2017, which will mature in July 2022. Resulting in a modest increase in long-term interest-bearing liabilities, the new loan replaced the earlier €80 million bond maturing in June 2018, which is now booked as current liabilities.
In addition to the above-mentioned funding arrangements, Uponor has outstanding, bilateral long-term loans of €50 million and €20 million, both of which will mature in the summer of 2021. As back-up funding arrangements, Uponor has four committed bilateral revolving credit facilities in force, totalling €200 million. These back-up facili-ties will mature in 2019–2021; none of them were used during the reporting period.
For short-term funding needs, Uponor’s main source of funding is its domestic commercial paper programme, totalling €150 million, none of which was outstanding on the balance sheet date. Available cash-pools limits granted by Uponor’s key banks amounted to €34.8 million, none of which was in use on the balance sheet date. At the end of the year, Uponor had €107.0 (16.3) million in cash and cash equivalents.
Accounts receivable and credit risks received special attention throughout the year. Most of Uponor’s accounts receivable are secured by credit insurance.
Consolidated net interest-bearing liabilities decreased slightly to €151.5 (159.5) million. The solvency ratio was 40.5% (42.8%) and gearing came to 43.5 (48.8). Average quarterly gearing was 58.4 (56.7), in line with the range of 30–70 set in the company’s financial targets.
Events during the period
In January 2017, Uponor closed its PEX pipe production site in Mós-toles, Spain and concentrated production in the company’s facilities in Virsbo, Sweden as part of the transformation programme. Building
Comparable operating profit by segment for 1 January–31 December 2017:
M€ 1–12/2017 1–12/2016 Comparable change (%)Building Solutions – Europe 42.8 37.8 12.9%Building Solutions – North America 49.7 50.0 -0.7%(Building Solutions – North America (M$) 56.5 55.2 2.3%)Uponor Infra 10.5 6.4 65.5%Others -4.2 -1.9Eliminations -1.6 -1.6Total 97.2 90.7 7.2%

Uponor Annual Report 2017 – Review by the Board of Directors • 41
Solutions – Europe’s transformation programme was completed in June. The last initiative in the programme involved the closing of an office in Italy in December.
In March, at the international ISH trade fair in Germany, Uponor presented its solutions and new offerings under the concept “Build on innovation”, with a focus on drinking water hygiene, indoor climate, comfort and efficient energy distribution for a wide variety of building types. Uponor also presented its renewed Uponor PRO mobile app, which is intended to be the mobile channel through which Uponor serves the professional community.
On 4 May 2017, Uponor’s U.S. subsidiary, Uponor, Inc., part of the Building Solutions – North America segment, announced plans to continue expanding its manufacturing facility in Apple Valley, Min-nesota with a €16.3 million ($17.4 million) investment. As the tenth expansion since operations began in Apple Valley in 1990, this project was completed in January 2018, adding 5,440 square metres (58,000 square feet) in manufacturing operations space related to crosslinked polyethylene (PEX) pipe production. Furthermore, on 20 July, Uponor announced a plan to purchase a manufacturing facility and real estate in Hutchinson, Minnesota, intended to safeguard future pipe manufac-turing capacity and meet expected longer-term growth. Production of PEX pipe in Hutchinson is expected to begin in the summer of 2018, after regulatory approvals have been obtained.
On 13 September, the Supreme Administrative Court in Finland resolved the taxation adjustment decisions, based on the appeals submitted in January 2016, concerning Uponor Corporation and its subsidiary Uponor Business Solutions Oy. The matter concerns taxation adjustment decisions made by the Large Taxpayers’ Office in 2011. The decision of the Supreme Administrative Court lowers Uponor Corporation’s uncharged mark-up of service fees, which was added to the company’s taxable income, from seven to three per cent for the tax years 2005–2007. The taxes, late fees and tax increases imposed on the company have also been decreased. The taxation adjustment decisions concerning the parent company’s subsidiary, Uponor Business Solutions Oy, for the 2005 tax year were also over-ruled. The Finnish Tax Administration has reassessed the changes in taxation caused by this decision and will adjust the payment for both companies. With regard to the tax years 2006–2009, the clarification of arm’s length amounts of service fees charged by Uponor Business Solutions Oy have been returned to the Finnish Tax Administration for review.
Uponor Infra announced two new licensees in 2017. Licenses to manufacture and market the Weholite® pipe were granted to the French company TUBAO S.A.S. and the Tanzanian company, Plasco Ltd. Invented in the 1980s, Uponor’s revolutionary Weholite® technol-ogy consists of high density polyethylene (HDPE) pipe, fittings and fabricated assemblies, and is used worldwide in low-pressure service applications for potable water, storm water, sewage and various other liquids.
On 13 December, the Board of Directors of Uponor Corporation resolved to continue the key management Performance Share Plan mechanism, originally decided on by the Board in 2014. Approximate-ly 50 Group key managers, including the members of the Executive Committee, belong to the target group covered by the new plan. The new plan covers the calendar years 2018–2020. The potential reward based on the new plan will be paid in 2021. The purpose of the incen-
tive programmes is to align the objectives of the management and Uponor shareholders in order to increase the value of the company, boost profitable growth and retain the services of participants over the longer term.
Personnel and organisation
At the end of the year, the Uponor Group had 4,075 (3,868) employ-ees, in full-time-equivalent (FTE) terms. This is 207 more than at the end of 2016. The average number of employees (FTE) for the year was 3,990 (3,869). The increase in the number of employees was mainly driven by the expansion of operations in Building Solutions – North America.
The Group’s Executive Committee had two new members in 2017. M.Sc. (Econ) Maija Strandberg (47), Executive Vice President, Finance and member of the Executive Committee, joined Uponor in March and took over as CFO on 21 March 2017. In September, M.Sc. (Eng) Minna Blomqvist (48) joined Uponor to become Executive Vice President, Human Resources and member of the Executive Committee.
At the end of March, Uponor organised its traditional Leadership Event in the Netherlands, bringing together close to 150 Uponor leaders from around the world. The event was built around customer experience, digitalisation and leadership in a volatile world. In addition to building alignment between the various businesses and geogra-phies, a special emphasis was placed on viewing leadership through the eyes of the millennial generation.
The renewed internal employee engagement survey, Our Voice, was carried out for the second time in the autumn. With close to 3,000 employees responding, the response rate was 74.5%. According to the results, Uponor is doing very well compared to the external manufacturing norm, and its employees give Uponor a high rating as a great place to work.
The geographical breakdown of the Group’s personnel (FTE) was as follows: Germany 23% (23%), USA 20% (18%), Finland 15% (16%), Sweden 13% (13%), Poland 6% (6%), Canada 4% (4%), Spain 3% (4%), Denmark 3% (3%), Russia 2% (2%), China 2% (2%), and other countries 9% (9%).
Further, in North America, Uponor sells products through manufac-turers’ representatives. Such representatives are not direct employees of Uponor, but are independent businesses that operate in defined geographical areas and are paid a commission by Uponor.
A total of €245.7 (240.8) million was recorded in salaries, other remunerations and employee benefits during the financial period.
Non-financial information
For non-financial information, see pages 16–33.
Key risks associated with business
Uponor’s financial performance could be affected by a range of market, operational, financial and hazard risks.

42 • Uponor Annual Report 2017 – Review by the Board of Directors
Market risksUponor’s principal areas of business are Europe and North America, where its exposure to political risks is considered to be relatively low in general. The situation has changed somewhat after Uponor opened production facilities in the St. Petersburg, Russia area (2015) and in Taicang, near Shanghai in China (2017).
The Ukraine crisis, the sanctions imposed by the U.S. and EU against Russia, and Russia’s counter sanctions are affecting business conditions in Russia and elsewhere in Europe, particularly in Finland. This has kept the political risks associated with Russia on the agenda. Tense relations have negatively impacted on the European markets and their growth. Russia’s share of Uponor’s net sales was around 2.0% in 2017.
The European economy finally shows fairly clear signs of recovery, albeit with regional differences. The uncertainty around the UK’s decision to “Brexit” is a clear risk factor for both the UK and its trade partners in mainland Europe.
Despite the weakening of terror organisations in the Middle East, unrest and warfare still prevail in the area. Together with unrest in Africa, the possibility of uncontrolled mass migration poses huge challenges to Europe now and in the years to come.
Since Uponor’s net sales are divided among a large number of customers, most of which are distributors (wholesalers); end-market demand for the company’s products is distributed across a wide customer base. The five largest customer groups, whose sales are distributed between over 20 countries, generate roughly one third of Uponor’s net sales.
Demand for Uponor’s products depends on business cycles in the construction sector. Uponor’s main end market has traditionally comprised single-family housing. However, the company’s products are increasingly being supplied for multi-family residential and non-residential building construction, where Uponor plans to increase its sales further. Demand often fluctuates differently within each of these two sectors. To a certain degree, such fluctuations are being offset by demand for renovation projects, which is not always as discretionary as that for new housing projects.
Roughly one quarter of Uponor’s annual net sales come from the infrastructure solutions business. In addition to construction sector cycles, demand for infrastructure products depends on civil engineering and publicly funded investments in municipal develop-ment. To safeguard against risks associated with economic cycles and fluctuations in demand, the company has developed its sales forecasting processes and enhanced the flexibility of its organisation and supply chain.
In many countries, Uponor’s operations are regulated by local legislation. For example, Uponor seeks national product approval for a large proportion of the products it sells. It also closely monitors any laws and regulations under preparation, in order to anticipate their impact on Uponor and its customers.
Operational risksThe prices of raw materials used in the manufacture of plastic pipe systems are susceptible to change, driven by several factors including petrochemical and metal product price fluctuations, supply capacity, market demand etc. In recent years, Uponor has been able to pass most of the effects of such fluctuations onto its selling prices with
a reasonable delay, in such a way that this has not resulted in any material losses in income. Whenever feasible, Uponor manages the risk of fluctuations in the price of metals and plastics raw materials through supply agreements with fixed prices, and by means of financial products. Uponor continuously and systematically uses financial instruments to manage price risks associated with electricity prices at Nordic level.
With respect to component, raw material or services sourcing, Uponor aims to use supplies and raw materials available from several suppliers who are also expected to follow all aspects of Uponor’s Code of Conduct and our framework contracts. Wherever only one raw material supplier is used, Uponor seeks to ensure that the supplier has at least two production plants manufacturing the goods used by Uponor. The Group implements systems for material and raw material quality control and supplier accreditation.
Uponor manages its organisational and management risks, such as employee turnover and distortion of the age distribution, by continuously analysing its human resources and ensuring that its organisational structure supports efficient operations. Personnel development programmes focus on enhancing leadership skills in a multicultural matrix organisation. Uponor’s internal employee surveys provide important information on our employees’ engagement, by measuring various aspects of engagement, alignment, the working environment and motivation. Action plans are agreed and followed up based on the survey results, resulting in better performance and employee engagement.
The relevance of the ’cyber world’ is growing and Uponor has entered the ’IoT era’ by launching new intelligent product lines. Cyber risks are being taken seriously, and potential cyber, data and information threats are continuously monitored as a matter of course. Uponor’s business processes are managed using several IT applications, the most important of which are the ERP systems for the company’s European and North American operations. A system criticality review and contingency planning are included in the implementation and lifecycle management of major IT systems. Contingency plans can include activities such as failover planning, backup and restore management, and testing. Disaster recovery tests are held every two years for key systems. IT-related risks are evalu-ated as part of Uponor’s risk management process, with an increasing emphasis being placed on the security aspects of IT systems. Uponor IT systems are regularly evaluated by external parties. These reviews are used as input for further security improvements. In addition, Uponor has been acquiring insurance coverage that covers certain risks within IT applications over a period of several years.
A few years ago, Uponor had already declared that it had adopted a stance of zero or near-zero tolerance with respect to Health & Safety, Compliance & Laws, and Environment risks. Risks – and the opportunities – related to sustainability issues have long been on Uponor’s agenda. The world is in the midst of major transformations and one of the risks concerning the whole planet is climate change, which is likely to introduce a new set of risks in turn. For Uponor, risks related to climate issues or clean water also represent potential opportunities. These include the possibilities of executing our vision, “Throughout the world, our solutions enrich people’s way of life”, based on our water saving, water hygiene-enhancing and energy-saving products and solutions.

Uponor Annual Report 2017 – Review by the Board of Directors • 43
Uponor applies an ISO 9001 quality management system and an ISO 14001 environmental management system, which enhance production safety, environmental law compliance and productivity while reducing the environmental impact and risks of Uponor’s operations. In Germany, Uponor has implemented a certified Energy Management System based on ISO 50001 for all factories. A further rollout to all Uponor production sites is planned by 2020.
In its Project Business operations, Uponor is seeking to manage risks related to issues such as project-specific timing and costs. In so far as possible, such risks are covered in project and supplier agreements. In addition, the staff’s project management skills are being actively enhanced.
Financial risksMajor disruptions can occur on the international financial markets with very little warning. For this reason, although the situation now seems rather stable from Uponor’s perspective, significant risks may arise in relation to the availability of financing in the future. Uponor aims to ensure the availability, flexibility and affordability of financing by main-taining sufficient committed credit limit reserves and a well-balanced maturity distribution of loans, as well as by using several reputable and well-rated counterparties and various forms of financing.
The Group manages its liquidity through efficient cash manage-ment solutions and by applying a risk-averse investment policy, investing solely in low-risk instruments that can be liquidated rapidly and at a clear market price.
Interest rate movements expose the Group to changes in interest expenses, as well as in the fair values of fixed-rate financial items. The interest rate risk is managed by spreading Group funding across fixed and floating rate instruments.
The international nature of its operations exposes the Group to currency risks associated with various currencies. A significant proportion of Uponor’s net sales are created in currencies other than the euro. Correspondingly, a major part of expenses associated with these net sales are also denominated in the same local currencies, markedly decreasing the associated currency risks. The Group Treas-ury function is responsible for managing and hedging Group-level net currency flows in external currency markets, mainly by using currency forward contracts and currency options as hedging instruments.
Uponor is also exposed to currency translation risk, which manifests itself in the translation of non-euro-area subsidiaries’ equity into euro. According to the company’s hedging policy, non-euro-area balance sheet items are not hedged, with the exception of some internal loans, which are classified as net investments and included in hedge accounting. Only reputable and well-rated banks are used as currency hedging counterparties.
Hazard risksAt the year-end 2017, Uponor operated 15 factories in ten countries as well as several sites assembling prefabricated products. The products manufactured in these plants generate most of the com-pany’s net sales. Uponor co-ordinates property damage and business interruption insurance at Group level on a centralised basis, in order to achieve extensive insurance cover neutralising the possible finan-cial damage caused by risks associated with machine breakdowns, fire etc.
Another major risk is associated with product liability related to products manufactured and sold by Uponor. Product liability is also addressed through centralised insurance programmes at Group level.
A Group-wide project, Business Continuity Management and Business Interruption Analysis, launched in 2015, was completed in 2016. No significant new risks regarding business continuity were discovered. Based on the findings, the Group Business Continuity Management Guideline was updated and implemented at unit and function levels during 2016 and 2017. Various and numerous meas-ures are taken in order to manage the risks associated with property damage and business interruption. These include unit-level Business Contingency Plans, safety training for personnel, adherence to maintenance schedules, and actions taken to maintain the availability of major spare parts. The integrity of the supply chain has been and is one of the main focuses of risk management.
Audits and training conducted at Uponor’s production sites by, and in cooperation with, insurance companies also form an essential part of Group risk management. When needed, suppliers’ production facilities may also be audited.
Risk management in 2017Although the business environment in many of Uponor’s major geographical markets has turned more positive, the management and monitoring of market risks continued to play a key role in the field of risk management. Uponor conducted risk assessment exercises in the spring and autumn of 2017 in relation to the core risks identified, and updated its risk management plans accordingly. In 2017, in coop-eration with insurance companies, Uponor assessed the functionality and preparedness of its risk management in six production units. The results showed the level of risk management to be good or excellent in all units.
In 2017, there were no exceptional price spikes or abnormal market developments in the commodity markets relevant to Uponor. In the plastic resin markets there was one big, but rapid price spike. After the new President took office in the U.S., the price of copper rose significantly. Neither of these episodes had any meaningful effect on Uponor’s operations. In the long run, high copper prices may be a positive competition factor regarding Uponor’s main products. The availability of raw materials was good overall and price formation occurred in accordance with normal market mechanisms. In order to minimise risks, Uponor continued to add new, approved raw material sources to the supplier portfolios of its business units. In spring 2017, Uponor faced some raw-material based production challenges in the U.S., which caused a short, temporary production halt. Uponor managed to solve the issue and production was quickly normalised.
With volatility still dominating the global economic arena, concern about the availability of bank and market-based funding on favour-able terms remained on the agenda. To secure longer-term funding, Uponor has diversified its financing risks through various funding instruments, maturities, multiple counterparties and markets. When funding is not being raised from money or capital markets, special attention is paid to the quality of counterparties. Only solid, well-rated banks or financial institutions are used. The size of Uponor’s total committed revolving credit facility programmes is €200 million, with maturities ranging between 2019 and 2021.

44 • Uponor Annual Report 2017 – Review by the Board of Directors
As in previous years, special attention was paid to the monitoring of accounts receivable and the handling of credit risk.
Together with changing tax policies, global economic volatility has increased companies’ tax risk exposure, giving tax risk management continued prominence within Uponor. The company has proactively endeavoured to focus on good tax governance and has assigned a more explicit role to tax risk assessment within its risk assessment process.
Uponor is involved in several judicial proceedings in various countries. The year 2017 saw no materialisation of risks, pending litigation or other legal proceedings, or measures taken by the authori-ties that, based on current information, might have been of material significance to the Group. On the other hand, the Supreme Adminis-trative Court resolved the taxation adjustment decisions concerning Uponor Corporation and its subsidiary Uponor Business Solutions Oy, submitted in January 2016. The matter concerned taxation adjustment decisions made by the Large Taxpayers’ Office in 2011, which Uponor regarded as ungrounded. Both Supreme Administrative Court’s Yearbook decisions are mainly in Uponor’s favour.
In relation to Group Risk Management, Uponor has strengthened and reorganised the role of Internal Controls during 2017.
Administration and audit
Uponor’s Annual General Meeting, held in Helsinki, Finland, on 20 March 2017, re-elected the existing Chair of the Board Jorma Eloranta for a new one-year term. The other Board members, i.e. Markus Lengauer, Eva Nygren, Annika Paasikivi and Jari Rosendal, were also re-elected, with the exception of Timo Ihamuotila who declined re-election and was succeeded by Pia Aaltonen-Forsell as a new member of the board. Audit firm Deloitte Oy were re-elected as the auditor of the corporation for the 8th consecutive year. In this connection, Jukka Vattulainen, Authorised Public Accountant, was re-elected as the principal auditor.
Uponor prepares a separate corporate governance statement and a remuneration statement, which are made available online, after the annual accounts have been published, on Uponor’s IR website at https://investors.uponor.com > Governance > Corporate governance.
Uponor complies with the Finnish Corporate Governance Code 2015, issued by the Securities Market Association, with the exception of recommendation 15 in relation to the Personnel and Remuneration Committee, which has two members instead of the three stated in the recommendation. Uponor considers sufficient expertise to have been secured for the Personnel and Remuneration Committee on the basis of two members, and the Committee may also obtain views from outside the Committee.
The Committee acts as a preparatory and assisting body for the Board of Directors, and all essential matters relating to remuneration shall be dealt with by the Board of Directors.
Share capital and shares
In 2017, Uponor’s share turnover on Nasdaq Helsinki was 35.1 (20.3) million shares, totalling €545.5 (297.7) million. The share quotation at the end of 2017 was €16.78 (16.51), and the market capitalisation of the shares was €1,228.4 (1,208.6) million.
At the end of the year, there were a total of 19,191 (16,113) shareholders. Foreign shareholding in Uponor accounted for 26.4% (26.1%) of all shareholding in the company at the end of the report-ing period. More detailed information is available in the financial statements.
In 2017, Uponor Corporation’s share capital totalled €146,446,888, and the number of shares stood at 73,206,944; there were no changes during the year. On 20 March 2017, the holdings of Franklin Resources, Inc., a U.S. nominee registered shareholder, went down to 4.97%.
On 20 May 2016, Uponor announced the Board’s decision to declare forfeit and sell any shares issued on the basis of the bonus issues of 18 March 1998 and 16 November 2004, and which had not been accepted by 20 May 2017. The 842 shares in question were sold in public trading on 1 November 2017. A party entitled to such shares is entitled to the funds received from the sale, less the expenses incurred due to the sale and the request. Right-holders must submit their claim for the deposited funds as well as their share certificates or any other title documents, to the Nordea Bank AB (publ) branch in Finland on 1 November 2021, at the latest. Funds not withdrawn within four years from the sale shall revert to the company.
Board authorisationsOn 20 March 2017, the Annual General Meeting authorised the Board of Directors to buy back a maximum of 3.5 million of the company’s own shares. The authorisation is valid until the end of the next AGM, and for no longer than 18 months.
The Board was also authorised to resolve on issuing a maximum of 7.2 million new shares or transferring the company’s own shares, amounting to approximately 9.8 per cent of the total number of shares. This authorisation is valid until the end of the next AGM. On 13 February 2017, the Board decided to transfer the company’s own shares as specified in the rules of the LTI plan 2014–2016. A total of 9,838 were transferred to 6 key employees.
Further details regarding the AGM are available at https://investors.uponor.com/governance/general-meeting/annual-general-meeting-2017.
Treasury sharesAt the end of the year, Uponor held 59,121 of its own shares, representing approximately 0.1% of the company’s shares and voting rights.
Management shareholdingAt the end of the year the members of the Board of Directors and the President and CEO, along with corporations known to the company and in which they exercise control, held a total of 134,288 Uponor shares (139,173 shares). These shares accounted for 0.18% of all shares and votes in the company.
Share-based incentive programmeThe Board of Directors has resolved on several long-term incentive programmes for key management in the last few years. Details of the plans are presented on the company’s IR website.
In December 2017, the Board of Directors of Uponor Corporation resolved to continue the key management Performance Share Plan

Uponor Annual Report 2017 – Review by the Board of Directors • 45
mechanism, originally decided on by the Board in 2014. Approximately 50 Group key managers, including the members of the Executive Committee, belong to the target group covered by the new plan. The new plan covers the calendar years 2018–2020. The potential reward based on the new plan will be paid in 2021.
The purpose of the incentive programmes is to align the objectives of the management and Uponor shareholders in order to increase the value of the company, boost profitable growth and retain the services of participants over the longer term. The plans offer key managers a competitive reward plan based on achieving the company’s strategic profitability and growth targets and provide the opportunity to earn and accumulate Uponor shares.
Events after the period
Effective 2 January 2018, Uponor Corporation was listed on the Large Cap segment on Nasdaq Helsinki.
In January 2018, Building Solutions – North America presented a new monitoring system for homes, named Phyn Plus Smart Water Assistant + Shutoff. This new monitoring system for homes automati-cally measures changes in water pressure, in order to identify and alert homeowners of leaks. The product will be available in the USA in the spring. Its introduction to the European markets is planned for 2019.
On 13 February, Uponor announced its decision to invest an addi-tional USD10 million in Phyn, a smart water technology joint venture between Uponor and Belkin International, bringing its total investment in the company to USD25 million. After this investment, Uponor will have a 50 percent ownership in Phyn, both in the U.S. and in Europe, with the other 50 percent owned by Belkin. As a joint-venture company, Phyn will be consolidated into Uponor’s financial accounts using the equity method.
Short-term outlook
Uponor reported favourable market trends for the third quarter in Octo-ber 2017, and anticipated that the markets would somewhat soften towards the year-end but trends for the second half of 2017 would match those of the first half year. This is more or less what happened.
For the whole 2017, the overall macro-economic development in Uponor’s key markets, Europe and North America, has been rather strong and there are no indicators emerging that would materially change the picture. This view is justified by various supporting argu-ments, such as rising employment rates, demographic needs, sustain-ability demands and aspirations, new technologies such as digitalisa-tion and prefabrication, as well as urbanisation, to name a few. All of these can act as stimulants to economic activity and prosperity.
Uponor has strengthened its operations in several respects in recent years. Uponor’s business segments are more streamlined, more efficient and have a competitive supply chain and manufacturing network. Our sales and marketing functions have been reorganised and refocussed to align with customer needs and our strategic ambitions. In North America, we are determinedly building up our capacities and capabilities to meet growing customer demand, which has been a bottle neck to growth in the last few years.
Uponor remains committed and is working hard to be at the forefront of the digitalisation and sustainability trends in our industry, and has already launched new unique offerings, for instance in the niche sector of smart water technology.
Assuming that economic and political developments in Uponor’s key geographies otherwise continue undisturbed, Uponor issues the following full-year guidance for 2018: Excluding the impact of curren-cies, Uponor expects its organic net sales and comparable operating profit to grow from 2017.
Uponor estimates that the Group’s capital expenditure, excluding any investment in shares, will remain at roughly the same level as in 2017, mainly driven by the capacity expansion programme in North America.
Uponor’s financial performance may be affected by a range of stra-tegic, operational, financial, legal, political and hazard risks. A more detailed risk analysis is provided in the section “Key risks associated with business” in the Annual Report 2017.
Uponor CorporationBoard of Directors

46 • Uponor Annual Report 2017 – Proposal of the Board of Directors
Proposal of the Board of Directors
The distributable funds of the parent company, Uponor Corporation are €149,061,294.22, of which profit for the period is €40,046,378.52.The Board of Directors proposes to the Annual General Meeting that
- a dividend of €0.49 per share will be paid, at maximum €35,842,433.27
- the remainder be retained in the shareholders’ equity €113,218,860.95
€149,061,294.22
The company’s financial situation has not changed materially after the closing day. The company’s liquidity is good. The Board of Directors’ view is that the proposed profit distribution does not risk the company’s liquidity.
Vantaa, 15 February 2018
Jorma Eloranta Chair
Annika Paasikivi Deputy Chair
Pia Aaltonen-Forsell
Markus Lengauer Eva Nygren Jari Rosendal Jyri Luomakoski President and CEO
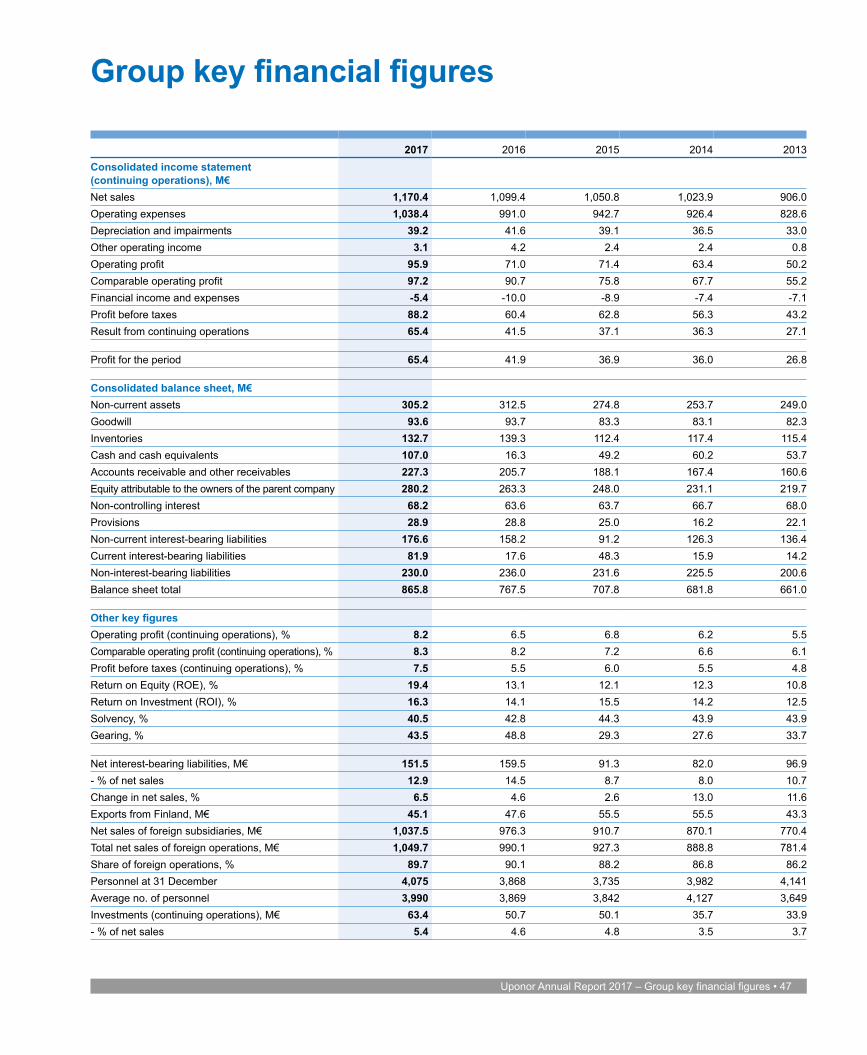
Uponor Annual Report 2017 – Group key financial figures • 47
Group key financial figures
2017 2016 2015 2014 2013Consolidated income statement (continuing operations), M€Net sales 1,170.4 1,099.4 1,050.8 1,023.9 906.0Operating expenses 1,038.4 991.0 942.7 926.4 828.6Depreciation and impairments 39.2 41.6 39.1 36.5 33.0Other operating income 3.1 4.2 2.4 2.4 0.8Operating profit 95.9 71.0 71.4 63.4 50.2Comparable operating profit 97.2 90.7 75.8 67.7 55.2Financial income and expenses -5.4 -10.0 -8.9 -7.4 -7.1Profit before taxes 88.2 60.4 62.8 56.3 43.2Result from continuing operations 65.4 41.5 37.1 36.3 27.1
Profit for the period 65.4 41.9 36.9 36.0 26.8
Consolidated balance sheet, M€Non-current assets 305.2 312.5 274.8 253.7 249.0Goodwill 93.6 93.7 83.3 83.1 82.3Inventories 132.7 139.3 112.4 117.4 115.4Cash and cash equivalents 107.0 16.3 49.2 60.2 53.7Accounts receivable and other receivables 227.3 205.7 188.1 167.4 160.6Equity attributable to the owners of the parent company 280.2 263.3 248.0 231.1 219.7Non-controlling interest 68.2 63.6 63.7 66.7 68.0Provisions 28.9 28.8 25.0 16.2 22.1Non-current interest-bearing liabilities 176.6 158.2 91.2 126.3 136.4Current interest-bearing liabilities 81.9 17.6 48.3 15.9 14.2Non-interest-bearing liabilities 230.0 236.0 231.6 225.5 200.6Balance sheet total 865.8 767.5 707.8 681.8 661.0
Other key figuresOperating profit (continuing operations), % 8.2 6.5 6.8 6.2 5.5Comparable operating profit (continuing operations), % 8.3 8.2 7.2 6.6 6.1Profit before taxes (continuing operations), % 7.5 5.5 6.0 5.5 4.8Return on Equity (ROE), % 19.4 13.1 12.1 12.3 10.8Return on Investment (ROI), % 16.3 14.1 15.5 14.2 12.5Solvency, % 40.5 42.8 44.3 43.9 43.9Gearing, % 43.5 48.8 29.3 27.6 33.7
Net interest-bearing liabilities, M€ 151.5 159.5 91.3 82.0 96.9- % of net sales 12.9 14.5 8.7 8.0 10.7Change in net sales, % 6.5 4.6 2.6 13.0 11.6Exports from Finland, M€ 45.1 47.6 55.5 55.5 43.3Net sales of foreign subsidiaries, M€ 1,037.5 976.3 910.7 870.1 770.4Total net sales of foreign operations, M€ 1,049.7 990.1 927.3 888.8 781.4Share of foreign operations, % 89.7 90.1 88.2 86.8 86.2Personnel at 31 December 4,075 3,868 3,735 3,982 4,141Average no. of personnel 3,990 3,869 3,842 4,127 3,649Investments (continuing operations), M€ 63.4 50.7 50.1 35.7 33.9- % of net sales 5.4 4.6 4.8 3.5 3.7

48 • Uponor Annual Report 2017 – Share-specific key figures
Share-specific key figures
2017 2016 2015 2014 2013Share capital, M€ 146.4 146.4 146.4 146.4 146.4Number of shares at 31 December, in thousands 73,207 73,207 73,207 73,207 73,207Number of shares outstanding, in thousands- at end of year 73,148 73,138 73,109 73,067 73,067- average 73,130 73,133 73,106 73,067 73,067Total equity attributable to the owners of the parent company, M€ 280.2 263.3 248.1 231.1 219.7Share trading, M€ 545.5 297.7 384.1 229.3 179.3Share trading, in thousands 35,077 20,339 27,590 18,843 14,563- of average number of shares, % 48.0 27.8 37.7 25.8 19.9Market value of share capital, M€ 1,228.4 1,208.6 995.6 841.1 1,041.0Earnings per share (diluted), € 0.83 0.58 0.51 0.50 0.38Equity per share, € 3.83 3.60 3.39 3.16 3.00Dividend, M€ 35.81) 33.6 32.2 30.7 27.8Dividend per share, € 0.491) 0.46 0.44 0.42 0.38Effective share yield, % 2.91) 2.8 3.2 3.7 2.7Dividend per earnings, % 59.0 79.3 86.3 84.0 100.0P/E ratio 20.2 28.5 26.7 23.0 37.4Issue-adjusted share prices, €- highest 17.79 17.35 17.30 14.94 15.85- lowest 13.30 11.13 10.42 9.11 9.65- average 15.55 14.64 13.92 12.17 12.31
The definitions of key ratios are shown on on page 64.
Notes to the table:1) Proposal of the Board of DirectorsThe average number of shares is adjusted with treasury shares.

Uponor Annual Report 2017 – Shares and shareholders • 49
Shares and shareholdersThe volume of Uponor shares traded on Nasdaq Helsinki in 2017 totalled 35,077,317 valued at € 545.5 million. The share closed at € 16.78 and the market capitalisation came to € 1,228.4 million. The year-end number of shareholders totalled 19,191 of which foreign shareholders accounted for 26.4 (26.1) per cent.
The maximum number of votes which may be cast at the Annual General Meeting is 73,147,823 (status on 31 December 2017).
At the end of the financial period the company held a total of 59,121 own shares corresponding to the same number of votes. These shares do not entitle to vote in the Annual General Meeting.
The Paasikivi family has shareholdings directly and through Oras Invest Ltd totalling 25.3 (25.3) per cent.
Major shareholders on 31 December 2017
Shareholder Shares % of shares % of votesOras Invest Ltd 16,571,780 22.7 22.7Varma Mutual Pension Insurance Company 3,862,072 5.3 5.3Investment Fund Nordea Nordic Small Cap 2,789,006 3.8 3.8Ilmarinen Mutual Pension Insurance Company 1,847,527 2.5 2.5Mandatum Life Insurance Company Limited 1,055,794 1.4 1.4KEVA 940,833 1.3 1.3OP-Finland Value Fund 834,710 1.1 1.1Nordea Pro Finland Fund 732,487 1.0 1.0The State Pension Fund 655,000 0.9 0.9SEB Gyllenberg Finlandia Fund 606,128 0.8 0.8Paasikivi Pekka 560,406 0.8 0.8Paasikivi Jari 548,888 0.7 0.8Others 42,143,192 57.6 57.6Total 73,147,823 99.9 100.0
Own shares held by the company 59,121 0.1 -Grand total 73,206,944 100.0 100.0
Nominee registered shares on 31 December 2017Nordea Bank AB (publ), Finnish Branch 11,710,554 16.0 16.0Skandinaviska Enskilda Banken Ab (publ) Helsinki Branch 5,457,006 7.5 7.5Svenska Handelsbanken AB (publ), Branch Operation in Finland 988,717 1.3 1.3Others 729,760 1.0 1.0Total 18,886,037 25.8 25.8

50 • Uponor Annual Report 2017 – Shares and shareholders
Shareholders by category on 31 December 2017
Category No. of shares % of sharesPrivate non-financial corporations 19,464,417 26.6Public non-financial corporations 18,708 0.0Financial and insurance corporations 9,828,078 13.4General government 8,565,079 11.7Non-profit institutions 2,593,882 3.5Households 13,441,867 18.4Foreign (including nominee registrations) 19,294,913 26.4Total 73,206,944 100.0
Shareholders by size of holding on 31 December 2017
Shares per shareholder No. of shares, total % of share capital No. of shareholders % of shareholders1–100 333,667 0.5 5,655 29.5101–1,000 4,376,153 6.0 10,834 56.41,001–10,000 6,549,532 8.9 2,470 12.910,001–100,000 4,743,425 6.5 184 1.0100,001–1,000,000 13,910,428 19.0 41 0.21,000,001– 43,293,739 59.1 7 0.0Total 73,206,944 100.0 19,191 100.0
Share capital development 2013–2017
Date Reason Change, euro Share capital, euro Number of shares2017 31 Dec 146,446,888 73,206,9442016 31 Dec 146,446,888 73,206,9442015 31 Dec 146,446,888 73,206,9442014 31 Dec 146,446,888 73,206,9442013 31 Dec 146,446,888 73,206,944

Uponor Annual Report 2017 – Corporate governance • 51
Corporate governancePursuant to the Finnish Companies Act and the Articles of Association of Uponor Corporation (hereinafter “the Company”), the control and man-agement of the Company is divided among the shareholders, the Board of Directors (“the Board’) and the Chief Executive Officer (“CEO”). The Company’s shares are quoted on Nasdaq Helsinki, and the Company observes its rules and regulations for listed companies.
Furthermore, the Company complies with the Finnish Corporate Governance Code 2015 (www.cgfinland.fi) issued by the Securities Market Association, with the exception of recommendation 15, in relation to the Personnel and Remuneration Committee, which has two members instead of three members as stated in the recommendation. Uponor considers that sufficient expertise for the Personnel and Remuneration Committee is secured with two members, and the Committee may also obtain views from outside of the Committee. The Committee acts as a preparatory and assisting body for the Board of Directors, and all essential matters relating to remuneration shall be dealt by the Board of Directors.
General meeting of shareholders
Shareholders exercise their rights in general meetings of shareholders, which constitute the Company’s highest decision-making body. Under the Finnish Companies Act, decisions made by general meetings of shareholders include:• Amendments to the Articles of Association;• Adoption of the annual accounts;• Dividend distribution;• Share issues;• Buyback and disposal of the Company’s shares;• Share and stock option plans;• Election of members of the Board and decision on their
emoluments; and• Election of the Company’s auditor and decision on audit fees.
Under the Finnish Companies Act, a shareholder has the right to require that an issue to be addressed by the general meeting of shareholders be included on the agenda of the general meeting of shareholders, if (s)he submits his/her demand in writing to the Board well in advance so that the matter can be included in the notice of meeting.
Shareholders who alone or jointly with others hold a minimum of 10 per cent of the Company’s shares have the right to demand in writing that an extraordinary general meeting of shareholders be convened for the purpose of dealing with a specific matter.
Shareholders are entitled to exercise their rights at the general meeting of shareholders via an authorised representative, and the shareholder or the representative authorised by the shareholder may use an assistant at the meeting.
Shareholders wishing to participate in and exercise their voting rights at the general meeting of shareholders must notify the Company of their intention to attend the meeting by the date mentioned in the notice of meeting.
Board of Directors
CompositionPursuant to the Articles of Association, the Board comprises a minimum of five and a maximum of seven members, elected for a one-year term starting at closing of the Annual General Meeting (AGM) at which they were elected and expiring at closing of the following AGM. Board members may be elected or removed only by a resolution adopted by the shareholders in a general meeting. The number of terms a Board member may serve is not limited, nor is there any defined retirement age. The AGM shall elect the Chair of the Board, while the Board elects a Deputy Chair for one year at a time from amongst its members.
In March 2017, the AGM elected the following six members to the Board:• Mr Jorma Eloranta, born 1951, M. Sc. (Tech.), Doctor of Science in
Technology h.c., member of the Uponor Board since 2005• Ms Pia Aaltonen-Forsell, born 1974, M. Soc.Sc.in Economics, CFO,
Ahlstrom-Munksjö Oyj, member of the Uponor Board since 2017• Mr Markus Lengauer, born 1965, Master of Engineering, Doctorate in
Mechanical Engineering, member of the Uponor Board since 2015• Ms Eva Nygren, born 1955, Architect, member of the Uponor Board
since 2011• Ms Annika Paasikivi, born 1975, B.A, M.Sc. (global politics), Chief
Operating Officer, Oras Invest Ltd and CEO, Finow Ltd, member of the Uponor Board since 2014
• Mr Jari Rosendal, born 1965, M. Sc. (Tech.), President & CEO, Kemira Oyj, member of the Uponor Board since 2012.
For more detailed information on Uponor’s Board members, please refer to page 36 or visit investors.uponor.com.
The Company complies with the recommendations on issues related to Board members, their independence and non-executive position, issued by the Securities Market Association. Based on the evaluation of the Board, all of the current Board members are independent of the Company. The Chair of the Board, Mr Eloranta, has served as a member in the Uponor Board since 2005, as a deputy Chair since 15 March 2012 and as a Chair since 19 March 2014. The Board has concluded unanimously, and based on an overall evaluation and factual circumstances, that Mr Jorma Eloranta is still independent of the company irrespective of the fact that he has served as a member in the Board of the company for more than 10 years. Based on the evaluation of the Board, all the current Board members, with the exception of Ms Annika Paasikivi and Mr Markus Lengauer, are also independent of major shareholders. According to Finnish legislation, all Board members are required to act in the best interest of the Company and its subsidiaries (“Group”) as well as shareholders, and to disclose any potential conflicts of interest.
The AGM determines Board remuneration and fees. Based on the 2017 AGM’s decision, the annual Board remuneration is as follows: €88,000 for the Chair, €49,000 for the Deputy Chair, €49,000 for the Chair of the Audit Committee and €44,000 for ordinary members. The AGM further decided that approximately 40 per cent of the annual
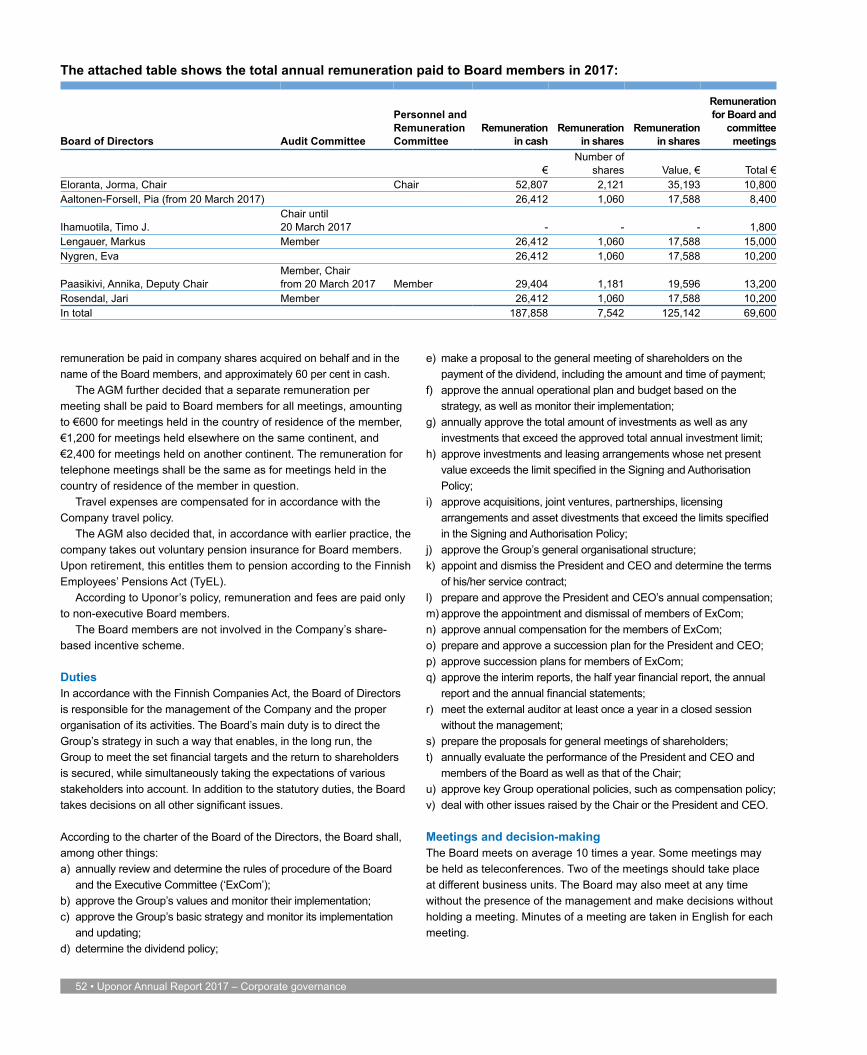
52 • Uponor Annual Report 2017 – Corporate governance
remuneration be paid in company shares acquired on behalf and in the name of the Board members, and approximately 60 per cent in cash.
The AGM further decided that a separate remuneration per meeting shall be paid to Board members for all meetings, amounting to €600 for meetings held in the country of residence of the member, €1,200 for meetings held elsewhere on the same continent, and €2,400 for meetings held on another continent. The remuneration for telephone meetings shall be the same as for meetings held in the country of residence of the member in question.
Travel expenses are compensated for in accordance with the Company travel policy.
The AGM also decided that, in accordance with earlier practice, the company takes out voluntary pension insurance for Board members. Upon retirement, this entitles them to pension according to the Finnish Employees’ Pensions Act (TyEL).
According to Uponor’s policy, remuneration and fees are paid only to non-executive Board members.
The Board members are not involved in the Company’s share-based incentive scheme.
Duties In accordance with the Finnish Companies Act, the Board of Directors is responsible for the management of the Company and the proper organisation of its activities. The Board’s main duty is to direct the Group’s strategy in such a way that enables, in the long run, the Group to meet the set financial targets and the return to shareholders is secured, while simultaneously taking the expectations of various stakeholders into account. In addition to the statutory duties, the Board takes decisions on all other significant issues.
According to the charter of the Board of the Directors, the Board shall, among other things:a) annually review and determine the rules of procedure of the Board
and the Executive Committee (‘ExCom’);b) approve the Group’s values and monitor their implementation;c) approve the Group’s basic strategy and monitor its implementation
and updating;d) determine the dividend policy;
e) make a proposal to the general meeting of shareholders on the payment of the dividend, including the amount and time of payment;
f) approve the annual operational plan and budget based on the strategy, as well as monitor their implementation;
g) annually approve the total amount of investments as well as any investments that exceed the approved total annual investment limit;
h) approve investments and leasing arrangements whose net present value exceeds the limit specified in the Signing and Authorisation Policy;
i) approve acquisitions, joint ventures, partnerships, licensing arrangements and asset divestments that exceed the limits specified in the Signing and Authorisation Policy;
j) approve the Group’s general organisational structure;k) appoint and dismiss the President and CEO and determine the terms
of his/her service contract;l) prepare and approve the President and CEO’s annual compensation;m) approve the appointment and dismissal of members of ExCom;n) approve annual compensation for the members of ExCom;o) prepare and approve a succession plan for the President and CEO;p) approve succession plans for members of ExCom;q) approve the interim reports, the half year financial report, the annual
report and the annual financial statements;r) meet the external auditor at least once a year in a closed session
without the management;s) prepare the proposals for general meetings of shareholders;t) annually evaluate the performance of the President and CEO and
members of the Board as well as that of the Chair;u) approve key Group operational policies, such as compensation policy;v) deal with other issues raised by the Chair or the President and CEO.
Meetings and decision-makingThe Board meets on average 10 times a year. Some meetings may be held as teleconferences. Two of the meetings should take place at different business units. The Board may also meet at any time without the presence of the management and make decisions without holding a meeting. Minutes of a meeting are taken in English for each meeting.
Board of Directors Audit Committee
Personnel and Remuneration Committee
Remuneration in cash
Remuneration in shares
Remuneration in shares
Remuneration for Board and
committee meetings
€Number of
shares Value, € Total €Eloranta, Jorma, Chair Chair 52,807 2,121 35,193 10,800Aaltonen-Forsell, Pia (from 20 March 2017) 26,412 1,060 17,588 8,400
Ihamuotila, Timo J. Chair until 20 March 2017 - - - 1,800
Lengauer, Markus Member 26,412 1,060 17,588 15,000Nygren, Eva 26,412 1,060 17,588 10,200
Paasikivi, Annika, Deputy Chair Member, Chair from 20 March 2017 Member 29,404 1,181 19,596 13,200
Rosendal, Jari Member 26,412 1,060 17,588 10,200In total 187,858 7,542 125,142 69,600
The attached table shows the total annual remuneration paid to Board members in 2017:

Uponor Annual Report 2017 – Corporate governance • 53
During 2017, the Board held nine meetings in total, two at a business unit and one as a teleconference meeting. Two partial non-attendances were recorded (Pia Aaltonen-Forsell one and Eva Nygren one). Further, the Board made three decisions without having a meeting.
The CEO shall prepare the Board meeting agenda for the review by the Chair. Any Board member may recommend the inclusion of a specific agenda item, such recommendations being accommodated to the extent practicable. Material for Board meetings shall be distributed to the members well in advance of each meeting.
The CEO and the Secretary to the Board shall attend Board meetings on a regular basis, while other members of the corporate management shall attend at the Chair’s invitation.
Board members shall have complete access to members of the ExCom and vice versa. Any non-routine communications shall be reported to the CEO.
The Board constitutes a quorum when more than half of the mem-bers are present. Decisions shall be made on a simple majority basis, with the Chair casting the deciding vote should the votes be even.
Board diversity principlesWhen designing the composition of the Board of Directors, the Nomination Board of the company assesses the Board composition from the viewpoint of the company’s current and future business needs, while taking into account the diversity of the Board.
The diversity of the Board of Directors will be assessed from various viewpoints. The members of Uponor’s Board of Directors shall have sufficient and complementary experience and expertise in the key industries and markets relevant to Uponor’s business. In addition, an essential element is the personal characteristics of the members and their diversity.
Expertise Personal characteristics
• Knowledge on the company’s value creation drivers
• Industry• Relevant markets and
technologies• Accounting and finance• Governance
• Professional experience• Education• Gender• Age• Personality
ObjectiveThe company’s aim is that the Board of Directors represents diverse expertise in different industries and markets, diverse professional and educational background, diverse age distribution and both genders. Concerning gender diversity the objective is that both genders are represented in the Board by at least two members.
The realisation of the diversity principles is monitored and reported in the company’s Corporate Governance Statement.
Board committees
Audit CommitteeThe Board decided to re-establish the Audit Committee on 20 March 2017, with the same charter as earlier. The members of the Audit Committee are Annika Paasikivi, Jari Rosendal and Markus Lengauer, with Annika Paasikivi elected as the committee chair.
According to the charter of the Audit Committee, the Committee shall have the following duties: • to monitor the reporting process of financial statements and
assuring that the reporting process generates correct information, to deal with any exceptional and material items and their handling and to approve important accounting principles;
• to review and oversee the quality and integrity of the annual report and the annual financial statements as well as the interim reports and the half year financial report;
• to monitor the financial and liquidity position of the company and prepare matters and proposals to the Board on a need-to-know basis;
• to monitor the efficiency, plans and processes of the Group’s internal control, internal audit and risk management systems;
• to review the Company’s corporate governance statement including the description of the main features of the internal control and risk management systems pertaining to the financial reporting process;
• to approve the annual plan and budget, to issue instructions on and to review and monitor the operations, plans and reports of the internal audit function, to receive status reports of the internal audit function in every meeting and to meet with the internal auditor at least twice a year;
• to review the external audit plan and to monitor the statutory audit of the financial statements and consolidated financial statements, to approve the budget of the external audit as well as new assignment above the limit set by the Audit Committee;
• to meet with the external auditor quarterly and to review all material reports from the auditor;
• to evaluate the independence of the statutory auditor or audit firm, particularly the provision of related services to the company to be audited;
• to prepare the proposal for a resolution on the election of the auditor;
• to monitor the Company’s compliance with legal and regulatory requirements, including the performance of its ethics and compliance programme, and
• to meet with the management of the company, particularly the CEO and the CFO, but also others responsible for internal control and risk management.
The invitation and materials of the audit committee meetings shall be sent to the board members, who all have the right to attend the meetings.
The Committee held four meetings in 2017, one of which was a teleconference meeting. No non-attendances were recorded.

54 • Uponor Annual Report 2017 – Corporate governance
Personnel and Remuneration CommitteeThe Board decided to re-establish the Personnel and Remuneration Committee on 20 March 2017, with the same charter as earlier. The members of the Personnel and Remuneration Committee are Jorma Eloranta (chair) and Annika Paasikivi.
The Personnel and Remuneration Committee shall have the following duties (charter): • preparing the appointments of the President and CEO and the
members of the Executive Committee, and the terms and conditions of their employment
• preparing matters to be brought to the Board relating to personnel, evaluation of top management and succession planning as needed
• preparation of matters pertaining to the remuneration and other financial benefits of the President and CEO and other executives
• preparation of matters pertaining to the remuneration schemes of the company
• evaluation of the remuneration of the President and CEO and the other executives as well as seeing to it that the remuneration schemes are appropriate
• reviewing the remuneration statement• answering questions related to the remuneration statement at
the general meeting.
The Personnel and Remuneration Committee held five meetings in 2017, with no non-attendances.
Nomination Board
In March 2012, the AGM resolved to establish a permanent Nomination Board comprising of shareholders or representatives of shareholders to annually prepare the proposals for the election of the members of the Board of Directors and the remuneration of the members of the Board of Directors. The duties of the Nomination Board shall be to: • prepare the proposal for the appointment of the members of
the Board of Directors to be presented to the general meeting• prepare the proposal to the general meeting on matters pertaining
to the remuneration of the members of the Board of Directors• look for prospective successors for the members of the Board of
Directors• present the proposals on the members of the Board of Directors
and the members’ remuneration to the general meeting.
The Nomination Board shall be comprised of the three largest shareholders or representatives of such shareholders, in addition to which the Chair of the Board of Directors shall act as an expert member. The three largest shareholders who on 31 August preceding the general meeting are registered in the shareholders’ register of the company, held by Euroclear Finland Ltd., and have the largest share of all the voting rights, shall have the right to appoint the members representing the shareholders. The holdings of a shareholder, held in several funds or registers, who according to the Securities Market Act has an obligation to disclose changes in ownership (notified share-holdings), will be calculated together when counting the voting rights, if the shareholder so requests in writing to the Board of Directors, at
the latest on 30 August preceding the general meeting. If a share-holder does not wish to use the right to appoint a member, the right shall pass on to the next biggest shareholder in to the shareholders’ register, who otherwise would not have a right to appoint a member. The Nomination Board shall constitute a quorum when a majority of the members are present.
The Nomination Board is convened by the Chair of the Board of Directors and it shall elect a Chair amongst its members.
The Nomination Board shall, as a rule, present its proposal to the Board of Directors of the company by the end of January and, in the minimum, four weeks prior to the general meeting in the same year as the general meeting is being held.
The Board of Directors of Uponor Corporation argues that it is in the interest of the company and its shareholders that the biggest shareholders of the company participate in the preparation of the election and remuneration of the members of the Board of Directors.
In September 2017, the following persons were nominated to the Nomination Board: Jari Paasikivi (Oras Invest Oy), Chair, Reima Rytsölä (Varma Mutual Pension Insurance Company) and Mikko Mursula (Ilmarinen Mutual Pension Insurance Company). Chair of the Board Jorma Eloranta acts as an additional expert member.
The Nomination Board held one meeting in 2017. No non- attendances were recorded. Further, the Nomination Board made one decision without having a meeting.
Chief Executive Officer
Mr Jyri Luomakoski, MBA, born 1967, acts as President and CEO of the Company.
Assisted by the Executive Committee, the CEO is in charge of the Group’s day-to-day management in accordance with the orders and instructions issued by the Board. It is the CEO’s duty to ensure that the Group’s accounting procedures comply with the applicable legislation and that the financial management is conducted in a reliable manner. The CEO is also the Chair of the Executive Committee.
In 2017, the base salary paid to the CEO, Mr Jyri Luomakoski, totalled €422,340 in cash and €29,481 as fringe benefits, in total €451,821. The Company paid the CEO a total of €259,470 based on the short-term incentive plan for the year 2016. Based on the decision of the Board of Directors on 15 February 2018, the CEO was awarded a reward of €149,580 based on the short-term incentive plan 2017. In addition, based on the long-term incentive plan 2015–2017, he was awarded 3,138 shares to be transferred to his book-entry account, in connection with which a money transfer will be made to the tax author-ity, which corresponds to the value of 4,222 shares as income tax and asset transfer tax.
Under the terms of the CEO’s written service contract, the contract may be terminated at a six months’ notice, either by the CEO or the Company. If the Company terminates the contract, it must pay the CEO, in addition to statutory compensation for the notice period, an amount equivalent to the fixed total salary paid for the 12 months preceding the termination. The Company may also terminate the agree-ment with immediate effect, by paying an indemnification equivalent to the CEO’s fixed total salary for 18 months. Retirement age for the CEO will be determined in accordance with the Employees’ Pensions Act (TyEL), however, both the Company and the CEO may require the

Uponor Annual Report 2017 – Corporate governance • 55
CEO’s retirement at the age of 63 years. The company has also taken a defined contribution pension insurance for the CEO, into which the company annually pays €40,000. The Company has further concluded a pension arrangement based on a capitalisation agreement for the benefit of the CEO, into which the company annually pays €40,000. In 2016, the Board concluded to increase the payment based on the capitalisation agreement by €10,000 so that the company payment was €50,000 in 2017 and will be €50,000 also in 2018.
President of Uponor Infra Oy and member of the Executive Com-mittee, Mr Sebastian Bondestam acted in 2017 as the deputy to the managing director of the parent company. The company has taken a defined contribution pension plan for Mr Sebastian Bondestam, deputy to the managing director, according to which he shall be entitled to a contribution of 8,85% of the annual base salary including fringe benefits for the year 2017. The Board shall decide on the percentage of the defined contribution separately for each year.
Executive Committee
Duties The Executive Committee is mainly responsible for formulating and implementing the Group’s strategy. It also discusses and decides on significant operational issues, while each of its members is respon-sible for the Group’s day-to-day management with respect to his/her field of responsibility.
The ExCom shall, among other things, attend to the following:a) the Group’s strategy and its implementation throughout the Group;b) budgets, business plans and their implementation;c) significant organisational changes and any changes in employment
conditions affecting large numbers of employees such as:• the composition of area/regional management teams,• major structural changes within the organisation,• all major redundancy programmes,
d) the appointment or removal of Senior Officers and Unit Managers belonging to the reporting chain of any ExCom member;
e) annual salary and incentive structures of the management (excluding those of ExCom members);
f) investments and leasing arrangements with net present value of leases being in the limits specified in the Signing and Authorisation Policy;
g) acquisitions, joint ventures, partnerships and licensing arrangements and, should these exceed the limit specified in the Signing and Authorisation Policy, the ExCom shall submit a proposal to the Board;
h) incorporation or dissolution of legal entities;i) asset divestments - including real estate, legal units and shares in
the limits specified in the Signing and Authorisation Policy;j) performance by region/unit including analysis of market trends and
the competitive environment, as well as significant corrective actions (to be discussed in each meeting);
k) R&D and new business development priorities and resources;l) items related to the Group’s brand architecture;m) legal disputes and claims of a significant nature including matters at
regional/unit level;n) other matters, upon the Board’s request.
ExCom prepares proposals to the Board on matters which require a resolution of the Board.
Membership The ExCom comprises of the CEO and the number of executives determined by the Board, with the CEO acting as the Chair. For more information on ExCom members and their responsibilities, please refer to page 37 or visit our website at investors.uponor.com.
Meetings and decision-making The ExCom meets 8–12 times a year, with informal records being kept of its meetings. In 2017, the ExCom held ten meetings.
The target is to achieve a unanimous view among the members of the ExCom on the issues under discussion. The decisions shall be confirmed by the Chair.
Board and CEO evaluation
The Board conducts an annual evaluation of the CEO’s performance with respect to, for example, strategic planning, management skills and financial performance, based on a special evaluation form. In addition, the Board conducts a separate evaluation of its performance and that of the Chair.
Compensation
The Group’s compensation system consists of the basic salary, fringe benefits and a short-term incentive plan, which is subject to an individual employee’s position. The superior of an employee’s immediate supervisor is responsible for approving an individual employee’s compensation.
On 10 December 2014, the Board of Directors approved the establishment of a new long-term share-based incentive plan, which covered a maximum of 25 members of the Group’s key management. The plan covered the years 2015–2017. On 11 December 2015, the Board of Directors approved the establishment of a new long-term share-based incentive plan, which covered a maximum of 25–30 members of the Group’s key management. The plan covers the years 2016–2018. On 12 December 2016, the Board of Directors approved the establishment of a new long-term share-based incentive plan, which covered a maximum of 25–30 members of the Group’s key management. The plan covers the years 2017–2019. Further, on 13 December 2017, the Board of Directors approved the establishment of a continuation to the long-term share-based incentive plan, which may cover a maximum of 50 members of the Group’s key manage-ment. The plan covers the years 2018–2020.
The purpose of the plans is to retain key management, as well as to motivate and reward the management for good performance that supports the company’s profitability and the implementation of the company’s strategy. The plans also encourage the key management to further acquire and own Uponor’s shares, which will contribute to aligning the interests of the management, the company and the shareholders.
A Group employee is not entitled to a separate fee for a board membership within a Group company.

56 • Uponor Annual Report 2017 – Corporate governance
The Board determines the CEO’s employment terms and conditions and annual compensation, and approves ExCom members’ annual compensation, based on the CEO’s proposal.
Internal control, risk management, internal audit and external audit
Internal controlThe Board is responsible for the principles of internal control in Uponor. Uponor’s internal control is defined as a process influenced by the Board, the management and all the individual employees of the Group. The objective of internal control is to ensure that the management has a reasonable assurance that:• operations are effective, efficient and aligned with the strategy;• financial reporting and management information is reliable,
comprehensive and timely; and• the Group is in compliance with applicable laws and regulations.
Uponor’s internal control framework strives to balance the business needs and the control perspective. The aim of the internal control framework is thus to:• focus on the most business-relevant risks and issues from the
strategic alignment and operational effectiveness point of view;• promote ethical values, good corporate governance and risk
management practices;• ensure compliance with laws, regulations and Uponor’s internal
policies; and• assure production of reliable financial reporting to support internal
decision-making and to serve the needs of external stakeholders.
The base for the internal control environment and integrity of the employees is set in Uponor’s Code of Conduct and values.
Uponor’s aim is to embed control in the daily operations. Effec-tive internal control requires that duties are properly segregated to different employees and potential conflicts of interests are identified and eliminated. Examples of existing control mechanisms include group policies, accounting and reporting instructions and regular management business review meetings. Additionally, as an example, responsibilities for communication with external parties, such as customers, suppliers, regulators and shareholders are clearly set.
Ongoing monitoring occurs locally in each organisational unit dur-ing the course of daily operations. On Group level, the responsibility lies within the Finance and Administration function.
Whether separate evaluations are needed, their scope and frequency, will depend primarily on an assessment of risks and the effectiveness of ongoing monitoring procedures. Internal control deficiencies shall be reported upstream, with serious matters to be reported to the top management and the Board. Any separate evalua-tions are performed by the internal audit function and may be initiated by the Board or by the management.
Risk managementRisk management is a systematic way of protecting business assets and income against losses in order to achieve the Company’s targets without unnecessary interruption. Risk management also includes
risk-taking. That means utilisation of opportunities, taking into account the risk-reward ratio in each case.
The objective of risk management is to enable the Company to implement its strategy, to ensure it achieves its financial targets and to protect it from operative incidents, which might prevent it from achieving its targets. A further objective is to ensure the continuity of the operations even in an exceptional business environment.
The main risk areas of the Company have been identified. Each ExCom member has been allocated his/her own area of responsibility with regard to the identified risks, including the management and proper organisation of those risk areas throughout the Group.
Group Risk Management Team, comprising the CFO, President, Uponor Infra, EVP, Group Technology and Corporate Development, General Counsel and Director, Treasury and Risk Management, is responsible for the monitoring of Group-level risks and mitigation actions, and for informing the ExCom and the Board.
Director, Treasury and Risk Management is responsible for provid-ing support to the ExCom in developing risk policies and guidelines, as well as for establishing assessment, monitoring and reporting procedures. He/she provides support to the Regions/areas, units and functions by providing assistance and training. He/she is also responsible for establishing and maintaining the company’s global insurance programmes.
A summary of risks associated with business is available on pages 38–45 in the section “Review by the Board of Directors” or on our website at investors.uponor.com.
Financial Risk Management related notes can be found on pages 90–92 in the section “Notes to the consolidated financial state-ments” or on our website at investors.uponor.com.
Internal auditInternal audit is an integrated part of Uponor’s internal control framework. It supports the Board and the management in following up the effective-ness of internal control and corporate governance. Internal Audit shall focus on the key risk areas of business. To achieve its objectives, it car-ries out independent audits of business units and subsidiaries, process reviews, and targeted audits on specific areas, to give the ExCom and the Board assurance that effective controls are in place. Moreover, Internal Audit performs reviews to ensure compliance with internal company policies, guidelines and laws and regulations.
Internal auditing is an independent, objective assurance and consulting activity designed to add value to and improve the Company’s operations. It helps the Company accomplish its objectives by bringing a systematic, disciplined approach to evaluate and improve the effective-ness of risk management, control and governance processes.
The purpose, authority, and responsibilities of Internal Audit are defined in the Internal Audit Charter approved by the Audit Commit-tee, to which Internal Audit is subordinated. The annual audit plan is approved by the Audit Committee. A summary of the most significant audit findings is presented to the Audit Committee four times a year. Internal Audit has the obligation and authority to report on any significant audit findings both to the ExCom and to the Audit Com-mittee. Internal Audit has unrestricted access to the Board, and to all Uponor’s records, personnel, and physical properties relevant to the performance of its engagement.

Uponor Annual Report 2017 – Corporate governance • 57
In 2017, the focus areas of internal audit included audits of Uponor’s foreign subsidiaries and group functions. The audits of subsidiaries concentrated on compliance with group policies, changes in business operations as well as review of business processes, risks and controls.
Administratively, Internal Audit reports to the Chief Financial Officer (CFO). As of 1 January 2014, Uponor has outsourced its internal audit function to EY.
External audit
Assisted by the Audit Committee, the Board prepares a proposal on the external auditor and presents it to the AGM for election. The external auditor must be a corporation of authorised public account-ants accredited by the Finnish Patent and Registration Office. In co-operation with the auditor, the corporate management organises the audit of the Group’s subsidiary companies, as required by applicable local legislation. Auditors of these subsidiary companies report directly to the legal unit they have audited, submitting a copy of each report to the Group’s financial administration for inclusion in the Company’s audit log.
The 2017 AGM appointed audit firm Deloitte Oy as the Company’s auditor for the financial year 2017, with Jukka Vattulainen, Authorised Public Accountant, acting as the principal auditor.
Fees paid to the external auditor for the statutory audit services totalled €898,000 and for audit related and other services €39,000, in total €937,000 for the year 2017.
Insider administration
Uponor Corporation complies with applicable EU regulations, especially the Market Abuse Regulation (596/2014, “MAR”), and any regulation and guidance given by the European Securities Markets Authority (“ESMA”). Further, the company observes Finnish legislation, especially the Securities Markets Act (746/2012, as amended) and the Finnish Penal Code (39/1889, as amended), including the insider and other guidelines of Nasdaq Helsinki Ltd. and the standards and guidance of the Finn-ish Financial Supervisory Authority (“FIN-FSA”) and other authorities. Uponor also has its own insider policy.
Managers, as defined by MAR, include the members of the Board of Directors and senior executives in the following positions: the president and CEO, the CFO, and other members of the Executive Committee as determined by the President and CEO from time to time. As of 3 July 2016, such managers include the president of Building Solutions – Europe, the president of Building Solutions – North America, and the president of Uponor Infra. MAR requires that each manager and his/her closely associated persons notify the company and FIN-FSA of their transactions in the financial instruments of or linked to the company conducted on his/her own account. These notifications shall be made promptly and no later than three business days after the date of transaction (T+3). Uponor will issue stock exchange releases to disclose information on transactions by managers and their closely associated persons, as specified in MAR.
Since 3 July 2016, Uponor no longer maintains a list of permanent insiders. Instead, all persons involved with insider projects will be listed as project-specific insiders. Project-specific lists will be established and
maintained for each project or event constituting inside information, based on a separate decision. All persons working for Uponor, repre-sentatives of external entities, shareholders and authorities who have information concerning an insider project or have access to project-specific inside information, as well as persons who are working for the implementation of an insider project, will be entered in a project-specific insider list.
Preparation of periodic disclosure (annual and half-year financial statements, interim reports, financial statements bulletins) or regular access to unpublished financial information is not regarded as an insider project. However, due to the sensitive nature of unpublished informa-tion on the company’s financial results, the persons determined by the company, based on their position or access rights, to have authorised access to unpublished financial result information are added to a list of Financial Information Recipients.
Uponor applies an absolute trading prohibition (a ‘closed window’ principle) during a period beginning 30 calendar days before the announcement of each of the periodic financial reports and the year-end report (the financial statements bulletin) and ending at the end of the trading day following the day of publication of such a report. At the minimum, a closed period commences at the end of the reporting period in question. The closed window principle applies to the managers (as defined by MAR) as well as the Financial Information Recipients.
Uponor’s internal insider policy is published on the group intranet. All group employees are required to act in accordance with these rules.
The public insider register, which was in place until 2 July 2016, when MAR entered into force, contained information of the holdings of the public insiders, their immediate circle and the corporations controlled by them, as well as their most important positions of trust.
The attached table shows the shares owned by the management – including the management as defined by MAR (including any holdings of corporations controlled by them).

58 • Uponor Annual Report 2017 – Corporate governance
Name Position Date Shares
Eloranta, Jorma Chair of the Board1 Jan
31 Dec35,33437,455
Aaltonen-Forsell, Pia Board member (from 20 March)20 March
31 Dec0
1,060
Ihamuotila, Timo J. Board member (until 20 March)1 Jan
20 March5,2895,289
Lengauer, Markus Board member 1 Jan
31 Dec2,3523,412
Nygren, Eva Board member 1 Jan
31 Dec8,3249,384
Paasikivi, Annika Deputy Chair of the Board and Board member1 Jan
31 Dec38,19639,377
Rosendal, Jari Board member 1 Jan
31 Dec6,9938,053
Shares held by management in 2017 (including also management as defined by MAR)
Name Position Date Shares
Blomqvist, Minna ExCom member (from 1 Sep)1 Sep
31 Dec00
Bondestam, Sebastian ExCom member1 Jan
31 Dec15,41216,889
Gray, Bill ExCom member 1 Jan
31 Dec17,49419,317
Luomakoski, Jyri President and CEO1 Jan
31 Dec42,68535,547
Palomäki, Riitta ExCom member (until 20 March)1 Jan
20 March14,48315,869
Roses, Fernando ExCom member1 Jan
31 Dec16,13117,788
Schrey-Hyppänen, Minna ExCom member (until 25 June)1 Jan
25 June5,2295,229
Strandberg, Maija ExCom member (from 20 March)20 Mar31 Dec
00
Tewes, Jan Peter ExCom member1 Jan
31 Dec13,51913,519
The Executive Committee
The Board of Directors

Uponor Annual Report 2017 – Consolidated statement of comprehensive income • 59
Consolidated statement of comprehensive income
M€ Note 2017 % 2016 %
Continuing operations
Net sales 2 1,170.4 100.0 1,099.4 100.0Cost of goods sold 776.3 66.3 723.4 65.8Gross profit 394.1 33.7 376.0 34.2
Other operating income 4 3.1 0.3 4.2 0.4
Dispatching and warehousing expenses 33.2 2.8 34.6 3.1Sales and marketing expenses 190.3 16.3 190.1 17.3Administration expenses 53.4 4.6 58.9 5.4Other operating expenses 4 24.4 2.1 25.6 2.3Expenses 301.3 25.7 309.2 28.1
Operating profit 2 95.9 8.2 71.0 6.5
Financial income 7 14.7 1.3 10.4 0.9Financial expenses 7 20.1 1.7 20.4 1.9Share of result in associated companies -2.3 -0.2 -0.6 -0.1
Profit before taxes 88.2 7.5 60.4 5.5
Income taxes 8 22.8 1.9 18.9 1.7
Result from continuing operations 65.4 5.6 41.5 3.8
Discontinued operationsResult from discontinued operations - - 0.4 0.0
Profit for the period 65.4 5.6 41.9 3.8
Other comprehensive incomeItems that will not be reclassified subsequently to profit or loss:Re-measurements on defined benefit pensions, net of taxes -0.4 1.4Items that may be reclassified subsequently to profit or loss:Translation differences -13.2 2.1Cash flow hedges, net of taxes 1.2 1.4Net investment hedges 1.7 0.2Other comprehensive income for the period, net of taxes -10.7 5.1
Total comprehensive income for the period 54.7 47.0
Profit for the period attributable to Equity holders of parent company 60.5 42.2 Non-controlling interest 4.9 -0.3
Total comperensive income for the period attributable to Equity holders of parent company 50.1 47.1 Non-controlling interest 4.6 -0.1
Earnings per share, € 9 0.83 0.58- Continuing operations 0.83 0.57- Discontinued operations - 0.01
Diluted earnings per share, € 0.83 0.58- Continuing operations 0.83 0.57- Discontinued operations - 0.01
Financial statements

60 • Uponor Annual Report 2017 – Consolidated balance sheet
M€ Note 31 Dec 2017 % 31 Dec 2016 %
ASSETS
Non-current assets
Intangible assetsIntangible rights 14.2 15.8Goodwill 93.6 93.7Customer relationship value 5.9 8.3Technology 0.7 0.8Other intangible assets 1.6 0.3Investment in progress 0.0 0.1Total intangible assets 10 116.0 13.4 119.0 15.5
Tangible assetsLand and water areas 14.3 15.4Buildings and structures 77.8 71.8Machinery and equipment 112.0 100.9Other tangible assets 16.6 14.5Construction work in progress 31.5 38.3Total tangible assets 11 252.2 29.1 240.9 31.4
Securities and long-term investmentsInvestments in associated companies and joint ventures 13 9.5 13.3Other shares and holdings 14 0.2 0.3Non-current receivables 15 10.5 21.1Total securities and long-term investments 20.2 2.3 34.7 4.5
Deferred tax assets 20 10.4 1.2 11.6 1.5
Total non-current assets 398.8 46.1 406.2 52.9
Current assets
Inventories 16 132.7 15.3 139.3 18.1
Current receivablesAccounts receivables 171.8 165.8Current income tax receivables 19.5 6.0Accruals 3.4 4.4Other receivables 32.6 29.5Total current receivables 17 227.3 26.3 205.7 26.8
Cash and cash equivalents 18 107.0 12.4 16.3 2.1
Total current assets 467.0 53.9 361.3 47.1
Total assets 865.8 100.0 767.5 100.0
Consolidated balance sheet

Uponor Annual Report 2017 – Consolidated balance sheet • 61
M€ Note 31 Dec 2017 % 31 Dec 2016 %
SHAREHOLDERS' EQUITY AND LIABILITIES
Equity attributable to the owners of the parent company 19Share capital 146.4 146.4Share premium 50.2 50.2Other reserves 1.7 0.5Translation reserve -10.4 0.9Retained earnings 31.8 23.1Profit for the period 60.5 42.2Total equity attributable to the owners of the parent company 280.2 32.4 263.3 34.3
Non-controlling interest 68.2 63.6Total equity 348.4 40.2 326.9 42.6
Liabilities
Non-current liabilitiesInterest-bearing liabilities 23 176.6 158.2Employee benefit obligations 21 24.3 24.8Provisions 22 7.1 8.9Deferred tax liabilities 20 7.9 11.8Other non-current liabilities 0.1 0.4Total non-current liabilities 216.0 24.9 204.1 26.6
Current liabilitiesInterest bearing liabilities 23 81.9 17.6Accounts payable 77.0 76.2Current income tax liability 5.8 5.8Provisions 22 21.8 19.9Other current liabilities 24 114.9 117.0Total current liabilities 301.4 34.8 236.5 30.8
Total liabilities 517.4 59.8 440.6 57.4
Total shareholders' equity and liabilities 865.8 100.0 767.5 100.0

62 • Uponor Annual Report 2017 – Consolidated cash flow statement
Consolidated cash flow statement
M€ Note 1 Jan–31 Dec 2017 1 Jan–31 Dec 2016
Cash flow from operations
Net cash from operationsProfit for the period 65.4 41.9Adjustments for:
Depreciation 39.2 41.6Dividend income 0.0 0.0Income taxes 22.8 18.9Interest income -0.2 -0.2Interest expense 3.8 4.8Sales gains/losses from the sale of businesses and fixed assets -2.3 -1.0Share of profit in associated companies 2.3 0.6Other cash flow adjustments 10.8 -1.3
Net cash from operations 141.8 105.3
Change in net working capitalReceivables -18.2 -7.5Inventories 1.5 -19.9Non-interest-bearing liabilities 9.5 10.8Change in net working capital -7.2 -16.6
Income taxes paid -29.5 -24.9Interests paid -3.8 -4.1Interests received 0.2 0.2
Cash flow from operations 101.5 59.9
M€ Note 1 Jan–31 Dec 2017 1 Jan–31 Dec 2016
Cash flow from investmentsAcquisition of subsidiaries and businesses 3 - -31.4Acquisition of joint ventures - -13.5Purchase of fixed assets -63.4 -50.7Proceeds from sale of fixed assets 3.7 3.4Dividends received 0.2 0.4Loan granted and repayments 0.0 0.0Cash flow from investments -59.5 -91.8
Cash flow before financing 42.0 -31.9
Cash flow from financingBorrowings of debt 159.5 97.3Repayments of debt -59.6 -58.8Change in other short term debt -16.2 -5.4Dividends paid -33.6 -32.2Payment of finance lease liabilities -1.1 -1.1Cash flow from financing 49.0 -0.2
Conversion differences for cash and cash equivalents -0.3 0.2
Change in cash and cash equivalents 90.7 -31.9
Cash and cash equivalents at 1 January 16.3 48.2Cash and cash equivalents at 31 December 107.0 16.3Changes according to balance sheet 18 90.7 -31.9

Uponor Annual Report 2017 – Consolidated statement of changes in shareholders’ equity • 63
Consolidated statement of changes in shareholders’ equity
Number of shares
out-standing
(1,000)Share capital
Share premium
Other reserves
Unrestrict-ed equity
Hedge reserve
Treasury shares
Trans-lation
reserveRetained earnings
Equity attribut-
able to the owners of the parent company
Non- Con-
trolling interest
Total equity
Balance at 1 January 2017 73,138 146.4 50.2 1.7 0.1 -1.3 -0.5 0.9 65.8 263.3 63.6 326.9Total comprehensive income for the period 1.2 -11.3 60.2 50.1 4.6 54.7Dividend paid -33.6 -33.6 -33.6Share based incentive plan 10 0.1 0.3 0.4 0.4Balance at 31 December 2017 73,148 146.4 50.2 1.7 0.1 -0.1 -0.4 -10.4 92.7 280.2 68.2 348.4
Balance at 1 January 2016 73,109 146.4 50.2 1.6 0.1 -2.7 -0.7 -1.8 54.9 248.0 63.7 311.7Total comprehensive income for the period 1.4 2.7 43.0 47.1 -0.1 47.0Dividend paid -32.2 -32.2 -32.2Transfers between reserves 0.1 -0.1 - -Share based incentive plan 29 0.2 0.2 0.4 0.4Other adjustments 0.0 0.0 0.0Balance at 31 December 2016 73,138 146.4 50.2 1.7 0.1 -1.3 -0.5 0.9 65.8 263.3 63.6 326.9
For further information see note 19.

64 • Uponor Annual Report 2017 – Definitions of key ratios
Definitions of key ratios
Return on Equity (ROE), %Profit before taxes – taxes
x 100=Total equity, average
Return on Investment (ROI), %Profit before taxes + interest and other financing costs
x 100=Balance sheet total – non-interest-bearing liabilities, average
Solvency, %Total equity
x 100=Balance sheet total – advance payments received
Gearing, %Net interest-bearing liabilities
x 100=Total equity
Net interest-bearing liabilities = Interest-bearing liabilities – cash, bank receivables and financial assets excluding restricted cash
Earnings per share (EPS)Profit for the period attributable to equity holders of parent company
=Average number of shares adjusted for share issue in financial period excluding treasury shares
Equity per share ratioEquity attributable to the owners of the parent company
=Number of shares adjusted for share issue at end of year
Dividend per share ratioDividend per share
x 100=Earnings per share
Effective dividend yieldDividend per share
x 100=Share price at end of financial period
Price-Earnings ratio (P/E)Share price at end of financial period
=Earnings per share
Market value of shares = Number of shares at end of financial period x last trading price
Average share priceTotal value of shares traded €
=Total number of shares traded
Gross profit marginGross profit
x 100=Net sales
Operating profit margin Operating profit
x 100=Net sales
Comparable gross profit marginGross profit – items affecting comparability
x 100=Net sales
Comparable operating profit margin Operating profit – items affecting comparability
x 100=Net sales

Uponor Annual Report 2017 – Notes to the consolidated financial statements • 65
Notes to the consolidated financial statements
1. Accounting principles
Company profileUponor is an international industrial group providing building and municipal infrastructure solutions. Uponor Group’s segment structure consists of the following three reporting segments: Building Solutions – Europe, Building Solutions – North America and Uponor Infra. Its segment business risks and profitability factors differ from each other with respect to the market and business environment as well as offer-ing, services and customers. Group management, control and reporting structures are organised according to the business segments.
Uponor Group’s parent company is Uponor Corporation, domiciled in Helsinki in the Republic of Finland. Its registered address is:
Uponor CorporationP.O. Box 37 (street address: Äyritie 20), FI-01511 Vantaa, FinlandTel. +358 (0)20 129 211
The Financial Statements will also be available on the company website at http://investors.uponor.com and can be ordered from Uponor Corporation at the above-mentioned address.
At its meeting of 15 February 2018, Uponor Corporation’s Board of Directors approved the publication of these financial statements. According to the Finnish Limited Liability Companies Act, the shareholders have the opportunity to approve or reject the financial statements at the Annual General Meeting to be held after their publication. Furthermore, the Annual General Meeting can decide on the modification of the financial statements.
Basis of preparationUponor Group’s consolidated financial statements have been prepared in compliance with the International Financial Reporting Standards (IFRS), including International Accounting Standards (IAS) and their SIC and IFRIC interpretations valid on 31 December 2017. In the Finnish Accounting Act and ordinances based on the provisions of the Act, IFRS refer to the standards and their interpretations adopted in accordance with the procedures as set in regulation (EC) No 1606/2002 of the European Parliament and of the European Council. The consolidated financial statements also include additional information required by the Finnish Accounting Act and the Limited Liability Companies Act. The consolidated financial statements are presented in millions of euros (M€) and are based on the historical cost convention, unless otherwise specified in the accounting principles section below.
Use of estimatesThe preparation of consolidated financial statements under IFRS requires the use of estimates and assumptions affecting the reported amounts of assets and liabilities and the disclosure of contingent assets and liabilities on the date of the financial statements, as well as the reported amounts of income and expenses during the report period. Although these estimates are based on the management’s best view of
current events and actions, the actual results may ultimately differ from these estimates. In addition, judgement is required in the application of accounting policies.
Consolidation principlesThe consolidated financial statements include the parent company, Uponor Corporation, and all companies in which the parent company holds more than half of the voting rights, either directly or through its subsidiaries. Subsidiaries include those companies in which Uponor Corporation has direct or indirect control of over 50 per cent of the voting rights or otherwise has power to govern the financial and operating policies, with the purpose of gaining financial benefit from their operations. Subsidiaries acquired or established during the year are included from the date the Group obtained control. Divested companies have been included up to their date of sale.
Intra-Group shareholdings are eliminated using the acquisition cost method. Accordingly, the assets and liabilities of an acquired company are measured at fair value on the date of acquisition. The excess of the acquisition cost over the fair value of the net assets has been recorded as goodwill. Based on the First-Time-Adoption of IFRS 1, any company acquisitions made prior to the IFRS transition date (1 January 2004) are not adjusted for IFRS, but book value according to Finnish Accounting Standards (FAS) is applied to goodwill amounts. Intra-Group transactions, receivables, liabilities, unrealised gains and dividends between Group companies are eliminated in the consolidated financial statements.
Associated companies are entities over which the Group has 20–50 per cent of the voting rights, or over which the Group otherwise exercises a major influence. Joint ventures are arrange-ments in which the Group has a joint control with another entity. Holdings in associated companies and joint ventures over which the Group does not have over 50 per cent ownership of the voting rights or over which the Group does not excise a major influence are included in the consolidated financial statements using the equity method. Accordingly, the share of post-acquisition profits and losses are recognised in the income statement to the extent of the Group’s holding in the associated companies and joint ventures. When the Group’s share of losses exceeds the carrying amount it is reduced to nil and any recognition of further losses ceases unless the Group has an obligation to fulfil the associated company’s or joint ventures’ obligations. Joint ventures over which the Group has over 50 per cent ownership of the voting rights or over which the Group other-wise exercises a major influence are included in the consolidated financial statements using the acquisition cost method.
Foreign currency translations and exchange rate differencesEach company translates its foreign currency transactions into its own functional currency, using the rate of exchange prevailing on the transaction date. Outstanding monetary receivables and payables in foreign currencies are stated using the exchange rates on the balance sheet date. Exchange rate gains and losses on actual business operations are treated as sales adjustment items or adjustment

66 • Uponor Annual Report 2017 – Notes to the consolidated financial statements
items to materials and services. Exchange rate gains and losses on financial transactions are entered as exchange rate differences in financial income and expenses.
In the consolidated financial statements, the income statements of the Group’s foreign subsidiaries are converted into euros using the average exchange rates quoted for the reporting period. All balance sheet items are converted into euros using the exchange rates quoted on the reporting date. The resulting conversion difference and other conversion differences resulting from the conversion of subsidiaries’ equity are shown as a separate item under equity. In addition, in the consolidated financial statements, exchange rate differences in the loans granted by the parent company to foreign subsidiaries in replacement of their equity are treated as translation differences. Realised translation differences in relation to the divestment of subsidiaries and the redemption of material shares in subsidiaries are recognised as income or expenses in the consolidated statement of comprehensive income.
Key exchange rates for the euro
At end of period Average
2017 2016 2017 2016USD 1.1993 1.0541 1.1370 1.1032SEK 9.8438 9.5525 9.6464 9.4713CAD 1.5039 1.4188 1.4725 1.4589DKK 7.4449 7.4344 7.4390 7.4451NOK 9.8403 9.0863 9.3717 9.2626RUB 69.3920 64.3000 66.1795 73.3091
Non-current assets held for sale and discontinued operationsNon-current assets held for sale and assets related to discontinued operations are formed once the company, according to a single co-ordinated plan, decides to dispose of a separate significant business unit, whose net assets, liabilities and financial results can be separated operationally and for financial reporting purposes (cash generating unit). Non-current assets held for sale are shown separately in the consoli-dated balance sheet. Profit or loss from a discontinued operation and gains or losses on its disposal are shown separately in the consolidated statement of comprehensive income. Assets related to non-current assets held for sale and discontinued operations are assessed at book value or, if it is the lower of the two, at fair value. Depreciation from these assets has been discontinued upon the date of classifying assets as non-current assets held for sale and discontinued operations. The Group has no assets classified as non-current assets held for sale at the end of the financial or a comparable period. The Group had discontinued operations related to the Irish infrastructure business sold in 2008; the Irish subsidiary was liquidated in 2016.
Revenue recognitionSales of products are recognised as income once the risks and benefits related to ownership of the sold products have been transferred to the buyer, according to the agreed delivery terms, and the Group no longer has possession of, or control over, the products. Sales of services are recognised as income once the service has been rendered. Net sales comprise the invoiced value of the sale of goods and services net of indirect taxes, sales rebates and exchange rate differences. The Group
uses percentage of completion method to recognise work-in-progress for long-term contracts in project business companies, when the outcome of the project can be estimated reliably. The percentage of completion is defined as the proportion of the individual project cost incurred to date from the total estimated project costs.
Research and developmentResearch costs are expensed as incurred and are included in the consolidated statement of comprehensive income in other operating expenses. Development costs are expensed as incurred, unless the criteria for capitalising these costs as assets are met. Product development costs are capitalised as intangible assets and are depreciated during the useful life of the asset, if future economic benefits are expected to flow to the entity and certain other criteria, such as the product’s technical feasibility and commercial usability, are confirmed. The Group does not have any capitalised develop-ment costs.
Employee benefitsThe Group’s pension schemes comply with each country’s local rules and regulations. Pensions are based on actuarial calculations or actual payments to insurance companies. The Group applies defined contribution and defined benefit pension plans. Within the defined contribution plan, pension contributions are paid directly to insurance companies and, once the contributions have been paid, the Group has no further payment obligations. These contributions are recog-nised in the income statement for the accounting period during which such contributions are made.
For defined benefit pension plans, the liability is the present value of the defined benefit obligation on the balance sheet date less the fair value of plan assets. The pension obligation is defined using the projected unit credit method. The discount rate applied to calculating the present value of post-employment benefit obligations is determined by the market yields of long-term corporate bonds or government bonds. Costs resulting from the defined benefit pension plans are recognised as expenses for the remaining average period of employment.
Current service cost (benefit expense) and net interest cost on defined benefit obligation (net liability) are recognised in the income statement and presented under employee benefit costs. Re-measurement items on defined benefit plan obligations and plan assets, including actuarial gains and losses and return on plan assets (excluding interest income), are immediately recognised through other comprehensive income and such balances are permanently excluded from the consolidated income statement.
Operating profitOperating profit is an income statement item, which is calculated by deducting expenses related to operating activities from net sales.
Borrowing costsBorrowing costs are recognised in the income statement as they incur. Direct transaction expenses due to loans, clearly linked to a specific loan, are included in the loan’s original cost on an accrual basis and recognised as interest expenses using the effective inter-est method. Interest costs on borrowings to finance the construction

Uponor Annual Report 2017 – Notes to the consolidated financial statements • 67
of assets are capitalised as part of the cost during the period required to prepare and complete the property for its intended use.
Income taxesIncome taxes in the consolidated statement of comprehensive income comprise taxes based on taxable income recognised for the period by each Group company on an accrual basis, according to local tax regula-tions, including tax adjustments from the previous periods and changes in deferred tax. Deferred tax assets or liabilities are calculated, using the liability method, on temporary differences arising between the tax bases of assets and liabilities and their carrying amounts in the financial state-ments, using the tax rate approved on the balance sheet date. Deferred tax assets are recognised to the extent that it appears probable that future taxable profit will be available, against which temporary differences can be utilised.
Intangible assets
GoodwillGoodwill represents future economic benefits arising from assets that are not capable of being individually identified and separately recognised by the Group. Goodwill represents the excess of the cost of an acquisition over the fair value of the net assets of the acquired company on the date of acquisition. Goodwill is allocated to the business segments. Goodwill is not amortised, but is tested for impairment annually. Gains and losses on the disposal of a Group entity include any goodwill relating to the entity sold.
Other intangible assetsOther intangible assets include trademarks, patents, copyrights, software licences and customer relations. Intangible assets are recognised in the balance sheet at historical costs less accumulated depreciation, accord-ing to the expected useful life and any impairment losses.
Property, plant and equipmentGroup companies’ property, plant and equipment are stated at historical cost less accumulated depreciation, according to the expected useful life and any impairment losses. Interest costs on borrowings to finance the construction of these assets are capitalised as part of the cost during the period required to prepare and complete the property for its intended use.
Ordinary repair and maintenance costs are charged to the income statement during the financial period in which they are incurred. The cost of major renovations is included in the asset’s carrying amount when it is probable that the Group will incur future economic benefits in excess of the originally assessed standard of performance of the existing asset.
Gains or losses on the disposal, divestment or removal from use of property, plant and equipment are based on the difference between the net gains and the balance sheet value. Gains are shown within other operating income and losses under other operating expenses.
DepreciationsGroup companies’ intangible assets and property, plant and equip-ment are stated at historical cost less accumulated straight-line depre-ciation, according to their expected useful life and any impairment
losses. Land is not depreciated, as it is deemed to have an indefinite life, but depreciation is otherwise based on estimated useful lives as follows:
YearsBuildings 20–40Production machinery and equipment 8–12Other machinery and equipment 3–15Office and outlet furniture and fittings 5–10Transport equipment 5–7Intangible assets 3–10
The residual value and useful life of assets are reviewed on each balance sheet date and, if necessary, adjusted to reflect any changes in expectations of financial value.
Government grantsAny grants received for the acquisition of intangible or tangible assets are deducted from the asset’s acquisition cost and recorded on the income statement to reduce the asset’s depreciation. Other grants are recognised as income for the periods during which the related expenses are incurred. Such grants are shown as deductions from expenses related to the target of the grant.
ImpairmentThe balance sheet values of assets are assessed for impairment on a regular basis. Should any indication of an impaired asset exist, the asset’s recoverable amount will be assessed. The asset’s recoverable amount is its net selling price less any selling expenses, or its value in use, whichever is higher. The value in use is determined by reference to the discounted future net cash flow expected from the asset. Dis-count rates correspond to the cash generating unit’s average return on investment before taxes. Impairment is measured at the level of cash generating units, which is the lowest level that is primarily independent of other units and whose cash flows can be distinguished from other cash flows.
Whenever the asset’s carrying amount exceeds its recoverable amount, it is impaired and the resulting impairment loss is recognised in the income statement. An impairment of property, plant and equipment and other intangible assets, excluding goodwill, will be reversed if, and only if, there has been a change in the estimates used to determine the asset’s recoverable amount since the last impairment loss was recognised. Impairment is not reversed over the balance sheet value that existed before the recognition of impairment losses in the previous financial periods. Any impairment loss on goodwill is not reversed.
Goodwill is assessed for impairment at least annually, or if any indication of impairment exists, more often.
LeasesLease liabilities, which expose the Group to the risks and rewards inherent in holding such leased assets, are classified as finance leases. These are recognised as tangible assets on the balance sheet and measured at the lesser of the fair value of the leased property at the inception of the lease or the present value of the minimum lease payments. Similarly, lease obligations, from which financing expenses

68 • Uponor Annual Report 2017 – Notes to the consolidated financial statements
are deducted, are included in interest bearing liabilities. Financing interests are recognised in the consolidated statement of comprehensive income during the lease period. An asset acquired under finance lease is depreciated over its useful life or within the shorter lease term.
Leases, which expose the lessor to the risks and rewards inherent in holding such leases, are classified as other leases. These rents are recognised as expenses during the lease period.
The assets leased by the Group, where the lessee bears the risks and rewards inherent in holding such leases, are treated as finance leases and recognised as receivables on the balance sheet at their present value. The Group has no finance lease receivables.
InventoriesInventories are stated at the lower of cost or net realisable value, based on the FIFO principle. The net realisable value is the estimated selling price in the ordinary course of business, less the costs of completion and sale. In addition to the cost of materials and direct labour, an appropriate proportion of production overheads is included in the inventory value of finished products and work in progress.
Provisions Provisions are recognised when the Group has a present legal or constructive obligation as a result of past events, if it is probable that an outflow of resources will be required to settle the obligation or if the settlement of an obligation will cause a legal loss and a reliable esti-mate of the amount of obligation can be made. Provisions can include inter alia environmental provisions, warranty provisions, restructuring costs and onerous contracts. Changes in provisions are included in relevant expenses on the consolidated statement of comprehensive income. The amount of provisions is reviewed on every balance sheet date and the amounts are revised to correspond to the best estimate at that moment.
Contingent assets and liabilitiesA contingent liability is a possible obligation that arises from past events and whose existence will be confirmed only by the occurrence of uncertain future events not wholly within the control of the entity. Such present obligation that probably does not require a settlement of a payment obligation or the amount of which cannot be reliably measured is also considered to be a contingent liability. Contingent liabilities are disclosed in the notes to the financial statements.
Cash and cash equivalentsCash and cash equivalents include cash in hand, deposits held at bank and other short-term, highly liquid investments, whose maturity does not exceed three months. Cash and cash equivalents are car-ried in the balance sheet at cost. The bank account credit limit in use is recognised under current interest-bearing liabilities.
Financial assetsFinancial assets are classified as follows: financial assets at fair value through profit and loss, held-to-maturity investments, loans and receivables, and available-for-sale financial assets. Sales and purchase of financial assets are recognised at their trading date.
Financial assets at fair value through profit and loss include financial assets held for trading and measured at fair value. Financial
assets at fair value through profit and loss have been acquired principally for the purpose of generating a profit from short-term fluctuations in market prices. Derivative instruments, for which hedge accounting is not applied, are included in financial assets at fair value through profit and loss. Interest and currency derivatives, for which no hedge accounting is applied, are recognised in the balance sheet at historical cost and valued at fair value on each balance sheet date. Fair value is determined using market prices on the balance sheet date, or the present value of estimated future cash flows. Changes in the fair value of financial assets at fair value through profit and loss, and unrealised and realised gains and losses, are included in financial income and expenses in the period in which they occur. Financial assets at fair value through profit and loss are presented under the other current assets in the balance sheet.
Held-to-maturity investments are assets with a fixed maturity, which the enterprise has the positive intent and ability to hold to maturity. Held-to-maturity assets are measured at amortised cost using the effective interest rate method. The Group did not have any held-to-maturity investments during the financial period.
Loans and receivables are non-derivative assets with fixed or determinable payment dates that are not quoted in the active markets or held for trading purposes. Loan and receivables are measured at amortised cost. Accounts receivable are carried at expected fair value, which is the original invoice amount less the provision made for impairment of these receivables. A provision for impairment of accounts receivable is established when there is objective evidence that the Group will not be able to collect all amounts due according to the original terms of receivables. Significant financial difficulties of the debtor, the probable bankruptcy of the debtor or default in payments are considered as probable indicators of the impairment of accounts receivable. Impairment of a loan receivable is assessed with the same criteria as an impairment of accounts receivable.
Available-for-sale financial assets consist of holdings in listed and non-listed companies and investments. Available-for-sale assets are measured at fair value based on market prices on the balance sheet date, or using the net present value method of cash flows, or another revaluation model. If the fair value of a holding or investment cannot be measured reliably, it will be measured at cost. Changes in the fair value of available-for-sale assets are recognised in the fair value reserve under shareholders’ equity, taking tax consequences into account. Changes in the fair value will be re-entered from sharehold-ers’ equity into the consolidated statement of comprehensive income when the asset is disposed of or has lost its value to the extent that an impairment loss must be recognised.
Financial liabilitiesFinancial liabilities at fair value through profit and loss are measured at their fair value. This group includes those derivatives for which hedge accounting is not applied and whose fair value is negative.
Other financial liabilities are initially measured at fair value and subsequently measured at amortised cost using the effective interest rate method. Transaction costs are included in the original book value of financial liabilities. Other financial liabilities include non-current and current interest-bearing liabilities and accounts payable.

Uponor Annual Report 2017 – Notes to the consolidated financial statements • 69
Derivative contracts and hedge accountingFinancial derivatives are used for hedging purposes and are initially recognised in the balance sheet at fair value and are subsequently re-measured at fair value on each reporting period’s balance sheet date. At the contract date derivatives are classified as either cash flow hedges, hedges of net investments in foreign entities or hedges that hedge accounting is not applied to. For derivatives that hedge accounting is not applied to the changes in fair value are recognised under financial items in the consolidated statement of comprehensive income. The fair values of derivatives are determined on the basis of publicly quoted market prices.
Cash flow hedging is applied to electricity derivatives and interest rate derivatives. Net investment hedging is applied to certain currency derivatives that hedge foreign currency risk in internal loans classified as net investments in foreign entities. Hedge programmes are docu-mented according to the requirements of IAS 39, and the efficiency of hedge accounted derivatives is tested both at the inception of, and during, the hedge.
Fair value changes of derivatives, which are designated as cash flow hedges, are recognised in other comprehensive income in the hedge reserve to the extent that the hedge is effective. The spot price part of the fair value changes of currency derivatives designated as hedges of net investment in foreign entities, are recognised in other comprehensive income in the translation differences whereas the interest rate differential part of the fair value changes is recognised under financial items. Accumulated fair value changes in other comprehensive income are released into the consolidated statement of comprehensive income in the period during which the hedged cash flow affects the result, while electricity derivatives are recognised under cost of goods sold and interest rate derivatives under financial items.
The ineffective portion of the fair value change of cash flow hedges is recognised under cost of goods sold for electricity derivatives and under financial items for interest rate derivatives.
Share-based payments – Management incentive schemeThe costs relating to share-based payments are recorded in the income statement and the corresponding liability for share-based payments settled in cash is deferred. The recognised liability is measured at fair value on every balance sheet date. For equity-settled share-based payment transactions, an increase corresponding to the expensed amount is recorded in equity.
Treasury sharesTreasury shares are presented in the financial statements as a reduc-tion in shareholders’ equity. Treasury shares are taken into account in calculating key figures and ratios according to IAS 33.
DividendsDividends proposed by the Board of Directors are not recognised in the financial statements until their proposal is approved by the shareholders in the Annual General Meeting.
Accounting policies requiring consideration by management and essential uncertainty factors associated with estimatesEstimates and assumptions regarding the future must be made during the preparation of the financial statements, and the outcome may dif-fer from the estimates and assumptions. Furthermore, the application of accounting principles requires consideration.
Group management needs to make decisions regarding the selec-tion and application of accounting principles. These judgements are in particular required in those cases in which the IFRS in force provide the opportunity to choose between various accounting, valuation or presentation methods.
The estimates made in connection with preparing the financial statements reflect the management’s best view at the time of the closing of the accounts. These estimates are affected by historical experience and assumptions regarding future developments, which are regarded as well-founded at the time of closing the accounts. On a regular basis, the Group monitors the realisation of these estimates and assumptions through internal and external information sources. Any changes in estimates and assumptions are recognised in the financial statements for the period during which such corrections are made, and all subsequent financial periods.
Estimates have been used in determining the size of items reported in the financial statements, including, among other things, the realisability of certain asset items, such as deferred tax assets and other receivables, the economic useful life of property, plant and equipment, provisions, pension liabilities and impairment on goodwill.
From the Group’s perspective, the most significant uncertainty factors are related to impairment testing on goodwill and the defined benefit-based pension obligations. The application of the related accounting policies requires the use of estimates and assumptions that also have a large impact. Uncertainty factors in connection with impairment testing on goodwill relate to the assumptions made on future cash flows and determining the discount rate. The Group’s weighted average capital cost rate (WACC), determined by reporting segment, is used as the discount rate in impairment tests. The book value of the defined benefit-based pension obligation is based on actuarial calculations, which in turn are based on the assumptions and estimates of a discount rate used for assessing plan assets and obligations at their current value, the expected rate of return on plan assets and developments in inflation, salary and wage levels.
Items affecting comparabilityItems affecting comparability are exceptional transactions that are not related to normal business operations. The most common items affecting comparability are capital gains and losses, inefficiencies in production related to plant closures, additional write-downs, or reversals of write-downs, expenses due to accidents and disasters, provisions for planned restructurings, environmental matters, penal-ties, and changes in legislation and legal proceedings. The Group’s management exercises its discretion when taking decisions regarding the classification of items affecting comparability.
New and amended IFRSs and Interpretations adopted in 2017The following new and revised IFRSs have been adopted from 1 January 2017 in these consolidated financial statements. The applica-tion of these new and revised IFRSs has not had any material impact

70 • Uponor Annual Report 2017 – Notes to the consolidated financial statements
on the amounts reported for the current and prior years but may affect the accounting for future transactions and events.• Amendments to IAS 7 Disclosure Initiative. The amendments
require an entity to provide disclosures that enable users of financial statements to evaluate changes in liabilities arising from financing activities, including both cash and non-cash changes. The Group’s liabilities arising from financing activities consist of borrowings and certain other financial liabilities (note 23). A reconciliation between the opening and closing balances of these items is provided in note 23. Apart from the additional disclosure in note 23, the application of these amendments has had no impact on the Group’s consolidated financial statements.
• Amendments to IAS 12 Recognition of Deferred Tax Assets for Unrealised Losses. The amendments clarify how an entity should evaluate whether there will be sufficient taxable profits against which it can utilise a deductible temporary difference. The application of these amendments has had no impact on the Group’s consolidated financial statements as the Group already assesses the sufficiency of future taxable profits in a way that is consistent with these amendments.
• Annual Improvements to IFRSs 2014–2016 Cycle. In the annual improvement process, the non-urgent but necessary amendments to IFRS are collected and issued annually. The nature of the improvements depends on the standards, but they do not have material impact on the consolidated financial statements. The Group has applied the amendments to IFRS 12 included in this Annual Improvements to IFRSs Cycle in the current year. The other amendments included in this package are not yet mandatorily effective and they have not been earlier adopted by the Group (see note on standards not yet effective). IFRS 12 states that an entity need not provide summarised financial information for interests in subsidiaries, associates or joint ventures that are classified (or included in a disposal group that is classified) as held for sale. The amendments clarify that this is the only concession from the disclosure requirements of IFRS 12 for such interests. The application of these amendments has had no effect on the Group’s consolidated financial statements as none of the Group’s interests in these entities are classified, or included in a disposal group that is classified, as held for sale.
Application of new and revised IFRSs in issue but not yet effectiveIASB has published the following new or revised standards which the Group has not yet adopted. The Group will adopt each standard as from the effective date, or if the effective date is other than the first day of the reporting period, from the beginning of the next reporting period after the effective date. The effects of these new and amended standards are under investigation, unless otherwise stated below.
• IFRS 9 Financial Instruments (effective in the EU for annual periods beginning on or after 1 January 2018). IFRS 9 issued in November 2009 introduced new requirements for the classification and measurement of financial assets. IFRS 9 was subsequently amended in October 2010 to include requirements for the classification and measurement of financial liabilities and for derecognition, and in November 2013 to include the new
requirements for general hedge accounting. Another revised version of IFRS 9 was issued in July 2014 mainly to include a) impairment requirements for financial assets and b) limited amendments to the classification and measurement requirements by introducing a ‘fair value through other comprehensive income’ (FVTOCI) measurement category for certain simple debt instruments.
Key requirements of IFRS 9:• all recognised financial assets that are within the scope of IFRS
9 are required to be subsequently measured at amortised cost or fair value. Specifically, debt investments that are held within a business model whose objective is to collect the contractual cash flows, and that have contractual cash flows that are solely payments of principal and interest on the principal outstanding are generally measured at amortised cost at the end of subsequent accounting periods. Debt instruments that are held within a business model whose objective is achieved both by collecting contractual cash flows and selling financial assets, and that have contractual terms that give rise on specified dates to cash flows that are solely payments of principal and interest on the principal amount outstanding, are generally measured at FVTOCI. All other debt investments and equity investments are measured at their fair value at the end of subsequent accounting periods. In addition, under IFRS 9, entities may make an irrevocable election to present subsequent changes in the fair value of an equity investment (that is not held for trading nor contingent consideration recognised by an acquirer in a business combination to which IFRS 3 applies) in other comprehensive income, with only dividend income generally recognised in profit or loss.
• with regard to the measurement of financial liabilities designated as at fair value through profit or loss, IFRS 9 requires that the amount of change in the fair value of a financial liability that is attributable to changes in the credit risk of that liability is presented in other comprehensive income, unless the recognition of such changes in other comprehensive income would create or enlarge an accounting mismatch in profit or loss. Changes in fair value attributable to a financial liability’s credit risk are not subsequently reclassified to profit or loss. Under IAS 39, the entire amount of the change in the fair value of the financial liability designated as fair value through profit or loss is presented in profit or loss.
• in relation to the impairment of financial assets, IFRS 9 requires an expected credit loss model, as opposed to an incurred credit loss model under IAS 39. The expected credit loss model requires an entity to account for expected credit losses and changes in those expected credit losses at each reporting date to reflect changes in credit risk since initial recognition. In other words, it is no longer necessary for a credit event to have occurred before credit losses are recognised.
• the new general hedge accounting requirements retain the three types of hedge accounting mechanisms currently available in IAS 39. Under IFRS 9, greater flexibility has been introduced to the types of transactions eligible for hedge accounting, specifically broadening the types of instruments that qualify for hedging instruments and the types of risk

Uponor Annual Report 2017 – Notes to the consolidated financial statements • 71
components of non-financial items that are eligible for hedge accounting. In addition, the effectiveness test has been overhauled and replaced with the principle of an ‘economic relationship’. Retrospective assessment of hedge effectiveness is also no longer required. Enhanced disclosure requirements about an entity’s risk management activities have also been introduced.
Uponor will apply the IFRS 9 standard as of the financial period starting on January 1, 2018. Based on an analysis of the Group’s financial assets and financial liabilities as at 31 December 2017 on the basis of the facts and circumstances that exist at that date, Group management have assessed the impact of IFRS 9 to the Group’s consolidated financial statements. Uponor does not expect the application of IFRS 9 to have a material impact on financial performance nor financial position of the company.
Classification and measurement All financial assets and financial liabilities will continue to be
measured on the same bases as is currently adopted under IAS 39. According to IFRS 9 financial assets will be classified in three measurement categories: fair value through other comprehensive income, at amortised cost, and fair value through profit or loss instead of IAS 39’s four categories. The classification depends on the company’s business model and cash flow characteristics in financial assets.
Impairment Financial assets measured at amortised cost, listed redeemable
notes that will be carried at FVTOCI under IFRS 9, finance lease receivables, amounts due from customer under construction contracts, and financial guarantee contracts will be subject to the impairment provisions of IFRS 9. The Group expects to apply the simplified approach to recognize lifetime expected credit losses for its trade receivables as required or permitted by IFRS 9.
Hedge accounting As the new hedge accounting requirements will align more closely
with the Group’s risk management policies, with generally more qualifying hedging instruments and hedged items, an assessment of the Group’s current hedging relationships indicates that they will qualify as continuing hedging relationships upon application of IFRS 9. Additionally, the requirements for hedge effectiveness testing will become easier. Similar to the Group’s current hedge accounting policy, the management does not intend to exclude the forward element of foreign currency forward contracts from designated hedging relationships. IFRS 9 requires the economic relationship between the hedged item and the hedging instrument and same hedge ratio that is actually used in risk management. Moreover, the Group has already elected to basis adjust non-financial hedged items with gains/losses arising from effective cash flow hedges under IAS 39, which is mandatory under IFRS 9. Documentation requirements differ from IAS 39 requirements, but are still mandatory under IFRS 9.
Nevertheless, under IFRS 9, basis adjustments are not considered a reclassification adjustment and therefore they would
not affect other comprehensive income. Currently, gains/losses arising from effective cash flow hedges that are subject to basis adjustments are presented in other comprehensive income as amounts that may be subsequently reclassified to profit or loss.
• IFRS 15 Revenue from Contracts with Customers (effective in the EU for annual periods beginning on or after 1 January 2018). IFRS 15 establishes a single comprehensive model for entities to use in accounting for revenue arising from contracts with customers. IFRS 15 will supersede the current revenue recognition guidance including IAS 18 Revenue, IAS 11 Construction Contracts and the related interpretations when it becomes effective. The core principle of IFRS 15 is that an entity should recognise revenue to depict the transfer of promised goods or services to customers in an amount that reflects the consideration to which the entity expects to be entitled in exchange for those goods or services. Under IFRS 15, an entity recognises revenue when (or as) a performance obligation is satisfied, i.e. when ‘control’ of the good or service underlying the particular performance obligation is transferred to the customer. Furthermore, IFRS 15 requires extensive disclosures.
The principles in IFRS 15 are applied using the following five steps:
1. Identify the contract(s) with a customer 2. Identify the performance obligations in the contract 3. Determine the transaction price 4. Allocate the transaction price to the performance
obligations in the contract 5. Recognise revenue
The Group will adopt the new standard IFRS 15 Revenue from customer contracts as of January 1, 2018. The Group will adopt the new standard using the full retrospective method. During 2017, the Group performed an assessment of IFRS 15 impacts and as a result, no significant accounting changes were identified and are not expected. However, impact on processes, controls and agreements has been considered.
The Group’s revenue streams and impact of implementing IFRS 15
Revenue streams, sale of goods and rendering of services including project business, were analysed based on the Group’s reporting segments presented in the segment information note 2. The Group’s most significant revenue stream is sale of goods representing approximately 96% of the total revenue.
In connection with the contract analysis the Group identified certain customers and contracts that were affected. However, the impacts are not significant and some minor updates on processes, controls and agreements have been adopted. Each revenue stream will be described separately below and additionally, the impacts will be discussed step by step.
• Sale of goods The Group is delivering goods to the customer where each good provided to the customer is distinct from the other goods provided to the customer.

72 • Uponor Annual Report 2017 – Notes to the consolidated financial statements
The Step 1 of IFRS 15 revenue recognition model starts with identifying the contract to provide goods and services to customers. Based on the IFRS 15 assessment, the Group will not have any changes compared to the current practice for identifying the contracts with customers. A typical contract with the customer consists of a frame agreement and a purchase order. Accordingly, only frame agreements do not meet the contract criteria in accordance with IFRS 15 and to establish a customer contract a separate purchase order is always required for sale of goods as the customer commitment is received only after receiving the purchase order.
The Step 2 of IFRS 15 revenue recognition model consists of identifying performance obligations in the contract. According to IFRS 15, a performance obligation is a promise (explicit or implicit) to transfer to a customer either a distinct good or service or a series of distinct goods or services that are substantially the same and have the same pattern of transfer. Based on the assessment, the Group delivers goods to the customer and each good is considered distinct from the other goods provided to the customer. The Group will not have any significant changes compared to the current practice.
The Step 3 of IFRS 15 revenue recognition model consists of determining the transaction price. The basis for the new requirements for determining the transaction price is the amount to which the Group expects to be entitled in exchange for transferring promised goods or services to a customer. Transaction price may vary because of variable consideration. IFRS 15 requires the variable consideration to be estimated at contract inception and constrained to prevent over-recognition of revenue. The application of the constraint will not have a significant impact in terms of revenue recognition as variable considerations in the sale of goods are immaterial and for instance annual bonuses are already treated in accordance with IFRS 15 requirements.
The Step 4 of IFRS 15 revenue recognition model requires entities to allocate the transaction price to the performance obligations after having determined the separate performance obligations and the transaction price in previous phases (Step 2 and Step 3, respectively). Based on the assessment, there are no expected changes that would take a place in terms of allocating the transaction price to the performance obligations in the contracts.
The Step 5 of IFRS 15 revenue recognition model sets out the criteria when to recognise revenue. The Group has assessed that the revenue recognition will take place at a point in time generally when the goods are delivered to the customer and the customer has accepted the delivery and the control over the good is transferred to the customer. The exact timing of the control transfer will be analysed contract by contract taking into account the delivery terms, customer acceptance clauses and customer’s ability to benefit from the goods delivered. There are no expected changes compared to the Group’s current practice.
• Rendering of services including project businessRendering of services including project business represents approximately 4% of the total revenue of the Group Typically the promised goods and services in the contract are not distinct from each other and therefore, in most of the cases the Group accounts for the goods and services as a single performance obligation.
Step 1. Based on the IFRS 15 assessment, the Group does not expect to have any changes compared to the current practice for identifying the contracts with customers. However, some impact on processes and controls has been considered. Combining contracts: IFRS 15 requires entities to analyse whether individual contracts should be combined for the purposes of revenue recognition. Based on the assessment, the revenue recognition model will be applied in most cases to individual contracts with a customer. However, there are some occasions where the Group has entered into two contracts near the same time with the same customer. As the contracts have been negotiated as a package with a single commercial objective they will be combined for the revenue recognition purposes. However, the impact of this change is insignificant and it will not impact on the comparison figures for 2017.
Step 2. Based on the assessment in most of the cases the performance obligations will remain unchanged. There are, however, certain occasions where goods or services currently treated separately will need to be combined into one performance obligation. As a result, there will not be any significant changes compared to the current practice. Warranties: IFRS 15 distinguishes between two types of warranties. Assurance-type of warranty promises the customer that the deliverable is as specified in the contract whereas service-type warranty provides a service to the customer in addition to assurance that the deliverable is as specified in the contract. Based on the assessment, the Group has not identified any changes in terms of revenue recognition as extended warranties are considered immaterial.
Step 3. Variable consideration: Based on the assessment, the Group’s contracts may include variable considerations relating to penalties for delay. The Group does not expect that application of the constraint will have an impact in terms of revenue recognition as variable considerations (i.e. penalties) are immaterial and the likelihood is very minor.
Step 4. Based on the assessment, there are no expected changes that would take a place in terms of allocating the transaction price to the performance obligations in the contracts.
Step 5. The Group has assessed that the rendered services including project business are satisfied over time given that the Group’s performance does not create an asset with an alternative use to the Group, the Group has an enforceable right to payment for performance completed to date or Group’s performance creates or enhances an asset that the customer

Uponor Annual Report 2017 – Notes to the consolidated financial statements • 73
controls as the asset is created or enhanced. The Group has not identified any significant changes in terms of the revenue recognition and no changes will take place regarding the comparison figures for 2017.
Presentation and disclosure requirements The presentation and disclosure requirements in IFRS 15
are more detailed than under current IFRS. The presentation requirements represent a significant change from current practice and significantly increases the volume of disclosures required in the Group’s financial statements. Many of the disclosure requirements in IFRS 15 are new and the Group has assessed that the impact of some of the disclosures will be significant. Also, extended disclosures are expected as a result of the significant judgement made when assessing the contracts. In addition, as required by IFRS 15, the Group will disaggregate revenue recognised from contracts with customers into categories that depict how the nature, amount, timing and uncertainty of revenue and cash flows are affected by economic factors. In 2017, the Group continued testing of appropriate systems, internal controls, policies and procedures necessary to collect and disclose the required information.
• IFRS 16 Leases (effective for annual periods beginning on or after 1 January 2019). IFRS 16 provides a comprehensive model for the identification of lease arrangements and their treatment in the financial statements of both lessees and lessors. It will supersede the current guidance including IAS 17 Leases and the related interpretations when it becomes effective. IFRS 16 distinguishes leases and service contracts on the basis of whether an identified asset is controlled by a customer. Distinction of operating leases (off balance sheet) and finance leases (on balance sheet) are removed for lessee accounting, and is replaced by a model where a right-of-use asset and a corresponding liability have to be recognised for all leases by lessees (i.e. all on balance sheet) except for short-term leases and leases of low value assets. In contrast to lessee accounting, IFRS 16 substantially carries forward the lessor accounting requirements in IAS 17, and continues to require a lessor to classify a lease either as an operating lease or a finance lease. Furthermore, extensive disclosure are required by IFRS 16.
The Group will adopt the new standard IFRS 16 Leases as of January 1, 2019. The Group considers adopting the new standard using the modified retrospective application method. Under modified retrospective approach:• Lessee does not restate comparative figures• For leases previously classified as operating leases under
IAS 17, a lessee recognises a lease liability measured at the present value of the remaining lease payments, discounted using the lessee’s incremental borrowing rate at the date of initial application
• A lessee measures the right-of use asset on a lease-by-lease basis, at either an amount equal to lease liability or as if standard always has been applied, but using a discount rate based on the lessee’s incremental borrowing rate at the date of initial application
During 2017, the impact on Group’s consolidated financial statements by the new requirement to recognise a right-of-use asset and a related lease liability were analysed on a high-level. Based on the assessment, the right-of-use assets of the Group will consist mainly of real estate (offices and warehouses including land area), cars and forklifts. The Group has not identified any service-type of contracts that would include identified right-of-use asset. Thus, the operating lease commitments mentioned in Note 26 will cover, for the most part, the lease arrangements that will be recognized as right-of use assets in the future. The impact analysis and implementation considerations including possible development of contract database, investment process and controls as well as systems will continue during 2018.
• Amendments to IFRS 2 Classification and Measurement of Share-based Payment Transactions (effective for annual periods beginning on or after 1 January 2018). The amendments clarify the following:• In estimating the fair value of a cash-settled share-based
payment, the accounting for the effects of vesting and non-vesting conditions should follow the same approach as for equity-settled share-based payments.
• Where tax law or regulation requires an entity to withhold a specified number of equity instruments, equal to the monetary value of the employee’s tax obligation, to meet the employee’s tax liability, which is then remitted to the tax authority, i.e. the share-based payment arrangement has a “net settlement feature”. Such an arrangement should be classified as equity-settled in its entirety, provided that the share-based payment would have been classified as equity-settled had it not included the net settlement feature.
• A modification of a share-based payment that changes the transaction from cash-settled to equity-settled should be accounted for as follows:- the original liability is derecognised;- the equity-settled share-based payment is recognised at the modification date fair value of the equity instrument granted to the extent that services have been rendered up to the modification date; and- any difference between the carrying amount of the liability at the modification date and the amount recognised in equity should be recognised in profit or loss immediately.
The application of the amendments in the future is not anticipated to have a significant impact on the Group’s consolidated financial statements. The amendments have not yet been endorsed for use in the EU.
• Annual Improvements to IFRSs 2014–2016 Cycle (effective for annual periods beginning on or after as indicated below). The Annual Improvements include amendments to a number of IFRSs which are not yet mandatorily effective for the Group. They are summarised below. The package also includes amendments to IFRS 12 which is mandatorily effective for the Group in the current year.• The amendments to IFRS 1 delete certain short-term
exemptions in IFRS 1 because they are redundant.

74 • Uponor Annual Report 2017 – Notes to the consolidated financial statements
• The amendments to IAS 28 clarify that the option for a venture capital organisation and other similar entities to measure investments in associates and joint ventures at FVTPL is available separately for each associate or joint venture, and that election should be made at initial recognition of the associate or joint venture. In respect of the option for an entity that is not an investment entity (IE) to retain the fair value measurement applied by its associates and joint ventures that are IEs when applying the equity method, the amendments make a similar clarification that this choice is available for each IE associate or IE joint venture. The amendments apply retrospectively with earlier application permitted.
Both sets of amendments are effective for annual periods beginning on or after 1 January 2018. The amendments have not yet been endorsed for use in the EU. The application of the amendments in the future is not anticipated to have any impact on the Group’s consolidated financial statements as the Group is not a first-time adopter of IFRS or a venture capital organisation. Furthermore, the Group does not have any associate or joint venture that is an investment entity
• Amendments to IAS 40 Transfers of Investment Property (effective for annual periods beginning on or after 1 January 2018). The amendments clarify that a transfer to, or from, investment property necessitates an assessment of whether a property meets, or has ceased to meet, the definition of investment property, supported by observable evidence that a change in use has occurred. The amendments further clarify that situations other than the ones listed in IAS 40 may evidence a change in use, and that a change in use is possible for properties under construction (i.e. a change in use is not limited to completed properties). Entities can apply the amendments either retrospectively (if this is possible without the use of hindsight) or prospectively. Specific transition provisions apply. The amendments have not yet been endorsed for use in the EU. The application of these amendments is anticipated to have an impact on the Group’s consolidated financial statements in future periods should there be a change in use of any of its properties.
• IFRIC Interpretation 22 Foreign Currency Transactions and Advance Consideration (effective for annual periods beginning on or after 1 January 2018). IFRIC 22 addresses how to determine ”the date of the transaction” for the purpose of determining the exchange rate to use on initial recognition of an asset, expense or income, when consideration for that item has been paid or received in advance in a foreign currency which resulted in the recognition of a non-monetary asset or non-monetary liability (e.g. a non-refundable deposit or deferred revenue). The Interpretation specifies that the date of transaction is the date on which the entity initially recognises the non-monetary asset or non-monetary liability arising from the payment or receipt of advance consideration. If there are multiple payments or receipts in advance, the Interpretation requires an entity to determine the date of transaction for each payment or receipt of advance consideration. Entities can apply the Interpretation either retrospectively or prospectively. Specific transition provisions apply
to prospective application. The interpretation has not yet been endorsed for use in the EU. The application of the amendments in the future is not anticipated to have an impact on the Group’s consolidated financial statements. This is because the Group already accounts for transactions involving the payment or receipt of advance consideration in a foreign currency in a way that is consistent with the amendments.
• IFRIC 23 Uncertainty over Income Tax Treatments (effective for annual periods beginning on or after 1 January 2019). The interpretation addresses the determination of taxable profit (tax loss), tax bases, unused tax losses, unused tax credits and tax rates, when there is uncertainty over income tax treatments under IAS 12. It specifically considers:• Whether tax treatments should be considered collectively• Assumptions for taxation authorities’ examinations• The determination of taxable profit (tax loss), tax bases,
unused tax losses, unused tax credits and tax rates• The effect of changes in facts and circumstances
Early adoption of the interpretation is permitted. The interpretation has not yet been endorsed for use in the EU. The Group is currently assessing the impact of the interpretation on the consolidated financial statements of the Group.
• Amendments to IFRS 9 Prepayment Features with Negative Compensation (effective for annual periods beginning on or after 1 January 2019). The amendments will change the existing requirements in IFRS 9 regarding termination rights in order to allow measurement at amortized cost (or, depending on the business model, at fair value through other comprehensive income) even in the case of negative compensation payments. The amendments are to be applied retrospectively and early application is permitted. The amendments have not yet been endorsed for use in the EU. The Group is currently assessing the impact of the amendments on the consolidated financial statements of the Group.
• Amendments to IAS 28 Long-term Interests in Associates and Joint Ventures (effective for annual periods beginning on or after 1 January 2019). The amendments clarify that an entity applies IFRS 9 “Financial Instruments” to long-term interests in an associate or joint venture that form part of the net investment in the associate or joint venture but to which the equity method is not applied. Earlier application of the amendments is permitted. The amendments have not yet been endorsed for use in the EU. The Group is currently assessing the impact of the amendments on the consolidated financial statements of the Group.
• Annual Improvements to IFRS Standards 2015–2017 Cycle (effective for annual periods beginning on or after 1 January 2019). The improvements make amendments to the following standards:• IFRS 3 and IFRS 11 – The amendments to IFRS 3 clarify
that when an entity obtains control of a business that is a joint operation, it remeasures previously held interests in that business. The amendments to IFRS 11 clarify that when an entity obtains joint control of a business that is a joint operation,

Uponor Annual Report 2017 – Notes to the consolidated financial statements • 75
the entity does not remeasure previously held interests in that business.
• IAS 12 – The amendments clarify that all income tax consequences of dividends (i.e. distribution of profits) should be recognized in profit or loss, regardless of how the tax arises.
• IAS 23 – The amendments clarify that if any specific borrowing remains outstanding after the related asset is ready for its intended use or sale, that borrowing becomes part of the funds that an entity borrows generally when calculating the capitalization rate on general borrowings.
The Group is currently assessing the impact of the amendments on the consolidated financial statements of the Group. The amendments have not yet been endorsed for use in the EU.
• IFRS 17 Insurance Contracts (effective for annual periods beginning on or after 1 January 2021). IFRS 17 requires insurance liabilities to be measured at a current fulfillment value and provides a more uniform measurement and presentation approach for all insurance contracts. These requirements are designed to achieve the goal of a consistent, principle-based accounting for insurance contracts. The standard supersedes IFRS 4 “Insurance Contracts” and is to be applied retrospectively unless impracticable. Earlier adoption permitted if both IFRS 15 and IFRS 9 have also been applied. The standard has not yet been endorsed for use in the EU. The Group is currently assessing the impact of the amendments on the consolidated financial statements of the Group.
• Amendments to IFRS 10 and IAS 28 Sale or Contribution of Assets between an Investor and its Associate or Joint Venture. The amendments to IFRS 10 and IAS 28 deal with situations where there is a sale or contribution of assets between an investor and its associate or joint venture. Specifically, the amendments state that gains or losses resulting from the loss of control of a subsidiary that does not contain a business in a transaction with an associate or a joint venture that is accounted for using the equity method, are recognised in the parent’s profit or loss only to the extent of the unrelated investors’ interests in that associate or joint venture. Similarly, gains and losses resulting from the re-measurement of investments retained in any former subsidiary (that has become an associate or a joint venture that is accounted for using the equity method) to fair value are recognised in the former parent’s profit or loss only to the extent of the unrelated investors’ interests in the new associate or joint venture. The effective date of the amendments has yet to be set by the IASB; however, earlier application of the amendments is permitted. The application of these amendments is anticipated to have an impact on the Group’s consolidated financial statements in future periods should such transactions arise.
2. Segment information
Uponor’s segment structure is based on business and geographical segments in accordance with the organisational structure. The report-ing segments are Building Solutions – Europe, Building Solutions – North America and Uponor Infra. The business risks and profitability factors differ from each other with respect to the market and business
environments, product offering, services and customers. The Group’s management, control and reporting structures are organised by business segment. The reported segments are specified as operating segments, which have not been combined.
Building Solutions – Europe is in charge of the European markets, Asia and sales to such non-European countries in which Uponor does not have its own operations. Building Solutions – North America is responsible for business operations in the USA and Canada. Build-ing solutions in Uponor mainly refers to indoor climate and plumbing solutions for residential and non-residential buildings. A major part of the building solutions customers are heating, ventilation and air conditioning (HVAC) professionals, such as installers and building companies.
Uponor Infra specialises in municipal infrastructure pipe systems business in Northern Europe and it has also business in Central Europe and North America. Its products and services, such as sewer and storm water systems and waste water treatment systems and project services are sold to municipalities, utilities and pipeline construction and renova-tion customers.
The “Others” segment includes Group functions. As of the beginning of 2017 non-operative companies have been transferred from the seg-ment Others to the segments Building Solutions – Europe and Building Solutions – North America, causing a change in elimination of internal receivables and liabilities and presentation of segment assets and liabilities. The comparable data have been adjusted accordingly.
Financial target setting and monitoring mainly focus on figures for segment sales, operating profit, operative costs and net working capital. Group resources are managed, for instance, by allocating investments to attractive businesses and balancing human resources and competencies to match the requirements of business processes.
Segment reporting is based on the Group accounting principles. All transactions between segments are market-based and internal sales and margins are eliminated from consolidated figures.
The segment revenue equals to the net sales and the segment result equals to the operating profit presented in the condensed consolidated income statement. The income statement consists of continuing opera-tions by segment, while balance sheet items match the Group structure on the closing dates. Continuing operations do not include the infrastruc-ture business in Ireland, which was sold in June 2008.
Segment assets include items directly attributable to a segment and items which can be allocated on a reasonable basis. These are mainly non-interest bearing items such as intangible assets, property, plant and equipment, inventories, accruals, accounts receivables and other receivables.
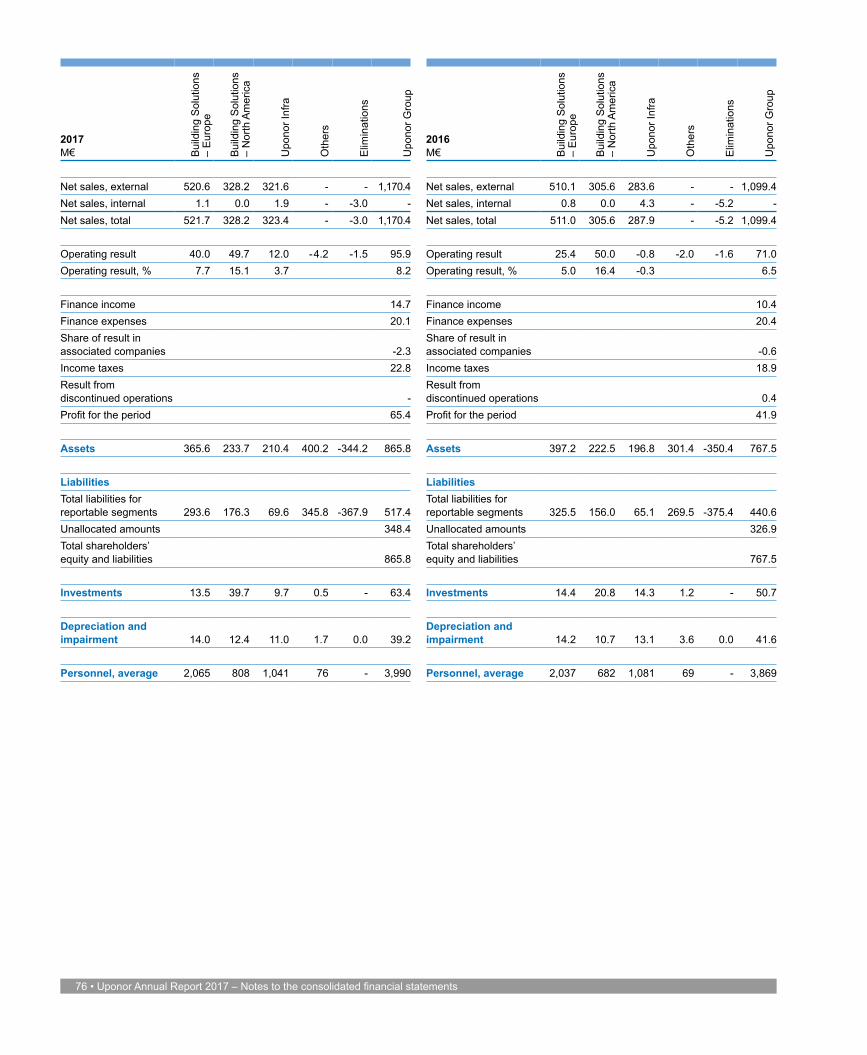
76 • Uponor Annual Report 2017 – Notes to the consolidated financial statements
2017M€ B
uild
ing
Sol
utio
ns
– E
urop
e
Bui
ldin
g S
olut
ions
–
Nor
th A
mer
ica
Upo
nor I
nfra
Oth
ers
Elim
inat
ions
Upo
nor G
roup
Net sales, external 520.6 328.2 321.6 - - 1,170.4Net sales, internal 1.1 0.0 1.9 - -3.0 -Net sales, total 521.7 328.2 323.4 - -3.0 1,170.4
Operating result 40.0 49.7 12.0 -4.2 -1.5 95.9Operating result, % 7.7 15.1 3.7 8.2
Finance income 14.7Finance expenses 20.1Share of result in associated companies -2.3Income taxes 22.8Result from discontinued operations -Profit for the period 65.4
Assets 365.6 233.7 210.4 400.2 -344.2 865.8
LiabilitiesTotal liabilities for reportable segments 293.6 176.3 69.6 345.8 -367.9 517.4Unallocated amounts 348.4Total shareholders’ equity and liabilities 865.8
Investments 13.5 39.7 9.7 0.5 - 63.4
Depreciation and impairment 14.0 12.4 11.0 1.7 0.0 39.2
Personnel, average 2,065 808 1,041 76 - 3,990
2016M€ B
uild
ing
Sol
utio
ns
– E
urop
e
Bui
ldin
g S
olut
ions
–
Nor
th A
mer
ica
Upo
nor I
nfra
Oth
ers
Elim
inat
ions
Upo
nor G
roup
Net sales, external 510.1 305.6 283.6 - - 1,099.4Net sales, internal 0.8 0.0 4.3 - -5.2 -Net sales, total 511.0 305.6 287.9 - -5.2 1,099.4
Operating result 25.4 50.0 -0.8 -2.0 -1.6 71.0Operating result, % 5.0 16.4 -0.3 6.5
Finance income 10.4Finance expenses 20.4Share of result in associated companies -0.6Income taxes 18.9Result from discontinued operations 0.4Profit for the period 41.9
Assets 397.2 222.5 196.8 301.4 -350.4 767.5
LiabilitiesTotal liabilities for reportable segments 325.5 156.0 65.1 269.5 -375.4 440.6Unallocated amounts 326.9Total shareholders’ equity and liabilities 767.5
Investments 14.4 20.8 14.3 1.2 - 50.7
Depreciation and impairment 14.2 10.7 13.1 3.6 0.0 41.6
Personnel, average 2,037 682 1,081 69 - 3,869

Uponor Annual Report 2017 – Notes to the consolidated financial statements • 77
Entity-wide information
Information about product and services
M€ 2017 2016External net sales, continuing operationsBuilding Solutions 848.7 815.3Infrastructure Solutions 321.6 284.1Uponor Group 1,170.4 1,099.4
Information about geographical areas
M€ 2017 2016External net sales, continuing operationsUnited States 308.0 276.0Germany 154.5 161.1Finland 120.5 123.1Sweden 113.0 99.6Canada 100.6 80.7Denmark 49.8 48.9Netherlands 41.5 39.5Spain 37.4 34.7Norway 30.0 29.7Russian Federation 23.7 18.9Others 191.3 187.0Uponor Group 1,170.4 1,099.4
M€ 2017 2016Non-current assetsUnited States 122.1 112.0Sweden 40.5 36.4Finland 39.0 49.5Germany 36.4 35.3Canada 15.1 11.8Others 41.6 55.9Uponor Group 294.7 300.9
External net sales are presented in accordance with the geographi-cal location of the customers. Non-current assets are presented in accordance with the geographical location of the assets. Non-current assets do not include goodwill and deferred tax asset.
3. Business combinations
There were no acquisitions of subsidiaries or businesses in 2017.On 4 January 2016, Uponor Holding GmbH closed the acquisition
of all of the shares in the German companies, Delta Systemtechnik GmbH and the KaMo Group, as announced on 30 November, 2015. KaMo Group consisted of the companies: KaMo Frischwarmwasser-systeme GmbH, KaMo Verteilersysteme GmbH and Morlok Betriebs-gesellschaft mbH which were merged in 2017. Delta Systemtechnik produces fresh water units for central domestic hot water systems as well as heating transfer stations and components for hot water and
heating systems. KaMo develops and distributes systems for local and central heating and domestic hot water preparation. This acquisi-tion aimed at broadening Uponor’s portfolio and competencies in the increasingly important hygienic drinking water delivery sector. The companies are included in the segment Building Solutions – Europe.
M€ 2017 2016Recognised amounts of identifiable net assets acquired and liabilities assumedProperty, plant and equipment - 3.7Intangible assets - 19.8Inventories - 5.5Accounts receivable and other receivables - 5.7Cash and cash equivalents - 1.1Total assets - 35.8
Non-current interest-bearing liabilities - 3.3Deferred tax liability - 5.7Provisions - 0.7Current interest-bearing liabilities - 0.4Accounts payable and other current liabilities - 4.3Total liabilities - 14.4
Net assets - 21.4
Consideration - 32.5Acquired net assets - -21.4Goodwill - 11.1
M€ 2017 2016Cash flow effectAcquisition cost - 32.5Received in cash and cash equivalents - -1.1Cash flow effect - 31.4
The consideration of €32.5 million represents the entire determined fair value of Delta Systemtechnik GmbH and the KaMo Group. The estimate was done by applying an income approach and a market approach. The fair value measurement is based on significant inputs that are not observable in the market, which IFRS 13 Fair Value Measurement refers to as Level 3 inputs.
The goodwill of €11.1 million arising from the acquisition consists largely of attainable synergies, such as those involving international growth, project business, product portfolio, and cross selling. The acquisition calculation is preliminary; the fair value of acquired net assets is provisional pending on the receipt of final valuations for identifiable intangible assets and property, plant and equipment.
Acquisition related costs amounted to €0.9 million. They were included in administration expenses in the consolidated statement of comprehensive income as follows: €0.6 million for the year ended 31 December 2015 and €0.3 million for the reporting period ended 31 December 2016.

78 • Uponor Annual Report 2017 – Notes to the consolidated financial statements
4. Other operating income and expenses
M€ 2017 2016Other operating incomeGains from sales of fixed assets 2.5 0.7Other items 0.6 3.5Total 3.1 4.2
Other operating expensesResearch and development expenses 23.2 21.4Losses from sales of fixed assets 0.4 0.3Impairments 0.6 3.3Other items 0.2 0.6Total 24.4 25.6
Auditor feesAudit firm Deloitte Statutory audit services 0.9 0.8Other services 0.0 0.1Total 0.9 0.9
In 2017, other operating income includes a €1.9 million gain from the sale of office and manufacturing space in Uponor Infra’s premises in Vaasa, Finland.
In 2016, other items in other operating income include funds received in royalties and compensation for patent infringement as part of a settle-ment in Canada.
5. Employee benefits
M€ 2017 2016Short-term employee benefits:- Salaries and bonuses 200.1 193.8- Other social costs 31.4 29.7Post-employment benefits:- Pension expenses - defined contribution plans 11.0 11.4- Pension expenses - defined benefit plans 0.9 1.3Other long-term employee benefits 0.1 0.0Termination benefit expenses 1.1 3.8Share based payments- Equity settled share-based payment transactions 1.1 0.8Total 245.7 240.8
Personnel at 31 December 4,075 3,868Personnel, average 3,990 3,869
Information on the management’s employee benefits is presented in note 32 Related party transactions.
6. Depreciation and impairment
M€ 2017 2016Depreciation and impairment by asset categoryIntangible rights 3.5 5.3Other intangible assets 2.7 2.6Land and water areas 0.1 0.9Buildings and structures 4.9 5.8Machinery and equipment 22.8 21.3Other tangible assets 5.2 5.7Total 39.2 41.6
Depreciation and impairment by functionCost of goods sold 27.4 25.5Dispatching and warehousing 1.3 1.2Sales and marketing 4.1 4.2Administration 4.7 6.4Other 1.7 4.3Total 39.2 41.6
In 2017, an impairment of €0.4 (3.3) million was made relating to tangible assets. By function, this is included in the line Other.
7. Financial income and expenses and currency exchange differences
M€ 2017 2016Financial incomeDividend income on available-for-sale financial assets 0.0 0.0Interest income from loans and other receivables 0.2 0.2Interest income from interest rate swaps 0.0 -Profit from financial assets and liabilities designated at fair value through profit and loss- net foreign currency derivatives, not under hedge accounting 7.9 -Exchange differences 6.6 10.1Other financial income 0.0 0.1Total 14.7 10.4
Financial expensesInterest expense for financial liabilities measured at amortised cost 3.0 3.8Interest expense from interest rate swaps 1.1 1.0Refund of penalty interest -3.6 -Loss from financial assets and liabilities designated at fair value through profit and loss- net foreign currency derivatives, not under hedge accounting - 6.0Exchange differences 17.7 8.0Other financial costs 1.9 1.6Total 20.1 20.4
A €3.6 million adjustment in financial expenses was booked in 2017 after the decision by the Supreme Administrative Court in Finland to adjust earlier taxation decision and late fees imposed on the company.

Uponor Annual Report 2017 – Notes to the consolidated financial statements • 79
In 2017, exchange rate gains and losses included in operating income and expenses total a €0.8 million gain (0.9 million loss in 2016). Interest expenses include the interest part of finance lease payments of €0.4 (0.4) million.
8. Income taxes
M€ 2017 2016Current year and previous years taxesFor the financial period 27.9 23.4For previous financial periods -2.2 0.3Change in deferred taxes -2.9 -4.8Total 22.8 18.9
Tax reconciliation
Profit before taxes 88.2 60.4
Computed tax at Finnish statutory rate (20%) 17.6 12.2Difference between Finnish and foreign rates 10.9 7.8Non-deductible expenses 1.5 1.2Tax exempt income -2.0 -1.9Utilisation of previously unrecognised tax losses -2.0 -1.7Unrecognised deferred tax assets on losses 1.4 0.8Change in tax legislation -1.6 0.0Taxes from previous years -2.2 0.3Other items -0.8 0.2Total 22.8 18.9
Effective tax rate, % 25.8 31.3
Effective tax rate in 2017 was 25.8% (31.3%), largely as a result of the Supreme Administrative Court tax resolution in Uponor’s favour in Finland as well as the U.S. tax reform. A €1.6 million adjustment in taxes for previous periods and a €3.6 million adjustment in financial expenses was booked in 2017 after the decision of the Supreme Administrative Court to lower taxes, tax increases and late fees imposed on the company in 2011; the total impact of -2.6% pts, or €2.3 million, on taxes. The impact of the U.S. tax reform is due to a mandatory repatriation and revaluation of the net deferred taxes with the new federal tax rate 21% (35%). The total impact from U.S. tax reform was -2.6% pts, or €2.3 million. Both the U.S. and the Finnish elements affecting the effective tax rate in 2017 are viewed as one-time impacts.
During 2016 there were no significant changes in national tax leg-islation influencing Group companies. In 2016, utilisation of previously unrecognised tax losses, a lower amount of unrecognised deferred tax assets on losses, and one-time R&D tax credits granted to Uponor in the USA retrospectively decreased the Group’s effective tax rate.
Taxes relating to other comprehensive income
2017M€ Before taxes Tax effect Net of taxesCash flow hedges 1.3 0.1 1.2Net investment hedging 1.7 - 1.7Re-measurements on defined benefit pensions -0.6 -0.2 -0.4Translation differences -13.2 0.0 -13.2Total -10.8 -0.1 -10.7
2016M€ Before taxes Tax effect Net of taxesCash flow hedges 1.6 0.2 1.4Net investment hedging 0.2 - 0.2Re-measurements on defined benefit pensions 1.8 0.4 1.4Translation differences 2.1 0.0 2.1Total 5.7 0.6 5.1

80 • Uponor Annual Report 2017 – Notes to the consolidated financial statements
9. Earnings per share
M€ 2017 2016Result from continuing operations 65.4 41.5Result from discontinued operations - 0.4Profit for the period 65.4 41.9
Profit for the period attributable to equity holders of parent company 60.5 42.2
Shares, in thousandsWeighted average number of shares*) 73,130 73,133Diluted weighted average number of shares 73,130 73,133
Basic earnings per share, € 0.83 0.58- Continuing operations 0.83 0.57- Discontinued operations - 0.01
Diluted earnings per share, € 0.83 0.58- Continuing operations 0.83 0.57- Discontinued operations - 0.01
*) Weighted average number of shares does not include treasury shares.
10. Intangible assets
2017 M€
Intangible rights
Customer relationship
value Technology Goodwill
Other intangible
assetsInvestment in progress
Intangible assets
Acquisition costs 1 Jan 74.1 11.9 1.5 94.4 1.1 0.1 183.1Translation difference -0.2 - - -0.1 0.0 - -0.3Increases 1.8 - - - 0.6 - 2.4Decreases -0.7 - - 0.0 - - -0.7Transfers between items 0.1 - - - 0.9 -0.1 0.9Acquisition costs 31 Dec 75.1 11.9 1.5 94.3 2.6 0.0 185.4
Accumulated depreciations and impairments 1 Jan 58.3 3.6 0.7 0.7 0.8 - 64.1Translation difference -0.2 - - - 0.0 - -0.2Acc. depreciation on disposals and transfers -0.7 - - - - - -0.7Depreciation for the financial period 3.5 2.4 0.1 - 0.2 - 6.2Accumulated depreciations and impairments 31 Dec 60.9 6.0 0.8 0.7 1.0 - 69.4
Book value 31 December 14.2 5.9 0.7 93.6 1.6 0.0 116.0

Uponor Annual Report 2017 – Notes to the consolidated financial statements • 81
2016 M€
Intangible rights
Customer relationship
value Technology Goodwill
Other intangible
assetsInvestment in progress
Intangible assets
Acquisition costs 1 Jan 63.3 2.4 1.5 84.0 0.9 - 152.1Structural changes 10.4 9.5 - 11.1 - - 31.0Translation difference -0.4 - - -0.7 0.1 - -1.0Increases 1.9 - - - 0.2 0.1 2.2Decreases -1.1 - - 0.0 -0.1 - -1.2Transfers between items - - - - 0.0 - 0.0Acquisition costs 31 Dec 74.1 11.9 1.5 94.4 1.1 0.1 183.1
Accumulated depreciations and impairments 1 Jan 54.3 1.2 0.5 0.7 0.7 - 57.4Structural changes 0.1 - - - - - 0.1Translation difference -0.3 - - - 0.1 - -0.2Acc. depreciation on disposals and transfers -1.1 - - - -0.1 - -1.2Depreciation for the financial period 5.3 2.4 0.2 - 0.1 - 8.0Accumulated depreciations and impairments 31 Dec 58.3 3.6 0.7 0.7 0.8 - 64.1
Book value 31 December 15.8 8.3 0.8 93.7 0.3 0.1 119.0
In 2017, increases in intangible assets mainly included investments in the renewal of Uponor’s websites visually and technically. In 2016, increases in intangible rights include investments in the ERP system and software.
In 2016, structural changes include the acquisitions of Delta Systemtechnik GmbH and the KaMo Group in Germany.
According to the IFRS 3 standard, goodwill is not depreciated, but it is tested at least annually for any impairment. The recoverable amount of cash generating units are determined based on value in use calculation which uses cash flow projections. If a unit’s recover-able amount does not exceed the carrying amount, impairment is booked. Goodwill has been allocated between the segments as follows: Building Solutions – Europe €76.7 (76.8) million and Uponor Infra €17.1 (17.1) million.
Impairment tests are carried out for each separate cash-generating unit. Cash flow forecasts related to goodwill cover a period of 5 years. Terminal value is calculated from the fifth year’s cash flow. Cash flow forecasts are based on the strategic plans approved by the manage-ment. Key assumptions of the plans relate to growth and profitability development of the markets and the product and service offerings. A cash-generating unit’s useful life has been assumed to be indefinite,
since these units have been estimated to impact on the accrual of cash flows for an undetermined period. The discount rate used is based on the interest rate level reflecting the average yield require-ment for the cash generating unit in question. The discount rate used was 7.1 (7.4) per cent for Building Solutions – Europe and 7.6 (7.5) per cent for Uponor Infra. The 2017 goodwill impairment tests indicated that there was no need to make impairments.
A sensitivity analysis is performed for the following variables: sales, gross profit margin and discount rate. A 8.4 per cent sales reduction compared to the forecasted long-term levels would not expose the Group to any material impairment risk. A decrease of 3.3 percent-age points in gross profit margin would not cause any impairment, provided that other business factors remained unchanged. A discount rate increase of 6.4 percentage points would not lead to any impair-ment, either. Presented sensitivities relate to the segment Uponor Infra, as its goodwill is more sensitive to the risk of impairment. It is the opinion of management that the changes in the basic assump-tions in the theoretical scenarios mentioned above should not be interpreted as evidence that they are likely to occur.
The Group does not have any capitalised development costs.

82 • Uponor Annual Report 2017 – Notes to the consolidated financial statements
11. Tangible assets
2017 M€
Land and water areas
Buildings and structures
Machinery and equipment
Other tangible assets
Construction work in
progressTangible
assetsAcquisition costs 1 Jan 18.5 165.7 401.0 64.2 38.3 687.7Translation difference -0.6 -6.9 -16.0 -2.5 -2.4 -28.5Increases 0.2 15.3 28.9 6.9 9.6 61.0Decreases -0.5 -12.4 -12.7 -6.2 0.0 -31.8Transfers between items -0.2 2.2 9.7 -0.1 -13.8 -2.2Acquisition costs 31 Dec 17.4 163.9 410.9 62.3 31.7 686.2
Accumulated depreciations and impairments 1 Jan 3.1 93.9 300.1 49.7 - 446.8Translation difference 0.0 -1.9 -10.4 -1.9 0.0 -14.2Acc. depreciation on disposals and transfers -0.1 -11.6 -12.6 -6.0 - -30.3Depreciation for the financial period 0.1 4.6 22.8 4.9 - 32.4Transfers between items 0.0 0.8 -1.1 -1.0 - -1.3Impairments 0.0 0.3 0.1 0.0 0.2 0.6Accumulated depreciations and impairments 31 Dec 3.1 86.1 298.9 45.7 0.2 434.0
Book value 31 December 14.3 77.8 112.0 16.6 31.5 252.2
Book value for production plant, machinery and equipment 100.8
2016 M€
Land and water areas
Buildings and structures
Machinery and equipment
Other tangible assets
Construction work in
progressTangible
assetsAcquisition costs 1 Jan 17.5 159.2 386.3 62.0 21.8 646.8Structural changes 0.4 3.2 -1.1 0.1 0.9 3.5Translation difference 0.2 1.6 2.1 0.4 0.4 4.7Increases 0.6 3.0 19.9 3.9 21.1 48.5Decreases -0.5 -2.5 -9.5 -2.7 -0.6 -15.8Transfers between items 0.3 1.2 3.3 0.5 -5.3 0.0Acquisition costs 31 Dec 18.5 165.7 401.0 64.2 38.3 687.7
Accumulated depreciations and impairments 1 Jan 2.1 89.5 287.5 46.3 - 425.4Structural changes 0.1 0.4 -0.9 0.2 - -0.2Translation difference -0.1 0.1 1.1 0.3 - 1.4Acc. depreciation on disposals and transfers 0.0 -1.9 -8.9 -2.6 - -13.4Depreciation for the financial period 0.1 5.0 20.0 5.2 - 30.3Transfers between items - - - 0.0 - 0.0Impairments 0.9 0.8 1.3 0.3 - 3.3Accumulated depreciations and impairments 31 Dec 3.1 93.9 300.1 49.7 - 446.8
Book value 31 December 15.4 71.8 100.9 14.5 38.3 240.9
Book value for production plant, machinery and equipment 90.8
The 2017 increase in tangible assets consists mainly of production capacity expansion in Building Solutions – North America, new machinery and equipment in factories in Sweden and Germany in Building Solutions – Europe, as well as production enhancement and relocations in Uponor Infra.
The 2016 increases include investments in new production tech-nology and the new factory in Taicang (China) being equipped with production lines in Building Solutions – Europe, capacity expansion in Building Solutions – North America, as well as production enhance-ment projects in Uponor Infra.
Construction work in progress decreased by €6.8 million to €31.5 million at closing date in 2017 mainly relating to Uponor Infra’s completion of the production relocations in Finland as well as new automated production line in Denmark.
In 2016, structural changes include the acquisitions of Delta Systemtechnik GmbH and the KaMo Group in Germany.
Tangible assets include property acquired under finance lease arrangements, as follows:

Uponor Annual Report 2017 – Notes to the consolidated financial statements • 83
2017 M€
Land and water areas
Buildings and structures Others
Finance lease arrangements total
Acquisition costs 1 Jan 0.7 11.2 0.7 12.6Translation difference - -0.1 0.0 -0.1Acquisition costs 31 Dec 0.7 11.1 0.7 12.5
Accumulated depreciations and impairments 1 Jan - 8.4 0.4 8.8Translation difference - 0.0 0.0 0.0Depreciation for the financial period - 0.3 0.1 0.4Accumulated depreciations and impairments 31 Dec - 8.7 0.5 9.2
Book value 31 December 0.7 2.4 0.2 3.3
2016 M€
Land and water areas
Buildings and structures Others
Finance lease arrangements total
Acquisition costs 1 Jan 0.7 11.3 0.7 12.7Translation difference - -0.1 0.0 -0.1Increases - - 0.0 0.0Decreases 0.0 0.0 - 0.0Acquisition costs 31 Dec 0.7 11.2 0.7 12.6
Accumulated depreciations and impairments 1 Jan - 8.2 0.3 8.5Translation difference - -0.1 0.0 -0.1Acc. depreciation on disposals and transfers - - 0.0 0.0Depreciation for the financial period - 0.3 0.1 0.4Accumulated depreciations and impairments 31 Dec - 8.4 0.4 8.8
Book value 31 December 0.7 2.8 0.3 3.8
12. Financial assets and liabilities by measurement category
2017 M€
Derivative contracts,
under hedge accounting
Financial assets/
liabilities at fair value
through profit or loss
Loans and receivables
Available- for-sale
financial assets
Financial liabilities
measured at amortised
cost
Carrying amounts
by balance sheet item
IFRS 7 Fair value hierarchy
level NoteNon-current financial assetsOther shares and holdings 0.2 0.2 14Non-current receivables 10.1 10.1 15Electricity derivatives 0.4 0.4 1 15Other derivative contracts 0.0 0.0 0.0 2 15Current financial assetsAccounts receivable and other receivables 202.4 202.4 17Electricity derivatives 0.1 0.1 1 28Other derivative contracts 0.2 1.7 1.9 2 28Cash and cash equivalent 107.0 107.0 18Carrying amount by category 0.7 1.7 319.5 0.2 322.1
Non-current financial liabilitiesInterest-bearing liabilities 176.6 176.6 23Electricity derivatives 0.0 0.0 1 28

84 • Uponor Annual Report 2017 – Notes to the consolidated financial statements
2017 M€
Derivative contracts,
under hedge accounting
Financial assets/
liabilities at fair value
through profit or loss
Loans and receivables
Available- for-sale
financial assets
Financial liabilities
measured at amortised
cost
Carrying amounts
by balance sheet item
IFRS 7 Fair value hierarchy
level NoteCurrent financial liabilitiesInterest-bearing liabilities 81.9 81.9 23Electricity derivatives 0.1 0.1 1 28Other derivative contracts 0.5 0.8 1.3 2 28Accounts payable and other liabilities 105.4 105.4 24Carrying amount by category 0.6 0.8 363.9 365.3
2016 M€
Derivative contracts,
under hedge accounting
Financial assets/
liabilities at fair value
through profit or loss
Loans and receivables
Available-for-sale financial
assets
Financial liabilities
measured at amortised
cost
Carrying amounts
by balance sheet item
IFRS 7 Fair value hierarchy
level NoteNon-current financial assetsOther shares and holdings 0.3 0.3 14Non-current receivables 20.9 20.9 15Electricity derivatives 0.1 0.1 1 15Other derivative contracts 0.1 0.1 2 15Current financial assetsAccounts receivable and other receivables 193.6 193.6 17Electricity derivatives 0.1 0.1 1 28Other derivative contracts 1.6 1.6 2 28Cash and cash equivalent 16.3 16.3 18Carrying amount by category 0.2 1.7 230.8 0.3 233.0
Non-current financial liabilitiesInterest-bearing liabilities 158.2 158.2 23Electricity derivatives 0.2 0.2 1 28Current financial liabilitiesInterest-bearing liabilities 17.6 17.6 23Electricity derivatives 0.3 0.3 1 28Other derivative contracts 1.6 2.1 3.7 2 28Accounts payable and other liabilities 102.6 102.6 24Carrying amount by category 2.1 2.1 278.4 282.6
The carrying value of financial assets and liabilities is considered to correspond to their fair value. Group’s financial instruments are classified according to IFRS 7 fair value hierarchies. Uponor applies hierarchy as follows: - The fair value of electricity derivatives are measured based on
stock exchange prices. (Hierarchy 1) - The fair value of foreign exchange derivatives and interest rate
derivatives are measured based on price information from common markets and commonly used valuation methods. (Hierarchy 2)

Uponor Annual Report 2017 – Notes to the consolidated financial statements • 85
13. Investment in joint ventures and associated companies
M€ 2017 2016Acquisition costs 1 Jan 13.3 0.2Share of result in associated companies -2.3 -0.6Increases - 13.5Decreases -0.2 -0.4Translation difference -1.3 0.6Book value 31 Dec 9.5 13.3
The Group has two German associated companies: Punitec GmbH and Punitec Verwaltungs GmbH, whose book value is €0.2 (0.1) million. From its 2017 result, Punitec GmbH paid a dividend of €0.2 (0.4) million to Uponor.
On 13 July 2016, Uponor Corporation and Belkin International, Inc. completed a partnership agreement and formed a joint venture company in the United States and in Europe for the development and commercialisation of intelligent water technology. The new joint venture, named Phyn, develops water sensing and conservation technology both for consumers and to the building industry.
Uponor invested €13.5 million in exchange of a 37.5% sharehold-ing in the companies. The joint venture company is consolidated into Uponor’s financial accounts using the equity method.
Summarised financial information in respect of the joint ventures
M€ 2017 2016PhynIncome statementProfit for the period -7.1 -2.3Total comprehensive income for the period -7.1 -2.3
Balance sheetNon-current assets 21.1 23.7Current assets 5.6 13.0
Current liabilities 2.2 1.4
The above amounts of assets and liabilities includeCash and cash equivalents 5.4 12.7
Carrying amount of interest in joint ventureNet assets in joint ventures 24.6 35.3Group's ownership 37.5% 37.5%
Carrying amount of interest in joint venture 9.2 13.2
14. Other shares and holdings
M€ 2017 2016Other non-current investments 0.2 0.3Total 0.2 0.3
Other non-current investments include other unlisted shares accounted for at cost, since it was not possible to determine their fair value reliably.
15. Non-current receivables
M€ 2017 2016Other loan receivables 0.3 0.3Derivative contracts 0.4 0.2Other receivables 9.8 20.6Total 10.5 21.1
Other non-current receivables include €9.2 (10.6) million in funds recorded as receivables related to the court approved class action settlements in the USA in 2015. In 2016, other non-current receiva-bles also included the tax receivables of €9.6 million related to the Finnish tax dispute which was transferred to current receivables in 2017. Further information related to Finnish tax dispute is disclosed in note 25 Commitments, contingent assets and liabilities.
16. Inventories
M€ 2017 2016Raw materials and consumables 21.3 21.2Semifinished products 17.2 16.9Finished products / goods 94.2 101.2Total 132.7 139.3
Based on the FIFO principle, inventories are valued at the lower of cost or net realisable value. During the year, inventories were scrapped or written down by €4.7 (1.2) million.
17. Current receivables
M€ 2017 2016Accounts receivable 171.8 165.8Current income tax receivables 19.5 6.0Prepayments and accrued income 3.4 4.4Derivative contracts 2.0 1.7Interest-bearing current assets 0.0 0.0Other receivable 30.6 27.8Total 227.3 205.7
According to the Group’s assessment, the carrying value of non-interest-bearing current receivables, except for commodity contracts receivable, is considered to correspond with their fair value.

86 • Uponor Annual Report 2017 – Notes to the consolidated financial statements
The Group booked a €0.3 (1.5) million impairment in accounts receiv-able as expenses during the financial period. The Group is unaware of any factors which would cause possible additional impairments.
Aging of accounts receivable is as presented in note 27 Financial risk management.
M€ 2017 2016Accrued incomeDiscounts received 0.0 0.1Other accrued income 3.4 4.3Total 3.4 4.4
18. Cash and cash equivalents
M€ 2017 2016Cash and bank deposits 96.6 16.0Other short-term investments (1–3 months) 10.4 0.3Total 107.0 16.3
19. Shareholders’ equity
During 2017, Uponor Corporation’s share capital remained unchanged at 146,446,888 euros and the number of shares totalled 73,206,944. Each share entitles its holder to one vote at the shareholders’ meeting. The share does not have any nominal value. Additionally, it does not have any minimum or maximum share capital. All shares issued have been paid in full.
At the beginning of 2017 the company held 68,959 treasury shares with a value of €0.5 million. During the period 9,838 of the company’s own shares were transferred to the management as part of the long-term incentive programme for the years 2014–2016. At the end of 2017 company held a total of 59,121 treasury shares with a value of €0.4 million. The treasury shares were reacquired during the period 17 Nov.–5 Dec. 2008. The justification for the buy-back was the use of shares as consideration in connection with the company’s share-based incentive schemes. Treasury shares are presented as a reduction in retained earnings and do not have any asset value in the financial statements.
Reserve for invested unrestricted equity includes investments complying with the Limited Liability Companies Act. Hedge reserve is used for recording the changes in fair value of derivative contracts under hedge accounting.
At present, other reserves include statutory legal reserves.
20. Deferred taxes
M€ 2017 2016Deferred tax assetsInternal profit in inventory 0.3 0.4Provisions 5.5 5.6Unused tax losses 4.3 4.1Tangible assets 0.3 0.3Employee benefits 3.4 2.8Fair valuation of available-for-sale investments and financial instruments 0.1 0.4Other temporary differences 9.1 4.9Total deferred tax assets 23.0 18.5Offset against deferred tax liabilities -12.6 -6.9Net deferred tax assets 10.4 11.6
M€ 2017 2016Deferred tax liabilitiesAccumulated depreciation difference and untaxed reserve 12.2 13.1Tangible assets 0.1 0.1Fair valuation of available-for-sale investments and financial instruments 0.3 0.2Other temporary differences 8.0 5.3Total deferred tax liabilities 20.6 18.7Offset against deferred tax assets -12.6 -6.9Total deferred tax liabilities 7.9 11.8
M€ 2017 2016Deferred tax assets1 Jan 11.6 21.0Recognised on income statement -0.9 -9.3Recognised in comprehensive income 0.0 -0.3Recorded in equity -0.1 0.3Translation difference -0.2 -0.131 Dec 10.4 11.6
M€ 2017 2016Deferred tax liabilities1 Jan 11.8 20.2Recognised on income statement -3.8 -14.1Recognised in comprehensive income 0.3 0.3Recorded in equity 0.1 -0.2Translation difference -0.5 -0.1Bought / sold business operations - 5.731 Dec 7.9 11.8

Uponor Annual Report 2017 – Notes to the consolidated financial statements • 87
The Group has recognised a deferred tax asset for its net operating loss carry-forwards, which can probably be utilised against future profits in the relevant tax jurisdictions. On 31 December 2017, the Group carried forward losses of €19.4 (18.1) million, for which the Group has a recognised deferred tax asset. In 2017, there is a €26.3 (29.9) million of loss carry-forwards for which no deferred tax asset has been recognised due to the uncertainty of the utilisation of these loss carry-forwards. Losses of €1.2 million will expire in 2018.
The Group does not provide for deferred taxes on the undistributed earnings of non-Finnish subsidiaries, to the extent that such earnings are intended to be permanently reinvested in those operations and repatriation would cause tax expenses.
21. Employee benefit obligations
The Group has a number of pension plans covering its operations, complying with each country’s local rules and regulations. Moreover, the Group applies defined contribution and defined benefit pen-sion plans. Pensions are based on actuarial calculations or actual payments to insurance companies. Independent authorised actuaries have prepared the actuarial calculations. The discount rate for actuarial calculations is determined by the reference to market yields of high-quality corporate bonds or government bonds. Used discount rates are country specific. Pension benefits are normally based on the number of working years and salary. Most defined benefit plans are located in Germany, Sweden and Canada, constituting around 99% (98%) of the defined benefit pension liability in the Group’s balance sheet. Defined benefit plans in Germany and Sweden are unfunded and relate to pensions. These plans are closed for new entrants. Currently pensions are accrued according to defined contribution plans. In Canada, defined benefit plans relate to pensions and post-employment medical and life insurance benefits. Defined benefit pension plan is funded.
M€ 2017 2016Post-employment benefit obligations:- Defined benefit plans 22.8 23.2Other long-term employee benefit liability 1.5 1.6Total 24.3 24.8
Defined benefit obligations
M€ 2017 2016Reconciliation of assets and liabilities recognised in the balance sheetDefined benefit obligation 31.5 33.1Fair value of plan assets -8.7 -9.9Net liability in the balance sheet 22.8 23.2
Expenses recognised in the income statementCurrent service costs 0.5 0.5Net interest costs 0.6 0.8Past service costs -0.2 -Total 0.9 1.3Expenses recognised in the income statement by functionCost of goods sold 0.4 0.4Dispatching and warehousing 0.1 0.1Sales and marketing 0.1 0.4Administration 0.3 0.4Other 0.0 0.0Total 0.9 1.3
Movements in obligationObligation at 1 Jan 33.0 34.0Service cost 0.3 0.5Interest expense 0.9 1.1Remeasurements 0.8 -1.5Member contributions 0.0 0.1Settlements -1.2 -Conversion difference -1.0 0.7Benefit payments -1.3 -1.8Obligation at 31 Dec 31.5 33.1
Movements in fair value of plan assetsFair value of plan assets at 1 Jan 9.9 8.7Interest income 0.3 0.3Remeasurements 0.2 0.3Contributions by employer 1.4 1.6Member contributions 0.0 0.1Settlements -1.2 -Conversion difference -0.6 0.7Benefit payments -1.3 -1.8Fair value of plan assets at 31 Dec 8.7 9.9

88 • Uponor Annual Report 2017 – Notes to the consolidated financial statements
Major categories of plan assets, fair values and % of total plan assets2017 2016
M€ Fair value % Fair value %Equity instruments 5.3 60.0 5.8 58.5Debt instruments 3.5 40.0 3.8 39.0Assets held by insurance company 0.0 0.0 0.2 2.5Total 8.8 100.0 9.9 100.0
Defined benefit obligation and fair value of plan assets by countries
Germany Sweden CanadaOther
Countries
2017 2016 2017 2016 2017 2016 2017 2016Defined benefit obligation 10.7 11.2 6.8 6.9 13.7 14.2 0.3 0.7Fair value of plan assets - - - - 8.8 9.6 - 0.2Net liability (asset) 10.7 11.2 6.8 6.9 5.0 4.6 0.3 0.5
Principal actuarial assumptions
Germany Sweden CanadaOther
Countries
2017 2016 2017 2016 2017 2016 2017 2016
Discount rate (%) 1.8 1.5 2.3 2.8 3.5 4.01.8- 2.5
1.5– 2.6
Expected rate of salary increase (%) 3.0 3.0 n/a n/a 3.0 3.0
n/a – 2.25
n/a – 2.25
Expected rate of pension increase (%) 1.5 1.5 1.5 1.5 n/a n/a
0.1- 1.5
0.1– 1.5
Sensitivity analysis of discount rateIncrease of 0.5%Decrease of 0.5%
Effect on amount of liabilityDecrease of 7% on averageIncrease of 8% on average
The Group expects to contribute €1.9 (1.6) million to its defined benefit pension plans in 2018.
The following table shows maturity of expected benefit payments:
Maturity of benefit payments 2018 2019 2020 2021 2022 2023–Expected benefit payments 1.3 1.4 1.5 1.5 1.5 7.8
22. Provisions
M€ Gua
rant
ee
and
war
rant
y ob
ligat
ions
Env
ironm
enta
l ob
ligat
ions
Res
truct
urin
g
Oth
er
prov
isio
ns
Tota
l
Provisions at 1 Jan 2017 9.5 2.4 4.2 12.7 28.8Conversion difference -0.8 - 0.0 -0.8 -1.6Additional provisions 6.2 - 0.8 4.0 11.0Utilised provisions -2.7 -0.1 -4.1 -2.3 -9.2Unused amounts reversed 0.0 - 0.0 -0.1 -0.1Provisions at 31 Dec 2017 12.2 2.3 0.9 13.5 28.9
Current provisions 10.6 0.3 0.9 10.0 21.8Non-current provisions 1.6 2.0 - 3.5 7.1Total 12.2 2.3 0.9 13.5 28.9
Warranty provisions amounted to €12.2 (9.5) million at the end of the period. Warranty provisions are based on the previous years’ experience of defective goods. The aim is to be prepared for future warranty expenses. Warranty periods vary from country to country, depending on local legislation and commercial practices. Other provisions include provision for enhanced warranty to cover potential fitting failures related to Uponor yellow brass fittings sold in the USA. This enhanced warranty relates to the court approved terms of the class action suits settled on 17 December 2015.
Changes in restructuring provisions relate mainly to transforma-tion programmes in Building Solutions – Europe.
At period end, the environmental provision relating mainly to the divested Finnish real estate business in 2004 was €2.3 (2.4) million.
23. Interest-bearing liabilities
M€ 2017 2016Non-current interest bearing liabilitiesBonds - 80.0Loans from financial institutions 172.0 72.7Finance lease liabilities 4.4 5.3Other non-current interest bearing liabilities 0.2 0.2Total 176.6 158.2
Current interest-bearing liabilitiesLoans from financial institutions 0.6 16.8Current portion of bonds 80.0 -Finance lease liabilities 0.8 0.7Other current interest bearing liabilities 0.5 0.1Total 81.9 17.6

Uponor Annual Report 2017 – Notes to the consolidated financial statements • 89
M€ 2017 2016A reconciliation between the opening and closing balances of liabilities arising from financing activitiesInterest bearing liabilities at 1 Jan 175.8 139.5Cash flows 83.0 32.4Acquisitions / divestments - 3.7Translation difference -0.3 0.2Interest bearing liabilities at 31 Dec 258.5 175.8
M€ 2019 2020 2021 2022 2023–Maturity of non-current interest bearing liabilitiesLoans from financial institutions 0.1 0.1 70.1 100.1 1.6Finance lease agreements 0.8 0.9 2.7 0.0 0.0Other non-current interest bearing liabilities 0.1 0.1Total 1.0 1.1 72.8 100.1 1.6
2017 2016The weighted average interest rates of interest-bearing liabilities, % paLoans from financial institutions 0.79 1.04Bonds 1.78 1.83Other non-current interest bearing liabilities 0.92 0.97
Uponor has one outstanding bond totalling €80 million, issued in 2011. It has bullet repayment structure maturing in 2018, thus currently included into current liabilities. €50 million of the outstanding bonds’ nominal value is hedged with fixed rate interest rate swaps. The transaction costs of the bonds have been netted to the bond. In 2016 Uponor took out 5-year loans of €50 million and €20 million, in order to fund M&A and joint venture activities. In 2017 Uponor raised a €100 million loan mainly to repay the €80 million bond maturing in June 2018. €50 million of the loan capital is hedged with financial instruments.
At the end of the year, the Group did not have any outstanding commercial papers.
M€ 2017 2016Finance lease liabilitiesMinimum lease paymentsIn less than one year 1.1 1.11–5 years 4.8 5.9Over 5 years 0.0 0.0Total 5.9 7.0Future finance charges 0.7 1.0Finance lease liabilities – the present value of minimum lease payments 5.2 6.0
The present value of minimum lease paymentsIn less than one year 0.8 0.71–5 years 4.4 5.3Over 5 years 0.0 0.0Total 5.2 6.0
The Group’s finance lease agreements are mainly related to office, factory and warehouse premises. On 31 December 2017, the total amount of capitalised costs for finance lease agreements in the Group was €3.3 (3.8) million, which was included in the balance sheet under property, plant and equipment. The corresponding depreciation in 2017 was €0.4 (0.4) million. The total amount of finance lease pay-ments in 2017 was €1.1 (1.1) million, which included €0.4 (0.4) million in interest expenses.
The most significant leasing liability is the finance lease agreement relating to office buildings and production facilities in Germany, signed in 1999. In 2017, the Group did not enter into any significant new finance lease agreements.
24. Current liabilities
M€ 2017 2016Accounts payable 76.8 76.2Current income tax liability 5.8 5.8Accrued liabilities 79.9 83.7Advances received 0.9 0.5Advances received from construction contracts 4.1 2.4Derivative contracts 1.4 4.0Other current liabilities 28.6 26.4Total 197.5 199.0
Accrued liabilitiesPersonnel expenses 38.1 39.2Bonuses 18.0 19.4Taxes 0.7 1.2Interest 0.3 0.6Others 22.8 23.3Total 79.9 83.7

90 • Uponor Annual Report 2017 – Notes to the consolidated financial statements
25. Commitments, contingent assets and liabilities
M€ 2017 2016Commitments of purchase PPE (Property, plant, equipment) 12.4 9.7Other commitments 0.8 0.6
- on own behalfPledges at book value 0.1 0.1Mortgages issued 2.1 2.5Guarantees issued 5.6 5.0
- on behalf of a subsidiaryGuarantees issued 29.4 34.1
Letter of Comfort commitments undertaken on behalf of subsidiaries are not included in the above figures.
Pledges at book value 0.1 0.1Mortgages issued 2.1 2.5Guarantees issued 34.9 39.2Total 37.1 41.8
Contingent liabilities are presented in accordance with the best estimate of the amount of liability.
Uponor Corporation’s subsidiary in Spain, Uponor Hispania, S.A.U, had tax audits covering financial years 2006–2007 and 2011–2012. As a result of the audits, the tax authority rejected the tax deductibility of costs related to certain Group services and to advertising and promotion. As a result of this, Uponor Hispania has paid €0.7 million in taxes and in interest on delayed payments and booked a provision of €0.4 million to cover further delayed interest payments. The company has started a process to avoid double taxation.
On 13 September 2017, the Supreme Administrative Court in Finland resolved the taxation adjustment decisions concerning Uponor Corporation and its subsidiary Uponor Business Solutions Oy. The decision lowers Uponor Corporation’s uncharged mark-up of service fees that was added on the company’s taxable income, from seven to three per cent for the tax years 2005–2007. The taxes, late fees and tax increases imposed on the company have also been decreased. The Finnish Tax Administration has reassessed the changes in taxation caused by this decision and will adjust the payment. The taxation adjustment decisions concerning the parent company’s subsidiary, Uponor Business Solutions Oy, for the tax year 2005 have been overruled. The Finnish Tax Administration has reas-sessed the changes in taxation caused by this decision and will adjust the payment. Based on the reassessments, Uponor has booked the paid surtaxes and delay interests as income at €1.6 million. With regard to the tax years 2006–2009, the clarification of arm’s length amounts of service fees charged by the company will be returned to the Finnish Tax Administration for review. Uponor has also booked the paid surtaxes and delay interests for the tax years 2006–2009, which have not been reassessed, as income at €3.4 million. The paid taxes at €9.6 million have been transferred from the non-current receivables to the current receivables.
Uponor is involved several judicial proceedings, in various countries. The Group believes at the moment that the outcome of these disputes will not have a material effect on the Group’s result or financial position.
26. Operating lease commitments
M€ 2017 2016Future minimum lease paymentsIn less than one year 12.4 10.71–5 years 24.6 27.8Over 5 years 7.0 9.2Total 44.0 47.7
The Group has rented office and warehouse premises under various agreements. In addition, rental agreements, which do not constitute finance lease agreements, are classified as other rental agreements. The rents of operative leasing commitments are booked as expenses during the maturity period.
27. Financial risk management
Financial risk management aims to ensure Uponor Group’s sufficient liquidity in a cost-efficient manner and to minimise any adverse effects on the Group’s financial performance caused by uncertainties in the financial markets. The general operating principles of financial risk management are defined in the Group Treasury Finance Policy, approved by the Board.
At practical level Group’s Treasury activities are governed by Treasury Committee. Treasury Committee is chaired by the Group’s President and CEO, and its other members are the Group CFO and Director, Treasury and Risk Management. The Treasury Committee is responsible for steering and supervising practical financial risk man-agement. For the purposes of risk management, Uponor uses only such financial instruments whose market value and risk profile can be monitored reliably and continuously. Hedging transactions related to, for instance foreign currency, interest rate, liquidity and counterparty risks, are carried out in accordance with the Group Hedging Policy.
The management of financial risk is centralised into parent company and Group Treasury which also operates as the Group’s internal bank. Group Treasury’s financial risk management duties include identifying, assessing and covering the Group’s financial risks. The Treasury is also responsible for external market transactions related to financial assets and risk management. Providing Group companies with consultation and services within financing belongs to the scope of Group Treasury as well.
Currency riskDue to its international operations, the Group is exposed to currency risks arising from, for instance, currency-denominated accounts receivable and payable, intra-Group transactions, currency-denominated financing, deposits and bank account balances. According to the Group hedging policy, subsidiaries hedge all relevant transaction risks with the Group Treasury, using internal forward transactions. Group Treasury is responsible for assessing net positions and hedging them in external currency markets. Currency forward agreements and options are main

Uponor Annual Report 2017 – Notes to the consolidated financial statements • 91
instruments used in external hedging. The maximum duration of used foreign exchange contracts is one year.
A rule in intra-Group trade is that the production units invoice the sales units in the sales units’ local currency. This enables the concentra-tion of the currency risks into the production units, which have better resources for managing currency risks together with the Group Treasury. Currency risks in internal trade arise mainly from the sales from the production units in Germany, Sweden, the United States and Finland, in currencies other than seller units’ home currency.
Subsidiaries forecast their foreign currency cash flows monthly for the following 12 month period. In accordance with the Group hedging policy, they hedge the relevant portion of their net foreign currency cash flows. In addition to the euro, other main invoicing currencies are US dollar (USD), Swedish krona (SEK), Canadian dollar (CAD) and Danish krone (DKK). On 31 December 2017, these currencies accounted for approximately 62.1 (58.4) percent of the Group’s external accounts receivable. Costs arising from the Group’s own production in the United States and Sweden are used as natural hedges against sales in the mentioned currencies.
Group’s currency risk position at 31 Dec 2017
M€EUR USD
EUR SEK
USD CAD
EUR RUB
EUR DKK Total
Gross exposure 99.0 14.8 -1.3 3.8 7.1 123.4Hedged -110.5 -29.9 13.6 -8.3 4.1 -131.0Net exposure -11.5 -15.1 12.4 -4.4 11.1 -7.5
Sensitivity analysis (+/-10%)
M€EUR USD
EUR SEK
USD CAD
EUR RUB
EUR DKK Total
Income statement 1.2 1.5 1.2 0.4 1.1 5.4Equity (translation differences) 1.3 1.3
Group’s currency risk position at 31 Dec 2016
M€EUR USD
EUR SEK
USD CAD
EUR GBP
EUR DKK Total
Gross exposure 62.0 0.9 -2.0 -3.7 4.6 61.8Hedged -79.3 -15.5 14.6 -3.8 3.9 -80.1Net exposure -17.3 -14.6 12.6 -7.5 8.5 -18.3
Sensitivity analysis (+/-10%)
M€EUR USD
EUR SEK
USD CAD
EUR GRB
EUR DKK Total
Income statement 0.3 1.5 1.3 0.7 0.8 4.6Equity (translation differences) 1.4 1.4
The exposure presented includes only financial instruments as defined by IFRS 7. An exposure is a net of all the financial assets and liabilities nominated in foreign currencies outstanding on the balance sheet date. The exposure does not include any internal loans designated as net investments in foreign operations or any forecasted sales and purchases that are not yet on the balance sheet. The presented foreign exchange risk sensitivity analysis illustrates the impact of a 10 percent change in exchange rates on the income statement and on the balance sheet in euro.
Translational risks arise when the currency denominated assets and liabilities of subsidiaries located outside the euro area are exposed to currency fluctuations and these assets and liabilities are translated into the parent company’s reporting currency, the euro. The most important balance sheet items in foreign currency are in the US dollar (USD). Translation risk affects the reported profit and key ratios through changes in the balance sheet, but not the cash flow. A 10 percent change in the euro against the US dollar would have resulted in a translation difference of €1.3 million before taxes in equity. According to the Group hedging policy, such non-euro denominated balance sheet items are not hedged, with the exception of non-euro denominated internal loans which are hedged in full. In addition, hedge accounting is applied to certain hedges on internal loans defined as net investments by the Group’s Treasury Committee. Thereby, the fair value changes in these loans and loan hedges will not have an effect on the profit, but will be recognised in the equity to the extent that the hedge is effective.
Interest rate riskInterest rate risk arises when changes in market interest rates influ-ence financing costs, returns on financial investments and valuation of interest-bearing balance sheet items. Group Treasury is responsible for managing interest rate risks within the framework specified by Group Treasury policy, with the aim of balancing the interest rate position and optimising interest rate risks.
In order to manage interest rate risks, Uponor Group’s funding is executed by using both fixed and floating interest rate loans and financial instruments. Currently all the external loans are based on floating interest rates. The duration of the interest rate position is managed by choosing loans with different interest rate periods. Different derivative instruments, such as interest rate swaps, forward rate agreements and interest rate options can also be used. Group Treasury is also responsible for matching external financial items and the duration of balance sheet items funded by such items. Short-term money market investments expose the Group to cash flow interest rate risks, but the overall impact of such investments is insignificant.
Financial instruments’ sensitivity to fluctuations in market interest rates, as stated in the standard IFRS 7, is as follows: the impact of an interest rate increase or decrease of one percentage point is -/+ €1.4 (-/+ 0.9) million to the income statement and +/- €1.3 (+/- 0.5) million to shareholders’ equity. The impact is calculated before taxes. The interest position impacting income statement consists of floating rate interest-bearing financial liabilities and assets, interest rate options and interest rate swaps where hedge accounting is not applied. The impact to shareholders’ equity results from the fair value change of the interest rate swap under cash flow hedge accounting.

92 • Uponor Annual Report 2017 – Notes to the consolidated financial statements
Liquidity and refinancing riskLiquidity and refinancing risk arises when a company is not able to arrange funding at reasonable terms and conditions, or at all. Uponor seeks to ensure availability and flexibility of financing through a balanced distribution of loan maturities, utilisation of various types of funding, multiple sources and by maintaining adequate credit limit reserves. The Group’s liquidity is managed through efficient cash management and by investing solely in low-risk instruments, that can be liquidated rapidly and at a clear market price.
Group Treasury is responsible for the co-ordination of Group funding through the parent company. In exceptional cases, mainly for practical or legal reasons, Group Treasury can establish local working capital credit lines or loan structures in the name of a subsidiary, guaranteed by the parent company.
The most significant existing funding programmes on 31 December 2017 included:• Bond €80 million maturing in 2018• Bilateral term loan of €50 million maturing in 2021• Bilateral term loan of €20 million maturing in 2021• Bilateral term loan of €100 million maturing in 2022• Four committed bilateral revolving credit facilities totalling €200
million of which €100 million maturing in 2019 and €100 million maturing in 2021
None of the committed bilateral revolving credit facilities were used during the reporting period.
In addition, the Group has €34.8 million of cash-pool limits and a domestic commercial paper programme totalling €150 million. No cash-pool limits nor commercial paper programme were used at the end of the reporting period.
At the end of the reporting period, the Group had a total of €107.0 (16.3) million in cash and cash equivalents.
Contractual maturity of financial liabilities at 31 Dec 2017
M€ 2018 2019 2020 2021 2022–Bonds 80.7Loans from financial institutions 1.7 1.4 1.5 71.3 102.8Finance lease liabilities 1.1 1.0 1.0 2.8 -Other non-current interest bearing liabilities 0.1 0.2Bank overdrafts in use 0.5Accounts payable 76.8
Derivative contractsForeign currency derivatives- cash outflow 204.3- cash inflow 205.5Interest derivatives 0.5 0.2 0.3 0.3Electricity derivatives 0.1 0.0
Contractual maturity of financial liabilities at 31 Dec 2016
M€ 2017 2018 2019 2020 2021–Bonds 1.5 80.8Loans from financial institutions 0.9 0.9 0.9 51.0 22.6Finance lease liabilities 1.1 1.1 1.0 1.0 2.8Other non-current interest bearing liabilities 0.1 0.1 0.2Bank overdrafts in use 16.8Accounts payable 76.2
Derivative contractsForeign currency derivatives- cash outflow 177.4- cash inflow 176.7Interest derivatives 1.0 0.5Electricity derivatives 0.3 0.1 0.1
Counterparty and credit riskThe counterparty risk related to financial instruments has been defined as the risk of the counterparty being unable or unwilling to fulfil its contractual obligations.
In order to minimise counterparty risks, the Group invests its cash reserves and makes derivative contracts using only counterparties who meet the Group’s criteria for creditworthiness. The Group did not suffer any significant credit losses in its normal business operations during the financial year. The maximum counterparty risk is the book value of financial assets on 31 December 2017.
Potential concentrations of credit risk with respect to trade and other receivables are limited due to the large number and geographic dispersion of companies that comprise the Group’s customer base. Customer credit limits are established and constantly monitored, and the evaluation of customers’ financial conditions is performed on an ongoing basis. Trade receivables are credit insured when applicable. The Group recorded a €0.3 (1.5) million impairment in accounts receivable in 2017.
M€ 2017 2016The aging of accounts receivableUndue 145.4 134.2Due 1–30 days 16.7 24.0Due 31–60 days 3.0 2.3Due 61–90 days 2.2 0.9Due over 90 days 4.5 4.4Total 171.8 165.8

Uponor Annual Report 2017 – Notes to the consolidated financial statements • 93
Price riskIn its business operations, the Group is exposed to raw material price risks including materials like plastics, aluminium, copper, zinc as well as electricity price risks. Such price risks are managed through long-term fixed-price supply contracts, whenever financially feasible. As far as the metals’ price risk is concerned, LME-based (London Metal Exchange) financial instruments can be used to supplement fixed-price contracts. Hedge accounting is not applied to metals hedging via financial instruments.
Group Treasury is responsible for managing electricity price risks at the Nordic level within the framework defined in the Group hedging policy. Hedging targets are achieved mainly by using financial electric-ity derivative contracts. The Group applies hedge accounting to the electricity derivatives.
The table below presents the sensitivity of open electricity deriva-tives to fluctuations in electricity prices should the market price of electricity increase or decrease by 10 percent, while other factors are expected to remain unchanged. These figures are calculated before taxes. Electricity derivatives recorded at fair value affect the profit and loss statement. Any changes in the value of electricity derivatives that meet the criteria for hedge accounting as set forth in IAS 39 have an impact on shareholders’ equity.
M€ 2017 2016Change in shareholders' equity +/- 0.5 +/- 0.5
28. Derivative contracts and hedge accounting
M€ 2017 2016Nominal valueInterest rate derivatives 100.0 50.0Interest rate swaps 70.0 20.0Interest rate options
Foreign currency derivatives:Forward agreements 199.7 173.6 - not under hedge accounting 12.7 14.1 - under hedge accounting
Commodity derivatives:Forward agreements 4.7 5.8 - under hedge accountingEnergy, MWh 186,215 210,250
M€ 2017 2016
Posi
tive
fair
valu
e
Neg
ativ
e fa
ir va
lue
Net
fair
va
lue
Pos
itive
fair
valu
e
Neg
ativ
e fa
ir va
lue
Net
fair
valu
e
Fair valueInterest rate derivativesInterest rate swaps 0.0 -0.5 -0.5 - -1.5 -1.5Interest rate options 0.0 - 0.0 0.1 - 0.1
Foreign currency derivatives:Forward agreements- not under hedge accounting 1.7 -0.8 0.9 1.6 -2.1 -0.5- under hedge accounting 0.2 - 0.2 - -0.1 -0.1
Commodity derivatives:Electricity derivatives- under hedge accounting 0.5 -0.1 0.4 0.2 -0.4 -0.2
Changes in the fair values of electricity and interest rate derivatives designated as cash flow hedges are recognised in other comprehen-sive income to the extent that the hedge is effective.
From electricity derivatives a gain of €0.4 (0.8) million was booked to other comprehensive income during the financial period.
From interest rate derivatives a gain of €0.8 (0.6) million was entered into other comprehensive income during the financial period. The tax impact has been taken into account in the amount. No ineffectiveness has been booked.
29. Capital management
The purpose of the Group’s capital management is to create an efficient capital structure in order to ensure normal operational preconditions and growth opportunities and, thereby, to increase long-term shareholder return.
In addition to investment decisions, dividend distribution is a key factor affecting the capital structure. The Group’s long-term goal is to pay a basic dividend which represents at least 50 percent of annual earnings per share.
The Group’s capital structure developments are monitored by means of gearing. Gearing is calculated by dividing net interest-bearing liabilities by total equity. Net interest-bearing liabilities include interest bearing liabilities less cash and cash equivalents. The Group’s target is to keep its gearing between 30 and 70 percent across quarters. In 2017, gearing average across quarters was 58.4 (56.7) per cent.

94 • Uponor Annual Report 2017 – Notes to the consolidated financial statements
M€ 2017 2016Interest-bearing liabilities 258.5 175.8Cash and cash equivalent 107.0 16.3Restricted cash 0.0 0.0Net interest-bearing liabilities 151.5 159.5
Total equity 348.4 326.9
Gearing, % 43.5 48.8
Gearing across quarters, % 58.4 56.7
Group’s financial agreements include typical covenant clauses regarding the gearing and interest cover ratio. The realised ratio levels have clearly fulfilled the covenant clauses.
30. Management incentive programmes and share based payments
Uponor has long-term share based incentive plans for its key manage-ment. The existing plans are described below.
The plan 2017–2019, announced in December 2016, covers approxi-mately 30 Group key managers, including the members of the Executive Committee. The plan is based on achieving the company’s performance targets over a three year period, the earned reward will correspond to a maximum total of 300,000 Uponor Corporation shares, including the proportion to be paid in cash.
The plan 2016–2018, covers approximately 25–30 Group key managers, including the members of the Executive Committee. The plan is based on achieving the company’s performance targets over a three year period, the earned reward will correspond to a maximum total of 300,000 Uponor Corporation shares, including the proportion to be paid in cash.
The plan 2015–2017 covers a maximum of 25 key managers of the Group including Executive Committee members. The plan is based on achieving the company’s performance targets over a three year period, the earned reward will correspond to a maximum total of 350,000 Uponor Corporation shares, including the proportion to be paid in cash.The management incentive scheme impact on the Group’s operating profit is €-1.1 (-0.8) million, on equity it is €0.4 (0.4) million and the liabil-ity reserved for paying any related income taxes for scheme participants is €1.2 (0.7) million.
In addition, on 13 December 2017 the Board resolved to continue the key management performance share plan mechanism resolved by the Board in 2014. Approximately 50 Group key managers, including the members of the Executive Committee, belong to the target group of the new plan. The plan covers the calendar years 2018–2020 and is based on achieving the company’s performance targets over a three year period, the earned reward will correspond to a maximum total of 400,000 Uponor Corporation shares, including the proportion to be paid in cash. This did not have any impact on the consolidated financial statements 2017.
31. Interests in subsidiaries and non-controlling interests
Subsidiaries are listed in the note 32 Related party transactions.Uponor Corporation’s subsidiary Uponor Infra Oy has material
non-controlling interest as a result of its ownership structure. Uponor Corporation has control in Uponor Infra Oy through the 55.3 per cent direct ownership and the voting ownership by holding the Chair position in the board of directors of Uponor Infra Oy. KWH Group Ltd has 44.7 per cent ownership in Uponor Infra Oy. Uponor Infra Oy is a parent company of a subgroup and its consolidated financials are presented below. The structure of this subgroup is presented in the list of subsidiaries.
Non
-con
trolli
ng
inte
rest
, pr
opor
tion
of
owne
rshi
p
Pro
fit fo
r the
pe
riod
attri
buta
ble
to n
on-c
ontro
lling
in
tere
st
Equ
ity a
ttrib
utab
le
to n
on-c
ontro
lling
in
tere
st
Company name and location 2017 2016 2017 2016 2017 2016Uponor Infra Oy, Finland, Helsinki 44.7% 44.7% 4.9 -0.3 68.2 63.6
Financial information on Uponor Infra Oy’s consolidated financial statements:
M€ 2017 2016Net sales 323.4 287.9Profit for the period 11.1 -0.7Total comprehensive income for the period 10.3 -0.3
Profit for the period attributable to - Equity holders of parent company 11.1 -0.7
Total comprehensive income for the period - Equity holders of parent company 10.3 -0.3
Non-current assets 81.3 83.6Current assets 130.8 113.4
Non-current liabilities 8.4 9.6Current liabilities 60.7 54.7
Cash flow from operations 13.0 12.8Cash flow from investments -6.1 -14.0Cash flow from financing -6.4 -1.6
Uponor Infra Oy did not pay any dividends in 2017 or in the compari-son period to its owners.

Uponor Annual Report 2017 – Notes to the consolidated financial statements • 95
32. Related party transactions
Uponor Group’s related parties include subsidiaries and associates as well as Board members, the President and CEO, and Executive Committee members.
The related party transactions disclosed consist of transactions carried out with related parties that are not eliminated in the consoli-dated financial statements.
Executive Committee and Board remuneration
T€ 2017 2016Executive Committee remunerationRemuneration 3,039.5 2,862.2Post-employment benefits - defined contribution plans 357.2 320.0Share based benefits 583.5 659.1Total 3,980.2 3,841.3
Executive Committee remuneration includes salaries, fringe benefits and short term incentives.
Post-employment benefits include expenses accrued in accord-ance with local legal pension arrangements for the members of the Executive Committee and expenses related to defined contribution pension insurances taken in addition to the President and CEO. The Group does not have any other commitments related to post-employment benefits.
Share based benefits include accrued expenses relating to man-agement long term incentive schemes (further details in the note 30).
Remuneration of the President and CEO is also included in the table presented above.
T€ 2017 2016Executive Committee remuneration: the President and CEOLuomakoski, Jyri, President and CEO 811.9 820.9
The retirement age of the President and CEO will be determined in accordance with the Employees’ Pensions Act (TyEL), however the Group and the President and CEO may jointly agree for the President and CEO to retire at the age of 63 years. The President and CEO’s pension accrues in accordance with the Employee’s Pensions Act (TyEL). The Group has also taken a defined contribution pension insur-ance for the President and CEO, to which the company paid €40,000 in 2017.The Group has further concluded a pension arrangement based on a capitalisation agreement for the benefit of the President and CEO, to which the Group paid €50,000 in 2017.
T€ 2017 2016Board remunerationEloranta Jorma, Chair 98.8 97.6Paasikivi Annika, Deputy Chair, Chair of the Audit Committee 62.2 60.4Lengauer Markus 59.0 56.6Nygren Eva 54.2 54.2Rosendal Jari 54.2 52.4Aaltonen-Forsell Pia, from 20 March 2017 52.4 -Ihamuotila Timo, until 20 March 2017 1.8 57.4Total 382.6 378.6
The Company has taken a voluntary pension insurance for Board members. Upon retirement, this entitles them to a pension according to TyEL, the Finnish Employees’ Pensions Act.
Other related party disclosuresThe Group had not issued any loans to the persons classified as related party on 31 December 2017 or 31 December 2016.
Persons classified as related party to the company have carried out minor transactions with companies belonging to the Group.
The shareholdings of the management and Board members are presented under the Corporate Governance section of the Financial Statements.
M€ 2017 2016Transactions with associated companiesContinuing operationsPurchases 2.4 1.9
Balances at the end of periodAccounts payable and other liabilities 0.2 0.1

96 • Uponor Annual Report 2017 – Notes to the consolidated financial statements
Shares and holdings
Subsidiaries
Name Country and domicileUponor Beteiligungs GmbH Germany, Hassfurt
Uponor GmbH Germany, HassfurtUponor S.A.R.L. France, Saint Quentin
FallavierUponor S.r.l. Italy, Badia Polesine
Uponor Holding GmbH Germany, HassfurtZent-Frenger GmbH Germany, HeppenheimKaMo GmbH Germany, EhingenDelta Systemtechnik GmbH (95% Uponor Holding GmbH, 5% KaMo Frischwarmwassersysteme GmbH) Germany, Celle
Uponor Hispania, S.A.U. Spain, MóstolesUponor A/S Denmark, BrøndbyUponor Eesti Oü Estonia, TallinnUponor Suomi Oy Finland, LahtiUponor Business Solutions Oy Finland, VantaaUWater Oy Finland, TampereUponor Asia Oy Finland, Helsinki
Uponor Korea Co., Ltd. Korea, Kyungki-doUponor (China) Plumbing Systems Co., Ltd. China, TaicangUponor Hong Kong Ltd Hong Kong
Uponor Kft. (Uponor Épuletgépészeti Korlátolt Felelösségu Társaság) Hungary, BudapestSIA Uponor Latvia Latvia, RigaUAB Uponor Lithuania, VilniusUponor, s.r.o. Czech Rep., PragueUponor AS Norway, VestbyUponor Sp. z o.o. Poland, PlonieUponor Portugal - Sistemas para Fluidos, Lda. Portugal, V.N. GaiaUponor AG Switzerland, Pfungen JSC "Uponor Rus" Russia, MoscowUponor Innovation AB Sweden, BoråsUponor AB Sweden, Virsbo
Uponor Vertriebs GmbH Austria, Wiener NeudorfUponor Limited England, Watford
Uponor Building Energy Limited England, WatfordUPONOR, s.r.o. Slovakia, BratislavaUponor NA Holding, Inc. USA, Delaware
Uponor NA Asset Leasing, Inc. USA, DelawareUponor NA Investment LLC USA, DelawareUponor North America, Inc. USA, Delaware
Tulsa Pipe Plant, Inc. (*) USA, DelawareHot Water Systems North America, Inc. USA, Delaware
Uponor Ltd. Canada, SaskatchewanRadiant Technology, Inc. USA, DelawareUponor, Inc. USA, Illinois
Uponor Innovations, LLC USA, Delaware
Name Country and domicileUponor Trading (Beijing) Co., Ltd. China, BeijingUponor Romania S.R.L. Romania, BucharestUponor Insurance Limited GuernseyUponor Pty Ltd Australia, SydneyUponor Infra Oy (55.3% Uponor Corporation, 44.7% KWH Group Ltd) Finland, Helsinki
Jita Oy Finland, VirratUponor Infra AB Sweden, VirsboUponor Infra A/S Denmark, HolbækUponor Infra AS Norway, VestbyUponor Infra Ltd. Canada, Mississauga
Uponor Infra Holding Corp. USA, DelawareUponor Infra Corp. USA, California
Uponor Infra Limited England, Milton KeynesUponor Infra Sp. z o.o. Poland, WarsawUponor Infra Oü Estonia, TartuKoy Tuusulan Pakkasraitti 12 Finland, TuusulaKWH PIPE (INDIA) LIMITED (*) India, MumbaiUponor Infra Fintherm a.s. Czech Rep., PragueKWH Pipe Espana SA (*) Madrid, SpainKWH Pipe (Portugal) Tubos Lda. (*) Portugal, Palmela
Associated companies and joint ventures
Name Country and domicilePunitec GmbH & Co. KG (36%) Germany, GochsheimPunitec Verwaltungs GmbH (36%) Germany, GochsheimPhyn Oy (37.5%) Finland, HelsinkiPhyn LLC (37.5%) USA, Delaware
(*) Dormant company
33. Events after the balance sheet date
On 13 February, Uponor announced its decision to invest an addi-tional USD10 million in Phyn, a smart water technology joint venture between Uponor and Belkin International, bringing its total investment in the company to USD25 million. After this investment, Uponor will have a 50 percent ownership in Phyn, both in the U.S. and in Europe, with the other 50 percent owned by Belkin. As a joint-venture company, Phyn will be consolidated into Uponor’s financial accounts using the equity method.

Uponor Annual Report 2017 – Parent company financial statements (FAS) • 97
Parent company financial statements (FAS)Parent company income statement
M€ Note 2017 % 2016 %Net sales 2 11.3 100.0 12.3 100.0
Personnel expenses 4 6.4 56.1 6.7 54.9Depreciation and impairments 5 0.2 1.8 0.2 1.4Other operating expenses 3 11.5 101.8 11.5 93.5
Operating loss -6.8 -59.6 -6.1 -49.8
Financial income and expenses 6 44.8 395.1 32.5 265.5
Profit before appropriations and taxes 38.0 335.5 26.4 215.7
Appropriations 7 2.3 20.4 14.1 115.1Income taxes 8 -0.3 -2.3 -1.7 -13.5Profit for the period 40.0 353.6 38.9 317.4

98 • Uponor Annual Report 2017 – Parent company financial statements (FAS)
Parent company balance sheet
M€ Note 31 Dec 2017 31 Dec 2016Assets
Non-current assets
Intangible assetsIntangible rights 0.3 0.3Total intangible assets 9 0.3 0.3
Tangible assetsMachinery and equipment 0.2 0.1Total tangible assets 9 0.2 0.1
Non-current investmentsShares in subsidiaries 290.4 305.5Shares in associated companies 1.6 1.6Other shares and holdings 0.0 0.0Loan receivables 214.0 225.9Total non-current investments 10 506.0 533.0
Total non-current assets 506.5 533.4
Current assets
Non-current receivablesDeferred tax assets 0.3 0.4Total non-current receivables 11 0.3 0.4
Current receivablesAccounts receivable 0.9 3.2Loan receivables 34.5 7.3Accruals 4.7 1.0Other receivables 57.5 60.0Total current receivables 12 97.6 71.6
Cash and cash equivalents 86.0 3.6
Total current assets 183.9 75.5
Total assets 690.4 608.9
M€ Note 31 Dec 2017 31 Dec 2016Liabilities and shareholders' equity
Shareholders' equity
Share capital 146.4 146.4Share premium 50.2 50.2Unrestricted equity 0.1 0.1Retained earnings 108.9 103.6Profit for the period 40.0 38.9Total shareholders' equity 13 345.6 339.2
Accumulated appropriationsDepreciation difference 0.2 0.2Total accumulated appropriations 0.2 0.2
Provisions 14 1.7 1.8
Liabilities
Non-current liabilitiesBonds 0.0 80.0Loans from financial institutions 170.0 70.0Total non-current liabilities 15 170.0 150.0
Current liabilitiesBonds 80.0 0.0Accounts payable 1.1 1.4Accruals 2.0 4.2Other current liabilities 89.8 112.2Total current liabilities 16 172.9 117.8
Total liabilities 342.9 267.8
Total liabilities and shareholders' equity 690.4 608.9

Uponor Annual Report 2017 – Parent company financial statements (FAS) • 99
Parent company cash flow statement
M€ 1 Jan–31 Dec 2017 1 Jan–31 Dec 2016Cash flow from operations
Operating profit / loss -6.8 -6.1Depreciation 0.2 0.2Other non-cash items -0.1 -0.8
Income taxes paid -2.5 0.0Net cash from operations -9.2 -6.7
Change in working capitalReceivables 3.0 -18.1Non-interest-bearing liabilities -0.8 3.1Change in working capital 2.2 -15.0
Dividends received 54.7 29.9Group contributions 14.1 7.6Cash flow from operations 61.8 15.8
Cash flow from investmentsPurchase of fixed assets -0.3 -0.1Purchase of investments 0.0 -1.6Other current investments -10.0 0.0Income from sales of other investments 0.0 0.0Granted loans -42.1 -65.0Loan repayments 15.4 10.6Changes in investments in subsidiaries 0.7 -4.6Share divestments and result of subsidiary liquidations 0.0 0.1Interests received 6.9 5.9Dividends received 0.0 0.0Cash flow from investments -29.4 -54.7
Cash flow before financing 32.4 -38.9
Cash flow from financingBorrowings of debt 267.0 95.0Repayments of debt -167.0 -45.0Change in other short term debt -14.1 -5.7Interests paid -2.3 -2.1Dividends paid -33.6 -32.2Cash flow from financing 50.0 10.0
Change in cash and cash equivalents 82.4 -29.0
Cash and cash equivalents at 1 January 3.6 32.6Cash and cash equivalents at 31 December 86.0 3.6Changes according to balance sheet 82.4 -29.0

100 • Uponor Annual Report 2017 – Notes to the parent company financial statements
Notes to the parent company financial statements
1. Accounting principles
The parent company’s financial statements have been prepared according to Generally Accepted Accounting Principles in Finland. Uponor Group´s financial statements have been prepared in accord-ance with International Financial Reporting Standards (IFRS), and the parent company observes the Group’s accounting policies whenever this has been possible. Presented below are principally the account-ing policies in which the practice differs from the Group’s accounting policies. In other respects, the Group’s accounting policies are applied.
Net salesParent company’s business consists of Group functions and turnover of the service charges to the Group companies.
Loan arrangement feeLoan arrangement fee has been accrued linearly to current assets.
Pension arrangementsThe company’s pension liabilities are handled through a pension insur-ance company. All expenses incurred in pension benefits are recorded as expenses in the period during which the corresponding work was performed.
Financial assets, financial liabilities and derivative contractsDerivatives are measured at their fair value, which are based on market prices on the closing day. Changes in the value of financial assets and liabilities, including derivatives, are recorded as gain or loss through profit and loss as financial income and expenses. Changes in the fair value of different derivative groups are shown in the Note 6. Parent company does not apply hedge accounting. Otherwise the methods of measuring derivative contracts are explained in the section on the Group’s accounting standards. The fair values of different derivative groups are shown in the note 18. The use of derivatives is described in the note 28 in Group notes to the consolidated financial statements.
LeasesAll leasing payments have been treated as rental expenses.
2. Net sales
M€ 2017 2016Income from services- From group companies 11.3 12.3Total 11.3 12.3
3. Other operating expenses
M€ 2017 2016Other operating expensesTravel expenses 0.6 0.5Purchased services 2.4 2.9Other 8.5 8.0Total 11.5 11.5
M€ 2017 2016Auditor's fees- Audit fees 0.1 0.1- Tax advice 0.0 0.0- Other services 0.0 0.0
4. Personnel expenses
M€ 2017 2016Salaries and bonuses 5.5 5.7Pension expenses 0.7 0.7Other personnel expenses 0.2 0.3Total 6.4 6.7
During financial period company employed:Employees, average 53 47
Salaries and emoluments paid to the President and CEO and the board of directors T€ *)
President and CEO 811.9 820.9Board of Directors 382.6 378.6Total 1,194.5 1,199.5
*) specification per persons has been reported in the notes of the consolidated financial statements.
Loans to company directors
At 31 December 2017, neither the President and CEO of the company nor the members of the Board of Directors had loans outstanding from the company or its subsidiaries.
President and CEO’s pension obligations
The retirement age of the President and CEO will be determined in accordance with the Employee’s Pension Act (TyEL), however, both the company and the President and CEO may jointly agree on the President and CEO to retire at the age of 63 years.
The President and CEO’s pension accrues in accordance with the Employee’s Pension Act (TyEL). The company has also taken out a defined contribution pension insurance for the President and CEO, to which the company paid €40,000 in 2017. The company has further

Uponor Annual Report 2017 – Notes to the parent company financial statements • 101
concluded a pension arrangement based on capitalisation agreement for the benefit of the President and CEO to which the company has paid €40,000 in 2016. In 2016, the Board decided to increase the payment based on the capitalisation agreement by €10,000, in such a manner that the company payment in 2017 was €50,000.
5. Depreciations
M€ 2017 2016Intangible assets 0.1 0.1Tangible assets 0.1 0.1Total 0.2 0.2
6. Financial income and expenses
M€ 2017 2016Interest income 0.1 0.1Intercompany interest income 10.4 7.1Dividend income 0.0 0.0Dividend income from subsidiaries 54.7 29.9
Interest expenses -3.2 -4.1Intercompany interest expenses -0.1 0.0
Other financial expenses -0.1 -0.1Other financial income 0.0 0.1
Impairments on non-current investments -14.4 -
Gains and losses from derivativesRealised 7.1 -4.3Unrealised 0.9 0.7
Exchange differencesRealised 0.6 -1.4Unrealised -11.2 4.5Financial income and expenses total 44.8 32.5
7. Appropriations
M€ 2017 2016Change in depreciation difference 0.0 0.0Group contributions 2.3 14.1Total 2.3 14.1
8. Income taxes
M€ 2017 2016For the financial period 0.0 -1.5For previous financial periods -0.3 0.0Change in deferred taxes 0.0 -0.2Total -0.3 -1.7
9. Intangible and tangible assets
2017 M€ In
tang
ible
rig
hts
Mac
hine
ry
and
equi
pmen
t
Inta
ngib
le
and
tang
ible
as
sets
Acquisition costs 1 Jan 2.9 0.5 3.4Increases 0.2 0.2 0.4Acquisition costs 31 Dec 3.1 0.7 3.8
Accumulated depreciations 1 Jan 2.6 0.5 3.1Depreciation for the financial period 0.1 0.1 0.2Accumulated depreciations 31 Dec 2.7 0.6 3.3
Book value 31 December 0.3 0.2 0.5
2016 M€ In
tang
ible
rig
hts
Mac
hine
ry
and
equi
pmen
t
Inta
ngib
le
and
tang
ible
as
sets
Acquisition costs 1 Jan 2.8 0.5 3.3Increases 0.1 0.0 0.1Acquisition costs 31 Dec 2.9 0.5 3.4
Accumulated depreciations 1 Jan 2.5 0.4 2.9Depreciation for the financial period 0.1 0.1 0.2Accumulated depreciations 31 Dec 2.6 0.5 3.1
Book value 31 December 0.3 0.1 0.4

102 • Uponor Annual Report 2017 – Notes to the parent company financial statements
10. Non-current investments
M€ 2017 2016Shares in subsidiaries book value 1 Jan 305.5 285.0Increases 0.0 20.4Decreases 0.8 0.0Shares in subsidiaries acquisition cost 31 Dec 304.7 305.5
Impairments 14.4 -
Shares in subsidiaries book value 31 Dec 290.3 305.5
Associated companies 1 Jan 1.6 0.0Increases 0.0 1.6Associated companies 31 Dec 1.6 1.6
Other shares and holdings 1 Jan 0.0 0.0Decreases 0.0 0.0Other shares and holdings 31 Dec 0.0 0.0
Loans receivables- From group companies 208.8 220.6- Subordinated loan 5.0 5.0- Others 0.2 0.3Loan receivables total 214.0 225.9
Total 506.0 533.0
Impairments in subsidiary shares in 2017 were related to Uponor Ltd and Uponor Hispania shares.
11. Non-current receivables
M€ 2017 2016Deferred tax assets 0.3 0.4Total 0.3 0.4
Deferred tax asset is recorded for obligatory provisions in the balance sheet. Deferred tax asset includes short-term tax assets totalling €0.06 million.
12. Current receivables
M€ 2017 2016From group companies- accounts receivable 0.9 3.2- loan receivable 34.5 7.3- accruals 3.3 0.6- other receivables 44.8 57.6Total 83.5 68.7
M€ 2017 2016From external parties- loan receivable 0.0 0.0
From external parties- accounts receivable 0.0 0.0- accruals 1.4 0.4- other receivables 12.7 2.4Total 14.1 2.8
Total current receivables 97.6 71.6
AccrualsInterest income 3.4 0.6Taxes 1.0 0.1Others 0.3 0.3Total 4.7 1.0
13. Changes in equity
M€ 2017 2016Restricted equity
Share capital on 1 Jan 146.4 146.4Share capital on 31 Dec 146.4 146.4
Share premium on 1 Jan 50.2 50.2Share premium on 31 Dec 50.2 50.2
Total restricted equity 196.6 196.6
Unrestricted equity
Unrestricted equity 1 Jan 0.1 0.1Unrestricted equity 31 Dec 0.1 0.1
Retained earnings 1 Jan 142.5 135.6Dividend payments -33.7 -32.2Treasury shares 0.1 0.2Retained earnings 31 Dec 108.9 103.6
Profit for financial period 40.0 38.9
Total unrestricted equity 149.1 142.6
Shareholders' equity 31 December 345.7 339.2
Distributable fundsUnrestricted equity 0.1 0.1Retained earnings 109.4 104.2Profit for the period 40.0 38.9Treasury shares -0.4 -0.5Distributable funds 31 Dec 149.1 142.6

Uponor Annual Report 2017 – Notes to the parent company financial statements • 103
14. Provisions
M€ 2017 2016Environmental provision 1.7 1.8Total 1.7 1.8
15. Non-current liabilities
M€ 2017 2016Bonds 0.0 80.0Loans from financial institutions 170.0 70.0Total 170.0 150.0
Maturity of non-current interest bearing liabilities
M€ 2020 2021 2022Loans from financial institutions 50.0 20.0 100.0
16. Current liabilities
M€ 2017 2016From group companies- accounts payable 0.4 0.1- other current liabilities 87.8 107.8Total 88.2 107.9
From external parties- bonds 80.0 0.0- accounts payable 0.7 1.3- accruals 2.0 4.2- other current liabilities 2.1 4.4Total 84.8 9.9
Total current liabilities 172.9 117.8
Accrued liabilitiesPersonnel expenses 0.9 1.1Bonuses 0.5 0.8Taxes 0.2 1.6Interest 0.2 0.3Others 0.2 0.4Total 2.0 4.2
17. Contingent liabilities
M€ 2017 2016- on behalf group companiesGuarantees issued 46.8 53.5Guarantees issued 46.8 53.5
Operating lease commitmentsDue within next 12 months 0.2 0.2Due later 0.1 0.1Total lease commitments 0.3 0.3
The parent company has a 10 years fixed-term rental agreement on its premises. Rental period started on 1 March 2013.
Rental lease obligationsDue within next 12 months 0.6 0.6Due later 2.5 3.1Total rental lease obligations 3.1 3.7
Total 50.2 57.5
Letter of Comfort commitments undertaken on behalf of subsidiaries are not included in the above figures.
18. Derivative contracts
M€ 2017 2016Nominal value
Interest derivatives:Interest rate swaps 100.0 50.0Interest rate options 70.0 20.0
Fair valueInterest derivatives:Interest rate swaps -0.5 -1.5Interest rate options 0.0 0.1
Nominal valueForeign currency derivatives:Forward agreements 211.9 187.7Intragroup forward agreements 96.8 102.0
Commodity derivatives:Electricity derivatives 4.7 5.8Energy, MWh 186,215 210,250
Fair valueForeign currency derivatives:Forward agreements 1.1 -0.6Intragroup forward agreements 1.8 0.9
Commodity derivatives:Electricity derivatives 0.4 -0.2

104 • Uponor Annual Report 2017 – Auditor’s report
Auditor’s reportTo the Annual General Meeting of Uponor Corporation
Report on the Audit of Financial Statements
OpinionWe have audited the financial statements of Uponor Corporation (business identity code 0148731-6) for the year ended 31 December, 2017. The financial statements comprise the consolidated statement of financial position, income statement, statement of comprehensive income, statement of changes in equity, statement of cash flows and notes, including a summary of significant accounting policies, as well as the parent company’s balance sheet, income statement, statement of cash flows and notes.
In our opinion• the consolidated financial statements give a true and fair view of
the group’s financial position, financial performance and cash flows in accordance with International Financial Reporting Standards (IFRS) as adopted by the EU,
• the financial statements give a true and fair view of the parent company’s financial performance and financial position in accordance with the laws and regulations governing the preparation of financial statements in Finland and comply with statutory requirements.
Our opinion is consistent with the additional report submitted to the Audit Committee.
Basis for OpinionWe conducted our audit in accordance with good auditing practice in Finland. Our responsibilities under good auditing practice are further described in the Auditor’s Responsibilities for the Audit of Financial Statements section of our report.
We are independent of the parent company and of the group com-panies in accordance with the ethical requirements that are applicable in Finland and are relevant to our audit, and we have fulfilled our other ethical responsibilities in accordance with these requirements.
In our best knowledge and understanding, the non-audit services that we have provided to the parent company and group companies are in compliance with laws and regulations applicable in Finland regarding these services, and we have not provided any prohibited non-audit services referred to in Article 5(1) of regulation (EU) 537/2014.
The non-audit services that we have provided have been disclosed in note 4 to the consolidated financial statements.
We believe that the audit evidence we have obtained is sufficient and appropriate to provide a basis for our opinion.
Key Audit MattersKey audit matters are those matters that, in our professional judgment, were of most significance in our audit of the financial statements of the current period. These matters were addressed in the context of our audit of the financial statements as a whole, and in forming our opinion thereon, and we do not provide a separate opinion on these matters.
We have also addressed the risk of management override of internal controls. This includes consideration of whether there was evidence of management bias that represented a risk of material misstatement due to fraud.
Key audit matter How our audit addressed the key audit matter
Goodwill impairment assessments
Refer to Note 10Consolidated financial statements includes goodwill of EUR 93,6 million. Management has conducted annual goodwill impairment testing and as a result of the testing conducted, management assessed that no impairment was needed.Goodwill impairment testing requires substantial management judgment over the projected future business performance, cash flows and applied discount rate. Certain assumptions made by management in the impairment review are key judgments, including gross profit rate, net sales and discount rates used. As described in note 10, management concluded that goodwill related to Uponor Infra, EUR 17.1 million, is more sensitive to risk of impairment. This matter is a significant risk of material misstatement referred to in EU Regulation No 537/241, point (c) of Article 10(2).
As part of our audit procedures we assessed the key assumptions by each cash generating unit in impairment testing performed by management by:• assessing the growth and profitability estimates and comparing
them to historical performance;• comparing the estimates with the latest approved budgets and
strategic plans;• comparing applied discount rates to independent third party
sources;• testing the accuracy and the underlying calculations.
We also assessed the adequacy of the related disclosure information.

Uponor Annual Report 2017 – Auditor’s report • 105
Key audit matter How our audit addressed the key audit matter
Provisions and contingent liabilities
Refer to Note 22 and 25.The provisions in total amounted to EUR 28.9 million in the consolidated financial statements of Uponor. In addition, the Group has disclosed significant open legal cases and other contingent liabilities in Note 25.The assessment of the existence of the present legal or constructive obligation, analysis of the probability of the related payment and analysis of a reliable estimate, requires management’s judgement to ensure appropriate accounting or disclosures.Due to the level of judgement relating to recognition, valuation and presentation of provisions and contingent liabilities, this is considered to be a key audit matter.
Our audit procedures included, among others, assessing the appropriateness of the management’s judgement. We assessed the completeness of provisions through review of minutes of the Board meetings and decisions. We also had discussions with the Group’s legal counsel and obtained formal confirmations from the Group’s external counsels where appropriate.We have assessed the appropriateness of presentation of the provisions and contingent liabilities in the consolidated financial statements.
Responsibilities of the Board of Directors and the President and CEO for the Financial StatementsThe Board of Directors and the President and CEO are responsible for the preparation of consolidated financial statements that give a true and fair view in accordance with International Financial Reporting Standards (IFRS) as adopted by the EU, and of financial statements that give a true and fair view in accordance with the laws and regula-tions governing the preparation of financial statements in Finland and comply with statutory requirements. The Board of Directors and the President and CEO are also responsible for such internal control as they determine is necessary to enable the preparation of financial statements that are free from material misstatement, whether due to fraud or error.
In preparing the financial statements, the Board of Directors and the President and CEO are responsible for assessing the parent company’s and the group’s ability to continue as going concern, disclosing, as applicable, matters relating to going concern and using the going concern basis of accounting. The financial statements are prepared using the going concern basis of accounting unless there is an intention to liquidate the parent company or the group or cease operations, or there is no realistic alternative but to do so.
Auditor’s Responsibilities in the Audit of Financial StatementsOur objectives are to obtain reasonable assurance on whether the financial statements as a whole are free from material misstatement, whether due to fraud or error, and to issue an auditor’s report that includes our opinion. Reasonable assurance is a high level of assur-ance, but is not a guarantee that an audit conducted in accordance with good auditing practice will always detect a material misstatement when it exists. Mis-statements can arise from fraud or error and are consid-ered material if, individually or in aggregate, they could reasonably be expected to influence the economic decisions of users taken on the basis of the financial statements.
As part of an audit in accordance with good auditing practice, we exercise professional judgment and maintain professional skepticism throughout the audit. We also:
• Identify and assess the risks of material misstatement of the financial statements, whether due to fraud or error, design and perform audit procedures responsive to those risks, and obtain audit evidence that is sufficient and appropriate to provide a basis for our opinion. The risk of not detecting a material misstatement resulting from fraud is higher than for one resulting from error, as fraud may involve collusion, forgery, intentional omissions, misrepresentations, or the override of internal control.
• Obtain an understanding of internal control relevant to the audit in order to design audit procedures that are appropriate in the circumstances, but not for the purpose of expressing an opinion on the effectiveness of the parent company’s or the group’s internal control.
• Evaluate the appropriateness of accounting policies used and the reasonableness of accounting estimates and related disclosures made by management.
• Conclude on the appropriateness of the Board of Directors’ and the President and CEO ’s use of the going concern basis of accounting and based on the audit evidence obtained, whether a material uncertainty exists related to events or conditions that may cast significant doubt on the parent company’s or the group’s ability to continue as a going concern. If we conclude that a material uncertainty exists, we are required to draw attention in our auditor’s report to the related disclosures in the financial statements or, if such disclosures are inadequate, to modify our opinion. Our conclusions are based on the audit evidence obtained up to the date of our auditor’s report. However, future events or conditions may cause the company to cease to continue as a going concern.
• Evaluate the overall presentation, structure and content of the financial statements, including the disclosures, and whether the financial statements represent the underlying transactions and events so that the financial statements give a true and fair view.
• Obtain sufficient appropriate audit evidence regarding the financial information of the entities or business activities within the group to express an opinion on the consolidated financial statements. We are responsible for the direction, supervision and performance of the group audit. We remain solely responsible for our audit opinion.

106 • Uponor Annual Report 2017 – Auditor’s report
We communicate with those charged with governance regarding, among other matters, the planned scope and timing of the audit and significant audit findings, including any significant deficiencies in internal control that we identify during our audit.
We also provide those charged with governance with a statement that we have complied with relevant ethical requirements regarding independence, and communicate with them all relationships and other mat-ters that may reasonably be thought to bear on our independence, and where applicable, related safeguards.
From the matters communicated with those charged with govern-ance, we determine those matters that were of most significance in the audit of the financial statements of the current period and are therefore the key audit matters. We describe these matters in our auditor’s report unless law or regulation precludes public disclosure about the matter or when, in extremely rare circumstances, we determine that a matter should not be communicated in our report because the adverse consequences of doing so would reasonably be expected to outweigh the public interest benefits of such communication.
Other Reporting Requirements
Information on our audit engagementWe were first appointed as auditors by the Annual General Meeting on 17 March 2010, and our appointment represents a total of uninter-rupted engagement of 8 years.
Other informationThe Board of Directors and the President and CEO are responsible for the other information. The other information comprises the report of the Board of Directors and the information included in the Annual
Report, but does not include the financial statements and our report thereon. We have obtained the report of the Board of Directors prior to the date of the auditor’s report, and the Annual Report is expected to be made available to us after that date.
Our opinion on the financial statements does not cover the other information.
In connection with our audit of the financial statements, our responsibility is to read the other information identified above and, in doing so, consider whether the other information is materially incon-sistent with the financial statements or our knowledge obtained in the audit, or otherwise appears to be materially misstated. With respect to report of the Board of Directors, our responsibility also includes considering whether the report of the Board of Directors has been prepared in accordance with the applicable laws and regulations.
In our opinion, the information in the report of the Board of Direc-tors is consistent with the information in the financial statements and the report of the Board of Directors has been prepared in accordance with the applicable laws and regulations.
If, based on the work we have performed on the other information that we obtained prior to the date of this auditor’s report, we conclude that there is a material misstatement of this other infor-mation, we are required to report this fact. We have nothing to report in this regard.
Other opinionsWe support that the financial statements should be adopted. The proposal by the Board of Directors regarding the treatment of distrib-utable funds is in compliance with the Limited Liability Companies Act. We support that the Board of Directors of the parent company and the President and CEO should be discharged from liability for the financial period audited by us.
Vantaa, 15 February 2018Deloitte OyAudit Firm
Jukka VattulainenAuthorised Public Accountant (KHT)

Uponor Annual Report 2017 – Quarterly data • 107
Quarterly data2017 2016
10–12 7–9 4–6 1–3 10–12 7–9 4–6 1–3Continuing operationsNet sales, M€ 279.4 317.5 308.4 265.1 268.9 284.1 299.5 246.9- Building Solutions – Europe 125.5 136.3 135.6 124.3 125.8 127.3 134.8 123.0- Building Solutions – North America 79.5 91.2 79.3 78.2 77.2 77.5 80.2 70.7- Building Solutions – North America, $ 94.2 106.8 88.7 83.5 82.7 86.3 90.0 78.2- Uponor Infra 75.4 90.6 94.3 63.1 67.2 80.9 85.8 54.1
Gross profit, M€ 95.0 109.3 98.4 91.4 85.9 96.8 105.5 87.8- Gross profit, % 34.0 34.4 31.9 34.5 32.0 34.1 35.2 35.5
Operating profit, M€ 18.0 40.4 22.9 14.6 7.5 25.1 26.5 11.9- Building Solutions – Europe 10.2 14.4 9.1 6.3 1.6 10.7 8.2 4.9- Building Solutions – North America 9.6 19.0 10.5 10.6 11.9 12.4 14.6 11.1- Building Solutions – North America, $ 11.5 21.9 11.7 11.4 12.7 13.8 16.3 12.3- Uponor Infra 1.8 7.4 4.7 -1.9 -5.0 2.7 5.1 -3.6- Others -2.5 0.2 -1.0 -0.9 -0.7 -0.1 -0.9 -0.7
Operating profit, % of net sales 6.4 12.7 7.4 5.5 2.8 8.8 8.8 4.8- Building Solutions – Europe 8.1 10.5 6.8 5.0 1.2 8.5 6.0 4.0- Building Solutions – North America 12.2 20.8 13.2 13.6 15.4 16.0 18.2 15.7- Uponor Infra 2.5 8.1 5.0 -3.0 -7.4 3.3 6.0 -6.7
Profit for the period, M€ 15.1 28.6 14.3 7.4 5.9 14.8 15.4 5.9
Balance sheet total, M€ 865.8 820.2 825.9 812.9 767.5 803.7 792.5 748.7
Earnings per share, € 0.19 0.35 0.18 0.11 0.11 0.19 0.19 0.09Equity per share, € 3.83 3.68 3.35 3.25 3.60 3.41 3.22 3.01Market value of share capital, M€ 1,228.4 1,073.2 1,164.7 1,216.0 1,208.6 1,206.5 1,038.1 934.1
Return on investment, % (p.a.) 16.3 19.4 13.6 9.9 14.1 16.9 15.3 8.9Net interest-bearing liabilities at the end of the period, M€ 151.5 161.8 208.9 224.0 159.5 177.5 175.1 176.5Gearing, % 43.5 48.2 67.6 74.5 48.8 56.6 58.5 62.4Gearing, % rolling 4 quarters 58.4 59.8 61.9 59.6 56.7 51.8 47.1 44.3
Gross investment, M€ 26.0 18.1 11.5 7.8 21.0 14.0 10.4 5.3- % of net sales 9.3 5.7 3.7 2.9 7.8 4.9 3.5 2.1


PEFC/02-31-146Printed matter
4041 0042
Layout: Innocorp OyPrinting: Markprint Oy, 2018Paper: LumiSilk 300g / Edixion 120g
Uponor Investor Relations App
Keep yourself up to date with Uponor’s latest share prices, company announcements, financial performance and events.
• Easy and intuitive • Offline support: content is available both online and offline• Global: 17 languages supported • Watch Uponor’s webcasts live or recorded • Monitor Uponor’s stock performance against other
companies of choice
www.appstore.com play.google.com

Uponor CorporationÄyritie 20P.O. Box 37FI-01511 VantaaFinland
Tel. +358 (0)20 129 211www.uponor.comwww.investors.uponor.com