ANNUAL REPORT 2014/15 - Department of Tourism Annual Report... · ANNUAL REPORT 2014/15 Department...
178
ANNUAL REPORT 2014/15
-
Upload
nguyenkhuong -
Category
Documents
-
view
218 -
download
3
Transcript of ANNUAL REPORT 2014/15 - Department of Tourism Annual Report... · ANNUAL REPORT 2014/15 Department...
ANNUAL REPORT 2014/15
Depa
rtmen
t of T
ours
im A
NN
UA
L RE
PORT
201
4/15
Physical address17 Trevenna Street, Tourism HouseSunnyside, Pretoria 0002
Postal addressPrivate Bag X424, Pretoria 0001
Contact informationCall centre: +27 (0) 860 121 929Call centre e-mail: [email protected] number: +27 (0) 12 444 6000Switchboard fax: +27 (0) 12 444 7000
www.tourism.gov.za
RP156/2015ISBN: 978-0-621-43644-0
Department of Tourism
@Tourism_gov_za
PART A General Information1
contents
PART A: GENERAL INFORMATION 3
1. GENERAL INFORMATION ABOUT THE DEPARTMENT 4
2. LIST OF ACRONYMS AND ABBREVIATIONS 5
3. FOREWORD BY THE MINISTER OF TOURISM 6
4. STATEMENT BY THE DEPUTY MINISTER OF TOURISM 8
5. REPORT BY THE ACCOUNTING OFFICER 10
6. STATEMENT OF RESPONSIBILITY FOR, AND CONFIRMATION
OF ACCURACY, OF THE ANNUAL REPORT 14
7. STRATEGIC OVERVIEW 15
7.1 Vision 15
7.2 Mission 15
7.3 Values 15
8. LEGISLATIVE AND OTHER MANDATES 16
9. ORGANISATIONAL STRUCTURE 17
10. ENTITY REPORTING TO THE MINISTER 18
PART B: PERFORMANCE INFORMATION 19
1. AUDITOR-GENERAL’S REPORT: PREDETERMINED OBJECTIVES 20
2. OVERVIEW OF DEPARTMENTAL PERFORMANCE 21
2.1 Service delivery environment 21
2.2 Service delivery improvement plan 23
2.3 Organisational environment 25
2.4 Key policy developments and legislative changes 25
3. STRATEGIC OUTCOME-ORIENTED GOALS 26
4. PERFORMANCE INFORMATION BY PROGRAMME 27
4.1 Programme 1: Administration 27
4.2 Programme 2: Policy and Knowledge Services 34
4.3 Programme 3: International Tourism 39
4.4 Programme 4: Domestic Tourism 43
5. TRANSFER PAYMENTS 49
5.1 Transfer payment to public entity: South African Tourism 49
5.2 Transfer payments to all organisations other than public entity 49
6. DONOR FUNDS 52
6.1 Donor funds received 52

Department of Tourism Annual Report 2014/152
PART C: GOVERNANCE 53
1. INTRODUCTION 54
2. RISK MANAGEMENT 54
3. FRAUD AND CORRUPTION 55
4. MINIMISING CONFLICTS OF INTEREST 55
5. CODE OF CONDUCT 56
6. HEALTH, SAFETY AND ENVIRONMENTAL ISSUES 56
7. PORTFOLIO COMMITTEE ON TOURISM AND SELECT COMMITTEE
ON TRADE AND INTERNATIONAL RELATIONS 56
8. SCOPA RESOLUTIONS 60
9. PRIOR MODIFICATIONS TO AUDIT REPORTS 60
10. INTERNAL CONTROL UNIT 60
11. INTERNAL AUDIT UNIT AND AUDIT COMMITTEE 60
12. AUDIT COMMITTEE REPORT 61
PART D: HUMAN RESOURCE MANAGEMENT 63
1. INTRODUCTION 64
2. OVERVIEW OF HUMAN RESOURCES 64
3. HUMAN RESOURCES OVERSIGHT STATISTICS 66
PART E: FINANCIAL INFORMATION 93
1. REPORT OF THE AUDITOR-GENERAL 94
2. ANNUAL FINANCIAL STATEMENTS 97
Cover photos (from left to right):
• Umhlanga Beach in Durban KwaZulu-Natal.
• Tourists walking to and from the Cape Point in the Western Cape.
• The Purple Onion Café in Clarens, Free State.
• Richtersveld Cultural and Botanical Landscape in the Northern Cape
- Photo by Richard Veillon, Copyright: UNESCO.
contents
PART AGENERAL INFORMATION
Department of Tourism Receptionist, Mabel Masemola assisting a client.
Department of Tourism Annual Report 2014/154
National office
Telephone number: +27 (0) 12 444 6000
Physical address: Tourism House, 17 Trevenna Street, Sunnyside, Pretoria 0002
Postal address: Private Bag X424, Pretoria 0001
Tourism call centre
Telephone number: +27 (0) 86 012 1929
E-mail address: [email protected]
Website address: www.tourism.gov.za
Facebook: Department of Tourism
Twitter: @Tourism_gov_za
1. GENERAL INFORMATION ABOUT THE DEPARTMENT
PART A General Information5
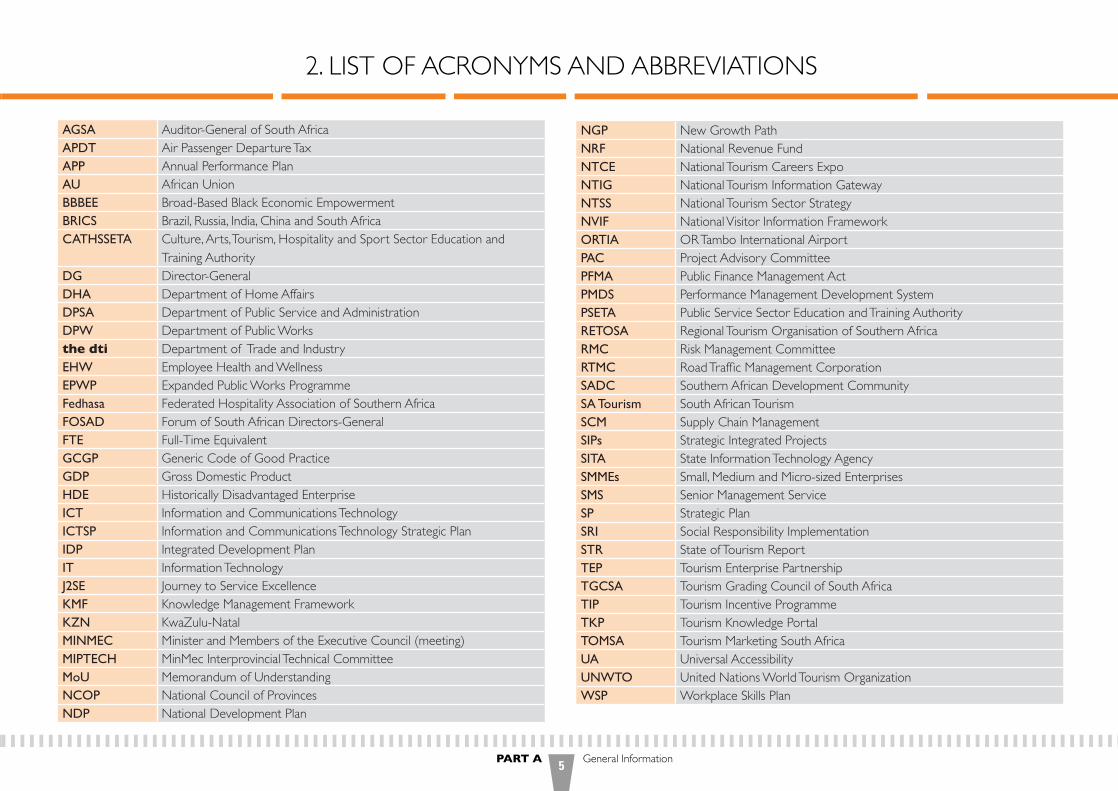
AGsA Auditor-General of South AfricaAPDt Air Passenger Departure TaxAPP Annual Performance PlanAU African UnionBBBee Broad-Based Black Economic EmpowermentBRIcs Brazil, Russia, India, China and South AfricacAtHssetA Culture, Arts, Tourism, Hospitality and Sport Sector Education and
Training AuthorityDG Director-GeneralDHA Department of Home AffairsDPsA Department of Public Service and AdministrationDPW Department of Public Worksthe dti Department of Trade and IndustryeHW Employee Health and WellnessePWP Expanded Public Works ProgrammeFedhasa Federated Hospitality Association of Southern AfricaFosAD Forum of South African Directors-GeneralFte Full-Time EquivalentGcGP Generic Code of Good PracticeGDP Gross Domestic ProductHDe Historically Disadvantaged EnterpriseIct Information and Communications TechnologyIctsP Information and Communications Technology Strategic PlanIDP Integrated Development PlanIt Information TechnologyJ2se Journey to Service ExcellenceKMF Knowledge Management FrameworkKZn KwaZulu-NatalMInMec Minister and Members of the Executive Council (meeting)MIPtecH MinMec Interprovincial Technical CommitteeMoU Memorandum of UnderstandingncoP National Council of ProvincesnDP National Development Plan
nGP New Growth PathnRF National Revenue Fundntce National Tourism Careers ExpontIG National Tourism Information Gatewayntss National Tourism Sector StrategynVIF National Visitor Information FrameworkoRtIA OR Tambo International AirportPAc Project Advisory CommitteePFMA Public Finance Management ActPMDs Performance Management Development SystemPsetA Public Service Sector Education and Training AuthorityRetosA Regional Tourism Organisation of Southern AfricaRMc Risk Management CommitteeRtMc Road Traffic Management Corporation sADc Southern African Development CommunitysA tourism South African TourismscM Supply Chain ManagementsIPs Strategic Integrated ProjectssItA State Information Technology AgencysMMes Small, Medium and Micro-sized EnterprisessMs Senior Management ServicesP Strategic PlansRI Social Responsibility ImplementationstR State of Tourism ReportteP Tourism Enterprise PartnershiptGcsA Tourism Grading Council of South AfricatIP Tourism Incentive ProgrammetKP Tourism Knowledge PortaltoMsA Tourism Marketing South AfricaUA Universal AccessibilityUnWto United Nations World Tourism OrganizationWsP Workplace Skills Plan
2. LIST OF ACRONYMS AND ABBREVIATIONS

Department of Tourism Annual Report 2014/156
3. FOREWORD BY THE MINISTER OF TOURISM
Tourism’s total contribution to the national economy for the period under review was R323 billion, supporting over 1,4 million jobs.
This performance firmly entrenches the tourism sector as a major contributor to national economic development. It reinforces tourism’s position as one of the six pillars of economic growth in our country.
The Department of Tourism’s Annual Report for 2014/15 demonstrates how the Department is delivering on its mandate to develop and promote responsible tourism for the benefit and the enjoyment of all our residents and visitors, as required by the Tourism Act, 2014 (Act 3 of 2014).
We are determined to build on the gains achieved in the past, implement innovative programmes in response to emerging challenges, and review key areas of our policy and operations to keep them aligned with the vision spelled out in the National Development Plan.
I am pleased that the Department continues on its path of good governance, with no unauthorised expenditure reported in the period under review. Management is also commended for recording a low vacancy rate of 6%.
The Department has achieved 85.62% of its targets for the period under review. Significant work was accomplished on a further 13.85% of the targets, with only 1.54% of targets not achieved.
These achievements are underpinned by a strategy that promotes the economic, social and environmental sustainability of tourism.
Transformation of the sector remains a fundamental objective. The Department has aligned the Tourism B-BBEE Codes with the dti’s revised Generic Codes of Good Practice.
To protect tourists and maintain ethical behaviour throughout the industry, a Tourism Complaints Officer was appointed, as required by the Tourism Act (Act 3 of 2014) to provide consumer protection.
The Department continues to provide skills training and product development, quality assurance and business support for Small, Medium and Micro-sized Enterprises. This programme has created 2 701 jobs and trained 1 203 enterprises during the period under review.
The strategy to use online platforms to provide information at Visitor Information Centres, to provide establishments with self-assessment tools for responsible tourism and to support municipal tourism development is innovative and effective. It recognises that our resources do not allow us to provide hands-on technical support in all areas of the country, and significantly increases access to information while reducing costs.
The Department is strengthening regional integration and cooperation with neighbouring countries. The inaugural Ministerial Session at Indaba 2014 included 16 African Tourism Ministers, who discussed the state of tourism in Africa and charted a path for the progressive growth of the sector on the continent.
The world is changing rapidly around us. The internet and mobile communications have fundamentally shifted the way in which tourism information is shared, destinations are marketed and transactions are concluded. To keep pace with this change, and to ride the wave of opportunity that comes with it, we must continuously review the way the tourism sector conducts business.
A panel was appointed to conduct an institutional review of South African Tourism by assessing the entity’s alignment with the public and private sector tourism landscape. The panel’s insights will be used to inform the entity’s direction in the years ahead, ensuring that it keeps pace with global trends and satisfies the country’s domestic and international marketing needs.
DeReK HAneKoM, MPMinister of Tourism

PART A General Information7
The Department has commenced the process of reviewing the National Tourism Sector Strategy to ensure that this strategy retains its relevance and responds to the constant global trends affecting the performance of the tourism industry. The review will strengthen strategic alignment with the Tourism Act, the broader economic government imperatives outlined in the National Development Plan, and the Medium-Term Strategic Framework.
I acknowledge the assistance and the valuable insights provided by stakeholders as we got to grips with the strategic issues affecting tourism in the first year of this term. We have developed many sound relationships, which will stand us in good stead as we move into the future.
I also appreciate our relationships with other government departments, especially those whose work has an impact on tourism. By working together, we can overcome the challenges we face as we forge ahead with growing our economy, developing our country and uplifting our people.
The commitment of the departmental management and staff, combined with stakeholder and inter-governmental liaison, contributed to the relatively good performance of the sector over this period.
I value the guidance and oversight role of the chairpersons and members of the Portfolio Committee in the National Assembly and the Select Committee on Trade and International Relations in the National Council of Provinces.
In the months ahead, we will accelerate the pace of transformation, review and adjust policy and operations where we are required to, and continue to seek out and implement best practice for the benefit of the sector and all who derive a livelihood from it.
We will continue promoting sustainable and responsible tourism to enhance South Africa’s competitive advantage as a destination, building on the recent international accolades achieved by several establishments. The Tourism Incentive Programme will help establishments become more sustainable, and our efforts to get more South Africans to enjoy the country will be invigorated through SA Tourism’s domestic marketing campaign.
As we strive to transform tourism, we rely on effective engagement and collaboration with all our partners to continue growing the sector sustainably, supporting jobs and creating a better life for all.
Derek Hanekom, MPMinister of Tourism
DereK haneKom, mpMinister of Tourism
Department of Tourism Annual Report 2014/158
Our first priority at the Department of Tourism will always be empowering the people of South Africa to participate productively and profitably in the economy, because people development is at the heart of socio-economic transformation in this dynamic sector.
We are working towards creating a symbiotic relationship between the development of our people and the growth of the sector. Knowledgeable and well-trained staff with a service excellence mindset will continue to create a positive experience for tourists, strengthening the brand reputation of South Africa and making this a desirable destination to visit.
In the year under review, we have made great strides in our journey towards an expanded tourism sector that builds incrementally, year-on-year, towards an inclusive and prosperous South Africa. We recognise that there can be no economic development without people development. By empowering our people, we give them the tools with which to participate in the economy in a meaningful way and take advantage of what South Africa has to offer.
At the coalface of the sector are our tourist guides, who are our chief ambassadors in translating South Africa in all its diversity for tourists. Registration with the relevant Provincial Registrar binds the guides to a prescribed code of conduct and ethics. We will continue our work in setting the agenda for service excellence amongst tourist guides in 2015/16.
Tourism has rightly been earmarked as a key sector for economic growth, transformation and job creation, as it is still one of the few sectors in the country that is human-capital-intensive. With this in mind, we escalated our focus on skills development in 2014/15 to further unlock the potential within tourism.
An innovative Food Safety Programme pilot has introduced a new career path within the hospitality sector. Unemployed hospitality and tourism graduates are being trained as Food Safety Assurers (FSAs) in hygienic food-handling, preparation and storage.
The Tourism Buddies, Chefs Who Share and Sommelier Programmes have all shown greatsuccess with the number of learners placed in experiential training positions in the sector.
Equally, we are empowering women in the tourism space to make their voices heard and prepare them to take the lead in driving the sector forward.
In 2014, the inaugural conference of what has become known as “Women in Tourism” was held. Stemming from this, a national mobilisation campaign has started that will see provincial chapters of the Women in Tourism Forum established, aimed at engaging women on issues such as economic empowerment (addressing funding constraints), the establishment of support structures and incentives for women, as well as creating a platform to celebrate women achievers. In 2015/16, we will continue to lobby the United Nations World Tourism Organization to collaborate with us on the development of women in our sector.
In collaboration with our stakeholder CATHSSETA, our successful National Tourism Careers Expo (NTCE) has become a best-practice example of exposing learners to career-streaming, entering its seventh sustainable year in existence in 2015/16.
The 2014/15 event held in East London, Eastern Cape, from 2-4 October 2014 expanded on the success of previous years with new platforms introduced. These included an aviation centre manned by South African Airways, an adventure corner and a student-preneur, which was facilitated by South African Youth in Travel, Tourism and Hospitality, with the support of the National Youth Development Agency and the South African Bureau of Standards. A total of 8 617 people participated in the NTCE. Certainly one of our outstanding success stories in 2014 has been the pilot of the Journey to Service Excellence programme, which caused great excitement in the Upington area of the
4. STATEMENT BY THE DEPUTY MINISTER OF TOURISM
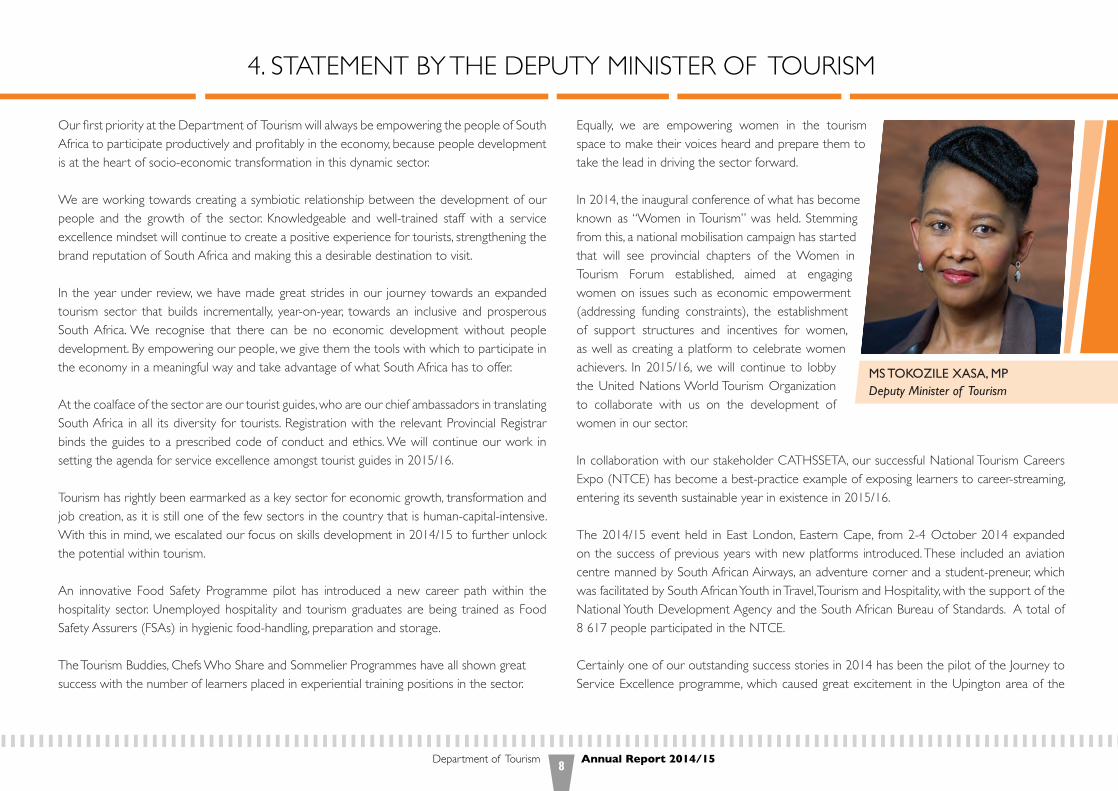
Ms toKoZILe XAsA, MPDeputy Minister of Tourism
PART A General Information9
Northern Cape province. Work in this town included workshops to shape a service excellence culture, applying community development principles. We looked at the extended value chain of tourism, including sectors that interface with tourists, such as banks, petrol stations and taxis. The initiative culminated with the presentation of a Service Hero Award to recognise community members with a service excellence mindset.
We now also have a Service Excellence Forum, which meets on a quarterly basis to share best practices, a Framework for Service Excellence, and a Service Excellence self-assessment tool for tourism product owners to measure themselves against the SANS 1197 standards.
Our Tourism Grading Council of South Africa is ensuring that both domestic and international tourists have a wide choice of quality-graded establishments that enhance their experience.
In 2014, our Department identified Universal Accessibility as an important initiative to enhance South Africa’s competitiveness in the global tourism quest to win tourist arrivals. We consulted widely with the tourism and hospitality sector and national disability organisations to come up with a set of minimum entry requirements and grading criteria to activate Universal Accessibility as part of our grading framework.
In addition to ensuring that current products and services in the sector live up to service excellence standards, the creation of new products and attractions takes centre stage. The approach we take is a collaborative process of working with our marketing implementation agency, SA Tourism, and a variety of industry stakeholders. Our rich liberation heritage provides
largely untapped niche tourism potential. We will be working closely with the Department of Arts and Culture and our provincial and local stakeholders to identify sites that can be leveraged in this way. Social Tourism is also a niche area that is currently being developed.
Another niche tourism opportunity lies in business and events tourism. This is enabled by the fact that South Africa provides cost-competitive options, while simultaneously providing a wealth of leisure, recreation and hospitality opportunities. The SA National Conventions Bureau (SANCB) focuses its efforts on attracting business events in economic sectors aligned with the NDP. The South African industry along with the SANCB also secured 177 business events for the country over the next five years with an estimated economic impact of R3,5 billion.
The year 2014/15 has been a busy and fruitful year in the tourism sector. The gains made in engineering long-term sustainable growth for our industry have been a collaborative effort. We appreciate the dedication of stakeholders in the sector who have so willingly partnered with us in driving our mandate, and especially that of the staff and management of the National Department of Tourism and South African Tourism, working diligently towards the goals we set ourselves in our 2014/15 strategy.
Ms Tokozile Xasa, MPDeputy Minister of Tourism
Ms toKoZILe XAsA, MPDeputy Minister of Tourism
Department of Tourism Annual Report 2014/1510
5.1 Overview of the operations of the Department
The legislative mandate of the Department of Tourism is the Tourism Act, 2014 (Act 3 of 2014), which aims to promote the practising of responsible tourism for the benefit of the Republic and for the enjoyment of all its residents and foreign visitors; provide for the effective domestic and international marketing of South Africa as a tourist destination; promote quality tourism products and services; promote growth in and the development of the tourism sector, and enhance cooperation and coordination between all spheres of government in developing and managing tourism.
The policy mandates of the Department are as follows:• The National Development Plan (NDP) is the 2030 vision for the country. It envisions rising
employment, productivity and incomes as a way of ensuring a long-term solution to achieve a reduction in inequality, an improvement in living standards and a dignified existence for all South Africans. The NDP recognises tourism as one of the main drivers of employment and economic growth;
• The New Growth Path (NGP) includes tourism as one of the six pillars of economic growth;• The National Tourism Sector Strategy (NTSS) provides a blueprint for the tourism sector
in the pursuit of growth targets contained in the (NGP); and• The White Paper on the Development and Promotion of Tourism in South Africa, 1996,
provides a framework and guidelines for tourism development and promotion in South Africa.
Tourism already contributes to considerable economic growth, services exports and social development. Tourist arrivals to South Africa continue to grow every year. Its direct and indirect contribution to our gross domestic product (GDP) is now R323 billion annually, which constitutes approximately 9.5% of total GDP. The tourism sector supports over 1,4 million jobs, representing some 10% of total employment in the country.
5.1.1 Achievements of the Department
The Minister has appointed the South African Tourism Board Review Panel to conduct an extensive review of SA Tourism. The panel will review SA Tourism’s institutional alignment and strategic focus in the context of the broader public and private-sector landscape for tourism marketing and tourism-sector governance.
The Tourism Incentive Programme (TIP) pilot was launched on 10 March 2015. This new incentive scheme aims to help tourism establishments become graded, seek out new markets and encourage establishments to retrofit themselves with renewable energy sources and diversifying and enhancing the product offering at iconic attractions to improve the overall destination competitiveness.
In respect of tourism protection, the Minister has in terms of section 45(1) of the Tourism Act, 2014 (Act 3 of 2014) designated an official of the Department as the tourism Complaints Officer, whose name was published in the Government Gazette. The mandate of the tourism complaints officer includes making recommendations to the Minister for the accreditation of schemes or arrangements within the tourism sector, resolving tourism complaints in terms of section 46 of the Tourism Act, referring complaints received in respect of tourism services, facilities or products to authorities who have jurisdiction to resolve them in the manner provided for in section 47 of the act, and integrating tourism protection with the broader spectrum of consumer protection. Working relationships with the National Consumer Commission and Provincial Consumer Affairs Offices have been established.
The Tourism B-BBEE Charter Council has undertaken a process to align the tourism B-BBEE codes with the Department of Trade and Industry’s (the dti) revised generic codes of good practice (GCGP). The codes have been finalised and submitted to the dti for gazetting.
The Department has continued implementing its agreement with the Tourism Enterprise Partnership (TEP) to ensure that small, medium and micro-sized enterprises (SMMEs) are supported to improve their performance and increase their profitability. The focus in the past financial year was on skills and product development, quality assurance and access to finance in order to actively support the creation of new jobs and the maintenance of existing ones. Through the partnership, 2 701 jobs were created, 466 rural enterprises supported, 35 enterprises mentored, 282 businesses supported with market access, 1 363 historically disadvantaged enterprises (HDEs) supported and 1 203 enterprises trained during the period under review.The Inaugural Indaba Ministerial Session was held in Durban in 2014 under the theme “Africa: Open for Tourism Business”. The ministerial session provided a platform for politicians and key industry players, whose mandate is to grow and develop travel and tourism on the African continent, to deliberate on emerging tourism trends, opportunities and challenges facing the tourism sector in Africa.
5. REPORT BY THE ACCOUNTING OFFICER
PART A General Information11
To empower tourism educators, seminars were hosted in nine provinces and a pilot placement programme was introduced. The programme places educators at tourism establishments with a view to exposing them to tourism operations, thereby enhancing their practical teaching.
The National Tourism Careers Expo (NTCE) was held in East London in 2014. The NTCE created platforms to stimulate the interest of learners, students and graduates in the tourism and hospitality industry.
The 2014 Journey to Service Excellence (J2SE) celebration was the final stage of a three-phase pilot programme that began in November 2013. The programme was aimed at improving service levels and creating a service-oriented culture in South Africa.
The Tourism Month and Tourism Day celebrations for the year 2014 were held in Kimberley. The celebrations focused on domestic tourism with the aim of encouraging South Africans to travel and explore their country.
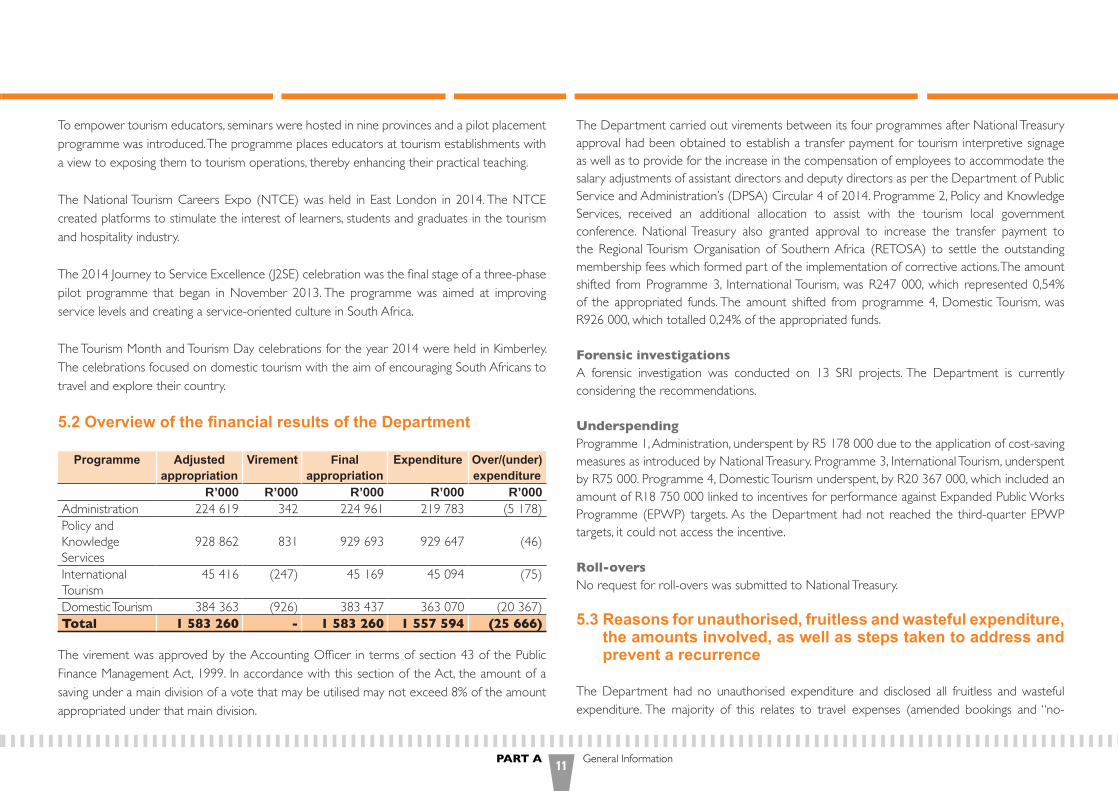
5.2 Overview of the financial results of the Department
Programme Adjusted appropriation
Virement Finalappropriation
Expenditure Over/(under) expenditure
R’000 R’000 R’000 R’000 R’000Administration 224 619 342 224 961 219 783 (5 178)Policy and Knowledge Services
928 862 831 929 693 929 647 (46)
International Tourism
45 416 (247) 45 169 45 094 (75)
Domestic Tourism 384 363 (926) 383 437 363 070 (20 367)Total 1 583 260 - 1 583 260 1 557 594 (25 666)
The virement was approved by the Accounting Officer in terms of section 43 of the Public Finance Management Act, 1999. In accordance with this section of the Act, the amount of a saving under a main division of a vote that may be utilised may not exceed 8% of the amount appropriated under that main division.
The Department carried out virements between its four programmes after National Treasury approval had been obtained to establish a transfer payment for tourism interpretive signage as well as to provide for the increase in the compensation of employees to accommodate the salary adjustments of assistant directors and deputy directors as per the Department of Public Service and Administration’s (DPSA) Circular 4 of 2014. Programme 2, Policy and Knowledge Services, received an additional allocation to assist with the tourism local government conference. National Treasury also granted approval to increase the transfer payment to the Regional Tourism Organisation of Southern Africa (RETOSA) to settle the outstanding membership fees which formed part of the implementation of corrective actions. The amount shifted from Programme 3, International Tourism, was R247 000, which represented 0,54% of the appropriated funds. The amount shifted from programme 4, Domestic Tourism, was R926 000, which totalled 0,24% of the appropriated funds.
Forensic investigationsA forensic investigation was conducted on 13 SRI projects. The Department is currently considering the recommendations.
UnderspendingProgramme 1, Administration, underspent by R5 178 000 due to the application of cost-saving measures as introduced by National Treasury. Programme 3, International Tourism, underspent by R75 000. Programme 4, Domestic Tourism underspent, by R20 367 000, which included an amount of R18 750 000 linked to incentives for performance against Expanded Public Works Programme (EPWP) targets. As the Department had not reached the third-quarter EPWP targets, it could not access the incentive.
Roll-oversNo request for roll-overs was submitted to National Treasury.
5.3 Reasons for unauthorised, fruitless and wasteful expenditure, the amounts involved, as well as steps taken to address and prevent a recurrence
The Department had no unauthorised expenditure and disclosed all fruitless and wasteful expenditure. The majority of this relates to travel expenses (amended bookings and “no-
Department of Tourism Annual Report 2014/1512
shows”), which are reported as fruitless and wasteful expenditure pending an investigation. Once investigated, the expenditure will be either accepted as valid or transferred to the departmental debt account for recovery.
5.4 Future plans of the Department
The Department has reviewed its programme performance indicators to strengthen monitoring and evaluation of its strategic plan as well as to enable oversight. The 2015/16 review of the Strategic Plan and Annual Performance Plan builds on the Department’s strengths to ensure that we continue to develop a sustainable and inclusive tourism sector in South Africa. These plans establish priorities in tourism, and align the means to address these, informed by the lessons learned in the past financial cycle. The Department will continue to assert tourism’s position as a key economic growth driver in South Africa, as recognised by the NDP.
The Department will focus on the following initiatives in the period ahead:• Review of the NTSS in the 2015/16 financial year. This review will inter alia allow for
alignment with the NDP, ensuring that the departmental priorities for 2015/16 also contribute to the achievement of the NDP objectives;
• Provision of a policy framework, stakeholder management, planning-related and capacity-building support services to provincial and local government;
• Promotion of sector transformation as well as the development and growth of SMMEs in the tourism sector;
• Provision of tourism sector knowledge and information services;• Examine best practices and ensure proper execution of research for tourism growth and
development;• Promotion of sustainable and responsible tourism as a way of strengthening South Africa’s
competitive advantage as a tourism destination of choice; • Implementation of the TIP to support tourism enterprises in the three priority areas of
market access, resource efficiency and tourism grading;• Implementation of the Domestic Tourism Growth Strategy to inculcate a culture of travel
among South Africans; • Conducting a tourism-sector skills audit in order to review the Tourism Human Resource
Development Strategy (THRDS) and improve skills development in the tourism sector; and
• Implementation of the Social Responsibility Implementation (SRI) Programme to contribute to government’s EPWP. SRI involves tourism infrastructure and skills development programmes and creates full-time equivalent (FTE) jobs.
5.5 Public-private partnerships
The Department has no public-private partnerships registered with National Treasury.
5.6 Activities discontinued / to be discontinued
The Department has no activities already discontinued or to be discontinued.
5.7 New or proposed activities
The Department is implementing programmes to support sustainability of major tourism attractions, such as South Africa’s World Heritage Sites. It will also roll out the Tourism Incentive Programme to support investment and transformation in the tourism sector. The Department will conduct a sector skills audit to inform the revision of the Tourism Sector Human Resource Development Strategy. It will also review emerging needs of small businesses in the tourism sector to inform adaptation of responsive programmes for SMME support.
5.8 Supply Chain Management
The Department received no unsolicited bids in the 2014/15 financial year. In order to avoid any irregular expenditure relating to supply chain management, the Department has established bid specification, bid evaluation and bid adjudication committees to conclude bidding administration. These committees have been capacitated to deal with the functions assigned.
5.9 Gifts and donations received in kind from non-related parties
The European Union donated R120 million via National Treasury for the Golden Gate Highlands National Park interpretive centre over a three-year period. The allocation of R9,6 million for the 2014/15 financial year is intended for the planning phase of the construction
PART A General Information13
of an interpretive centre featuring dinosaur relics found in the park. The centre will also be a tourist destination.
5.10 Exemptions and deviations granted by National Treasury
National Treasury’s approval was obtained in accordance with Treasury Regulation 6.3.1(a) to increase the transfer payment to RETOSA for the payment of outstanding membership contributions. Approval was also obtained to increase the allocation for compensation of employees in line with salary adjustments of assistant and deputy directors. In addition, approval was granted for the establishment of a transfer payment for tourism interpretive signage.
In the 2014/15 financial year, the Department received permission from the Accountant-General within National Treasury to continue with the classification of expenditure and budget relating to EPWP infrastructure projects as transfer payments.
5.11 Events after the reporting date
None.
5.12 Other
There are no other material facts or circumstances on which to report.
5.13 Acknowledgements and appreciation
The Accounting Officer appreciates the leadership and support provided by the Minister and Deputy Minister of Tourism. The work, commitment and professionalism of the management
and staff of the Department in the implementation of the plans are noted with gratitude. The Department extends its appreciation to the chairpersons and all members of our oversight committees in both the National Assembly and the National Council of Provinces for their continued support. We also appreciate the contribution of the Audit and Risk Management Committees in providing assurance on the effectiveness of the Department’s control environment. Finally, the Department extends its appreciation to the broader tourism stakeholders, both in the private and public sector, for their continued support and cooperation.
5.14 Conclusion
The Department has achieved fairly good results and maintained good governance during the reporting period. We will continue to work with our partners to ensure continuous improvement of our efforts towards better service delivery.
5.15 Approval and sign-off
The annual financial statements set out on page 97 to 174 have been approved by the Accounting Officer.
Mr Victor TharageAccounting Officer (Acting)Department of TourismDate: 29 May 2015

Department of Tourism Annual Report 2014/1514
To the best of my knowledge and belief, I confirm the following: • All information and amounts disclosed throughout the Annual Report are consistent; • The Annual Report is complete, accurate and free from any omissions;• The Annual Report has been prepared in accordance with the guidelines on the Annual
Reports as issued by National Treasury;• The annual financial statements (Part E) have been prepared in accordance with the
modified cash standard and the relevant frameworks and guidelines issued by National Treasury;
• The Accounting Officer is responsible for the preparation of the annual financial statements and for the judgements made in this information; and
• The Accounting Officer is responsible for establishing and implementing a system of internal control, which has been designed to provide reasonable assurance of the integrity and reliability of the performance information, the human resource information and the annual financial statements.
The external auditors are engaged to express an independent opinion on the annual financial statements.
In my opinion, the Annual Report fairly reflects the operations, performance information, human resource information and financial affairs of the Department for the financial year ended 31 March 2015.
Mr Victor TharageAccounting Officer (Acting)Department of TourismDate: 29 May 2015
6. STATEMENT OF RESPONSIBILITY FOR, AND CONFIRMATION OF ACCURACY OF, THE ANNUAL REPORT
PART A General Information15
7. STRATEGIC OVERVIEW1
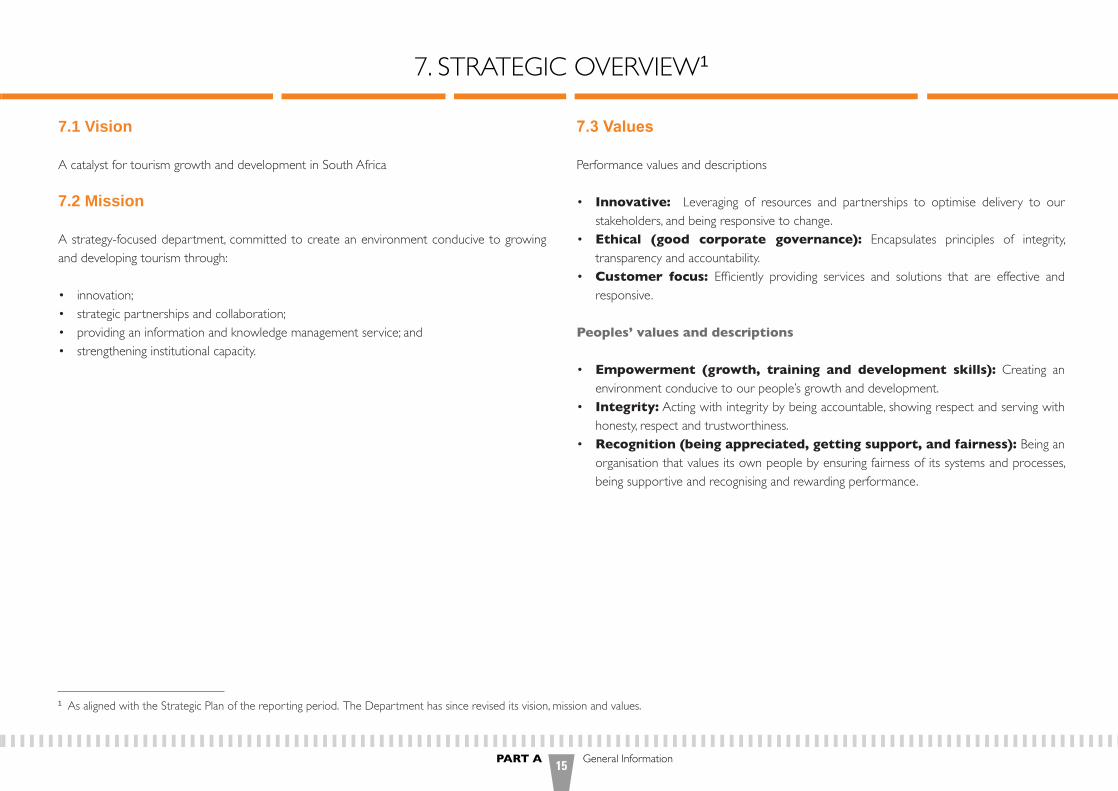
7.1 Vision
A catalyst for tourism growth and development in South Africa
7.2 Mission
A strategy-focused department, committed to create an environment conducive to growing and developing tourism through:
• innovation;• strategic partnerships and collaboration;• providing an information and knowledge management service; and• strengthening institutional capacity.
7.3 Values
Performance values and descriptions
• Innovative: Leveraging of resources and partnerships to optimise delivery to our stakeholders, and being responsive to change.
• Ethical (good corporate governance): Encapsulates principles of integrity, transparency and accountability.
• Customer focus: Efficiently providing services and solutions that are effective and responsive.
Peoples’ values and descriptions
• Empowerment (growth, training and development skills): Creating an environment conducive to our people’s growth and development.
• Integrity: Acting with integrity by being accountable, showing respect and serving with honesty, respect and trustworthiness.
• Recognition (being appreciated, getting support, and fairness): Being an organisation that values its own people by ensuring fairness of its systems and processes, being supportive and recognising and rewarding performance.
1 As aligned with the Strategic Plan of the reporting period. The Department has since revised its vision, mission and values.

Department of Tourism Annual Report 2014/1516
8. LEGISLATIVE AND OTHER MANDATES
8.1 Constitutional mandates
Part A of Schedule 4 to the Constitution of the Republic of South Africa, 1996, lists tourism as a functional area of concurrent national and provincial legislative competence.
8.2 Legislative mandates
The Tourism Act, 2014 (Act 3 of 2014) aims to promote the practising of responsible tourism for the benefit of the Republic and for the enjoyment of all its residents and foreign visitors; provide for the effective domestic and international marketing of South Africa as a tourist destination; promote quality tourism products and services; promote growth in and the development of the tourism sector, and enhance cooperation and coordination between all spheres of government in developing and managing tourism.
8.3 Policy mandates
• The White Paper on the Development and Promotion of Tourism in South Africa, 1996, provides a framework and guidelines for tourism development and promotion in South Africa.
• The NTSS provides a blueprint for the tourism sector in the pursuit of growth targets contained in the NGP.
• The NDP is government’s blueprint and recognises tourism as one of the main drivers of employment and economic growth.
PART A General Information17
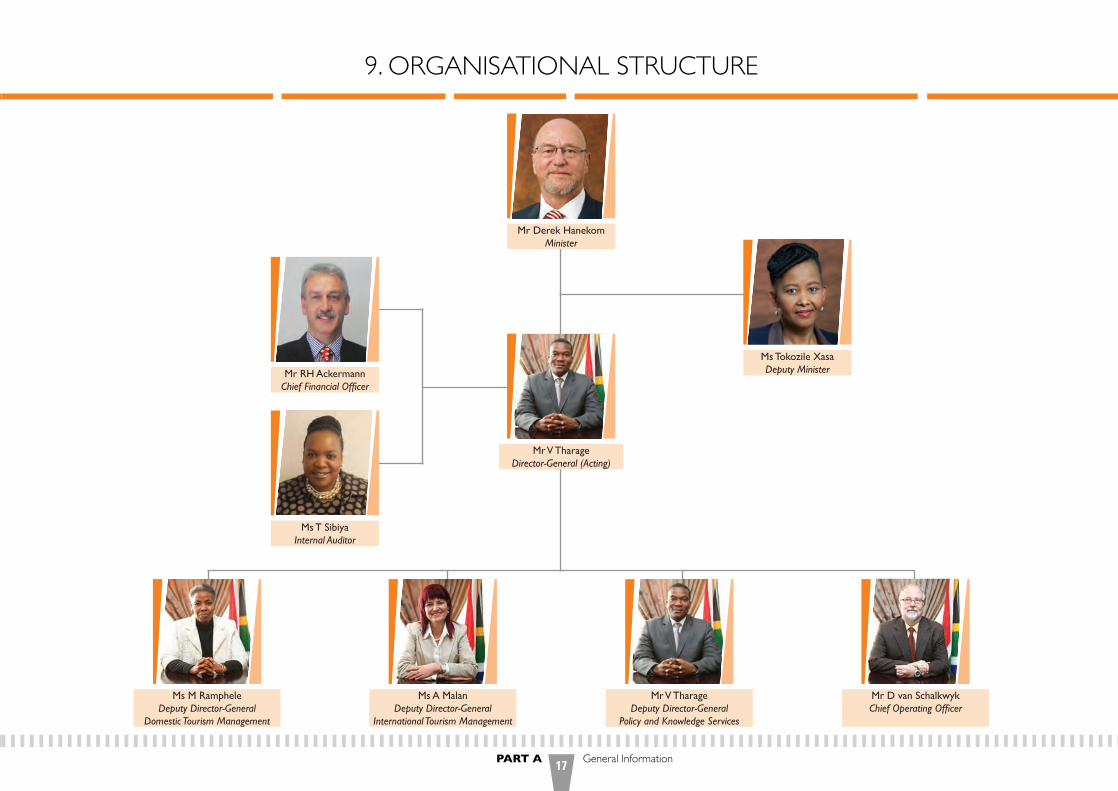
9. ORGANISATIONAL STRUCTURE
Ms tokozile XasaDeputy Minister
Mr Derek HanekomMinister
Mr V tharageDirector-General (Acting)
Ms t sibiyaInternal Auditor
Mr RH AckermannChief Financial Officer
Mr V tharageDeputy Director-General
Policy and Knowledge Services
Mr D van schalkwykChief Operating Officer
Ms M RampheleDeputy Director-General
Domestic Tourism Management
Ms A MalanDeputy Director-General
International Tourism Management
Department of Tourism Annual Report 2014/1518
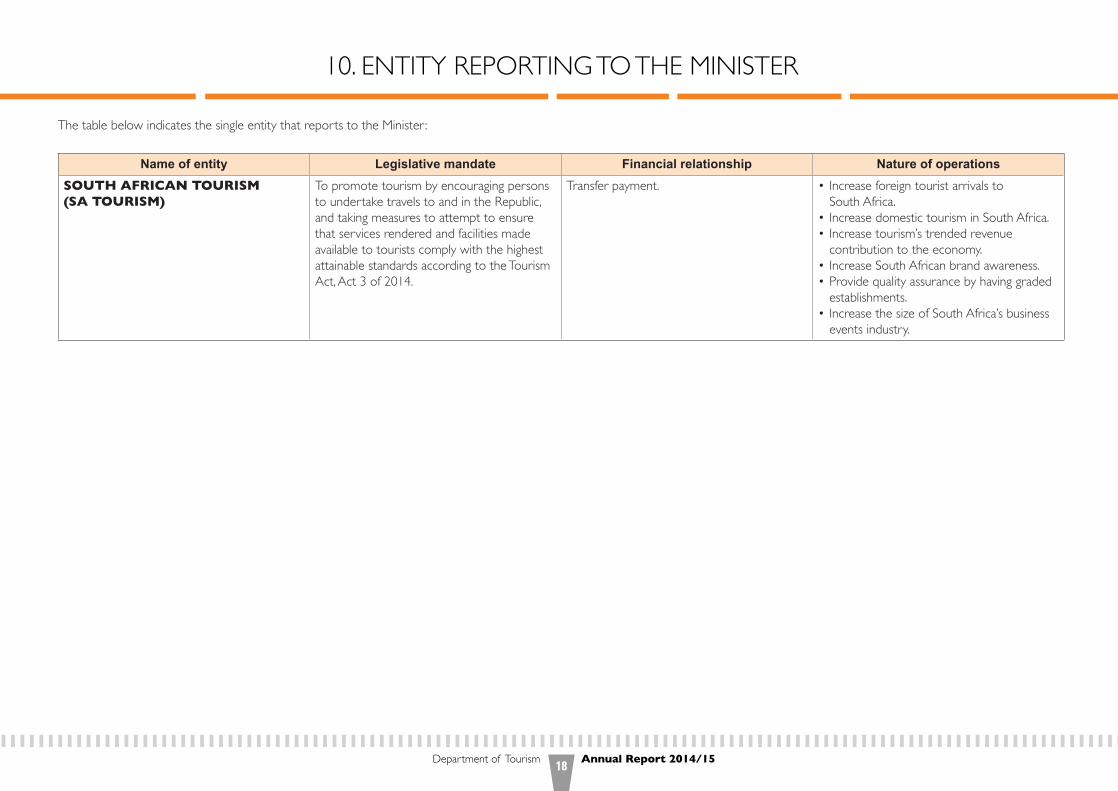
10. ENTITY REPORTING TO THE MINISTER
The table below indicates the single entity that reports to the Minister :
Name of entity Legislative mandate Financial relationship Nature of operationsSOUTH AFRICAN TOURISM (SA TOURISM)
To promote tourism by encouraging persons to undertake travels to and in the Republic, and taking measures to attempt to ensure that services rendered and facilities made available to tourists comply with the highest attainable standards according to the Tourism Act, Act 3 of 2014.
Transfer payment. • Increase foreign tourist arrivals to South Africa.
• Increase domestic tourism in South Africa.• Increase tourism’s trended revenue
contribution to the economy.• Increase South African brand awareness.• Provide quality assurance by having graded
establishments.• Increase the size of South Africa’s business
events industry.

PART Bperformance information
The Witsieshoek Mountain Lodge & Sentinel Peak situated in the Northern Drakensberg - one of the Social Responsibility Implementation (SRI) projects by the Department of Tourism.
Department of Tourism Annual Report 2014/1520
The Auditor-General South Africa (AGSA) currently performs the necessary audit procedure on the performance information to provide reasonable assurance in the form of an audit conclusion. The audit conclusion on the performance against the predetermined objectives is included in the report to management, and there were no material findings reported under the ‘Predetermined objectives’ heading in the report on other legal and regulatory requirements section of the Auditor’s Report. Refer to page 95 of the Report of the Auditor-General, published as Part E: Financial Information.
1. AUDITOR-GENERAL’S REPORT: PREDETERMINED OBJECTIVES

PART B Performance Information21
2.1 Service delivery environment
Tourism’s potential to stimulate economic growth and create jobs has been demonstrated globally. The South African government has recognised the capacity of tourism to contribute to equitable economic growth, and has therefore prioritised the tourism sector. This provides political and administrative support to the tourism agenda, allowing the government machinery to collectively work to put in place elements that support tourism growth. The Department is optimistic that this will also encourage a flow of resources into tourism development.
As a politically stable country since the advent of democracy in 1994, South Africa is regarded as being fully aligned with the United Nations international conventions and an integral part of the international community. Our foreign policy earns our country a good reputation globally. The country’s involvement in the Brazil, Russia, India, China and South Africa (BRICS) grouping presents opportunities not only in terms of South-South economic, political and social relations, but also growth in tourism to South Africa. This can contribute to an increase in arrivals and support the Department’s objective of increasing tourism’s contribution to the South African economy.
South Africa’s approach to cooperative governance, within and across all spheres of government, provides an important vehicle for the tourism mandate. Coordination between government departments that have mandates with a direct and indirect effect on tourism growth has recently improved. This, along with the capacity of the different spheres of government to develop tourism, can however be improved even further.
There is a need for strong political and economic regional coordinating structures to ensure the long-term growth of tourism on the African continent. Currently, there is limited support and coordination within the African Union (AU) agenda and other structures for tourism on the continent. Improved tourism coordination within Africa can provide benefits for tourism growth in the region, which can in turn benefit South Africa’s tourism agenda.
South Africa has established trade relations with important global tourism markets. This provides an opportunity to expand the country’s share of global outbound tourists. The sustained growth
in Africa’s economy in recent years is positive for the development of regional tourism. The notable increases in tourist arrivals from the African continent will present an added boon to economic growth and investment in South Africa. With an outbound market of more than 80 million tourists annually, other emerging economies, including China, represent a growing focus for tourism in South Africa. The capturing of a sizeable percentage of this market for tourism to South Africa may lead to an increased tourist spend in the national economy, thereby boosting tourism’s contribution to the country’s GDP.
The tourism sector’s relatively low barriers for entry by new entrepreneurs gives effect to government’s policy of expanding access to economic opportunities for previously disadvantaged individuals. This, coupled with the multiplier effect of tourism, provides opportunities for job creation in other sectors of the country’s economy as well, thereby supporting government’s mission of reducing poverty and unemployment. Supportive programmes such as the NDP place more emphasis on growth and jobs, education and skills, and a capable and developmental state. The NGP, which emphasises the creation of decent work, will be at the centre of our economic policies and will influence our investment attraction and job-creation initiatives. The manner in which the tourism sector has been organised (tourism associations) enables the development of a common approach and synergies when implementing tourism projects.
South Africa boasts a broad and exceptional natural and cultural resource base for leisure and business tourism, which provides further opportunities for product development. This has enabled SA Tourism to create a strong focus on marketing South Africa as a preferred tourist destination.
South Africa’s economic infrastructure provides the necessary supporting platform for the development of tourism and allows the sector to provide essential services to tourists. Areas for further infrastructure development to enable tourism growth have been identified. Infrastructure will be affected if maintenance and capacity do not keep pace with population growth. This can have an impact on the quality of tourists’ experience in South Africa. Where tourism infrastructure is lacking, the growth and spread of tourism is negatively affected.
Tourists’ decision to travel to and within South Africa is affected by perceptions about safety, crime and security in the country. Negative travel advisories add to these perceptions,
2. OVERVIEW OF DEPARTMENTAL PERFORMANCE

Department of Tourism Annual Report 2014/1522
thus reducing South Africa’s competitiveness as a tourist destination. The upward trend in cross-border international crime makes it challenging to strike a balance between maintaining adequate security and encouraging growth in inbound tourists to South Africa through enabling visa facilitation conditions. The global economy, which has shown signs of weakness in some of our key markets, also affects the travel decisions of tourists, who may now tend to take shorter trips or stay for shorter periods, thus affecting tourism earnings for South Africa.
The unemployment rate in South Africa and a poorly developed culture of travel amongst South Africans themselves reduce the size of the domestic market, which affects its growth. The perceived lack of tourism skills affects the perception of the quality of service the sector is able to provide, thereby influencing tourists’ decision to travel to and within South Africa. Skills development is a crucial contributor to tourism growth. There is a need to improve the skills development initiatives within the sector. This can be strengthened by expanding the quality assurance system in the tourism service value chain.
South Africa’s cultural diversity and spirit provide a unique selling point for both international and domestic tourism. However, the cultural resources of our country remain little-known and are not adequately integrated with tourism products and experiences. This is the focus of the departmental Domestic Tourism Strategy. The strategy continues to build a culture of increased awareness of tourism and its value for the country. It also aims to increase the levels of community participation in the tourism sector. Through the implementation plan of this strategy, the Department seeks to direct a consolidated and integrated approach to address the challenges of geographic spread and seasonality, which offers opportunities for enhanced levels of domestic tourism.
Tourists’ use of the internet for online travel arrangements is growing worldwide. As South Africa is advanced in the provision of internet and communications technology (ICT), it is able to migrate to services such as electronic permitting for tourists in the medium to long term, which could see positive developments in arrivals, especially from the advanced industrial Western and Asian countries. The spread of social media increases our capacity to reach our markets. It provides a marketing platform and may also serve as an information platform – a
critical service for tourists. Despite having experienced advancement in ICT provision, the cost of access to broadband in South Africa still hampers the development of faster and quicker cross-border travel arrangements. In addition, incidents of cybercrime affect tourists using internet platforms, particularly in respect of tourism-related transacting.
Technologies that are becoming available for tourism establishments to reduce their environmental footprint support the Department’s objective of responsible tourism development. However, the multiple and varying data sources on the same indicators result in negative perceptions of data and information integrity.
South Africa’s policy on the management of natural resources and protected areas, as well as the growing interest in responsible tourism and eco-tourism, increases our competitive edge compared to other destinations. Natural disasters, climate change and irregular weather patterns can have a dramatic effect on tourist arrivals to a country. Climate change and South Africa’s positioning as a long-haul destination in key markets do discourage some international tourists from travelling to South Africa. The unsustainable use of natural resources (such as deforestation and rhino poaching) could further damage South Africa’s image and erode the diversity of South African tourism products.
Tax, legal and travel restrictions imposed on citizens prevent the unhindered flow of tourists across countries. Pollution-related taxes such as carbon taxes, aviation costs, increases in the air passenger departure tax (APDT) and the pricing of oil contribute to increases in the overall cost of travel. These trends may have a negative impact on tourism to developing countries and emerging industrial economies such as South Africa.
Since the establishment of the Department of Tourism, essential tourism development policies and strategies have been developed to guide our choices and focus our actions. Recently, the focus has been on the implementation of these strategies and the monitoring of progress to inform our decisions. The Department continues to enjoy a good working relationship with our stakeholders. The National Tourism Stakeholder Forum provides an invaluable platform for coordinating the implementation of the NTSS. Our capacity to implement the NTSS can however be further strengthened.

PART B Performance Information23
Established systems for performance management allow the Department to measure its performance and progress towards its objectives. This is further supported by the political and executive oversight over governance systems. The Department has the organisational design, human resource capacity and skills for the functional areas that support tourism growth and development. The regular review of the Department’s training programme strengthens our ability to bridge gaps and improve professionalism and managerial competence.
2.2 Service delivery improvement plan
The Department has compiled a service delivery improvement plan. The tables below highlight the key features of this plan and the achievements to date.
Main services and standards
Main services Beneficiaries Current/actual standard of service
Desired standard of service Actual achievement
Creation of job opportunities through the Social Responsibility Implementation Programme, which is essentially the Department’s EPWP initiative.
Communities, local government and provincial departments responsible for tourism.
5 173 full-time equivalent (FTE) jobs created.
Calls or requests for projects to be funded are dealt with via the responsible provincial departments as well as through the provincial tourism authorities.
5 625 FTE jobs created.
Strengthen project owners’ involvement in the planning and implementation of projects.
Involve the stakeholders that are key to ensuring the sustainability of the tourism projects throughout the project cycle.
3 037 FTE jobs created.
Project owners were involved in planning and implementation.
Stakeholders were involved in the process.
Provision for policy and strategic direction for domestic tourism growth and stakeholder management.
Communities.
Tourism associations.
Provinces.
Local government/municipalities.
Tourism businesses.
Consultation takes place on a formal and informal level.
50% participation by stakeholders. The Department has established platforms such as:• Working Group meetings;• National Tourism Planning and
Coordinating Forum; and• National Tourism Stakeholders
Forum.
Going forward, the Department is still to measure the percentage participation in these platforms.
Department of Tourism Annual Report 2014/1524
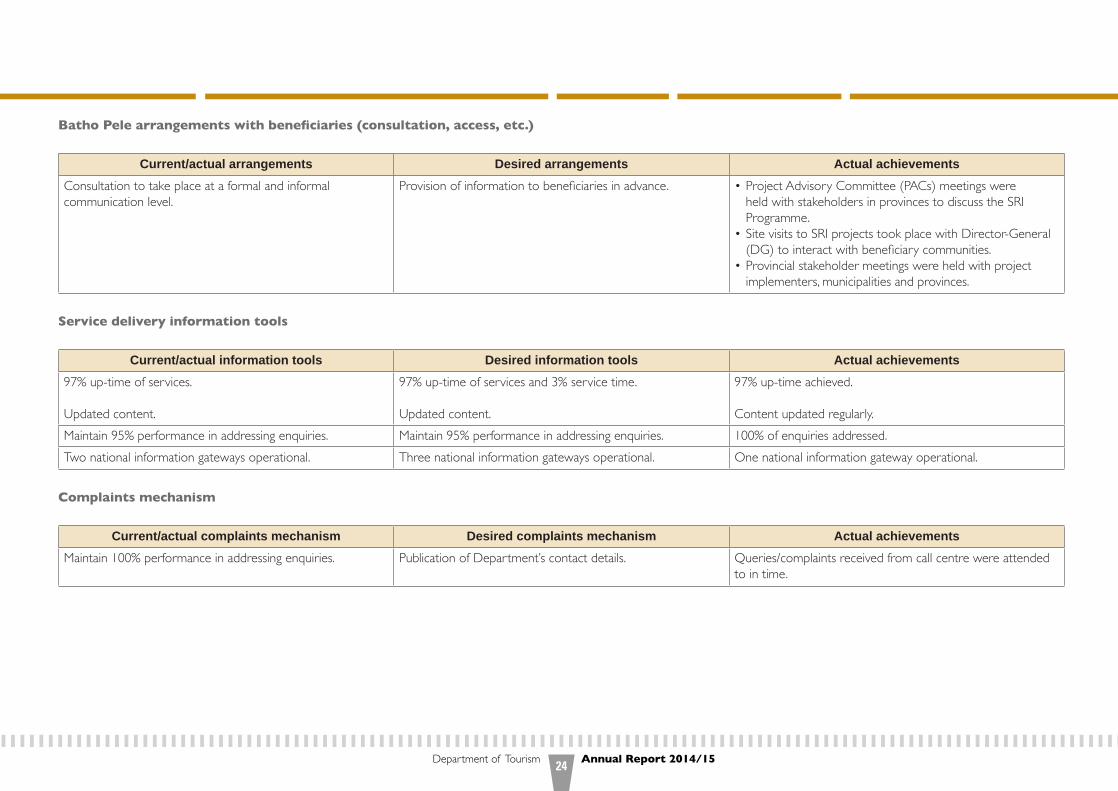
Batho Pele arrangements with beneficiaries (consultation, access, etc.)
Current/actual arrangements Desired arrangements Actual achievementsConsultation to take place at a formal and informal communication level.
Provision of information to beneficiaries in advance. • Project Advisory Committee (PACs) meetings were held with stakeholders in provinces to discuss the SRI Programme.
• Site visits to SRI projects took place with Director-General (DG) to interact with beneficiary communities.
• Provincial stakeholder meetings were held with project implementers, municipalities and provinces.
Service delivery information tools
Current/actual information tools Desired information tools Actual achievements97% up-time of services.
Updated content.
97% up-time of services and 3% service time.
Updated content.
97% up-time achieved.
Content updated regularly.Maintain 95% performance in addressing enquiries. Maintain 95% performance in addressing enquiries. 100% of enquiries addressed.Two national information gateways operational. Three national information gateways operational. One national information gateway operational.
Complaints mechanism
Current/actual complaints mechanism Desired complaints mechanism Actual achievementsMaintain 100% performance in addressing enquiries. Publication of Department’s contact details. Queries/complaints received from call centre were attended
to in time.
PART B Performance Information25
2.3 Organisational environment
Initially, the Department’s establishment was structured around existing functions, which were largely designed so as to serve the tourism industry. The new strategic direction of government, however, required a review of the Department’s composition.
In the period under review, the Department continued to implement the NTSS and the Tourism Act, 2014 (Act 3 of 2014). The mission of the NTSS is to grow a sustainable tourism economy in South Africa, with domestic, regional and international components and based on innovation, service excellence, meaningful participation and partnerships.
The following new focal areas have also been included in the Tourism Act:
(i) The NTSS;(ii) The national tourism information and monitoring system;(iii) Information by tourism businesses;(iv) Norms and standards for tourism;(v) Codes of good practice for tourism; and(vi) Tourism complaints.
These can only be implemented and/or developed through proper collaboration between the Department and the provinces.
The organisational structure was therefore redesigned to improve access to the various regions of the world through the International Tourism Management Branch and to provide guidance and coordination for the development of the tourism sector, focusing on each of the nine provinces, through the Domestic Tourism Management Branch.
During the period under review, the Department set out to implement the Tourism Incentive Programme (TIP) to support and help tourism establishments and enterprises to grow, become graded and seek out new markets. The programme was partially implemented in that the milestones relating to the call for applications, the receipt of applications and the adjudication and awarding of incentives were not achieved.
During mid-year, the management of the TIP function was transferred from Programme 4 to Programme 2. This was due to operational reasons, as the delays in the implementation of the TIP were due to capacity constraints. However, by the end of March 2015, the following had been developed:
• Stakeholder engagement plan;• Concept document;• Draft operational plan;• Draft guidelines for international trade exhibitor and trade mission assistance programmes. • Draft application forms; • Draft Monitoring and Evaluation Framework for Market Access Support Programme;• Guidelines to the Tourism Grading Support Programme; and• Terms of Reference for the TIP Adjudication Committee.
In order to ensure full implementation, the TIP was redesigned and capacity created under Programme 2 through reprioritisation of resources. Its implementation had commenced with the launch in March 2015.
2.4 Key policy developments and legislative changes
The Tourism Act of 1993, as amended, was repealed by the Tourism Act of 2014.

Department of Tourism Annual Report 2014/1526
Strategic outcome-oriented goals Goal statements Government outcomesAchieve good corporate and cooperative governance. Provide a comprehensive corporate support service to the
Department to ensure good governance.Outcome 12: An efficient, effective and development-oriented public service and an empowered, fair and inclusive citizenship.
Integration of tourism priorities within private sector stakeholders and the three spheres of government’s planning.
Render policy frameworks, stakeholder management and planning-related support services at local government level by analysing and participating in their planning processes.
Outcome 12: An efficient, effective and development-oriented public service and an empowered, fair and inclusive citizenship.
Improved levels of competitiveness and sustainability in the tourism sector.
To promote responsible tourism best practices to inculcate a culture of responsible tourism in South Africa.
Outcome 4: Decent employment through inclusive economic growth.Outcome 10: Environmental assets and natural resources that are well protected and continually enhanced.
Improved tourism sector knowledge services. To advance research, information and knowledge management within the tourism sector.
Outcome 4: Decent employment through inclusive economic growth.
Increased contribution of tourism sector to inclusive economic growth.
Facilitation of compliance to the gazetted tourism charter by identified tourism sub-sectors.
Outcome 7: Vibrant, equitable and sustainable rural communities and food security for all.Outcome 4: Decent employment through inclusive economic growth.
Provide international tourism market (country and / or region) analysis to inform strategic intervention.Profile regions and develop appropriate integrated support packages that respond to tourism development and growth needs.
Strengthened regional, Africa and international collaboration and partnerships.
Strengthen regional, Africa and international collaboration and partnerships through bilateral and multilateral engagements.
Outcome 11: Creating a better South Africa and contributing to a better and safer Africa in a better world.
3. STRATEGIC OUTCOME-ORIENTED GOALS

PART B Performance Information27
The activities of the Department of Tourism are organised in the following programmes:
Programme 1: AdministrationProgramme 2: Policy and Knowledge ServicesProgramme 3: International Tourism Programme 4: Domestic Tourism
4.1 Programme 1: Administration
Purpose: To provide strategic leadership, centralised administration, executive support and corporate services.
Sub-Programmes: Governance Support; Chief Financial Officer, Corporate Affairs; Communications; Information Communications Technology; Internal Audit; Legal Services.
Strategic objective Performance indicator
Actual achievement
2013/2014
Actual performance against target Deviation from planned
target to actual achievement
Comment on deviations
Strategy to overcome under
performance Planned target
2014/2015Actual
achievement 2014/2015
Strategic outcome-oriented goal: achieve good corporate and cooperative governanceProvide effective organisational performance management system.
1. Number of strategic documents developed and implemented.
Annual Performance Report for 2012/13 developed and four quarterly reports on the implementation of the Strategic Plan and Annual Performance Plan.
Annual Performance Report for 2013/14 developed.
Four quarterly reports on the implementation of the Strategic Plan and Annual Performance Plan.
Annual Performance Report for 2013/14 was developed.
Four quarterly reports on the implementation of the Strategic Plan and Annual Performance Plan were developed.
None None N/A
Strategic Plan and APP for 2014/15 reviewed.
Review of the Strategic Plan and APP for 2015/16.
Strategic Plan and APP for 2015/16 reviewed.
None None N/A
4. PERFORMANCE INFORMATION BY PROGRAMME

Department of Tourism Annual Report 2014/1528
Strategic objective Performance indicator
Actual achievement
2013/2014
Actual performance against target Deviation from planned
target to actual achievement
Comment on deviations
Strategy to overcome under
performance Planned target
2014/2015Actual
achievement 2014/2015
Strategic outcome-oriented goal: achieve good corporate and cooperative governanceOne quarterly Risk Mitigation Report analysed and submitted to Risk Management Committee.
Four quarterly Risk Mitigation Reports analysed and submitted to Audit and Risk Committees.
Secretariat for the Risk Management Committee (RMC).
Three quarterly Risk Mitigation Reports were analysed and submitted to Risk Management Committee.
Secretariat provided for the Risk Management Committee (RMC).
Fourth quarter Risk Mitigation Report not analysed and submitted to Risk Management Committee.
Fourth quarter Risk Mitigation Report fell outside of the reporting period.
As at 31 May 2015 the Fourth quarter Risk Mitigation Report has been developed, analysed and submitted to Risk Management Committee.
2. NDT FOSAD and CABINET coordination and support system reviewed and implemented.
Internal protocol was reviewed and implemented.
Review and implement internal protocol.
Protocol was reviewed and implemented.
None None N/A
3. System for South African Tourism (SAT) oversight developed and implemented.
Four SAT reports developed.
Four SAT oversight reports.
Four SAT oversight reports were prepared.
None None N/A
Provide corporate legal support.
4. Percentage compliance with legal services litigation protocol.
New indicator. 100% compliance with legal services litigation protocol.
100% compliance with Legal Services Litigation Protocol.
None None N/A
5. Percentage compliance with Legal Service Delivery Charter.
100% compliance with Services Service Delivery Charter.
100% compliance with Legal Services Delivery Charter.
100% compliance with Legal Services Service Delivery Charter.
None None N/A
PART B Performance Information29
Strategic objective Performance indicator
Actual achievement
2013/2014
Actual performance against target Deviation from planned
target to actual achievement
Comment on deviations
Strategy to overcome under
performance Planned target
2014/2015Actual
achievement 2014/2015
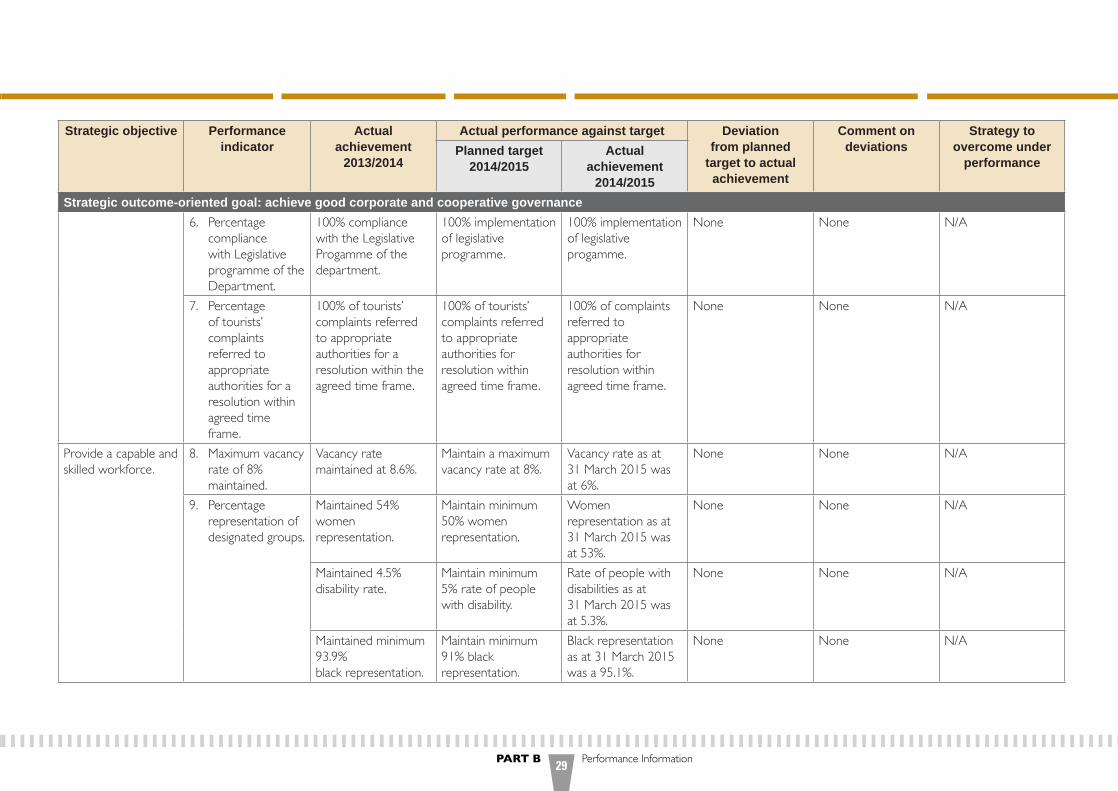
Strategic outcome-oriented goal: achieve good corporate and cooperative governance6. Percentage
compliance with Legislative programme of the Department.
100% compliance with the Legislative Progamme of the department.
100% implementation of legislative programme.
100% implementation of legislative progamme.
None None N/A
7. Percentage of tourists’ complaints referred to appropriate authorities for a resolution within agreed time frame.
100% of tourists’ complaints referred to appropriate authorities for a resolution within the agreed time frame.
100% of tourists’ complaints referred to appropriate authorities for resolution within agreed time frame.
100% of complaints referred to appropriate authorities for resolution within agreed time frame.
None None N/A
Provide a capable and skilled workforce.
8. Maximum vacancy rate of 8% maintained.
Vacancy rate maintained at 8.6%.
Maintain a maximum vacancy rate at 8%.
Vacancy rate as at 31 March 2015 was at 6%.
None None N/A
9. Percentage representation of designated groups.
Maintained 54% women representation.
Maintain minimum 50% women representation.
Women representation as at 31 March 2015 was at 53%.
None None N/A
Maintained 4.5% disability rate.
Maintain minimum 5% rate of people with disability.
Rate of people with disabilities as at 31 March 2015 was at 5.3%.
None None N/A
Maintained minimum 93.9%black representation.
Maintain minimum 91% black representation.
Black representation as at 31 March 2015 was a 95.1%.
None None N/A
Department of Tourism Annual Report 2014/1530
Strategic objective Performance indicator
Actual achievement
2013/2014
Actual performance against target Deviation from planned
target to actual achievement
Comment on deviations
Strategy to overcome under
performance Planned target
2014/2015Actual
achievement 2014/2015
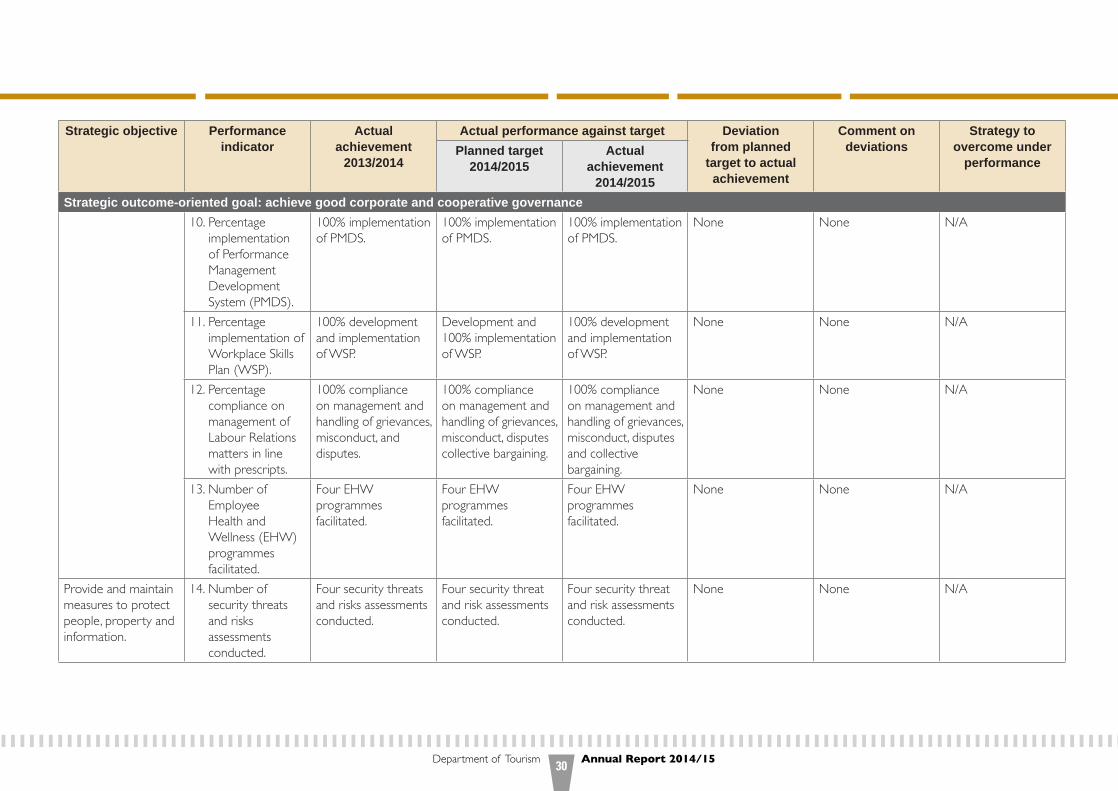
Strategic outcome-oriented goal: achieve good corporate and cooperative governance10. Percentage
implementation of Performance Management Development System (PMDS).
100% implementation of PMDS.
100% implementation of PMDS.
100% implementation of PMDS.
None None N/A
11. Percentage implementation of Workplace Skills Plan (WSP).
100% development and implementation of WSP.
Development and 100% implementation of WSP.
100% development and implementation of WSP.
None None N/A
12. Percentage compliance on management of Labour Relations matters in line with prescripts.
100% compliance on management and handling of grievances, misconduct, and disputes.
100% compliance on management and handling of grievances, misconduct, disputes collective bargaining.
100% compliance on management and handling of grievances, misconduct, disputes and collective bargaining.
None None N/A
13. Number of Employee Health and Wellness (EHW) programmes facilitated.
Four EHW programmes facilitated.
Four EHW programmes facilitated.
Four EHW programmes facilitated.
None None N/A
Provide and maintain measures to protect people, property and information.
14. Number of security threats and risks assessments conducted.
Four security threats and risks assessments conducted.
Four security threat and risk assessments conducted.
Four security threat and risk assessments conducted.
None None N/A

PART B Performance Information31
Strategic objective Performance indicator
Actual achievement
2013/2014
Actual performance against target Deviation from planned
target to actual achievement
Comment on deviations
Strategy to overcome under
performance Planned target
2014/2015Actual
achievement 2014/2015
Strategic outcome-oriented goal: achieve good corporate and cooperative governanceProvide effective governance of Information Communication Technology (ICT)
15. Ensure maximum uptime ICT services.
Up-time maintained at 97%.
Maintained a maximum of 2.4% service time.
97% uptime on all ICT services and maximum of 3% service time.
Maintained 98.75% uptime on all ICT services and maximum 1.25% service time.
None None N/A
16. Development of Information Communications Technology Strategic Plan (ICTSP).
New indicator. 2014-2018 ICTSP developed.
2014-2018 ICTSP developed.
None None N/A
Ensure economic, efficient and effective use of departmental resources.
17. Number of quarterly and annual financial statements compiled and submitted.
Submission of four quarterly and one annual financial statements.
Submission of four quarterly and one annual financial statement to National Treasury and Auditor-General South Africa.
Submission of four quarterly and one annual financial statement to National Treasury and Auditor-General South Africa.
None None N/A
18. Percentage of expenditure on procurement from enterprises with Broad-Based Black Economic Empowerment (BBBEE) status level of contributor 1-8 (excluding government entities).
100% of expenditure on procurement from B-BBEE status level of contributor 1 to 8 enterprises achieved.
100% of expenditure on procurement from B-BBEE status level of contributor 1 to 8 enterprises.
100% of expenditure on procurement from B-BBEE status level of contributor 1 to 8 enterprises achieved.
None None N/A

Department of Tourism Annual Report 2014/1532
Strategic objective Performance indicator
Actual achievement
2013/2014
Actual performance against target Deviation from planned
target to actual achievement
Comment on deviations
Strategy to overcome under
performance Planned target
2014/2015Actual
achievement 2014/2015
Strategic outcome-oriented goal: achieve good corporate and cooperative governanceProvide effective Internal Audit Services
19. Percentage implementation of the annual Internal Audit plan.
100% implementation. 100% implementation of the annual internal audit plan.
100% implementation of the annual internal audit plan.
None None N/A
Reach out to tourism stakeholders through targeted communication.
20. Percentage implementation of the Communication Strategy (media engagement, branding, events management, internal, intergovernmental communications).
100% implementation of the Communication Strategy (media, engagement, branding, events management, internal, intergovernmental communication).
100% implementation of the Communication Strategy.
91% implementation of the Communication Strategy.
9% implementation of the Communication Strategy.
Inadequate integration and coordination of events calendar led to a deviation from full achievement of targets.
The review of the Communication Strategy will address identified weaknesses and challenges in fully achieving planned targets

PART B Performance Information33
Changes to planned targets
None.
Sub-programme expenditure
2014/15 2013/14
Sub-programme name Final appropriation
Actualexpenditure
(Over)/under expenditure
Final appropriation
Actualexpenditure
(Over)/under expenditure
R’000 R’000 R’000 R’000 R’000 R’000
Ministry 30 851 30 834 17 35 567 35 567 -Management 16 830 14 543 2 287 16 456 16 259 197Corporate Affairs 142 874 140 000 2 874 131 539 131 325 214Office Accommodation 34 406 34 406 - 29 084 28 849 235Total 224 961 219 783 5 178 212 646 212 000 646
Department of Tourism Annual Report 2014/1534
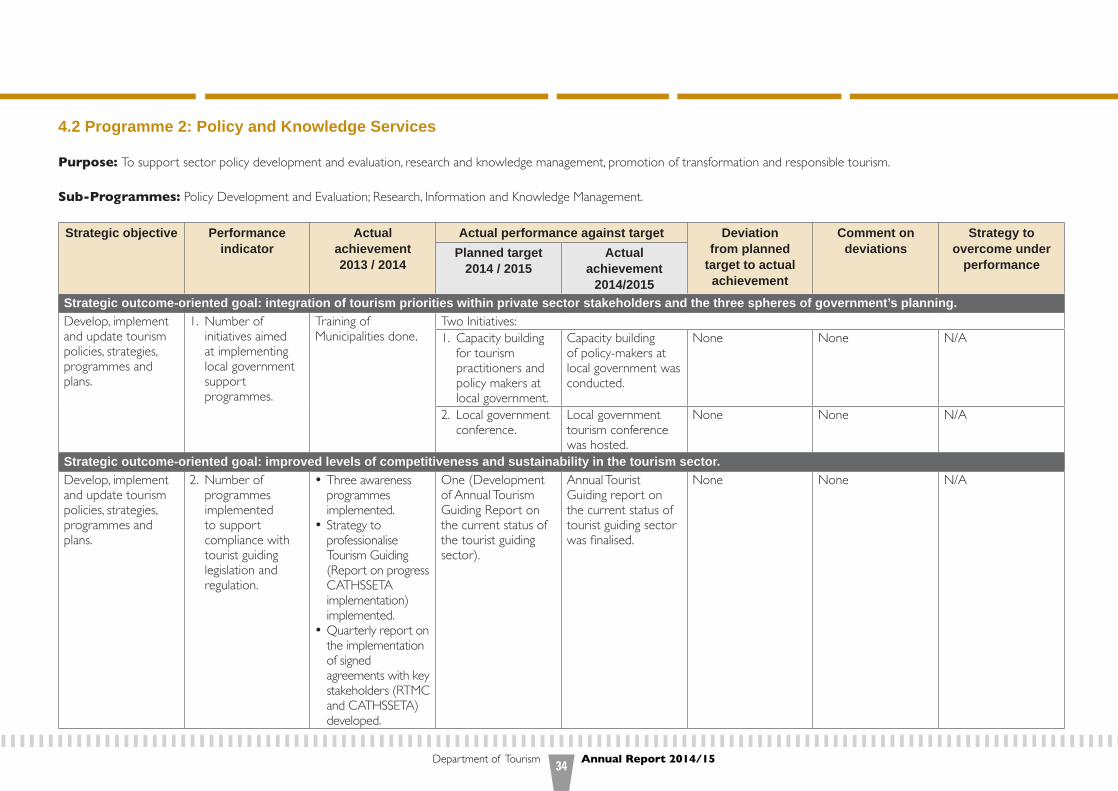
4.2 Programme 2: Policy and Knowledge Services
Purpose: To support sector policy development and evaluation, research and knowledge management, promotion of transformation and responsible tourism.
Sub-Programmes: Policy Development and Evaluation; Research, Information and Knowledge Management.
Strategic objective Performance indicator
Actual achievement 2013 / 2014
Actual performance against target Deviation from planned
target to actual achievement
Comment on deviations
Strategy to overcome under
performancePlanned target
2014 / 2015Actual
achievement 2014/2015
Strategic outcome-oriented goal: integration of tourism priorities within private sector stakeholders and the three spheres of government’s planning.Develop, implement and update tourism policies, strategies, programmes and plans.
1. Number of initiatives aimed at implementing local government support programmes.
Training of Municipalities done.
Two Initiatives: 1. Capacity building
for tourism practitioners and policy makers at local government.
Capacity building of policy-makers at local government was conducted.
None None N/A
2. Local government conference.
Local government tourism conference was hosted.
None None N/A
Strategic outcome-oriented goal: improved levels of competitiveness and sustainability in the tourism sector.Develop, implement and update tourism policies, strategies, programmes and plans.
2. Number of programmes implemented to support compliance with tourist guiding legislation and regulation.
•Three awareness programmes implemented.
• Strategy to professionalise Tourism Guiding (Report on progress CATHSSETA implementation) implemented.
•Quarterly report on the implementation of signed agreements with key stakeholders (RTMC and CATHSSETA) developed.
One (Development of Annual Tourism Guiding Report on the current status of the tourist guiding sector).
Annual Tourist Guiding report on the current status of tourist guiding sector was finalised.
None None N/A

PART B Performance Information35
Strategic objective Performance indicator
Actual achievement 2013 / 2014
Actual performance against target Deviation from planned
target to actual achievement
Comment on deviations
Strategy to overcome under
performancePlanned target
2014 / 2015Actual
achievement 2014/2015
Promote Responsible Tourism best practice.
3. Report on the implementation of the National Responsible Tourism Strategy
• Progress report on UA compliance framework in one city destination developed.
• Report on the state of UA in provincial parks developed.
Report and implementation Plan for Universal Accessibility (UA) in Provincial Parks.
Report and implementation Plan for Universal Accessibility (UA) in Provincial Parks was developed.
None None N/A
Strategic outcome-oriented goal: improved tourism sector knowledge services.Monitoring and evaluation of tourism sector performance, strategies, policies and initiatives.
4. Number of tourism monitoring reports developed.
• 2012 State of Tourism Report (STR) finalised.
• 2012/13 NTSS Report finalised.
Two Reports developed: 1. 2013 State of
Tourism Report (STR).
2013 State of Tourism Report (STR) was developed.
None None N/A
2. 2013/14 NTSS Implementation Report.
2013/14 NTSS Annual Implementation Report was developed.
None None
5. Number of evaluation reports on tourism projects and initiatives developed.
• NTCE Evaluation Report finalised.
• Evaluation report on the impact of local municipal by-laws on tourism.
Two Evaluation reports: 1. Chef Training
Programme (CTP).Report on the evaluation of the Chef Training Programme (CTP) was developed.
None None N/A
2. Report on tourism sustainability post land settlement.
Report on tourism sustainability post land settlement was developed.
None None N/A

Department of Tourism Annual Report 2014/1536
Strategic objective Performance indicator
Actual achievement 2013 / 2014
Actual performance against target Deviation from planned
target to actual achievement
Comment on deviations
Strategy to overcome under
performancePlanned target
2014 / 2015Actual
achievement 2014/2015
Provide research and knowledge management services to inform policy and decision making.
6. Number of information and knowledge system, services and frameworks developed, implemented and maintained.
• Online self-assessment tool for Responsible Tourism developed and maintained.
• Self-assessment tool for local government developed.
• Tourism Local Government Support online portal developed.
• (To be housed within the TKP) developed, approved and ‘live’. https://tkp.tourism.gov.za
• NVIF Implementation Report developed and approved.
• KMF Implementation Report developed and approved.
• 2 NTIGs maintained:
• ORTIA and Beitbridge report developed and approved.
Two Knowledge Systems developed.1. Visitor information Knowledge Centre Database Tool.
Visitor information Knowledge Centre Database Tool was developed.
None None N/A
2. Tourist Guide Central Database.
Tourist Guide Central Database was developed.
None None N/A
National Visitor Information Framework (NVIF) implementation (Visitor Information Centre national directory and operational guidelines developed).
National Visitor Information Framework (NVIF) implementation (Visitor Information Centre national directory and operational guidelines developed).
None None N/A
Two NTIGs maintained: One land port or entry (Beitbridge) One airport of entry (ORTIA).
One NTIG maintained: One airport of entry (ORTIA) was developed.
One NTIG not maintained: One landport of entry (Beitbridge) was not developed.
The development of the Beitbridge Gateway could not materialise due to the restructuring at the Border post. This, combined with the changes to the management processes for border operations rendered the initiative infeasible.
The infrastructure will be used for the establishment of the Fezile Dabi District Municipality Visitor Information Centre.

PART B Performance Information37
Strategic objective Performance indicator
Actual achievement 2013 / 2014
Actual performance against target Deviation from planned
target to actual achievement
Comment on deviations
Strategy to overcome under
performancePlanned target
2014 / 2015Actual
achievement 2014/2015
7. Number of research studies conducted.
Four research studies conducted in collaboration with universities were initiated.
Six Research studies conducted in collaboration with universities completed.Phase 2:• Services
Excellence • Cross-border
tourist guiding• Events impact
evaluation• Tourism
competitiveness• Religious tourismNew study:• Facilities within
municipal parks.
Five Research reports of studies in collaboration with universities finalised.
One Research study conducted in collaboration with universities was not completed.
One of the universities that signed MoU with the department was unable to finalise the report on time due to capacity constraint.
The university to appoint a service provider to finalise the study and the report is due to the department during 2015/16.
Strategic outcome-oriented goal: Increased contribution of tourism sector to inclusive economic growth.To promote compliance with the Tourism Sector B-BBEE Codes.
8. Number of programmes implemented to promote compliance with the Tourism Sector Specific B-BBEE Scorecard and verification
Quarterly reports on the implementation of the Tourism BBBEE Charter Council Plan of Action developed.
Two Programmes Implemented:1. Amendment of
Tourism B-BBEE Codes.
Amendment of Tourism B-BBEE Codes implemented.
None None N/A
2. Feasibility assessment of creating a database of black owned enterprises in the tourism sector.
Feasibility assessment of creating a database of black owned enterprises in the tourism sector was done.
None None N/A

Department of Tourism Annual Report 2014/1538
Changes to planned targets
None.
Sub-programme expenditure
2014/15 2013/14
Sub- programme name Final appropriation
Actualexpenditure
(Over)/under expenditure
Final appropriation
Actualexpenditure
(Over)/under expenditure
R’000 R’000 R’000 R’000 R’000 R’000
Policy and Knowledge Services Management 4 070 4 024 46 5 794 4 460 1 334Policy Development and Evaluation 23 490 23 490 - 19 466 17 963 1 503Research and Knowledge Management 22 124 22 124 - 20 250 20 034 216South African Tourism 880 009 880 009 - 866 333 866 333 -Total 929 693 929 647 46 911 843 908 790 3 053
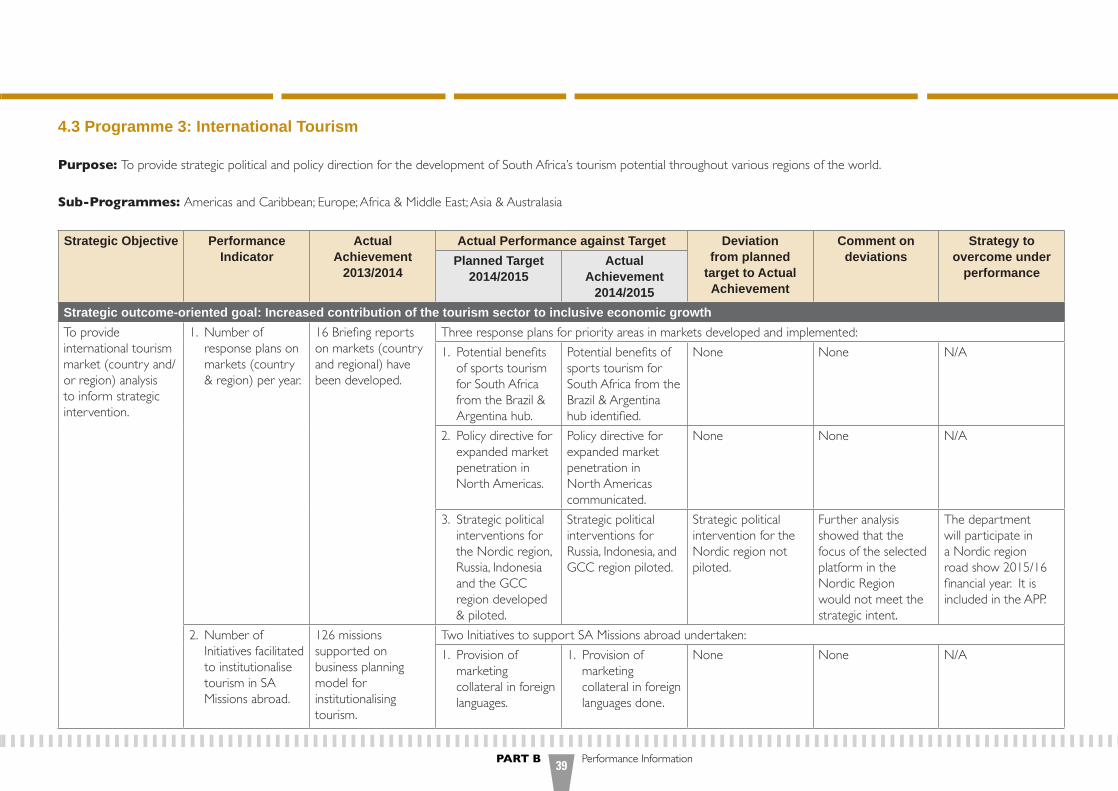
PART B Performance Information39
4.3 Programme 3: International Tourism
Purpose: To provide strategic political and policy direction for the development of South Africa’s tourism potential throughout various regions of the world.
Sub-Programmes: Americas and Caribbean; Europe; Africa & Middle East; Asia & Australasia
Strategic Objective Performance Indicator
Actual Achievement
2013/2014
Actual Performance against Target Deviation from planned
target to Actual Achievement
Comment on deviations
Strategy to overcome under
performance Planned Target
2014/2015Actual
Achievement 2014/2015
Strategic outcome-oriented goal: Increased contribution of the tourism sector to inclusive economic growthTo provide international tourism market (country and/or region) analysis to inform strategic intervention.
1. Number of response plans on markets (country & region) per year.
16 Briefing reports on markets (country and regional) have been developed.
Three response plans for priority areas in markets developed and implemented:1. Potential benefits
of sports tourism for South Africa from the Brazil & Argentina hub.
Potential benefits of sports tourism for South Africa from the Brazil & Argentina hub identified.
None None N/A
2. Policy directive for expanded market penetration in North Americas.
Policy directive for expanded market penetration in North Americas communicated.
None None N/A
3. Strategic political interventions for the Nordic region, Russia, Indonesia and the GCC region developed & piloted.
Strategic political interventions for Russia, Indonesia, and GCC region piloted.
Strategic political intervention for the Nordic region not piloted.
Further analysis showed that the focus of the selected platform in the Nordic Region would not meet the strategic intent.
The department will participate in a Nordic region road show 2015/16 financial year. It is included in the APP.
2. Number of Initiatives facilitated to institutionalise tourism in SA Missions abroad.
126 missions supported on business planning model for institutionalising tourism.
Two Initiatives to support SA Missions abroad undertaken:1. Provision of
marketing collateral in foreign languages.
1. Provision of marketing collateral in foreign languages done.
None None N/A
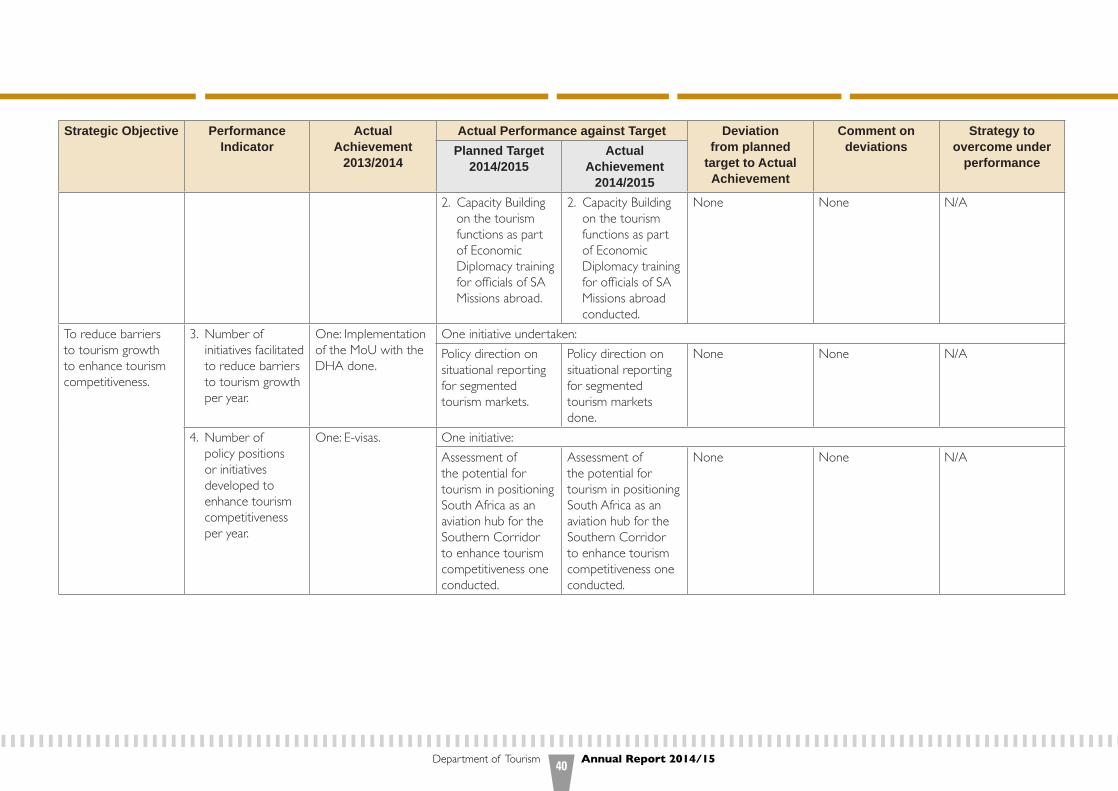
Department of Tourism Annual Report 2014/1540
Strategic Objective Performance Indicator
Actual Achievement
2013/2014
Actual Performance against Target Deviation from planned
target to Actual Achievement
Comment on deviations
Strategy to overcome under
performance Planned Target
2014/2015Actual
Achievement 2014/2015
2. Capacity Building on the tourism functions as part of Economic Diplomacy training for officials of SA Missions abroad.
2. Capacity Building on the tourism functions as part of Economic Diplomacy training for officials of SA Missions abroad conducted.
None None N/A
To reduce barriers to tourism growth to enhance tourism competitiveness.
3. Number of initiatives facilitated to reduce barriers to tourism growth per year.
One: Implementation of the MoU with the DHA done.
One initiative undertaken:Policy direction on situational reporting for segmented tourism markets.
Policy direction on situational reporting for segmented tourism markets done.
None None N/A
4. Number of policy positions or initiatives developed to enhance tourism competitiveness per year.
One: E-visas. One initiative:Assessment of the potential for tourism in positioning South Africa as an aviation hub for the Southern Corridor to enhance tourism competitiveness one conducted.
Assessment of the potential for tourism in positioning South Africa as an aviation hub for the Southern Corridor to enhance tourism competitiveness one conducted.
None None N/A

PART B Performance Information41
Strategic Objective Performance Indicator
Actual Achievement
2013/2014
Actual Performance against Target Deviation from planned
target to Actual Achievement
Comment on deviations
Strategy to overcome under
performance Planned Target
2014/2015Actual
Achievement 2014/2015
Strategic outcome-oriented goal: strengthen regional, Africa and international collaboration and partnership.Strategic Objective: To utilise bilateral and multilateral engagements to advance the tourism national, regional, Africa and global agenda.
5. Number of strategic national priorities facilitated to implement International Agreements per year.
One Annual Report on international agreements and strategic national priorities facilitated developed.
Two National Priorities facilitated.1. Regional
Integration:
• Capacity Building Workshop on grading and statistics targeted at African countries that South Africa signed Agreement with.
• Review of the implementation of the Indaba expansion policy.
1. Regional Integration:
• Capacity Building Workshop on grading and statistics targeted at African countries that South Africa signed Agreement with conducted.
• Review of the implementation of the Indaba expansion policy finalised.
None None N/A
2. Training: Policy framework for international placement for skills development.
2. Training: Policy framework for international placement for skills development developed.
None None N/A
6. Number of national priorities driven through strategic engagements in multilateral fora.
Participation in eight multilateral fora supported.
Implementation of one national priority: 1. Regional
integration: Development of South Africa’s policy position on tourism within SADC & AU.
1. Regional integration: Development of South Africa’s policy position on tourism within SADC & AU done.
None None N/A
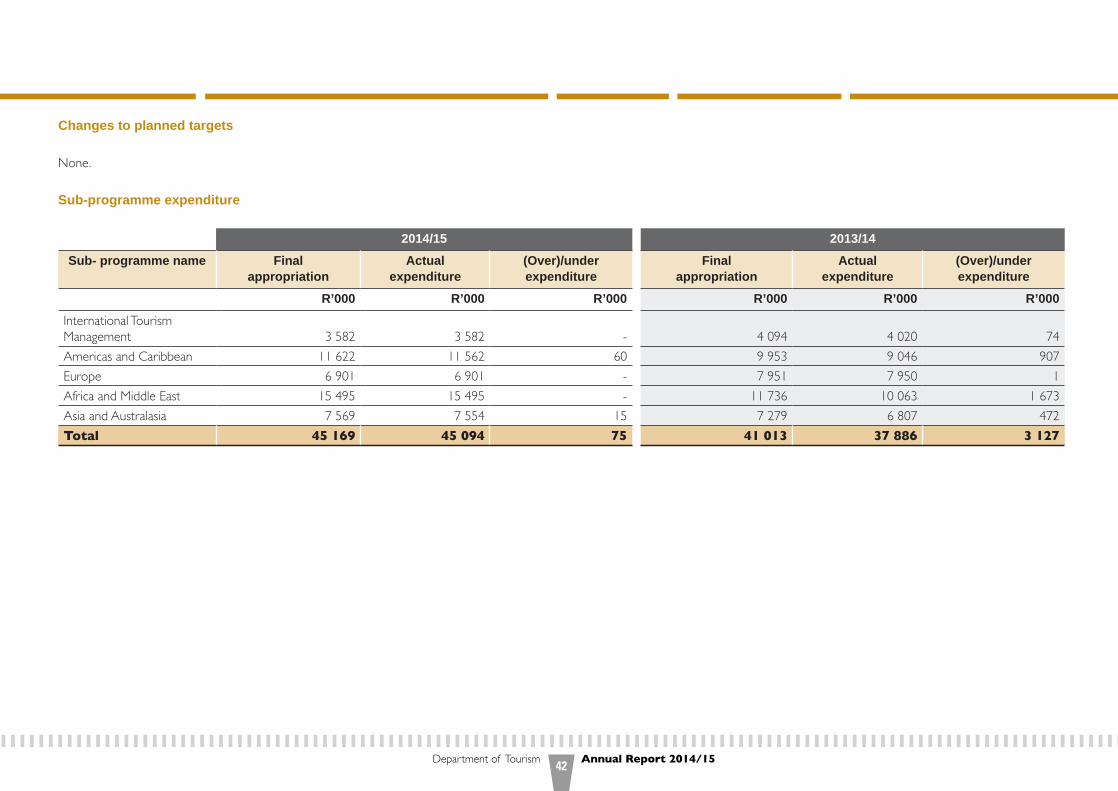
Department of Tourism Annual Report 2014/1542
Changes to planned targets
None.
Sub-programme expenditure
2014/15 2013/14
Sub- programme name Final appropriation
Actualexpenditure
(Over)/under expenditure
Final appropriation
Actualexpenditure
(Over)/under expenditure
R’000 R’000 R’000 R’000 R’000 R’000
International Tourism Management 3 582 3 582 - 4 094 4 020 74Americas and Caribbean 11 622 11 562 60 9 953 9 046 907Europe 6 901 6 901 - 7 951 7 950 1Africa and Middle East 15 495 15 495 - 11 736 10 063 1 673Asia and Australasia 7 569 7 554 15 7 279 6 807 472Total 45 169 45 094 75 41 013 37 886 3 127

PART B Performance Information43
4.4 Programme 4: Domestic Tourism
Purpose: To provide political, policy and strategic direction for the development and growth of sustainable domestic tourism throughout South Africa.
Sub-Programmes: Domestic Tourism Management: Southern Region; Domestic Tourism Management: Northern Region; Social Responsibility Implementation.
Strategic Objective Performance Indicator
Actual Achievement
2012/2013
Actual Performance against Target Deviation from planned
target to Actual Achievement
Comment on deviations
Strategy to overcome under
performance Planned Target
2014/2015Actual
Achievement 2014/2015
Strategic outcome-oriented goal: Increase contribution of the tourism sector to inclusive economic growth.To implement tourism growth and development strategies in order to increase tourism’s contribution to inclusive economic growth.
1. Number of national tourism programmes activated from the approved Domestic Tourism Growth Strategy’s action plan (4 National Programmes).
Four programmes:National Tourism Career Expo (NTCE) 2013/14 hosted.
1. National Tourism Career Expo (NTCE) hosted.
National Tourism Career Expo (NTCE) hosted.
None None N/A
N/A 2. Nine (9) educators’ seminars held.
Nine educators’ seminars held.
None None N/A
Tourism Month events calendar done.
3. Annual Tourism Month hosted.
Annual Tourism Month hosted.
None None N/A
Service Excellence Strategy implemented.
4. Implement prioritised programmes for Pillars 2,3 and 4 of the National Tourism Service Excellence Strategy:
4.1 Up-skilling Service Delivery.
4.2 Public Awareness.4.3 Service Standards
and Norms.
Prioritised programmes for Pillars 2, 3 and 4 of the National Tourism Service Excellence Strategy implemented:
4.1 Up-skilling Service Delivery.
4.2 Public Awareness.4.3 Service Standards
and Norms.
None None N/A

Department of Tourism Annual Report 2014/1544
Strategic Objective Performance Indicator
Actual Achievement
2012/2013
Actual Performance against Target Deviation from planned
target to Actual Achievement
Comment on deviations
Strategy to overcome under
performance Planned Target
2014/2015Actual
Achievement 2014/2015
Strategic outcome-oriented goal: Increase contribution of the tourism sector to inclusive economic growth.To coordinate and facilitate the development and implementation of integrated Support Packages to enhance destination competitiveness.
2. Number of projects implemented from the approved tourism development strategies action plan for the development of integrated support packages (e.g. access, amenities, attractions, accommodation).
Two integrated support packages developed.
• Eight needs assessment of the World Heritage Sites done.
• World Heritage Sites Pavilion at Indaba.
Two Projects implemented: 1. Capacity Building
Workshop hosted.Capacity Building Workshop hosted.
None None N/A
2. Implementation of tourism interpretation signage in 04 WHS.
• Mapungubwe• Richeterveld• uKhahlamba
Drakensberg• Cape Floral
(Baavianskloof) WHS.
• The department did not physically implement the tourism signage, instead it transferred funds to the four management authorities and one NGO to implement.
• Treasury agreed to the department’s request to transfer the funds to the four management authorities and one NGO. The implementation will continue into the new financial year.
The target was not correctly formulated as a result the department could not implement tourism signage directly in the WHS, hence the transfer of funds to the management authorities and the NGO.
In the 2015/16 financial year the target has been reformulated to transfer funds to the management authorities to implement tourism signage.
N/A

PART B Performance Information45
Strategic Objective Performance Indicator
Actual Achievement
2012/2013
Actual Performance against Target Deviation from planned
target to Actual Achievement
Comment on deviations
Strategy to overcome under
performance Planned Target
2014/2015Actual
Achievement 2014/2015
Strategic outcome-oriented goal: Increase contribution of the tourism sector to inclusive economic growth.To provide support to tourism businesses through funding and capacity building in order to grow tourism’s contribution to Gross Domestic Product (GDP).
3. Incentive programme implemented to support enterprises to grow.
Concept incentive programme and draft programme guidelines developed.
Tourism Incentive Programme (TIP) Implemented2.
TIP was partially implemented:
• The system was designed and developed.
• The programme was launched.
• Call for applications.
• The receipt of applications.
• Adjudication and awarding of incentives.
The delays in the implementation of the TIP were due to capacity constraints.
TIP was redesigned and capacity was created under Programme 2.
The implementation of TIP commenced with the launch in March 2015.
4. Number of rural enterprises supported per year.
891 489 *466 23 Rural enterprises experienced financial constraints in relation to attending TEP interventions at centralised locations. This has impacted on achieving the planned target.
The department is undertaking a comprehensive study to determine how best to support SMMEs over the long-term.
5. Number of enterprises supported to grow through mentorship.
119 34 *35 1 One additional enterprise was accommodated in the programme.
N/A
2 The management of Tourism Incentive Programme function was transferred from Programme 4 to Programme 2 at mid-year.

Department of Tourism Annual Report 2014/1546
Strategic Objective Performance Indicator
Actual Achievement
2012/2013
Actual Performance against Target Deviation from planned
target to Actual Achievement
Comment on deviations
Strategy to overcome under
performance Planned Target
2014/2015Actual
Achievement 2014/2015
Strategic outcome-oriented goal: Increase contribution of the tourism sector to inclusive economic growth.6. Number of
businesses supported with market access.
977 450 *282 168 The market access programme was more costly than anticipated, due to high exchange rate for international platforms. As a result TEP has focused more funding where sustainability and quality could best be achieved.
The department is undertaking a comprehensive study to determine how best to support SMMEs over the long-term. The department is focusing on supporting 100 rural enterprises during 2015/16 financial year.
7. Number of Historically Disadvantaged Enterprises (HDE) supported per year.
3 569 1 263 *1 363 100 The demand exceeded the planned target for support to HDEs which TEP could accommodate within allocated resources.
N/A
8. Number of enterprises trained (industry workshops, customer service, toolkits and business skills).
2 757 975 *1 203 228 The demand exceeded the planned target for support to enterprises to be trained which TEP could accommodate within allocated resources.
N/A

PART B Performance Information47
Strategic Objective Performance Indicator
Actual Achievement
2012/2013
Actual Performance against Target Deviation from planned
target to Actual Achievement
Comment on deviations
Strategy to overcome under
performance Planned Target
2014/2015Actual
Achievement 2014/2015
Strategic outcome-oriented goal: Increase contribution of the tourism sector to inclusive economic growth.9. Number of full-
time equivalent (FTE) jobs supported through Tourism Enterprise Partnership per year.
4 040 2 475 *2 701 226 The interventions provided by TEP encouraged enterprises to create more full-time equivalent (FTE) jobs.
N/A
Create employment opportunities by implementing tourism projects targeted at the unemployed through the Expanded Public Works Programme (EPWP).
10. Number of Full Time Equivalent (FTE) jobs created through the social responsibility Implementation programme (EPWP) per year.
2 797 4 369 3 037 1 332 Procurement challenges and delays in appointing service providers for the high labour intensity and training projects.
Appointment of Service providers will be done well in advance during the planning phase.
* TEP figures are based on the audited report of the Independent Auditor (Herman Leach Chartered Accountants (SA)) to the Board of Directors of the Strategic Partners in Tourism (Operating as Tourism Enterprise Partnership).
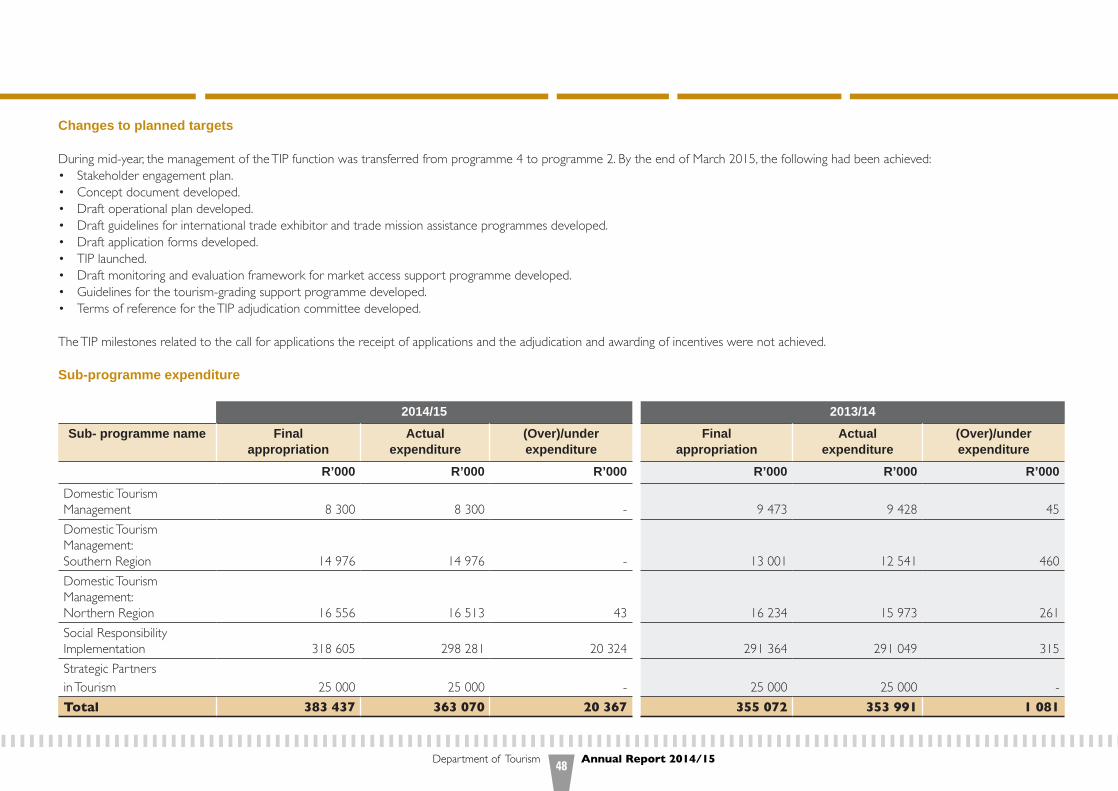
Department of Tourism Annual Report 2014/1548
Changes to planned targets
During mid-year, the management of the TIP function was transferred from programme 4 to programme 2. By the end of March 2015, the following had been achieved: • Stakeholder engagement plan.• Concept document developed. • Draft operational plan developed. • Draft guidelines for international trade exhibitor and trade mission assistance programmes developed. • Draft application forms developed. • TIP launched. • Draft monitoring and evaluation framework for market access support programme developed.• Guidelines for the tourism-grading support programme developed.• Terms of reference for the TIP adjudication committee developed.
The TIP milestones related to the call for applications the receipt of applications and the adjudication and awarding of incentives were not achieved. Sub-programme expenditure
2014/15 2013/14
Sub- programme name Final appropriation
Actualexpenditure
(Over)/under expenditure
Final appropriation
Actualexpenditure
(Over)/under expenditure
R’000 R’000 R’000 R’000 R’000 R’000
Domestic Tourism Management 8 300 8 300 - 9 473 9 428 45Domestic Tourism Management: Southern Region 14 976 14 976 - 13 001 12 541 460Domestic Tourism Management: Northern Region 16 556 16 513 43 16 234 15 973 261Social Responsibility Implementation 318 605 298 281 20 324 291 364 291 049 315Strategic Partners in Tourism 25 000 25 000 - 25 000 25 000 -Total 383 437 363 070 20 367 355 072 353 991 1 081
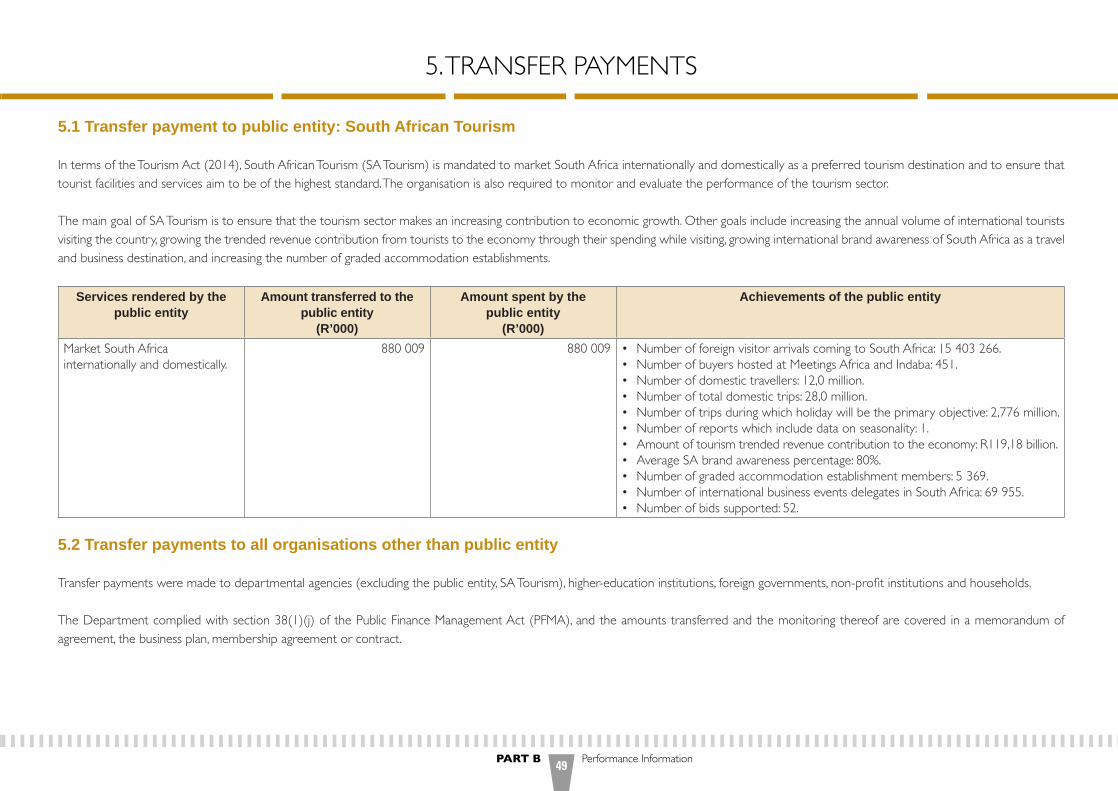
PART B Performance Information49
5.1 Transfer payment to public entity: South African Tourism
In terms of the Tourism Act (2014), South African Tourism (SA Tourism) is mandated to market South Africa internationally and domestically as a preferred tourism destination and to ensure that tourist facilities and services aim to be of the highest standard. The organisation is also required to monitor and evaluate the performance of the tourism sector.
The main goal of SA Tourism is to ensure that the tourism sector makes an increasing contribution to economic growth. Other goals include increasing the annual volume of international tourists visiting the country, growing the trended revenue contribution from tourists to the economy through their spending while visiting, growing international brand awareness of South Africa as a travel and business destination, and increasing the number of graded accommodation establishments.
Services rendered by the public entity
Amount transferred to the public entity
(R’000)
Amount spent by the public entity
(R’000)
Achievements of the public entity
Market South Africa internationally and domestically.
880 009 880 009 • Number of foreign visitor arrivals coming to South Africa: 15 403 266.• Number of buyers hosted at Meetings Africa and Indaba: 451.• Number of domestic travellers: 12,0 million.• Number of total domestic trips: 28,0 million.• Number of trips during which holiday will be the primary objective: 2,776 million.• Number of reports which include data on seasonality: 1. • Amount of tourism trended revenue contribution to the economy: R119,18 billion.• Average SA brand awareness percentage: 80%.• Number of graded accommodation establishment members: 5 369.• Number of international business events delegates in South Africa: 69 955.• Number of bids supported: 52.
5.2 Transfer payments to all organisations other than public entity
Transfer payments were made to departmental agencies (excluding the public entity, SA Tourism), higher-education institutions, foreign governments, non-profit institutions and households.
The Department complied with section 38(1)(j) of the Public Finance Management Act (PFMA), and the amounts transferred and the monitoring thereof are covered in a memorandum of agreement, the business plan, membership agreement or contract.
5. TRANSFER PAYMENTS

Department of Tourism Annual Report 2014/1550
The table below reflects the transfer payments made for the period 1 April 2014 to 31 March 2015:
Name of transferee Type of organisation Purpose for which the funds were used
Did the Department comply with s 38(1)(j)
of the PFMA?
Amount transferred (R’000)
Amount spent by the entity
(R’000)
Reasons for unspent funds
Foreign governments and international organisationsUnited Nations World Tourism Organization (UNWTO)
Foreign governments and international organisations
Membership fee Not applicable 2 286 2 286 Not applicable
Regional Tourism Organisation of Southern Africa (RETOSA)
Foreign governments and international organisations
Membership fee Not applicable 6 266 6 266 Not applicable
Higher-education institutionsUniversity of Pretoria Higher-education
institutionsNational Tourism Research Framework
Yes 1 240 1 240 Not applicable
University of Venda Higher-education institutions
National Tourism Research Framework
Yes 620 620 Not applicable
University of Zululand Higher-education institutions
National Tourism Research Framework
Yes 620 620 Not applicable
University of Johannesburg
Higher-education institutions
National Tourism Research Framework
Yes 620 620 Not applicable
Cape Peninsula University of Technology
Higher-education institutions
National Tourism Research Framework
Yes 620 620 Not applicable
HouseholdsEPWP Households Development of tourism
infrastructure projectsYes 93 909 93 909 Not applicable
EPWP incentive Households Development of tourism infrastructure projects
Yes 47 450 47 450 Not applicable
TIP Households Yes 15 361 15 361 Not applicableLeave gratuity Households Employee social benefits Yes 2 031 2 031 Not applicable

PART B Performance Information51
Name of transferee Type of organisation Purpose for which the funds were used
Did the Department comply with s 38(1)(j)
of the PFMA?
Amount transferred (R’000)
Amount spent by the entity
(R’000)
Reasons for unspent funds
Non-business entitiesEastern Cape Parks and Tourism Agency
Non-business entities NTCE Yes 3 630 3 630 Not applicable
Tourism Accelerated Apprenticeship Programme
Non-business entities Empowerment of tourism graduates
Yes 2 000 2 000 Not applicable
Culture, Art, Tourism, Hospitality and Sports Sector Education and Training Authority (CATHSSETA)
Non-business entities Training contribution Yes 230 0 Amount transferred end of March 2015
Public Service Sector Education and Training Authority (PSETA)
Non-business entities Training contribution Yes 388 0 Amount transferred end of March 2015
Non-profit institutionsStrategic Partners in Tourism
Non-profit institutions TEPSMME development
Yes 25 000 25 000 Not applicable
Tourism interpretive signage
Non-profit institutions Tourism signage for world heritage sites
Yes 1 250 1 250 Not applicable
Federated Hospitality Association of South Africa (Fedhasa)
Non-profit institutions Contribution to operations of Fedhasa
Yes 200 200 Not applicable
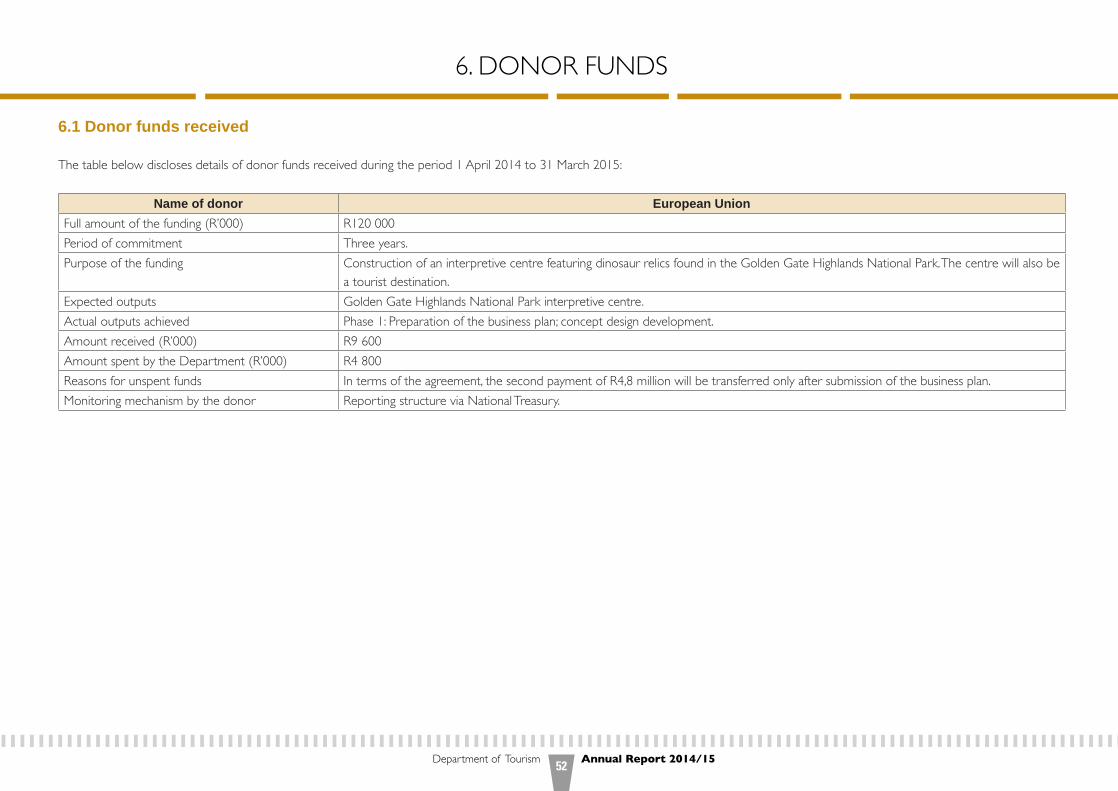
Department of Tourism Annual Report 2014/1552
6.1 Donor funds received
The table below discloses details of donor funds received during the period 1 April 2014 to 31 March 2015:
Name of donor European UnionFull amount of the funding (R’000) R120 000Period of commitment Three years.Purpose of the funding Construction of an interpretive centre featuring dinosaur relics found in the Golden Gate Highlands National Park. The centre will also be
a tourist destination.Expected outputs Golden Gate Highlands National Park interpretive centre.Actual outputs achieved Phase 1: Preparation of the business plan; concept design development.Amount received (R’000) R9 600Amount spent by the Department (R’000) R4 800Reasons for unspent funds In terms of the agreement, the second payment of R4,8 million will be transferred only after submission of the business plan.Monitoring mechanism by the donor Reporting structure via National Treasury.
6. DONOR FUNDS

PART Cgovernance
Chief Director for Corporate Affairs, Albert Mafanele during the launch of the tourism service charter.

Department of Tourism Annual Report 2014/1554
1. INTRODUCTION
Effective corporate governance remains an integral part of the Department’s strategic and operational activities. The Department is committed to the highest standards and principles of good corporate governance, as supported by the Public Finance Management Act, 1999 (Act 1 of 1999) (PFMA), as amended. It is also committed to the Batho Pele principles and is guided by its own risk management framework and the King Code on Corporate Governance (King III). To this end, the Department regularly reviews its internal control framework to ensure that it maintains adequate systems of internal control and risk management.
2. RISK MANAGEMENT
The Department recognises that risk management is a valuable management tool, which increases its prospects of success through minimising any negative impact and optimising all opportunities emanating from its operating environment. It understands that risk management is ideally intended to ensure that potential challenges are managed effectively. Risk management processes add value to the Department’s operations through the systematic identification, assessment, prioritisation and evaluation of key risks. The risk management strategy, therefore, remains in synergy with the Department’s goals and objectives.
The Department’s risk management processes are aimed at:
a) ensuring sustainable and efficient service delivery;b) assisting management in making informed decisions underpinned by appropriate tactical,
project, fraud, strategic, operational and strategic risk assessment; c) avoiding fruitless and wasteful expenditure;d) instituting preventative measures to avoid fraud and corruption; e) advancing economical, efficient and effective utilisation of resources; and f) improving programme and project management.
The Department has laid the foundations by ensuring the establishment of the Risk Management Committee (RMC) and the development of the departmental risk management framework,
strategies and plans (risk and fraud). In the period under review, the RMC discharged its governance responsibilities relating to risk management as mandated by the PFMA, the Public Sector Risk Management Framework and the Treasury regulations.
The key responsibilities of the RMC are to:
a) review and recommend the Department’s risk management framework to the DG for approval;
b) evaluate the extent and effectiveness of integration of risk management in the Department;c) assess the implementation of the risk management policy and strategy (including the risk
management implementation plan); d) evaluate the effectiveness of the risk mitigation strategies, and recommend improvement; e) review the material findings recommended by assurance providers on the system of risk
management, and monitor the implementation of such recommendations; f) interact with the Audit Committee to share information on material risks; andg) provide timely risk management reports to the DG.
During the reporting period, the RMC held four ordinary meetings, the details of which are indicated in the table below:
Name Designation 4 April 2014
3 July 2014
18 November 2014
23 March 2015
1. Ms Thabile Nyaba External chairperson
P P P P
2. Mr Dirk van Schalkwyk Member P P A P3. Mr Victor Tharage Member A P * *4. Ms Aneme Malan Member P A P P5. Ms Morongoe Ramphele Member A A P P6. Mr Ralph Ackermann Member P P P A7. Mr Albert Mafanele Member P A A P8. Ms Mmaditonki Setwaba Member P P P P
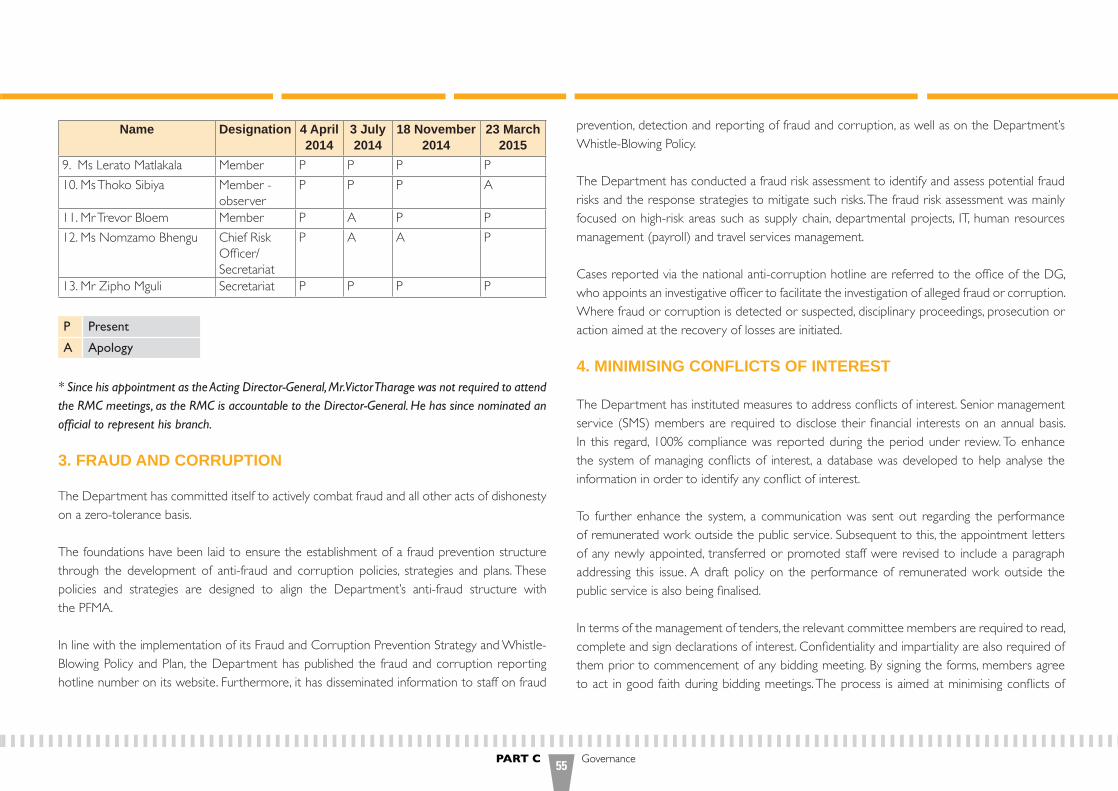
PART C Governance55
Name Designation 4 April 2014
3 July 2014
18 November 2014
23 March 2015
9. Ms Lerato Matlakala Member P P P P10. Ms Thoko Sibiya Member -
observerP P P A
11. Mr Trevor Bloem Member P A P P12. Ms Nomzamo Bhengu Chief Risk
Officer/ Secretariat
P A A P
13. Mr Zipho Mguli Secretariat P P P P
P Present
A Apology
* Since his appointment as the Acting Director-General, Mr. Victor Tharage was not required to attend the RMC meetings, as the RMC is accountable to the Director-General. He has since nominated an official to represent his branch.
3. FRAUD AND CORRUPTION
The Department has committed itself to actively combat fraud and all other acts of dishonesty on a zero-tolerance basis.
The foundations have been laid to ensure the establishment of a fraud prevention structure through the development of anti-fraud and corruption policies, strategies and plans. These policies and strategies are designed to align the Department’s anti-fraud structure with the PFMA.
In line with the implementation of its Fraud and Corruption Prevention Strategy and Whistle-Blowing Policy and Plan, the Department has published the fraud and corruption reporting hotline number on its website. Furthermore, it has disseminated information to staff on fraud
prevention, detection and reporting of fraud and corruption, as well as on the Department’s Whistle-Blowing Policy.
The Department has conducted a fraud risk assessment to identify and assess potential fraud risks and the response strategies to mitigate such risks. The fraud risk assessment was mainly focused on high-risk areas such as supply chain, departmental projects, IT, human resources management (payroll) and travel services management.
Cases reported via the national anti-corruption hotline are referred to the office of the DG, who appoints an investigative officer to facilitate the investigation of alleged fraud or corruption. Where fraud or corruption is detected or suspected, disciplinary proceedings, prosecution or action aimed at the recovery of losses are initiated.
4. MINIMISING CONFLICTS OF INTEREST
The Department has instituted measures to address conflicts of interest. Senior management service (SMS) members are required to disclose their financial interests on an annual basis. In this regard, 100% compliance was reported during the period under review. To enhance the system of managing conflicts of interest, a database was developed to help analyse the information in order to identify any conflict of interest.
To further enhance the system, a communication was sent out regarding the performance of remunerated work outside the public service. Subsequent to this, the appointment letters of any newly appointed, transferred or promoted staff were revised to include a paragraph addressing this issue. A draft policy on the performance of remunerated work outside the public service is also being finalised.
In terms of the management of tenders, the relevant committee members are required to read, complete and sign declarations of interest. Confidentiality and impartiality are also required of them prior to commencement of any bidding meeting. By signing the forms, members agree to act in good faith during bidding meetings. The process is aimed at minimising conflicts of

Department of Tourism Annual Report 2014/1556
interest in supply chain management. If a member of the tender committee manages the line function relating to a specific tender, that member will not participate in the departmental adjudication committee.
Furthermore, supply chain management officials are required to sign Practice Note No SCM 4 of 2003, “Code of Conduct for Supply Chain Management Practitioners”, on or before the start of each financial year. For the period under review, no reports of conflicts of interest were received.
5. CODE OF CONDUCT
The Department’s code of conduct sets the minimum standards with which employees are expected to comply. It assists in promoting appropriate conduct in the process of service delivery to the communities. The service charter further contributes to committing the Department to high service standards. Any alleged breach of the code of conduct is regarded as misconduct, in which case the Department will investigate and institute disciplinary action against any implicated official. Based on the outcome of the investigation, appropriate sanctions are imposed in terms of the Disciplinary Code and Procedure for Public Service (Resolution 1 of 2003).
6. HEALTH, SAFETY AND ENVIRONMENTAL ISSUES
The Department’s internal Occupational Health and Safety Policy is aimed at safeguarding the interests of employees, all visitors and clients. This is done through the provision and maintenance, as far as reasonably practical, of a working environment that is safe and without risks. In order to ensure such an environment, the Department provides and maintains safe offices and equipment that pose no risk to the health of employees, visitors and clients.
The Department has appointed health and safety representatives, fire marshals and first-aiders who have completed their training in basic first aid and fire-fighting. These representatives assist in conducting inspections in the workplace to minimise hazards that may affect and expose employees, visitors and clients to health risks. Further training will be conducted for additional
members, who have been appointed to the emergency team to ensure that there is enough personnel to attend to emergencies.
Appointed in 2014/15, the Health and Safety Committee will review existing health and safety measures, provide advice and make recommendations to management on any health and safety matter that requires management’s attention.
Additional fire equipment was installed in the Department to ensure proper fire detection. Maintenance plans also ensure the proper servicing of all mechanical and electrical equipment.
Disposal of waste is monitored and conducted appropriately. Dedicated waste disposal spaces for various types of waste have been provided. Paper waste is disposed of separately to prevent fire. Information sessions and dry-runs have been performed to educate employees on the emergency exit routes and to test their knowledge on the evacuation procedures to be followed in case of emergency.
An evacuation drill was conducted in the course of the financial year. Further evacuation drills will be conducted every six months to ensure the safety of all employees, visitors and clients.
The measures that are in place have equipped employees with knowledge of health, safety and environmental issues. As a result, employees are able to assist in identifying potential hazards and promptly reporting them to the building management team for immediate attention. This reduces the risks of any dangers occurring in and around the working environment.
7. PORTFOLIO COMMITTEE ON TOURISM AND SELECT COMMITTEE ON TRADE AND INTERNATIONAL RELATIONS
The Portfolio Committee on Tourism (in the National Assembly) and the Select Committee on Trade and International Relations (in the National Council of Provinces, or NCOP) were established in terms of sections 55 and 69 of Chapter 4 of the Constitution. Their primary role is to oversee the actions of government, to assure Parliament of such oversight role, and also to provide assurance that government is able to provide services to all citizens.

PART C Governance57
Composition of committees
PORTFOLIO COMMITTEE ON TOURISM – NATIONAL ASSEMbLYAfrican National Congress (ANC) Ms BT Ngcobo (Chairperson)
Ms LS Makhubela-Mashele (Whip)Mr SD BekwaMs PE AdamsMs ST Xego-SovitaMs EK Masehela
Democratic Alliance (DA) Mr J VosMr GR KrumbockMr AG Whitfield
Inkatha Freedom Party (IFP) Mr JA EsterhuizenEconomic Freedom Fighters (EFF) Mr NP Khoza
ALTERNATESParty Member Province
ANC Ms GM Manopole Northern Cape Mr JP Parkies Free State
DA Mr F Essack MpumalangaMr EJ von Brandis Western Cape
EFF Mr MA Matebus Northern CapeUnited Democratic Movement (UDM)
Mr LB Gaehler Eastern Cape
SELECT COMMITTEE ON TRADE AND INTERNATIONAL RELATIONS (NATIONAL COUNCIL OF PROVINCES)
Party Name Province African National Congress (ANC) Mr ER Makue (Chairperson) Gauteng
Mr SG Mthimunye (Whip) MphumalangaMs MC Dikgale LimpopoMr BG Nthebe North WestMr L Suka Eastern Cape
Democratic Alliance (DA) Mr WF Faber Northern Cape Mr JJ Londt Western CapeMs EC Van Lingen Eastern Cape
Economic Freedom Fighters (EFF) Mr LG Mokoena Free StateDr YC Vawda Mpumalanga
Committee meeting dates, matters raised by the portfolio and Select Committee on Trade and International Relations, on how these were addressed by the Department
PORTFOLIO COMMITTEE ON TOURISM (NATIONAL ASSEMbLY)
Briefing by the Department on the Strategic Plan and Annual Performance Plan 2014/15 on 4 July 2014
The committee provided comments to the Department on its five year plan and 2014/15 Annual Performance Plan. The matters highlighted included the focus on job creation, addressing obstacles to tourism growth in South Africa, with specific reference to immigration regulations, prioritisation of domestic tourism, sector transformation, inter-governmental coordination and capacity of local government to develop tourism.
In 2014/15, the Department implemented the following programmes to address the portfolio committee’s comments:
• Implementation of the National Tourism Sector Strategy (NTSS) towards job creation in the tourism sector;
Department of Tourism Annual Report 2014/1558
• Implementation of the Department’s Social Responsibility Implementation Programme, which creates full-time equivalent jobs aimed at the unemployed youth, women and people living with disabilities;
• Engaged directly with the Department of Home Affairs and through the economic cluster system of FOSAD on the matter of new immigration regulations;
• Funded the Domestic Tourism Marketing Strategy implemented by SA Tourism and implemented the Domestic Tourism Growth Strategy;
• Amended the tourism B-BBEE codes to promote sector transformation;• Continued to coordinate matters of tourism development bilaterally with departments
whose mandates affect tourism, and through the MINMEC and FOSAD systems; and• Programme for capacity building for tourism practitioners and policy-makers at local
government level, held the tourism local government conference.
Briefing by the Department on the National Tourism Sector Strategy (NTSS) on 22 August 2014
The committee raised matters relating to tourism statistics, domestic air transport, capacity of local municipalities to develop tourism, disaster management response, the TOMSA levy, tourism infrastructure development in relation to the Presidential Tourism Coordinating Committee (PICC), monitoring of the NTSS, intergovernmental coordination and sector transformation.
The Department implemented the following to address the matters raised by the committee:
• Engaged with Statistics South Africa to address matters relating to tourism statistics;• Engaged with the departments of Public Enterprises and Transport to address issues of
domestic air transport;• Implemented the programme for capacity building for tourism practitioners and policy -
makers at local government level, and held the tourism local government conference;• Collaborated with provinces to submit to the PICC tourism infrastructure projects to be
supported;• Through the National Tourism Sector Forum, the Department monitors and reports on
the implementation of the NTSS;• Amended the tourism B-BBEE codes to promote sector transformation; and
• Continued to coordinate matters of tourism development bilaterally with departments whose mandates affect on tourism, and through the MINMEC and FOSAD systems.
Briefing by the Department on the Tourism Incentive Programme (TIP) on 5 September 2014 and 13 March 2015
The committee sought details on the plans for the implementation of the TIP, how it would be distinguished from the Tourism Support Programme (TSP) previously housed in the dti, and how it would support sector transformation.
The Department has designed the systems for the TIP. In the qualifying criteria for awarding the incentive, the Department has addressed the issue of promoting transformation. The nature of the TIP distinguishes it from the TSP in the qualifying criteria and in the areas of investment selected.
Briefing by the Department on the National Heritage and Cultural Tourism Strategy and the Rural Tourism Strategy on 19 September 2014
The committee raised matters relating to marketing of heritage, training of local tourist guides and preservation of national assets.
The Department has prioritised support to South Africa’s World Heritage Sites. It has also developed plans to support the professionalisation of the tourist guiding subsector. A video on Cultural and Heritage Tourism was provided to the committee.
Briefing by the Department on the Annual Report 2013/14 on 24 October 2014
The committee raised matters relating to impact assessment of departmental programmes and classification of the Expanded Public Works Programme (EPWP) transfers.
The Department has a programme that conducts impact assessments of selected projects in the Department. It is also addressing the matter of classification of the EPWP transfers with National Treasury.
PART C Governance59
Briefing by the Department on the binnual report for 2014/15 during the oversight visit on 25 November 2014
The committee raised a matter relating to the explanation of deviations from performance targets. They also requested more details to support their preparation for the Budgetary Review and Recommendations Report.
The Department provided an explanation of any deviation in terms of performance targets.
Short presentation on a scan of the tourism environment during the oversight visit on 25 November 2014
The committee welcomed the presentation on the tourism environment scan.
Briefing on the Department’s focus areas for the next five years during the continued oversight visit on 4 February 2015
The committee raised matters relating to delays in the release of tourism statistics, the revamping of the Tourism Indaba, the impact of immigration regulations, promotion of responsible tourism and funding of the Tourism Enterprise Programme.
The Department has done the following to address these matters:
• Engaged with Statistics South Africa on the release of tourism statistics. These have since been released;
• The Minister has appointed a panel to review the Tourism Indaba;• Engaged directly with the Department of Home Affairs and through the economic cluster
system of FOSAD on the matter of new immigration regulations;• The Department promotes the implementation of responsible tourism standards; and• The TEP will be funded in the 2015/16 financial year.
Briefing by the Department on the five-year Strategic Plan 2015/16-2019/20 and APP 2015/16 on 27 March 2015
The committee sought more detail on the planned projects for the next five years. The Department presented in detail the five-year plan, with a focus on the year of the Annual Performance Plan.
SELECT COMMITTEE ON TRADE AND INTERNATIONAL RELATIONS (NATIONAL COUNCIL OF PROVINCES)
Briefing by the Department on the Strategic Plan and APP of 2014/15 on 16 July 2014
The committee raised matters relating to advocacy to promote access to information on tourism programmes, promotion of rural tourism, sustainability of World Heritage Sites, tourism statistics, the tourism budget structure for provinces, details on SRI projects, tourism signage and the appointment of a Tourism Complaints Officer.
The Department has implemented the following in response:
• Expanded its use of various media platforms to communicate its programme, including through community radio stations, social media and the departmental website;
• Prioritised support to South Africa’s World Heritage Sites as tourism attractions; • Engaged with Statistics South Africa to address matters relating to tourism statistics;• Developed the tourism budget structure in collaboration with National Treasury, provincial
treasuries and the provincial departments responsible for the tourism portfolio;• Submitted to the committee the details of SRI projects;• Prioritised the implementation of tourism interpretive signage at South Africa’s World
Heritage Sites; and• The Minister appointed the Tourism Complaints Officer in terms of the Tourism Act, 2014.
Briefing on the Rural and Heritage Strategy and a short briefing on the NTSS on 15 October 2014
The committee emphasised the importance of domestic tourism. The Department has implemented the Domestic Tourism Growth Strategy and has funded the Domestic Tourism Marketing Strategy implemented by SA Tourism.
Oversight visit to Mapungubwe World Heritage Site on 23 October 2014
The committee recommended improvements in signage and accommodation for school children visiting the site. The Department is implementing improvements in signage at the site through a partnership with the management authority.
Department of Tourism Annual Report 2014/1560
Briefing by the Department on the Annual Report 2013/14 on 5 November 2014
The committee raised matters relating to the Local Government Conference, the tourism toolkit for local government, the department’s research on support to beneficiaries following land settlement.
The Department held the Local Government Conference on 30-31 March 2015. The tourism toolkit for local government was provided to the committee. The Department is finalising the report on support to beneficiaries following land settlement.
8. SCOPA RESOLUTIONS
The Department has no Standing Committee on Public Accounts (SCOPA) resolutions on which to report.
9. PRIOR MODIFICATIONS TO AUDIT REPORTS
No matters were reported by the AGSA in the previous financial year, and therefore, no modifications were done to prior audit reports.10. INTERNAL CONTROL UNIT
The Department of Tourism does not have an internal control unit due to various reasons, including limited budget allocation for the compensation of employees, and the size of the Department. However, the Directorate: Financial Management and the Directorate: Supply Chain Management fulfil the function of an internal control unit, as submission, forms, route forms and delegations are compiled in such a manner so as to ensure compliance.
11. INTERNAL AUDIT AND AUDIT COMMITTEES
The Internal Audit Unit provides assurance and consulting services.
The Internal Audit Unit conducts its affairs in terms of an approved Internal Audit charter.
It follows a risk based audit approach, whereby the Department’s Risk Strategy and Internal Audit Unit’s assessment of risks drive the internal audit approach and approved Internal Audit Plan, The Internal Audit Unit Plan was formally adopted and approved by the Audit Committee.
Below are some of the audits performed by Internal Audit during the 2014/15 financial year :
• Predetermine objectives.• Annual Report 2013/14.• Travel expenditure - refunds.• Employee Wellness Programme.• Assets management.• Performance audit - integrated planning within the three spheres of government.• Social Responsibility Implementation Programme.• National Tourism Sector Strategy.• Stakeholder management.• ICT governance.• IT general controls.• Performance audit – Internal Tourism Management.• Follow-up audit on Auditor-General 2013/14 report.• Second draft of the Department’s Strategic Plan.
Progress on the implementation of the plan was monitored and reported on at each Audit Committee meeting.
The primary purpose of the Audit Committee is to assist the Department in fulfilling its oversight responsibilities and ensuring that the Department has and maintains effective, efficient and transparent systems of financial, risk management, governance and internal control by: (i) supporting management in respect of financial reporting and a system of internal control;(ii) enhancing business ethics and trust in the Department; (iii) ensuring and enhancing the independence of internal audit activity;(iv) ensuring that risks facing the Department are identified and that appropriate procedures
are implemented to manage and minimise risks;(v) ensuring the proper functioning of the audit process; and(vi) monitoring compliance with laws, regulations and codes of conduct.

PART C Governance61
Audit Committee members and attendance
The Audit Committee consist of the members listed below and meets at least four times per annum as per its approved terms of reference. During the year under review, four meetings were held.
The table below discloses relevant information on the audit committee members:
Name Qualifications Internal or external
Date appointed
Date resigned
No of meetings attended
Prof H de Jager DCom CA (SA); RGA
External 1 August 2012 4
Mr JR Rapoo BComm (Law); Hons.BCompt
External 1 August 2012 4
Mr R Rajcoomar Hons.BComm in Business Management; Master of Business Administration
External 1 August 2012 3
Ms KT Rapoo Advanced Project Management; EDP Gibbs
External 1 August 2012 4
12. AUDIT COMMITTEE REPORT
We are pleased to present our report for the financial year ended 31 March 2015.
Audit Committee responsibility
The Audit Committee reports that it has complied with its responsibilities arising from section 38(1)(a)(ii) of the Public Finance Management Act and Treasury regulation 3.1.13.
In addition, the Audit Committee has adopted appropriate formal terms of reference as its Audit Committee Charter, has regulated its affairs in compliance with this charter, and has discharged all its responsibilities as contained therein, except that it has not reviewed changes in accounting policies and practices.
The effectiveness of internal control
The Department’s system of internal control is designed to provide reasonable assurance, inter alia, that assets are safeguarded and that liabilities and working capital are efficiently managed. Based on the approved annual internal audit plan setting out the scope, control objectives and risks for the period covered, various reports were submitted by the internal auditors.
The results of the internal and external audits indicated that controls have been operating as intended in certain areas, while in others attention should be given to strengthening, improving and monitoring the controls. Where control weaknesses and other matters were reported, the Audit Committee has considered management’s responses to address the matters and to facilitate corrective actions, improvements and monitoring of the controls and procedures. Implementation of such corrective actions is monitored through an issue-tracking report and the follow-up review reports submitted to the committee on a regular basis.
The following internal audit work was completed during the year under review:
• Predetermine objectives.• Annual Report 2013/14.• Travel expenditure - refunds.• Employee Wellness Programme.• Assets management.• Performance audit - integrated planning within the three spheres of government.• Social Responsibility Implementation Programme.• National Tourism Sector Strategy.• Stakeholder management.• ICT governance.• IT general controls.
Department of Tourism Annual Report 2014/1562
• Performance audit - International Tourism Management.• Follow-up audit on Auditor-General 2013/14 report.• Second draft of the Department’s Strategic Plan.
In-year management and monthly/quarterly report
The Audit Committee is satisfied with the content and quality of monthly and quarterly reports prepared and issued by the Department during the year under review.
Evaluation of Financial Statements
The Audit Committee has:
• Reviewed and discussed the audited annual financial statements to be included in the annual report with the AGSA and management.
• Reviewed the AGSA management report and management’s response thereto.• Reviewed the department’s compliance with legal and regulatory provisions based on the
findings of the AGSA and internal audit. • Noted that there were certain adjustments resulting from the audit.
The Audit Committee concurs and accepts the Auditor-General’s conclusion on the annual financial statements, and is of the opinion that the audited annual financial statements be accepted and read together with the report of the AGSA.
The Audit Committee would like to impress upon management to give more attention to monitor the controls, to ensure that appropriate corrective action is taken to prevent a reoccurrence in the future.
The Committee believes that the adoption of the going concern concept assertion in the preparation of the Annual Financial Statements is appropriate.
Management is commended that the Audit Report is unqualified and for their attitude to take corrective actions.
Internal Audit
The Internal Audit Unit conducts its affairs in terms of an approved Internal Audit Charter, which is reviewed on an annual basis. The Internal Audit Unit follows a risk-based audit approach, whereby the Department’s risk strategy and the Internal Audit Unit’s assessment of the risks are taken into account.
The Internal Audit Plan was formally adopted and approved by the Audit Committee. Progress on the execution of the plan was monitored and reported on at each Audit Committee meeting.
The Audit Committee is therefore satisfied that the Internal Audit function (in-house) is operating effectively and that it has addressed the risks pertinent to the Department in its audit plan.
Risk strategy
The Department has a risk management strategy in place and actively monitors and takes appropriate action against the risks identified per the risk register.
Auditor General’s report
The Audit Committee has met with the Auditor-General South Africa to ensure that there are no unresolved issues as at 29 July 2015.
Prof H de JagerChairperson of the Audit CommitteeDepartment of TourismDate: 29 July 2015

PART Dhuman resource
management
Minister Derek Hanekom presents a long service award to Ms Glenda Esemang.
Department of Tourism Annual Report 2014/1564
1. INTRODUCTION
The information contained in this part of the Annual Report has been prescribed by the Minister for the Public Service and Administration for all departments in the public service.
2. OVERVIEW OF HUMAN RESOURCES
The status of human resources in the Department
Human resources are among the most strategic resources that are managed with great care and diligence within the Department.
An efficiently run Human Resources Component provides the Department with the organisational structure and the concomitant human resources required to meet its needs in pursuit of its strategic goals by managing the Department’s most valuable resources – its employees. The Human Resources Component is strategically positioned to: • retain, engage and attract outstanding employees;• promote a workforce that is diverse and inclusive; • provide a safe and healthy, learning and working environment; and• develop employees to their fullest potential.
Human resource priorities for the year under review, and the impact of these priorities
a. To recruit a suitably qualified, capable and skilled workforce.b. To promote employment equity.c. To have skilled, motivated, capacitated and empowered employees who are equipped to
deliver on the mandate of the Department.d. To develop high-quality leaders and managers who exemplify the core values of the Public
Service and the Department, and are committed to service delivery.e. To promote effective performance management systems.
f. To effectively manage employee health and wellness in the workplace.g. To coordinate special transformation programmes.h. To promote sound labour relations between employer and employees.
Workforce planning and key strategies to attract and recruit a skilled and capable workforce
Workforce planning is about having the right people with the right skills in the right jobs at the right time and at the right cost. It identifies the gap between current workforce capabilities and the workforce capabilities required to achieve the Department’s strategic goals in an ever changing operational environment. This is what the Department has been striving to achieve during the year under review.
Workforce planning is guided by the Department’s strategy. The legal framework in this regard consists of the Employment Equity Act, Public Service Act and Public Service Regulations. During the year under review, the implementation of the Human Resources Strategy 2014-2017 continued in order to guide the process of attracting, recruiting and developing a skilled and capable workforce. This has been achieved and is exemplified by the quality and number of employees that have been attracted to the organisation.
In view of the large number of generic posts in the International Tourism Management and Domestic Tourism Management branches, a generic recruitment approach was developed for implementation on 1 April 2014.
Employee performance management
The Department annually commits to 100% implementation of the performance management development system (PMDS), as guided by the departmental PMDS Policy and relevant chapter of the Senior Management Service (SMS) Handbook. Workshops are conducted to provide knowledge and understanding on the development of performance agreement and work plans as well as on how to assess performance.

PART D Human Resource Management65
Employees’ performance assessments are conducted at the end of the financial year, and performance outcomes implemented. Employees who performed outstandingly were afforded performance rewards and pay progression according to policy guidelines. Steps are taken to address poor performance, such as retraining and other interventions.
Employee wellness programmes
During the period under review, the Employee Health and Wellness (EHW) Unit managed to coordinate programmes that were in line with the EHW Public Service Strategic Framework (2008), which is composed of four strategic intents and policies, namely the HIV & Aids and TB Management Policy, the Health and Productivity Management Policy, the Occupational Health and Safety Management Policy and the Wellness Management Policy. The EHW Unit managed to implement the Wellness Management Policy by reaching an average of 22% of the departmental staff members during the wellness days coordinated once per quarter. Implementation of the HIV & Aids Management Policy saw an average of 13% of staff receiving HIV counselling and testing. As far as implementation of the Health and Productivity Management Policy and the Occupational Health and Safety Policy is concerned, 0,74% and 4% of cases were attended to in the Department. Adequate implementation of two additional policies, namely the Bereavement and Sports & Recreation policies, means that the Department’s EHW programmes were fully functional during the period under review.
Achievements and challenges faced by the Department, as well as future human resource plans/goals
The Department has exceeded government’s targets for the representation of persons with disabilities and currently stands at 5,3% representation for this group. At SMS level, the Department has reached 48% female occupation of posts and continues to pursue the 50% mark in the new financial year.
A 100% disclosure rate was recorded in respect of SMS members’ financial interests.
Looking into future human resource plans/goals, the Department’s existing human resource policies, procedures and systems (codes of practice) and the HR Strategy 2015-2018 provide an effective framework for recruiting, developing and retaining staff in a fair and supportive environment. To this end, the goals listed in the strategy are as follows:a) Strategic partnerships with core businessb) Employee championshipc) Organisational development and designd) Recruitment and employee life-cycle management, with two sub-categories:
i. Human resource utilisation ii. Human resource development

Department of Tourism Annual Report 2014/1566
3. HUMAN RESOURCES OVERSIGHT STATISTICS
3.1 Personnel-related expenditure
The following tables summarise the final, audited personnel-related expenditure by programme and salary band. In particular, they provide an indication of the following:• Amount spent on personnel; and • Amount spent on salaries, overtime, homeowner’s allowances and medical aid.
Table 3.1.1 Personnel expenditure by programme for the period 1 April 2014 to 31 March 2015
Programme Total expenditure Personnel expenditure
Training expenditure Professional and special services
expenditure
Personnel expenditure as a % of total expenditure
Average personnel cost per employee
R’000 R’000 R’000 R’000 R’000Administration 219 783 115 076 3 178 - 52,8 216Policy and Knowledge Services 929 647 33 388 188 - 3,6 63International Tourism 45 094 32 030 200 - 71,1 60Domestic Tourism 363 070 51 010 259 - 49,2 96Total 1 557 594 231 504 3 825 - 14,9 435
Table 3.1.2 Personnel costs by salary band for the period 1 April 2014 to 31 March 2015
Salary band Personnel expenditure % of total personnel cost Number of employees Average personnel cost per employee
R’000 RSkilled (levels 3-5) 4 758 2 31 153 484Highly skilled production (levels 6-8) 47 822 20 188 254 372Highly skilled supervision (levels 9-12) 106 498 46 218 488 523Senior and top management (levels 13-16) 61 274 27 61 1 004 492Contract 11 152 5 34 328 000Total 231 504 100 532 435 157
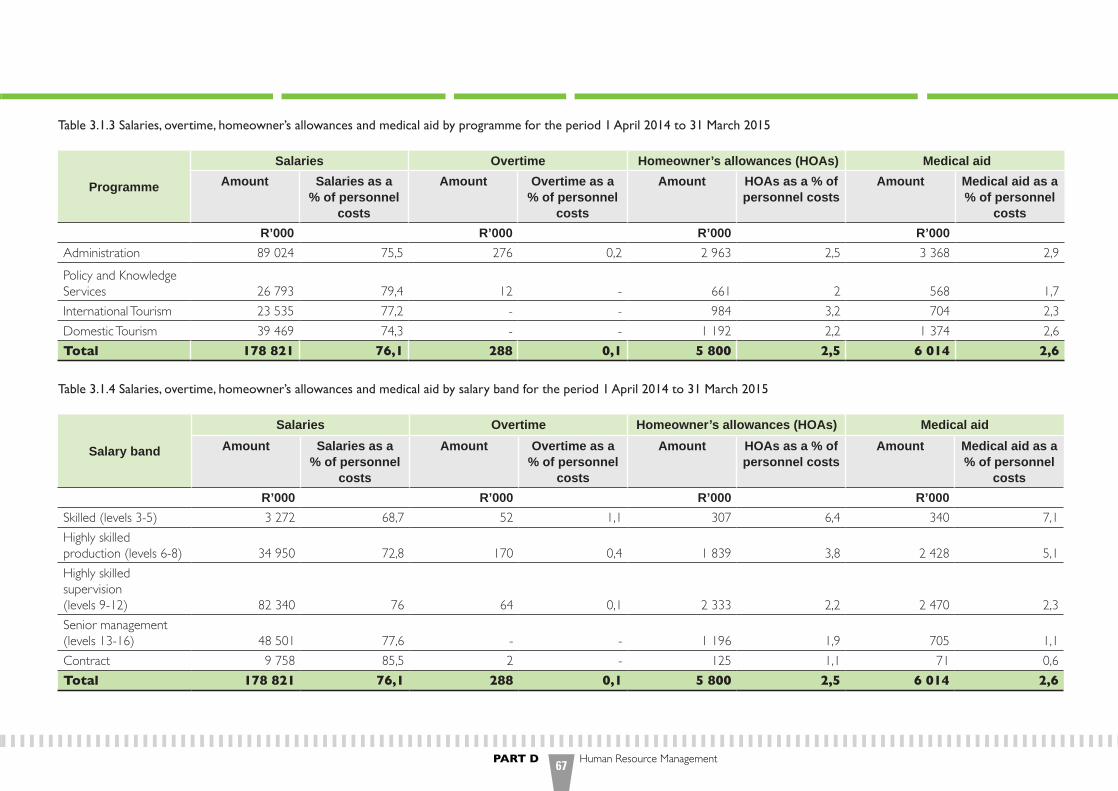
PART D Human Resource Management67
Table 3.1.3 Salaries, overtime, homeowner’s allowances and medical aid by programme for the period 1 April 2014 to 31 March 2015
Programme
Salaries Overtime Homeowner’s allowances (HOAs) Medical aidAmount Salaries as a
% of personnel costs
Amount Overtime as a % of personnel
costs
Amount HOAs as a % of personnel costs
Amount Medical aid as a % of personnel
costs R’000 R’000 R’000 R’000
Administration 89 024 75,5 276 0,2 2 963 2,5 3 368 2,9Policy and Knowledge Services 26 793 79,4 12 - 661 2 568 1,7International Tourism 23 535 77,2 - - 984 3,2 704 2,3Domestic Tourism 39 469 74,3 - - 1 192 2,2 1 374 2,6Total 178 821 76,1 288 0,1 5 800 2,5 6 014 2,6
Table 3.1.4 Salaries, overtime, homeowner’s allowances and medical aid by salary band for the period 1 April 2014 to 31 March 2015
Salary band
Salaries Overtime Homeowner’s allowances (HOAs) Medical aidAmount Salaries as a
% of personnel costs
Amount Overtime as a % of personnel
costs
Amount HOAs as a % of personnel costs
Amount Medical aid as a % of personnel
costs R’000 R’000 R’000 R’000
Skilled (levels 3-5) 3 272 68,7 52 1,1 307 6,4 340 7,1Highly skilled production (levels 6-8) 34 950 72,8 170 0,4 1 839 3,8 2 428 5,1Highly skilled supervision (levels 9-12) 82 340 76 64 0,1 2 333 2,2 2 470 2,3Senior management (levels 13-16) 48 501 77,6 - - 1 196 1,9 705 1,1Contract 9 758 85,5 2 - 125 1,1 71 0,6Total 178 821 76,1 288 0,1 5 800 2,5 6 014 2,6

Department of Tourism Annual Report 2014/1568
3.2 Employment and vacancies
The tables in this section summarise the position with regard to employment and vacancies.
The following tables summarise the number of posts on the Department’s establishment, the number of employees, the vacancy rate and whether there are any staff additional to the establishment. This information is presented in terms of three key variables:• Programme;• Salary band; and• Critical occupations.
Table 3.2.1 Employment and vacancies by programme as at 31 March 2015
Programme Number of posts Number of posts filled Vacancy rate Number of Posts Filled Additional to the Establishment
Administration 291 278 4,5% 5Policy & knowledge services 83 70 15,7% 1International tourism 70 66 5,7% 5Domestic tourism 102 99 2,9% 7Total 546 513 6% 18
Table 3.2.2 Employment and vacancies by salary band as at 31 March 2015
Salary band Number of posts Number of posts filled Vacancy rate Number of Posts Filled Additional to the Establishment
Lower skilled (Levels 1-2) 0 0 0% 17
Skilled (Levels 3-5), Permanent 34 33 2,9% 0
Highly skilled production (Levels 6-8) 207 194 6,3% 0Highly skilled supervision (Levels 9-12) 236 224 5,1% 0Senior management (Levels 13-16) 69 62 10,1% 0Total 546 513 6% 18
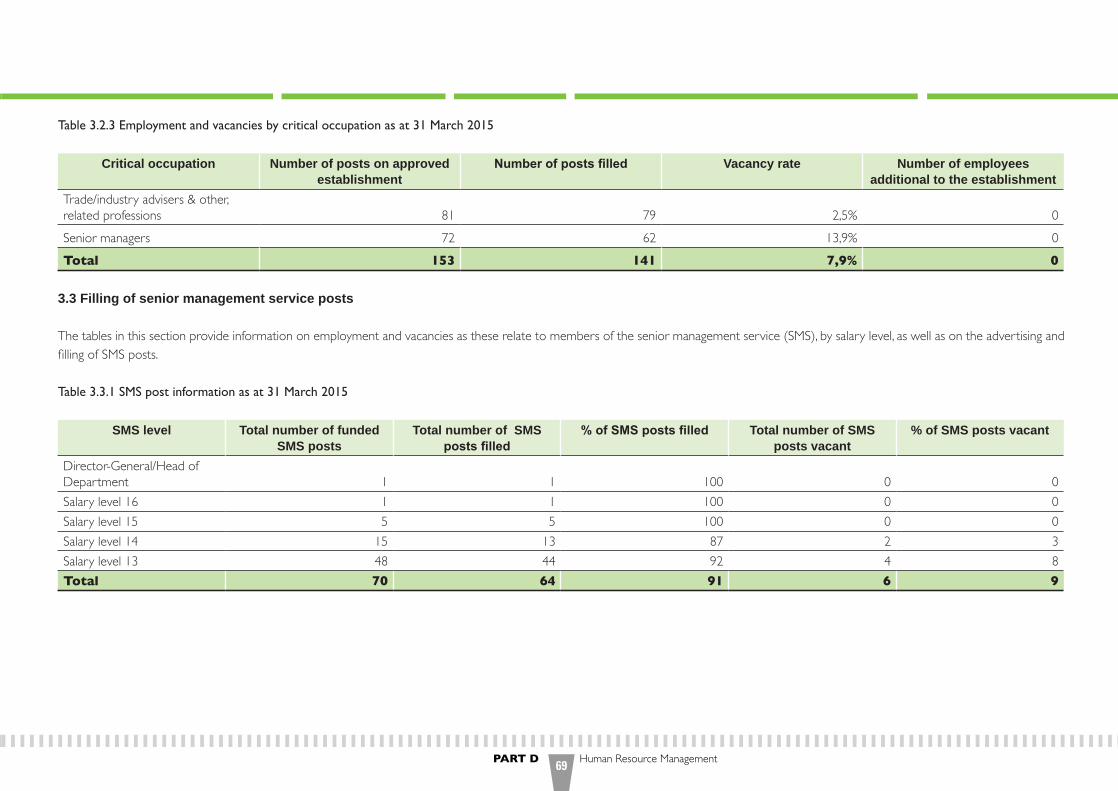
PART D Human Resource Management69
Table 3.2.3 Employment and vacancies by critical occupation as at 31 March 2015
Critical occupation Number of posts on approved establishment
Number of posts filled Vacancy rate Number of employees additional to the establishment
Trade/industry advisers & other, related professions 81 79 2,5% 0Senior managers 72 62 13,9% 0Total 153 141 7,9% 0
3.3 Filling of senior management service posts
The tables in this section provide information on employment and vacancies as these relate to members of the senior management service (SMS), by salary level, as well as on the advertising and filling of SMS posts.
Table 3.3.1 SMS post information as at 31 March 2015
SMS level Total number of funded SMS posts
Total number of SMS posts filled
% of SMS posts filled Total number of SMS posts vacant
% of SMS posts vacant
Director-General/Head of Department 1 1 100 0 0Salary level 16 1 1 100 0 0Salary level 15 5 5 100 0 0Salary level 14 15 13 87 2 3Salary level 13 48 44 92 4 8Total 70 64 91 6 9
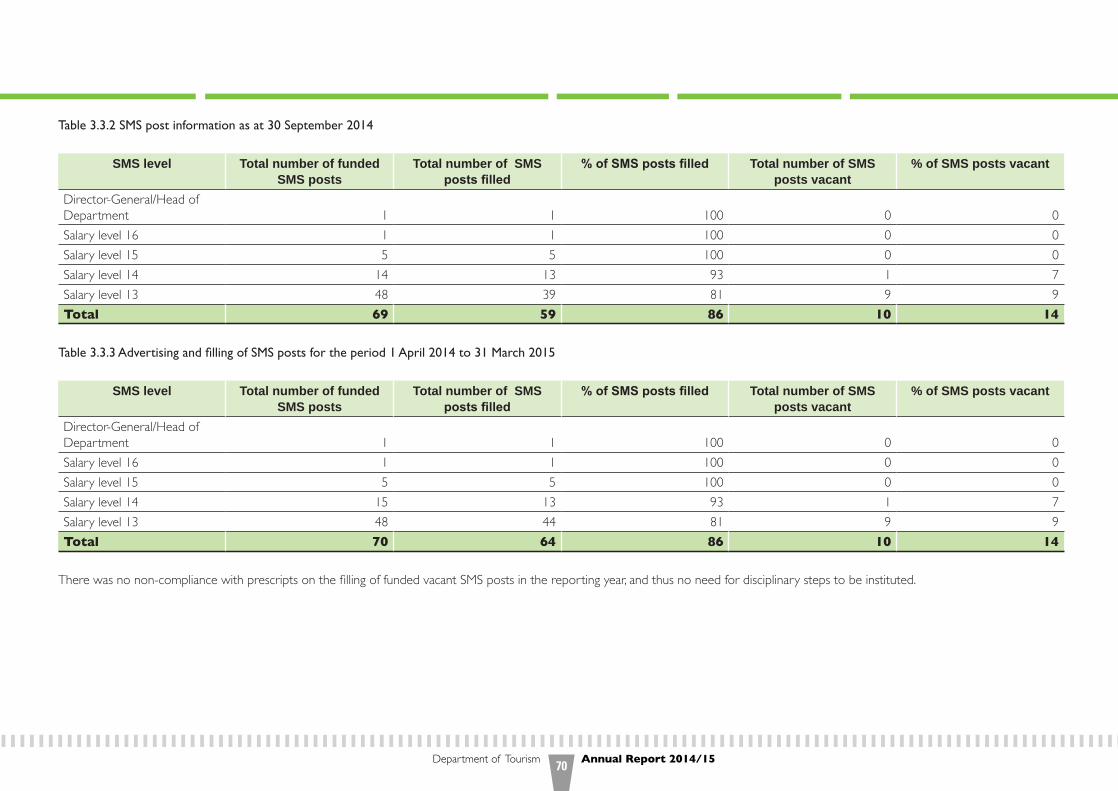
Department of Tourism Annual Report 2014/1570
Table 3.3.2 SMS post information as at 30 September 2014
SMS level Total number of funded SMS posts
Total number of SMS posts filled
% of SMS posts filled Total number of SMS posts vacant
% of SMS posts vacant
Director-General/Head of Department 1 1 100 0 0Salary level 16 1 1 100 0 0Salary level 15 5 5 100 0 0Salary level 14 14 13 93 1 7Salary level 13 48 39 81 9 9Total 69 59 86 10 14
Table 3.3.3 Advertising and filling of SMS posts for the period 1 April 2014 to 31 March 2015
SMS level Total number of funded SMS posts
Total number of SMS posts filled
% of SMS posts filled Total number of SMS posts vacant
% of SMS posts vacant
Director-General/Head of Department 1 1 100 0 0Salary level 16 1 1 100 0 0Salary level 15 5 5 100 0 0Salary level 14 15 13 93 1 7Salary level 13 48 44 81 9 9Total 70 64 86 10 14
There was no non-compliance with prescripts on the filling of funded vacant SMS posts in the reporting year, and thus no need for disciplinary steps to be instituted.

PART D Human Resource Management71
3.4 Job evaluation
Within a nationally determined framework, executing authorities may evaluate or re-evaluate any job in his or her organisation. In terms of the regulations, all vacancies on salary levels 9 and higher must be evaluated before they are filled. The following table summarises the number of jobs that were evaluated during the year under review and also provides statistics on the number of posts that were upgraded or downgraded.
Table 3.4.1 Job evaluation by salary band for the period 1 April 2014 to 31 March 2015
Salary band Number of posts Number of jobs evaluated
% of posts evaluated
Number of posts upgraded
% of upgraded posts evaluated
Number of posts downgraded
% of downgraded posts evaluated
Lower-skilled (levels 1-2) 2 0 0 0 0 0 0Contract (levels 1-2) 17 0 0 0 0 0 0Contract (levels 3-5) 3 0 0 0 0 0 0Contract (levels 6-8) 6 0 0 0 0 0 0Contract (levels 9-12) 5 0 0 0 0 0 0Contract (band A) 1 0 0 0 0 0 0Contract (band D) 2 0 0 0 0 0 0Skilled (levels 3-5) 32 2 6,3 0 0 0 0Highly skilled production (levels 6-8) 204 6 2,9 0 0 0 0Highly skilled supervision (levels 9-12) 230 9 3,9 1 11,1 0 0Senior management service band A 47 3 6,4 0 0 0 0Senior management service band B 14 0 0 0 0 0 0Senior management service band C 5 0 0 0 0 0 0Senior management service band D 2 0 0 0 0 0 0Total 570 20 3,5 1 5 0 0
NB: Two permanent posts on level 6 were downgraded to salary level 5.
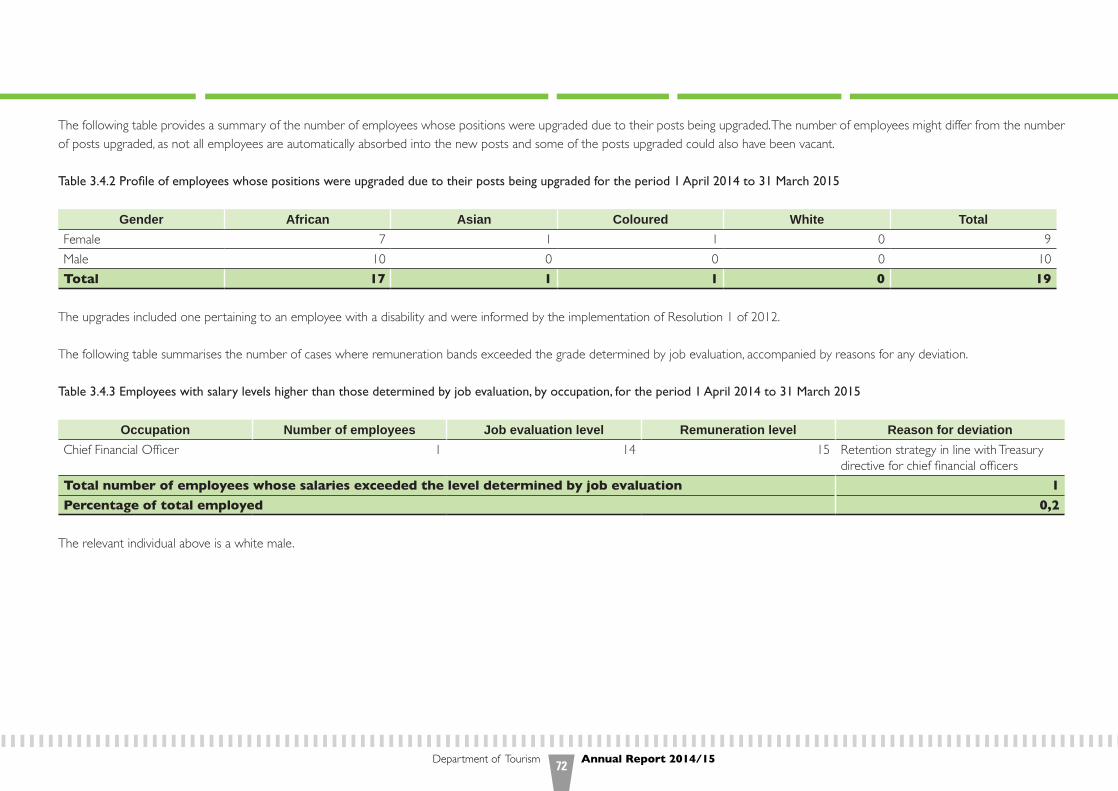
Department of Tourism Annual Report 2014/1572
The following table provides a summary of the number of employees whose positions were upgraded due to their posts being upgraded. The number of employees might differ from the number of posts upgraded, as not all employees are automatically absorbed into the new posts and some of the posts upgraded could also have been vacant.
Table 3.4.2 Profile of employees whose positions were upgraded due to their posts being upgraded for the period 1 April 2014 to 31 March 2015
Gender African Asian Coloured White TotalFemale 7 1 1 0 9Male 10 0 0 0 10Total 17 1 1 0 19
The upgrades included one pertaining to an employee with a disability and were informed by the implementation of Resolution 1 of 2012.
The following table summarises the number of cases where remuneration bands exceeded the grade determined by job evaluation, accompanied by reasons for any deviation.
Table 3.4.3 Employees with salary levels higher than those determined by job evaluation, by occupation, for the period 1 April 2014 to 31 March 2015
Occupation Number of employees Job evaluation level Remuneration level Reason for deviationChief Financial Officer 1 14 15 Retention strategy in line with Treasury
directive for chief financial officersTotal number of employees whose salaries exceeded the level determined by job evaluation 1
Percentage of total employed 0,2
The relevant individual above is a white male.
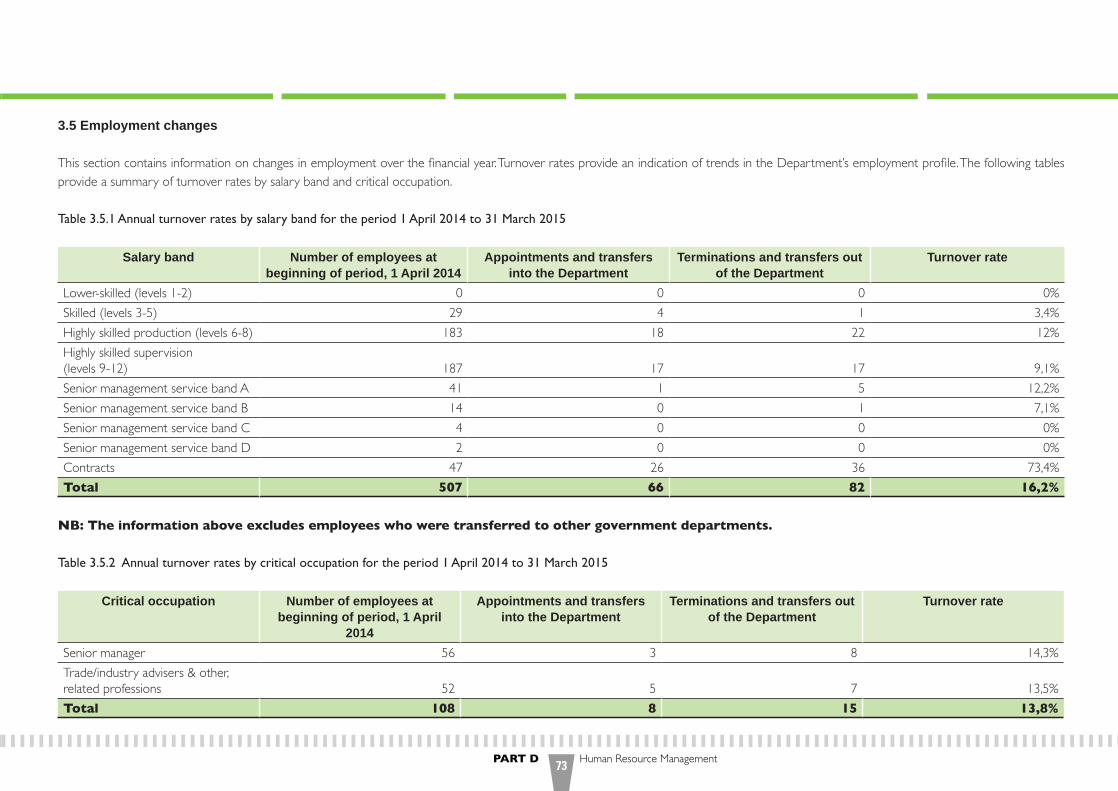
PART D Human Resource Management73
3.5 Employment changes
This section contains information on changes in employment over the financial year. Turnover rates provide an indication of trends in the Department’s employment profile. The following tables provide a summary of turnover rates by salary band and critical occupation.
Table 3.5.1 Annual turnover rates by salary band for the period 1 April 2014 to 31 March 2015
Salary band Number of employees at beginning of period, 1 April 2014
Appointments and transfers into the Department
Terminations and transfers out of the Department
Turnover rate
Lower-skilled (levels 1-2) 0 0 0 0%Skilled (levels 3-5) 29 4 1 3,4%Highly skilled production (levels 6-8) 183 18 22 12%Highly skilled supervision (levels 9-12) 187 17 17 9,1%Senior management service band A 41 1 5 12,2%Senior management service band B 14 0 1 7,1%Senior management service band C 4 0 0 0%Senior management service band D 2 0 0 0%Contracts 47 26 36 73,4%Total 507 66 82 16,2%
NB: The information above excludes employees who were transferred to other government departments.
Table 3.5.2 Annual turnover rates by critical occupation for the period 1 April 2014 to 31 March 2015
Critical occupation Number of employees at beginning of period, 1 April
2014
Appointments and transfers into the Department
Terminations and transfers out of the Department
Turnover rate
Senior manager 56 3 8 14,3%Trade/industry advisers & other, related professions 52 5 7 13,5%Total 108 8 15 13,8%
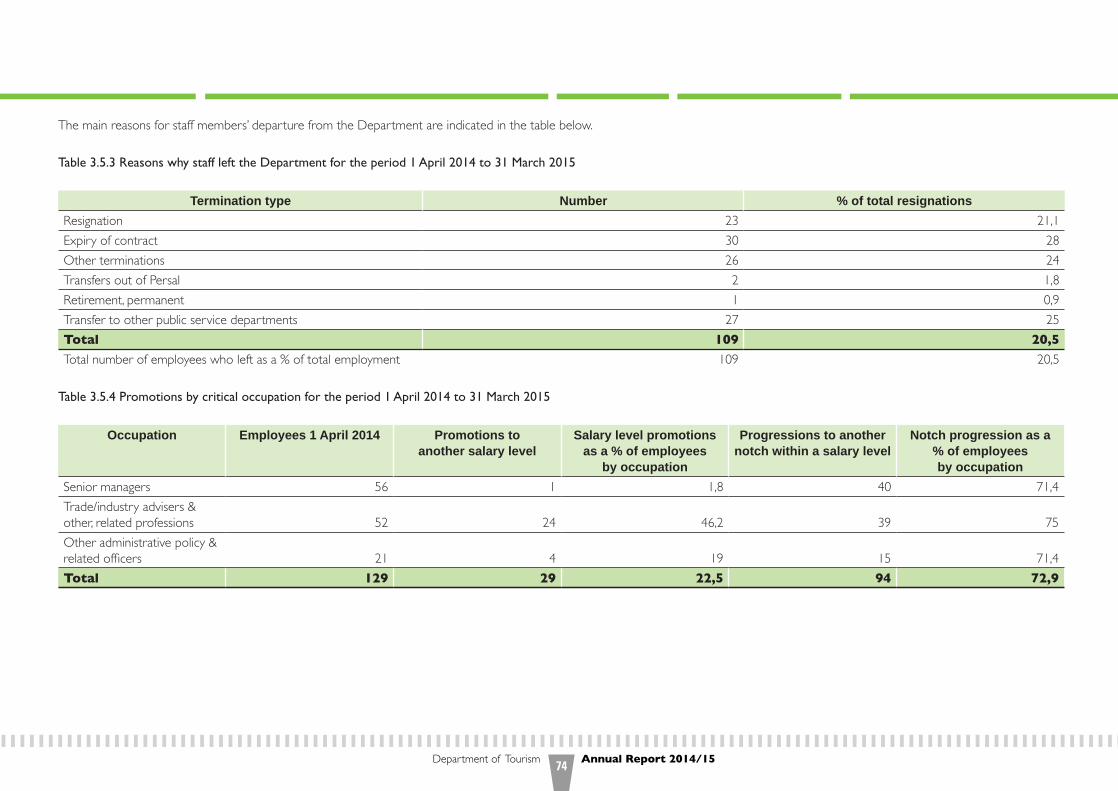
Department of Tourism Annual Report 2014/1574
The main reasons for staff members’ departure from the Department are indicated in the table below.
Table 3.5.3 Reasons why staff left the Department for the period 1 April 2014 to 31 March 2015
Termination type Number % of total resignationsResignation 23 21,1Expiry of contract 30 28Other terminations 26 24Transfers out of Persal 2 1,8Retirement, permanent 1 0,9Transfer to other public service departments 27 25Total 109 20,5
Total number of employees who left as a % of total employment 109 20,5
Table 3.5.4 Promotions by critical occupation for the period 1 April 2014 to 31 March 2015
Occupation Employees 1 April 2014 Promotions to another salary level
Salary level promotions as a % of employees
by occupation
Progressions to another notch within a salary level
Notch progression as a % of employees by occupation
Senior managers 56 1 1,8 40 71,4Trade/industry advisers & other, related professions 52 24 46,2 39 75Other administrative policy & related officers 21 4 19 15 71,4Total 129 29 22,5 94 72,9
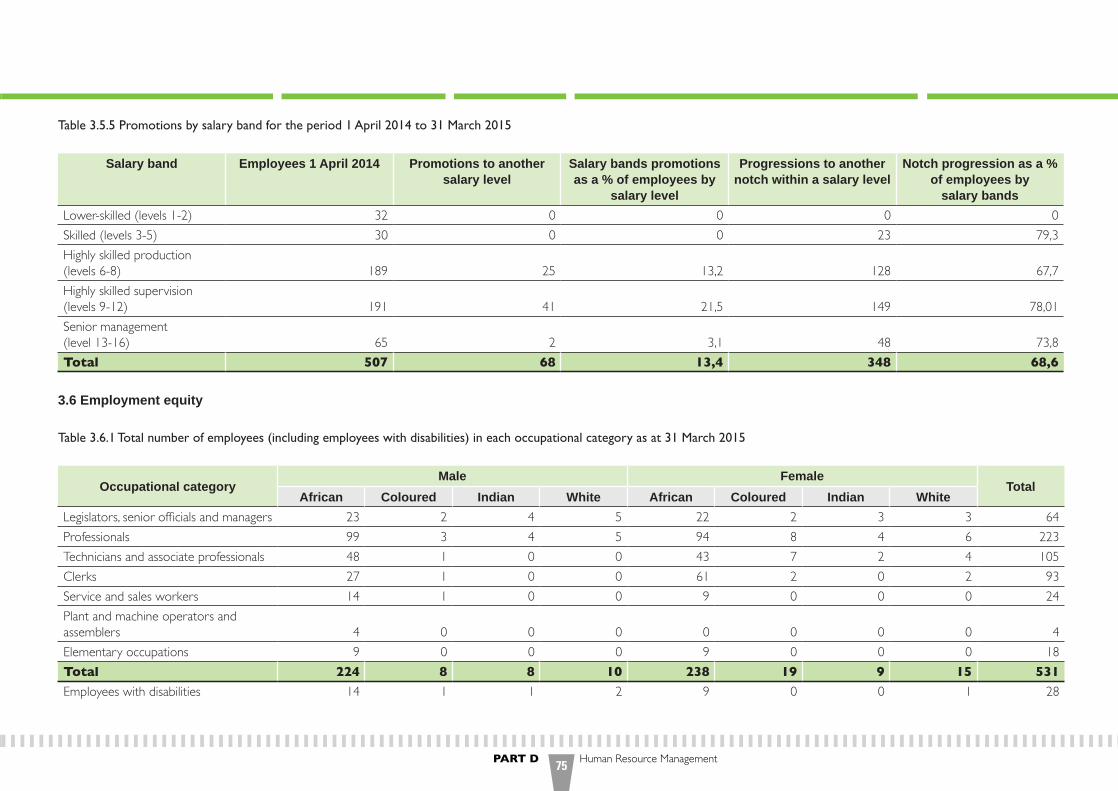
PART D Human Resource Management75
Table 3.5.5 Promotions by salary band for the period 1 April 2014 to 31 March 2015
Salary band Employees 1 April 2014 Promotions to another salary level
Salary bands promotions as a % of employees by
salary level
Progressions to another notch within a salary level
Notch progression as a % of employees by
salary bandsLower-skilled (levels 1-2) 32 0 0 0 0Skilled (levels 3-5) 30 0 0 23 79,3Highly skilled production (levels 6-8) 189 25 13,2 128 67,7Highly skilled supervision (levels 9-12) 191 41 21,5 149 78,01Senior management (level 13-16) 65 2 3,1 48 73,8Total 507 68 13,4 348 68,6
3.6 Employment equity
Table 3.6.1 Total number of employees (including employees with disabilities) in each occupational category as at 31 March 2015
Occupational categoryMale Female
TotalAfrican Coloured Indian White African Coloured Indian White
Legislators, senior officials and managers 23 2 4 5 22 2 3 3 64Professionals 99 3 4 5 94 8 4 6 223Technicians and associate professionals 48 1 0 0 43 7 2 4 105Clerks 27 1 0 0 61 2 0 2 93Service and sales workers 14 1 0 0 9 0 0 0 24Plant and machine operators and assemblers 4 0 0 0 0 0 0 0 4Elementary occupations 9 0 0 0 9 0 0 0 18Total 224 8 8 10 238 19 9 15 531
Employees with disabilities 14 1 1 2 9 0 0 1 28
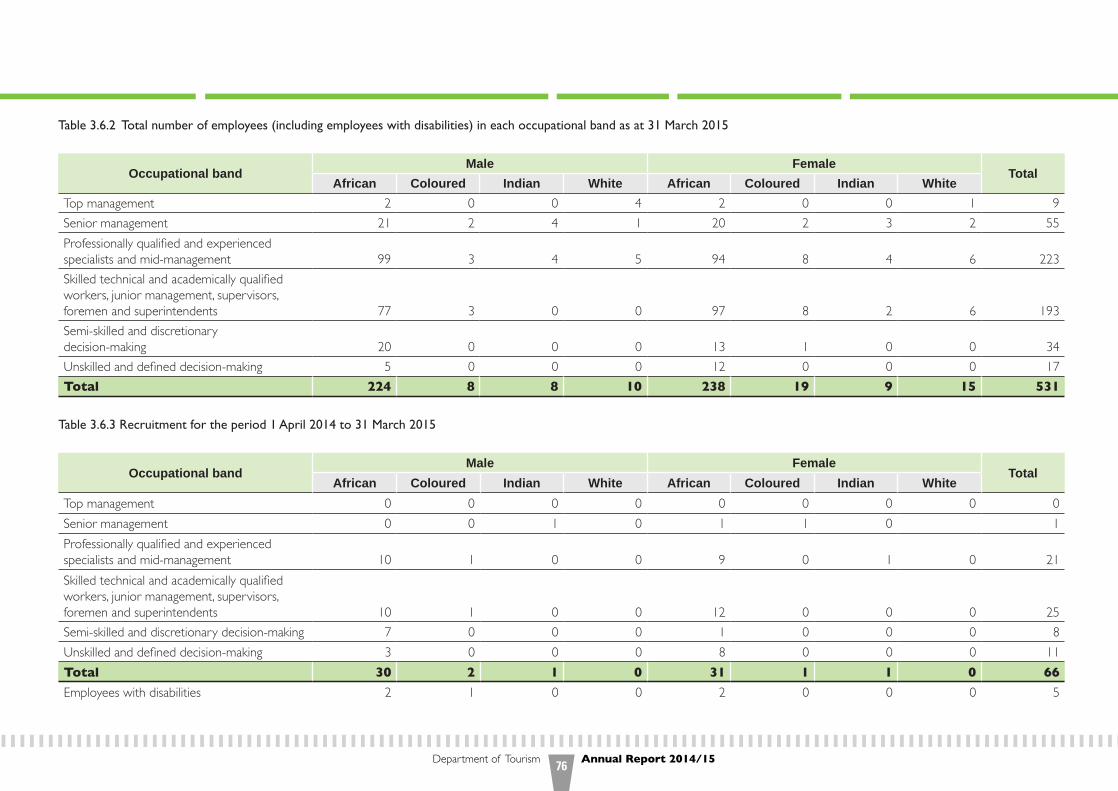
Department of Tourism Annual Report 2014/1576
Table 3.6.2 Total number of employees (including employees with disabilities) in each occupational band as at 31 March 2015
Occupational bandMale Female
TotalAfrican Coloured Indian White African Coloured Indian White
Top management 2 0 0 4 2 0 0 1 9Senior management 21 2 4 1 20 2 3 2 55Professionally qualified and experienced specialists and mid-management 99 3 4 5 94 8 4 6 223Skilled technical and academically qualified workers, junior management, supervisors, foremen and superintendents 77 3 0 0 97 8 2 6 193Semi-skilled and discretionary decision-making 20 0 0 0 13 1 0 0 34Unskilled and defined decision-making 5 0 0 0 12 0 0 0 17Total 224 8 8 10 238 19 9 15 531
Table 3.6.3 Recruitment for the period 1 April 2014 to 31 March 2015
Occupational bandMale Female
TotalAfrican Coloured Indian White African Coloured Indian White
Top management 0 0 0 0 0 0 0 0 0Senior management 0 0 1 0 1 1 0 1Professionally qualified and experienced specialists and mid-management 10 1 0 0 9 0 1 0 21Skilled technical and academically qualified workers, junior management, supervisors, foremen and superintendents 10 1 0 0 12 0 0 0 25Semi-skilled and discretionary decision-making 7 0 0 0 1 0 0 0 8Unskilled and defined decision-making 3 0 0 0 8 0 0 0 11Total 30 2 1 0 31 1 1 0 66
Employees with disabilities 2 1 0 0 2 0 0 0 5
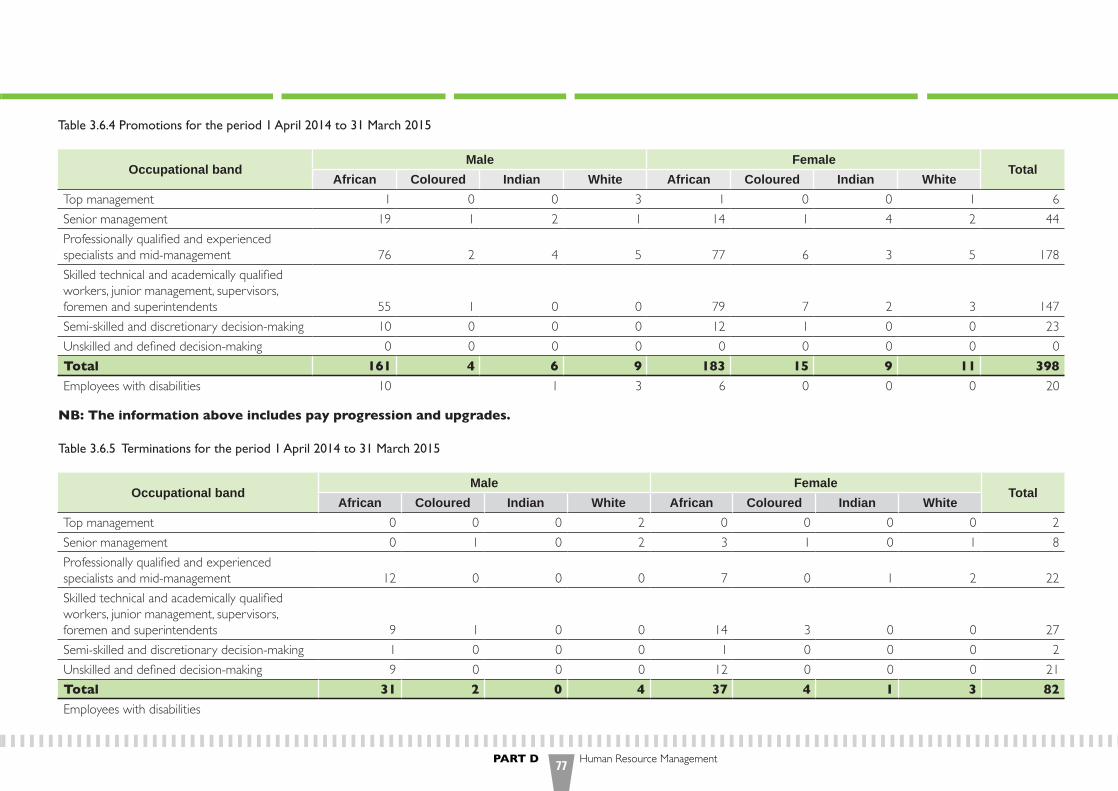
PART D Human Resource Management77
Table 3.6.4 Promotions for the period 1 April 2014 to 31 March 2015
Occupational bandMale Female
TotalAfrican Coloured Indian White African Coloured Indian White
Top management 1 0 0 3 1 0 0 1 6Senior management 19 1 2 1 14 1 4 2 44Professionally qualified and experienced specialists and mid-management 76 2 4 5 77 6 3 5 178Skilled technical and academically qualified workers, junior management, supervisors, foremen and superintendents 55 1 0 0 79 7 2 3 147Semi-skilled and discretionary decision-making 10 0 0 0 12 1 0 0 23Unskilled and defined decision-making 0 0 0 0 0 0 0 0 0Total 161 4 6 9 183 15 9 11 398
Employees with disabilities 10 1 3 6 0 0 0 20
NB: The information above includes pay progression and upgrades.
Table 3.6.5 Terminations for the period 1 April 2014 to 31 March 2015
Occupational bandMale Female
TotalAfrican Coloured Indian White African Coloured Indian White
Top management 0 0 0 2 0 0 0 0 2Senior management 0 1 0 2 3 1 0 1 8Professionally qualified and experienced specialists and mid-management 12 0 0 0 7 0 1 2 22Skilled technical and academically qualified workers, junior management, supervisors, foremen and superintendents 9 1 0 0 14 3 0 0 27Semi-skilled and discretionary decision-making 1 0 0 0 1 0 0 0 2Unskilled and defined decision-making 9 0 0 0 12 0 0 0 21Total 31 2 0 4 37 4 1 3 82
Employees with disabilities

Department of Tourism Annual Report 2014/1578
Table 3.6.6 Disciplinary action for the period 1 April 2014 to 31 March 2015
Disciplinary action Male Female
Total African Coloured Indian White African Coloured Indian White
Correctional counselling 0 0 0 0 1 0 0 0 1 Final written warning 1 0 0 0 0 0 0 0 1Suspended without pay 1 0 1 0 0 1 0 0 3Case withdrawn 0 0 0 0 1 0 0 0 1Total 2 0 1 0 2 1 0 0 6
Table 3.6.7 Skills development for the period 1 April 2014 to 31 March 2015
Occupational categoryMale Female
TotalAfrican Coloured Indian White African Coloured Indian White
Legislators, senior officials and managers 61 1 1 0 61 1 1 1 127Professionals 66 0 2 0 60 1 0 1 130Technicians and associate professionals 28 1 0 1 43 4 0 2 79Clerks 64 1 0 0 48 2 1 1 117Service and sales workers 0 0 0 0 0 0 0 0 0Skilled agriculture and fishery workers 0 0 0 0 0 0 0 0 0Craft and related trades workers 0 0 0 0 0 0 0 0 0Plant and machine operators and assemblers 0 0 0 0 0 0 0 0 0Elementary occupations 5 0 0 0 5 0 0 0 10Non-permanent employees 6 0 0 0 16 0 0 0 22Total 230 3 3 1 233 8 2 5 485
Employees with disabilities 8 0 0 0 1 0 0 1 10
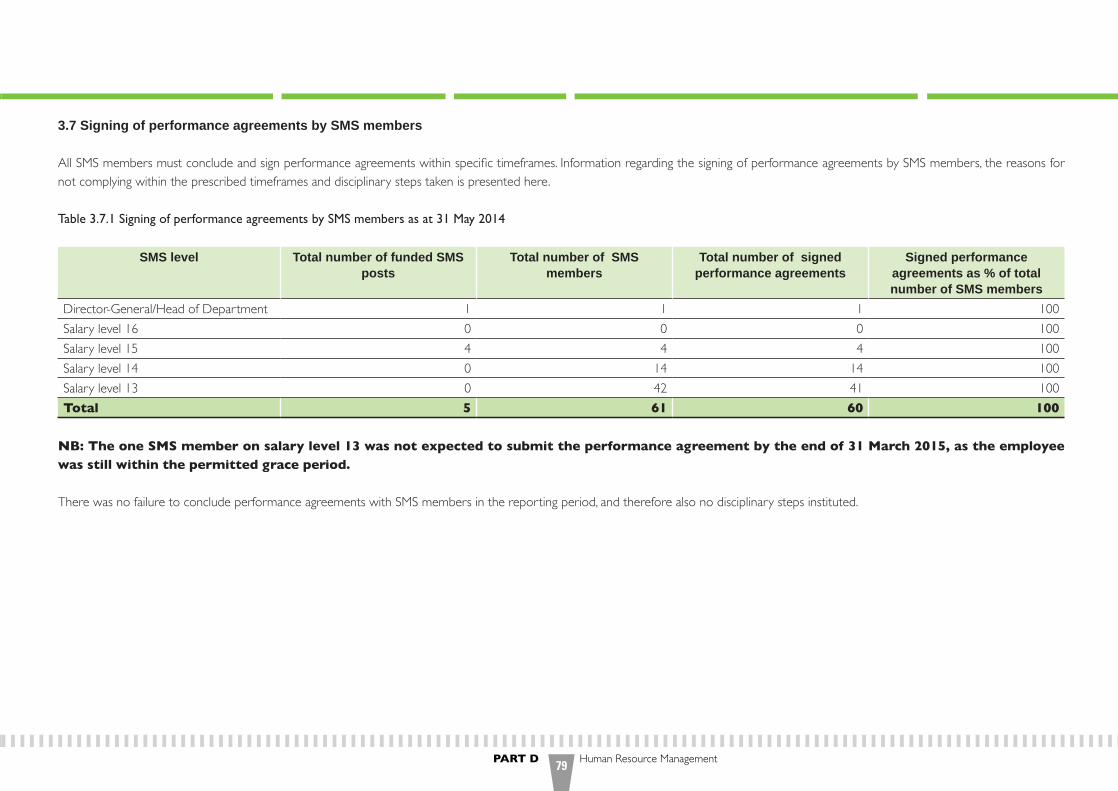
PART D Human Resource Management79
3.7 Signing of performance agreements by SMS members
All SMS members must conclude and sign performance agreements within specific timeframes. Information regarding the signing of performance agreements by SMS members, the reasons for not complying within the prescribed timeframes and disciplinary steps taken is presented here.
Table 3.7.1 Signing of performance agreements by SMS members as at 31 May 2014
SMS level Total number of funded SMS posts
Total number of SMS members
Total number of signed performance agreements
Signed performance agreements as % of total number of SMS members
Director-General/Head of Department 1 1 1 100Salary level 16 0 0 0 100Salary level 15 4 4 4 100Salary level 14 0 14 14 100Salary level 13 0 42 41 100Total 5 61 60 100
NB: The one SMS member on salary level 13 was not expected to submit the performance agreement by the end of 31 March 2015, as the employee was still within the permitted grace period.
There was no failure to conclude performance agreements with SMS members in the reporting period, and therefore also no disciplinary steps instituted.
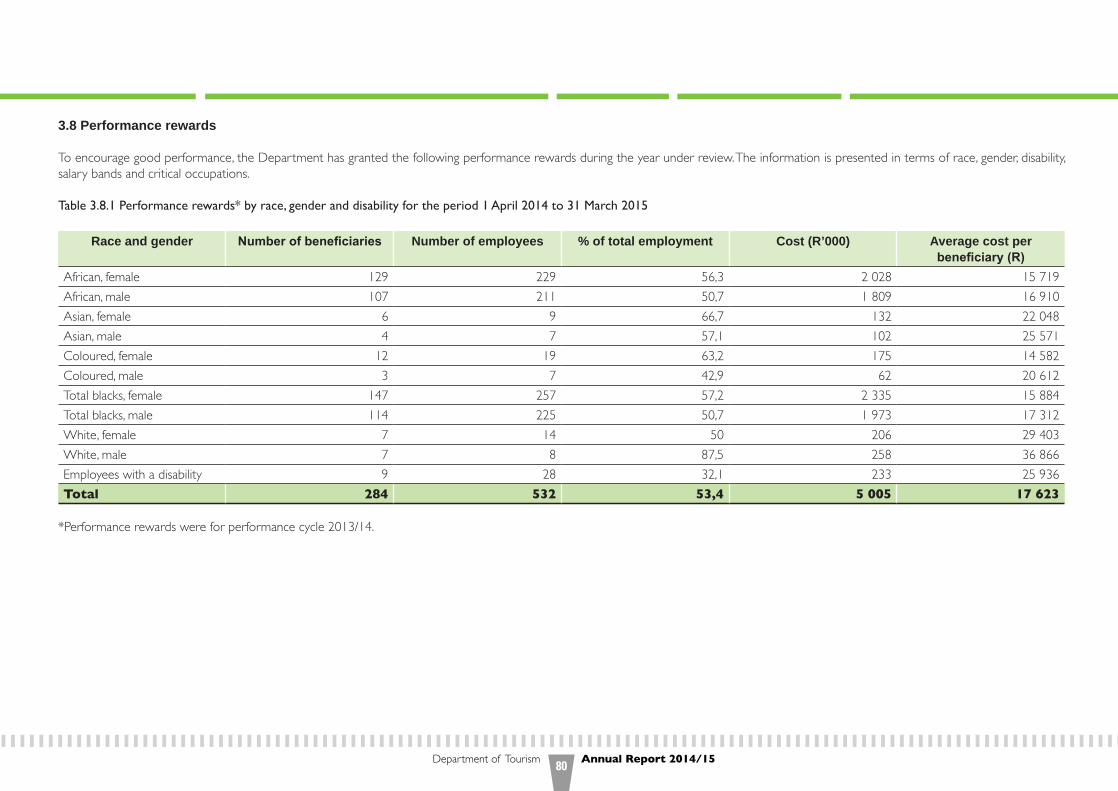
Department of Tourism Annual Report 2014/1580
3.8 Performance rewards
To encourage good performance, the Department has granted the following performance rewards during the year under review. The information is presented in terms of race, gender, disability, salary bands and critical occupations.
Table 3.8.1 Performance rewards* by race, gender and disability for the period 1 April 2014 to 31 March 2015
Race and gender Number of beneficiaries Number of employees % of total employment
Cost (R’000) Average cost per beneficiary (R)
African, female 129 229 56,3 2 028 15 719African, male 107 211 50,7 1 809 16 910Asian, female 6 9 66,7 132 22 048Asian, male 4 7 57,1 102 25 571Coloured, female 12 19 63,2 175 14 582Coloured, male 3 7 42,9 62 20 612Total blacks, female 147 257 57,2 2 335 15 884Total blacks, male 114 225 50,7 1 973 17 312White, female 7 14 50 206 29 403White, male 7 8 87,5 258 36 866Employees with a disability 9 28 32,1 233 25 936Total 284 532 53,4 5 005 17 623
*Performance rewards were for performance cycle 2013/14.

PART D Human Resource Management81
Table 3.8.2 Performance rewards* by salary band for personnel below SMS level for the period 1 April 2014 to 31 March 2015
Salary band Number of beneficiaries Number of employees % of total employees within salary band
Cost (R’000) Average cost per beneficiary (R)
Skilled (levels 3-5) 19 31 61,3 96 5 053Highly skilled production (levels 6-8) 99 188 52,7 882 8 909Highly skilled supervision (levels 9-12) 130 218 59,6 2 417 18 592Contract (levels 1-2) 0 17 0 0 0Contract (levels 3-5) 0 3 0 0 0Contract (levels 6-8) 0 6 0 0 0Contract (levels 9-12) 3 5 60 41 13 667Total 251 468 53,6 3 436 13 689
*Performance rewards were for performance cycle 2013/14.
Table 3.8.3 Performance rewards by critical occupation for the period 1 April 2014 to 31 March 2015
Critical occupations Number of beneficiaries
Total employment Percentage of total employment
Cost (R’000) Average cost per beneficiary (R)
Financial and related professionals 3 5 60 61 20 333Human resources & organisational development & related professions 14 19 73,7 253 18 071Senior managers 29 54 53,7 1 388 47 862Total 46 78 58,9 1 702 37 000

Department of Tourism Annual Report 2014/1582
Table 3.8.4 Performance-related rewards* (cash bonus) by salary band for SMS members for the period 1 April 2014 to 31 March 2015
Salary band Number of beneficiaries
Number of employees
% of total within the salary band
Cost (R’000) Average cost per beneficiary (R)
Total cost as % of total personnel
expenditure
Personnel cost SMS (R)
Band A 22 44 50 890 40 455 2,4 37 019Band B 7 13 53,8 356 50 857 2,5 14 211Band C 4 5 80 324 81 000 4,9 6 557Band D 0 2 0 0 0 0 0Total 33 64 51,6 1 570 47 576 2,7 57 787
*Performance rewards were for performance cycle 2013/14.
NB: The information above includes 12 employees (six females and six males) who transferred to the Department, while it excludes the 16 employees assessed in, though transferred out of the Department.
3.9 Foreign workers
The Department had no foreign nationals in its employ in the period under review.
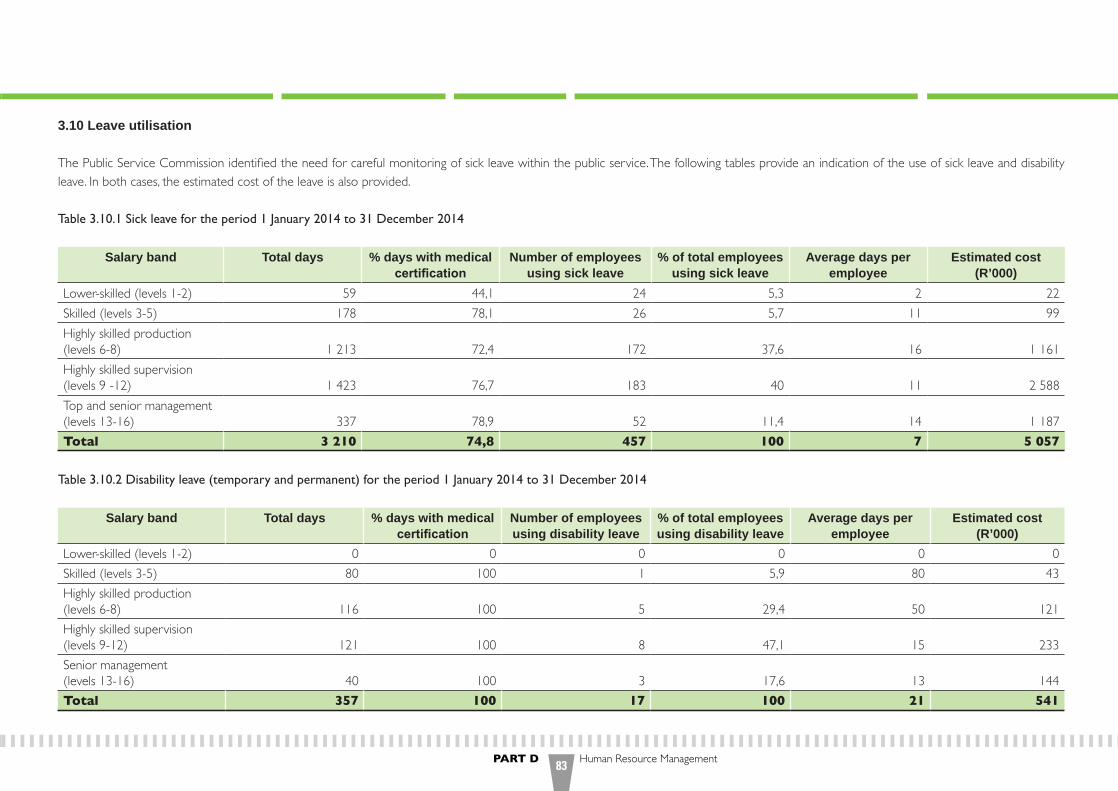
PART D Human Resource Management83
3.10 Leave utilisation
The Public Service Commission identified the need for careful monitoring of sick leave within the public service. The following tables provide an indication of the use of sick leave and disability leave. In both cases, the estimated cost of the leave is also provided.
Table 3.10.1 Sick leave for the period 1 January 2014 to 31 December 2014
Salary band Total days % days with medical certification
Number of employees using sick leave
% of total employees using sick leave
Average days per employee
Estimated cost (R’000)
Lower-skilled (levels 1-2) 59 44,1 24 5,3 2 22Skilled (levels 3-5) 178 78,1 26 5,7 11 99Highly skilled production (levels 6-8) 1 213 72,4 172 37,6 16 1 161Highly skilled supervision (levels 9 -12) 1 423 76,7 183 40 11 2 588Top and senior management (levels 13-16) 337 78,9 52 11,4 14 1 187Total 3 210 74,8 457 100 7 5 057
Table 3.10.2 Disability leave (temporary and permanent) for the period 1 January 2014 to 31 December 2014
Salary band Total days % days with medical certification
Number of employees using disability leave
% of total employees using disability leave
Average days per employee
Estimated cost (R’000)
Lower-skilled (levels 1-2) 0 0 0 0 0 0Skilled (levels 3-5) 80 100 1 5,9 80 43Highly skilled production (levels 6-8) 116 100 5 29,4 50 121Highly skilled supervision (levels 9-12) 121 100 8 47,1 15 233Senior management (levels 13-16) 40 100 3 17,6 13 144Total 357 100 17 100 21 541
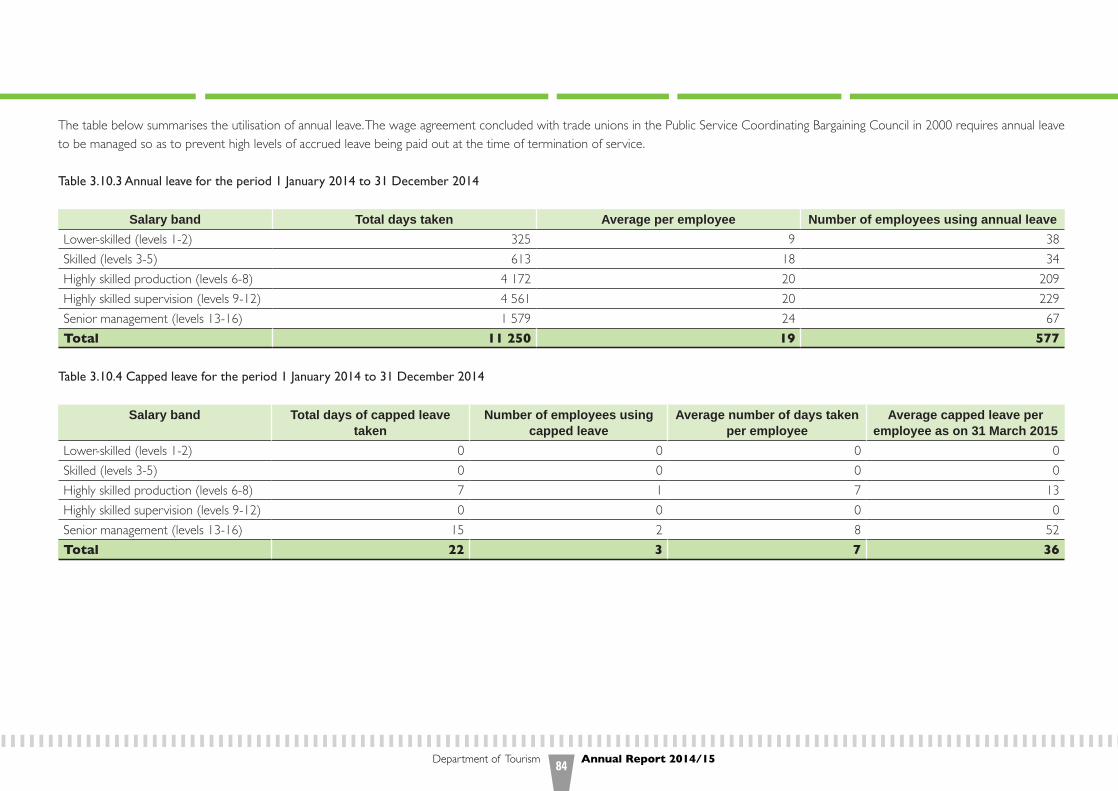
Department of Tourism Annual Report 2014/1584
The table below summarises the utilisation of annual leave. The wage agreement concluded with trade unions in the Public Service Coordinating Bargaining Council in 2000 requires annual leave to be managed so as to prevent high levels of accrued leave being paid out at the time of termination of service.
Table 3.10.3 Annual leave for the period 1 January 2014 to 31 December 2014
Salary band Total days taken Average per employee Number of employees using annual leaveLower-skilled (levels 1-2) 325 9 38Skilled (levels 3-5) 613 18 34Highly skilled production (levels 6-8) 4 172 20 209Highly skilled supervision (levels 9-12) 4 561 20 229Senior management (levels 13-16) 1 579 24 67Total 11 250 19 577
Table 3.10.4 Capped leave for the period 1 January 2014 to 31 December 2014
Salary band Total days of capped leave taken
Number of employees using capped leave
Average number of days taken per employee
Average capped leave per employee as on 31 March 2015
Lower-skilled (levels 1-2) 0 0 0 0Skilled (levels 3-5) 0 0 0 0Highly skilled production (levels 6-8) 7 1 7 13Highly skilled supervision (levels 9-12) 0 0 0 0Senior management (levels 13-16) 15 2 8 52Total 22 3 7 36

PART D Human Resource Management85
The following table summarises payments made to employees as a result of leave not taken.
Table 3.10.5 Leave payouts for the period 1 April 2014 to 31 March 2015
Reason Total amount (R’000) Number of employees Average per employee (R)Leave payouts for 2014/2015 due to non-utilisation of leave for the previous cycle 181 11 16 455Capped leave payouts upon termination of service for 2014/15 513 47 10 915Current leave payout upon termination of service for 2014/15 327 44 7 432Total 1 021 102 10 010
3.11 HIV/Aids & health promotion programmes
In the year under review, no units/categories of employees were identified to be at a high risk of contracting HIV and related diseases, and therefore no steps were required to reduce the risk of occupational exposure.
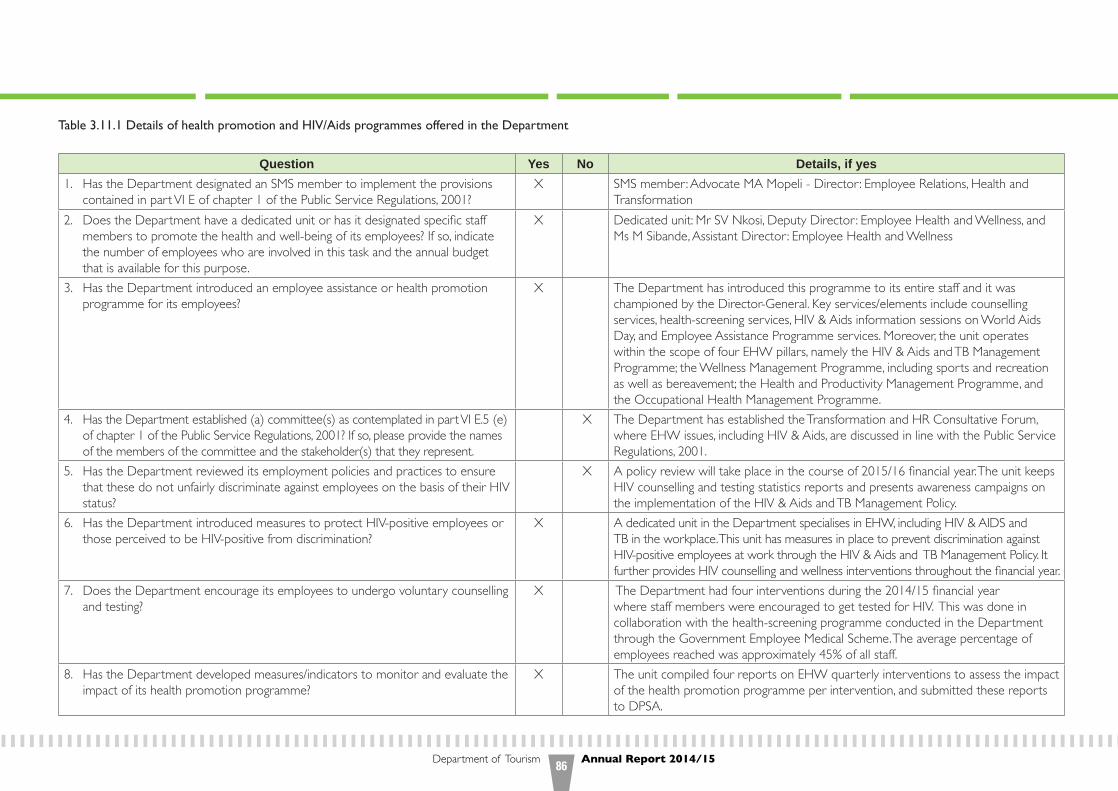
Department of Tourism Annual Report 2014/1586
Table 3.11.1 Details of health promotion and HIV/Aids programmes offered in the Department
Question Yes No Details, if yes 1. Has the Department designated an SMS member to implement the provisions
contained in part VI E of chapter 1 of the Public Service Regulations, 2001? X SMS member: Advocate MA Mopeli - Director: Employee Relations, Health and
Transformation2. Does the Department have a dedicated unit or has it designated specific staff
members to promote the health and well-being of its employees? If so, indicate the number of employees who are involved in this task and the annual budget that is available for this purpose.
X Dedicated unit: Mr SV Nkosi, Deputy Director: Employee Health and Wellness, and Ms M Sibande, Assistant Director: Employee Health and Wellness
3. Has the Department introduced an employee assistance or health promotion programme for its employees?
X The Department has introduced this programme to its entire staff and it was championed by the Director-General. Key services/elements include counselling services, health-screening services, HIV & Aids information sessions on World Aids Day, and Employee Assistance Programme services. Moreover, the unit operates within the scope of four EHW pillars, namely the HIV & Aids and TB Management Programme; the Wellness Management Programme, including sports and recreation as well as bereavement; the Health and Productivity Management Programme, and the Occupational Health Management Programme.
4. Has the Department established (a) committee(s) as contemplated in part VI E.5 (e) of chapter 1 of the Public Service Regulations, 2001? If so, please provide the names of the members of the committee and the stakeholder(s) that they represent.
X The Department has established the Transformation and HR Consultative Forum, where EHW issues, including HIV & Aids, are discussed in line with the Public Service Regulations, 2001.
5. Has the Department reviewed its employment policies and practices to ensure that these do not unfairly discriminate against employees on the basis of their HIV status?
X A policy review will take place in the course of 2015/16 financial year. The unit keeps HIV counselling and testing statistics reports and presents awareness campaigns on the implementation of the HIV & Aids and TB Management Policy.
6. Has the Department introduced measures to protect HIV-positive employees or those perceived to be HIV-positive from discrimination?
X A dedicated unit in the Department specialises in EHW, including HIV & AIDS and TB in the workplace. This unit has measures in place to prevent discrimination against HIV-positive employees at work through the HIV & Aids and TB Management Policy. It further provides HIV counselling and wellness interventions throughout the financial year.
7. Does the Department encourage its employees to undergo voluntary counselling and testing?
X The Department had four interventions during the 2014/15 financial year where staff members were encouraged to get tested for HIV. This was done in collaboration with the health-screening programme conducted in the Department through the Government Employee Medical Scheme. The average percentage of employees reached was approximately 45% of all staff.
8. Has the Department developed measures/indicators to monitor and evaluate the impact of its health promotion programme?
X The unit compiled four reports on EHW quarterly interventions to assess the impact of the health promotion programme per intervention, and submitted these reports to DPSA.
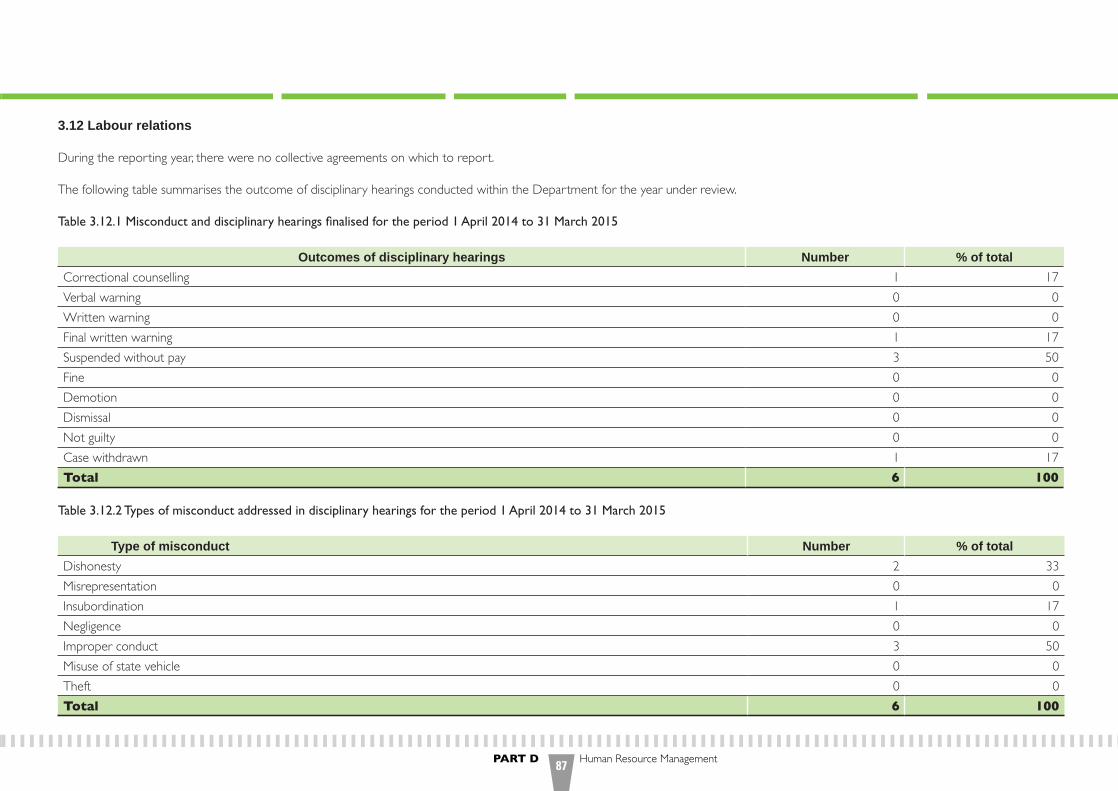
PART D Human Resource Management87
3.12 Labour relations During the reporting year, there were no collective agreements on which to report.
The following table summarises the outcome of disciplinary hearings conducted within the Department for the year under review.
Table 3.12.1 Misconduct and disciplinary hearings finalised for the period 1 April 2014 to 31 March 2015
Outcomes of disciplinary hearings Number % of total Correctional counselling 1 17Verbal warning 0 0Written warning 0 0Final written warning 1 17Suspended without pay 3 50Fine 0 0Demotion 0 0Dismissal 0 0Not guilty 0 0Case withdrawn 1 17Total 6 100
Table 3.12.2 Types of misconduct addressed in disciplinary hearings for the period 1 April 2014 to 31 March 2015
Type of misconduct Number % of total Dishonesty 2 33Misrepresentation 0 0Insubordination 1 17Negligence 0 0Improper conduct 3 50Misuse of state vehicle 0 0Theft 0 0Total 6 100
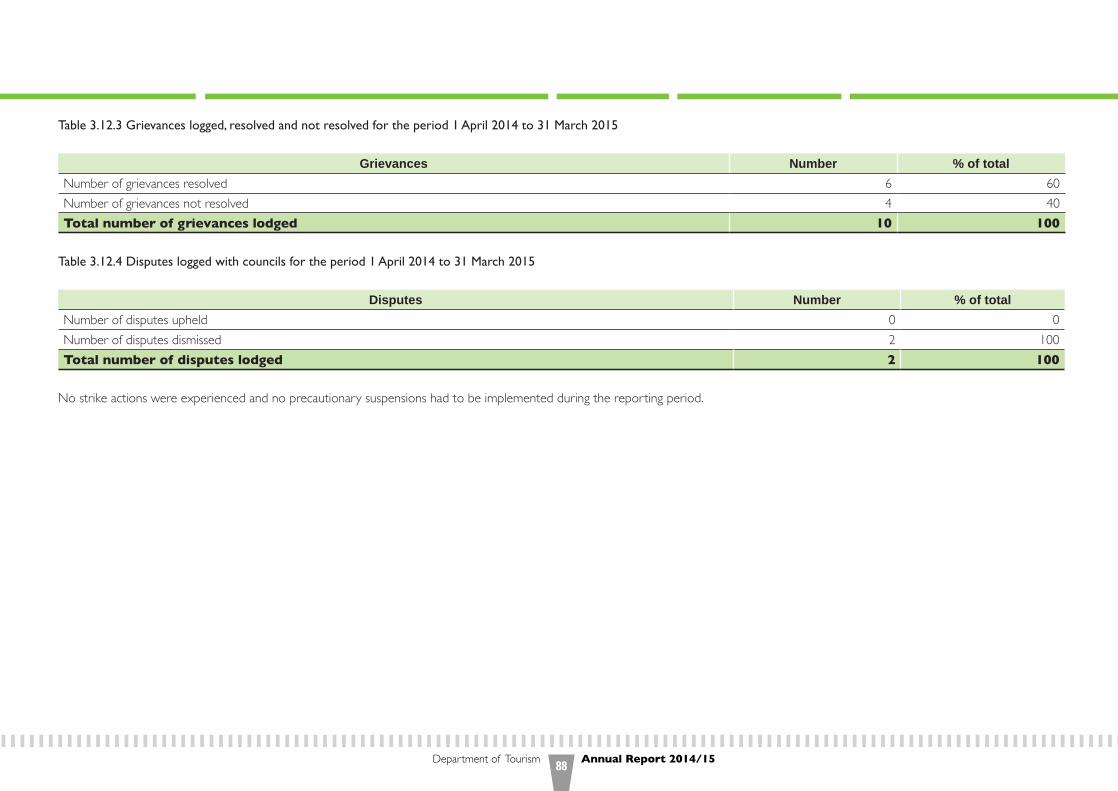
Department of Tourism Annual Report 2014/1588
Table 3.12.3 Grievances logged, resolved and not resolved for the period 1 April 2014 to 31 March 2015
Grievances Number % of total Number of grievances resolved 6 60 Number of grievances not resolved 4 40 Total number of grievances lodged 10 100
Table 3.12.4 Disputes logged with councils for the period 1 April 2014 to 31 March 2015
Disputes Number % of total Number of disputes upheld 0 0Number of disputes dismissed 2 100 Total number of disputes lodged 2 100
No strike actions were experienced and no precautionary suspensions had to be implemented during the reporting period.

PART D Human Resource Management89
3.13 Skills development
This section highlights the Department’s efforts with regard to skills development.
Table 3.13.1 Training needs identified for the period 1 April 2014 to 31 March 2015
Occupational categories Gender Number of employees as at 1
April 2014
Training needs identified at start of the reporting periodLearnerships Skills programmes
& other short courses
Other forms of training
Total
Legislators, senior officials and managers
Female 30 0 16 0 16Male 34 0 17 0 17
Professionals
Female 112 0 48 0 48Male 111 0 43 0 43
Technicians and associate professionals
Female 56 0 1 0 1Male 49 0 3 0 3
Clerks
Female 65 0 70 0 70Male 28 0 39 0 39
Service and sales workers
Female 9 0 0 0 0Male 15 0 0 0 0
Skilled agriculture and fishery workers
Female 0 0 0 0 0Male 0 0 0 0 0
Craft and related trades workers
Female 0 0 0 0 0Male 0 0 0 0 0
Plant and machine operators and assemblers Female 0 0 0 0 0Male 4 0 0 0 0
Elementary occupations
Female 9 0 6 0 6Male 9 0 4 0 4
Gender sub-totals
Female 281 0 141 0 141Male 250 0 106 0 106
Total 531 0 247 0 247
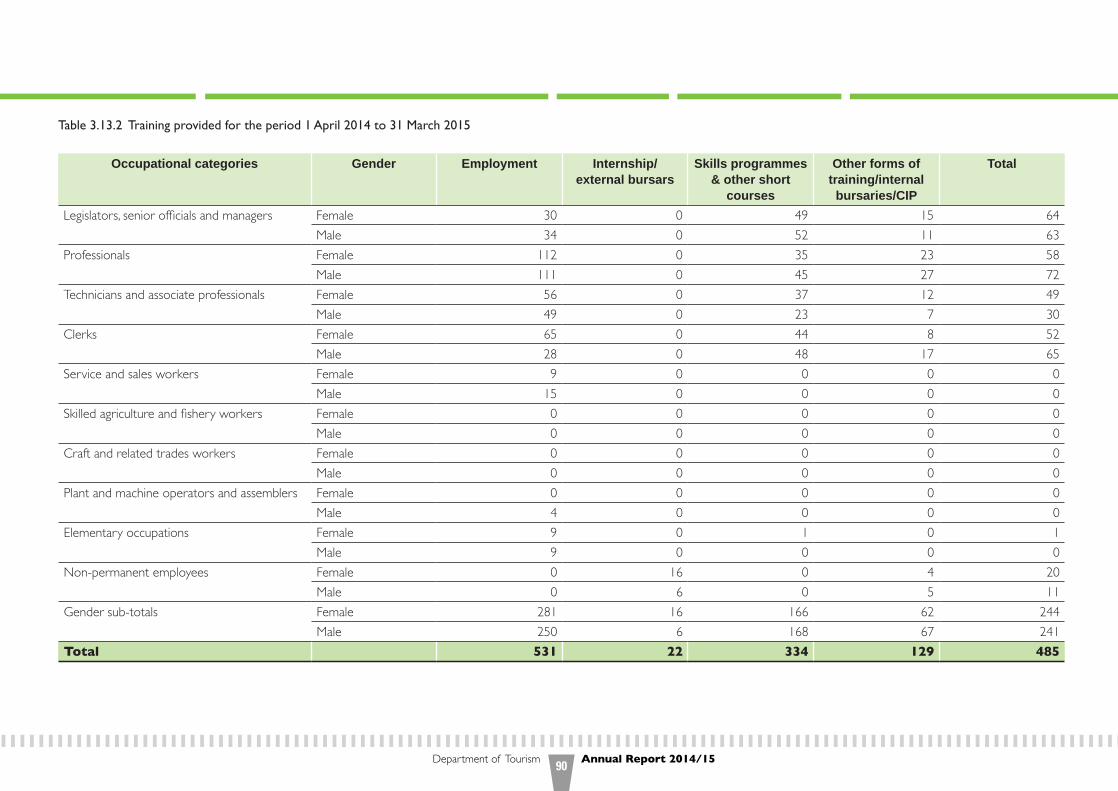
Department of Tourism Annual Report 2014/1590
Table 3.13.2 Training provided for the period 1 April 2014 to 31 March 2015
Occupational categories Gender Employment Internship/ external bursars
Skills programmes & other short
courses
Other forms of training/internal
bursaries/CIP
Total
Legislators, senior officials and managers
Female 30 0 49 15 64Male 34 0 52 11 63
Professionals
Female 112 0 35 23 58Male 111 0 45 27 72
Technicians and associate professionals
Female 56 0 37 12 49Male 49 0 23 7 30
Clerks
Female 65 0 44 8 52Male 28 0 48 17 65
Service and sales workers
Female 9 0 0 0 0Male 15 0 0 0 0
Skilled agriculture and fishery workers
Female 0 0 0 0 0Male 0 0 0 0 0
Craft and related trades workers
Female 0 0 0 0 0Male 0 0 0 0 0
Plant and machine operators and assemblers
Female 0 0 0 0 0Male 4 0 0 0 0
Elementary occupations
Female 9 0 1 0 1Male 9 0 0 0 0
Non-permanent employees
Female 0 16 0 4 20Male 0 6 0 5 11
Gender sub-totals
Female 281 16 166 62 244Male 250 6 168 67 241
Total 531 22 334 129 485
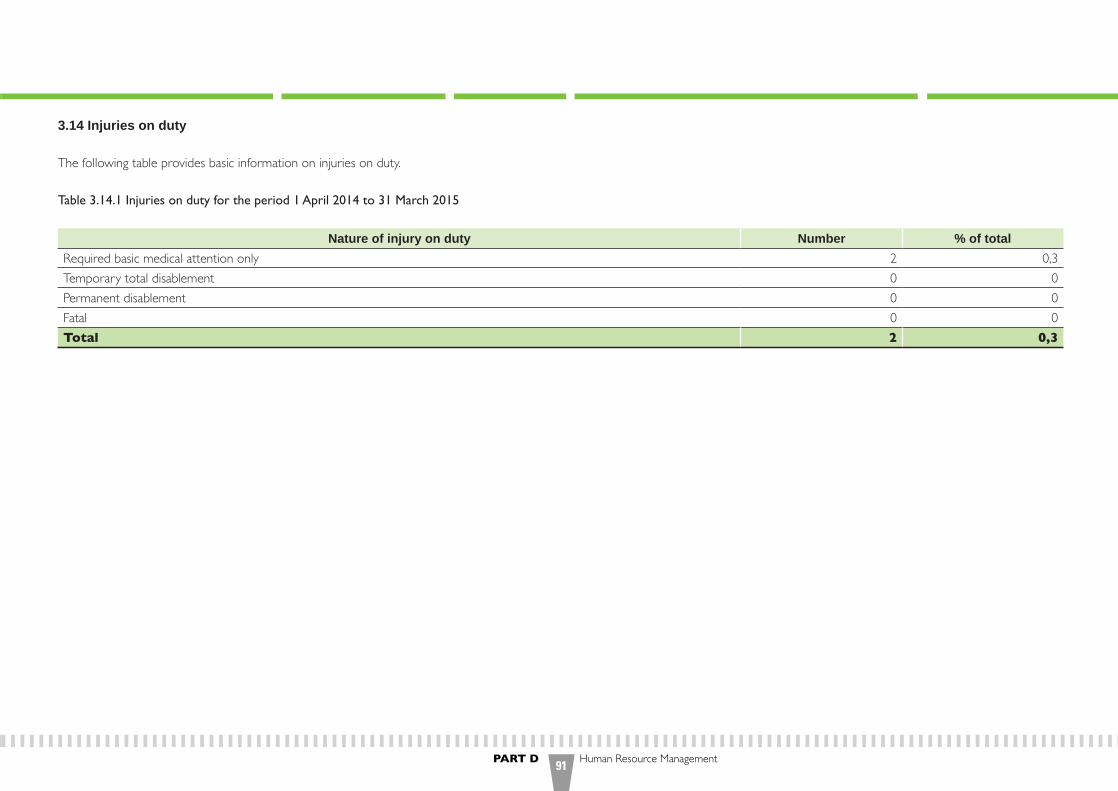
PART D Human Resource Management91
3.14 Injuries on duty
The following table provides basic information on injuries on duty.
Table 3.14.1 Injuries on duty for the period 1 April 2014 to 31 March 2015
Nature of injury on duty Number % of totalRequired basic medical attention only 2 0,3Temporary total disablement 0 0Permanent disablement 0 0Fatal 0 0Total 2 0,3

Department of Tourism Annual Report 2014/1592
3.15 Utilisation of consultants
The following tables relate to information on the utilisation of consultants in the Department. In terms of the Public Service Regulations, ‘consultant’ means a natural or juristic person or a partnership who or which provides, in terms of a specific contract on an ad hoc basis, any of the following professional services to a department against remuneration received from any source:
• The rendering of expert advice;• The drafting of proposals for the execution of specific tasks; and• The execution of a specific task that is of a technical or intellectual nature, but excludes an employee of a department.
Table 3.15.1 Report on consultant appointments using appropriated funds for the period 1 April 2014 to 31 March 2015
Project title Total number of consultants who worked
on project
Duration(work days)
Contract value inrand
% ownership by historically disadvantaged individuals/groups
Document configuration and Live Link 3 13 140 8 390 671,40 32,48Sharepoint software support and maintenance services 7 13 140 9 713 894,40 25Validation of the amended tourism B-BBEE codes 4 Once-off 450 200,00 51Development of universal accessibility assessment tool 4 Once-off 293 094,00 86,63
Total number of projects Total individual consultants Total duration (work days) Total contract value in rand4 18 26 280 18 847 859,80
There were no consultant appointments using donor funds during the reporting year.
3.16 Severance packages
No employee-initiated severance packages were negotiated or granted during the period under review.
PART Efinancial information
Financial and Supply Chain Management Delegations and other important kits for the Department of Tourism.
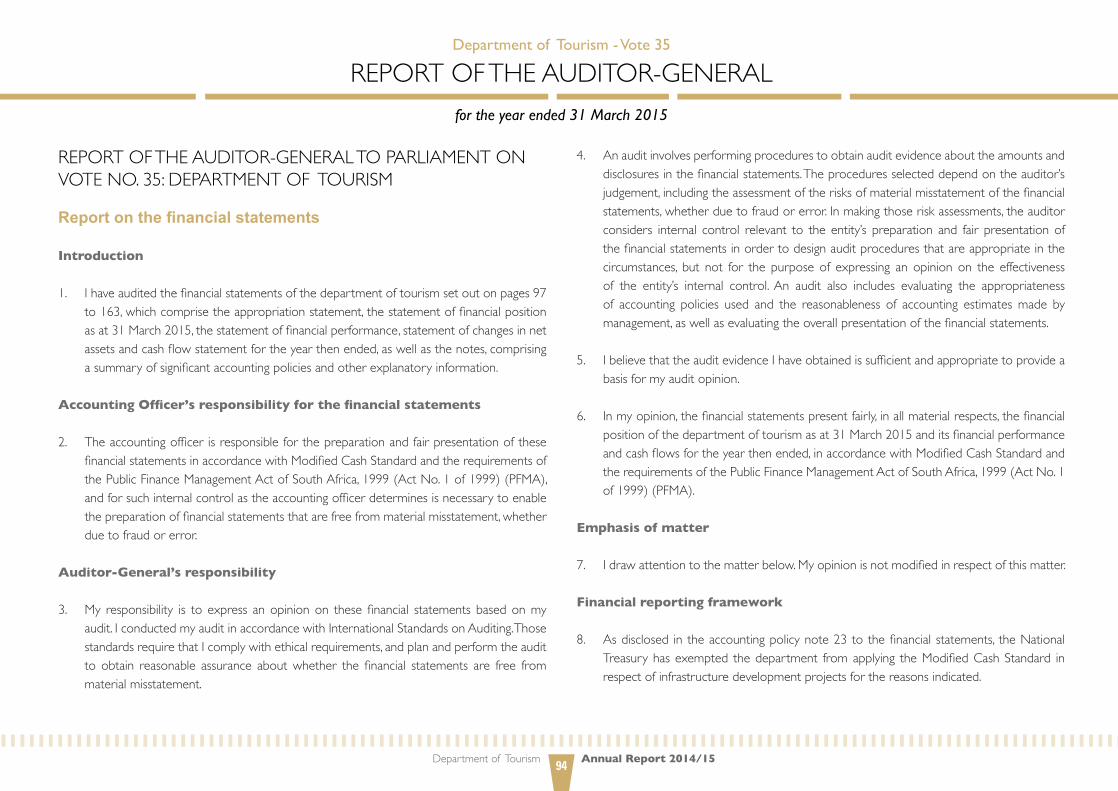
Department of Tourism Annual Report 2014/1594
RepoRt of the auditoR-geneRal to paRliament on vote no. 35: depaRtment of touRism
Report on the financial statements
Introduction
1. Ihaveauditedthefinancialstatementsofthedepartmentoftourismsetoutonpages97to163,whichcomprisetheappropriationstatement,thestatementoffinancialpositionasat31March2015,thestatementoffinancialperformance,statementofchangesinnetassetsandcashflowstatementfortheyearthenended,aswellasthenotes,comprisingasummaryofsignificantaccountingpoliciesandotherexplanatoryinformation.
Accounting Officer’s responsibility for the financial statements
2. TheaccountingofficerisresponsibleforthepreparationandfairpresentationofthesefinancialstatementsinaccordancewithModifiedCashStandardandtherequirementsofthePublicFinanceManagementActofSouthAfrica,1999(ActNo.1of1999)(PFMA),andforsuchinternalcontrolastheaccountingofficerdeterminesisnecessarytoenablethepreparationoffinancialstatementsthatarefreefrommaterialmisstatement,whetherduetofraudorerror.
Auditor-General’s responsibility
3. My responsibility is to express anopinionon these financial statements basedonmyaudit.IconductedmyauditinaccordancewithInternationalStandardsonAuditing.ThosestandardsrequirethatIcomplywithethicalrequirements,andplanandperformtheauditto obtain reasonable assurance aboutwhether the financial statements are free frommaterialmisstatement.
4. Anauditinvolvesperformingprocedurestoobtainauditevidenceabouttheamountsanddisclosuresinthefinancialstatements.Theproceduresselecteddependontheauditor’sjudgement,includingtheassessmentoftherisksofmaterialmisstatementofthefinancialstatements,whetherduetofraudorerror.Inmakingthoseriskassessments,theauditorconsiders internal control relevant to the entity’s preparation and fair presentationofthefinancialstatementsinordertodesignauditproceduresthatareappropriateinthecircumstances, but not for the purpose of expressing an opinion on the effectivenessof the entity’s internal control.An audit also includes evaluating the appropriatenessof accounting policies used and the reasonableness of accounting estimatesmade bymanagement,aswellasevaluatingtheoverallpresentationofthefinancialstatements.
5. IbelievethattheauditevidenceIhaveobtainedissufficientandappropriatetoprovideabasisformyauditopinion.
6. Inmyopinion,thefinancialstatementspresentfairly,inallmaterialrespects,thefinancialpositionofthedepartmentoftourismasat31March2015anditsfinancialperformanceandcashflowsfortheyearthenended,inaccordancewithModifiedCashStandardandtherequirementsofthePublicFinanceManagementActofSouthAfrica,1999(ActNo.1of1999)(PFMA).
Emphasis of matter
7. Idrawattentiontothematterbelow.Myopinionisnotmodifiedinrespectofthismatter.
Financial reporting framework
8. Asdisclosed intheaccountingpolicynote23tothefinancialstatements, theNationalTreasuryhasexempted thedepartment fromapplying theModifiedCashStandard inrespectofinfrastructuredevelopmentprojectsforthereasonsindicated.
Department of Tourism - Vote 35
RepoRt of the auditoR-geneRalfor the year ended 31 March 2015
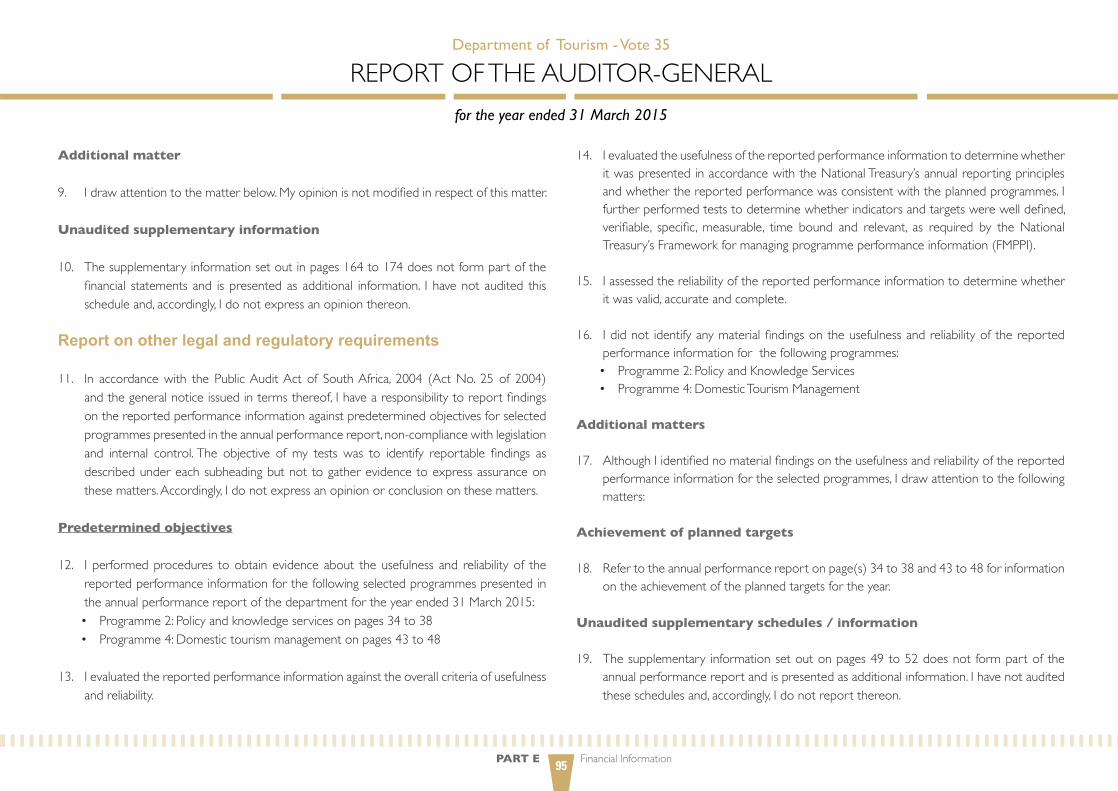
PART E Financial Information95
Additional matter
9. Idrawattentiontothematterbelow.Myopinionisnotmodifiedinrespectofthismatter.
Unaudited supplementary information
10. Thesupplementaryinformationsetoutinpages164to174doesnotformpartofthefinancial statements and ispresentedas additional information. I havenot audited thisscheduleand,accordingly,Idonotexpressanopinionthereon.
Report on other legal and regulatory requirements
11. In accordancewith the PublicAuditAct of SouthAfrica, 2004 (ActNo. 25 of 2004)andthegeneralnoticeissuedintermsthereof,Ihavearesponsibilitytoreportfindingsonthereportedperformanceinformationagainstpredeterminedobjectivesforselectedprogrammespresentedintheannualperformancereport,non-compliancewithlegislationand internal control.The objective of my tests was to identify reportable findings asdescribedundereachsubheadingbutnottogatherevidencetoexpressassuranceonthesematters.Accordingly,Idonotexpressanopinionorconclusiononthesematters.
Predetermined objectives
12. I performedprocedures toobtainevidenceabout theusefulness and reliabilityof thereportedperformanceinformationforthefollowingselectedprogrammespresentedintheannualperformancereportofthedepartmentfortheyearended31March2015:• Programme2:Policyandknowledgeservicesonpages34to38• Programme4:Domestictourismmanagementonpages43to48
13. Ievaluatedthereportedperformanceinformationagainsttheoverallcriteriaofusefulnessandreliability.
14. IevaluatedtheusefulnessofthereportedperformanceinformationtodeterminewhetheritwaspresentedinaccordancewiththeNationalTreasury’sannualreportingprinciplesandwhetherthereportedperformancewasconsistentwiththeplannedprogrammes.Ifurtherperformedteststodeterminewhetherindicatorsandtargetswerewelldefined,verifiable, specific, measurable, time bound and relevant, as required by the NationalTreasury’sFrameworkformanagingprogrammeperformanceinformation(FMPPI).
15. Iassessedthereliabilityofthereportedperformanceinformationtodeterminewhetheritwasvalid,accurateandcomplete.
16. Ididnot identifyanymaterialfindingsontheusefulnessandreliabilityofthereportedperformanceinformationforthefollowingprogrammes:• Programme2:PolicyandKnowledgeServices• Programme4:DomesticTourismManagement
Additional matters
17. AlthoughIidentifiednomaterialfindingsontheusefulnessandreliabilityofthereportedperformanceinformationfortheselectedprogrammes,Idrawattentiontothefollowingmatters:
Achievement of planned targets
18. Refertotheannualperformancereportonpage(s)34to38and43to48forinformationontheachievementoftheplannedtargetsfortheyear.
Unaudited supplementary schedules / information
19. Thesupplementary informationsetoutonpages49to52doesnot formpartoftheannualperformancereportandispresentedasadditionalinformation.Ihavenotauditedtheseschedulesand,accordingly,Idonotreportthereon.
Department of Tourism - Vote 35
RepoRt of the auditoR-geneRalfor the year ended 31 March 2015

Department of Tourism Annual Report 2014/1596
Compliance with legislation
20. I performed procedures to obtain evidence that the department had complied withapplicablelegislationregardingfinancialmatters,financialmanagementandotherrelatedmatters.Myfindingsonmaterialnon-compliancewithspecificmattersinkeylegislation,assetoutinthegeneralnoticeissuedintermsofthePAA,areasfollows:
Financial statements, performance and annual reports
21. Thefinancialstatementssubmittedforauditingwerenotprepared inaccordancewiththeprescribedfinancialreportingframeworkandsupportedbyfullandproperrecordsasrequiredbysection40(1)(b)ofthePublicFinanceManagementAct.
22. Materialmisstatementsof disclosure items identifiedby the auditors in the submittedfinancial statement were subsequently corrected, resulting in the financial statementsreceivinganunqualifiedauditopinion.
Internal control
23. I considered internal control relevant to my audit of the financial statements, annualperformance report and compliancewith legislation.Thematters reportedbelow arelimited to the significant internal control deficiencies that resulted in the opinion, thefindings on the annual performance report and the findings on non-compliancewithlegislationincludedinthisreport.
Financial and performance management
24. InternalcontrolstoensurethattheannualfinancialstatementsincludedthecommitmentsdisclosurenoteinrespectoftheEPWP–Trainingprogrammeswerenoteffective.
Other reports
Investigations
25. AtthedateofthisreportaninvestigationhasbeencarriedoutbytheDepartment,butthis report has not been finalised as someof the findings are still being interrogated.Possibleirregularandfruitlessandwastefulexpenditurecanonlybequantifiedoncetheinvestigationhasbeenfinalised.
Pretoria27 July 2015
Department of Tourism - Vote 35
RepoRt of the auditoR-geneRalfor the year ended 31 March 2015

PART E Financial Information97
Department of Tourism - Vote 35
ANNuAlFINANCIAlSTATEMENTSfor the year ended 31 March 2015
Table of conTenTs
Appropriationstatement 98 Notestotheappropriationstatement 128 Statementoffinancialperformance 130 Statementoffinancialposition 131 Statementofchangesinnetassets 132 Cashflowstatement 133 Accountingpolicies 134 Notestotheannualfinancialstatements 140 Annexurestotheannualfinancialstatements 164

Department of Tourism Annual Report 2014/1598
Appropriation per programme
2014/15 2013/14
ProgrammesAdjusted
appropriationShifting of
fundsVirement Final
appropriationActual
expenditureVariance Expenditure
as % of final appropriation
Final appropriation
Actual expenditure
R’000 R’000 R’000 R’000 R’000 R’000 % R’000 R’0001. Administration 224619 - 342 224961 219783 5178 97,7 212646 2120002. Policy and Knowledge
Services 928862 - 831 929693 929647 46 100,0 911843 9087903. International Tourism 45416 - (247) 45169 45094 75 99,8 41013 378864. Domestic Tourism 384363 - (926) 383437 363070 20367 94,7 355072 353991TOTAL 1 583 260 - - 1 583 260 1 557 594 25 666 98,4 1 520 574 1 512 667
Reconciliation with statement of financial performance
ADD
Departmentalreceipts 3504 4209Aidassistance 9600 -Actual amounts per statement of financial performance (total revenue) 1 596 364 1 524 783
ADD
Aidassistance 4800 -Actual amounts per statement of financial performance (total expenditure) 1 562 394 1 512 667
Department of Tourism - Vote 35
appRopRiation statementfor the year ended 31 March 2015
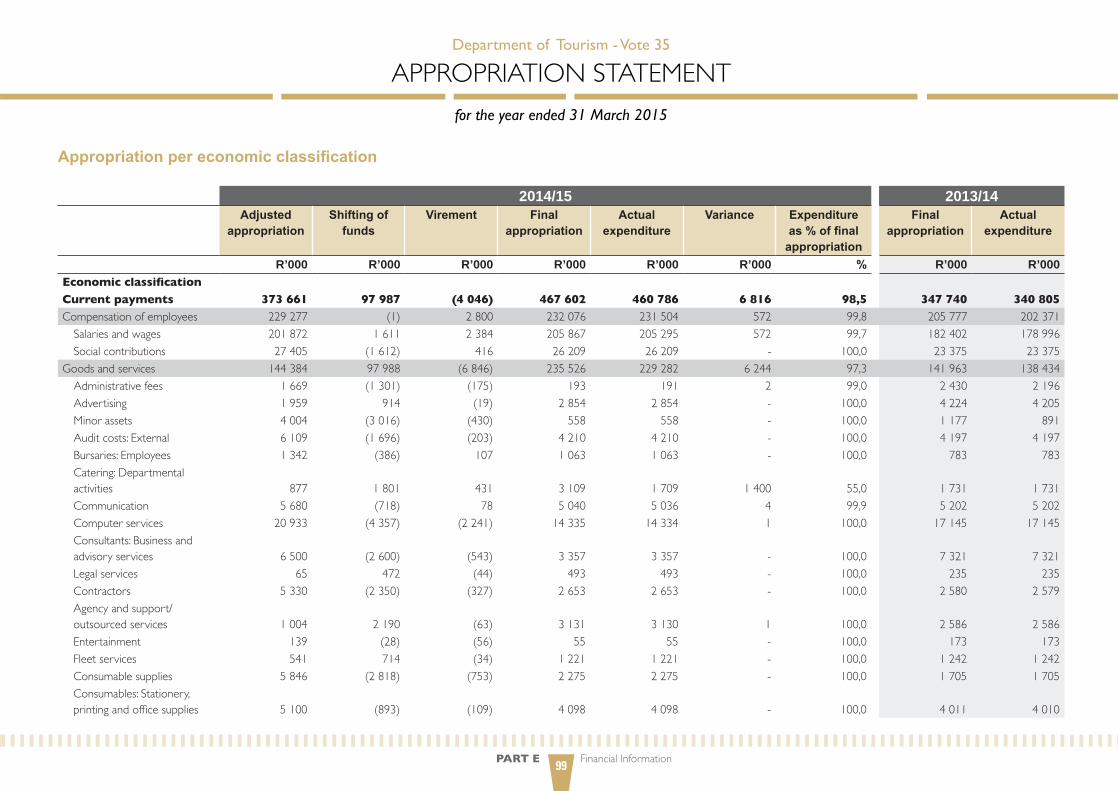
PART E Financial Information99
Appropriation per economic classification
2014/15 2013/14 Adjusted
appropriationShifting of
fundsVirement Final
appropriationActual
expenditureVariance Expenditure
as % of final appropriation
Final appropriation
Actual expenditure
R’000 R’000 R’000 R’000 R’000 R’000 % R’000 R’000Economic classification Current payments 373 661 97 987 (4 046) 467 602 460 786 6 816 98,5 347 740 340 805 Compensationofemployees 229277 (1) 2800 232076 231504 572 99,8 205777 202371Salariesandwages 201872 1611 2384 205867 205295 572 99,7 182402 178996Socialcontributions 27405 (1612) 416 26209 26209 - 100,0 23375 23375
Goodsandservices 144 384 97988 (6846) 235526 229282 6244 97,3 141963 138 434 Administrativefees 1669 (1301) (175) 193 191 2 99,0 2430 2196Advertising 1959 914 (19) 2854 2854 - 100,0 4224 4205Minorassets 4004 (3016) (430) 558 558 - 100,0 1177 891Auditcosts:External 6109 (1696) (203) 4210 4210 - 100,0 4197 4197Bursaries:Employees 1342 (386) 107 1063 1063 - 100,0 783 783Catering:Departmentalactivities 877 1801 431 3109 1709 1400 55,0 1731 1731Communication 5680 (718) 78 5040 5036 4 99,9 5202 5202Computerservices 20933 (4357) (2241) 14 335 14 334 1 100,0 17145 17145Consultants:Businessandadvisoryservices 6500 (2600) (543) 3357 3357 - 100,0 7321 7321legalservices 65 472 (44) 493 493 - 100,0 235 235Contractors 5330 (2350) (327) 2653 2653 - 100,0 2580 2579Agencyandsupport/outsourcedservices 1004 2190 (63) 3 131 3130 1 100,0 2586 2586Entertainment 139 (28) (56) 55 55 - 100,0 173 173Fleetservices 541 714 (34) 1221 1221 - 100,0 1242 1242Consumablesupplies 5846 (2818) (753) 2275 2275 - 100,0 1705 1705Consumables:Stationery,printingandofficesupplies 5100 (893) (109) 4098 4098 - 100,0 4011 4010
Department of Tourism - Vote 35
appRopRiation statementfor the year ended 31 March 2015

Department of Tourism Annual Report 2014/15100
Appropriation per economic classification - continued
2014/15 2013/14 Adjusted
appropriationShifting of
fundsVirement Final
appropriationActual
expenditureVariance Expenditure
as % of final appropriation
Final appropriation
Actual expenditure
R’000 R’000 R’000 R’000 R’000 R’000 % R’000 R’000Operatingleases 26507 5632 - 32139 32139 - 100,0 26894 26894Propertypayments 777 1710 (28) 2459 2459 - 100,0 234 234Travelandsubsistence 35979 1 138 (2013) 35104 31168 3936 88,8 43367 41750Traininganddevelopment 3260 103193 (280) 106173 106173 - 100,0 3731 3731Operatingpayments 5560 74 (553) 5081 5081 - 100,0 4642 4642Venuesandfacilities 3951 1274 580 5805 4905 900 84,5 6001 4630Rentalandhiring 1252 (961) (171) 120 120 - 100,0 352 352
Transfers and subsidies 1 199 225 (100 669) 4 024 1 102 580 1 083 730 18 850 98,3 1 160 232 1 160 115 Departmentalagenciesandaccounts 886257 - - 886257 886257 - 100,0 872633 872633Higher-educationinstitutions 3720 - - 3720 3720 - 100,0 3105 3105Foreigngovernmentsandinternationalorganisations 5864 - 2748 8612 8552 60 99,3 4930 4 813 Non-profitinstitutions 25200 - 1250 26450 26450 - 100,0 26000 26000Households 278184 (100669) 26 177541 158751 18790 89,4 253564 253564Socialbenefits - 2006 26 2032 2031 1 99,9 343 343 Othertransferstohouseholds 278184 (102675) - 175509 156720 18789 89,3 253221 253221
Payments for capital assets 10 374 2 442 - 12 816 12 816 - 100,0 12 484 11 629
Machineryandequipment 10245 473 - 10718 10718 - 100,0 11164 10330Transportequipment 2113 73 (332) 1 854 1 854 - 100,0 3039 3039Othermachineryandequipment 8132 400 332 8864 8864 - 100,0 8125 7291
Intangibleassets 129 1969 - 2098 2098 - 100,0 1320 1299Payments for financial assets - 240 22 262 262 - 100,0 118 118 TOTAL 1 583 260 - - 1 583 260 1 557 594 25 666 98,4 1 520 574 1 512 667
Department of Tourism - Vote 35
appRopRiation statementfor the year ended 31 March 2015

PART E Financial Information101
Detail per programme 1: Administration
2014/15 2013/14
Programme 1: Administration
Adjusted appropriation
Shifting of funds
Virement Final appropriation
Actual expenditure
Variance Expenditure as % of final
appropriation
Final appropriation
Actual expenditure
R’000 R’000 R’000 R’000 R’000 R’000 % R’000 R’000Sub-programmes 1.Ministry 37104 (5953) (300) 30851 30834 17 99,9 35567 355672.Management 17807 (730) (247) 16830 14 543 2287 86,4 16456 162593.CorporateAffairs 143281 (1296) 889 142874 140000 2874 98,0 131539 1313254.OfficeAccommodation 26427 7979 - 34406 34406 - 100,0 29084 28849Total for sub-programmes 224 619 - 342 224 961 219 783 5 178 97,7 212 646 212 000 Economic classificationCurrent payments 217 519 (4 525) (802) 212 192 207 015 5 177 97,6 202 093 201 812Compensationofemployees 114633 - 957 115590 115076 514 99,6 102472 102462Salariesandwages 101166 503 524 102193 101679 514 99,5 90389 90379Socialcontributions 13467 (503) 433 13397 13397 - 100,0 12083 12083
Goodsandservices 102886 (4525) (1759) 96602 91939 4663 95,2 99621 99350Administrativefees 1363 (1116) (162) 85 83 2 97,6 2299 2065Advertising 1299 (236) (54) 1009 1009 - 100,0 1 381 1 381Minorassets 3292 (2552) (367) 373 373 - 100,0 632 597Auditcosts:External 6109 (1696) (203) 4210 4210 - 100,0 4197 4197Bursaries:Employees 1342 (438) 53 957 957 - 100,0 783 783Catering:Departmentalactivities 140 1177 488 1805 405 1400 22,4 789 789Communication 4520 (580) (27) 3913 3909 4 99,9 4050 4050Computerservices 19397 (3170) (1941) 14286 14285 1 100,0 15990 15990Consultants:Businessandadvisoryservices 3167 (2624) (283) 260 260 - 100,0 3865 3865legalservices - 420 - 420 420 - 100,0 5 5Contractors 3065 (1401) (186) 1478 1478 - 100,0 1 553 1552Agencyandsupport/outsourcedservices 995 2176 (60) 3 111 3110 1 100,0 2570 2570
Department of Tourism - Vote 35
appRopRiation statementfor the year ended 31 March 2015
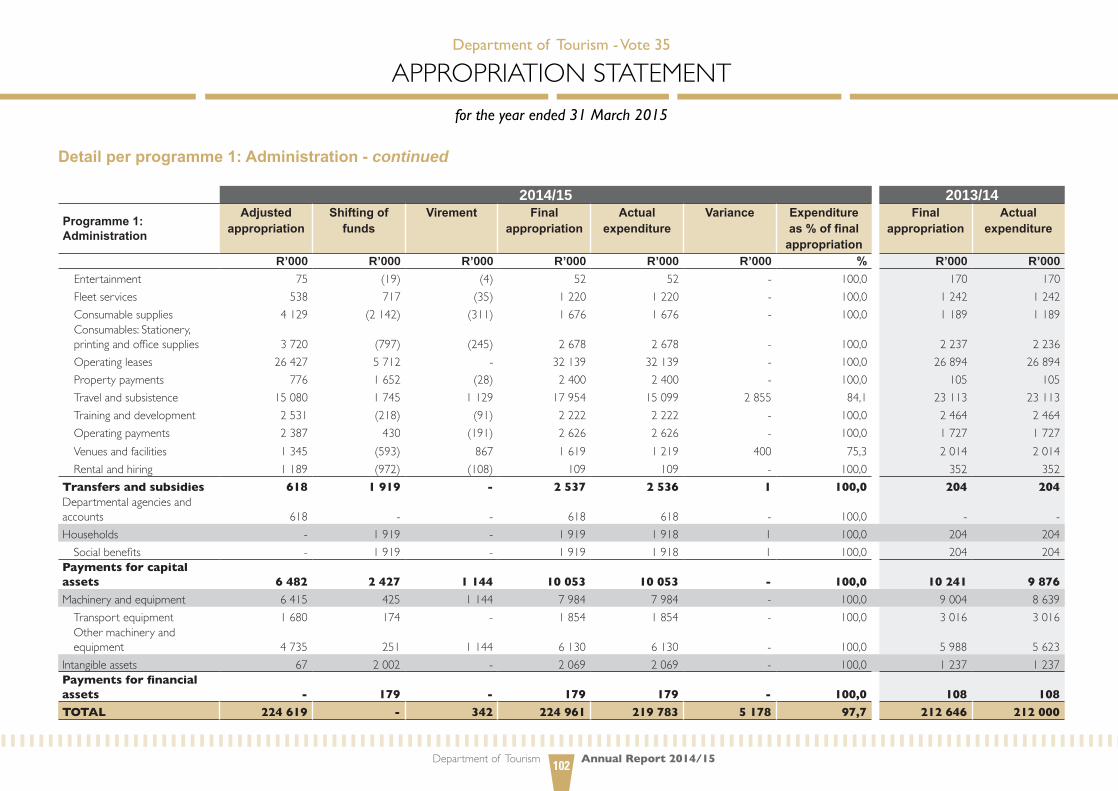
Department of Tourism Annual Report 2014/15102
Detail per programme 1: Administration - continued
2014/15 2013/14Programme 1: Administration
Adjusted appropriation
Shifting of funds
Virement Final appropriation
Actual expenditure
Variance Expenditure as % of final
appropriation
Final appropriation
Actual expenditure
R’000 R’000 R’000 R’000 R’000 R’000 % R’000 R’000Entertainment 75 (19) (4) 52 52 - 100,0 170 170Fleetservices 538 717 (35) 1220 1220 - 100,0 1242 1242Consumablesupplies 4129 (2142) (311) 1676 1676 - 100,0 1189 1189Consumables:Stationery,printingandofficesupplies 3720 (797) (245) 2678 2678 - 100,0 2237 2236Operatingleases 26427 5712 - 32139 32139 - 100,0 26894 26894Propertypayments 776 1652 (28) 2400 2400 - 100,0 105 105Travelandsubsistence 15080 1745 1129 17954 15099 2855 84,1 23113 23113Traininganddevelopment 2531 (218) (91) 2222 2222 - 100,0 2464 2464Operatingpayments 2387 430 (191) 2626 2626 - 100,0 1727 1727Venuesandfacilities 1 345 (593) 867 1619 1219 400 75,3 2014 2014Rentalandhiring 1189 (972) (108) 109 109 - 100,0 352 352
Transfers and subsidies 618 1 919 - 2 537 2 536 1 100,0 204 204Departmentalagenciesandaccounts 618 - - 618 618 - 100,0 - -Households - 1919 - 1919 1918 1 100,0 204 204Socialbenefits - 1919 - 1919 1918 1 100,0 204 204
Payments for capital assets 6 482 2 427 1 144 10 053 10 053 - 100,0 10 241 9 876
Machineryandequipment 6415 425 1 144 7984 7984 - 100,0 9004 8639Transportequipment 1680 174 - 1 854 1 854 - 100,0 3016 3016Othermachineryandequipment 4735 251 1 144 6130 6130 - 100,0 5988 5623
Intangibleassets 67 2002 - 2069 2069 - 100,0 1237 1237Payments for financial assets - 179 - 179 179 - 100,0 108 108
TOTAL 224 619 - 342 224 961 219 783 5 178 97,7 212 646 212 000
Department of Tourism - Vote 35
appRopRiation statementfor the year ended 31 March 2015
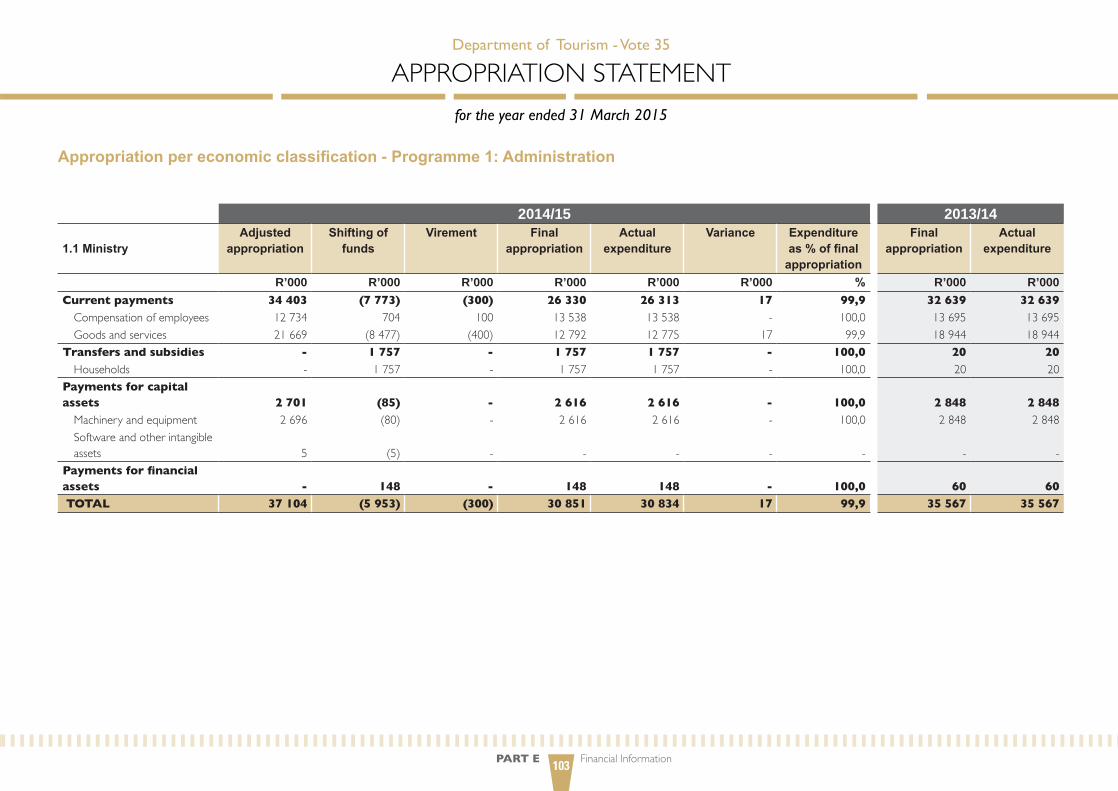
PART E Financial Information103
Appropriation per economic classification - Programme 1: Administration
2014/15 2013/14
1.1 MinistryAdjusted
appropriationShifting of
fundsVirement Final
appropriationActual
expenditureVariance Expenditure
as % of final appropriation
Final appropriation
Actual expenditure
R’000 R’000 R’000 R’000 R’000 R’000 % R’000 R’000Current payments 34 403 (7 773) (300) 26 330 26 313 17 99,9 32 639 32 639Compensationofemployees 12734 704 100 13 538 13 538 - 100,0 13695 13695Goodsandservices 21669 (8477) (400) 12792 12775 17 99,9 18944 18944
Transfers and subsidies - 1 757 - 1 757 1 757 - 100,0 20 20Households - 1757 - 1757 1757 - 100,0 20 20
Payments for capital assets 2 701 (85) - 2 616 2 616 - 100,0 2 848 2 848Machineryandequipment 2696 (80) - 2616 2616 - 100,0 2848 2848Softwareandotherintangibleassets 5 (5) - - - - - - -
Payments for financial assets - 148 - 148 148 - 100,0 60 60 TOTAL 37 104 (5 953) (300) 30 851 30 834 17 99,9 35 567 35 567
Department of Tourism - Vote 35
appRopRiation statementfor the year ended 31 March 2015

Department of Tourism Annual Report 2014/15104
Appropriation per economic classification - Programme 1: Administration - continued
2014/15 2013/14
1.2 ManagementAdjusted
appropriationShifting of
fundsVirement Final
appropriationActual
expenditureVariance Expenditure
as % of final appropriation
Final appropriation
Actual expenditure
R’000 R’000 R’000 R’000 R’000 R’000 % R’000 R’000Current payments 17 445 (704) (247) 16 494 14 207 2 287 86,1 15 887 15 880Compensationofemployees 12488 (704) 53 11837 11374 463 96,1 11147 11146Goodsandservices 4957 - (300) 4657 2833 1824 60,8 4740 4734
Transfers and subsidies - - - - - - - 17 17Households - - - - - - - 17 17Payments for capital assets 362 (26) - 336 336 - 100,0 552 362Machineryandequipment 361 (25) - 336 336 - 100,0 552 362Softwareandotherintangibleassets 1 (1) - - - - - - -
TOTAL 17 807 (730) (247) 16 830 14 543 2 287 86,4 16 456 16 259
Department of Tourism - Vote 35
appRopRiation statementfor the year ended 31 March 2015
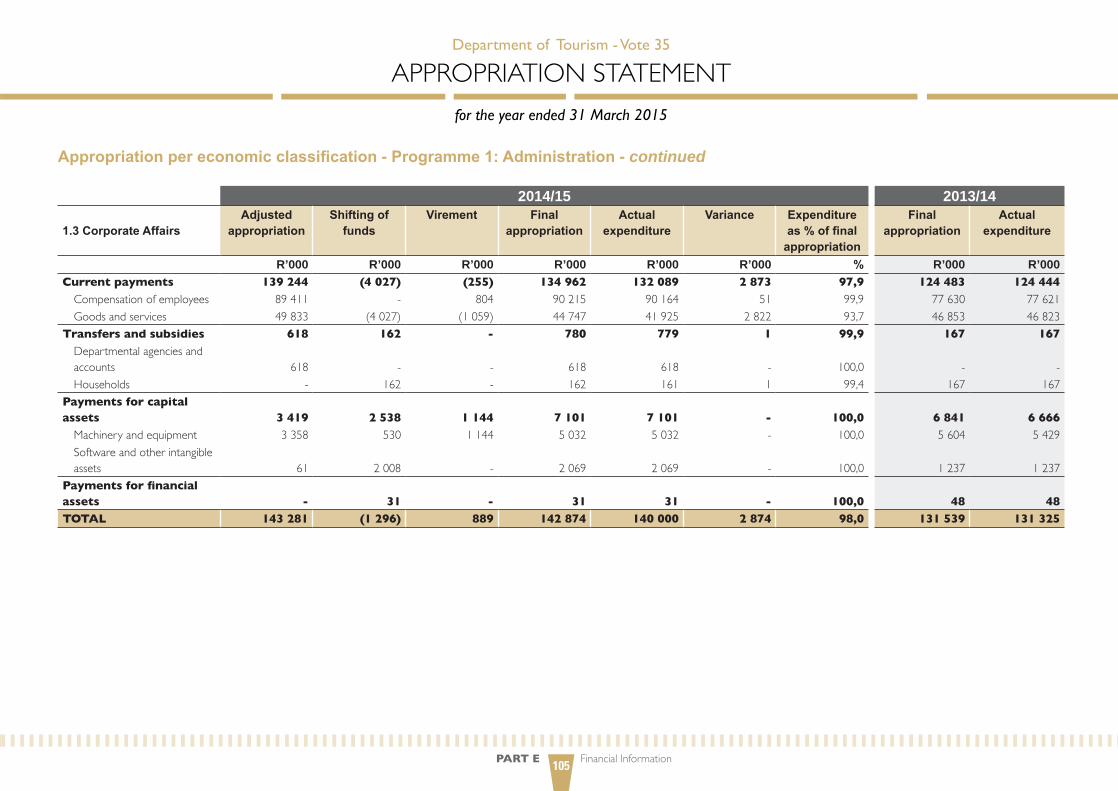
PART E Financial Information105
Appropriation per economic classification - Programme 1: Administration - continued
2014/15 2013/14
1.3 Corporate AffairsAdjusted
appropriationShifting of
fundsVirement Final
appropriationActual
expenditureVariance Expenditure
as % of final appropriation
Final appropriation
Actual expenditure
R’000 R’000 R’000 R’000 R’000 R’000 % R’000 R’000Current payments 139 244 (4 027) (255) 134 962 132 089 2 873 97,9 124 483 124 444 Compensationofemployees 89411 - 804 90215 90164 51 99,9 77630 77621Goodsandservices 49833 (4027) (1059) 44747 41925 2822 93,7 46853 46823
Transfers and subsidies 618 162 - 780 779 1 99,9 167 167 Departmentalagenciesandaccounts 618 - - 618 618 - 100,0 - - Households - 162 - 162 161 1 99,4 167 167
Payments for capital assets 3 419 2 538 1 144 7 101 7 101 - 100,0 6 841 6 666 Machineryandequipment 3 358 530 1 144 5032 5032 - 100,0 5604 5429Softwareandotherintangibleassets 61 2008 - 2069 2069 - 100,0 1237 1237
Payments for financial assets - 31 - 31 31 - 100,0 48 48 TOTAL 143 281 (1 296) 889 142 874 140 000 2 874 98,0 131 539 131 325
Department of Tourism - Vote 35
appRopRiation statementfor the year ended 31 March 2015

Department of Tourism Annual Report 2014/15106
Appropriation per economic classification - Programme 1: Administration - continued
2014/15 2013/14
1.4 Office AccommodationAdjusted
appropriationShifting of
fundsVirement Final
appropriationActual
expenditureVariance Expenditure
as % of final appropriation
Final appropriation
Actual expenditure
R’000 R’000 R’000 R’000 R’000 R’000 % R’000 R’000Current payments 26 427 7 979 - 34 406 34 406 - 100,0 29 084 28 849 Goodsandservices 26427 7979 - 34406 34406 - 100,0 29084 28849TOTAL 26 427 7 979 - 34 406 34 406 - 100,0 29 084 28 849
Department of Tourism - Vote 35
appRopRiation statementfor the year ended 31 March 2015
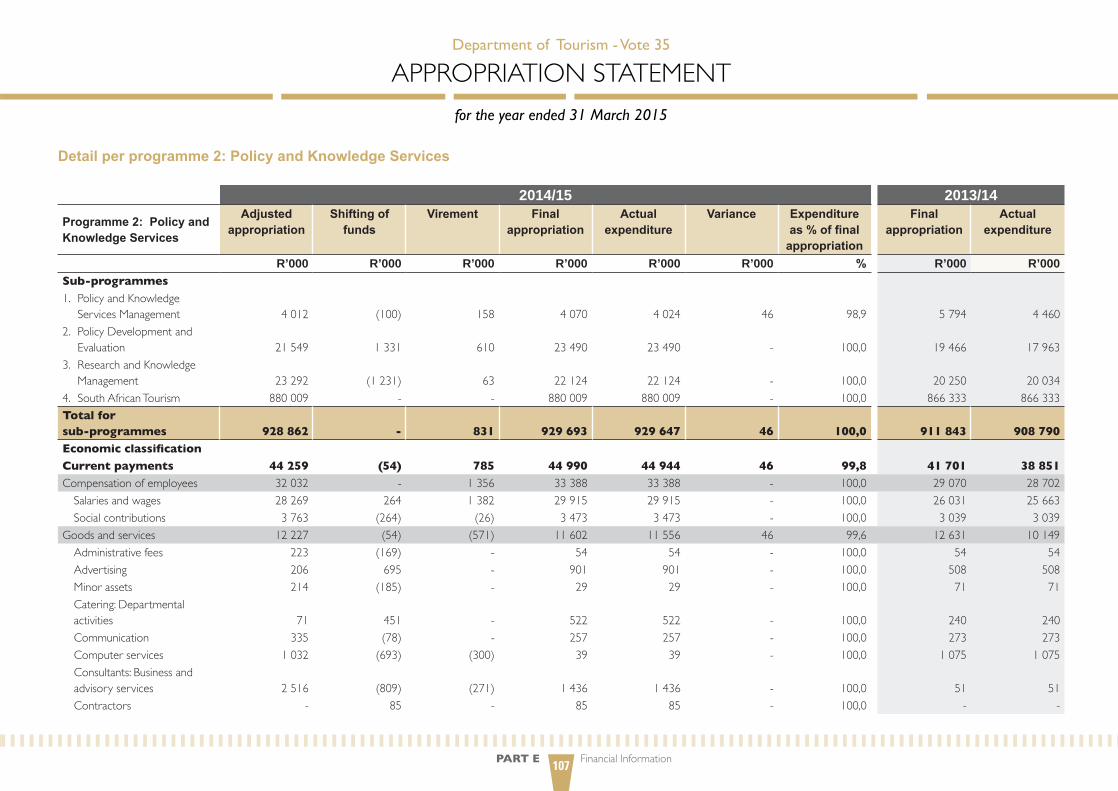
PART E Financial Information107
Detail per programme 2: Policy and Knowledge Services
2014/15 2013/14
Programme 2: Policy and Knowledge Services
Adjusted appropriation
Shifting of funds
Virement Final appropriation
Actual expenditure
Variance Expenditure as % of final
appropriation
Final appropriation
Actual expenditure
R’000 R’000 R’000 R’000 R’000 R’000 % R’000 R’000Sub-programmes1. PolicyandKnowledgeServicesManagement 4012 (100) 158 4070 4024 46 98,9 5794 4460
2. PolicyDevelopmentandEvaluation 21549 1 331 610 23490 23490 - 100,0 19466 17963
3. ResearchandKnowledgeManagement 23292 (1231) 63 22124 22124 - 100,0 20250 20034
4. SouthAfricanTourism 880009 - - 880009 880009 - 100,0 866333 866333Total for sub-programmes 928 862 - 831 929 693 929 647 46 100,0 911 843 908 790 Economic classificationCurrent payments 44 259 (54) 785 44 990 44 944 46 99,8 41 701 38 851 Compensationofemployees 32032 - 1356 33 388 33 388 - 100,0 29070 28702Salariesandwages 28269 264 1382 29915 29915 - 100,0 26031 25663Socialcontributions 3763 (264) (26) 3473 3473 - 100,0 3039 3039
Goodsandservices 12227 (54) (571) 11602 11556 46 99,6 12631 10149Administrativefees 223 (169) - 54 54 - 100,0 54 54 Advertising 206 695 - 901 901 - 100,0 508 508Minorassets 214 (185) - 29 29 - 100,0 71 71Catering:Departmentalactivities 71 451 - 522 522 - 100,0 240 240Communication 335 (78) - 257 257 - 100,0 273 273Computerservices 1032 (693) (300) 39 39 - 100,0 1075 1075Consultants:Businessandadvisoryservices 2516 (809) (271) 1436 1436 - 100,0 51 51 Contractors - 85 - 85 85 - 100,0 - -
Department of Tourism - Vote 35
appRopRiation statementfor the year ended 31 March 2015

Department of Tourism Annual Report 2014/15108
2014/15 2013/14
Programme 2: Policy and Knowledge Services
Adjusted appropriation
Shifting of funds
Virement Final appropriation
Actual expenditure
Variance Expenditure as % of final
appropriation
Final appropriation
Actual expenditure
R’000 R’000 R’000 R’000 R’000 R’000 % R’000 R’000Agencyandsupport/outsourcedservices - 7 - 7 7 - 100,0 3 3 Entertainment 11 (10) - 1 1 - 100,0 - - Consumablesupplies 256 (202) - 54 54 - 100,0 46 46Consumables:Stationery,printingandofficesupplies 424 (76) - 348 348 - 100,0 394 394Operatingleases 30 (30) - - - - - - -Travelandsubsistence 4741 (1521) - 3220 3174 46 98,6 5139 3981Traininganddevelopment 343 580 - 923 923 - 100,0 538 538 Operatingpayments 638 1150 - 1788 1788 - 100,0 2110 2110Venuesandfacilities 1187 751 - 1938 1938 - 100,0 2129 805
Transfers and subsidies 883 729 - 26 883 755 883 755 - 100,0 869 473 869 473 Departmentalagenciesandaccounts 880009 - - 880009 880009 - 100,0 866333 866333Higher-educationinstitutions 3720 - - 3720 3720 - 100,0 3105 3105Households - - 26 26 26 - 100,0 35 35 Socialbenefits - - 26 26 26 - 100,0 35 35
Payments for capital assets 874 14 - 888 888 - 100,0 669 466 Machineryandequipment 874 (15) - 859 859 - 100,0 626 444 Transportequipment 110 (110) - - - - - - -Othermachineryandequipment 764 95 - 859 859 - 100,0 626 444
Intangibleassets - 29 - 29 29 - 100,0 43 22Payments for financial assets - 40 20 60 60 - 100,0 - - TOTAL 928 862 - 831 929 693 929 647 46 100,0 911 843 908 790
Department of Tourism - Vote 35
appRopRiation statement
for the year ended 31 March 2015
Detail per programme 2: Policy and Knowledge Services - continued
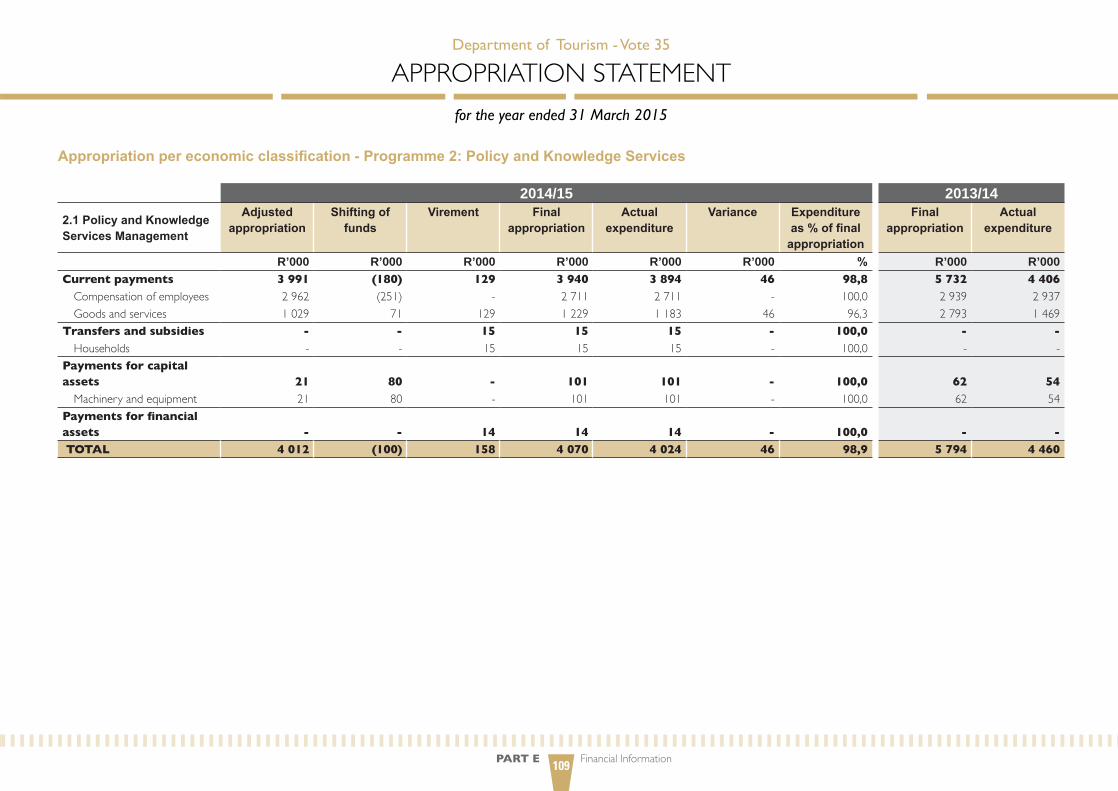
PART E Financial Information109
Appropriation per economic classification - Programme 2: Policy and Knowledge Services
2014/15 2013/14
2.1 Policy and Knowledge Services Management
Adjusted appropriation
Shifting of funds
Virement Final appropriation
Actual expenditure
Variance Expenditure as % of final
appropriation
Final appropriation
Actual expenditure
R’000 R’000 R’000 R’000 R’000 R’000 % R’000 R’000Current payments 3 991 (180) 129 3 940 3 894 46 98,8 5 732 4 406 Compensationofemployees 2962 (251) - 2711 2711 - 100,0 2939 2937Goodsandservices 1029 71 129 1229 1 183 46 96,3 2793 1469
Transfers and subsidies - - 15 15 15 - 100,0 - -Households - - 15 15 15 - 100,0 - -
Payments for capital assets 21 80 - 101 101 - 100,0 62 54 Machineryandequipment 21 80 - 101 101 - 100,0 62 54
Payments for financial assets - - 14 14 14 - 100,0 - - TOTAL 4 012 (100) 158 4 070 4 024 46 98,9 5 794 4 460
Department of Tourism - Vote 35
appRopRiation statement
for the year ended 31 March 2015

Department of Tourism Annual Report 2014/15110
Appropriation per economic classification - Programme 2: Policy and Knowledge Services - continued
2014/15 2013/14
2.2 Policy Development and Evaluation
Adjusted appropriation
Shifting of funds
Virement Final appropriation
Actual expenditure
Variance Expenditure as % of final
appropriation
Final appropriation
Actual expenditure
R’000 R’000 R’000 R’000 R’000 R’000 % R’000 R’000Current payments 21 161 1 181 610 22 952 22 952 - 100,0 19 155 17 739 Compensationofemployees 15985 (180) 910 16715 16715 - 100,0 13517 13 151 Goodsandservices 5176 1361 (300) 6237 6237 - 100,0 5638 4 588
Transfers and subsidies - - - - - - - 35 35 Households - - - - - - - 35 35 Payments for capital assets 388 131 - 519 519 - 100,0 276 189 Machineryandequipment 388 102 - 490 490 - 100,0 276 189Intangibleassets - 29 - 29 29 - 100,0 - - Payments for financial assets - 19 - 19 19 - 100,0 - - TOTAL 21 549 1 331 610 23 490 23 490 - 100,0 19 466 17 963
Department of Tourism - Vote 35
appRopRiation statementfor the year ended 31 March 2015

PART E Financial Information111
Appropriation per economic classification - Programme 2: Policy and Knowledge Services - continued
2014/15 2013/14
2.3 Research and Knowledge Management
Adjusted appropriation
Shifting of funds
Virement Final appropriation
Actual expenditure
Variance Expenditure as % of final
appropriation
Final appropriation
Actual expenditure
R’000 R’000 R’000 R’000 R’000 R’000 % R’000 R’000Current payments 19 107 (1 055) 46 18 098 18 098 - 100,0 16 814 16 706 Compensationofemployees 13085 431 446 13962 13962 - 100,0 12614 12614Goodsandservices 6022 (1486) (400) 4136 4136 - 100,0 4200 4092
Transfers and subsidies 3 720 - 11 3 731 3 731 - 100,0 3 105 3 105 Higher-educationinstitutions 3720 - 3720 3720 - 100,0 3105 3105Households - - 11 11 11 - 100,0 - - Payments for capital assets 465 (197) - 268 268 - 100,0 331 223 Machineryandequipment 465 (197) - 268 268 - 100,0 288 201Intangibleassets - - - - - - - 43 22Payments for financial assets - 21 6 27 27 - 100,0 - - TOTAL 23 292 (1 231) 63 22 124 22 124 - 100,0 20 250 20 034
Department of Tourism - Vote 35
appRopRiation statementfor the year ended 31 March 2015

Department of Tourism Annual Report 2014/15112
Appropriation per economic classification - Programme 2: Policy and Knowledge Services - continued
2014/15 2013/14
2.4 South African TourismAdjusted
appropriationShifting of
fundsVirement Final
appropriationActual
expenditureVariance Expenditure
as % of final appropriation
Final appropriation
Actual expenditure
R’000 R’000 R’000 R’000 R’000 R’000 % R’000 R’000Transfers and subsidies 880 009 - - 880 009 880 009 - 100,0 866 333 866 333 Departmentalagenciesandaccounts 880009 - - 880009 880009 - 100,0 866333 866333
TOTAL 880 009 - - 880 009 880 009 - 100,0 866 333 866 333
Department of Tourism - Vote 35
appRopRiation statementfor the year ended 31 March 2015
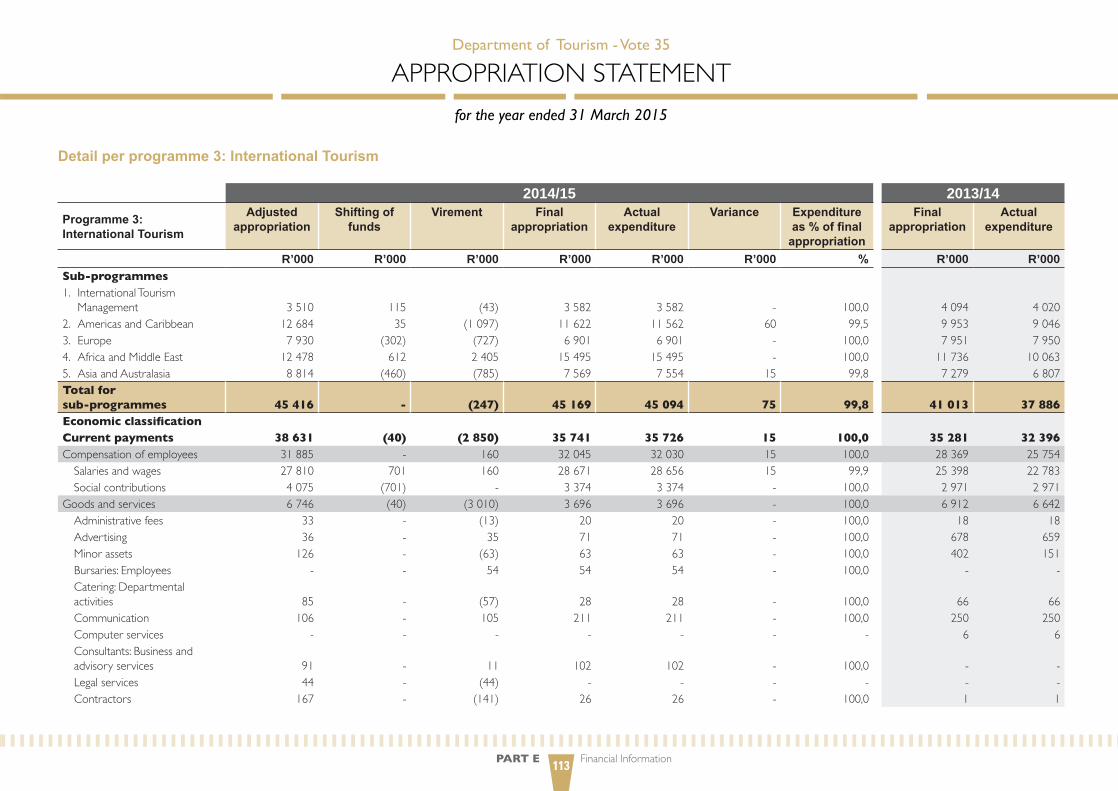
PART E Financial Information113
Detail per programme 3: International Tourism
2014/15 2013/14Programme 3: International Tourism
Adjusted appropriation
Shifting of funds
Virement Final appropriation
Actual expenditure
Variance Expenditure as % of final
appropriation
Final appropriation
Actual expenditure
R’000 R’000 R’000 R’000 R’000 R’000 % R’000 R’000Sub-programmes1. InternationalTourismManagement 3510 115 (43) 3582 3582 - 100,0 4094 4020
2. AmericasandCaribbean 12684 35 (1097) 11622 11562 60 99,5 9953 90463. Europe 7930 (302) (727) 6901 6901 - 100,0 7951 79504. AfricaandMiddleEast 12478 612 2405 15495 15495 - 100,0 11736 100635. AsiaandAustralasia 8 814 (460) (785) 7569 7554 15 99,8 7279 6807Total for sub-programmes 45 416 - (247) 45 169 45 094 75 99,8 41 013 37 886 Economic classificationCurrent payments 38 631 (40) (2 850) 35 741 35 726 15 100,0 35 281 32 396 Compensationofemployees 31 885 - 160 32045 32030 15 100,0 28369 25754Salariesandwages 27810 701 160 28671 28656 15 99,9 25398 22783Socialcontributions 4075 (701) - 3374 3374 - 100,0 2971 2971
Goodsandservices 6746 (40) (3010) 3696 3696 - 100,0 6912 6642Administrativefees 33 - (13) 20 20 - 100,0 18 18 Advertising 36 - 35 71 71 - 100,0 678 659Minorassets 126 - (63) 63 63 - 100,0 402 151 Bursaries:Employees - - 54 54 54 - 100,0 - - Catering:Departmentalactivities 85 - (57) 28 28 - 100,0 66 66Communication 106 - 105 211 211 - 100,0 250 250Computerservices - - - - - - - 6 6Consultants:Businessandadvisoryservices 91 - 11 102 102 - 100,0 - - legalservices 44 - (44) - - - - - - Contractors 167 - (141) 26 26 - 100,0 1 1
Department of Tourism - Vote 35
appRopRiation statementfor the year ended 31 March 2015

Department of Tourism Annual Report 2014/15114
2014/15 2013/14Programme 3: International Tourism
Adjusted appropriation
Shifting of funds
Virement Final appropriation
Actual expenditure
Variance Expenditure as % of final
appropriation
Final appropriation
Actual expenditure
R’000 R’000 R’000 R’000 R’000 R’000 % R’000 R’000Agencyandsupport/outsourcedservices 9 - (3) 6 6 - 100,0 - - Entertainment 52 - (52) - - - - 2 2Fleetservices - - 1 1 1 - 100,0 - - Consumablesupplies 324 - (242) 82 82 - 100,0 179 179Consumables:Stationery,printingandofficesupplies 214 - 136 350 350 - 100,0 613 613Propertypayments 1 - - 1 1 - 100,0 - - Travelandsubsistence 3896 (40) (1892) 1964 1964 - 100,0 3394 3394Traininganddevelopment 336 - (189) 147 147 - 100,0 613 613Operatingpayments 752 - (306) 446 446 - 100,0 425 425Venuesandfacilities 411 - (287) 124 124 - 100,0 265 265Rentalandhiring 63 - (63) - - - - - -
Transfers and subsidies 5 864 40 2 748 8 652 8 592 60 99,3 5 026 4 909 Foreigngovernmentsandinternationalorganisations 5864 - 2748 8612 8552 60 99,3 4930 4 813 Households - 40 - 40 40 - 100,0 96 96Socialbenefits - 40 - 40 40 - 100,0 96 96
Payments for capital assets 921 - (147) 774 774 - 100,0 706 581 Machineryandequipment 921 - (147) 774 774 - 100,0 687 562Transportequipment 104 (7) (97) - - - - - - Othermachineryandequipment 817 7 (50) 774 774 - 100,0 687 562
Intangibleassets - - - - - - - 19 19Payments for financial assets - - 2 2 2 - 100,0 - - TOTAL 45 416 - (247) 45 169 45 094 75 99,8 41 013 37 886
Department of Tourism - Vote 35
appRopRiation statementfor the year ended 31 March 2015
Detail per programme 3: International Tourism - continued
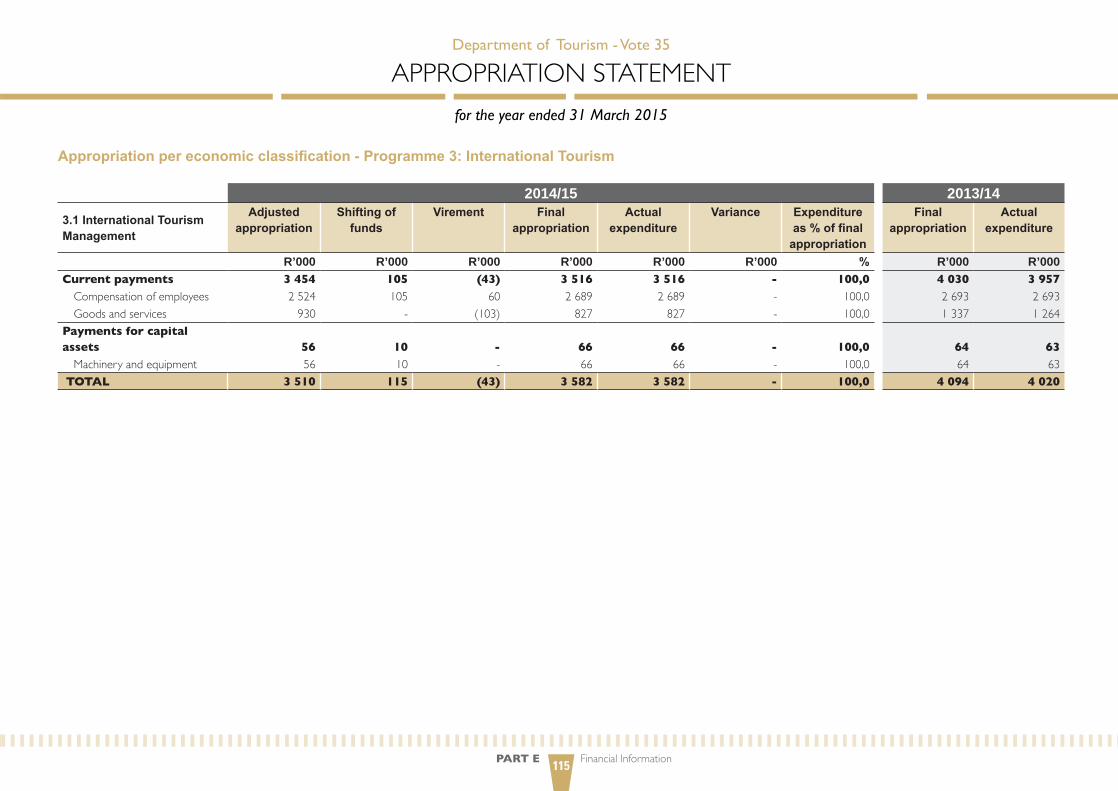
PART E Financial Information115
Appropriation per economic classification - Programme 3: International Tourism
2014/15 2013/14
3.1 International Tourism Management
Adjusted appropriation
Shifting of funds
Virement Final appropriation
Actual expenditure
Variance Expenditure as % of final
appropriation
Final appropriation
Actual expenditure
R’000 R’000 R’000 R’000 R’000 R’000 % R’000 R’000Current payments 3 454 105 (43) 3 516 3 516 - 100,0 4 030 3 957 Compensationofemployees 2524 105 60 2689 2689 - 100,0 2693 2693Goodsandservices 930 - (103) 827 827 - 100,0 1337 1264
Payments for capital assets 56 10 - 66 66 - 100,0 64 63 Machineryandequipment 56 10 - 66 66 - 100,0 64 63
TOTAL 3 510 115 (43) 3 582 3 582 - 100,0 4 094 4 020
Department of Tourism - Vote 35
appRopRiation statementfor the year ended 31 March 2015
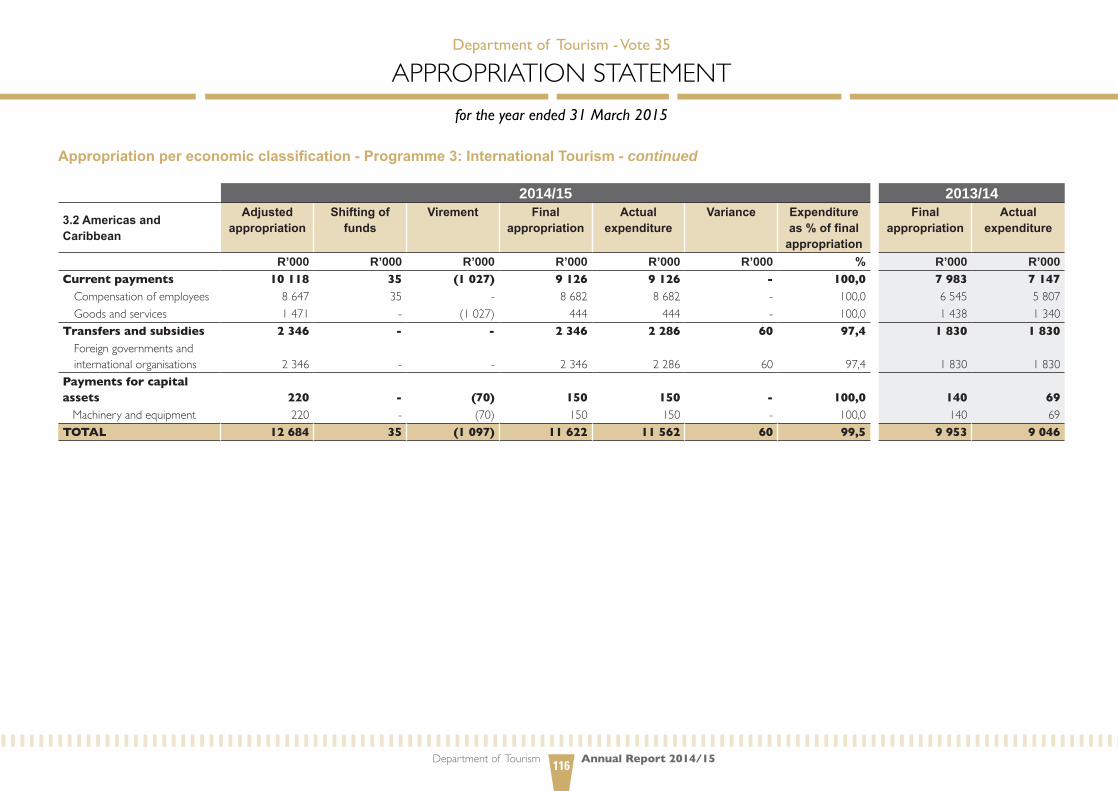
Department of Tourism Annual Report 2014/15116
Appropriation per economic classification - Programme 3: International Tourism - continued
2014/15 2013/14
3.2 Americas and Caribbean
Adjusted appropriation
Shifting of funds
Virement Final appropriation
Actual expenditure
Variance Expenditure as % of final
appropriation
Final appropriation
Actual expenditure
R’000 R’000 R’000 R’000 R’000 R’000 % R’000 R’000Current payments 10 118 35 (1 027) 9 126 9 126 - 100,0 7 983 7 147 Compensationofemployees 8647 35 - 8682 8682 - 100,0 6545 5807Goodsandservices 1471 - (1027) 444 444 - 100,0 1 438 1340
Transfers and subsidies 2 346 - - 2 346 2 286 60 97,4 1 830 1 830 Foreigngovernmentsandinternationalorganisations 2346 - - 2346 2286 60 97,4 1830 1830
Payments for capital assets 220 - (70) 150 150 - 100,0 140 69 Machineryandequipment 220 - (70) 150 150 - 100,0 140 69TOTAL 12 684 35 (1 097) 11 622 11 562 60 99,5 9 953 9 046
Department of Tourism - Vote 35
appRopRiation statementfor the year ended 31 March 2015

PART E Financial Information117
Appropriation per economic classification - Programme 3: International Tourism - continued
2014/15 2013/14
3.3 EuropeAdjusted
appropriationShifting of
fundsVirement Final
appropriationActual
expenditureVariance Expenditure
as % of final appropriation
Final appropriation
Actual expenditure
R’000 R’000 R’000 R’000 R’000 R’000 % R’000 R’000Current payments 7 715 (342) (698) 6 675 6 675 - 100,0 7 684 7 683 Compensationofemployees 6129 (302) 50 5877 5877 - 100,0 6142 6141Goodsandservices 1586 (40) (748) 798 798 - 100,0 1542 1542
Transfers and subsidies - 40 - 40 40 - 100,0 56 56 Households - 40 - 40 40 - 100,0 56 56
Payments for capital assets 215 - (29) 186 186 - 100,0 211 211 Machineryandequipment 215 - (29) 186 186 - 100,0 192 192Softwareandotherintangibleassets - - - - - - - 19 19
TOTAL 7 930 (302) (727) 6 901 6 901 100,0 7 951 7 950
Department of Tourism - Vote 35
appRopRiation statementfor the year ended 31 March 2015
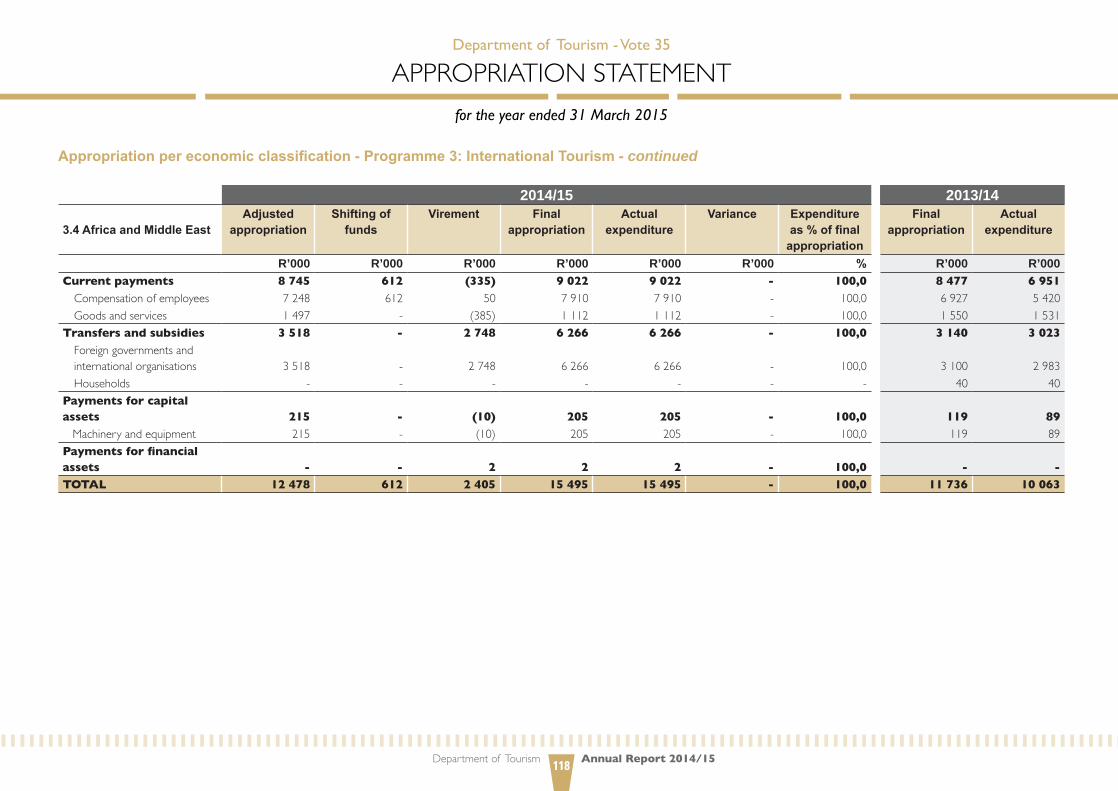
Department of Tourism Annual Report 2014/15118
Appropriation per economic classification - Programme 3: International Tourism - continued
2014/15 2013/14
3.4 Africa and Middle EastAdjusted
appropriationShifting of
fundsVirement Final
appropriationActual
expenditureVariance Expenditure
as % of final appropriation
Final appropriation
Actual expenditure
R’000 R’000 R’000 R’000 R’000 R’000 % R’000 R’000Current payments 8 745 612 (335) 9 022 9 022 - 100,0 8 477 6 951 Compensationofemployees 7248 612 50 7910 7910 - 100,0 6927 5420Goodsandservices 1497 - (385) 1112 1112 - 100,0 1550 1 531
Transfers and subsidies 3 518 - 2 748 6 266 6 266 - 100,0 3 140 3 023 Foreigngovernmentsandinternationalorganisations 3 518 - 2748 6266 6266 - 100,0 3100 2983Households - - - - - - - 40 40
Payments for capital assets 215 - (10) 205 205 - 100,0 119 89 Machineryandequipment 215 - (10) 205 205 - 100,0 119 89Payments for financial assets - - 2 2 2 - 100,0 - - TOTAL 12 478 612 2 405 15 495 15 495 - 100,0 11 736 10 063
Department of Tourism - Vote 35
appRopRiation statementfor the year ended 31 March 2015

PART E Financial Information119
Appropriation per economic classification - Programme 3: International Tourism - continued
2014/15 2013/14
3.5 Asia and AustralasiaAdjusted
appropriationShifting of
fundsVirement Final
appropriationActual
expenditureVariance Expenditure
as % of final appropriation
Final appropriation
Actual expenditure
R’000 R’000 R’000 R’000 R’000 R’000 % R’000 R’000Current payments 8 599 (450) (747) 7 402 7 387 15 99,8 7 107 6 658 Compensationofemployees 7337 (450) - 6887 6872 15 99,8 6062 5693Goodsandservices 1262 - (747) 515 515 - 100,0 1045 965
Payments for capital assets 215 (10) (38) 167 167 - 100,0 172 149 Machineryandequipment 215 (10) (38) 167 167 - 100,0 172 149TOTAL 8 814 (460) (785) 7 569 7 554 15 99,8 7 279 6 807
Department of Tourism - Vote 35
appRopRiation statementfor the year ended 31 March 2015
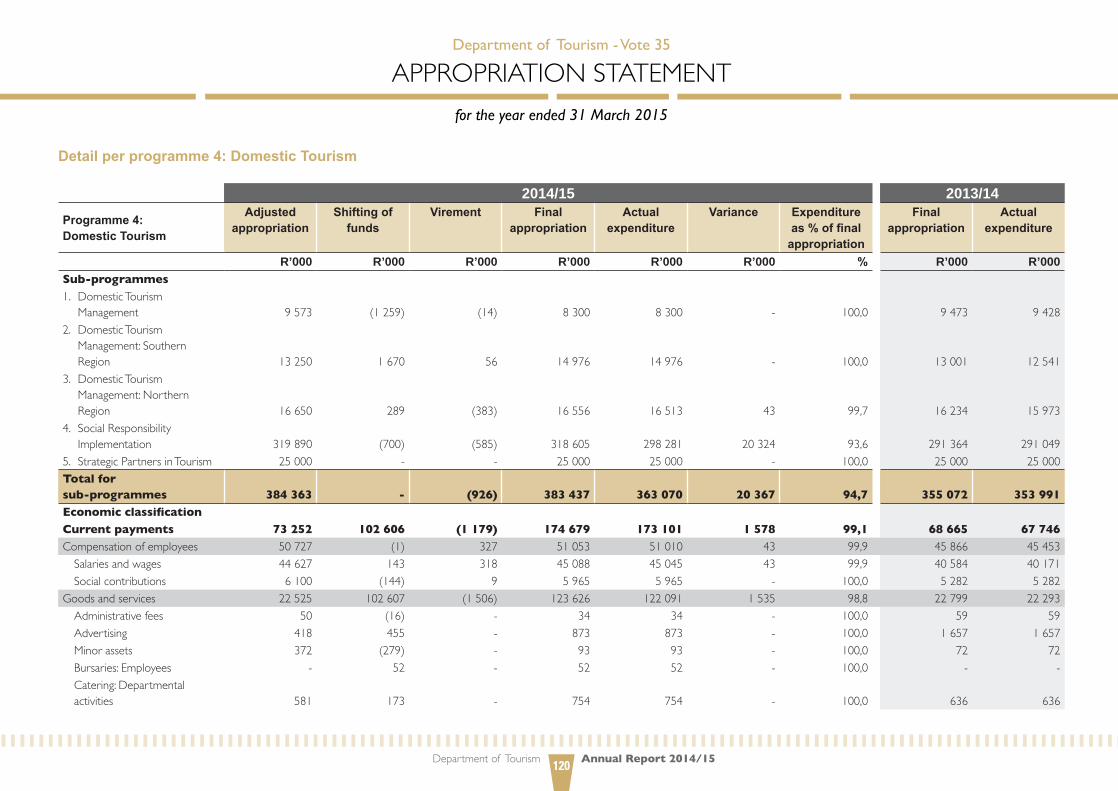
Department of Tourism Annual Report 2014/15120
Detail per programme 4: Domestic Tourism
2014/15 2013/14
Programme 4: Domestic Tourism
Adjusted appropriation
Shifting of funds
Virement Final appropriation
Actual expenditure
Variance Expenditure as % of final
appropriation
Final appropriation
Actual expenditure
R’000 R’000 R’000 R’000 R’000 R’000 % R’000 R’000Sub-programmes1. DomesticTourismManagement 9573 (1259) (14) 8300 8300 - 100,0 9473 9428
2. DomesticTourismManagement:SouthernRegion 13250 1670 56 14976 14976 - 100,0 13001 12541
3. DomesticTourismManagement:NorthernRegion 16650 289 (383) 16556 16513 43 99,7 16234 15973
4. SocialResponsibilityImplementation 319890 (700) (585) 318605 298281 20324 93,6 291364 291049
5. StrategicPartnersinTourism 25000 - - 25000 25000 - 100,0 25000 25000Total for sub-programmes 384 363 - (926) 383 437 363 070 20 367 94,7 355 072 353 991 Economic classification Current payments 73 252 102 606 (1 179) 174 679 173 101 1 578 99,1 68 665 67 746 Compensationofemployees 50727 (1) 327 51053 51010 43 99,9 45866 45 453 Salariesandwages 44627 143 318 45088 45045 43 99,9 40584 40171Socialcontributions 6100 (144) 9 5965 5965 - 100,0 5282 5282
Goodsandservices 22525 102607 (1506) 123626 122091 1 535 98,8 22799 22293Administrativefees 50 (16) - 34 34 - 100,0 59 59Advertising 418 455 - 873 873 - 100,0 1657 1657Minorassets 372 (279) - 93 93 - 100,0 72 72Bursaries:Employees - 52 - 52 52 - 100,0 - - Catering:Departmentalactivities 581 173 - 754 754 - 100,0 636 636
Department of Tourism - Vote 35
appRopRiation statementfor the year ended 31 March 2015
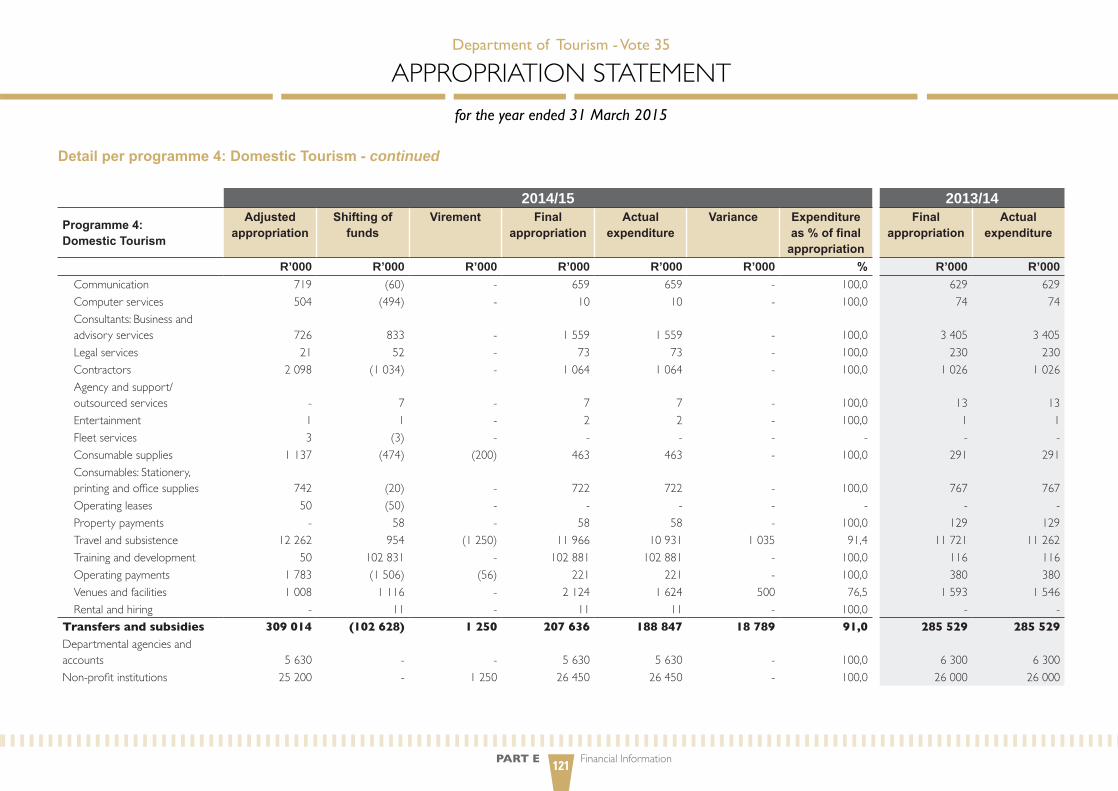
PART E Financial Information121
2014/15 2013/14
Programme 4: Domestic Tourism
Adjusted appropriation
Shifting of funds
Virement Final appropriation
Actual expenditure
Variance Expenditure as % of final
appropriation
Final appropriation
Actual expenditure
R’000 R’000 R’000 R’000 R’000 R’000 % R’000 R’000Communication 719 (60) - 659 659 - 100,0 629 629Computerservices 504 (494) - 10 10 - 100,0 74 74Consultants:Businessandadvisoryservices 726 833 - 1559 1559 - 100,0 3405 3405legalservices 21 52 - 73 73 - 100,0 230 230Contractors 2098 (1034) - 1064 1064 - 100,0 1026 1026Agencyandsupport/outsourcedservices - 7 - 7 7 - 100,0 13 13 Entertainment 1 1 - 2 2 - 100,0 1 1 Fleetservices 3 (3) - - - - - - - Consumablesupplies 1137 (474) (200) 463 463 - 100,0 291 291Consumables:Stationery,printingandofficesupplies 742 (20) - 722 722 - 100,0 767 767Operatingleases 50 (50) - - - - - - - Propertypayments - 58 - 58 58 - 100,0 129 129Travelandsubsistence 12262 954 (1250) 11966 10931 1035 91,4 11721 11262Traininganddevelopment 50 102831 - 102881 102881 - 100,0 116 116Operatingpayments 1783 (1506) (56) 221 221 - 100,0 380 380Venuesandfacilities 1008 1116 - 2124 1624 500 76,5 1593 1546Rentalandhiring - 11 - 11 11 - 100,0 - -
Transfers and subsidies 309 014 (102 628) 1 250 207 636 188 847 18 789 91,0 285 529 285 529 Departmentalagenciesandaccounts 5630 - - 5630 5630 - 100,0 6300 6300Non-profitinstitutions 25200 - 1250 26450 26450 - 100,0 26000 26000
Department of Tourism - Vote 35
appRopRiation statementfor the year ended 31 March 2015
Detail per programme 4: Domestic Tourism - continued

Department of Tourism Annual Report 2014/15122
2014/15 2013/14
Programme 4: Domestic Tourism
Adjusted appropriation
Shifting of funds
Virement Final appropriation
Actual expenditure
Variance Expenditure as % of final
appropriation
Final appropriation
Actual expenditure
R’000 R’000 R’000 R’000 R’000 R’000 % R’000 R’000Households 278184 (102628) - 175556 156767 18789 89,3 253229 253229Socialbenefits - 47 - 47 47 - 100,0 8 8 Othertransferstohouseholds 278184 (102675) - 175509 156720 18789 89,3 253221 253221
Payments for capital assets 2 097 1 (997) 1 101 1 101 - 100,0 868 706 Machineryandequipment 2035 63 (997) 1101 1101 - 100,0 847 685Transportequipment 219 16 (235) - - - 100,0 23 23Othermachineryandequipment 1816 47 (762) 1101 1101 - 100,0 824 662
Intangibleassets 62 (62) - - - - - 21 21Payments for financial assets - 21 - 21 21 - 100,0 10 10 TOTAL 384 363 - (926) 383 437 363 070 20 367 94,7 355 072 353 991
Department of Tourism - Vote 35
appRopRiation statementfor the year ended 31 March 2015
Detail per programme 4: Domestic Tourism - continued

PART E Financial Information123
Appropriation per economic classification - Programme 4: Domestic Tourism
2014/15 2013/14
4.1 Domestic Tourism Management
Adjusted appropriation
Shifting of funds
Virement Final appropriation
Actual expenditure
Variance Expenditure as % of final
appropriation
Final appropriation
Actual expenditure
R’000 R’000 R’000 R’000 R’000 R’000 % R’000 R’000Current payments 5 664 (1 262) - 4 402 4 402 - 100,0 4 997 4 952 Compensationofemployees 2725 (142) - 2583 2583 - 100,0 2668 2623Goodsandservices 2939 (1120) - 1819 1819 - 100,0 2329 2329
Transfers and subsidies 3 830 - - 3 830 3 830 - 100,0 4 300 4 300 Departmentalagenciesandaccounts 3630 - - 3630 3630 - 100,0 3300 3300Non-profitinstitutions 200 - - 200 200 - 100,0 1000 1000
Payments for capital assets 79 - (14) 65 65 - 100,0 176 176 Machineryandequipment 77 2 (14) 65 65 - 100,0 155 155 Intangibleassets 2 (2) - - - - - 21 21
Payments for financial assets - 3 - 3 3 - 100,0 - - TOTAL 9 573 (1 259) (14) 8 300 8 300 - 100,0 9 473 9 428
Department of Tourism - Vote 35
appRopRiation statementfor the year ended 31 March 2015
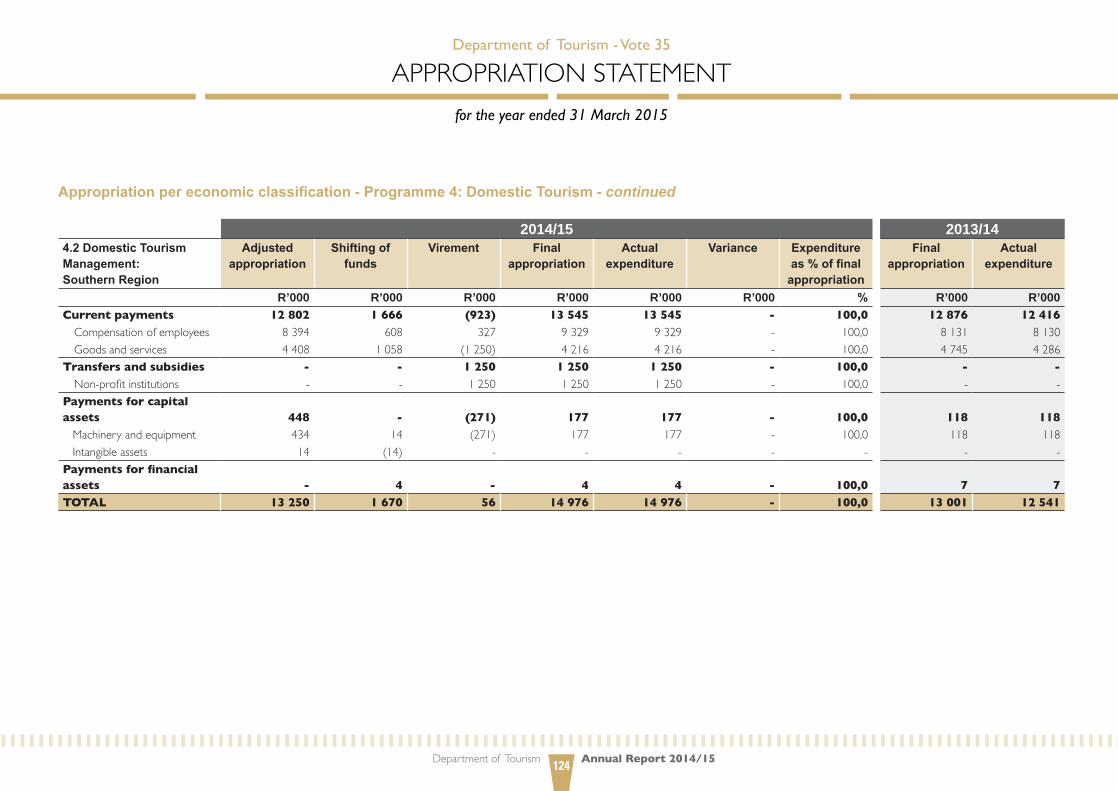
Department of Tourism Annual Report 2014/15124
Appropriation per economic classification - Programme 4: Domestic Tourism - continued
2014/15 2013/144.2 Domestic Tourism Management: Southern Region
Adjusted appropriation
Shifting of funds
Virement Final appropriation
Actual expenditure
Variance Expenditure as % of final
appropriation
Final appropriation
Actual expenditure
R’000 R’000 R’000 R’000 R’000 R’000 % R’000 R’000Current payments 12 802 1 666 (923) 13 545 13 545 - 100,0 12 876 12 416 Compensationofemployees 8394 608 327 9329 9329 - 100,0 8 131 8130Goodsandservices 4408 1058 (1250) 4216 4216 - 100,0 4745 4286
Transfers and subsidies - - 1 250 1 250 1 250 - 100,0 - - Non-profitinstitutions - - 1250 1250 1250 - 100,0 - -
Payments for capital assets 448 - (271) 177 177 - 100,0 118 118 Machineryandequipment 434 14 (271) 177 177 - 100,0 118 118 Intangibleassets 14 (14) - - - - - - - Payments for financial assets - 4 - 4 4 - 100,0 7 7 TOTAL 13 250 1 670 56 14 976 14 976 - 100,0 13 001 12 541
Department of Tourism - Vote 35
appRopRiation statementfor the year ended 31 March 2015
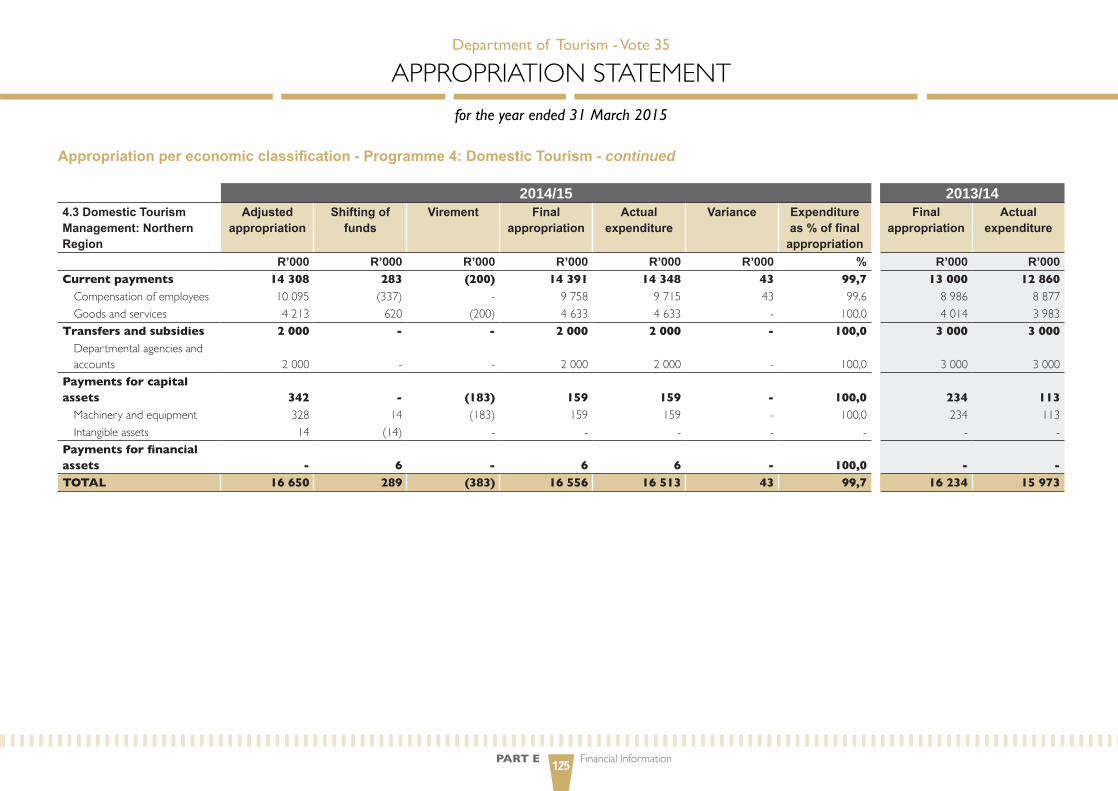
PART E Financial Information125
Appropriation per economic classification - Programme 4: Domestic Tourism - continued
2014/15 2013/144.3 Domestic Tourism Management: Northern Region
Adjusted appropriation
Shifting of funds
Virement Final appropriation
Actual expenditure
Variance Expenditure as % of final
appropriation
Final appropriation
Actual expenditure
R’000 R’000 R’000 R’000 R’000 R’000 % R’000 R’000Current payments 14 308 283 (200) 14 391 14 348 43 99,7 13 000 12 860 Compensationofemployees 10095 (337) - 9758 9715 43 99,6 8986 8877Goodsandservices 4213 620 (200) 4633 4633 - 100,0 4014 3983
Transfers and subsidies 2 000 - - 2 000 2 000 - 100,0 3 000 3 000 Departmentalagenciesandaccounts 2000 - - 2000 2000 - 100,0 3000 3000
Payments for capital assets 342 - (183) 159 159 - 100,0 234 113 Machineryandequipment 328 14 (183) 159 159 - 100,0 234 113 Intangibleassets 14 (14) - - - - - - -
Payments for financial assets - 6 - 6 6 - 100,0 - - TOTAL 16 650 289 (383) 16 556 16 513 43 99,7 16 234 15 973
Department of Tourism - Vote 35
appRopRiation statementfor the year ended 31 March 2015

Department of Tourism Annual Report 2014/15126
Appropriation per economic classification - Programme 4: Domestic Tourism - continued
2014/15 2013/14
4.4 Social Responsibility Implementation
Adjusted appropriation
Shifting of funds
Virement Final appropriation
Actual expenditure
Variance Expenditure as % of final
appropriation
Final appropriation
Actual expenditure
R’000 R’000 R’000 R’000 R’000 R’000 % R’000 R’000Current payments 40 478 101 919 (56) 142 341 140 806 1 535 99,0 37 792 37 518 Compensationofemployees 29513 (130) - 29383 29383 - 100,0 26081 25823Goodsandservices 10965 102049 (56) 112958 111423 1 535 98,6 11711 11695
Transfers and subsidies 278 184 (102 628) - 175 556 156 767 18 789 89,3 253 229 253 229 Households 278184 (102628) - 175556 156767 18789 89,3 253229 253229
Payments for capital assets 1 228 1 (529) 700 700 - 100,0 340 299 Machineryandequipment 1196 33 (529) 700 700 - 100,0 340 299Intangibleassets 32 (32) - - - - - - -
Payments for financial assets - 8 - 8 8 - 100,0 3 3 TOTAL 319 890 (700) (585) 318 605 298 281 20 324 93,6 291 364 291 049
Department of Tourism - Vote 35
appRopRiation statementfor the year ended 31 March 2015

PART E Financial Information127
Appropriation per economic classification - Programme 4: Domestic Tourism - continued
2014/15 2013/14
4.5 Strategic Partners in Tourism
Adjusted appropriation
Shifting of funds
Virement Final appropriation
Actual expenditure
Variance Expenditure as % of final
appropriation
Final appropriation
Actual expenditure
R’000 R’000 R’000 R’000 R’000 R’000 % R’000 R’000Transfers and subsidies 25 000 - - 25 000 25 000 - 100,0 25 000 25 000 Non-profitinstitutions 25000 - - 25000 25000 - 100,0 25000 25000
TOTAL 25 000 - - 25 000 25 000 - 100,0 25 000 25 000
Department of Tourism - Vote 35
appRopRiation statementfor the year ended 31 March 2015

Department of Tourism Annual Report 2014/15128
1. Details of transfers and subsidies as per Appropriation Act (after virement)
Detailsofthesetransactionscanbeviewedinthenote“Transfersandsubsidies”,aswellasAnnexure1(A-E)totheannualfinancialstatements.
2. Details of specifically and exclusively appropriated amounts voted (after virement)
Detailsofthesetransactionscanbeviewedinnote1,“Annualappropriation”,totheannualfinancialstatements.
3. Details on payments for financial assets
Detailsofthesetransactionsperprogrammecanbeviewedinthenote“Paymentsforfinancialassets”totheannualfinancialstatements.
4. Explanations of material variances from amounts voted (after virement)
4.1 Per programmeFinal appropriation Actual expenditure Variance Variance as a % of final
appropriation
R’000 R’000 R’000 %Programme 1: AdministrationGoodsandservices 96602 91939 4663 4,83Programme 3: International TourismTransfersandsubsidies 8652 8592
60 0,69
Programme 4: Domestic Tourism
Goodsandservices 123626 122091 1 535 1,24Transfersandsubsidies 207636 188847 18789 9,05
Department of Tourism - Vote 35
notes to the appRopRiation statementfor the year ended 31 March 2015
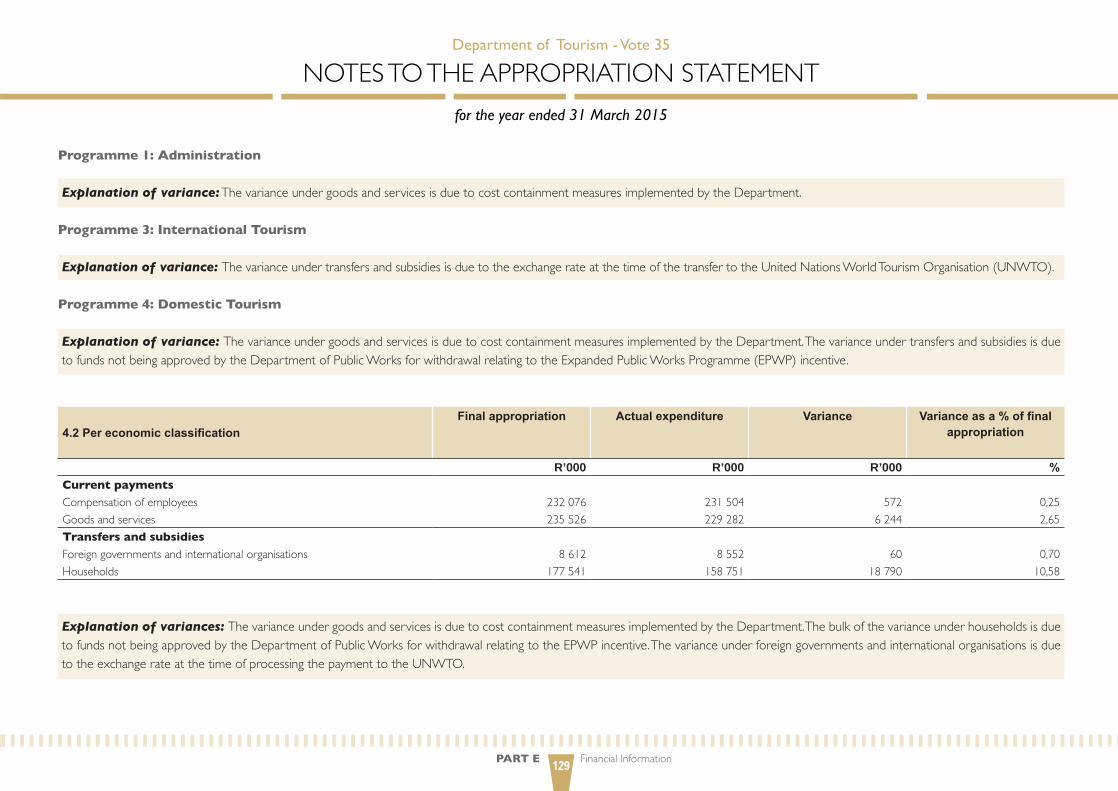
PART E Financial Information129
Programme 1: Administration
Explanation of variance:ThevarianceundergoodsandservicesisduetocostcontainmentmeasuresimplementedbytheDepartment.
Programme 3: International Tourism
Explanation of variance: ThevarianceundertransfersandsubsidiesisduetotheexchangerateatthetimeofthetransfertotheunitedNationsWorldTourismOrganisation(uNWTO).
Programme 4: Domestic Tourism
Explanation of variance: ThevarianceundergoodsandservicesisduetocostcontainmentmeasuresimplementedbytheDepartment.ThevarianceundertransfersandsubsidiesisduetofundsnotbeingapprovedbytheDepartmentofPublicWorksforwithdrawalrelatingtotheExpandedPublicWorksProgramme(EPWP)incentive.
4.2 Per economic classificationFinal appropriation Actual expenditure Variance Variance as a % of final
appropriation
R’000 R’000 R’000 %Current paymentsCompensationofemployees 232076 231504 572 0,25Goodsandservices 235526 229282 6244 2,65Transfers and subsidies
Foreigngovernmentsandinternationalorganisations 8612 8552 60 0,70Households 177541 158751 18790 10,58
Explanation of variances: ThevarianceundergoodsandservicesisduetocostcontainmentmeasuresimplementedbytheDepartment.ThebulkofthevarianceunderhouseholdsisduetofundsnotbeingapprovedbytheDepartmentofPublicWorksforwithdrawalrelatingtotheEPWPincentive.ThevarianceunderforeigngovernmentsandinternationalorganisationsisduetotheexchangerateatthetimeofprocessingthepaymenttotheuNWTO.
Department of Tourism - Vote 35
notes to the appRopRiation statementfor the year ended 31 March 2015

Department of Tourism Annual Report 2014/15130
Note 2014/15 2013/14R’000 R’000
REVENUEAnnualappropriation 1 1583260
35049600
1520574Departmentalrevenue 2 4209Aidassistance 3 -TOTAL REVENUE 1 596 364 1 524 783
EXPENDITURECurrent expenditureCompensationofemployees 4 231504 202371Goodsandservices 5 229282 138 434Total current expenditure 460 786 340 805
Transfers and subsidiesTransfersandsubsidies 7 1083730 1160115Aidassistance 3 4800 -Total transfers and subsidies 1 088 530 1 160 115
Expenditure for capital assetsTangibleassets 8 10718 10330Intangibleassets 8 2098 1299Total expenditure for capital assets 12 816 11 629
Payments for financial assets 8 262 118
TOTAL EXPENDITURE 1 562 394 1 512 667
SURPLUS/(DEFICIT) FOR THE YEAR 33 970 12 116
Reconciliation of net surplus/(deficit) for the yearVotedfunds 25666 7907Annualappropriation 25666 7907
Departmentalrevenue 13 3504 4209Aidassistance 3 4800 -SURPLUS/(DEFICIT) FOR THE YEAR 33 970 12 116
Department of Tourism - Vote 35
STATEMENTOFFINANCIAlPERFORMANCEfor the year ended 31 March 2015
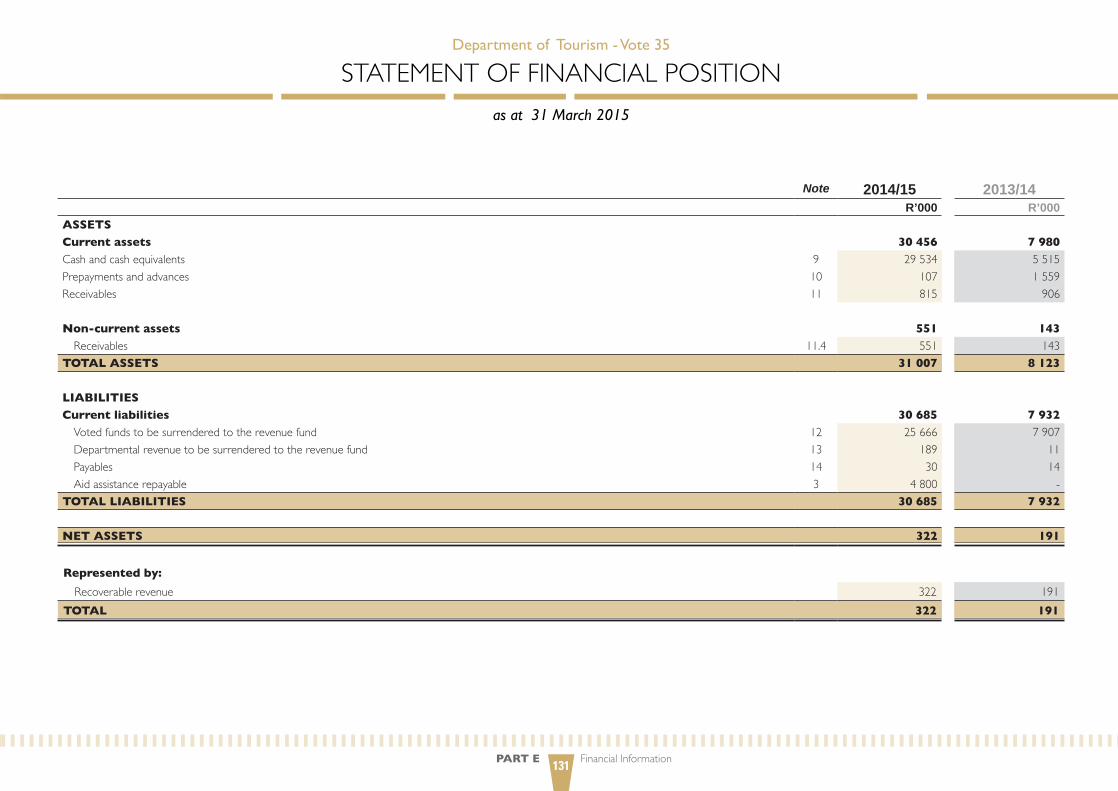
PART E Financial Information131
Note 2014/15 2013/14R’000 R’000
ASSETS Current assets 30 456 7 980Cashandcashequivalents 9 29534 5 515Prepaymentsandadvances 10 107 1559Receivables 11 815 906 Non-current assets 551 143Receivables 11.4 551 143
TOTAL ASSETS 31 007 8 123
LIABILITIESCurrent liabilities 30 685 7 932Votedfundstobesurrenderedtotherevenuefund 12 25666 7907Departmentalrevenuetobesurrenderedtotherevenuefund 13 189 11Payables 14 30 14Aidassistancerepayable 3 4800 -
TOTAL LIABILITIES 30 685 7 932
NET ASSETS 322 191
Represented by:
Recoverablerevenue 322 191TOTAL 322 191
Department of Tourism - Vote 35
STATEMENTOFFINANCIAlPOSITIONas at 31 March 2015

Department of Tourism Annual Report 2014/15132
Note 2014/15 2013/14R’000 R’000
Recoverable revenue
Openingbalance 191 100Transfers: 131 91
Debtsrecovered(includedindepartmentalreceipts) (36) (28)Debtsraised 167 119
Closingbalance 322 191TOTAL 322 191
Department of Tourism - Vote 35
STATEMENTOFCHANGESINNETASSETSfor the year ended 31 March 2015
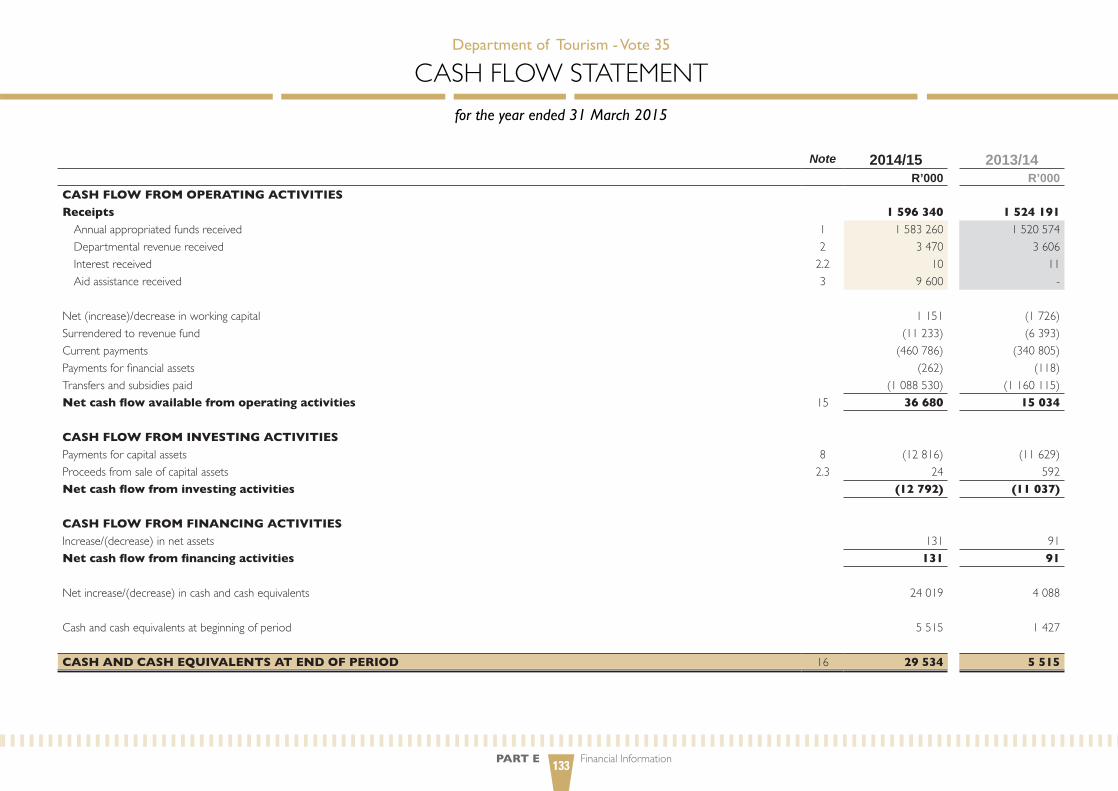
PART E Financial Information133
Note 2014/15 2013/14R’000 R’000
CASH FLOW FROM OPERATING ACTIVITIESReceipts 1 596 340 1 524 191Annualappropriatedfundsreceived 1 1583260 1520574Departmentalrevenuereceived 2 3470 3606Interestreceived 2.2 10 11Aidassistancereceived 3 9600 -
Net(increase)/decreaseinworkingcapital 1 151 (1726)Surrenderedtorevenuefund (11233) (6393)Currentpayments (460786) (340805)Paymentsforfinancialassets (262) (118)Transfersandsubsidiespaid (1088530) (1160115)Net cash flow available from operating activities 15 36 680 15 034
CASH FLOW FROM INVESTING ACTIVITIESPaymentsforcapitalassets 8 (12816) (11629)Proceedsfromsaleofcapitalassets 2.3 24 592Net cash flow from investing activities (12 792) (11 037)
CASH FLOW FROM FINANCING ACTIVITIESIncrease/(decrease)innetassets 131 91Net cash flow from financing activities 131 91
Netincrease/(decrease)incashandcashequivalents 24019 4088
Cashandcashequivalentsatbeginningofperiod 5 515 1427
CASH AND CASH EQUIVALENTS AT END OF PERIOD 16 29 534 5 515
Department of Tourism - Vote 35
CASHFlOWSTATEMENTfor the year ended 31 March 2015
Department of Tourism Annual Report 2014/15134
Summary of significant accounting policies
Thefinancialstatementshavebeenpreparedinaccordancewiththefollowingpolicies,whichhavebeenappliedconsistentlyinallmaterialaspects,unlessindicatedotherwise.
Thehistoricalcostconventionhasbeenused,exceptwhereindicatedotherwise.Managementhasusedassessmentsandestimates inpreparing theannualfinancial statements.Thesearebasedonthebestinformationavailableatthetimeofpreparation.
Whereappropriateandmeaningful,additionalinformationhasbeendisclosedtoenhancetheusefulnessofthefinancialstatementsandtocomplywiththestatutoryrequirementsofthePublicFinanceManagementAct(PFMA),Act1of1999(asamendedbyAct29of1999),andtheTreasuryregulationsissuedintermsofthePFMA.
1. Basis of preparation ThefinancialstatementshavebeenpreparedinaccordancewiththeModifiedCashStandard.
2. Going concern Thefinancialstatementshavebeenpreparedonagoing-concernbasis.
3. Presentation currencyAmountshavebeenpresented inthecurrencyofSouthAfricanrand(R),which isalsothefunctionalcurrencyoftheDepartment.
4. Rounding unlessotherwisestated,financialfigureshavebeenroundedtothenearestonethousandrand(R’000).
5. Foreign-currency translationCashflowarisingfromforeign-currencytransactionsistranslatedintoSouthAfricanrand,usingtheexchangeratesprevailingatthedateofpayment/receipt.
6. Comparative information
6.1 Prior-period comparative information Prior-period comparative information has been presented in the current year’s financialstatements. Wherenecessary,figures included in theprior-periodfinancial statementshavebeenreclassifiedtoensurethattheformatinwhichtheinformationispresentedisconsistentwiththeformatofthecurrentyear’sfinancialstatements.
6.2 Current-year comparison with budget Acomparisonbetweentheapproved,finalbudgetandactualamountsforeachprogrammeandeconomicclassificationisincludedintheappropriationstatement.
7. Revenue
7.1 Appropriated fundsAppropriated fundscomprisedepartmentalallocationsaswellasdirectchargesagainst therevenuefund(i.e.statutoryappropriation).
Appropriated funds are recognised in the statement of financial performance on the datewhen theappropriationbecomeseffective.Adjustmentsmade in termsof the adjustmentsbudgetprocessarerecognisedinthestatementoffinancialperformanceonthedatewhentheadjustmentsbecomeeffective.
The net amount of any appropriated funds due to/from the relevant revenue fund at thereportingdateisrecognisedasapayable/receivableinthestatementoffinancialposition. 7.2 Departmental revenue Departmentalrevenueisrecognisedinthestatementoffinancialperformancewhenreceivedandissubsequentlypaidintotherelevantrevenuefund,unlessstatedotherwise.
Department of Tourism - Vote 35
ACCOuNTINGPOlICIESfor the year ended 31 March 2015

PART E Financial Information135
Any amount owing to the relevant revenue fund at the reporting date is recognised as apayableinthestatementoffinancialposition.
7.3 Accrued departmental revenue Accrualsinrespectofdepartmentalrevenue(excludingtaxrevenue)arerecordedinthenotestothefinancialstatementswhen:
• itisprobablethattheeconomicbenefitsorservicepotentialassociatedwiththetransactionwillflowtotheDepartment;and
• theamountofrevenuecanbemeasuredreliably.
Theaccruedrevenueismeasuredatthefairvalueoftheconsiderationreceivable.
Accruedtaxrevenue(andrelatedinterestandpenalties)ismeasuredatamountsreceivablefromcollectingagents.
8. Expenditure
8.1 Compensation of employees
8.1.1 Salaries and wagesSalariesandwagesarerecognisedinthestatementoffinancialperformanceonthedateofpayment.
8.1.2 Social contributionsSocialcontributionsmadebytheDepartmentinrespectofcurrentemployeesarerecognisedinthestatementoffinancialperformanceonthedateofpayment.
Social contributionsmadeby theDepartment in respectof ex-employees are classified astransferstohouseholdsinthestatementoffinancialperformanceonthedateofpayment.
8.2 Other expenditureOther expenditure (such as goods and services, transfers and subsidies, and payments forcapitalassets)isrecognisedinthestatementoffinancialperformanceonthedateofpayment.Theexpenseisclassifiedasacapitalexpenseifthetotalconsiderationpaidismorethanthecapitalisationthreshold.
8.3 Accrued expenditure payableAccruedexpenditurepayableisrecordedinthenotestothefinancialstatementswhenthegoodsarereceivedor,inthecaseofservices,whentheyarerenderedtotheDepartment.
Accruedexpenditurepayableismeasuredatcost.
8.4 Leases
8.4.1 Operating leasesOperating lease payments made during the reporting period are recognised as currentexpenditureinthestatementoffinancialperformanceonthedateofpayment.
Theoperatingleasecommitmentsarerecordedinthenotestothefinancialstatements.
8.4.2 Finance leases Financeleasepaymentsmadeduringthereportingperiodarerecognisedascapitalexpenditureinthestatementoffinancialperformanceonthedateofpayment.
Thefinanceleasecommitmentsarerecordedinthenotestothefinancialstatementsandarenotapportionedbetweenthecapitalandinterestportions.
Financeleaseassetsacquiredattheendoftheleasetermarerecordedandmeasuredatthelowerof:• cost,beingthefairvalueoftheasset;or
Department of Tourism - Vote 35
ACCOuNTINGPOlICIESfor the year ended 31 March 2015

Department of Tourism Annual Report 2014/15136
• thesumoftheminimumleasepaymentsmade,includinganypaymentsmadetoacquireownershipattheendoftheleaseterm,excludinginterest.
9. Aid assistance
9.1 Aid assistance receivedAidassistancereceivedincashisrecognisedinthestatementoffinancialperformancewhenreceived.In-kindaidassistanceisrecordedinthenotestothefinancialstatementsonthedateofreceiptandismeasuredatfairvalue.
Aidassistancenot spent for the intendedpurposeaswell asanyunutilised funds fromaidassistancethatarerequiredtoberefundedtothedonorarerecognisedasapayableinthestatementoffinancialposition.
9.2 Aid assistance paidAidassistancepaid is recognised in the statementof financial performanceon thedateofpayment.Aid assistance paymentsmade prior to the receipt of funds are recognised as areceivableinthestatementoffinancialposition.
10. Cash and cash equivalentsCashandcashequivalentsarestatedatcostinthestatementoffinancialposition.
Bankoverdraftsareshownseparatelyonthefaceofthestatementoffinancialposition.
Forthepurposesofthecashflowstatement,cashandcashequivalentscomprisecashonhand,depositsheld,othershort-termhighlyliquidinvestmentsandbankoverdrafts.
11. Prepayments and advancesPrepayments and advances are recognised in the statement of financial positionwhen theDepartmentreceivesordisbursesthecash.
Prepaymentsandadvancesareinitiallyandsubsequentlymeasuredatcost.
Prepaymentsareexpensedaspertheserviceprovideragreement.
12. Loans and receivablesloansandreceivablesarerecognisedinthestatementoffinancialpositionatcost,plusaccruedinterestwhereinterestischarged,lessamountsalreadysettledorwrittenoff.
13. InvestmentsInvestmentsarerecognisedinthestatementoffinancialpositionatcost.
14. Impairment of financial assetsWherethereisanindicationofimpairmentofafinancialasset,anestimationofthereductionintherecordedcarryingvalue,whichistoreflectthebestestimateoftheamountofthefutureeconomicbenefitsexpectedtobereceivedfromthatasset,isrecordedinthenotestothefinancialstatements.
15. Payablesloansandpayablesarerecognisedinthestatementoffinancialpositionatcost.
16. Capital assets
16.1 Immovable capital assetsImmovablecapitalassetsareinitiallyrecordedinthenotestothefinancialstatementsatcost.Immovablecapitalassetsacquiredthroughanon-exchangetransactionismeasuredatfairvalueasatthedateofacquisition.
Wherethecostofimmovablecapitalassetscannotbedeterminedaccurately,theimmovablecapitalassetsaremeasuredatR1,unlessthefairvalueoftheassethasbeenreliablyestimated,inwhichcasethefairvalueisused.
Department of Tourism - Vote 35
ACCOuNTINGPOlICIESfor the year ended 31 March 2015

PART E Financial Information137
All assetsacquiredprior to1April2002 (ora laterdateasapprovedby theofficeof theAccountant-General)mayberecordedatR1.
Immovablecapitalassetsaresubsequentlycarriedatcostandarenotsubjecttodepreciationorimpairment.
Subsequentexpenditureofacapitalnatureisaddedtothecostoftheassetattheendofthecapitalproject,unlesstheimmovableassetisrecordedbyanotherdepartment,inwhichcasethecompletedprojectcostsaretransferredtothatdepartment.
16.2 Movable capital assetsMovablecapitalassetsare initially recorded inthenotestothefinancial statementsatcost.Movablecapitalassetsacquiredthroughanon-exchangetransactionismeasuredatfairvalueasatthedateofacquisition.
Wherethecostofmovablecapitalassetscannotbedeterminedaccurately,themovablecapitalassetsaremeasuredat fairvalue,andwhere fairvaluecannotbedetermined, themovableassetsaremeasuredatR1.
All assetsacquiredprior to1April2002 (ora laterdateasapprovedby theofficeof theAccountant-General)mayberecordedatR1.
Movablecapitalassetsaresubsequentlycarriedatcostandarenotsubjecttodepreciationorimpairment.
Subsequentexpenditureofacapitalnatureisaddedtothecostoftheassetattheendofthecapitalproject,unlessthemovableasset isrecordedbyanotherdepartment/entity, inwhichcasethecompletedprojectcostsaretransferredtothatdepartment.
16.3 Intangible assetsIntangibleassetsareinitiallyrecordedinthenotestothefinancialstatementsatcost.Intangibleassetsacquiredthroughanon-exchangetransactionaremeasuredatfairvalueasatthedateofacquisition.
Internally generated intangible assets are recorded in thenotes to thefinancial statementswhentheDepartmentcommenceswiththedevelopmentphaseoftheproject.
Where the costof intangible assets cannotbedeterminedaccurately, the intangible capitalassetsaremeasuredatfairvalue,andwherefairvaluecannotbedetermined,theintangibleassetsaremeasuredatR1.
All assetsacquiredprior to1April2002 (ora laterdateasapprovedby theofficeof theAccountant-General)mayberecordedatR1.
Intangible assets are subsequently carried at cost and are not subject to depreciation orimpairment.
Subsequentexpenditureofacapitalnatureisaddedtothecostoftheassetattheendofthecapitalproject,unlesstheintangibleassetisrecordedbyanotherdepartment/entity,inwhichcasethecompletedprojectcostsaretransferredtothatdepartment.
17. Provisions and contingents
17.1 ProvisionsProvisionsarerecordedinthenotestothefinancialstatementswhenthereisapresentlegalorconstructiveobligationtoforfeiteconomicbenefitsasaresultofeventsinthepast,anditisprobablethatanoutflowofresourcesembodyingeconomicbenefitsorservicepotentialwillberequiredtosettletheobligation,andareliableestimateoftheobligationcanbemade.Theprovisionismeasuredasthebestestimateofthefundsrequiredtosettlethepresentobligationatthereportingdate.
Department of Tourism - Vote 35
ACCOuNTINGPOlICIESfor the year ended 31 March 2015

Department of Tourism Annual Report 2014/15138
17.2 Contingent liabilitiesContingent liabilities are recorded in thenotes to thefinancial statementswhen there is apossibleobligationthatarisesfrompastevents,theexistenceofwhichwillbeconfirmedonlybytheoccurrenceornon-occurrenceofoneormoreuncertainfutureeventsnotwithintheDepartment’scontrol,orwhenthereisapresentobligationthatisnotrecognisedbecauseitisnotprobablethatanoutflowofresourceswillberequiredtosettletheobligation,ortheamountoftheobligationcannotbemeasuredreliably.
17.3 Contingent assetsContingentassetsarerecordedinthenotestothefinancialstatementswhenapossibleassetarisesfrompastevents,theexistenceofwhichwillbeconfirmedbytheoccurrenceornon-occurrenceofoneormoreuncertainfutureeventsnotwithintheDepartment’scontrol.
17.4 Commitments Commitments are recordedat cost in thenotes to thefinancial statementswhen there isa contractual arrangement or an approval bymanagement in amanner that raises a validexpectation that theDepartmentwill discharge its responsibilities, thereby incurring futureexpenditurethatwillresultintheoutflowofcash.
18. Unauthorised expenditureunauthorisedexpenditureisrecognisedinthestatementoffinancialpositionuntilsuchtimeastheexpenditureis:• approvedbyParliamentwithfunding,andtherelatedfundsarereceived;or• approvedbyParliamentwithoutfundingandiswrittenoffagainsttheappropriationinthe
statementoffinancialperformance;or• transferredtoreceivablesforrecovery.
unauthorised expenditure is measured at the amount of the confirmed unauthorisedexpenditure.
19. Fruitless and wasteful expenditureFruitlessandwastefulexpenditureisrecordedinthenotestothefinancialstatementswhenconfirmed.Theamountrecordedisequaltothetotalvalueofthefruitlessand/orwastefulexpenditureincurred.
Fruitlessandwastefulexpenditureisremovedfromthenotestothefinancialstatementswhenitisresolvedortransferredtoreceivablesforrecovery.
Fruitlessandwastefulexpenditurereceivablesaremeasuredattheamountthatisexpectedtoberecoverableandarede-recognisedwhensettledorsubsequentlywrittenoffasirrecoverable.
20. Irregular expenditureIrregularexpenditure is recorded in thenotes to thefinancial statementswhenconfirmed.Theamountrecordedisequaltothevalueoftheirregularexpenditureincurred,unlessitisimpracticabletodetermine,inwhichcasereasonsforthisareprovidedinthenote.
Irregularexpenditureisremovedfromthenotewhenit iseithercondonedbytherelevantauthority,transferredtoreceivablesforrecovery,ornotcondonedandnotrecoverable. Irregular expenditure receivables are measured at the amount that is expected to berecoverableandarede-recognisedwhensettledorsubsequentlywrittenoffasirrecoverable.
21. Changes in accounting policies, accounting estimates and errorsChanges in accounting policies that are implemented by management have been appliedretrospectivelyinaccordancewithModifiedCashStandardrequirements,excepttotheextentthatitisimpracticabletodeterminetheperiod-specificorcumulativeeffectofthechangeinpolicy.Insuchinstances,theDepartmentshallrestatetheopeningbalancesofassets,liabilitiesandnetassetsfortheearliestperiodforwhichretrospectiverestatementispracticable.
ChangesinaccountingestimatesareappliedprospectivelyinaccordancewithModifiedCashStandardrequirements.
Department of Tourism - Vote 35
ACCOuNTINGPOlICIESfor the year ended 31 March 2015

PART E Financial Information139
Correction of errors is applied retrospectively in the period inwhich the error occurred,in accordance with Modified Cash Standard requirements, except to the extent that it isimpracticabletodeterminetheperiod-specificorcumulativeeffectoftheerror.Insuchcases,theDepartmentshallrestatetheopeningbalancesofassets,liabilitiesandnetassetsfortheearliestperiodforwhichretrospectiverestatementispracticable.
22. Events after the reporting dateEvents after the reportingdate that areclassifiedasadjustingeventshavebeenaccountedforinthefinancialstatements.Theeventsafterthereportingdatethatareclassifiedasnon-adjustingeventshavebeendisclosedinthenotestothefinancialstatements.
23. Departures from the Modified Cash Standard requirementsManagementconcludedthatthefinancialstatementspresentfairlytheDepartment’sprimaryandsecondary informationand that theDepartmentcompliedwith thestandard.NationalTreasury granted approval in terms of section 79 of the PFMA for the Department todepart fromtheModifiedCashStandard (MCS)with regard to theclassificationofEPWPinfrastructureprojects.
24. Capitalisation reserveThe capitalisation reserve comprises financial assets and/or liabilities originating in a priorreportingperiod,butwhicharerecognisedinthestatementoffinancialpositionforthefirsttime in thecurrent reportingperiod.Amountsare recognised in thecapitalisationreserveswhenidentifiedinthecurrentperiodandaretransferredtotheNationalRevenueFundwhentheunderlyingassetisdisposedofandtherelatedfundsarereceived.
25. Recoverable revenueAmountsarerecognisedasrecoverablerevenuewhenapaymentmadeinapreviousfinancialyear becomes recoverable from a debtor in the current financial year.Amounts are eithertransferredtotheNationalRevenueFundwhenrecoveredoraretransferredtothestatementoffinancialperformancewhenwrittenoff.
26. Related-party transactionsA related-party transaction is a transfer of resources, services or obligations between thereportingentityandarelatedparty.Related-partytransactionsarerecordedinthenotestothefinancialstatementswhenthetransactionisnotatarm’slength.
27. Key management personnelKey management personnel are those persons having the authority and responsibility forplanning,directingandcontrollingtheactivitiesoftheDepartment.TheSpecialAdvisortotheExecutingAuthority isnotpartof thekeymanagementpersonnelashe/sheshould refrainfrom interfering in theadministrationandmanagementof theDepartment.Thenumberofindividualsandtheirfullcompensationisrecordedinthenotestothefinancialstatements.
28. Inventories (effective from 1 April 2016)Atthedateofacquisition,inventoriesarerecordedatcostpriceinthenotestothefinancialstatements.
Whereinventoriesareacquiredaspartofanon-exchangetransaction,thecostofinventoryisitsfairvalueatthedateofacquisition.
Inventoriesaresubsequentlymeasuredatthe lowerofcostandnetrealisablevalue,orthelowerofcostandreplacementvalue.
Department of Tourism - Vote 35
ACCOuNTINGPOlICIESfor the year ended 31 March 2015
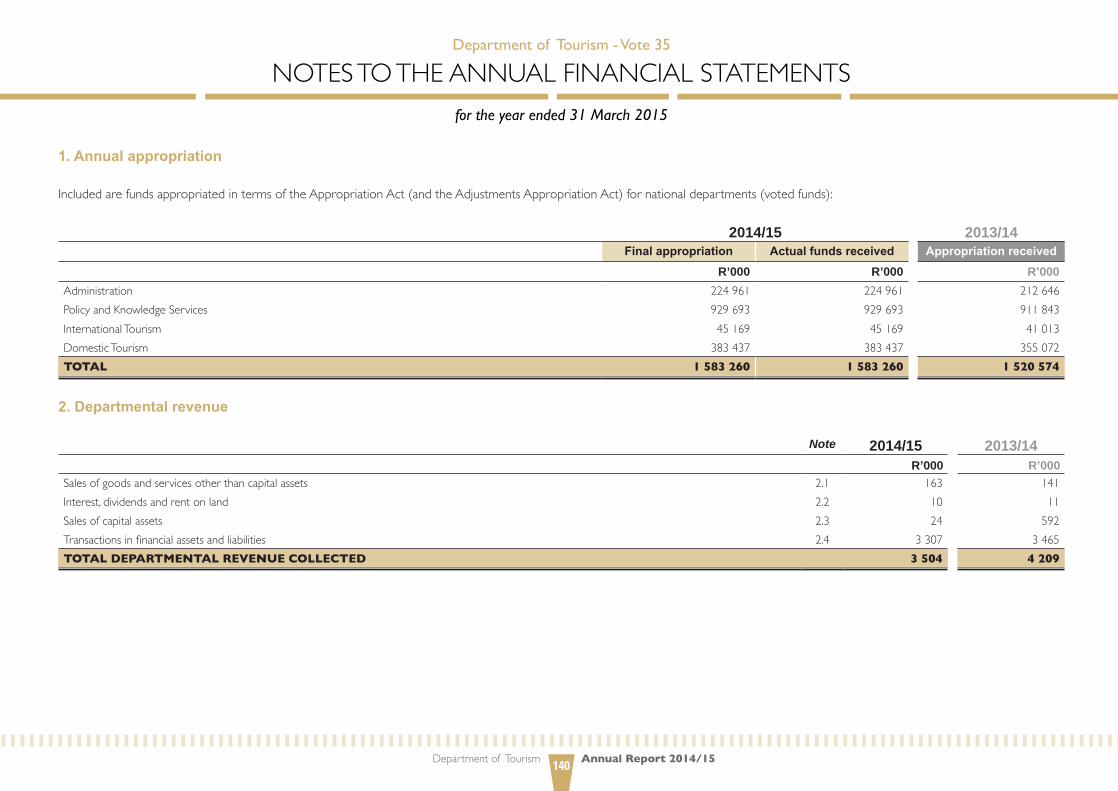
Department of Tourism Annual Report 2014/15140
1. Annual appropriation
IncludedarefundsappropriatedintermsoftheAppropriationAct(andtheAdjustmentsAppropriationAct)fornationaldepartments(votedfunds):
2014/15 2013/14Final appropriation Actual funds received Appropriation received
R’000 R’000 R’000Administration 224961 224961 212646PolicyandKnowledgeServices 929693 929693 911843InternationalTourism 45169 45169 41013DomesticTourism 383437 383437 355072TOTAL 1 583 260 1 583 260 1 520 574
2. Departmental revenue
Note 2014/15 2013/14R’000 R’000
Salesofgoodsandservicesotherthancapitalassets 2.1 163 141Interest,dividendsandrentonland 2.2 10 11Salesofcapitalassets 2.3 24 592Transactionsinfinancialassetsandliabilities 2.4 3307 3465TOTAL DEPARTMENTAL REVENUE COLLECTED 3 504 4 209
Department of Tourism - Vote 35
NOTESTOTHEANNuAlFINANCIAlSTATEMENTSfor the year ended 31 March 2015

PART E Financial Information141
2.1 Sales of goods and services other than capital assets
Note 2014/15 2013/142 R’000 R’000
SalesofgoodsandservicesproducedbytheDepartment 163 141Salesbymarketestablishment 84 69Othersales 79 72
TOTAL 163 141
2.2 Interest, dividends and rent on land
Note 2014/15 2013/142 R’000 R’000
Interest 10 11TOTAL 10 11
2.3 Sale of capital assets
Note 2014/15 2013/142 R’000 R’000
Tangible assets 24 592
Machineryandequipment 25.2 24 592TOTAL 24 592
Department of Tourism - Vote 35
NOTESTOTHEANNuAlFINANCIAlSTATEMENTSfor the year ended 31 March 2015

Department of Tourism Annual Report 2014/15142
2.4 Transactions in financial assets and liabilities
Note 2014/15 2013/142 R’000 R’000
Otherreceipts,includingrecoverablerevenue 3307 3465TOTAL 3 307 3 465
3. Aid assistance
2014/15 2013/14R’000 R’000
Openingbalance - -Transferredfromstatementoffinancialperformance 4800 -Paidduringtheyear - -CLOSING BALANCE 4 800 -
Note:RevenueofR9,6millionwasreceivedforthedinosaurproject.Theexpenditureforthe2014/15financialyearwasR4,8million.(SeeAnnexure1F)
3.1 Analysis of balance by source
Note 2014/15 2013/143 R’000 R’000
AidassistancefromReconstructionandDevelopmentProgramme(RDP) 4800 -CLOSING BALANCE 4 800 -
3.2 Analysis of balance
Note 2014/15 2013/143 R’000 R’000
Aidassistancerepayable 4800 -CLOSING BALANCE 4 800 -
Department of Tourism - Vote 35
NOTESTOTHEANNuAlFINANCIAlSTATEMENTSfor the year ended 31 March 2015
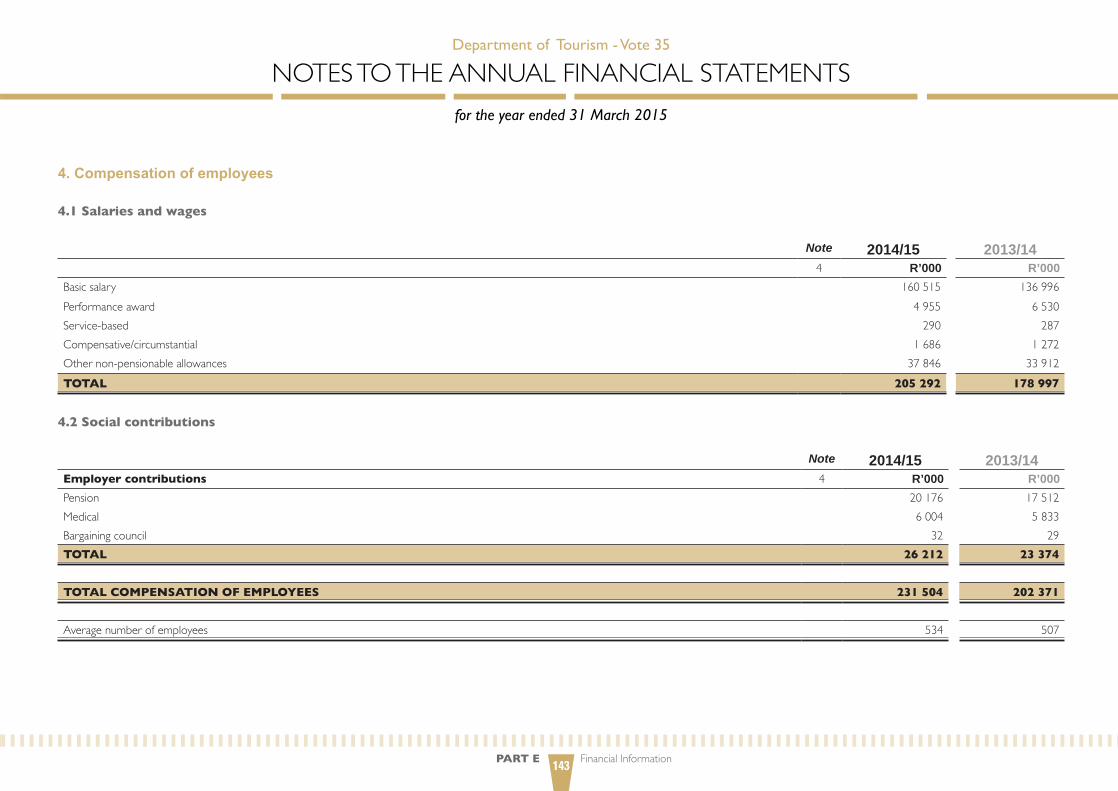
PART E Financial Information143
4. Compensation of employees
4.1 Salaries and wages
Note 2014/15 2013/144 R’000 R’000
Basicsalary 160515 136996Performanceaward 4955 6530Service-based 290 287Compensative/circumstantial 1686 1272Othernon-pensionableallowances 37846 33912TOTAL 205 292 178 997
4.2 Social contributions
Note 2014/15 2013/14Employer contributions 4 R’000 R’000Pension 20176 17512Medical 6004 5 833Bargainingcouncil 32 29TOTAL 26 212 23 374
TOTAL COMPENSATION OF EMPLOYEES 231 504 202 371
Averagenumberofemployees 534 507
Department of Tourism - Vote 35
NOTESTOTHEANNuAlFINANCIAlSTATEMENTSfor the year ended 31 March 2015

Department of Tourism Annual Report 2014/15144
5. Goods and services
Note 2014/15 2013/14R’000 R’000
Administrativefees 193 242Advertising 2854 4204Minorassets 5.1 558 891Bursaries(employees) 1063 783Catering 1709 1732Communication 5035 5203Computerservices 5.2 14 335 17145Consultants:Businessandadvisoryservices 3357 7321legalservices 493 235Contractors 2653 2578Agencyandsupport/outsourcedservices 3128 2586Entertainment 55 174Auditcost–external 5.3 4210 4197Fleetservices 1221 1241Consumables 5.4 6374 5714Operatingleases 32139 26894Rentalandhiring 120 -Propertypayments 5.5 2459 2188Travelandsubsistence 5.6 31169 41752Venuesandfacilities 4904 4628Traininganddevelopment 106173 3 551Otheroperatingexpenditure 5.7 5080 5175TOTAL 229 282 138 434
Note: The2013/14 amounts for administrative fees andpropertypaymentswere reclassified asper StandardChartofAccounts (SCOA)with themanagement/handling fees amount ofR1954962,35(note5.5).
Department of Tourism - Vote 35
NOTESTOTHEANNuAlFINANCIAlSTATEMENTSfor the year ended 31 March 2015
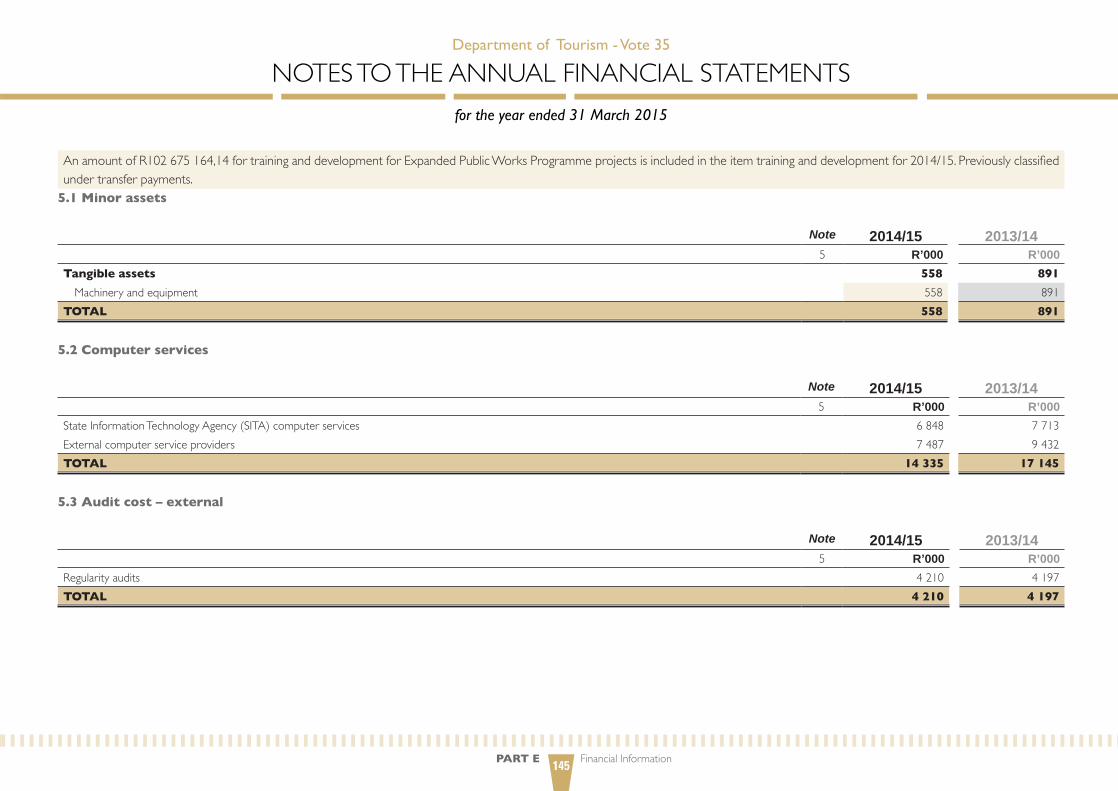
PART E Financial Information145
AnamountofR102675164,14fortraininganddevelopmentforExpandedPublicWorksProgrammeprojectsisincludedintheitemtraininganddevelopmentfor2014/15.Previouslyclassifiedundertransferpayments.
5.1 Minor assets
Note 2014/15 2013/145 R’000 R’000
Tangible assets 558 891
Machineryandequipment 558 891TOTAL 558 891
5.2 Computer services
Note 2014/15 2013/145 R’000 R’000
StateInformationTechnologyAgency(SITA)computerservices 6848 7713Externalcomputerserviceproviders 7487 9432TOTAL 14 335 17 145
5.3 Audit cost – external
Note 2014/15 2013/145 R’000 R’000
Regularityaudits 4210 4197TOTAL 4 210 4 197
Department of Tourism - Vote 35
NOTESTOTHEANNuAlFINANCIAlSTATEMENTSfor the year ended 31 March 2015
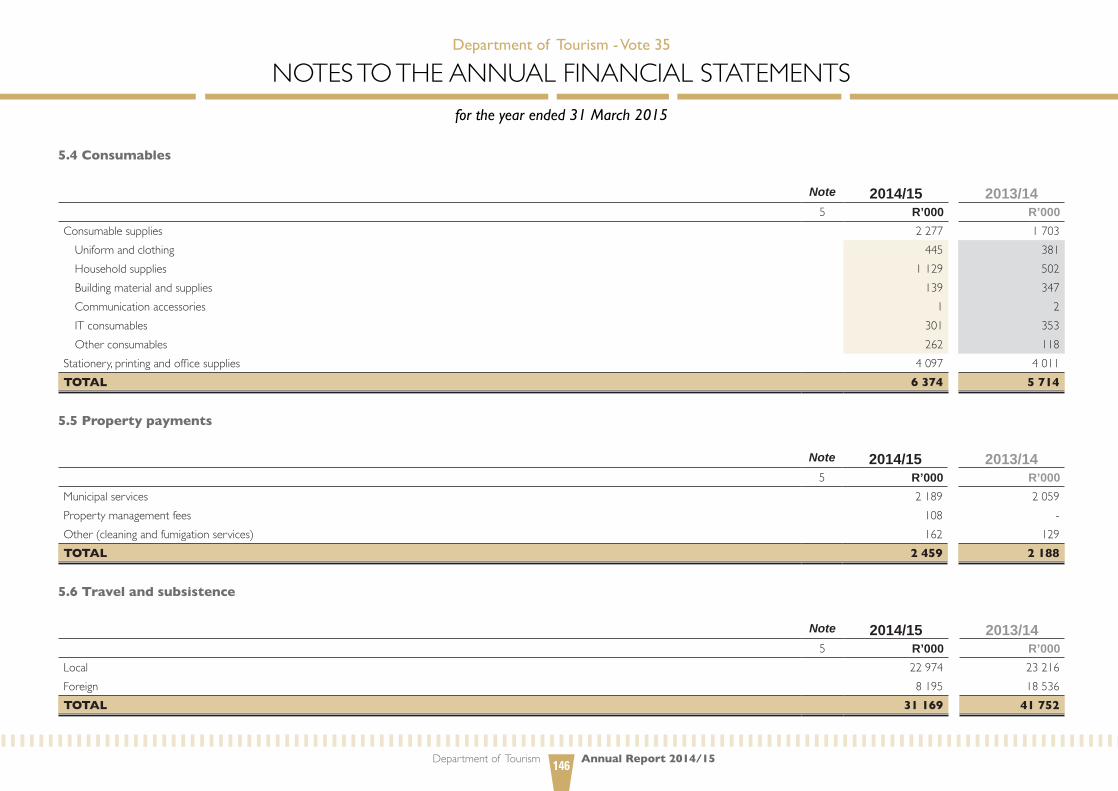
Department of Tourism Annual Report 2014/15146
5.4 Consumables
Note 2014/15 2013/145 R’000 R’000
Consumablesupplies 2277 1703uniformandclothing 445 381Householdsupplies 1129 502Buildingmaterialandsupplies 139 347Communicationaccessories 1 2ITconsumables 301 353Otherconsumables 262 118
Stationery,printingandofficesupplies 4097 4011TOTAL 6 374 5 714
5.5 Property payments
Note 2014/15 2013/145 R’000 R’000
Municipalservices 2189 2059Propertymanagementfees 108 -Other(cleaningandfumigationservices) 162 129TOTAL 2 459 2 188
5.6 Travel and subsistence
Note 2014/15 2013/145 R’000 R’000
local 22974 23216Foreign 8195 18536TOTAL 31 169 41 752
Department of Tourism - Vote 35
NOTESTOTHEANNuAlFINANCIAlSTATEMENTSfor the year ended 31 March 2015
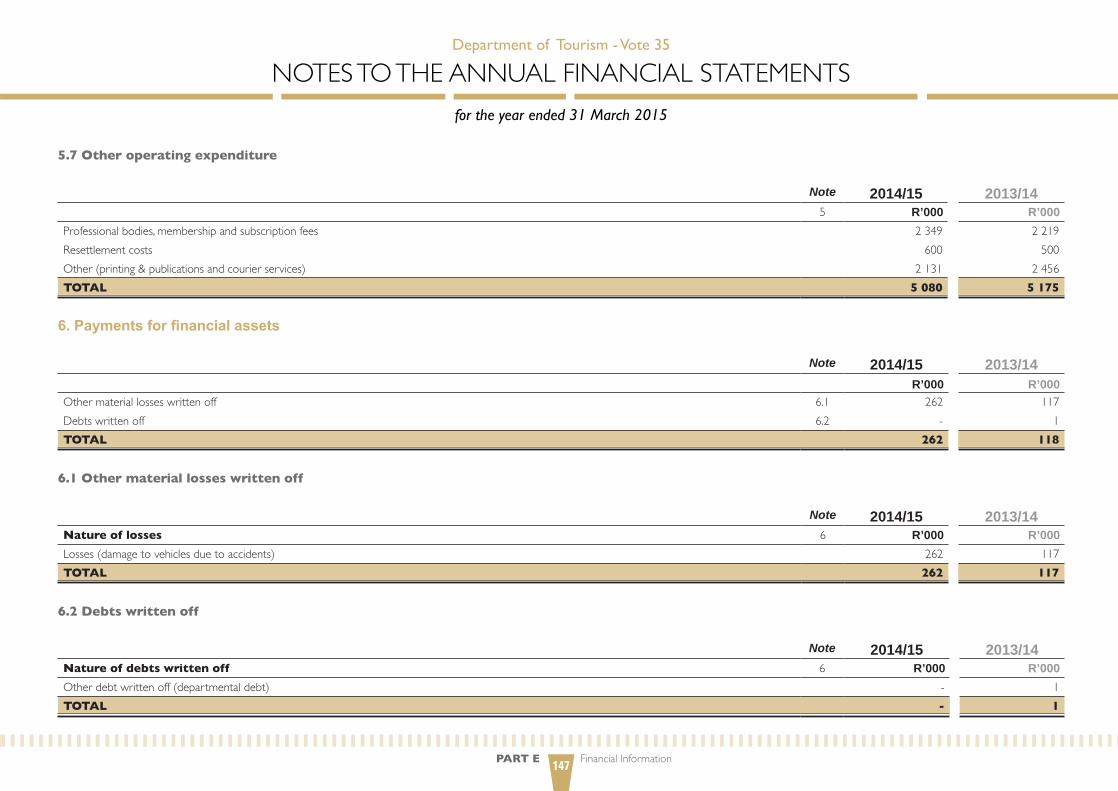
PART E Financial Information147
5.7 Other operating expenditure
Note 2014/15 2013/145 R’000 R’000
Professionalbodies,membershipandsubscriptionfees 2349 2219Resettlementcosts 600 500Other(printing&publicationsandcourierservices) 2131 2456TOTAL 5 080 5 175
6. Payments for financial assets
Note 2014/15 2013/14R’000 R’000
Othermateriallosseswrittenoff 6.1 262 117Debtswrittenoff 6.2 - 1TOTAL 262 118
6.1 Other material losses written off
Note 2014/15 2013/14Nature of losses 6 R’000 R’000losses(damagetovehiclesduetoaccidents) 262 117TOTAL 262 117
6.2 Debts written off
Note 2014/15 2013/14Nature of debts written off 6 R’000 R’000Otherdebtwrittenoff(departmentaldebt) - 1TOTAL - 1
Department of Tourism - Vote 35
NOTESTOTHEANNuAlFINANCIAlSTATEMENTSfor the year ended 31 March 2015
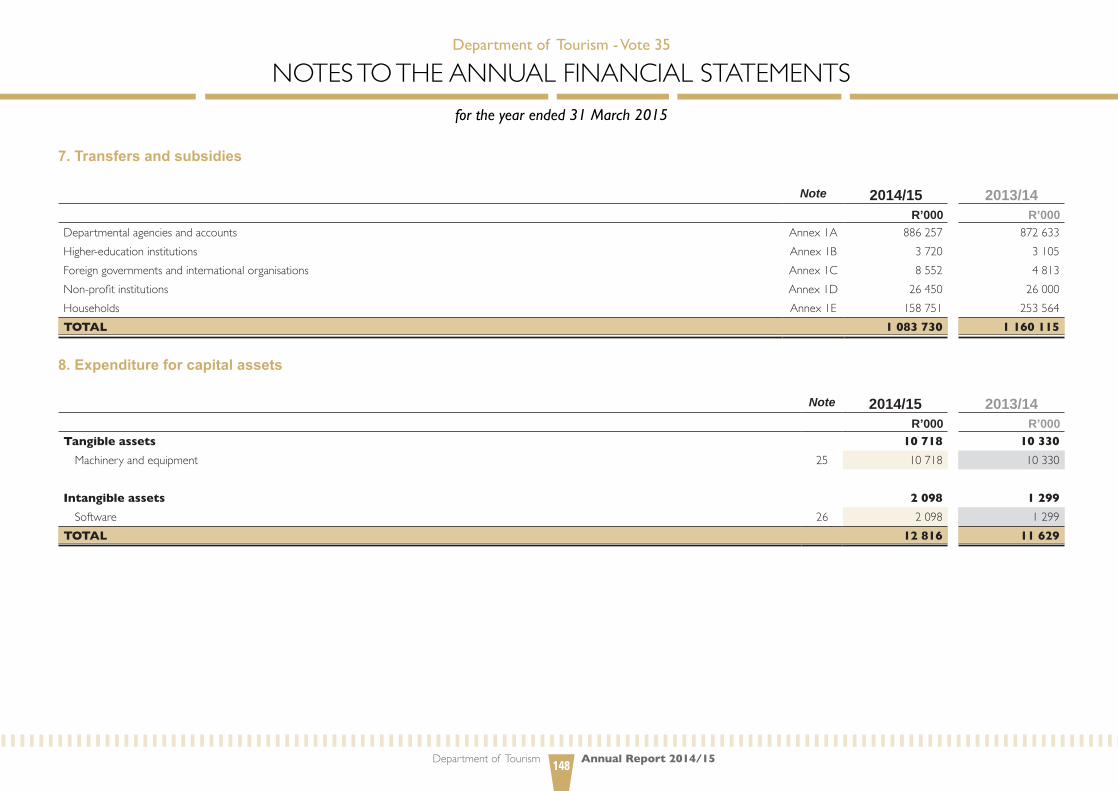
Department of Tourism Annual Report 2014/15148
7. Transfers and subsidies
Note 2014/15 2013/14R’000 R’000
Departmentalagenciesandaccounts Annex1A 886257 872633Higher-educationinstitutions Annex1B 3720 3105Foreigngovernmentsandinternationalorganisations Annex1C 8552 4 813Non-profitinstitutions Annex1D 26450 26000Households Annex1E 158751 253564TOTAL 1 083 730 1 160 115
8. Expenditure for capital assets
Note 2014/15 2013/14R’000 R’000
Tangible assets 10 718 10 330
Machineryandequipment 25 10718 10330
Intangible assets 2 098 1 299
Software 26 2098 1299TOTAL 12 816 11 629
Department of Tourism - Vote 35
NOTESTOTHEANNuAlFINANCIAlSTATEMENTSfor the year ended 31 March 2015

PART E Financial Information149
8.1 Analysis of voted funds utilised to acquire capital assets
2014/15 2013/14R’000 R’000
Tangible assets 10 718 10 330
Machineryandequipment 10718 10330
Intangible assets 2 098 1 299
Software 2098 1299TOTAL 12 816 11 629
8.2 Finance lease expenditure included in expenditure for capital assets
2014/15 2013/14R’000 R’000
Tangible assets
Machineryandequipment 1637 1524TOTAL 1 637 1 524
9. Cash and cash equivalents
2014/15 2013/14R’000 R’000
ConsolidatedPaymastergeneralaccount 35337 13008Cashreceipts 1 -Disbursements (5859) (7548)Cashonhand 55 55TOTAL 29 534 5 515
Note:AnamountofR35054,58waspaidintothedepartmentalbankaccount(ABSA)andtheinterfacewiththeDepartment’sPaymastergeneralaccounttookplaceon1April2015.AstheDepartmentisonmodifiedcashaccounting,thisamountisnotpartofthecashandcashequivalentasstatedabove.
Department of Tourism - Vote 35
NOTESTOTHEANNuAlFINANCIAlSTATEMENTSfor the year ended 31 March 2015

Department of Tourism Annual Report 2014/15150
10. Prepayments and advances
2014/15 2013/14R’000 R’000
Travelandsubsistence 57 251Prepayments 50 1308TOTAL 107 1 559
11. Receivables
2014/15 2013/14R’000 R’000 R’000 R’000 R’000
Note Less than one year One to three years Older than three years Total TotalClaimsrecoverable 11.1
Annex3360 - - 360 488
Recoverableexpenditure 11.2 63 - - 63 179Staffdebt 11.3 196 - - 196 239Otherdebtors 11.4 - 501 50 551 143Fruitlessandwastefulexpenditure 11.5 196 - - 196 -TOTAL 815 501 50 1 366 1 049
11.1 Claims recoverable
Note 2014/15 2013/1411 R’000 R’000
Nationaldepartments 215 13Provincialdepartments 72 245Publicentities 73 230TOTAL 360 488
Department of Tourism - Vote 35
NOTESTOTHEANNuAlFINANCIAlSTATEMENTSfor the year ended 31 March 2015

PART E Financial Information151
11.2 Recoverable expenditure (disallowance accounts)
Note 2014/15 2013/1411 R’000 R’000
Departmentalsuspenseaccount 63 179TOTAL 63 179
11.3 Staff debt
Note 2014/15 2013/1411 R’000 R’000
Departmentaldebtaccount 196 239TOTAL 196 239
11.4 Other debtors
Note 2014/15 2013/1411 R’000 R’000
Debtaccount–non-current 316 134Departmentalsuspenseaccounts–non-current 11 9Claimsrecoverable–publicentities–non-current 224 -TOTAL 551 143
11.5 Fruitless and wasteful expenditure
Note 2014/15 2013/1411 R’000 R’000
Openingbalance - -Transfersfromnote22.1,“Fruitlessandwastefulexpenditure” 196 -TOTAL 196 -
Department of Tourism - Vote 35
NOTESTOTHEANNuAlFINANCIAlSTATEMENTSfor the year ended 31 March 2015

Department of Tourism Annual Report 2014/15152
12. Voted funds to be surrendered to the revenue fund
2014/15 2013/14R’000 R’000
Openingbalance 7907 2184Transferfromstatementoffinancialperformance(asrestated) 25666 7907Paidduringtheyear (7907) (2184)CLOSING BALANCE 25 666 7 907
13. Departmental revenue to be surrendered to the revenue fund
2014/15 2013/14R’000 R’000
Openingbalance 11 11Transferfromstatementoffinancialperformance(asrestated) 3504 4209Paidduringtheyear (3326) (4209)CLOSING BALANCE 189 11
14. Payables – current
Note 2014/15 2013/14R’000 R’000
Otherpayables 14.1 30 14TOTAL 30 14
14.1 Other payables
Note 2014/15 2013/1414 R’000 R’000
Salary-relatedpayables 30 14TOTAL 30 14
Department of Tourism - Vote 35
NOTESTOTHEANNuAlFINANCIAlSTATEMENTSfor the year ended 31 March 2015

PART E Financial Information153
15. Net cash flow available from operating activities
2014/15 2013/14R’000 R’000
Netsurplus/(deficit)asperstatementoffinancialperformance 33970 12116Addbacknon-cash/cashmovementsnotdeemedoperatingactivities 2710 2918(Increase)/decreaseinreceivables–current (317) (345)(Increase)/decreaseinprepaymentsandadvances 1452 (1373)Increase/(decrease)inpayables–current 16 (8)Proceedsfromsaleofcapitalassets (24) (592)Expenditureoncapitalassets 12816 11629Surrenderedtorevenuefund (11233) (6393)Net cash flow generated by operating activities 36 680 15 034
16. Reconciliation of cash and cash equivalents for cash flow purposes
2014/15 2013/14R’000 R’000
ConsolidatedPaymastergeneralaccount 35337 13008Cashreceipts 1 -Disbursements (5859) (7548)Cashonhand 55 55TOTAL 29 534 5 515
Department of Tourism - Vote 35
NOTESTOTHEANNuAlFINANCIAlSTATEMENTSfor the year ended 31 March 2015

Department of Tourism Annual Report 2014/15154
17. Contingent liabilities and contingent assets
17.1 Contingent liabilities
Note 2014/15 2013/14R’000 R’000
Liable to Nature
Housingloanguarantees Employees Annex2A 26 26ClaimsagainsttheDepartment Annex2B 15215 15215Intergovernmentalpayables(unconfirmedbalances) Annex4 31 151TOTAL 15 272 15 392
TheDepartmenthasonlyonehousingguarantee.Thereisnopossibilityofanyoutfloworreimbursement.DuetothesensitivityofclaimsagainsttheDepartmentthatarecurrentlywithinthelegaldomain,noindicationcanbeprovidedonthepossibleoutfloworreimbursement.
17.2 Contingent assets
2014/15 2013/14Nature of contingent asset R’000 R’000NationalTourismCareersExpopartners/BlackMagic–terminationofcontractandreimbursementoftotalamountpaid 1083 1083BeenAroundGPAdvertConsultingCC–non-performance/breachofcontract 2805 2805TOTAL 3 888 3 888
Department of Tourism - Vote 35
NOTESTOTHEANNuAlFINANCIAlSTATEMENTSGfor the year ended 31 March 2015

PART E Financial Information155
18. Commitments
2014/15 2013/14R’000 R’000
Current expenditure
Approvedandcontracted 75728 24578Approvedandnotcontracted 25000 -
100728 24578Capital expenditure
Approvedandcontracted 871 2039871 2039
TOTAL COMMITMENTS 101 599 26 617
Three-yearcontractappointmentofanICTmanagedserviceproviderofSharePointsoftwaresupportandmaintenance.Three-yearcontractappointmentofanICTmanagedserviceproviderfordocumentconfigurationservicesandlivelink.ExpandedPublicWorksProgrammemulti-yearcontractpaymentsfortraining.
Department of Tourism - Vote 35
NOTESTOTHEANNuAlFINANCIAlSTATEMENTSfor the year ended 31 March 2015

Department of Tourism Annual Report 2014/15156
19. Accruals and payables not recognised
2014/15 2013/14R’000 R’000
Listed by economic classification 30 days 30+ days Total TotalGoodsandservices 2474 108 2582 3999Other(assetsandliabilities) 277 - 277 7Capitalassets 292 104 396 285TOTAL 3 043 212 3 255 4 291
2014/15 2013/14Listed by programme level R’000 R’000Administration 2079 3255PolicyandKnowledgeServices 194 394InternationalTourism 215 58DomesticTourism 490 577Other(assetsandliabilities) 277 7TOTAL 3 255 4 291
Confirmedbalanceswithotherdepartments Annex4 166 665TOTAL 166 665
Note:Materialaccruals(aboveR100000)relatetothefollowing:Auditfees R488279,18 Externalcomputerservices R379209,60StateAttorneyservices R134025,00 Domestictravel R260362,27Telephoneaccount R242699,83
Department of Tourism - Vote 35
NOTESTOTHEANNuAlFINANCIAlSTATEMENTSfor the year ended 31 March 2015
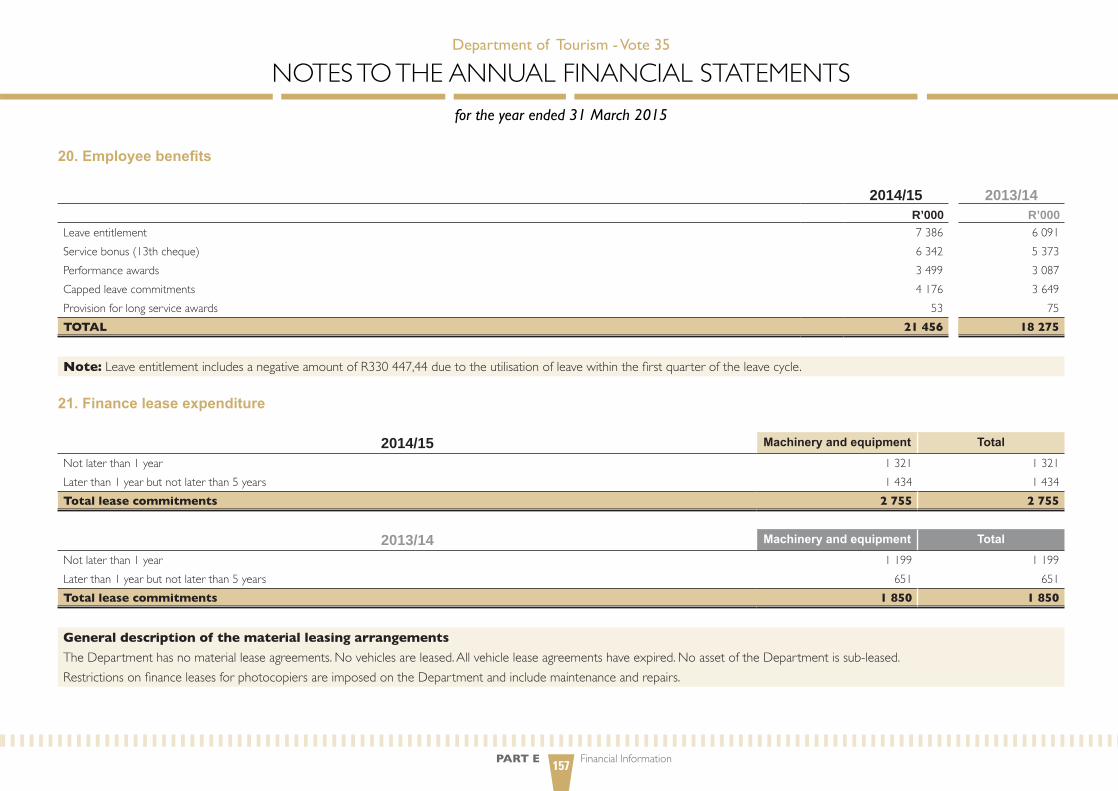
PART E Financial Information157
20. Employee benefits
2014/15 2013/14R’000 R’000
leaveentitlement 7386 6091Servicebonus(13thcheque) 6342 5373Performanceawards 3499 3087Cappedleavecommitments 4176 3649Provisionforlongserviceawards 53 75TOTAL 21 456 18 275
Note:leaveentitlementincludesanegativeamountofR330447,44duetotheutilisationofleavewithinthefirstquarteroftheleavecycle.
21. Finance lease expenditure
2014/15 Machinery and equipment Total
Notlaterthan1year 1321 1321laterthan1yearbutnotlaterthan5years 1 434 1 434Total lease commitments 2 755 2 755
2013/14 Machinery and equipment Total
Notlaterthan1year 1199 1199laterthan1yearbutnotlaterthan5years 651 651Total lease commitments 1 850 1 850
General description of the material leasing arrangements
TheDepartmenthasnomaterialleaseagreements.Novehiclesareleased.Allvehicleleaseagreementshaveexpired.NoassetoftheDepartmentissub-leased.RestrictionsonfinanceleasesforphotocopiersareimposedontheDepartmentandincludemaintenanceandrepairs.
Department of Tourism - Vote 35
NOTESTOTHEANNuAlFINANCIAlSTATEMENTSfor the year ended 31 March 2015
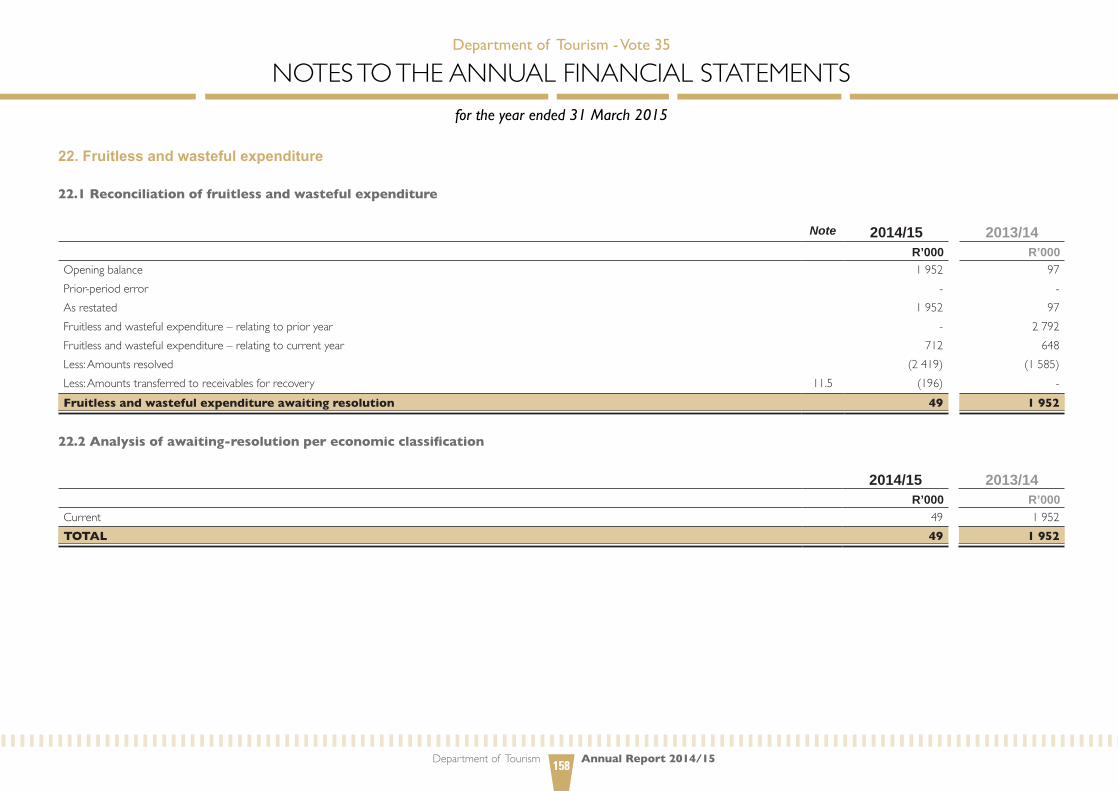
Department of Tourism Annual Report 2014/15158
22. Fruitless and wasteful expenditure
22.1 Reconciliation of fruitless and wasteful expenditure
Note 2014/15 2013/14R’000 R’000
Openingbalance 1952 97Prior-perioderror - -Asrestated 1952 97Fruitlessandwastefulexpenditure–relatingtoprioryear - 2792Fruitlessandwastefulexpenditure–relatingtocurrentyear 712 648less:Amountsresolved (2419) (1585)less:Amountstransferredtoreceivablesforrecovery 11.5 (196) -Fruitless and wasteful expenditure awaiting resolution 49 1 952
22.2 Analysis of awaiting-resolution per economic classification
2014/15 2013/14R’000 R’000
Current 49 1952TOTAL 49 1 952
Department of Tourism - Vote 35
NOTESTOTHEANNuAlFINANCIAlSTATEMENTSfor the year ended 31 March 2015

PART E Financial Information159
22.3 Analysis of current year’s fruitless and wasteful expenditure
2014/15R’000
Incident Disciplinary steps taken/criminal proceedings
latecancellation/no-show/flightamendmentswithregardtotravelbookings Nodisciplinarystepsrequired–investigationconductedandexpenditurecondonedasvalid 663latecancellation/no-show/flightamendmentswithregardtotravelbookings underinvestigationtodetermineliability 49TOTAL 712
23. Related-party transactions
SouthAfricanTourism(SATourism)isapublicentityoftheDepartment.TransferpaymentstoSATourismhavebeenincludedinAnnexure1Atothefinancialstatements.
24. Key management personnel
No. of individuals 2014/15 2013/14R’000 R’000
Politicaloffice-bearers 2 5647 3 841Officials:level15to16 5 7089 7010level14 15 15036 14419
TOTAL 27 772 25 270
Department of Tourism - Vote 35
NOTESTOTHEANNuAlFINANCIAlSTATEMENTSfor the year ended 31 March 2015

Department of Tourism Annual Report 2014/15160
25. Movable tangible capital assets
MOVEMENT IN MOVABLE TANGIBLE CAPITAL ASSETS PER ASSET REGISTER FOR THE YEAR ENDED 31 MARCH 2015
Opening balance Additions Disposals Closing balanceR’000 R’000 R’000 R’000
MACHINERY AND EQUIPMENT 44 727 9 091 (2 089) 51 729
Transportassets 5 343 1647 - 6990Computerequipment 19308 5660 (1857) 23111Furnitureandofficeequipment 12492 829 (93) 13228Othermachineryandequipment 7584 955 (139) 8400TOTAL MOVABLE TANGIBLE CAPITAL ASSETS 44 727 9 091 (2 089) 51 729
25.1 Additions
ADDITIONS TO MOVABLE TANGIBLE CAPITAL ASSETS PER ASSET REGISTER FOR THE YEAR ENDED 31 MARCH 2015
Cash Non-cash (Capital-work-in-progress current costs and finance
lease payments)
Received current, not paid(paid current year,
received prior year)
Total
R’000 R’000 R’000 R’000 R’000MACHINERY AND EQUIPMENT 10 718 10 (1 637) - 9 091
Transportassets 1 854 - (207) - 1647Computerequipment 5660 - - - 5660Furnitureandofficeequipment 819 10 - - 829Othermachineryandequipment 2385 - (1430) - 955TOTAL ADDITIONS TO MOVABLE TANGIBLE CAPITAL ASSETS 10 718 10 (1 637) - 9 091
Department of Tourism - Vote 35
NOTESTOTHEANNuAlFINANCIAlSTATEMENTSfor the year ended 31 March 2015
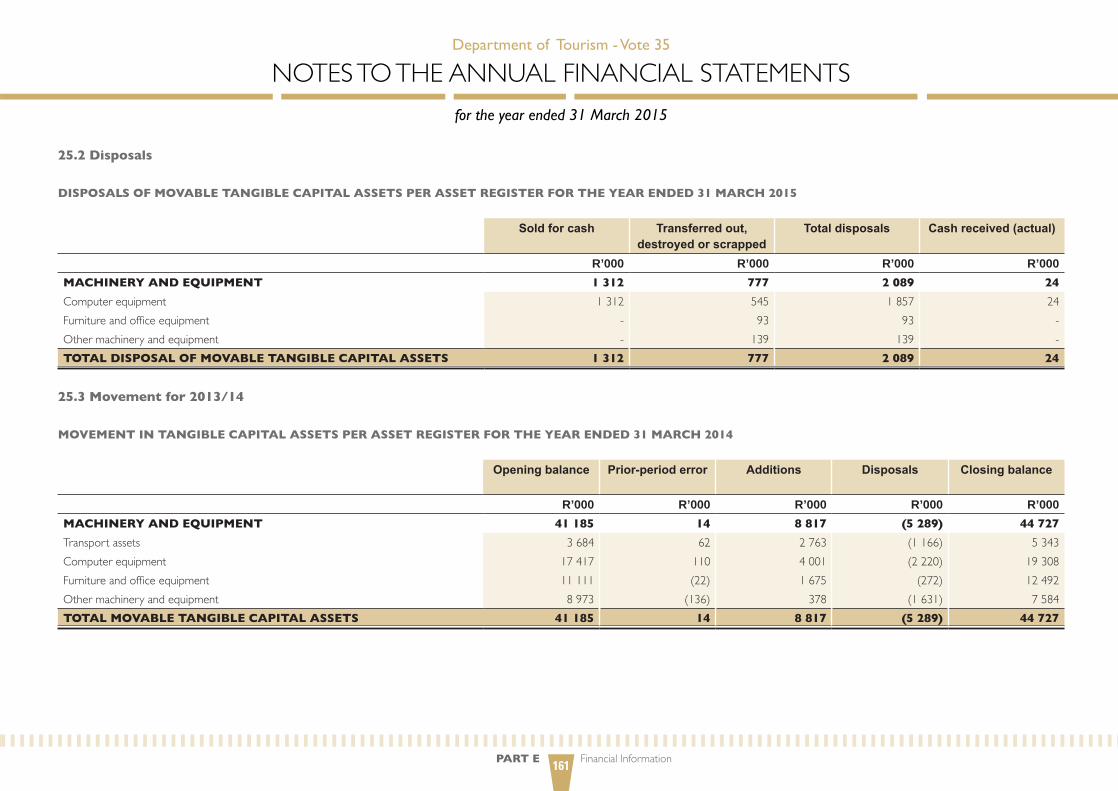
PART E Financial Information161
25.2 Disposals
DISPOSALS OF MOVABLE TANGIBLE CAPITAL ASSETS PER ASSET REGISTER FOR THE YEAR ENDED 31 MARCH 2015
Sold for cash Transferred out, destroyed or scrapped
Total disposals Cash received (actual)
R’000 R’000 R’000 R’000MACHINERY AND EQUIPMENT 1 312 777 2 089 24
Computerequipment 1312 545 1857 24Furnitureandofficeequipment - 93 93 -Othermachineryandequipment - 139 139 -TOTAL DISPOSAL OF MOVABLE TANGIBLE CAPITAL ASSETS 1 312 777 2 089 24
25.3 Movement for 2013/14
MOVEMENT IN TANGIBLE CAPITAL ASSETS PER ASSET REGISTER FOR THE YEAR ENDED 31 MARCH 2014
Opening balance Prior-period error Additions Disposals Closing balance
R’000 R’000 R’000 R’000 R’000MACHINERY AND EQUIPMENT 41 185 14 8 817 (5 289) 44 727
Transportassets 3684 62 2763 (1166) 5 343Computerequipment 17417 110 4001 (2220) 19308Furnitureandofficeequipment 11 111 (22) 1675 (272) 12492Othermachineryandequipment 8973 (136) 378 (1631) 7584TOTAL MOVABLE TANGIBLE CAPITAL ASSETS 41 185 14 8 817 (5 289) 44 727
Department of Tourism - Vote 35
NOTESTOTHEANNuAlFINANCIAlSTATEMENTSfor the year ended 31 March 2015

Department of Tourism Annual Report 2014/15162
25.4 Minor assets
MOVEMENT IN MINOR ASSETS PER THE ASSET REGISTER FOR THE YEAR ENDED 31 MARCH 2015
Intangible assets Machinery and equipment TotalR’000 R’000 R’000
Openingbalance 1364 6318 7682Additions 10 548 558Disposals (2) (195) (197)TOTAL MINOR ASSETS 1 372 6 671 8 043
Intangible assets Machinery and equipment TotalNumberofR1minorassets - 544 544Numberofminorassetsatcost 444 5993 6437TOTAL NUMBER MINOR ASSETS 444 6 537 6 981
MOVEMENT IN MINOR ASSETS PER THE ASSET REGISTER FOR THE YEAR ENDED 31 MARCH 2014
Intangible assets Machinery and equipment TotalR’000 R’000 R’000
Openingbalance 1364 5842 7206Additions - 891 891Disposals - (415) (415)TOTAL MINOR ASSETS 1 364 6 318 7 682
Intangible assets Machinery and equipment TotalNumberofR1minorassets - 683 683Numberofminorassetsatcost 443 5 444 5887TOTAL NUMBER OF MINOR ASSETS 443 6 127 6 570
Department of Tourism - Vote 35
NOTESTOTHEANNuAlFINANCIAlSTATEMENTSfor the year ended 31 March 2015

PART E Financial Information163
26. Intangible capital assets
MOVEMENT IN INTANGIBLE CAPITAL ASSETS PER ASSET REGISTER FOR THE YEAR ENDED 31 MARCH 2015
Opening balance Additions Disposals Closing balanceR’000 R’000 R’000 R’000
SOFTWARE 1 863 2 098 - 3 961
TOTAL INTANGIBLE CAPITAL ASSETS 1 863 2 098 - 3 961
26.1 Additions ADDITIONS TO INTANGIBLE CAPITAL ASSETS PER ASSET REGISTER FOR THE YEAR ENDED 31 MARCH 2015
Cash Non-cash Received current year, not paid
(paid current year, received prior year)
Total
R’000 R’000 R’000 R’000SOFTWARE 2 098 - - 2 098
TOTAL ADDITIONS TO INTANGIBLE CAPITAL ASSETS 2 098 - - 2 098
26.2 Movement for 2013/14
MOVEMENT IN INTANGIBLE CAPITAL ASSETS PER ASSET REGISTER FOR THE YEAR ENDED 31 MARCH 2014
Opening balance
Prior-period error
Additions Disposals Closing balance
R’000 R’000 R’000 R’000 R’000SOFTWARE 550 20 1 299 (6) 1 863
TOTAL INTANGIBLE CAPITAL ASSETS 550 20 1 299 (6) 1 863
Department of Tourism - Vote 35
NOTESTOTHEANNuAlFINANCIAlSTATEMENTSfor the year ended 31 March 2015
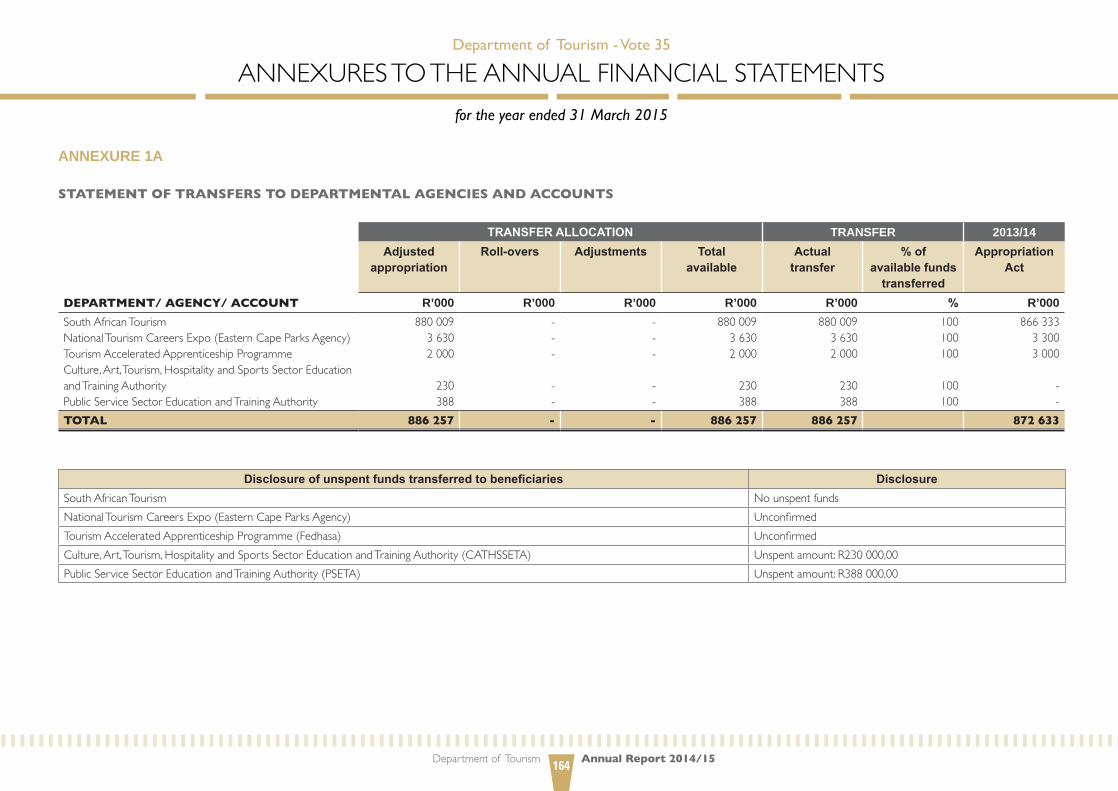
Department of Tourism Annual Report 2014/15164
anneXURe 1a
STATEMENT OF TRANSFERS TO DEPARTMENTAL AGENCIES AND ACCOUNTS
DEPARTMENT/ AGENCY/ ACCOUNT
TRANSFER ALLOCATION TRansfeR 2013/14Adjusted
appropriationRoll-overs Adjustments Total
availableActual
transfer% of
available funds transferred
Appropriation Act
R’000 R’000 R’000 R’000 R’000 % R’000SouthAfricanTourismNationalTourismCareersExpo(EasternCapeParksAgency)TourismAcceleratedApprenticeshipProgrammeCulture,Art,Tourism,HospitalityandSportsSectorEducationandTrainingAuthorityPublicServiceSectorEducationandTrainingAuthority
88000936302000
230388
---
--
---
--
88000936302000
230388
88000936302000
230388
100100100
100100
86633333003000
--
TOTAL 886 257 - - 886 257 886 257 872 633
Disclosure of unspent funds transferred to beneficiaries DisclosureSouthAfricanTourism NounspentfundsNationalTourismCareersExpo(EasternCapeParksAgency) unconfirmedTourismAcceleratedApprenticeshipProgramme(Fedhasa) unconfirmedCulture,Art,Tourism,HospitalityandSportsSectorEducationandTrainingAuthority(CATHSSETA) unspentamount:R230000,00PublicServiceSectorEducationandTrainingAuthority(PSETA) unspentamount:R388000,00
Department of Tourism - Vote 35
ANNEXuRESTOTHEANNuAlFINANCIAlSTATEMENTSfor the year ended 31 March 2015

PART E Financial Information165
anneXURe 1b
STATEMENT OF TRANSFERS TO HIGHER-EDUCATION INSTITUTIONS
NAME OF HIGHER-EDUCATION INSTITUTION
TRANSFER ALLOCATION TRansfeR 2013/14Adjusted
appropriationRoll-overs Adjustments Total
availableActual
transferAmount not transferred
% of available
funds transferred
Appropriation Act
R’000 R’000 R’000 R’000 R’000 % R’000 R’000CapePeninsulauniversityofTechnologyuniversityofJohannesburg
620620
--
--
620620
620620
--
100100
517517
universityofPretoriauniversityofVendauniversityofZululand
1240620620
---
---
1240620620
1240620620
---
100100100
1035518518
TOTAL 3 720 - - 3 720 3 720 - 3 105
anneXURe 1c
STATEMENT OF TRANSFERS TO FOREIGN GOVERNMENTS AND INTERNATIONAL ORGANISATIONS
STATEMENT OF TRANSFERS TO FOREIGN GOVERNMENTS AND INTERNATIONAL ORGANISATIONS
TRANSFER ALLOCATION TRansfeR 2013/14Adjusted
appropriationRoll-overs Adjustments Total
availableActual
transfer% of
available funds transferred
Appropriation Act
R’000 R’000 R’000 R’000 R’000 % R’000TransfersRegionalTourismOrganisationofSouthernAfrica(RETOSA)unitedNationsWorldTourismOrganization(uNWTO)
3 5182346
--
2748-
62662346
62662286
10097
29831830
TOTAL 5 864 - 2 748 8 612 8 552 4 813
Department of Tourism - Vote 35
ANNEXuRESTOTHEANNuAlFINANCIAlSTATEMENTSfor the year ended 31 March 2015

Department of Tourism Annual Report 2014/15166
anneXURe 1D
STATEMENT OF TRANSFERS TO NON-PROFIT INSTITUTIONS
STATEMENT OF TRANSFERS TO NON-PROFIT INSTITUTIONS
TRANSFER ALLOCATION TRansfeR 2013/14Adjusted
appropriationRoll-overs Adjustments Total
availableActual
transfer% of
available funds transferred
Appropriation Act
R’000 R’000 R’000 R’000 R’000 % R’000TransfersFederatedHospitalityAssociationofSouthernAfrica(Fedhasa)EzemveloKZNWildlifeStrategicPartnersinTourismTourisminterpretivesignage
200-
25000-
----
---
1250
200-
250001250
200-
250001250
100-
100100
500500
25000-
TOTAL 25 200 - 1 250 26 450 26 450 26 000
Department of Tourism - Vote 35
ANNEXuRESTOTHEANNuAlFINANCIAlSTATEMENTSfor the year ended 31 March 2015

PART E Financial Information167
anneXURe 1e
STATEMENT OF TRANSFERS TO HOUSEHOLDS
STATEMENT OF TRANSFERS TO HOUSEHOLDS
TRANSFER ALLOCATION TRansfeR 2013/14Adjusted
appropriationRoll-overs Adjustments Total
availableActual
transfer% of
available funds transferred
Appropriation Act
R’000 R’000 R’000 R’000 R’000 % R’000TransfersExpandedPublicWorksProgrammeExpandedPublicWorksProgrammeincentive SubtotalTourismIncentiveProgrammeEmployeesocialbenefits:leavegratuity
9390966200
160 10915400
-
-----
----
2032
9390966200
160 109154002032
9390947450
141 359153612031
10072
88,399,799,9
21411439107
253 221-
343TOTAL 175 509 - 2 032 177 541 158 751 253 564
anneXURe 1e (continued)
DETAIL ON EXPANDED PUBLIC WORKS PROGRAMMES acTUal TRansfeRInfrastructure projects 2014/15
R’000EasternCape-MthathaAirportInformation 3040852,80EasternCape-PortStJohnsWaterfront 5004266,00EasternCape-AliwalSPA-Phase2 453000,00EasternCape-BongoloDam 3570637,00EasternCape-Mbashe,CoffeeBay,MvezoN.Mandela-Phase2 102375,00EasternCape-NdlambeTourismInfrastructure&Heritage 9102060,00EasternCape-Mthonsilodge 11047200,00EasternCape-QatywaEco-tourismDevelopment 6056449,00
Department of Tourism - Vote 35
ANNEXuRESTOTHEANNuAlFINANCIAlSTATEMENTSfor the year ended 31 March 2015
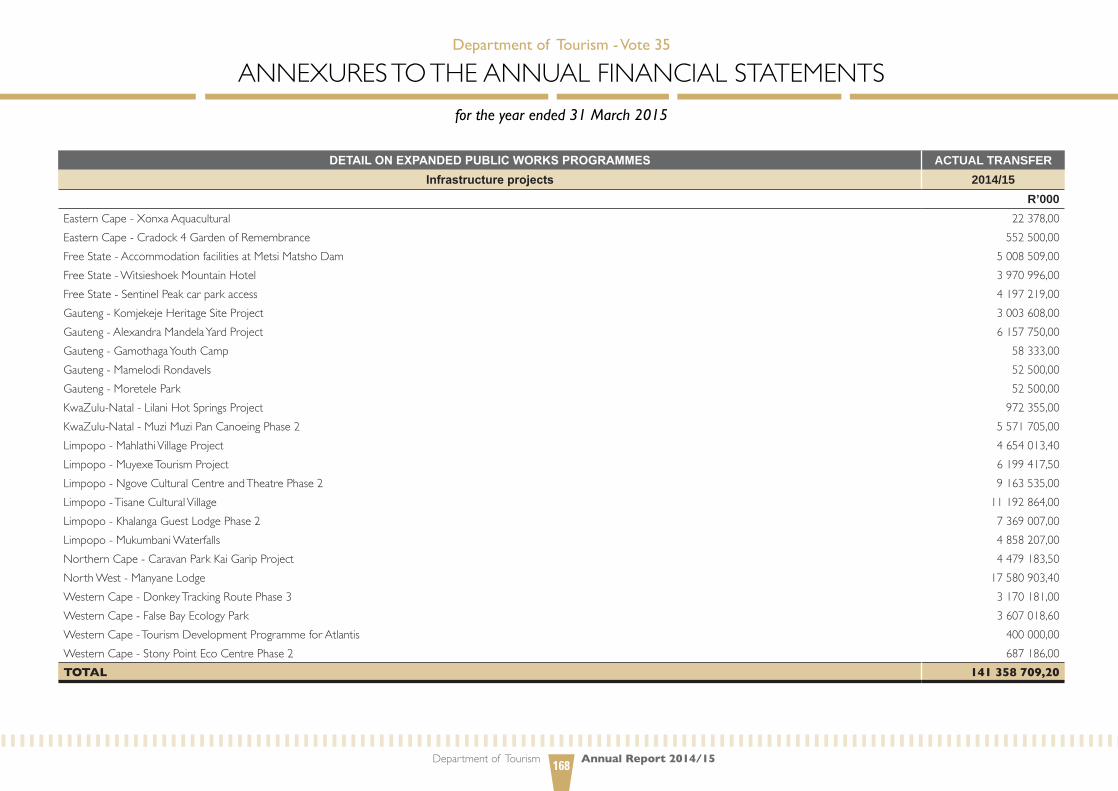
Department of Tourism Annual Report 2014/15168
DETAIL ON EXPANDED PUBLIC WORKS PROGRAMMES acTUal TRansfeRInfrastructure projects 2014/15
R’000EasternCape-XonxaAquacultural 22378,00EasternCape-Cradock4GardenofRemembrance 552500,00FreeState-AccommodationfacilitiesatMetsiMatshoDam 5008509,00FreeState-WitsieshoekMountainHotel 3970996,00FreeState-SentinelPeakcarparkaccess 4197219,00Gauteng-KomjekejeHeritageSiteProject 3003608,00Gauteng-AlexandraMandelaYardProject 6157750,00Gauteng-GamothagaYouthCamp 58333,00Gauteng-MamelodiRondavels 52500,00Gauteng-MoretelePark 52500,00KwaZulu-Natal-lilaniHotSpringsProject 972355,00KwaZulu-Natal-MuziMuziPanCanoeingPhase2 5571705,00limpopo-MahlathiVillageProject 4654013,40limpopo-MuyexeTourismProject 6199417,50limpopo-NgoveCulturalCentreandTheatrePhase2 9163535,00limpopo-TisaneCulturalVillage 11192864,00limpopo-KhalangaGuestlodgePhase2 7369007,00limpopo-MukumbaniWaterfalls 4858207,00NorthernCape-CaravanParkKaiGaripProject 4479183,50NorthWest-Manyanelodge 17580903,40WesternCape-DonkeyTrackingRoutePhase3 3170181,00WesternCape-FalseBayEcologyPark 3607018,60WesternCape-TourismDevelopmentProgrammeforAtlantis 400000,00WesternCape-StonyPointEcoCentrePhase2 687186,00TOTAL 141 358 709,20
Department of Tourism - Vote 35
ANNEXuRESTOTHEANNuAlFINANCIAlSTATEMENTSfor the year ended 31 March 2015
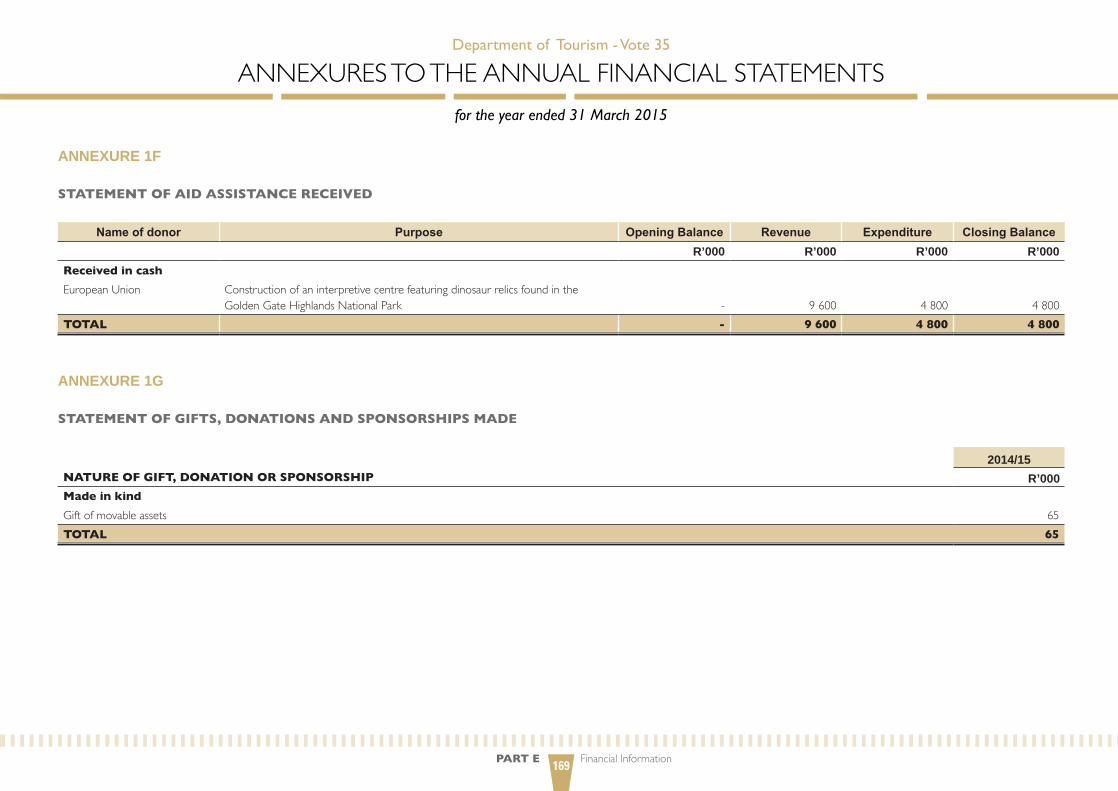
PART E Financial Information169
anneXURe 1f
STATEMENT OF AID ASSISTANCE RECEIVED
Name of donor Purpose Opening Balance Revenue Expenditure Closing BalanceR’000 R’000 R’000 R’000
Received in cash
Europeanunion ConstructionofaninterpretivecentrefeaturingdinosaurrelicsfoundintheGoldenGateHighlandsNationalPark - 9600 4800 4800
TOTAL - 9 600 4 800 4 800
anneXURe 1G
STATEMENT OF GIFTS, DONATIONS AND SPONSORSHIPS MADE
NATURE OF GIFT, DONATION OR SPONSORSHIP
2014/15R’000
Made in kind
Giftofmovableassets 65TOTAL 65
Department of Tourism - Vote 35
ANNEXuRESTOTHEANNuAlFINANCIAlSTATEMENTSfor the year ended 31 March 2015
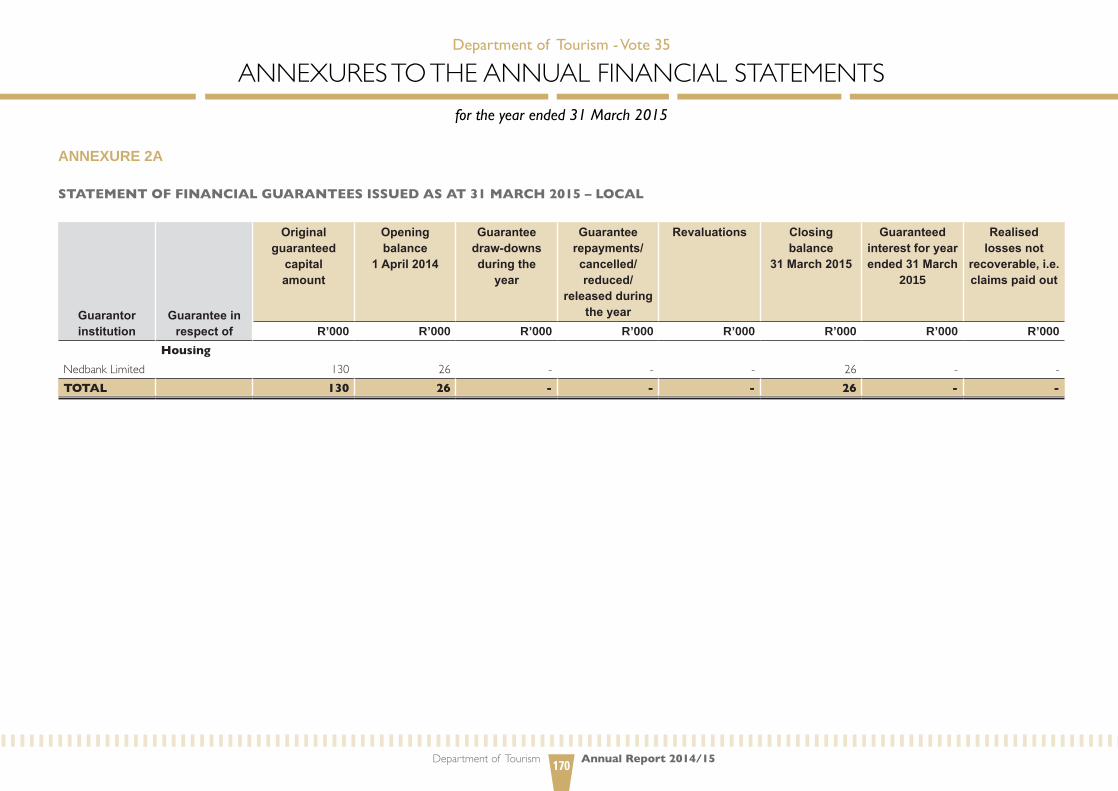
Department of Tourism Annual Report 2014/15170
anneXURe 2a
STATEMENT OF FINANCIAL GUARANTEES ISSUED AS AT 31 MARCH 2015 – LOCAL
Guarantor institution
Guarantee in respect of
Original guaranteed
capital amount
Opening balance
1 April 2014
Guarantee draw-downsduring the
year
Guarantee repayments/ cancelled/ reduced/
released during the year
Revaluations Closing balance
31 March 2015
Guaranteed interest for year ended 31 March
2015
Realised losses not
recoverable, i.e. claims paid out
R’000 R’000 R’000 R’000 R’000 R’000 R’000 R’000Housing
Nedbanklimited 130 26 - - - 26 - -TOTAL 130 26 - - - 26 - -
Department of Tourism - Vote 35
ANNEXuRESTOTHEANNuAlFINANCIAlSTATEMENTSfor the year ended 31 March 2015
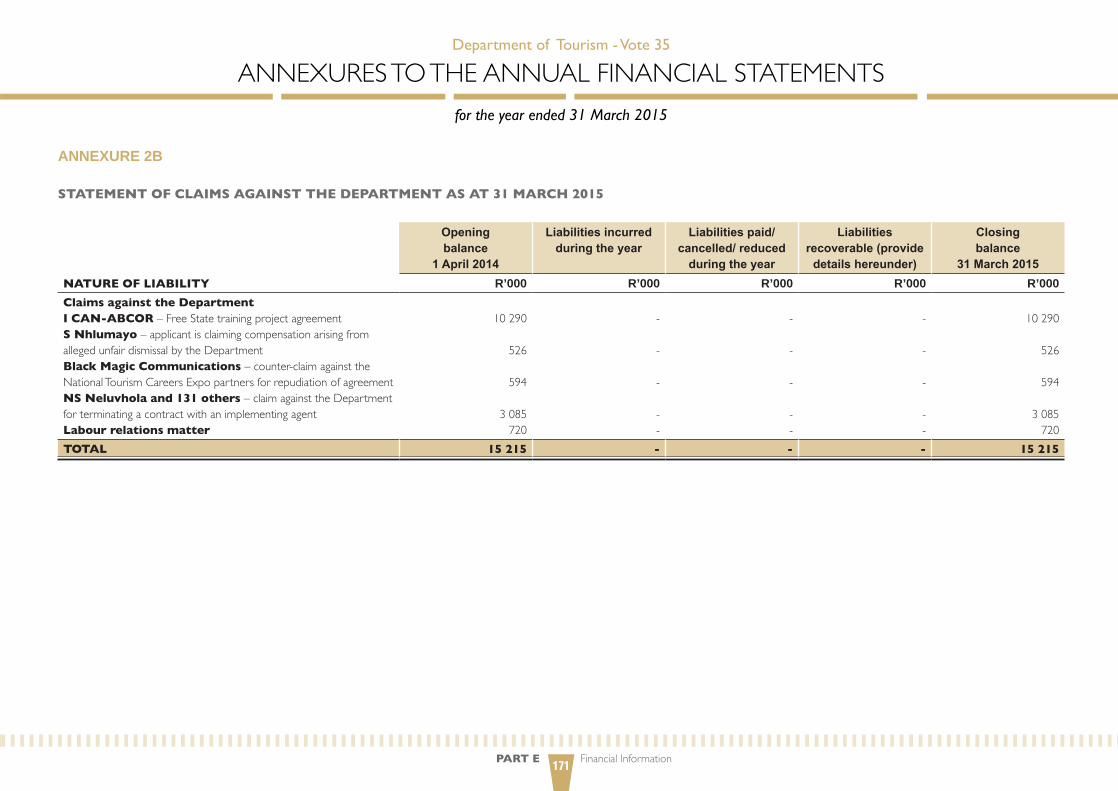
PART E Financial Information171
anneXURe 2b
STATEMENT OF CLAIMS AGAINST THE DEPARTMENT AS AT 31 MARCH 2015
NATURE OF LIABILITY
Openingbalance
1 April 2014
Liabilities incurred during the year
Liabilities paid/ cancelled/ reduced
during the year
Liabilities recoverable (provide
details hereunder)
Closingbalance
31 March 2015R’000 R’000 R’000 R’000 R’000
Claims against the DepartmentI CAN-ABCOR–FreeStatetrainingprojectagreementS Nhlumayo–applicantisclaimingcompensationarisingfromallegedunfairdismissalbytheDepartmentBlack Magic Communications–counter-claimagainsttheNationalTourismCareersExpopartnersforrepudiationofagreementNS Neluvhola and 131 others–claimagainsttheDepartmentforterminatingacontractwithanimplementingagentLabour relations matter
10290
526
594
3085720
-
-
-
--
-
-
-
--
-
-
-
--
10290
526
594
3085720
TOTAL 15 215 - - - 15 215
Department of Tourism - Vote 35
ANNEXuRESTOTHEANNuAlFINANCIAlSTATEMENTSfor the year ended 31 March 2015
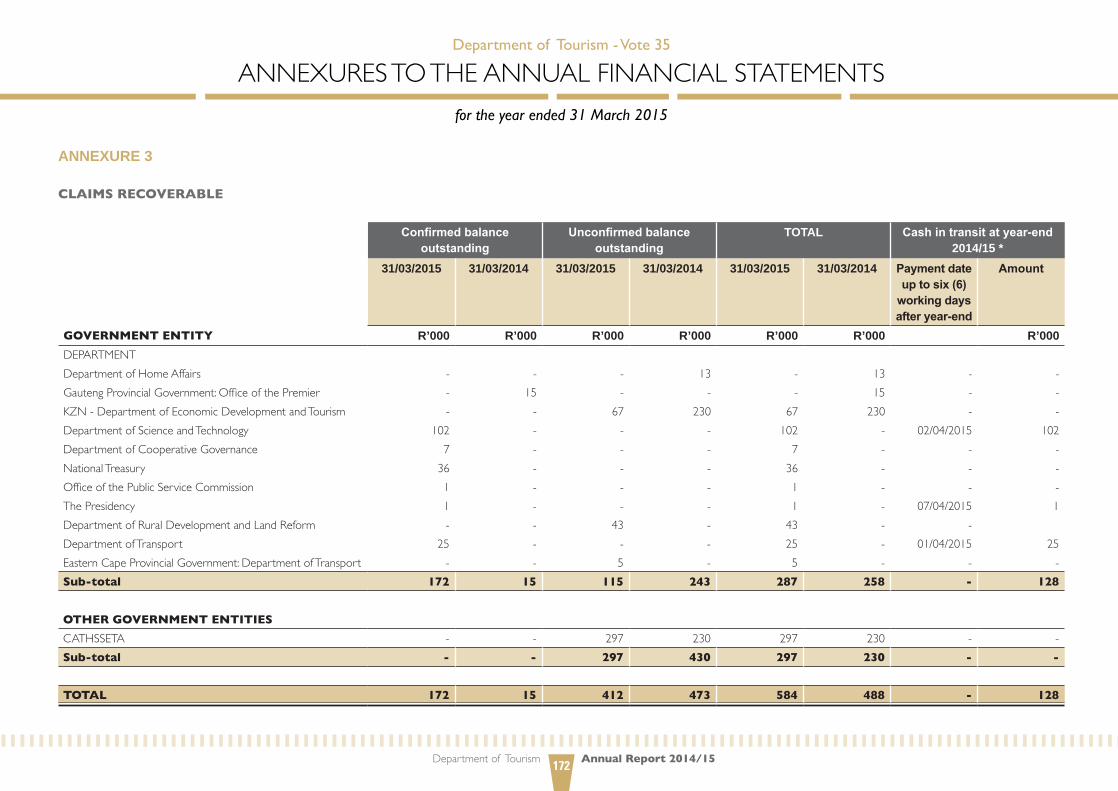
Department of Tourism Annual Report 2014/15172
anneXURe 3
CLAIMS RECOVERABLE
Confirmed balance outstanding
Unconfirmed balance outstanding
ToTal Cash in transit at year-end 2014/15 *
31/03/2015 31/03/2014 31/03/2015 31/03/2014 31/03/2015 31/03/2014 Payment date up to six (6)
working days after year-end
Amount
GOVERNMENT ENTITY R’000 R’000 R’000 R’000 R’000 R’000 R’000depaRtmentDepartmentofHomeAffairs - - - 13 - 13 - -GautengProvincialGovernment:OfficeofthePremier - 15 - - - 15 - -KZN-DepartmentofEconomicDevelopmentandTourism - - 67 230 67 230 - -DepartmentofScienceandTechnology 102 - - - 102 - 02/04/2015 102DepartmentofCooperativeGovernance 7 - - - 7 - - -NationalTreasury 36 - - - 36 - - -OfficeofthePublicServiceCommission 1 - - - 1 - - -ThePresidency 1 - - - 1 - 07/04/2015 1DepartmentofRuralDevelopmentandlandReform - - 43 - 43 - -DepartmentofTransport 25 - - - 25 - 01/04/2015 25EasternCapeProvincialGovernment:DepartmentofTransport - - 5 - 5 - - -Sub-total 172 15 115 243 287 258 - 128
OTHER GOVERNMENT ENTITIES
CATHSSETA - - 297 230 297 230 - -Sub-total - - 297 430 297 230 - -
TOTAL 172 15 412 473 584 488 - 128
Department of Tourism - Vote 35
ANNEXuRESTOTHEANNuAlFINANCIAlSTATEMENTSfor the year ended 31 March 2015

PART E Financial Information173
anneXURe 4
INTERGOVERNMENTAL PAYABLES
GOVERNMENT ENTITY
Confirmed balance outstanding
Unconfirmed balance outstanding
ToTal Cash in transit at year-end 2014/15
31/03/2015 31/03/2014 31/03/2015 31/03/2014 31/03/2015 31/03/2014 Payment date up to six (6)
working days before
year-end
Amount
R’000 R’000 R’000 R’000 R’000 R’000 R’000DEPARTMENT
Current
ParliamentofSouthAfrica - 1 - 16 - 17 - -GovernmentCommunicationandInformationSystem - - - 48 - 48 - -DepartmentofHomeAffairs - 19 - - - 19 - -DepartmentofHumanSettlements 15 - - - 15 - - -DepartmentofInternationalRelationsandCooperation - 441 - 68 - 509 - -DepartmentofJusticeandConstitutionalDevelopment 137 184 - - 137 184 - -DepartmentofGovernmentPrintingWorks 14 8 - - 14 8 - -SouthAfricanPoliceService - - 31 - 31 - - -WesternCapeProvincialTreasury - 12 - - - 12 - -WesternCapeGovernment:SocialDevelopment - - - 19 - 19 - -TOTAL 166 665 31 151 197 816 - -
Department of Tourism - Vote 35
ANNEXuRESTOTHEANNuAlFINANCIAlSTATEMENTSfor the year ended 31 March 2015

Department of Tourism Annual Report 2014/15174
anneXURe 5
INVENTORY
Inventory
Quantity 2014/15 Quantity 2013/14R’000 R’000
Openingbalance - - 7323 150(less):Adjustmentstoprior-yearbalances - - (7323) (150)Add:Additions/purchases-cash - - - -Add:Additionsnon-cash - - - -(less):Issues - - - -(less):Adjustments - - - -Closing balance - - - -
Department of Tourism - Vote 35
ANNEXuRESTOTHEANNuAlFINANCIAlSTATEMENTSfor the year ended 31 March 2015

175
notes
176
notes

ANNUAL REPORT 2014/15
Depa
rtmen
t of T
ours
im A
NN
UA
L RE
PORT
201
4/15
Physical address17 Trevenna Street, Tourism HouseSunnyside, Pretoria 0002
Postal addressPrivate Bag X424, Pretoria 0001
Contact informationCall centre: +27 (0) 860 121 929Call centre e-mail: [email protected] number: +27 (0) 12 444 6000Switchboard fax: +27 (0) 12 444 7000
www.tourism.gov.za
RP156/2015ISBN: 978-0-621-43644-0
Department of Tourism
@Tourism_gov_za