ANNUAL REPORT 2009 - bancatransilvania.ro · ANNUAL REPORT 2009 Banca Transilvania is the bank for...
103
ANNUAL REPORT 20 09
Transcript of ANNUAL REPORT 2009 - bancatransilvania.ro · ANNUAL REPORT 2009 Banca Transilvania is the bank for...
ANNUAL REPORT
2 0 0 9
ANNUAL REPORT
2 0 0 9
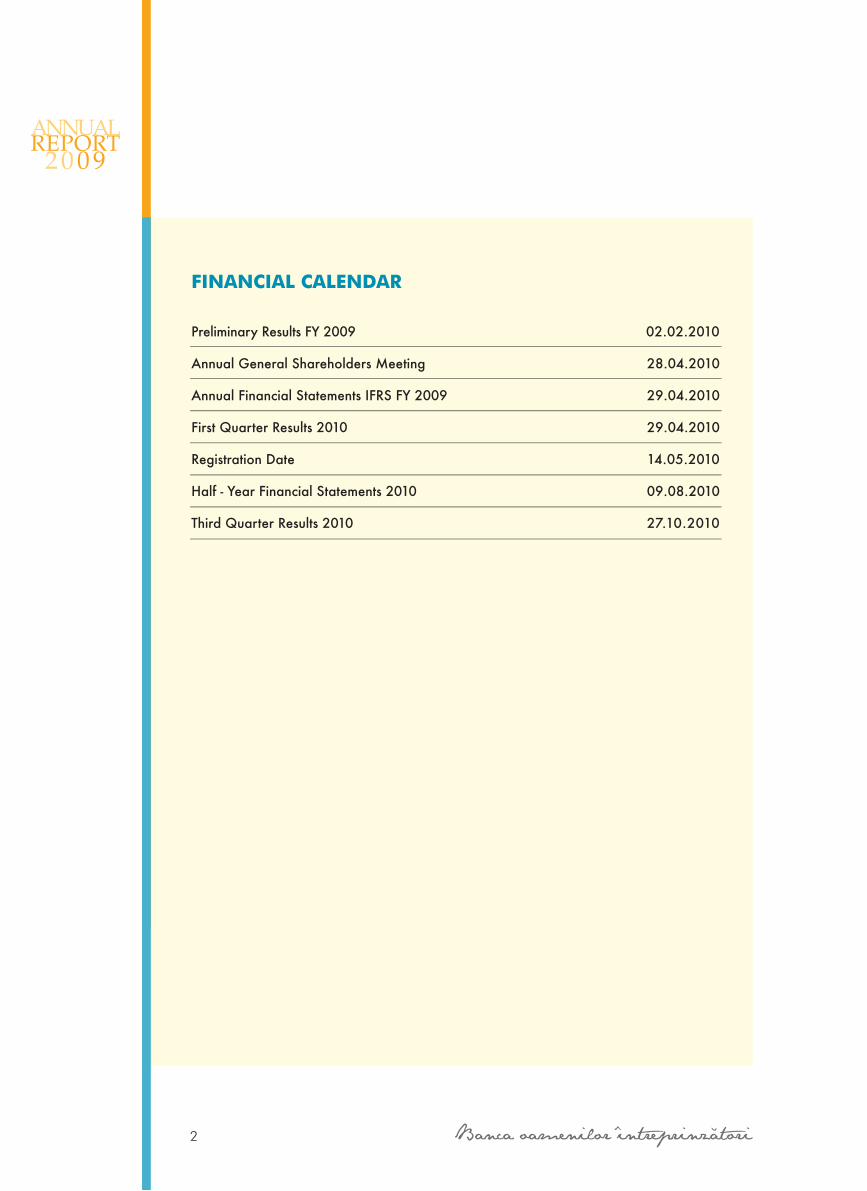
Preliminary Results FY 2009 02.02.2010
Annual General Shareholders Meeting 28.04.2010
Annual Financial Statements IFRS FY 2009 29.04.2010
First Quarter Results 2010 29.04.2010
Registration Date 14.05.2010
Half - Year Financial Statements 2010 09.08.2010
Third Quarter Results 2010 27.10.2010
FINANCIAL CALENDAR
2

ANNUAL REPORT
2 0 0 9
Banca Transilvania is the bank for entrepreneurial
people in Romania.
Our mission, as a privately owned Romanian bank,
is to support the business environment development
through innovative products and services offered
with professionalism. We believe in a mentality
aimed at finding solutions for our clients. There is
soul and energy in everything we do, motivated by
the respect for our clients and a responsibility for
the community.
MIssIoN stAtEMENt
3
ANNUAL REPORT
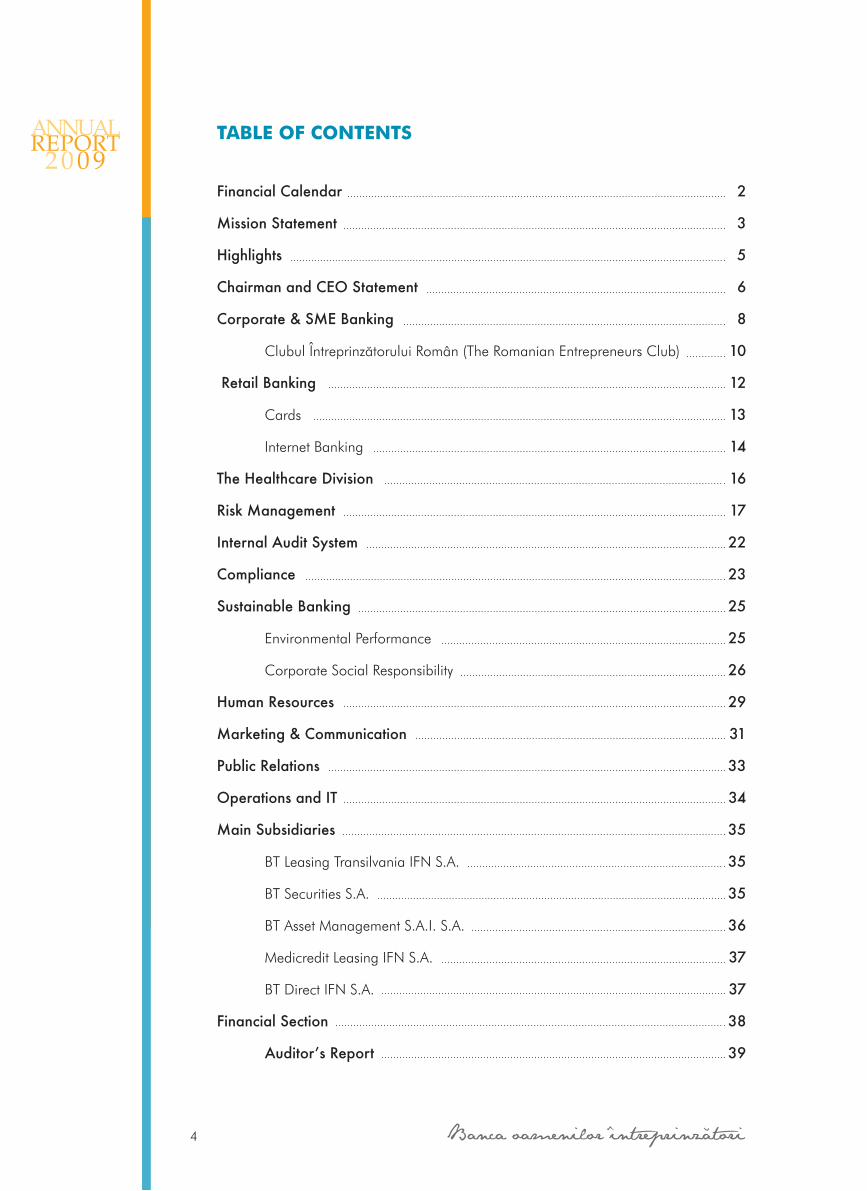
2 0 0 9Financial Calendar
Mission Statement
Highlights
Chairman and CEO Statement
Corporate & SME Banking
ClubulÎntreprinzãtoruluiRomân(TheRomanianEntrepreneursClub)
Retail Banking
Cards
InternetBanking
The Healthcare Division
Risk Management
Internal Audit System
Compliance
Sustainable Banking
EnvironmentalPerformance
CorporateSocialResponsibility
Human Resources
Marketing & Communication
Public Relations
Operations and IT
Main Subsidiaries
BTLeasingTransilvaniaIFNS.A.
BTSecuritiesS.A.
BTAssetManagementS.A.I.S.A.
MedicreditLeasingIFNS.A.
BTDirectIFNS.A.
Financial Section
Auditor’sReport
tABLE oF CoNtENts
4
2
3
5
6
8
10
12
13
14
16
17
22
23
25
25
26
29
31
33
34
35
35
35
36
37
37
38
39
ANNUAL REPORT
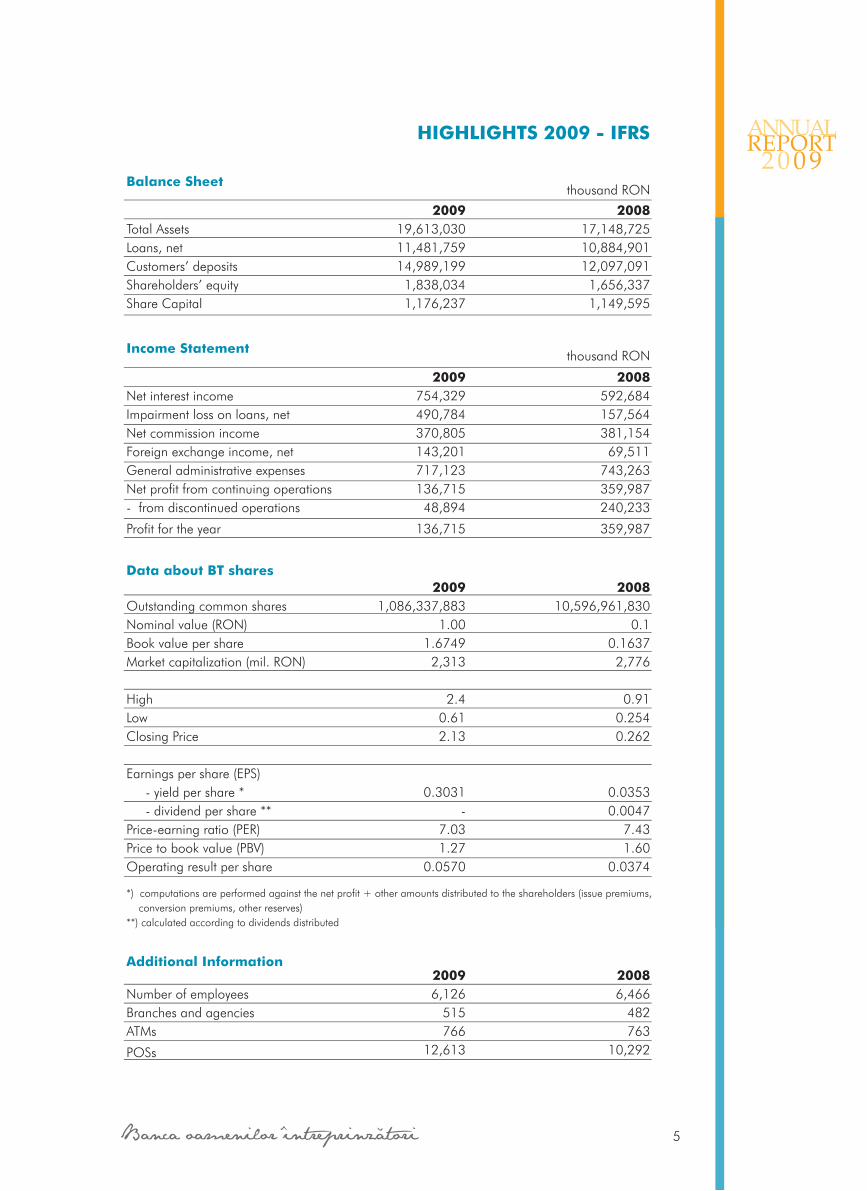
2 0 0 9HIGHLIGHts 2009 - IFRs
Income statement
TotalAssetsLoans,netCustomers’depositsShareholders’equityShareCapital
200919,613,03011,481,75914,989,1991,838,0341,176,237
200817,148,72510,884,90112,097,0911,656,3371,149,595
thousandRON
NetinterestincomeImpairmentlossonloans,netNetcommissionincomeForeignexchangeincome,netGeneraladministrativeexpensesNetprofitfromcontinuingoperations-fromdiscontinuedoperations
Profitfortheyear
2009754,329490,784370,805143,201717,123136,71548,894
136,715
2008592,684157,564381,15469,511
743,263359,987240,233
359,987
thousandRON
Data about Bt shares
OutstandingcommonsharesNominalvalue(RON)BookvaluepershareMarketcapitalization(mil.RON)
HighLowClosingPrice
Earningspershare(EPS)-yieldpershare*-dividendpershare**Price-earningratio(PER)Pricetobookvalue(PBV)Operatingresultpershare
20091,086,337,883
1.001.67492,313
2.40.612.13
0.3031-
7.031.27
0.0570
200810,596,961,830
0.10.16372,776
0.910.2540.262
0.03530.0047
7.431.60
0.0374
*)computationsareperformedagainstthenetprofit+otheramountsdistributedtotheshareholders(issuepremiums,conversionpremiums,otherreserves)**)calculatedaccordingtodividendsdistributed
NumberofemployeesBranchesandagenciesATMs
POSs
20096,126
515766
12,613
20086,466
482763
10,292
Additional Information
Balance sheet
5

ANNUAL REPORT
2 0 0 9
Chairman’s and Chief Executive officer’s statement
Everybodyknewthat2009wouldbeachallengingyear.Strategiesneededtobereconsidered,
businessmodelsreviewedandworkingtoolsrenderedmoreefficient.
2009hasbeena yearof consolidation forBancaTransilvania.Ouroperatingprofitwas96
percenthigherthanin2008andthecost-incomeratioimprovedto55percentversus70percent
theyearbefore.
Liquidityremainedatcomfortablelevel,withloantodepositratiobelowoneandastrongposition
intermsofraiseddepositsonthedomesticmarket.Wemaintainedcapitalrequirementsathigh
standards(14percent),significantlyabovethe8percentminimumlimitimposedbytheNational
RegulatoryAuthority.
Tocopewithbusinessenvironmentuncertainties,weimplementedacoherentandaggressive
provisioningpolicy,withenhancedprotectivemeasuresovertheloanportfolio.Additionalloan
lossprovisionsagainstfutureeconomicdeteriorationwerecreated,non-deductiblesaccounting
for17.6percentoftotalprovisions,whileEUR126millionwasthetotalamountallocatedfor
theincreaseinnetriskcost.
BancaTransilvaniarealizedthattimehascometoadapt,reinforcingtherangeofservicesand
making room for innovativebusinessproducts. In this context, flexibilityandcustomer facing
solutionswerekeywordsforBTtoreclaimmarketshare,meetrevenueandmargintargets.
The Anti-Crisis Platform was designed, setting the foundation for opportune services, much
neededinthemarketplacefloodedbyconcerns.Wefacilitatedaccesstofinancingresources,
improvedcash-flowandreducedoperationalcosts.
In this unsettled economic environment it is important to create strong partnerships with the
public sectors. The National Guarantee Fund for SMEs is our business associate in two
importantprojects.ApremiereontheRomanianbankingmarket,Creditul Gata Garantat-the
ReadySecuredLoan-isaco-brandedproductdesignedtosolvetheentrepreneurs’liquidityand
6

ANNUAL REPORT
2 0 0 9
All in all, we can say that 2008 was a year of strategy adjustment, BT consolidatingits market position. Efficient management of operational expenses, increased riskmanagement and constant communication with the market were just a few mitigationmeasures taken to tackle the effects generated by the economic upheaval.
As for 2009, discussions will revolve around the deployment of thecapital we hold, the duration and sources of our funding, the qualityof the assets. We will continue to monitor the soundness of loanportfolio and aspects pertaining to liquidity and risk management.We will pay great attention to cost reduction and try to constantlymould on market realities.
The bank and its clients are part of the real economy; therefore BT isnot immune to the crisis. However, being flexible, prudent andcapable to adjust our business model to the new market conditions,we feel that we will be able to safely pass these turbulent times.
Moreover, counting on the valuable support of our strategic partnersand shareholders, we remain committed to sustain the localeconomy, being the largest privately-owned bank with majorityRomanian capital.
Horia Ciorcila Robert C. RekkersChairman Chief Executive Officer
7
collateraldifficulties,providingfinancingbasedonstateguarantees.Thesecondproject-Prima
Casa- isaprogramcreatedbytheRomanianGovernment inordertoexpandthemortgage
lendingpace.BTenrolledintheprojectandplacedEUR30millionintotal.
Another aspect revealed by the crisis was the importance of financial support from the EU,
materializedintheformofstructuralfunds.Furthertothese,BThasdecidedtosetupanother
importantplatform- theEU Structural Funds Platform.Ourclientsareprovidedwithadvisory
servicesandco-financingforbusinessturnaroundornewinvestmentprojects.
All our 2009 endeavors benefited from the EBRD’s ongoing support as shareholder and
businesspartnerandwewelcomed thearrivalofnewkey shareholders, IFC -aWorld Bank
Division-andBankofCyprus.
Steeledbyachallenging2009,wecautiouslylookat2010.Weareawarethatthiswillnotbe
aneasyyear,butBT,astheBankforEntrepreneurialPeople,willcontinuetoactwithcourage,
intelligenceand responsibility, relyingonsoundstakeholdersandpartners,professional team
players,localapproachandloyalcustomers.
HoriaCiorcila RobertC.Rekkers
Chairman ChiefExecutiveOfficer
7
ANNUAL REPORT
2 0 0 9
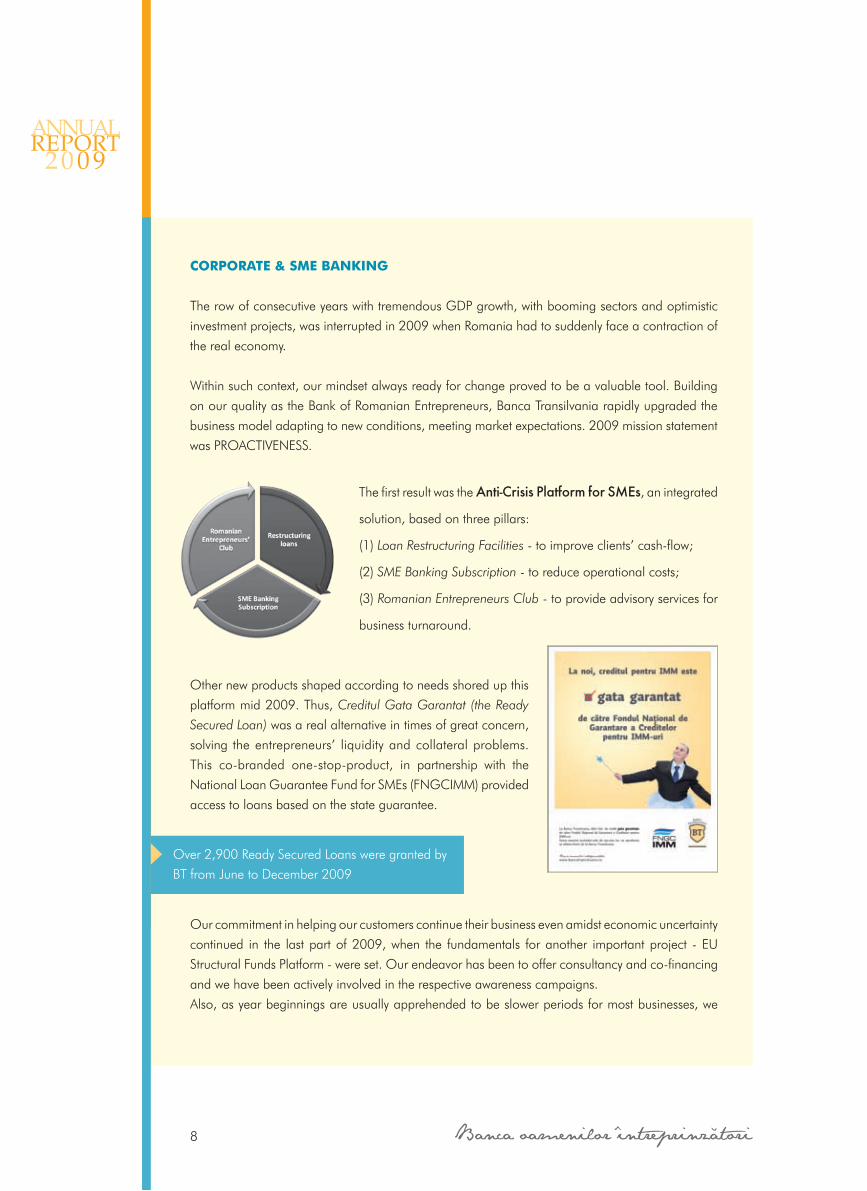
CoRpoRAtE & sME BANkING
TherowofconsecutiveyearswithtremendousGDPgrowth,withboomingsectorsandoptimistic
investmentprojects,wasinterruptedin2009whenRomaniahadtosuddenlyfaceacontractionof
therealeconomy.
Withinsuchcontext,ourmindsetalwaysreadyforchangeprovedtobeavaluabletool.Building
onourqualityastheBankofRomanianEntrepreneurs,BancaTransilvaniarapidlyupgradedthe
businessmodeladaptingtonewconditions,meetingmarketexpectations.2009missionstatement
wasPROACTIVENESS.
ThefirstresultwastheAnti-Crisis Platform for SMEs,anintegrated
solution,basedonthreepillars:
(1)Loan Restructuring Facilities-toimproveclients’cash-flow;
(2)SME Banking Subscription-toreduceoperationalcosts;
(3)Romanian Entrepreneurs Club-toprovideadvisoryservicesfor
businessturnaround.
Othernewproductsshapedaccordingtoneedsshoredupthis
platformmid2009.Thus,Creditul Gata Garantat (the Ready
Secured Loan)wasarealalternativeintimesofgreatconcern,
solving theentrepreneurs’ liquidityandcollateralproblems.
This co-branded one-stop-product, in partnership with the
NationalLoanGuaranteeFundforSMEs(FNGCIMM)provided
accesstoloansbasedonthestateguarantee.
Ourcommitmentinhelpingourcustomerscontinuetheirbusinessevenamidsteconomicuncertainty
continued in the lastpartof2009,when the fundamentals foranother importantproject -EU
StructuralFundsPlatform-wereset.Ourendeavorhasbeentoofferconsultancyandco-financing
andwehavebeenactivelyinvolvedintherespectiveawarenesscampaigns.
Also,asyearbeginningsareusuallyapprehendedtobeslowerperiodsformostbusinesses,we
Over2,900ReadySecuredLoansweregrantedby
BTfromJunetoDecember2009
8
ANNUAL REPORT
2 0 0 9
launchedIesirea din iarna (Getting through winter)asolutionofferedtoimproveclients’cash-flow,
anddealwithadversebusinessconditionsduringthefirstmonthoftheyear.
Besidesadaptingourbankingproductstohelpclientsweatherthecrisis,wealsostreamlinedthe
bank’sstrategyintermsofcustomerriskprofileinordertobuildamorerobustSMEclientbaseand
acquirecorporateclientswithseminalbusinessmodels.
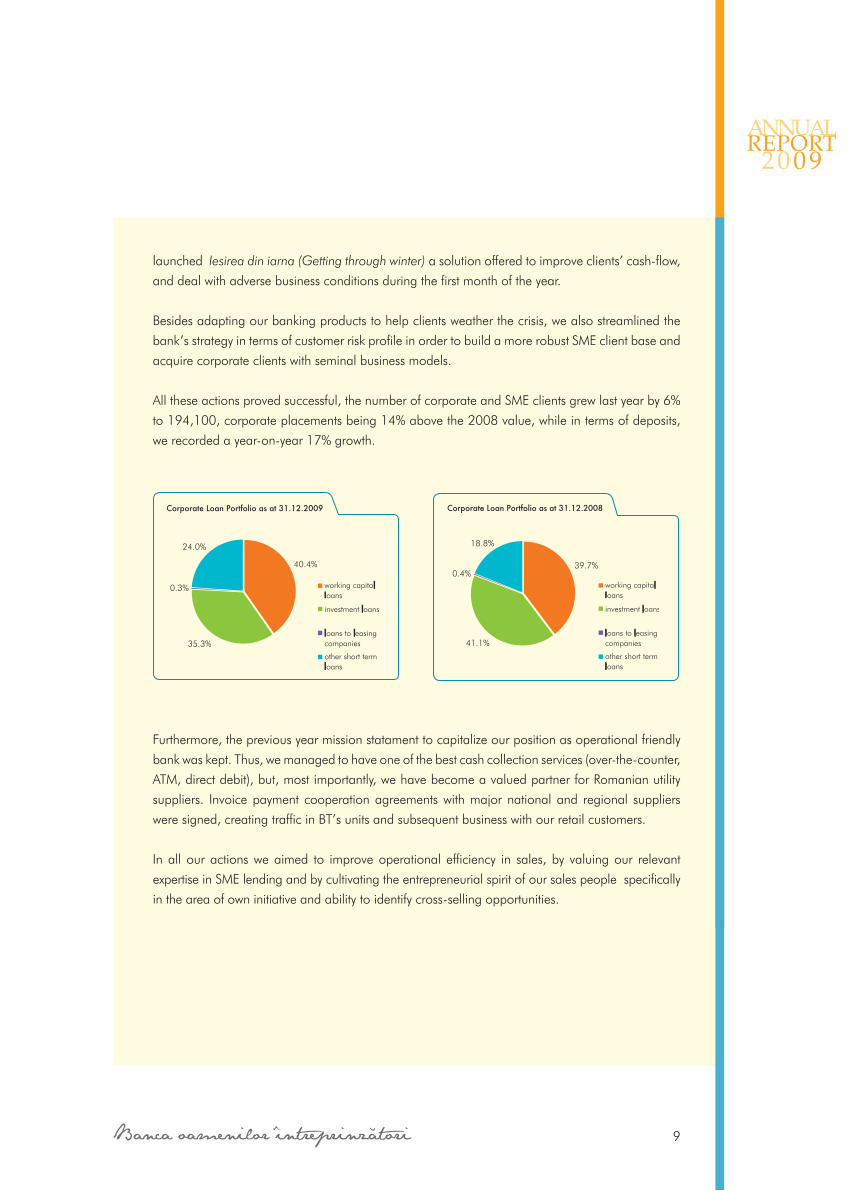
Alltheseactionsprovedsuccessful,thenumberofcorporateandSMEclientsgrewlastyearby6%
to194,100,corporateplacementsbeing14%abovethe2008value,whileintermsofdeposits,
werecordedayear-on-year17%growth.
Furthermore,thepreviousyearmissionstatamenttocapitalizeourpositionasoperationalfriendly
bankwaskept.Thus,wemanagedtohaveoneofthebestcashcollectionservices(over-the-counter,
ATM,directdebit),but,mostimportantly,wehavebecomeavaluedpartnerforRomanianutility
suppliers. Invoicepayment cooperationagreementswithmajornationaland regional suppliers
weresigned,creatingtrafficinBT’sunitsandsubsequentbusinesswithourretailcustomers.
Inallouractionsweaimed to improveoperational efficiency in sales,by valuingour relevant
expertiseinSMElendingandbycultivatingtheentrepreneurialspiritofoursalespeoplespecifically
intheareaofowninitiativeandabilitytoidentifycross-sellingopportunities.
Corporate Loan Portfolio as at 31.12.2009
40.4%
35.3%
0.3%
24.0%
39.7%
41.1%
0.4%
18.8%
Corporate Loan Portfolio as at 31.12.2008
9

ANNUAL REPORT
2 0 0 9
Clubul Întreprinzãtorului Român - CIR (the Romanian Entrepreneurs Club)
Trainingsessionsontopicsofinteresttothebusinesscommunity,networkingprograms,assistance
inapplyingforEUstructuralfundsandfinancial&bankingconsultancyserviceswerefrontlinesin
our2009activity.
The Club counted almost 12,000 members at the end of 2009, with approximately 1,800
newcomersovertheprevious12months.
In2009,theClubappliedforEUstructuralfunds,eitherasmainapplicantorasco-participant.
Asmostoftheprojectswereapprovedwemanagedtoraisesignificantfunds,provingonceagain
thatweactuponourstatements.
The website www.btclub.ro was upgraded, with new tools and functions in order to increase
attractivenessandaccessibility.
InJune2009,theproduct“Site-ul meu pe BT Club” (My site on BT Club)waslaunchedfor
companiesthatdidnothavetheirownwebsite.Asaresult,213webpagesweredesignedandare
currentlyhostedontheCIRsite.
Furthermore, Google partnered with CIR to grant 100 RON vouchers for Google AdWords
campaigns,whichwereusedbyapproximately130companies.
training programs and Events
Morethan360trainingsessionswereorganized,sincetheClubwasestablishedthreeandahalf
yearsago.41eventswereheldin2009andprofessionalspeakers,eitherfromBancaTransilvania
orconsultingcompaniestookthefloor.6,000participantsattendedtheseseminarsin21towns,
gettingacquaintedwithboththetraditionalbusinesstopicsandthechallengesimposedbythe
21stcentury.
Feed-backprovidedbyparticipantsencouragedustostrengthenoureffortsinthisarea.Thus,the
Clubestablished“mobileconsultingoffices”insixtowns,offeringsupporttoSMEswhichwould
liketotakeadvantageoftheEUstructuralfunds.
10

ANNUAL REPORT
2 0 0 9
Furthermore,CIRenteredaspecialpartnershipwithGoogle,organizing“GooglecomestoCluj”
event,withlivebroadcastingontheClub’swebpageandover1,500Internetuserstunedin.
The Club also organized 4 events under the auspices of the “First European SME Week”
(May6-14,2009)andaspartofthe“GlobalEntrepreneurshipWeek”(November16-22,2009).
Alltopicswerereceivedwithgreatinterest,especiallytheEUstructuralfunds.
the Networking program
Theprogramwaslaunchedbackin2008,supportingnationwidenetworkingamongCIRmembers
andofferingexclusivebenefits.
Accreditedmembersbenefitedfromdiscountsthatrangedfrom1%to50%,grantedbyover130
partnersacrossthecountryandcoveringalargevarietyofproductsandservices.
partnerships
Newcollaborationswithconsultingfirmswereestablished,amongthemEurocenterManagement
Network,PNOGrantConsultants,Ecocare,CBCTraining,RomanianTrainingInstitute,Codecs,
DeKlausen,Rentrop&Straton,EcartorShoreBankInternationalandUPCBusiness.Thelatter
co-sponsoredthreeofthe2009events.
Consultancy and newsletter
TheClubprovidesbothfinancialandbankingconsultancy,aswellasotherservicestoitsmembers,
viathetollfreenumber0800800466,bye-mailandthroughitswebsitewww.btclub.ro.
Also,awiderangeoftopicsofinterestforentrepreneursaroundthecountryareapproachedand
debatedinnewsletterssenttotheClub’smembers.
11

ANNUAL REPORT
2 0 0 9
REtAIL
Loans and Deposits, simple products
Overthepast10years,BancaTransilvania’sfocusonRetailBankinghasbeenreinforcedyearafter
yearsothatendof2009,theretailcustomerbasecountedonemillioneighthundredthousand
clients.Theextensivegrowth in termsofclientnumberwascomplementedby intensivegrowth
strategies,theaveragenumberofproductsperclientdevelopingfrom2.12to2.37,thatisa12%
increase.
Weprovidedloananddepositpackageswithfeaturestriggeredbytheeconomicbackground.
Newmortgageloansandupdatedhomeequitylendingproductswerelaunched,aimedatraising
retailcustomers’appetiteforcredit,giventheabruptconsumptiondownslope.
Moreover,tosupplyourclientswiththe
necessary funds and simultaneously
sustain the real estate market, we
enrolled, in partnership with the
National Guarantee Fund, in the
Prima Casa Program. As part of this
project, we managed to grant 753
loans,equivalentofEUR30million.
In 2009, people’s behavior faced
amigration from consumerism to savings. Backed by our retail business focus, expertise and
reputation,wecontinuedtoembraceadispersedliquiditymodelandaheterogeneouscustomer
breakdown,preservingaloantodepositratioconstantlybelowone.Furthertothis,during2009,
our retail deposits grew by 24%, standing for 66% of total
deposits.
Combined services, lined up with market requirements
In 2009 we expanded the channels to insurance products.
The Savings and Protection Plan,launchedinpartnershipwith
AEGON Romania, met the requirements of a savings-prone
and risk-averse market. This co-branded financial solution
combinedtheadvantagesofasavingsaccountwiththoseofa
lifeinsurancefacilitywithinacustomizedinvestmentprogram.
12
2009 Retail Loan Portfolio
17.01%
6.71%
30.42%
20.93%
20.32%2.63%
1.98% housing
mortgage
home equity
consumer loans
card loans
car loans
other
ANNUAL REPORT
2 0 0 9
Card platform
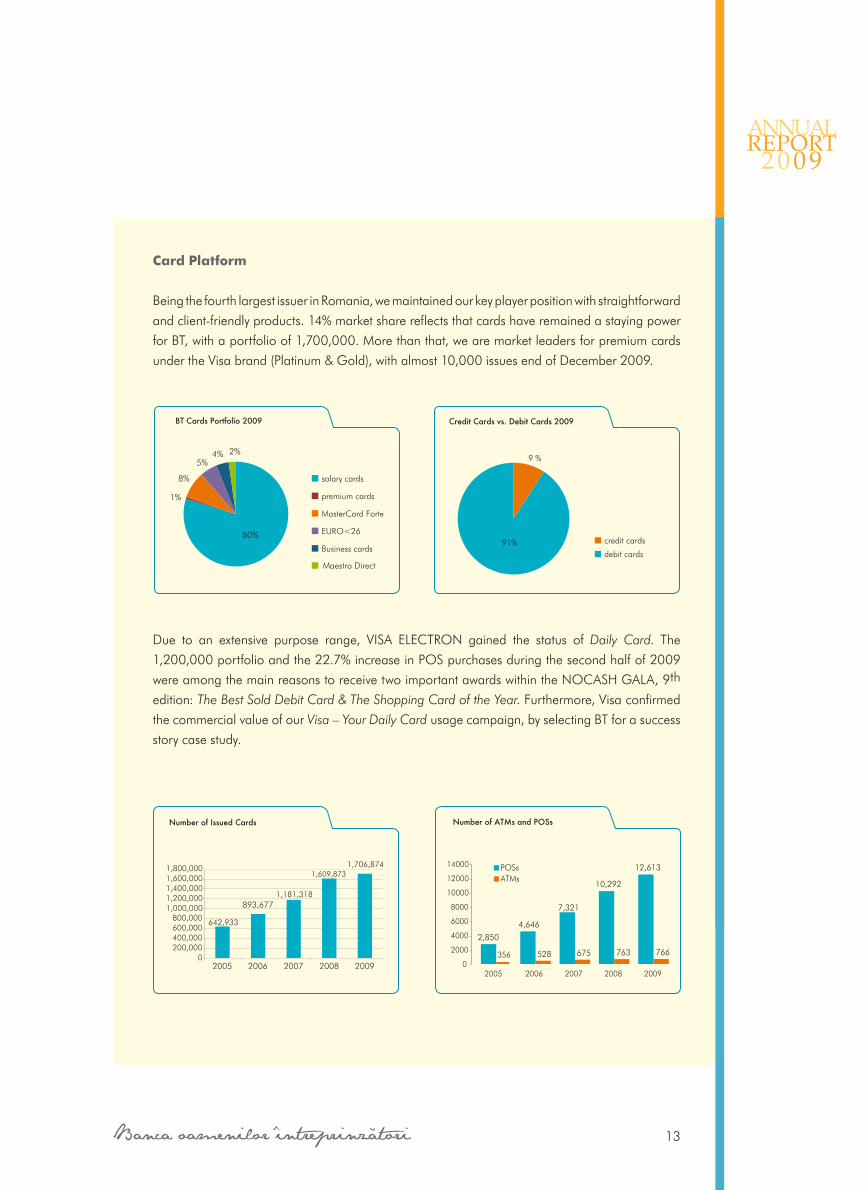
BeingthefourthlargestissuerinRomania,wemaintainedourkeyplayerpositionwithstraightforward
andclient-friendlyproducts.14%marketsharereflectsthatcardshaveremainedastayingpower
forBT,withaportfolioof1,700,000.Morethanthat,wearemarketleadersforpremiumcards
undertheVisabrand(Platinum&Gold),withalmost10,000issuesendofDecember2009.
Due to an extensive purpose range, VISA ELECTRON gained the status of Daily Card. The
1,200,000portfolioandthe22.7%increaseinPOSpurchasesduringthesecondhalfof2009
wereamongthemainreasonstoreceivetwoimportantawardswithintheNOCASHGALA,9th
edition:The Best Sold Debit Card & The Shopping Card of the Year.Furthermore,Visaconfirmed
thecommercialvalueofourVisa – Your Daily Cardusagecampaign,byselectingBTforasuccess
storycasestudy.
13
2005 2006 2007 2008 2009
642,933893,677
1,706,8741,609,8731,181,318
Number of BT CARDS issued Number of Issued Cards
1,181,318
642,933
0200,000400,000600,000800,000
1,000,0001,200,0001,400,0001,600,0001,800,000
2005 2006 2007 2008 2009
1,706,8741,609,873
893,677
salary cards
premium cards
MasterCard Forte
EURO<26
Business cards
MasterCard vs Visa
BT Cards Portfolio 2009
0
200,000
400,000600,000
800,0001,000,000
1,200,000
1,400,0001,600,000
1,800,000
2006 2007 2008 2009
MasterCard
Visa
1%
8%
5%4% 2%
80%
Maestro Direct
Credit Cards vs. Debit Cards 2009
Number of ATMs and POSs
2,850
4,646
10,292
12,613
356 528 675 763 766
7,321
0
2000
4000
6000
8000
10000
12000
14000
2005 2006 2007 2008 2009
POSsATMs
91%
9 %
credit cards
debit cards
Credit Cards vs. Debit Cards 2009
Number of ATMs and POSs
2,850
4,646
10,292
12,613
356 528 675 763 766
7,321
0
2000
4000
6000
8000
10000
12000
14000
2005 2006 2007 2008 2009
POSsATMs
91%
9 %
credit cards
debit cards
ANNUAL REPORT
2 0 0 9
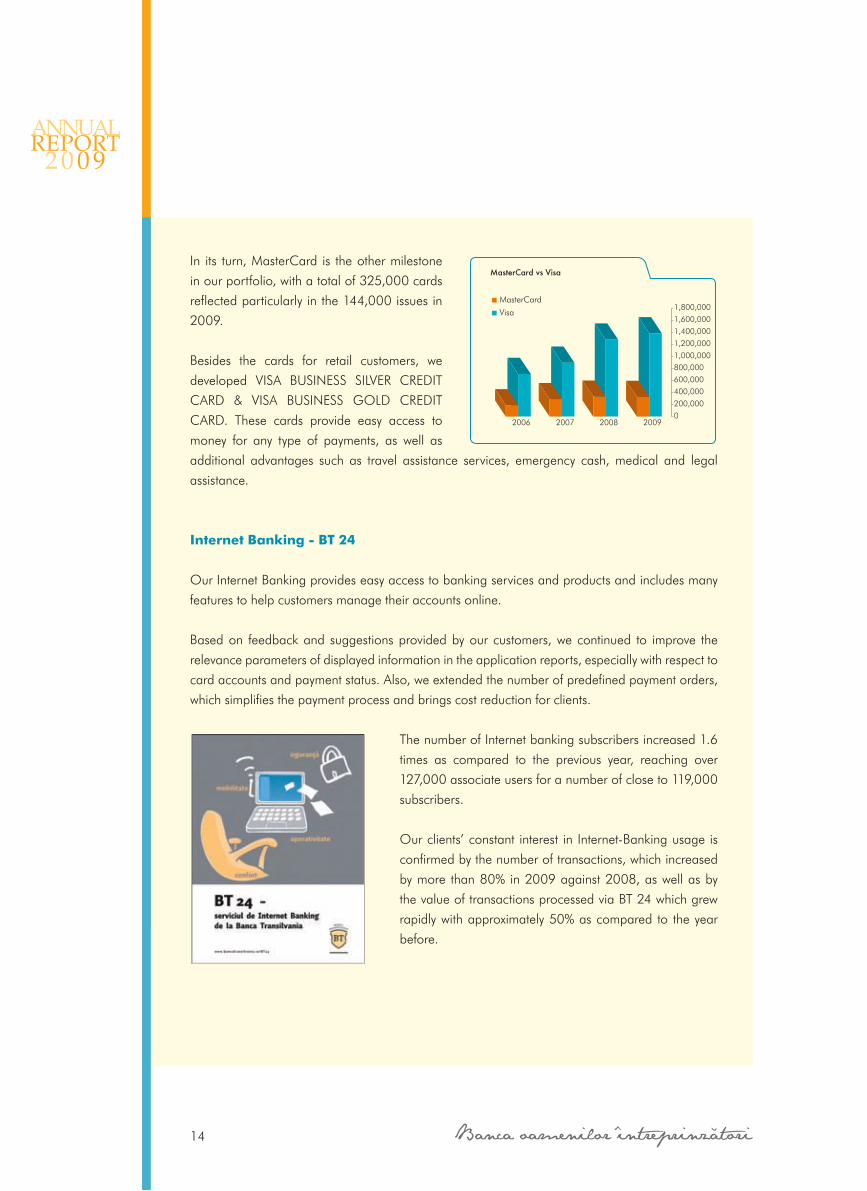
In its turn,MasterCard is theothermilestone
inourportfolio,withatotalof325,000cards
reflectedparticularlyinthe144,000issuesin
2009.
Besides the cards for retail customers, we
developed VISA BUSINESS SILVER CREDIT
CARD & VISA BUSINESS GOLD CREDIT
CARD. These cards provide easy access to
money for any type of payments, as well as
additional advantages such as travel assistance services, emergency cash, medical and legal
assistance.
Internet Banking - Bt 24 OurInternetBankingprovideseasyaccesstobankingservicesandproductsandincludesmany
featurestohelpcustomersmanagetheiraccountsonline.
Basedon feedbackandsuggestionsprovidedbyourcustomers,wecontinued to improve the
relevanceparametersofdisplayedinformationintheapplicationreports,especiallywithrespectto
cardaccountsandpaymentstatus.Also,weextendedthenumberofpredefinedpaymentorders,
whichsimplifiesthepaymentprocessandbringscostreductionforclients.
ThenumberofInternetbankingsubscribersincreased1.6
times as compared to the previous year, reaching over
127,000associateusersforanumberofcloseto119,000
subscribers.
Ourclients’constant interest inInternet-Bankingusageis
confirmedbythenumberoftransactions,whichincreased
bymore than80%in2009against2008,aswellasby
thevalueoftransactionsprocessedviaBT24whichgrew
rapidlywithapproximately50%ascomparedto theyear
before.
14
salary cards
premium cards
MasterCard Forte
EURO<26
Business cards
MasterCard vs Visa
BT Cards Portfolio 2009
0
200,000
400,000600,000
800,0001,000,000
1,200,000
1,400,0001,600,000
1,800,000
2006 2007 2008 2009
MasterCard
Visa
1%
8%
5%4% 2%
80%
Maestro Direct
ANNUAL REPORT
2 0 0 9
Bt 24 Advantages
@ Privacy and securityKeepaccountssafeandsecure
@ SwiftnessCheckaccountbalance,transfermoney,paybillsinminutes
@ Key featuresManageaccountsandsavetimeandmoney.
paymentorderpredefinition/import/export
accountstatementviewandprintoptions
accountbalancegraphs
@ Switch to e-statementsReceivebankaccountandcreditcardstatementsonline:convenient,fastandpaperfree
@ AlertsStayincontrolofaccounts.
key Figures
•
•
•
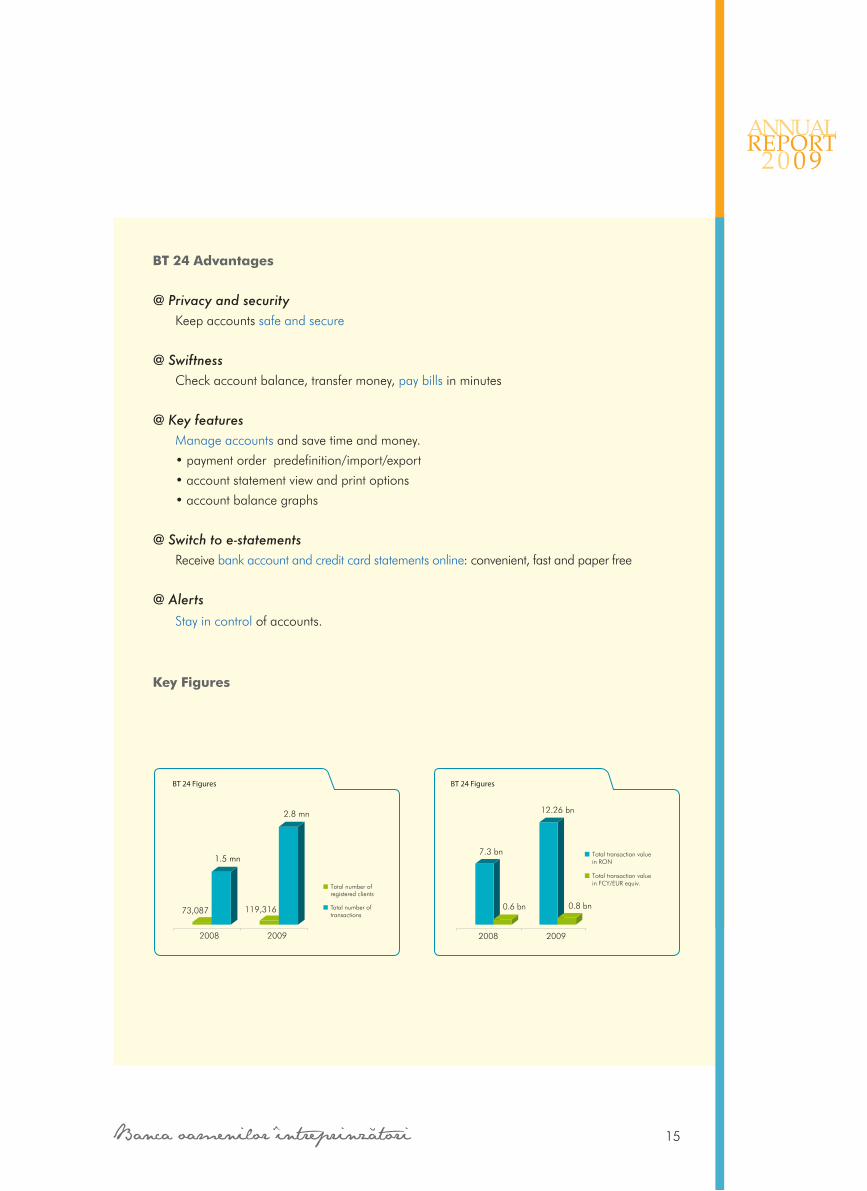
BT 24 Figures BT 24 Figures
73,087
1.5 mn
119,316
2.8 mn
Total number of registered clients
Total number of transactions
2008 2009 2008 2009
7.3 bn
0.6 bn
12.26 bn
0.8 bn
Total transaction value in RON
Total transaction value in FCY/EUR equiv.
15
BT 24 Figures BT 24 Figures
73,087
1.5 mn
119,316
2.8 mn
Total number of registered clients
Total number of transactions
2008 2009 2008 2009
7.3 bn
0.6 bn
12.26 bn
0.8 bn
Total transaction value in RON
Total transaction value in FCY/EUR equiv.
ANNUAL REPORT
2 0 0 9
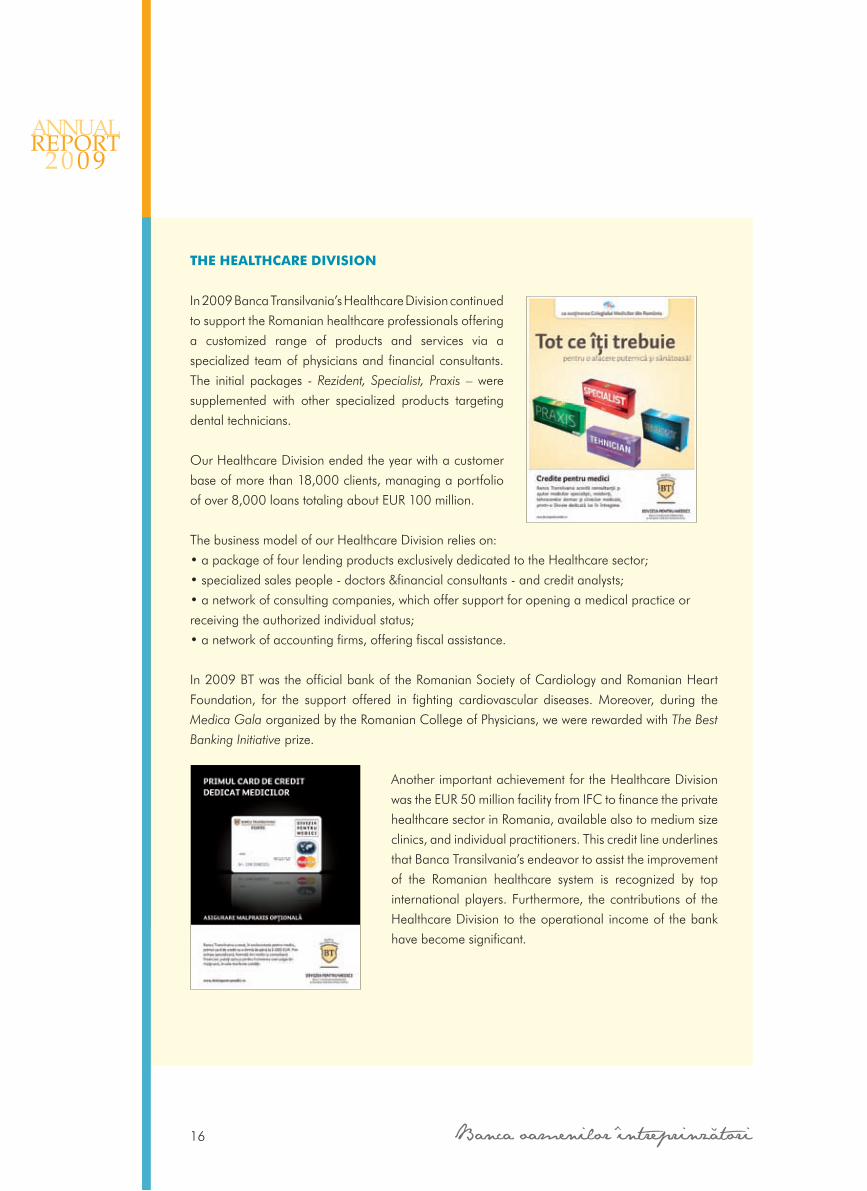
tHE HEALtHCARE DIvIsIoN
In2009BancaTransilvania’sHealthcareDivisioncontinued
tosupporttheRomanianhealthcareprofessionalsoffering
a customized range of products and services via a
specialized teamofphysiciansandfinancialconsultants.
The initial packages -Rezident, Specialist, Praxis –were
supplemented with other specialized products targeting
dentaltechnicians.
OurHealthcareDivisionendedtheyearwithacustomer
baseofmorethan18,000clients,managingaportfolio
ofover8,000loanstotalingaboutEUR100million.
ThebusinessmodelofourHealthcareDivisionrelieson:
•apackageoffourlendingproductsexclusivelydedicatedtotheHealthcaresector;
•specializedsalespeople-doctors&financialconsultants-andcreditanalysts;
•anetworkofconsultingcompanies,whichoffersupportforopeningamedicalpracticeor
receivingtheauthorizedindividualstatus;
•anetworkofaccountingfirms,offeringfiscalassistance.
In2009BTwastheofficialbankoftheRomanianSocietyofCardiologyandRomanianHeart
Foundation, for the support offered in fighting cardiovascular diseases. Moreover, during the
Medica GalaorganizedbytheRomanianCollegeofPhysicians,wewererewardedwithThe Best
Banking Initiativeprize.
AnotherimportantachievementfortheHealthcareDivision
wastheEUR50millionfacilityfromIFCtofinancetheprivate
healthcaresectorinRomania,availablealsotomediumsize
clinics,andindividualpractitioners.Thiscreditlineunderlines
thatBancaTransilvania’sendeavortoassisttheimprovement
of the Romanian healthcare system is recognized by top
internationalplayers.Furthermore, thecontributionsof the
HealthcareDivisiontotheoperational incomeofthebank
havebecomesignificant.
16
ANNUAL REPORT
2 0 0 9
RIsk MANAGEMENt
2009wasmarkedbytheglobaleconomiccrisis.Mostbankssufferedfromthevolatilemarket
surroundingsand thebulkof the corporate sector showedpoor financial results inall sectors
duetothesharpdownturnoftherealeconomy.WhiletheeconomiesofFranceandGermany
emergedfromrecessionfasterthanexpected,otherWesternandCEEcountriesendedtheyear
withsevereshrinkagesofGDPs.
The international banking system was under constant pressure, caused by substantial non-
performingloanswhichhadanadverseeffectonthelendingcapacity.Tacklingthischallenge
became themainconcernofbanksallover theworld.CentralBanks interfered,adjusting the
monetarypolicy,reducinginterestratesanddevelopingprogramstoensurethenecessaryliquidity.
Butastheyearendedconcernsaboutsovereignandcommercialdebtscontinuedtofuelanxiety,
triggeringacontinuedreluctanceofinvestors.
Within this macroeconomic context, the Romanian National Bank initiated several support
measurestoensuretheliquidityoftheRomanianbankingmarket,keepinginflationandexchange
ratevolatilityundercontrol.
Ifgovernmentsand financial supervisingauthoritiesplaced theirattentiononmeasuresmeant
tocombatandbalancesystemicmalfunctions,BancaTransilvaniaadapted itsbusinessmodel
enhancingtheriskmanagementframeworktobetterassisttheorganizationtoadequatelyprocess
andreportriskrelatedinformation.
Formally,BancaTransilvaniaclassifiesriskintothefollowingmaincategories:(1)creditrisk,(2)
liquidityrisk,(3)marketriskwithitsmaincomponents:(3.1)currencyriskand(3.2)interestrisk,(4)
operationalriskand(5)reputationalrisk,(6)compliancerisk.Infact,thebank’sendeavorsareto
assesandrecognizethepotentialriskrelatedtoanysingletransactionoroperation,quantifying
theirimpactintermsofcapitalrequirements.
Severalscenariosandtheirimpactoncapitaladequacywereregularlyscreenedandoverall2009
targetsweredefinedaccordingly.
Themainriskmanagementprinciplesfollowedbythebankwhendefiningitsyearlystrategy:
•Financialstabilityprotection:limitingtheimpactofpotentialadverseeventsoncapital
andincome;
•Independentperspective:riskmanagement,aswellasthelegalandcompliancefunctions
operatefullyindependently,ensuringtheintegrityofthebank’scontrolprocesses;
•Investmentsdiversificationtoavoidriskconcentration;
•Uniformapproachofriskmonitoringwithinthebankanditssubsidiaries;
•Constantreviewofriskscenariosadaptedtocurrentsituations.
17

ANNUAL REPORT
2 0 0 9
Risk Management system
Credit risk
Oneof themaindecisions promptedby the economic surroundings in the first part of 2009
waslinkedtoBT’slendingapprovalprocesswhichwasshiftedtoheadquarterlevel,thatiscredit
authorityatbranchnetworklevelwastemporarysuspended.Afterthenecessaryaccommodation
processtothenewmacroeconomicconditionswascompleted,i.e.adjustmentoflendingpolicies,
product termsandconditionsandeligibilitycriteria, thebranchnetwork regainedgradually its
lending approval limits. Today, additional monitoring and early warning systems have been
implemented,toavoidadverseeffectscausedbynegativedevelopmentsoftheexisting,aswellas
newlyacquiredportfolio.
Thebasiccreditriskmanagementcomponentssuchas:
•individualcounterpartyratingsystem;
•transactionriskassessmentsystem;
•regional/sectoralconcentrationlimits;
•pricingmethodologybasedonrisks;
wereenhancedby:
•anactivemanagementofloanportfolio;
•newpost-approvalmonitoringsystems(reports&on-sitevisits);
• stringent credit risk provisioningpolicy, includingnon-deductibleprovisions (from the
fiscalperspective),countingfor17.6%oftotalloanprovisions,accordingtoRAS.
Market risk
Inordertoreducemarketrisksinherenttofinancialoperations,theBankadoptedaprudentbut
proactiveapproachtoprotectexpectedtransactionprofitsfromanymarketvolatilityininterestand
exchangerates.
18
Risk Management Department
Corporate Credit Risk Analysis
Risk Inspection
Department
Risk and Monitoring
Department
Operational Risk
Department
Risk Analysis and
ReportingOffice
Operational Risk Monitoring and
InspectionOffice
ANNUAL REPORT
2 0 0 9
BancaTransilvaniafine-tuneditssecuritiesportfoliobyconcentratingonlessvolatile,liquidand
well-dispersed(intermsofmaturityandriskprofile)assets.
Although,BancaTransilvaniadoesnothaveaValue-at-Risksystem,simulations(stresstests)are
constantlyperformedtoprepareforunforeseeablemarketswingsandtoproperlymanagethis
risk.Theroleofstresstestingistoenhanceapro-activemanagement,especiallyastheprofileset
bythebankforthemarketriskis“low/conservative”.Asageneralstrategy,BToptsforplainvanilla
operations,strictlylimitinganyopenpositions.
During2009theNationalBankofRomaniaactivelyusedoneofitsmainmonetarylevers,reducing
theinterestreferenceratefrom10%to8%andpreparingafurtherdecreaseinJanuary2010to
7.5%.Thesedecisions,intendedtostimulatetheeconomiccome-back,wereimmediatlytranslated
by Banca Transilvania which acted as trend setter among the commercial banks, diminishing
lendingrates.
Liquidity risk
Theannualliquiditymanagementstrategysetsprudentialratiolimitsandguidelinesforthebalance
sheetstructure,soastoensurecompliancewiththebestpracticesandthespecificnorms,while
balancingthemaintenanceofsufficientliquiditywithprojectedoperationalprofit.
Liquiditymanagementrelieson3components:
•Strategic Component-balancesheetstructureandannualliquiditymanagementstrategy,
withoptimallevelsofratiosassumedbythebankduringtheyear;
•Management Component-monitoringandapprovingtheshortandmediumtermactions,
onamonthlyandquarterlybasis;
•Operational Component-dailyactionswithinpre-definedcompetencelimits;
IntermsofliquidityratiosobservedbyBT,especiallycashandcashequivalents,liquidassetsto
totalassetsandtheloan-to-depositratioareofutmostimportance.Theirlevelsarepermanently
monitoredand theAssetsandLiabilityCommitteemeetsanddiscussesonaweeklybasis the
actionstobetakentokeeptheseratioswithinthelimitssetbytheannualliquiditystrategy.
Fromaliquidityriskperspective,makinguseofitslargenetwork,thebankalwaysfocusedonraising
retaildepositsinsteadofwholesalefunding.BTtraditionallyreliedonthisbroadretaildepositors’
base,constantlymaintainingaloantodepositratiobelowone.
19

ANNUAL REPORT
2 0 0 9
Furthermore,2009wasmarkedbyashiftinconsumerbehavior,triggeredbythefastexpanding
crisis. In thisclimate,peoplespent lessandsavedmore.Thisnewsituationwasclearly toBT’s
benefit,causingretaildepositstorecordastaggeringincreaseof22%yoy.
Moreover, the National Regulatory Authority reduced the minimum reserve requirement on
deposits both in RON and foreign currency, making available more liquidity to the domestic
economicsystem.Preferringasoundriskprofile,BToptedforsafeandliquidinvestments,placing
availablefundsinTreasuryBillswithanadequatematuritymix,consequentlyboostingtheweight
ofliquidassetsintotalassets.
operational risk
BTdevelopedan internalmechanism toautomaticallygenerate reportsonanyevent thatcan
beclassifiedaccording tooperational riskdefinitionsbasedon itsownoperational riskevents
statistics,national regulations, international standards, recommendationsand systemstatistical
data.
Besidestheelectronicmonitoringtoolsverifyingthecompliancewithoperationalriskmanagement
procedures,aspecializedteam,partoftheOperationalRiskDepartment,performson-sitecontrols
ratingthequalityofoperationalriskmanagementateachunit/department.
Banca Transilvania is continuously building new features to its operational risk management
system:
•Ensuring that thebank-levelpoliciesandproceduresarewrittenaccordinglywith the
operationalriskmanagementprinciplesandcontrols;
• Performing operational risk assessment for the bank’s products and processes and
identifyingtheaggregatelevelofresidualriskfortheseelements;
•Modelingandmaintainingthebusinesscontinuityplan;theprimarysolutionsite(Data
Center)isfullybackedbythesecondaryone(DataRecoveryCenter);theDisasterRecovery
Site isabletosustainall theBank’smainactivities;specificbusinesscontinuityplansfor
eachsubsystemareinplacetestedonaregularbasis;
•Continuouslyenhancingoperationalriskmanagementforbettercapitalallocation;
•Limitingtheeffectsofoperationalrisk,viaspecificinsurancepolicies.
In termsof capital allocation to cover theoperational riskourbankused for2009 thebasic
indicatorapproach(BIA).
20
ANNUAL REPORT
2 0 0 9
Reputational risk
TheefficientmanagementofreputationalriskrepresentsakeymarkerofBT’sstrategy,impacting
thebank’sfinancialpositionatalessforeseeablelevel,onshort,mediumandlongterm.
Monitoringof this typeof risk isbasedonspecific ratiosand takes intoaccount the reporting
of reputational riskeventsaffecting themanagementandsupervision functionof thebank.By
adoptingsuchmeasures,BT takesaction towardsanefficientmanagementofpotentialevents
generatingreputationalriskandsetsupclearobjectivesinordertocounteractthisrisk,toprevent
brandawarenessdepreciationandlossofcustomerconfidence.
Compliance risk
Theyear2009wasimpactedbytheNBRprojecttargetingtheimplementationofcreditinstitutions’
activitymanagementframework,theinternalprocessofcapitaladequacyassessment,aswellas
outsourcingconditions.
TheelementofnoveltybroughtbythisregulationapprovedinSeptember2009isthedefinitionof
compliancefunctionandofcompliancerisk.
Compliance risk awareness has determined to rethink organizational and management
structuresbycreatingthecompliancecoordinationfunction,bydraftingandapplyingassessment
methodologies forcompliance risk,byusingactivityperformance ratiosandbyassigningnew
complianceriskresponsibilitiesrelatedtothemanagementandsupervisionfunction.
TheimplementationofthisprojectistobefinalizedbytheendofH12010.Thiswillrendermore
efficient thecompliance riskmanagementprocess,as it isdefinedby theNBRRegulationno.
18/2009.
21

ANNUAL REPORT
2 0 0 9
INtERNAL AUDItsYstEM
Banca Transilvania’s Internal Audit Department conducts the internal audit of the Group’s
operations,contributingtotheoptimalmanagementofallsystems.TheDepartment’sactivities
arebuiltontheAnnual Audit PlanapprovedbytheBoardofDirectors.
TheAuditDepartmentensurestheproperconductoftheGroup’soperations,beingresponsible
fortheoverallsupervisionofinternalsystems.
Theaudit unitwithin Banca Transilvaniaworks to apply best practices, performing risk based
auditsonpastdatainspections.Auditsarenotonlylimitedtoverifyingandcontrollingdeficiencies,
buttheyalsopointoutcomplianceandriskmanagementproblemsandmakerecommendations
forrequiredfutureactions.
Audit Reporting and subordination
TheAudit Committeewasestablishedtostreamlinetheauditprocess.Thecommitteemeetsevery
monthanddiscussesimportantmattersrelatingtointernalauditing,basedonreportsprepared
bytheauditunit.Functionally,theauditreportsarehandedoverbothtotheAuditCommitteeand
ExecutiveManagementtoassessthefindingsandprovidethebestlinesofreaction.
The internal audit procedures are designed and updated to ensure the communication flow
betweentheBoard,AuditCommittee,thebank’sExecutiveManagementandtheexternalfinancial
auditor.
22
GeneRAlShARehOldeR’SMeetInG
BOARD OF DIRECTORS
Executive Management Committee
Audit Committee
InternalAudit
Department
ExternalAuditor
Committeefor InternalAssessment
ANNUAL REPORT
2 0 0 9
Internal Audit principles within Banca transilvania
Permanence
• Independence
• Objectivity & Impartiality
• Integrity & Professional Competence
• Confidentiality
Internal Audit Ratings within Banca transilvania
•Excellent –risks&processesarecorrectlycontrolled
•Satisfactory–minorproblems,risks&processescontrolledadequately
•Marginally satisfactory-significantproblems,stillacontrollevelofrisks&processes
•Unsatisfactory –seriousproblems,risks&processescontrolledinadequately;
Unacceptable –majorproblems,risks&processesarenotcontrolled
CoMpLIANCE
Anti-Money Laundering, know-Your-Customer & Counter terrorism Financing Legislation
Thecrisishasmadecertainfinancialsystemsmorevulnerabletomoneylaunderingandterrorist
financingthreats.Inthisgloomycontext,theriseof“intelligent”criminalsandmoneylaunderers
renderedsuchactivitiesmoreandmoredifficulttodetectinspiteoftheirapparentlegitimacy.
Compliance with money laundering obligations is one of the greatest challenges nowadays.
Governmentsand supervisoryauthoritiesworldwideare introducingnew lawsand regulations
imposingnewrequirementsinordertoprovidearobustdefenseagainstmoneylaundering.
Amajorissuetobeaddressedbyfinancialinstitutionsistheneedtocomplywithenhancedanti-
money laundering and suspicious transaction reporting laws. Thus, the compliance agenda
formostbanksandfinancial institutionshasrapidlyshiftedfromanarbitrarycommitment toa
mandatoryone.
•
•
23
ANNUAL REPORT
2 0 0 9
Inlightofthenewlegislation,BTgrantsfurtherattentiontothe“compliancefunction”,underlining
its role in assisting the management bodies in the identification, assessment, monitoring and
reportingof compliance risk, ensuring the complianceorganizational structure, reviewingand
draftingtheinternalregulationstoproperlyimplementcompliancestandards.
In2009,wecontinuedsupervisingtheimplementationofthe3rdEuropeanDirective(Directive
2005/60/EC) on the prevention of the use of the financial system for the purpose of money
launderingandterroristfinancing,therequirementsofwhicharetransposedintoNBRRegulation
no. 9/2008 and Law no. 656/2002. Through the application of these regulations, the client
portfolio of Banca Transilvania is reviewed and updated in accordance with the new legal
requirementsconcerningbeneficialownersandpoliticallyexposedpersons.
kYC and AML systems
definingandprioritizingKYCdataqualityrequirements:workingcloselywithregulatory
expertsinanti-moneylaunderingcomplianceanddatamanagement;
focusing on key areas:criticalKYCdatafieldsnecessarytodetectunusualtransactions,
identifyand risk-ratecustomersandprevent financialcrime;gettingparticipation fromkey
personnelincompliance,operations,ITandfrontoffice;
sustaining data quality over time: once the data has been cleansed and integrated,
developsustainedmeasurestoensurethatdataqualitycontinuestomeetorexceedrequired
levelsovertime.Thesemeasuresshouldincludedatamonitoringprograms,developmentof
appropriatepoliciesandprocedures,andcontrolimplementationsforallkeysystems;
assigning individual responsibilitytotheinvolvedpersonnel.
In summary,dataqualityanddata integrationplaya crucial role in renderingKYCandAML
strategiesfunctional,engagingquicklyandcomprehensivelyproactiveresponses.
•
•
•
•
24
Problemnoticed
Actiontaken
Crisissolved

ANNUAL REPORT
2 0 0 9
sUstAINABLE BANkING
Environmental performance
BancaTransilvaniadecidedtobeasupporterofenvironmentalinitiatives,acorporatecitizenwho
believesinefficientlyimplementingacoordinatedenvironmentalriskmanagementframework.
BancaTransilvania’senvironmentalapproachfocusesontwodimensions:
1.Defining,controllingandreducingitsownenvironmentalimpactarisingfromoperationalactivity:
•Electricitymanagement;
•Water&paperconsumption;
•Useofnaturalventilationsystemsvs.airconditioning.
Proactive solutionsareacknowledgedbyBancaTransilvaniaemployees,whovoluntarilymake
efforts tominimize theenvironmental impactsof their dailyactivitiesatwork. Since2008,BT
started the renovation of the headquarters building to optimize the consumption in terms of
electricity,water,fuel,gas,paperandotherwaste.
2.Sustainablebankingviaproductsandservices:
•Financingrenewableenergy;
•Energyefficiencyplatform;
•Environmentinvestments.
In2008,BancaTransilvaniaproposedtoengageitscustomersandpartnersinadvancing
smarterenergyefficiencypractices.Inlinewiththiscommitment,BT’s2009aimwastoframethe
25
Environmental risk management policy
Environmental initiatives implementation
Reduce environmental impact
Promote environmental related business
Energy Efficiency
electricity management
water & paper level reduction
natural ventilation system

ANNUAL REPORT
2 0 0 9
environmentalimpactsregardingfinancedprojectsandsupportclientstominimizetheundesired
environmentaleffects.
Withinthiscontext,anewriskevaluationmodel,ascreeningprocess,wasdesignedtoidentify
thepotentialenvironmentalissuesassociatedwithaproject,soastorecognizeboththenegative
aspectsofcertainundertakings,aswellaspositiveoutcomes.
EnergyEfficiencyfacilitiesatcompetitiverates,withgrantsforsuccessfulfinalizationoftheinvestment
wereofferedtoourclients.Wealsoprovidedfreetechnicalassistancefortheseprojects,withon-
linesupport,thecustomers’soleconcernbeingtheircommitmenttowardsviableenergysaving
solutions.
Withitsspecializedbankingproductsandservices,BancaTransilvaniawillcontinuetosupport
innovativetechnologiesandenergysavingprojectstocontributetomaintaininganecologically
balancedenvironment.
Corporate social Responsibility
BancaTransilvaniapreservedinatransparentandethicalmannerits2009socialinvolvement,
regardlessoftheeconomicenvironment.
ThemostimportantprojectcontinuedtobeClujul areSuflet,whichhasgainedbynowitsown
identity.Withover twoyearsofexperience, theproject reaching thematurity stage,managed
to engage as many Cluj citizens as possible. This undertaking in partnership with Romanian
Foundation for Children, Community and Family - Cluj (FRCCF), helped and supported over
500teenagerstoreintegratesocially.InadditiontothedirectmaterialaidofferedbyBT,during
September –December2009 for eachpaymentwithaBT card,1RONwasdonated to the
Foundation.
BT’stotaldonationswereRON450,000,ofwhichRON250,000viaFundatiaTransilvaniaand
therestasaconsequenceofthecardpaymentcampaign.
26
Wemanagedtoassist:
115studentstoimprovetheirgrades
26studentstopasstheirfinals
41youthstoqualifyforajob
69teenagerstofindajob

ANNUAL REPORT
2 0 0 9
OureffortswereacknowledgedbyForbesmagazine,whichplacedBTthirdin2009amongstthe
mostgenerousRomaniancompanies.WealsoreceivedtheExcellencyawardgrantedbyTVRCluj
for“efficientmanagementofemotionalcapitalandcivicspirit”atMediaExcellencyawards.
Clujul areSufletwasaninspirationnotonlyforClujcitizensbutforourBucharestcolleagues
aswell.Theyhelpedthelessfortunate,withasmallscaleundertaking,butwithgreataffective
impact.NewfurniturewassuppliedtoFundeniHospital,PediatricOncologyDepartment,sothat
thechildrencouldenjoyanewcolorfulenvironment.
social welfare
Beforemajorholidays (suchasChristmas,Easter,March1st– thebeginningofspring,March
8th – International Women’s Day) the bank’s ground floor becomes a charity bazaar, where
theheadquartersemployeescanpurchasecardsandornaments,whichareskillfullycraftedby
childrenwithspecialneeds(eitherphysical,psychologicalorsocial).BT’smanagementstrongly
supportstheseactivitiesandtheemployeesenjoyacquiringbeautifulhandicrafts,whilemakinga
contributiontoprovidinglittleartistswithabetterfuture.
Community projects
Banca Transilvania also provides support for students via “Student Plus” program. Highly
attractiveplatform,allowingyouthswithOmnipassandVisaElectronEuro<26cardstobenefit
fromcertainpricediscounts(suchaspublictransportation)matchingtheirlifestyle.Wewerejoined
inthisundertakingbyprestigiouslocalinstitutions,suchastheTechnicalUniversity,Babeş-Bolyai
UniversityandtheLocalTown-HallandCouncil.
CsR in the medical field
BancaTransilvaniaofferedsupporttothemedicalsector,evenmoresosinceBThasadedicated
businesslinetoassisttheRomanianmedicalsystem.Weencouragedandhelpedaseriesofspecific
programs,thuscontributingtothesuccessofcertainphysician’sinitiativeswithentrepreneurialspirit.
27
Projects:
FirstprivategeriatricscenterinArad
StateoftheartmedicalimaginginGiurgiu,Galaøi,SatuMare,
Baia Mare and Piteşti Hospitals
FirstprivategastroenterologycenterinCluj-Napoca
FirstdentalchairinasmallvillageinTulcea
FinancingaprivatestemcellbankinBucharest

ANNUAL REPORT
2 0 0 9
CsR for entrepreneurs
Support the Romanian businesses!showedourcommitmentandinvolvementinthesociallifeof
Clujcitizens,supportingthejumpstartofmicro-businesses.Togetherwiththeonlinepublication
HotNews.ro,weorganizedacontestmeanttorewardthebestbusinessinitiative,andsowedid.
“Carry me, mommy”hadgreatimpact,asitproposedaneasyandinventivewaytohelpyoung
motherscarry theirbabies,byusingbabyslings.BTwilloffersupportviafinancialconsultancy
services,designofaprofessionalsiteandpromotiononGoogle AdWords.
CsR for employees
InOctober 2009, BTorganized the11th editionof the running contest –Crosul BT, by now
an official trademark of the bank, which had Gabriela Szabo, multiple international athletics
champion,asspecialguest.The4kmracewasheldforamateursportsmenandBTemployees.
Dear participants,
I was happy to learn that the tradition of this running
competition was revived. This is why I will be by your side
at the start line, to get to know you and cheer you on.
I look forward to giving the official start to this wonderful health
training program!
All the best,
Gabi Szabo
28
BT’ssocialresponsibility“comesfrom
theinside”,fromitsteamdrivenby
involvement,commitmentandproactive
attitudecombinedwithresponsibility.

ANNUAL REPORT
2 0 0 9
HUMAN REsoURCEs
Evenif2009broughtashiftinHRpriorities,BTcontinuedtofocusonefficienthumanresource
services, so that the bank’s near term objectives could be balanced with long term business
requirements.
Withcompaniesandbankinginstitutionsreducingtheirworkforce,wewerereadytoadaptquickly
tothechangingbusinesspriorities,retaininganddevelopingourexistingemployees’corebase.
To be among the winners, the executive management, together with our HR Department
consideredthebestpracticestoprovideamovingforwardbalancedapproach,byincludingboth
costreductionmeasures,andsmartinvestmentsintalentsaswell.
Staffprofile
Skill and competence were our assets in times
of crisis. 2009 human resources strategy was
centered on key personnel. Communication,
initiative and talent were rewarded and
encouraged,soastomaintainBT’scompetitive
edge.
hRinfigures:2008vs.2009
29
Gender Breakdown
male
female
23.7%
76.3%
Staff Average Age
2003
34.5
2004
32.2
2005
31.1
2006
30.6
2007
31.1
2008
31.2
2009
33.24
Headcount Evolution
2003 2004 2005 2006 2007 2008 2009
staff numbernewcomers
TotalHeadcount
ActiveEmployees
Dec 2008
6,507
6,036
Dec 2009
6,126
5,285

ANNUAL REPORT
2 0 0 9
Withinthiscontext,theactivityofBT Academycapitalizedontheexistingtalentpool,identifying,
retainingandrewardingviatrainingprograms,theemployeesthatmakeadifference.
Financialanalysisandcreditriskmanagementwerethetwomaintrainingdirectionsof2009.650 corporate and SME division employeeswereengagedinspecifictrainingprogramsmoderated
byoutsidespeakersandBTspecialists.Theseminarsweretargetedatraisingemployees’awareness
withrespecttoBaselIIrequirementsandcompliancewiththevastarrayofregulationsimposedby
thesupervisionauthority.
A solid operational risk management training platform was built up by the top management
togetherwithComplianceprofessionals,soastosupportthehighvelocitychangesimposedbythe
2009climate.Consequently,850colleaguesattendedtrainingsessionsonfraudidentification
andprevention,know-your-customerandoperationalriskmanagement.
Asproductsandservicessetusapartfromourcompetitors,wedevelopedmultiplecoursesmeant
toenhanceouremployees’customercareskills.Training on products and servicescomprises
alargerangeofsessionsprovidedtoourstafftobecomethoroughlyaccustomedwiththebest
possiblepracticestoensurecustomersatisfaction.
HRDepartmentwithinBancaTransilvaniaiscontinuallybeingchallengedtoprovidemanagement programsintendedtoraiseexpertise,efficiencyandcompetenceofkeypersonnelandenhance
communicationskillsandinterpersonalrapportsatdifferenthierarchicallevels.Asaresult,MBA
programs,leadershipandcommunicationcourseswereimplementedduring2009.
30
Reinforcing “BT Spirit”
Professionaland
risk aware
Teamwork
Human capital•retention•performance management•training
Staffreallocation/re-qualification
Reinforcing BT Spirit Teamwork
Professional & risk aware
Human capital
Staff reallocation &
re-qualification
ANNUAL REPORT
2 0 0 9
MARkEtING AND CoMMUNICAtIoN
TheBank for Entrepreneurial Peopleconceptcontinuedtobepromotedduring2009throughout
allmarketingprojectsrolledoutbyBancaTransilvania.Notonlydidweconveytothepublicthe
messagethatBTsupportsentrepreneurialpeople,butwealsoacted“entrepreneurial”throughlarge
scaleadvertisementcampaignsandspecific,punctualactivities,beingbothinnovativeandefficient.
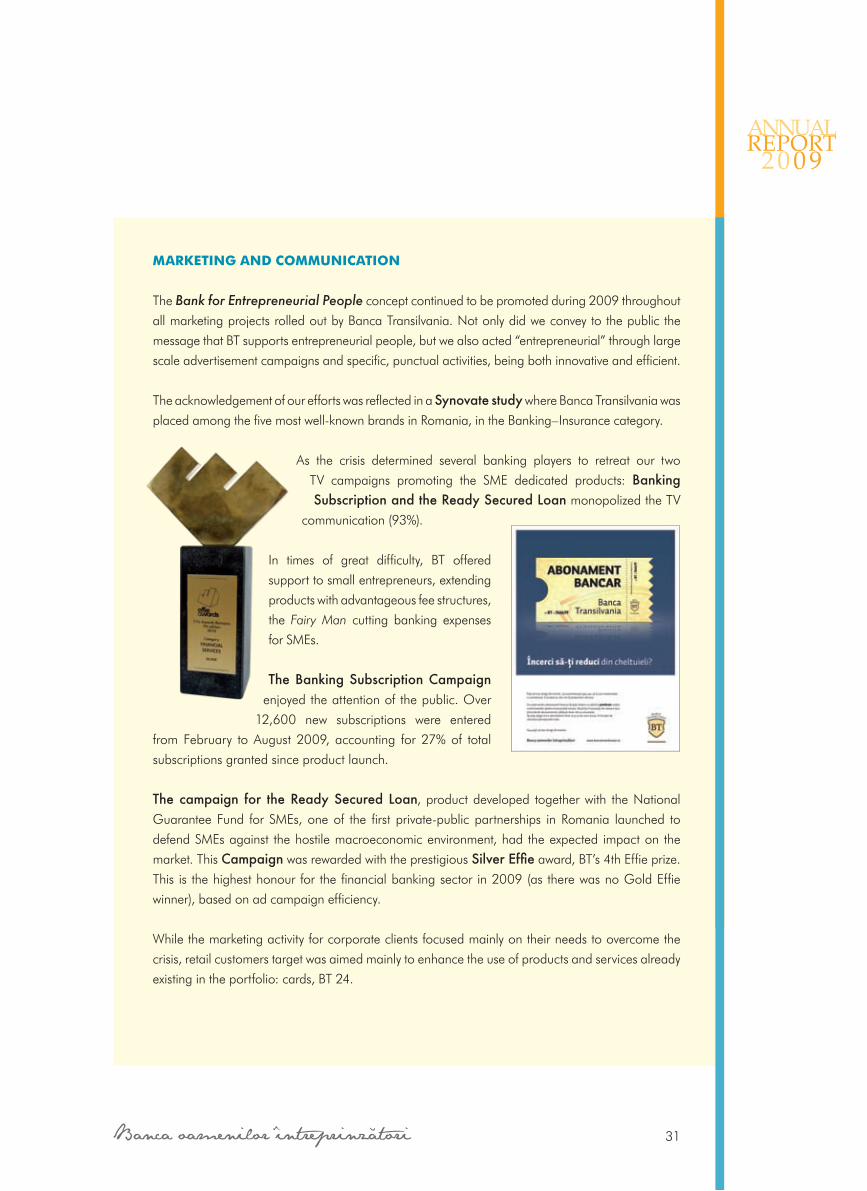
TheacknowledgementofoureffortswasreflectedinaSynovate studywhereBancaTransilvaniawas
placedamongthefivemostwell-knownbrandsinRomania,intheBanking–Insurancecategory.
As the crisis determined several banking players to retreat our two
TV campaigns promoting the SME dedicated products: Banking Subscription and the Ready Secured LoanmonopolizedtheTV
communication(93%).
In times of great difficulty, BT offered
supporttosmallentrepreneurs,extending
productswithadvantageousfeestructures,
the Fairy Man cutting banking expenses
forSMEs.
The Banking Subscription Campaign
enjoyedtheattentionofthepublic.Over
12,600 new subscriptions were entered
fromFebruary toAugust 2009, accounting for 27%of total
subscriptionsgrantedsinceproductlaunch.
The campaign for the Ready Secured Loan,productdeveloped togetherwith theNational
GuaranteeFund for SMEs,oneof the first private-publicpartnerships inRomania launched to
defendSMEsagainst thehostilemacroeconomicenvironment,had theexpected impacton the
market.ThisCampaignwasrewardedwiththeprestigiousSilvereffieaward,BT’s4thEffieprize.
This is thehighesthonourfor thefinancialbankingsector in2009(as therewasnoGoldEffie
winner),basedonadcampaignefficiency.
Whilethemarketingactivityforcorporateclientsfocusedmainlyontheirneedstoovercomethe
crisis,retailcustomerstargetwasaimedmainlytoenhancetheuseofproductsandservicesalready
existingintheportfolio:cards,BT24.
31

ANNUAL REPORT
2 0 0 9
Cardswereagainstarproducts,asignificantpartofthemarketing
activitytargetedthissegment.VISA ELECTRON,Your Daily Card Campaignpositionedtheuseofcardsasaday-by-day
instrument,even forsmallpayments. In fact, increase inPOS
cardusagefulfilledourexpectationsfor2009andrecordeda
22.7% rise in December 2009 vs. June 2009.
Besidesthe“classical”promotiontools,over400ATMswere
redesignedtodisplayspecificcampaignlogos.
DuringtheWin in 3 Moves!campaign,theFairy Manoffered
prizes to customerswhoused threeoutof fiveBTproducts.
Thisprogramcontributed significantly to the intensiveuseof
productsbytheexistingcustomerbase.
Moreoverin2009,westrengthenedtheconceptof“The Bank for utilities”. Pay your bills at Banca Transilvaniawaslaunchedforourcustomerstomakebillpaymentaneasy,linefreeactivity.
Theco-brandedBT - Western Unioncampaignmadeproof
ofsimplicityandreliabilitytothebestofourcustomers.Thus,
themarketshareonthissegmentincreasedto20.35%.
Inonlinemarketing,wecontinuedto improveInternetbrand
awarenessandsales.
Anewtypeofonlinecommunicationwasinitiatedbycreatinga
BTprofileonFacebook,thelargestsocialnetworkingwebsite.
OurpresenceinthistypeofenvironmentenhancesBT’sonline
visibility,placingthebankinthespotlight.
WeweretheBank for Entrepreneurial peopleontheInternet
aswell.HundredsofRomanianentrepreneursbenefitedfrom
advertisingspaceinGoogleAdWords,followingthe Google Friend Campaign.
AnotheringeniousinitiativewasBT-Daily Planner,anonline
applicationhelpingourclientstoefficientlymanagetheirdaily
tasks.
32

ANNUAL REPORT
2 0 0 9
public relationscontinuedtosupporttheBank’sintegratedcommunication,focusingonthe
relationshipwiththemass-media.Foraconsistentandtransparentcommunication,severalpress
releases were sent per week, thus ensuring an outstanding information flow between Banca
Transilvaniaandthepress.Thetopicscoveredinformationonthebank’sfinancialresults,business
line results, financings received from strategicpartners (IFC,EBRD),
partnerships,Clubul Întreprinzătorului Românactivities.
Internal communication played an important role in Banca
Transilvaniatoo,greatemphasisbeingplacedonkeepingour
employeespermanentlyupdated.
PR strategy in2009 targetedawareness and reputation
preservation,aswellasthepromotionofBTastheBank
forEntrepreneurialPeople.
Integrated communication was the key to success in 2009, achieved by
efficient means, via marketing and PR initiatives, in environments meant to
createvisibilityandbrandawareness.
33
During2009,thesitehad1,644,742solevisitorswith
5,402,288logins
www.bancatransilvania.rowasviewed14milliontimes
Eachvisitlastedinaverage2minutes
ANNUAL REPORT
2 0 0 9
opERAtIoNs AND It
2009 main achievementsWehadagoodbusinessevolutionin2009,markedbytheincreaseandconsolidationofmarket
shareinseveralsegments(domesticpayments,cards,debitinstruments)reachingvaluescloseto
15%.
Duetotechnicalstaffwithhighlevelexpertise,wesucceededindevelopingadequateITsupport,
whilemaintaininglowoperationalcosts.
WorthmentioningisthechangeoftheCardSystemITplatformandtheacquisitionofExadataV2
equipmentprovidedbyOracle&Sun,inordertoincreaseperformancerelatedtoDataWarehouse
andMIS.
2010 priorities and objectivesFortheyeartocome,weintendtodevelopnewandmoresophisticatedbankingproductsoffered
viavariousdistributionchannels.Therefore,itisessentialtoincreaseefficiencyandperformancein
ourcorebankingsystemtosupportthebank’sintensivegrowthandthehightransactionvolumes,
butalsotocomplywiththesuperiorqualitystandardssetforourclients,theNationalBankand
theAuditors.
Ouroperationalinitiativesconsistin:
business reengineering,throughactivitycentralizationandcostcontrolusinge-channels;
quality managementintermsofproductsandservicesandproductlifecycles.
In terms of technologies, we analyze the opportunity of implementing a new, scalable Core-
BankingsystemandanenhancedInternetBankingsolution.
AmongourITstrategicgoals,wemention:
customerserviceenhancement,expressingoureffortstorespondtocustomerneedsina
timelyandeffectivemanner;
alignmentandagility,becausewesetprioritiesbasedonbusinessdriversandweadaptto
changingcustomerneeds;
financialcontribution, for thepurposeofaccuratecostestimationandefficient resource
allocation;
updatedtechnologyinordertoensureconfidentiality,securityanddataintegrity;
enterprisearchitecture,meaningourattemptstosimplifytheenvironmenttoensurestable
andefficientperformanceforcrucialapplications.
••
•
•
•
•
•
34

ANNUAL REPORT
2 0 0 9
MAIN sUBsIDIARIEs
Bt Leasing transilvania IFN s.A.
Withover14yearsofexperience,staffprofessionalismandclient-tailoredfinancialsolutions,BT
Leasingoffersaccessibleandadvantageous funding for theacquisitionofgoodsbymeansof
financelease.
In2009,BTLhad2,475clientsservicedvia25branchesthroughoutthecountry.Ourbusiness
modelisstrategicallyconnectedtoBancaTransilvania’s,creatinginter-groupsynergyandcross-
sellingopportunities.
TheleasingproductsaredesignedascomplementarytoBT’sbankingoffer:
•LeasingStandard–basicproduct;
•LeasingRapid-designedforcorporateclients;
•LeasingTakeandGo-bothforretailandcorporateclients;
•RefinanceLeasing-uniqueproductfullyadaptedtotheclient’sneeds;
•Lease-Back/Cash In -productwhichallowscompanies toenjoy thebenefitsofworking
capital,whilestillusingthe“Sale&Leaseback”goods;
Ourcontinuedsuccessinthemarketin2009washighlightedbytheincreaseinsharecapitalRON
3,643,321,reachingRON39,910,314,whiletheturnoverrosetoRON43,276,225,comparedto
RON38,368,887attheendof2008.
Bt securities s.A.
2009activity startedwith clear cut,well-definedobjectives, so as to reflect the consolidation
processontheprimarycapitalmarket.Increasingmarketshare,raisingefficiency,improvingrisk
managementactivity,anddevelopingtheITinfrastructure,inordertoaccommodatethesubstantial
workloadweretheguidingprinciplesthroughouttheyear.
IntermsofmarketshareandnetworkBTSecuritieswasamongtheleadinginstitutions.Inthearea
ofstocktradingandbrokeragehousesonBucharestStockExchange,BTSwasranked1stin2009,
withamarketshareof9.87%.Moreover,16RomanianCountiesarecoveredbyBTSecurities
network,themostextensiveplatformofanybrokeragecompanyinRomania.
In2009,BTSecuritiesmaintaineditsstatusastheonlyintermediaryinRomaniawhichofferedits
clientsmarginanddirecttransactionsontheViennaStockExchange(WienerBörse).
35

ANNUAL REPORT
2 0 0 9
36
Capital market development fully confirmed the accuracy of the company’s market research
reports,encouragingitsspecialiststocontinueonthesamepath.
BTScarriedonitsstrategybyactiveinvolvementontheprimarycapitalmarket,bymeansof:
issuing municipal bonds for Alba-Iulia Town Hall & County Council, Focşani, Orãştie and
NãvodariTownHalls;
winning the tender for financing Botoşani Town Hall;
finalizingfivepublictenderoffersinitiatedbydifferentlistedcompanies;
startingtheinitialpublicoffering,followedbylistingontheBSE,for3internationalairports:
“Henri Coandã” in Bucharest, “Mihail Kogãlniceanu” in Constanøa and “Traian Vuia” in
Timişoara.
Bt Asset Management s.A.I. s.A.
BTAssetManagement,thebiggestequityfundmanagerontheRomanianmarket,rankedfourthin
theassetmanagementbusinesswithamarketshareof5.5%.Itspecializesinfundandindividual
investmentaccountsmanagement.
Attheendof2009,theassetsunderthecompany’smanagementamountedtoRON171milion,
representinga136.52%risecomparedto2008.Thenumberofclientsalsoincreasedtoover
6,500in2009.
In2009,therewasasignificantboostinmanagedassets,onthebackgroundoftheincreased
attractivenessofourproductsgiventheirappealingyields.
•
•
•
•
YIELD, 2009
BTObligatiuni
BTClasic
BTIndex
BTMaxim
14.01%
25.84%
50.11%
62.78%
AssetsunderManagement
Numberofclients
2008
72,355,608
2,237
2009
171,135,214
6,521
%
136.52
191.51

ANNUAL REPORT
2 0 0 9
37
Medicredit Leasing IFN s.A.
Establishedin2003asanon-bankingfinancialinstitution,MedicreditLeasinghasmanagedto
gainthestatusofleaderontheprivatemedicalmarket,witha54%marketsharein2009interms
ofmedicalequipmentleasing.
Over theyears, thecompany succeeded inaddressingdifferentneeds,whetherclientswished
to expand existing medical businesses or required technical-financial solutions for a start-up
company.
Medicredit Leasing provides to its customers integrated technical-financial solutions through
packageoffers,consistingoftechnicaladviceonmedicalequipment,businessandmanagerial
consultancy,followedbyfinancialsupport.
BancaTransilvaniabecameashareholderin2006,increasingitsparticipationto57.39%in2008.
Startingwith2010MedicreditLeasingisfullyownedbyBT,thebankcompletingitsproductoffer
fortheHealthcareDivision,addingleasingfacilitiestothebankingproductsandservices.
Duetoitsexpertiseinthemedicalfieldandtrustgainedamongstphysicians,Medicreditextended
itsactivitycountrywidein2009servicing29largeclinics,5newscreeningcenters,aswellasa
newmultidisciplinarymedicalcenter.
Bt Direct IFN s.A.
Specializedinconsumerfinance,BTDirectportfoliodynamicsin2009showedatotalfinancing
valueofRON16.3millionfor7,767newcontracts,withthefollowingbreakdown:RON6million
financeleasingagreementsandRON10.3millionlendingcontracts.
BTDirectcollaborateswith460partnerstoresandfinancesover18,600clients.
FINANCIAL HIGHLIGHTS, 2009
Totalincomefromfinancingoperations
Totalincome
Grossprofit
Taxonprofit
Netprofit
2009
5,931,218
6,581,418
1,548,816
203,480
1,345,336
2008
4,805,492
5,403,547
432,885
252,588
180,297
RON
BANCA TRANSILVANIA S.A.
Consolidated Financial Statements31 December 2009
Prepared in accordance with the International Financial Reporting Standards
as endorsed by the European Union
TRANSLATOR’S EXPLANATORY NOTE:
The above is provided as a free translation from Romanian which is the official and binding version.

INDEPENDENT AUDITORS' REPORT(free translation1)
The ShareholdersBanca Transilvania S.A.
Report on the consolidated financial statements
1 We have audited the accompanying consolidated financial statements of Banca Transilvania S.A. and its subsidiaries (the“Group”), which comprise the consolidated statement of financial position as at 31 December 2009 and the consolidatedincome statement, the consolidated statement of comprehensive income, the consolidated statement of changes in equity andthe consolidated cash flow statement for the year then ended, as well as a summary of significant accounting policies andother explanatory notes.
Management's responsibility for the consolidated financial statements
2 Management is responsible for the preparation and fair presentation of these consolidated financial statements in accordancewith International Financial Reporting Standards as endorsed by the European Union. This responsibility includes: designing,implementing and maintaining internal control relevant to the preparation and fair presentation of consolidated financialstatements that are free from material misstatements, whether due to fraud or error; selecting and applying appropriateaccounting policies; and making accounting estimates that are resonable under the circumstances.
Auditors' responsibility
3 Our responsibility is to express an opinion on the consolidated financial statements of the Group based on our audit. Weconducted our audit in accordance with Standards on Auditing as adopted by the Romanian Chamber of Financial Auditors.Those standards require that we comply with relevant ethical requirements and plan and perform the audit to obtainreasonable assurance whether the consolidated financial statements are free from material misstatements.
4 An audit involves performing procedures to obtain audit evidence about the amounts and disclosures in the consolidatedfinancial statements. The procedures selected depend on our judgment, including the assessment of the risks of materialmisstatement of the consolidated financial statements, whether due to fraud or error. In making those risk assessments, weconsider internal control relevant to the entity’s preparation and fair presentation of the consolidated financial statements inorder to design audit procedures that are appropriate under the circumstances, but not for the purpose of expressing anopinion on the effectiveness of the entity’s internal control. An audit also includes evaluating the appropriateness ofaccounting principles used and the reasonableness of accounting estimates made by management, as well as evaluating theoverall presentation of the consolidated financial statements.
5 We believe that the audit evidence we have obtained is sufficient and appropriate to provide a basis for our opinion.
Opinion
6 In our opinion, the accompanying consolidated financial statements of Banca Transilvania S.A. and its subsidiaries presentfairly, in all material respects, the consolidated financial position of the Group as at 31 December 2009, and its consolidatedfinancial performance and its consolidated cash flows for the year then ended in accordance with International FinancialReporting Standards as endorsed by the European Union.
2
1 TRANSLATOR'S EXPLANATORY NOTE: The above translation of the auditors' report is provided as a free translation from Romanian whichis the official and binding version.

Emphasis of matters
7 Without qualifying our opinion, we draw attention to the following:
• As presented in Notes 3j, 19 and 20 to the consolidated financial statements, the Group has estimated the impairment lossprovision for loans and advances to customers and net lease investments at RON 826,912 thousand based on the internalmethodologies developed and applied as at 31 December 2009. We draw attention to the limitations mentioned in Note3j and to the uncertainties on the local financial markets regarding the operating environment and assets valuationmentioned in note 4f to the consolidated financial statements.
• As presented in Note 2c to the consolidated financial statements, the Group has presented in Euros for the convenience ofreaders the amounts reported in Lei in the consolidated balance sheet and in the consolidated income statement. Thispresentation does not form part of the audited financial statements.
Other Matters
8 This report is made solely to the Bank’s shareholders, as a body. Our audit work has been undertaken so that we might stateto the Bank’s shareholders those matters we are required to state to them in an auditor's report and for no other purpose. Tothe fullest extent permitted by law, we do not accept or assume responsibility to anyone other than the Bank and the Bank’sshareholders as a body, for our audit work, for this report, or for the opinions we have formed.
Report on conformity of the administrators’ report with the consolidated financial statements
In accordance with the Order of the National Bank of Romania no. 13/2009, article no. 223, point (e) we have read theaccompanying administrators’ report on the consolidated financial statements of Banca Transilvania S.A. and its subsidiaries (the“Group”) prepared in accordance with International Financial Reporting Standards as endorsed by the European Union as at andfor the year ended 31 December 2009. The administrators’ report as presented from page 1 to 22 is not a part of the Group'sconsolidated financial statements. In the administrators’ report we have not identified any financial information which is notconsistent, in all material respects, with the information presented in the Group's consolidated financial statements as at 31December 2009.
Please refer to the original signed Romanian version
For and on behalf of KPMG Audit SRL:
Cezar Gabriel Furtuna KPMG AUDIT SRL
registered with the Chamber of Financial registered with the Chamber of FinancialAuditors of Romania under no. 1626/2003 Auditors of Romania under no. 9/2001
Bucharest, 29 March 2010
3
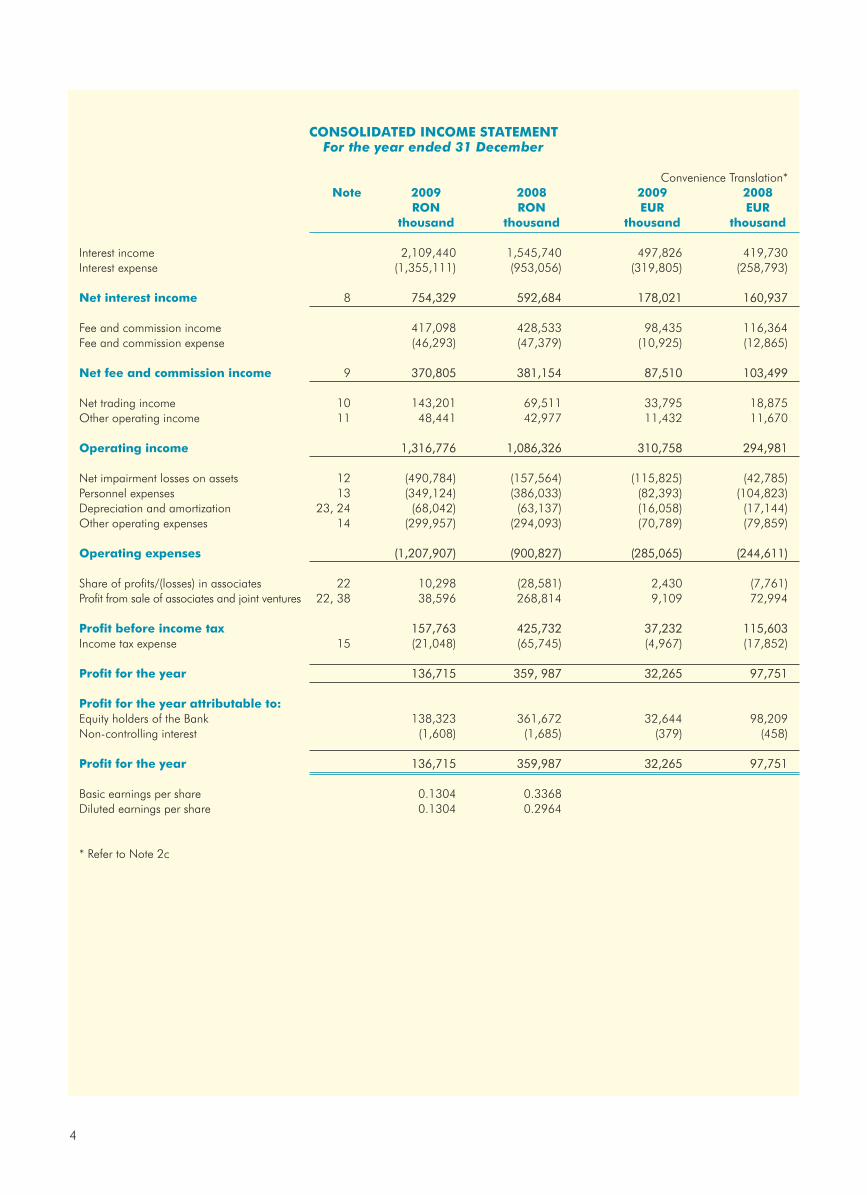
CONSOLIDATED INCOME STATEMENTFor the year ended 31 December
Convenience Translation*Note 2009 2008 2009 2008
RON RON EUR EURthousand thousand thousand thousand
Interest income 2,109,440 1,545,740 497,826 419,730 Interest expense (1,355,111) (953,056) (319,805) (258,793)
Net interest income 8 754,329 592,684 178,021 160,937
Fee and commission income 417,098 428,533 98,435 116,364 Fee and commission expense (46,293) (47,379) (10,925) (12,865)
Net fee and commission income 9 370,805 381,154 87,510 103,499
Net trading income 10 143,201 69,511 33,795 18,875 Other operating income 11 48,441 42,977 11,432 11,670
Operating income 1,316,776 1,086,326 310,758 294,981
Net impairment losses on assets 12 (490,784) (157,564) (115,825) (42,785)Personnel expenses 13 (349,124) (386,033) (82,393) (104,823)Depreciation and amortization 23, 24 (68,042) (63,137) (16,058) (17,144)Other operating expenses 14 (299,957) (294,093) (70,789) (79,859)
Operating expenses (1,207,907) (900,827) (285,065) (244,611)
Share of profits/(losses) in associates 22 10,298 (28,581) 2,430 (7,761)Profit from sale of associates and joint ventures 22, 38 38,596 268,814 9,109 72,994
Profit before income tax 157,763 425,732 37,232 115,603 Income tax expense 15 (21,048) (65,745) (4,967) (17,852)
Profit for the year 136,715 359, 987 32,265 97,751
Profit for the year attributable to:Equity holders of the Bank 138,323 361,672 32,644 98,209 Non-controlling interest (1,608) (1,685) (379) (458)
Profit for the year 136,715 359,987 32,265 97,751
Basic earnings per share 0.1304 0.3368Diluted earnings per share 0.1304 0.2964
* Refer to Note 2c
4

CONSOLIDATED STATEMENT OF COMPREHENSIVE INCOMEAs at 31 December
Convenience Translation*Note 2009 2008 2009 2008
RON RON EUR EURthousand thousand thousand thousand
Profit for the year 136,715 359,987 32,265 97,751
Other comprehensive income, net of income tax
Fair values gains/(losses) from available for sale investments (net of deferred tax) 44,405 (65,890) 10,480 17,892Other changes 2,950 (17,853) 696 (4,848)
Total comprehensive income for the period 184,070 276,244 43,441 110,795
Total comprehensive income attributable to:Equity holders of the Bank 186,692 276,028 44,059 74,952Non-controlling interest (2,622) 216 (618) 59
Total comprehensive income for the period 184,070 276,244 43,441 75,011
* Refer to Note 2c
The consolidated financial statements were approved by the Board of Directors on 29 March 2010 and were signed on its behalf by:
Horia Ciorcila Maria MoldovanChairman Chief Financial Officer
5
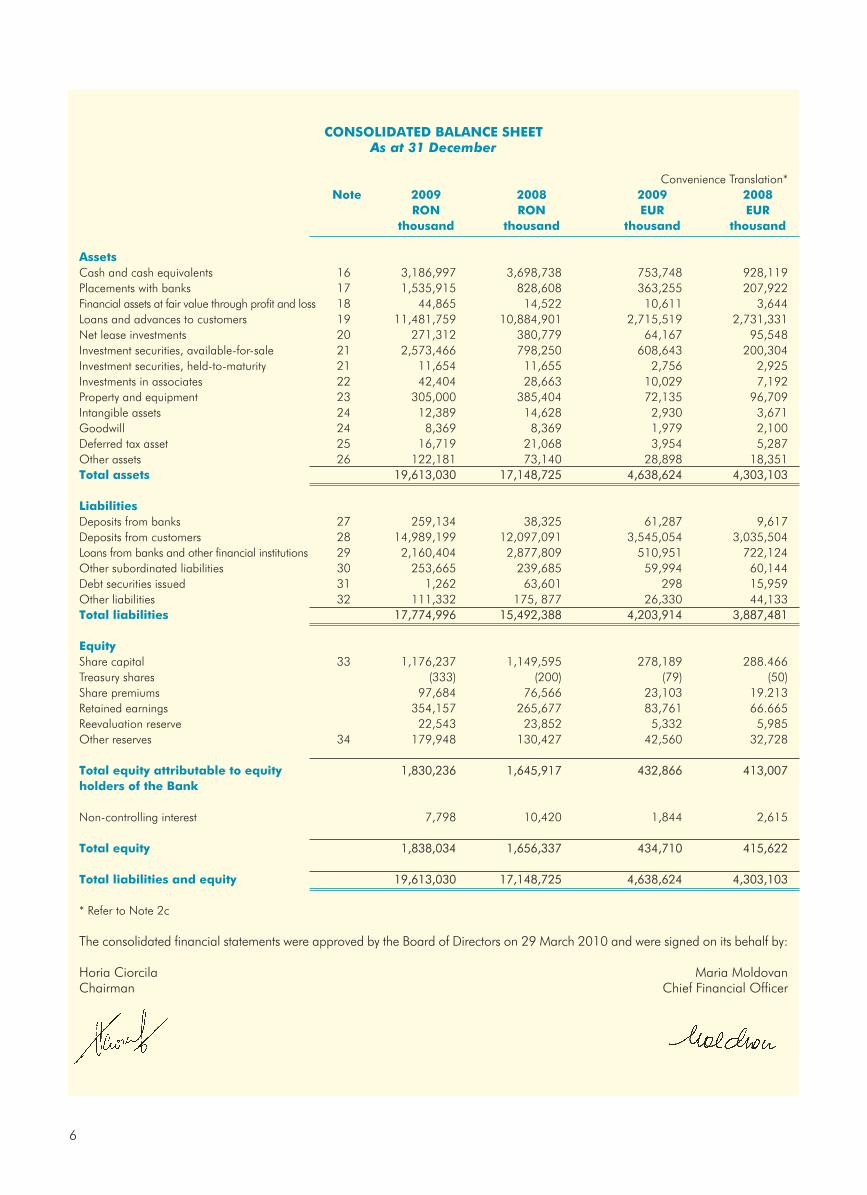
CONSOLIDATED BALANCE SHEETAs at 31 December
Convenience Translation*Note 2009 2008 2009 2008
RON RON EUR EURthousand thousand thousand thousand
AssetsCash and cash equivalents 16 3,186,997 3,698,738 753,748 928,119 Placements with banks 17 1,535,915 828,608 363,255 207,922 Financial assets at fair value through profit and loss 18 44,865 14,522 10,611 3,644 Loans and advances to customers 19 11,481,759 10,884,901 2,715,519 2,731,331Net lease investments 20 271,312 380,779 64,167 95,548 Investment securities, available-for-sale 21 2,573,466 798,250 608,643 200,304 Investment securities, held-to-maturity 21 11,654 11,655 2,756 2,925 Investments in associates 22 42,404 28,663 10,029 7,192 Property and equipment 23 305,000 385,404 72,135 96,709 Intangible assets 24 12,389 14,628 2,930 3,671 Goodwill 24 8,369 8,369 1,979 2,100 Deferred tax asset 25 16,719 21,068 3,954 5,287 Other assets 26 122,181 73,140 28,898 18,351Total assets 19,613,030 17,148,725 4,638,624 4,303,103
LiabilitiesDeposits from banks 27 259,134 38,325 61,287 9,617 Deposits from customers 28 14,989,199 12,097,091 3,545,054 3,035,504 Loans from banks and other financial institutions 29 2,160,404 2,877,809 510,951 722,124 Other subordinated liabilities 30 253,665 239,685 59,994 60,144 Debt securities issued 31 1,262 63,601 298 15,959 Other liabilities 32 111,332 175, 877 26,330 44,133Total liabilities 17,774,996 15,492,388 4,203,914 3,887,481
EquityShare capital 33 1,176,237 1,149,595 278,189 288.466Treasury shares (333) (200) (79) (50)Share premiums 97,684 76,566 23,103 19.213 Retained earnings 354,157 265,677 83,761 66.665Reevaluation reserve 22,543 23,852 5,332 5,985 Other reserves 34 179,948 130,427 42,560 32,728
Total equity attributable to equity 1,830,236 1,645,917 432,866 413,007holders of the Bank
Non-controlling interest 7,798 10,420 1,844 2,615
Total equity 1,838,034 1,656,337 434,710 415,622
Total liabilities and equity 19,613,030 17,148,725 4,638,624 4,303,103
* Refer to Note 2c
The consolidated financial statements were approved by the Board of Directors on 29 March 2010 and were signed on its behalf by:
Horia Ciorcila Maria MoldovanChairman Chief Financial Officer
6

7
CO
NSO
LID
ATE
D S
TATE
MEN
T O
F C
HA
NG
ES I
N E
QU
ITY
For
the y
ea
r en
ded
31
Dece
mb
er
20
09
Att
rib
uta
ble
to e
qu
ity
hold
ers
of
the B
an
k
In R
ON
thou
sand
Sha
re
Trea
sury
Sha
reRee
valu
ation
Oth
er
Ret
ain
edN
on
-con
trollin
gTo
tal
cap
ita
lsh
are
sp
rem
ium
sre
serv
esre
serv
esea
rnin
gs
inte
rest
Ba
lan
ce a
s a
t 31 D
ece
mb
er
2008
1,14
9,59
5(2
00)
76,5
6623
,852
130,
427
265,
677
10,4
201,
656,
337
Tota
l co
mp
reh
en
sive
in
com
e
for
the p
eri
od
Prof
it fo
r th
e ye
ar-
--
--
138,
323
(1,6
08)
136,
715
Oth
er
com
pre
hen
sive
in
com
e,
net
of
inco
me t
ax
Tran
sfer
from
ree
valu
atio
n su
rplu
s to
re
tain
ed e
arni
ngs
--
-(1
,309
)-
1,30
9-
-Fa
ir va
lue
gain
s fro
m a
vaila
ble
for
sale
inve
stm
ents
(net
of d
efer
red
tax)
--
--
44,4
05-
-44
,405
Oth
er c
hang
es-
--
-1,
376
2,58
8(1
,014
)2,
950
Tota
l co
mp
reh
en
sive
in
com
e
for
the p
eri
od
---
(1,3
09)
45,7
8114
2,22
0(2
,622
)18
4,07
0
Incr
ease
in s
hare
cap
ital t
hrou
gh
conv
ersi
on o
f bon
ds26
,642
--
--
--
26,6
42In
crea
se in
sha
re p
rem
ium
s th
roug
h in
corp
orat
ion
of d
iffer
ence
s fro
m th
e co
nver
sion
of b
onds
--
21,1
18-
--
-21
,118
Dis
tribu
tion
to s
tatu
tory
res
erve
s-
--
-3,
740
(3,7
40)
--
Acqu
isiti
on o
f tre
asur
y sh
ares
-(1
33)
--
--
-(1
33)
Dist
ribut
ion
of d
ivid
ends
for 2
008
finan
cial
yea
r-
--
--
(50,
000)
(50,
000)
Con
trib
uti
on
s b
y a
nd
d
istr
ibu
tion
s to
ow
ners
26,6
42(1
33)
21,1
18-
3,74
0(5
3,74
0)-
(2,3
73)
Ba
lan
ce a
s a
t 31 D
ece
mb
er
2009
1,17
6,23
7(3
33)
97,6
8422
,543
179,
948
354,
157
7,79
81,
838,
034

8
CO
NSO
LID
ATE
D S
TATE
MEN
T O
F C
HA
NG
ES I
N E
QU
ITY
For
the y
ea
r en
ded
31
Dece
mb
er
20
08
Att
rib
uta
ble
to e
qu
ity
hold
ers
of
the B
an
k
In R
ON
thou
sand
Sha
re
Trea
sury
Sha
reRee
valu
ation
Oth
er
Ret
ain
edN
on
-con
trollin
gTo
tal
cap
ita
lsh
are
sp
rem
ium
sre
serv
esre
serv
esea
rnin
gs
inte
rest
Ba
lan
ce a
s a
t 31 D
ece
mb
er
2007
700,
979
-98
,602
24,0
6117
2,95
726
6,37
110
,204
1,27
3,17
4
Tota
l co
mp
reh
en
sive
in
com
e
for
the p
eri
od
Prof
it fo
r th
e ye
ar-
--
--
361,
672
(1,6
85)
359,
987
Oth
er
com
pre
hen
sive
in
com
e,
net
of
inco
me t
ax
Tran
sfer
from
ree
valu
atio
n su
rplu
s to
re
tain
ed e
arni
ngs
--
-(2
09)
-20
9-
-Fa
ir va
lue
gain
s fro
m a
vaila
ble
for
sale
inve
stm
ents
(net
of d
efer
red
tax)
--
--
(65,
890)
--
(65,
89)
Oth
er c
hang
es-
--
--
(19,
754)
1,90
1(1
7,85
3)To
tal co
mp
reh
en
sive
in
com
e
for
the p
eri
od
--
-(2
09)
(65,
890)
342,
127
216
276,
244
Incr
ease
in s
hare
cap
ital t
hrou
gh
appr
opria
tion
of r
etai
ned
earn
ings
319,
461
--
--
(319
,461
)-
-In
crea
se in
sha
re c
apita
l thr
ough
in
corp
orat
ion
of s
hare
pre
miu
ms
98,6
02-
(98,
602)
--
--
-C
ash
cont
ribut
ion
to s
hare
cap
ital
30,5
53-
76,5
66-
- -
-10
7,11
9D
istri
butio
n to
sta
tuto
ry r
eser
ves
--
--
23,3
60(2
3,36
0)-
-Ac
quis
ition
of t
reas
ury
shar
es-
(200
)-
--
--
(200
)
Con
trib
uti
on
s b
y a
nd
d
istr
ibu
tion
s to
ow
ners
448,
616
(200
)(2
2,03
6)-
23,3
60(3
42,8
21)
-10
6,91
9
Ba
lan
ce a
t 31 D
ece
mb
er
2008
1,14
9,59
5(2
00)
76,5
6623
,852
130,
427
265,
677
10,4
201,
656,
337

CONSOLIDATED CASH FLOW STATEMENTfor the year ended 31 December
In RON thousand Note 2009 2008
Cash flow from/ (used in) operating activitiesProfit for the year 136,715 359,987
Adjustments for:Depreciation and amortization 23,24 68,042 63,137Impairments and write-offs of financial assets 490,784 161,492Share of profit in associates, net of dividends 10,298 28,581Fair value adjustment of financial assets at fair value through profit and loss (17,203) 51,208Profit from sale of associates and joint ventures (38,596) (268,814)Income tax expense 15 21,048 65,745Other adjustment (85,769) 36,995
Net profit adjusted with non-monetary elements 585,319 498,331
Changes in operating assets and liabilitiesChange in investment securities (1,702,780) (371,893)Change in placements with banks (101,705) (4,000)Change in loans and advances to customers (1,034,093) (2,537,511)Change in net lease investments 104,893 (89,164)Change in financial assets at fair value through profit and loss (13,140) (1,912)Change in other assets (51,168) (20,350)Change in deposits from banks and customers 3,114,883 1,618,937Change in other liabilities (5,918) 8,450Income tax paid (82,943) (106,280)
Net cash from/ (used in) operating activities 813,348 (1,005,392)
Cash flow from / (used in) investing activitiesNet acquisitions of property and equipment and intangible assets (24,138) (154,035)Net proceeds from sale of associates and joint ventures 44,693 299,330Proceeds from sale of equity investments - 721Acquisition of subsidiaries (net of cash acquired) and investments in associates (24,039) (4,696)Dividends collected 2,017 4,338
Net cash flow from/(used in) investing activities (1,467) 145,658
Cash flow from / (used in) financing activitiesProceeds from increase of share capital - 107,119Subscription of non-controlling interest to the share capital of subsidiaries - 584Net proceeds/(payments) from loans from banks and other financial institutions, subordinated liabilities and debt securities issued (681,477) 1,014,407Payments for dividends (48,793) -Payments for treasury shares (12,297) -
Net cash flow from financing activities (742,567) 1,122,110
Net increase in cash and cash equivalents 69,314 262,376Cash and cash equivalents as at 1 January 4,462,650 4,200,274
Cash and cash equivalents as at 31 December 4,531,964 4,462,650
9

Reconciliation of cash and cash equivalents with statement of financial position
Note 31 December 31 DecemberIn RON thousand 2009 2008
Cash and cash equivalents 16 3,186,997 3,698,738Placements with banks, less than 3 months maturity 1,349,220 770,649Less accrued interest (4,253) (6,737)
Cash and cash equivalents in the cash flow statement 4,531,964 4,462,650
Cash flows from operating activities include:
In RON thousand 2009 2008
Interest collected 2,066,742 1,537,442Interest paid 1,377,312 875,854
10
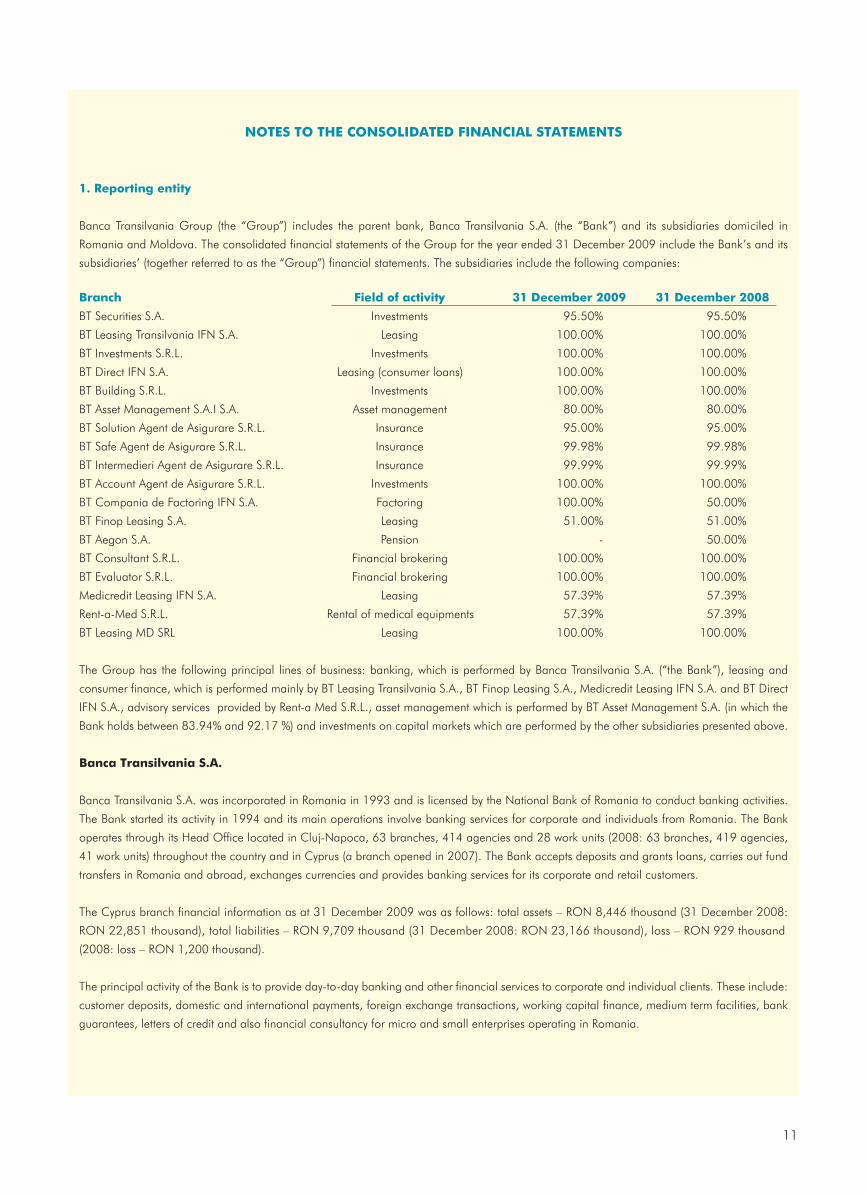
NOTES TO THE CONSOLIDATED FINANCIAL STATEMENTS
1. Reporting entity
Banca Transilvania Group (the “Group”) includes the parent bank, Banca Transilvania S.A. (the “Bank”) and its subsidiaries domiciled in
Romania and Moldova. The consolidated financial statements of the Group for the year ended 31 December 2009 include the Bank’s and its
subsidiaries’ (together referred to as the “Group”) financial statements. The subsidiaries include the following companies:
8002 rebmeceD 139002 rebmeceD 13ytivitca fo dleiFhcnarB
%05.59%05.59stnemtsevnI.A.S seitiruceS TB
%00.001%00.001gnisaeL.A.S NFI ainavlisnarT gnisaeL TB
%00.001%00.001stnemtsevnI .L.R.S stnemtsevnI TB
%00.001%00.001)snaol remusnoc( gnisaeL.A.S NFI tceriD TB
%00.001%00.001stnemtsevnI.L.R.S gnidliuB TB
BT Asset Management S.A.I S.A. Asset management 80.00% 80.00%
%00.59%00.59 ecnarusnI.L.R.S erarugisA ed tnegA noituloS TB
%89.99%89.99 ecnarusnI.L.R.S erarugisA ed tnegA efaS TB
%99.99%99.99 ecnarusnI.L.R.S erarugisA ed tnegA ireidemretnI TB
%00.001%00.001stnemtsevnI.L.R.S erarugisA ed tnegA tnuoccA TB
%00.05%00.001gnirotcaF.A.S NFI gnirotcaF ed ainapmoC TB
%00.15%00.15gnisaeL.A.S gnisaeL poniF TB
%00.05-noisneP.A.S nogeA TB
%00.001%00.001gnirekorb laicnaniF.L.R.S tnatlusnoC TB
%00.001%00.001gnirekorb laicnaniF.L.R.S rotaulavE TB
%93.75%93.75gnisaeL.A.S NFI gnisaeL tidercideM
%93.75%93.75stnempiuqe lacidem fo latneR.L.R.S deM-a-tneR
%00.001%00.001gnisaeLLRS DM gnisaeL TB
The Group has the following principal lines of business: banking, which is performed by Banca Transilvania S.A. (“the Bank”), leasing and
consumer finance, which is performed mainly by BT Leasing Transilvania S.A., BT Finop Leasing S.A., Medicredit Leasing IFN S.A. and BT Direct
IFN S.A., advisory services provided by Rent-a Med S.R.L., asset management which is performed by BT Asset Management S.A. (in which the
Bank holds between 83.94% and 92.17 %) and investments on capital markets which are performed by the other subsidiaries presented above.
Banca Transilvania S.A.
Banca Transilvania S.A. was incorporated in Romania in 1993 and is licensed by the National Bank of Romania to conduct banking activities.
The Bank started its activity in 1994 and its main operations involve banking services for corporate and individuals from Romania. The Bank
operates through its Head Office located in Cluj-Napoca, 63 branches, 414 agencies and 28 work units (2008: 63 branches, 419 agencies,
41 work units) throughout the country and in Cyprus (a branch opened in 2007). The Bank accepts deposits and grants loans, carries out fund
transfers in Romania and abroad, exchanges currencies and provides banking services for its corporate and retail customers.
The Cyprus branch financial information as at 31 December 2009 was as follows: total assets – RON 8,446 thousand (31 December 2008:
RON 22,851 thousand), total liabilities – RON 9,709 thousand (31 December 2008: RON 23,166 thousand), loss – RON 929 thousand
(2008: loss – RON 1,200 thousand).
The principal activity of the Bank is to provide day-to-day banking and other financial services to corporate and individual clients. These include:
customer deposits, domestic and international payments, foreign exchange transactions, working capital finance, medium term facilities, bank
guarantees, letters of credit and also financial consultancy for micro and small enterprises operating in Romania.
11
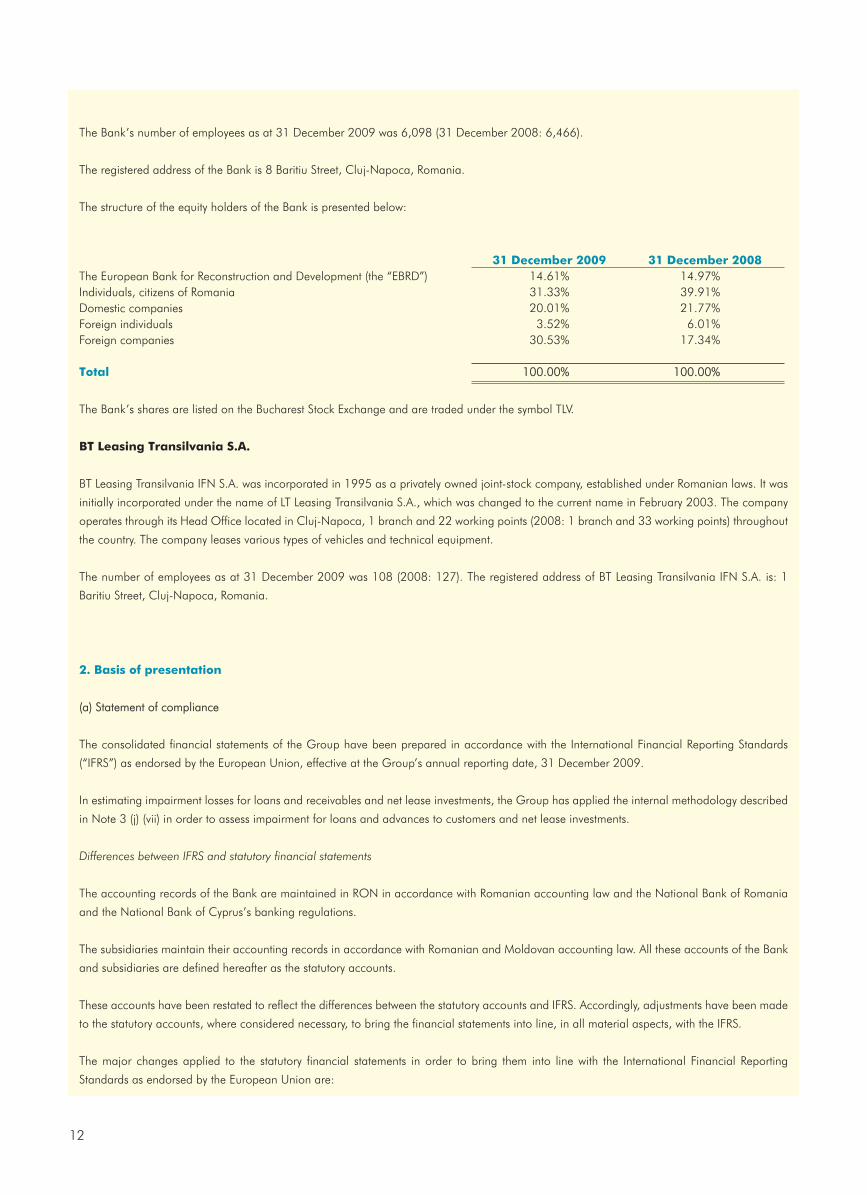
The Bank’s number of employees as at 31 December 2009 was 6,098 (31 December 2008: 6,466).
The registered address of the Bank is 8 Baritiu Street, Cluj-Napoca, Romania.
The structure of the equity holders of the Bank is presented below:
31 December 2009 31 December 2008The European Bank for Reconstruction and Development (the “EBRD”) 14.61% 14.97%Individuals, citizens of Romania 31.33% 39.91%Domestic companies 20.01% 21.77%Foreign individuals 3.52% 6.01%Foreign companies 30.53% 17.34%
Total 100.00% 100.00%
The Bank’s shares are listed on the Bucharest Stock Exchange and are traded under the symbol TLV.
BT Leasing Transilvania S.A.
BT Leasing Transilvania IFN S.A. was incorporated in 1995 as a privately owned joint-stock company, established under Romanian laws. It was
initially incorporated under the name of LT Leasing Transilvania S.A., which was changed to the current name in February 2003. The company
operates through its Head Office located in Cluj-Napoca, 1 branch and 22 working points (2008: 1 branch and 33 working points) throughout
the country. The company leases various types of vehicles and technical equipment.
The number of employees as at 31 December 2009 was 108 (2008: 127). The registered address of BT Leasing Transilvania IFN S.A. is: 1
Baritiu Street, Cluj-Napoca, Romania.
2. Basis of presentation
(a) Statement of compliance
The consolidated financial statements of the Group have been prepared in accordance with the International Financial Reporting Standards
(“IFRS”) as endorsed by the European Union, effective at the Group’s annual reporting date, 31 December 2009.
In estimating impairment losses for loans and receivables and net lease investments, the Group has applied the internal methodology described
in Note 3 (j) (vii) in order to assess impairment for loans and advances to customers and net lease investments.
Differences between IFRS and statutory financial statements
The accounting records of the Bank are maintained in RON in accordance with Romanian accounting law and the National Bank of Romania
and the National Bank of Cyprus’s banking regulations.
The subsidiaries maintain their accounting records in accordance with Romanian and Moldovan accounting law. All these accounts of the Bank
and subsidiaries are defined hereafter as the statutory accounts.
These accounts have been restated to reflect the differences between the statutory accounts and IFRS. Accordingly, adjustments have been made
to the statutory accounts, where considered necessary, to bring the financial statements into line, in all material aspects, with the IFRS.
The major changes applied to the statutory financial statements in order to bring them into line with the International Financial Reporting
Standards as endorsed by the European Union are:
12
• grouping of numerous detailed items into broader captions;
• restatement adjustments required in accordance with IAS 29 (“Financial Reporting in Hyperinflationary Economies”) due to the fact that
Romanian economy was hyperinflationary until 31 December 2003 (refer to Note 3c);
• fair value and impairment adjustments required in accordance with IAS 39 (“Financial Instruments – Recognition and Measurement’);
• setting up provisions for deferred tax, and
• presenting the necessary information in accordance with the IFRS.
(b) Basis of measurement
The consolidated financial statements of the Group are prepared on a fair value basis, for financial assets and liabilities held at fair value
through profit and loss and available-for-sale instruments, except for those for which a reliable measure of fair value is not available.
Other financial assets and liabilities and non-financial assets and liabilities are stated at amortized cost, reevaluated amount or historical cost.
Non-current assets held for sale are stated at the lower of net carrying amount and fair value, less cost to sale.
(c) Functional and presentation currency
Items included in the financial statements of each of the Group’s entities are measured using the currency of the primary economic environment
in which the entity operates (‘the functional currency’). The consolidated financial statements are presented in Romanian lei “RON”, which is the
Bank’s and the Group’s functional and presentation currency, rounded to the nearest thousand.
Convenience translation
For the user’s information, the restated RON figures have been presented in EUR, following the requirement of IAS 21 “The Effect of Changes
in Foreign Exchange Rates”. This presentation is not part of the audited financial statements.
According to IAS 21, since the functional currency is RON, for translation from RON to EUR the following procedures were followed:
• Assets, liabilities and equity items for all balance sheet items presented (i.e. including comparatives) were translated at the closing rate
existing at the date of each balance sheet presented (31 December 2009: 4.4282 RON/EUR; 31 December 2008: 3.9852 RON/EUR);
• Income and expenses items for current period presented were translated at the exchange rates existing at the dates of the transactions or
a rate that approximates the actual exchange rates (average exchange rate in 2009: 4.2373 RON/EUR; average exchange rate in
2008: 3.6827 RON/EUR);
• All exchange differences resulting from translation in the current period are recognized directly in equity.
The restatement and presentation procedures used according to IAS 21, “The Effects of Changes in Foreign Exchange Rates”, could result in
differences between the amounts presented in EUR and the real values.
(d) Use of estimates and judgments
The preparation of financial statements in accordance with IFRS as endorsed by the European Union implies that the management uses
estimation and judgments that affect the application of accounting policies, as well as the reported value of assets, liabilities, income and
expenses. The estimates and associated assumptions are based on historical experience and various other factors that are believed to be
reasonable under the circumstances, the result of which form the basis of the judgments used in assessing the carrying value of the assets and
liabilities for which no other evaluation sources are available. Actual results may differ from these estimates.
The estimates and judgments are reviewed on an ongoing basis. The review of the accounting estimates are recognized in the period in which
the estimate is reviewed if the review affects only that period or in the period of the review and future periods if the review affects both current
and future periods.
Information about estimates used in the application of the accounting policies which carry a significant impact on the financial statements, as
well as the estimates which involve a significant degree of uncertainty, are described in Notes 4 and 5.
13

(e) Changes in accounting policies
Effective 1 January 2009 the Group has changed its accounting policy regarding presentation of the consolidated financial statements.
The Group applies revised IAS 1 Presentation of Financial Statements (2007), which became effective as of 1 January 2009. As a result, the
Group presents in the consolidated statement of changes in equity all owner changes in equity, whereas all non-owner changes in equity are
presented in the consolidated statement of comprehensive income; in respect of the consolidated statement of comprehensive income the
Group elected the single statement approach.
Comparative information has been re-presented so that it also is in conformity with the revised standard.
(f) Other accounting developments
Disclosures pertaining to fair value and liquidity risk for financial instruments
The Group has applied Improving Disclosures about Financial Instruments (Amendments to IFRS 7), issued in March 2009, that require
enhanced disclosures about fair value measurements and liquidity risk in respect of financial instruments.
The amendments require that fair value measurement disclosures use a three-level fair value hierarchy that reflects the significance of the inputs
used in measuring fair values of financial instruments. Specific disclosures are required when fair value measurements are categorized as Level
3 (significant unobservable inputs) in the fair value hierarchy. The amendments require that any significant transfers between Level 1 and Level 2
of the fair value hierarchy be disclosed separately, distinguishing between transfers into and out of each level. Furthermore, changes in valuation
techniques from one period to another, including reasons therefore, are required to be disclosed for each class of financial instruments.
Revised disclosures in respect of fair values of financial instruments are included in note 5.
Further, the definition of liquidity risk has been amended and it is now defined as the risk that an entity will encounter difficulty in meeting
obligations associated with financial liabilities that are settled by delivering cash or another financial asset.
The amendments require disclosure of a maturity analysis for non-derivative and derivative financial liabilities, but contractual maturities are
required to be disclosed for derivative financial liabilities only when contractual maturities are essential for an understanding of the timing of
cash flows. For issued financial guarantee contracts, the amendments require to disclose the maximum amount of the guarantee that could be
called. Revised disclosures in respect of liquidity risk are included in note 4.
3. Significant accounting policies
The accounting policies set out below have been applied consistently to all periods presented in these consolidated financial statements, and
have been applied consistently by the Group entities, except as explained in note 2 (e), which addresses changes in accounting policies.
a) Basis of consolidation
(i) Subsidiaries
Subsidiaries are those companies controlled by the Bank. Control exists when the Bank has the power, directly or indirectly, to govern the
financial and operating policies of an entity so as to obtain benefits from its activities. When assessing control, potential voting rights that
presently are exercisable or convertible must be taken into consideration. The financial statements of subsidiaries are included in the
consolidated financial statements from the date that control starts until the date that control ceases.
The Bank consolidates the financial statements of its subsidiaries in accordance with IAS 27 “Consolidated and separate financial statements”.
The list of the Group’s branches is presented in Note 1.
14

(ii) Investment funds management
The Group manages and administrates assets invested in unit funds on behalf of investors. The financial statements of these entities are not
included in these consolidated financial statements except when the Group controls the entity by holding an interest higher than 50% in the
respective unit fund.
(iii) Associates
Associates are those companies on which the Group may exercise a significant influence, but not control over the financial and operational
policies. The consolidated financial statements include the Group’s share of the total recognized gains and losses of associates using the equity
method, from the date that significant influence commences until the date that significant influence ceases. If the Group’s share of losses from
associates exceeds the carrying amount of the investment, the carrying amount is reduced to nil and recognition of further losses is discontinued
except to the extent that the Group has incurred obligations in respect of the associate.
Banca Transilvania’s share in these investment funds varies between minimum of 21.43% and maximum of 49.52%.
The Grup included its share from the associates losses and gains according to IAS 28 “Investment in associates”.
(iv) Jointly controlled entities
Jointly controlled entities are those enterprises where there is a contractually agreed sharing of control over the economic activities of the
respective entities, and exist only when the strategic financial and operating decisions relating to the activities require the unanimous consent of
the parties sharing control. The consolidated financial statements include the Group’s share of interest in a jointly controlled entity using
proportionate consolidation in accordance with the provisions of IAS 31 „Interests in joined ventures”.
At 31 December 2009, the Group does not own jointly controlled entities.
(v) Transactions eliminated on consolidation
Intra-group balances and transactions as well as any unrealized gains resulted from the intra-group transactions have been eliminated in preparing
the consolidated financial statements. Unrealized gains resulted from transactions with associates and jointly controlled entities are eliminated to the
extent of the Group’s interest in the entity. Unrealized gains resulted from transactions with associates are eliminated against the investment in the
associate. Unrealized losses are eliminated in the same way as unrealized gains, but only to the extent that there is no evidence of impairment.
b) Foreign currency
i) Foreign currency transactions
Transactions in foreign currencies are booked in RON at the official exchange rate at the dates of the transaction. Monetary assets and liabilities
denominated in foreign currencies at the date of the consolidated statement of financial position are retranslated to the functional currency at
the exchange rate at that date.
The gains and losses related to the settlement and translations of these balances using the exchange rate at the end of the financial year are
recognized in the income statement, except for the ones booked in equity as a result of applying hedge accounting.
Non-monetary assets and liabilities that are measured in terms of historical cost in a foreign currency are translated using the exchange rate at
the date of the transaction Non-monetary assets and liabilities denominated in foreign currencies that are stated at fair value are translated to
the functional currency at the exchange rate valid at the date when the fair value is determined.
Foreign currency differences arising on retranslation are recognized in profit or loss, except for differences arising on the retranslation of
available-for-sale financial assets which are included in the fair value reserve in equity.
15
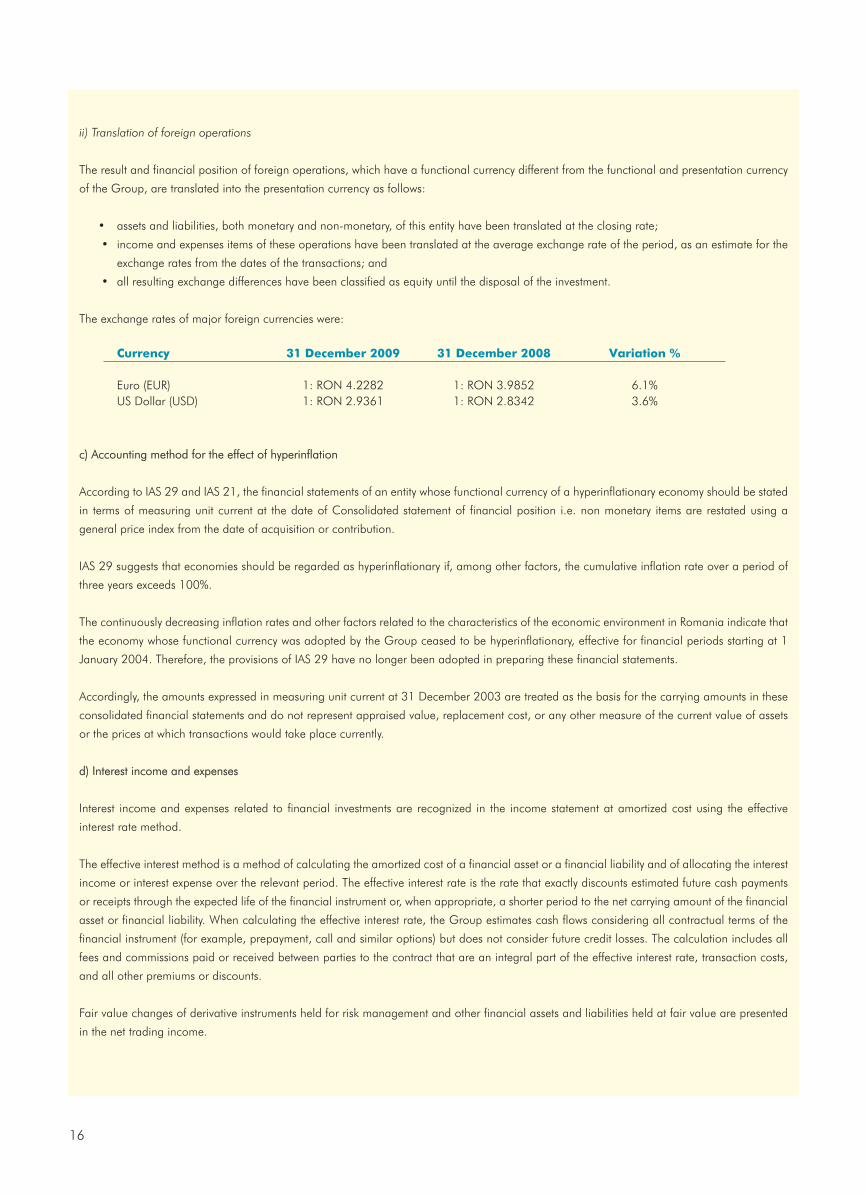
ii) Translation of foreign operations
The result and financial position of foreign operations, which have a functional currency different from the functional and presentation currency
of the Group, are translated into the presentation currency as follows:
• assets and liabilities, both monetary and non-monetary, of this entity have been translated at the closing rate;
• income and expenses items of these operations have been translated at the average exchange rate of the period, as an estimate for the
exchange rates from the dates of the transactions; and
• all resulting exchange differences have been classified as equity until the disposal of the investment.
The exchange rates of major foreign currencies were:
Currency 31 December 2009 31 December 2008 Variation %
Euro (EUR) 1: RON 4.2282 1: RON 3.9852 6.1%US Dollar (USD) 1: RON 2.9361 1: RON 2.8342 3.6%
c) Accounting method for the effect of hyperinflation
According to IAS 29 and IAS 21, the financial statements of an entity whose functional currency of a hyperinflationary economy should be stated
in terms of measuring unit current at the date of Consolidated statement of financial position i.e. non monetary items are restated using a
general price index from the date of acquisition or contribution.
IAS 29 suggests that economies should be regarded as hyperinflationary if, among other factors, the cumulative inflation rate over a period of
three years exceeds 100%.
The continuously decreasing inflation rates and other factors related to the characteristics of the economic environment in Romania indicate that
the economy whose functional currency was adopted by the Group ceased to be hyperinflationary, effective for financial periods starting at 1
January 2004. Therefore, the provisions of IAS 29 have no longer been adopted in preparing these financial statements.
Accordingly, the amounts expressed in measuring unit current at 31 December 2003 are treated as the basis for the carrying amounts in these
consolidated financial statements and do not represent appraised value, replacement cost, or any other measure of the current value of assets
or the prices at which transactions would take place currently.
d) Interest income and expenses
Interest income and expenses related to financial investments are recognized in the income statement at amortized cost using the effective
interest rate method.
The effective interest method is a method of calculating the amortized cost of a financial asset or a financial liability and of allocating the interest
income or interest expense over the relevant period. The effective interest rate is the rate that exactly discounts estimated future cash payments
or receipts through the expected life of the financial instrument or, when appropriate, a shorter period to the net carrying amount of the financial
asset or financial liability. When calculating the effective interest rate, the Group estimates cash flows considering all contractual terms of the
financial instrument (for example, prepayment, call and similar options) but does not consider future credit losses. The calculation includes all
fees and commissions paid or received between parties to the contract that are an integral part of the effective interest rate, transaction costs,
and all other premiums or discounts.
Fair value changes of derivative instruments held for risk management and other financial assets and liabilities held at fair value are presented
in the net trading income.
16

e) Fees and commissions
Fee and commission income arises from financial services provided by the Group including commitment fees, card fees, cash management
services, brokerage services, investment advice and financial planning, investment banking services, project and structured finance transactions,
and asset management services.
Fees and commissions directly attributable to the financial asset or liability origination (both income and expense) are included in the
measurement of the effective interest rate. Loan commitment fees that are likely to be drawn down, are deferred, together with the related direct
costs, and are recognized as an adjustment to the effective interest rate of the loan.
Other fee and commission income arising from the financial services provided by the Group including investment management services,
brokerage services, and account services fees are recognized as the related service is provided in the income statement. Other fee and
commission expense relates mainly to transaction and service fees, which are expensed as the services are received.
f) Net trading income
Net trading income represents the difference between the gain and loss related to the trading assets and liabilities and includes all fair value
changes realized and unrealized and net foreign exchange differences.
g) Dividends
Dividend income is recognized in the income when the right to receive income is established. Income from equity investments and other non-
fixed income investments is recognized as dividend income when incurred. Dividends are reflected as a component of other operating income.
Dividends are treated as an appropriation of profit in the period they are declared and approved by the General Shareholders’ Meeting. The
only profit available for distribution is the profit for the year recorded in the Romanian statutory accounts, which differs from the profit in these
financial statements, prepared in accordance with IFRS, due to the differences between the applicable Romanian Accounting Regulations and
IFRS as endorsed by the European Union.
h) Lease payments
Payments made under operating leases are recognized in profit or loss based on a straight-line basis over the term of the lease. Lease incentives
received are recognized as an integral part of the total lease expense, over the term of the lease. Operating lease expense is recognized as a
component of the operating expenses.
Minimum lease payments made under finance leases are apportioned between the interest expense and the reduction of the outstanding liability.
The interest expense is allocated to each period during the lease term so as to produce a constant periodic rate of interest on the remaining
balance of the liability. Contingent lease payments are accounted for by revising the minimum lease payments over the remaining term of the
lease when the lease adjustment is confirmed.
i) Income tax expense
Income tax for the year comprises current and deferred tax. Income tax is recognized in the income statement except to the extent that it relates
to items recognized directly in equity, in which case it relates to equity elements.
Current tax is the expected tax payable on the taxable income for the year, using tax rates enacted or substantially enacted at the balance sheet
date, and any adjustment to tax payable in respect of prior periods.
Deferred tax is provided using the balance sheet liability method, providing for temporary differences between the carrying amounts of assets
and liabilities for financial reporting purposes and the amounts used for taxation purposes. Deferred tax is not recognized for the following
temporary differences: the initial recognition of the goodwill, the initial recognition of the assets and liabilities that come from transactions other
than business mergers and which have no impact on the accounting profit nor on the fiscal one and differences related to investments in
17
subsidiaries, as long as they are not considered to be reversed in the near future. The amount of deferred tax provided is based on the expected
manner of realization or settlement of the carrying amount of assets and liabilities, using tax rates enacted or substantively enacted at the date
of the consolidated statement of financial position.
A deferred tax asset is recognized only to the extent that it is probable that future taxable profits will be available against which the asset can be
utilized. Deferred tax assets are reduced to the extent that it is no longer probable that the related tax benefit will be realized.
Additional income taxes that arise from the distribution of dividends are recognized at the same time as the liability to pay the related dividend.
The tax rate used to calculate the current and deferred tax position at 31 December 2009 is 16% (31 December 2008: 16%).
j) Financial assets and liabilities
(i) Classifications
The Group classifies its financial assets and liabilities in the following categories:
Financial assets or financial liabilities at fair value through profit or loss. This category has two sub-categories: financial assets or financial
liabilities held for trading, and those designated at fair value through profit or loss at inception. A financial instrument is classified in this category
if acquired principally for the purpose of short term profit-taking or if so designated by management. Derivatives are also categorized as held for
trading unless the derivative is a designated and effective hedging instrument. The financial instruments at fair value through profit or loss
comprise listed equity securities and derivatives instruments.
Loans and receivables are non-derivative financial assets with fixed or determinable payments that are not quoted on an active market, other
than those that the Group intends to sell immediately or in the near term, those that the Group, upon initial recognition, designates at fair value
through profit and loss, those that the Group, upon initial recognition, designates as available for sale or those for which the holder may not
recover substantially all of its initial investment, other than because of credit deterioration. Loans and receivables comprise loans and advances
to banks and customers and net lease investments.
Held-to-maturity investments are non-derivative financial assets with fixed or determinable payments and fixed maturities that the Group’s
management has the positive intention and ability to hold to maturity. As at 31 December 2009 and 31 December 2008 the Group included in
this category certain treasury bills issued by the Ministry of Public Finance.
Available-for-sale financial assets are those financial assets that are designated as available for sale or are not classified as loans and advances,
held-to-maturity investments or financial assets at fair value through profit or loss. Available-for-sale instruments include treasury bonds and
other bonds eligible for discounting with central banks, investments in unit funds, equity investments and other investment securities that are not
at fair value through profit and loss or held-to-maturity.
(ii) Recognition
Financial assets and financial liabilities are initially recognized at fair value plus, in case of financial assets and financial liabilities not carried at
fair value through profit or loss, directly attributable transaction costs.
The Group initially recognizes loans and advances, deposits, debt securities issued and subordinated liabilities on the date that they are
originated. All other financial assets and liabilities (including assets and liabilities designated at fair value through profit or loss) are initially
recognized on the trade date at which the Group becomes a party to the contractual provisions of the financial instrument.
(iii) Derecognition
The Group derecognizes a financial asset when the contractual rights to the cash flows from the asset expire, or it transfers the rights to receive
the contractual cash flows on the financial asset in a transaction in which substantially all the risks and rewards of ownership of the financial
18

asset are transferred. Any interest in transferred financial assets that is created or retained by the Group is recognized as a separate asset or
liability.
On derecognition of a financial asset, the difference between the carrying amount of the asset (or the carrying amount allocated to the portion
of the asset transferred), and the sum of (i) the consideration received (including any new asset obtained less any new liability assumed) and (ii)
any cumulative gain or loss that had been recognized in other comprehensive income is recognized in profit or loss.
The Group derecognizes a financial liability when its contractual obligations are discharged or cancelled or expired.
The Group enters into transactions whereby it transfers assets recognized on its balance sheet, but retains either all risks or rewards of the
transferred assets or a portion of them. If all or substantially all risks and rewards are retained, then the transferred assets are not derecognized
from the balance sheet. Transfers of assets with retention of all or substantially all risks and rewards include, for example, securities lending and
repurchase transactions.
When assets are sold to a third party with a concurrent total rate of return swap on the transferred assets, the transaction is accounted for as a
secured financing transaction similar to repurchase transactions. In transactions where the Group neither retains nor transfers substantially all
the risks and rewards of ownership of a financial asset, it derecognizes the asset if control over the asset is lost.
The rights and obligations retained in the transfer are recognized separately as assets and liabilities as appropriate. In transfers where control
over the asset is retained, the Group continues to recognize the asset to the extent of its continuing involvement, determined by the extent to
which it is exposed to changes in the value of the transferred asset.
(iv) Offsetting
Financial assets and liabilities are offset and the net amount reported in the statement of financial position when and only when there is a legally
enforceable right to set off the recognized amounts and there is an intention to settle on a net basis, or realize the asset and settle the liability
simultaneously.
Income and expenses are presented on a net basis only when permitted by the accounting standards, or for gains and losses arising from a
group of similar transactions such as in the Group’s trading activity.
(v) Amortized cost measurement
The amortized cost of a financial asset or liability is the amount at which the financial asset or liability is measured at initial recognition, minus
principal repayments, plus or minus the cumulative amortization using the effective interest method of any difference between the initial amount
recognized and the maturity amount, less any reduction for impairment.
(vi) Fair value measurement
Fair value is the amount for which an asset could be exchanged, or a liability settled, between knowledgeable, willing parties in an arm’s length
transaction on the measurement date.
When available, the Group measures the fair value of an instrument using quoted prices in an active market for that instrument. A market is regarded
as active if quoted prices are readily and regularly available and represent actual and regularly occurring market transactions on an arm’s length
basis. If a market for a financial instrument is not active, the Group establishes fair value using a valuation technique. Valuation techniques include
using recent arm’s length transactions between knowledgeable, willing parties (if available), reference to the current fair value of other instruments that
are substantially the same, discounted cash flow analyses and option pricing models. The chosen valuation technique makes maximum use of market
inputs, relies as little as possible on estimates specific to the Group, incorporates all factors that market participants would consider in setting a price,
and is consistent with accepted economic methodologies for pricing financial instruments. Inputs to valuation techniques reasonably represent market
expectations and measures of the risk-return factors inherent in the financial instruments. The Group calibrates valuation techniques and tests them
for validity using prices from observable current market transactions in the same instrument or based on other observable market data.
19
The best evidence of the fair value of a financial instrument at initial recognition is the transaction price, i.e., the fair value of the consideration given
or received, unless the fair value of that instrument is evidenced by comparison with other observable current market transactions in the same
instrument or based on a valuation technique whose variables include only data from observable markets. When transaction price provides the best
evidence of fair value at initial recognition, the financial instrument is initially measured at the transaction price and any difference between this price
and the value initially obtained from a valuation model is subsequently recognized in profit or loss on an appropriate basis over the life of the
instrument but not later than when the valuation is supported wholly by observable market data or the transaction is closed out.
Where discounted cash flow techniques are used, estimated future cash flows are based on management’s best estimates and the discount rate is a
market related rate for an instrument with similar terms and conditions. Where pricing models are used, inputs are based on market related measures
at the date of consolidated statement of financial position. Where a fair value cannot be reliably estimated, equity instruments that do not have a
quoted market price in an active market are measured at cost and periodically tested for impairment.
(vii) Identification and measurement of impairment
Assets held at amortized cost
At each balance sheet date the Group assesses whether there is objective evidence that financial assets not carried at fair value
through profit or loss are impaired. Financial assets or a group of financial assets are impaired when objective evidence demonstrates
that a loss event has occurred after the initial recognition of the asset (“loss generating event”), and that the loss event has an impact
on the future cash flows on the asset that can be estimated reliably.
It is probable that the identification of a single event responsible for the impairment is difficult. Impairment may have been caused by the
combined effect of multiple events. The losses expected as a result of the future events, regardless of their probability, are not recognized.
If there is objective evidence that an impairment loss on financial assets carried at amortized cost has been incurred, the amount of the loss is
measured as the difference between the asset's carrying amount and the present value of estimated future cash flows discounted at the financial
asset's original effective interest rate (i.e. the effective interest rate computed at initial recognition). If a financial asset has a variable interest rate,
the discount rate for measuring any impairment loss is the variable interest rate at current rate, specified in the contract. The asset’s accounting
value can be decreased directly or by using an impairment account. The expense with the impairment loss is recognized in the income
statement.
If during a future period, an event that took place after the date of the impairment recognition generates decrease in the impairment expense,
the formerly recognized impairment loss is reversed either directly or through the adjustment of an impairment account. The impairment
decrease is recognized through profit and loss.
Loans and advances to customers and net lease investments
The Group, based on its internal impairment assessment methodology included observable data on the following loss events that came to its
attention as objective evidence that loans and advances to customers and net lease investments or groups of assets were impaired:
(a) significant financial difficulty of the borrower (lessee) determined in accordance with the Group’s internal rating system;
(b a breach of contract, such as a default or delinquency in interest or principal payments of the borrowers (individually and in the same
group of borrowers);
(c) the lender, for economic or legal reasons relating to the borrower's or lessee’s financial difficulty, granted to the borrower a concession
that the lender would not otherwise consider such as the rescheduling of the interest or principal payments;
(d) it becomes probable that the borrower will enter bankruptcy or other financial reorganization;
(e) credible information indicating a measurable decrease in the estimated future cash flows of a group of financial assets from the date of
the initial recognition, regardless of the fact that the decrease cannot be identified for each asset, including:
i) unfavorable change in the payment behavior of the Group’s debtors, or
ii) national or local economic circumstances that can be correlated to the loss / depreciation of the Group’s assets.
20

The Group first assesses whether objective evidence of impairment exists as described above, individually for loans to customers and net lease
investments that are individually significant, and individually or collectively for loans to customers and net lease investments that are not
individually significant.
If the Group determines that no objective evidence of impairment exists for an individually assessed financial asset, whether significant or not, it
includes the loans to customers and net lease investments in groups with similar credit risk characteristics and collectively assesses them for
impairment. Loans and advances to customers and net lease investments that are individually assessed for impairment and for which an
impairment loss is or continues to be recognized are not included in a collective assessment of impairment. The calculation of the present value
of the estimated future cash flows of a collateralized loan and net lease investments reflects the cash flows that may result from foreclosure less
costs for obtaining and selling the collateral, whether or not foreclosure is probable.
For the purpose of a collective evaluation of impairment, loans and advances to customers and net lease investments are grouped on the basis
of similar credit risk characteristics that are indicative of the debtors' ability to pay all amounts due according to the contractual terms (for
example, on the basis of the industry for corporate clients and small and medium enterprises and on the basis of significant types of products for
individuals).
Management considers that these characteristics chosen are the best estimate of similar credit risk characteristics relevant to the estimation of
future cash flows for groups of such loans and net lease investments by being indicative of the debtors' ability to pay all amounts due according
to the contractual terms of the assets being evaluated.
Future cash flows in a group of loans and advances to customers and net lease investments that are collectively evaluated for impairment are
estimated on the basis of historical loss experience for loans and net lease investments with credit risk characteristics similar to those in the
group. Historical loss experience is adjusted on the basis of current observable data to reflect the effects of current conditions that did not affect
the period on which the historical loss experience is based and to remove the effects of conditions in the historical period that do not exist
currently.
Due to the inherent limitation regarding historical experience in obtaining information regarding loans and advances and net lease investments
individually impaired, the historical loss ratios, the complexity of the methodology used, the estimated impairment may differ from the one
obtained if the Group had sufficient historical experience in obtaining reliable information regarding timing and amount of future cash flows.
The Group reviews on a regular basis the methodology and the premises used for estimating the future cash flows in order to diminish the
differences between the estimated losses and the real ones.
Available-for-sale financial assets
For financial assets classified as available-for-sale, when a decline in the fair value of an available-for-sale financial asset has been recognized
directly in equity and there is objective evidence that the asset is impaired, the cumulative loss that had been recognized directly in equity shall
be released directly from equity and recognized in profit or loss even though the financial asset has not been derecognized.
The amount of the cumulative loss that is released from equity and recognized in profit or loss shall be the difference between the acquisition
cost (net of any principal repayment and amortization) and current fair value, less any impairment loss on that financial asset previously
recognized in income statement.
Impairment losses recognized in income statement for an investment in an equity instrument classified as available for sale shall not be released
through profit or loss. If, in a subsequent period, the fair value of a debt instrument classified as available for sale increases and the increase
can be objectively related to an event occurring after the impairment loss was recognized in profit or loss, the impairment loss shall be reversed,
with the amount of the reversal recognized in profit or loss.
Financial assets carried at cost
If there is objective evidence that an impairment loss has been incurred on an unquoted equity instrument that is not carried at fair value because its
fair value cannot be reliably measured, or on a derivative asset that is linked to and must be settled by delivery of such an unquoted equity instrument,
21
the amount of the impairment loss is measured as the difference between the carrying amount of the financial asset and the present value of estimated
future cash flows discounted at the current market rate of return for a similar financial asset. Such impairment losses are not reversed through income
statement.
(viii) Designation at fair value through profit and loss
The Group has designated financial assets and liabilities at fair value through profit and loss when it:
• eliminates or significantly reduces an evaluation or recognition mismatch (“accounting error”) which might have arisen from the
measurement of the assets and liabilities or from the recognition of their gain or loss based on different principles;
• they are part of a group of financial assets or liabilities managed, evaluated and reported to the management on a fair value basis
according to the risk management documentation / investment strategy; or
• they are hybrid contracts through which an entity can reflect the entire contract at fair value through profit and loss.
Cash and cash equivalents are carried at amortized cost in the statement of financial position.
k) Cash and cash equivalents
Cash and cash equivalents comprise: cash on hand, unrestricted balances held at the National Bank of Romania and highly liquid financial
assets with original maturities of less than three months, which are subject to insignificant risk of changes in their fair value. Cash and cash
equivalents are recognized at amortized cost in the consolidated statement of financial position.
l) Trading assets and liabilities
Trading assets and liabilities are those assets and liabilities that the Group acquires or incurs principally for the purpose of selling or
repurchasing in the near term, or holds as part of a portfolio that is managed together for short-term profit or position taking.
Trading assets and liabilities are initially recognized and subsequently measured at fair value in the Consolidated statement of the financial
position and the transaction costs are taken directly to comprehensive income. All changes in fair value are recognized as part of net trading
income in comprehensive income. Trading assets and liabilities are not reclassified subsequent to their initial recognition.
m) Derivatives
(i) Derivatives held for risk management purposes
Derivatives held for risk management purposes include all derivative assets and liabilities that are not classified as trading assets or liabilities.
Derivatives held for risk management purposes are measured at fair value in the Consolidated statement of the financial position.
When a derivate is not held for trading, and is not designated in a qualifying hedge relationship, all changes in its fair value are recognized
immediately in statement of comprehensive income as a component of net trading income.
(ii) Embedded derivatives
Derivatives may be embedded in another contractual arrangement (a “host contract”). The Group accounts for embedded derivatives separately
from the host contract when the host contract is not itself carried through profit and loss, and the characteristics of the embedded derivatives are
not clearly and closely related to the host contract. Separate embedded derivatives are accounted for depending on their classification, and are
presented in Consolidated statement of the financial position together with the host contract.
Loans and advances and net lease investments are presented net of provision for impairment losses. Provision for impairment losses are made
against the carrying amount of loans and advances and net lease investments that are identified as being impaired based on regular reviews of
outstanding balances to reduce these assets to their recoverable amounts.
22

n) Loans and advances and net lease investments
Loans and advances are non-derivative financial assets with fixed or determinable payments that are not quoted in an active market and that the
Group does not intend to sell immediately or in the near term.
When the Group is the lessor in a lease agreement that transfers substantially all the risks and rewards incidental to ownership of an asset to the
lessee, the arrangement is presented within loans and advances. Consumer loans granted to customers are also included in net lease
investments.
Loans and advances and net lease investments are initially measured at fair value plus incremental direct transaction costs, and subsequently
measured at their amortized cost using the effective interest method as described in the accounting policy 3(d) above, except when the Group
chooses to carry the loans and advances and net lease investments at fair value through profit or loss as described in accounting policy 3(j) (viii)
above.
Loans and advances are presented net of allowances for impairment. These allowances for impairment of loans and advances to customers and
net lease investments are constantly evaluated for presenting these assets to their recoverable amounts.
o) Investment securities
Investment securities are initially measured at fair value plus incremental direct transaction costs and subsequently accounted for depending on
their classification as either held-to-maturity, fair value through profit and loss or available-for-sale.
(i) Held-to-maturity
Held-to-maturity investments are carried at amortized cost using the linear method. The linear amortization method used to determine the
amortized cost for held-to-maturity investments represent the management’s best estimate for the value of the corresponding amortization and
the impact of applying the effective interest rate method would not be material. Any sale or reclassification of a significant amount of held-to-
maturity investments not close to their maturity would result in the reclassification of all held-to-maturity investments as available-for-sale, and
prevent the Group from classifying investment securities as held-to-maturity for the current and the following two financial years.
(ii) Fair value through profit and loss
The Group carries some investment securities at fair value, with fair value changes recognized immediately in profit or loss as described in
accounting policy 3(l).
(iii) Available-for-sale
Debt securities such as treasury bills issued by the Government of Romania are classified as available-for-sale assets.
The Group considered that the effective transaction prices would be between the informative BID-ASK quotations obtained, which are rather an
interval within which the Group could have realistically negotiated the quotations for each series and taking into account the volume of its
portfolio, and thus, the Bank used in its estimation an average price for each series.
Other securities such as investments in unit funds are classified as available-for-sale assets and are carried at their market prices.
Other equity investments in listed or unlisted companies are classified as available-for-sale assets and are carried at the fair value. Where no
reliable estimate of fair value is available, equity investments are stated at restated cost less impairment.
Interest income is recognized in profit and loss using effective interest method. Dividend income is recognized in profit and loss when the Group
becomes entitled to the dividend. Foreign exchange gains or losses on available-for-sale debt security investments are recognized in profit and
loss.
23
Other fair value changes are recognized directly in equity until the investment is sold or impaired and the balance in equity is recognized in profit
or loss.
Change in accounting policy
In October 2008 the International Accounting Standards Board (“IASB”) issued Reclassification of Financial Assets (Amendments to IAS 39
“Financial instruments: Recognition and Measurement and IFRS 7 Financial instruments: Disclosures”). The amendment to IAS 39 permits an
entity to transfer from the available-for-sale category to the loans and receivables category a non-derivative financial asset that otherwise would
have met the definition of loans and receivables if the entity has the intention and ability to hold that financial asset for the foreseeable future or
until maturity.
The amendment to IFRS 7 introduces additional disclosure requirements if an entity has reclassified financial assets in accordance with the
amendment to IAS 39. The amendments are effective retrospectively from 1 July 2008.
Pursuant to these amendments, the Group reclassified certain non-derivatives financial assets out of available-for-sale investment securities into
placement with banks. For details on the impact of this reclassification, see note 21.
p) Property and equipment
(i) Recognition and measurement
Items of property and equipment are stated at their cost or revalued amount less accumulated depreciation value and impairment losses.
Capital expenditure on property and equipment in the course of construction is capitalized and depreciated once the assets enter into use.
Leases in term of which the Group assumes substantially all the risks and rewards of ownership are classified as finance leases. Plant and
equipment acquired by way of finance lease is stated at an amount equal to the lower of its fair value and the present value of the minimum
lease payments at inception of the lease, less accumulated depreciation and impairment losses.
(ii) Subsequent costs
The Group recognizes in the carrying amount of an item of property, plant and equipment the cost of replacing part of such an item when that
cost is incurred if it is probable that the future economic benefits embodied with the item will flow to the Group and the cost of the item can be
measured reliably. All other costs are recognized in the income statement as an expense as incurred.
(iii) Depreciation
Depreciation is charged to the income statement on a straight-line basis over the estimated useful lives of each part of an item of property, plant
and equipment. Leased assets are depreciated over the shorter of the lease term and their useful lives. Land is not depreciated.
The estimated useful lives for the current and comparative periods are as follows:
Buildings 50 yearsLeasehold improvements (average) 7 yearsComputers 3 yearsFurniture and equipments 3 – 20 yearsVehicles 4 – 5 years
The leasehold improvements are depreciated over the rental contract period, which varies between 1 and 52 years. Depreciation methods,
useful lives and residual values are reassessed at the reporting date.
24
q) Intangible assets
(i) Goodwill and negative goodwill
Goodwill and negative goodwill arise on the acquisition of subsidiaries. Goodwill represents the difference between the cost of the acquisition
and the Group’s interest in the net fair value of the acquired identifiable assets, liabilities and contingent liabilities. Negative goodwill is
recognized immediately in profit and loss, after reanalyzing the manner of identification and valuation of the assets, liabilities and identifiable
contingent liabilities and measurement of the acquisition cost.
Acquisition of minority interests
Goodwill arising on the acquisition of a minority interest in a subsidiary represents the excess of the cost of the additional investment over the
carrying amount of the net assets acquired at the date of buy.
Subsequent measurement
Goodwill is measured at cost less accumulated impairment losses. Negative goodwill is recognized immediately in the income statement, after
assets, liabilities and contingent liabilities identification and measurement of acquisition cost.
(ii) Software
Costs associated with developing or maintaining software programs are recognized as an expense when incurred. Costs that are directly
associated with the production of identifiable and unique software products controlled by the Group, and that will probably generate economic
benefits exceeding costs beyond one year, are recognized as intangible assets. Subsequent expenditure on software assets is capitalized only
when it increases the future economic benefits embodied in the specific asset to which it relates. All other expenditure is expensed as incurred.
Amortization is recognized in income statement on a straight-line basis over the estimated useful life of the software, from the date that it is
available for use. The estimate useful life of software is three years.
r) Financial lease – lessee
Group’s lease agreements transferring substantially all the risks and rewards of ownership to the lessee are classified under financial lease. Upon
initial recognition, leasing payments are recognized at a value equal with the minimum between the fair value and current value of minimum leasing
payments. Subsequent to initial recognition, the asset is accounted for in accordance with the accounting policy applicable to that asset.
Other leasing agreements represent operating leases and the assets making the object of that leasing agreement are not recognized in the the
Group’s consolidated statement of financial position.
s) Impairment of non-financial assets
An impairment loss is recognized if the carrying amount of an asset or its cash-generating unit exceeds its recoverable amount. A cash-generating unit
is the smallest identifiable asset group that generates cash flows and which is independent from other assets and groups. Impairment losses
recognized in respect of cash-generating units are allocated to reduce the carrying amount of any goodwill allocated to that cash generating unit
(group of units) and to any other assets of the unit based on book value weight.
The recoverable amount of an asset or cash-generating unit is the greater of its value in use and its fair value less costs to sell. In assessing value in
use, the estimated future cash flows are discounted to their present value using a pre-tax discount rate that reflects current market assessments of the
time value of money and the risks specific to the asset. To determine the net use value, future cash flows are discounted using a pre- tax discount rate,
reflecting the current market conditions and risks incurred by the respective asset.
In respect of other assets, impairment losses recognized in prior periods are assessed at each reporting date for any indications that the loss has
decreased or no longer exists. An impairment loss in other than goodwill is reversed if there has been a change in the estimates used to determine the
recoverable amount. An impairment loss is reversed only to the extent that the asset’s carrying amount does not exceed the carrying amount that
would have been determined, net of depreciation or amortization, should no impairment loss be recognized.
25
t) Deposits from customers
Deposits from customers are initially measured at fair value plus transaction costs, and subsequently measured at amortized cost using the
effective interest method.
u) Debt securities issued and loans from banks and other financial institutions
Borrowings such as loans from banks and other financial institutions and debt securities issued are recognized initially at fair value, being their
issue proceeds (fair value of consideration received) net of transaction costs occurred. Debt securities and loans from banks and other financial
institutions are subsequently stated at amortized cost.
The Group classifies capital instruments as financial liabilities or equity instruments in accordance with the substance of the contractual terms of
the instrument.
v) Provisions
A provision is recognized in the consolidated statement of financial position when the Group has a present legal or constructive obligation as a
result of a past event, and it is probable that an outflow of economic benefits will be required to settle the obligation and to reasonably estimate
the obligation’s value. To determine the provision, the future cash flows are discounted using a pre-tax discount rate, which reflects the current
market conditions and risks incurred by the respective liability.
w) Financial guarantees
Financial guarantees are contracts that require the Group to make specified payments to reimburse the holder for a loss it incurs because a
specified debtor fails to make payment when due in accordance with the terms of a debt instrument.
Financial guarantee liabilities are initially recognized at their fair value, and the initial fair value is amortized over the life of the financial
guarantee. The guarantee liability is subsequently carried at the higher of this amortized amount and the present value of any expected payment
(when a payment under the guarantee has become probable).
x) Employee benefits
(i) Short term benefits
Short-term employee benefits include wages, salaries, bonuses and social security contributions. Short-term employee benefits are recognized as
expense when services are rendered.
(ii) Defined contribution plans
The Bank and its subsidiaries, in the normal course of business, makes payments to the Romanian State funds on behalf of its Romanian
employees for pension, health care and unemployment benefit. All employees of the Bank and its subsidiaries are members and are also legally
obliged to make defined contributions (included in the social security contributions) to the Romanian State pension plan (a State defined
contribution plan). All relevant contributions to the Romanian State pension plan are recognized as an expense in the income statement as
incurred. The Bank and its subsidiaries do not have any further obligations.
The Bank and its subsidiaries do not operate any independent pension scheme and, consequently, have no obligation in respect of pensions.
The Bank and its subsidiaries do not operate any other post retirement benefit plan. The Bank and its subsidiaries have no obligation to provide
further services to current or former employees.
26

y) Segment reporting
A segment is a distinguishable component of the Group that is engaged either in providing products or services (business segment), or in
providing products or services within a particular economic environment (geographical segment), which is subject to risks and rewards that are
different from those of other segments. The Group’s primary format for segment reporting is based on business segments.
z) Earnings per share
The Group presents basic and diluted earnings per share (“EPS”) data for its ordinary shares. Basic EPS is calculated by dividing the profit or loss
attributable to ordinary shareholders of the Bank by the weighted average of ordinary shares outstanding during the period. Diluted EPS is
determined by adjusting the profit or loss attributable to ordinary shareholders and the weighted average of ordinary shares outstanding for the
effect of all dilutive potential ordinary shares, which comprise convertible notes and share options granted to employees.
aa) Treasury shares
Own equity instruments which are reacquired (treasury shares) are deducted from equity. No gain or loss is recognized in the income statement
on the purchase, sale, issue or cancellation of the Group’s own equity instruments.
ab) New standards and interpretations not yet adopted
A number of new standards, amendments to standards and interpretations are not yet effective for the year ended 31 December 2009, and have
not been applied in preparing these financial statements. None of these standards will have an impact on the financials, except for:
• IFRS 9 Financial Instruments, published on 12 November 2009 as part of phase I of the IASB’s comprehensive project to replace IAS 39,
deals with classification and measurement of financial assets. The requirements of this standard represent a significant change from the
existing requirements in IAS 39 in respect of financial assets. The standard contains two primary measurement categories for financial
assets: amortized cost and fair value. A financial asset would be measured at amortized cost if it is held within a business model whose
objective is to hold assets in order to collect contractual cash flows, and the asset’s contractual terms give rise on specified dates to cash
flows that are solely payments of principal and interest on the principal outstanding. All other financial assets would be measured at fair
value. The standard eliminates the existing IAS 39 categories of held to maturity, available for sale and loans and receivables. For an
investment in an equity instrument which is not held for trading, the standard permits an irrevocable election, on initial recognition, on
an individual share-by-share basis, to present all fair value changes from the investment in other comprehensive income. No amount
recognized in other comprehensive income would ever be reclassified to profit or loss at a later date. However, dividends on such
investments are recognized in profit or loss, rather than other comprehensive income unless they clearly represent a partial recovery of
the cost of the investment. Investments in equity instruments in respect of which an entity does not elect to present fair value changes in
other comprehensive income would be measured at fair value with changes in fair value recognized in profit or loss. This standard was
not yet adopted by European Union.
The standard requires that derivatives embedded in contracts with a host that is a financial asset within the scope of the standard are not
separated; instead the hybrid financial instrument is assessed in its entirety as to whether it should be measured at amortized cost or fair
value. The standard is effective for annual periods beginning on or after 1 January 2013. Earlier application is permitted.
Given the nature of the Group’s operations, this standard is expected to have a pervasive impact on the Group’s financial statements.
• Revised IFRS 3 Business Combinations (effective for annual periods beginning on or after 1 July 2009). The scope of the revised
Standard has been amended and the definition of a business has been expanded. The revised Standard also includes a number of other
potentially significant changes including:
• All items of consideration transferred by the acquirer are recognized and measured at fair value as of the acquisition date,
including contingent consideration.
• Subsequent change in contingent consideration will be recognized in profit or loss.
• Transaction costs, other than share and debt issuance costs, will be expensed as incurred.
• The acquirer can elect to measure any non-controlling interest at fair value at the acquisition date (full goodwill), or at its
proportionate interest in the fair value of the identifiable assets and liabilities of the acquiree, on a transaction-by-transaction
basis.
27

As the revised Standard should not be applied to business combinations prior to the date of adoption, the revised Standard is expected
to have no impact on the financial statements with respect to business combinations that occur before the date of adoption of the revised
Standard.
• Revised IAS 27 Consolidated and Separate Financial Statements (effective for annual periods beginning on or after 1 July 2009). In the
revised Standard the term minority interest has been replaced by non-controlling interest, and is defined as "the equity in a subsidiary not
attributable, directly or indirectly, to a parent". The revised Standard also amends the accounting for non-controlling interest, the loss of
control of a subsidiary, and the allocation of profit or loss and other comprehensive income between the controlling and non-controlling
interest. The Group has not yet completed its analysis of the impact of the revised Standard.
• Amendment to IAS 32 Financial Instruments: Presentation – Classification of Rights Issues (effective for annual period beginning on or
after 1 February 2010). The amended Standard clarifies the application of existing principles that determine whether specific risks or
portions of cash flows are eligible for designation in a hedging relationship. In designating a hedging relationship the risks or portions
must be separately identifiable and reliably measurable; however inflation cannot be designated, except in limited circumstances. The
amendments to IAS 32 are not relevant to the Group’s financial statements as the Group has not issued such instruments at any time in
the past.
• Amendment to IAS 39 Financial Instruments: Recognition and Measurement – Eligible Hedged Items (effective for annual periods
beginning on or after 1 July 2009). The amended Standard clarifies the application of existing principles that determine whether specific
risks or portions of cash flows are eligible for designation in a hedging relationship. In designating a hedging relationship the risks or
portions must be separately identifiable and reliably measurable; however inflation cannot be designated, except in limited
circumstances. The amendments to IAS 39 are not relevant to the Group’s financial statements as the Group does not apply hedge
accounting.
• IFRIC 12 Service Concession Arrangements (effective for first annual reporting period beginning on or after 1 April 2009). The
Interpretation provides guidance to private sector entities on certain recognition and measurement issues that arise in accounting for
public-to-private service concession arrangements. IFRIC 12 is not relevant to the Group’s operations as none of the Group entities have
entered into any service concession arrangements.
• IFRIC 15 Agreements for the Construction of Real Estate (effective for annual periods beginning on or after 1 January 2010). IFRIC 15
clarifies that revenue arising from agreements for the construction of real estate is recognized by reference to the stage of completion of
the contract activity in the following cases:
• the agreement meets the definition of a construction contract in accordance with IAS 11.3;
• the agreement is only for the rendering of services in accordance with IAS 18 (e.g., the entity is not required to supply
construction materials); and
• the agreement is for the sale of goods but the revenue recognition criteria of IAS 18.14 are met continuously as construction
progresses.
In all other cases, revenue is recognized when all of the revenue recognition criteria of IAS 18.14 are satisfied (e.g., upon completion of
construction or upon delivery).
IFRIC 15 is not relevant to the Group’s financial statements as the Group does not provide real estate construction services or develop
real estate for sale.
• IFRIC 16 Hedges of a Net Investment in a Foreign Operation (effective for annual periods beginning on or after 1 July 2009). The
Interpretation explains the type of exposure that may be hedged, where in the group the hedged item may be held, whether the method
of consolidation affects hedge effectiveness, the form the hedged instrument may take and which amounts are reclassified from equity to
profit or loss on disposal of the foreign operation. IFRIC 16 is not relevant to the Group’s financial statements as the Group has not
designated any hedges of a net investment in a foreign operation.
• IFRIC 17 Distributions of Non-cash Assets to Owners (effective prospectively for annual periods beginning on or after 1 November
2009). The Interpretation applies to non-reciprocal distributions of non-cash assets to owners acting in their capacity as owners. In
accordance with the Interpretation a liability to pay a dividend shall be recognized when the dividend is appropriately authorized and is
no longer at the discretion of the entity and shall be measured at the fair value of the assets to be distributed. The carrying amount of the
dividend payable shall be remeasured at each reporting date, with any changes in the carrying amount recognized in equity as
adjustments to the amount of the distribution. When the dividend payable is settled, the difference, if any, between the carrying amount
of the assets distributed and the carrying amount of the dividend payable shall be recognized in profit or loss. As the Interpretation is
applicable only from the date of application, it will have no impact on the financial statements for periods prior to the date of adoption
of the interpretation.
• IFRIC 18 Transfers of Assets from Customers (effective prospectively for annual period beginning on or after 1 November 2009). The
Interpretation requires an entity that receives a contribution in the scope of the Interpretation to recognize the item as an asset at its fair
28

value if the transferred item meets the criteria for property, plant, and equipment in IAS 16, Property, Plant and Equipment. The
Interpretation also requires the entity to recognize the amount as revenue; the timing of revenue recognition depends on the facts and
circumstances of the particular arrangement. IFRIC 18 is not relevant to the Group’s financial statements as the Group does normally
receive contributions from customers.
4. Financial Risk Management
a) Introduction
The Group has exposure to the following risks from its use of financial instruments:
• Credit risk
• Liquidity risk
• Market risk
• Operational risk
• Taxation risk
This note presents information about the Group’s exposure to each of the above risks, the Group’s objectives, policies and processes for
measuring and managing risk. The most important types of financial risk to which the Group is exposed are credit risk, liquidity risk and market
risk. Market risk includes currency risk, interest rate risk and equity price risk.
Risk management framework
The risk management is an important part of all the decisional and business processes within the Group.
The Board of Directors has overall responsibility for the establishment and oversight of the Group’s risk management framework. The Board of
Directors has appointed the Management Committee, Risk Management Committee, Asset and Liability Committee (ALCO), Operations Risk
Committee, Credit Committee (lending policy), HQ Credit and Risk Committee (loan approval), Credit and Risk Committee within
Branches/Agencies, in charge with drafting/and or monitoring risk management policies in their specified areas. The Board of Directors
periodically reviews the activity of these committees.
The Board of Directors monitors the Group’s compliance with the risk policies and the appropriateness of the general risk management
framework related to the risks the Group is exposed to.
Banca Transilvania S.A.’s strategy regarding significant risk management focuses over the realization of the budgeted ratios in a controlled risk
environment which ensures both the normal continuity of the business and the protection of the shareholders and clients’ interest. Banca
Transilvania S.A. ensures that its risk management strategy is adequate in terms of undertaken risk profile, nature, size and business complexity
and also in correlation with its business plan.
Risk management policies and systems are reviewed regularly (mainly annually) with the participation of the Executive Management Committee,
Risk Management Committee and responsible persons within the involved departments in order to reflect the changes in the market conditions,
products and services provided.
The Group’s Audit Committee reports to Board of Directors and is responsible for with monitoring compliance with the Bank’s risk management
procedures. The Audit Committee is assisted in these functions by Internal Audit. Internal Audit performs regular and ad-hoc reviews of risk
management controls and procedures, the results being reported to the Audit Committee.
The Board of Directors and management committees of the subsidiaries which constitute the Group are responsible for significant risk
management, in correlation with their business characteristics and the legislation in force.
29

b) Credit risk
(i) Credit risk management
The Group is exposed to credit risk through its trading, lending, leasing and investing activities, as well as in cases of guarantee issues. Credit
risk associated with trading and investing activities is mitigated through selecting counterparties of good credit standings and monitoring their
activities and ratings and through the use of exposure limits and when appropriate by collateral.
The Group’s primary exposure to credit risk arises through its loans and advances to customers. The amount of credit exposure in this regard is
represented by the carrying amounts of the assets on the balance sheet. The Group is exposed to credit risk on various other financial assets,
including derivative instruments and debt investments, the current credit exposure in respect of these instruments is equal to the carrying amount
of these assets in the Consolidated statement of financial situation. In addition, the Group is exposed to off balance sheet credit risk through
commitments to extend credit and issued guarantees (see Note 36).
In order to minimize the risk, the Group has certain procedures meant to assess the clients before granting the loans, to observe their capacity
of reimbursing the principal and related interests during the entire period of the loans and to establish exposure limits.
The Board of Directors delegated the responsibility for credit risk management to the Management Committee, Banking Risk Management
Committee (“CARB”), Credit Committee (lending policy), Credit and Risk committee within the Bank’s headquarters (loan approval), Credit and
Risk committees within the branches / agencies at local level. Furthermore, inside the Group operates the Risk Management Department, which
reports to the HQ committees previously presented and has the following responsibilities:
• Identifying and assessing the specific risks within the lending activity;
• Complying with internal regulations specific for the lending activity;
• Elaborating proposals for reducing specific risks, to maintain sound lending standards;
• Monitoring the granted loans, in accordance with the client’s financial performance, type of loan credit, the nature of collateral and
debt service, according to the internal lending norms;
• Approving and valuating ratio computation regarding lending competence assignment/modification according to the specific internal
policies;
• Periodical revision and recommendation of accepted risk levels to the Risk Management Committee;
• Identifying, monitoring and controlling credit risk at branch level;
• Complying with internal norms, NBR regulations and legislation in force regarding the lending activity performed in the bank’s units;
• Drafting of proposals to reduce specific risks, to maintain lending standards within the branches;
• Risk analysis for new/changes of credit products, including recommendations to the involved directions;
• Approving computed counterparty exposure limits
• Accepting proposals from specialized departments;
• Periodical assessment and presentation of reports to CARB and the Board of Directors regarding the evolution of significant risks (risk
implications, forecasts).
Each Branch / Agency implements at local level the Group policies and regulations regarding the credit risk, having loan approval
competencies established by the Management Committee. Each Branch is responsible for the quality and performance of its credit portfolio and
for monitoring and controlling all credit risks in its portfolios, including those subject to HQ approval.
The Internal Audit Department and the Risk Inspection Department within the Risk Management Department carries out periodical verifications
of the branches and agencies.
The Group classified the exposures according to the risk level of the potential financial losses. The risk classification system is used for assessing
the risk monitoring activities and the rapport with the customers. The scoring system reflects different levels of the default risk and is reviewed
periodically.
30
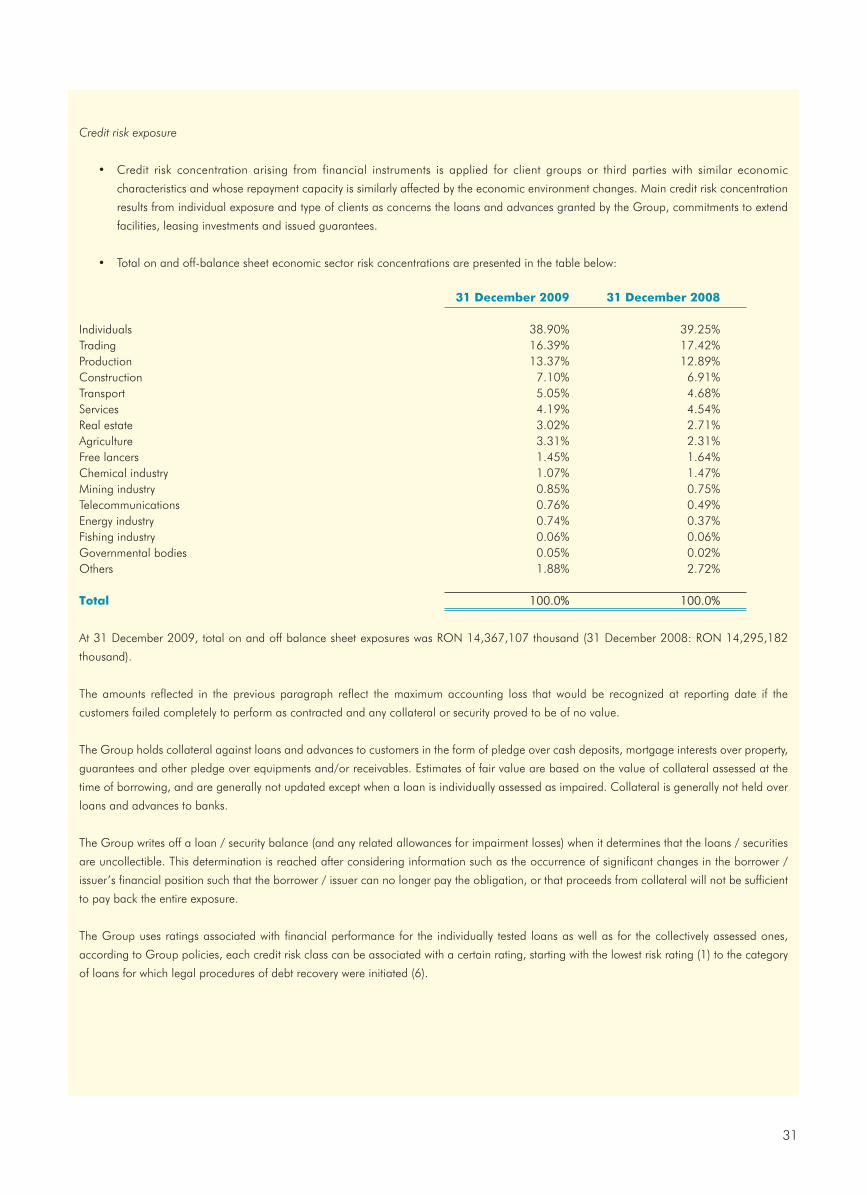
Credit risk exposure
• Credit risk concentration arising from financial instruments is applied for client groups or third parties with similar economic
characteristics and whose repayment capacity is similarly affected by the economic environment changes. Main credit risk concentration
results from individual exposure and type of clients as concerns the loans and advances granted by the Group, commitments to extend
facilities, leasing investments and issued guarantees.
• Total on and off-balance sheet economic sector risk concentrations are presented in the table below:
31 December 2009 31 December 2008
Individuals 38.90% 39.25%Trading 16.39% 17.42%Production 13.37% 12.89%Construction 7.10% 6.91%Transport 5.05% 4.68%Services 4.19% 4.54%Real estate 3.02% 2.71%Agriculture 3.31% 2.31%Free lancers 1.45% 1.64%Chemical industry 1.07% 1.47%Mining industry 0.85% 0.75%Telecommunications 0.76% 0.49%Energy industry 0.74% 0.37%Fishing industry 0.06% 0.06%Governmental bodies 0.05% 0.02%Others 1.88% 2.72%
Total 100.0% 100.0%
At 31 December 2009, total on and off balance sheet exposures was RON 14,367,107 thousand (31 December 2008: RON 14,295,182
thousand).
The amounts reflected in the previous paragraph reflect the maximum accounting loss that would be recognized at reporting date if the
customers failed completely to perform as contracted and any collateral or security proved to be of no value.
The Group holds collateral against loans and advances to customers in the form of pledge over cash deposits, mortgage interests over property,
guarantees and other pledge over equipments and/or receivables. Estimates of fair value are based on the value of collateral assessed at the
time of borrowing, and are generally not updated except when a loan is individually assessed as impaired. Collateral is generally not held over
loans and advances to banks.
The Group writes off a loan / security balance (and any related allowances for impairment losses) when it determines that the loans / securities
are uncollectible. This determination is reached after considering information such as the occurrence of significant changes in the borrower /
issuer’s financial position such that the borrower / issuer can no longer pay the obligation, or that proceeds from collateral will not be sufficient
to pay back the entire exposure.
The Group uses ratings associated with financial performance for the individually tested loans as well as for the collectively assessed ones,
according to Group policies, each credit risk class can be associated with a certain rating, starting with the lowest risk rating (1) to the category
of loans for which legal procedures of debt recovery were initiated (6).
31
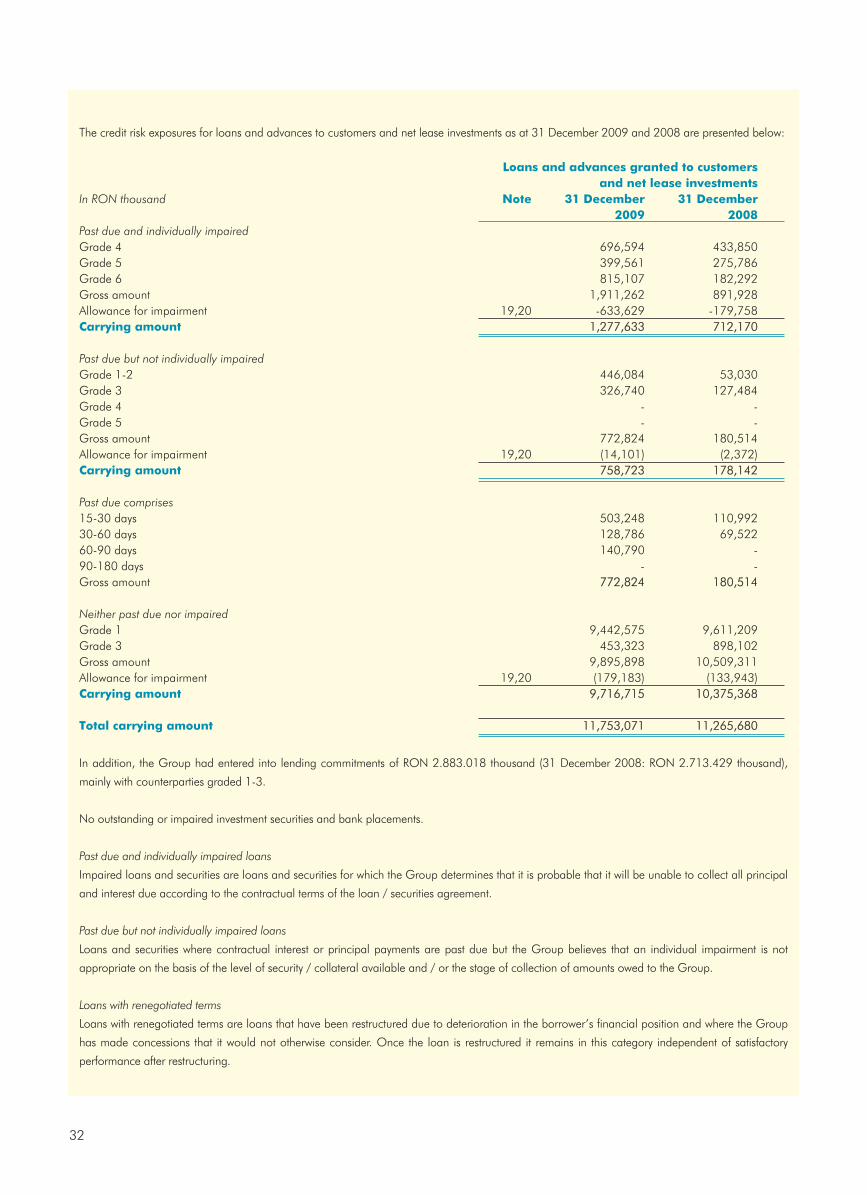
The credit risk exposures for loans and advances to customers and net lease investments as at 31 December 2009 and 2008 are presented below:
Loans and advances granted to customersand net lease investments
In RON thousand Note 31 December 31 December2009 2008
Past due and individually impairedGrade 4 696,594 433,850Grade 5 399,561 275,786Grade 6 815,107 182,292Gross amount 1,911,262 891,928Allowance for impairment 19,20 -633,629 -179,758Carrying amount 1,277,633 712,170
Past due but not individually impairedGrade 1-2 446,084 53,030Grade 3 326,740 127,484Grade 4 - -Grade 5 - -Gross amount 772,824 180,514Allowance for impairment 19,20 (14,101) (2,372)Carrying amount 758,723 178,142
Past due comprises15-30 days 503,248 110,99230-60 days 128,786 69,52260-90 days 140,790 -90-180 days - -Gross amount 772,824 180,514
Neither past due nor impairedGrade 1 9,442,575 9,611,209Grade 3 453,323 898,102Gross amount 9,895,898 10,509,311Allowance for impairment 19,20 (179,183) (133,943)Carrying amount 9,716,715 10,375,368
Total carrying amount 11,753,071 11,265,680
In addition, the Group had entered into lending commitments of RON 2.883.018 thousand (31 December 2008: RON 2.713.429 thousand),
mainly with counterparties graded 1-3.
No outstanding or impaired investment securities and bank placements.
Past due and individually impaired loans
Impaired loans and securities are loans and securities for which the Group determines that it is probable that it will be unable to collect all principal
and interest due according to the contractual terms of the loan / securities agreement.
Past due but not individually impaired loans
Loans and securities where contractual interest or principal payments are past due but the Group believes that an individual impairment is not
appropriate on the basis of the level of security / collateral available and / or the stage of collection of amounts owed to the Group.
Loans with renegotiated terms
Loans with renegotiated terms are loans that have been restructured due to deterioration in the borrower’s financial position and where the Group
has made concessions that it would not otherwise consider. Once the loan is restructured it remains in this category independent of satisfactory
performance after restructuring.
32

Allowances for impairment
The Group sets an allowance for impairment losses that represents its estimate of incurred losses in its loan portfolio, The main components of this
allowance are an individual loan loss component that relates to individually significant exposures, and a collective loan loss allowance established for
groups of homogeneous assets in respect of losses that have been incurred but have not been identified on loans subject to individual assessment for
impairment.
Write-off policy
The Group writes off a loan / security balance (and any related allowances for impairment losses) when the Group’s Risk Committee/ Board of
Directors determines that the loans / securities are uncollectible. This determination is reached after considering information such as the occurrence
of significant changes in the borrower / issuer’s financial position such that the borrower / issuer can no longer pay the obligation, or that proceeds
from collateral will not be sufficient to pay back the entire exposure. For smaller balance standardized loans, charge off decisions generally are based
on a product specific past due status.
Set out below is an analysis of the gross and net (of allowances for impairment) amounts of individually impaired assets by risk grade:
In thousand RON Gross amount Carrying amount
31 December 2009Grade 4 696,594 639,134Grade 5 399,561 396,579Grade 6 815,107 241,920Total 1,911,262 1,277,633
31 December 2008Grade 4 433,850 423,198Grade 5 275,786 262,943Grade 6 182,292 26,029Total 891,928 712,170
The Group holds collateral against loans and advances to customers in the form of mortgage interests over land and buildings, property,
inventory, insurance policies, financed assets that represent objects of the lease agreements, on which the Group has the ownership right until
the end of the contracts, and other guarantees. Estimates of fair value are based on the value of collateral assessed at the time of borrowing,
and periodical updates on collaterals.
An estimate of the value of collateral and other security enhancements held against financial assets is shown below:
In thousand RON 31 December 2009 31 December 2008
Against past due and individually impairedProperty 1,897,359 890,222Debt securities 361,328 155,943Other 159,598 27,578
2,418,285 1,073,743Against past due but not individually impaired Property 918,468 1,359,921Debt securities 81,357 91,536Other 108,909 16,965
1,108,734 1,468,422Against neither past due nor impairedProperty 10,287,866 10,128,060Debt securities 2,038,774 808,906Other 1,090,340 212,929
13,416,980 11,149,895
Total 16,943,999 13,692,060
33

c) Liquidity risk
Liquidity risk is the general policy of the institution's inability to honor their debt outstanding at maturity date. The Group is concerned on the
counteract of this type of risk in the 2 components: the difficulties in procuring funds on the relative maturity date, necessary to refinance current
assets or the inability to convert an asset into cash at a value near its fair value, in a reasonable period of time.
The group has access to a diverse funding base. Funds are raised using a broad range of instruments including bank deposits from customers
or partners, loans from development institutions and financial institutions and share capital. Access to diverse funding sources improves flexibility
to attract funds, limiting dependence on one type of financing and on one type of partner and lead to an overall decrease of costs of
fundraising. The group tries to maintain a balance between continuity and flexibility of attracting funds, through contracting debts with different
maturities and different currencies. The Group continually assesses liquidity risk by identifying and monitoring changes in funding, and
diversifying the funding sources.
The financial assets and liabilities of the Group analyzed over the remaining period from the balance sheet date to contractual maturity are as
at 31 December 2009 as follows:
34

35
In R
ON
thou
sand
Up
to
33
– 6
6 –
121
– 3
3 –
5O
ver
5W
ith
out
Tota
l
mon
ths
mon
ths
mon
ths
yea
rsye
ars
yea
rsm
atu
rity
31 D
ece
mb
er
2009
Fin
an
cia
l a
ssets
Cas
h an
d ca
sh e
quiv
alen
ts3,
186,
997
--
--
--
3,18
6,99
7Pl
acem
ents
with
ban
ks1,
369,
877
48,5
411,
289
106,
208
-10
,000
-1,
535,
915
Fina
ncia
l ass
ets
at fa
ir va
lue
thro
ugh
prof
it an
d lo
ss-
--
--
-44
,865
44,8
65Lo
ans
and
adva
nces
to c
usto
mer
s1,
396,
737
1,19
9,31
62,
137,
453
1,91
8,93
71,
027,
804
3,80
1,51
2-
11,4
81,7
59N
et le
ase
inve
stm
ents
31,3
2529
,222
54,4
9712
5,03
531
,233
--
271,
312
Fina
ncia
l ass
ets
avai
labl
e fo
r sa
le52
1,68
070
4,09
473
0,12
038
8,60
816
5,05
532
,722
31,1
872,
573,
466
Hel
d-to
-mat
urity
inve
stm
ents
308
10,5
66-
780
--
-11
,654
Inve
stm
ent i
n as
soci
ates
ent
ities
--
--
--
42,4
0442
,404
Oth
er a
sset
s11
2,85
32,
195
2,25
52,
938
1,21
872
2-
122,
181
Tota
l fi
na
nci
al a
ssets
6,61
9,77
71,
993,
934
2,92
5,61
42,
542,
506
1,22
5,31
03,
844,
956
118,
456
19,2
70,5
53
Fin
an
cia
l lia
bilit
ies
Dep
osits
from
ban
ks25
8,91
422
0-
--
--
259,
134
Dep
osits
from
cus
tom
ers
10,2
76,6
421,
115,
635
544,
609
950,
209
2,07
8,03
024
,074
-14
,989
,199
Loan
s fro
m b
anks
and
oth
er fi
nanc
ial
inst
itutio
ns, o
ther
sub
ordi
nate
d lo
ans
and
debt
sec
uriti
es is
sued
425,
967
175,
838
316,
542
789,
900
571,
199
135,
885
-2,
415,
331
Oth
er li
abili
ties
110,
330
167
292
543
--
-11
1,33
2
Tota
l fi
na
nci
al lia
bilit
ies
11,0
71,8
531,
291,
860
861,
443
1,74
0,65
22,
649,
229
159,
959
-17
,774
,996
Ma
turi
ty s
urp
lus
/ (s
hort
fall)
(4,4
52,0
76)
702,
074
2,06
4,17
180
1,85
4(1
,423
,919
)3,
684,
997
118,
456
1,49
5,55
7
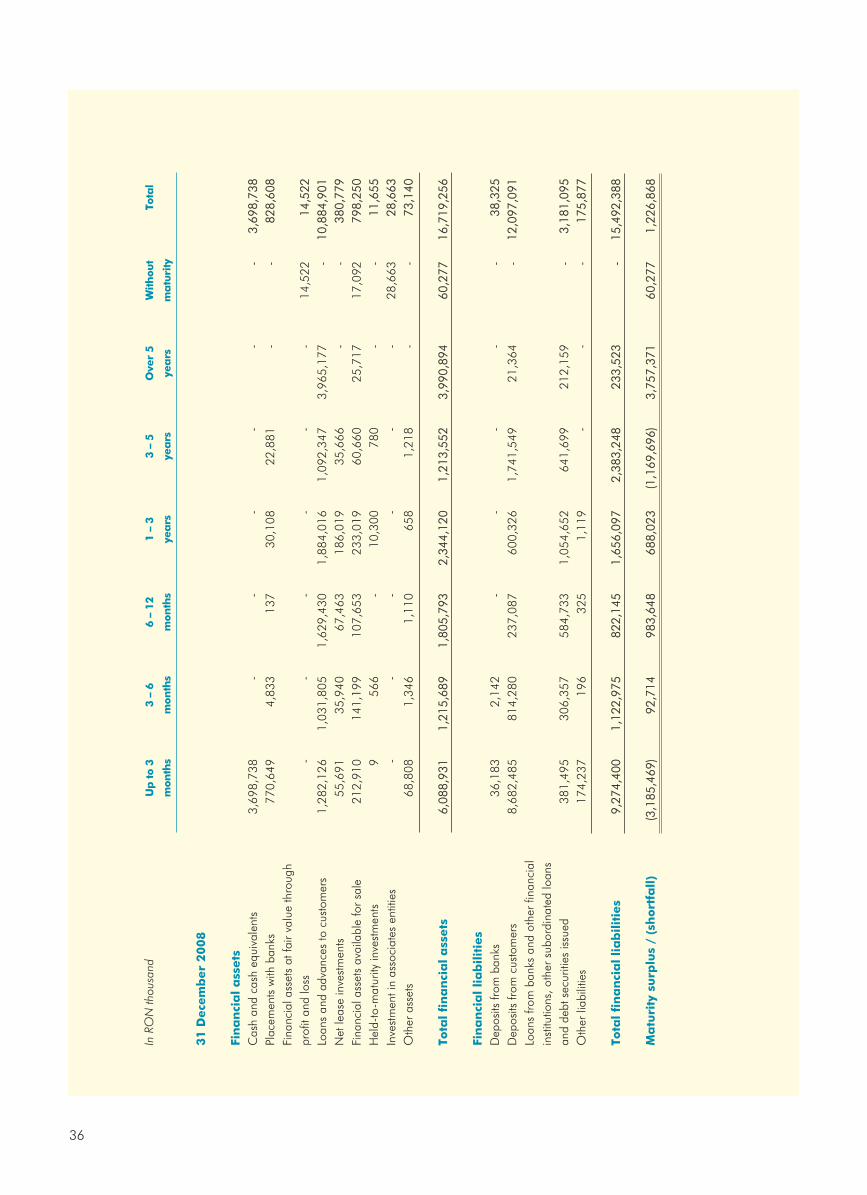
36
In R
ON
thou
sand
Up
to
33
– 6
6 –
121
– 3
3 –
5O
ver
5W
ith
out
Tota
l
mon
ths
mon
ths
mon
ths
yea
rsye
ars
yea
rsm
atu
rity
31 D
ece
mb
er
2008
Fin
an
cia
l a
ssets
Cas
h an
d ca
sh e
quiv
alen
ts3,
698,
738
--
--
--
3,69
8,73
8Pl
acem
ents
with
ban
ks77
0,64
94,
833
137
30,1
0822
,881
--
828,
608
Fina
ncia
l ass
ets
at fa
ir va
lue
thro
ugh
prof
it an
d lo
ss-
--
--
-14
,522
14,5
22Lo
ans
and
adva
nces
to c
usto
mer
s1,
282,
126
1,03
1,80
51,
629,
430
1,88
4,01
61,
092,
347
3,96
5,17
7-
10,8
84,9
01N
et le
ase
inve
stm
ents
55,6
9135
,940
67,4
6318
6,01
935
,666
--
380,
779
Fina
ncia
l ass
ets
avai
labl
e fo
r sa
le21
2,91
014
1,19
910
7,65
323
3,01
960
,660
25,7
1717
,092
798,
250
Hel
d-to
-mat
urity
inve
stm
ents
956
6-
10,3
0078
0-
-11
,655
Inve
stm
ent i
n as
soci
ates
ent
ities
--
--
--
28,6
6328
,663
Oth
er a
sset
s68
,808
1,34
61,
110
658
1,21
8-
-73
,140
Tota
l fi
na
nci
al a
ssets
6,08
8,93
11,
215,
689
1,80
5,79
32,
344,
120
1,21
3,55
23,
990,
894
60,2
7716
,719
,256
Fin
an
cia
l lia
bilit
ies
Dep
osits
from
ban
ks36
,183
2,14
2-
--
--
38,3
25D
epos
its fr
om c
usto
mer
s8,
682,
485
814,
280
237,
087
600,
326
1,74
1,54
921
,364
-12
,097
,091
Loan
s fro
m b
anks
and
oth
er fi
nanc
ial
inst
itutio
ns, o
ther
sub
ordi
nate
d lo
ans
and
debt
sec
uriti
es is
sued
381,
495
306,
357
584,
733
1,05
4,65
264
1,69
921
2,15
9-
3,18
1,09
5O
ther
liab
ilitie
s17
4,23
719
632
51,
119
--
-17
5,87
7
Tota
l fi
na
nci
al lia
bilit
ies
9,27
4,40
01,
122,
975
822,
145
1,65
6,09
72,
383,
248
233,
523
-15
,492
,388
Ma
turi
ty s
urp
lus
/ (s
hort
fall)
(3,1
85,4
69)
92,7
1498
3,64
868
8,02
3(1
,169
,696
)3,
757,
371
60,2
771,
226,
868

d) Market risk
Market risk is the risk that changes depending on market prices, such as interest rate, equity prices, foreign exchange rates and credit spreads (not
relating to changes in the obligor’s / issuer’s credit standing) will affect the Group’s income or the value of its holdings of financial instruments. The
objective of market risk management is to manage and control market risk exposures within acceptable parameters, while optimizing the return on risk.
Exposure to market risk – trading portfolio
The Group controls its exposure to market risk by daily monitoring the market value of the trading portfolio relating to a system of limits of “stop
loss” type approved by the Assets and Liabilities Committee. The trading portfolio comprises: fixed-income securities issued in Romania or on
the European markets (government bonds, bonds whose issuer is rated not less than the sovereign rating) denominated in LEI or EURO and
shares issued by Romanian entities traded on the Bucharest Stock Exchange (that are not directly exposed to interest and foreign exchange risk,
being exposed to price risk).
Exposure to interest rate risk –non-trading portfolio
The principal risk to which non-trading portfolios are exposed is the risk of loss from fluctuations in the future cash flows or fair values of financial
instrument because of a change in market interest rates. Interest rate risk is managed principally through monitoring GAP's interest rates and by
having pre-approved limits for re-pricing bands. Assets and Liabilities Committee is the monitoring body for compliance with these limits and is
assisted by Treasury Department in its day-to-day monitoring activities.
Interest rate risk
Managing interest rate risk within the variation limits of the interest rate is supplemented by monitoring the sensitivity of the Group financial
assets and liabilities in different standard scenarios of interest rate. The monthly standard scenarios include the parallel decrease or increase of
the interest curve with 100 and 200 basis points.
An analysis of the Bank’s interest carrying assets and liabilities sensitivity to the increase or decrease in the market interest rates is set out below:
200 basis 200 basis 100 basis 100 basispoints points points points
Increase Decrease Increase DecreaseRON RON RON RON
thousand thousand thousand thousand
As at 31 December 2009Average for the period 38,411 (38,411) 19,205 (19,205)Minimum for the period (12,057) 12,057 (6,029) 6,029 Maximum for the period 99,859 (99,859) 49,929 (49,929)
As at 31 December 2008Average for the period (7,386) 7,386 (3,693) 3,693Minimum for the period (47,072) 2 (23,536) 1Maximum for the period (2) 47,072 (1) 23,536
In the sensitivity analysis regarding interest rate variation the Bank has computed the impact over the interest margin over the future financial
exercise by taking into consideration the interest rate resetting date for assets and liabilities recorded in the balance sheet as follows: the Bank
divided the assets and liabilities bearing fixed interest rate from the ones bearing variable interest rate and for each category the following split
was made: less than 1 week, 1 week – 3 months, 3 – 6 months, 6 – 12 months, 1 – 3 years and 3 – 4 years; for the assets and liabilities with
variable interest rate the future interest cash flows were recomputed by modifying the interest rate by +/- 100 and 200 basis points.
Based on the Bank’s sensitivity analysis according to the methodology presented above it can be observed that the impact over the Bank’s profit
over the next 3 years is limited. The most significant impact is recorded between 3 and 4 years, which gives the Bank enough time to adjust to
current market conditions. The average for the period included in the table above represents the average monthly impact of the change in
37
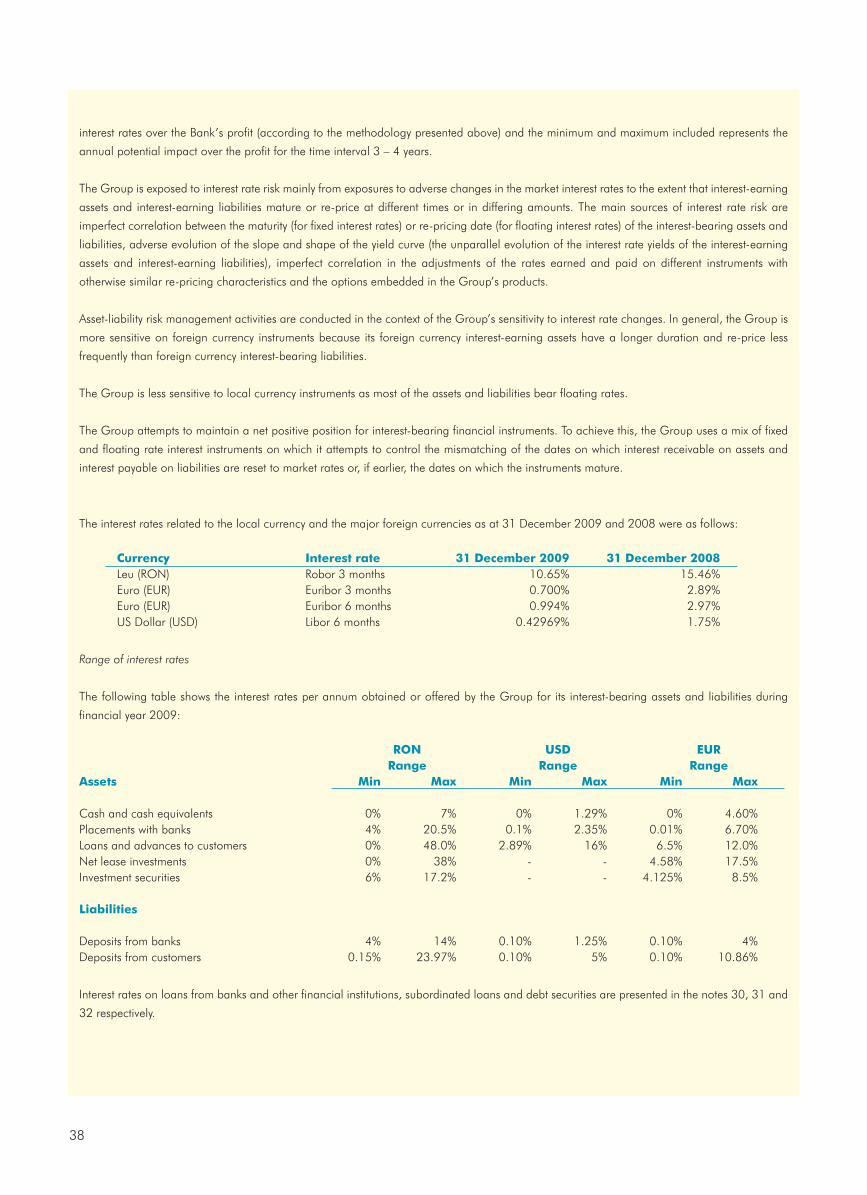
interest rates over the Bank’s profit (according to the methodology presented above) and the minimum and maximum included represents the
annual potential impact over the profit for the time interval 3 – 4 years.
The Group is exposed to interest rate risk mainly from exposures to adverse changes in the market interest rates to the extent that interest-earning
assets and interest-earning liabilities mature or re-price at different times or in differing amounts. The main sources of interest rate risk are
imperfect correlation between the maturity (for fixed interest rates) or re-pricing date (for floating interest rates) of the interest-bearing assets and
liabilities, adverse evolution of the slope and shape of the yield curve (the unparallel evolution of the interest rate yields of the interest-earning
assets and interest-earning liabilities), imperfect correlation in the adjustments of the rates earned and paid on different instruments with
otherwise similar re-pricing characteristics and the options embedded in the Group’s products.
Asset-liability risk management activities are conducted in the context of the Group’s sensitivity to interest rate changes. In general, the Group is
more sensitive on foreign currency instruments because its foreign currency interest-earning assets have a longer duration and re-price less
frequently than foreign currency interest-bearing liabilities.
The Group is less sensitive to local currency instruments as most of the assets and liabilities bear floating rates.
The Group attempts to maintain a net positive position for interest-bearing financial instruments. To achieve this, the Group uses a mix of fixed
and floating rate interest instruments on which it attempts to control the mismatching of the dates on which interest receivable on assets and
interest payable on liabilities are reset to market rates or, if earlier, the dates on which the instruments mature.
The interest rates related to the local currency and the major foreign currencies as at 31 December 2009 and 2008 were as follows:
Currency Interest rate 31 December 2009 31 December 2008Leu (RON) Robor 3 months 10.65% 15.46%Euro (EUR) Euribor 3 months 0.700% 2.89%Euro (EUR) Euribor 6 months 0.994% 2.97%US Dollar (USD) Libor 6 months 0.42969% 1.75%
Range of interest rates
The following table shows the interest rates per annum obtained or offered by the Group for its interest-bearing assets and liabilities during
financial year 2009:
RON USD EURRange Range Range
Assets Min Max Min Max Min Max
Cash and cash equivalents 0% 7% 0% 1.29% 0% 4.60%Placements with banks 4% 20.5% 0.1% 2.35% 0.01% 6.70%Loans and advances to customers 0% 48.0% 2.89% 16% 6.5% 12.0%Net lease investments 0% 38% - - 4.58% 17.5%Investment securities 6% 17.2% - - 4.125% 8.5%
Liabilities
Deposits from banks 4% 14% 0.10% 1.25% 0.10% 4%Deposits from customers 0.15% 23.97% 0.10% 5% 0.10% 10.86%
Interest rates on loans from banks and other financial institutions, subordinated loans and debt securities are presented in the notes 30, 31 and
32 respectively.
38

The following table shows the interest rates per annum obtained or offered by the Group for its interest-bearing assets and liabilities during
financial year 2008:
RON USD EURRange Range Range
Assets Min Max Min Max Min Max
Cash and cash equivalents 0% 7% 0% 1.3% 0% 4%Placements with banks 2% 65% 1% 6.5% 1.4% 7.5%Loans and advances to customers 0% 38% 4.6% 13.% 0% 17.5%Net lease investments 0% 38% - - 5.4% 18.3%Investment securities 6% 14.2% - - - -
Liabilities
Deposits from banks 2% 27.5% 1% 5.8% 4.2% 7.3%Deposits from customers 0% 23.2% 0.1% 5% 0% 10%
A summary of the Group’s interest rate gap position on interest bearing instruments as at 31 December 2009 is as follows:
In RON thousand Less than 6 – 12 1 – 3 3 – 5 More than Non Total6 months months years years 5 years sensitive
31 December 2009Financial assetsCash and cash equivalents 3,186,997 - - - - - 3,186,997Placements with banks 1,418,418 1,289 106,208 - 10,000 - 1,535,915Financial assets at fair value through profit and loss 44,865 - - - - - 44,865Loans and advances to customers 6,991,886 4,223,639 265,076 1,158 - - 11,481,759Net lease investments 148,806 113,285 8,096 1,125 - - 271,312Financial assets available for sale 1,253,769 730,120 388,608 165,055 32,722 3,192 2,573,466Held-to-maturity investments 10,874 - 780 - - - 11,654
13,055,615 5,068,333 768,768 167,338 42,722 3,192 19,105,968
Financial liabilitiesDeposits from banks 259,134 - - - - - 259,134Deposits from customers 11,385,953 3,481,518 96,359 5,574 19,795 - 14,989,199Loans from banks and other financial institutions, other subordinated loans and debt securities 2,324,223 78,545 12,563 - - - 2,415,331
13,969,310 3,560,063 108,922 5,574 19,795 - 17,663,664
Net position (913,695) 1,508,270 659,846 161,764 22,927 3,192 1,442,304
39
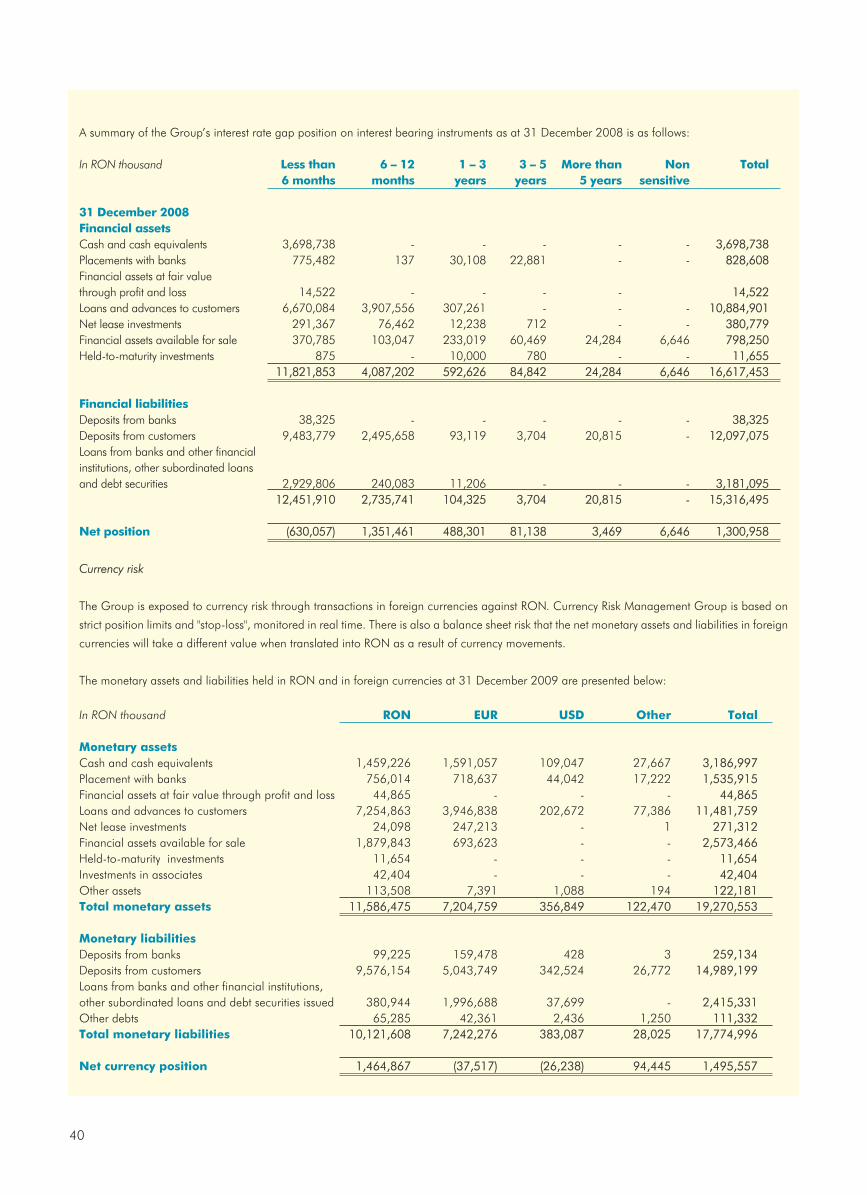
A summary of the Group’s interest rate gap position on interest bearing instruments as at 31 December 2008 is as follows:
In RON thousand Less than 6 – 12 1 – 3 3 – 5 More than Non Total6 months months years years 5 years sensitive
31 December 2008Financial assetsCash and cash equivalents 3,698,738 - - - - - 3,698,738Placements with banks 775,482 137 30,108 22,881 - - 828,608Financial assets at fair value through profit and loss 14,522 - - - - 14,522Loans and advances to customers 6,670,084 3,907,556 307,261 - - - 10,884,901Net lease investments 291,367 76,462 12,238 712 - - 380,779Financial assets available for sale 370,785 103,047 233,019 60,469 24,284 6,646 798,250Held-to-maturity investments 875 - 10,000 780 - - 11,655
11,821,853 4,087,202 592,626 84,842 24,284 6,646 16,617,453
Financial liabilitiesDeposits from banks 38,325 - - - - - 38,325Deposits from customers 9,483,779 2,495,658 93,119 3,704 20,815 - 12,097,075Loans from banks and other financial institutions, other subordinated loans and debt securities 2,929,806 240,083 11,206 - - - 3,181,095
12,451,910 2,735,741 104,325 3,704 20,815 - 15,316,495
Net position (630,057) 1,351,461 488,301 81,138 3,469 6,646 1,300,958
Currency risk
The Group is exposed to currency risk through transactions in foreign currencies against RON. Currency Risk Management Group is based on
strict position limits and "stop-loss", monitored in real time. There is also a balance sheet risk that the net monetary assets and liabilities in foreign
currencies will take a different value when translated into RON as a result of currency movements.
The monetary assets and liabilities held in RON and in foreign currencies at 31 December 2009 are presented below:
In RON thousand RON EUR USD Other Total
Monetary assetsCash and cash equivalents 1,459,226 1,591,057 109,047 27,667 3,186,997Placement with banks 756,014 718,637 44,042 17,222 1,535,915Financial assets at fair value through profit and loss 44,865 - - - 44,865Loans and advances to customers 7,254,863 3,946,838 202,672 77,386 11,481,759Net lease investments 24,098 247,213 - 1 271,312Financial assets available for sale 1,879,843 693,623 - - 2,573,466Held-to-maturity investments 11,654 - - - 11,654Investments in associates 42,404 - - - 42,404Other assets 113,508 7,391 1,088 194 122,181Total monetary assets 11,586,475 7,204,759 356,849 122,470 19,270,553
Monetary liabilitiesDeposits from banks 99,225 159,478 428 3 259,134Deposits from customers 9,576,154 5,043,749 342,524 26,772 14,989,199Loans from banks and other financial institutions, other subordinated loans and debt securities issued 380,944 1,996,688 37,699 - 2,415,331Other debts 65,285 42,361 2,436 1,250 111,332Total monetary liabilities 10,121,608 7,242,276 383,087 28,025 17,774,996
Net currency position 1,464,867 (37,517) (26,238) 94,445 1,495,557
40
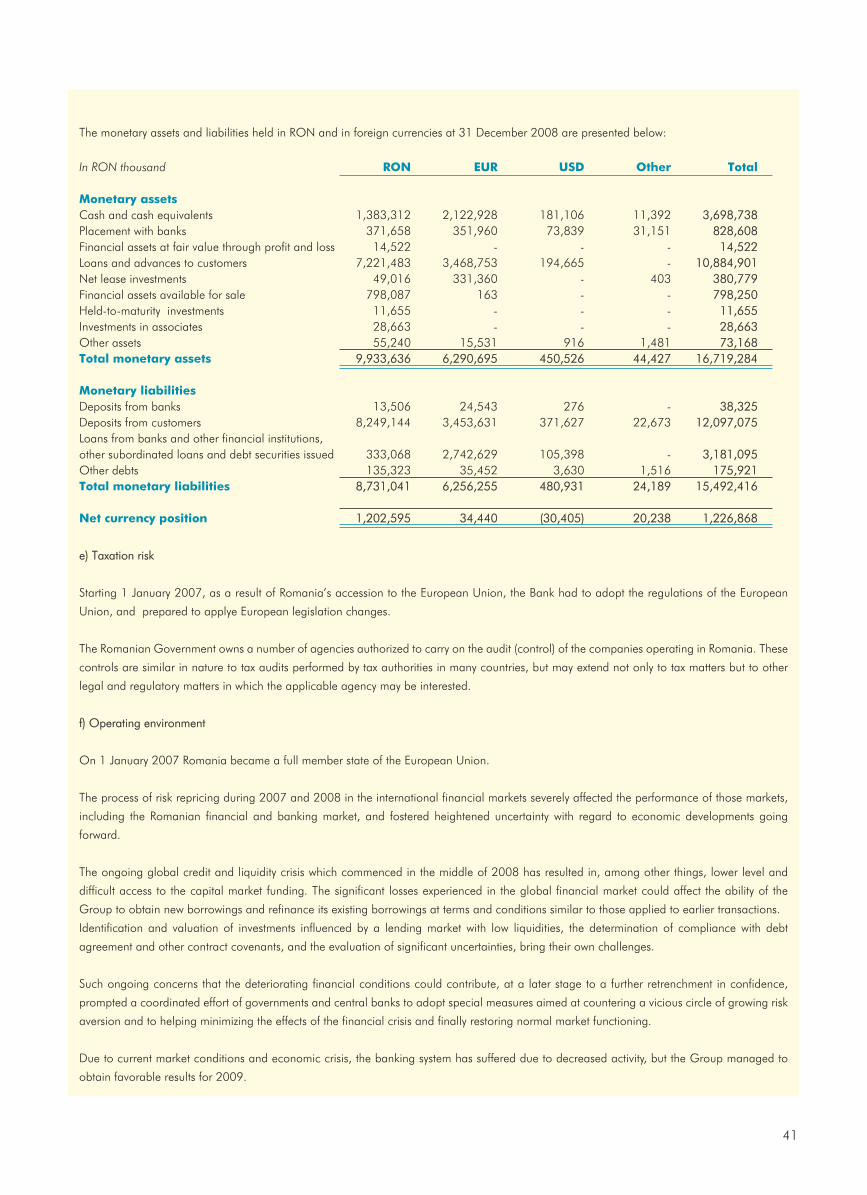
The monetary assets and liabilities held in RON and in foreign currencies at 31 December 2008 are presented below:
In RON thousand RON EUR USD Other Total
Monetary assetsCash and cash equivalents 1,383,312 2,122,928 181,106 11,392 3,698,738Placement with banks 371,658 351,960 73,839 31,151 828,608Financial assets at fair value through profit and loss 14,522 - - - 14,522Loans and advances to customers 7,221,483 3,468,753 194,665 - 10,884,901Net lease investments 49,016 331,360 - 403 380,779Financial assets available for sale 798,087 163 - - 798,250Held-to-maturity investments 11,655 - - - 11,655Investments in associates 28,663 - - - 28,663Other assets 55,240 15,531 916 1,481 73,168Total monetary assets 9,933,636 6,290,695 450,526 44,427 16,719,284
Monetary liabilitiesDeposits from banks 13,506 24,543 276 - 38,325Deposits from customers 8,249,144 3,453,631 371,627 22,673 12,097,075Loans from banks and other financial institutions, other subordinated loans and debt securities issued 333,068 2,742,629 105,398 - 3,181,095Other debts 135,323 35,452 3,630 1,516 175,921Total monetary liabilities 8,731,041 6,256,255 480,931 24,189 15,492,416
Net currency position 1,202,595 34,440 (30,405) 20,238 1,226,868
e) Taxation risk
Starting 1 January 2007, as a result of Romania’s accession to the European Union, the Bank had to adopt the regulations of the European
Union, and prepared to applye European legislation changes.
The Romanian Government owns a number of agencies authorized to carry on the audit (control) of the companies operating in Romania. These
controls are similar in nature to tax audits performed by tax authorities in many countries, but may extend not only to tax matters but to other
legal and regulatory matters in which the applicable agency may be interested.
f) Operating environment
On 1 January 2007 Romania became a full member state of the European Union.
The process of risk repricing during 2007 and 2008 in the international financial markets severely affected the performance of those markets,
including the Romanian financial and banking market, and fostered heightened uncertainty with regard to economic developments going
forward.
The ongoing global credit and liquidity crisis which commenced in the middle of 2008 has resulted in, among other things, lower level and
difficult access to the capital market funding. The significant losses experienced in the global financial market could affect the ability of the
Group to obtain new borrowings and refinance its existing borrowings at terms and conditions similar to those applied to earlier transactions.
Identification and valuation of investments influenced by a lending market with low liquidities, the determination of compliance with debt
agreement and other contract covenants, and the evaluation of significant uncertainties, bring their own challenges.
Such ongoing concerns that the deteriorating financial conditions could contribute, at a later stage to a further retrenchment in confidence,
prompted a coordinated effort of governments and central banks to adopt special measures aimed at countering a vicious circle of growing risk
aversion and to helping minimizing the effects of the financial crisis and finally restoring normal market functioning.
Due to current market conditions and economic crisis, the banking system has suffered due to decreased activity, but the Group managed to
obtain favorable results for 2009.
41
Due to economic collapse of the entire banking system, records indicated growth of arrears to credit / financing and hence the provisions
established by banks, such as net profit recorded in the banking system dropped significantly in 2009 compared to 2008.
Group management anticipates that the difficulties that have marked the Romanian economy will manifest in 2009 and during 2010, so the net
cost of credit risk / financing will have a marked influence in 2010 on the financial results of banking sector in Romania, but it cannot fairly
estimate the events that could have an effect on the Romanian banking sector and subsequently, on its financial statements.
Group management estimates for 2010 and a high level of provisions on loans / financing, comparable to 2009, with corresponding effects on
the Group's financial statements, but cannot predict with rather high certainty the impact on the Group's financial statements as a result of the
deterioration in financial market liquidity, impairment of financial assets affected by non-cash market conditions and high volatility of national
currency and financial markets.
Management believes it is taking all the necessary measures to support the sustainability and growth of the Bank’s business in the current
circumstances by:
• adopting of the Bank’s strategy of intensive development
• establishing specific measures to address potential liquidity crisis;
• daily monitoring its liquidity position;
• better control of costs;
• an aggressive provisioning policy, granting maximum attention to portfolio of loans / financing quality and to risk management;
• gradually and selectively targeting the larger size operations - mainly growth of the corporate segment;
• improving customer service concept, based on cross-selling, finding fast solutions.
The national economy is constantly presenting the characteristic of an emergent market. Among these characteristics one can mention:
significant current account deficit, the difference between Romania and the other EU member states, a market relatively undeveloped, low
infrastructure and fluctuations in the currency exchange rate.
g) Operational risks
Operational risk is the risk of direct or indirect loss arising from a wide variety of causes associated with the Group’s processes, personnel, technology
and infrastructure, and from external factors other than credit, market and liquidity risk such as those arising from legal and regulatory requirements and
generally accepted standards of corporate behavior. Operational risks arise from all of the Group’s operations and are faced by all business entities.
The Group’s objective is to manage operational risk so as to balance the avoidance of financial losses and damage to the Group’s reputation
with overall cost effectiveness and to avoid control procedures that restrict initiative and creativity.
The primary responsibility for the development and implementation of controls to address operational risk is assigned to senior management
within each business unit. This responsibility is supported by the development of overall Group standards for the management of operational risk
in the following areas:
• requirements for appropriate segregation of duties, including the independent authorization of transactions;
• requirements for the reconciliation and monitoring of transactions;
• compliance with regulatory and other legal requirements;
• documentation of controls and procedures;
• requirements for the periodic assessment of operational risk faced, and the adequacy of controls and procedures to address the risks
identified;
• requirements for the reporting of operational losses and proposed remedial action;
• a formalized approach over the continuity of the business with a focus on IT infrastructure (public services, hardware, software, human
resources) due to its high degree of support during the activity;
• training and professional development for all business lines and for all the Group employees; development of ethical and business
standards;
• risk mitigation, including insurance where applicable.
42

Internal Audit Department, Monitoring and Operational Risk Control Department and the management of the Group is monitoring the Bank’s
standards through regular control. The results of Internal Audit reviews are discussed with the management of the business unit to which they
relate, with summaries submitted to the Audit Committee and senior management of the Bank.
h) Capital management
The Bank’s regulatory capital based on the legal requirements in force regarding capital management includes:
• Tier 1 capital, which includes ordinary share capital, share premium, eligible reserves (for 31 December 2009 the computation was
performed based on the National Bank of Romania (“NBR”) regulation 18/2006 modified by the NBR Regulation 6/2009) after deductions
of intangible assets, 50% of shares value and other investments in financial or credit institutions that exceed 10% of their share capital and
50% of the investments held in insurance and reinsurance companies;
• Tier 2 capital, which includes qualifying subordinated liabilities, fixed assets revaluation reserves after deduction of 50% of shares value and
other investments in financial or credit institutions that exceed 10% of their share capital and 50% of the investments held in insurance and
reinsurance companies
Starting 2008 the Bank applied the NBR Regulation 13/2006 regarding the computation of the minimum capital requirements and adopted:
• the standard approach regarding credit risk, based on Regulation 14/2006;
• the standard approach based on appendix I, II and IV of the NBR Regulation 22/2006 for the computation of the minimum capital
requirements for the position risk, foreign exchange risk and commodity risk;
• the standard approach for the minimum capital requirements regarding operational risk based on the NBR Regulation 24/2006.
The Bank’s regulatory capital as at 31 December 2009 and 31 December 2008 and the legal requirements regarding capital management as
at 31 December 2009 and 31 December 2008 were as follows:
In RON thousand 31 December 2009 31 December 2008
Tier I 1,620,803 1,505,930Tier II 156,267 199,362Total Bank’s capital 1,777,070 1,705,292Risk weighted assets n/aCapital requirement for credit risk, counterparty risk, decrease in receivables and for incomplete transactions 848,946 797,949Capital requirements for foreign exchange position and commodities 46,080 20,217Capital requirements for operational risk 120,154 88,500Total capital requirements 1,015,180 906,666
Note: In the computation of the Bank’s own funds, profit for the years ended 31 December 2008 and 31December 2009 is included.
5. Use of estimates and judgments
The Group makes estimates and assumptions that affect the reported amounts of assets and liabilities within the next financial year. Estimates
and judgments are continually evaluated and are based on historical experience and other factors, including expectations of future events that
are believed to be reasonable under the circumstances.
Impairment losses on loans and advances
The Group reviews its loan and net lease investments portfolios to assess impairment at least on an annual basis. In determining whether an impairment
loss should be recorded in the income statement, the Group makes judgments as to whether there is any observable data indicating that there is a
measurable decrease in the estimated future cash flows from a portfolio of loans and net lease investments before the decrease can be identified with
43
an individual loan in that portfolio. This evidence may include observable data indicating that there has been an adverse change in the payment status
of borrowers (lessees) in a group, or national or local economic conditions that correlate with defaults on assets in the group.
Management uses estimates based on historical loss experience for assets with credit risk characteristics and objective evidence of impairment similar
to those in the portfolio when scheduling its future cash flows. The methodology and assumptions used for estimating both the amount and timing of
future cash flows are reviewed regularly to reduce any differences between loss estimates and actual loss experience. The loan impairment assessment
considers the visible effects of current market conditions on the individual / collective assessment of loans and advances to customers’ impairment.
Hence, the Group has estimated the impairment loss provision for loans and advances to customers based on the internal methodology harmonized
with Group policies and assessed that no further provision for impairment losses is required except as already provided for in the financial statements.
To the extent that the net present value of estimated cash flows differs by +/-5 percent, the impairment provision for loans and advances to customers
would be estimated RON 7,899 thousand higher or RON 7,916 thousand lower (31 December 2008: RON 11,215 thousand higher or RON 8,001
thousand lower).
Fair value of financial instruments
The Group measures fair values using the following fair value hierarchy that reflects the significance of the inputs used in making the
measurements:
• Level 1: Quoted market price in an active market for an identical instrument.
• Level 2: Valuation techniques based on observable inputs. This category includes instruments valued using: quoted market prices in
active markets for similar instruments; quoted prices for similar instruments in markets that are considered less than active; or other
valuation techniques where all significant inputs are directly or indirectly observable from market data.
• Level 3: Valuation techniques using significant unobservable inputs. This category includes all instruments where the valuation technique
includes inputs not based on observable data and the unobservable inputs could have a significant effect on the instrument’s valuation.
This category includes instruments that are valued based on quoted prices for similar instruments where significant unobservable
adjustments or assumptions are required to reflect differences between the instruments.
The objective of valuation techniques is to arrive at a fair value determination that reflects the price of the financial instrument at the reporting
date that would have been determined by market participants acting at arm’s length.
Availability of observable market prices and model inputs reduces the need for management judgment and estimation and also reduces the
uncertainty associated with determination of fair values. Availability of observable market prices and inputs varies depending on the products
and markets and is prone to changes based on specific events and general conditions in the financial markets.
The fair value of financial instruments that are not traded in an active market (for example, unlisted treasury securities, bonds and certificates of
deposit) is determined by using valuation techniques. The management uses its judgment to select the valuation method and make assumptions
that are mainly based on market conditions existing at the date of the consolidated statement of the financial position.
Valuation models that employ significant unobservable inputs require a higher degree of management judgment and estimation in
determination of fair value. Management judgment and estimation are usually required for selection of the appropriate valuation model to be
used, determination of expected future cash flows on the financial instrument being valued, determination of probability of counterparty default
and prepayments and selection of appropriate discount rates. The Group’s percentage of this type of portfolio instruments is not significant.
The carrying amount of financial assets at fair value through profit and loss and of available-for-sale investment securities would be estimated
RON 20,478 thousand lower (31 December 2008: 11,366 thousand RON), or more than RON 21,027 thousand (31 December 2008:
11,832 thousand RON), were the discount rate used in the discounted cash flow analysis to differ by +/- 10% from management’s estimate.
44

The table below analyzes financial instruments measured at fair value at the end of the reporting period, the hierarchical levels:
In RON thousand Note Quoted market Valuation Valuation Totalprices in active techniques – techniques –
markets observable unobservableinputs inputs
31 December 2009Financial assets at fair value through profit and loss 18 44,865 - - 44,865Investments securities, available for sale 21 27,995 2,545,471 - 2,573,46631 December 2008Financial assets at fair value through profit and loss 18 14,522 - - 14,522Investments securities, available for sale 21 10,446 787,804 - 798,250
Financial assets and liabilities
The Group considered that the effective transaction prices would be situated between the informative BID-ASK quotations obtained, which arerather an interval within which the Group could have realistically negotiated the quotations for each series and taking into account the volumeof its portfolio, and thus, the bank used in its estimation an average price for each series.
The Group’s accounting policies provide scope for assets and liabilities to be designated on inception into different accounting categories incertain circumstances:
• In classifying financial assets or liabilities as “trading”, the Group has determined that it meets the description of trading assets andliabilities set out in accounting policy 3(j);
• In classifying financial assets as held-to-maturity, the Group has determined that it has both the positive intention and ability to hold theassets until their maturity date as required by its accounting policy.
If the Group fails to keep these investments to maturity other than for the specific circumstances mentioned in IAS 39, it will be required toreclassify the entire class as available-for-sale. The investments would therefore be measured at fair value not amortized cost. If the entire classof held-to-maturity investments is tainted, the fair value would not be significantly different from the carrying amount.
6. Segment reporting
The business segment reporting format is the Group’s primary basis of segment reporting. Transactions between business segments areconducted at arm’s length.
Segment assets and liabilities include items directly attributable to a segment as well as those that can be allocated on a reasonable basis.
The Group’s segment reporting comprises the following main business segments:
• Corporate banking. Within corporate banking the Group provides corporations with a range of banking products and services, includinglending and deposit taking, providing cash management, foreign commercial business, investment advices, financial planning, securitiesbusiness, project and structured finance transactions, syndicated loans and asset backed transactions.
• Retail and SME banking. The Group provides individuals and SMEs with a range of banking products and services, including lending (consumerloans, vehicles purchase, personal needs, and mortgages), savings and deposit taking business, payment services and securities business.
• Leasing and customer finance. Within leasing the Group includes financial products and services provided by the leasing and consumerfinance arm of the Group.
• Other. Within other, the Group incorporates financial products and services provided to or by financial institutions including:management of securities, brokerage, factoring, logistic, real estate.
• Treasury: incorporating of work services for cash.
The allocation method of the Group income and expenses on segments was improved during 2009 in order to eliminate the limitation imposedby the IT system in the previous period.
45
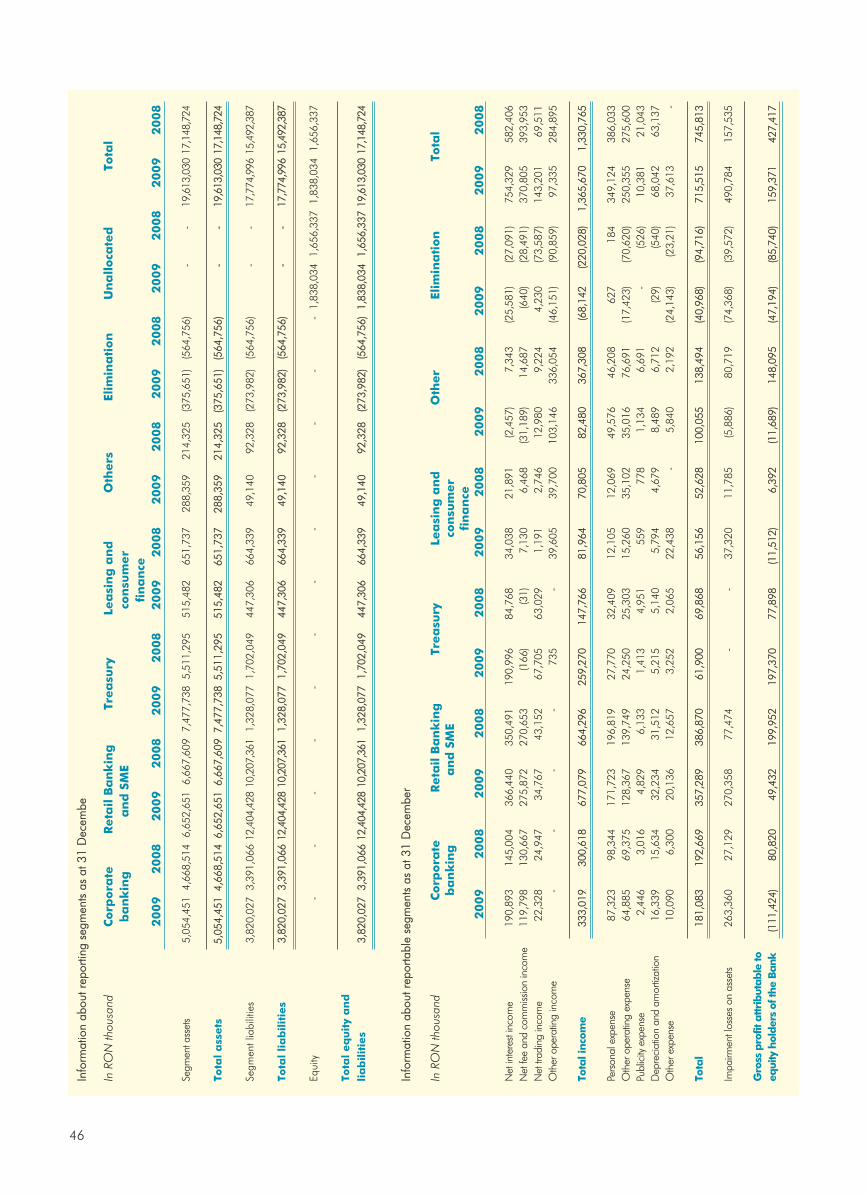
46
Info
rmat
ion
abou
t rep
orta
ble
segm
ents
as
at 3
1 D
ecem
ber
In R
ON
thou
sand
Corp
ora
te
Reta
il B
an
kin
g
Trea
sury
Lea
sin
g a
nd
Oth
er
Elim
ina
tion
Tota
lb
an
kin
g
an
d S
ME
con
sum
er
fin
an
ce2009
2008
2009
2008
2009
2008
2009
2008
2009
2008
2009
2008
2009
2008
Net
inte
rest
inco
me
190,
893
145,
004
366,
440
350,
491
190,
996
84,7
6834
,038
21,8
91(2
,457
)7,
343
(25,
581)
(27,
091)
754,
329
582,
406
Net
fee
and
com
miss
ion
inco
me
119,
798
130,
667
275,
872
270,
653
(166
)(3
1)7,
130
6,46
8(3
1,18
9)14
,687
(640
)(2
8,49
1)37
0,80
539
3,95
3N
et tr
adin
g in
com
e22
,328
24,9
4734
,767
43,1
5267
,705
63,0
291,
191
2,74
612
,980
9,22
44,
230
(73,
587)
143,
201
69,5
11O
ther
ope
ratin
g in
com
e-
--
-73
5-
39,6
0539
,700
103,
146
336,
054
(46,
151)
(90,
859)
97,3
3528
4,89
5
Tota
l inco
me
333,
019
300,
618
677,
079
664,
296
259,
270
147,
766
81,9
6470
,805
82,4
8036
7,30
8(6
8,14
2(2
20,0
28)
1,36
5,67
01,
330,
765
Pers
onal
exp
ense
87,3
2398
,344
171,
723
196,
819
27,7
7032
,409
12,1
0512
,069
49,5
7646
,208
627
184
349,
124
386,
033
Oth
er o
pera
ting
expe
nse
64,8
8569
,375
128,
367
139,
749
24,2
5025
,303
15,2
6035
,102
35,0
1676
,691
(17,
423)
(70,
620)
250,
355
275,
600
Publ
icity
exp
ense
2,44
63,
016
4,82
96,
133
1,41
34,
951
559
778
1,13
46,
691
-(5
26)
10,3
8121
,043
Dep
reci
atio
n an
d am
ortiz
atio
n16
,339
15,6
3432
,234
31,5
125,
215
5,14
05,
794
4,67
98,
489
6,71
2(2
9)(5
40)
68,0
4263
,137
Oth
er e
xpen
se10
,090
6,30
020
,136
12,6
573,
252
2,06
522
,438
-5,
840
2,19
2(2
4,14
3)(2
3,21
)37
,613
-
Tota
l18
1,08
319
2,66
935
7,28
938
6,87
061
,900
69,8
6856
,156
52,6
2810
0,05
513
8,49
4(4
0,96
8)(9
4,71
6)71
5,51
574
5,81
3
Impa
irmen
t los
ses
on a
sset
s26
3,36
027
,129
270,
358
77,4
74-
-37
,320
11,7
85(5
,886
)80
,719
(74,
368)
(39,
572)
490,
784
157,
535
Gro
ss p
rofit
attri
but
able
to
equi
ty h
older
s of
the
Bank
(111
,424
)80
,820
49,4
3219
9,95
219
7,37
077
,898
(11,
512)
6,39
2(1
1,68
9)14
8,09
5(4
7,19
4)(8
5,74
0)15
9,37
142
7,41
7
Info
rmat
ion
abou
t rep
ortin
g se
gmen
ts a
s at
31
Dec
embe
In R
ON
thou
sand
Corp
ora
te
Reta
il B
an
kin
g
Trea
sury
Lea
sin
g a
nd
Oth
ers
El
imin
ati
on
Un
alloca
ted
To
tal
ba
nk
ing
a
nd
SM
Eco
nsu
mer
fin
an
ce
2009
2008
2009
2008
2009
2008
2009
2008
2009
2008
2009
2008
2009
2008
2009
2008
Segm
ent a
sset
s 5,
054,
451
4,66
8,51
46,
652,
651
6,66
7,60
97,
477,
738
5,51
1,29
551
5,48
265
1,73
728
8,35
921
4,32
5(3
75,6
51)
(564
,756
)-
-19
,613
,030
17,1
48,7
24
Tota
l a
ssets
5,05
4,45
14,
668,
514
6,65
2,65
16,
667,
609
7,47
7,73
85,
511,
295
515,
482
651,
737
288,
359
214,
325
(375
,651
)(5
64,7
56)
--
19,6
13,0
3017
,148
,724
Segm
ent l
iabi
litie
s3,
820,
027
3,39
1,06
612
,404
,428
10,2
07,3
611,
328,
077
1,70
2,04
944
7,30
666
4,33
949
,140
92,3
28(2
73,9
82)
(564
,756
)-
-17
,774
,996
15,4
92,3
87
Tota
l lia
bilit
ies
3,82
0,02
73,
391,
066
12,4
04,4
2810
,207
,361
1,32
8,07
71,
702,
049
447,
306
664,
339
49,1
4092
,328
(273
,982
)(5
64,7
56)
--
17,7
74,9
9615
,492
,387
Equi
ty-
--
--
--
--
--
-1,
838,
034
1,65
6,33
71,
838,
034
1,65
6,33
7
Tota
l eq
uit
y a
nd
lia
bilit
ies
3,82
0,02
73,
391,
066
12,4
04,4
2810
,207
,361
1,32
8,07
71,
702,
049
447,
306
664,
339
49,1
4092
,328
(273
,982
)(5
64,7
56)
1,83
8,03
41,
656,
337
19,6
13,0
3017
,148
,724

7. Financial assets and liabilities
Accounting classifications and fair values
In RON thousand Note Financial Held-to- Loans Available Other Total Fair assets at Maturity and for sale amortized carrying value
fair value receivables cost amountthrough (including
profit and net leaseloss investments)
31 December 2008Financial AssetsCash and cash equivalents 16 - - - - 3,698,738 3,698,738 3,698,738Placements with banks 17 - - - - 828,608 828,608 828,608Financial assets at fair value through profit and loss 18 14,522 - - - - 14,522 14,522Loans and advances to customers 19 - - 10,884,901 - - 10,884,901 10,884,901Net lease investments 20 - - 380,779 - - 380,779 380,779Investments securities 21 - 11,665 - 798,250 - 809,905 808,957Total financial assets 14,522 11,665 11,265,680 798,250 4,527,346 16,617,453 16,616,505
Financial LiabilitiesDeposits from banks 27 - - - - 38,325 38,325 38,325Deposits from customers 28 - - - - 12,097,075 12,097,075 12,087,959Loans from banks and other financial institutions 29 - - - - 2,877,809 2,877,809 2,877,809Other subordinated loans 30 - - - - 239,685 239,685 239,685Debts securities issued 31 - - - - 63,601 63,601 63,601Total financial liabilities - - - - 15,316,495 15,316,495 15,307,379
In RON thousand Note Financial Held-to- Loans Available Other Total Fair assets at Maturity and for sale amortized carrying value
fair value receivables cost amountthrough (including
profit and net leaseloss investments)
31 December 2009Financial AssetsCash and cash equivalents 16 - - - - 3,186,997 3,186,997 3,186,997Placements with banks 17 - - - - 1,535,915 1,535,915 1,535,915Financial assets at fair value through profit and loss 18 44,865 - - - - 44,865 44,865Loans and advances to customers 19 - - 11,481,759 - - 11,481,759 11,736,413Net lease investments 20 - - 271,312 - - 271,312 271,312Investments securities 21 - 11,654 - 2,573,466 - 2,585,120 2,584,971Total financial assets 44,865 11,654 11,753,071 2,573,466 4,722,912 19,105,968 19,360,473
Financial LiabilitiesDeposits from banks 27 - - - - 259,134 259,134 259,134Deposits from customers 28 - - - - 14,989,199 14,989,199 14,992,127Loans from banks and other financial institutions 29 - - - - 2,160,404 2,160,404 2,160,404Other subordinated loans 30 - - - - 253,665 253,665 253,665Debts securities issued 31 - - - - 1,262 1,262 1,262Total financial liabilities - - - - 17,663,664 17,663,664 17,666,592
47

8. Net interest income
In RON thousand 2009 2008
Interest incomeLoans and advances to customers 1,636,683 1,320,811Current accounts held with banks 99,026 77,805Available-for-sale securities 274,327 52,067Placements with banks 47,404 48,236Net lease investments 52,000 46,821Total interest income 2,109,440 1,545,740
Interest expenseDeposits from customers 1,113,150 745,032Loans from banks and other financial institutions 235,493 169,757Deposits from banks 6,468 38,267Total interest expense 1,355,111 953,056
Net interest income 754,329 592,684
9. Net fee and commission income
In RON thousand 2009 2008
Fee and commission incomeTransactions 286,508 262,029Loans management and guarantees issuance 118,359 152,759Other fee and commission income 12,231 13,745Total fee and commission income 417,098 428,533
Fee and commission expenseBank commissions 37,430 26,921Transactions 7,085 5,932Total fee and commission expense 44,515 32,853
Net fee and commission income 370,805 381,154
10. Net trading income
In RON thousand 2009 2008
Net income from foreign exchange transactions (i) 104,524 138.936 Net income/ (expenses) from financial assets through profit and loss 15,922 (65,693)Net expense from revaluation of assets and liabilities held in foreign currency 22,755 (3,732)
Net trading income 143,201 69,511
(i) Net income from foreign exchange transactions also includes the realized and unrealized gain and loss from spot and forward contracts.
48

11. Other operating income
In RON thousand 2009 2008
Rent income 10,081 7,801Dividend income 2,031 5,268Other operating income 36,329 29,908
Total 48,441 42,977
12. Impairment losses on assets
In RON thousand 2009 2008
Net charge of impairment losses on financial assets (i) 478,213 158,840Loans and net lease investments written-off 13,915 2,681Recoveries from loans previously written off (1,344) (3,957)
Net impairment losses on assets 490,784 157,564
(i) Net charge with impairment losses contains the following:
In RON thousand Note 2009 2008
Loans and advances to customers 19 437,350 144,756Net lease investments 20 39,748 9,266Investment securities 21 (2,449) 348Other assets 26 3,619 4,325Property and equipment 23 (55) 145
Net charge with impairment losses 478,213 158,840
13. Personnel expenses
In RON thousand 2009 2008
Wages and salaries 260,073 286,908Contribution to social security 53,774 55,867Meal tickets and other taxes related to personnel 16,733 21,034Contribution to health fund 17,249 19,473Contribution to unemployment fund 1,295 2,751
Total 349,124 386,033
The Group’s number of employees as at 31 December 2009 was 6,457 persons (31 December 2008: 6,866).
49

14. Other operating expenses
In RON thousand 2009 2008
Operating lease 90,273 81,420Repairs and maintenance 33,286 32,922Materials and consumables 18,873 39,164Postage and telecommunications 31,428 35,743Advertising and promotional expenses 11,815 21,044Security 19,851 20,005Taxes 24,826 13,208Electricity and heating 12,690 12,488Travel and transport 3,716 2,642Legal, advisory and consulting 2,649 11,286Loss on sale of property and equipment 2,894 1,113Other operating expense 47,656 23,058Total 299,957 294,093
15. Income tax expense
In RON thousand Note 2009 2008
Current tax expense at 16% (2008: 16%) of taxable profits determined in accordance with Romanian Law 25,470 75,122Adjustments from prior periods (4,422) (9,377)Total income tax expense 21,048 65,745
Tax reconciliation
In RON thousand 2009 2008
Profit before tax 157,763 425,732Taxation at statutory rate of 16% (2008: 16%) 25,242 68,117Non-deductible expenses and non-taxable revenues and other permanent differences (8,730) (2,165)Effect of carried forward losses 4,536 (207)Taxation in the income statement 21,048 65,745
16. Cash and cash equivalents
In RON thousand 31 December 2009 31 December 2008
Minimum compulsory reserve (i) 2,871,310 3,420,964Cash on hand 271,094 259,532Current accounts held with other banks (ii) 44,593 18,242Total 3,698,738 3,017,299
(i) As at 31 December 2009 the minimum compulsory reserve, held with the Central Bank, was established at 15% for RON and 25% for
USD or EUR (31 December 2008: 18% for RON and 40% for USD or EUR) denominated funds. The balance of mandatory reserve can
vary on a daily basis. The interest paid by the Central Bank for the reserve held by banks was 3.36% – 5.9% p.a. for RON denominated
reserves, 1.27% - 2.8% p.a. for EUR and 0.89% - 1.24% p.a. for US Dollars denominated reserves. The mandatory reserve can be used
by the Bank’s day to day activities provided the average balance for the month is maintained within required formula.
(ii) Current accounts held with other banks are at immediate disposal of the Group and unencumbered.
50

17. Placements with banks
In RON thousand 31 December 2009 31 December 2008
Sight and term deposits placed at other banks 1,275,648 774,008Loans and advances to banks (i) 260,267 54,600Total 1,535,915 828,608
(i) Investment securities reclassified by the Group during 2009 from assets available for sale into loans and advances (see note 21 (iii)).
18. Financial assets at fair value through profit and loss
In RON thousand 31 December 2009 31 December 2008
Trading assets
Listed equity investments (i) 44,865 14,522
Total 44,865 14,522
(i) All shares in listed companies are quoted on the Bucharest Stock Exchange.
As at 31 December 2009, the Group owns significant investments amounting to RON 40,337 thousand, in the following companies: SIF Banat-
Crisana S.A., SIF Moldova S.A., SIF Oltenia S.A., SIF Muntenia S.A., SIF Transilvania S.A., BRD-Societe Generale S.A., Armax Medias S.A., SNP
Petrom S.A., andi Argus Constanta S.A. (31 December 2008: RON 12,606 thousand).
19. Loans and advances to customers
The Group’s commercial lending is concentrated on companies and individuals domiciled in Romania and Cyprus. Economic sector risk
concentrations within the customer’s loan portfolio as at 31 December 2009 and 31 December 2008, were as follows:
In RON thousand 31 December 2009 31 December 2008
Individuals 5,086,987 4,739,605Trading 2,033,326 1,941,568Manufacturing 1,494,532 1,259,192Construction 626,186 596,094Services 564,808 490,600Transport 570,533 455,537Real estate 426,200 344,005Agriculture 423,798 289,953Free lancers 274,128 231,318Chemical industry 196,049 201,881Mining industry 99,205 95,495Telecommunications 38,808 86,535Financial institutions 89,040 59,918Energy industry 89,941 36,494Fishing industry 7,726 7,160Governmental bodies 1,726 1,847Others 230,394 348,690Total loans and advances to customers before provisions 12,253,387 11,185,892
Less provisions for impairment losses on loans (771,628) (300,991)
Total loans and advances to customers, net of provisions 10,884,901 8,484,048
51
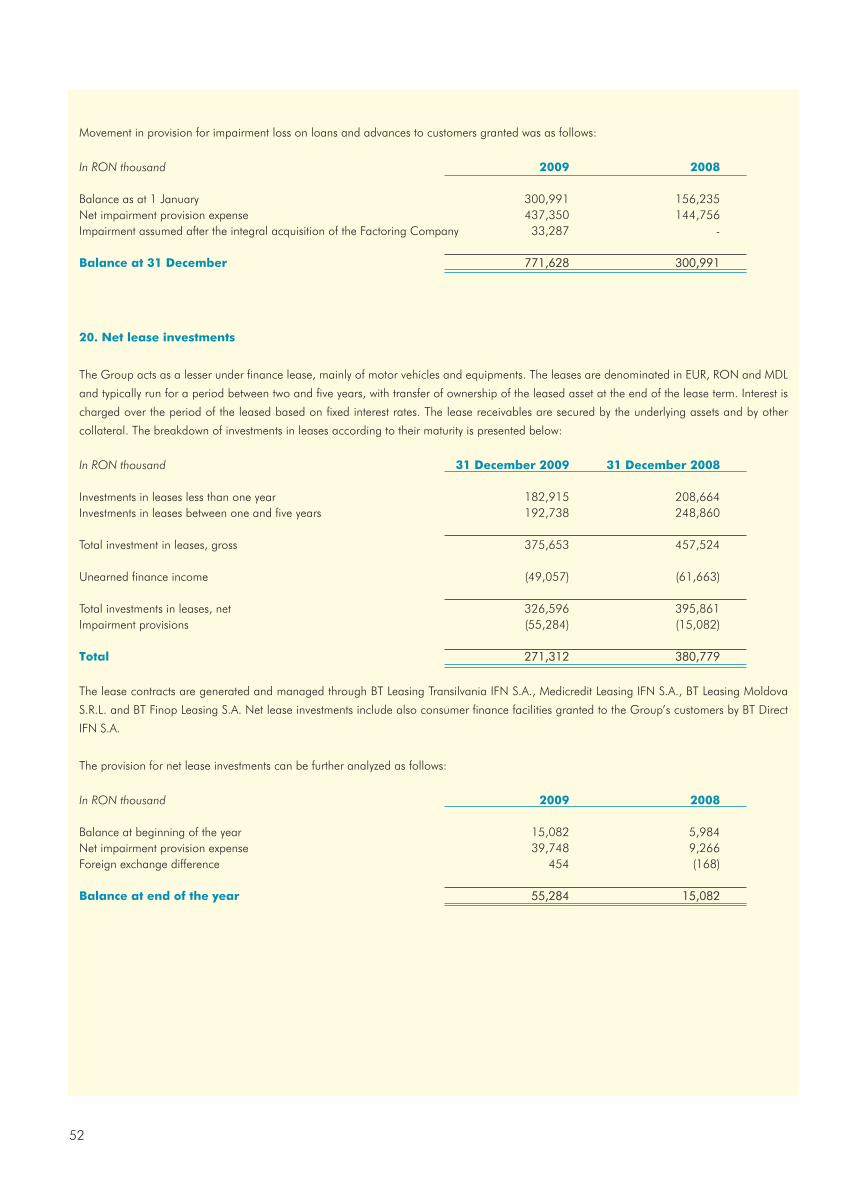
Movement in provision for impairment loss on loans and advances to customers granted was as follows:
In RON thousand 2009 2008
Balance as at 1 January 300,991 156,235Net impairment provision expense 437,350 144,756Impairment assumed after the integral acquisition of the Factoring Company 33,287 -
Balance at 31 December 771,628 300,991
20. Net lease investments
The Group acts as a lesser under finance lease, mainly of motor vehicles and equipments. The leases are denominated in EUR, RON and MDL
and typically run for a period between two and five years, with transfer of ownership of the leased asset at the end of the lease term. Interest is
charged over the period of the leased based on fixed interest rates. The lease receivables are secured by the underlying assets and by other
collateral. The breakdown of investments in leases according to their maturity is presented below:
In RON thousand 31 December 2009 31 December 2008
Investments in leases less than one year 182,915 208,664Investments in leases between one and five years 192,738 248,860
Total investment in leases, gross 375,653 457,524
Unearned finance income (49,057) (61,663)
Total investments in leases, net 326,596 395,861Impairment provisions (55,284) (15,082)
Total 271,312 380,779
The lease contracts are generated and managed through BT Leasing Transilvania IFN S.A., Medicredit Leasing IFN S.A., BT Leasing Moldova
S.R.L. and BT Finop Leasing S.A. Net lease investments include also consumer finance facilities granted to the Group’s customers by BT Direct
IFN S.A.
The provision for net lease investments can be further analyzed as follows:
In RON thousand 2009 2008
Balance at beginning of the year 15,082 5,984Net impairment provision expense 39,748 9,266Foreign exchange difference 454 (168)
Balance at end of the year 55,284 15,082
52

21. Investment securities
In RON thousand 31 December 2009 31 December 2008
Investment securities available-for-saleUnlisted debt and other fixed income instruments:
Treasury securities issued by the Government of Romania (i) 2,474,150 761,468Eurobond issued by the Romanian Government 52,197 -Bonds issued by the World Bank - 9,281Bonds and Eurobonds (ii) 15,932 10,409
Unit funds (iii) 6,320 -Listed equity securities (iv) 21,675 10,446Equity investment (v) 3,192 6,646Equity investment, gross 3,192 9,095Impairment provision on equity investment - (2,449)
Total investment securities available-for-sale 2,573,466 798,250
Investment securities held-to-maturityTreasury securities issued by the Government of Romania 11,654 11,655
Total investment securities held-to-maturity 11,654 11,655
Total investment securities 2,585,120 809,905
i) Treasury bills issued by the Romanian Government include treasury bills, coupon bonds and Benchmark bonds issued in RON, and
Treasury bills with coupon issued by the Romanian Government in EUR.
As at 31 December 2009 treasury bills were in amount of RON 2,074,929 thousand (31 December 2008: RON 482,577 thousand)
out of which RON 24,550 thousand (31 December 2007: RON 39,350 thousand) were pledged for other current operations
(RoCLEAR, SENT, MASTERCARD and VISA).
As at 31 December 2009 benchmark bonds issued by the Ministry of Finance in amount of RON 399,221 thousand (31 December
2008: RON 278,891 thousand) mature in 2011 and 2013.
ii) The Group held on December 31, 2009 bonds amounting to: RON 15,932 thousand (RON 8,291 thousand on 31 December 31
2008) issued by Ralfi IFN International Leasing IFN SA, Alba Iulia municipality and the municipality of Bucharest.
Bonds issued by Ralfi IFN S.A. carry a variable interest rate of Robor 6M+1.75% (31 December 2009: 15.81%; 31 December 2008:
19.72%); Alba Iulia municipal bonds carry a variable interest rate of (ROBID 6M+Robor 6M) / 2 + 1.5% (31 December 2009: 10.5%;
31 December 2008: 15.5%); International Leasing bonds carry a variable interest rate of Robor 6M +2.25% (31 December 2009:
17.26%; 31 December 2008: 15.71%). Bonds in EUR issued by the Bucharest Municipality carry a fixed interest rate of 4.125%.
Reclassification out of available-for-sale investments securities into loans and advances
During 2007 the Group acquired Euro-bonds worth 56,912 thousand lei: fixed-interest bonds issued by BRD Societe Generale, by Alpha Bank
and by Erste Bank.
The amendment to IAS 39 "Financial Instruments - Recognition and Measurement" and IFRS 7 "Financial Instruments: Disclosure" (described in
accounting policy 3 (o) iii) the Group has reclassified the Euro bonds held in July 1, 2008 from the category available for sale securities to the
category placements with banks. Group identified financial assets that have fulfilled the conditions imposed by this category (the non-derivative
financial assets fixed and determinable payments that are not quoted on an active market) and held in the foreseeable future.
53
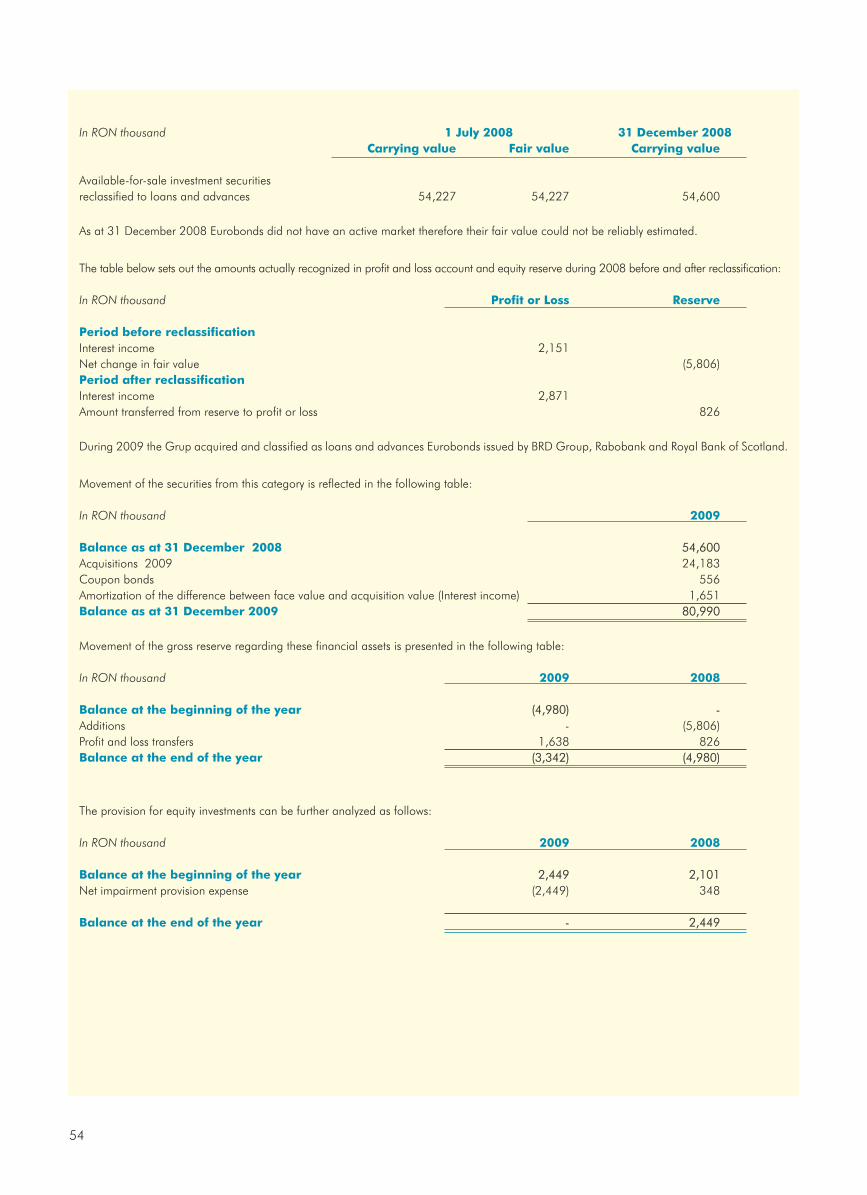
In RON thousand 1 July 2008 31 December 2008Carrying value Fair value Carrying value
Available-for-sale investment securities reclassified to loans and advances 54,227 54,227 54,600
As at 31 December 2008 Eurobonds did not have an active market therefore their fair value could not be reliably estimated.
The table below sets out the amounts actually recognized in profit and loss account and equity reserve during 2008 before and after reclassification:
In RON thousand Profit or Loss Reserve
Period before reclassificationInterest income 2,151Net change in fair value (5,806)Period after reclassificationInterest income 2,871Amount transferred from reserve to profit or loss 826
During 2009 the Grup acquired and classified as loans and advances Eurobonds issued by BRD Group, Rabobank and Royal Bank of Scotland.
Movement of the securities from this category is reflected in the following table:
In RON thousand 2009
Balance as at 31 December 2008 54,600Acquisitions 2009 24,183Coupon bonds 556Amortization of the difference between face value and acquisition value (Interest income) 1,651Balance as at 31 December 2009 80,990
Movement of the gross reserve regarding these financial assets is presented in the following table:
In RON thousand 2009 2008
Balance at the beginning of the year (4,980) -Additions - (5,806)Profit and loss transfers 1,638 826Balance at the end of the year (3,342) (4,980)
The provision for equity investments can be further analyzed as follows:
In RON thousand 2009 2008
Balance at the beginning of the year 2,449 2,101Net impairment provision expense (2,449) 348
Balance at the end of the year - 2,449
54
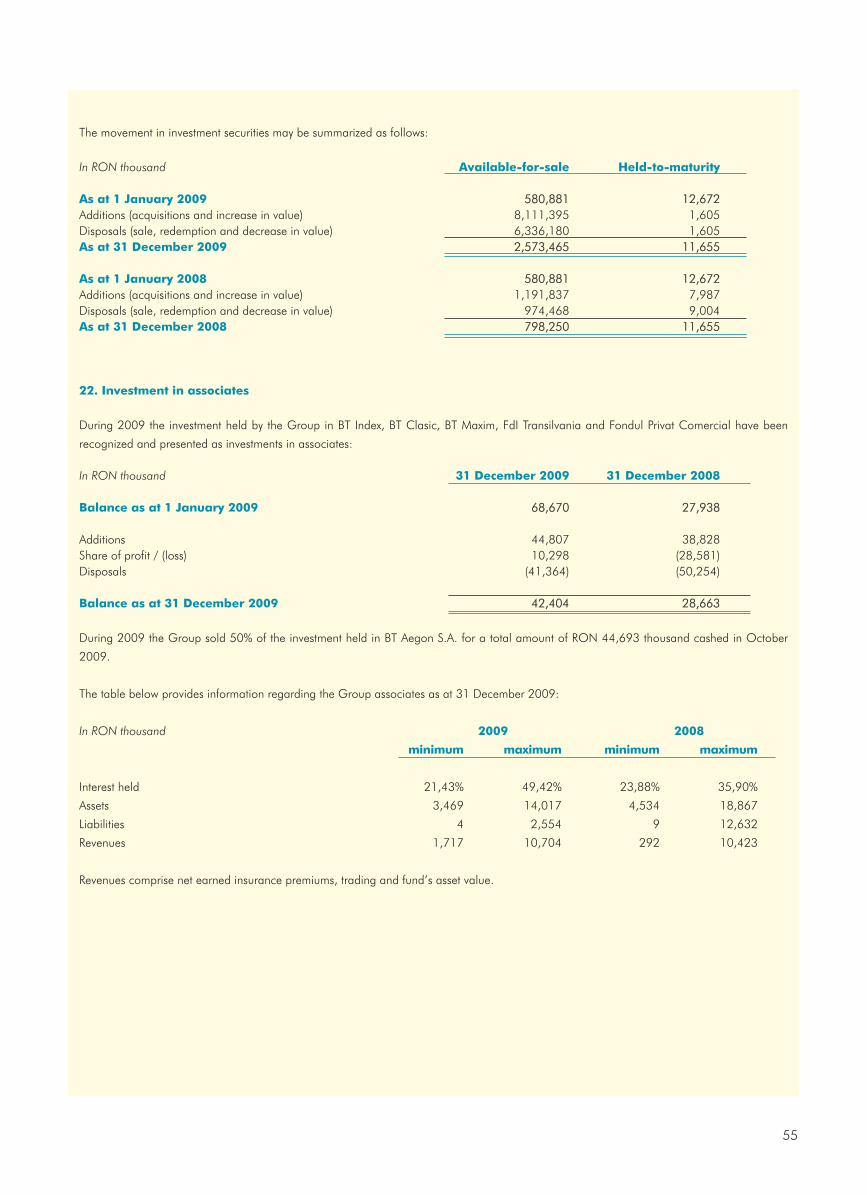
The movement in investment securities may be summarized as follows:
In RON thousand Available-for-sale Held-to-maturity
As at 1 January 2009 580,881 12,672Additions (acquisitions and increase in value) 8,111,395 1,605Disposals (sale, redemption and decrease in value) 6,336,180 1,605As at 31 December 2009 2,573,465 11,655
As at 1 January 2008 580,881 12,672Additions (acquisitions and increase in value) 1,191,837 7,987Disposals (sale, redemption and decrease in value) 974,468 9,004As at 31 December 2008 798,250 11,655
22. Investment in associates
During 2009 the investment held by the Group in BT Index, BT Clasic, BT Maxim, FdI Transilvania and Fondul Privat Comercial have been
recognized and presented as investments in associates:
In RON thousand 31 December 2009 31 December 2008
Balance as at 1 January 2009 68,670 27,938
Additions 44,807 38,828Share of profit / (loss) 10,298 (28,581)Disposals (41,364) (50,254)
Balance as at 31 December 2009 42,404 28,663
During 2009 the Group sold 50% of the investment held in BT Aegon S.A. for a total amount of RON 44,693 thousand cashed in October
2009.
The table below provides information regarding the Group associates as at 31 December 2009:
In RON thousand 2009 2008
minimum maximum minimum maximum
Interest held 21,43% 49,42% 23,88% 35,90%
Assets 3,469 14,017 4,534 18,867
Liabilities 4 2,554 9 12,632
Revenues 1,717 10,704 292 10,423
Revenues comprise net earned insurance premiums, trading and fund’s asset value.
55
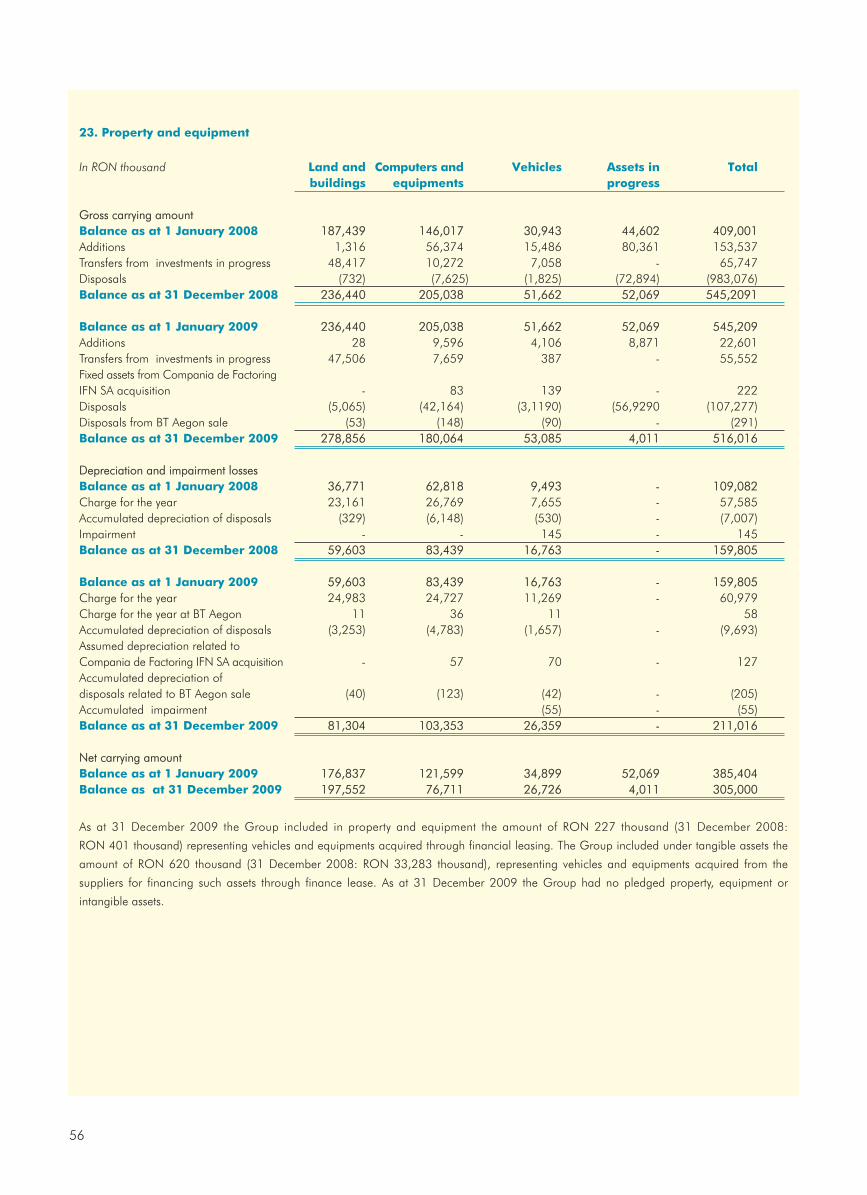
23. Property and equipment
In RON thousand Land and Computers and Vehicles Assets in Totalbuildings equipments progress
Gross carrying amountBalance as at 1 January 2008 187,439 146,017 30,943 44,602 409,001Additions 1,316 56,374 15,486 80,361 153,537Transfers from investments in progress 48,417 10,272 7,058 - 65,747 Disposals (732) (7,625) (1,825) (72,894) (983,076) Balance as at 31 December 2008 236,440 205,038 51,662 52,069 545,2091
Balance as at 1 January 2009 236,440 205,038 51,662 52,069 545,209Additions 28 9,596 4,106 8,871 22,601Transfers from investments in progress 47,506 7,659 387 - 55,552Fixed assets from Compania de FactoringIFN SA acquisition - 83 139 - 222Disposals (5,065) (42,164) (3,1190) (56,9290 (107,277)Disposals from BT Aegon sale (53) (148) (90) - (291)Balance as at 31 December 2009 278,856 180,064 53,085 4,011 516,016
Depreciation and impairment lossesBalance as at 1 January 2008 36,771 62,818 9,493 - 109,082 Charge for the year 23,161 26,769 7,655 - 57,585 Accumulated depreciation of disposals (329) (6,148) (530) - (7,007)Impairment - - 145 - 145Balance as at 31 December 2008 59,603 83,439 16,763 - 159,805
Balance as at 1 January 2009 59,603 83,439 16,763 - 159,805Charge for the year 24,983 24,727 11,269 - 60,979Charge for the year at BT Aegon 11 36 11 58Accumulated depreciation of disposals (3,253) (4,783) (1,657) - (9,693)Assumed depreciation related to Compania de Factoring IFN SA acquisition - 57 70 - 127Accumulated depreciation of disposals related to BT Aegon sale (40) (123) (42) - (205)Accumulated impairment (55) - (55)Balance as at 31 December 2009 81,304 103,353 26,359 - 211,016
Net carrying amountBalance as at 1 January 2009 176,837 121,599 34,899 52,069 385,404Balance as at 31 December 2009 197,552 76,711 26,726 4,011 305,000
As at 31 December 2009 the Group included in property and equipment the amount of RON 227 thousand (31 December 2008:
RON 401 thousand) representing vehicles and equipments acquired through financial leasing. The Group included under tangible assets the
amount of RON 620 thousand (31 December 2008: RON 33,283 thousand), representing vehicles and equipments acquired from the
suppliers for financing such assets through finance lease. As at 31 December 2009 the Group had no pledged property, equipment or
intangible assets.
56

24. Intangible assets (including goodwill)
In RON thousand Goodwill Software
Gross carrying amountBalance as at 1 January 2008 8,369 34,622Additions - 22,568Disposals (13,577)Balance as at 31 December 2008 8,369 43,613
Balance as at 1 January 2009 8,369 43,613Additions - 7,487Intangible assets from Compania de Factoring IFN SA acquisition 360Disposals - (2,709)Disposals related to BT Aegon sale - (627)Balance as at 31 December 2009 8,369 48,124
Accumulated depreciationBalance as at 1 January 2008 - 26,256Charge for the year - 5,552Disposals - (2,823)Balance as at 31 December 2008 - 28,985
Balance as at 1 January 2009 - 28,985Charge for the year - 6,890Charge for the year BT Aegon SA - 115Net accumulated depreciation related to Compania de Factoring acquisition - 66Disposals - (33)Disposals related to BT Aegon sale (288)Balance as at 31 December 2009 - 35,735
Net carrying amountAs at 1 January 2009 8,369 14,628As at 31 December 2009 8,369 12,389
Impairment testing for cash generating units containing goodwill
For the purpose of impairment testing, goodwill is allocated to the Group’s operating divisions which represent the lowest level within the Group
at which the goodwill is monitored for internal management.
The carrying amount of the goodwill of RON 8,369 thousand is allocated to BT Leasing IFN (RON 376 thousand) and Medicredit Leasing IFN
S.A. (RON 7,993 thousand).
25. Deferred tax assets and liabilities
In RON thousand 31 December 2009Asset Liability Net
Loans and advances to customers (including net lease investments) 85,716 - 85,716Investment securities, available-for-sale 2,707 - 2,707Investment in associates 18,175 - 18,175Other assets (2,104) - (2,104)Total 104,494 - 104,494Net temporary differences 104,494Deferred tax asset at 16% 16,719
57

In RON thousand 31 December 2008Asset Liability Net
Loans and advances to customers (including net lease investments) 47,854 - 47,854Investment securities, available-for-sale 57,204 - 57,204Investment in associates 26,180 26,180Other assets 440 - 440Total 131,678 - 131,678Net temporary differences 131,678Deferred tax liability at 16% 21,068
26. Other assets
In RON thousand 31 December 2009 31 December 2008
Amounts under settlement 7,765 29,148Assets repossessed 42,331 13,082Prepayments 13,922 11,307Sundry debtors 13,208 10,403VAT receivable 34,201 7,312Other assets 19,240 6,840Less provision for other assets (8,486) (4,952
Total 122,181 73,140
Movement in provision for impairment loss on other assets for the year was as follows:
In RON thousand 2009 2008
Balance as at 1 January 4,952 627Net provision expense (Note 13) 3,619 4,325Balance provision of acquired subsidiaries (85) -Balance as at 31 December 8,486 4,952
27. Deposits from banks
In RON thousand 31 December 2009 31 December 2008
Sight deposits 16,296 1,176Term deposits 242,838 37,149
Total 259,134 38,325
28. Deposits from customers
In RON thousand 31 December 2009 31 December 2008
Current accounts 2,119,953 2,128,314Sight deposits 312,568 392,290Term deposits 12,263,816 9,324,445Collateral deposits 292,862 252,042
Total 14,989,199 12,097,091
58

Deposits from customers can be also analyzed as follows:
In RON thousand 31 December 2009 31 December 2008
Retail customers 9,998,613 7,600,847Corporate customers 4,990,586 4,496,244
Total 14,989,199 12,097,091
29. Loans from banks and other financial institutions
In RON thousand 31 December 2009 31 December 2008
Loans from commercial banks 295,365 1,025,833Romanian banks 187,861 574,139Foreign banks 107,504 451,694
Loans from development banks (EBRD, IFC) 1,257,313 1,298,901Other funds from financial institutions 607,726 553,075
Total 2,160,404 2,877,809
The interest rates range for loans from banks and financial institutions was as follows:
2009 2008
Minimum Maximum Minimum Maximum
EUR Euribor 6M+0.55% 9.65 % Euribor 6M+0.65% Variable 9.65% + 1%
LEI 8% Robor 6M +3% 14.25% Robor 3M + 5%
USD Libor 6M+0.38% Libor 6M + 3% Libor 6M+0.38% Libor 6M + 3%
30. Other subordinated liabilities
In 2006, the Group contracted a subordinated loan agreement with five credit institutions for EUR 60,000 thousand bearing an interest rate
valid for the respective period EURIBOR + 3.4%. The inter-banking rate is, for each period, the annual interest rate offered for deposits in the
respective currency, which is published on the reference page at 11:00 am, Brussels time. The loan shall be repaid by one installment on the
seventh anniversary from the contract date.
The payments of any amounts payable under this contract are subordinated to the payment of all Senior Indebtedness, so that no amount shall
be paid in respect of the loan in such bankruptcy, insolvency, winding-up or liquidation of the borrower or in any other similar event affecting the
borrower, until all claims in respect of Senior Indebtedness admitted in such cases.
31. Debt securities issued
In September 2005 the Bank issued 2,290 convertible bonds with a par value of USD 10,000 each. The interest is payable semi-annually starting from
15 January 2006 until 15 July 2010. The rate for the first interest period was set at LIBOR USD 6 months + 3% and for subsequent interest periods, the
rate will be established by the Payment Agent on the basis of: (i) LIBOR for such a period taking as a reference the inter-banking offered rate for USD
deposits by the British Banker Association: plus (ii) a margin applicable to such period by reference to either the highest foreign currency credit rating given
to Romania by S&P or the long term ratings in foreign currency given by Moody’s on the Romanian government bonds applicable on the payment date.
59
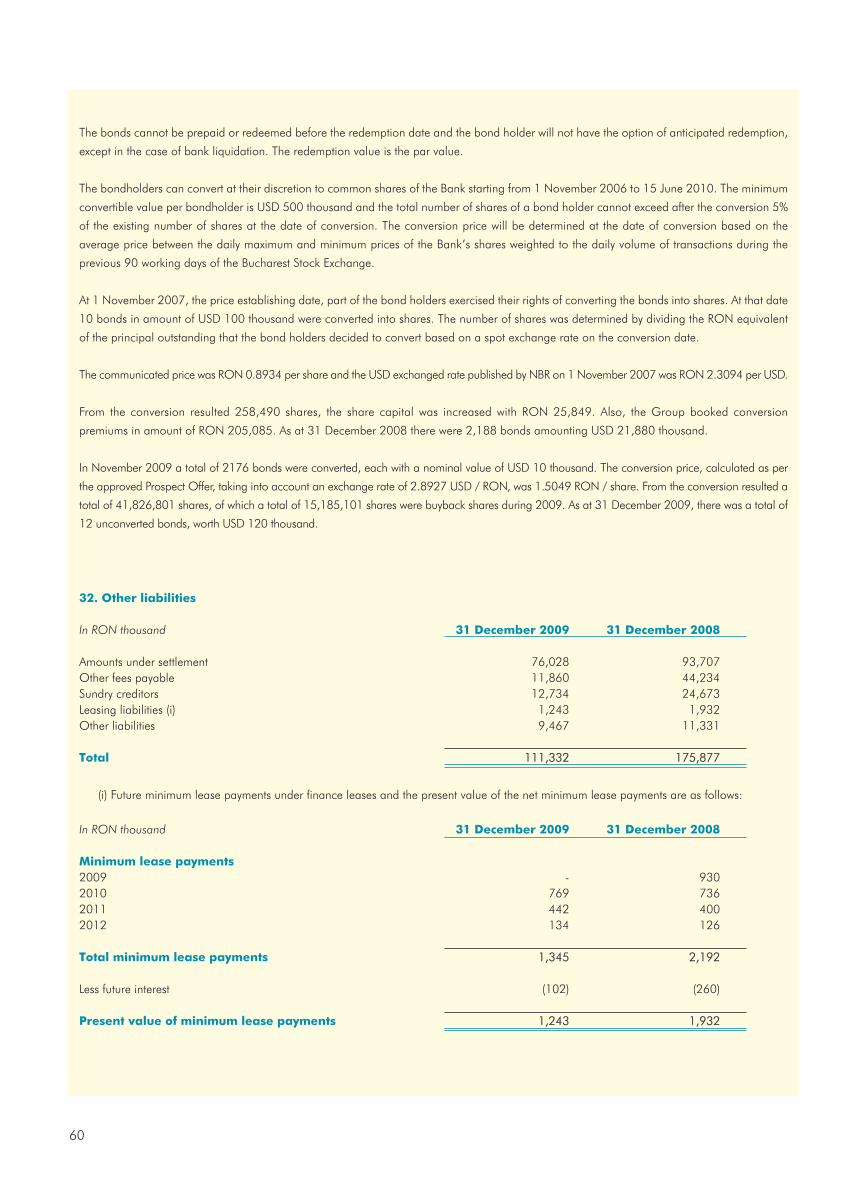
The bonds cannot be prepaid or redeemed before the redemption date and the bond holder will not have the option of anticipated redemption,
except in the case of bank liquidation. The redemption value is the par value.
The bondholders can convert at their discretion to common shares of the Bank starting from 1 November 2006 to 15 June 2010. The minimum
convertible value per bondholder is USD 500 thousand and the total number of shares of a bond holder cannot exceed after the conversion 5%
of the existing number of shares at the date of conversion. The conversion price will be determined at the date of conversion based on the
average price between the daily maximum and minimum prices of the Bank’s shares weighted to the daily volume of transactions during the
previous 90 working days of the Bucharest Stock Exchange.
At 1 November 2007, the price establishing date, part of the bond holders exercised their rights of converting the bonds into shares. At that date
10 bonds in amount of USD 100 thousand were converted into shares. The number of shares was determined by dividing the RON equivalent
of the principal outstanding that the bond holders decided to convert based on a spot exchange rate on the conversion date.
The communicated price was RON 0.8934 per share and the USD exchanged rate published by NBR on 1 November 2007 was RON 2.3094 per USD.
From the conversion resulted 258,490 shares, the share capital was increased with RON 25,849. Also, the Group booked conversion
premiums in amount of RON 205,085. As at 31 December 2008 there were 2,188 bonds amounting USD 21,880 thousand.
In November 2009 a total of 2176 bonds were converted, each with a nominal value of USD 10 thousand. The conversion price, calculated as per
the approved Prospect Offer, taking into account an exchange rate of 2.8927 USD / RON, was 1.5049 RON / share. From the conversion resulted a
total of 41,826,801 shares, of which a total of 15,185,101 shares were buyback shares during 2009. As at 31 December 2009, there was a total of
12 unconverted bonds, worth USD 120 thousand.
32. Other liabilities
In RON thousand 31 December 2009 31 December 2008
Amounts under settlement 76,028 93,707Other fees payable 11,860 44,234Sundry creditors 12,734 24,673Leasing liabilities (i) 1,243 1,932Other liabilities 9,467 11,331
Total 111,332 175,877
(i) Future minimum lease payments under finance leases and the present value of the net minimum lease payments are as follows:
In RON thousand 31 December 2009 31 December 2008
Minimum lease payments2009 - 9302010 769 7362011 442 4002012 134 126
Total minimum lease payments 1,345 2,192
Less future interest (102) (260)
Present value of minimum lease payments 1,243 1,932
60
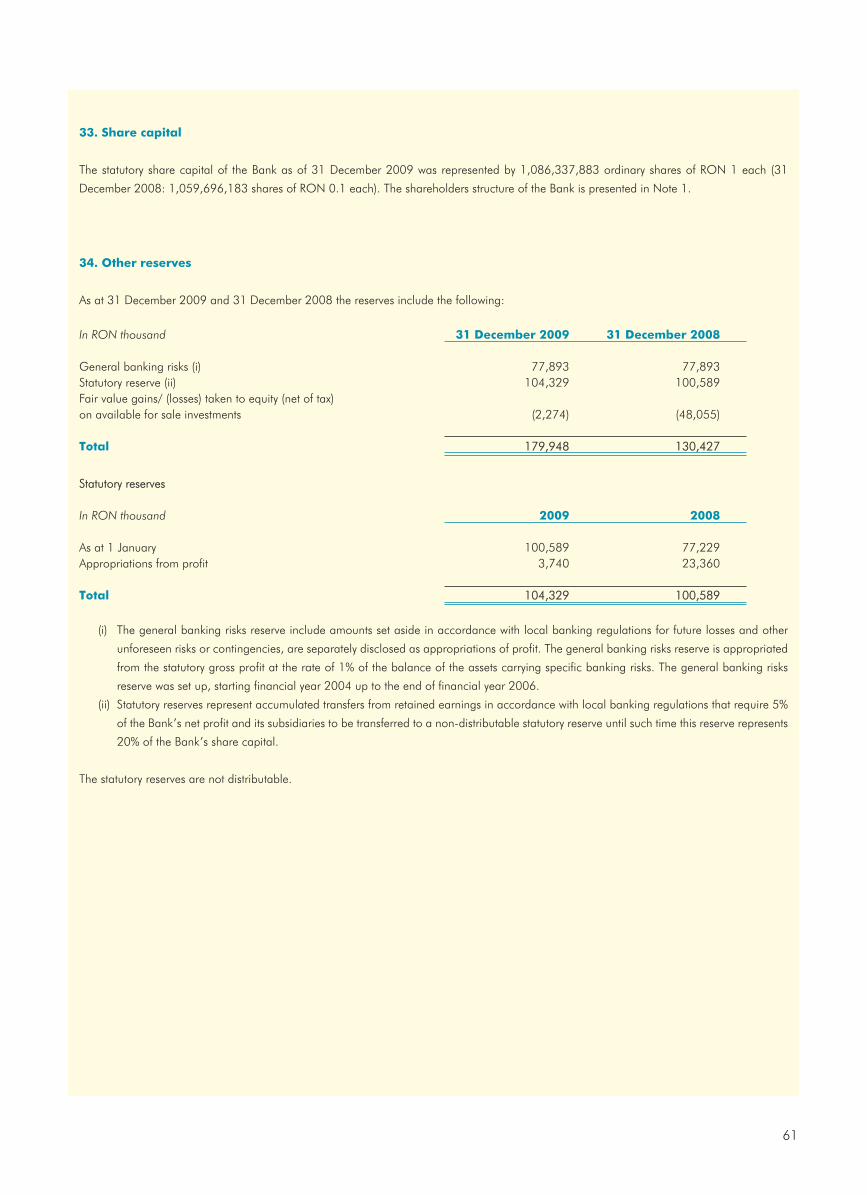
33. Share capital
The statutory share capital of the Bank as of 31 December 2009 was represented by 1,086,337,883 ordinary shares of RON 1 each (31
December 2008: 1,059,696,183 shares of RON 0.1 each). The shareholders structure of the Bank is presented in Note 1.
34. Other reserves
As at 31 December 2009 and 31 December 2008 the reserves include the following:
In RON thousand 31 December 2009 31 December 2008
General banking risks (i) 77,893 77,893Statutory reserve (ii) 104,329 100,589Fair value gains/ (losses) taken to equity (net of tax) on available for sale investments (2,274) (48,055)
Total 179,948 130,427
Statutory reserves
In RON thousand 2009 2008
As at 1 January 100,589 77,229Appropriations from profit 3,740 23,360
Total 104,329 100,589
(i) The general banking risks reserve include amounts set aside in accordance with local banking regulations for future losses and other
unforeseen risks or contingencies, are separately disclosed as appropriations of profit. The general banking risks reserve is appropriated
from the statutory gross profit at the rate of 1% of the balance of the assets carrying specific banking risks. The general banking risks
reserve was set up, starting financial year 2004 up to the end of financial year 2006.
(ii) Statutory reserves represent accumulated transfers from retained earnings in accordance with local banking regulations that require 5%
of the Bank’s net profit and its subsidiaries to be transferred to a non-distributable statutory reserve until such time this reserve represents
20% of the Bank’s share capital.
The statutory reserves are not distributable.
61
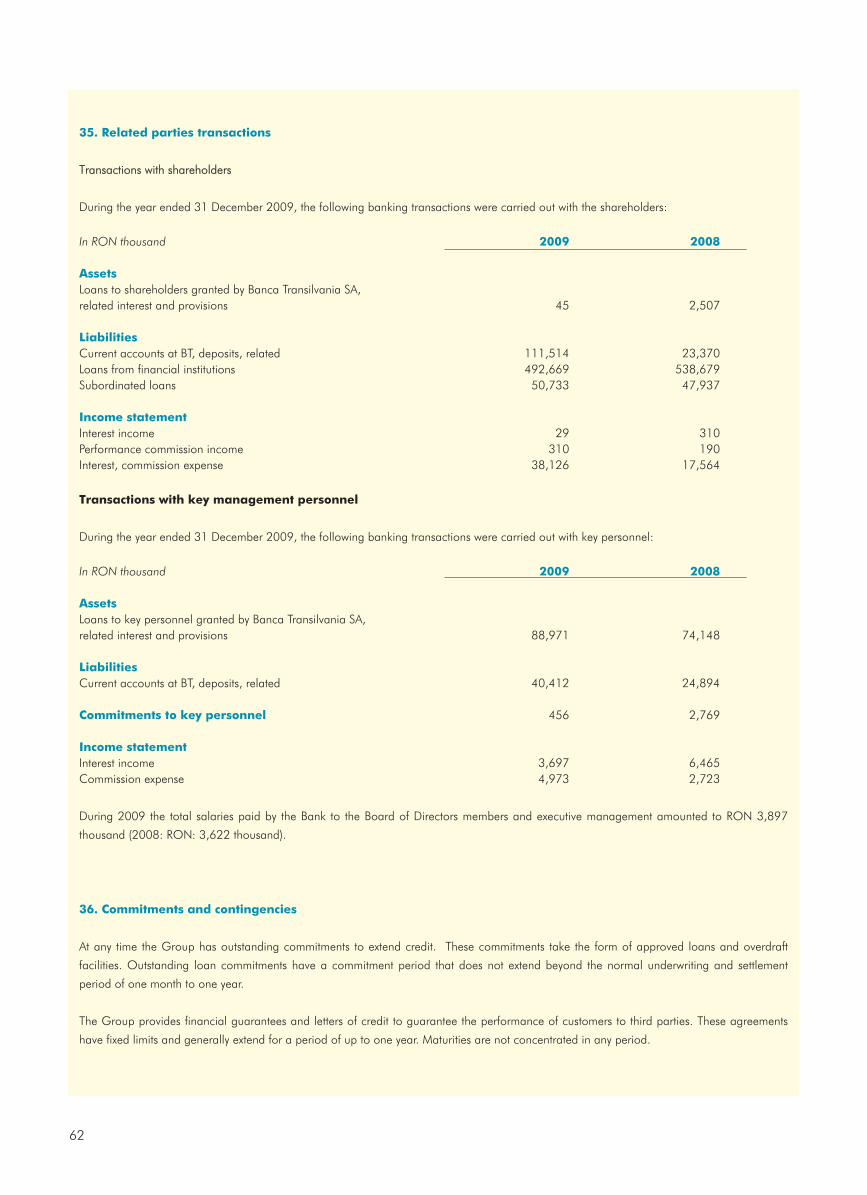
35. Related parties transactions
Transactions with shareholders
During the year ended 31 December 2009, the following banking transactions were carried out with the shareholders:
In RON thousand 2009 2008
AssetsLoans to shareholders granted by Banca Transilvania SA, related interest and provisions 45 2,507
LiabilitiesCurrent accounts at BT, deposits, related 111,514 23,370Loans from financial institutions 492,669 538,679Subordinated loans 50,733 47,937
Income statementInterest income 29 310Performance commission income 310 190Interest, commission expense 38,126 17,564
Transactions with key management personnel
During the year ended 31 December 2009, the following banking transactions were carried out with key personnel:
In RON thousand 2009 2008
AssetsLoans to key personnel granted by Banca Transilvania SA, related interest and provisions 88,971 74,148
LiabilitiesCurrent accounts at BT, deposits, related 40,412 24,894
Commitments to key personnel 456 2,769
Income statementInterest income 3,697 6,465Commission expense 4,973 2,723
During 2009 the total salaries paid by the Bank to the Board of Directors members and executive management amounted to RON 3,897
thousand (2008: RON: 3,622 thousand).
36. Commitments and contingencies
At any time the Group has outstanding commitments to extend credit. These commitments take the form of approved loans and overdraft
facilities. Outstanding loan commitments have a commitment period that does not extend beyond the normal underwriting and settlement
period of one month to one year.
The Group provides financial guarantees and letters of credit to guarantee the performance of customers to third parties. These agreements
have fixed limits and generally extend for a period of up to one year. Maturities are not concentrated in any period.
62

The contractual amounts of commitments and contingent liabilities are set out in the following table by category. The amounts reflected in the
table as commitments assume that amounts are fully advanced.
The amounts reflected in the table as guarantees and letters of credit represent the maximum accounting loss that would be recognized at the
balance sheet date if counterparties failed completely to perform as contracted.
In RON thousand 31 December 2009 31 December 2008
Guarantees issued 764,600 683,520Loan commitments 1,861,059 1,725,593
Total 2,625,659 2,409,113
As at 31 December 2009, foreign currency transactions were due to purchase transactions amounting to EUR 500 thousand, USD 1,375
thousand and RON 6,175 thousand (31 December 2008: EUR 47,370 thousand sales operations and purchasing operations EUR 370
thousand). The outstanding transactions at 31 December 2009 have maturities until February 2009.
37. Earnings per share
Basic earnings per share
The calculation of basic earnings per share (basic and diluted) was based on net profit attributable to ordinary shareholders of RON 138,323
thousand (31 December 2008: RON 361,672 thousand) and on the weighted average number of ordinary shares outstanding during the year,
calculated as follows:
2009 2008*
Ordinary shares issued as at 1 January 1,059,698,186 611,079,770Effect of shares issued during the year 948,882 436,042,053Weighted average number of shares as at 31 December 1,060,647,068 1,047,121,823Weighted average number of shares as at 31 December 2007 retreated n/a 1,073,763,523
* The number of shares related to 2008 was adjusted retrospectively.
Diluted earnings per share
The potential ordinary shares of the Bank are represented by the bonds convertible to outstanding shares (please refer to Note 31). The potential
ordinary shares are anti-dilutive because their conversion to ordinary shares would increase earnings per share.
Because the calculation of the diluted earnings per share does not take into account the conversion of potential ordinary shares that would have
an anti-dilutive effect, it is the same as the basic earnings per share.
38. Changes in Group structure
Acquisitions
In October 2009 the Group acquired 50% of the share capital of Compania de Factoring IFN SA, thus holding 99.18% of this company. Fair
value of assets minus the fair value of liabilities acquired were considered equal to the Company’s net assets, therefore the Group did not
consider necessary to record goodwill following this transaction.
63

64
Sales
During 2009 the Group sold its entire holding of 50% of the share capital of BT Aegon SA for the amount of RON 44,693 thousand, after this
transaction the Group recorded a profit of RON 38,596 thousand as compared to the value of the Company’s net assets at the date of sale.
Other changes
BT Group's stake in BT Obligatiuni fund managed by BT Asset Management decreased from 80.4% (December 2008) to 11.23% (December
2009). The holdings of this fund are presented in the category of securities available for sale as of 31 December 2009.
39. Reconciliation of profit under IFRS and Romanian Accounting Standards
In RON thousand 2009 2008
Net profit under Romanian Accounting Standards 70,131 362,501
Fair value adjustment for investment securities (51,959) 69,069Reversal of dividends from subsidiaries (2,894) (27,923)Adjustment to amortized cost and impairment of loans to customers 94,698 (31,332)Net income related to subsidiaries sold/ acquired 9,259 -Deferred tax income 4,422 9,371Brokerage commissions income - 12,840Investment in associates(loss) 8,005 (25,362)Income/ (loss) from consolidated funds 5,018 (9,198)Other items 35 21
Net profit under IFRS 136,715 359,987
40. Reconciliation of equity under IFRS and Romanian Accounting Standards
In RON thousand 31 December 2009 31 December 2008
Equity under Romanian Accounting Standards 1,684,863 1,239,487
Loans related adjustments 44,038 (49,355)Reevaluation of available-for-sale investments 15,479 2,272Deferred tax 16,719 21,088Other items 27 (2,531)
Equity under IFRS 1,838,034 1,656,337
41. Subsequent events
In February 2010 the Bank acquired 42.61% stake in Medicredit Leasing IFN SA from minority shareholders, owning at the date of these financial
statements 99.99% of this company. This transaction had no impact on the financial statements for the year ended 31 December 2009.
Horia Ciorcila Maria MoldovanChairman Chief Financial Officer
65
BANCA TRANSILVANIA S.A.
HEAD OFFICE
8 G. Baritiu St.
400027 Cluj-Napoca, Romania
Ph: +40 264 407150
Fax: +40 264 407179
tarait SWIFT: BTRLRO22
www.bancatransilvania.ro
BT DIRECT IFN S.A.
1 G. Baritiu St.
400027 Cluj-Napoca, Romania
Ph: +40 264 301485
Fax: +40 264 301343
www.btdirect.ro
BT FINOP LEASING IFN S.A.
43 Sos. Bucuresti-Ploiesti
013685, Bucharest, Romania
Ph: +40 21 3088008
Fax: +40 21 2692100
www.bt-finopleasing.ro
BT LEASING TRANSILVANIA IFN S.A.
1 G. Baritiu St., 1st floor
400027 Cluj-Napoca, Romania
Ph: +40 264 438816
Fax: +40 264 444150
www.btleasing.ro
BT SECURITIES S.A.
104, 21 Decembrie 1989 Blvd., 1st floor
400127 Cluj-Napoca, Romania
Ph: +40 264 430564
+40 264 431747
Fax: +40 264 431718
www.btsecurities.ro
BT ASSET MANAGEMENT S.A.I. S.A.
104, 21 Decembrie 1989 Blvd., 4th floor
400127 Cluj-Napoca, Romania
Ph: +40 264 301036
Fax: +40 264 301035
www.btassetmanagement.ro
S.C. MEDICREDIT LEASING IFN S.A.
43 Sos. Bucuresti-Ploiesti
013685 Bucharest, Romania
Ph: +40 21 2226559
Fax: +40 21 2226504
www.medicredit.ro

IDEA DESIGN & PRINT Cluj, 2010