
Annual Financial Report 2012 - NAB Personal Banking · National Australia Bank Limited ABN 12 004...
176
Annual Financial Report 2012
Transcript of Annual Financial Report 2012 - NAB Personal Banking · National Australia Bank Limited ABN 12 004...

Annual Financial Report
2012

National Australia Bank Limited ABN 12 004 044 937
This Annual Financial Report (Report) is lodged with the Australian Securities and Investments Commission and ASX Limited.
National Australia Bank Limited (NAB) is publicly listed in Australia and overseas. The Report contains information prepared on the basis of the Banking Act 1959 (Cth), Corporations Act 2001 (Cth) and Accounting Standards and Interpretations issued by the Australian Accounting Standards Board. The Group deregistered from the United States Securities and Exchange Commission (SEC) effective 20 September 2007. Accordingly, NAB is not required to include SEC-related disclosures in the Report for either the current or comparative financial years.
NAB no longer produces a concise report under section 314(2) of the Corporations Act 2001 (Cth), and instead compiles a non-statutory Annual Review which can be viewed online at www.nabgroup.com.
To view the Report online, visit www.nabgroup.com. Alternatively, to arrange for a copy to be sent to you free of charge, call Shareholder Services on 1300 367 647 from within Australia, or +61 3 9415 4299 from outside Australia.
Nothing in the Report is, or should be taken as, an offer of securities in NAB for issue or sale, or an invitation to apply for the purchase of such securities.
All figures in the Report are in Australian dollars unless otherwise stated.
2012 Annual Financial Report 1
Table of ContentsReport of the Directors 2
Remuneration report 15
Corporate governance 41
Diversity 50
Financial report 53
Income statement 54
Statement of comprehensive income 55
Balance sheet 56
Cash flow statement 57
Statement of changes in equity 58
Notes to the financial statements 60
1 Principal accounting policies 60
2 Segment information 73
3 Net interest income 77
4 Other income 77
5 Operating expenses 78
6 Income tax expense 79
7 Dividends and distributions 80
8 Earnings per share 81
9 Cash and liquid assets 81
10 Due from other banks 81
11 Trading and hedging derivative assets and liabilities 82
12 Trading securities 85
13 Investments - available for sale 85
14 Investments - held to maturity 85
15 Investments relating to life insurance business 85
16 Other financial assets at fair value 86
17 Loans and advances 87
18 Provision for doubtful debts 89
19 Asset quality disclosures 90
20 Property, plant and equipment 91
21 Investments in controlled entities 92
22 Goodwill and other intangible assets 93
23 Current and deferred tax assets 95
24 Other assets 96
25 Other financial liabilities at fair value 96
26 Deposits and other borrowings 96
27 Life policy liabilities 97
28 Current and deferred tax liabilities 98
29 Provisions 99
30 Bonds, notes and subordinated debt 100
31 Other debt issues 102
32 Defined benefit superannuation plan assets and liabilities
103
33 Other liabilities 106
34 Contributed equity 107
35 Reserves 109
36 Retained profits 110
37 Shares, performance options and performance rights 111
38 Notes to the cash flow statement 114
39 Particulars in relation to controlled entities 116
40 Contingent liabilities and credit commitments 117
41 Financial risk management 121
42 Fair value of financial instruments 138
43 Financial asset transfers and securitisations 144
44 Operating leases 145
45 Investment commitments 145
46 Related party disclosures 146
47 Equity instrument holdings of key management personnel
150
48 Remuneration of external auditor 154
49 Fiduciary activities 155
50 Life insurance business disclosures 156
51 Capital adequacy 161
52 Events subsequent to balance date 161
Directors’ declaration 162
Independent auditor’s report to the members of National Australia Bank Limited
163
Shareholder information 165
Glossary 169

2 NATIONAL AUSTRALIA BANK
Report of the DirectorsThe directors of National Australia Bank Limited (Company) present their report, together with the financial statements of the Group, being the Company and its controlled entities, for the year ended 30 September 2012.
Certain definitions
The Group’s financial year ends on 30 September. The financial year ended 30 September 2012 is referred to as 2012 and other financial years are referred to in a corresponding manner. The abbreviations $m and $bn represent millions and thousands of millions (i.e. billions) of Australian dollars respectively. Any discrepancies between total and sums of components in tables contained in this report are due to rounding.
Key terms used in this report are contained in the Glossary.
Forward-looking statements
This report contains certain forward-looking statements. The words ‘anticipate’, ‘believe’, ‘expect’, ‘project’, ‘estimate’, ‘likely’, ‘intend’, ‘should’, ‘could’, ‘may’, ‘target’, ‘plan’ and other similar expressions are intended to identify forward-looking statements. Indications of, and guidance on, future earnings and financial position and performance are also forward-looking statements.
Such forward-looking statements are not guarantees of future performance and involve known and unknown risks, uncertainties and other factors, many of which are beyond the control of the Group, which may cause actual results to differ materially from those expressed or implied in such statements. There can be no assurance that actual outcomes will not differ materially from these statements.
Further information on important factors that could cause actual results to differ materially from those projected in such statements is contained in Note 41 in the Financial report.
Rounding of amounts
Pursuant to Australian Securities and Investments Commission (ASIC) Class Order 98/100 dated 10 July 1998, the Company has rounded off amounts in this report and the accompanying Financial report to the nearest million dollars, except where indicated.
Principal activities and significant changes in nature of activities
The principal activities of the Group during the year were banking services, credit and access card facilities, leasing, housing and general finance, international banking, investment banking, wealth management, funds management, life insurance and custodian, trustee and nominee services.
Review of operations and Group results
Financial performance summaryGroup
2012 2011$m $m
Net interest income 13,242 13,034 Net life insurance income 740 360 Other income 3,733 3,449 Operating expenses (8,822) (8,365)Charge to provide for doubtful debts (2,734) (1,750)
Profit before income tax expense 6,159 6,728 Income tax expense (2,076) (1,508)
Net profit 4,083 5,220 Non-controlling interest in controlled entities (1) (1)
Net profit attributable to owners of the Company 4,082 5,219
Net profit attributable to owners of the Company decreased by $1,137 million or 21.8% compared to 2011, reflecting higher charges for bad and doubtful debts including a $250 million uplift to the economic cycle adjustment, impairment of goodwill, restructuring costs and provisions for customer redress costs in UK Banking. This was partly offset by a strong performance in Wholesale Banking and higher earnings in Personal Banking and NZ Banking.
Net interest income increased by $208 million or 1.6% compared to 2011. This was largely driven by Wholesale Banking’s gains on economically hedged positions relating to the Group’s banking book interest rate risk (offset in other operating income), and an increase in interest earning assets. Growth in home lending volumes in Personal Banking and NZ Banking also contributed. This increase was partly offset by higher funding and deposit costs, particularly in UK Banking following the Clydesdale Bank PLC credit rating downgrade.
The Group’s net interest margin has fallen 14 basis points from 2.24% to 2.10% largely as a result of higher funding and deposit costs, partly offset by product repricing.
Net life insurance income increased by $380 million or 105.6% compared to 2011. This reflects growth in average funds under management and inforce premiums, together with favourable earnings on the annuities portfolio. This was partly offset by unfavourable lapses and changes in the profile of the retail insurance book.
Total other income increased by $284 million or 8.2% compared to 2011. This was largely due to higher income from the Risk business within Wholesale Banking. Excluding the effects of losses on economic hedges relating to the Group’s banking book interest rate risk (offset in net interest income), the underlying increase in trading income was due to strong risk management and overall trading activity on external market uncertainty combined with gains on the liquidity portfolio, partially offset by provisions for customer redress costs relating to payment protection insurance in UK Banking.
Total operating expenses increased by $457 million or 5.5% compared to 2011. This largely reflects the impairment of goodwill and capitalised software in UK Banking, and provisions for customer redress in UK Banking, partly offset by disciplined management of discretionary expenditure.
The charge to provide for bad and doubtful debts increased by $984 million or 56.2% compared to 2011. Excluding the $250 million economic cycle adjustment, the increase in the charge to provide for bad and doubtful debts was $734 million or 41.9%. This largely reflects business lending losses in UK Banking as a result of prolonged weakness in the UK economy.
Income tax expense increased by $568 million or 37.7% compared to 2011. Excluding the one-off benefit in 2011 relating to the refund of tax on exchangeable capital units settlement, income tax expense was $426 million higher which was largely due to a higher income tax expense attributable to the statutory funds of the life insurance business and their controlled trusts.

2012 Annual Financial Report 3
Report of the DirectorsDividends
The directors have declared a final dividend of 90 cents per fully paid ordinary share, 100% franked, payable on 18 December 2012. The proposed payment amounts to approximately $2,067 million.
Dividends paid since the end of the previous financial year: • the final dividend for the year ended 30 September 2011 of 88
cents per fully paid ordinary share, 100% franked, paid on 19 December 2011. The payment amount was $1,940 million; and
• the interim dividend for the year ended 30 September 2012 of 90 cents per fully paid ordinary share, 100% franked, paid on 16 July 2012. The payment amount was $2,015 million.
Information on the dividends paid and declared to date is contained in Note 7 to the Financial report.
The franked portion of these dividends carries Australian franking credits at a tax rate of 30%, reflecting the current Australian company tax rate of 30%.
The extent to which future dividends will be franked, for Australian taxation purposes, will depend on a number of factors, including the proportion of the Group’s profits that will be subject to Australian income tax and any future changes to Australia’s business tax system.
Balance sheet summaryGroup
2012 2011$m $m
AssetsCash and liquid assets 19,464 27,093 Due from other banks 47,410 47,106 Trading derivatives 40,899 48,466 Trading securities 28,614 34,628 Investments – available for sale 28,985 18,045 Investments – held to maturity 9,762 12,787 Investments relating to life insurance business 68,414 63,920 Other financial assets at fair value 64,027 51,756 Loans and advances 394,735 382,369 Due from customers on acceptances 36,957 43,017 All other assets 23,823 24,570
Total assets 763,090 753,757
LiabilitiesDue to other banks 28,691 40,162 Trading derivatives 45,127 47,889 Other financial liabilities at fair value 21,732 23,726 Deposits and other borrowings 419,921 402,964 Liability on acceptances 7,801 10,633 Life policy liabilities 56,584 53,608 Bonds, notes and subordinated debt 103,372 99,768 Other debt issues 1,783 2,494 All other liabilities 34,276 30,325
Total liabilities 719,287 711,569
Total equity 43,803 42,188
Total liabilities and equity 763,090 753,757
Total assets increased by $9,333 million or 1.2% compared to 2011.
The increase in total assets was mainly due to an increase in loans and advances including acceptances and other financial assets at fair value, totalling $18,577 million or 3.9%. Growth was primarily due to continuing momentum in housing lending, reflecting the Group’s strategy to remain competitive in this sector. Growth in market share was achieved in Australia and in the UK as a result of the effective execution of this strategy. There was also growth in non-housing lending despite a challenging operating environment in the Group’s key markets, partially offset by a decline in UK Banking due to subdued demand for credit together with a focus on managing down commercial property and unsecured personal lending, and also a decline in Specialised Group Assets as the business is managed down.
Marketable debt securities (comprising Trading securities, Investments – available for sale, and Investments – held to maturity) increased by $1,901 million or 2.9% in aggregate, reflecting the Group’s continuing desire to maintain balance sheet flexibility and strength.
These increases were partially offset by a decline in Cash and liquid assets of $7,629 million or 28.2% and a decline in Trading derivatives of $7,567 million or 15.6%. The movement in Cash and liquid assets is part of managing and optimising the Group’s funding and liquidity profile. The decline in Trading derivative assets reflected continued market volatility, in particular foreign exchange rates and the general reduction in interest rate yield, affecting customer demand for risk management products and the revaluation of these derivatives and economic hedging positions.
Total liabilities increased by $7,718 million or 1.1% compared to 2011.
The increase in total liabilities was mainly due to an increase in Deposits and other borrowings of $16,957 million or 4.2% reflecting the Group’s continued focus on attracting and retaining sustainable customer deposits as a source of funding to meet business needs and strengthen the balance sheet. In addition, Bonds, notes and subordinated debt increased by $3,604 million or 3.6%. This was partially offset by the decrease in Due to other banks of $11,471 million or 28.6% and Liability on acceptances of $2,832 million or 26.6% as the Group continues to explore opportunities to enhance and diversify its funding sources.
Total equity increased by $1,615 million or 3.8% compared to 2011. This increase is due to current year earnings, shares issued through the dividend reinvestment plan, and the conversion of Convertible Notes and Stapled Securities, partially offset by the payment of dividends.

4 NATIONAL AUSTRALIA BANK
Report of the DirectorsDirectors
Details of directors of the Company in office at the date of this report (or holding office during the year), and each director’s qualifications, experience and special responsibilities are below:
Mr Michael A Chaney AO, BSc, MBA, Hon. LLD W.Aust, FAICD
Age: 62
Term of office: Chairman since September 2005 and director since December 2004.
Independent: Yes
Skills & Experience: Over 27 years of experience in a range of industries in executive, financial management and governance roles, including Managing Director and Chief Executive Officer of Wesfarmers Limited from 1992 until July 2005. Three years with investment bank Australian Industry Development Corporation, from 1980 to 1983. Eight years in petroleum exploration in Australia, Indonesia and the United States from 1972 to 1980.
Directorships of listed entities within the last three years, other directorships and offices (current & recent):• Chairman of Woodside Petroleum Ltd (since August 2007, Director
since November 2005) • Chairman of Gresham Partners Holdings Limited (since July 2005,
Director since November 1985) • Director of Centre for Independent Studies (since October 2000) • Chancellor of University of Western Australia (since December
2005) • Member of JP Morgan International Council (since October 2003)
Board Committee membership:• Chairman of the Nomination Committee
Mr Cameron A Clyne BA
Age: 44
Term of office: Managing Director and Group Chief Executive Officer since January 2009.
Independent: No
Skills & Experience: Over 21 years in financial services, including 12 years with PricewaterhouseCoopers (PwC), culminating in leadership of the Financial Services Industry practice in Asia Pacific, prior to the acquisition by IBM of PwC Consulting. During his consulting career he worked with many of the world’s leading banks in Australia, New Zealand, the United States, Europe and Asia. He is also a director of Bank of New Zealand and Chairman of National Australia Group Europe Limited and Clydesdale Bank PLC (subsidiaries of the Company). He is Co-Chair of National Australia Bank’s Group Diversity Forum and the Company’s Advisory Council on Corporate Responsibility.
Directorships of listed entities within the last three years, other directorships and offices (current & recent):• Director of The Financial Markets Foundation for Children (since
April 2009)
Board Committee membership:• Member of the Information Technology Committee
Mrs Patricia A Cross BSc (Hons), FAICD
Age: 53
Term of office: Director since December 2005.
Independent: Yes
Skills & Experience: Over 30 years in international banking and finance, including management and senior executive roles in Europe, the United States and Australia with Chase Manhattan Bank, Banque Nationale de Paris and National Australia Bank. Mrs Cross was a
founding member of the Financial Sector Advisory Council to the Federal Treasurer serving for five years. She has served in a variety of honorary advisory capacities to the Federal Government for 14 years, including as a member of the Federal Government’s Panel of Experts for the Australian Financial Centre Forum. In 2003, she received a Centenary Medal for service to Australian society through the finance industry. She is also a Director of JBWere Pty Ltd (a subsidiary of the Company).
Directorships of listed entities within the last three years, other directorships and offices (current & recent):• Director of Qantas Airways Limited (since January 2004) • Director of Grattan Institute (since September 2008) • Director of Methodist Ladies College, Melbourne (since January
2008) • Ambassador to the Australian Indigenous Education Foundation
(since April 2009)• Director of the Advisory Board of the Faculty of Business and
Economics at Melbourne University (since November 2007)• Former Director of Murdoch Childrens Research Institute (from
August 2005 to May 2011) • Former Director of Wesfarmers Limited (from February 2003 to
March 2010)
Board Committee membership:• Chairman of the Remuneration Committee • Member of the Risk Committee • Member of the Nomination Committee
Mr Daniel T Gilbert AM, LLB
Age: 61
Term of office: Director since September 2004.
Independent: Yes
Skills & Experience: Over 30 years in commercial law, specialising in technology and corporate law. He is Managing Partner of Gilbert + Tobin, which he co-founded in 1988. He is also Co-Chair of National Australia Bank’s Indigenous Advisory Group and Chairman of the Group’s Litigation Sub-Committee.
Directorships of listed entities within the last three years, other directorships and offices (current & recent):• Chairman, National Museum of Australia (since March 2009)• Chairman, University of Western Sydney Foundation (since
January 2012)
Board Committee membership:• Member of the Remuneration Committee• Member of the Nomination Committee• Chairman of the Information Technology Committee
Dr Kenneth R Henry AC, FASSA, BCom, PhD, DB h.c
Age: 54
Term of office: Director since November 2011.
Independent: Yes
Skills & Experience: Over 27 years in public service, serving in senior economic policy advisory positions to the Australian Government. He chaired Australia’s Future Tax System Review, known as the Henry Tax Review, which was published in 2010. In June 2011, he was appointed as Special Advisor to the Prime Minister. He is a former member of the Board of the Reserve Bank of Australia, the Board of Taxation, the Council of Financial Regulators, the Defence Procurement Advisory Committee and the Council of Infrastructure Australia.

2012 Annual Financial Report 5
Report of the DirectorsDirectorships of listed entities within the last three years, other directorships and offices (current & recent):
• Chairman, Advisory Council of the SMART Infrastructure Facility, University of Wollongong (since September 2011)
• Chairman, The Institute of Public Policy at the Australian National University (ANU) (since July 2012)
• Member of the Board of Reconciliation Australia (since July 2012)• Member, Sir Roland Wilson Foundation, ANU (since May 2001)• Member of the Advisory Board of the Australian Demographic and
Social Research Institute (ADSRI), ANU (since June 2008)
Board Committee membership:• Member of the Audit Committee• Member of the Nomination Committee
Mr Mark A Joiner ACA, MBA
Age: 54
Term of office: Director since March 2009. Mr Joiner was appointed Group Chief Financial Officer in October 2007 and Executive Director, Finance in March 2009.
Independent: No
Skills & Experience: Over 25 years in commerce, banking and finance. He originally joined National Australia Bank as a member of the Australian Executive Committee in 2006. He was appointed Group Chief Financial Officer in October 2007, from his previous position as Group Executive General Manager, New Business and Development. Prior to joining the Group, he was Chief Financial Officer and Managing Director, Head of Strategy and Mergers and Acquisitions for Citigroup’s Global Wealth Management business, based in New York. Before entering banking, he was with strategy consulting firm Boston Consulting Group for 17 years, working out of various Australian and United States offices. He is Chairman of JBWere Pty Ltd, Invia Custodian Pty Ltd and I.C. Nominees Pty Ltd and Director of National Australia Group Europe Limited and Clydesdale Bank PLC (all subsidiaries of the Company). He is Co-Chair of National Australia Bank’s Group Diversity Forum, Chairman of the Company’s Corporate Responsibility Council and a Member of the Group’s Capital and Funding Sub-Committee.
Directorships of listed entities within the last three years, other directorships and offices (current & recent):• Director of Aurora Vineyard Limited (since October 1999)• Member of the Founders’ Board of Flora and Fauna International
(since March 2010)
Mr Paul J Rizzo BCom, MBA
Age: 67
Term of office: Director since September 2004.
Independent: Yes
Skills & Experience: Over 40 years experience in banking and finance. Formerly Dean and Director of Melbourne Business School from 2000 to 2004, Group Managing Director, Finance and Administration, Telstra Corporation Limited from 1993 to 2000, senior roles at Commonwealth Bank of Australia from 1991 to 1993, Chief Executive Officer of State Bank of Victoria in 1990 and 24 years with Australia and New Zealand Banking Group Ltd from 1966 to 1990. He is a Member of the Group’s Capital and Funding Sub-Committee.
Directorships of listed entities within the last three years, other directorships and offices (current & recent):• Chairman of the Defence Audit and Risk Committee for the
Australian Government Department of Defence (since February 2008)
• Chairman of the Foundation for Very Special Kids (since July 2004)
• Chairman of The Rizzo Report Implementation Committee for Defence (since September 2011)
• Deputy Chairman of the Defence Strategic Reform Advisory Board (since September 2011)
Board Committee membership:• Chairman of the Risk Committee • Member of the Audit Committee • Member of the Nomination Committee• Member of the Information Technology Committee
Ms Jillian S Segal AM, BA, LLB, LLM (Harvard), FAICD
Age: 57
Term of office: Director since September 2004.
Independent: Yes
Skills & Experience: Over 20 years as a lawyer and regulator. From 1997 to 2002, she was a commissioner of ASIC, being Deputy Chairman from 2000 to 2002. She was Chairman of the Banking & Financial Services Ombudsman Board from 2002 to 2004. Prior to that she was an environmental and corporate partner and consultant at Allen Allen & Hemsley and worked for Davis Polk & Wardwell in New York. She is a Member of the Company’s Advisory Council on Corporate Responsibility and a Member of the Group’s Litigation Sub-Committee.
Directorships of listed entities within the last three years, other directorships and offices (current & recent):• Director of ASX Limited (since July 2003) • Director of ASX Compliance Pty Limited (since July 2006) • Chairman of General Sir John Monash Foundation (Director since
February 2008 and Chairman since May 2010) • Director of The Garvan Institute of Medical Research (since June
2009) • Deputy Chancellor, University of New South Wales Council (since
January 2010) • Member, Australian Government’s Remuneration Tribunal (since
April 2010) • Member, Sydney Advisory Council of the Centre for Social Impact
(since August 2008)
Board Committee membership:• Member of the Audit Committee • Member of the Risk Committee • Member of the Nomination Committee
Mr John G Thorn FCA, FAICD
Age: 64
Term of office: Director since October 2003.
Independent: Yes
Skills & Experience: 37 years in professional services with PwC, over 20 years as a partner responsible for significant international and Australian clients. A member of the Global Audit Management Group and Australian National Managing Partner until 2003. He is a Member of the Group’s Litigation, and Capital and Funding Sub-Committees.
Directorships of listed entities within the last three years, other directorships and offices (current & recent):• Director of Amcor Limited (since December 2004) • Director of Caltex Australia Limited (since June 2004) • Director of Salmat Limited (since September 2003)
Board Committee membership:• Chairman of the Audit Committee • Member of the Nomination Committee• Member of the Information Technology Committee

6 NATIONAL AUSTRALIA BANK
Report of the DirectorsMr Geoffrey A Tomlinson BEc
Age: 65
Term of office: Director since March 2000.
Independent: Yes
Skills & Experience: 29 years with the National Mutual Group, six years as Group Managing Director and Chief Executive Officer until 1998. He is Chairman of National Wealth Management Holdings Limited and other wealth subsidiaries (all subsidiaries of the Company).
Directorships of listed entities within the last three years, other directorships and offices (current & recent):• Director, Calibre Global Limited (since May 2012) • Former Chairman of Programmed Maintenance Services Limited
(from August 1999 to August 2011) • Former Director of Amcor Limited (from March 1999 to April 2010)
Board Committee membership:• Member of the Remuneration Committee • Member of the Nomination Committee
Mr John A Waller BCom, FCA
Age: 60
Term of office: Director since February 2009.
Independent: Yes
Skills & Experience: Over 20 years in professional services with PwC, New Zealand. His roles at PwC included being a member of the firm’s New Zealand Board and leader of its Advisory division. He was also a member of the New Zealand Takeovers Panel until February 2011. In addition to a wealth of valuable corporate and financial experience, he brings to the Board a deep understanding of the New Zealand market as a non-executive director. He is Chairman of Bank of New Zealand (a subsidiary of the Company).
Directorships of listed entities within the last three years, other directorships and offices (current & recent):• Director of Fonterra Co-operative Group Limited (since Feb 2009) • Director of Sky Network Television Limited (since April 2009) • Director of Alliance Group Limited (since January 2009) • Director of Haydn & Rollett Limited (since February 2009) • Director of Donaghys Limited (since March 2009) • Director of JAW Advisory Limited (since May 2009) • Director of Direct Property Fund & subsidiaries (since November
2010) • Director of Yealands Wine Group Limited (since November 2011)• Chairman of Eden Park Trust (since September 2009) • Former Member of the Auckland Transition Agency (from 2009 to
October 2011) • Former Member of the New Zealand Takeovers Panel (from
December 2006 to February 2011)
Board Committee membership:• Member of the Audit Committee • Member of the Risk Committee • Member of the Nomination Committee
Sir Malcolm Williamson
Age: 73
Term of office: Director from May 2004 to June 2012.
Independent: Yes
Skills & Experience: Over 50 years in the banking and finance industry, both in the United Kingdom and the United States. He served with Barclays PLC from 1957 to 1985. In 1989, he joined Standard Chartered PLC and became Group Chief Executive. In 1998, he moved to the United States and took up the role of President
and Chief Executive Officer of Visa International, which he held until 2004. He was also Chairman of National Australia Group Europe Limited and Clydesdale Bank PLC, from 2004 to 2012 (subsidiaries of the Company).
Directorships of listed entities within the last three years, other directorships and offices (current & recent):• Chairman of Signet Jewelers Ltd (since September 2008)• Director of Signet Group Limited (Director since November 2005
and Chairman from June 2006 to September 2008)• Chairman of Friends Life Group PLC (formerly Friends Provident
Holdings (UK) PLC) (Director since November 2009 and Chairman since February 2010)
• Chairman of SAV Credit Limited (since June 2010) • Chairman of The Prince of Wales Youth Business International
Limited (since March 2008) • Chairman of Cass Business School Strategy and Development
Board (since April 2008)
Board Committee membership:• Member of the Risk Committee • Member of the Nomination Committee
Mr Anthony K T Yuen B.Soc.Scs & Law
Age: 62
Term of office: Director since March 2010.
Independent: Yes
Skills & Experience: Over 38 years in international banking and finance. Prior to taking on a strategic investment management role on behalf of The Royal Bank of Scotland PLC with Bank of China in 2006, he held senior executive roles, having Asia wide regional responsibility with Bank of America Corporation, National Westminster Bank PLC and The Royal Bank of Scotland PLC.
Directorships of listed entities within the last three years, other directorships and offices (current & recent):• Member of Supervisory Committee, ABF Hong Kong Bond Index
Fund (since 2006)
Board Committee membership• Member of the Risk Committee • Member of the Remuneration Committee • Member of the Nomination Committee
Board changes
Sir Malcolm Williamson retired from the Board of the Company on 7 June 2012 and from the National Australia Group Europe Limited and Clydesdale Bank PLC boards on 23 July 2012.
Company Secretaries
Details of company secretaries of the Company in office at the date of this report (or holding office during the year), and each company secretary’s qualifications and experience are below:
Ms Michaela Healey LLB, FCIS, was appointed Group Company Secretary in April 2006. She has experience in a range of legal, business and corporate affairs roles in listed companies and was formerly Company Secretary of Orica Limited and North Limited. The Company Secretary advises and supports the Board to enable the Board to fulfil its role.
Mr Nathan Butler LLB (Hons), LLM, BA (Jur), joined the Group in 2001 and was appointed as a company secretary in May 2008. Mr Butler is the General Counsel Corporate and advises the Group on a wide range of strategic, corporate, governance and regulatory matters.
Ms Fiona Last BCom, LLB (Hons), joined the Group in 2005 and was appointed as a company secretary in May 2012. Ms Last is a
2012 Annual Financial Report 7
Report of the DirectorsSenior Corporate Lawyer who advises the Group on a wide range of strategic, corporate, governance and regulatory matters. She also manages the Group’s Australian Secretariat.
Mr Jason Elphick BCom, LLB, LLM, joined the Group in 2004 and was Head of Governance and General Counsel Capital and Funding and has advised the Group on a wide range of debt, capital, equity, governance and regulatory matters. Mr Elphick was appointed as a company secretary in October 2010 and ceased to be a company secretary in May 2012.
Directors’ and officers’ indemnity
The Company’s constitution
Article 20.1 of the Company’s constitution provides that to the maximum extent permitted by law and without limiting the Company’s power, the Company may indemnify any current or former officer out of the property of the Company against: • any liability incurred by the person in the capacity as an officer
(except a liability for legal costs); • legal costs incurred in defending or resisting (or otherwise in
connection with) proceedings, whether civil or criminal or of an administrative or investigatory nature, in which the officer becomes involved because of that capacity;
• legal costs incurred in connection with any investigation or inquiry of any nature (including, without limitation, a royal commission) in which the officer becomes involved (including, without limitation, appearing as a witness or producing documents) because of that capacity; and
• legal costs incurred in good faith in obtaining legal advice on issues relevant to the performance of their functions and discharge of their duties as an officer, if that expenditure has been approved in accordance with the Board’s charter,
except to the extent that:• the Company is forbidden by law to indemnify the person against
the liability or legal costs; or • an indemnity by the Company of the person against the liability or
legal costs, if given, would be made void by law.
Under Article 20.2, the Company may pay or agree to pay, whether directly or through an interposed entity, a premium for a contract insuring a person who is or has been an officer against liability incurred by the person in that capacity, including a liability for legal costs, unless: • the Company is forbidden by law to pay or agree to pay the
premium; or • the contract would, if the Company paid the premium, be made
void by law.
The Company may enter into an agreement with a person referred to in Articles 20.1 and 20.2 with respect to the subject matter of those Articles. Such an agreement may include provisions relating to rights of access to the books of the Company.
In the context of Article 20, ‘officer’ means a director, secretary or senior manager of the Company or of a related body corporate of the Company.
The Company has executed deeds of indemnity in favour of each director of the Company and certain directors of related bodies corporate of the Company. Some companies within the Group have extended equivalent deeds of indemnity in favour of directors of those companies.
Directors’ and officers’ insurance
During the year, the Company, pursuant to Article 20, paid a premium for a contract insuring all directors, secretaries, executive officers and officers of the Company and of each related body corporate of the Company. The contract does not provide cover for the
independent auditors of the Company or of a related body corporate of the Company. In accordance with usual commercial practice, the insurance contract prohibits disclosure of details of the nature of the liabilities covered.
Significant changes in the state of affairs
Senior executive changes
On 28 May 2012, the Company announced Mr Clyne’s appointment as Chairman of National Australia Group Europe Limited and Clydesdale Bank PLC upon the retirement of Sir Malcolm Williamson.
Mr Joiner and Mr Sawers (Group Executive, Wholesale Banking) were appointed directors of National Australia Group Europe Limited and Clydesdale Bank PLC effective 14 June 2012.
On 14 August 2012, the Company announced that Mr D Thorburn, CEO United Kingdom, would step down from the Group Executive Committee. Mr D Thorburn remains as Chief Executive Officer, UK and continues to report to Mr Clyne as Group Chief Executive Officer and Chairman of National Australia Group Europe Limited.
Recent market conditions
The heightened uncertainty, volatility and stress evident in global markets in late 2011 has resulted in a weakening in business confidence and slower growth in the advanced economies throughout 2012. The annualised pace of growth in the seven biggest advanced economies (G7) slowed to only 1% in the first half of 2012 with much of Western Europe falling back into recession. This was a disappointing outcome which indicated that G7 GDP had taken four years to regain its early 2008 level.
As a consequence of the poor growth record of the advanced economies, global growth over the last few years has been reliant on the emerging economies, particularly China, India and Brazil. However, these emerging economies too experienced a slowdown through 2012 as their export markets were affected by the sluggish performance of the advanced economies. At the same time, previous rounds of monetary tightening slowed domestic demand across Asia and Latin America. Growth in China, India and Brazil has slowed from around the 10% seen in 2010 to less than 6% year-on-year in mid-2012, while the Asian ‘Tiger’ economies have slowed from around 8% in 2010 to about 3% year-on-year in mid-2012. These trends have caused a broad-based softening in the pace of growth that has driven global growth well below its long run trend and initial consensus forecasts for 2012. The net result is that the world economy is expected to grow by 3% this year with the emerging markets contributing over 2% of that overall expansion.
Global growth is then expected to pick-up to 3.25% in 2013. This is premised on the Euro-zone policy makers preserving the single currency, the avoidance of a ‘hard landing’ in China and the US authorities ensuring that their economy does not stumble over a ‘fiscal cliff’ of spending cuts and tax increases.
Domestically, Australia has been one of the best performing advanced economies over the last five years. In contrast with many of its peers, output, employment and real incomes are well above their early 2008 levels and it has not suffered their four years of lost growth. Real output in mid-2012 was around 10% above its early 2008 level, implying average annual growth of almost 2.5%. This good relative performance reflects the surge in commodity prices and mining investment, the relative strength of the financial system and government accounts and the capacity to deliver policy stimulus that has supported local private demand.
Business conditions have been mixed across the Australian economy, reflecting the diverse forces hitting different sectors and regions. Caution in the household sector, reflected in the higher savings ratio and weak credit appetite, is the other major challenge.
8 NATIONAL AUSTRALIA BANK
Report of the DirectorsThe Group is regulated in Australia and the other countries in which it operates. Across these countries, banking and financial services regulation reforms are ongoing. These reforms, and in particular Basel III, will strengthen bank capital requirements and introduce new regulatory requirements on bank liquidity and bank leverage ratios.
Litigation and disputes
On 18 November 2010, Pathway Investments Pty Ltd and Another commenced a class action proceeding against the Group in the Supreme Court of Victoria in relation to the Group’s disclosure about exposure to certain Collateralised Debt Obligations (CDOs). On 9 November 2012, the Group reached an agreement to settle the class action without admission of liability by the Group. The settlement involves a payment of $85 million plus an allowance in respect of interest and costs in full and final settlement of the class action, of which $50 million is comprised of available insurance proceeds with the remainder substantially covered by existing provisions. The settlement of the proceedings is subject to approval of the Supreme Court of Victoria.
On 16 December 2011, Steven Farey and Others commenced a class action proceeding against the Group in relation to the payment of exception fees, along with similar proceedings against several other financial institutions. The quantum of the claim against the Group has not yet been identified in the proceeding. The Group has not been required to file a defence as the proceeding has been stayed until 7 December 2012. The proceeding will be vigorously defended.
Market wide issues relating to the UK banking industry payment protection insurance (PPI) matter are ongoing.
A provision of $168 million (GBP108 million) is held for this matter. The provision reflects an assessment of future PPI claims based upon estimates, statistical analysis and assumptions in relation to a wide range of factors that remain uncertain, including how many PPI claims will be made against Clydesdale Bank PLC, for what value, and the prospects of mis-selling being established in relation to those claims. The final amount required to settle the potential liability is therefore uncertain. The Group continues to keep the matter under review.
On 29 June 2012, the UK Financial Services Authority (FSA) announced that it had reached agreement with a number of UK banks in relation to a review and redress exercise on sales of certain interest rate hedging products to small and medium businesses.
Clydesdale Bank PLC agreed to participate in this exercise, as announced by the FSA on 23 July 2012, and has embarked on a program to identify small and medium sized customers that may have been affected. The exercise voluntarily incorporates certain of the Group’s tailored business loan products as well as the standalone hedging products identified in the FSA’s notice.
The total cost of this exercise is uncertain. A provision of $75 million (GBP48 million) for customer redress including the interest rate hedging review is held and reflects management’s best estimate of this and a number of other ongoing matters as at 30 September 2012.
Credit rating
Ratings agencies regularly conduct review activities. During the year ended 30 September 2012, Standard and Poor’s revised its global bank ratings methodology and Fitch Ratings conducted a broad review of the four major Australian banks in its rating portfolio. As a result of these review processes, Standard and Poor’s downgraded:• the long-term rating of the Company from AA to AA-;• the long-term rating of Bank of New Zealand from AA to AA-;• the long-term rating of Clydesdale Bank PLC from A+ to BBB+;• the short-term rating of Clydesdale Bank PLC from A-1 to A-2; and• the long-term rating of National Wealth Management Holdings
Limited from AA- to A+.
Fitch Ratings also downgraded:• the long-term rating of the Company from AA to AA-;• the long-term rating of Bank of New Zealand from AA to AA-; and• the long-term rating of Clydesdale Bank PLC from A+ to A.
Events subsequent to balance date
The UK Commercial Real Estate (CRE) business, comprising assets with balances before provisions of $8,723 million, was transferred from Clydesdale Bank PLC (Clydesdale) to the Company on 5 October 2012 as part of the UK Banking strategic review.
The portfolio of assets that has been transferred includes the majority of Clydesdale’s CRE exposures, together with some associated loans and other assets, and will be run-off as the assets reach maturity (subject to customers’ ability to refinance or repay). The assets were transferred at book value and proceeds from the transfer were largely used to repay intra-Group funding. Some residual UK CRE assets have been retained by Clydesdale.
Future developments
In the opinion of the directors, discussion or disclosure of any further future developments including the Group’s business strategies and its prospects for future financial years would be likely to result in unreasonable prejudice to the interests of the Group.
Proceedings on behalf of the Company
There are no proceedings brought or intervened in, or applications to bring or intervene in proceedings, on behalf of the Company by a member or other person entitled to do so under section 237 of the Corporations Act 2001 (Cth).
Environmental regulation
The operations of the Group are not subject to any site specific environmental licences or permits which would be considered as particular or significant environmental regulation under laws of the Australian Commonwealth Government or of an Australian state or territory. However, as the Group’s operations at its main Melbourne-based data centre constitute a Scheduled Activity for the purposes of the Environmental Protection (Environment and Resources Efficiency Plan) Regulations 2007 (Vic), the Group is subject to registration, annual reporting and environment and resource efficiency planning requirements under the Environment Protection Act 1970 (Vic). The Group complied with these requirements.
In addition, the Group’s Melbourne-based data centre is subject to the reporting requirements of the National Pollutant Inventory (NPI). The NPI provides a public internet database of emissions and transfers of specified NPI substances from various facilities. The Group is required to report on the volume of energy consumed at its tri-generation facilities operated at the data centre and has complied with this requirement.
The operations of the Group are subject to the Energy Efficiency Opportunities Act 2006 (Cth) (EEO Act) and the National Greenhouse and Energy Reporting Act 2007 (Cth) (NGER Act) as part of the legislative response to climate change in Australia. While this legislation is not particular to the Group or significant in its impact, the Group complied with its requirements. Both the EEO and the NGER Acts require the Group to make assessments and report on the basis of the year from 1 July to 30 June (the environmental reporting year).
During the environmental reporting year to 30 June 2012, the Group continued to implement an energy efficiency program in Australia, including energy efficiency opportunity assessments pursuant to the EEO Act, which helped to produce greenhouse gas emissions savings and contributed to the Group’s carbon neutral status. The environmental reporting year to 30 June 2012 was the first year of the second 5-year assessment cycle under the EEO Act.

2012 Annual Financial Report 9
Report of the DirectorsThe Group’s Australian vehicle fleet and building related net energy use during the 2012 environmental reporting year was 675,228 gigajoules (GJ), which is approximately 59% of the Group’s measured total energy use. During the environmental reporting year to 30 June 2012, the Group carried out over 200 assessments, identifying potential energy savings of 43,963 GJ per annum.
In the first year of the second 5-year cycle of the Energy Efficiency Opportunities (EEO) Program, the Group has assessed energy efficiency opportunities in 12% of the Australian building portfolio by energy use. In total, across both Cycle I and Cycle II of the EEO Program, the Group has identified 943 opportunities, of which 51 are under investigation or have been approved to proceed. If the 51 projects are all implemented, they are expected to result in approximately 36,645 GJ of energy savings per annum. Of the energy efficiency opportunities identified to date, the Group has implemented opportunities equivalent to approximately 263,239 GJ of ongoing savings.
A key energy efficiency project implemented during the 2012 environmental reporting year was a program of works across nine key sites in the commercial property portfolio. Works include a variety of control adjustments, several lighting initiatives and disconnection of surplus equipment. This is expected to result in estimated savings of 2,220 GJ per annum.
More information about the Group’s participation in the EEO Program is available at www.nabgroup.com.
In the United Kingdom, the Group is a participant in the Carbon Reduction Commitment Energy Efficiency (CRC EE) Scheme.
The CRC EE Scheme 2011/12 reporting period (year ending 31st March 2012) is the first reporting period for which there is an obligation to purchase and surrender CRC Allowances in relation to carbon dioxide emissions. The Group’s second regulatory return was made in July 2012 as required by the CRC EE Scheme Order 2010. Additionally, National Australia Group Europe Limited, on behalf of the Group’s UK-based entities, purchased and surrendered 23,314 CRC Allowances by 28 September 2012, equal to the quantity of CRC emissions for energy supplies reported in the Group’s 2011/12 CRC Annual Report, in accordance with CRC EE Scheme requirements.
As a lender, the Group can also incur environmental liabilities arising from the operations of its borrowers and, as a result, it has developed credit policies to ensure that this risk is managed appropriately.
In addition to responding to regulatory requirements, the Group can perform a key role as a global provider of financial products and services in contributing to the environmental sustainability of the communities in which it operates. The Group’s approach to environmental sustainability and management of direct and indirect environmental impacts is outlined in its environmental policy at www.nabgroup.com. Further information on the Group’s environmental management and commitments is outlined in the 2012 Annual Review and the associated Environmental Dig Deeper paper information available at www.nabgroup.com.

10 NATIONAL AUSTRALIA BANK
Report of the DirectorsExecutive performance options and performance rights
Performance options and performance rights are granted by the Company under the National Australia Bank Executive Share Option Plan No. 2 (executive share option plan) and the National Australia Bank Performance Rights Plan (performance rights plan). The executive share option plan was approved by shareholders at the Annual General Meeting (AGM) in January 1997, and the performance rights plan at the 2002 AGM. Each performance option or performance right is for one fully paid ordinary share in the Company. (Refer to the Remuneration report for a description of the key terms and conditions of the executive share option plan and the performance rights plan.)
All performance options and performance rights that have not expired are detailed below.
The number and terms of performance options and performance rights granted by the Company during 2012 over ordinary shares under the executive share option plan and the performance rights plan, including the number of performance options and performance rights exercised during 2012, are shown in the following tables:
Exercise period (1)Exercise
price (2)Number held at
30 September 2012
Number exercised from 1 October 2011
to 30 September 2012Number granted
since 1 October 2011
Performance options14 February 2011 - 14 August 2013 $31.70 256,602 - - 16 January 2012 - 16 July 2014 $19.89 77,379 273,396 - 14 February 2012 - 14 August 2013 $31.70 449,374 - - 16 January 2013 - 16 July 2014 $19.89 350,772 - - 14 February 2013 - 14 August 2013 $31.70 449,374 - - 16 January 2014 - 16 July 2014 $19.89 350,770 - -
Exercise period (1)Exercise
price (2)Number held at
30 September 2012
Number exercised from 1 October 2011
to 30 September 2012Number granted
since 1 October 2011
Performance rights7 February 2010 - 7 August 2012 - - 18,015 - 1 November 2010 - 1 May 2012 - - 1,674 - 7 February 2011 - 7 August 2012 - - 48,814 - 1 November 2011 - 1 May 2012 - - 41,190 - 10 November 2011 - 10 May 2013 - 1,765 33,522 - 16 November 2011 - 16 May 2012 - - 19,929 - 1 December 2011 - 1 May 2012 - - 1,246 - 31 December 2011 - 30 June 2012 - - 325,682 - 1 January 2012 - 1 January 2016 - 4,038 96,931 - 7 February 2012 - 7 August 2012 - - 87,094 - 9 May 2012 - 9 November 2012 - - 6,621 6,621 9 May 2012 - 9 November 2013 - - 3,262 - 10 November 2012 - 10 May 2013 - 37,273 - - 23 November 2012 - 23 May 2014 - 34,611 - 34,611 16 December 2012 - 16 June 2013 - 18,904 278 - 31 December 2012 - 30 June 2013 - 81,575 - - 9 May 2013 - 9 November 2013 - 3,482 - - 23 May 2013 - 23 November 2015 - 7,120 - 7,120 15 June 2013 - 15 December 2013 - 1,166 - - 23 November 2013 - 23 May 2014 - 37,124 - 37,124 15 December 2013 - 15 June 2014 - 114,912 - - 23 May 2014 - 23 November 2015 - 7,638 - 7,638 14 December 2014 - 14 June 2015 - 1,717,368 - 1,779,132 23 May 2015 - 23 November 2015 - 27,171 - 28,189 14 June 2015 - 14 December 2015 - 145,729 - 145,729
(1) Performance options and performance rights generally expire on the last day of their exercise period. Refer to the Remuneration report for details of the relevant expiry dates applicable to performance options and performance rights.
(2) Further details of performance options and performance rights are set out in Note 37 in the Financial report. All shares issued or transferred on exercise of performance options and performance rights are fully paid ordinary shares in the Company. The exercise price for performance options is based on the weighted average price at which the Company’s shares are traded on the ASX during a specified period on a relevant date, usually at or around the date of the grant.

2012 Annual Financial Report 11
Report of the DirectorsPerformance options and performance rights on issue and number exercised
There are currently 1,934,271 performance options and 3,212,912 performance rights which are exercisable, or may become exercisable in the future under the respective plans.
The Company has issued 139 fully paid ordinary shares of the Company since the end of the year as a result of performance options and performance rights granted being exercised for no consideration.
For the period 1 October 2011 to the date of this report, 5,384,712 performance options expired as they were not exercised before their expiry date and 6,818,492 otherwise lapsed before their expiry date. Similarly, during this period 1,070,849 performance rights expired and 1,709,460 performance rights lapsed
Persons holding performance options and performance rights are entitled to participate in certain capital actions by the Company (such as rights issues and bonus issues) in accordance with the terms of the ASX Listing Rules which govern participation in such actions by holders of options granted by listed entities. The terms of the performance options and the performance rights reflect the requirements of the ASX Listing Rules in this regard.
Directors’ attendances at meetings
The table below shows the number of directors’ meetings held (including meetings of Board Committees noted below) and the number of meetings attended by each of the directors of the Company during the year.
Board meetingsAudit Committee
meetingsRisk Committee
meetings
Remuneration Committee meetings
Nomination Committee meetings
Directors’ meetings of controlled
entities (1)Additional meetings (2)
Directors A B A B A B A B A B A B A MA Chaney 13 13 2 2 7 7 7 7 2 2 5 5 -CA Clyne 13 13 1 1 9 9 9 9 - - 22 30 5PA Cross 13 13 1 1 10 10 11 11 2 2 8 10 2DT Gilbert 13 13 - - 8 8 11 11 2 2 5 5 6KR Henry (3) 10 10 6 6 8 9 - - 2 2 5 5 2MA Joiner 12 13 8 8 7 7 - - - - 15 16 8PJ Rizzo 13 13 8 8 10 10 - - 2 2 5 5 2JS Segal 13 13 8 8 10 10 - - 2 2 5 5 5JG Thorn (4) 12 13 8 8 8 8 - - 2 2 5 5 11GA Tomlinson 13 13 - - 7 7 11 11 2 2 59 60 2JA Waller 13 13 8 8 10 10 - - 2 2 31 31 3AKT Yuen 13 13 2 2 10 10 11 11 2 2 5 5 3Former directorGM Williamson (5) 10 12 3 3 5 7 - - 2 2 28 28 -
A Indicates the number of meetings (including meetings of Board Committees) attended during the period.B Indicates the number of directors’ meetings (including meetings of Board Committees) held during the year. Where a director is not a member of the relevant Board Committee, this column reflects the
number of meetings attended.(1) Where a controlled entity holds board meetings in a country other than the country of residence of the director, or where there may be a potential conflict of interest, then the number of meetings held is the
number of meetings the director was expected to attend, which may not be every board meeting held by the controlled entity during the year.(2) Reflects the number of additional formal meetings attended during the year by each director, including committee meetings (other than Audit Committee, Risk Committee, Remuneration Committee or
Nomination Committee) where any two directors are required to form a quorum.(3) Dr Henry was appointed a non-executive director on 1 November 2011.(4) Mr Thorn attended all scheduled Board meetings of the Company. This number reflects an unscheduled Board meeting.(5) Sir Malcolm Williamson retired as a director of the Company on 7 June 2012 and as Chairman of National Australia Group Europe Limited and Clydesdale Bank PLC on 23 July 2012.

12 NATIONAL AUSTRALIA BANK
Report of the DirectorsDirectors’ and executives’ interests
The tables below show the interests of each director and senior executive in the issued ordinary shares and National Income Securities of the Company, and in registered schemes made available by the Group as at the date of this Report. No director or senior executive held an interest in Trust Preferred Securities, Trust Preferred Securities II or National Capital Instruments of the Company.
National Income Securities
Performance options over fully
paid ordinary shares of the
Company (1)
Performance rights over fully
paid ordinary shares of the
Company (1)
Fully paid ordinary shares of the Company
No. No. No. No.
DirectorsMA Chaney (2) - - - 28,373 CA Clyne - 121,448 183,147 674,345 PA Cross (2) - - - 18,645 DT Gilbert (2) 1,253 - - 16,190 KR Henry (3) - - - 2,000 MA Joiner - 211,344 67,663 486,609 PJ Rizzo (2) - - - 5,824 JS Segal (2) 180 - - 14,836 JG Thorn (2) - - - 12,333 GA Tomlinson (2) 350 - - 41,696 JA Waller - - - 4,000 AKT Yuen - - - 5,059 Former directorGM Williamson (4) - - - 9,407
National Income Securities
Performance options over fully
paid ordinary shares of the
Company (1)
Performance rights over fully
paid ordinary shares of the
Company (1)
Fully paid ordinary shares of the Company
No. No. No. No.
Senior executives (5)
LJ Gray - - 67,685 181,011 AP Hagger - - 60,957 182,444 MJ Healey - - 42,215 132,903 JC Healy - - 83,816 381,295 BF Munro - - 51,688 190,384 RJ Sawers - - 81,056 164,515 GR Slater - - 64,681 107,984 AG Thorburn - - 194,341 50,261 DJ Thorburn - - 36,016 18,485 SJ Tucker - - 72,234 104,869
(1) Further details of performance options and performance rights are set out in Note 37 in the Financial report.(2) Includes shares acquired under the Non-Executive Director Share Plan operated through the National Australia Bank Staff Share Ownership Plan.(3) Dr Henry was appointed a non-executive director on 1 November 2011.(4) Sir Malcolm Williamson retired as a non-executive director on 7 June 2012.(5) Senior executives in current employment with the Group as at 30 September 2012 where information on shareholdings is disclosed in Note 47 in the Financial report.
The directors from time-to-time invest in various debentures, registered schemes and securities offered by the Company and certain subsidiaries of the Company. The level of interests held directly and indirectly by a director as at 30 September 2012 were:
Director Nature of product Relevant interest (Units)
DT Gilbert NAB Subordinated Notes 2,000MA Joiner PIC Wholesale Horizon 5 Growth Portfolio 3,436,509JA Waller Perpetual Non-Cumulative Shares in BNZ Income Securities Ltd 250,000
There are no contracts, other than those disclosed in the level of interests held table immediately above, to which directors are a party, or under which the directors are entitled to a benefit and that confer the right to call for, or deliver shares in, debentures of, or interests in, a registered scheme made available by the Company or a related body corporate. All of the directors have disclosed interests in organisations not related to the Group and are to be regarded as interested in any contract or proposed contract that may be made between the Company and any such organisations.
Integrity of reporting
The directors of the Company have a responsibility with respect to the integrity of external reporting. This involves reviewing and monitoring, with the assistance of the Audit Committee and management, the processes, controls and procedures which are in place to maintain the integrity of the Group’s financial statements.
Further details of the role of the Board and its committees can be found in the Corporate governance section and on the Group’s website at www.nabgroup.com.

2012 Annual Financial Report 13
Report of the DirectorsPast employment with external auditor
Ernst & Young has been the Company’s external auditor since 31 January 2005. There is no person who has acted as an officer of the Group during the year who has previously been a partner at Ernst & Young when that firm conducted the Company’s audit.
Non-audit services
Ernst & Young provided non-audit services to the Group during 2012. The fees paid or due and payable to Ernst & Young for these services during the year to 30 September 2012 are as follows:
Group2012
$’000
Audit-related regulatoryGuidance Statements (GS) 007 reports 1,434 APRA reporting 1,420 Audit of the Group’s Australian Financial Services Licenses 304
Regulatory audit, reviews, attestations and assurances for Group entities: - Australia 819 - Offshore 343
Total audit-related regulatory 4,320
Audit-related non-regulatoryAgreed upon procedures on results announcements 79
Other non-regulatory reviews, attestations and assurances for Group entities: - Australia 167 - Offshore 125
Total audit-related non-regulatory 371
All other Controls reviews and related work 778 Other - Australia 61
Total all other 839
Total non-audit services fees 5,530
Ernst & Young also provides audit and non-audit services to non-consolidated trusts of which a Group entity is trustee, manager or responsible entity and to non-consolidated Group superannuation plans. The fees paid or due and payable to Ernst & Young for these services during the year to 30 September 2012 total $2.5 million.
In accordance with advice received from the Audit Committee, the directors are satisfied that the provision of non-audit services during the year to 30 September 2012 by Ernst & Young is compatible with the general standard of independence for auditors imposed by the Corporations Act 2001 (Cth). The directors are so satisfied because the Audit Committee or its delegate has assessed each service, having regard to auditor independence requirements of applicable laws, rules and regulations, and concluded in respect of each non-audit service or type of non-audit service that the provision of that service or type of service would not impair the independence of Ernst & Young.
A description of the Audit Committee’s pre-approval policies and procedures is set out in the Corporate governance section. Details of the services provided by Ernst & Young to the Group during 2012 and the fees paid or due and payable for those services are set out in Note 48 of the Financial report. A copy of Ernst & Young’s independence declaration is set out on the following page.

Liability limited by a scheme approved under Professional Standards Legislation
Auditor’s Independence Declaration to the Directors of National Australia Bank Limited
In relation to our audit of the financial report of National Australia Bank Limited and the entities it controlled during the year for the financial year ended 30 September 2012, to the best of my knowledge and belief, there have been no contraventions of the auditor independence requirements of the Corporations Act 2001 or any applicable code of professional conduct.
Ernst & Young
AJ (Tony) Johnson Partner Melbourne 19 November 2012
14 NATIONAL AUSTRALIA BANK

2012 Annual Financial Report 15
Report of the DirectorsRemuneration report - contentsIntroduction from the Remuneration Committee
Executive summary• Overview of the Group’s approach to performance and reward• Remuneration governance• Linking remuneration and performance for 2012• Five year Group performance• Overview of actual senior executive remuneration
Statutory disclosure for senior executives• Remuneration policy for senior executives• Senior executive remuneration
Statutory disclosure for non-executive directors• Remuneration policy for non-executive directors• Non-executive director remuneration
Other remuneration disclosures
Appendices• Insider trading and derivatives policy• Table of key terms
This Remuneration report has been audited.
16 NATIONAL AUSTRALIA BANK
Report of the DirectorsIntroduction from the Remuneration Committee
Dear Shareholder,
The Remuneration Committee is pleased to present the 2012 Remuneration report.
We recognise the trust our shareholders have placed with us to ensure the Company has robust remuneration practices, and we are grateful for the support we receive from shareholders.
The Remuneration Committee’s overarching objective is to have policies and practices which encourage appropriate behaviours to achieve sustainablefinancialandcustomeroutcomes,whileattractingandretaininghighqualityseniorfinancialservicesexecutives.Duringtheyear,theBoard made a number of decisions in support of this objective, including:• a move to performance conditions for the Executive Long-term incentive (LTI) plan that are based on a relative Total Shareholder Return measure,
removingtheperformanceconditionsrelatingtoGroupcashearningsandReturnonEquity,sothatLTIwillnotvestifshareholdersdonotbenefit;• extensionoftheperformanceperiodfortheExecutiveLTIplanfromthreetofouryears,includingapotentialadditionaltestafterfiveyears,toalign
seniorexecutiverewardwithlongertermsuccessoftheGroup;• changeofShort-termincentive(STI)deferralfromashare-baseddeferraltoarights-baseddeferral;• exercise of its discretion under the terms of the deferred STI arrangements to forfeit some deferred STI held by executives in business segments
thathavenotsustainedperformanceatacceptablelevels;and• nottoincreaseannualfixedremuneration,STItargetorLTIawardfortheGroupChiefExecutiveOfficer(GroupCEO)andExecutiveDirector,
Finance nor to increase non-executive director fees.
We continue to encourage our regulators, shareholders and all of our stakeholders to provide feedback on the development of our remuneration practices, and thank you for your continued support.
Yours sincerely,
Patricia CrossRemuneration Committee Chairman

2012 Annual Financial Report 17
Report of the DirectorsExecutive summary
Overview of the Group’s approach to performance and reward
The Group’s remuneration strategy recognises and rewards performance consistent with general practices within the markets in which the Group operates while being linked to shareholder outcomes. The Group’s remuneration philosophy is underpinned by principles that: • linkemployeerewardstothecreationofshareholdervalue;and• providecompetitivelevelsofremunerationwithinthemarketsinwhichtheGroupoperatestoattractandretainthehighestqualitytalent.
The following changes to the Group’s performance and reward framework have been made during 2012: • changed the Executive LTI plan from a share-based award to a rights-based award for the award granted in December 2011. Participants do not
receive dividends for this award until all performance conditions are met and the rights are exercised. Dividend income will be received by senior executivesforthepreviouslyallocated2008,2009and2010LTIawards;
• the performance hurdles for the 2012 Executive LTI plan are an external measure based on the Company’s Total Shareholder Return (TSR) performance relative to two peer groups comprising:• theS&P/ASXTop50Index;and• aselectionoffinancialservicescompaniesintheS&P/ASX200.
ThesechangeswillmorecloselyalignLTIoutcomeswithshareholdervalue;and• the deferred components of the 2012 STI plan for senior roles will be provided as performance rights instead of shares. Therefore no dividends
will be provided to participants until all performance conditions are met. Dividend income will be received by senior executives for the previously allocated2009,2010and2011deferredSTIawards;and
• the performance period for the 2012 Executive LTI will be extended from three to four years. If any performance rights do not vest at the end of the initialfouryearperformanceperiod,anadditionaltestoftheperformanceconditionsoverfiveyearswilloccurtoreflecttheexpecteduncertaintyoftheglobalfinancemarketsoverthenextfewyears.
The Group’s performance and reward framework delivers superior rewards for individuals who have the highest relative performance. The framework applies to all employees of the Group, including senior executives. The Group’s remuneration structure is based on a total reward methodology consisting of:
Fixed remuneration ExternalbenchmarkingisundertakentoprovidefixedrewardthatiscomparableandcompetitivewithinthemarketsinwhichtheGroupoperates.Individualperformance,skills,expertiseandexperiencearealsousedtodeterminewheretheemployee’sfixedremunerationshouldsitwithinthemarket range.
Short-term incentive (STI) STIrewardsreflectbothindividualandbusinessperformanceforthecurrentyearthroughcomplianceassessment,individualperformancescorecards, behaviour assessment, peer review resulting in a relatively ranked individual performance outcome, and linkages to business outcomes. STIrewardsareprovidedincashandequityandincludeappropriatelevelsofdeferral.TheGroupoperatesarangeofSTIarrangementsthataredesignedtomeettheparticularrequirementsofspecificroles.AllSTIarrangementsincorporatetheabovecomponents.Generally,employeesparticipate in an STI plan once minimum service criteria are met.
Long-term incentive (LTI) LTI rewards are provided to senior employees of the Group. They help to drive management decisions focussed on the long-term prosperity of the Group through the use of challenging multi-year performance hurdles.
More detail on the Group’s performance and reward framework is available at www.nabgroup.com.
Remuneration governance
The Remuneration Committee (the Committee) has been established by the Board. Its Charter (which is approved by the Board) sets out the membership, responsibilities, authority and activities of the Committee. The full Charter is available online at www.nabgroup.com.
The Committee: • reviewsandmakesrecommendationstotheBoardontheremunerationstrategyfortheGroup;• reviews and makes annual recommendations to the Board in relation to the remuneration arrangements and remuneration packages (including
performance measures and targets) for the Group CEO and executive directors, and for other senior executives who report directly to the Group CEO;
• reviewsandmonitorsterminationpoliciesandpaymentsforseniorexecutives;• reviewsandapprovesfeespayabletonon-executivedirectorsofcontrolledentities;• reviewsandmakesannualrecommendationstotheBoardontheremunerationstructureapplicabletoemployeesinrisk,complianceandfinancial
controlroleswithintheGroup;• reviewsandmakesrecommendationstotheBoardonthedesignandimplementationofkeyvariablerewardprograms(includingequity-based
arrangements), the methodology for assessing, determining and adjusting incentive outcomes and ensuring that incentive payments are aligned withshareholderoutcomes;
• approves and makes recommendations to the Board regarding the Group’s annual remuneration report and ensures that remuneration arrangementsforseniorexecutivesaredisclosedinaccordancewithapplicableaccounting,legalandgovernancerequirements;
• supportstheBoardwithmonitoringtheprinciplesandframeworkrequiredformeasuringthecomplianceandbehaviouralrequirementsoftheGroup;and
• reviews and recommends to the Board remuneration policies applicable to non-executive directors of the Company.
Committee members at 30 September 2012 were Mrs Cross (Chairman), Mr Gilbert, Mr Tomlinson and Mr Yuen, all independent non-executive directors. The Committee membership has been consistent since 1 March 2010.

18 NATIONAL AUSTRALIA BANK
Report of the DirectorsThe Remuneration Committee’s approach
The Group operates a global remuneration policy that is reviewed by the Committee and approved by the Board at least annually. The Group’s current remuneration policy was formally established in March 2010.
TheremunerationpolicywasamendedinMarch2011tocapturenewregulatoryrequirementsaffectingtheGroup’sUKoperations.Committeedecisions and recommendations are made as far as practicable to align remuneration with shareholder returns, in accordance with regional regulatoryrequirementsandglobalregulatorytrends.TheCommitteehasestablishedremunerationframeworksinplaceataGroupleveltoassistwithremunerationdecisions.TheCommittee’sremunerationdecisionsarebasedonariskadjustedviewoftheGroup’sfinancialperformancethrough:
Risk assessment – The Group sets and monitors risk through its risk appetite framework.
Performance assurance – TheCommitteereviewsinformationonfinancialandriskperformance,regulatorychangesandmarketpracticestoassistin assessing the overall performance of the Group.
Determining remuneration outcomes – Attheendofeachyear,aformalreportisprovidedtotheCommitteecapturingallriskandfinancialoutcomesandassessingtheoverallhealthofthefinancialresult.ThisinformationisprovidedbytheGroup’sRiskandFinancefunctions.AjointmeetingoftheCommitteeandthePrincipalBoardRiskCommitteeisheldtoreviewthereport’sfindings.TheCommitteehasdiscretiontorecommend to the Board the adjustment of incentive outcomes for the current year and vary vesting of deferred incentives and long-term incentives iftheGroup’sperformancehassignificantlydeterioratedoverthevestingperiod.Inaddition,aqualitativeoverlaymaybeappliedbytheCommitteethatreflectstheGroup’smanagementofbusinessrisks,shareholderexpectationsandthequalityofthefinancialresults.ThePrincipalBoardAuditCommitteeisengagedtoconfirmthatacomprehensiveassuranceprocessisfollowed.
TheCommitteeinvitestheChairmanoftheBoardandmembersofthemanagementteam,includingtheGroupChiefRiskOfficer,toassistinitsdeliberations (except concerning their individual remuneration).
Use of external advisers
The Committee seeks and considers advice directly from external advisers, who are independent of management, where appropriate.
During2012,theCommitteeengagedjwsconsultingtoreviewandproviderecommendationsonthefixedremunerationlevelsforseniorexecutives.Underthetermsofaretainerarrangement,jwsconsultingprovidedremunerationadvicetotheCommittee(inclusiveof‘remunerationrecommendations’asdefinedinsection9BoftheCorporations Act2001(Cth))forafeeof$30,000(excludingGST)forservicesoverafivemonthperiod. As at 30 September 2012, $12,000 (excluding GST) of fees had been paid. In addition, the Committee engaged jws consulting in October 2011 to provide governance advice and the fees paid for these services were $13,510 (excluding GST).
The Committee established protocols for engaging with jws consulting to support compliance with the Corporations Act 2001 (Cth). These protocolsarereflectedinthetermsofengagementandhavebeenadheredto.jwsconsultingprovidedaformaldeclarationconfirmingthattherecommendationsprovidedwerefreefrom‘undueinfluence’bytheseniorexecutivestowhomtherecommendationsrelated.Onthisbasis,theBoardissatisfiedthattherecommendationsweremadefreefromundueinfluencebytheseniorexecutivestowhomtherecommendationsrelated.
Duringtheperiodto1July2012,thelawfirmofJohnsonWinter&Slattery,whichisanassociatedbusinessofjwsconsulting,providedinsolvencyand recoveries, commercial litigation and corporate and business lending legal services to the Company in South Australia. The total fees paid for these other services during 2012 were $120,706 (excluding GST).

2012 Annual Financial Report 19
Report of the DirectorsLinking remuneration and performance for 2012
TheGroup’sresultsforthe2012financialyearreflectcontinuedprogressagainsttheGroup’sstrategicagendaandfurtherpositivedifferentiationofthe Group from peers through the Company’s customer proposition.
2012 STI outcomes
AsignificantcomponentofseniorexecutiveSTIpaymentsisdeterminedbytheGroupSTIpoolresult.TheGroupSTIpoolisbasedontheGroup’sachievementofthreeperformancemeasures-cashearnings,ReturnonEquity(ROE)andReturnonTotalAllocatedEquity(ROTAE).TheBoardselectedthesemeasurestoprovideabalancebetweengrowthandreturn,andtoadequatelycapturetheGroup’skeyrisks.Definitionsforthesemeasures are provided in the Table of key terms.
TheSTIpoolisadjustedtoreflecttheGroup’smanagementofbusinessrisks,thequalityoftheGroup’sfinancialresultsandanyotherqualitativefactors that the Board considers has impacted on the overall performance of the Group. Senior executives’ actual STI is further adjusted to account for their individual performance outcomes during 2012.
Individual senior executive performance is assessed against a number of key measures supporting the Group’s strategy and business objectives. Measures and targets are tailored to the individual’s role. The following table details some of the key measures used in 2012 to assess individual performance outcomes:
Key Business Driver Measure (1) 2012 AchievementsFinancial and risk management Group cash earnings
ROE ROTAE Tier 1 ratio Risk appetite
•Groupcashearnings(2) of $5,433 million for 2012 year decreased by $27 million or 0.5% against 2011. Excluding the $250 million ($175 million post tax) uplift to the economic cycle adjustment, cash earnings increased by $148 million or 2.7%. This was largely driven by higher earnings in Wholesale Banking, PersonalBankingandNZBanking,partiallyoffsetbysignificantlylowerearningsinUKBankingasaresultof higher charges for bad and doubtful debts. •GroupcashROEdecreasedby100basispointsto14.2%duetolowerearnings,coupledwithhigherlevelsof capital being held as the Group continues its transition to Basel III. •ROTAEwasbelowbudget. •TheTier1capitalratiohasincreasedby57bpsto10.27%,consistentwiththeGroupobjectiveofmaintaining a strong capital position. •Maintainedsoundcapital,fundingandliquiditypositions. •AdherencetoriskappetiteacrosstheGroupandstrongriskculture.
Strategic projects and process quality
Technology and process transformation Cross sell
•Severalkeymilestonesachievedinthemulti-yearproject,includinglaunchofnabtrade. •Crossselltargetsmet.
Employees and culture Employee engagement Diversity targets
•Stronggainsinemployeeengagement,placingtheGroupabovethefinancialservicesaverage.(3) •Ontracktomeetdiversitytargets(formoredetailsseetheDiversitysection).
Customer and community Customer satisfaction Corporate responsibility objectives
•AchievedthehighestbankcustomersatisfactionscoreofthefourmajorAustralianbankssincethecustomer satisfaction survey began. (4) •MaintainedorimprovedcustomersatisfactionacrossallAustralianbusinesssegments.(5) •Improvedoutcomesonmajorityofcorporateresponsibilitymeasures(formoredetailsseetheCompany’s2012 Annual Review available at www.nabgroup.com).
(1) Refer to the Table of key terms for definitions of cash earnings, ROE and ROTAE and to the Glossary for a definition of Tier 1 ratio.(2) Refer to the Financial report for statutory net profit attributable to owners of the Company, and to Note 2 of the Financial report for a reconciliation between cash earnings and statutory net profit attributable
to owners of the Company.(3) May 2012, measured though an annual employee survey conducted by external consultants (Hay Group).(4) August 2012, Roy Morgan Research Customer Satisfaction Report. NAB compared with ANZ, CBA and WBC.(5) DBM Business Financial Services Monitor April 2009 to September 2012, six month rolling averages.
The following graph shows the average of the individual total STI payments (including cash and deferred amounts) as a percentage of each individual’sSTI(where100%isthetarget)fortheseniorexecutives,anditsrelationshiptotheGroup’scashearningsoverthelastfiveyears.TheaverageindividualSTIpaymentreflectsbothbusinessandindividualperformance:
60%
80%
100%
120%
140%
160%
180%
200%
0
1,000
2,000
3,000
4,000
5,000
6,000
2008 2009 2010 2011 2012
Gro
up C
ash
Earn
ings
($m
)
Perc
enta
ge o
f tar
get S
TIpa
id/p
ayab
le to
sen
ior
exec
utiv
es
Cash earnings Average STI Payment (as % of target STI)
The average STI payments in the graph include the senior executives in each of those years. The 2012 average in the graph is based on the total STI payable (including deferred components) for each of the 2012 senior executives.

20 NATIONAL AUSTRALIA BANK
Report of the Directors2012 LTI outcomes
During 2012 a number of LTI grants were tested with the following outcomes:
Grant Securities Grant Date Test Date Result (1) Tranche
Previously Vested
%
Previously lapsed
%
Vested in 2012
%
Lapsed in 2012
%Remaining (2)
%
2004 Long-term incentive
Options & Rights
16/01/2004 15/10/2011 TSR 40th percentile - ASX50 1 - - - 100 -
2008 Long-term incentive
Shares or Rights
31/12/2008 31/12/2011 TBR target met 1 - - 100 - -
2009 CEO Long-term incentive
Rights 18/06/2009 1/01/2012 TSR 72nd percentile - Financials 1 - - 96 - 4
2009 Executive Long-term incentive (3)
Options 16/01/2009 16/01/2012 TSR 74th percentile - ASX50 TSR 72nd percentile - Financials
1 - - 92.2 - 7.8
2007 Executive Long-term incentive and Commencement Award (4)
Options & Rights
7/02/2007 3/08/2007
28/08/2007
7/02/2012 TSR 46th percentile - ASX50 TSR 63rd percentile Financials
1 21.4 78.6 - - -
2 21.4 - 11.7 66.9 -
3 - - 33.1 66.9 -
2007 Commencement Award (5)
Options 28/08/2007 7/02/2012 TSR 46th percentile - ASX50 TSR 63rd percentile Financials
1 21.4 78.6 - - -
2 21.4 - 11.7 66.9 -
3 - - 33.1 66.9 -
2007 Long-term incentive
Options & Rights
7/02/2007 7/02/2012 TBR target not met 1 - 100 - - -
2, 3 - - - 100 -
2008 Executive Long-term incentive (6)
Options 14/02/2008 14/02/2012 TSR 58th percentile - ASX50 TSR 61st percentile Financials
1 20.1 - 37 42.9 -
2 - - 57.1 - 42.9
(1) Refer to the Table of key terms for definitions of TSR and TBR.(2) Amounts shown indicate the unvested portion of the tranche which is subject to further testing.(3) The performance options have delivered actual value to participants because they have an exercise price of $19.89 (meaning they are ‘in-the-money’). The award consists of three tranches subject to testing
in future years.(4) Half the award was provided as performance options with an exercise price of $40.91 which have delivered no actual value to participants (meaning they are ‘out-of-the-money’) prior to the expiry date of 7
August 2012. The other half was provided as performance rights which have delivered value to participants because they have no exercise price. Mr Joiner received a late allocation of this grant on 3 August 2007. Mr Healy received an allocation of this grant on 28 August 2007 as a Commencement offer. The securities were issued in three tranches. Tranche 1 tested at the end of year 3 with a re-test in year 4. Tranche 2 tested at the end of year 4 with a re-test in year 5. Tranche 3 tested in year 5 only.
(5) Mr Joiner received a Commencement grant on 28 August 2007. The award was provided as performance options with an exercise price of $39.25 which have delivered no actual value (meaning they are ‘out-of-the-money’) prior to the expiry date of 7 August 2012. The securities were issued in three tranches. Tranche 1 tested at the end of year 3 with a re-test in year 4. Tranche 2 tested at the end of year 4 with a re-test in year 5. Tranche 3 tested in year 5 only.
(6) The award was provided as performance options with an exercise price of $31.70 which to date has delivered no actual value to participants (meaning they are currently ‘out-of-the-money’). The award consists of three tranches. Tranche 2 has one further test on 14 February 2013. Tranche 3 will be tested once only on 14 February 2013.
Further details on the LTI outcomes are provided in the Value of previous LTI awards section.
Five year Group performanceThefollowingtableshowstheGroup’sannualperformanceoverthelastfiveyears.ThetableshowstheimpactofGroupperformanceonshareholdervalue, taking into account dividend payments, share price changes and other capital adjustments during the period.
2012 2011 2010 2009 2008
Basic earnings per share (cents) 175.3 233.6 191.8 123.4 262.7Cash earnings $5,433m $5,460m $4,581m $3,841m $3,916mDividends paid per share $1.78 $1.62 $1.47 $1.70 $1.92Company share price at start of year $22.37 $25.34 $30.76 $24.26 $39.71Company share price at end of year $25.49 $22.37 $25.34 $30.76 $24.26Absolute TSR for the year 22.4% (5.7%) (13.3%) 34.6% (35.2%)
The Group’s total performance-based compensation expenditure is 9.3% of Group cash earnings for 2012:
2012 2011 2010 2009 2008
Performance-based compensation (1) $506m $506m $699m $643m $573mCash earnings $5,433m $5,460m $4,581m $3,841m $3,916mPerformance-based compensation as a % of cash earnings 9.3% 9.3% 15.3% 16.7% 14.6%
(1) Determined in line with Australian Accounting Standards.
The Table of key termscontainsadefinitionofcashearningsandNote 8 of the Financial report details the calculation of basic earnings per share. Refer to the Financial reportfordetailsofstatutorynetprofitattributabletoownersoftheCompany,andtoNote 2 of the Financial report for a reconciliationbetweencashearningsandstatutorynetprofitattributabletoownersoftheCompany.
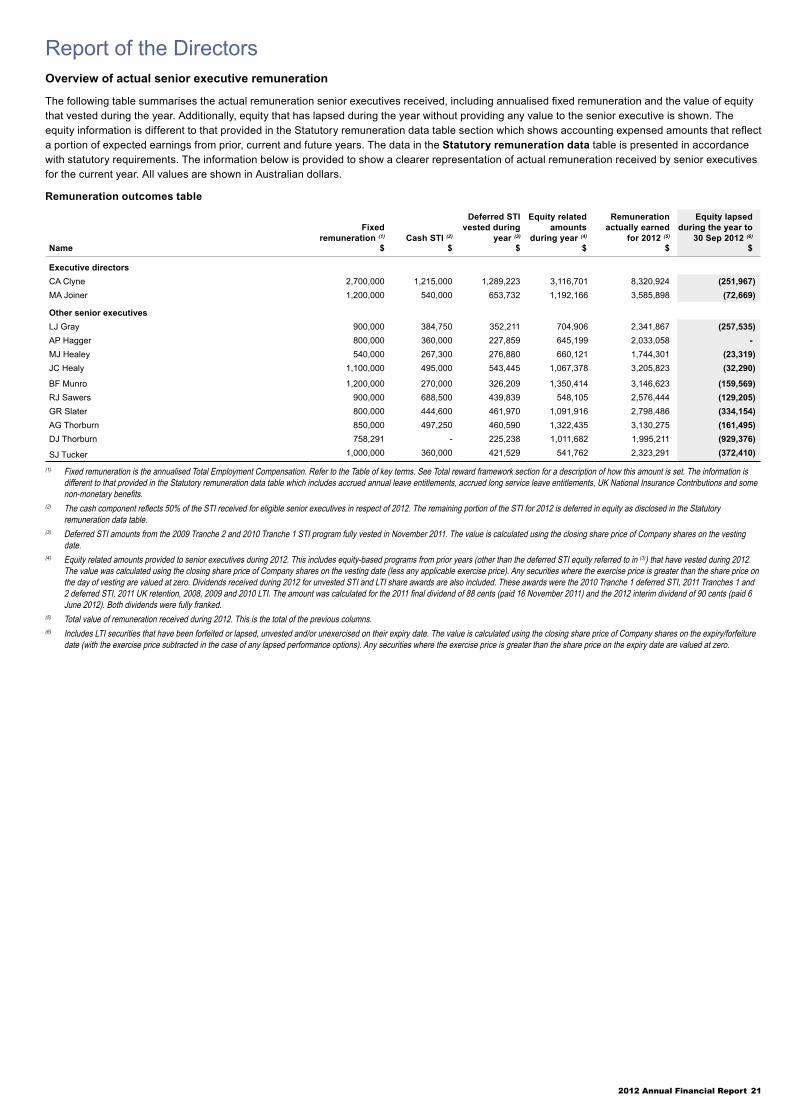
2012 Annual Financial Report 21
Report of the DirectorsOverview of actual senior executive remuneration
Thefollowingtablesummarisestheactualremunerationseniorexecutivesreceived,includingannualisedfixedremunerationandthevalueofequitythatvestedduringtheyear.Additionally,equitythathaslapsedduringtheyearwithoutprovidinganyvaluetotheseniorexecutiveisshown.TheequityinformationisdifferenttothatprovidedintheStatutoryremunerationdatatablesectionwhichshowsaccountingexpensedamountsthatreflecta portion of expected earnings from prior, current and future years. The data in the Statutory remuneration data table is presented in accordance withstatutoryrequirements.Theinformationbelowisprovidedtoshowaclearerrepresentationofactualremunerationreceivedbyseniorexecutivesfor the current year. All values are shown in Australian dollars.
Remuneration outcomes table
Fixed remuneration (1) Cash STI (2)
Deferred STI vested during
year (3)
Equity related amounts
during year (4)
Remuneration actually earned
for 2012 (5)
Equity lapsed during the year to
30 Sep 2012 (6)
Name $ $ $ $ $ $
Executive directorsCA Clyne 2,700,000 1,215,000 1,289,223 3,116,701 8,320,924 (251,967)MA Joiner 1,200,000 540,000 653,732 1,192,166 3,585,898 (72,669)
Other senior executivesLJ Gray 900,000 384,750 352,211 704,906 2,341,867 (257,535)AP Hagger 800,000 360,000 227,859 645,199 2,033,058 - MJ Healey 540,000 267,300 276,880 660,121 1,744,301 (23,319)JC Healy 1,100,000 495,000 543,445 1,067,378 3,205,823 (32,290)
BF Munro 1,200,000 270,000 326,209 1,350,414 3,146,623 (159,569)RJ Sawers 900,000 688,500 439,839 548,105 2,576,444 (129,205)GR Slater 800,000 444,600 461,970 1,091,916 2,798,486 (334,154)AG Thorburn 850,000 497,250 460,590 1,322,435 3,130,275 (161,495)DJ Thorburn 758,291 - 225,238 1,011,682 1,995,211 (929,376)
SJ Tucker 1,000,000 360,000 421,529 541,762 2,323,291 (372,410)
(1) Fixed remuneration is the annualised Total Employment Compensation. Refer to the Table of key terms. See Total reward framework section for a description of how this amount is set. The information is different to that provided in the Statutory remuneration data table which includes accrued annual leave entitlements, accrued long service leave entitlements, UK National Insurance Contributions and some non-monetary benefits.
(2) The cash component reflects 50% of the STI received for eligible senior executives in respect of 2012. The remaining portion of the STI for 2012 is deferred in equity as disclosed in the Statutory remuneration data table.
(3) Deferred STI amounts from the 2009 Tranche 2 and 2010 Tranche 1 STI program fully vested in November 2011. The value is calculated using the closing share price of Company shares on the vesting date.
(4) Equity related amounts provided to senior executives during 2012. This includes equity-based programs from prior years (other than the deferred STI equity referred to in (3)) that have vested during 2012. The value was calculated using the closing share price of Company shares on the vesting date (less any applicable exercise price). Any securities where the exercise price is greater than the share price on the day of vesting are valued at zero. Dividends received during 2012 for unvested STI and LTI share awards are also included. These awards were the 2010 Tranche 1 deferred STI, 2011 Tranches 1 and 2 deferred STI, 2011 UK retention, 2008, 2009 and 2010 LTI. The amount was calculated for the 2011 final dividend of 88 cents (paid 16 November 2011) and the 2012 interim dividend of 90 cents (paid 6 June 2012). Both dividends were fully franked.
(5) Total value of remuneration received during 2012. This is the total of the previous columns.(6) Includes LTI securities that have been forfeited or lapsed, unvested and/or unexercised on their expiry date. The value is calculated using the closing share price of Company shares on the expiry/forfeiture
date (with the exercise price subtracted in the case of any lapsed performance options). Any securities where the exercise price is greater than the share price on the expiry date are valued at zero.

22 NATIONAL AUSTRALIA BANK
Report of the DirectorsStatutory disclosure for senior executives
Remuneration policy for senior executives
The following section describes the remuneration policy for senior executives and how the remuneration of each senior executive is determined by the performance of both the Group and the individual. These individuals are Key Management Personnel (KMP) for the 2012 financial year as defined in the Table of key terms and are listed in the Remuneration outcomes table.
Total reward framework
The Group’s remuneration policy uses a range of components to focus senior executives on achieving the Group’s strategy and business objectives. The Group’s overall philosophy is to adopt, where possible, a total reward methodology which links remuneration directly to the performance and behaviour of an individual and the Group’s results, and provides competitive levels of remuneration to attract and retain high quality talent.
The total reward framework is designed to: • reward those who deliver the highest relative performance through
the Group’s annual STI program; • attract, recognise, motivate and retain high performers; • provide competitive, fair and consistent rewards, benefits and
conditions within an integrated global strategy; and • align the interests of senior executives and shareholders through
ownership of Company securities.
In setting an individual’s target total reward the Board considers: • input from the Group CEO on the target total reward for senior
executives who report directly to the Group CEO;• market data from comparable roles in the Australian Securities
Exchange (ASX) 25 financial services firms or ASX 50 companies where the first peer group does not provide sufficient data. The peer group chosen contains the Company’s major competitors and is large enough to provide meaningful market data information;
• comparable roles at the Group’s direct competitors in Australia and overseas where appropriate;
• individual and Group performance over the last year; • internal relativities; and • general remuneration market environment and trends.
Each individual’s actual remuneration will reflect: • the degree of individual achievement in meeting performance
measures under the performance management framework; • parameters approved by the Board (such as the size of the STI
pool) based on the Group’s financial and risk performance and other qualitative factors;
• the Company’s share price performance and relative shareholder returns; and
• the timing and level of deferral.
Performance management framework
The Group’s performance management framework is briefly described in the Executive summary and is set out in detail at www.nabgroup.com.
The performance management framework for senior executives includes: • meeting the compliance requirements expected for their role; • setting corporate key performance measures as part of the Group’s
strategy development process, which cascade to scorecard measures for each senior executive;
• assessment of Enterprise Behaviours (as described in the Table of key terms) expected from each senior executive; and
• a peer review process where the Group CEO compares and calibrates the performance of his collective Group reports.
Each scorecard has four key business drivers. For 2012 these were:
• financial and risk management; • strategic projects and process quality; • employees and culture; and • customer and community.
The measures under each business driver are selected for their alignment to the Group’s strategic direction. Through the scorecard approach and the subsequent peer review, the STI program is structured to reward the highest achievers against key individual, business and Group performance outcomes.
The key measures and achievements for 2012 are described within the 2012 STI outcomes section.
Components of total reward
The performance framework delivers higher rewards for individuals who have the highest relative performance by providing them with: • fixed remuneration levels, STI targets and LTI awards, generally set
higher in the market range; • a greater STI individual multiple; and • an LTI reward.
Collectively, these components drive higher total reward for the highest performers.
Target reward mix
An appropriate target reward mix is determined with ‘at risk’ rewards increasing with the level of responsibility and the influence of the individual’s role. Target reward includes fixed remuneration, STI and LTI. The target reward mix for the 2012 year is:
Target reward mix for 2012
Group Chief Executive
Officer %
Group Chief Risk Officer
%
Other Senior Executives
%
Fixed remuneration (1) 33.3 50 35STI (50% Cash) 16.7 12.5 17.5STI (50% Deferred) 16.7 12.5 17.5LTI (100% Deferred) 33.3 25 30
Total 100 100 100
(1) Mr D Thorburn’s fixed remuneration is base salary only.
Actual reward mix will vary depending on the achievement of individual and business performance under the STI and LTI programs. The actual reward mix for 2012 for each senior executive is shown in the Performance related remuneration table.
Fixed remuneration
Fixed remuneration is generally reviewed annually. The Group targets median fixed remuneration for each position within the financial services industry in the relevant global markets in which it operates. A range of 80% to 120% is set around those market positions, with the upper half of the range limited to exceptional performers. Individual performance, skills, expertise, and experience are used to determine where the employee’s fixed remuneration should sit within the market range.
Short-term incentive
STI targets and performance measures for senior executives are determined by the Board.
An STI target is set for each individual as shown in the Target reward mix table, with reference to external relativities (set between the median and upper quartile of the relevant market) and internal relativities.
Actual STI rewards reflect both individual and business performance. An individual’s actual STI reward for the performance year is their STI target multiplied by their individual STI multiple and by the Group STI multiple
2012 Annual Financial Report 23
Report of the Directors(as described below). In this way, STI rewards reflect both individual and business performance.
The impact of individual performance on STI rewards
The Board assesses the performance of senior executives against their scorecards of key performance measures and demonstration of Enterprise Behaviours, taking into account input from the Group CEO on senior executives reporting to him, and assigns an overall performance outcome.
An individual STI multiple of between 0 and 2 is awarded based on the individual’s overall performance outcome. Only the most outstanding performers may receive an individual STI multiple of 2 times their STI target. An employee would receive an individual STI multiple of 0 if their performance is demonstrably below scorecard targets and/or their behaviour falls short of Enterprise Behaviour expectations. The total STI reward paid to all employees is limited to the size of the funded STI pool.
The impact of business performance on STI rewards
The Group’s annual business plan (set as part of the Group’s longer-term strategy) and the associated STI pool measures and targets are approved by the Board. At the end of the performance period, the Committee, in consultation with the Principal Board Risk Committee, recommends to the Principal Board the size of the STI pool (i.e. the business STI multiple), taking into account a qualitative overlay that reflects the Group’s management of business risks, shareholder expectations and the quality of the financial results.
For 2012, the financial performance of the Group for the purposes of calculating the STI pool is determined by a mix of growth in cash earnings, ROE and ROTAE. These measures reasonably capture the effects of a number of material risks and minimise actions that promote short-term results at the expense of longer-term business growth and success.
The business STI multiple can range from 0 up to 1.3 for exceptional business performance.
STI risk adjustment
STI reward outcomes can be adjusted for risk at a number of levels:
Individual scorecards – Senior executives will have specific risk related measures relevant to their role included in their scorecard. Their performance against these measures is captured through the senior executive’s individual STI multiple.
Compliance Gateway – Senior executives who do not pass the compliance expectations of their role will have their STI reduced in part or in full depending on the severity of the breach.
STI pool measures – The financial measures used to determine the STI pool capture a number of material risks.
Risk adjustment of business outcomes – The Committee may recommend to the Board adjustment of the financial outcomes upon which STI rewards are determined based on a qualitative overlay that reflects the Group’s management of business risks, shareholder expectations and the quality of the financial results.
STI deferral and vesting
Senior executives will have half (60% for UK senior executives) of their STI reward deferred in the form of performance rights (subject to jurisdictional legal or tax reasons and any required shareholder approval for executive directors). Half of the performance rights will be restricted from being exercised and subject to lapsing and performance conditions for 12 months following grant, and the remaining half for 24 months. In the UK, the period of deferral may be extended to 36 months to meet minimum regulatory deferral and vesting requirements for individual senior executives.
The remainder of the STI reward will be provided in the form of cash, except for UK senior executives and other UK senior managers. UK
senior executives and senior managers will receive half in the form of Company shares (restricted from trading for six months and subject to forfeiture if the senior executive fails the Compliance Gateway) and the other half provided in the form of cash.
The performance rights will be restricted from being exercised and subject to lapsing and performance conditions during the deferral periods. The Board may, in its absolute discretion, and subject to compliance with the law, determine that the deferred STI performance rights be fully or partially lapsed during the deferral periods. In exercising its discretion, the Board can consider whether the rewards are appropriate given later individual or business performance. The Committee, in consultation with the Principal Board Risk Committee, will review on an annual basis the appropriateness of releasing deferred STI equity. At that time, the Group’s Risk and Finance functions will advise the Committee of any known risk or business performance issues that are likely to have materially impacted the financial soundness of the Group. The Committee may, taking into account all relevant information, recommend to the Board the full or partial lapsing of any deferred STI equity for senior executives. The Committee may recommend to the Board the full or partial lapsing of any deferred STI equity for any employees across the Group, by division, by role and/or individual, depending on circumstances.
Senior executives do not receive dividends on deferred STI performance rights during the deferral period.
The terms and forfeiture conditions of the deferred STI equity are set out in the Table of key terms. The Committee believes the restrictions and lapsing conditions on the equity instil an appropriate focus on business performance beyond the current year, allow for alignment with risk outcomes, support consistent achievement of targets, and encourage an appropriate level of shareholding by senior executives.
Individuals located in Australia may also express a preference to be provided a portion of their cash STI reward in superannuation contributions.
STI awards for senior executives for 2012
The graph in the 2012 STI outcomes section shows the average STI payment (including cash and deferred components) for senior executives for 2012. The Performance related remuneration table provides further details on the STI payments and the form and timing of payment.
Long-term incentive
LTI rewards help to drive management decisions concerning the long-term prosperity of the Group through the use of challenging performance hurdles. The hurdles are measured over no less than a three year period, and may combine internal and external performance measures.
An LTI award is set annually for each individual based on external market and internal relativities in line with the Target reward mix table.
The impact of individual performance on LTI rewards
An individual must pass threshold performance requirements and the Compliance Gateway to be eligible for any award of LTI.
The impact of business performance on LTI rewards
LTI programs reward both internal and/or external performance. Internal hurdles track the Group’s financial performance against key measures within the Group’s business plan (such as cash earnings and ROE) approved by the Board. External hurdles compare the Company’s relative TSR over a three to eight year period (depending on the grant) against that of the Company’s competitors.
LTI awards for senior executives for 2012
The Performance related remuneration table shows the LTI value which will be granted for 2012 (in the column headed: ‘LTI opportunity for 2012’).

24 NATIONAL AUSTRALIA BANK
Report of the DirectorsDelivery and deferral of LTI award
For 2012, the whole of the value of LTI award for senior executives will be provided in the form of performance rights. The LTI performance rights are restricted for four years and cannot be exercised during this period. The terms and lapsing conditions of the performance rights are set out in the Table of key terms. These terms include conditions relating to lapsing if the performance hurdles are not met, as described below.
In the UK, a further six month retention period will apply to the whole of any vested LTI performance rights. During the retention period the LTI performance rights are restricted from trading and cannot be exercised during this period. The LTI performance rights are subject to lapsing if the senior executive fails the Compliance Gateway during the retention period.
Performance hurdles for 2012 LTI award
The performance hurdles for 2012 are an external measure, initially assessed over a four year performance period from 12 November 2012 to 12 November 2016 (Test One Performance Period). If any performance rights do not vest upon testing at the end of the Test One Performance Period, those performance rights will be assessed again over a five year performance period from 12 November 2012 to 12 November 2017 (Test Two Performance Period).
The performance hurdles measure the Company’s relative Total Shareholder Return (TSR) performance against two different peer groups over the performance period. In respect of half of the grant value (Tranche 1), the performance hurdle is the Company’s TSR performance relative to the TSR performance of each company in the S&P/ASX Top 50 Index (which comprises the 50 largest companies by market capitalisation in Australia) as at 1 October 2012. For the other half of the grant value (Tranche 2), the performance hurdle is the Company’s TSR performance relative to the TSR performance of a selection of financial services companies in the S&P/ASX 200 (which can be found at www.nabgroup.com). There is no substitution for de-listed companies during the performance period.
For the purposes of calculating TSR for the relevant performance period, the value of the relevant shares on the start date and the end date of the relevant performance period is based on the volume weighted average price of those shares over the 30 trading days up to and including the relevant date. This approach avoids the impact of short-term share price fluctuations.
The Company’s TSR at the end of the Test One Performance Period is then compared to the TSR for each of the companies in the peer group relevant to the tranche. The Company’s ranking compared to the peer groups in a tranche will determine the proportion of performance rights that will vest for that tranche. Vesting will be determined on a straight line scale from 50% of the performance rights vesting at median (that is, 50th percentile) TSR performance, up to 100% of the performance rights vesting at 75th percentile TSR performance.
Any performance rights that have not vested at the end of the Test One Performance Period will not lapse. Instead they will be subject to an additional test after a further 12 months when the Company’s TSR at the end of the Test Two Performance Period is then compared to the TSR for each of the companies in the peer group relevant to the tranche. If there is an increase in TSR performance from the first test to the second test, then vesting will be determined on a straight line scale from 50% of the performance rights vesting at median (that is, 50th percentile) TSR performance, up to 100% of the performance rights vesting at 75th percentile TSR performance (taking into account any performance rights which vested on the first test date). Any performance rights that do not vest following the second test will lapse.
The directors strongly support the single additional testing of the LTI performance rights because the performance hurdles are relative TSR. Given the cumulative nature of relative TSR, in order for any additional
performance rights to vest on the later test date, the Company has to achieve stronger performance in the final year.
The Board will assess TSR performance in its absolute discretion.
Senior executives do not receive dividends on LTI performance rights during the performance period.
Value of previous LTI awards
The LTI performance hurdles are designed to deliver rewards to employees consistent with returns to shareholders when compared to returns delivered by the Group’s competitors. A full description of the LTI instruments which are currently held by senior executives, and the relevant hurdles, is set out in the Summary of prior LTI grants section.
The remuneration data shown in the Statutory remuneration data table includes the accounting value of the LTI awards that each individual holds.
Details of previous LTI awards that have delivered value to senior executives during 2012 are provided in the 2012 LTI outcomes table. No other LTI awards have delivered any value to current senior executives during 2012, other than dividends received on any 2008, 2009 and 2010 LTI shares. Previous LTI awards to several of the senior executives have lapsed (unvested and unexercised) during the year, as shown in the 2012 LTI outcomes table. This is due to the performance hurdles not being achieved.
Full details of all equity granted, vested and lapsed during 2012 for each senior executive is provided in the Value of shares, performance options and performance rights table.
Commencement and retention programs
Commencement awards for senior executives are only entered into with the recommendation of the Committee and approval of the Board. These enable buy-out of unvested equity from previous employment. The amount, timing and performance hurdles relevant to any such awards must be based on satisfactory evidence. The awards are primarily provided in the form of shares, performance options or performance rights, subject to performance hurdles, restrictions and certain forfeiture conditions, including forfeiture on resignation, unique to each offer. No commencement awards have been provided to any senior executives since 2008.
The Group’s Remuneration Policy does not provide for discretionary sign-on bonuses to any employees.
The Group provides retention awards for key individuals in roles where retention is critical over a medium-term timeframe (two to three years). These are normally provided in the form of shares subject to a restriction period, achievement of individual performance standards and forfeiture conditions, including forfeiture on resignation. No retention awards were provided to senior executives during 2012.
Guaranteed incentives
Guaranteed incentives or bonuses do not support the Group’s performance-based culture and are not provided as part of the Group’s Remuneration Policy.
UK retention
From 2011, UK-based senior executives will have a further retention period applying to a minimum of 40% of any ‘at risk’ reward after the initial performance conditions have been met. This includes STI and LTI rewards provided in the form of cash and Company equity. The portion of ‘at risk’ reward subject to retention is provided as Company equity and restricted from trading for six months. No further performance conditions apply to the retention equity. However, the equity will be forfeited if the senior executive fails the Compliance Gateway during the retention period. No forfeiture conditions apply to grants made from 2012.

2012 Annual Financial Report 25
Report of the DirectorsSenior executive remuneration
This section of the Remuneration report details information for executive Key Management Personnel (KMP) of both the Company and of the Group during the 2012 financial year. Senior executives describes both current and other executive KMP.
Current executive KMP on 30 September 2012
Members of the Group Executive Committee on 30 September 2012 (current executive KMP) were:
• Mr Clyne and Mr Joiner, executive directors, who were also executive KMP for the year to 30 September 2011; and• other senior executives, as listed in the table below, who were also executive KMP for the year to 30 September 2011.
Mr D Thorburn has agreed to step down from the Group Executive Committee to allow him to focus on executing the restructure of the Group’s UK Banking operations announced in April 2012. Mr D Thorburn continues to report to Mr Clyne as Group CEO and Chairman of the National Australia Group Europe board.
Contractual arrangements
The following table shows the position and contract terms for all senior executives:
Executive directors Position
Term of agreement/ contract and date
commenced if during the year
Termination arrangements (1)
Notice period (weeks)Termination payment (2)Employee Company
Senior executives for the year ended 30 September 2012
Executive directorsCA Clyne Executive Director, Group Chief Executive Officer No fixed term 52 52 2,700,000MA Joiner Executive Director, Finance No fixed term 13 52 1,200,000
Other senior executivesLJ Gray Group Executive, Personal Banking No fixed term 13 26 409,091AP Hagger Group Executive, People, Marketing and Communications No fixed term 13 26 363,636MJ Healey Group Executive, Group Governance and Legal No fixed term 8 26 245,455JC Healy Group Executive, Business Banking No fixed term 26 52 1,000,000BF Munro Group Chief Risk Officer No fixed term 13 52 1,200,000RJ Sawers Group Executive, Wholesale Banking No fixed term 26 52 818,182GR Slater Group Executive, Group Business Services No fixed term 13 65 1,000,000AG Thorburn Group Executive, New Zealand and the United States No fixed term 13 52 850,000DJ Thorburn Group Executive, United Kingdom No fixed term 13 26 306,380SJ Tucker Group Executive, NAB Wealth No fixed term 13 26 454,545
(1) Employment may be terminated by either the senior executive or the Company giving the applicable notice.(2) Calculated as the Company notice period multiplied by either the current Total Employment Compensation (TEC) or Total Remuneration Package (TRP) as defined in the Table of key terms. These are paid,
subject to law, if the Company terminates the senior executive’s employment agreement on notice and without cause, and makes payment in lieu of notice. Termination payments are not generally paid on resignation, summary termination or unsatisfactory performance, although the Board may determine exceptions to this. The retention or forfeiture of shares, performance options and performance rights on cessation of employment depends on applicable law and the terms and conditions of each grant including Board discretion. The amount shown is the termination payment payable, based on the senior executive’s current TEC or TRP if the Company were to give notice. The value does not include any value for equity holdings which may be retained, or other statutory payments that would be payable on termination.
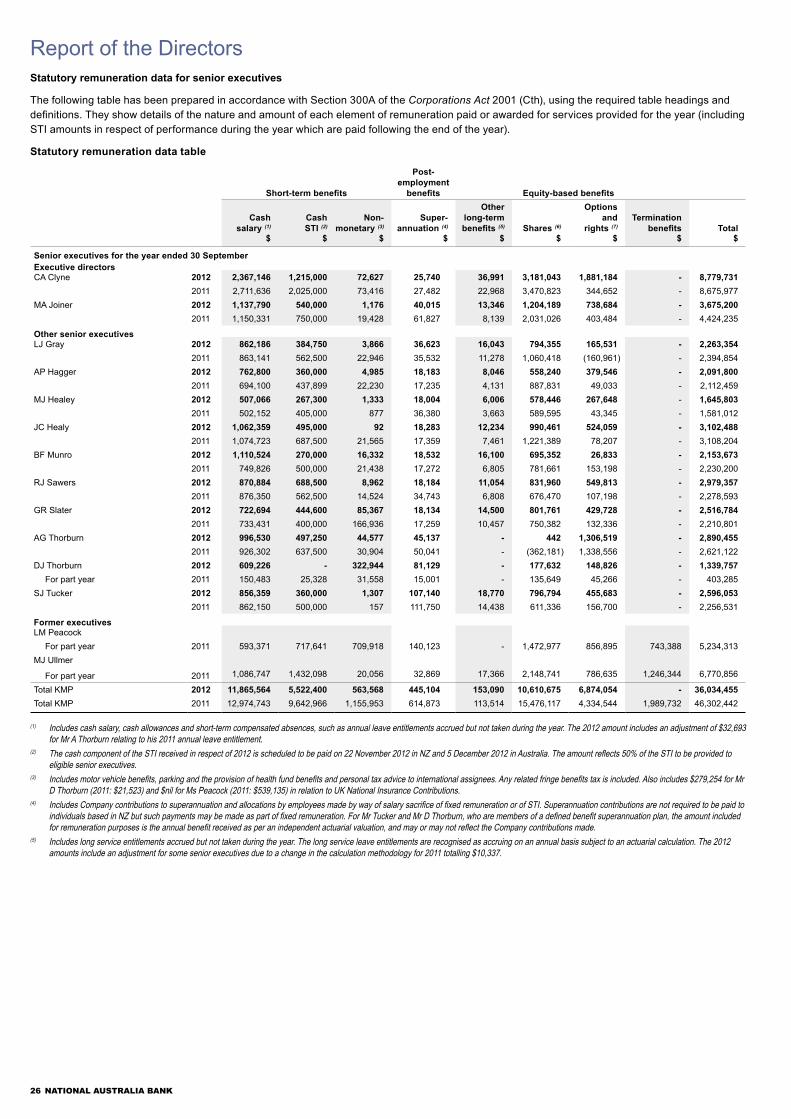
26 NATIONAL AUSTRALIA BANK
Report of the DirectorsStatutory remuneration data for senior executives
The following table has been prepared in accordance with Section 300A of the Corporations Act 2001 (Cth), using the required table headings and definitions. They show details of the nature and amount of each element of remuneration paid or awarded for services provided for the year (including STI amounts in respect of performance during the year which are paid following the end of the year).
Statutory remuneration data table
Short-term benefits
Post-employment
benefits Equity-based benefits
Cash salary (1)
Cash STI (2)
Non-monetary (3)
Super-annuation (4)
Other long-term benefits (5) Shares (6)
Options and
rights (7) Termination
benefits Total$ $ $ $ $ $ $ $ $
Senior executives for the year ended 30 SeptemberExecutive directorsCA Clyne 2012 2,367,146 1,215,000 72,627 25,740 36,991 3,181,043 1,881,184 - 8,779,731
2011 2,711,636 2,025,000 73,416 27,482 22,968 3,470,823 344,652 - 8,675,977 MA Joiner 2012 1,137,790 540,000 1,176 40,015 13,346 1,204,189 738,684 - 3,675,200
2011 1,150,331 750,000 19,428 61,827 8,139 2,031,026 403,484 - 4,424,235
Other senior executivesLJ Gray 2012 862,186 384,750 3,866 36,623 16,043 794,355 165,531 - 2,263,354
2011 863,141 562,500 22,946 35,532 11,278 1,060,418 (160,961) - 2,394,854 AP Hagger 2012 762,800 360,000 4,985 18,183 8,046 558,240 379,546 - 2,091,800
2011 694,100 437,899 22,230 17,235 4,131 887,831 49,033 - 2,112,459 MJ Healey 2012 507,066 267,300 1,333 18,004 6,006 578,446 267,648 - 1,645,803
2011 502,152 405,000 877 36,380 3,663 589,595 43,345 - 1,581,012 JC Healy 2012 1,062,359 495,000 92 18,283 12,234 990,461 524,059 - 3,102,488
2011 1,074,723 687,500 21,565 17,359 7,461 1,221,389 78,207 - 3,108,204 BF Munro 2012 1,110,524 270,000 16,332 18,532 16,100 695,352 26,833 - 2,153,673
2011 749,826 500,000 21,438 17,272 6,805 781,661 153,198 - 2,230,200 RJ Sawers 2012 870,884 688,500 8,962 18,184 11,054 831,960 549,813 - 2,979,357
2011 876,350 562,500 14,524 34,743 6,808 676,470 107,198 - 2,278,593 GR Slater 2012 722,694 444,600 85,367 18,134 14,500 801,761 429,728 - 2,516,784
2011 733,431 400,000 166,936 17,259 10,457 750,382 132,336 - 2,210,801 AG Thorburn 2012 996,530 497,250 44,577 45,137 - 442 1,306,519 - 2,890,455
2011 926,302 637,500 30,904 50,041 - (362,181) 1,338,556 - 2,621,122 DJ Thorburn 2012 609,226 - 322,944 81,129 - 177,632 148,826 - 1,339,757
For part year 2011 150,483 25,328 31,558 15,001 - 135,649 45,266 - 403,285 SJ Tucker 2012 856,359 360,000 1,307 107,140 18,770 796,794 455,683 - 2,596,053
2011 862,150 500,000 157 111,750 14,438 611,336 156,700 - 2,256,531
Former executivesLM Peacock
For part year 2011 593,371 717,641 709,918 140,123 - 1,472,977 856,895 743,388 5,234,313 MJ Ullmer
For part year 2011 1,086,747 1,432,098 20,056 32,869 17,366 2,148,741 786,635 1,246,344 6,770,856
Total KMP 2012 11,865,564 5,522,400 563,568 445,104 153,090 10,610,675 6,874,054 - 36,034,455 Total KMP 2011 12,974,743 9,642,966 1,155,953 614,873 113,514 15,476,117 4,334,544 1,989,732 46,302,442
(1) Includes cash salary, cash allowances and short-term compensated absences, such as annual leave entitlements accrued but not taken during the year. The 2012 amount includes an adjustment of $32,693 for Mr A Thorburn relating to his 2011 annual leave entitlement.
(2) The cash component of the STI received in respect of 2012 is scheduled to be paid on 22 November 2012 in NZ and 5 December 2012 in Australia. The amount reflects 50% of the STI to be provided to eligible senior executives.
(3) Includes motor vehicle benefits, parking and the provision of health fund benefits and personal tax advice to international assignees. Any related fringe benefits tax is included. Also includes $279,254 for Mr D Thorburn (2011: $21,523) and $nil for Ms Peacock (2011: $539,135) in relation to UK National Insurance Contributions.
(4) Includes Company contributions to superannuation and allocations by employees made by way of salary sacrifice of fixed remuneration or of STI. Superannuation contributions are not required to be paid to individuals based in NZ but such payments may be made as part of fixed remuneration. For Mr Tucker and Mr D Thorburn, who are members of a defined benefit superannuation plan, the amount included for remuneration purposes is the annual benefit received as per an independent actuarial valuation, and may or may not reflect the Company contributions made.
(5) Includes long service entitlements accrued but not taken during the year. The long service leave entitlements are recognised as accruing on an annual basis subject to an actuarial calculation. The 2012 amounts include an adjustment for some senior executives due to a change in the calculation methodology for 2011 totalling $10,337.
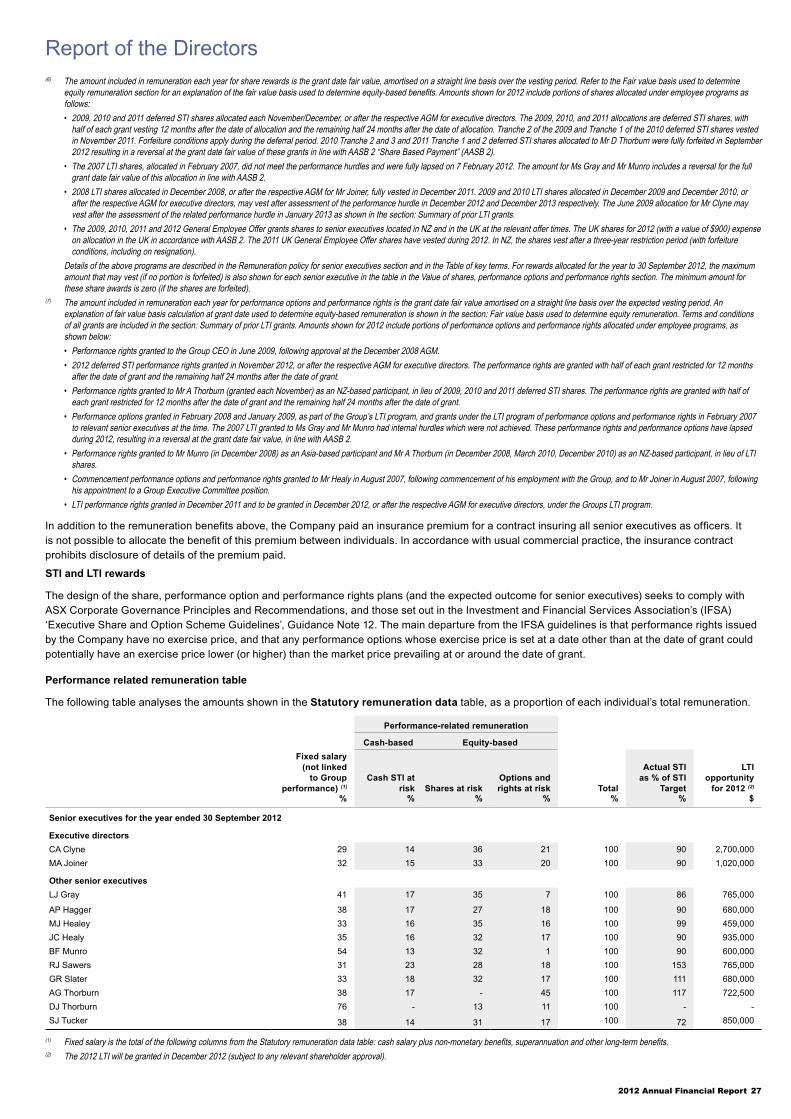
2012 Annual Financial Report 27
Report of the Directors(6) The amount included in remuneration each year for share rewards is the grant date fair value, amortised on a straight line basis over the vesting period. Refer to the Fair value basis used to determine
equity remuneration section for an explanation of the fair value basis used to determine equity-based benefits. Amounts shown for 2012 include portions of shares allocated under employee programs as follows:• 2009, 2010 and 2011 deferred STI shares allocated each November/December, or after the respective AGM for executive directors. The 2009, 2010, and 2011 allocations are deferred STI shares, with
half of each grant vesting 12 months after the date of allocation and the remaining half 24 months after the date of allocation. Tranche 2 of the 2009 and Tranche 1 of the 2010 deferred STI shares vested in November 2011. Forfeiture conditions apply during the deferral period. 2010 Tranche 2 and 3 and 2011 Tranche 1 and 2 deferred STI shares allocated to Mr D Thorburn were fully forfeited in September 2012 resulting in a reversal at the grant date fair value of these grants in line with AASB 2 “Share Based Payment” (AASB 2).
• The 2007 LTI shares, allocated in February 2007, did not meet the performance hurdles and were fully lapsed on 7 February 2012. The amount for Ms Gray and Mr Munro includes a reversal for the full grant date fair value of this allocation in line with AASB 2.
• 2008 LTI shares allocated in December 2008, or after the respective AGM for Mr Joiner, fully vested in December 2011. 2009 and 2010 LTI shares allocated in December 2009 and December 2010, or after the respective AGM for executive directors, may vest after assessment of the performance hurdle in December 2012 and December 2013 respectively. The June 2009 allocation for Mr Clyne may vest after the assessment of the related performance hurdle in January 2013 as shown in the section: Summary of prior LTI grants.
• The 2009, 2010, 2011 and 2012 General Employee Offer grants shares to senior executives located in NZ and in the UK at the relevant offer times. The UK shares for 2012 (with a value of $900) expense on allocation in the UK in accordance with AASB 2. The 2011 UK General Employee Offer shares have vested during 2012. In NZ, the shares vest after a three-year restriction period (with forfeiture conditions, including on resignation).
Details of the above programs are described in the Remuneration policy for senior executives section and in the Table of key terms. For rewards allocated for the year to 30 September 2012, the maximum amount that may vest (if no portion is forfeited) is also shown for each senior executive in the table in the Value of shares, performance options and performance rights section. The minimum amount for these share awards is zero (if the shares are forfeited).
(7) The amount included in remuneration each year for performance options and performance rights is the grant date fair value amortised on a straight line basis over the expected vesting period. An explanation of fair value basis calculation at grant date used to determine equity-based remuneration is shown in the section: Fair value basis used to determine equity remuneration. Terms and conditions of all grants are included in the section: Summary of prior LTI grants. Amounts shown for 2012 include portions of performance options and performance rights allocated under employee programs, as shown below:• Performance rights granted to the Group CEO in June 2009, following approval at the December 2008 AGM.• 2012 deferred STI performance rights granted in November 2012, or after the respective AGM for executive directors. The performance rights are granted with half of each grant restricted for 12 months
after the date of grant and the remaining half 24 months after the date of grant.• Performance rights granted to Mr A Thorburn (granted each November) as an NZ-based participant, in lieu of 2009, 2010 and 2011 deferred STI shares. The performance rights are granted with half of
each grant restricted for 12 months after the date of grant and the remaining half 24 months after the date of grant.• Performance options granted in February 2008 and January 2009, as part of the Group’s LTI program, and grants under the LTI program of performance options and performance rights in February 2007
to relevant senior executives at the time. The 2007 LTI granted to Ms Gray and Mr Munro had internal hurdles which were not achieved. These performance rights and performance options have lapsed during 2012, resulting in a reversal at the grant date fair value, in line with AASB 2.
• Performance rights granted to Mr Munro (in December 2008) as an Asia-based participant and Mr A Thorburn (in December 2008, March 2010, December 2010) as an NZ-based participant, in lieu of LTI shares.
• Commencement performance options and performance rights granted to Mr Healy in August 2007, following commencement of his employment with the Group, and to Mr Joiner in August 2007, following his appointment to a Group Executive Committee position.
• LTI performance rights granted in December 2011 and to be granted in December 2012, or after the respective AGM for executive directors, under the Groups LTI program.
In addition to the remuneration benefits above, the Company paid an insurance premium for a contract insuring all senior executives as officers. It is not possible to allocate the benefit of this premium between individuals. In accordance with usual commercial practice, the insurance contract prohibits disclosure of details of the premium paid.
STI and LTI rewards
The design of the share, performance option and performance rights plans (and the expected outcome for senior executives) seeks to comply with ASX Corporate Governance Principles and Recommendations, and those set out in the Investment and Financial Services Association’s (IFSA) ‘Executive Share and Option Scheme Guidelines’, Guidance Note 12. The main departure from the IFSA guidelines is that performance rights issued by the Company have no exercise price, and that any performance options whose exercise price is set at a date other than at the date of grant could potentially have an exercise price lower (or higher) than the market price prevailing at or around the date of grant.
Performance related remuneration table
The following table analyses the amounts shown in the Statutory remuneration data table, as a proportion of each individual’s total remuneration.
Performance-related remuneration
Cash-based Equity-basedFixed salary
(not linked to Group
performance) (1)Cash STI at
risk Shares at riskOptions and rights at risk Total
Actual STI as % of STI
Target
LTI opportunity
for 2012 (2)
% % % % % % $
Senior executives for the year ended 30 September 2012
Executive directorsCA Clyne 29 14 36 21 100 90 2,700,000 MA Joiner 32 15 33 20 100 90 1,020,000
Other senior executivesLJ Gray 41 17 35 7 100 86 765,000
AP Hagger 38 17 27 18 100 90 680,000 MJ Healey 33 16 35 16 100 99 459,000 JC Healy 35 16 32 17 100 90 935,000 BF Munro 54 13 32 1 100 90 600,000 RJ Sawers 31 23 28 18 100 153 765,000 GR Slater 33 18 32 17 100 111 680,000 AG Thorburn 38 17 - 45 100 117 722,500 DJ Thorburn 76 - 13 11 100 - - SJ Tucker 38 14 31 17 100 72 850,000
(1) Fixed salary is the total of the following columns from the Statutory remuneration data table: cash salary plus non-monetary benefits, superannuation and other long-term benefits.(2) The 2012 LTI will be granted in December 2012 (subject to any relevant shareholder approval).
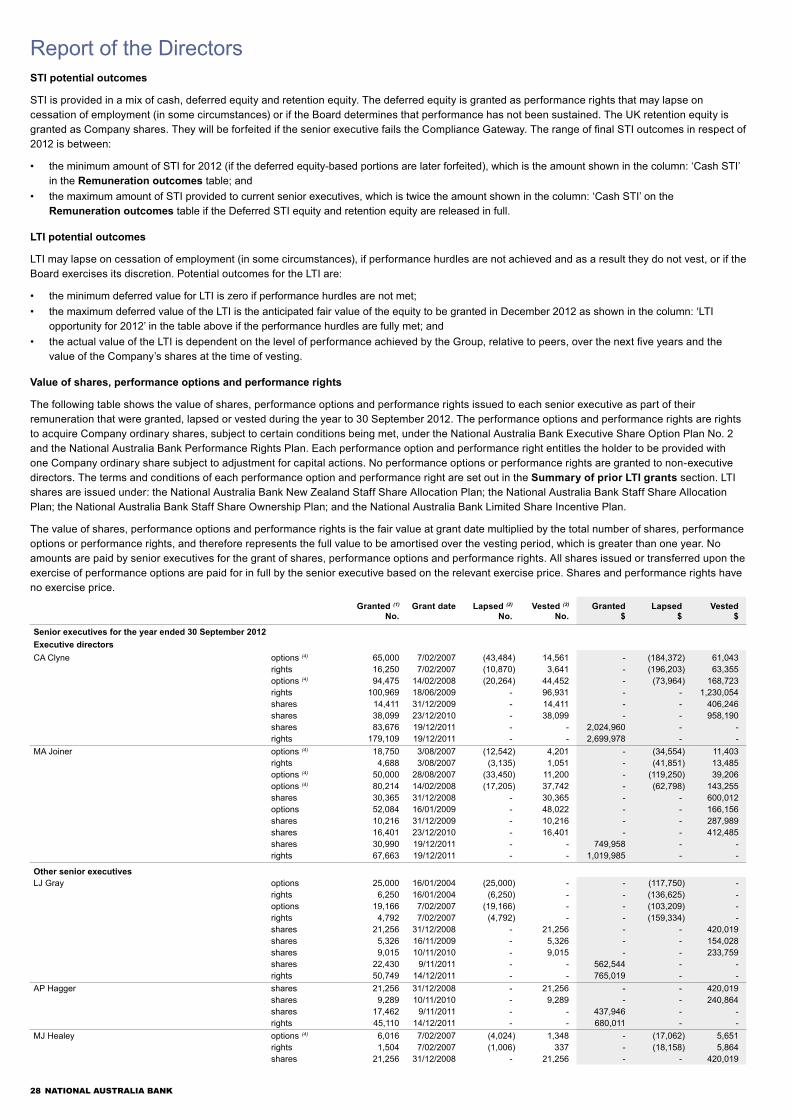
28 NATIONAL AUSTRALIA BANK
Report of the DirectorsSTI potential outcomes
STI is provided in a mix of cash, deferred equity and retention equity. The deferred equity is granted as performance rights that may lapse on cessation of employment (in some circumstances) or if the Board determines that performance has not been sustained. The UK retention equity is granted as Company shares. They will be forfeited if the senior executive fails the Compliance Gateway. The range of final STI outcomes in respect of 2012 is between:
• the minimum amount of STI for 2012 (if the deferred equity-based portions are later forfeited), which is the amount shown in the column: ‘Cash STI’ in the Remuneration outcomes table; and
• the maximum amount of STI provided to current senior executives, which is twice the amount shown in the column: ‘Cash STI’ on the Remuneration outcomes table if the Deferred STI equity and retention equity are released in full.
LTI potential outcomes
LTI may lapse on cessation of employment (in some circumstances), if performance hurdles are not achieved and as a result they do not vest, or if the Board exercises its discretion. Potential outcomes for the LTI are:
• the minimum deferred value for LTI is zero if performance hurdles are not met; • the maximum deferred value of the LTI is the anticipated fair value of the equity to be granted in December 2012 as shown in the column: ‘LTI
opportunity for 2012’ in the table above if the performance hurdles are fully met; and • the actual value of the LTI is dependent on the level of performance achieved by the Group, relative to peers, over the next five years and the
value of the Company’s shares at the time of vesting.
Value of shares, performance options and performance rights
The following table shows the value of shares, performance options and performance rights issued to each senior executive as part of their remuneration that were granted, lapsed or vested during the year to 30 September 2012. The performance options and performance rights are rights to acquire Company ordinary shares, subject to certain conditions being met, under the National Australia Bank Executive Share Option Plan No. 2 and the National Australia Bank Performance Rights Plan. Each performance option and performance right entitles the holder to be provided with one Company ordinary share subject to adjustment for capital actions. No performance options or performance rights are granted to non-executive directors. The terms and conditions of each performance option and performance right are set out in the Summary of prior LTI grants section. LTI shares are issued under: the National Australia Bank New Zealand Staff Share Allocation Plan; the National Australia Bank Staff Share Allocation Plan; the National Australia Bank Staff Share Ownership Plan; and the National Australia Bank Limited Share Incentive Plan.
The value of shares, performance options and performance rights is the fair value at grant date multiplied by the total number of shares, performance options or performance rights, and therefore represents the full value to be amortised over the vesting period, which is greater than one year. No amounts are paid by senior executives for the grant of shares, performance options and performance rights. All shares issued or transferred upon the exercise of performance options are paid for in full by the senior executive based on the relevant exercise price. Shares and performance rights have no exercise price.
Granted (1) Grant date Lapsed (2) Vested (3) Granted Lapsed VestedNo. No. No. $ $ $
Senior executives for the year ended 30 September 2012Executive directorsCA Clyne options (4) 65,000 7/02/2007 (43,484) 14,561 - (184,372) 61,043
rights 16,250 7/02/2007 (10,870) 3,641 - (196,203) 63,355 options (4) 94,475 14/02/2008 (20,264) 44,452 - (73,964) 168,723 rights 100,969 18/06/2009 - 96,931 - - 1,230,054 shares 14,411 31/12/2009 - 14,411 - - 406,246 shares 38,099 23/12/2010 - 38,099 - - 958,190 shares 83,676 19/12/2011 - - 2,024,960 - - rights 179,109 19/12/2011 - - 2,699,978 - -
MA Joiner options (4) 18,750 3/08/2007 (12,542) 4,201 - (34,554) 11,403 rights 4,688 3/08/2007 (3,135) 1,051 - (41,851) 13,485 options (4) 50,000 28/08/2007 (33,450) 11,200 - (119,250) 39,206 options (4) 80,214 14/02/2008 (17,205) 37,742 - (62,798) 143,255 shares 30,365 31/12/2008 - 30,365 - - 600,012 options 52,084 16/01/2009 - 48,022 - - 166,156 shares 10,216 31/12/2009 - 10,216 - - 287,989 shares 16,401 23/12/2010 - 16,401 - - 412,485 shares 30,990 19/12/2011 - - 749,958 - - rights 67,663 19/12/2011 - - 1,019,985 - -
Other senior executivesLJ Gray options 25,000 16/01/2004 (25,000) - - (117,750) -
rights 6,250 16/01/2004 (6,250) - - (136,625) - options 19,166 7/02/2007 (19,166) - - (103,209) - rights 4,792 7/02/2007 (4,792) - - (159,334) - shares 21,256 31/12/2008 - 21,256 - - 420,019 shares 5,326 16/11/2009 - 5,326 - - 154,028 shares 9,015 10/11/2010 - 9,015 - - 233,759 shares 22,430 9/11/2011 - - 562,544 - - rights 50,749 14/12/2011 - - 765,019 - -
AP Hagger shares 21,256 31/12/2008 - 21,256 - - 420,019 shares 9,289 10/11/2010 - 9,289 - - 240,864 shares 17,462 9/11/2011 - - 437,946 - - rights 45,110 14/12/2011 - - 680,011 - -
MJ Healey options (4) 6,016 7/02/2007 (4,024) 1,348 - (17,062) 5,651 rights 1,504 7/02/2007 (1,006) 337 - (18,158) 5,864 shares 21,256 31/12/2008 - 21,256 - - 420,019

2012 Annual Financial Report 29
Report of the DirectorsGranted (1) Grant date Lapsed (2) Vested (3) Granted Lapsed Vested
No. No. No. $ $ $MJ Healey (continued) shares 4,115 16/11/2009 - 4,115 - - 119,006
shares 7,159 10/11/2010 - 7,159 - - 185,633 shares 16,150 9/11/2011 - - 405,042 - - rights 30,449 14/12/2011 - - 459,004 - -
JC Healy options (4) 8,333 28/08/2007 (5,574) 1,867 - (17,977) 5,919 rights 2,083 28/08/2007 (1,393) 467 - (20,715) 6,675 shares 34,009 31/12/2008 - 34,009 - - 672,018 shares 6,225 16/11/2009 - 6,225 - - 180,027 shares 15,909 10/11/2010 - 15,909 - - 412,520 shares 27,414 9/11/2011 - - 687,544 - - rights 21,892 14/12/2011 - - 330,014 - - rights 40,135 22/02/2012 - - 605,014 - -
BF Munro options 27,500 7/02/2007 (27,500) - - (148,088) - rights 6,875 7/02/2007 (6,875) - - (228,594) - rights 49,823 31/12/2008 - 49,823 - - 886,849 shares 5,326 16/11/2009 - 5,326 - - 154,028 shares 7,955 10/11/2010 - 7,955 - - 206,273 shares 19,938 9/11/2011 - - 500,046 - - rights 39,803 14/12/2011 - - 600,013 - -
RJ Sawers options (4) 33,334 7/02/2007 (22,298) 7,468 - (94,544) 31,307 rights 8,333 7/02/2007 (5,574) 1,867 - (100,611) 32,488 shares 12,652 31/12/2008 - 12,652 - - 250,004 shares 6,640 16/11/2009 - 6,640 - - 192,029 shares 11,269 10/11/2010 - 11,269 - - 292,205 shares 22,430 9/11/2011 - - 562,544 - - rights 50,749 14/12/2011 - - 765,019 - -
GR Slater options 20,000 16/01/2004 (20,000) - - (94,200) - rights 5,000 16/01/2004 (5,000) - - (109,300) - options (4) 56,000 7/02/2007 (37,464) 12,544 - (158,847) 52,588 rights 14,000 7/02/2007 (9,366) 3,136 - (169,056) 54,568 shares 52 19/12/2008 - 52 - - 998 shares 34,009 31/12/2008 - 34,009 - - 672,018 shares 6,086 16/11/2009 - 6,086 - - 176,007 shares 12,727 10/11/2010 - 12,727 - - 330,011 shares 15,950 9/11/2011 - - 400,026 - - rights 45,110 14/12/2011 - - 680,011 - -
AG Thorburn options (4) 41,666 7/02/2007 (27,873) 9,334 - (118,181) 39,130 rights 10,416 7/02/2007 (6,967) 2,334 - (125,753) 40,614 rights 53,381 31/12/2008 - 53,381 - - 950,182 rights 7,545 16/11/2009 - 7,545 - - 189,229 rights 11,207 10/11/2010 - 11,207 - - 275,020 rights 28,306 9/11/2011 - - 637,516 - - shares 40 14/12/2011 - - 977 - - rights 47,929 14/12/2011 - - 722,505 - -
DJ Thorburn options 35,000 16/01/2004 (35,000) - - (164,850) - rights 8,750 16/01/2004 (8,750) - - (191,275) - options (4) 56,000 7/02/2007 (37,464) 12,544 - (158,847) 52,588 rights 14,000 7/02/2007 (9,366) 3,136 - (169,056) 54,568 shares 52 19/12/2008 - 52 - - 998 shares 35,294 31/12/2008 - 35,294 - - 697,409 shares 15,350 10/11/2010 (8,064) 7,286 - (209,099) 188,926 shares 13,702 9/11/2011 (11,812) 1,890 343,645 (296,244) 47,401 rights 36,016 14/12/2011 - - 524,223 - - shares 40 14/12/2011 - - 977 - -
SJ Tucker options 25,000 16/01/2004 (25,000) - - (117,750) - rights 6,250 16/01/2004 (6,250) - - (136,625) - options (4) 58,333 7/02/2007 (39,024) 13,067 - (165,462) 54,780 rights 14,583 7/02/2007 (9,754) 3,268 - (176,060) 56,866 shares 11,337 31/12/2008 - 11,337 - - 224,019 shares 5,896 16/11/2009 - 5,896 - - 170,512 shares 11,269 10/11/2010 - 11,269 - - 292,205 shares 19,938 9/11/2011 - - 500,046 - - rights 56,387 14/12/2011 - - 850,008 - -
(1) The following securities have been granted during 2012:• Deferred STI share allocations in November 2011 (in respect of the 2011 performance year) and December 2011 for the executive directors.• Deferred UK Retention shares allocated to Mr D Thorburn in November 2011 (in respect of the 2011 performance year).• LTI performance rights allocations in December 2011 and February 2012 for Mr Healy only (in respect of the 2011 performance year).• 2011 General Employee Share Offer granted to Mr A Thorburn and Mr D Thorburn in December 2011.
(2) The following securities have lapsed or been forfeited during 2012:• LTI performance options and performance rights granted in January 2004 to Ms Gray, Mr Slater, Mr D Thorburn and Mr Tucker, fully lapsed in January 2012.• LTI Tranche 2 and 3 performance options and performance rights granted in February 2007 to Ms Gray and Mr Munro, fully lapsed in February 2012.• Partial lapsing of LTI Tranche 2 and 3 Executive performance options and performance rights granted in August 2007 to Mr Joiner and February 2007 to other eligible senior executives, in February 2012.• Partial lapsing of Tranche 2 and 3 Commencement options and rights granted to Mr Healy in August 2007.• Partial lapsing of Tranche 2 and 3 Commencement options granted to Mr Joiner in August 2007.• Partial lapsing of Tranche 1 Executive performance options granted to Mr Clyne and Mr Joiner in February 2008.• 2010 Tranche 2 and 3 Deferred STI program shares allocated in November 2010 to Mr D Thorburn, fully forfeited in September 2012.• 2011 Tranche 1 and 2 Deferred STI program shares allocated in November 2011 to Mr D Thorburn, fully forfeited in September 2012.

30 NATIONAL AUSTRALIA BANK
Report of the Directors(3) The following securities have vested during 2012:
• Partial vesting of LTI Tranche 2 and 3 Executive performance options and performance rights granted in August 2007 to Mr Joiner and February 2007 to other eligible senior executives, in February 2012.• Partial vesting of Tranche 2 and 3 Commencement options and rights granted to Mr Healy in August 2007.• Partial vesting of Tranche 2 and 3 Commencement options granted to Mr Joiner in August 2007.• Partial vesting of Tranche 1 and 2 Executive performance options granted to Mr Clyne and Mr Joiner in February 2008.• 2008 LTI shares allocated to all senior executives, except Mr Clyne, in December 2008 fully vested in December 2011.• Partial vesting of Tranche 1 Executive performance options granted in January 2009 to Mr Joiner. Mr Joiner exercised these options during the year. These options had an exercise price of $19.89. The
value of the options on exercise (based on the closing share price on the day less the exercise price) was $146,467.• Partial vesting of Group CEO performance rights granted to Mr Clyne in June 2009 as approved by shareholders at the December 2008 AGM.• 2009 Tranche 2 Deferred STI program shares allocated to all senior executives except Mr Hagger, in November 2009, and for executive directors in December 2009, fully vested in November 2011.• 2010 Tranche 1 Deferred STI shares allocated in November 2010, and for executive directors in December 2010, fully vested in November 2011.• Full vesting in May 2012 of Deferred UK Retention shares allocated to Mr D Thorburn in November 2011 (in respect of the 2011 performance year).• Full vesting in December 2011 of the December 2008 UK General Employee Share Offer for Mr Slater and Mr D Thorburn.
(4) The senior executive received no value from this grant which was ‘out-of-the-money’. Refer to the 2012 LTI outcomes table on page 20 for further details.
Fair value basis used to determine equity remuneration
The grant date fair value of shares, performance options and performance rights in the previous tables is calculated in accordance with AASB 2 “Share-based Payment” and amortised on a straight line basis over the vesting period and included in each senior executive’s remuneration for disclosure purposes.
The fair value of each share is determined by the market value of the share as at the grant date, and is generally a five day weighted average share price. The fair value of each performance option and performance right is determined using an appropriate numerical pricing model depending on the type of security, and whether there is a market-based performance hurdle (Black Scholes, Monte Carlo simulation, and/or a discounted cash flow methodology). These models take account of factors including: the exercise price; the current level and volatility of the underlying share price; the risk-free interest rate; expected dividends on the underlying share; current market price of the underlying share; and the expected life of the securities. For market-based performance hurdles, the probability of the performance hurdle being reached is taken into consideration in valuing the securities. For further details, refer to Note 1(ss) in the Financial repor t.
Fair value of securities granted to senior executives
The fair value per share and performance right (at grant) are set out below for grants provided to senior executives during 2012. No performance options have been granted during the year. Shares and performance rights granted during 2012 have a zero exercise price.
Shares Performance rights
Type of allocationGrant date Fair value Restriction period end Fair value Exercise period Exercise period
$ $ From To (1)
Deferred STI (2) 9 November 2011 $25.08 23 November 2012 $23.34 23 November 2012 23 May 2014Deferred STI (2) 9 November 2011 $25.08 23 November 2013 $21.76 23 November 2013 23 May 2014Deferred STI (3) 9 November 2011 $25.08 23 May 2013Deferred STI (3) 9 November 2011 $25.08 23 May 2014UK Retention Shares 9 November 2011 $25.08 9 May 2012Long Term Incentive 14 December 2011 $12.17 14 December 2014 14 June 2015Long Term Incentive 14 December 2011 $19.80 14 December 2014 14 June 2015Long Term Incentive (3) 14 December 2011 $11.75 14 June 2015 14 December 2015Long Term Incentive (3) 14 December 2011 $19.12 14 June 2015 14 December 2015Long Term Incentive (4) 22 February 2012 $12.17 14 December 2014 14 June 2015Long Term Incentive (4) 22 February 2012 $19.80 14 December 2014 14 June 2015NZ Year End Share Offer 14 December 2011 $24.43 14 December 2014UK General Employee Shares 14 December 2011 $24.43 14 December 2014Deferred STI (5) 19 December 2011 $24.20 23 November 2012Deferred STI (5) 19 December 2011 $24.20 23 November 2013Long Term Incentive (5) 19 December 2011 $12.17 14 December 2014 14 June 2015Long Term Incentive (5) 19 December 2011 $19.80 14 December 2014 14 June 2015
(1) The end of the exercise period for each performance rights allocation is also the expiry date.(2) Due to jurisdictional reasons, 2011 deferred STI performance rights were granted to Mr A Thorburn, who is based in NZ, instead of the 2011 STI deferred shares granted to other senior executives.(3) The 2011 deferred STI and LTI allocations granted to Mr D Thorburn have an additional six month retention period to meet minimum UK regulatory deferral and vesting requirements.(4) A portion of Mr Healy’s 2011 LTI performance rights were granted later than the 2011 LTI shares granted to senior executives, however the terms and conditions are the same.(5) Deferred STI and LTI allocations (in respect of the 2011 performance year) for the executive directors, as approved by shareholders at the December 2011 AGM.

2012 Annual Financial Report 31
Report of the DirectorsSummary of prior LTI grants
The LTI program has changed over time to reflect market practice, changes in regulation, and to progressively improve alignment with shareholders’ experience. Key terms are defined in the Table of key terms.
This section details the terms and conditions of LTI awards held by senior executives during 2012. Some details are provided at the end of this section for the June 2009 allocation to Mr Clyne, following approval by shareholders at the December 2008 AGM, where it varies from the summary information below.
Frequency of offers
There is generally one main LTI award per annum. There are occasional intervening grants for individuals who join the Group or receive a significant promotion during the year, and each references the structure and hurdles of the preceding main grant (only the grant date and exercise price may be different and for simplicity, these intervening grants are combined with the related main grant in this summary, and not described separately).
Form of securities
For the January 2004 and February 2007 awards, performance options were provided for approximately half of the grant value, with the remainder provided in performance rights to enable delivery of rewards where the Group had performed well against the performance hurdles but market conditions were adverse (i.e. if the exercise price exceeded the Company’s share price and the performance options were ‘out-of-the-money’).
For 2008, performance options were continued for half of the grant value, only for members of the Group Executive Committee (at the time of each allocation - excluding the Group CEO), with the remainder in shares (or performance rights in Asia and NZ due to jurisdictional reasons). Other employees received the whole of any LTI reward in shares (or performance rights in Asia and NZ).
For 2009 and 2010, LTI rewards have been provided as shares or performance rights, dependent on jurisdictional circumstances, to all participants.
For 2011, LTI rewards have been provided as performance rights to all participants except US employees, who received the whole of any LTI reward in shares.
Exercise price
The exercise price for performance options is generally the weighted average price of ordinary Company shares traded on the ASX in the week up to and including the day of allocation. On occasion, for intervening grants made in relation to a previous grant, the price at the previous date may be used. There is no exercise price for shares or performance rights.
Basis for allocation of LTI awards
From January 2004, LTI awards have been determined by assessment of an individual’s performance and potential under the Executive Talent Review. From December 2009, individual allocations are based on market relativity and total reward mix.
Life of the grant (and expiry date)
The January 2004 allocation has an overall life of eight years after allocation until the expiry date. Vested securities can be exercised until the expiry date and any securities that do not vest under the performance hurdles lapse on the expiry date.
For the February 2007 and February 2008 awards the life of the securities was reduced to five years, with the expiry date on the fifth anniversary of the grant. These awards have tranche-based performance testing. The securities were issued in three tranches.
Tranche 1 tested at the end of year 3 with a re-test in year 4. Tranche 2 tested at the end of year 4 with a re-test in year 5. Tranche 3 tested in year 5 only. An additional six month period has been added to allow time for participants to exercise any securities that vest from that test. The additional six month period also applies to performance rights granted since 2008, with one hurdle test on the third anniversary, and an additional six month period for exercise.
For 2011, an additional six month retention period applies to any vested performance rights in the UK, and an additional six month period for exercise.
The shares allocated for December 2008, 2009 and 2010 are released from restrictions on trading upon achievement of the related performance hurdle (and have no expiry date).
Restriction period
The restriction period is three years during which no performance testing is conducted, and therefore no vesting occurs.
Performance hurdles
LTI allocated prior to 2006 has a TSR performance hurdle measured relative to peer companies.
In 2007, the TSR performance hurdle was continued for the most senior executives at the time (approximately 80 positions) and for any grants made to individuals joining the Group. An internal hurdle applies to allocations to other employees, with vesting of both the performance options and performance rights based on Total Business Return (TBR) results against the business plan for the Group or for the relevant regional business. TBR is a combined measure including ROE and cash earnings, averaged over the relevant years of the testing period.
In 2008, the relative TSR hurdle was confined to the performance options allocated to the Group Executive Committee. The hurdle on their LTI shares (or performance rights), and on the LTI shares (or performance rights) for the remainder of the LTI participants, was based on ROE performance against the business plan for the Group or for the relevant regional business for each individual once a cash earnings threshold has been met. ROE and cash earnings targets are cumulative measures set in line with the relevant regional operational business plans for the 2009, 2010 and 2011 years.
During 2009, the 2007 and 2008 performance hurdles moved to being measured at Group level rather than regional level. The move to Group testing is a result of the restructuring that took place in early 2009.
In 2009 and 2010, the same performance hurdles applied to all participants of the executive LTI (approximately 100 positions). Half the allocation has a TSR performance hurdle for the performance period and the other half has a performance hurdle based on Group cash earnings and ROE with a TSR overlay. Group cash earnings and ROE targets are cumulative measures set in line with the relevant operational business plans.
For 2011, half the allocation has a TSR performance hurdle for the performance period and the other half has two components, namely Group cash earnings and ROE. Group cash earnings and ROE targets are cumulative measures set in line with the operational business plans for the 2011, 2012 and 2013 years.
The 2012 performance hurdle is based solely on relative TSR and is described in the Performance hurdle for 2012 LTI award section.
Reasons for the performance hurdles
The performance hurdles are chosen to support the Group’s longer-term business strategy. TSR is considered a relevant and direct link to shareholder returns over the medium to long-term, and appropriate

32 NATIONAL AUSTRALIA BANK
Report of the Directorsfor the most senior executives. The Group cash earnings/ROE hurdle provides a link to business results.
Peer groups used in performance hurdles
Prior to September 2004, TSR performance for the Company is compared with that of the Top 50 Companies (as defined in the Table of key terms).
From September 2004 to September 2009 the TSR hurdles have incorporated two peer groups, with each determining half of the TSR vesting. The first group is the Top 50 Companies as above, and the second is the Top Financial Services (as defined in the Table of key terms).
From September 2009 to December 2011, the TSR performance for the Company is compared with that of the Top Financial Services.
De-listed companies are replaced by new peers from a reserve list approved at the time of each allocation (current listings are available at www.nabgroup.com).
The 2012 peer groups are described in the Performance hurdles for 2012 LTI award section.
Peer group selection criteria
Peer group selection is designed to provide a measure against the type of companies investors might reasonably hold as an alternative. Using a larger peer group helps to reduce volatility and lessens the impact of changes to the peer group (due to de-listings). The Top Financial Services peer group was introduced to allow performance to be specifically measured against comparable organisations as well as to a broader selection of financial industry organisations.
Performance hurdle testing
Allocations made prior to September 2004 have ongoing performance testing, which is conducted continuously over the five year performance period following the end of the restriction period (with the last test being three months prior to the end of the performance period and eight year expiry date).
For allocations made in 2007, the hurdles are tested on three occasions over the two year performance period – i.e. at the third, fourth, and fifth anniversaries of the allocation date. Each test affects the vesting of different tranches as described below. This approach is designed to balance the number of performance hurdle tests, while providing a fair level of reward to employees.
For allocations made in 2008 and January 2009, the TSR hurdles on performance options for the Group Executive Committee are tested on three separate occasions as above. The ROE/cash earnings hurdle for the LTI shares (or performance rights) is tested once only, at the end of the performance period.
From December 2009 until December 2012, the hurdles are tested once only, at the end of the three year performance period.
The 2012 hurdles testing is described in the Performance hurdles for 2012 LTI award section on page 24.
Performance hurdle methodology
For the January 2004 award, each TSR comparison is averaged over a 30-day period to guard against short-term spikes in the share price. Performance is tested daily, during the performance period (for practical reasons tests are run quarterly).
From February 2007, in addition to the 30-day averaging, the TSR ranking must be maintained for 30 consecutive trading days (i.e. vesting only occurs if there is sustained TSR performance).
For allocations made in 2007, individual allocations are divided into three equal tranches. Only Tranche 1 is tested at the end of the restriction period, on the 3rd anniversary of grant. Tranche 1 and
Tranche 2 are tested one year later, and Tranche 2 and Tranche 3 are tested the following year. This minimises additional testing of the hurdle while maintaining employee focus on medium to long-term performance.
From 2008, the performance options, allocated in three tranches, have the same progressive testing as above. The shares (or performance rights) are tested only once, measuring cash earnings and ROE prior to the 3rd anniversary of grant, compared with business plan over three financial years.
For 2009, 2010 and 2011, the TSR performance hurdle measures the Company’s TSR and the TSR for each of the peer group companies relevant to that tranche over the relevant performance period. The value of the relevant shares on the start date and the end date of the relevant performance period is based on the volume weighted average price of those shares over the 30 trading days up to and including the relevant date, in order to avoid the impact of short-term share price fluctuations. The performance hurdle is tested only once. The Group cash earnings and ROE performance hurdle measures achievement against the level budgeted in the Group’s business plans over the three year performance period (cumulatively measured).
Vesting schedule
For the January 2004 award, there is no vesting if the Company is ranked below the 50th percentile of the peer group and 50% to 98% progressive vesting for the 50th to 74th percentile ranking (2% vesting per percentile). All of the securities vest when the Company’s performance ranking is at or above the 75th percentile of the peer group.
For the February 2007, February 2008 and January 2009 Executive awards, TSR vesting schedules have no vesting at the 50th percentile, and 35% to 97% progressive vesting from the 51st to 75th percentiles (2.6% vesting per percentile). All securities vest when the Company’s performance ranking is at or above the 76th percentile of the peer group.
For the participants with internal hurdles the following applies: • February 2007: under the TBR hurdle, there is 50% to 100%
progressive vesting when business results are 90% to 120% of business plan (i.e. achievement of 120% of business plan required for full vesting). Assessment of TBR performance against target is determined by the Board in its absolute discretion. The Board may adjust its assessment to take into account extraordinary or significant items.
• December 2008: under the ROE/cash earnings hurdle, there is 50% to 100% progressive vesting (or retention of shares) when business results are 90% to 100% of business plan (i.e. achievement of 100% of business plan required for full vesting or retention). There is capacity for the Board to approve an additional allocation of securities if the Group significantly exceeds business plan over the three year hurdle period. Assessment of ROE and cash earnings performance against target is determined by the Board in its absolute discretion. The Board may adjust its assessment to take into account extraordinary or significant items.
For 2009, 2010 and 2011, the awards have half external and half internal performance hurdles. The external hurdle, TSR, has no vesting if the Company is ranked below the 50th percentile of the peer group and 50% to 98% progressive vesting for the 50th to the 74th percentile ranking (2% vesting per percentile). All of the securities vest when the Company’s performance ranking is at or above the 75th percentile of the peer group.
For the internal hurdle for 2009 and 2010 where TSR performance is in the top quartile Group cash earnings must achieve at least 90% of business plan. Where TSR performance is below the top quartile Group cash earnings must achieve 100% of business plan. If the Group cash earnings threshold is achieved, there is 50% to 100% progressive vesting when the level of Group ROE achieved is 90%

2012 Annual Financial Report 33
Report of the Directorsto 100% of business plan. Assessment of Group cash earnings and Group ROE performance against target is determined by the Board in its absolute discretion. The Board may adjust its assessment to take into account extraordinary or significant items and the quality of the result.
For 2011, Group cash earnings must be at least 90% of the level budgeted in the Group’s business plans over the 2012, 2013 and 2014 financial years, and Group ROE must also be at least 90% of business plan for the same financial years.
If both the cash earnings and ROE thresholds are met, then the level of achievement compared to business plan will determine vesting, as follows: • 25% of performance rights will vest if both cash earnings and ROE
are 90% of business plan; • between 25% and 100% of performance rights will vest if both
cash earnings and ROE are greater than 90% but less than 100% of business plan. The actual number will depend on a matrix of cash earnings and ROE achievement against business plan. For example, an ROE outcome of 95% and a cash earnings outcome of 95% will result in 56% of the internal hurdle performance rights vesting; and
• 100% of performance rights will vest if both cash earnings and ROE are equal to or greater than 100% of business plan.
Assessment of Group cash earnings and Group ROE performance against target is determined by the Board in its absolute discretion. The Board may adjust its assessment to take into account extraordinary or significant items and the quality of the result. The Board may adjust its assessment with a qualitative overlay that reflects shareholder expectations, the quality of the financial results and the Group’s management of business risks.
How shares are provided under the LTI
During 2007, the terms of the performance options and performance rights plans were altered to allow shares issued upon exercise of performance options or performance rights to be either issued as new shares or purchased on market. Previously, only new shares could be issued.
Lapsing and forfeiture
Performance options and performance rights - Performance options and performance rights lapse if not exercised on or before their expiry date (as described above). If a senior executive is dismissed or resigns, the Board may exercise its discretion to lapse all unvested performance options and performance rights immediately. All vested performance options and performance rights lapse immediately in the case of dismissal or after 90 days in the case of resignation. When a senior executive’s employment ceases in any other circumstances all vested performance options and performance rights will be retained until the original expiry date. Unvested performance options and performance rights will be retained under the relevant performance conditions and restrictions. From 2011, where the Board does not exercise its discretion to lapse on cessation of employment, some or all of the performance rights are retained based on the elapsed period of the grant at the time of cessation, subject to the original terms and conditions.
Shares - If a senior executive fails to meet individual compliance requirements, or is dismissed or resigns, shares are forfeited. When a senior executive’s employment ceases in any other circumstances, shares, if allocated: • prior to December 2009, subject to Board discretion, some or all
of the shares are retained and released based on the calculated probability of the performance hurdle being achieved and the elapsed period of the grant at the time of cessation; and
• from December 2009, are retained subject to the relevant performance hurdle and restriction periods.
Conditions for retaining securities
In the majority of cases, performance options and performance rights only vest as a result of achieving the relevant performance hurdle. The Board has discretion, following death or permanent disablement, to approve early vesting and retention of securities as permitted by law (and without requiring shareholder approval).
In relation to certain events, including a takeover or scheme of arrangement, the Board has discretion to allow holders to exercise securities regardless of the normal criteria and the restriction period on LTI would end.
June 2009 allocation to Mr Clyne
Form of securities - Half of the value of the allocation was provided in the form of performance rights and the remainder in shares.
Restriction period - For the performance rights, no performance testing was conducted until 1 January 2012 and for the shares until the restriction period 30 September 2012.
Performance hurdles - Each half of the allocation has a separate performance hurdle:• Performance rights: Vesting is based on TSR performance of the
Company compared with that of the Top Financial Services on 1 January 2009 and 1 January 2012, 2013 and 2014. There is no vesting if the Company is below the 55th percentile, progressive vesting to the 82nd percentile and full vesting if above the 82nd percentile. TSR is averaged over a 30-day period for each test.
• Shares: Retention of the shares is based on the Group’s performance against Group ROE, as projected in the Group’s business plans, once a cash earnings threshold has been achieved for the periods 1 January 2009 to 30 September 2010, 1 October 2010 to September 2011 and 1 October 2011 to 30 September 2012. On 1 January 2013, all of the shares are forfeited if the cash earnings threshold is not met, or if ROE performance is below 90% of plan, and 50% to 100% progressive release of the shares from restrictions when ROE performance is between 90% to 100% of plan (i.e. achievement of 100% of business plan is required for all of the shares to be released from restrictions). Assessment of performance against target is determined by the Board in its absolute discretion. The Board may adjust its assessment to take into account extraordinary or significant items.

34 NATIONAL AUSTRALIA BANK
Report of the DirectorsStatutory disclosure for non-executive directorsThe table below shows the individuals who were both non-executive directors and KMP of the Company and Group during 2012:
Name Director
MA Chaney ChairmanPA Cross DirectorDT Gilbert DirectorKR Henry (1) DirectorPJ Rizzo DirectorJS Segal DirectorJG Thorn DirectorGA Tomlinson DirectorJA Waller DirectorGM Williamson (2) DirectorAKT Yuen Director
(1) Dr Henry was appointed a non-executive director on 1 November 2011.(2) Sir Malcolm Williamson retired as a non-executive director of the Company on 7 June 2012
and as Chairman of National Australia Group Europe Limited and Clydesdale Bank PLC on 23 July 2012.
Remuneration policy for non-executive directors
The fees paid to non-executive directors who serve on the Board are based on advice and market data from independent external remuneration advisers. This advice takes into consideration the level of fees paid to board members of other major Australian corporations, the size and complexity of the Group’s operations, the activities of the Group and the responsibilities and workload requirements of Board members.
Generally, the Board annually reviews the fees paid to the Chairman and non-executive directors on the Board in line with general industry practice. Additional fees are paid, where applicable, for participation on Board Committees and for serving on the boards of controlled entities and on internal advisory boards. Since October 2005, the fees have included the Company’s compulsory contributions to superannuation. Non-executive directors can elect to take part of their remuneration as additional Company superannuation contributions. Non-executive directors are not paid any performance or incentive payments.
Non-executive directors must hold at least 2,000 fully paid ordinary shares in the Company within six months of appointment. (Details of non-executive director shareholdings in the Company are set out in Note 47 of the Financial report.)
The Board fees were not reviewed during 2012. The next review is scheduled for March 2013.
The total fees paid during the 2011 and 2012 years are shown in the total row of the Non-executive director fees table.
There is no change to the maximum fee pool of $4.5 million per annum which was approved at the Company’s February 2008 AGM.
The appointment letters for the non-executive directors set out the terms and conditions of their appointments. These terms and conditions are in conjunction with, and subject to, the Company’s Constitution and the charters and policies approved by the Board from time-to-time, as set out in the Corporate governance section.
Non-executive director remuneration
Non-executive director fees
The total fees paid by the Company to non-executive members of the Board, including fees paid for their involvement on (a) the Board; (b) Board Committees; and (c) boards of controlled entities, are kept within the total pool approved by shareholders from time-to-time. The following table sets out details of the components of non-executive directors’ remuneration paid in the form of Board and committee fees and other non-monetary benefits:
NameBoard
Audit Committee
Risk Committee
Remuneration Committee
Information Technology Committee
Controlled Entities Other Total
$ $ $ $ $ $ $ $
MA Chaney 770,000 - - - - - - 770,000 PA Cross (1) 220,000 - 30,000 50,000 - 45,000 - 345,000 DT Gilbert 220,000 - - 22,500 30,000 - - 272,500 KR Henry (for part year) (2) 201,667 27,500 - - - - - 229,167 PJ Rizzo 220,000 30,000 60,000 - 15,000 - - 325,000 JS Segal 220,000 30,000 30,000 - - - - 280,000 JG Thorn 220,000 60,000 - - 15,000 - - 295,000 GA Tomlinson (3) 220,000 - - 22,500 - 277,500 - 520,000 JA Waller (4) 220,000 30,000 30,000 - - 135,828 - 415,828 GM Williamson (for part year) (5) 151,032 - 20,595 - - 143,872 42,496 357,995 AKT Yuen (6) 220,000 - 30,000 22,500 - 25,000 - 297,500
Total 2,882,699 177,500 200,595 117,500 60,000 627,200 42,496 4,107,990
(1) Mrs Cross receives a fee in respect of services performed as non-executive director of JBWere Pty Ltd. (2) Dr Henry was appointed a non-executive director on 1 November 2011.(3) Mr Tomlinson receives fees in respect of services performed as Chairman of National Wealth Management Holdings Limited, MLC Limited, MLC Investments Limited, MLC Wealth Management Limited, WM
Life Australia Ltd and Navigator Australia Ltd (all subsidiaries of the Company).(4) Mr Waller receives fees in respect of services performed as Chairman of Bank of New Zealand, which are paid in NZD.(5) Sir Malcolm Williamson retired as a director of the Company on 7 June 2012 and as Chairman of National Australia Group Europe Limited and Clydesdale Bank PLC on 23 July 2012. The fees shown,
which are paid in GBP, are pro-rated up until his retirement from the Company on 7 June 2012. Sir Malcolm Williamson received a non-monetary benefit in relation to UK National Insurance Contributions. An amount of $108,252 (paid in GBP) was paid to Sir Malcolm Williamson related to services provided from 8 June 2012 until his retirement as Chairman of National Australia Group Europe Limited and Clydesdale Bank PLC.
(6) Mr Yuen receives fees in respect of services performed on the Asia Management Board.

2012 Annual Financial Report 35
Report of the Directors
Board and committee fee schedule
The following table shows the annual fees paid to the Chairman and non-executive directors on the Board, and to non-executive directors who participate on Board Committees:
Chairman ($pa) Director ($pa)
Board 770,000 220,000
Chairman ($pa) Director ($pa)
Audit Committee 60,000 30,000 Risk Committee 60,000 30,000 Remuneration Committee 50,000 22,500 Information Technology Committee 30,000 15,000
Non-executive director remuneration
The following table sets out the nature and amount of each element of remuneration of non-executive directors of the Company in relation to services they provided in the 2012 year. No performance options or performance rights are granted to non-executive directors.
Short-term benefits
Post- employment
benefits Total
Cash salary and fees (1) fixed Non-monetary (2)
Super-annuation (3)
fixedName $ $ $ $
MA Chaney 2012 754,051 - 15,949 770,000
2011 754,657 - 15,343 770,000 PA Cross 2012 324,472 - 20,528 345,000
2011 310,459 - 34,541 345,000 DT Gilbert 2012 233,385 - 39,115 272,500
2011 211,269 - 46,231 257,500 KR Henry (for part year) (4) 2012 214,127 - 15,040 229,167 PJ Rizzo 2012 281,250 - 43,750 325,000
2011 267,500 - 50,000 317,500 JS Segal 2012 264,051 - 15,949 280,000
2011 264,657 - 15,343 280,000 JG Thorn 2012 279,051 - 15,949 295,000
2011 272,157 - 15,343 287,500 GA Tomlinson 2012 504,051 - 15,949 520,000
2011 504,657 - 15,343 520,000 JA Waller 2012 399,879 - 15,949 415,828
2011 363,880 - 50,144 414,024 GM Williamson (for part year) (5) 2012 315,499 42,496 - 357,995
2011 469,508 61,109 - 530,617 AKT Yuen 2012 294,022 - 3,478 297,500
2011 291,376 - 6,124 297,500
Total 2012 3,863,838 42,496 201,656 4,107,990 Total 2011 3,710,120 61,109 248,412 4,019,641
(1) Non-executive directors’ remuneration represents fees in connection with their roles, duties and responsibilities as a non-executive director, and includes attendance at meetings of the Board, of Board Committees and boards of controlled entities.
(2) Sir Malcolm Williamson received a non-monetary benefit in relation to UK National Insurance Contributions.(3) Reflects compulsory Company contributions to superannuation and, where applicable, includes additional superannuation contributions made by the Company, in lieu of payment of fees, at the election of
the non-executive director.(4) Dr Henry was appointed a non-executive director on 1 November 2011.(5) Sir Malcolm Williamson retired as a director of the Company on 7 June 2012 and as Chairman of National Australia Group Europe Limited and Clydesdale Bank PLC on 23 July 2012. The fees shown, which
are paid in GBP, are pro-rated up until his retirement from the Company on 7 June 2012. An amount of $108,252 (paid in GBP) was paid to Sir Malcolm Williamson related to services provided from 8 June 2012 until his retirement as Chairman of National Australia Group Europe Limited and Clydesdale Bank PLC.

36 NATIONAL AUSTRALIA BANK
Report of the DirectorsOther remuneration disclosuresThe UK regulator, the Financial Services Authority (FSA), has issued disclosure requirements within its ‘Prudential Sourcebook for Banks, Building Societies and Investment Firms’ (BIPRU). The tables below reflect the remuneration disclosure requirements of BIPRU 11.5.18 for the Group’s UK businesses.
The following groups of employees have been identified as meeting the FSA’s criteria for Remuneration Code Staff (Code Staff): • Senior Management – including members of the Group Executive Committee, the UK Executive Committee, and senior management in both the UK
Banking and Wholesale Banking UK businesses; and • Other Code Staff – including non-executive directors of the UK board, non-executive directors of the Principal Board with specific responsibilities
in relation to the UK operations, employees performing Significant Influence Functions, employees who have responsibility and accountability that could have a material impact on the business and employees in key control function roles.
Remuneration policy
The Group operates an enterprise-wide remuneration policy. The remuneration policy and framework described in this report applies to Code Staff. Further information on the Group’s Performance and Reward framework is available at www.nabgroup.com.
‘At risk’ reward programs
The majority of Code Staff are covered by the Group’s STI plan, as described in the Senior executive remuneration section. A small number of Other Code Staff are eligible to participate in STI plans specific to their roles. These plans are designed in line with the Group’s Remuneration Policy. Payments under these plans are linked to profit measures specific to the individual’s role.
Deferral and retention arrangements
For a number of senior managers, three year deferral applies to the total quantum of variable reward paid with no more than a third of total variable reward vesting in any year. Remaining Code Staff have deferral and retention arrangements applying to any variable reward payment they receive in line with the FSA’s requirements. All deferred amounts are provided as Company equity. Deferred amounts may be partially or fully reduced subject to the Committee’s review of business performance and risk outcomes during the deferral period and approval by the Board, or where the employee resigns, is dismissed or fails the Compliance Gateway.
A further retention period of six months will apply to half of any up-front 2012 STI payments to Code Staff and a further six month retention period will apply to deferred STI and LTI after performance conditions have been satisfied. The retained amounts will be provided as Company equity. No further performance conditions apply to retention equity, however they will be fully lapsed if the employee fails the Compliance Gateway during the retention period.
Aggregate 2012 remuneration of Code Staff by operating segment
Wholesale Banking UK UK Banking
Group Functions
and Other (1) Total
Number of Code Staff 17 30 25 72Total remuneration ($m) 16.1 7.9 13.4 37.4
(1) Includes non-executive directors, risk employees and other Group-based employees.
Aggregate 2012 remuneration of Code Staff by remuneration typeSenior
ManagementOther Code
Staff Total
Number of Code Staff 17 55 72
Senior Management
Other Code Staff Total
$m $m $m
Fixed remuneration 9.7 11.6 21.3
Variable remuneration (cash) 2.5 2.6 5.1 Variable remuneration (retained shares) 1.2 2.3 3.5 Deferred remuneration (equity) (1) 1.3 6.2 7.5
Total variable remuneration 5.0 11.1 16.1
Total remuneration 14.7 22.7 37.4
(1) The Group provides all deferred remuneration in Company equity. The amount shown includes any LTI awards.
2012 Code Staff deferred remunerationSenior
ManagementOther Code
Staff Total$m $m $m
Outstanding - vested 3.5 1.3 4.8 Outstanding - unvested 34.9 5.5 40.4 Awarded during the year 12.6 3.8 16.4 Reduced during the year through performance adjustments (6.9) (1.9) (8.8)Vested during the year 11.8 6.4 18.2

2012 Annual Financial Report 37
Report of the DirectorsOther 2012 disclosures for Code Staff
Senior Management
Other Code Staff Total
Total sign-on awards ($m) (1) - - - Number of beneficiaries - - - Total commencement awards ($m) (1) - - - Number of beneficiaries - - - Total termination payments ($m) - 0.4 0.4 Number of beneficiaries - 4 4 Highest award to a single beneficiary ($m) - 0.3 0.3
(1) No sign-on bonuses or commencement awards were provided to Code Staff during 2012.

38 NATIONAL AUSTRALIA BANK
Report of the DirectorsAppendices
Insider trading and derivatives policy
The Group Securities Trading Policy specifically prohibits directors and employees from protecting the value of unvested securities (including unvested LTI or deferred STI) with derivative instruments consistent with the Corporations Act 2001 (Cth) requirements on hedging. Directors and employees can protect the value of vested securities in limited circumstances. Further details on the Group Securities Trading Policy are set out in the Corporate governance section. The Group Securities Trading Policy is available online at www.nabgroup.com.
The Group treats compliance with the Group Securities Trading Policy as a serious issue, and takes appropriate measures to ensure adherence to the policy. These measures include imposing employee trading blackout periods prior to each results announcement, and at other relevant times. All ‘designated employees’, as defined by the policy, are required to complete a compliance certificate prior to any trading in Company securities to confirm that they do not hold any price-sensitive information, and the policy prevents short-term or speculative trading. Any person found to be in breach of the policy is subject to appropriate sanctions, which could include forfeiture of the relevant securities and/or termination from the Group.
Table of key terms
The following key terms and abbreviations are used in the Remuneration report:Term Used Description
Cash earnings The STI and LTI programs use a measure of cash earnings. For senior executives, this is for the consolidated Group. Cash earnings is a key financial performance measure used by the Company, the investment community and the Company’s Australian peers with similar business portfolios. The Company also uses cash earnings for its internal management reporting as it better reflects what the Company considers to be the underlying performance of the Group. It is not a statutory financial measure and is not presented in accordance with Australian Accounting Standards nor audited or reviewed in accordance with Australian Auditing Standards. ‘Cash earnings’ is calculated by excluding some items which are included within the statutory net profit attributable to owners of the Company. Cash earnings is defined in the Glossary of the Financial report. Note 2 of the Financial report provides a reconciliation between cash earnings and statutory net profit attributable to owners of the Company.
Commencement awards Buy-out of unvested equity or performance-based award from previous employment. The amount, timing and performance hurdles relevant to any such awards must be based on evidentiary information. The awards are primarily provided in the form of shares, performance options and performance rights, subject to performance hurdles, restrictions and certain forfeiture conditions, including forfeiture on resignation unique to each offer.
Compliance gateway All employees must satisfy threshold measures for compliance which reflect a range of internal and external regulatory requirements.
Deferred STI performance rights Deferred STI performance rights are restricted for at least one year. They are provided in respect of prior year(s) performance and are subject to performance conditions. Performance rights will lapse if the performance conditions are not achieved, if the participant fails to meet individual performance standards or the Compliance Gateway, or if the Board exercises its discretion to lapse. If performance rights are retained on cessation of employment, the number of performance rights retained will remain subject to the normal timetable and performance hurdles of the initial grant. No amounts are paid by participants for the grant of performance rights. Performance rights have no exercise price. No dividend income is provided to the employee until the end of the restriction period and the performance conditions have been met.
Deferred STI shares Deferred STI shares are Company ordinary shares, allocated at no charge to the employee, in respect of prior year(s) performance, which provide dividend income to the employee from allocation. The shares are held on trust for at least one year, are restricted from trading and may be fully or partially forfeited if individual or business performance warrants. The shares are forfeited if the participant fails to meet the Compliance Gateway, or if they resign or are dismissed. The shares may be retained on cessation of employment in other circumstances.
Enterprise behaviours Enterprise behaviours are the foundation of the Group’s culture and brand and define how employees relate to one another, work together and interact with customers and communities. They are to: · be authentic and respectful; · work together; and · create value through excellence.
Group Executive Committee The Group’s leadership team, comprising the individuals listed in the section: Senior executive remuneration.
Key management personnel (KMP) Key executives of the Group and Company who have the authority and responsibility for planning, directing and controlling the activities of the Group, directly or indirectly, including any director (whether executive or otherwise) as defined in AASB 124 “Related Party Disclosures”.
Long-term incentive (LTI) An ‘at risk’ opportunity for individuals linked to the long-term performance of the Group. LTI is allocated under the Group’s program in the form of LTI shares or performance rights. The LTI program is described in the section: Long-term incentive.
LTI performance rights A performance right is a right to acquire one Company ordinary share. Performance rights are restricted for at least three years and are subject to achievement of performance hurdles. Performance rights will lapse if the performance hurdles are not achieved, if the participant fails to meet individual performance standards or the Compliance Gateway, or if the Board exercises its discretion to lapse. If performance rights are retained on cessation of employment, the number of performance rights retained will be based on the elapsed time within the performance period as at the time of cessation. The performance hurdles remain subject to the normal timetable and performance hurdles of the initial grant. No amounts are paid by participants for the grant of performance rights. Performance rights have no exercise price.
LTI shares LTI shares are Company ordinary shares, allocated at no charge to the employee, which provide dividend income to the employee from allocation. The shares are held in trust for at least three years on the employee’s behalf, are restricted from trading and are forfeited if the performance hurdles are not achieved, if the participant fails to meet individual performance standards or the Compliance Gateway, or if they resign or are dismissed. The shares are retained on cessation of employment in other circumstances (unless the Board determines otherwise) with vesting still subject to the performance hurdles.
Performance options A performance option is a right to acquire one Company ordinary share, once the performance option has vested based on achievement of the related performance hurdle or at the Board’s discretion. The performance option is issued at no charge to the employee. To acquire a share, the holder must pay the exercise price, which is generally the weighted average price at which Company ordinary shares traded on the ASX over the one week up to and including the grant date of the performance options. The lapsing of performance options is described in the section: Summary of prior LTI grants.

2012 Annual Financial Report 39
Report of the DirectorsTerm Used Description
Performance rights A performance right, such as an LTI Performance right (as described above), is a right to acquire one Company ordinary share, once the performance right has vested based on achievement of the related performance hurdle or at the Board’s discretion. A performance right is similar to a performance option as described above, except that there is no exercise price to be paid to exercise the performance right. Performance rights may be used instead of shares due to jurisdictional reasons including awards such as deferred STI, UK retention and Commencement and other retention programs. The terms and conditions, including lapsing, will vary for each particular grant.
Return on Equity (ROE) ROE is calculated as cash earnings divided by average shareholders’ equity, excluding non-controlling interests and other equity instruments and adjusted for treasury shares. It allows for risk to the extent that actual equity aligns with target equity and Risk Weighted Assets (RWA). RWA measures the risk exposure of the Group’s assets that are used to determine quantitative minimum capital requirements. ROE also measures inorganic growth. For senior executives, the STI and LTI programs use ROE performance for the consolidated Group.
Return on Total Allocated Equity (ROTAE) ROTAE is a function of cash earnings, combined divisional Risk Weighted Assets (and by capital adequacy for Wealth Management) and target regulatory capital ratios.
Senior executives Defined in this report as current and former members of the Group Executive Committee, comprising the individuals listed in the Statutory remuneration data tables.
Short-term incentive (STI) An ‘at risk’ opportunity for individuals to receive an annual bonus. Each employee has a short-term incentive target (STI Target) which is usually described as a percentage of their fixed remuneration (e.g. 20% of TEC). The actual STI reward that an individual will receive in any particular year will reflect both business and individual performance as set out in the section: STI rewards. STI rewards may be allocated in the form of deferred STI shares as described above under Deferred STI shares.
Sign-on bonuses Discretionary amounts provided to employees on commencement with no linkage to prior employment.
Top 50 Companies The top 50 companies in the Standard & Poors (S&P)/ASX100 by market capitalisation, excluding the Company, determined on or around the effective date of the LTI award. The Top 50 Companies is used as a measure for the LTI performance hurdle.
Top Financial Services The top financial services companies in the S&P/ASX200 (approximately 12 companies) by market capitalisation, excluding the Company, determined on or around the effective date of the LTI award. The Top Financial Services is used as a measure for the LTI performance hurdle.
Total business return (TBR) Total Business Return (TBR) is a value management tool using the metrics of ROE and cash earnings growth to provide an assessment of relative value creation.
Total employment compensation (TEC) The Group’s primary measure of fixed remuneration, or salary paid to employees, is called Total Employment Compensation (TEC). It includes employer and employee superannuation contributions (where applicable), but does not include STI or LTI. A portion of TEC may be taken in the form of packaged, non-monetary benefits (such as motor vehicle and parking) and associated fringe benefits tax. Senior executives are also eligible to participate in other benefits that are normally provided to executives of the Group, subject to any overriding legislation prevailing at the time including the Corporations Act 2001 (Cth).
Total remuneration package (TRP) TEC (as above) less employer superannuation contributions (where applicable).
Total reward Overall remuneration, comprising fixed remuneration (TEC) and ‘at risk’ remuneration (STI and LTI) as defined in this table.
Total shareholder return (TSR) A measure of the return that a shareholder receives through dividends (and any other distributions) together with capital gains over a specific period. TSR is calculated on the basis that all dividends and distributions are reinvested in Company shares. TSR is an external measure which aligns shareholder wealth creation and market expectations for employee equity plans. TSR is a common measure for the LTI performance hurdle.

40 NATIONAL AUSTRALIA BANK
Report of the DirectorsDirectors’ signatures
This report of directors signed in accordance with a resolution of the directors:
Michael A ChaneyChairman
Cameron A ClyneGroup Chief Executive Officer
19 November 2012

2012 Annual Financial Report 41
Corporate governanceThe Board of directors of the Company is responsible for the governance of the Company and its controlled entities (the Group). Good corporate governance is a fundamental part of the culture and business practices of the Group. The key aspects of the Group’s corporate governance framework and primary corporate governance practices for the 2012 year are outlined below.
The Board of directors
The role and responsibilities of the Board
The Board has adopted a formal charter that details the functions and responsibilities of the Board. A copy of the charter is available in the Corporate governance section of the Group’s website at www.nabgroup.com.
The Board’s most significant responsibilities are:
Stakeholder interests
• guiding the Group with a view to long-term returns for shareholders having regard to the interests of other stakeholders, including customers, regulators, staff and the communities in the regions in which the Group operates;
• providing strategic direction to the Group with a focus on consistent business performance, behaviour, transparency and accountability; and
• reviewing and monitoring corporate governance and corporate social responsibility throughout the Group.
Strategy
• reviewing, approving and monitoring corporate strategy and plans; • making decisions concerning the Group’s capital structure and
dividend policy; and • reviewing, approving and monitoring major investment and
strategic commitments.
Performance
• reviewing business results; and • monitoring budgets.
Integrity of external reporting
• reviewing and monitoring the processes, controls and procedures which are in place to maintain the integrity of the Group’s accounting and financial records and statements with the guidance of the Audit Committee; and
• reviewing and monitoring reporting to shareholders and regulators, including the provision of objective, comprehensive, factual and timely information to the various markets in which the Company’s securities are listed.
Risk management and compliance
• monitoring and reviewing the risk management processes, the Group’s risk profile and the processes for compliance with prudential regulations and standards and other regulatory requirements; and
• reviewing and monitoring processes for the maintenance of adequate credit quality with the guidance of the Risk Committee.
Executive review, succession planning and culture
• approving key executive appointments and remuneration, and monitoring and reviewing executive succession planning and diversity;
• reviewing and monitoring the performance of the Group Chief Executive Officer and senior management; and
• monitoring and influencing the Group’s culture, reputation and ethical standards.
Board performance
• monitoring Board composition, director selection, Board processes and performance with the Nomination Committee’s guidance.
The Board has reserved certain powers for itself and delegated authority and responsibility for day-to-day management of the Company to the Group Chief Executive Officer. Delegations are subject to strict limits. The Group Chief Executive Officer’s authorities and responsibilities include: • development and implementation of Board approved strategies; • setting operational plans within a comprehensive risk management
framework; and • sound relationship management with the Group’s stakeholders.
All delegated authorities provided by the Board to the Group Chief Executive Officer are reviewed and reconfirmed annually or as required.
Composition of the Board
The current members of the Board and the period each member has been in office are set out in the Report of the Directors.
The composition of the Board is driven by the following principles: • the Board will be of an appropriate size to allow efficient decision
making; • the Chairman of the Board should be an independent non-
executive director; • the Chairman must not be a former executive officer of the Group; • the Board should comprise a majority of independent non-
executive directors; and • the Board should consist of directors with a broad range
of expertise, skills and experience from a diverse range of backgrounds, including sufficient skills and experience appropriate to the Group’s business.
The Chairman is an independent non-executive director and is not a former executive of the Group. The roles of the Chairman and Group Chief Executive Officer are not exercised by the same individual.
The Company’s Constitution provides that the Company is to have not less than five, nor more than 14 directors. At the date of this report, the Board consisted of 12 directors, comprising:• 10 independent non-executive directors, including the Chairman;
and• two executive directors, being the Managing Director and Group
Chief Executive Officer, and the Executive Director, Finance.
The Board requires that each of its directors possess unquestionable integrity and good character. The Nomination Committee identifies other appropriate skills and characteristics required by the Board and individual directors in order for the Company to fulfil its goals and its responsibilities to shareholders and other key stakeholders.
The Company has established a Board approved ‘Fit and Proper’ Policy (Policy) that meets the requirements of Prudential Standard APS 520 “Fit and Proper” (the Standard) issued by the Australian Prudential Regulation Authority (APRA). The Policy requires all ‘responsible persons’, as defined by the Standard, to be assessed as meeting the criteria to ensure that they are ‘Fit and Proper’. The Standard requires directors, senior management and auditors of an authorised deposit-taking institution to be assessed to determine whether or not they have the appropriate skills, experience and knowledge to perform their role. They also need to be able to establish that they have acted with honesty and integrity.
There were two changes to the composition of the Board during the year. Sir Malcolm Williamson retired from the Board in June 2012 and Dr Henry was appointed a director in November 2011.
The skills, experience, expertise and commencement dates of the directors are set out in the Report of the Directors.

42 NATIONAL AUSTRALIA BANK
Corporate governanceChairman
The Chairman of the Company is responsible for leading the Board and ensuring that it is operating to the appropriate governance standards.
The Company’s Chairman is Mr Chaney. Mr Chaney has been Chairman of the Company since 2005 and a non-executive director since 2004.
Mr Chaney has skills and experience across a broad portfolio of industries and companies, including corporate, mining, investment and general banking. A detailed list of his positions outside the Company and prior experience can be found in the Report of the Directors.
The Board considers that none of Mr Chaney’s positions held outside the Company interfere with his ability to execute and fulfil all of his obligations and responsibilities to the Board and the Company.
Independence of directors
Directors are expected to bring independent views and judgement to Board deliberations. An independent director must be independent of management and able to exercise unfettered and independent judgement, free of any business or other relationship that could materially interfere with the exercise of the director’s ability to act in the best interests of the Company.
A register of directors’ material interests is maintained and is regularly sent to each director for their review. If a director is involved with another company or professional firm, which may have dealings with the Company, such dealings are at arm’s length and on normal commercial terms.
In assessing whether a director is independent, the Board has regard to the standards it has adopted that reflect the independence requirements of applicable laws, rules and regulations, including the ASX Corporate Governance Principles and Recommendations.
To assist the Board in determining independence, each non-executive director is required to make an annual disclosure of all relevant information to the Board. Any assessment of independence for a non-executive director who does not meet the independence standards adopted by the Board will be specifically disclosed to the market.
The Board has determined that all non-executive directors of the Company are independent. The Company’s independent directors (together with the period they have been in office) are identified in the Report of the Directors.
The Board has procedures in place to ensure it operates independently of management. This is achieved by the non-executive directors meeting together in the absence of management at each scheduled Board and Board Committee meeting.
Tenure
The tenure of a director is a factor taken into account by the Board in assessing the independence of a director. However, the Board does not consider that term of service on the Board should be considered as a sole determining factor affecting a director’s independence or the ability to act in the best interests of the Company. As a guide, most directors would retire after serving 10 years on the Board.
Mr Tomlinson has served on the Board for more than 10 years from the date of his first election. Having considered the significant contribution Mr Tomlinson brings to the Board, specifically in relation to the wealth operations of the Group, the Board is satisfied that Mr Tomlinson has retained independence of character and judgement and has not formed associations with management (or others) that might compromise his ability to exercise independent judgement or act in the best interests of the Company.
Conflicts of interest
Directors are expected to avoid any action, position or interest that conflicts or appears to conflict with an interest of the Group. This is a matter for ongoing consideration by all directors, and any director who has a material personal interest in a matter relating to the Group’s affairs must notify the other directors of that interest.
The Corporations Act 2001 (Cth), together with the Company’s Constitution, require that a director who has a material personal interest in a matter that is being considered at a directors’ meeting cannot be present while the matter is being considered at the meeting or vote on the matter, except in the following circumstances: • the directors without a material personal interest in the matter
have passed a resolution that identifies the director, the nature and extent of the director’s interest in the matter and its relation to the affairs of the Company, which states that the remaining directors are satisfied that the interest should not disqualify the director from voting or being present;
• ASIC has made a declaration or order under the Corporations Act 2001 (Cth), which permits the director to be present and vote even though the director has a material personal interest;
• there are not enough directors to form a quorum for a directors’ meeting because of the disqualification of the interested directors, in which event one or more of the directors (including a director with a material personal interest) may call a general meeting to address the matter; or
• the matter is of a type which the Corporations Act 2001 (Cth) specifically permits the director to vote upon and to be present at a directors’ meeting during consideration of the matter notwithstanding the director’s material personal interest.
Even though the Corporations Act 2001 (Cth) and the Company’s Constitution allow these exceptions, the Group’s corporate governance standards dictate that when a potential conflict of interest arises, the director concerned will not receive copies of the relevant Board papers and will not be present at the Board meeting while such matters are considered. Accordingly, in such circumstances, the director concerned takes no part in discussions and exercises no influence over other members of the Board. If a significant conflict of interest with a director exists and cannot be resolved, the director is expected to tender his or her resignation after consultation with the Chairman.
The provision of financial services to directors by the Company is subject to any applicable legal or regulatory restrictions, including the Corporations Act 2001 (Cth). Financial services are provided to directors on arm’s length terms and conditions.
Refer to Note 46 in the Financial report for further information, including details of related party dealings and transactions.
Appointment and re-election of Board members
The Nomination Committee, using a skills matrix that enables the Committee to assess the skills and the experience of each director and the combined capabilities of the Board, undertakes a review of Board composition and skills. The results of this review are considered in the context of the Group’s operations and strategy and the need for diversity on the Board (refer to the Diversity section) and are then incorporated into the selection process for new directors.
The process for appointing a director is that, when a vacancy exists, the Nomination Committee assesses the skills and experience required and then identifies candidates with the appropriate expertise and experience, using external consultants as appropriate. The most suitable candidate is appointed by the Board but must stand for election by shareholders at the next Annual General Meeting of the Company.
The Company has formal letters of appointment for each of its directors, setting out the key terms and conditions of the appointment.

2012 Annual Financial Report 43
Corporate governanceThe process of election and re-election of a director is in accordance with Article 10.3 of the Company’s Constitution. Article 10.3 requires that at each Annual General Meeting directors who have held office without re-election for at least three years, or beyond the third Annual General Meeting following their appointment (whichever is the longer period), and directors appointed during the year are required to retire from office at the Annual General Meeting and are eligible to stand for re-election and election. Article 10.3 does not apply to the Group Chief Executive Officer.
Before each Annual General Meeting, the Board assesses the performance of each director due to stand for re-election, and the Board decides whether to recommend to shareholders that they vote in favour of the re-election of each director.
The commencement dates of the directors are set out in the Report of the Directors.
Induction and continuing education
Management, working with the Board, provides an orientation program for new directors. The program includes discussions with executives and management, reading material, tutorials and workshops. These cover the Group’s strategic plans, its significant financial, accounting and risk management issues, its compliance programs, its management structure, its internal and external audit programs, its Code of Conduct, its Enterprise Behaviours (which provide the foundation of the culture of the Group and its brands) and director’s rights, duties and responsibilities. Management periodically conducts additional presentations and tutorial sessions for directors about the Group, and the factors impacting, or likely to impact, on its businesses. These assist non-executive directors to gain a broader understanding of the Group. Directors are also encouraged to keep up-to-date on topical issues.
Board meetings
Directors are expected to prepare adequately for, attend and participate at Board meetings and meetings of Board Committees. Directors are also expected to attend site visits. The Board aims to meet once a year in each of the United Kingdom and New Zealand, where the Company has significant business interests. This allows directors to meet customers, employees and other stakeholders in those regions.
The number of Board meetings and each director’s attendance at those meetings are set out in the Report of the Directors. Members of the Board also meet with key regulators in various jurisdictions throughout the year.
Performance of the Board, its Committees and individual directors
The Board conducts an annual assessment of the performance and effectiveness of the Board as a whole and of its Committees and individual directors. Performance of each Committee of the Board is initially discussed and reviewed within each Committee and then subsequently reviewed as part of the Board’s annual assessment.
Each director participates in individual interviews with the Chairman. External experts are engaged as required to review aspects of the Board’s activities and to assist in a continuous improvement process to enhance the overall effectiveness of the Board. When external experts are engaged, the results of the evaluations are compiled to include a quantitative and qualitative analysis and a written report is provided to the Chairman. The external expert’s report disclosing the overall results, and the various issues for discussion and recommendations for initiatives, are presented to the Board for discussion.
This process is designed to assist the Board in fulfilling its functions and ensuring that it remains an effective decision-making body. The annual performance evaluation for the Board, its Committees
and the individual directors did not utilise an external expert in 2012 but otherwise has been conducted in accordance with the process disclosed in this report.
Remuneration arrangements
The remuneration policy for the Board and the remuneration of each director is set out in both the Remuneration report, which forms part of the Report of the Directors, and in Note 46 in the Financial report.
Access to management
Board members have complete and open access to management through the Chairman, Group Chief Executive Officer or Group Company Secretary at any time. In addition to regular presentations by management to Board and Board Committee meetings, directors may seek briefings from management on specific matters. The Board also consults with other Group employees and advisers and seeks additional information, where appropriate.
The Group Company Secretary also provides advice and support to the Board and is responsible for managing the Group’s day-to-day governance framework.
Access to independent professional advice
Written guidelines entitle each director to seek independent professional advice at the Company’s expense, with the prior approval of the Chairman.
The Board can conduct or direct any investigation to fulfil its responsibilities and can retain, at the Company’s expense, any legal, accounting or other services that it considers necessary from time-to-time to perform its duties.
Shareholding requirements
Within six months of appointment, the Company’s Constitution requires that a director must hold at least 2,000 fully paid ordinary shares in the Company. Executive directors may receive shares, performance options and performance rights, as approved by shareholders. Non-executive directors do not receive any securities via incentive schemes.
Details of directors’ shareholdings in the Company are set out in the Report of the Directors and Note 47 in the Financial report.
Company secretaries
All company secretaries are appointed and removed by the Board. Further detail on each company secretary is provided in the Report of the Directors.
Senior executives
Information on the performance evaluation and structure of remuneration for the Company’s senior executives can be found in the Remuneration report, which forms part of the Report of the Directors.

44 NATIONAL AUSTRALIA BANK
Corporate governanceBoard and Committee operations
To help it carry out its responsibilities, the Board has established the following Committees:• Audit Committee; • Risk Committee; • Remuneration Committee; and • Nomination Committee.
The Board has adopted charters for each Committee setting out the matters relevant to the composition, responsibilities and administration of each Committee. The Board has also created sub-committees to assist the Board in the oversight of specific areas that may require more detailed attention including technology, litigation, and capital and funding (refer to the Other Committees section).
Following each Committee meeting, the Board receives a copy of the minutes of meeting from the relevant Committee. Further, on an annual basis, the Board receives a report from each Committee on its activities undertaken during the year. The qualifications of each Committee’s members and the number of meetings they attended during the 2012 year are set out in the Report of the Directors.
The Office of the Company Secretary provides secretariat support for the Board and each of the Committees. The Group Company Secretary is responsible for advising the Board on governance matters and ensuring compliance with Board and Board Committee procedures.
Audit Committee Risk Committee Remuneration Committee Nomination Committee
Members Mr John Thorn (Chairman) Mr Paul Rizzo (Chairman) Mrs Patricia Cross (Chairman) Mr Michael Chaney (Chairman)Dr Kenneth Henry Mrs Patricia Cross Mr Daniel Gilbert Mrs Patricia CrossMr Paul Rizzo Ms Jillian Segal Mr Geoff Tomlinson Mr Daniel GilbertMs Jillian Segal Mr John Waller Mr Anthony Yuen Dr Kenneth HenryMr John Waller Mr Anthony Yuen Mr Paul Rizzo
Ms Jillian SegalMr John ThornMr Geoff TomlinsonMr John WallerMr Anthony Yuen
Composition Minimum three Minimum three Minimum three Minimum threeAll members are non-executive directors
All members are non-executive directors
All members are non-executive directors
All members are non-executive directors
One member must also be a member of the Risk Committee
One member must also be a member of the Audit Committee
Responsibilities:
Audit Committee
• integrity of the accounting and financial reporting processes of the Group;
• Group’s external audit; • Group’s internal audit; • compliance with applicable accounting standards to give a true and
fair view of the financial position and performance of the Group; • oversight of management in the preparation of the Group’s
financial statements and financial disclosures; • oversight of the work of the external auditor; and • setting, approval and regulation of the annual fee limit for each
type of audit or non-audit service to be provided by the external auditor.
Risk Committee
• review and oversight of the risk profile of the Group within the context of the Board approved risk appetite;
• making recommendations to the Board concerning the Group’s risk appetite and particular risks or risk management practices of concern to the Committee;
• review of management’s plans for mitigation of material risks faced by the various business units of the Group; and
• promoting awareness of a risk-based culture and the achievement of a balance between risk and reward for the risks accepted.
Remuneration Committee
• oversee the Group’s general performance and reward strategy; • review and make recommendations to the Board concerning:
• remuneration policy and Total Reward packages for the Group Chief Executive Officer, direct reports and other persons whose activities may affect the financial soundness of the Company or its subsidiaries;
• remuneration arrangements for non-executive directors (as detailed in the Remuneration report);
• arrangements for recruiting, retaining and terminating senior executives; and
• support the Board with monitoring the application of the principles and framework required for measuring the compliance, culture and behavioural requirements of the Group.
Nomination Committee
• Board performance and the methodology for Board performance reviews;
• Board and Committee membership and composition; and • succession planning for the Board.

2012 Annual Financial Report 45
Corporate governanceAudit Committee
The Audit Committee assists the Board in carrying out its responsibility to exercise due care, diligence and skill by maintaining oversight of the Group’s:• internal control systems;• compliance with applicable laws and regulations; and• accounting policies and procedures designed to safeguard
company assets and maintain financial disclosure integrity,in relation to external financial reporting.
All members of the Audit Committee must be independent, non-executive directors. Independence for these purposes is determined in accordance with the standard adopted by the Board, which reflects the independence requirements of applicable laws, rules and regulations, including the ASX Corporate Governance Principles and Recommendations.
It is a requirement that all members of the Audit Committee be financially literate and have a range of different backgrounds, skills and experience, having regard to the operations and financial and strategic risk profile of the Group. The experience and qualifications of members of the Audit Committee are detailed in the Report of the Directors. The Board recognises the importance of the Audit Committee having at least one member with appropriate accounting or financial expertise, as required by applicable laws, ASX Corporate Governance Principles and Recommendations and listing standards.
The Chairman of the Board cannot be a member of the Audit Committee.
The Audit Committee’s role, responsibilities, composition and membership requirements are documented in the Audit Committee charter approved by the Board, which is available in the Corporate governance section of the Group’s website at www.nabgroup.com.
The Audit Committee has the authority to conduct or direct any investigation required to fulfil its responsibilities and has the ability to retain, at the Company’s expense, such legal, accounting or other advisers, consultants or experts as it considers necessary from time-to-time in the performance of its duties.
The Audit Committee relies on the information provided by management and the external auditor. The Audit Committee does not have the duty to plan or conduct audits or to determine that the Group’s financial statements and disclosures are complete and accurate.
Access to the Audit Committee
To draw appropriate matters to the attention of the Audit Committee, the following individuals have direct access to the Audit Committee: Group Chief Executive Officer; Executive Director, Finance; Executive General Manager Finance; Group Chief Risk Officer; General Counsel Corporate; Chief Audit Officer; and the external auditor. ‘Direct access’ means that the person has the right to approach the Committee without having to proceed via normal reporting line protocols.
Other employees of the Group may have access to the Audit Committee through the ‘Whistleblower Protection Program’. Refer to the Code of conduct section for further information on the ‘Whistleblower Protection Program’.
Audit Committee finance professional
Although the Board has determined that Mr Thorn (as Chairman of the Audit Committee) has the requisite attributes defined under applicable governance principles and recommendations, his responsibilities are the same as those of the other Audit Committee members. He is not an auditor or accountant for the Company, does not perform ‘field work’ and is not an employee of the Company.
Activities during the year
Key activities undertaken by the Audit Committee during the year include: • review of the scope of the annual audit plans for 2012 of the
external auditor and internal auditor, and oversight of the work performed by the auditors throughout the year;
• review of significant accounting, financial reporting and other issues raised by management, and the internal and external auditors;
• review of the performance and independence of the external auditor and internal auditor, together with their assurances that all applicable independence requirements were met;
• holding of separate meetings, without the presence of management, with Internal Audit and key partners from the external auditor, Ernst & Young;
• consideration and recommendations to the Board on significant accounting policies and areas of accounting judgement;
• review and recommendations to the Board for the adoption of the Group’s half-year and annual financial statements; and
• regular review of minutes and updates from subsidiary board audit committee meetings.
The Audit Committee met eight times during the 2012 year. Senior representatives from Ernst & Young and Internal Audit attended every scheduled meeting of the Audit Committee throughout the period. The Chairs of each main subsidiary board audit committee met during the 2012 financial year, to discuss and share current issues and challenges in their respective jurisdictions of the United Kingdom, the United States, Australia and New Zealand. This meeting is chaired by the Chairman of the Board Audit Committee.
External auditor
The Audit Committee is responsible for the selection, evaluation, compensation and, where appropriate, replacement of the external auditor, subject to shareholder approval where required.
The Audit Committee ensures that the lead external audit partner and concurring review partner must rotate off that role every five years or, if they have acted in that capacity for five out of the last seven successive financial years, will be subject to a two year ‘cooling off’ period following rotation. The Audit Committee and the Board may resolve to extend the five year period by not more than two successive years, subject to compliance with the Corporations Act 2001 (Cth).
The Audit Committee meets with the external auditor throughout the year to review the adequacy of the existing external audit arrangements with particular emphasis on the effectiveness, performance and independence of the audit.
The Audit Committee receives assurances from the external auditor that they meet all applicable independence requirements in accordance with the Corporations Act 2001 (Cth) and the rules of the professional accounting bodies. This independence declaration forms part of the Report of the Directors.
The external auditor attends the Group’s Annual General Meeting and is available to answer shareholder questions regarding aspects of the external audit and their report.
Details of the services provided by Ernst & Young to the Group and the fees paid or due and payable for those services are set out in the Report of the Directors and Note 48 in the Financial report.
Internal audit
The Audit Committee is responsible for assessing whether the Internal Audit function is independent of management and is adequately resourced and funded. The Audit Committee also assesses the performance of the Chief Audit Officer, Internal Audit and may recommend to the Board the appointment and dismissal of
46 NATIONAL AUSTRALIA BANK
Corporate governancethis officer. Internal Audit and External Audit operate, perform and report as separate, independent functions.
Audit Committee pre-approval policies and procedures
The Audit Committee is responsible for the oversight of the work of the external auditor. To assist it in discharging its oversight responsibility, the Audit Committee has adopted a Group External Auditor Independence Policy which requires, among other things, pre-approval of all audit and non-audit services to be provided by the external auditor. The Group External Auditor Independence Policy incorporates auditor independence requirements of applicable laws, rules and regulations and applies these throughout the Group.
In accordance with the Group External Auditor Independence Policy, the external auditor may only provide a service to the Group if: • the external auditor is not prohibited from providing that service by
applicable auditor independence laws, rules and regulations; • in the opinion of the Audit Committee or its delegate, the service
does not otherwise impair the independence of the external auditor;
• in the opinion of the Audit Committee or its delegate, there is a compelling reason for the external auditor to provide the service; and
• the service is specifically pre-approved by the Audit Committee or delegate.
In accordance with the Group External Auditor Independence Policy, the Group will not employ, or permit to serve as a member of a board of directors or similar management or governing body, any current or former partner, principal, shareholder or professional employee of the external auditor or their family members if, in doing so, the external auditor’s independence would be impaired or perceived to be impaired.
The Audit Committee may set an annual fee limit for each type of audit or non-audit service to be provided by the external auditor. Unless the Audit Committee approves otherwise, the fees paid or due and payable to the external auditor for the provision of non-audit services in any financial year must not exceed the fees paid or due and payable to the external auditor for audit services in that year.
The Audit Committee may delegate to one or more of its membership or to management as it sees fit, the authority to approve services to be provided by the external auditor. The decision of any delegate to specifically pre-approve any audit or audit related service is presented to the Audit Committee at its next scheduled meeting. The Audit Committee has delegated the authority to pre-approve services to the Audit Committee Chairman and certain members of management where the services meet specific requirements and fee limits as approved by the Audit Committee.
Risk Committee
The Risk Committee’s authority, responsibilities, composition and membership requirements are documented in the Risk Committee charter approved by the Board, which is available in the Corporate governance section of the Group’s website at www.nabgroup.com.
Activities during the year
At each scheduled meeting, the Risk Committee received a report from the Group Chief Risk Officer and updates in relation to key matters from the General Managers of the Group’s key risk functions. The Group’s capital and liquidity position was also reviewed on a regular basis with the Group Treasurer. These are in addition to presentations provided on topical issues by senior management as required.
The Group has continued to strengthen its risk management processes. Key activities undertaken by the Risk Committee during the year include:
• review of the Group’s key risks and risk management framework as developed by management;
• review of the Group’s internal capital adequacy assessment process;
• ongoing critical review of the credit environment, asset quality and provisioning;
• approval of the budget and headcount of the Group’s risk management function;
• review of the Group’s 2012 risk appetite statement; • review of the certifications from management in relation to
the Group’s compliance with applicable prudential standard obligations;
• review of the certifications and assurances from Internal Audit and management in relation to the effectiveness of the Group’s internal controls and risk management framework; and
• regular review of minutes and updates from subsidiary board risk committee meetings.
The Risk Committee met 10 times during the 2012 year, with senior representatives from the Company’s external auditor, Ernst & Young, in attendance. Internal Audit is invited to attend every scheduled meeting of the Risk Committee throughout the period.
The Group Chief Risk Officer attends every Risk Committee meeting, and meets regularly with the Chairman of the Risk Committee outside of the scheduled Board program.
The Chairs of each main subsidiary board risk committee met regularly in the 2012 financial year, to discuss and share current issues and challenges in their respective jurisdictions of the United Kingdom, the United States, Australia and New Zealand. This meeting is chaired by the Chairman of the Board Risk Committee. During the year, members of the Committee have met with regulators in certain jurisdictions.
More comprehensive details in relation to the Group’s risk oversight and management of its material business risks are available in the Corporate governance section of the Group’s website at www.nabgroup.com.
Remuneration Committee
Members of the Remuneration Committee have been selected to ensure the appropriate level of remuneration, risk, legal and industry expertise and knowledge. Two members of the Remuneration Committee are also members of the Risk Committee recognising the importance of aligning remuneration and risk.
The Remuneration Committee’s role, responsibilities, composition and membership requirements are documented in the Remuneration Committee charter approved by the Board, which is available in the Corporate governance section of the Group’s website at www.nabgroup.com. The skills, experience and qualifications of members of the Remuneration Committee are detailed in the Report of the Directors.
Information in relation to the Group’s remuneration framework (including information regarding the remuneration strategy and policies and their relationship to Group performance) can be found in the Remuneration report which forms part of the Report of the Directors, together with details of the remuneration paid to Board members and senior executives who were the key management personnel of the Company during the 2012 year.
Recognising the increased focus and responsibilities associated with remuneration related risks, the Group’s Chief Risk Officer has a standing invitation to attend meetings and the Committee Chairman will specifically invite the Group’s Chief Risk Officer to attend meetings where matters specific to risk-adjusted reward measures are discussed.

2012 Annual Financial Report 47
Corporate governanceActivities during the year
Key activities undertaken by the Remuneration Committee during the year include: • approval of the 2012 Remuneration report;• review and recommendation to the Board of the remuneration
package for the Group Chief Executive Officer and the Executive Director, Finance;
• review and recommendation to the Board of the remuneration packages for other senior executives;
• review and recommendation to the Board of remuneration structures for categories of persons across the Group, as required by applicable regulators;
• monitoring global regulatory and legislative reform in relation to remuneration, market trends and stakeholder views on remuneration and reward in the financial services industry;
• meeting with regulators to discuss the Group’s remuneration frameworks;
• monitoring executive director terminations across the Group;• review and recommendation to the Board of award values for the
long-term incentive plan for 2012;• review and recommendation to the Board of the incentives payable
to senior executives based on performance and risk criteria structured to increase shareholder value;
• review, approval and determination of vesting outcomes of employee equity plans and allocations, including the long-term incentive program;
• oversight of the Company’s compliance framework and management of underperformance and impact on remuneration outcomes; and
• review of remuneration of non-executive directors of subsidiary companies.
The Remuneration Committee met 12 times during the 2012 year.
As part of the review process for approval of incentive payments in 2012, the Remuneration Committee held a joint meeting with the Risk Committee to ensure that risk impacts had been taken into account in the determination of the allocation and calculation of short and long-term incentive payments.
Nomination Committee
The Nomination Committee’s role, responsibilities, composition and membership requirements are documented in the Nomination Committee charter approved by the Board, which is available in the Corporate governance section of the Group’s website at www.nabgroup.com.
Activities during the year
Key activities undertaken by the Nomination Committee during the year include: • assessment of the appropriate size and composition of the Board; • succession planning for non-executive directors; • consideration of diversity, including gender diversity in director
succession planning; • review of the methodology for the annual Board performance
review;• oversight of the induction program for new directors; and • review of Nomination Committee composition and memberships.
Other Committees
The Board has also established three further committees to support the Board in carrying out its responsibilities:• Information Technology Committee – established to provide
oversight of key strategic technology and infrastructure projects impacting the Group’s operations. Its members are Mr Gilbert (Chairman), Mr Clyne, Mr Rizzo and Mr Thorn.
• Litigation Sub-Committee – established to monitor significant litigation risks involving the Group. Its members are Mr Gilbert (Chairman), Ms Segal and Mr Thorn.
• Capital and Funding Sub-Committee – established to exercise delegated authority on behalf of the Board in relation to the Group’s capital and funding activities. Its members are Mr Joiner, Mr Rizzo and Mr Thorn.
Controlled entities
The activities of each company in the Group are overseen by its own respective board of directors. Mr Tomlinson is the Chairman of National Wealth Management Holdings Limited, and certain wealth management controlled entities. Mr Clyne is the Chairman of National Australia Group Europe Limited and Clydesdale Bank PLC. Mr Waller is the Chairman of Bank of New Zealand. Mr A Thorburn is the Chairman of Great Western Bank. The chairs of each of the Group’s major subsidiary boards (except for Great Western Bank) are members of the Board and this provides a key link between the Board of the Company and its subsidiary entities and enables issues considered by the major operating subsidiaries to be efficiently escalated to the Board. The Board’s confidence in the activities of a controlled entity board is based on having a high-quality controlled entity board committed to the Group’s objectives.
There is a standing invitation to the Company’s directors to attend any board meeting of a controlled entity through consultation with the relevant Chairman. Such visits are undertaken to develop a broader understanding of the Group’s total operations.
Communicating with shareholders
The Group aims to be open and transparent with all stakeholders, including the shareholders. Information is communicated to shareholders regularly through a range of forums and publications. These include: • the Company’s Annual General Meeting; • notices and explanatory memoranda of Annual General Meetings; • the Annual Financial Report (for those shareholders who have
requested a copy); • the Annual Review; • regular trading updates and market/investor briefings; • letters from the Chairman to inform shareholders of key matters of
interest; and • the Shareholder Centre and Media sections of the Group’s
website at www.nabgroup.com, which provide access to Company announcements, media releases, financial reports, previous years’ financial results and investor presentations.
The Group employs a range of communication approaches, including direct written communication with shareholders, publication of all relevant Group information and webcasting of significant market briefings and meetings (including the Annual General Meeting for shareholders).
The Group is committed to maintaining a level of disclosure that provides all investors with timely and equal access to information.
Continuous disclosure
The Corporations Act 2001 (Cth) and the ASX Listing Rules require that the Group discloses to the market matters which could be expected to have a material effect on the price or value of the Company’s securities. In compliance with these continuous disclosure requirements, the Company’s policy is that shareholders are informed in a timely manner of all major developments that impact the Group. There is a detailed disclosure policy in place, which has been formed to provide advice on the requirements for disclosure of information to the market and is intended to maintain the market integrity and market efficiency of the Company’s securities.
48 NATIONAL AUSTRALIA BANK
Corporate governanceThe Company has established written guidelines and procedures to supplement the disclosure policy. These guidelines and procedures are designed to manage the Company’s compliance with the continuous disclosure obligations of the various stock exchanges on which the Company’s securities are listed, including the ASX, and to attribute accountability at a senior executive level for that compliance.
Pursuant to the disclosure policy and supplementary guidelines and procedures, all material matters which may potentially require disclosure are promptly reported to a Disclosure Committee of executives. The Disclosure Committee may refer matters to other senior executives or the Board, to make an assessment and determination as to disclosure.
Where appropriate the Board will be consulted on the most significant or material disclosures. All members of the Group Executive Committee are responsible for reporting matters qualifying for disclosure to the General Counsel Corporate and/or the Group Company Secretary. Routine administrative announcements will be made by the Group Company Secretary without requiring approval from the Disclosure Committee. The Disclosure Committee reports annually to the Board on activities and decisions taken throughout the year.
The Group Company Secretary is responsible for all communications with all relevant stock exchanges.
The Group Disclosure and External Communications Policy is available in the Corporate governance section of the Group’s website at www.nabgroup.com.
ASX Corporate Governance Principles and Recommendations
The Company has complied with the ASX Corporate Governance Principles and Recommendations for the 2012 year.
In accordance with Recommendation 7.2 of the ASX Corporate Governance Principles and Recommendations, management has reported to the Board as to the effectiveness of the Company’s management of its material business risks.
Assurance provided to the Board
The Board has received: • the relevant declarations required under section 295A of the
Corporations Act 2001 (Cth); and • the relevant assurances required under Recommendation 7.3 of
the ASX Corporate Governance Principles and Recommendations, jointly from the Group Chief Executive Officer and the Executive Director, Finance.
The Diversity section, which follows this Corporate Governance Statement, contains the diversity disclosures required under the ASX Corporate Governance Principles and Recommendations.
Further information regarding the Company’s compliance with the ASX Corporate Governance Principles and Recommendations is set out in a checklist available at www.nabgroup.com.
Corporate responsibility
Values and culture
At the heart of the National Australia Bank Group of companies is a belief in the potential of our customers and communities, and in each other. It unites and motivates us: • to do the right thing; • to help our customers and communities; and • to realise potential.
From these beliefs come a common set of Enterprise Behaviours that require our people to: • be authentic and respectful;
• work together; and • create value through excellence.
Our approach to corporate responsibility
The Group’s approach to corporate responsibility (CR) seeks to ensure that our beliefs and behaviours are embedded in our everyday decision making and our longer-term planning for the future. This approach is centred around the following core commitments: • getting the fundamentals right with our customers - by delivering
fair value and quality advice; • being a good employer - through investing in the skills and
capabilities of our employees; and • addressing our broader responsibility to society - by supporting
communities, managing our environmental impact and having a positive impact through our supply chain.
We ensure our CR approach continues to be relevant by:• engaging with our stakeholders in each of these commitment areas
to inform us of current and emerging material issues, challenging us to develop mutually beneficial solutions and helping us to define our strategic direction;
• developing a CR strategy that sets clear objectives, establishes appropriate policies, procedures and activities and includes measuring and reporting on our progress; and
• integrating CR management and reporting into the Company’s governance structures and internal communication to ensure that CR is understood by our Board, Executive Committee and our people.
The NAB Advisory Council on Corporate Responsibility, co-chaired by the Rev Tim Costello and the Group Chief Executive Officer, comprises a range of experienced internal and external advisors, who help guide the Company with strategic advice and feedback in relation to the Group’s CR strategy and activities. More information on the Council is available in the Corporate Responsibility section of the Group’s website at www.nabgroup.com.
In 2011, a CR Council was established, consisting of the Executive Committee and chaired by the Executive Director, Finance. This Council meets on a quarterly basis. Progress against our annual CR commitments is reported to this committee and to the NAB Advisory Council on Corporate Responsibility on a quarterly basis, and an update on our CR strategy is provided to the Board on an annual basis. A Customer Council (chaired by the Group Chief Executive Officer) also meets on a monthly basis to ensure an ongoing focus on customer experience.
Corporate responsibility performance
Further information on our CR approach, scorecard and performance is provided in our Annual Review and on the Group’s website at www.nabgroup.com. External assurance is provided over the CR data contained in the Annual Review.
Code of conduct
The Company has a Code of Conduct which requires the observance of strict ethical guidelines. The Code of Conduct applies to all employees and directors of the Group, with the conduct of the Board and each director also governed by the Board charter.
The Code of Conduct covers: • personal conduct; • honesty; • relations with customers; • financial advice to customers; • conflict of interest; and • disclosure.
The Group’s Enterprise Behaviours, together with the Company’s Code of Conduct, take into account the Company’s legal obligations

2012 Annual Financial Report 49
Corporate governanceand the reasonable expectations of the Group’s stakeholders, and emphasise the practices necessary to maintain confidence in the Company’s integrity. Copies of the Group’s Enterprise Behaviours and Code of Conduct are available on the Group’s website at www.nabgroup.com.
The Group supports the Code of Banking Practice 2004 of the Australian Bankers’ Association, which includes: • major obligations and commitments to customers; • principles of conduct; and • the role and responsibilities of an independent external body,
the Code Compliance Monitoring Committee, which investigates complaints about non-compliance with this Code.
Escalation
The Group has clear and established procedures and a culture that encourages the escalation of complaints and notification of incidents to management and the Board. This ranges from escalation of daily business or management concerns, up to serious financial, cultural or reputation matters. Employees are provided with various avenues for escalation of complaints or concerns, including general and confidential email alert addresses and telephone lines, as well as a comprehensive Whistleblower program.
Whistleblower protection
The Group has a Whistleblower Protection Program for confidential reporting of unacceptable or undesirable conduct. The system enables disclosures to be made to a protected disclosure officer by the Group’s employees, or, where applicable, if the matter is highly sensitive and the employee believes it more appropriate, directly to the Audit Committee. The Group does not tolerate incidents of fraud, corrupt conduct, adverse behaviour, legal or regulatory non-compliance, or questionable accounting and auditing matters by its employees.
There are established procedures for the receipt, retention and treatment of complaints regarding accounting, internal accounting controls or auditing matters.
Employees are also encouraged to escalate any issues they believe could have a material impact on the Group’s profitability, reputation, governance or regulatory compliance.
It is a responsibility of the Audit Committee to oversee that employees can make confidential, anonymous submissions regarding such matters.
The Company will take all reasonable steps to protect a person who discloses unacceptable or undesirable conduct, including disciplinary action (potentially resulting in dismissal) for any person taking reprisals against them.
Restrictions on dealing in securities
Directors, officers and employees are subject to the Corporations Act 2001 (Cth) restrictions on applying for, acquiring and disposing of securities in, or other relevant financial products of, the Company (or procuring another person to do so) if they are in possession of inside information. Inside information is information which is not generally available, and which if it were generally available a reasonable person would expect it to have a material effect on the price or value of the securities in, or other relevant financial products of, the Group. There are also legal restrictions on insider trading imposed by the laws of other jurisdictions that apply to the Group and its directors, officers and employees. The Company has an established policy relating to trading in the Company’s securities by directors, officers and certain other employees of the Group. For more detail, refer to the Appendix of the Remuneration report.

Diversity
50 NATIONAL AUSTRALIA BANK
Diversity
The Group recognises that a diverse and inclusive workforce is not only good for our employees, it is also good for our business. It helps the Group attract and retain talented people, create more innovative solutions, and be more flexible and responsive to our customers’ and shareholders’ needs. There is increasing momentum on diversity with a particular focus on gender and age, as well as greater work and career flexibility.
Gender diversity and inclusion continues to be a key priority for the Group. The Company is committed to building strong female representation at all levels within the Group, including executive management. The Group Chief Executive Officer and the Executive Director, Finance co-chair the Group’s Diversity Forum. The Diversity Forum was established in 2010 and is comprised of senior business representatives. It works to align the Group’s diversity strategy with business objectives.
The Board receives regular updates on diversity from senior executives of the Group.
The Company makes the following disclosures in relation to the ASX Corporate Governance Principles and Recommendations relating to diversity:
Diversity policy (Recommendation 3.2)
The Group Diversity and Inclusion Policy is available in the Corporate governance section of the Group’s website at www.nabgroup.com.
Measurable objectives and progress (Recommendation 3.3)
The measurable objectives for achieving gender diversity which have been set by the Board in accordance with the Group Diversity and Inclusion Policy, and the Company’s progress towards achieving them, are set out in the table below.
Measurable objectives Progress
Increase the number of women in executive management (the top three layers of the organisation (1)), from 23% to 33% by 2015.
As at 30 September 2012, 30% of the Group’s executive management were women (compared with 23% in 2010 (2) and 28% in 2011 (3)).
Increase the proportion of women on Group subsidiary boards from 14% to 30% by 2015.
The Company has actively encouraged women to join Group subsidiary boards during the year. Of the total number of subsidiary directors, the proportion of women has increased to 26% as at 30 September 2012 (compared with 14% and 20% as at the 2010 and 2011 financial year ends respectively).
Increase the number of female non-executive directors on the Board of directors of the Company, as vacancies and circumstances allow, with the aim of achieving a representation of at least 30%.
Diversity, including gender diversity, continues to be an important consideration of the Board in its director succession planning. The proportion of female non-executive directors on the Board as at 30 September 2012 was 20% (being the same proportion as at the 2011 financial year end).
Strengthen the talent pipeline by targeting a 50/50 gender balance in the Australian graduate program intake and an even representation of women and men on the Company’s core Australian talent development programs from 2011 onwards.
Graduate program (Australia): As at 30 September 2012, 53% of the graduates who have accepted positions in the Company’s 2013 graduate program are women (compared with 40% and 44% for the 2011 and 2012 programs respectively). Core talent development programs (Australia): For the 2012 financial year, 41% of the Australian talent development program participants, on an aggregated basis across the Company’s core talent development programs (Elevate, Ignite and Accelerate) were women (compared with 40% and 47% as at the 2010 and 2011 financial year ends respectively).
(1) Executive management positions (also known as senior executive positions) are those held by Group Executive Committee members, Group Executive Committee members’ direct reports, and their direct reports. Note: Support roles reporting in to these roles (for example, Executive Manager and Executive Assistant) are not included in the data.
(2) As at June 2010.(3) As at September 2011.
Proportion of women employees and Board members (Recommendation 3.4)
Recommendation 3.4 requirement Disclosure
Proportion of women employees in the whole organisation. As at 30 September 2012, 57% of the Group’s employees were women.
Proportion of women in senior executive positions (executive management positions) within the Group.
As at 30 September 2012, 30% of the senior executive positions within the Group were held by women.
Proportion of women on the Board of the Company. As at 30 September 2012, 16% of the Company’s Board of directors (including executive directors) were women. The Company is committed to ensuring that the composition of its Board continues to be appropriate. The Board’s charter clearly states that it should comprise directors with a broad range of skills, experience and diversity.
Some of the Group’s activities and initiatives relating to diversity during the year were as follows:• Unconscious bias: the Company’s ‘Consciously Addressing Unconscious Bias’ program, reflects leading-edge thinking and research and
addresses unconscious bias that may influence decision-making in situations such as recruitment. In 2012, over 300 of our senior leaders in Australia, New Zealand, Asia and the United Kingdom attended this program.
• Women in executive management positions: • requiring that a mix of men and women be short-listed for executive management roles in Australia and that men and women make hiring
decisions on interview panels together, where possible; and• offering a range of programs in Australia including ‘Realise’, which encourages women to prepare themselves for the transition to senior
management, and ‘Board Ready’, which supports women by coaching and educating them in the skills necessary for subsidiary board positions and community partner directorships.
• Gender equity audit: the Company has conducted a second audit of gender pay equity in partnership with the Financial Sector Union (FSU). Findings and recommendations were reported to the Diversity Forum in August 2012.

Diversity
2012 Annual Financial Report 51
• Women’s networks: continued focus on women’s networking opportunities across the Group through ‘Connecting Women’ in Australia, the BNZ Women’s Network in New Zealand, and the Women’s Networking Group and ‘Pearls Program’ in the United Kingdom.
• Flexible working: awareness initiatives continue to encourage flexible working arrangements, such as compressed working weeks, salary averaging and flexible leave.
• Mature age employees: MyFuture, a program to assist mature age employees plan their career, health, finances, retirement and career direction.
Please refer to the Corporate governance section of the Group’s website at www.nabgroup.com for additional reporting on the Group’s recent activities and initiatives relating to diversity.

This Page has been left blank intentionally

Financial report

54 NATIONAL AUSTRALIA BANK
Income statementGroup Company
For the year ended 30 September 2012 2011 2012 2011Note $m $m $m $m
Interest income 3 34,542 34,270 30,487 30,109 Interest expense 3 (21,300) (21,236) (20,654) (20,457)
Net interest income 13,242 13,034 9,833 9,652
Premium and related revenue 1,406 1,359 - - Investment revenue 7,463 (447) - - Fee income 525 553 - - Claims expense (800) (794) - - Change in policy liabilities (5,677) 475 - - Policy acquisition and maintenance expense (908) (914) - - Investment management expense (5) (5) - - Movement in external unitholders’ liability (1,264) 133 - -
Net life insurance income 740 360 - -
Gains less losses on financial instruments at fair value 4 223 (329) 1,182 133 Other operating income 4 3,510 3,778 2,797 2,953
Total other income 3,733 3,449 3,979 3,086
Personnel expenses 5 (4,526) (4,563) (3,291) (3,156)Occupancy-related expenses 5 (609) (599) (358) (400)General expenses 5 (3,687) (3,203) (1,958) (1,799)
Total operating expenses (8,822) (8,365) (5,607) (5,355)
Charge to provide for doubtful debts 5 (2,734) (1,750) (1,476) (1,178)
Profit before income tax expense 6,159 6,728 6,729 6,205 Income tax expense 6 (2,076) (1,508) (1,714) (1,315)
Net profit for the year 4,083 5,220 5,015 4,890
Attributable to:Owners of the Company 4,082 5,219 5,015 4,890 Non-controlling interest in controlled entities 1 1 - -
Net profit for the year 4,083 5,220 5,015 4,890
Basic earnings per share (cents) 8 175.3 233.6 Diluted earnings per share (cents) 8 174.4 231.5

2012 Annual Financial Report 55
Statement of comprehensive incomeGroup Company
For the year ended 30 September 2012 2011 2012 2011Note $m $m $m $m
Net profit for the year 4,083 5,220 5,015 4,890 Other comprehensive incomeActuarial (losses)/gains on defined benefit superannuation plans 36 (535) 80 - 5 Cash flow hedges
Gains on cash flow hedging instruments 35 123 221 104 215 (Gains)/losses transferred to the income statement 35 (7) - 5 (7)
Exchange differences on translation of foreign operations 35 (139) (171) (63) (8)Reclassification to the income statement on disposal of foreign operations 35 - (2) - - Tax on items transferred directly to/(from) equity 35 (70) (42) (38)Investments - available for sale
Revaluation gains/(losses) 35 66 (36) 36 (67)(Gains)/losses from sale transferred to the income statement 35 (19) (20) - 2 Impairment transferred to the income statement 35 5 10 - -
Revaluation of land and buildings 35 (1) 11 - -
Other comprehensive income for the year, net of income tax (472) 23 40 102
Total comprehensive income for the year 3,611 5,243 5,055 4,992
Attributable to:Owners of the Company 3,610 5,242 5,055 4,992 Non-controlling interest in controlled entities 1 1 - -
Total comprehensive income for the year 3,611 5,243 5,055 4,992

56 NATIONAL AUSTRALIA BANK
Balance sheetGroup Company
As at 30 September 2012 2011 2012 2011Note $m $m $m $m
AssetsCash and liquid assets 9 19,464 27,093 13,586 22,532 Due from other banks 10 47,410 47,106 35,322 36,853 Trading derivatives 11 40,899 48,466 41,680 47,353 Trading securities 12 28,614 34,628 25,741 31,513 Investments - available for sale 13 28,985 18,045 25,605 14,516 Investments - held to maturity 14 9,762 12,787 5,533 6,249 Investments relating to life insurance business 15 68,414 63,920 - - Other financial assets at fair value 16 64,027 51,756 38,737 26,765 Hedging derivatives 11 3,615 4,108 3,177 3,051 Loans and advances 17 394,735 382,369 308,728 294,171 Due from customers on acceptances 36,957 43,017 36,946 43,006 Current tax assets 23 92 - - - Property, plant and equipment 20 1,901 1,919 1,106 1,069 Due from controlled entities - - 57,523 53,597 Investments in controlled entities 21 - - 18,291 17,176 Goodwill and other intangible assets 22 7,088 7,262 1,018 760 Deferred tax assets 23 2,150 2,243 1,597 1,559 Other assets 24 8,977 9,038 6,526 5,939
Total assets 763,090 753,757 621,116 606,109
LiabilitiesDue to other banks 28,691 40,162 26,169 35,902 Trading derivatives 11 45,127 47,889 43,947 46,048 Other financial liabilities at fair value 25 21,732 23,726 4,675 3,444 Hedging derivatives 11 6,348 4,550 5,921 4,317 Deposits and other borrowings 26 419,921 402,964 336,355 317,156 Liability on acceptances 7,801 10,633 7,790 10,622 Life policy liabilities 27 56,584 53,608 - - Current tax liabilities 28 713 561 722 557 Provisions 29 1,820 1,596 906 939 Due to controlled entities - - 46,629 45,653 Bonds, notes and subordinated debt 30 103,372 99,768 94,677 89,648 Other debt issues 31 1,783 2,494 1,288 1,939 Defined benefit superannuation plan liabilities 32 482 295 - - External unitholders’ liability 12,546 9,959 - - Deferred tax liabilities 28 - 28 - 30 Other liabilities 33 12,367 13,336 7,402 8,485
Total liabilities 719,287 711,569 576,481 564,740
Net assets 43,803 42,188 44,635 41,369
EquityContributed equity 34 27,373 25,274 26,039 23,776 Reserves 35 (2,319) (773) 760 964 Retained profits 36 18,702 17,667 17,836 16,629
Total equity (parent entity interest) 43,756 42,168 44,635 41,369 Non-controlling interest in controlled entities 47 20 - -
Total equity 43,803 42,188 44,635 41,369
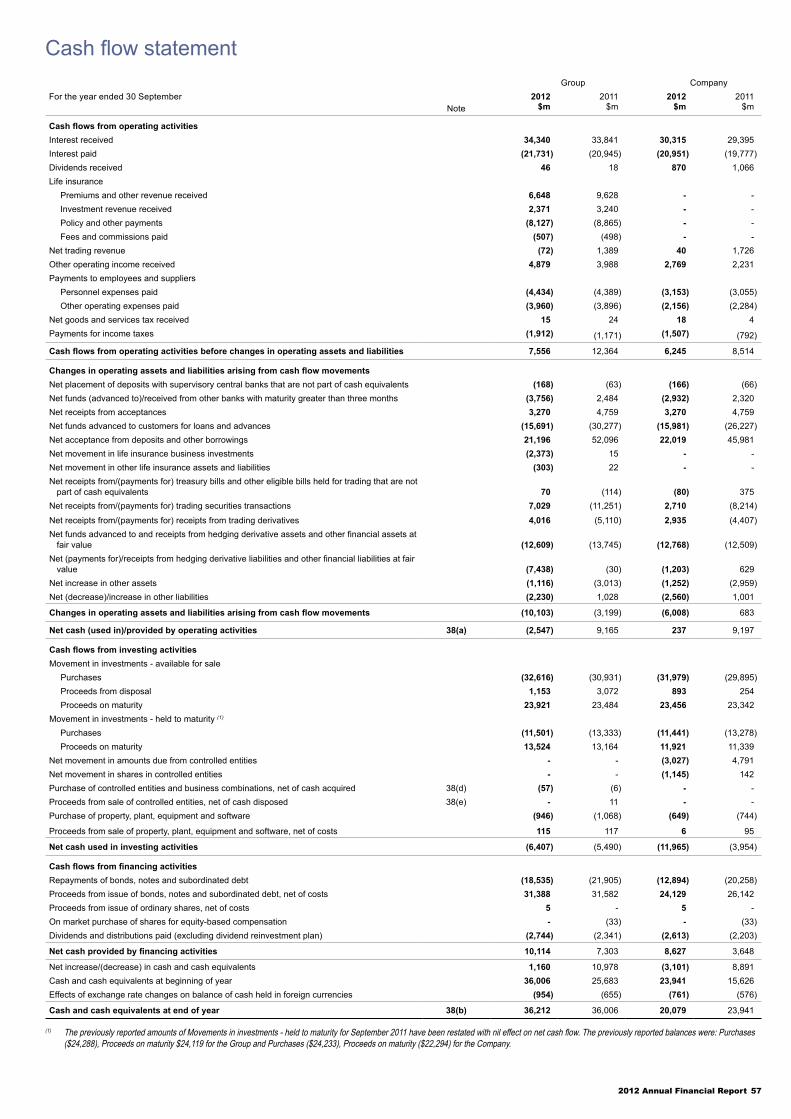
2012 Annual Financial Report 57
Cash flow statementGroup Company
For the year ended 30 September 2012 2011 2012 2011Note $m $m $m $m
Cash flows from operating activitiesInterest received 34,340 33,841 30,315 29,395 Interest paid (21,731) (20,945) (20,951) (19,777)Dividends received 46 18 870 1,066 Life insurance
Premiums and other revenue received 6,648 9,628 - - Investment revenue received 2,371 3,240 - - Policy and other payments (8,127) (8,865) - - Fees and commissions paid (507) (498) - -
Net trading revenue (72) 1,389 40 1,726 Other operating income received 4,879 3,988 2,769 2,231 Payments to employees and suppliers
Personnel expenses paid (4,434) (4,389) (3,153) (3,055)Other operating expenses paid (3,960) (3,896) (2,156) (2,284)
Net goods and services tax received 15 24 18 4 Payments for income taxes (1,912) (1,171) (1,507) (792)
Cash flows from operating activities before changes in operating assets and liabilities 7,556 12,364 6,245 8,514
Changes in operating assets and liabilities arising from cash flow movementsNet placement of deposits with supervisory central banks that are not part of cash equivalents (168) (63) (166) (66)Net funds (advanced to)/received from other banks with maturity greater than three months (3,756) 2,484 (2,932) 2,320 Net receipts from acceptances 3,270 4,759 3,270 4,759 Net funds advanced to customers for loans and advances (15,691) (30,277) (15,981) (26,227)Net acceptance from deposits and other borrowings 21,196 52,096 22,019 45,981 Net movement in life insurance business investments (2,373) 15 - - Net movement in other life insurance assets and liabilities (303) 22 - - Net receipts from/(payments for) treasury bills and other eligible bills held for trading that are not
part of cash equivalents 70 (114) (80) 375 Net receipts from/(payments for) trading securities transactions 7,029 (11,251) 2,710 (8,214)
Net receipts from/(payments for) receipts from trading derivatives 4,016 (5,110) 2,935 (4,407)Net funds advanced to and receipts from hedging derivative assets and other financial assets at
fair value (12,609) (13,745) (12,768) (12,509)Net (payments for)/receipts from hedging derivative liabilities and other financial liabilities at fair
value (7,438) (30) (1,203) 629 Net increase in other assets (1,116) (3,013) (1,252) (2,959)Net (decrease)/increase in other liabilities (2,230) 1,028 (2,560) 1,001
Changes in operating assets and liabilities arising from cash flow movements (10,103) (3,199) (6,008) 683
Net cash (used in)/provided by operating activities 38(a) (2,547) 9,165 237 9,197
Cash flows from investing activitiesMovement in investments - available for sale
Purchases (32,616) (30,931) (31,979) (29,895)Proceeds from disposal 1,153 3,072 893 254 Proceeds on maturity 23,921 23,484 23,456 23,342
Movement in investments - held to maturity (1)
Purchases (11,501) (13,333) (11,441) (13,278)Proceeds on maturity 13,524 13,164 11,921 11,339
Net movement in amounts due from controlled entities - - (3,027) 4,791 Net movement in shares in controlled entities - - (1,145) 142 Purchase of controlled entities and business combinations, net of cash acquired 38(d) (57) (6) - - Proceeds from sale of controlled entities, net of cash disposed 38(e) - 11 - - Purchase of property, plant, equipment and software (946) (1,068) (649) (744)
Proceeds from sale of property, plant, equipment and software, net of costs 115 117 6 95
Net cash used in investing activities (6,407) (5,490) (11,965) (3,954)
Cash flows from financing activitiesRepayments of bonds, notes and subordinated debt (18,535) (21,905) (12,894) (20,258)Proceeds from issue of bonds, notes and subordinated debt, net of costs 31,388 31,582 24,129 26,142 Proceeds from issue of ordinary shares, net of costs 5 - 5 - On market purchase of shares for equity-based compensation - (33) - (33)Dividends and distributions paid (excluding dividend reinvestment plan) (2,744) (2,341) (2,613) (2,203)
Net cash provided by financing activities 10,114 7,303 8,627 3,648
Net increase/(decrease) in cash and cash equivalents 1,160 10,978 (3,101) 8,891 Cash and cash equivalents at beginning of year 36,006 25,683 23,941 15,626 Effects of exchange rate changes on balance of cash held in foreign currencies (954) (655) (761) (576)
Cash and cash equivalents at end of year 38(b) 36,212 36,006 20,079 23,941
(1) The previously reported amounts of Movements in investments - held to maturity for September 2011 have been restated with nil effect on net cash flow. The previously reported balances were: Purchases ($24,288), Proceeds on maturity $24,119 for the Group and Purchases ($24,233), Proceeds on maturity ($22,294) for the Company.
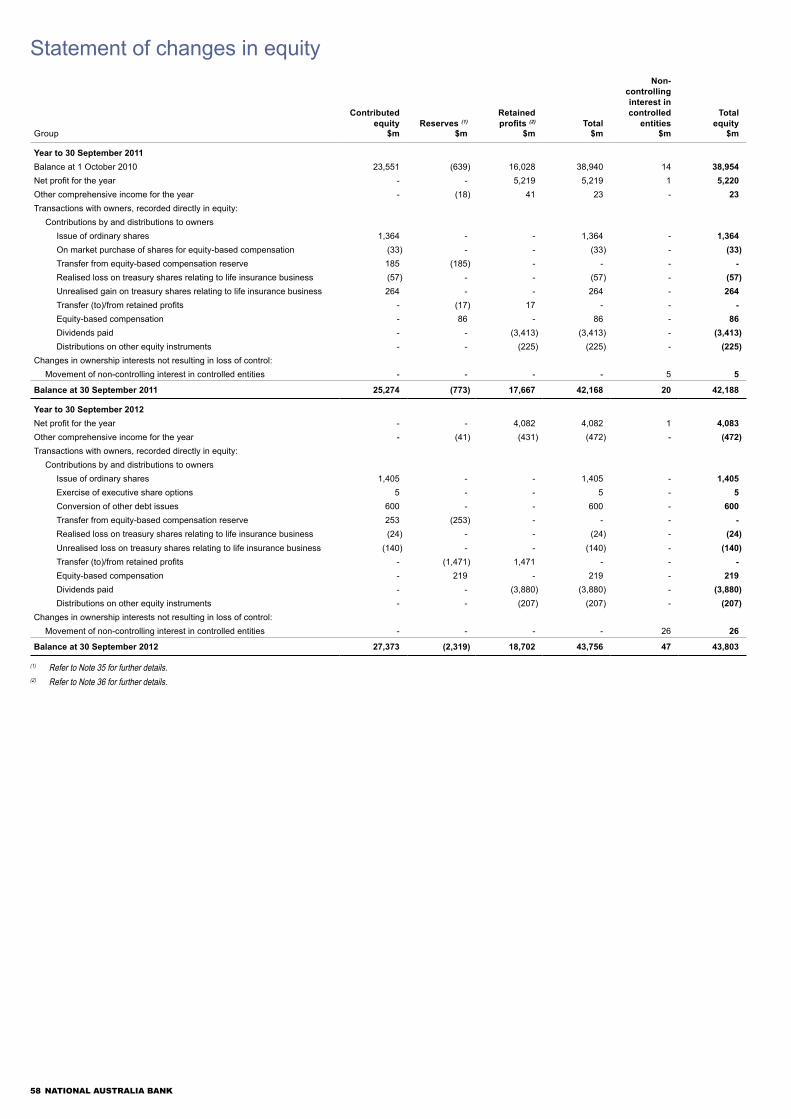
58 NATIONAL AUSTRALIA BANK
Statement of changes in equity
Contributed equity Reserves (1)
Retained profits (2) Total
Non- controlling interest in controlled
entitiesTotal
equityGroup $m $m $m $m $m $m
Year to 30 September 2011Balance at 1 October 2010 23,551 (639) 16,028 38,940 14 38,954 Net profit for the year - - 5,219 5,219 1 5,220 Other comprehensive income for the year - (18) 41 23 - 23 Transactions with owners, recorded directly in equity:
Contributions by and distributions to ownersIssue of ordinary shares 1,364 - - 1,364 - 1,364 On market purchase of shares for equity-based compensation (33) - - (33) - (33)Transfer from equity-based compensation reserve 185 (185) - - - - Realised loss on treasury shares relating to life insurance business (57) - - (57) - (57)Unrealised gain on treasury shares relating to life insurance business 264 - - 264 - 264 Transfer (to)/from retained profits - (17) 17 - - - Equity-based compensation - 86 - 86 - 86 Dividends paid - - (3,413) (3,413) - (3,413)Distributions on other equity instruments - - (225) (225) - (225)
Changes in ownership interests not resulting in loss of control:Movement of non-controlling interest in controlled entities - - - - 5 5
Balance at 30 September 2011 25,274 (773) 17,667 42,168 20 42,188
Year to 30 September 2012Net profit for the year - - 4,082 4,082 1 4,083 Other comprehensive income for the year - (41) (431) (472) - (472)Transactions with owners, recorded directly in equity:
Contributions by and distributions to ownersIssue of ordinary shares 1,405 - - 1,405 - 1,405 Exercise of executive share options 5 - - 5 - 5 Conversion of other debt issues 600 - - 600 - 600 Transfer from equity-based compensation reserve 253 (253) - - - - Realised loss on treasury shares relating to life insurance business (24) - - (24) - (24)Unrealised loss on treasury shares relating to life insurance business (140) - - (140) - (140)Transfer (to)/from retained profits - (1,471) 1,471 - - - Equity-based compensation - 219 - 219 - 219 Dividends paid - - (3,880) (3,880) - (3,880)Distributions on other equity instruments - - (207) (207) - (207)
Changes in ownership interests not resulting in loss of control:Movement of non-controlling interest in controlled entities - - - - 26 26
Balance at 30 September 2012 27,373 (2,319) 18,702 43,756 47 43,803
(1) Refer to Note 35 for further details.(2) Refer to Note 36 for further details.

2012 Annual Financial Report 59
Statement of changes in equityContributed
equity Reserves (1)Retained profits (2) Total
Total equity
Company $m $m $m $m $m
Year to 30 September 2011Balance at 1 October 2010 22,260 1,087 15,180 38,527 38,527 Net profit for the year - - 4,890 4,890 4,890 Other comprehensive income for the year - 94 8 102 102 Transactions with owners, recorded directly in equity:
Contributions by and distributions to ownersIssue of ordinary shares 1,364 - - 1,364 1,364 On market purchase of shares for equity-based compensation (33) - - (33) (33)Transfer from equity-based compensation reserve 185 (185) - - - Transfer (to)/from retained profits - (118) 118 - - Equity-based compensation - 86 - 86 86 Dividends paid - - (3,444) (3,444) (3,444)Distributions on other equity instruments - - (123) (123) (123)
Balance at 30 September 2011 23,776 964 16,629 41,369 41,369
Year to 30 September 2012Net profit for the year - - 5,015 5,015 5,015 Other comprehensive income for the year - 40 - 40 40 Transactions with owners, recorded directly in equity:
Contributions by and distributions to ownersIssue of ordinary shares 1,405 - - 1,405 1,405 Exercise of executive share options 5 - - 5 5 Conversion of other debt issues 600 - - 600 600 Transfer from equity-based compensation reserve 253 (253) - - - Transfer (to)/from retained profits - (210) 210 - - Equity-based compensation - 219 - 219 219 Dividends paid - - (3,904) (3,904) (3,904)Distributions on other equity instruments - - (114) (114) (114)
Balance at 30 September 2012 26,039 760 17,836 44,635 44,635
(1) Refer to Note 35 for further details.(2) Refer to Note 36 for further details.

60 NATIONAL AUSTRALIA BANK
Notes to the financial statements
1 Principal accounting policies
The Financial report of National Australia Bank Limited (Company) and its controlled entities (Group) for the year ended 30 September 2012 was authorised for issue on 19 November 2012 in accordance with a resolution of the directors.
(a) Basis of preparation
This General Purpose Financial report has been prepared in accordance with the requirements of the Corporations Act 2001 (Cth) and Accounting Standards and Interpretations issued by the Australian Accounting Standards Board (AASB). The financial statements have been prepared under the historical cost convention, as modified by the application of fair value measurements required or allowed by relevant Accounting Standards. Accounting policies have been consistently applied throughout the Group.
The preparation of financial statements requires the use of certain critical accounting estimates and assumptions that affect the reported amounts of assets, liabilities, revenues and expenses and the disclosed amount of contingent liabilities. It also requires management to exercise judgement in the process of applying accounting policies. The notes to the financial statements set out areas involving a higher degree of judgement or complexity, or areas where assumptions are significant to the Group.
Assumptions made at each balance sheet date (such as the calculation of provisions for doubtful debts, defined benefit obligations and fair value adjustments), are based on best estimates at that date. Although the Group has internal control systems in place to ensure that estimates are reliably measured, actual amounts may differ from those estimates. Estimates and underlying assumptions are reviewed on an ongoing basis. Revisions to accounting estimates are recognised in the period in which the estimates are revised and in any future periods affected.
Comparative amounts have been reclassified to accord with changes in presentations made in 2012, except where otherwise stated. Certain key terms used in this report are defined in the glossary.
(b) Statement of compliance
The Financial report of the Company and the Group complies with Australian Accounting Standards as issued by the AASB and International Financial Reporting Standards (IFRS) as issued by the International Accounting Standards Board (IASB).
To comply with its obligations as an Australian Financial Services Licence holder the Group includes in this Financial report the separate financial statements of the Company, which is permitted by Australian Securities and Investments Commission Class Order 10/654 dated 26 July 2010.
(c) New and amended Accounting Standards and Interpretations
(i) New and amended Accounting Standards and Interpretations issued and effective
The Group has adopted the following new and amended Accounting Standards and Interpretations which were applicable from 1 October 2011. Adoption of these new and amended Accounting Standards and Interpretations has not had a material impact on the Company or the Group:• Amended AASB 124 “Related Party Disclosures” and AASB
2009-12 “Amendments to Australian Accounting Standards” which clarifies the definition of a related party;
• AASB 2009-14 “Amendments to Australian Interpretation - Prepayments of a Minimum Funding Requirement,“ which removes unintended consequences arising from the treatment of
prepayments when there is a minimum funding requirement for an employee benefit plan;
• AASB 2010-4 “Further Amendments to Australian Accounting Standards arising from the Annual Improvements Project” which makes amendments to several Accounting Standards arising from the 2010 annual improvements project, including amendments to AASB 7 “Financial Instruments: Disclosures”;
• AASB 2011-1 “Amendments to Australian Accounting Standards arising from the Trans-Tasman Convergence Project” and AASB 1054 “Australian Additional Disclosures”. AASB 2011-1 makes amendments to Accounting Standards as part of the first phase of harmonisation of financial reporting requirements between Australia and New Zealand for entities that assert compliance with IFRS. AASB 1054 contains Australia specific disclosure requirements and definitions which have been relocated to a single Accounting Standard; and
• AASB 2010-6 “Amendments to Australian Accounting Standards - Disclosures on Transfers of Financial Assets” which requires disclosures to be made of transfers of financial assets that are not derecognised in their entirety, and financial assets that are derecognised in their entirety but for which an entity retains continuing involvement.
(ii) Early adoptions
The Group has not elected to early adopt any new or amended Accounting Standards or Interpretations in the current year.
(iii) New and amended Accounting Standards and Interpretations issued but not yet effective
The following issued, but not yet effective, new and amended Accounting Standards and Interpretations have not been applied in preparing this Financial report and have been identified as those which may impact the Group.
New and amended Accounting Standards and Interpretations applicable and expected to be applied by the Group for the year commencing 1 October 2012 that are not expected to result in significant changes to the Group’s accounting policies:• AASB 2010-8 “Amendments to Australian Accounting Standards -
Deferred Tax: Recovery of Underlying Assets” which clarifies that the tax base of investment property measured using the fair value model is based on the premise that the carrying amount will be recovered entirely through sale rather than through use;
• AASB 2011-9 “Amendments to Australian Accounting Standards - Presentation of Items of Other Comprehensive Income” which requires presentation of items of other comprehensive income that will be reclassified to profit or loss in the future separately from those that will never be reclassified to profit or loss.
New and amended Accounting Standards and Interpretations applicable and expected to be applied by the Group for the year commencing 1 October 2013, that are not expected to result in significant changes to the Group’s accounting policies:• AASB 2011-4 “Amendments to Australian Accounting Standards
to Remove Individual Key Management Personnel Disclosure Requirements” removes the requirements to include individual key management personnel disclosures in the notes to the financial statements, although does not change the Corporations Act 2001 (Cth) requirements in respect of the Remuneration report;
• AASB 2012-2 “Amendments to Australian Accounting Standards – Disclosures – Offsetting Financial Assets and Liabilities” which requires the disclosure of information to evaluate the potential effect of netting arrangements relating to financial assets and liabilities on an entity’s financial position;
• AASB 2012-5 “Amendments to Australian Accounting Standards arising from annual improvements 2009-2011 cycle” which
2012 Annual Financial Report 61
Notes to the financial statements
1 Principal accounting policies (continued)
provides clarification of the requirements for comparative information and other financial instrument presentation changes;
• AASB 11 “Joint Arrangements” which introduces a revised model for accounting for joint arrangements;
• Amended AASB 128 “Investment in Associates and Joint Ventures” which incorporates limited amendments to the existing accounting and disclosure requirements for investments in associates and joint ventures;
• AASB 12 “Disclosure of Interests in Other Entities” which requires disclosures to be made in respect of interests in subsidiaries, joint arrangements, associates and unconsolidated structured entities. New disclosures have been introduced about the judgements made by management to determine whether control exists, and to require summarised information about these entities;
• Amended AASB 119 “Employee Benefits” and AASB 2011-10 “Amendments to Australian Accounting Standards arising from AASB 119” which require the return on plan assets for defined benefit superannuation plans recognised in profit or loss to be calculated based on the rate used to discount the defined benefit obligation; and
• Amended AASB 127 “Separate Financial Statements” which carries forward the existing accounting and disclosure requirements for separate financial statements with some minor clarifications.
AASB 9 “Financial Instruments” contains new requirements for classification and measurement of financial assets and liabilities, replacing the corresponding requirements in AASB 139 “Financial Instruments: Recognition and Measurement”. It will introduce significant changes in the way that the Group accounts for financial instruments. The standard is effective for the Group in the year commencing 1 October 2015, however early adoption is permitted. The impact of AASB 9 on the Group’s financial statements has not yet been assessed.
It is expected that the IASB will release IFRS 9 ‘Financial Instruments’ by December 2013 which will include new requirements for impairment and hedge accounting. The changes arising from applying these standards are likely to significantly affect the Group’s accounting for its financial instruments.
AASB 10 “Consolidated Financial Statements” introduces a new approach to determine which investees should be consolidated. This approach comprises a series of indicators of control, requiring an analysis of all facts and circumstances and the application of judgement in making the control assessment. The standard is effective for annual periods beginning on or after 1 January 2013, with early adoption permitted, under certain circumstances. The Group intends to first apply the standards in the financial year beginning 1 October 2013. The impact of AASB 10 on the Group’s financial statements on initial application is being assessed.
AASB 13 “Fair Value Measurement” and AASB 2011-8 “Amendments to Australian Accounting Standards arising from AASB 13” which provide a single source of guidance for assets and liabilities measured at fair value. The impact of AASB 13 on the Group’s financial statements on initial application is being assessed.
AASB 132 “Financial Instruments: Presentation”, has been amended to clarify the conditions for offsetting financial assets and liabilities. These amendments, expected to be applied by the Group from 1 October 2014 with early adoption permitted, will not impact the Group’s current accounting practice for offsetting arrangements.
(d) Currency of presentation
All amounts are expressed in Australian dollars unless otherwise stated.
(e) Rounding of amounts
In accordance with Australian Securities and Investments Commission Class Order 98/100 dated 10 July 1998, all amounts have been rounded to the nearest million dollars, except where indicated.
(f) Principles of consolidation
(i) Controlled entities
The consolidated Financial report comprises the Financial report of the Company and its controlled entities. Controlled entities are all those entities (including special purpose entities) over which the Company has the power to govern the financial and operating policies so as to obtain benefits from their activities. Special purpose entities require consolidation in circumstances such as those where the Group has access to the majority of the residual income or is exposed to the majority of the residual risk associated with the special purpose entity.
An assessment of control, and in respect of special purpose entities an assessment of the Group’s exposure to the majority of residual income or majority of residual risk, is performed on an ongoing basis.
Entities are consolidated from the date on which control is transferred to the Group. Entities are de-consolidated from the date that control ceases. The effects of transactions between entities within the Group are eliminated in full upon consolidation.
External interest in the equity and results of the entities that are controlled by the Group is shown as non-controlling interest in controlled entities in the equity section of the consolidated balance sheet.
Statutory funds of the Group’s life insurance business are consolidated in the Financial report. The Financial report consolidates all of the assets, liabilities, revenues and expenses of the statutory funds and non-statutory fund life insurance business irrespective of whether they are designated as relating to policyholders or shareholders. In addition, where the Group’s life insurance statutory funds have the capacity to control managed investment schemes, the Group consolidates all of the assets, liabilities, revenues and expenses of these managed investment schemes. External interest in the units and results of the managed investment schemes that are controlled by the statutory funds is shown as external unitholders’ liability in the liability section of the consolidated balance sheet.
Investments in controlled entities are recorded at cost less any provision for impairment.
(ii) Jointly controlled operations
A jointly controlled operation is a joint venture carried on by each venturer using its own assets in pursuit of the joint operation. The consolidated financial statements include the assets that the Group controls and the liabilities that it incurs in the course of pursuing the joint operation, and the expenses that the Group incurs and its share of the income that it earns from the joint operation.
(g) Foreign currency translation
(i) Functional and presentation currency
Items included in the financial statements of each of the Group’s entities are measured using the currency of the primary economic environment in which the entity operates (functional currency). The consolidated Financial report is presented in Australian dollars, which is the Company’s functional and presentation currency.

62 NATIONAL AUSTRALIA BANK
Notes to the financial statements
1 Principal accounting policies (continued)
(ii) Transactions and balances
Foreign currency transactions are translated into the functional currency using the exchange rates prevailing at the dates of the transactions. Foreign exchange gains and losses resulting from the settlement of such transactions and from the translation at year end exchange rates of monetary assets and liabilities denominated in foreign currencies are normally recognised in the income statement. Non-monetary items are translated using the exchange rate at the date of the initial recognition of the asset or liability.
(iii) Translation to the presentation currency
The results and financial position of all Group entities that have a functional currency different from the Group’s presentation currency are translated into the presentation currency as follows:• assets and liabilities are translated at the closing rate at the date of
the balance sheet;• income and expenses are normally translated at average
exchange rates for the period; and• all resulting exchange differences are recognised as a separate
component of equity in the foreign currency translation reserve.
On consolidation, exchange differences arising from the translation of the net investment in foreign entities, and of borrowings and other foreign currency instruments designated as hedges of such investments, are taken to the foreign currency translation reserve to the extent that the hedge is effective. To the extent that the hedge is ineffective, such differences are recognised in the income statement.
When a foreign operation is disposed, such exchange differences are recognised in the income statement as part of the gain or loss on disposal.
(h) Fair value measurement
Fair value is the amount for which an asset could be exchanged or a liability settled, between willing parties in an arm’s length transaction.
Where the classification of a financial asset or liability results in it being measured at fair value, wherever possible, the fair value is determined by reference to the quoted bid or offer price in the most advantageous active market to which the Group has immediate access. An adjustment for credit risk is also incorporated into the fair value as appropriate.
Fair value for a net open position that is a financial liability quoted in an active market is the current offer price, and for a financial asset the bid price, multiplied by the number of units of the instrument held or issued.
Where no active market exists for a particular asset or liability, the Group uses a valuation technique to arrive at the fair value, including the use of transaction prices obtained in recent arm’s length transactions, discounted cash flow analyses, option pricing models and other valuation techniques, based on market conditions and risks existing at balance sheet date. In doing so, fair value is estimated using a valuation technique that makes maximum use of observable market inputs and places minimal reliance upon entity-specific inputs.
The best evidence of the fair value of a financial instrument at initial recognition is the transaction price (i.e. the fair value of the consideration given or received) unless the fair value of that instrument is evidenced by comparison with other observable current market transactions in the same instrument (i.e. without modification or repackaging) or based on a valuation technique whose variables include only data from observable markets. When such evidence exists, the Group recognises the difference between the transaction price and the fair value in profit or loss on initial recognition (i.e. on day one).
(i) Due from other banks
Due from other banks includes loans, deposits with central banks and other regulatory authorities and settlement account balances due from other banks. Amounts due from other banks are initially recognised at fair value plus directly attributable transaction costs and subsequently measured at amortised cost.
(j) Repurchase and reverse repurchase agreements
Securities sold subject to repurchase agreements are retained in their respective balance sheet categories. The counterparty liability is included in amounts due to other banks and deposits and other borrowings, as appropriate, based upon the counterparty to the transaction. Securities lent to counterparties are also retained in their respective balance sheet categories.
Securities purchased under agreements to resell are accounted for as collateralised loans. The difference between the sale and repurchase price is treated as interest and accrued over the life of the agreements using the effective interest method. Such amounts are normally classified as due from other banks or cash and liquid assets.
Securities borrowed are not recognised in the financial statements unless they are sold to third parties, in which case the purchase and sale are recorded with the gain or loss included in trading income. The obligation to return securities borrowed is recorded at fair value.
(k) Recognition and derecognition of financial instruments
A financial asset or financial liability is recognised in the balance sheet when the Group becomes a party to the contractual provisions of the instrument, which is generally on trade date.
The Group derecognises a financial asset when the contractual cash flows from the asset expire or it transfers its rights to receive contractual cash flows on the financial asset in a transaction in which substantially all the risks and rewards of ownership are transferred. Any interest in transferred financial assets that is created or retained by the Group is recognised as a separate asset or liability.
A financial liability is derecognised from the balance sheet when the Group has discharged its obligation or the contract is cancelled or expires.
Financial assets and liabilities are offset and the net amount is presented in the balance sheet when the Group has a legal right to offset the amounts and intends to settle on a net basis or to realise the asset and settle the liability simultaneously.
(l) Derivative financial instruments and hedge accounting
All derivatives are recognised in the balance sheet at fair value and are classified as trading except where they are designated as a part of an effective hedge relationship and classified as hedging derivatives. The carrying value of a derivative is remeasured at fair value throughout the life of the contract. Derivatives are carried as assets when the fair value is positive and as liabilities when the fair value is negative.
Embedded derivatives are separated from the host contract and accounted for separately, if the economic characteristics and risks of the host contract and the embedded derivative are not closely related. A separate instrument with the same terms as the embedded derivative would meet the definition of a derivative, and the combined instrument is not measured at fair value through profit or loss.
The method of recognising the resulting fair value gain or loss on a derivative depends on whether the derivative is designated as a hedging instrument, and if so, the nature of the item being hedged. The Group designates certain derivatives as:

2012 Annual Financial Report 63
Notes to the financial statements
1 Principal accounting policies (continued)
• hedges of the fair value of recognised assets or liabilities or firm commitments (fair value hedges);
• hedges of highly probable future cash flows attributable to a recognised asset or liability, or a highly probable forecast transaction (cash flow hedges); or
• hedges of net investments in foreign operations.
Hedge accounting is used for derivatives designated in this way provided certain criteria are met.
The Group documents, at the inception of the transaction, the relationship between hedging instruments and hedged items, the risk being hedged and the Group’s risk management objective and strategy for undertaking these hedge transactions. The Group also documents how effectiveness will be measured throughout the life of the hedge relationship. In addition, the Group documents its assessment, both at hedge inception and on an ongoing basis, of whether the derivatives that are used in hedging transactions are highly effective in offsetting changes in fair values or cash flows of hedged items.
The Group measures hedge effectiveness on a prospective basis at inception, as well as retrospectively and prospectively over the term of the hedge relationship. Hedge effectiveness is assessed through the application of regression and dollar offset analysis.
(i) Fair value hedges
Subsequent to initial designation, changes in the fair value of derivatives that are designated and qualify as fair value hedges are recorded in the income statement, together with any changes in the fair value of the hedged asset or liability that are attributable to the hedged risk. The movement in fair value of the hedged item attributable to the hedged risk is made as an adjustment to the carrying value of the hedged asset or liability.
When a hedging instrument expires or is sold, or when a hedge no longer meets the criteria for hedge accounting, the adjustment to the carrying amount of a hedged item is amortised to the income statement on an effective yield basis. Where the hedged item is derecognised from the balance sheet, the adjustment to the carrying amount of the asset or liability is immediately transferred to the income statement.
(ii) Cash flow hedges
The effective portion of changes in the fair value of derivatives that are designated and qualify as cash flow hedges are recognised in the cash flow hedge reserve within equity. The gain or loss relating to the ineffective portion is recognised immediately in the income statement.
The carrying value of the hedged item is not adjusted. Amounts accumulated in equity are transferred to the income statement in the period(s) in which the hedged item affects the income statement (e.g. when the forecast hedged variable cash flows are recognised in the income statement).
When a hedging instrument expires or is sold, or when a hedge no longer meets the criteria for hedge accounting, any cumulative gain or loss existing in equity at that time remains in equity and is recognised in the income statement when the forecast transaction is ultimately recognised in the income statement. When a forecast transaction is no longer expected to occur, the cumulative gain or loss existing in equity at that time is immediately transferred to the income statement.
(iii) Net investment hedges
Hedges of net investments in foreign operations are accounted for similarly to cash flow hedges. Any gain or loss on the hedging instrument relating to the effective portion of the hedge is recognised
in the foreign currency translation reserve within equity. The gain or loss relating to the ineffective portion is recognised immediately in the income statement. Gains and losses accumulated in equity are transferred to the income statement when the foreign operation is disposed.
(iv) Derivatives that do not qualify for hedge accounting
Certain derivative instruments do not qualify for hedge accounting. This could occur for two reasons:• the derivative is held for the purpose of short-term profit taking; or• the derivative is held to economically hedge an exposure but does
not meet the accounting criteria for hedge accounting.
In both of these cases, the derivative is classified as a trading derivative and recognised at fair value with the attributable transaction costs recognised in the income statement as incurred.
(m) Items at fair value through profit or loss
Items at fair value through profit or loss comprise both items held for trading and items specifically designated as fair value through profit or loss on initial recognition. Financial instruments held at fair value through profit or loss are initially recognised at fair value, with transaction costs recognised in the income statement as incurred. Subsequently, they are measured at fair value and any gains and losses are recognised in the income statement as they arise.
Where a financial asset is measured at fair value, the movement in fair value attributable to changes in credit risk is calculated by determining the changes in credit spreads above observable market interest rates, established through a statistical-based calculation to estimate expected losses attributable to adverse movements in credit risk.
Where a financial liability is measured at fair value, the movement in fair value attributable to changes in the Group’s own credit quality is calculated by determining the changes in credit spreads above observable market interest rates.
(i) Financial instruments held for trading
A financial instrument is classified as held for trading, if it is acquired or incurred principally for the purpose of selling or repurchasing in the near term, or forms part of a portfolio of financial instruments that are managed together and for which there is evidence of short-term profit taking, or it is a derivative not in a qualifying hedge relationship.
Trading derivatives and trading securities are classified as held for trading.
(ii) Financial instruments designated at fair value through profit or loss
Upon initial recognition, financial instruments may be designated as fair value through profit or loss. Restrictions are placed on the use of the designated fair value option and the classification can only be used:• in respect of an entire contract if a host contract contains one or
more embedded derivatives;• if designating the financial instruments eliminates or significantly
reduces measurement or recognition inconsistencies (i.e. eliminates an accounting mismatch) that would otherwise arise from measuring financial assets or liabilities on a different basis; or
• if financial assets and liabilities are both managed and their performance evaluated on a fair value basis in accordance with a documented risk management or investment strategy.

64 NATIONAL AUSTRALIA BANK
Notes to the financial statements
1 Principal accounting policies (continued)
(iii) Assets relating to life insurance businesses
Refer to Note 1(p) for further details.
(n) Investments - available for sale
Available for sale investments are non-derivative financial assets that are designated as available for sale or are not categorised into any of the categories of fair value through profit or loss, loans and receivables or held to maturity.
Available for sale investments primarily comprise debt securities.
Available for sale investments are initially recognised at fair value plus directly attributable transaction costs and subsequently measured at fair value. Gains and losses arising from changes in fair value are included in the available for sale investments reserve within equity until disposal, when the cumulative gain or loss is transferred to the income statement. Upon disposal or impairment, the accumulated change in fair value in the available for sale investments reserve is recognised in the income statement.
(o) Investments - held to maturity
Held to maturity investments are non-derivative financial assets with fixed or determinable payments that the Group has the intention and ability to hold to maturity. Held to maturity investments are initially recognised at fair value plus directly attributable transaction costs and subsequently measured at amortised cost using the effective interest method, net of any provision for impairment.
Any sale or reclassification of a more than insignificant amount of held to maturity investments would result in a reclassification of all held to maturity investments as available for sale, other than certain sales or reclassifications, such as those that are close to an asset’s maturity or those that are attributable to an isolated event that could not have been reasonably anticipated (for example, a significant deterioration in an issuer’s credit worthiness). Following a sale or reclassification of held to maturity investments to available for sale in circumstances other than those noted above, the Group would be prevented from classifying financial assets as held to maturity in the financial year of the sale or reclassification and the following two financial years.
(p) Assets relating to life insurance business
All assets held in statutory funds are considered to back policy liabilities and are classified at fair value through profit or loss.
Assets and liabilities held in the statutory funds of the Australian life insurance business are subject to the restrictions of the Life Insurance Act 1995 (Cth) and the constitutions of the life insurance entities. The main restrictions are that the assets in a statutory fund can only be used to meet the liabilities and expenses of that fund, to acquire investments to further the business of that fund, or to make profit distributions when solvency and capital adequacy requirements of the Life Insurance Act 1995 (Cth) are met.
(q) Loans and advances
Loans and advances are non-derivative financial assets with fixed or determinable payments that are not quoted in an active market. Loans and advances are initially recognised at fair value plus directly attributable transaction costs and subsequently measured at amortised cost, using the effective interest method, net of any provision for doubtful debts.
In certain circumstances the Group applies the fair value measurement option to loans and advances. This option is applied to loans and advances where there is an embedded derivative within the loan contract and the Group has entered into a derivative to offset the
risk introduced by the embedded derivative. The loan is designated as fair value through profit or loss to offset the movements in the fair value of the derivative in the income statement. When this option is applied, the asset is included in other financial assets at fair value.
Where a loan is measured at fair value, a statistical-based calculation is used to estimate expected losses attributable to adverse movements in credit on the assets. This adjustment to the credit quality of the asset is then applied to the carrying value of the loan measured at fair value.
(r) Impairment
(i) Impairment of financial assets
The Group assesses, at each balance sheet date, whether there is objective evidence that a financial asset or a portfolio of financial assets, that is not carried at fair value through profit or loss, is impaired. A financial asset or portfolio of financial assets is impaired and impairment losses are incurred if there is objective evidence of impairment as a result of one or more loss events that occurred after the initial recognition of the asset and prior to the balance sheet date and it is considered that the loss event has had an impact on the estimated future cash flows of the financial asset (or the portfolio) that can be reliably estimated.
The Group first assesses whether objective evidence of impairment exists individually for financial assets that are individually significant, and individually or collectively for financial assets that are not individually significant. If the Group determines that no objective evidence of impairment exists for an individually assessed financial asset, whether significant or not, it includes the asset in a group of financial assets with similar credit risk characteristics and collectively assesses them for impairment. Assets that are individually assessed for impairment and for which an impairment loss is or continues to be recognised are not included in a collective assessment of impairment.
For loans and advances and held to maturity investments, the amount of impairment loss is measured as the difference between the asset’s carrying amount and the present value of estimated future cash flows discounted at the asset’s original effective interest rate. The amount of the loss is recognised using a provision account.
For the purposes of a collective evaluation of impairment, financial assets are grouped on the basis of similar risk characteristics.
Future cash flows in a group of financial assets that are collectively evaluated for impairment are estimated on the basis of the contractual cash flows of the assets in the Group and historical loss experience for assets with credit risk characteristics similar to those in the Group. Historical loss experience is adjusted based on current observable data. In addition, the Group uses its experienced judgement to estimate the amount of an impairment loss. The use of such judgements and reasonable estimates is considered by management to be an essential part of the process and does not impact reliability.
The methodology and assumptions used for estimating future cash flows are reviewed regularly to reduce any differences between loss estimates and actual loss experience.
Following impairment, interest income is recognised on the unwinding of the discount from the initial recognition of impairment.
When an asset is uncollectible, it is written off against the related provision. Such assets are written off after all the necessary procedures have been completed and the amount of the loss has been determined. Subsequent recoveries of amounts previously written off reduce the amount of the expense in the income statement.

2012 Annual Financial Report 65
Notes to the financial statements
1 Principal accounting policies (continued)
If, in a subsequent period, the amount of the impairment loss decreases and the decrease can be related objectively to an event occurring after the impairment was recognised, the previously recognised impairment loss is reversed by adjusting the provision account. The amount of the reversal is recognised in the income statement.
If the originally contracted terms of loans and advances are amended, the amounts are classified as restructured. Such accounts accrue interest as long as the loan performs in accordance with the restructured terms.
In the case of equity instruments classified as available for sale, the Group seeks evidence of a significant or prolonged decline in the fair value of the instrument below its cost to determine whether impairment exists. In the case of debt instruments classified as available for sale, impairment is assessed based on the same criteria as for other financial assets not carried at fair value through profit or loss. Where such evidence exists, the cumulative net loss that has been previously recognised directly in equity is recognised in the income statement. Reversals of impairment of debt instruments classified as available for sale are recognised in the income statement. Reversals of impairment of equity instruments classified as available for sale are not recognised in the income statement, but rather directly in equity.
(ii) Impairment of non-financial assets
Assets with an indefinite useful life, including goodwill, are not subject to amortisation and are tested on an annual basis for impairment, and additionally whenever an indication of impairment exists. Assets that are subject to amortisation are reviewed for impairment whenever events or changes in circumstances indicate that the carrying amount may not be recoverable. An impairment loss is recognised for the amount by which the carrying amount of an asset exceeds its recoverable amount.
The recoverable amount of an asset is the higher of its fair value less costs to sell or its value in use.
For assets that do not generate largely independent cash inflows, the recoverable amount is determined for the cash generating unit to which that asset belongs. Management judgement is applied to identify cash generating units (which are determined according to the lowest level of aggregation for which an active market exists, as this evidences the assets involved that create largely independent cash inflows). Each of these cash generating units is represented by an operating segment or a subdivision of an operating segment.
(s) Acceptances
The Group’s liability arising from the acceptance of bills of exchange and the asset under acceptance representing the claims against its customer are measured initially at fair value and subsequently at amortised cost. When the Group discounts its own acceptance, the acceptance liability is derecognised. When the Group rediscounts its own acceptance, an acceptance liability is re-recognised and the asset remains recognised as an acceptance. The difference between the purchase and sale of the Group’s own acceptance gives rise to realised profits and losses that are recognised in the income statement. Bill acceptance fees are deferred and amortised on an effective yield basis over the life of the instrument.
(t) Property, plant and equipment
Land and buildings are measured at fair value and are revalued on a rolling three year cycle, effective 31 July, by directors to reflect fair values. Directors’ valuations are based on advice received from independent valuers. Such valuations are performed on an
open market basis, being the amounts for which the assets could be exchanged between a knowledgeable, willing buyer and a knowledgeable, willing seller in an arm’s length transaction at the valuation date. Newly acquired property assets are held at cost (i.e. equivalent to fair value due to their recent acquisition) until the time of the next annual review, a period not exceeding 12 months.
Revaluation increments are credited directly to the asset revaluation reserve, net of tax. However, the increment is recognised in the income statement to the extent it reverses a revaluation decrement previously recognised as an expense for a specific asset. Revaluation decrements are charged against the asset revaluation reserve to the extent that they reverse previous revaluation increments for a specific asset. Any excess is recognised as an expense in the income statement. This policy is applied to assets individually. Revaluation increases and decreases are not offset, even within a class of assets, unless they relate to the same asset.
Other items of plant and equipment are carried at cost less accumulated depreciation and any impairment losses. The cost of plant and equipment includes an obligation for removal of the asset or restoration of the site where such an obligation exists and if that cost can be reliably estimated.
With the exception of freehold land, all items of property, plant and equipment are depreciated using the straight-line method at rates appropriate to their estimated useful life to the Group. For major classes of property, plant and equipment, the annual rates of depreciation are:• buildings - 3.3%;• furniture, fixtures and fittings and other equipment - from 10% to
20%;• motor vehicles - 20%;• personal computers - 33.3%; and• other data processing equipment - from 20% to 33.3%.Leasehold improvements are depreciated on a straight-line basis over the shorter of their useful lives and the remaining expected term of the lease.
Assets’ residual values and useful lives are reviewed, and adjusted if appropriate, at each balance sheet date.
Gains or losses on the disposal of property, plant and equipment, which are determined as the difference between the net sale proceeds, if any, and the carrying amount at the time of disposal are included in the income statement.
Any realised amounts in the asset revaluation reserve are transferred directly to retained profits.
(u) Leases
Determining whether an arrangement contains a lease
At the inception of an arrangement, the Group determines whether the arrangement is or contains a lease. A specific asset is the subject of a lease if fulfilment of the arrangement is dependent on the use of that specified asset. An arrangement provides the right to use an asset, if the arrangement provides the right to control the use of the underlying asset. At inception or upon reassessment of an arrangement, the Group separates payment and other consideration required by such an arrangement into those for the lease and those for other elements on the basis of their relative fair values. If the Group concludes for a finance lease that it is impracticable to separate the amounts reliably, an asset and a liability is recognised at an amount equal to the fair value of the underlying asset. Subsequently the liability is reduced as payments are made and

66 NATIONAL AUSTRALIA BANK
Notes to the financial statements
1 Principal accounting policies (continued)
an imputed finance charge on the liability is recognised using the Group’s incremental borrowing rate.
Leases where the Group assumes substantially all risks and rewards of ownership are classified as finance leases. All other leases are classified as operating leases.
(i) As lessee
Operating lease rentals are charged to the income statement on a straight-line basis over the term of the lease. When an operating lease is terminated before the end of the lease period, any payment made to the lessor by way of penalty is recognised as an expense in the income statement in the period of termination. Lease incentives received are recognised as an integral part of the total lease expense, over the term of the lease.
(ii) As lessor
For finance leases, the net investment in the lease, which comprises of the present value of lease payments including any guaranteed residual value and initial direct costs, is recognised within loans and advances. The difference between the gross receivable and the present value of the receivable is unearned income. Income is recognised over the term of the lease using the net investment method (before tax), reflecting a constant periodic rate of return.
For operating leases, assets leased are included within property, plant and equipment at cost and depreciated over the life of the lease after taking into account anticipated residual values. Operating lease rental income is recognised within other operating income in the income statement on a straight-line basis over the life of the lease. Depreciation is recognised within the income statement consistent with the nature of the asset.
(v) Business combinations
The acquisition method of accounting is used for all business combinations. Consideration is measured at fair value and is calculated as the sum of the acquisition date fair value of assets transferred, liabilities incurred to former owners of the acquiree and equity instruments issued. Acquisition related costs are expensed as incurred.
When a non-controlling interest is present in an entity over which the Group gains control, the non-controlling interest is measured at either fair value or at the proportionate share of the acquiree’s identifiable net assets. This choice of accounting treatment is applied on a transaction by transaction basis. Any put and call instruments transacted concurrently with a business combination to acquire the remaining non-controlling interest are assessed to determine whether there is creation of a forward purchase agreement to acquire the remaining outstanding equity at a future date.
Any contingent consideration to be transferred is recognised at fair value at the acquisition date. Subsequent changes to the carrying amount of contingent consideration are recognised either in the income statement or in equity depending on the nature of the payment.
(w) Goodwill and other intangible assets
(i) Goodwill
Goodwill arises on the acquisition of an entity and represents the excess of the aggregate of the fair value of the purchase consideration and the amount of any non-controlling interest in the entity over the fair value of the Group’s share of the identifiable net assets at the date of the acquisition. If the Group’s interest in the fair value of the identifiable net assets of the acquired entity is greater
than the aggregate of the fair value of the purchase consideration and amount of any non-controlling interest, the excess is recognised in the income statement on acquisition date and no goodwill is recognised.
Goodwill is assessed for impairment annually, or more frequently if there is indication that goodwill may be impaired. For the purposes of impairment testing, goodwill has been allocated to cash generating units that benefit from the synergies of the acquisition. Each cash generating unit or group of cash generating units to which goodwill is allocated is the lowest level within the Group at which goodwill is monitored by management. Impairment is assessed by comparing the carrying amount of the cash generating unit or group of units, including the goodwill, with its recoverable amount. An impairment loss is recognised in the income statement if the carrying amount of the cash generating unit or group of units is greater than its recoverable amount. Impairment losses recognised for goodwill are not subsequently reversed.
(ii) Software costs
The identifiable and directly associated external and internal costs of acquiring and developing software are capitalised and recognised as an intangible asset where the software is controlled by the Group, and where it is probable that future economic benefits will flow from its use over more than one year. Costs associated with maintaining software are recognised as an expense as incurred.
Computer software and other intangible assets are stated at cost less amortisation and impairment losses, if any.
Capitalised software costs and other intangible assets are amortised on a systematic basis, using the straight-line method or the unit of production method over their expected useful lives which are between three and seven years.
(iii) Intangible assets acquired in a business combination
Intangible assets acquired in a business combination are identified and recognised separately from goodwill where they satisfy the definition of an intangible asset and their fair values can be measured reliably, and are initially measured at cost. The cost of an intangible asset acquired in a business combination is its fair value at the date of acquisition.
Subsequent to acquisition, finite life intangible assets are stated at cost less amortisation and impairment losses, if any. Amortisation is charged on a straight-line basis over their estimated useful lives which vary from three to 15 years. Amortisation methods, useful lives and residual values are reviewed each financial year end and adjusted if appropriate.
Subsequent to acquisition, indefinite life intangible assets are stated at cost less impairment losses, if any. Indefinite life intangible assets are assessed for impairment annually, or more frequently if there is indication that the intangible asset may be impaired.
(x) Investment property
Investment property is property held either to earn rental income or for capital appreciation, or both. Investment property is measured at fair value with any increments or decrements recognised in other operating income. Valuations are carried out annually by professional valuers.
(y) Due to other banks
Due to other banks includes deposits, repurchase agreements and settlement account balances due to other banks. Amounts due to other banks are initially recognised at fair value less directly

2012 Annual Financial Report 67
Notes to the financial statements
1 Principal accounting policies (continued)
attributable transaction costs and subsequently measured at amortised cost.
(z) Deposits and other borrowings
Deposits and other borrowings include non-interest-bearing deposits redeemable at call, on-demand and short-term deposits lodged for periods of less than 30 days, certificates of deposit, interest-bearing deposits, debentures and other borrowings. Deposits and other borrowings are initially recognised at fair value less directly attributable transactions costs and subsequently measured at amortised cost.
(aa) Life policy liabilities
Life policy liabilities in the Group’s balance sheet and the change in policy liabilities in the Group’s income statement have been calculated in accordance with Prudential Standard LPS1.04 ‘Valuation of Policy Liabilities’ issued by the Australian Prudential Regulation Authority (APRA).
(i) Life insurance contracts
Policy liabilities from insurance contracts are measured predominantly using the projection method which is the net present value of estimated future policy cash flows. Future cash flows incorporate investment income, premiums, expenses, redemptions and benefit payments (including bonuses). The accumulation method is only used where the result would not be materially different to the projection method.
Unvested policyholder benefits represent amounts that have been allocated to certain non-investment-linked policyholders that have not yet vested with specific policyholders.
The measurement of policy liabilities is subject to actuarial assumptions. Assumptions made in the calculation of policy liabilities at each balance sheet date are based on best estimates at that date. The assumptions include the benefits payable under the policies on death, disablement or surrender, future premiums, investment earnings and expenses. Best estimate means that assumptions are neither optimistic nor pessimistic but reflect the most likely outcome. The assumptions used in the calculation of the policy liabilities are reviewed at each balance sheet date. Deferred acquisition costs are presented as an offset in policy liabilities.
To the extent that the benefits under life insurance contracts are not contractually linked to the performance of the assets held, the life insurance liabilities are discounted for the time value of money using risk-free discount rates based on current observable, objective rates that relate to the nature, structure and term of the future obligations. Where the benefits under life insurance contracts are contractually linked to the performance of the assets held, the life insurance liabilities are discounted using discount rates based on the market returns on assets backing life insurance liabilities.
For reinsurance contracts, the Group retains the primary obligation of the underlying life insurance contract.
(ii) Life investment contracts
Policy liabilities for investment contracts are measured at fair value, with this value determined as equal to or greater than the surrender value of the policy. The discount rate reflects the return on assets backing the liabilities.
(bb) Provisions
Provisions are recognised when a legal or constructive obligation exists as a result of a past event, it is probable that an outflow of
economic benefits will be necessary to settle the obligation and the amount of the obligation can be reliably estimated. Provisions are not discounted to the present value of their expected net future cash flows except where the time value of money is material.
Contingent liabilities are possible obligations whose existence will be confirmed only by uncertain future events or present obligations where the transfer of economic benefits is not probable or cannot be reliably measured. Contingent liabilities are not recognised in the balance sheet but are disclosed unless the likelihood of payment is remote.
(i) Operational risk events
Provisions for operational risk event losses are raised for non-lending losses which include losses arising from specific legal actions not directly related to amounts of principal outstanding for loans and advances, and losses arising from forgeries, frauds and the correction of operational issues.
The amount recognised as a provision is the best estimate of the consideration required to settle the present obligation at the balance sheet date, taking into account the risks and uncertainties that surround the events and circumstances that affect the provision.
(ii) Restructuring costs
Provisions for restructuring costs include provisions for costs incurred but not yet paid and future costs that will arise as a direct consequence of decisions already made. A provision for restructuring costs is only made where the Group has made a commitment and entered into an obligation such that the Group has no realistic alternative but to carry out the restructure and make future payments to settle the obligation. A provision for restructuring costs is only recognised when a detailed plan has been approved and the restructuring has either commenced or has been publicly announced. This includes the cost of staff termination benefits and surplus lease space. Costs related to ongoing activities and future operating losses are not provided for.
(cc) Financial guarantees
The Group provides guarantees in its normal course of business on behalf of its customers. A financial guarantee contract is initially recorded at fair value which is equal to the premium received or receivable, unless there is evidence to the contrary. Subsequently, financial guarantee contracts are measured at the higher of:• the liability for the estimated amount of the loss payable where it is
likely that a loss will be incurred as a result of issuing the contract; and
• the amount initially recognised less, when appropriate, amortisation of the fee over the life of the guarantee.
(dd) Employee benefits
Wages and salaries, annual leave and other employee entitlements expected to be paid or settled within 12 months of employees rendering service are measured at their nominal amounts using remuneration rates that the Group expects to pay when the liabilities are settled.
Employee entitlements to long service leave are accrued using an actuarial calculation, including assumptions regarding staff departures, leave utilisation and future salary increases.
A liability is recognised for the amount expected to be paid under short-term cash bonuses when the Group has a present legal or constructive obligation to pay this amount as a result of past service provided by the employee and the obligation can be reliably estimated.

68 NATIONAL AUSTRALIA BANK
Notes to the financial statements
1 Principal accounting policies (continued)
All other employee entitlements that are not expected to be paid or settled within 12 months of the balance sheet date are measured at the present value of net future cash flows.
Termination benefits are recognised as an expense when the Group is demonstrably committed, without realistic possibility of withdrawal, to a formal detailed plan to either terminate employment before the normal retirement date, or to provide termination benefits as a result of an offer made to encourage voluntary redundancy. Termination benefits for voluntary redundancy are recognised as an expense if the Group has made an offer of voluntary redundancy, it is probable that the offer will be accepted, and the number of acceptances can be estimated reliably.
Employees of the Group are entitled to benefits on retirement, disability or death, from the Group’s superannuation plans. The Group operates superannuation plans which have both defined benefit and defined contribution components.
The defined contribution plans receive fixed contributions and the obligation for contributions to these plans are recognised as an expense in the income statement as incurred. Prepaid contributions are recognised as an asset to the extent that a cash refund or a reduction in future payments is available.
The defined benefit plans provide defined lump sum benefits based on years of service and a salary component determined in accordance with the specific plan. An asset or liability in respect of defined benefit superannuation plans is recognised in the balance sheet and is measured as the present value of the defined benefit obligation less the fair value of the superannuation plan’s assets at the balance sheet date.
The present value of the defined benefit obligation for each plan is discounted by either the government bond rate, or the average AA credit rated bond rate for bonds that have maturity dates approximating the terms of the obligation. The present value of the defined benefit obligations is calculated every three years using the projected unit credit method and updated on an annual basis for material movements in the plan position.
The Group does not offset plan assets and liabilities arising from different defined benefit plans. Past service costs are recognised immediately in the income statement. Where actuarial gains and losses arise as a result of actual experience, such amounts are fully recognised directly in retained profits.
Future taxes that are funded by the entity, and are part of the provision of existing benefit obligations, are taken into account in measuring the net asset or liability.
(ee) Trustee and funds management activities
The Group acts as trustee, custodian or manager of a number of funds and trusts, including superannuation and approved deposit funds, and wholesale and retail investment trusts. Where the Group does not have direct or indirect control of these funds and trusts, the assets and liabilities are not included in the consolidated financial statements of the Group. When controlled entities, as responsible entities or trustees, incur liabilities in respect of their activities, a right of indemnity exists against the assets of the applicable trusts and funds. Where these assets are determined to be sufficient to cover liabilities, and it is not probable that the controlled entities will be required to settle them, the Group does not include the liabilities in the consolidated financial statements.
Commissions and fees earned in respect of the Group’s trust and funds management activities are included in the income statement.
(ff) Securitisation
Through its loan securitisation program, the Group packages and sells loans (principally housing mortgage loans) as securities to investors through a series of securitisation vehicles. The Group is entitled to any residual income of the vehicles after all payments to investors and costs of the program have been met. The Group is considered to hold the majority of the residual risks and benefits of the vehicles. All relevant financial assets continue to be held on the Group balance sheet, and a liability is recognised for the proceeds of the funding transaction.
In addition to its loan securitisation program, the Group has various contractual relationships with entities that undertake securitisation of third party assets. The Group sponsors, manages and provides liquidity facilities and derivative contracts to these securitisation conduits.
(gg) Income tax
Income tax expense (or benefit) is the tax payable (or receivable) on the current period’s taxable income based on the applicable tax rate in each jurisdiction adjusted by changes in deferred tax assets and liabilities. Income tax expense is recognised in the income statement except to the extent that it related to items recognised directly in equity, in which case it is recognised in equity. The tax associated with these transactions will be recognised in the income statement at the same time as the underlying transaction.
Current tax liability is the expected tax payable on the taxable income for the year, using tax rates enacted or substantively enacted at the balance sheet date, and any adjustment to tax payable in respect of previous years.
Deferred tax assets and liabilities are recognised for temporary differences arising between the tax bases of assets and liabilities and their carrying amounts. Deferred income tax is determined using tax rates (and laws) that have been enacted or substantively enacted by the balance sheet date and are expected to apply when the related deferred income tax asset is realised or the deferred income tax liability is settled.
Deferred tax assets are only recognised for temporary differences, unused tax losses and unused tax credits if it is probable that future taxable amounts will arise to utilise those temporary differences and losses. Deferred tax assets are reviewed at each balance sheet date and are reduced to the extent that it is no longer probable that the related tax benefit will be realised.
Deferred tax assets and liabilities are offset where there is a legally enforceable right to offset current tax assets and liabilities and they relate to income taxes levied by the same tax authority on the same taxable entity, or on different tax entities, but they intend to settle current tax liabilities and assets on a net basis or their tax assets and liabilities are realised simultaneously.

2012 Annual Financial Report 69
Notes to the financial statements
1 Principal accounting policies (continued)
For life insurance business, taxation is not based on the concept of profit. Legislative provisions apply to tax policyholders and shareholders on different bases. According to the class of business to which their policies belong, policyholders have their investment earnings taxed at the following rates in Australia:• superannuation policies - 15%;• annuity policies - 0%; or• other policies - 30%.
The life insurance business shareholders’ funds in Australia are taxed at the company rate of 30% on fee income and profit arising from insurance risk policies less deductible expenses.
Tax consolidation
The Group and its wholly owned Australian resident entities formed a tax-consolidated group with effect from 1 October 2002 and are taxed as a single entity from that date. The head entity within the tax-consolidated group is National Australia Bank Limited.
Current tax expense (or benefit) and deferred tax assets and liabilities arising from temporary differences of the members of the tax-consolidated group are recognised in the separate financial statements of the members of the tax-consolidated group using the Group allocation approach.
Any current tax liabilities (or assets) and deferred tax assets arising from unused tax losses of the subsidiaries are assumed by the head entity in the tax-consolidated group and are recognised as amounts payable (or receivable from) other entities in the tax-consolidated group under the tax funding arrangement. Any difference between the amounts assumed and amounts receivable/payable under the tax funding agreement are recognised by the Company as an equity contribution to or distribution from its subsidiaries.
The members of the tax-consolidated group have entered into a tax funding arrangement that sets out the funding obligations of members of the tax-consolidated group in respect of tax amounts. Contributions to fund the current tax liabilities are payable in accordance with the tax funding arrangement and reflect the timing of the head entity’s obligation to make payments for tax liabilities to the relevant taxation authority.
(hh) Goods and services tax
Revenues, expenses and assets are recognised net of the amount of goods and services tax or other value-added tax, except where the tax incurred is not recoverable from the relevant taxation authority. In these circumstances, the tax is recognised as part of the expense or the cost of acquisition of the asset.
Receivables and payables are stated at an amount with tax included. The net amount of tax recoverable from, or payable to, the relevant taxation authority is included in other assets or other liabilities. Cash flows are included in the cash flow statement on a gross basis. The tax component of cash flows arising from investing and financing activities which is recoverable from, or payable to, the relevant taxation authority is classified as operating cash flows.
(ii) Bonds, notes, subordinated debt and other debt issues
Bonds, notes, subordinated debt and other debt issues are short and long-term debt issues including commercial paper, notes, term loans, medium-term notes, mortgage backed securities and other discrete debt issues.
Bonds, notes, subordinated debt and other debt issues are generally initially recognised at fair value less directly attributable transaction costs and subsequently measured at amortised cost using the effective interest method. Premiums, discounts and associated issue
expenses are recognised using the effective interest method through the income statement from the date of issue to accrete the carrying value of securities to redemption values by maturity date. Embedded derivatives within debt instruments are separately accounted for where not closely related to the terms of the host debt instrument.
In certain circumstances the Group applies the fair value measurement option to bonds, notes and subordinated debt issues and other debt issues. This option is applied where an accounting mismatch is significantly reduced or eliminated that would occur if the liability was measured on another basis. Where liabilities are designated at fair value through profit or loss, they are initially recognised at fair value, with transaction costs recognised in the income statement as incurred. Subsequently, they are measured at fair value and any gains or losses are recognised in the income statement as they arise.
(jj) Contributed equity
In accordance with the Corporations Act 2001 (Cth), the Company does not have authorised capital and all ordinary shares have no par value. Ordinary shares are classified as equity. Incremental costs directly attributable to the issue of new shares or options are included within equity. Holders of ordinary shares are entitled to receive dividends as declared from time to time and are entitled to one vote on a show of hands or, on a poll, one vote for each fully paid ordinary share held at shareholders’ meetings. In the event of a winding-up of the Company, ordinary shareholders rank after all other shareholders and creditors and are fully entitled to any residual proceeds of liquidation.
(kk) Treasury shares
If a controlled entity acquires shares in the Company (treasury shares), the cost of the acquired shares is recognised as a deduction from issued capital. Dividends on treasury shares are not credited to income, but eliminated on consolidation. Gains and losses on the sale of treasury shares are accounted for as adjustments to issued capital and not as part of income.
Shares in the Company held by certain statutory funds of the Group’s life insurance business (which are consolidated in the Financial report) are accounted for as treasury shares. Additionally, shares purchased on market to meet the requirements of employee incentive schemes and held in trust are accounted for as treasury shares.
(ll) Reserves
(i) General reserve
The balance of the general reserve was transferred to retained profits as at 30 September 2012. Going forward the statutory funds’ retained profits will no longer be segregated but instead will form part of the Group’s consolidated retained profits.
(ii) Asset revaluation reserve
The asset revaluation reserve records revaluation increments and decrements arising from the revaluation of land and buildings.
(iii) Foreign currency translation reserve
The foreign currency translation reserve records foreign currency differences arising from the translation of foreign operations, the translation of transactions that hedge the Company’s net investment in a foreign operation or the translation of foreign currency monetary items forming part of the net investment in a foreign operation.

70 NATIONAL AUSTRALIA BANK
Notes to the financial statements
1 Principal accounting policies (continued)
(iv) Cash flow hedge reserve
The cash flow hedge reserve records the fair value revaluation of derivatives designated and effective as cash flow hedging instruments.
(v) Equity-based compensation reserve
The equity-based compensation reserve records the value of equity benefits provided to employees as part of their remuneration.
Share capital tainting rules contained in Australian tax legislation apply prospectively from 26 May 2006 to discourage companies from distributing profits to shareholders as preferentially taxed capital rather than dividends. The focus of the tax legislation is on the transfer of amounts to a share capital account from another account.
The tainting rules are inconsistent with AASB 2 “Share-based Payment” which allows transfers between equity accounts upon the vesting of employee equity-based payments (i.e. when all conditions have been met by the employee).
During 2009, the Group received a private binding ruling from the Australian Taxation Office on this matter. The ruling allows, under certain circumstances, vested employee shares to be reversed from the equity-based compensation reserve and ultimately recorded in paid-up capital without giving rise to a tainting of the Company’s share capital account for tax purposes.
The share capital tainting rules and private binding ruling have no impact on the regulatory capital of the Group.
(vi) General reserve for credit losses
APRA Prudential Standard APS 220 “Credit Quality” requires a reserve to be held to cover credit losses estimated but not certain to arise in the future over the full life of all individual facilities. The general reserve for credit losses represents an appropriation of retained profits to non-distributable reserves.
(mm) Revenue recognition
Revenue is recognised and measured at the fair value of the consideration received or receivable, to the extent it is probable that the economic benefits will flow to the Group and the revenue can be reliably measured.
(nn) Interest income
Interest income is recognised in the income statement using the effective interest method.
The effective interest method is a method of calculating amortised cost using the effective interest rate of a financial asset or financial liability. The effective interest rate is the rate that exactly discounts the estimated stream of future cash payments or receipts over the expected life of the financial instrument or, when appropriate a shorter period, to the net carrying amount of the financial asset or financial liability.
Loan origination fees are recognised as income over the life of the loan as an adjustment of yield. Commitment fees are deferred until the commitment is exercised and are recognised over the life of the loan as an adjustment of yield or, if unexercised, recognised as income upon expiration of the commitment. Where commitment fees are retrospectively determined and nominal in relation to market interest rates on related loans, commitment fees are recognised as income when charged. Where the likelihood of exercise of the commitment is remote, commitment fees are recognised as income over the commitment period.
Direct loan origination costs are netted against loan origination fees and the net amount recognised as income over the life of the loan as an adjustment of yield. All other loan-related costs are expensed as incurred.
(oo) Life insurance business
The Group conducts its life insurance business through a number of controlled entities including MLC Limited and BNZ Life Insurance Limited.
(i) Types of business
The Australian life insurance operations of the Group consist of investment-linked business and non-investment-linked business, which are conducted in separate statutory funds as required under the Life Insurance Act 1995 (Cth). The overseas life insurance operations of the Group consist primarily of non-investment-linked business.
Life investment contracts include investment-linked contracts where policyholders’ investments are held within the statutory funds and policyholders’ returns are directly linked to the investment performance of the assets in that fund. The policyholder bears all the risks and rewards of the investment performance. The policyholder has no direct access to the specific assets; however, the policy value is calculated by reference to the market value of the statutory fund’s assets. Investment-linked business includes superannuation and allocated pension business. Fee income is derived from the administration of investment-linked policies and funds.
Life insurance contracts involve the acceptance of significant insurance risk. Insurance risk is significant if an insured event could cause an insurer to pay significant additional benefits in any scenario that has commercial substance. Any products sold by a life insurer that do not meet the definition of a life insurance contract are classified as life investment contracts. Insurance contracts include those where an insured benefit is payable on the occurrence of a specified event such as death, injury or disability caused by accident or illness or, in the case of an annuity, the continuance of the annuitant’s life or the expiry of the annuity term. The benefit payable is not directly referable to the market value of the fund’s assets.
Non-investment-linked business includes traditional whole of life and endowment policies (where the risks and rewards generally are shared between policyholders and shareholders) and risk policies such as death, disability and income insurance (where the shareholder bears all of the financial risks).
(ii) Allocation of profit
Life insurance contractsProfits are brought to account in the statutory funds on a Margin on Services (MoS) basis in accordance with Actuarial Standards. Under MoS, profit is recognised as fees are received and services are provided to policyholders over the life of the contract that reflects the pattern of risk accepted from the policyholder. When fees are received but the service has not been provided, profit is not recorded at the point of sale. Losses are expensed when identified.
Consistent with the principle of deferring unearned profit is the requirement to defer expenditure associated with the deferred profit. MoS permits costs associated with the acquisition of life insurance policies to be charged to the income statement over the period that the policy will generate profits. However, costs may only be deferred to the extent that a policy is expected to be profitable.
Profits arising from policies comprising non-investment-linked business are based on actuarial assumptions, and calculated as

2012 Annual Financial Report 71
Notes to the financial statements
1 Principal accounting policies (continued)
the excess of premiums and investment earnings less claims, operating expenses and the amortisation of acquisition costs that will be incurred over the estimated life of the policies. The profit is systematically recognised over the estimated period the policy will remain in force.
Certain policies are entitled to share in the profits that arise from the non-investment-linked business. This profit sharing is governed by the Life Insurance Act 1995 (Cth) and the life insurance companies’ constitutions. This profit sharing amount is treated as an expense in the income statement.
Life investment contractsProfit from investment-linked business is derived as the excess of the fees earned by the shareholder for managing the funds invested over operating expenses.
(iii) Premium and related revenue
Life insurance contractsPremiums are separated into their revenue and liability components. Premium amounts earned by providing services and bearing risks, including protection business, are treated as revenue. Other premium amounts received, net of initial fee income, which are akin to deposits, are recognised as an increase in policy liabilities.
Premiums with a regular due date are recognised as revenue on a due basis. Premiums with no due date are recognised as revenue or an increase in policy liabilities on a cash received basis. Premiums due before the balance sheet date but not received at balance sheet date are included as outstanding premiums receivable. Premiums due after but received before the balance sheet date are accounted for as premiums in advance.
Life investment contractsThe initial fee, which is the difference between the premium received and the initial surrender value, is recognised as fee income. Premiums are recognised as an increase in policy liabilities.
(iv) Investment revenue
Dividend and interest income is brought to account on an accruals basis when the life insurance controlled entity obtains control of the right to receive the dividend or interest income. Net realised profits and losses and changes in the measurement of fair values in respect of all investments recognised at fair value are recognised in the income statement in the period in which they occur.
(v) Claims expense
Claims are recognised when the liability to a policyholder under a policy contract has been established or upon notification of the insured event, depending on the type of claim. Claims are separated into their expense and liability components.
Life insurance contractsClaims incurred that relate to the provision of services and bearing of risks are treated as expenses and are recognised on an accruals basis.
Life investment contractsClaims incurred in respect of investment contracts, which are in the nature of investment withdrawals, are recognised as a reduction in policy liabilities.
(vi) Basis of expense apportionment
All expenses charged to the income statement are equitably apportioned to the different classes of business in accordance with Division 2 of Part 6 of the Life Insurance Act 1995 (Cth) as follows:
• expenses and other outgoings that relate specifically to a particular statutory fund are directly charged to that fund; and
• expenses and other outgoings (excluding commissions, medical fees and stamp duty relating to the policies which are all directly allocated) are apportioned between each statutory fund and shareholders’ fund.
Expenses are apportioned between classes of business by first allocating the expenses to major functions and activities, including sales support and marketing, new business processing and policyholder servicing. Expenses are then allocated to classes of products using relevant activity cost drivers, including commissions, policy counts, funds under management and benchmark profit.
Investment income, gains and losses on sale of property, plant and equipment, gains and losses on sale of investments, and appreciation and depreciation of investments are directly credited or charged to the appropriate statutory fund or shareholders’ fund.
(vii) Deferred acquisition costs
The extent to which policy acquisition costs are deferred varies according to the classification of the contract acquired (either life insurance or life investment).
Life insurance contractsThe costs incurred in selling or generating new business include adviser fees, commission payments, application processing costs, relevant advertising costs and costs for promotion of products and related activities. These costs are deferred to the extent they are deemed recoverable from premiums or policy charges (as appropriate for each policy class). Deferred acquisition costs are amortised over the period that they will be recovered from premiums or policy charges.
Life investment contractsThe incremental costs incurred in selling or generating new business are expensed as incurred.
(pp) Dividend income
Dividend income is recorded in the income statement on an accruals basis when the Group’s right to receive the dividend is established.
(qq) Fees and commissions
Unless included in the effective interest calculation, fees and commissions are recognised on an accruals basis when the service has been provided or on completion of the underlying transaction.
When the Group acts in the capacity of an agent, revenue is recognised as the net amount of fees and commissions made by the Group.
Asset management fees related to investment funds are recognised over the period the service is provided. The same principle is applied to the recognition of income from wealth management, financial planning and custody services that are continuously provided over an extended period of time. Account keeping charges, credit card fees, money transfer fees and loan servicing fees are recognised in the period the service is provided. Syndication fees are recognised as income after certain retention, timing and yield criteria are satisfied.
(rr) Gains less losses on financial instruments at fair value
Gains less losses on financial instruments at fair value comprise fair value gains and losses from:• trading derivatives;• trading securities;

72 NATIONAL AUSTRALIA BANK
Notes to the financial statements
1 Principal accounting policies (continued)
• instruments designated in hedge relationships; and• other financial assets and liabilities designated at fair value through
profit or loss.
In general, gains less losses on trading derivatives recognises the full change in fair value of the derivatives inclusive of interest income and expense. However, in cases where a trading derivative is economically offsetting movements in the fair value of a financial asset or liability designated at fair value through profit or loss, the interest income and expense attributable to the derivative is recognised within net interest income and not part of the fair value movement of the trading derivative.
Interest income and expense on trading securities are recognised within net interest income.
Gains less losses on hedging assets, liabilities and derivatives designated in hedge relationships recognises fair value movements on both the hedged item and hedging derivative in a fair value hedge relationship, and hedge ineffectiveness from both fair value and cash flow hedge relationships. Interest income and expense on both hedging instruments and instruments designated at fair value through profit or loss are recognised in net interest income.
Gains less losses on financial assets and liabilities designated at fair value through profit or loss recognises fair value movements (excluding interest) on those items designated as fair value through profit or loss. Interest income and expense on financial assets and liabilities designated at fair value through profit or loss are recognised within net interest income.
(ss) Equity-based compensation
The Group provides equity-based compensation to employees in respect of services received. The value of the services received is measured by reference to the grant date fair value of the shares, performance options and performance rights provided to employees.
The expense for each tranche of shares, performance options or performance rights granted is recognised in the income statement on a straight-line basis, adjusted for forfeitures, over the period that the services are received (the vesting period), with a corresponding increase in the equity-based compensation reserve.
The grant date fair value of shares is generally determined by reference to the weighted average price of the Company’s shares in the week up to, and including, the date on which the shares are granted. Employee share plans are linked to internal performance, market performance and/or service conditions. The fair value of shares with a market performance condition is determined using a Monte Carlo simulation.
The grant date fair value of the performance options and performance rights is determined using a simulated version of the Black-Scholes model. The key assumptions and inputs used in the valuation model are the exercise price of the performance options or performance rights, the expected volatility of the Company’s share price, the risk-free interest rate and the expected dividend yield on the Company’s shares for the life of the performance options and performance rights. When estimating expected volatility, historic daily share prices are analysed to arrive at annual and cumulative historic volatility estimates (which may be adjusted for any abnormal periods or non-recurring significant events). Trends in the data are analysed to estimate volatility movements in the future for use in the numeric pricing model. The simulation takes into account both the probability of achieving market performance conditions and the potential for early exercise of vested performance options or performance rights.
While market performance conditions are incorporated into the grant date fair values, non-market conditions are not taken into account when determining the fair value and expected time to vesting of shares, performance options and performance rights. Instead, non-market conditions are taken into account by adjusting the number of shares, performance options and performance rights included in the measurement of the expense so that the amount recognised in the income statement reflects the number of shares, performance options or performance rights that actually vest.
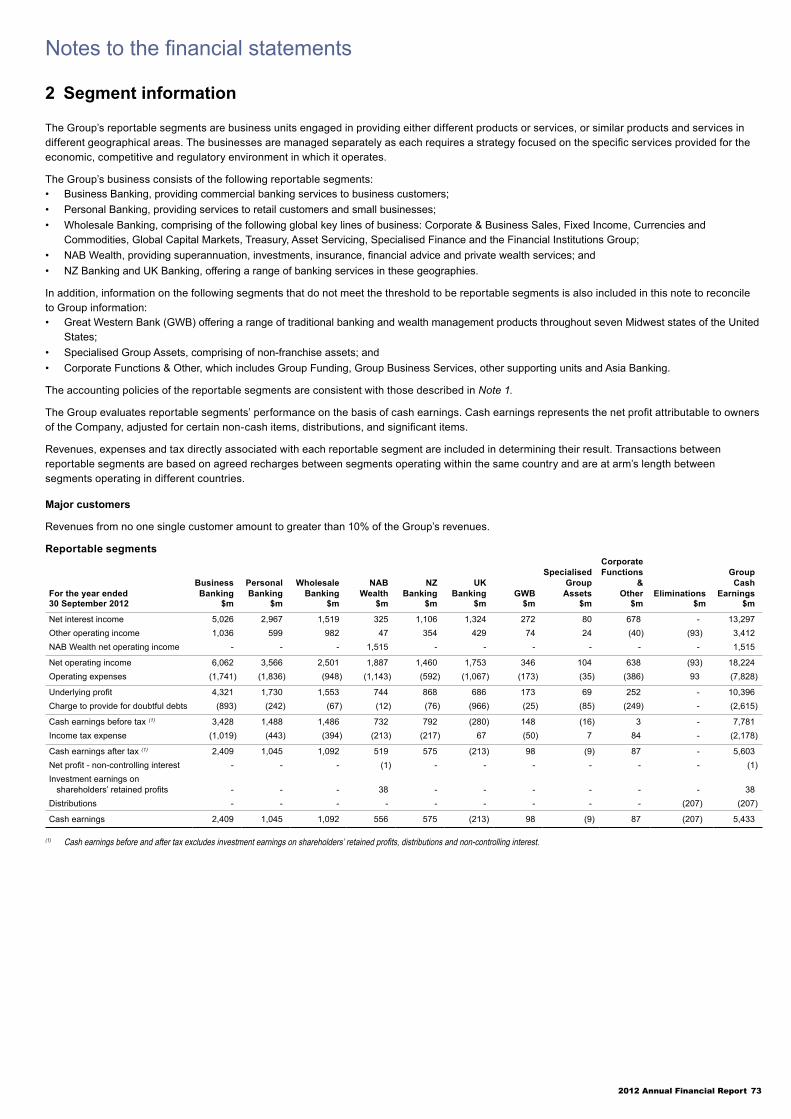
2012 Annual Financial Report 73
Notes to the financial statements
2 Segment information
The Group’s reportable segments are business units engaged in providing either different products or services, or similar products and services in different geographical areas. The businesses are managed separately as each requires a strategy focused on the specific services provided for the economic, competitive and regulatory environment in which it operates.
The Group’s business consists of the following reportable segments: • Business Banking, providing commercial banking services to business customers; • Personal Banking, providing services to retail customers and small businesses; • Wholesale Banking, comprising of the following global key lines of business: Corporate & Business Sales, Fixed Income, Currencies and
Commodities, Global Capital Markets, Treasury, Asset Servicing, Specialised Finance and the Financial Institutions Group; • NAB Wealth, providing superannuation, investments, insurance, financial advice and private wealth services; and• NZ Banking and UK Banking, offering a range of banking services in these geographies.
In addition, information on the following segments that do not meet the threshold to be reportable segments is also included in this note to reconcile to Group information:• Great Western Bank (GWB) offering a range of traditional banking and wealth management products throughout seven Midwest states of the United
States;• Specialised Group Assets, comprising of non-franchise assets; and• Corporate Functions & Other, which includes Group Funding, Group Business Services, other supporting units and Asia Banking.
The accounting policies of the reportable segments are consistent with those described in Note 1.
The Group evaluates reportable segments’ performance on the basis of cash earnings. Cash earnings represents the net profit attributable to owners of the Company, adjusted for certain non-cash items, distributions, and significant items.
Revenues, expenses and tax directly associated with each reportable segment are included in determining their result. Transactions between reportable segments are based on agreed recharges between segments operating within the same country and are at arm’s length between segments operating in different countries.
Major customers
Revenues from no one single customer amount to greater than 10% of the Group’s revenues.
Reportable segments
For the year ended Business Banking
Personal Banking
Wholesale Banking
NAB Wealth
NZ Banking
UK Banking GWB
Specialised Group
Assets
Corporate Functions
& Other Eliminations
Group Cash
Earnings30 September 2012 $m $m $m $m $m $m $m $m $m $m $m
Net interest income 5,026 2,967 1,519 325 1,106 1,324 272 80 678 - 13,297 Other operating income 1,036 599 982 47 354 429 74 24 (40) (93) 3,412 NAB Wealth net operating income - - - 1,515 - - - - - - 1,515
Net operating income 6,062 3,566 2,501 1,887 1,460 1,753 346 104 638 (93) 18,224 Operating expenses (1,741) (1,836) (948) (1,143) (592) (1,067) (173) (35) (386) 93 (7,828)
Underlying profit 4,321 1,730 1,553 744 868 686 173 69 252 - 10,396 Charge to provide for doubtful debts (893) (242) (67) (12) (76) (966) (25) (85) (249) - (2,615)
Cash earnings before tax (1) 3,428 1,488 1,486 732 792 (280) 148 (16) 3 - 7,781 Income tax expense (1,019) (443) (394) (213) (217) 67 (50) 7 84 - (2,178)
Cash earnings after tax (1) 2,409 1,045 1,092 519 575 (213) 98 (9) 87 - 5,603 Net profit - non-controlling interest - - - (1) - - - - - - (1)Investment earnings on
shareholders’ retained profits - - - 38 - - - - - - 38 Distributions - - - - - - - - - (207) (207)
Cash earnings 2,409 1,045 1,092 556 575 (213) 98 (9) 87 (207) 5,433
(1) Cash earnings before and after tax excludes investment earnings on shareholders’ retained profits, distributions and non-controlling interest.

74 NATIONAL AUSTRALIA BANK
Notes to the financial statements
2 Segment information (continued)
For the year ended Business Banking
Personal Banking
Wholesale Banking
NAB Wealth
NZ Banking
UK Banking GWB
Specialised Group Assets
Corporate Functions
& Other Eliminations
Group Cash
Earnings30 September 2011 $m $m $m $m $m $m $m $m $m $m $m
Net interest income 5,033 2,826 1,230 328 1,015 1,522 285 123 730 - 13,092 Other operating income 1,006 590 626 35 345 448 81 44 (78) (81) 3,016 NAB Wealth net operating income - - - 1,486 - - - - - - 1,486
Net operating income 6,039 3,416 1,856 1,849 1,360 1,970 366 167 652 (81) 17,594 Operating expenses (1,764) (1,791) (915) (1,128) (572) (1,136) (177) (49) (523) 81 (7,974)
Underlying profit 4,275 1,625 941 721 788 834 189 118 129 - 9,620 Charge to provide for doubtful debts (802) (301) (21) (18) (116) (462) (57) (41) (4) - (1,822)
Cash earnings before tax (1) 3,473 1,324 920 703 672 372 132 77 125 - 7,798 Income tax expense (1,028) (392) (259) (199) (203) (84) (44) 33 34 - (2,142)
Cash earnings after tax (1) 2,445 932 661 504 469 288 88 110 159 - 5,656 Net profit - non-controlling interest - - - (1) - - - - - - (1)Investment earnings on
shareholders’ retained profits - - - 30 - - - - - - 30 Distributions - - - - - - - - - (225) (225)
Cash earnings 2,445 932 661 533 469 288 88 110 159 (225) 5,460
(1) Cash earnings before and after tax excludes investment earnings on shareholders’ retained profits, distributions and non-controlling interest.
Business Banking
Personal Banking
Wholesale Banking
NAB Wealth
NZ Banking
UK Banking GWB
Specialised Group Assets
Corporate Functions
& Other Eliminations
Group Total
AssetsReportable segment assets $m $m $m $m $m $m $m $m $m $m $m
30 September 2012 198,745 154,271 227,008 98,195 49,069 69,408 8,646 6,339 35,811 (84,402) 763,090 30 September 2011 195,128 140,706 241,553 92,832 46,650 76,512 8,399 9,240 30,030 (87,293) 753,757
Reconciliations between reportable segment information and statutory results are as follows:
The tables below reconcile the information in the segment tables presented above, which have been prepared on a cash earnings basis, to the relevant statutory information presented in the Financial Report. In addition to the sum of the reportable segments, the cash earnings basis includes the segments that do not meet the threshold to be reportable segments and intra group eliminations. The NAB Wealth net adjustment represents a reallocation of the income statement of the NAB Wealth business prepared on a cash earnings basis into the appropriate statutory income statement lines.
Group2012 2011
$m $m
Net interest incomeNet interest income on a cash earnings basis 13,297 13,092 NAB Wealth net adjustment (55) (58)
Net interest income on a statutory basis 13,242 13,034
Total other income and NAB Wealth incomeTotal other income on a cash earnings basis 3,412 3,016 NAB Wealth net operating income 1,515 1,486
Total other operating and NAB Wealth income (1) 4,927 4,502 NAB Wealth net adjustment 296 (65)Treasury shares (175) 48 Fair value and hedge ineffectiveness (256) (338)IoRE discount rate variation 24 37 Hedging costs on SCDO assets (141) (219)Amortisation of acquired intangible assets (18) - Customer redress provision (184) (156)
Total other income and NAB Wealth income on a statutory basis 4,473 3,809
(1) Includes eliminations and distributions.

2012 Annual Financial Report 75
Notes to the financial statements
2 Segment information (continued)
Group2012 2011
$m $m
Operating expensesOperating expenses on a cash earnings basis 7,828 7,974 NAB Wealth net adjustment (25) 51 Property revaluation 5 - Litigation expense 141 7 Amortisation of acquired intangible assets 105 104 Customer redress provision 73 - Impairment of goodwill and software 349 - Restructure costs 222 - Due diligence, acquisition and integration costs 124 229
Operating expenses on a statutory basis 8,822 8,365
Charge to provide for doubtful debtsCharge to provide for doubtful debts on a cash earnings basis 2,615 1,822 Fair value and hedge ineffectiveness 119 (72)
Charge to provide for doubtful debts on a statutory basis 2,734 1,750
Income tax expenseIncome tax expense on a cash earnings basis 2,178 2,142 Income tax benefit/(expense) on non-cash earnings items:
NAB Wealth net adjustment 228 (204)Treasury shares (20) 9 Fair value and hedge ineffectiveness (110) (85)IoRE discount rate variation 8 11 Hedging costs on SCDO assets (42) (92)Litigation expense (40) (3)Amortisation of acquired intangible assets (24) (22)Customer redress provision (18) (39)Restructure costs (48) - Due diligence, acquisition and integration costs (36) (67)Refund of tax on exchangeable capital units (ExCaps) settlement - (142)
Income tax expense on a statutory basis 2,076 1,508
Investment earnings on shareholders’ retained profitsInvestment earnings on shareholders’ retained profits on a cash earnings basis 38 30 NAB Wealth net adjustment (38) (30)
Investment earnings on shareholders’ retained profits on a statutory basis - -
Distributions and net profit attributable to non-controlling interest in controlled entities
Distributions and non-controlling interest in controlled entities (208) (226)
Distributions 207 225
Net profit attributable to non-controlling interest in controlled entities (1) (1)

76 NATIONAL AUSTRALIA BANK
Notes to the financial statements
2 Segment information (continued)
Group2012 2011
$m $m
Cash earningsGroup cash earnings (1) 5,433 5,460 Non-cash earnings items (after tax):
Distributions 207 225 Treasury shares (155) 39 Fair value and hedge ineffectiveness (265) (181)IoRE discount rate variation 16 26 Hedging costs on SCDO assets (99) (127)Property revaluation (5) - Litigation expense (101) (4)Amortisation of acquired intangible assets (99) (82)Customer redress provision (239) (117)Impairment of goodwill and software (349) - Restructure Costs (174) - Due diligence, acquisition and integration costs (88) (162)Refund of tax on exchangeable capital units (ExCaps) settlement - 142
Net profit attributable to owners of the Company 4,082 5,219
(1) Includes eliminations and distributions.
Geographical information
The Group has operations in Australia (the Company’s country of domicile), Europe, New Zealand, the United States and Asia. The allocation of income and non-current assets is based on the geographical location in which transactions are booked.
GroupIncome Non-current assets (1)
2012 2011 2012 2011$m $m $m $m
Australia 13,944 12,679 7,729 6,807 Europe 2,024 2,148 759 1,165 New Zealand 1,259 1,425 561 538 United States 420 515 828 893 Asia 189 188 18 13
Total before inter-geographic eliminations 17,836 16,955 9,895 9,416 Elimination of inter-geographic items (121) (112) - -
Total 17,715 16,843 9,895 9,416
(1) Non-current assets refer to assets that include amounts expected to be recovered more than 12 months after the balance sheet date. They do not include financial instruments, deferred tax assets, post-employment benefits assets or rights under insurance contracts.
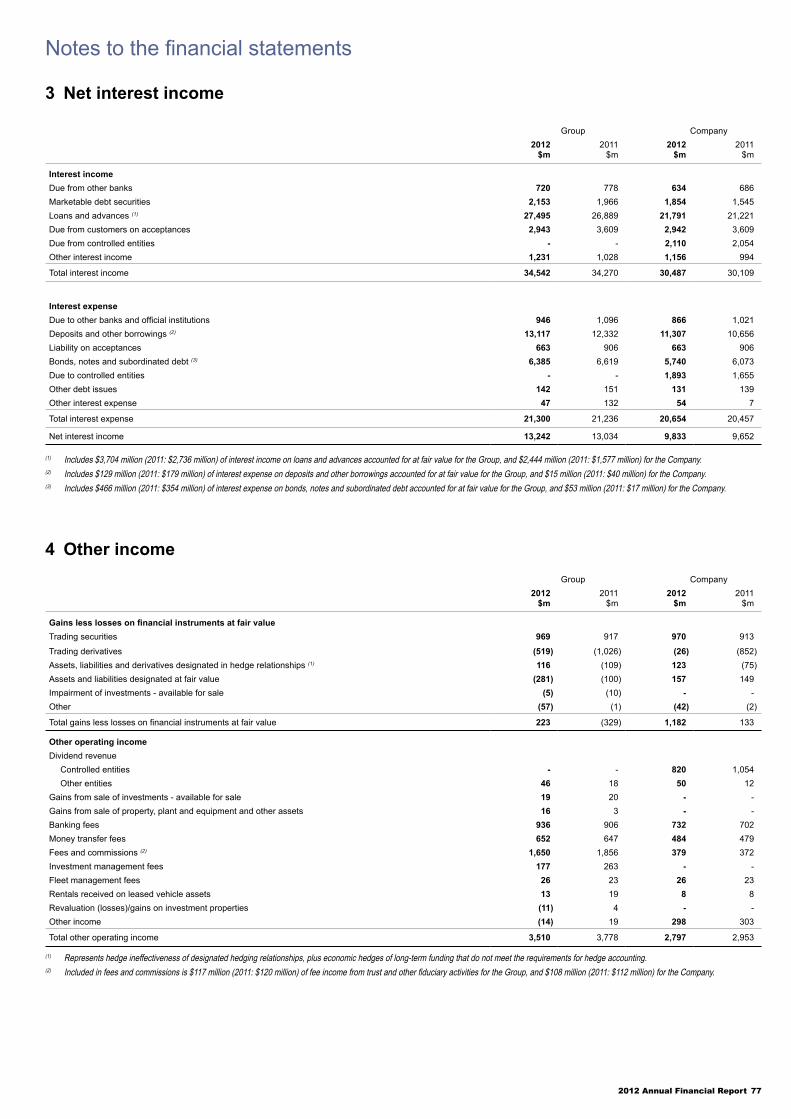
2012 Annual Financial Report 77
Notes to the financial statements
3 Net interest income
Group Company2012 2011 2012 2011
$m $m $m $m
Interest incomeDue from other banks 720 778 634 686 Marketable debt securities 2,153 1,966 1,854 1,545 Loans and advances (1) 27,495 26,889 21,791 21,221 Due from customers on acceptances 2,943 3,609 2,942 3,609 Due from controlled entities - - 2,110 2,054 Other interest income 1,231 1,028 1,156 994
Total interest income 34,542 34,270 30,487 30,109
Interest expenseDue to other banks and official institutions 946 1,096 866 1,021 Deposits and other borrowings (2) 13,117 12,332 11,307 10,656 Liability on acceptances 663 906 663 906 Bonds, notes and subordinated debt (3) 6,385 6,619 5,740 6,073 Due to controlled entities - - 1,893 1,655 Other debt issues 142 151 131 139 Other interest expense 47 132 54 7
Total interest expense 21,300 21,236 20,654 20,457
Net interest income 13,242 13,034 9,833 9,652
(1) Includes $3,704 million (2011: $2,736 million) of interest income on loans and advances accounted for at fair value for the Group, and $2,444 million (2011: $1,577 million) for the Company.(2) Includes $129 million (2011: $179 million) of interest expense on deposits and other borrowings accounted for at fair value for the Group, and $15 million (2011: $40 million) for the Company.(3) Includes $466 million (2011: $354 million) of interest expense on bonds, notes and subordinated debt accounted for at fair value for the Group, and $53 million (2011: $17 million) for the Company.
4 Other income Group Company
2012 2011 2012 2011$m $m $m $m
Gains less losses on financial instruments at fair valueTrading securities 969 917 970 913
Trading derivatives (519) (1,026) (26) (852)Assets, liabilities and derivatives designated in hedge relationships (1) 116 (109) 123 (75)Assets and liabilities designated at fair value (281) (100) 157 149 Impairment of investments - available for sale (5) (10) - - Other (57) (1) (42) (2)
Total gains less losses on financial instruments at fair value 223 (329) 1,182 133
Other operating incomeDividend revenue
Controlled entities - - 820 1,054 Other entities 46 18 50 12
Gains from sale of investments - available for sale 19 20 - - Gains from sale of property, plant and equipment and other assets 16 3 - - Banking fees 936 906 732 702 Money transfer fees 652 647 484 479 Fees and commissions (2) 1,650 1,856 379 372 Investment management fees 177 263 - - Fleet management fees 26 23 26 23 Rentals received on leased vehicle assets 13 19 8 8 Revaluation (losses)/gains on investment properties (11) 4 - - Other income (14) 19 298 303
Total other operating income 3,510 3,778 2,797 2,953
(1) Represents hedge ineffectiveness of designated hedging relationships, plus economic hedges of long-term funding that do not meet the requirements for hedge accounting.(2) Included in fees and commissions is $117 million (2011: $120 million) of fee income from trust and other fiduciary activities for the Group, and $108 million (2011: $112 million) for the Company.

78 NATIONAL AUSTRALIA BANK
Notes to the financial statements
5 Operating expenses
Group Company2012 2011 2012 2011
$m $m $m $m
Personnel expensesSalaries and related on-costs 3,236 3,299 2,217 2,273 Superannuation costs - defined contribution plans 256 253 196 192 Superannuation costs - defined benefit plans 38 44 - 3 Performance-based compensation
Cash 292 428 215 282 Equity-based compensation 214 78 172 25
Other expenses 490 461 491 381
Total personnel expenses 4,526 4,563 3,291 3,156
Occupancy-related expensesOperating lease rental expense 430 436 301 297 Other expenses 179 163 57 103
Total occupancy-related expenses 609 599 358 400
General expensesFees and commission expense 253 376 70 60 Depreciation and amortisation of property, plant and equipment 299 271 200 184 Amortisation of intangible assets 337 344 124 141 Depreciation on leased vehicle assets 9 9 5 5 Operating lease rental expense 27 32 15 15 Advertising and marketing 181 212 124 152 Charge to provide for operational risk event losses 276 72 112 42 Communications, postage and stationery 262 295 152 161 Computer equipment and software 524 428 456 359 Data communication and processing charges 124 122 63 55 Transport expenses 85 78 58 57 Professional fees 450 475 285 231 Travel 72 90 44 55 Loss on disposal of property, plant and equipment and other assets 4 19 1 10 Impairment losses recognised 355 16 33 35 Other expenses 429 364 216 237
Total general expenses 3,687 3,203 1,958 1,799
Charge to provide for doubtful debtsInvestments - held to maturity (1) 213 27 213 27 Loans and advances 2,521 1,723 1,263 1,151
Total charge to provide for doubtful debts 2,734 1,750 1,476 1,178
(1) Includes provisions for impairment of intercompany loans to securitisation conduits held by the Company.

2012 Annual Financial Report 79
Notes to the financial statements
6 Income tax expense
Group Company2012 2011 2012 2011
$m $m $m $m
Income tax expenseCurrent tax 2,146 1,946 1,756 1,508 Deferred tax (70) (438) (42) (193)
Total income tax expense 2,076 1,508 1,714 1,315
Reconciliation of income tax expense shown in the income statement with prima facie tax payable on the pre-tax accounting profit
Group Company2012 2011 2012 2011
$m $m $m $m
Profit before income tax expense 6,159 6,728 6,729 6,205 Deduct profit before income tax expense attributable to the statutory funds of the life insurance business and their
controlled trusts (850) (363) - -
Total profit excluding that attributable to the statutory funds of the life insurance business and their controlled trusts, before income tax expense 5,309 6,365 6,729 6,205
Prima facie income tax at 30% 1,593 1,910 2,019 1,862 Add/(deduct) tax effect of amounts not deductible/(assessable):
Assessable foreign income 8 9 5 5 Foreign tax rate differences 36 8 (11) 5 Depreciation on buildings not deductible 3 3 - - Refund of tax on exchangeable capital units settlement - (142) - (142)Foreign branch income not assessable (82) (60) (82) (60)Under/(over) provision in prior years 38 (24) 3 (16)Offshore banking unit income (37) (23) (33) (23)Restatement of deferred tax balances for UK, US and NZ tax changes 5 (20) 8 (2)
Profit on sale of controlled entities - (9) - - Treasury shares adjustment 32 (6) - - Dividend income adjustments - - (199) (264)Goodwill impairment 88 - - - Other 3 (78) 4 (50)
Total income tax expense on profit excluding that attributable to the statutory funds of the life insurance business and their controlled trusts 1,687 1,568 1,714 1,315
Income tax expense/(benefit) attributable to the statutory funds of the life insurance business and their controlled trusts 389 (60) - -
Total income tax expense 2,076 1,508 1,714 1,315

80 NATIONAL AUSTRALIA BANK
Notes to the financial statements
7 Dividends and distributions
Dividends recognised by the Company for the year ended 30 September:
Amount per share
Total amount
Franked amount per
sharecents $m %
2012Final dividend paid in respect of the year ended 30 September 2011 88 1,940 100Interim dividend paid in respect of the year ended 30 September 2012 90 2,015 100Deduct: Bonus shares in lieu of dividend n/a (51) n/a
Total dividends paid during the year ended 30 September 2012 3,904
2011Final dividend paid in respect of the year ended 30 September 2010 78 1,667 100Interim dividend paid in respect of the year ended 30 September 2011 84 1,823 100Deduct: Bonus shares in lieu of dividend n/a (46) n/a
Total dividends paid during the year ended 30 September 2011 3,444
Franked dividends declared or paid during the year were franked at a tax rate of 30% (2011: 30%).
Final dividend
On 31 October 2012, the directors declared the following dividend:
Amount per share
Total amount
Franked amount per
sharecents $m %
Final dividend declared in respect of the year ended 30 September 2012 90 2,067 100
The final 2012 ordinary dividend is payable on 18 December 2012. The financial effect of this dividend has not been brought to account in the financial statements for the year ended 30 September 2012 and will be recognised in subsequent financial reports.
Australian franking credits
The franking credits available to the Group at 30 September 2012, after allowing for Australian tax payable in respect of the current reporting period’s profit and the receipt of dividends recognised as receivable at balance date, are estimated to be $1,035 million (2011: $846 million). Franking credits to be utilised as a result of the payment of the proposed final dividend are $886 million (2011: $830 million). The extent to which future dividends will be franked will depend on a number of factors including the level of the profits that will be subject to Australian income tax.
New Zealand imputation credits
No New Zealand imputation credits have been attached to the 2012 final dividend.
Distributions on other equity instruments Group Company
2012 2011 2012 2011$m $m $m $m
National Income Securities 114 123 114 123 Trust Preferred Securities (1) 35 35 - - Trust Preferred Securities II (1) 43 43 - - National Capital Instruments 15 24 - -
Total distributions on other equity instruments 207 225 114 123
(1) $A Equivalent.
Dividends on preference sharesGroup Company
2012 2011 2012 2011$m $m $m $m
BNZ Income Securities 25 24 - - BNZ Income Securities 2 13 13 - -
Total dividends on preference shares (1) 38 37 - -
(1) $A Equivalent.
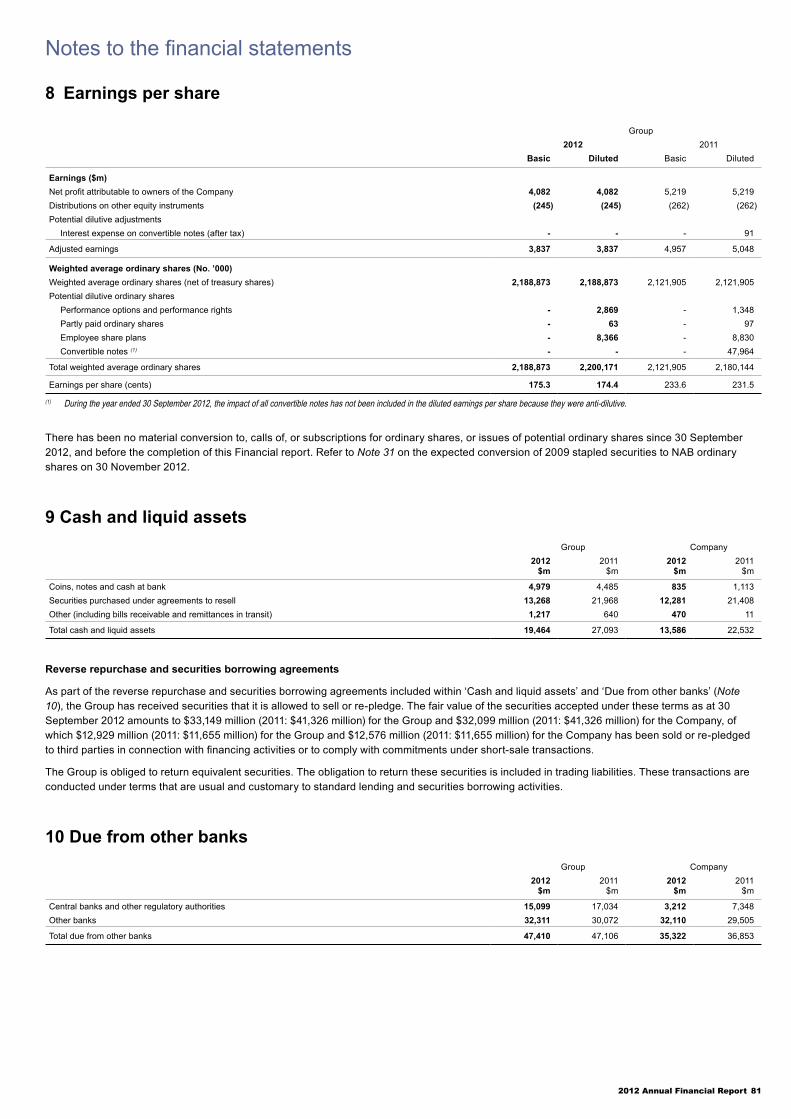
2012 Annual Financial Report 81
Notes to the financial statements
8 Earnings per share
Group2012 2011
Basic Diluted Basic Diluted
Earnings ($m)Net profit attributable to owners of the Company 4,082 4,082 5,219 5,219 Distributions on other equity instruments (245) (245) (262) (262)Potential dilutive adjustments
Interest expense on convertible notes (after tax) - - - 91
Adjusted earnings 3,837 3,837 4,957 5,048
Weighted average ordinary shares (No. ’000)Weighted average ordinary shares (net of treasury shares) 2,188,873 2,188,873 2,121,905 2,121,905 Potential dilutive ordinary shares
Performance options and performance rights - 2,869 - 1,348 Partly paid ordinary shares - 63 - 97 Employee share plans - 8,366 - 8,830 Convertible notes (1) - - - 47,964
Total weighted average ordinary shares 2,188,873 2,200,171 2,121,905 2,180,144
Earnings per share (cents) 175.3 174.4 233.6 231.5
(1) During the year ended 30 September 2012, the impact of all convertible notes has not been included in the diluted earnings per share because they were anti-dilutive.
There has been no material conversion to, calls of, or subscriptions for ordinary shares, or issues of potential ordinary shares since 30 September 2012, and before the completion of this Financial report. Refer to Note 31 on the expected conversion of 2009 stapled securities to NAB ordinary shares on 30 November 2012.
9 Cash and liquid assetsGroup Company
2012 2011 2012 2011$m $m $m $m
Coins, notes and cash at bank 4,979 4,485 835 1,113 Securities purchased under agreements to resell 13,268 21,968 12,281 21,408 Other (including bills receivable and remittances in transit) 1,217 640 470 11
Total cash and liquid assets 19,464 27,093 13,586 22,532
Reverse repurchase and securities borrowing agreements
As part of the reverse repurchase and securities borrowing agreements included within ‘Cash and liquid assets’ and ‘Due from other banks’ (Note 10), the Group has received securities that it is allowed to sell or re-pledge. The fair value of the securities accepted under these terms as at 30 September 2012 amounts to $33,149 million (2011: $41,326 million) for the Group and $32,099 million (2011: $41,326 million) for the Company, of which $12,929 million (2011: $11,655 million) for the Group and $12,576 million (2011: $11,655 million) for the Company has been sold or re-pledged to third parties in connection with financing activities or to comply with commitments under short-sale transactions.
The Group is obliged to return equivalent securities. The obligation to return these securities is included in trading liabilities. These transactions are conducted under terms that are usual and customary to standard lending and securities borrowing activities.
10 Due from other banksGroup Company
2012 2011 2012 2011$m $m $m $m
Central banks and other regulatory authorities 15,099 17,034 3,212 7,348 Other banks 32,311 30,072 32,110 29,505
Total due from other banks 47,410 47,106 35,322 36,853

82 NATIONAL AUSTRALIA BANK
Notes to the financial statements
11 Trading and hedging derivative assets and liabilities
Derivative financial instruments held or issued for trading purposes
The Group maintains trading positions in a variety of derivative financial instruments and acts primarily in the market by satisfying the needs of its customers through foreign exchange, interest rate-related and credit-related contracts. In addition, the Group takes positions on its own account, and carries an inventory of capital market instruments. Derivatives, except for those that are specifically designated as effective hedging instruments, are classified as held for trading. The held for trading classification therefore includes those derivatives used for risk management purposes which for various reasons do not meet the qualifying criteria for hedge accounting.
Derivative financial instruments held for hedging purposes
The operations of the Group are subject to risk of interest rate fluctuations to the extent of the repricing profile of the Group’s balance sheet. Derivative financial instruments are held or issued for the purpose of managing existing or anticipated interest rate risk from this source which is primarily in the Group’s banking operations. The Group monitors this non-trading interest rate risk by simulating future net interest income requirements, through the application of a range of possible future interest rate scenarios to its projected balance sheet.
The Group also holds or issues derivative financial instruments for the purpose of hedging foreign exchange risk. Foreign exchange derivatives are used predominantly to hedge borrowings and anticipated cash flows in currencies other than the Australian dollar.
(a) Fair value hedges
The Group applies fair value hedge accounting to hedge movements in the value of fixed interest rate assets and liabilities subject to interest rate risk, as well as assets and liabilities subject to foreign exchange risk.
(b) Cash flow hedges
The Group applies cash flow hedge accounting to hedge the variability in highly probable forecast future cash flows attributable to interest rate risk on variable rate assets and liabilities, and assets and liabilities subject to foreign exchange risk.
The tables below set out the fair value of both trading and hedging derivatives including notional principal values:
Trading derivative financial instrumentsGroup
Notional principal
Fair value assets
Fair value liabilities
Notional principal
Fair value assets
Fair value liabilities
2012 $m
2012 $m
2012 $m
2011 $m
2011 $m
2011 $m
Foreign exchange rate-related contractsSpot and forward contracts 410,756 3,544 4,763 445,920 9,813 8,338 Cross currency swaps 403,114 6,592 8,944 386,103 14,664 15,055 Options/swaptions purchased 14,124 162 77 17,056 344 83 Options/swaptions written 13,795 83 154 15,193 68 273
Total foreign exchange rate-related contracts 841,789 10,381 13,938 864,272 24,889 23,749
Interest rate-related contractsForward rate agreements 520,227 73 72 561,300 101 93 Swaps 1,575,682 29,274 29,739 1,390,034 21,803 22,542 Futures 881,480 86 287 917,203 94 123 Options/swaptions purchased 26,319 443 79 37,127 331 137 Options/swaptions written 24,233 56 301 34,533 117 252
Total interest rate-related contracts 3,027,941 29,932 30,478 2,940,197 22,446 23,147
Credit derivatives 33,147 212 273 42,709 730 589 Commodity derivatives 1,901 69 70 2,145 140 143 Other derivatives 2,127 305 368 1,567 261 261
Total trading derivative financial instruments 3,906,905 40,899 45,127 3,850,890 48,466 47,889

2012 Annual Financial Report 83
Notes to the financial statements
11 Trading and hedging derivative assets and liabilities (continued)
Trading derivative financial instrumentsCompany
Notional principal
Fair value assets
Fair value liabilities
Notional principal
Fair value assets
Fair value liabilities
2012 $m
2012 $m
2012 $m
2011 $m
2011 $m
2011 $m
Foreign exchange rate-related contractsSpot and forward contracts 402,639 3,182 4,296 432,139 9,250 8,187 Cross currency swaps 409,626 6,633 8,623 382,265 14,066 14,698 Options/swaptions purchased 15,174 163 104 18,388 345 114 Options/swaptions written 13,347 83 129 14,086 67 243
Total foreign exchange rate-related contracts 840,786 10,061 13,152 846,878 23,728 23,242
Interest rate-related contractsForward rate agreements 515,317 73 72 557,729 101 93 Swaps 1,636,116 30,317 29,362 1,308,059 21,791 21,222 Futures 787,655 86 287 899,075 94 123 Options/swaptions purchased 27,378 527 75 38,292 380 138 Options/swaptions written 25,106 25 303 33,695 125 232
Total interest rate-related contracts 2,991,572 31,028 30,099 2,836,850 22,491 21,808
Credit derivatives 35,007 217 278 42,842 731 593 Commodity derivatives 1,751 69 70 2,176 140 144 Other derivatives 2,128 305 348 1,567 263 261
Total trading derivative financial instruments 3,871,244 41,680 43,947 3,730,313 47,353 46,048
Hedging derivative financial instrumentsGroup
Notional principal
Fair value assets
Fair value liabilities
Notional principal
Fair value assets
Fair value liabilities
2012 $m
2012 $m
2012 $m
2011 $m
2011 $m
2011 $m
Derivatives held for hedging - fair value hedgesForeign exchange rate-related contracts
Cross currency swaps 43,638 881 3,804 41,008 1,684 3,301
Total foreign exchange rate-related contracts 43,638 881 3,804 41,008 1,684 3,301
Interest rate-related contractsSwaps 45,876 1,238 1,647 31,890 1,041 336
Total interest rate-related contracts 45,876 1,238 1,647 31,890 1,041 336
Total derivatives held for hedging - fair value hedges 89,514 2,119 5,451 72,898 2,725 3,637
Derivatives held for hedging - cash flow hedgesInterest rate-related contracts
Swaps 100,243 1,496 897 121,237 1,383 913
Total interest rate-related contracts 100,243 1,496 897 121,237 1,383 913
Total derivatives held for hedging - cash flow hedges 100,243 1,496 897 121,237 1,383 913
Total hedging derivative financial instruments 189,757 3,615 6,348 194,135 4,108 4,550

84 NATIONAL AUSTRALIA BANK
Notes to the financial statements
11 Trading and hedging derivative assets and liabilities (continued)
Hedging derivative financial instrumentsCompany
Notional principal
Fair value assets
Fair value liabilities
Notional principal
Fair value assets
Fair value liabilities
2012 $m
2012 $m
2012 $m
2011 $m
2011 $m
2011 $m
Derivatives held for hedging - fair value hedgesForeign exchange rate-related contracts
Cross currency swaps 42,047 881 3,723 39,145 1,135 3,301
Total foreign exchange rate-related contracts 42,047 881 3,723 39,145 1,135 3,301
Interest rate-related contractsSwaps 40,315 1,223 1,354 29,258 1,014 238
Total interest rate-related contracts 40,315 1,223 1,354 29,258 1,014 238
Total derivatives held for hedging - fair value hedges 82,362 2,104 5,077 68,403 2,149 3,539
Derivatives held for hedging - cash flow hedgesInterest rate-related contracts
Swaps 76,769 1,073 844 103,961 902 778
Total interest rate-related contracts 76,769 1,073 844 103,961 902 778
Total derivatives held for hedging - cash flow hedges 76,769 1,073 844 103,961 902 778
Total hedging derivative financial instruments 159,131 3,177 5,921 172,364 3,051 4,317
In certain instances, the Group has applied cash flow hedge accounting to hedge highly probable cash flows, which primarily vary with interest rates. These cash flows are expected to occur and impact the income statement in the following periods:
Group
0 to 1 year 1 to 2 year(s) 2 to 3 years 3 to 4 years 4 to 5 yearsGreater than
5 years TotalAs at 30 September 2012 $m $m $m $m $m $m $m
Forecast receivable cash flows 1,491 673 390 263 150 159 3,126 Forecast payable cash flows 967 499 248 127 87 143 2,071
0 to 1 year 1 to 2 year(s) 2 to 3 years 3 to 4 years 4 to 5 yearsGreater than
5 years TotalAs at 30 September 2011 $m $m $m $m $m $m $m
Forecast receivable cash flows 2,443 904 456 308 176 214 4,501 Forecast payable cash flows 1,508 785 441 222 163 310 3,429
Company
0 to 1 year 1 to 2 year(s) 2 to 3 years 3 to 4 years 4 to 5 yearsGreater than
5 years TotalAs at 30 September 2012 $m $m $m $m $m $m $m
Forecast receivable cash flows 1,282 545 314 221 134 123 2,619 Forecast payable cash flows 655 311 147 92 74 90 1,369
0 to 1 year 1 to 2 year(s) 2 to 3 years 3 to 4 years 4 to 5 yearsGreater than
5 years TotalAs at 30 September 2011 $m $m $m $m $m $m $m
Forecast receivable cash flows 2,273 793 384 263 157 211 4,081 Forecast payable cash flows 1,211 622 333 156 151 310 2,783
Group Company2012 2011 2012 2011
$m $m $m $m
Gains/(losses) arising from fair value hedgesGains/(losses) on hedging instruments (2,795) (174) (1,971) 10 Gains/(losses) on the hedged items attributable to the hedged risk 2,904 77 2,099 (80)
Gains/(losses) arising from cash flow hedgesGains/(losses) on hedge ineffectiveness 7 - (5) 7

2012 Annual Financial Report 85
Notes to the financial statements
12 Trading securities
Group Company2012 2011 2012 2011
$m $m $m $m
Government bonds, notes and securities 8,457 8,862 6,493 6,673 Semi-government bonds, notes and securities 3,895 5,619 3,460 5,619 Corporate/financial institution bonds, notes and securities 15,318 19,729 14,909 18,839 Other bonds, notes and securities 944 418 879 382
Total trading securities 28,614 34,628 25,741 31,513
13 Investments - available for saleGroup Company
2012 2011 2012 2011$m $m $m $m
Government bonds, notes and securities 4,777 4,729 1,702 1,426 Semi-government bonds, notes and securities 11,456 2,732 11,456 2,732 Corporate/financial institution bonds, notes and securities 8,168 6,827 8,166 6,827 Other bonds, notes and securities 4,584 3,757 4,281 3,531
Total investments - available for sale 28,985 18,045 25,605 14,516
14 Investments - held to maturityGroup Company
2012 2011 2012 2011$m $m $m $m
Government bonds, notes and securities - 696 - 696 Semi-government bonds, notes and securities - 119 - 119 Corporate/financial institution bonds, notes and securities 5,473 5,595 5,473 5,277 Other bonds, notes and securities 4,369 6,581 62 160 Deduct: Provision for impairment (80) (204) (2) (3)
Total investments - held to maturity 9,762 12,787 5,533 6,249
Provision for impairmentBalance at beginning of year 204 181 3 - Charge to the income statement (1) 213 27 - 6 Amounts written off (330) (3) - (3)Foreign currency translation adjustments (7) (1) (1) -
Balance at end of year 80 204 2 3
(1) Included within charge to income statement are amounts recovered through the realisation of the associated collateral on impaired assets.
15 Investments relating to life insurance businessGroup Company
2012 2011 2012 2011$m $m $m $m
Equity security investmentsDirect 231 663 - - Indirect 43,538 41,122 - -
Total equity security investments 43,769 41,785 - -
Debt security investmentsDirect 2,748 2,722 - - Indirect 18,585 16,526 - -
Total debt security investments 21,333 19,248 - -
Units held in property trustsIndirect 3,312 2,887 - -
Total units held in property trusts 3,312 2,887 - -
Total investments relating to life insurance business 68,414 63,920 - -
Direct investments refer to investments that are held directly with the issuer of the investment. Indirect investments refer to investments that are held through unit trusts or similar investment vehicles.

86 NATIONAL AUSTRALIA BANK
Notes to the financial statements
16 Other financial assets at fair value
Group Company2012 2011 2012 2011
$m $m $m $m
Loans at fair value 63,027 50,472 38,578 26,700 Other financial assets at fair value 1,000 1,284 159 65
Total other financial assets at fair value 64,027 51,756 38,737 26,765
Loans
The maximum credit exposure of loans (excluding any undrawn facility limits) included in other financial assets at fair value through profit or loss (designated on initial recognition) is $63,027 million (2011: $50,472 million) for the Group and $38,578 million (2011: $26,700 million) for the Company. The cumulative change in fair value of the loans attributable to changes in credit risk amounts to a $678 million loss (2011: $626 million loss) for the Group and a $219 million loss (2011: $208 million loss) for the Company and the change for the current year is a $52 million loss (2011: $272 million loss) for the Group and a $11 million loss (2011: $77 million loss) for the Company.
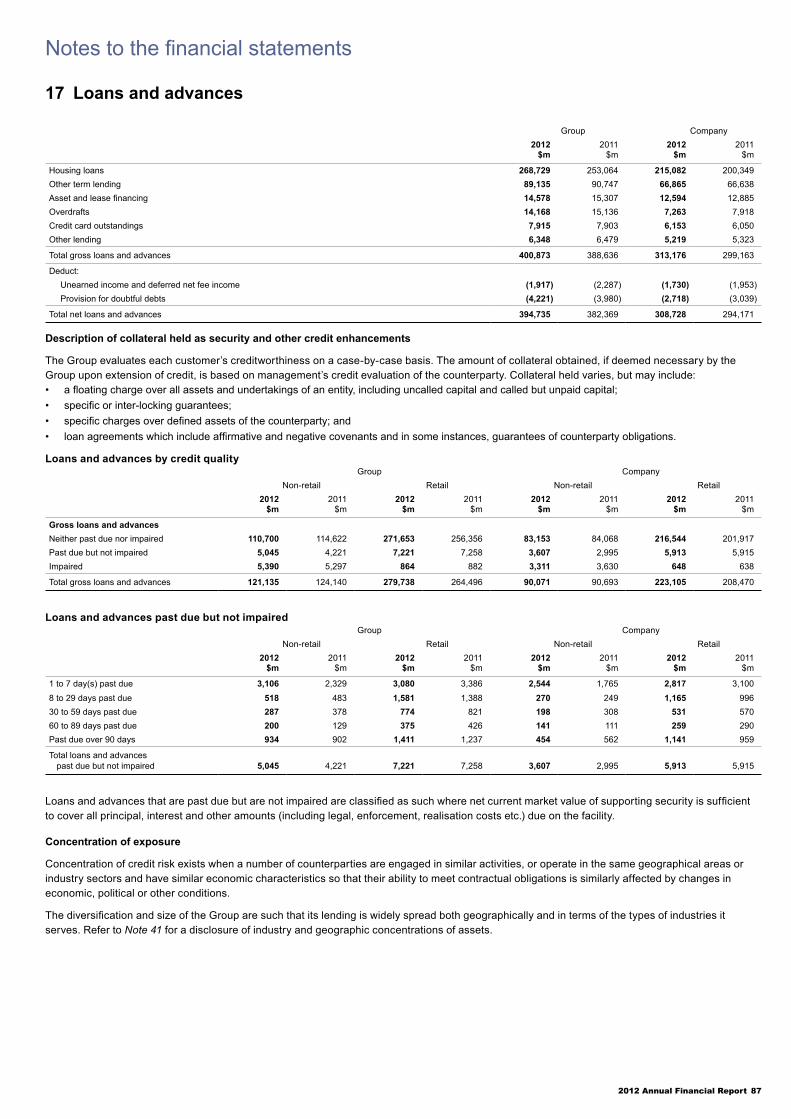
2012 Annual Financial Report 87
Notes to the financial statements
17 Loans and advances
Group Company2012 2011 2012 2011
$m $m $m $m
Housing loans 268,729 253,064 215,082 200,349 Other term lending 89,135 90,747 66,865 66,638 Asset and lease financing 14,578 15,307 12,594 12,885 Overdrafts 14,168 15,136 7,263 7,918 Credit card outstandings 7,915 7,903 6,153 6,050 Other lending 6,348 6,479 5,219 5,323
Total gross loans and advances 400,873 388,636 313,176 299,163
Deduct:Unearned income and deferred net fee income (1,917) (2,287) (1,730) (1,953)Provision for doubtful debts (4,221) (3,980) (2,718) (3,039)
Total net loans and advances 394,735 382,369 308,728 294,171
Description of collateral held as security and other credit enhancements
The Group evaluates each customer’s creditworthiness on a case-by-case basis. The amount of collateral obtained, if deemed necessary by the Group upon extension of credit, is based on management’s credit evaluation of the counterparty. Collateral held varies, but may include:• a floating charge over all assets and undertakings of an entity, including uncalled capital and called but unpaid capital;• specific or inter-locking guarantees;• specific charges over defined assets of the counterparty; and• loan agreements which include affirmative and negative covenants and in some instances, guarantees of counterparty obligations.
Loans and advances by credit qualityGroup Company
Non-retail Retail Non-retail Retail2012 2011 2012 2011 2012 2011 2012 2011
$m $m $m $m $m $m $m $m
Gross loans and advancesNeither past due nor impaired 110,700 114,622 271,653 256,356 83,153 84,068 216,544 201,917 Past due but not impaired 5,045 4,221 7,221 7,258 3,607 2,995 5,913 5,915 Impaired 5,390 5,297 864 882 3,311 3,630 648 638
Total gross loans and advances 121,135 124,140 279,738 264,496 90,071 90,693 223,105 208,470
Loans and advances past due but not impairedGroup Company
Non-retail Retail Non-retail Retail2012 2011 2012 2011 2012 2011 2012 2011
$m $m $m $m $m $m $m $m
1 to 7 day(s) past due 3,106 2,329 3,080 3,386 2,544 1,765 2,817 3,100
8 to 29 days past due 518 483 1,581 1,388 270 249 1,165 996 30 to 59 days past due 287 378 774 821 198 308 531 570 60 to 89 days past due 200 129 375 426 141 111 259 290 Past due over 90 days 934 902 1,411 1,237 454 562 1,141 959
Total loans and advances past due but not impaired 5,045 4,221 7,221 7,258 3,607 2,995 5,913 5,915
Loans and advances that are past due but are not impaired are classified as such where net current market value of supporting security is sufficient to cover all principal, interest and other amounts (including legal, enforcement, realisation costs etc.) due on the facility.
Concentration of exposure
Concentration of credit risk exists when a number of counterparties are engaged in similar activities, or operate in the same geographical areas or industry sectors and have similar economic characteristics so that their ability to meet contractual obligations is similarly affected by changes in economic, political or other conditions.
The diversification and size of the Group are such that its lending is widely spread both geographically and in terms of the types of industries it serves. Refer to Note 41 for a disclosure of industry and geographic concentrations of assets.

88 NATIONAL AUSTRALIA BANK
Notes to the financial statements
17 Loans and advances (continued)
Investment in finance lease receivablesGroup Company
2012 2011 2012 2011$m $m $m $m
Due within one year 2,433 2,556 1,908 1,958 Due after one but no later than five years 3,375 3,909 2,650 2,900 Due after five years 866 978 61 63
Total investment in finance lease receivables 6,674 7,443 4,619 4,921
Investment in finance lease receivables, net of unearned incomeGroup Company
2012 2011 2012 2011$m $m $m $m
Due within one year 2,150 2,252 1,626 1,656 Due after one but no later than five years 3,070 3,536 2,390 2,587 Due after five years 839 937 59 59
Total investment in finance lease receivables, net of unearned income 6,059 6,725 4,075 4,302
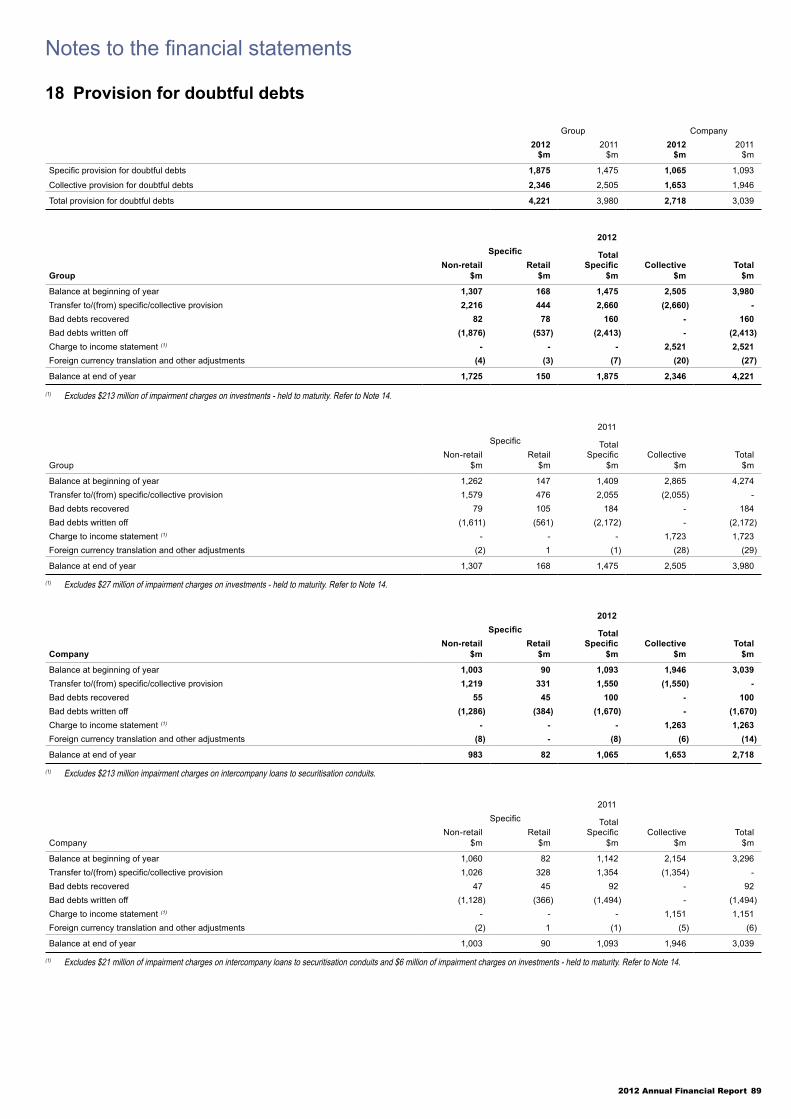
2012 Annual Financial Report 89
Notes to the financial statements
18 Provision for doubtful debts
Group Company2012 2011 2012 2011
$m $m $m $m
Specific provision for doubtful debts 1,875 1,475 1,065 1,093
Collective provision for doubtful debts 2,346 2,505 1,653 1,946
Total provision for doubtful debts 4,221 3,980 2,718 3,039
2012Specific Total
GroupNon-retail
$mRetail
$mSpecific
$mCollective
$mTotal
$m
Balance at beginning of year 1,307 168 1,475 2,505 3,980 Transfer to/(from) specific/collective provision 2,216 444 2,660 (2,660) - Bad debts recovered 82 78 160 - 160 Bad debts written off (1,876) (537) (2,413) - (2,413)Charge to income statement (1) - - - 2,521 2,521 Foreign currency translation and other adjustments (4) (3) (7) (20) (27)
Balance at end of year 1,725 150 1,875 2,346 4,221
(1) Excludes $213 million of impairment charges on investments - held to maturity. Refer to Note 14.
2011Specific Total
GroupNon-retail
$mRetail
$mSpecific
$mCollective
$mTotal
$m
Balance at beginning of year 1,262 147 1,409 2,865 4,274 Transfer to/(from) specific/collective provision 1,579 476 2,055 (2,055) - Bad debts recovered 79 105 184 - 184 Bad debts written off (1,611) (561) (2,172) - (2,172)Charge to income statement (1) - - - 1,723 1,723 Foreign currency translation and other adjustments (2) 1 (1) (28) (29)
Balance at end of year 1,307 168 1,475 2,505 3,980
(1) Excludes $27 million of impairment charges on investments - held to maturity. Refer to Note 14.
2012Specific Total
CompanyNon-retail
$mRetail
$mSpecific
$mCollective
$mTotal
$m
Balance at beginning of year 1,003 90 1,093 1,946 3,039 Transfer to/(from) specific/collective provision 1,219 331 1,550 (1,550) - Bad debts recovered 55 45 100 - 100 Bad debts written off (1,286) (384) (1,670) - (1,670)Charge to income statement (1) - - - 1,263 1,263 Foreign currency translation and other adjustments (8) - (8) (6) (14)
Balance at end of year 983 82 1,065 1,653 2,718
(1) Excludes $213 million impairment charges on intercompany loans to securitisation conduits.
2011Specific Total
CompanyNon-retail
$mRetail
$mSpecific
$mCollective
$mTotal
$m
Balance at beginning of year 1,060 82 1,142 2,154 3,296 Transfer to/(from) specific/collective provision 1,026 328 1,354 (1,354) - Bad debts recovered 47 45 92 - 92 Bad debts written off (1,128) (366) (1,494) - (1,494)Charge to income statement (1) - - - 1,151 1,151 Foreign currency translation and other adjustments (2) 1 (1) (5) (6)
Balance at end of year 1,003 90 1,093 1,946 3,039
(1) Excludes $21 million of impairment charges on intercompany loans to securitisation conduits and $6 million of impairment charges on investments - held to maturity. Refer to Note 14.

90 NATIONAL AUSTRALIA BANK
Notes to the financial statements
19 Asset quality disclosures
Impaired assets consist of retail loans (excluding unsecured portfolio managed facilities) which are contractually past due 90 days with security insufficient to cover principal and interest, non-retail loans which are contractually past due 90 days and there is sufficient doubt about the ultimate collectibility of principal and interest, and impaired off-balance sheet credit exposures where current circumstances indicate that losses may be incurred. Unsecured portfolio managed facilities are classified as impaired loans when they become 180 days past due (if not written off).
The following table provides an analysis of the asset quality of the Group’s loans and advances. Gross amounts are shown before taking into account any collateral held or other credit enhancements.
Group CompanyNon-retail Retail Non-retail Retail
2012 2011 2012 2011 2012 2011 2012 2011$m $m $m $m $m $m $m $m
Gross impaired assets (1) 5,679 5,504 864 882 3,343 3,651 648 638 Specific provision for doubtful debts (2) (1,833) (1,378) (150) (168) (983) (1,003) (82) (90)
Net impaired assets (3) 3,846 4,126 714 714 2,360 2,648 566 548
(1) Gross impaired assets include $256 million (2011: $186 million) for the Group and nil (2011: nil) for the Company of gross impaired other financial assets at fair value and $33 million (2011: $21 million) of impaired off-balance sheet credit exposures for the Group and $32 million (2011: $21 million) for the Company.
(2) Specific provision for doubtful debts includes $108 million (2011: $71 million) for the Group and nil (2011: nil) for the Company of fair value credit adjustments on other financial assets at fair value.(3) The fair value of security in respect of impaired assets is $4,438 million (2011: $4,219 million) for the Group and $3,039 million (2011: $2,905 million) for the Company. Fair value amounts of security held in
excess of the outstanding balance of individual impaired assets are not included in these amounts.

2012 Annual Financial Report 91
Notes to the financial statements
20 Property, plant and equipment
Group Company
2012 2011 2012 2011$m $m $m $m
Land and buildingsFreehold
At cost (acquired subsequent to previous valuation date) 45 34 - - At directors’ valuation 210 244 12 15
LeaseholdAt cost (acquired subsequent to previous valuation date) 5 5 - - At directors’ valuation 10 13 - -
Deduct: Accumulated depreciation on buildings (11) (10) - (1)
Total land and buildings 259 286 12 14
Leasehold improvementsAt cost 1,496 1,439 1,144 1,049 Deduct: Accumulated amortisation (780) (747) (584) (535)Deduct: Accumulated impairment losses (2) (1) (2) -
Total leasehold improvements 714 691 558 514
Furniture, fixtures and fittings and other equipmentAt cost 799 758 284 250 Deduct: Accumulated depreciation and amortisation (385) (363) (127) (108)Deduct: Accumulated impairment losses (3) (3) - -
Total furniture, fixtures and fittings and other equipment 411 392 157 142
Data processing equipment At cost 1,219 1,355 968 1,072 Under finance lease 113 105 102 90 Deduct: Accumulated depreciation and amortisation (908) (1,023) (716) (800)Deduct: Accumulated impairment losses (5) - (5) -
Total data processing equipment 419 437 349 362
Leased assets held as lessorAt cost 135 143 54 56 Deduct: Accumulated amortisation (37) (30) (24) (19)
Total leased assets held as lessor 98 113 30 37
Total property, plant and equipment 1,901 1,919 1,106 1,069
Included within land and buildings are freehold and leasehold land and buildings that are carried at directors’ valuation. Had these land and buildings been recognised under the cost model, as at 30 September 2012, the carrying amount for the Group and the Company would have been $144 million and $1 million respectively (2011: $169 million and $1 million respectively).
As at 30 September 2012 the Group and the Company had data processing equipment held under finance lease with a net carrying value of $49 and $44 million respectively (2011: $55 million and $47 million respectively).
As at 30 September 2012 the Group and the Company had contractual commitments to acquire property, plant and equipment of $186 million and $174 million respectively (2011: $232 million and $220 million respectively).

92 NATIONAL AUSTRALIA BANK
Notes to the financial statements
20 Property, plant and equipment (continued)
Reconciliations of movements in property, plant and equipmentGroup Company
2012 2011 2012 2011$m $m $m $m
Land and buildingsBalance at beginning of year 286 285 14 15 Additions from the acquisition of controlled entities and business combinations 10 - - - Additions 6 7 - - Disposals (21) (6) (2) - Net amount of revaluation (decrements)/increments to asset revaluation reserve (1) 11 - - Net amount of revaluation (decrements) to income statement (5) - - - Depreciation (7) (8) - (1)Foreign currency translation adjustments (9) (3) - -
Balance at end of year 259 286 12 14
Leasehold improvementsBalance at beginning of year 691 711 514 549 Additions 183 104 121 58 Disposals (53) (33) (1) (26)Amortisation (102) (87) (74) (66)Impairment losses recognised (1) (1) (2) (1)Foreign currency translation adjustments (4) (3) - -
Balance at end of year 714 691 558 514
Furniture, fixtures and fittings and other equipmentBalance at beginning of year 392 298 142 82 Additions from the acquisition of controlled entities and business combinations 2 - - - Additions 98 151 41 83 Disposals (18) (10) - (8)Depreciation and amortisation (62) (47) (26) (15)Foreign currency translation adjustments (1) - - -
Balance at end of year 411 392 157 142
Data processing equipmentBalance at beginning of year 437 360 362 294 Additions from the acquisition of controlled entities and business combinations 1 - - - Additions 121 266 96 230 Disposals (5) (58) (4) (55)Depreciation and amortisation (128) (129) (100) (102)Impairment losses recognised (5) (5) (5) (5)Foreign currency translation adjustments (2) 3 - -
Balance at end of year 419 437 349 362
Leased assets held as lessorBalance at beginning of year 113 124 37 42 Depreciation (9) (9) (5) (5)Foreign currency translation adjustments (6) (2) (2) -
Balance at end of year 98 113 30 37
21 Investments in controlled entitiesGroup Company
2012 2011 2012 2011$m $m $m $m
At cost - - 18,492 17,411 Deduct: Provision for diminution in value - - (201) (235)
Total investments in controlled entities - - 18,291 17,176
Refer to Note 39 for further details in relation to controlled entities.

2012 Annual Financial Report 93
Notes to the financial statements
22 Goodwill and other intangible assets
Group Company2012 2011 2012 2011
$m $m $m $m
GoodwillAt cost 5,561 5,567 - -
Deduct: Accumulated impairment losses (295) - - -
Total goodwill 5,266 5,567 - -
Internally generated softwareAt cost 2,557 2,357 1,677 1,467 Deduct: Accumulated amortisation (1,165) (1,226) (792) (830)Deduct: Accumulated impairment losses (87) (33) - -
Total internally generated software 1,305 1,098 885 637
Acquired softwareAt cost 473 550 341 418 Deduct: Accumulated amortisation (324) (396) (208) (295)
Total acquired software 149 154 133 123
Other acquired intangible assets (1)
At cost 664 684 - - Deduct: Accumulated amortisation (296) (241) - -
Total other acquired intangible assets 368 443 - -
Total goodwill and other intangible assets 7,088 7,262 1,018 760
(1) Other acquired intangible assets include core deposit intangibles, mortgage servicing rights, brand names and the value of business and contracts in force.
As at 30 September 2012 the Group and the Company had contractual commitments to acquire software of $40 million and $40 million respectively (2011: $25 million and $25 million respectively).
Reconciliation of movements in goodwill and other intangible assets
Group Company
2012 2011 2012 2011$m $m $m $m
GoodwillBalance at beginning of year 5,567 5,546 - - Additions from the acquisition of controlled entities and business combinations 41 26 - - Impairment losses recognised (295) - - - Foreign currency translation adjustments (47) (5) - -
Balance at end of year 5,266 5,567 - -
Internally generated softwareBalance at beginning of year 1,098 838 637 434 Additions from internal development 466 481 342 326 Disposals (4) (7) - (5)Amortisation (189) (195) (94) (110)Impairment losses recognised (54) (9) - (8)Foreign currency translation adjustments (12) (10) - -
Balance at end of year 1,305 1,098 885 637
Acquired softwareBalance at beginning of year 154 160 123 113 Additions 50 63 40 53 Disposals (2) (11) - (11)Amortisation (52) (54) (30) (31)Impairment losses recognised - (1) - (1)Foreign currency translation adjustments (1) (3) - -
Balance at end of year 149 154 133 123
Other acquired intangible assetsBalance at beginning of year 443 533 - - Additions 9 6 - - Additions from the acquisition of controlled entities and business combinations 16 9 - - Disposals and write-offs - (8) - - Amortisation (96) (95) - - Foreign currency translation adjustments (4) (2) - -
Balance at end of year 368 443 - -

94 NATIONAL AUSTRALIA BANK
Notes to the financial statements
22 Goodwill and other intangible assets (continued)
Impairment and cash generating unitsFor the purpose of undertaking impairment testing, cash generating units (CGUs) are identified and determined according to the smallest group of assets that generate cash inflows that are largely independent of the cash inflows from other assets or groups of assets. Goodwill impairment is assessed at the group of CGUs that represents the lowest level within the Group at which goodwill is maintained for internal management purposes, which is at the segment level.
Impairment testing compares the carrying value of a CGU with its recoverable amount as determined using a value in use calculation.
Assumptions for determining the recoverable amount of each CGU are based on past experience and expectations for the future. Cash flow projections are based on three year management approved forecasts which are then extrapolated using a constant growth rate for up to a further seven years. In the final year a terminal growth rate is applied in perpetuity. These forecasts use management estimates to determine income, expenses, capital expenditure and cash flows for each CGU.
The discount rate reflects the market determined, risk-adjusted, discount rate and is adjusted for specific risks relating to the CGUs and the countries in which they operate. Terminal value growth rate represents the growth rate applied to extrapolate cash flows beyond the forecast period. These growth rates are based on forecast assumptions of the CGUs long-term performance in their respective markets.
In response to a deterioration in the economic and operating conditions in the UK, the Group has performed a strategic review of its UK Banking operations. As a result of the review, goodwill of $295 million relating to UK Banking was assessed to be fully impaired.
The key assumptions used in determining the recoverable amount of CGUs, to which goodwill has been allocated, are as follows:
Goodwill Discount rate Terminal value growth rateper annum per annum
2012 2011 2012 2011 2012 2011Reportable segment $m $m % % % %
Personal Banking 279 279 9.6 10.2 6.0 6.8 UK Banking - 295 - 12.1 - 4.8 NZ Banking 258 258 9.9 10.4 4.7 5.0 NAB Wealth 4,068 4,027 10.9 11.3 6.0 3.9 Great Western Bank 661 708 9.7 10.5 4.9 4.5

2012 Annual Financial Report 95
Notes to the financial statements
23 Current and deferred tax assets
Group Company2012 2011 2012 2011
$m $m $m $m
Current tax assets 92 - - - Deferred tax assets 2,150 2,243 1,597 1,559
Total income tax assets 2,242 2,243 1,597 1,559
Deferred tax assetsLife company statutory funds 598 628 - - Specific provision for doubtful debts 351 394 291 322 Collective provision for doubtful debts 547 650 468 549 Employee entitlements 257 288 216 254 Tax losses 453 278 166 174 Defined benefit superannuation plan liabilities 144 77 34 - Other 605 432 636 420
Total deferred tax assets 2,955 2,747 1,811 1,719 Set-off of deferred tax liabilities pursuant to set-off provisions (805) (504) (214) (160)
Net deferred tax assets 2,150 2,243 1,597 1,559
Deferred tax asset amounts recognised in the income statementProvision for doubtful debts (128) (72) (107) (66)Employee entitlements (31) 12 (24) 19 Tax losses 232 48 3 1 Defined benefit superannuation plan liabilities (31) (21) 34 - Other 408 (57) 96 (101)
Total deferred tax asset amounts recognised in the income statement 450 (90) 2 (147)
Deferred tax asset amounts recognised in equityAvailable for sale investment reserve (15) 3 (13) 6 Cash flow hedge reserve (29) (63) (29) (63)Foreign currency translation reserve (5) (9) - - Equity-based compensation reserve - (3) - (3)Retained profits 87 (59) (4) (4)
Total deferred tax asset amounts recognised in equity 38 (131) (46) (64)
Total deferred tax asset amounts recognised during the year 488 (221) (44) (211)
Deferred tax assets not brought to account
Deferred tax assets have not been brought to account for the following items as realisation of the benefits is not regarded as probable:
Group Company2012 2011 2012 2011
$m $m $m $m
Capital gains tax losses 769 776 761 768 Income tax losses 92 3 89 - Temporary differences 57 19 - -

96 NATIONAL AUSTRALIA BANK
Notes to the financial statements
24 Other assets
Group Company2012 2011 2012 2011
$m $m $m $m
Accrued interest receivable 3,461 3,815 2,817 3,042 Prepayments 211 166 92 92 Receivables 538 1,325 344 867 Other life insurance assets 528 491 - - Investment properties carried at fair value 119 147 - - Other 4,120 3,094 3,273 1,938
Total other assets 8,977 9,038 6,526 5,939
25 Other financial liabilities at fair valueGroup Company
2012 2011 2012 2011$m $m $m $m
Bonds, notes and subordinated debt 11,973 10,823 1,448 811 Deposits and other borrowings
On-demand and short-term deposits 240 247 - - Certificates of deposit 1,473 1,440 - - Term deposits 2,341 2,432 879 932 Borrowings 2,814 6,346 - -
Securities sold short 2,164 1,583 2,164 1,583 Other financial liabilities 727 855 184 118
Total other financial liabilities at fair value 21,732 23,726 4,675 3,444
The change in fair value of bonds, notes and subordinated debt attributable to changes in the Group’s credit risk amounts to a loss for the year of $153 million (2011: $63 million gain) for the Group and $6 million loss (2011: nil) for the Company. The cumulative change in fair value of bonds, notes and subordinated debt attributable to changes in the Group’s credit risk amounts to a loss of $56 million (2011: $97 million gain) for the Group and $6 million loss (2011: nil) for the Company. The contractual amount to be paid at maturity of the bonds, notes and subordinated debt is $11,325 million (2011: $10,485 million) for the Group and $1,372 million (2011: $759 million) for the Company.
26 Deposits and other borrowingsGroup Company
2012 2011 2012 2011$m $m $m $m
DepositsTerm deposits 159,950 142,243 128,316 113,963 On-demand and short-term deposits 152,000 145,700 114,218 107,941 Certificates of deposit 68,019 75,505 67,049 70,084 Deposits not bearing interest 24,667 21,324 19,365 16,885
Borrowings 8,417 11,813 539 1,905 Securities sold under agreements to repurchase 6,868 6,379 6,868 6,378
Total deposits and other borrowings 419,921 402,964 336,355 317,156

2012 Annual Financial Report 97
Notes to the financial statements
27 Life policy liabilities
Group Company2012 2011 2012 2011
$m $m $m $m
Life insurance contractsBest estimate liabilities
Value of future policy benefits 8,608 8,540 - - Value of future expenses 976 2,341 - - Future charges for acquisition costs (25) (41) - - Value of future revenues (10,761) (11,653) - -
Total best estimate liabilities for life insurance contracts (1,202) (813) - -
Value of future profitsValue of policyholder bonuses 222 232 - - Value of future shareholder profit margins 2,876 2,504 - -
Total value of future profits 3,098 2,736 - - Unvested policyholder benefits 111 144 - -
Net policy liabilities for life insurance contracts 2,007 2,067 - - Policy liabilities ceded under reinsurance 277 249 - -
Gross policy liabilities for life insurance contracts 2,284 2,316 - -
Life investment contractsLife investment contract liabilities 54,300 51,292 - -
Total life policy liabilities 56,584 53,608 - -
The calculation of policy liabilities is subject to various actuarial assumptions which are summarised in Note 50. All policy liabilities relate to the business conducted in the statutory funds, including international life insurance funds, and will be settled from the assets of each statutory fund (refer to Note 1(aa)).
In respect of life insurance contracts with a discretionary participating feature, there are $1,692 million (2011: $1,781 million) of liabilities that relate to the guaranteed element. In respect of investment contracts, there are $4,133 million (2011: $3,601 million) of policy liabilities subject to investment performance guarantees.
Reconciliation of movements in policy liabilitiesGroup
2012 2011$m $m
Life insurance contract policy liabilitiesBalance at beginning of year 2,316 1,763 Transfer from life investment liabilities to life insurance liabilities - 453 Increase/(decrease) reflected in the income statement 79 100 Other (111) -
Balance at end of year 2,284 2,316
Life investment contract liabilitiesBalance at beginning of year 51,292 52,591 Transfer from life investment liabilities to life insurance liabilities - (453)Increase/(decrease) reflected in the income statement 5,611 (522)Premiums recognised in policy liabilities 4,707 6,358 Claims recognised in policy liabilities (7,310) (6,682)
Balance at end of year 54,300 51,292
Total gross policy liabilities at end of year 56,584 53,608
Liabilities ceded under reinsuranceBalance at beginning of year (249) (196)Increase reflected in the income statement (13) (53)Other (15) -
Balance at end of year (1) (277) (249)
Net policy liabilities at end of year 56,307 53,359
(1) The $277 million (2011: $249 million) reinsurance balance is included within ‘Other life insurance assets’.

98 NATIONAL AUSTRALIA BANK
Notes to the financial statements
28 Current and deferred tax liabilities
Group Company2012 2011 2012 2011
$m $m $m $m
Current tax liabilities 713 561 722 557 Deferred tax liabilities - 28 - 30
Total income tax liabilities 713 589 722 587
Deferred tax liabilitiesIntangible assets 87 116 - - Depreciation 7 65 (126) (95)Lease financing - 53 - 53 Life company statutory funds 275 - - - Defined benefit superannuation plan assets 6 4 6 4 Other 430 294 334 228
Total deferred tax liabilities 805 532 214 190 Deferred tax liabilities set-off against deferred tax assets pursuant to set-off provisions (805) (504) (214) (160)
Net deferred tax liability - 28 - 30
Deferred tax liability amounts recognised in the income statementIntangible assets (25) (21) - - Depreciation (53) (72) (31) (19)Lease financing - (27) - (27)Life company statutory funds 485 (222) - - Other (27) (186) (9) (294)
Total deferred tax liability amounts recognised in the income statement 380 (528) (40) (340)
Deferred tax liability amounts recognised in equityAvailable for sale investment reserve (2) (14) (9) (6)Cash flow hedge reserve (7) (19) - (5)Asset revaluation reserve - 3 - - Retained profits (2) - - 2
Total deferred tax liability amounts recognised in equity (11) (30) (9) (9)
Total deferred tax liability amounts recognised during the year 369 (558) (49) (349)

2012 Annual Financial Report 99
Notes to the financial statements
29 Provisions
Group Company2012 2011 2012 2011
$m $m $m $m
Employee entitlements 955 1,111 754 839 Operational risk event losses 258 61 120 44 Restructuring 224 28 26 26 Other 383 396 6 30
Total provisions 1,820 1,596 906 939
Reconciliations of movements in provisions
Group Company2012 2011 2012 2011
$m $m $m $m
Employee entitlementsBalance at beginning of year 1,111 1,070 839 831 Acquisition of controlled entities 18 - - - Provisions made 516 677 373 467 Payments out of provisions (682) (640) (454) (459)Provisions no longer required and net foreign currency movements (8) 4 (4) -
Balance at end of year 955 1,111 754 839
Operational risk event lossesBalance at beginning of year 61 70 44 51 Provisions made 276 72 112 42 Payments out of provisions (77) (82) (37) (48)Provisions no longer required and net foreign currency movements (2) 1 1 (1)
Balance at end of year 258 61 120 44
Restructuring Balance at beginning of year 28 14 26 12 Provisions made 297 19 56 19 Payments out of provisions (105) (5) (55) (5)Provisions no longer required and net foreign currency movements 4 - (1) -
Balance at end of year 224 28 26 26
Other (1)
Balance at beginning of year 396 291 30 50 Acquisition of controlled entities - 1 - - Provisions made 510 742 102 358 Payments out of provisions (525) (641) (126) (379)Provisions no longer required and net foreign currency movements 2 3 - 1
Balance at end of year 383 396 6 30
(1) Other provisions include provisions for contributions tax on superannuation funds and legal and other business claims (including certain claims relating to customer redress).

100 NATIONAL AUSTRALIA BANK
Notes to the financial statements
30 Bonds, notes and subordinated debt
Group Company2012 2011 2012 2011
$m $m $m $m
Medium-term notes 82,747 87,672 82,747 84,632 Other senior notes 14,656 6,385 6,322 - Subordinated medium-term notes 5,681 5,457 5,681 5,131 Other subordinated notes 361 369 - -
Total bonds, notes and subordinated debt 103,445 99,883 94,750 89,763
Net discounts (73) (115) (73) (115)
Total net bonds, notes and subordinated debt 103,372 99,768 94,677 89,648
Medium-term notes
The Group operates a number of medium-term note programs:• under the domestic debt issuance program of the Company, the aggregate issue amount is not limited. Outstanding under this program are $10,442
million (2011: $12,022 million) fixed rate notes maturing up to five years with fixed rates between 4.39% - 8.50% (2011: 4.25% - 8.50%), $700 million (2011: $700 million) fixed rate notes maturing greater than five years with a fixed rate of 7.25% (2011: 7.25%), $16,306 million (2011: $14,267 million) floating rate notes maturing up to five years and $8 million (2011: $28 million) floating rate notes maturing greater than five years;
• an aggregate limit of US$25,000 million was maintained under the discontinued Euro medium-term note program of the Company for terms of three months or more. No further issues are envisaged under this program as it has been replaced by the global medium-term note program. Outstanding under this program are $105 million (2011: $271 million) fixed rate notes maturing up to five years with fixed rates between 1.00% - 4.70% (2011: 1.00% - 4.70%);
• under the global medium-term note program of the Company, Clydesdale Bank PLC, BNZ International Funding Limited and National Australia Bank Limited notes may be issued up to an aggregate amount of US$100,000 million. Outstanding under this program are $25,291 million (2011: $27,272 million) fixed rate notes maturing up to five years with fixed rates between 0.49% - 8.00% (2011: 0.00% - 8.00%), $7,480 million (2011: $7,424 million) fixed rate notes maturing greater than five years with fixed rates between 1.13% - 7.25% (2011: 1.05% - 7.25%), $14,327 million (2011: $20,632 million) floating rate notes maturing up to five years and $70 million (2011: $107 million) floating rate notes maturing greater than five years;
• under the 3(a)(2) medium term note program of the Company (acting through its New York Branch), notes may be issued up to US$10,000 million. Outstanding under this program are $3,585 million (2011: nil) fixed rate notes maturing up to five years with fixed rates between 1.60% - 2.75%, and floating rate notes of $478 million (2011: nil) maturing up to five years; and
• the Group has conducted a number of stand-alone medium-term note issues: $2,398 million (2011: $2,928 million) fixed rate notes maturing up to five years with fixed rates between 1.01% - 8.43% (2011: 1.01% - 8.43%), $123 million (2011: $134 million) fixed rate notes maturing greater than five years with a fixed rate of 2.03% (2011: 2.03%), $1,274 million (2011: $1,715 million) floating rate notes maturing up to five years and $160 million (2011: $172 million) floating rate notes maturing greater than five years.
The Group has designated certain debt issues as being carried at fair value, which are included within other financial liabilities at fair value on the balance sheet; refer to Note 25 for further information. These debt issues totalling $11,325 million (2011: $10,485 million) have been issued predominantly by BNZ International Funding Limited under the global medium-term note program, by BNZ Limited under domestic debt issuance program, as covered bonds linked to the BNZ Covered Bond Trust and as structured notes by National Australia Bank Limited under the medium-term note program of the Company.
Other senior notes
The Group issued a number of other senior notes under stand-alone issues or programs:• under the Covered Bonds program of the Company the aggregate issue amount must not exceed US$20,000 million. Outstanding under this
program are $3,688m (2011: nil) fixed rate notes maturing up to five years with fixed rates between 2.00% - 2.63%, $1,619 million (2011: nil) of fixed rate notes maturing greater than five years with fixed rates between 2.37% - 5.00% and $1,016 million (2011: nil) of floating rate notes maturing up to five years;
• under the Covered Bonds program of Clydesdale Bank PLC the aggregate issue amount must not exceed EUR 10,000 million. Outstanding under this program are $617 million (2011: nil) floating rate notes maturing up to five years and $1,067 million (2011: nil) fixed rate notes maturing greater than five years at a fixed rate of 4.63%;
• under the National Wealth Management Holdings Limited medium-term note program, $151 million (2011: $302 million) fixed rate notes maturing in 2013 with a fixed rate of 7.50% (2011: 6.50% - 7.50%), $40 million (2011: nil) fix rate notes maturing in 2022 with a fix rate of 6.00% and $502 million (2011: $533 million) floating rate notes maturing up to five years;
• mortgage backed notes through a series of National RMBS Trusts of $2,345 million (2011: $3,184 million) maturing up to 2042;• floating rate notes through a series of Clydesdale RMBS Trusts of $3,229 million (2011: $2,353 million) maturing up to 2017;• TSL Trust A floating rate notes of $12 million (2011: $13 million) maturing up to 2020; and• asset backed notes issued out of the Medfin Trust of $75 million (2011: nil) maturing up to five years, and $295 million (2011: nil) maturing greater
than five years.
Subordinated notes
Certain notes are subordinated in right of payment to the claims of depositors and all other creditors of the Company. Subordinated notes with an original maturity of at least five years may constitute Tier 2 capital as defined by APRA for capital adequacy purposes.

2012 Annual Financial Report 101
Notes to the financial statements
30 Bonds, notes and subordinated debt (continued)
Subordinated medium-term notes
Subordinated notes have been issued under the following programs of the Group (subordinated note maturity is reflected on either the call or maturity date, whichever is earlier):• under the domestic debt issuance program of the Company, $301 million (2011: $300 million) fixed rate notes maturing in 2017 with a fixed rate of
7.25% (2011: 7.25%) and $1,200 million (2011: $1,200 million) floating rate notes maturing in 2017 and 2018 are outstanding;• under the global medium-term note program, $2,855 million (2011: $2,963 million) fixed rate notes maturing greater than five years with fixed rates
between 4.63% - 7.13% (2011: 4.63% - 7.13%) and nil (2011: $852 million) floating rate notes are outstanding;• the Group has conducted a number of stand-alone subordinated medium-term note issues: $48 million (2011: $51 million) fixed rate notes maturing
up to five years with a fixed rate of 5.47% (2011: 5.47%), $56 million (2011: $40 million) fixed rate notes maturing greater than five years with a fixed rate of 7.50% (2011: 7.50%);
• on 18 June 2012 the Group issued $1,173 million of NAB Subordinated Notes with a 10 year maturity and a non-call period of five years. Interest on the NAB Subordinated Notes is payable quarterly in arrears. The interest rate is equal to the sum of the 90 day bank bill rate plus a fixed margin of 2.75% per annum;
• $48 million floating rate notes maturing up to five years (2011: $51 million); and • Nil (2011: NZ$350 million) with a fixed yield of 8.42% payable semi-annually in arrears based on the fixed coupon rate, maturing 15 June 2017 but
called by BNZ on 15 June 2012.
Other subordinated notesThe Group has issued a number of other subordinated notes under stand-alone issues or programs (subordinated note maturity is reflected on either the call or maturity date, whichever is earlier):• under the National Wealth Management Holdings Limited medium-term note program, $201 million (2011: $206 million) fixed rate notes maturing
greater than five years with a fixed rate of 6.75% (2011: 6.75%) and $101 million (2011: $101 million) floating rate notes maturing greater than five years;
• Great Western Bank floating rate notes of $54 million (2011: $57 million) maturing between 2033 and 2035; and• securitisation conduits’ floating rate notes of $5 million (2011: $5 million) maturing in 2020.
The Group holds derivative financial instruments to manage interest rate and foreign exchange risk on bonds, notes and subordinated debt. Refer to Note 11 for further information on the Group’s trading and hedging derivative assets and liabilities.
Issued bonds, notes and subordinated debt by currencyGroup Company
2012 2011 2012 2011$m $m $m $m
AUD 35,188 33,331 32,155 29,927 USD 28,310 26,697 26,902 25,190 EUR 18,159 19,577 17,290 17,645 GBP 9,020 7,768 5,635 4,491 Other 12,695 12,395 12,695 12,395
Total bonds, notes and subordinated debt 103,372 99,768 94,677 89,648
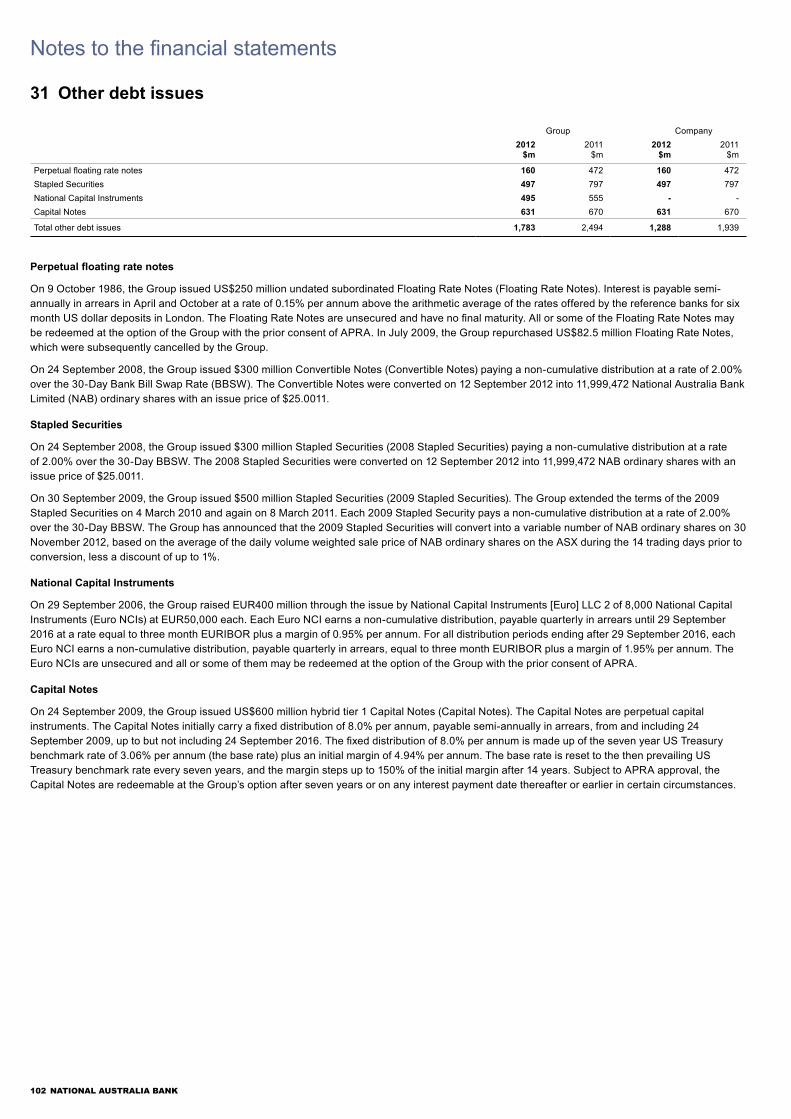
102 NATIONAL AUSTRALIA BANK
Notes to the financial statements
31 Other debt issues
Group Company2012 2011 2012 2011
$m $m $m $m
Perpetual floating rate notes 160 472 160 472 Stapled Securities 497 797 497 797 National Capital Instruments 495 555 - - Capital Notes 631 670 631 670
Total other debt issues 1,783 2,494 1,288 1,939
Perpetual floating rate notes
On 9 October 1986, the Group issued US$250 million undated subordinated Floating Rate Notes (Floating Rate Notes). Interest is payable semi-annually in arrears in April and October at a rate of 0.15% per annum above the arithmetic average of the rates offered by the reference banks for six month US dollar deposits in London. The Floating Rate Notes are unsecured and have no final maturity. All or some of the Floating Rate Notes may be redeemed at the option of the Group with the prior consent of APRA. In July 2009, the Group repurchased US$82.5 million Floating Rate Notes, which were subsequently cancelled by the Group.
On 24 September 2008, the Group issued $300 million Convertible Notes (Convertible Notes) paying a non-cumulative distribution at a rate of 2.00% over the 30-Day Bank Bill Swap Rate (BBSW). The Convertible Notes were converted on 12 September 2012 into 11,999,472 National Australia Bank Limited (NAB) ordinary shares with an issue price of $25.0011.
Stapled Securities
On 24 September 2008, the Group issued $300 million Stapled Securities (2008 Stapled Securities) paying a non-cumulative distribution at a rate of 2.00% over the 30-Day BBSW. The 2008 Stapled Securities were converted on 12 September 2012 into 11,999,472 NAB ordinary shares with an issue price of $25.0011.
On 30 September 2009, the Group issued $500 million Stapled Securities (2009 Stapled Securities). The Group extended the terms of the 2009 Stapled Securities on 4 March 2010 and again on 8 March 2011. Each 2009 Stapled Security pays a non-cumulative distribution at a rate of 2.00% over the 30-Day BBSW. The Group has announced that the 2009 Stapled Securities will convert into a variable number of NAB ordinary shares on 30 November 2012, based on the average of the daily volume weighted sale price of NAB ordinary shares on the ASX during the 14 trading days prior to conversion, less a discount of up to 1%.
National Capital Instruments
On 29 September 2006, the Group raised EUR400 million through the issue by National Capital Instruments [Euro] LLC 2 of 8,000 National Capital Instruments (Euro NCIs) at EUR50,000 each. Each Euro NCI earns a non-cumulative distribution, payable quarterly in arrears until 29 September 2016 at a rate equal to three month EURIBOR plus a margin of 0.95% per annum. For all distribution periods ending after 29 September 2016, each Euro NCI earns a non-cumulative distribution, payable quarterly in arrears, equal to three month EURIBOR plus a margin of 1.95% per annum. The Euro NCIs are unsecured and all or some of them may be redeemed at the option of the Group with the prior consent of APRA.
Capital Notes
On 24 September 2009, the Group issued US$600 million hybrid tier 1 Capital Notes (Capital Notes). The Capital Notes are perpetual capital instruments. The Capital Notes initially carry a fixed distribution of 8.0% per annum, payable semi-annually in arrears, from and including 24 September 2009, up to but not including 24 September 2016. The fixed distribution of 8.0% per annum is made up of the seven year US Treasury benchmark rate of 3.06% per annum (the base rate) plus an initial margin of 4.94% per annum. The base rate is reset to the then prevailing US Treasury benchmark rate every seven years, and the margin steps up to 150% of the initial margin after 14 years. Subject to APRA approval, the Capital Notes are redeemable at the Group’s option after seven years or on any interest payment date thereafter or earlier in certain circumstances.

2012 Annual Financial Report 103
Notes to the financial statements
32 Defined benefit superannuation plan assets and liabilities
(a) Superannuation plans
The Group maintains several defined benefit superannuation plans in different geographies including some superannuation plans which have defined benefit and defined contribution components. Defined benefit plans provide defined lump sum benefits based on years of service and a salary component determined in accordance with the specific plan. All defined benefit plans are closed to new members. An asset (surplus) or liability (deficit) in respect of defined benefit plans is recognised on the balance sheet and is measured as the present value of the defined benefit obligation less the fair value of the plan’s assets. Surpluses and deficits depend on various factors and can vary significantly over time having regard, for example, to movements in investment markets, future salaries and changes in employment patterns.
This note sets out details of defined benefit plans only, and is based on the most recent information available prior to the reporting date.
The National Australia Bank Superannuation Fund A is no longer included in the current year disclosures as the Plan no longer contains any material defined benefit components. The 2011 disclosures include both the defined benefit and contribution components of this plan.
(b) Balance sheet amounts
The defined benefit net asset and net liability recognised on the balance sheet are comprised of the following:Group Company
2012 2011 2012 2011$m $m $m $m
Net asset on the balance sheet (plan in surplus)Fair value of plan assets 35 3,292 - 3,187 Present value of funded obligations (33) (3,279) - (3,174)
Net asset before adjustment for contribution tax 2 13 - 13 Adjustment for contribution tax - 3 - 3
Net asset included in other assets on the balance sheet 2 16 - 16
Net liability on the balance sheet (plans in deficit)Fair value of plan assets 3,924 3,313 - - Present value of partly funded obligations (4,405) (3,608) - -
Net liability before adjustment for contribution tax (481) (295) - -
Adjustment for contribution tax (1) - - -
Net liability on the balance sheet (482) (295) - -
(c) Plan assets by asset category
The fair value of plan assets (for both the plans in surplus and deficit), by asset category, including the percentage of the total plan assets, as at 30 September is as follows:
Group Company
2012 2011 2012 2011$m % $m % $m % $m %
Cash 38 1.0 225 3.4 - - 202 6.3 Equity instruments 1,579 39.8 3,552 53.7 - - 1,873 58.8 Debt instruments 2,150 54.3 1,867 28.3 - - 319 10.0 Property 157 4.0 546 8.3 - - 381 12.0 Other assets 35 0.9 415 6.3 - - 412 12.9
Fair value of plan assets 3,959 100.0 6,605 100.0 - - 3,187 100.0
The fair value of plan assets includes land and buildings occupied by the Group with a fair value of $39 million (2011: $41 million) and nil for the Company (2011: nil).
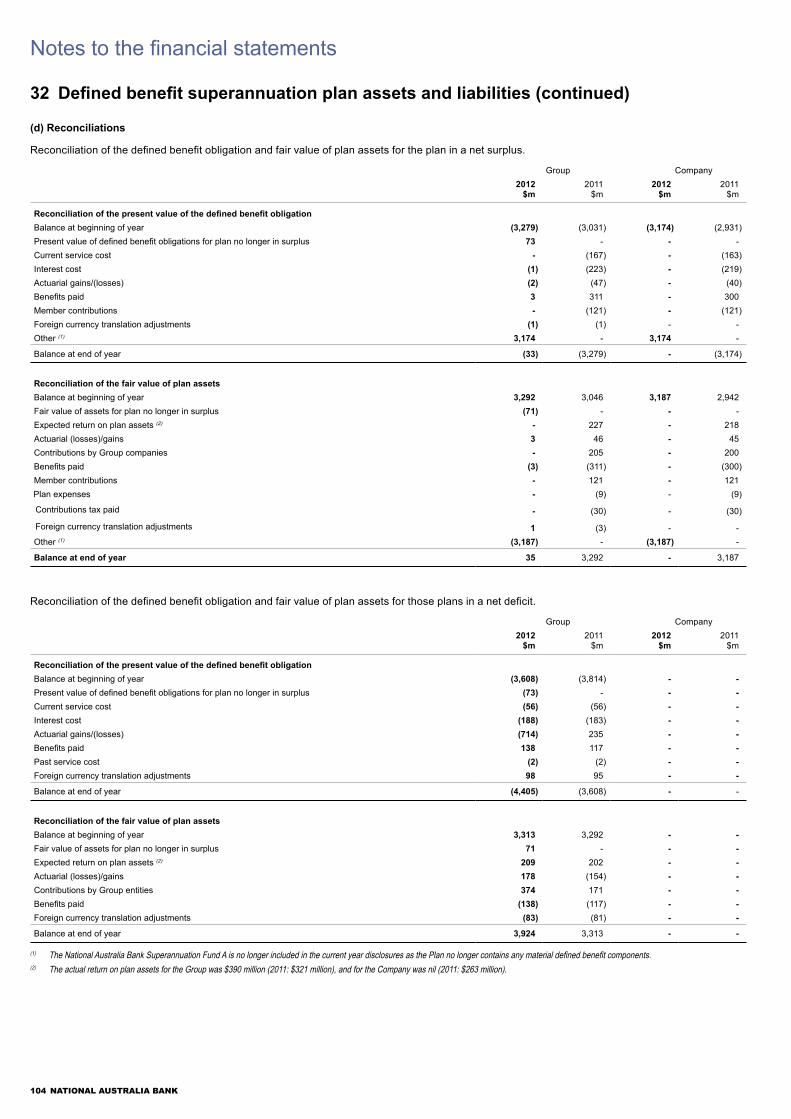
104 NATIONAL AUSTRALIA BANK
Notes to the financial statements
32 Defined benefit superannuation plan assets and liabilities (continued)
(d) Reconciliations
Reconciliation of the defined benefit obligation and fair value of plan assets for the plan in a net surplus.
Group Company2012 2011 2012 2011$m $m $m $m
Reconciliation of the present value of the defined benefit obligationBalance at beginning of year (3,279) (3,031) (3,174) (2,931)Present value of defined benefit obligations for plan no longer in surplus 73 - - - Current service cost - (167) - (163)Interest cost (1) (223) - (219)Actuarial gains/(losses) (2) (47) - (40)Benefits paid 3 311 - 300 Member contributions - (121) - (121)Foreign currency translation adjustments (1) (1) - - Other (1) 3,174 - 3,174 -
Balance at end of year (33) (3,279) - (3,174)
Reconciliation of the fair value of plan assetsBalance at beginning of year 3,292 3,046 3,187 2,942 Fair value of assets for plan no longer in surplus (71) - - - Expected return on plan assets (2) - 227 - 218 Actuarial (losses)/gains 3 46 - 45 Contributions by Group companies - 205 - 200 Benefits paid (3) (311) - (300)Member contributions - 121 - 121 Plan expenses - (9) - (9)
Contributions tax paid - (30) - (30)
Foreign currency translation adjustments 1 (3) - - Other (1) (3,187) - (3,187) -
Balance at end of year 35 3,292 - 3,187
Reconciliation of the defined benefit obligation and fair value of plan assets for those plans in a net deficit.
Group Company2012 2011 2012 2011$m $m $m $m
Reconciliation of the present value of the defined benefit obligationBalance at beginning of year (3,608) (3,814) - - Present value of defined benefit obligations for plan no longer in surplus (73) - - - Current service cost (56) (56) - - Interest cost (188) (183) - - Actuarial gains/(losses) (714) 235 - - Benefits paid 138 117 - - Past service cost (2) (2) - - Foreign currency translation adjustments 98 95 - -
Balance at end of year (4,405) (3,608) - -
Reconciliation of the fair value of plan assetsBalance at beginning of year 3,313 3,292 - - Fair value of assets for plan no longer in surplus 71 - - - Expected return on plan assets (2) 209 202 - - Actuarial (losses)/gains 178 (154) - - Contributions by Group entities 374 171 - - Benefits paid (138) (117) - - Foreign currency translation adjustments (83) (81) - -
Balance at end of year 3,924 3,313 - -
(1) The National Australia Bank Superannuation Fund A is no longer included in the current year disclosures as the Plan no longer contains any material defined benefit components.(2) The actual return on plan assets for the Group was $390 million (2011: $321 million), and for the Company was nil (2011: $263 million).

2012 Annual Financial Report 105
Notes to the financial statements
32 Defined benefit superannuation plan assets and liabilities (continued)
The following tables present a historic summary of the aggregate fair values of plan assets and present values of plan obligations before contribution tax and experience adjustments for all of the Group’s defined benefit superannuation plans for the last five years as at 30 September:
Group2012 2011 2010 2009 2008$m $m $m $m $m
Fair value of plan assets 3,959 6,605 6,338 6,113 7,334 Present value of plan obligation (4,438) (6,887) (6,845) (6,676) (6,714)
(Deficit)/surplus (479) (282) (507) (563) 620
Experience adjustments:Plan assets - actuarial (losses)/gains 181 (108) 132 (875) (1,151)Plan obligations - actuarial gains/(losses) (716) 188 (246) (256) 1,152
Company2012 2011 2010 2009 2008$m $m $m $m $m
Fair value of plan assets - 3,187 2,942 2,663 3,043 Present value of plan obligation - (3,174) (2,931) (2,655) (3,023)
Surplus - 13 11 8 20
Experience adjustments:Plan assets - actuarial gains/(losses) - 45 62 (652) (421)Plan obligations - actuarial (losses)/gains - (40) (59) 641 413
(e) Amounts recognised in the income statement
Amounts recognised in the income statement in the line item personnel expenses are in Note 5 as follows:Group Company
2012 2011 2012 2011$m $m $m $m
Current service cost 56 223 - 163 Interest cost 189 406 - 219 Expected return on plan assets (209) (429) - (218)Plan expenses - 9 - 9 Contributions tax expense - 30 - 30 Past service cost 2 2 - -
Total defined benefit plan expense 38 241 - 203
The total cumulative amount of actuarial losses recognised directly in retained profits for the Group is $1,146 million (2011: $611 million), and for the Company is $80 million gain (2011: $80 million gain). Actuarial gains and losses are translated at the closing spot rate and have been grossed up for contribution taxes.
(f) Principal actuarial assumptions
The Group plans to make contributions in accordance with actuarial recommendations. The estimated contribution for the Group for the year ended 30 September 2013 is $188 million (2011: $391 million), and for the Company is nil (2011: $210 million). The Group’s expected rate of return on defined benefit plan assets is determined by the plan assets’ historical long-term investment performance, the current asset allocation and estimates of future long-term returns by asset class.
The assets of all the plans are held independently of the Group’s assets in separate administered plans. Defined benefit plans are valued every year by independent actuaries for accounting purposes using the projected unit credit method. The latest actuarial valuations were made by applying the following principal actuarial assumptions at 30 September (weighted averages):
Group Company2012 2011 2012 2011
% % % %
Discount rate (per annum) 4.3 4.9 - 4.3 Expected return on plan assets (per annum) 5.1 6.8 - 7.5 Rate of compensation increase (per annum) 2.5 3.0 - 3.0 Future superannuation increases (per annum) 2.4 2.9 - 3.0
Group Company2012 2011 2012 2011
Expected future lifetime at the age of 60 Years Years Years Years
Male retired 27.8 26.3 - 22.2 Female retired 28.3 28.1 - 25.5 Male non-retired 29.1 27.7 - 22.2 Female non-retired 29.7 29.5 - 25.5

106 NATIONAL AUSTRALIA BANK
Notes to the financial statements
33 Other liabilities
Group Company2012 2011 2012 2011
$m $m $m $m
Accrued interest payable 4,801 5,253 3,964 4,264 Payables and accrued expenses 2,128 2,128 1,343 1,287 Notes in circulation 2,436 2,130 - - Other life insurance liabilities (1)
Unsettled investment liabilities - 1 - - Outstanding policy claims 108 111 - - Other 53 224 - -
Other 2,841 3,489 2,095 2,934
Total other liabilities 12,367 13,336 7,402 8,485
(1) Life insurance statutory fund liabilities are quarantined and will be settled from the assets of the statutory funds (refer to Note 1(p)).

2012 Annual Financial Report 107
Notes to the financial statements
34 Contributed equity
Group Company2012 2011 2012 2011
$m $m $m $m
Issued and paid-up ordinary share capitalOrdinary shares, fully paid 22,459 20,360 22,683 20,420 Issued and paid-up preference share capitalBNZ Income Securities 380 380 - - BNZ Income Securities 2 203 203 - - Other contributed equityNational Income Securities 1,945 1,945 1,945 1,945 Trust Preferred Securities 975 975 - - Trust Preferred Securities II 1,014 1,014 1,014 1,014 National Capital Instruments 397 397 397 397
Total contributed equity 27,373 25,274 26,039 23,776
Ordinary SharesReconciliation of movement in contributed equity
Group Company
2012 2011 2012 2011$m $m $m $m
Ordinary share capitalBalance at beginning of year 20,360 18,637 20,420 18,904 Shares issued
Dividend reinvestment plan 1,405 1,364 1,405 1,364 Exercise of executive share options 5 - 5 - On market purchase of shares for equity-based compensation - (33) - (33)Conversion of other debt issues 600 - 600 - Transfer from equity-based compensation reserve 253 185 253 185
Realised loss on treasury shares relating to life insurance business (24) (57) - - Unrealised (loss)/gain on treasury shares relating to life insurance business (140) 264 - -
Balance at end of year 22,459 20,360 22,683 20,420
The number of ordinary shares on issue for the last two years at 30 September was as follows:Company
2012 2011No. ’000 No. ’000
Ordinary shares, fully paidBalance at beginning of year 2,201,189 2,133,341 Shares issued
Dividend reinvestment plan 62,952 57,620 Bonus share plan 2,255 1,925 Conversion of other debt issues 23,999 -
Employee share plans 5,841 7,983 Performance options and performance rights 958 294
Paying up of partly paid shares 53 26
Total ordinary shares, fully paid 2,297,247 2,201,189
Ordinary shares, partly paid to 25 centsBalance at beginning of year 157 183 Paying up of partly paid shares (53) (26)
Total ordinary shares, partly paid to 25 cents 104 157
Total number of ordinary shares on issue at end of year (including treasury shares) 2,297,351 2,201,346
Deduct: Treasury shares (53,526) (48,390)
Total number of ordinary shares on issue at end of year (excluding treasury shares) 2,243,825 2,152,956
Group Company2012 2011 2012 2011
$m $m $m $m
Treasury sharesBalance at beginning of year 1,110 1,289 26 235 Realised loss on treasury shares relating to life insurance business 24 57 - - Unrealised loss/(gain) on treasury shares relating to life insurance business 140 (264) - - On market purchase for equity-based compensation - 33 - 33 Transfer from equity-based compensation reserve - purchased shares (1) (5) (1) (5)Other - - - (237)
Balance at end of year 1,273 1,110 25 26

108 NATIONAL AUSTRALIA BANK
Notes to the financial statements
34 Contributed equity (continued)
BNZ Income SecuritiesOn 28 March 2008, the Group raised $380 million through the issue by BNZ Income Securities Limited of 449,730,000 perpetual non-cumulative shares (BNZIS Shares) at NZ$1 each. Each BNZIS Share earns a non-cumulative distribution, payable quarterly in arrears at a rate of 9.89% per annum. The dividend rate is reset five yearly.
With the prior written consent of Australian Prudential Regulation Authority (APRA), any member of the Group other than BNZ Income Securities Limited has the right to acquire the BNZIS Shares for their issue price (plus any accrued but unpaid distributions) on any dividend payment date on or after 28 March 2013, or at any time after the occurrence of certain specified events. The BNZIS Shares have no maturity date and are quoted on the NZX Debt Market (NZDX).
BNZ Income Securities 2On 26 June 2009, the Group raised $203 million through the issue by BNZ Income Securities 2 Limited of 260,000,000 perpetual non-cumulative shares (BNZIS 2 Shares) at NZ$1 each. Each BNZIS 2 Share earns a non-cumulative distribution, payable quarterly in arrears, at a rate of 9.10% per annum. The dividend rate is reset five yearly.
With the prior written consent of APRA, any member of the Group other than BNZ Income Securities 2 Limited has the right to acquire the BNZIS 2 Shares for their issue price (plus any accrued but unpaid distributions) on any dividend payment date on or after 28 June 2014, or at any time after the occurrence of certain specified events. The BNZIS 2 Shares have no maturity date and are quoted on the NZDX.
National Income SecuritiesOn 29 June 1999, the Company issued 20,000,000 National Income Securities (NIS) at $100 each. These securities are stapled securities, comprising one fully paid note of $100 issued by the Company through its New York branch and one unpaid preference share issued by the Company (NIS preference share). The amount unpaid on a NIS preference share will become due in certain limited circumstances, such as if an event of default occurs. Each holder of NIS is entitled to non-cumulative distributions based on a rate equal to the Australian 90 day bank bill rate plus 1.25% per annum, payable quarterly in arrears.
With the prior written consent of APRA, the Company may redeem each note for $100 (plus any accrued distributions) and buy back or cancel the NIS preference share stapled to the note for no consideration. NIS have no maturity date and are quoted on the Australian Securities Exchange (ASX).
Trust Preferred SecuritiesOn 29 September 2003, the Group raised GBP400 million through the issue by National Capital Trust I of 400,000 Trust Preferred Securities at GBP1,000 each, to be used by the Company’s London branch. Each Trust Preferred Security earns a non-cumulative distribution, payable semi-annually in arrears until 17 December 2018 equal to 5.62% per annum and, in respect of each five year period after that date, a non-cumulative distribution payable semi-annually in arrears at a rate equal to the sum of the yield to maturity of the five year benchmark UK Government bond at the start of that period plus 1.93%.
With the prior written consent of APRA, the Trust Preferred Securities may be redeemed on 17 December 2018 and on every subsequent fifth anniversary, in which case the redemption price is GBP1,000 per Trust Preferred Security plus the unpaid distributions for the last six month distribution period, or redeemed earlier in certain circumstances, in some cases subject to a make-whole adjustment for costs of reinvestment as a result of the early redemption of the Trust Preferred Security.
Trust Preferred Securities IIOn 23 March 2005, the Group raised US$800 million through the issue by National Capital Trust II of 800,000 Trust Preferred Securities at US$1,000 each, to be used by the Company’s London branch. Each Trust Preferred Security earns a non-cumulative distribution, payable semi-annually in arrears until 23 March 2015 equal to 5.486%. For all distribution periods ending after 23 March 2015, each Trust Preferred Security earns a non-cumulative distribution, payable quarterly in arrears, equal to 1.5375% over three month London Interbank Offered Rate (LIBOR).
With the prior written consent of APRA, the Trust Preferred Securities may be redeemed on or after 23 March 2015, in which case the redemption price is US$1,000 per Trust Preferred Security plus the unpaid distributions for the last distribution period, or redeemed earlier in certain circumstances, in some cases subject to a make-whole adjustment for costs of reinvestment as a result of the early redemption of the Trust Preferred Security.
National Capital Instruments
On 18 September 2006, the Group raised $400 million (prior to issuance costs) through the issue by National Capital Trust III of 8,000 National Capital Instruments (Australian NCIs) at $50,000 each. Each Australian NCI earns a non-cumulative distribution, payable quarterly in arrears until 30 September 2016 at a rate equal to the bank bill rate plus a margin of 0.95% per annum. For all distribution periods ending after 30 September 2016, each Australian NCI earns a non-cumulative distribution, payable quarterly in arrears, equal to the bank bill rate plus a margin of 1.95% per annum.
With the prior written consent of APRA, the Australian NCIs may be redeemed on 30 September 2016 and any subsequent distribution payment date after 30 September 2016, or earlier in certain circumstances.
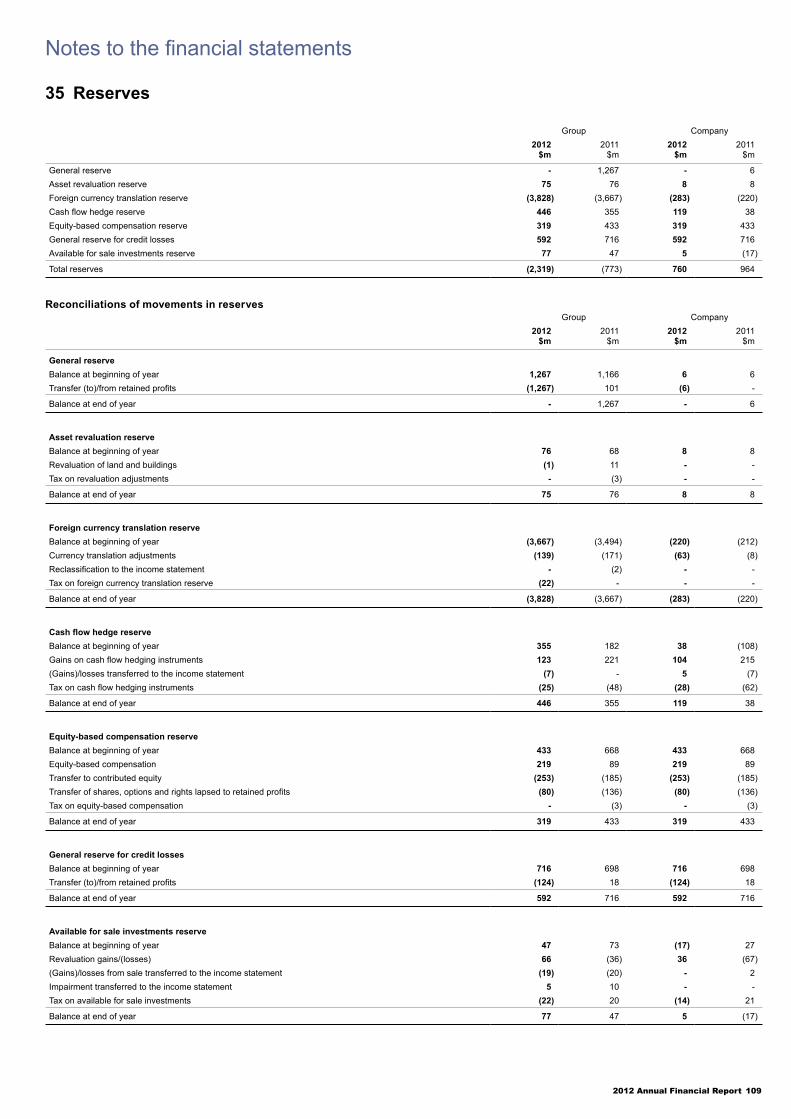
2012 Annual Financial Report 109
Notes to the financial statements
35 Reserves
Group Company2012 2011 2012 2011
$m $m $m $m
General reserve - 1,267 - 6 Asset revaluation reserve 75 76 8 8 Foreign currency translation reserve (3,828) (3,667) (283) (220)Cash flow hedge reserve 446 355 119 38 Equity-based compensation reserve 319 433 319 433 General reserve for credit losses 592 716 592 716 Available for sale investments reserve 77 47 5 (17)
Total reserves (2,319) (773) 760 964
Reconciliations of movements in reservesGroup Company
2012 2011 2012 2011$m $m $m $m
General reserveBalance at beginning of year 1,267 1,166 6 6 Transfer (to)/from retained profits (1,267) 101 (6) -
Balance at end of year - 1,267 - 6
Asset revaluation reserveBalance at beginning of year 76 68 8 8 Revaluation of land and buildings (1) 11 - - Tax on revaluation adjustments - (3) - -
Balance at end of year 75 76 8 8
Foreign currency translation reserveBalance at beginning of year (3,667) (3,494) (220) (212)Currency translation adjustments (139) (171) (63) (8)Reclassification to the income statement - (2) - - Tax on foreign currency translation reserve (22) - - -
Balance at end of year (3,828) (3,667) (283) (220)
Cash flow hedge reserveBalance at beginning of year 355 182 38 (108)Gains on cash flow hedging instruments 123 221 104 215 (Gains)/losses transferred to the income statement (7) - 5 (7)Tax on cash flow hedging instruments (25) (48) (28) (62)
Balance at end of year 446 355 119 38
Equity-based compensation reserveBalance at beginning of year 433 668 433 668 Equity-based compensation 219 89 219 89 Transfer to contributed equity (253) (185) (253) (185)Transfer of shares, options and rights lapsed to retained profits (80) (136) (80) (136)Tax on equity-based compensation - (3) - (3)
Balance at end of year 319 433 319 433
General reserve for credit lossesBalance at beginning of year 716 698 716 698 Transfer (to)/from retained profits (124) 18 (124) 18
Balance at end of year 592 716 592 716
Available for sale investments reserveBalance at beginning of year 47 73 (17) 27 Revaluation gains/(losses) 66 (36) 36 (67)(Gains)/losses from sale transferred to the income statement (19) (20) - 2 Impairment transferred to the income statement 5 10 - - Tax on available for sale investments (22) 20 (14) 21
Balance at end of year 77 47 5 (17)

110 NATIONAL AUSTRALIA BANK
Notes to the financial statements
36 Retained profits
Group Company2012 2011 2012 2011
$m $m $m $m
Balance at beginning of year 17,667 16,028 16,629 15,180 Actuarial (losses)/gains on defined benefit superannuation plans (535) 80 - 5 Tax on items taken directly to/(from) equity 104 (39) - 3 Net profit attributable to owners of the Company 4,082 5,219 5,015 4,890 Transfer from/(to) general reserve for credit losses 124 (18) 124 (18)Transfer from/(to) general reserve 1,267 (101) 6 - Transfer of options and rights lapsed from equity-based compensation reserve 80 136 80 136 Dividends paid (3,880) (3,413) (3,904) (3,444)Distributions on other equity instruments (207) (225) (114) (123)
Balance at end of year 18,702 17,667 17,836 16,629

2012 Annual Financial Report 111
Notes to the financial statements
37 Shares, performance options and performance rights
The Group’s employee equity plans provide Company shares, performance options and performance rights to employees of the Group. Each plan allows employees to be invited to participate in the offers under the relevant plan. Employee equity plans may be specific to employees in a particular region (e.g. New Zealand (NZ) staff share allocation plan, United Kingdom (UK) share incentive plan).
The Board determines the maximum number of shares, performance options or performance rights offered, and where required, the formula used in calculating the fair value per instrument. Each plan provides that the total number of shares issued in the last five years under the Company’s employee share, performance option or performance right plans and the total number of outstanding performance options and performance rights granted under its plans, including any proposed offer, must not exceed 5% of the number of shares in the issued share capital of the Company at the time of the proposed offer. The calculation does not include offers or grants made of shares, performance options or performance rights acquired as a result of an offer made to a person situated outside Australia at the time of the offer or offers which did not require disclosure under section 708 of the Corporations Act 2001 (Cth), otherwise than as a result of relief granted by ASIC. Under ASX Listing Rules, shares, performance options and performance rights may not be issued to Company directors under an employee incentive scheme without specific shareholder approval.
Equity-based programs for employees
Equity-based programs offered to employees form part of the Group’s remuneration strategy in rewarding current and future contributions to the Group’s performance and strengthening the link between value created for shareholders and rewards for employees.
Under the terms of most offers, there is a minimum holding period during which the shares are held on trust (or performance rights or options cannot be exercised) and cannot be dealt with by the employee. There may be forfeiture conditions particular to each program as described below if the employee leaves during this period. Shares allocated under the programs below are eligible for any cash dividends paid from the time they are allocated to the trustee on an employee’s behalf.
Short-term incentives (STI) may be provided under the STI Deferral program. Employees become eligible for these shares based on their individual or business performance (or both).
The STI deferral model for employees based in Australia, Asia, the UK and the United States (US), as well as for senior management employees in NZ, allows for a proportion of an employee’s STI reward to be deferred. The deferred amount is commensurate with the level of risk and responsibility within a role and the length of deferral, ranging from 6 to 42 months, aligns with both the level of risk and impact of the role on business performance and results. A threshold is in place whereby deferral only applies to STI deferred amounts of $1,000 or more.
Generally, STI shares (or performance rights granted for jurisdictional reasons) are forfeited during the deferral period if the employee resigns or fails to pass the Compliance Gateway during the following financial year(s) or, subject to certain exclusions, if the employee is terminated from the Group. In determining the release of an employee’s STI shares from restrictions during the deferral period, the Board may in its absolute discretion, subject to compliance with the law, forfeit some or all of the STI Deferral shares. For further details on STI awards granted to the executive directors of the Company, refer to the Remuneration report.
Commencement and recognition / retention shares respectively enable the buy-out of equity from previous employment, based on evidentiary information, for significant new hires or provide retention awards for key individuals in roles where retention is critical over a medium to long-term time frame. The shares may be subject to individual and business performance hurdles, including meeting minimum compliance, behaviour and performance thresholds, regional Return on Equity (ROE) and cash earnings, and internal qualitative measures. The shares are subject to forfeiture, or staggered forfeiture, if the participant resigns or retires before specified key dates or key milestones are achieved, if the individual fails to pass the Compliance Gateway or if their employment is terminated.
General employee shares up to a target value of $1,000 of Company shares are offered to each eligible employee when the Group’s performance is on target, measured against a scorecard of objectives for the financial year. These shares are held on trust, restricted from dealing for three years, and in Australia and Asia and are not subject to forfeiture. In NZ and the US, the shares are effectively forfeited if the employee voluntarily ceases employment with the Group before the end of three years. In the UK, the shares are forfeited if an employee is summarily dismissed prior to the end of three years.
Salary sacrifice shares are allocated on a monthly basis to UK employees when they nominate to contribute a portion of their gross salary to receive Company shares.
Long-term incentives (LTI) help to drive management decisions focused on the long-term prosperity of the Group through the use of challenging performance hurdles. The Executive LTI program is awarded to senior executives across the Group. An LTI target is set with reference to external and internal relativities for each executive who must also meet minimum performance and compliance thresholds. Performance hurdles (both internal and external) are measured at the end of a three year restriction period and during the restriction period, an executive will forfeit their shares (or their performance rights will lapse) for voluntary cessation of employment or if compliance requirements or performance hurdles are not met.
All other Group senior employees participate in the Restricted Share Plan where a $3,000 target award is granted based on Group performance. Eligibility is based on service and threshold performance and compliance outcomes. An employee forfeits shares for voluntary cessation of employment or failure to meet compliance requirements within the three year restriction period.
Other employee share offers include various other offers made to employees of the Group from time to time. These include MLC Ownership shares, which are provided under legacy arrangements to employees of the former MLC business as part of their fixed remuneration package. These shares do not have a restriction period and are forfeited for misconduct.
Performance options and performance rights are used to provide long-term incentives in recognition of executive potential and talent in the Group. They are also used instead of shares to provide rewards under the above employee programs to employees in some countries (such as NZ) for jurisdictional reasons.
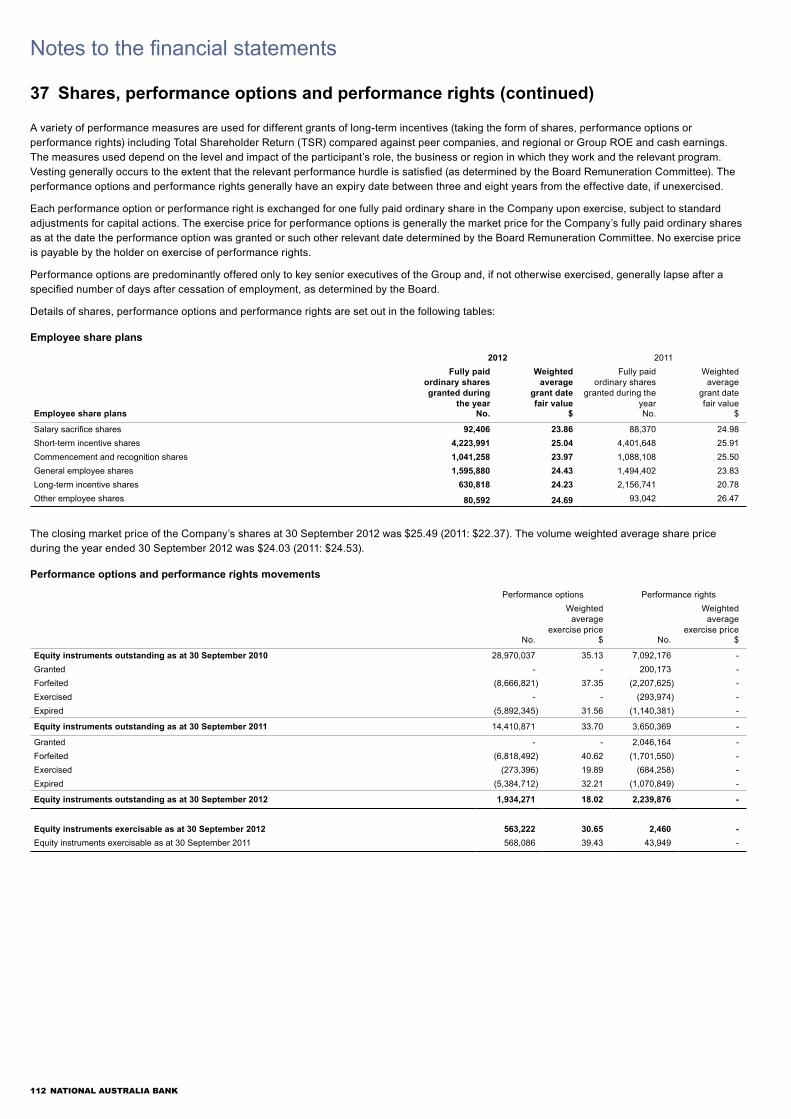
112 NATIONAL AUSTRALIA BANK
Notes to the financial statements
37 Shares, performance options and performance rights (continued)
A variety of performance measures are used for different grants of long-term incentives (taking the form of shares, performance options or performance rights) including Total Shareholder Return (TSR) compared against peer companies, and regional or Group ROE and cash earnings. The measures used depend on the level and impact of the participant’s role, the business or region in which they work and the relevant program. Vesting generally occurs to the extent that the relevant performance hurdle is satisfied (as determined by the Board Remuneration Committee). The performance options and performance rights generally have an expiry date between three and eight years from the effective date, if unexercised.
Each performance option or performance right is exchanged for one fully paid ordinary share in the Company upon exercise, subject to standard adjustments for capital actions. The exercise price for performance options is generally the market price for the Company’s fully paid ordinary shares as at the date the performance option was granted or such other relevant date determined by the Board Remuneration Committee. No exercise price is payable by the holder on exercise of performance rights.
Performance options are predominantly offered only to key senior executives of the Group and, if not otherwise exercised, generally lapse after a specified number of days after cessation of employment, as determined by the Board.
Details of shares, performance options and performance rights are set out in the following tables:
Employee share plans
2012 2011
Employee share plans
Fully paid ordinary shares granted during
the year
Weighted average
grant date fair value
Fully paid ordinary shares
granted during the year
Weighted average
grant date fair value
No. $ No. $
Salary sacrifice shares 92,406 23.86 88,370 24.98 Short-term incentive shares 4,223,991 25.04 4,401,648 25.91 Commencement and recognition shares 1,041,258 23.97 1,088,108 25.50 General employee shares 1,595,880 24.43 1,494,402 23.83 Long-term incentive shares 630,818 24.23 2,156,741 20.78 Other employee shares 80,592 24.69 93,042 26.47
The closing market price of the Company’s shares at 30 September 2012 was $25.49 (2011: $22.37). The volume weighted average share price during the year ended 30 September 2012 was $24.03 (2011: $24.53).
Performance options and performance rights movements
Performance options Performance rightsWeighted
average exercise price
Weighted average
exercise priceNo. $ No. $
Equity instruments outstanding as at 30 September 2010 28,970,037 35.13 7,092,176 - Granted - - 200,173 - Forfeited (8,666,821) 37.35 (2,207,625) - Exercised - - (293,974) - Expired (5,892,345) 31.56 (1,140,381) -
Equity instruments outstanding as at 30 September 2011 14,410,871 33.70 3,650,369 -
Granted - - 2,046,164 - Forfeited (6,818,492) 40.62 (1,701,550) - Exercised (273,396) 19.89 (684,258) - Expired (5,384,712) 32.21 (1,070,849) -
Equity instruments outstanding as at 30 September 2012 1,934,271 18.02 2,239,876 -
Equity instruments exercisable as at 30 September 2012 563,222 30.65 2,460 - Equity instruments exercisable as at 30 September 2011 568,086 39.43 43,949 -
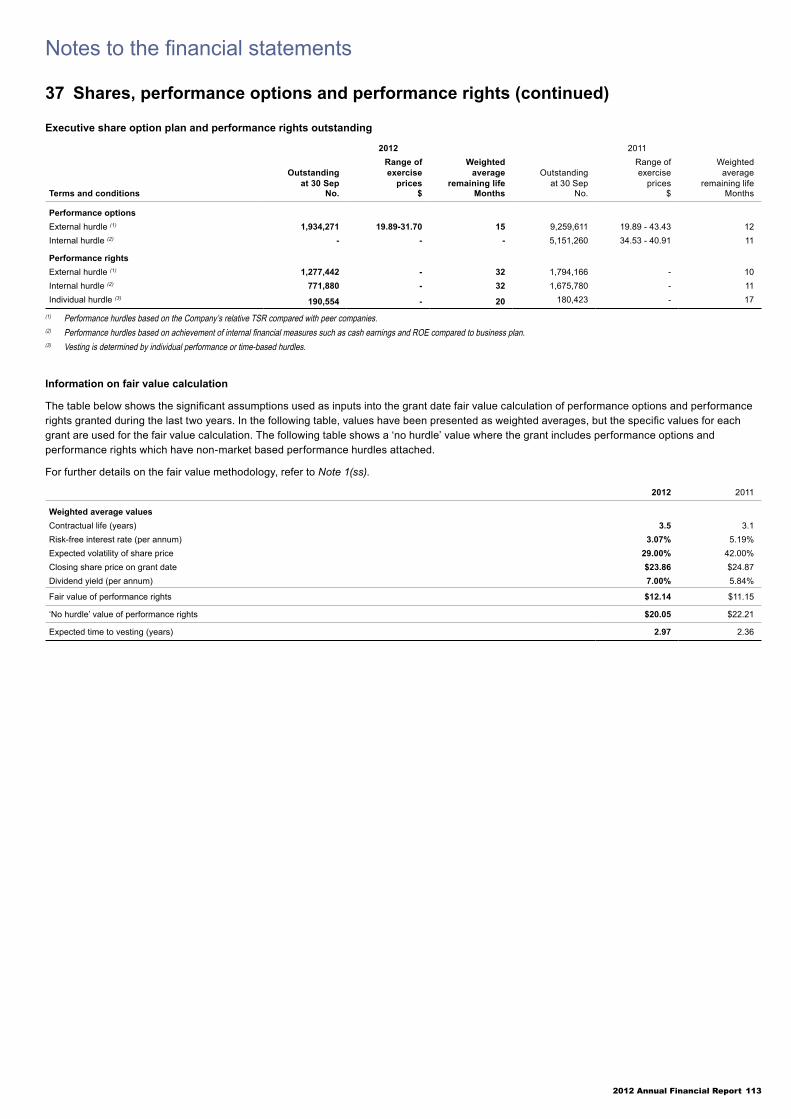
2012 Annual Financial Report 113
Notes to the financial statements
37 Shares, performance options and performance rights (continued)
Executive share option plan and performance rights outstanding
2012 2011
Terms and conditions
Outstanding at 30 Sep
Range of exercise
prices
Weighted average
remaining lifeOutstanding
at 30 Sep
Range of exercise
prices
Weighted average
remaining lifeNo. $ Months No. $ Months
Performance optionsExternal hurdle (1) 1,934,271 19.89-31.70 15 9,259,611 19.89 - 43.43 12 Internal hurdle (2) - - - 5,151,260 34.53 - 40.91 11
Performance rightsExternal hurdle (1) 1,277,442 - 32 1,794,166 - 10 Internal hurdle (2) 771,880 - 32 1,675,780 - 11 Individual hurdle (3) 190,554 - 20 180,423 - 17
(1) Performance hurdles based on the Company’s relative TSR compared with peer companies.(2) Performance hurdles based on achievement of internal financial measures such as cash earnings and ROE compared to business plan.(3) Vesting is determined by individual performance or time-based hurdles.
Information on fair value calculation
The table below shows the significant assumptions used as inputs into the grant date fair value calculation of performance options and performance rights granted during the last two years. In the following table, values have been presented as weighted averages, but the specific values for each grant are used for the fair value calculation. The following table shows a ‘no hurdle’ value where the grant includes performance options and performance rights which have non-market based performance hurdles attached.
For further details on the fair value methodology, refer to Note 1(ss).
2012 2011
Weighted average valuesContractual life (years) 3.5 3.1 Risk-free interest rate (per annum) 3.07% 5.19%Expected volatility of share price 29.00% 42.00%Closing share price on grant date $23.86 $24.87Dividend yield (per annum) 7.00% 5.84%
Fair value of performance rights $12.14 $11.15
‘No hurdle’ value of performance rights $20.05 $22.21
Expected time to vesting (years) 2.97 2.36

114 NATIONAL AUSTRALIA BANK
Notes to the financial statements
38 Notes to the cash flow statement
(a) Reconciliation of net profit attributable to owners of the Company to net cash provided by operating activities
Group Company2012 2011 2012 2011$m $m $m $m
Net profit attributable to owners of the Company 4,082 5,219 5,015 4,890 Add/(deduct) non-cash items in the income statement:
Decrease/(increase) in interest receivable 200 (222) 89 (670)(Decrease)/increase in interest payable (431) 291 (296) 680 Decrease in unearned income and deferred net fee income (402) (207) (262) (44)Fair value movements:
Assets, liabilities and derivatives held at fair value (357) 1,707 (1,184) 1,591 Net adjustment to bid/offer valuation 57 1 42 2
(Increase)/decrease in personnel provisions (166) 37 (81) 8 Increase/(decrease) in other operating provisions 376 105 52 (13)Equity-based compensation recognised in equity or reserves 219 89 219 89 Superannuation costs - defined benefit superannuation plans 38 44 - 3 Increase in impairment losses on non-financial assets 355 16 33 35 Impairment losses on financial assets 5 10 - - Charge to provide for bad and doubtful debts 2,734 1,750 1,476 1,178 Depreciation and amortisation expense 645 624 329 330 Movement in life insurance policyholder liabilities 3,067 (830) - - Unrealised (gain)/loss on investments relating to life insurance business (4,003) 3,602 - - Decrease in other assets 1,473 214 842 344 Decrease in other liabilities (469) (408) (237) (442)Increase in income tax payable 234 775 249 716 Increase/(decrease) in deferred tax liabilities 380 (528) (40) (340)(Increase)/decrease in deferred tax assets (450) 90 (2) 147
Operating cash flow items not included in profit (10,103) (3,199) (6,008) 683 Investing or financing cash flows included in profit
Gain on disposal of controlled entities, before income tax - (11) - - Gain on investments classified as available for sale (19) (20) - - (Gain)/loss on disposal of property, plant, equipment and other assets (12) 16 1 10
Net cash (used in)/provided by operating activities (2,547) 9,165 237 9,197
(b) Reconciliation of cash and cash equivalents
Cash and cash equivalents comprise the net amount of short-term, highly liquid investments that are readily convertible to known amounts of cash within three months and are subject to an insignificant risk of change in value. They are held for the purposes of meeting short-term cash commitments (rather than for investment or other purposes) and include cash and liquid assets, amounts due from other banks (including securities held under reverse repurchase agreements and short-term government securities), net of amounts due to other banks.
Included within cash and liquid assets are cash and liquid assets within the Group’s life insurance business statutory funds of $2,262 million (2011: $1,184 million) which are subject to restrictions imposed under the Life Insurance Act 1995 (Cth) and other restrictions and therefore are not available for use in operating, investing or financing activities of other parts of the Group.
Cash and cash equivalents as shown in the cash flow statement is reconciled to the related items on the balance sheet as follows:
Group Company2012 2011 2012 2011
Cash and cash equivalents $m $m $m $m
AssetsCash and liquid assets 19,464 27,093 13,586 22,532 Treasury and other eligible bills 135 159 - 27 Due from other banks (excluding mandatory deposits with supervisory central banks) 44,307 45,241 32,268 35,036
Total cash and cash equivalent assets 63,906 72,493 45,854 57,595
LiabilitiesDue to other banks (27,694) (36,487) (25,775) (33,654)
Total cash and cash equivalents 36,212 36,006 20,079 23,941
(c) Non-cash financing and investing activities
Group Company2012 2011 2012 2011$m $m $m $m
New share issuesDividend reinvestment plan 1,405 1,364 1,405 1,364 Bonus share plan 51 46 51 46

2012 Annual Financial Report 115
Notes to the financial statements
38 Notes to the cash flow statement (continued)
(d) Acquisitions of controlled entities and business combinations
The following acquisitions were made during the year to September 2012:• On 1 October 2011, NWMH Sub Limited acquired 100% of the issued share capital of Antares Capital Partners Limited (Antares), formerly known
as Aviva Investors Australia Limited. Antares is an Australian equities investment management business and the acquisition enhances the Group’s offering in Australian equities to its customers. The acquisition agreement contained a provision for contingent cash consideration of up to $10 million payable depending on the position of the ASX 200 as at 1 April 2012 relative to where it was on 3 August 2011. The fair value of this contingent consideration has been assessed as $6 million as at the acquisition date and this amount was paid in April 2012; and
• On 22 June 2012, Great Western Bancorporation, Inc. acquired 100% of the issued share capital of North Central Bancshares, Inc., the holding company of First Federal Savings Bank of Iowa (First Federal), and immediately caused First Federal to be merged with and into Great Western Bank. First Federal is a community oriented depository institution and the acquisition enhances Great Western Bank’s presence in Iowa, the second largest agricultural producing state in the United States.
Goodwill arose on the acquisition of Antares as the purchase consideration included a premium for the intrinsic value in the enhanced offering to customers, and for expected synergies from combining the business into the Group. The goodwill is not expected to be deductible for tax purposes. The accounting for the Antares acquisition, which was provisionally determined as at 31 March 2012, has now been completed. No goodwill arose on the acquisition of First Federal.
Since their respective acquisition dates, the acquired entities have not contributed a material amount to the revenue and profit of the Group. If the First Federal acquisition had been effective at 1 October 2011, there would not have been a material impact on the revenue and profit of the Group for the year ended 30 September 2012.
Details of the acquisitions were as follows:
Group2012 2011$m $m
Consideration transferredCash paid 90 14 Deferred cash consideration 6 12
Total consideration transferred 96 26
Group2012 2011$m $m
Recognised amounts of identifiable assets acquired and liabilities assumedCash and liquid assets 33 8 Investments - available for sale 63 - Loans and advances (1) 306 - Property, plant and equipment 13 - Other intangible assets 16 9 Deferred tax assets 8 - Other assets 16 2 Deposits and other borrowings (369) - Provisions (18) (1)Deferred tax liabilities (4) (3)Other liabilities (9) -
Net identifiable assets and liabilities 55 15 Less: Fair value of equity interest in the acquiree held before the acquisition date includedin other assets (2) - (11)Goodwill on acquisition 41 22
Total purchase consideration 96 26
Less Deferred consideration (6) (12)Less: Cash and cash equivalents acquired (33) (8)
Net cash outflow 57 6
(1) At the date of the First Federal acquisition, loans and advances has gross contractual amounts receivable of $306 million and the best estimate of the contractual cash flows not expected to be collected was $7 million.
(2) There was nil gain or loss recognised as a result of remeasuring to fair value the equity interest in the acquiree held before the business combination.
(e) Loss of control of controlled entities
Group2012 2011$m $m
Net assets - - Gain on disposal recognised in other operating income - 11
Cash consideration received - 11 Less: Cash and cash equivalents disposed - -
Net cash inflow from sale of controlled entities - 11

116 NATIONAL AUSTRALIA BANK
Notes to the financial statements
39 Particulars in relation to controlled entities
The following table presents the material controlled entities of the Group as at 30 September 2012 and 30 September 2011. Investment vehicles holding life policyholder assets are excluded from the list below.
Entity name Ownership % Incorporated/formed in
National Australia Bank Limited AustraliaNational Equities Limited (1) 100 Australia
National Americas Holdings LLC 100 United States of AmericaGreat Western Bancorporation Inc 100 United States of America
National Australia Group (NZ) Limited 100 New ZealandBank of New Zealand 100 New Zealand
BNZ International Funding Limited 100 New ZealandNational Australia Group Europe Limited 100 England
Clydesdale Bank PLC 100 ScotlandNational Wealth Management Holdings Limited 100 Australia
National Australia Financial Management Limited 100 AustraliaMLC Holdings Limited 100 Australia
MLC Lifetime Company Limited 100 AustraliaMLC Investments Limited 100 AustraliaMLC Limited 100 Australia
National Australia Trustees Limited 100 AustraliaNational Australia Group Services Limited 100 AustraliaNBA Properties Limited (1) 100 AustraliaNational Australia Corporate Services Limited (1) 100 AustraliaARDB Limited (1) 100 Australia
National HK Investments Limited 100 Hong KongNational Australia Finance (Asia) Limited 100 Hong Kong
(1) These controlled entities and C.B.C. Holdings Limited, C.B.C. Properties Limited and NAB Properties Australia Limited have entered into a deed of cross guarantee (refer to Note 40(c) for details) with the Company and National Australia Trustees Limited as trustees pursuant to ASIC Class Order 98/1418 dated 13 August 1998. These controlled entities and the Company form a closed group (a closed group is defined as a group of entities comprising a holding entity and its related wholly owned entities). Relief was granted to these controlled entities from the Corporations Act 2001 (Cth) requirements for preparation, audit and publication of an annual financial report.
Section 323D(3) of the Corporations Act 2001 (Cth) requires the Company to ensure that its controlled entities have the same financial year as the Company. Pursuant to Australian Securities and Investments Commission (ASIC) instrument 06/480 dated 5 June 2006, the Company is relieved from this requirement in respect of certain registered managed investment schemes of which MLC Investments Limited is the responsible entity. Each scheme prepares an audited financial report following its year end in accordance with its constituent document.
In addition, pursuant to ASIC instrument 12-1140 dated 21 September 2012, the Company is relieved from this requirement in respect of certain securitisation special purpose entities (Customer Trusts) to which the Group provides liquidity facilities and which are consolidated by the Company. With respect to each Customer Trust, relief is granted until either 30 September 2012, 30 September 2014 or 30 September 2015.

2012 Annual Financial Report 117
Notes to the financial statements
40 Contingent liabilities and credit commitments
(a) Financial assets pledged
Financial assets are pledged as collateral predominantly under repurchase agreements with other banks. The financial assets pledged by the Group are strictly for the purpose of providing collateral for the counterparty. These transactions are conducted under terms that are usual and customary to standard lending and securities borrowing and lending activities, as well as requirements determined by exchanges where the Group acts as an intermediary. Repurchase agreements that do not qualify for derecognition are reported in Note 43.
(b) Contingent liabilities
The Group’s exposure to potential loss in the event of non-performance by a counterparty in respect of commitments to extend credit, letters of credit and financial guarantees written is represented by the contractual notional principal amount of those instruments less any amounts that may be recovered under recourse provisions. The Group uses the same credit policies and assessment criteria in making commitments and conditional obligations for off-balance sheet risks as it does for on-balance sheet loan assets.
The following table shows details of the notional amount of contingent liabilities as at 30 September: Group Company
2012 2011 2012 2011$m $m $m $m
Contingent liabilitiesBank guarantees 4,724 4,824 6,107 6,690 Standby letters of credit 2,068 2,084 2,068 2,084
Documentary letters of credit 624 955 312 635 Performance-related contingencies 5,006 4,175 4,414 3,546
Total contingent liabilities 12,422 12,038 12,901 12,955
(i) Guarantees
The Group provides guarantees in its normal course of business on behalf of its customers. Guarantees written are conditional commitments issued by the Group to guarantee the performance of a customer to a third party. Guarantees are primarily issued to support direct financial obligations such as commercial bills or other debt instruments issued by a counterparty. It is the credit rating of the Group as a guarantee provider that enhances the marketability of the paper issued by the counterparty in these circumstances. Guarantees are also provided on behalf of counterparties as performance bonds and ongoing obligations to government entities. The Group has four principal types of guarantees:• bank guarantees – a financial guarantee that is an agreement by which the Group agrees to pay an amount of money on demand on behalf of a
customer to a third party during the life of the guarantee;• standby letters of credit – an obligation of the Group on behalf of a customer to make payment to a third party in the event that the customer fails to
meet an outstanding financial obligation;• documentary letters of credit – a guarantee that is established to indemnify exporters and importers in their trade transactions where the Group
agrees to make certain trade payments on behalf of a specified customer under specific conditions; and • performance-related contingencies – a guarantee given by the Group that undertakes to pay a sum of money to a third party where the customer
fails to carry out certain terms and conditions of a contract.
The credit risk involved in issuing guarantees is essentially the same as that involved in extending loan facilities to customers. Apart from the normal documentation for a facility of this type, the customer must also provide the Group with a written indemnity, undertaking that, in the event the Group is called upon to pay, the Group will be fully reimbursed by the customer.
(ii) Clearing and settlement obligations
The Company is subject to a commitment in accordance with the rules governing clearing and settlement arrangements contained in the Australian Payments Clearing Association Limited Regulations for the Australian Paper Clearing System, the Bulk Electronic Clearing System, the Consumer Electronic Clearing System and the High Value Clearing System which could result in a credit risk exposure and loss in the event of a failure to settle by a member institution. The Company also has a commitment in accordance with the Austraclear System Regulations and the Continuous Linked Settlement Bank Rules to participate in loss-sharing arrangements in the event that another financial institution fails to settle.

118 NATIONAL AUSTRALIA BANK
Notes to the financial statements
40 Contingent liabilities and credit commitments (continued)
(iii) Inter-bank deposit agreement
The Company is a party to an inter-bank deposit agreement between the four major Australian banks. Each participant, including the Company, has a maximum commitment to provide a deposit of an amount of up to $2,000 million, for a period of 30 days, to any other participant experiencing liquidity problems. Repayment of the deposit by the recipient bank may be by cash or by transfer of mortgages securing eligible housing loans to the value of the deposit. The agreement is certified by the Australian Prudential Regulation Authority as an industry support contract under section 11CB of the Banking Act 1959 (Cth).
(iv) Legal proceedings
Entities within the Group are defendants from time to time in legal proceedings arising from the conduct of their business.
There are contingent liabilities in respect of claims, potential claims and court proceedings against entities of the Group. Where appropriate, provisions have been made. The aggregate of potential liability in respect thereof cannot be accurately assessed.
(v) Contingent liability – Class action / Potential class action
On 18 November 2010, Pathway Investments Pty Ltd and Another commenced a class action proceeding against the Group in the Supreme Court of Victoria in relation to the Group’s disclosure about exposures to certain Collateralised Debt Obligations (CDOs). On 9 November 2012, the Group reached an agreement to settle the class action without admission of liability by the Group. The settlement involves a payment of $85 million plus an allowance in respect of interest and costs in full and final settlement of the class action, of which $50 million is comprised of available insurance proceeds with the remainder substantially covered by existing provisions. The settlement of the proceedings is subject to approval of the Supreme Court of Victoria.
On 16 December 2011 Steven Farey and Others commenced a class action proceeding against the Group in relation to the payment of exception fees, along with similar proceedings against several other financial institutions. The quantum of the claim against the Group has not yet been identified in the proceeding. The Group has not been required to file a defence as the proceeding has been stayed until 7 December 2012. The proceeding will be vigorously defended.
(vi) Contingent liability - United Kingdom Financial Services Compensation Scheme
The United Kingdom (UK) Financial Services Compensation Scheme (FSCS) provides compensation to depositors in the event that a financial institution is unable to repay amounts due. Following the failure of a number of financial institutions in the UK, claims have been triggered against the FSCS, initially to pay interest on borrowings which the FSCS has raised from the UK Government to support the protected deposits. The principal of these borrowings is anticipated to be repaid from the realisation of the assets of the institutions. The FSCS has estimated levies due to 31 March 2013 and an accrual of $12 million (GBP8 million) is held for the Group’s calculated liability. The ultimate FSCS levy as a result of the failures is uncertain.
(vii) Claims for potential mis-selling of Payment Protection Insurance
Market wide issues relating to the UK banking industry payment protection insurance (PPI) matter are ongoing. A provision of $168 million (GBP108 million) is held for this matter. The provision reflects an assessment of future PPI claims based upon estimates, statistical analysis and assumptions in relation to a wide range of factors that remain uncertain, including how many PPI claims will be made against Clydesdale Bank PLC, for what value, and the prospects of mis-selling being established in relation to those claims. The final amount required to settle the potential liability is therefore uncertain. The Group continues to keep the matter under review.
(viii) Review and redress of sales of certain interest rate hedging products
On 29 June 2012 the UK Financial Services Authority (FSA) announced that it had reached agreement with a number of UK banks in relation to a review and redress exercise on sales of certain interest rate derivative products to small and medium businesses. Clydesdale Bank PLC agreed to participate in this exercise, as announced by the FSA on 23 July 2012, and has embarked on a program to identify small and medium sized customers that may have been affected. The exercise voluntarily incorporates certain of the Group’s tailored business loan products as well as the standalone hedging products identified in the FSA’s notice. The total cost of this exercise is uncertain. A provision of $75 million (GBP48 million) for customer redress, including the interest rate derivative products review, is held and reflects management’s best estimate of the probable outflow of funds as at 30 September 2012.
(c) Credit-related commitments
Binding commitments to extend credit are agreements to lend to a customer so long as there is no violation of any condition established in the contract. Commitments generally have fixed expiration dates or other termination clauses and may require payment of a fee by the customer. Since many of the commitments are expected to expire without being drawn down, the total commitment amounts do not necessarily represent future cash requirements.
Refer to Note 17 for a description of collateral held as security and other credit enhancements.

2012 Annual Financial Report 119
Notes to the financial statements
40 Contingent liabilities and credit commitments (continued)
The following tables show details of the notional amount of credit-related commitments as at 30 September: Group Company
2012 2011 2012 2011$m $m $m $m
Credit-related commitmentsUnderwriting facilities 62 61 62 61 Binding credit commitments 116,054 114,786 90,214 87,410
Total credit-related commitments 116,116 114,847 90,276 87,471
The following table shows the geographical concentrations of credit-related commitments as at 30 September:
Group Company2012 2011 2012 2011
$m $m $m $m
Australia 85,016 82,383 85,016 82,383
Europe 16,652 18,640 2,835 2,188 New Zealand 11,305 10,292 - - United States 2,592 2,527 1,874 1,895 Asia 551 1,005 551 1,005
Total 116,116 114,847 90,276 87,471
(d) Parent entity guarantee and undertakings
The Company has provided the following guarantees and undertakings relating to entities in the Group. These guarantees and undertakings are not included in previous tables in the note.• commercial paper issued by National Australia Funding (Delaware) Inc. of $7,199 million (2011: $9,216 million), of which up to $19,120 million of
issuances will be guaranteed by the Company; • the Company will indemnify each customer of National Nominees Limited against any loss suffered by reason of National Nominees Limited failing
to perform any obligation undertaken by it to a customer;• the Company has agreed to provide a guarantee and indemnity with respect to the obligations of NAB Properties (Australia) Limited under the
leases and car park licences of the Group’s premises at 800 and 808 Bourke Street, Docklands, Victoria, Australia;• the Company and National Wealth Management Services Limited (NWMSL) have been granted licences by the Safety, Rehabilitation and
Compensation Commission (the Commission) to operate as self-insurers under the Commonwealth Government Comcare Scheme. Under these arrangements, the Company has agreed that in the event it is proposed that NWMSL no longer continue as a wholly owned controlled entity of the Company, the Company will provide the Commission with a guarantee of the then current workers’ compensation liabilities of NWMSL;
• the Company has provided a guarantee of the obligations of National Australia Group Services Limited pursuant to the sale agreement relating to the sale of the Custom Fleet business. The primary ongoing obligations of these companies under the sale agreement relate to warranties and indemnities to the buyers consistent with agreements of this nature;
• the Company has guaranteed certain sponsor funding commitments of nabInvest Capital Partners Pty Limited associated with the Group’s non-controlling interests in certain fund managers;
• the Company has issued letters of support in respect of certain subsidiaries in the normal course of business. The letters recognise that the Company has a responsibility to ensure that those subsidiaries continue to meet their obligations; and
• pursuant to Australian Securities and Investment Commission Class Order 98/1418 dated 13 August 1998, relief was granted to certain controlled entities (Note 39, footnote (1)) from the Corporations Act 2001 (Cth) requirements for preparation, audit and publication of annual financial reports. It is a condition of the Class Order that the Company and each of the controlled entities enter into a deed of cross guarantee. The effect of the deed is that the Company guarantees to each creditor payment in full of any debt in the event of winding-up of any of the controlled entities under certain provisions of the Corporations Act 2001 (Cth). If a winding-up occurs under other provisions of the Corporations Act 2001 (Cth), the Company will only be liable in the event that after six months any creditor has not been paid in full. The controlled entities have also given similar guarantees in the event that the Company is wound up.

120 NATIONAL AUSTRALIA BANK
Notes to the financial statements
40 Contingent liabilities and credit commitments (continued)
Closed group
The tables below presents the consolidated proforma income statement and balance sheet for the Company and controlled entities which are party to the deed of cross guarantee (referred to as a closed group).
The effects of transactions between entities to the deed are eliminated in full in the consolidated proforma income statement and balance sheet
2012 2011$m $m
Pro forma income statementFor the year ended 30 September Profit before income tax expense 6,689 6,159 Income tax expense (1,702) (1,306)
Net profit for the year 4,987 4,853
Pro forma balance sheetAs at 30 September
AssetsCash and liquid assets 13,592 22,547 Due from other banks 35,322 36,853 Trading derivatives 41,378 47,045 Trading securities 25,741 31,513 Investments - available for sale 25,625 14,533 Investments - held to maturity 5,455 6,249 Other financial assets at fair value 38,737 26,765 Hedging derivatives 3,177 3,051 Loans and advances 308,728 294,171 Due from customers on acceptances 36,946 43,006 Current tax assets 6 - Property, plant and equipment 1,310 1,293 Investments in controlled entities 18,632 17,527 Goodwill and other intangible assets 1,018 760 Deferred tax assets 1,831 1,647 Other assets 63,463 58,966
Total assets 620,961 605,926
LiabilitiesDue to other banks 26,169 35,902 Trading derivatives 43,639 45,749 Other financial liabilities at fair value 4,675 3,444 Hedging derivatives 5,921 4,317 Deposits and other borrowings 336,355 317,156 Liability on acceptances 7,790 10,622 Current tax liabilities 728 557 Provisions 906 939 Bonds, notes and subordinated debt 94,677 89,648 Other debt issues 1,288 1,939 Deferred tax liabilities 178 46 Other liabilities 53,897 54,115
Total liabilities 576,223 564,434
Net assets 44,738 41,492
EquityContributed equity 26,039 23,776 Reserves 558 760 Retained profits 18,141 16,956
Total equity (parent entity interest) 44,738 41,492
Total equity 44,738 41,492

2012 Annual Financial Report 121
Notes to the financial statements
41 Financial risk management
The Group is a major participant in the banking and financial services industry. The financial risks associated with these activities are a significant component of the Group’s overall risk exposure. The key financial risks faced by the Group are:• credit risk;• market risk - trading;• market risk - non-trading / banking positions;• market risk - Wealth Management; and• liquidity risk.
Further details regarding the nature and extent of each key financial risk faced by the Group, and how these are risks are managed, are outlined as part of this note. Financial risks are managed and overseen as part of the Group’s broader risk management framework and governance processes as follows:
Board Governance
The Group’s corporate governance provides a framework for effective decision making in all areas of the Group through the following practices:• strategic and operational planning;• risk management and compliance;• financial management and external reporting; and• succession planning and culture.
The Board is assisted in discharging its duties through its committees including the Principal Board Risk Committee (PBRC) which supports the framework for risk and capital management in the Group through:• oversight of the risk profile and risk management of the Group within the context of the Board determined risk appetite;• making recommendations to the Board concerning the Group’s risk appetite and particular risks or risk management practices;• reviewing management’s plans for mitigation of material risks faced by the Group;• oversight of the implementation and review of risk management and internal compliance and control systems throughout the Group; and• promotion of awareness of a risk-based culture and the achievement of a balance between risk and return for risks accepted.
Executive Governance
At an executive level, risk is overseen by the Group Chief Executive Officer through the Group Risk Return Management Committee (GRRMC) which leads management in respect of risk matters relating to culture, integrated governance processes, risk strategy and performance.
GRRMC is supported by sub-committees which provide oversight of strategy, risk/return and performance of specific risks as follows:• Group Asset & Liability Committee (GALCO): balance sheet structure;• Group Credit Risk Committee (GCRC): credit portfolio; and• Group Capital Committee (GCC): regulatory and economic capital.
GCRC is further supported by two sub-committees which provide specialist advice, support and decision making in areas requiring deep subject matter experience and expertise as follows: • Transactional Credit Committee (TCC): significant credit facility approvals; and• Group Credit Model Approval Committee (GCMAC): credit model frameworks and methodology.
Individual businesses have risk management committees comprising senior business unit executives. Their role is to provide management focus on specific risk issues prevalent within their business.
Risk management
Risk is identified and managed as part of an enterprise Group-wide risk management framework that starts with the Board approved Strategy, Risk Appetite, Capital, Funding and Operational Plans. Risk Appetite is translated and cascaded to the businesses qualitatively (through the Group’s risk postures, policies, standards and operating procedures) and quantitatively (through the Group’s risk limits, settings and decision making authorities).
Further details of risk accountabilities across the Group are disclosed in the Corporate Governance section of the Group’s website at www.nabgroup.com.
The key financial risks faced by the Group are set out in detail in this note.

122 NATIONAL AUSTRALIA BANK
Notes to the financial statements
41 Financial risk management (continued)
Credit risk
Credit is any transaction that creates an actual or potential obligation for a counterparty or customer to pay the Group. Credit risk is the potential that a counterparty or customer will fail to meet its obligations to the Group in accordance with agreed terms. Bank lending activities account for most of the Group’s credit risk, however other sources of credit risk also exist throughout the activities of the Group. These activities include the banking book, the trading book, and other financial instruments and loans (including, but not limited to, acceptances, placements, inter-bank transactions, trade financing, foreign exchange transactions, swaps, bonds and options), as well as in the extension of commitments and guarantees and the settlement of transactions.
The Group structures the levels of credit risk it undertakes by placing limits on the amount of risk accepted in relation to existing or potential counterparties or customers, groups of related counterparties or groups of related customers, and to geographical and industry segments. Such risks are monitored on a revolving basis and are subject to an annual or more frequent review.
Exposure to credit risk is managed through regular analysis of the ability of existing or potential counterparties, customers, groups of related counterparties or groups of related customers to meet interest and capital repayment obligations and by changing these lending limits where appropriate. Exposure to credit risk is also managed in part by obtaining collateral and corporate and personal guarantees.
(a) Derivatives
At any one time, the maximum exposure to credit risk is limited to the current fair value of instruments that are favourable to the Group less collateral obtained. This credit risk exposure is managed as part of the overall lending limits with customers, together with potential exposures from market movements.
The Group uses documentation including International Swaps and Derivatives Association (ISDA) Master Agreements to document derivative activities. Under the ISDA Master Agreements, if a default of counterparty occurs, all contracts with the counterparty are terminated. They are then settled on a net basis at market levels current at the time of default. The Group also executes Credit Support Annexes in conjunction with ISDA Master Agreements.
(b) Master netting arrangements
The Group further restricts its exposure to credit losses by entering into master netting arrangements with counterparties with which it undertakes a significant volume of transactions. Master netting arrangements do not generally result in an offset of balance sheet assets and liabilities, as transactions are usually settled on a gross basis. However, the credit risk associated with favourable contracts is reduced by a master netting arrangement to the extent that if a counterparty failed to meet its obligations in accordance with agreed terms, all amounts with the counterparty are terminated and settled on a net basis.
(c) Credit-related commitments
Credit-related commitments are facilities where the Group is under a legal obligation to extend credit unless some event occurs, which gives the Group the right, in terms of the commitment letter of offer or other documentation, to withdraw or suspend the facilities. Guarantees and standby letters of credit, which represent irrevocable assurances that the Group will make payments in the event that a customer cannot meet its obligations to third parties, carry the same credit risk as loans.
Documentary and commercial letters of credit, which are written undertakings by the Group on behalf of a customer authorising a third party to draw drafts on the Group up to a stipulated amount under specific terms and conditions, are collateralised by the underlying shipments of goods to which they relate and therefore carry less risk than a direct unsecured borrowing.
Commitments to extend credit represent unused portions of authorisations to extend credit in the form of loans, guarantees or letters of credit. With respect to credit risk on commitments to extend credit, the Group is potentially exposed to loss of an amount equal to the total unused commitments. However, the likely amount of loss is generally less than the total unused commitments, as most commitments to extend credit are contingent upon customers maintaining specific credit standards. The Group monitors the term to maturity of credit commitments because longer term commitments generally have a greater degree of credit risk than shorter term commitments.
(d) Collateral and other credit enhancements obtained
In general, the Group does not take possession of collateral it holds as security or call on other credit enhancements that would result in recognition of an asset on its balance sheet. It is the Group’s policy to dispose of the repossessed assets in an orderly fashion.
Real estate assets obtained by the Group from assuming ownership or foreclosing on the settlement of debt (referred to as ‘other real estate owned’ assets) in the year ended 30 September 2012 and held at the reporting date, have a carrying amount of $32 million (2011: $48 million).
As at 30 September 2012 the Group’s other real estate owned assets are located in the United States and have a carrying amount of $66 million (2011: $102 million). Of this amount, $42 million (2011: $85 million) is covered by loss sharing agreements with the Federal Deposit Insurance Corporation (FDIC), where the FDIC will absorb 80% of any losses arising from recovery of these assets. Other real estate owned assets are included in other assets and are not included in impaired assets.

2012 Annual Financial Report 123
Notes to the financial statements
41 Financial risk management (continued)
Maximum exposure to credit risk
The table below shows the maximum exposure to credit risk for recognised and unrecognised financial instruments. The maximum exposure is shown gross before both the effect of mitigation through use of master netting and collateral arrangements. The extent to which collateral and other credit enhancements have on mitigating the maximum exposure to credit risk are described in the footnotes to the table.
For financial assets recognised on the balance sheet, the gross exposure to credit risk equals their carrying amount.
For financial guarantees granted, the maximum exposure to credit risk is the maximum amount that the Group would have to pay if the guarantees are called upon. For loan commitments and other credit related commitments that are irrevocable over the life of the respective facilities, the maximum exposure to credit risk is the full amount of the committed facilities.
Group Company2012 2011 2012 2011
Footnote $m $m $m $m
Cash and liquid assets (a) 14,485 22,608 12,751 21,419 Due from other banks (b) 47,410 47,106 35,322 36,853 Trading derivatives (c) 40,899 48,466 41,680 47,353 Trading securities (d) 28,614 34,628 25,741 31,513 Investments - available for sale (d) 28,985 18,045 25,605 14,516 Investments - held to maturity (d) 9,762 12,787 5,533 6,249 Investments relating to life insurance business (f) 68,414 63,920 - - Other financial assets at fair value (e) 64,027 51,756 38,737 26,765 Hedging derivatives (c) 3,615 4,108 3,177 3,051 Loans and advances (e) 400,873 388,636 313,176 299,163 Due from customers on acceptances (e) 36,957 43,017 36,946 43,006 Due from controlled entities (g) - - 57,523 53,597 Other assets (g) 3,999 6,035 3,161 4,272
Total 748,040 741,112 599,352 587,757
Contingent liabilities (h) 12,422 12,038 12,901 12,955 Credit-related commitments (i) 116,116 114,847 90,276 87,471
Total 128,538 126,885 103,177 100,426
Total credit risk exposure 876,578 867,997 702,529 688,183
a) The balance of Cash and liquid assets which is exposed to credit risk is comprised primarily of securities borrowing agreements and reverse repurchase agreements. These are collateralised with highly liquid securities and the collateral is in excess of the borrowed or loaned amount. The fair value of the securities pledged as collateral by the counterparty under these agreements is disclosed in Note 9.
b) The balance of Due from other banks which is exposed to credit risk is comprised primarily of securities borrowing agreements and reverse repurchase agreements, as well as balances held with central supervisory banks and other interest bearing assets. Securities borrowing agreements and reverse repurchase agreements are collateralised with highly liquid securities and the collateral is in excess of the borrowed or loaned amount. The fair value of the securities pledged as collateral by the counterparty under these agreements is disclosed in Note 9.
Balances held with central supervisory banks and other interest bearing assets that are due from other banks are managed based on the counterparties creditworthiness. The Group will utilise master netting arrangements where possible to reduce its exposure to credit risk. Details on the credit grading of Due from other banks balances held by the Group is disclosed in the Credit quality table.
c) Credit risk from over-the-counter Trading and hedging derivatives is mitigated where possible through netting arrangements whereby derivative assets and liabilities with the same counterparty can be offset in certain circumstances.
Collateral is obtained against derivative assets, depending on the creditworthiness of the counterparty and/or the nature of the transaction.
d) Trading securities, Investments available for sale and Investments held to maturity are generally comprised of similar financial instruments being Government and Corporate bonds and notes. The amount of collateral held against such instruments will depend on the counterparty and the nature of the specific financial instrument.
The Group may utilise Credit Default Swaps (CDS), guarantees provided by central banks, other forms of credit enhancements or collateral in order to minimise the Group’s exposure to credit risk. The credit grading of Investments available for sale and Investments held to maturity are disclosed in the Credit quality table.
e) Other financial assets at fair value, Loans and advances and Due from customers on acceptances, mainly comprise general lending and line of credit products. The distinction in classification reflects the type of lending product or is due to an accounting designation. These lending and line of credit products will generally have a significant level of collateralisation depending on the nature of the product.

124 NATIONAL AUSTRALIA BANK
Notes to the financial statements
41 Financial risk management (continued)
Non-retail lending
Other lending to non-retail customers may be provided on an unsecured basis or secured (partially or fully) by acceptable collateral defined in specific Group credit policy and business unit procedures. Collateral is generally comprised of business assets, inventories and in some cases personal assets of the borrower. The Group manages its exposure to these products by completing a credit evaluation to assess the customer’s character, industry, business model and capacity to meet their commitments without distress. Collateral provides a secondary source of repayment for funds advanced in the event that a customer cannot meet their contractual repayment obligations. For amounts due from customers on acceptance the Group generally has recourse to guarantees, underlying inventories or other assets in the event of default which significantly mitigates the credit risk associated with accepting the customer’s credit facility with a third party.
Retail lending
Housing loans are secured against residential property as collateral, and where applicable, Lenders Mortgage Insurance (LMI) is obtained by the Group (mostly in Australia) in order to cover any shortfall in outstanding loan principal and accrued interest. LMI is generally obtained for residential mortgages with a Loan to Valuation Ratio (LVR) in excess of 80%. The financial effect of these measures is that remaining credit risk on residential mortgage loans is minimal. Other retail lending products are mostly unsecured (e.g. credit card outstandings and other personal lending).
f) Investments relating to life insurance business consist of $51,347 million (2011: $49,436 million) of investment assets linked to policyholder liabilities, $4,521 million (2011: $4,525 million) of assets not linked to policyholder liabilities, and $12,546 million (2011: $9,959 million) of assets within managed investment schemes that are controlled by the Group’s life insurance statutory funds that relate to external interests in the units of those managed investment schemes (External unitholders’ liability).
Credit and market risk is borne by policyholders and external unitholders’ in respect of investment assets linked to policyholder liabilities and external interests in the units of consolidated managed investment schemes respectively.
Investments not linked to policyholder liabilities consist of $2,456 million (2011: $2,485 million) of debt securities, which expose the Group to credit risk, and $2,065 million (2011: $2,040 million) of other investments, such as equity securities and units held in managed investment schemes. Minimal collateral or other credit enhancements are held in respect of these debt securities, however, the Group has the ability (at its discretion) to adjust the non-guaranteed bonuses and interest credits of $467 million (2011: $392 million) to absorb any credit losses that may occur.
g) The balance of Other assets which is exposed to credit risk is primarily comprised of interest receivable accruals and other receivables. Interest receivable accruals are subject to the same collateral as the underlying borrowings. Other receivables will mostly be unsecured. There are typically no collateral or other credit enhancements obtained in respect of amounts Due from controlled entities.
h) Contingent liabilities are comprised mainly of guarantees to customers, and to controlled entities of the Group under the deed of cross guarantee, standby or documentary letters of credit and performance related contingencies. The Group will typically have recourse to specific assets pledged as collateral in the event of a default by a party for which the Group has guaranteed its obligations to a third party.
i) Credit-related commitments are comprised mainly of irrevocable credit commitments to lend to a customer provided there is no breach of any condition established in the contract. If such credit commitments are drawn down by the customer there will typically be specific collateral requirements that will need to be satisfied by the customer in order to access the credit facilities.
Credit quality of financial assets
The Group has an internally developed credit rating system that uses data drawn from a number of sources to assess the potential risk in lending or through providing other financial services products to counterparties or customers. For loans and advances, the Group has a single common master-scale across all, retail and non-retail, counterparties for probability of default. The probability of default master-scale can be broadly mapped to external rating agencies and has performing (pre-default) and non-performing (post-default) grades. Impaired assets consist of: retail loans (excluding unsecured portfolio managed facilities) which are contractually past due 90 days with security insufficient to cover principal and arrears of interest revenue; non-retail loans which are contractually past due 90 days and there is sufficient doubt about the ultimate collectibility of principal and interest; and impaired off-balance sheet credit exposures where current circumstances indicate that losses may be incurred. Unsecured portfolio managed facilities are classified as impaired when they become 180 days past due (if not written off).
Financial assets neither past due nor impaired
The credit quality of the portfolio of financial assets that are neither past due nor impaired can be assessed by reference to the Group’s standard credit rating. The credit rating system is supported by a variety of financial analytics, combined with processed market information to provide the main inputs for the measurement of counterparty/customer risk. All internal risk ratings are tailored to the various categories and are derived in accordance with the Group’s rating policy.
The tables below represent an analysis of the credit quality of financial assets that are neither past due nor impaired, based on the following grades:• Senior investment grade: broadly corresponds with Standard & Poor’s ratings of AAA to A-;• Investment grade: broadly corresponds with Standard & Poor’s ratings of BBB+ to BBB-; and• Sub-investment grade: broadly corresponds with Standard & Poor’s ratings of BB+ or worse.

2012 Annual Financial Report 125
Notes to the financial statements
41 Financial risk management (continued)
Group CompanyLoan and advances
Non-retailLoan and advances
RetailLoan and advances
Non-retailLoan and advances
Retail2012 2011 2012 2011 2012 2011 2012 2011
$m $m $m $m $m $m $m $m
Senior investment grade 39,741 40,874 234,165 221,186 25,698 31,157 184,799 173,081 Investment grade 46,051 44,366 25,535 23,833 38,374 32,330 22,206 20,365 Sub-investment grade 24,908 29,382 11,953 11,337 19,081 20,581 9,539 8,471
Total 110,700 114,622 271,653 256,356 83,153 84,068 216,544 201,917
Due from other banksInvestments
- HTMInvestments
- AFS (1) Acceptances2012 2011 2012 2011 2012 2011 2012 2011
Group $m $m $m $m $m $m $m $m
Senior investment grade 42,763 42,868 7,910 9,473 28,439 17,637 8,087 8,489 Investment grade 4,527 2,917 1,430 2,603 279 251 21,107 23,611 Sub-investment grade 120 1,321 233 - 15 49 7,763 10,917
Total 47,410 47,106 9,573 12,076 28,733 17,937 36,957 43,017
Due from other banksInvestments
- HTMInvestments
- AFS (1) Acceptances2012 2011 2012 2011 2012 2011 2012 2011
Company $m $m $m $m $m $m $m $m
Senior investment grade 30,685 32,631 5,174 5,444 25,263 14,286 8,086 8,485 Investment grade 4,517 2,901 248 687 185 127 21,104 23,604 Sub-investment grade 120 1,321 111 - 1 13 7,756 10,917
Total 35,322 36,853 5,533 6,131 25,449 14,426 36,946 43,006
(1) Investments - available for sale excluding equity investments.
Risk concentrations
Concentration of risk is managed by counterparty, by industry sector and geographical region.
Counterparty concentration
Concentration of risk to a counterparty or groups of related counterparties is monitored in accordance with APS 221 “Large Exposures”, including the establishment of policies governing large exposures, implementation of appropriate limits and regular monitoring and reporting against those limits.
Industry concentration of financial assets
The following tables show the level of industry concentrations of financial assets as at 30 September:
Loans at fair value
Loans at amortised cost
Provisions for doubtful debts
Contingent liabilities and credit-related commitments
2012 2011 2012 2011 2012 2011 2012 2011Group $m $m $m $m $m $m $m $m
Government and public authorities 1,287 1,129 876 861 3 3 1,887 2,088 Agriculture, forestry, fishing and mining 17,995 13,814 11,408 11,070 237 260 9,775 9,586 Financial, investment and insurance 1,926 1,460 14,105 14,912 116 169 10,916 10,415 Real estate - construction 2,803 3,175 5,517 6,262 123 136 1,784 1,640 Manufacturing 3,481 2,826 6,536 7,491 252 176 8,926 8,934 Instalment loans to individuals and other
personal lending (including credit cards) 232 832 14,288 14,785 310 225 18,266 18,067 Real estate - mortgage - - 268,729 253,064 301 306 27,851 28,220 Asset and lease financing - - 14,578 15,307 135 150 586 732 Commercial property services 15,478 12,203 22,103 22,881 1,177 727 9,964 9,052 Other commercial and industrial 19,825 15,033 42,733 42,003 1,567 1,828 38,583 38,151
Total 63,027 50,472 400,873 388,636 4,221 3,980 128,538 126,885
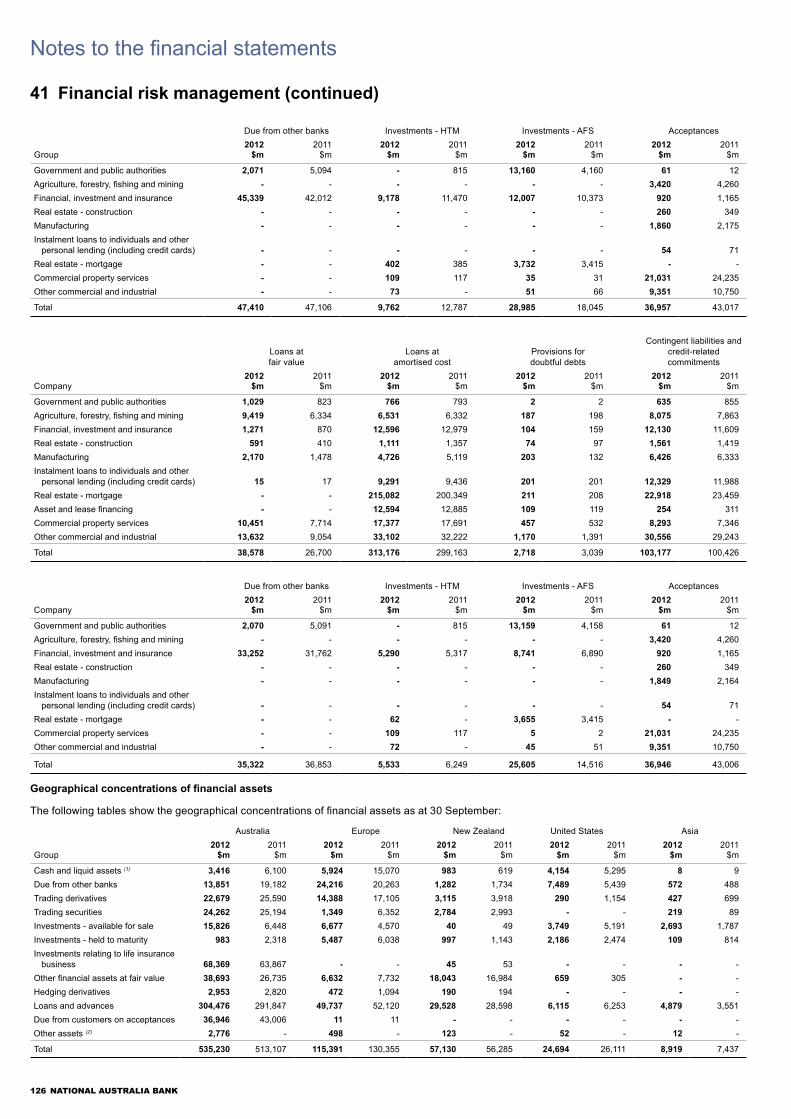
126 NATIONAL AUSTRALIA BANK
Notes to the financial statements
41 Financial risk management (continued)
Due from other banks Investments - HTM Investments - AFS Acceptances 2012 2011 2012 2011 2012 2011 2012 2011
Group $m $m $m $m $m $m $m $m
Government and public authorities 2,071 5,094 - 815 13,160 4,160 61 12 Agriculture, forestry, fishing and mining - - - - - - 3,420 4,260 Financial, investment and insurance 45,339 42,012 9,178 11,470 12,007 10,373 920 1,165 Real estate - construction - - - - - - 260 349 Manufacturing - - - - - - 1,860 2,175 Instalment loans to individuals and other
personal lending (including credit cards) - - - - - - 54 71 Real estate - mortgage - - 402 385 3,732 3,415 - - Commercial property services - - 109 117 35 31 21,031 24,235 Other commercial and industrial - - 73 - 51 66 9,351 10,750
Total 47,410 47,106 9,762 12,787 28,985 18,045 36,957 43,017
Loans at fair value
Loans at amortised cost
Provisions for doubtful debts
Contingent liabilities and credit-related commitments
2012 2011 2012 2011 2012 2011 2012 2011Company $m $m $m $m $m $m $m $m
Government and public authorities 1,029 823 766 793 2 2 635 855 Agriculture, forestry, fishing and mining 9,419 6,334 6,531 6,332 187 198 8,075 7,863 Financial, investment and insurance 1,271 870 12,596 12,979 104 159 12,130 11,609 Real estate - construction 591 410 1,111 1,357 74 97 1,561 1,419 Manufacturing 2,170 1,478 4,726 5,119 203 132 6,426 6,333 Instalment loans to individuals and other
personal lending (including credit cards) 15 17 9,291 9,436 201 201 12,329 11,988 Real estate - mortgage - - 215,082 200,349 211 208 22,918 23,459 Asset and lease financing - - 12,594 12,885 109 119 254 311 Commercial property services 10,451 7,714 17,377 17,691 457 532 8,293 7,346 Other commercial and industrial 13,632 9,054 33,102 32,222 1,170 1,391 30,556 29,243
Total 38,578 26,700 313,176 299,163 2,718 3,039 103,177 100,426
Due from other banks Investments - HTM Investments - AFS Acceptances 2012 2011 2012 2011 2012 2011 2012 2011
Company $m $m $m $m $m $m $m $m
Government and public authorities 2,070 5,091 - 815 13,159 4,158 61 12 Agriculture, forestry, fishing and mining - - - - - - 3,420 4,260 Financial, investment and insurance 33,252 31,762 5,290 5,317 8,741 6,890 920 1,165 Real estate - construction - - - - - - 260 349 Manufacturing - - - - - - 1,849 2,164 Instalment loans to individuals and other
personal lending (including credit cards) - - - - - - 54 71 Real estate - mortgage - - 62 - 3,655 3,415 - - Commercial property services - - 109 117 5 2 21,031 24,235 Other commercial and industrial - - 72 - 45 51 9,351 10,750
Total 35,322 36,853 5,533 6,249 25,605 14,516 36,946 43,006
Geographical concentrations of financial assets
The following tables show the geographical concentrations of financial assets as at 30 September:
Australia Europe New Zealand United States Asia2012 2011 2012 2011 2012 2011 2012 2011 2012 2011
Group $m $m $m $m $m $m $m $m $m $m
Cash and liquid assets (1) 3,416 6,100 5,924 15,070 983 619 4,154 5,295 8 9 Due from other banks 13,851 19,182 24,216 20,263 1,282 1,734 7,489 5,439 572 488 Trading derivatives 22,679 25,590 14,388 17,105 3,115 3,918 290 1,154 427 699 Trading securities 24,262 25,194 1,349 6,352 2,784 2,993 - - 219 89 Investments - available for sale 15,826 6,448 6,677 4,570 40 49 3,749 5,191 2,693 1,787 Investments - held to maturity 983 2,318 5,487 6,038 997 1,143 2,186 2,474 109 814 Investments relating to life insurance
business 68,369 63,867 - - 45 53 - - - - Other financial assets at fair value 38,693 26,735 6,632 7,732 18,043 16,984 659 305 - - Hedging derivatives 2,953 2,820 472 1,094 190 194 - - - - Loans and advances 304,476 291,847 49,737 52,120 29,528 28,598 6,115 6,253 4,879 3,551 Due from customers on acceptances 36,946 43,006 11 11 - - - - - - Other assets (2) 2,776 - 498 - 123 - 52 - 12 -
Total 535,230 513,107 115,391 130,355 57,130 56,285 24,694 26,111 8,919 7,437

2012 Annual Financial Report 127
Notes to the financial statements
41 Financial risk management (continued)
Australia Europe United States Asia2012 2011 2012 2011 2012 2011 2012 2011
Company $m $m $m $m $m $m $m $m
Cash and liquid assets (1) 2,815 3,926 5,808 13,342 4,135 5,256 (7) 8 Due from other banks 13,850 19,180 13,619 12,150 7,317 5,098 536 425 Trading derivatives 24,264 27,092 16,618 18,323 366 1,235 432 703 Trading securities 24,173 25,123 1,349 6,352 - - 219 38 Investments - available for sale 15,717 6,317 5,062 2,787 2,133 3,625 2,693 1,787 Investments - held to maturity 62 279 3,801 3,942 1,559 1,214 111 814 Other financial assets at fair value 38,737 26,765 - - - - - - Hedging derivatives 2,952 2,810 225 241 - - - - Loans and advances 297,681 284,060 5,235 6,083 937 1,280 4,875 2,748 Due from customers on acceptances 36,946 43,006 - - - - - - Other assets (2) 2,688 - 104 - 13 - 12 -
Total 459,885 438,558 51,821 63,220 16,460 17,708 8,871 6,523
(1) The 30 September 2011 balance includes coins, notes and cash at bank. The 30 September 2012 equivalent balance does not include such amounts. The 30 September 2011 balance for coins, notes and cash at bank by geographical concentration is $2,830 million for Australia, $1,524 million for Europe, $98 million for New Zealand and $33 million for United States for the Group, and $1,113 million for Australia for the Company.
(2) Other assets comprise accrued interest receivable. The equivalent 30 September 2011 balance for other assets by geographical concentration is $2,904 million for Australia, $759 million for Europe, $99 million for New Zealand, $46 million for the United States and $7 million for Asia for the Group, and $2,881 million for Australia, $148 million for Europe, $8 million for the United States and $5 million for Asia for the Company.
Market risk - trading
Traded market risk is the potential for losses to arise from trading activities undertaken by the Group as a result of adverse movements in market prices. Losses can arise from a change in the value of positions in traded financial instruments due to adverse movements in market prices (for example, interest rates, foreign exchange, commodities, equities and credit spreads).
The trading activities of the Group are principally carried out by Wholesale Banking Fixed Income, Currencies & Commodities. Trading activity represents dealings that encompass both active management of market risk and supporting the Group’s client sales businesses. The types of market risk arising from these activities include interest rate, foreign exchange, commodity, equity price, credit spread and volatility risk.
Traded market risk is primarily managed and controlled using Value at Risk (VaR) which is a standard measure used in the industry, and is subject to the disciplines prescribed in the Group traded market risk policy.
Objectives and limitations of the VaR methodology
VaR is a statistical estimate of the potential loss that could arise from shifts in interest rates, currency exchange rates, option volatility, equity prices, credit spreads, commodity prices and inflation. The estimate is calculated on an entire trading portfolio basis, including both physical and derivative positions. VaR is measured at a 99% confidence interval. This means that there is a 99% chance that the loss will not exceed the VaR estimate on any given day.
VaR is predominantly calculated using historical simulation. This method involves multiple revaluations of the trading books using 550 days (approximately two years) of historical pricing shifts. The pricing data is rolled daily so as to have the most recent 550 day history of prices. The results are ranked and the loss at the 99th percentile confidence interval identified. The calculation and rate shifts used assume a one day holding period for all positions.
The Group employs other risk measures to supplement VaR, with appropriate limits to manage and control risks, and communicate the specific nature of market exposures to executive management, the Risk Committee of the Board and ultimately the Board. These supplementary measures include stress testing, stop loss, position and sensitivity limits.
The use of a VaR methodology has limitations, which include:• the historical data used to calculate VaR is not always an appropriate proxy for current market conditions. If market volatility or correlation conditions
change significantly, losses may occur more frequently and to a greater magnitude than the VaR measure suggests;• VaR methodology assumes that positions are held for one day and may underestimate losses on positions that cannot be hedged or reversed inside
that timeframe;• VaR is calculated on positions at the close of each trading day, and does not measure risk on intra-day positions; and• VaR does not describe the directional bias or size of the positions generating the risk.
VaR estimates are checked via back-testing for reasonableness and continued relevance of the model assumptions.
VaR is measured individually for foreign exchange risk, interest rate risk, volatility risk, commodities risk, credit risk and inflation risk.

128 NATIONAL AUSTRALIA BANK
Notes to the financial statements
41 Financial risk management (continued)
Value at risk for physical and derivative positions
The following table shows the Group and Company VaR for the trading portfolio, including both physical and derivative positions:
As at 30 SeptemberAverage value during
reporting periodMinimum value during
reporting period (1)Maximum value during
reporting period (1)
2012 2011 2012 2011 2012 2011 2012 2011Group $m $m $m $m $m $m $m $m
Value at risk at a 99% confidence levelForeign exchange risk 1.5 1.8 2.4 2.3 0.5 0.3 6.5 7.5 Interest rate risk 3.6 4.5 4.6 7.4 2.6 3.7 9.3 14.9 Volatility risk 0.6 0.9 0.6 1.0 0.3 0.7 1.2 1.7 Commodities risk 0.3 0.1 0.5 0.9 0.2 0.1 1.1 2.2 Credit risk 6.4 8.6 6.4 7.3 4.5 4.1 8.8 9.9 Inflation risk 0.5 0.4 0.5 0.6 0.1 0.3 0.7 1.0 Diversification benefit (5.9) (7.8) (6.3) (8.4) n/a n/a n/a n/a
Total Diversified VaR at 99% confidence interval 7.0 8.5 8.7 11.1 5.8 7.4 11.3 23.1
Other market risks (2) 1.4 n/a 1.2 n/a 0.1 n/a 2.2 n/a
Total VaR for physical and derivative positions 8.4 8.5 9.9 11.1 5.9 7.4 13.5 23.1
As at 30 SeptemberAverage value during
reporting periodMinimum value during
reporting period (1)Maximum value during
reporting period (1)
2012 2011 2012 2011 2012 2011 2012 2011Company $m $m $m $m $m $m $m $m
Value at risk at a 99% confidence levelForeign exchange risk 1.3 1.8 2.2 2.1 0.5 0.3 6.3 7.0 Interest rate risk 3.7 4.4 4.5 7.1 2.5 3.6 9.6 15.1 Volatility risk 0.6 0.9 0.6 1.0 0.3 0.7 1.2 1.7 Commodities risk 0.3 0.1 0.5 0.9 0.2 0.1 1.1 2.2 Credit risk 5.9 8.6 6.1 7.1 4.5 4.0 8.8 9.8 Inflation risk 0.5 0.4 0.5 0.6 0.1 0.3 0.7 1.0 Diversification benefit (4.2) (7.3) (5.2) (7.9) n/a n/a n/a n/a
Total Diversified VaR at 99% confidence interval 8.1 8.9 9.2 10.9 6.6 7.4 12.3 21.8
Other market risks (2) 1.4 n/a 1.2 n/a 0.1 n/a 2.2 n/a
Total VaR for physical and derivative positions 9.5 8.9 10.4 10.9 6.7 7.4 14.5 21.8
(1) The maximum/minimum by risk types are likely to occur during different days in the period. As such, the sum of these figures will not equal the total maximum/minimum VaR, which is the maximum/minimum aggregate VaR position during the period.
(2) Other market risks includes exposures to various basis risks measured individually at a portfolio level. Comparatives are not available.
Market risk - non-trading / banking positions
The Group has exposure to non-traded market risk, primarily, Interest Rate Risk in the Banking Book (IRRBB).
Interest Rate Risk in the Banking BookIRRBB is the risk that the Group’s earnings or economic value will be affected or reduced due to changes in interest rates. The sources of IRRBB are as follows:• repricing risk, arising from changes to the overall level of interest rates and inherent mismatches in the repricing term of banking book items;• yield curve risk, arising from a change in the relative level of interest rates for different tenors and changes in the slope or shape of the yield curve;• basis risk, arising from differences between the actual and expected interest margins on banking book items over the implied cost of funds of those
items; and• optionality risk, arising from the existence of stand-alone or embedded options in banking book items, to the extent that the potential for those losses
is not included in the above risk types.
IRRBB is measured, monitored, and managed from both an internal management and regulatory perspective. The risk management framework incorporates both market valuation and earnings based approaches in accordance with the Group Non-Traded Market Risk (GNTMR) policy and IRRBB guidance notes. Risk measurement techniques include VaR, Earnings at Risk (EaR), interest rate risk stress testing, repricing analysis, cash flow analysis and scenario analysis. The IRRBB regulatory capital calculation incorporates repricing, yield curve, basis, and optionality risk, embedded gains/losses and any inter-risk and/or inter-currency diversification. The IRRBB risk and control framework achieved APRA accreditation for the internal model approach under Basel II, and is used to calculate the IRRBB regulatory capital requirement.
Key features of the internal interest rate risk management model include:• historical simulation approach utilising instantaneous interest rate shocks;• static balance sheet (i.e. any new business is assumed to be matched, hedged or subject to immediate repricing);• VaR and EaR are measured on a consistent basis;• 99% confidence level;• three month holding period;

2012 Annual Financial Report 129
Notes to the financial statements
41 Financial risk management (continued)
• EaR utilises a 12 month forecast period;• eight years of business day historical data (updated daily by GNTMR);• rate changes are proportional rather than absolute (VaR only);• investment term for capital is modelled with an established benchmark term of between one and five years; and• investment term for core ‘Non-Bearing Interest’ (non-interest bearing assets and liabilities) is modelled on a behavioural basis with a term that is
consistent with sound statistical analysis.
Model parameters and assumptions are reviewed and updated on at least an annual basis by GNTMR, in consultation with Group Treasury. Material changes require the approval of the GALCO and are advised to the local regulatory authorities.
Value at risk and earnings at risk for the IRRBB
The following tables show the Group and Company aggregate VaR and EaR for the IRRBB:
2012As at 30
SeptemberAverage
valueMinimum
value Maximum
valueGroup $m $m $m $m
Value at riskAustralia Region 89.8 108.8 63.1 175.4 UK Region 60.7 74.4 60.7 88.1 New Zealand Region 18.1 18.0 10.3 31.1
United States Region 5.6 11.7 4.9 32.5
Asia Region 3.3 2.6 0.6 4.5
Earnings at riskAustralia Region 27.5 42.7 16.3 78.9 UK Region 5.7 8.8 3.8 20.1 New Zealand Region 6.0 6.5 1.9 13.3 United States Region 12.2 11.7 9.5 13.6
2011As at 30
SeptemberAverage
valueMinimum
value Maximum
valueGroup $m $m $m $m
Value at riskAustralia Region 102.4 128.5 98.9 166.2 UK Region 88.3 73.8 69.6 88.3 New Zealand Region 13.8 31.0 13.6 42.0 United States Region 40.3 14.4 4.6 40.3 Asia Region 0.9 1.7 0.6 3.1
Earnings at riskAustralia Region 54.8 51.1 6.2 71.8
UK Region 22.2 13.7 3.6 22.2
New Zealand Region 3.6 5.1 1.8 10.7 United States Region 10.9 5.1 2.0 10.9
2012As at 30
SeptemberAverage
valueMinimum
value Maximum
valueCompany $m $m $m $m
Value at risk
Australia Region 89.8 108.8 63.1 175.4 UK Region 12.8 18.6 12.8 22.9
Earnings at riskAustralia Region 27.5 42.7 16.3 78.9
2011As at 30
SeptemberAverage
valueMinimum
value Maximum
valueCompany $m $m $m $m
Value at riskAustralia Region 102.4 128.5 98.9 166.2 UK Region 22.3 25.1 18.7 28.0
Earnings at riskAustralia Region 54.8 51.1 6.2 71.8

130 NATIONAL AUSTRALIA BANK
Notes to the financial statements
41 Financial risk management (continued)
Market risk - Wealth Management
This is the potential for losses to arise from the Group’s wealth management business activities as a result of its investments being exposed to market risk. Wealth Management refers to the National Wealth Management Holdings Limited consolidated group (NWMHL) which has investment linked and non-investment linked business. For investment linked business, policyholder liabilities are directly linked to the performance of the assets held to back those liabilities. Consequently, financial risks associated with those assets do not flow through to Wealth Management. However, a decline in the performance of investments would reduce the value of funds under management which, in turn, would reduce the fee income earned from this type of business. A significant proportion of Wealth Management’s business is investment linked business. For non-investment linked business, Wealth Management is exposed to market risk. The primary financial risk on non-investment linked business is that income from the assets backing the liabilities is insufficient to fund the benefits payable. The sources of market risk are: (a) interest rate risk, (b) equity and other price risk, and (c) foreign currency risk.
(a) Interest rate risk
Interest rate risk is the risk that the fair value or future cash flows of a financial instrument will fluctuate due to changes in interest rates. Interest rate risk arises primarily from investments in fixed interest securities. In addition, to the extent that claims costs are related to interest rates, liabilities to policyholders are exposed to interest rate risk.
Wealth Management manages interest rate risk by maintaining an appropriate mix of fixed and variable rate instruments and by managing the maturity dates of interest bearing instruments. Wealth Management also enters into interest rate derivative financial instruments to manage cash flows, maximise opportunities to increase returns, and reduce risk and transaction costs. The management of risks that relate to life insurance business are also governed by the requirements of the Life Insurance Act 1995 (Cth) and APRA both of which include provisions to hold reserves against unmatched assets and liabilities.
Interest rate sensitivity analysis (1)
The following table shows the pre-tax impact of a change in interest rates as at 30 September assuming that all other variables remain constant:
Impact on profit Impact on equity2012 2011 2012 2011
$m $m $m $m
+100 basis points (51.2) (23.0) (51.2) (23.0)-100 basis points 51.6 24.3 51.6 24.3
(1) Interest rate sensitivity excludes the impact of internal hedging derivatives taken out at the NWMHL consolidated level.
(b) Equity and other price risk
Equity and other price risk is the risk that the fair value of equities and unit priced investments change as a result of changes in market prices, whether these changes are caused by factors specific to an individual investment or factors affecting all instruments, or classes of instruments, in the market.
Pricing sensitivity analysis
The following table shows the pre-tax impact of a change in equity and unit prices as at 30 September assuming that all other variables remain constant:
Impact on profit Impact on equity2012 2011 2012 2011
$m $m $m $m
10% increase 12.7 13.0 12.7 13.0 10% decrease (12.7) (13.0) (12.7) (13.0)
(c) Foreign currency risk
Foreign currency risk is the risk that the fair value or future cash flows of a financial instrument will fluctuate because of changes in foreign exchange rates. Wealth Management’s assets that directly support the policy liabilities are predominantly denominated in the same currency as its policy liabilities. Currency derivative financial instruments are entered into to facilitate efficient portfolio management by obtaining desired currency exposures or to hedge against existing holdings of certain investments in foreign currencies or significant foreign currency transactions.
Currency sensitivity analysis
The following table shows the pre-tax impact of a change in foreign exchange rates as at 30 September assuming that all other variables remain constant:
Impact on profit Impact on equity2012 2011 2012 2011
$m $m $m $m
10% increase 5.1 4.9 5.1 4.9 10% decrease (5.1) (4.9) (5.1) (4.9)

2012 Annual Financial Report 131
Notes to the financial statements
41 Financial risk management (continued)
Liquidity risk
Liquidity risk is the risk that the Group is unable to meet its financial obligations as they fall due. These obligations mostly include the repayment of deposits on demand or at their contractual maturity, the repayment of borrowings and loan capital as they mature and the payment of interest on borrowings. The liquidity associated with financial markets can be reduced substantially as a result of external economic or market events, market size or the actions of individual participants.
These risks are governed by the Group’s funding and liquidity risk appetite, the GNTMR policy and GALCO approved limits, which are set by the Board. This is managed by Group Treasury and measured and monitored by GNTMR with oversight by GALCO. The Board has the ultimate responsibility to monitor and review the adequacy of the Group’s funding and liquidity risk management framework and the Group’s compliance with risk appetite.
Key principles adopted in the Group’s approach to managing liquidity risk include:• monitoring the Group’s liquidity position on a daily basis, using a combination of contractual and behavioural modelling of balance sheet cash flow
information;• maintaining a high quality liquid asset portfolio which supports intra-day operations and can be sold in times of market stress;• operating a prudent funding strategy which ensures appropriate diversification and limits maturity concentrations. The Group undertakes a
conservative approach by imposing internal limits that are in addition to regulatory requirements;• maintaining a contingent funding plan designed to respond to an accelerated outflow of funds from the Group; and• requiring the Group to have the ability to meet a range of survival horizon scenarios, including name-specific and general liquidity stress scenarios.
The Group maintains a well diversified and high quality liquid asset portfolio to manage liquidity risk in line with these principles. The liquid asset portfolio is well diversified by currency, tenor, counterparty and product type. The composition of the portfolio includes cash, Government, State Government and highly rated investment grade paper. In addition to these liquid assets, the Group holds Internal Securitisation in the form of Residential Mortgage Backed Securities (RMBS) as a source of contingent liquidity to further support its liquidity requirements. RMBS notes must meet central bank requirements to be eligible for repurchase agreements with a central bank. The volume of securities eligible for repurchase agreements, including contingent liquidity available after the appropriate haircuts applied by the relevant central bank as at 30 September 2012 was $110,885 million (2011: $115,618 million).
Funding mix
The Group’s funding liabilities are comprised of a mix of deposits, term wholesale funding and short-term wholesale funding. The Group manages the funding mix and liquidity risk appetite to enable it to respond to changing market and regulatory conditions.
Over the year there has been growth in customer deposits, which have funded all core asset growth in the 2012 financial year and this has resulted in the reduction of short-term wholesale funding. These outcomes are consistent with the Group’s Basel III transition strategy. Customer deposits now comprise a greater proportion of total funding liabilities, increasing from 54.7% as at 30 September 2011 to 57.7% as at 30 September 2012.
The Group achieved its term funding program, raising $31,308 million of term wholesale funding in the 2012 financial year (2011: $31,632 million) at a weighted average maturity of approximately 5.1 years to first call, higher than the 2011 financial year of 4.5 years. The Group’s term wholesale funding (with a remaining term to maturity of greater than 1 year) as a percentage of total funding liabilities increased from 16.3% as at 30 September 2011 to 16.8% as at 30 September 2012.
The Group continued to access international and domestic short-term wholesale markets over the 2012 financial year. The focus has been on maintaining the longer average maturity of the short-term book to support the Group’s liquidity position. The growth in customer deposits has reduced reliance on short-term wholesale funding, with short-term funding reducing from 25.2% of funding liabilities as at 30 September 2011 to 21.6% as at 30 September 2012.

132 NATIONAL AUSTRALIA BANK
Notes to the financial statements
41 Financial risk management (continued)
The following table shows the Group’s funding position as at 30 September:
2012 2011Core assets $m $m
Gross loan and advances 400,873 388,636Loans at fair value 63,027 50,472Other financial assets at fair value 971 1,269Due from customers on acceptances 36,957 43,017Investments held to maturity 9,762 12,787Net working capital adjustments (1) - (8,027)
Total core assets 511,590 488,154
Customer deposits
On-demand and short-term deposits 152,000 145,700Term deposits 159,950 142,243Deposits not bearing interest 24,667 21,324Due to other banks (2) - 7,634Customer deposits at fair value 2,581 2,679
Total customer deposits 339,198 319,580
Wholesale funding
Bonds, notes and subordinated debt 103,372 99,768Other debt issues 1,783 2,494Preference shares and other contributed equity 4,914 4,914Certificates of deposit 68,019 75,505Due to other banks (2) 28,691 32,528Other borrowings 8,417 11,814Securities sold under repurchase agreements 6,868 6,379Liability on acceptances 7,801 10,633Other financial liabilities at fair value 19,151 21,047
Total wholesale funding 249,016 265,082
Total funding liabilities 588,214 584,662
Total equity excluding preference shares and other contributed equity 38,889 37,274Life insurance liabilities (3) 69,130 63,567Other liabilities 66,857 68,254
Total liabilities and equity 763,090 753,757
Wholesale funding by maturity
Short-term funding 126,974 147,083Term funding
less than 1 year residual maturity 23,187 22,459greater than 1 year residual maturity 98,855 95,540
Total wholesale funding by maturity 249,016 265,082
Funding liabilities
Customer deposits 57.7% 54.7%Short-term funding less than 1 year residual maturity 21.6% 25.2%Term funding
less than 1 year residual maturity 3.9% 3.8%greater than 1 year residual maturity 16.8% 16.3%
Total funding liabilities 100.0% 100.0%
(1) $5,648 million of net working capital adjustments have been removed from core assets as at 30 September 2012.(2) $1,975 million of amounts due to other banks has been reclassified from customer deposits to wholesale funding as at 30 September 2012.(3) Comprises life policy liabilities and external unitholders’ liability.

2012 Annual Financial Report 133
Notes to the financial statements
41 Financial risk management (continued)
Contractual maturity of financial liabilities on an undiscounted basis
The following tables show cash flows associated with non-derivative financial liabilities and hedging derivatives, within relevant maturity groupings based on the earliest date on which the Group and Company may be required to pay.
The balances in the tables will not necessarily agree to amounts presented on the balance sheet as amounts incorporate cash flows on an undiscounted basis and therefore include both principal and associated future interest payments.
2012
At call0 to 3
month(s)3 to 12
months 1 to 5 year(s) Over 5 yearsNo specific
maturity TotalGroup $m $m $m $m $m $m $m
Due to other banks 4,615 23,043 470 572 - - 28,700 Other financial liabilities at fair value (1) 1,727 5,261 2,964 9,346 3,265 122 22,685 Deposits 168,881 143,953 82,681 13,591 81 - 409,187 Other borrowings 2,920 9,521 2,374 450 101 - 15,366 Liability on acceptances - 7,662 264 - - - 7,926 Life investment contract liabilities (2) - 329 461 124 26 53,371 54,311 Bonds, notes and subordinated debt - 2,389 19,390 73,056 18,115 - 112,950 Other debt issues (3) - - - - - 1,783 1,783 External unitholders’ liability (4) - - - - - 12,546 12,546 Other financial liabilities 2,742 1,371 16 21 - - 4,150 Hedging derivatives- contractual amounts payable - 2,326 8,592 28,618 18,893 - 58,429 - contractual amounts receivable - (2,328) (7,252) (25,327) (16,940) - (51,847)
Total cash flow payable 180,885 193,527 109,960 100,451 23,541 67,822 676,186
Contingent liabilities 12,422 - - - - - 12,422 Credit-related commitments and investment commitments 117,256 - - - - - 117,256
Total (5) 129,678 - - - - - 129,678
2011
At call0 to 3
month(s)3 to 12
months 1 to 5 year(s) Over 5 yearsNo specific
maturity TotalGroup $m $m $m $m $m $m $m
Due to other banks 8,374 28,160 3,262 493 - - 40,289 Other financial liabilities at fair value (1) 928 7,825 5,226 7,370 4,404 178 25,931 Deposits 157,426 159,981 64,403 6,647 87 - 388,544 Other borrowings 1,824 14,543 1,301 246 282 - 18,196 Liability on acceptances - 10,581 140 - - - 10,721 Life investment contract liabilities (2) - 58 272 245 38 50,707 51,320 Bonds, notes and subordinated debt - 4,488 17,353 72,173 15,698 - 109,712 Other debt issues (3) - - - - - 2,494 2,494 External unitholders’ liability (4) - - - - - 9,959 9,959 Other financial liabilities (6) - - - - - 2,348 2,348 Hedging derivatives- contractual amounts payable - 1,787 11,594 33,982 10,570 - 57,933 - contractual amounts receivable - (1,591) (10,162) (31,614) (9,531) - (52,898)
Total cash flow payable 168,552 225,832 93,389 89,542 21,548 65,686 664,549
Contingent liabilities 12,038 - - - - - 12,038 Credit-related commitments and investment commitments 116,220 - - - - - 116,220
Total (5) 128,258 - - - - - 128,258

134 NATIONAL AUSTRALIA BANK
Notes to the financial statements
2012
At call0 to 3
month(s)3 to 12
months 1 to 5 year(s) Over 5 yearsNo specific
maturity TotalCompany $m $m $m $m $m $m $m
Due to other banks 4,244 21,555 394 - - - 26,193 Other financial liabilities at fair value (1) 1,485 111 811 1,714 399 122 4,642 Deposits 128,658 130,378 68,684 5,077 - - 332,797 Other borrowings 2,732 4,433 243 - - - 7,408 Liability on acceptances - 7,651 264 - - - 7,915 Bonds, notes and subordinated debt - 2,343 17,745 69,767 13,389 - 103,244 Other debt issues (3) - - - - - 1,288 1,288 Other financial liabilities 302 943 16 21 - - 1,282
Hedging derivatives- contractual amounts payable - 2,260 8,443 28,465 18,892 - 58,060 - contractual amounts receivable - (2,293) (7,148) (25,236) (16,940) - (51,617)
Total cash flow payable 137,421 167,381 89,452 79,808 15,740 1,410 491,212
Contingent liabilities 12,901 - - - - - 12,901 Credit-related commitments and investment commitments 90,276 - - - - - 90,276
Total (5) 103,177 - - - - - 103,177
2011
At call0 to 3
month(s)3 to 12
months 1 to 5 year(s) Over 5 yearsNo specific
maturity TotalCompany $m $m $m $m $m $m $m
Due to other banks 7,214 26,468 2,251 6 - - 35,939 Other financial liabilities at fair value (1) 681 32 110 1,559 811 178 3,371 Deposits 117,532 142,856 50,106 1,587 - - 312,081 Other borrowings 1,615 6,595 24 50 - - 8,284 Liability on acceptances - 10,570 140 - - - 10,710 Bonds, notes and subordinated debt - 2,247 14,590 69,757 12,568 - 99,162 Other debt issues (3) - - - - - 1,939 1,939 Other financial liabilities (6) - - - - - 217 217
Hedging derivatives- contractual amounts payable - 1,698 11,389 33,709 10,570 - 57,366 - contractual amounts receivable - (1,505) (9,951) (31,250) (9,531) - (52,237)
Total cash flow payable 127,042 188,961 68,659 75,418 14,418 2,334 476,832
Contingent liabilities 12,955 - - - - - 12,955 Credit-related commitments and investment commitments 87,471 - - - - - 87,471
Total (5) 100,426 - - - - - 100,426
(1) Some other financial liabilities at fair value have not been allocated by contractual maturity because they are typically held for varying periods of time.(2) Life investment contract liabilities disclosed as ‘no specific maturity’ include investment-linked contracts of $53,371 million (2011: $50,707 million). The liability to policyholders for investment-linked contracts
is linked to the performance and value of the assets that back those liabilities, and liquidity risk is borne by the policyholder based on the ability to liquidate assets that back those liabilities in a timely manner to meet redemption requirements. Non-linked investment contracts, such as term annuities, have contractual maturities.
(3) Certain debt issues have no dated maturity (refer to Note 31 for further details). Therefore, the face value of these issues are disclosed as no specific maturity. The next interest cash flows payable under these floating rate financial liabilities are $2 million monthly, $2 million quarterly and $23 million semi-annually (2011: $6 million monthly, $4 million quarterly, and $25 million semi-annually) for the Group, and $2 million monthly and $23 million semi-annually (2011: $6 million monthly and $25 million semi-annually) for the Company.
(4) External unitholders’ liability does not have a contractual maturity. Liquidity risk is borne by the unitholders based on the ability to liquidate assets held by managed investment schemes which are controlled by the Group.
(5) The full notional amount of contingent liabilities, credit-related commitments and investment commitments have been disclosed as ‘at-call’ as they could be payable on demand. The Group expects that not all of the contingent liabilities or commitments will be drawn before their contractual expiry.
(6) For the year ended 30 September 2012 other financial liabilities have been allocated by contractual maturity. The 30 September 2011 equivalent balance by contractual maturity is $2,131 million for at call, $164 million for 0 to 3 month(s), $8 million for 3 to 12 months and $45 million for 1 to 5 year(s) for the Group, and $164 million for 0 to 3 month(s), $8 million for 3 to 12 months and $45 million for 1 to 5 year(s) for the Company.
41 Financial risk management (continued)

2012 Annual Financial Report 135
Notes to the financial statements
Contractual maturity of assets and liabilities
The following tables show an analysis of contractual maturities at balance date of assets and liabilities. The Group expects that certain assets and liabilities will be recovered or settled at maturities which are different to their contractual maturities, including deposits where the Group expects as part of normal banking operations that a large proportion of these balances will roll over.
2012Less than 12
monthsGreater than
12 monthsNo specific
maturity TotalGroup $m $m $m $m
AssetsCash and liquid assets 19,464 - - 19,464 Due from other banks 47,291 119 - 47,410 Trading derivatives (1) - - 40,899 40,899 Trading securities 13,162 14,764 688 28,614 Investments - available for sale 7,647 21,087 251 28,985 Investments - held to maturity 4,735 5,027 - 9,762 Investments relating to life insurance business 1,917 13,334 53,163 68,414 Other financial assets at fair value 18,970 45,057 - 64,027 Loans and advances 79,973 306,847 7,915 394,735 Due from customers on acceptances 36,957 - - 36,957 All other assets 6,848 3,146 13,829 23,823
Total assets 236,964 409,381 116,745 763,090
LiabilitiesDue to other banks 28,144 547 - 28,691 Trading derivatives (1) - - 45,127 45,127 Other financial liabilities at fair value 9,387 12,223 122 21,732 Deposits 391,874 12,762 - 404,636 Other borrowings 14,794 491 - 15,285 Liability on acceptances 7,801 - - 7,801 Life insurance contract liabilities (3) - - 2,284 2,284 Life investment contract liabilities (4) 790 139 53,371 54,300 Bonds, notes and subordinated debt 18,540 84,832 - 103,372 Other debt issues - - 1,783 1,783 All other liabilities 13,008 5,287 15,981 34,276
Total liabilities 484,338 116,281 118,668 719,287
Net (liabilities)/assets (247,374) 293,100 (1,923) 43,803
41 Financial risk management (continued)

136 NATIONAL AUSTRALIA BANK
Notes to the financial statements
2011Less than 12
monthsGreater than
12 monthsNo specific
maturity TotalGroup $m $m $m $m
AssetsCash and liquid assets 27,093 - - 27,093 Due from other banks 47,106 - - 47,106 Trading derivatives (1) - - 48,466 48,466 Trading securities 9,139 22,507 2,982 34,628 Investments - available for sale 8,357 9,453 235 18,045 Investments - held to maturity 5,595 7,192 - 12,787 Investments relating to life insurance business 2,206 12,922 48,792 63,920 Other financial assets at fair value 16,725 35,020 11 51,756 Loans and advances 83,218 291,248 7,903 382,369 Due from customers on acceptances 43,017 - - 43,017 All other assets (2) - - 24,570 24,570
Total assets 242,456 378,342 132,959 753,757
LiabilitiesDue to other banks 39,717 445 - 40,162 Trading derivatives (1) - - 47,889 47,889 Other financial liabilities at fair value 12,978 10,570 178 23,726 Deposits 378,444 6,328 - 384,772 Other borrowings 17,664 528 - 18,192 Liability on acceptances 10,633 - - 10,633 Life insurance contract liabilities (3) - - 2,316 2,316 Life investment contract liabilities (4) 325 260 50,707 51,292 Bonds, notes and subordinated debt 18,448 81,320 - 99,768 Other debt issues - - 2,494 2,494 All other liabilities (5) - - 30,325 30,325
Total liabilities 478,209 99,451 133,909 711,569
Net (liabilities)/assets (235,753) 278,891 (950) 42,188
2012Less than 12
monthsGreater than
12 monthsNo specific
maturity TotalCompany $m $m $m $m
AssetsCash and liquid assets 13,586 - - 13,586 Due from other banks 35,203 119 - 35,322 Trading derivatives (1) - - 41,680 41,680 Trading securities 10,938 14,115 688 25,741 Investments - available for sale 7,530 17,919 156 25,605 Investments - held to maturity 4,428 1,105 - 5,533 Other financial assets at fair value 9,005 29,732 - 38,737 Loans and advances 64,165 238,410 6,153 308,728 Due from customers on acceptances 36,946 - - 36,946 All other assets 5,078 2,772 81,388 89,238
Total assets 186,879 304,172 130,065 621,116
LiabilitiesDue to other banks 26,169 - - 26,169 Trading derivatives (1) - - 43,947 43,947 Other financial liabilities at fair value 2,361 2,192 122 4,675 Deposits 324,460 4,488 - 328,948 Other borrowings 7,407 - - 7,407 Liability on acceptances 7,790 - - 7,790 Bonds, notes and subordinated debt 17,017 77,660 - 94,677 Other debt issues - - 1,288 1,288 All other liabilities 8,625 4,894 48,061 61,580
Total liabilities 393,829 89,234 93,418 576,481
Net (liabilities)/assets (206,950) 214,938 36,647 44,635
41 Financial risk management (continued)

2012 Annual Financial Report 137
Notes to the financial statements
2011Less than 12
monthsGreater than
12 monthsNo specific
maturity TotalCompany $m $m $m $m
AssetsCash and liquid assets 22,532 - - 22,532 Due from other banks 36,853 - - 36,853 Trading derivatives (1) - - 47,353 47,353 Trading securities 6,990 21,543 2,980 31,513 Investments - available for sale 8,108 6,305 103 14,516 Investments - held to maturity 5,277 972 - 6,249 Other financial assets at fair value 5,727 21,038 - 26,765 Loans and advances 67,030 221,091 6,050 294,171 Due from customers on acceptances 43,006 - - 43,006 All other assets (2) - - 83,151 83,151
Total assets 195,523 270,949 139,637 606,109
LiabilitiesDue to other banks 35,896 6 - 35,902 Trading derivatives (1) - - 46,048 46,048 Other financial liabilities at fair value 856 2,410 178 3,444 Deposits 307,435 1,438 - 308,873 Other borrowings 8,233 50 - 8,283 Liability on acceptances 10,622 - - 10,622 Bonds, notes and subordinated debt 13,550 76,098 - 89,648 Other debt issues - - 1,939 1,939 All other liabilities (5) - - 59,981 59,981
Total liabilities 376,592 80,002 108,146 564,740
Net (liabilities)/assets (181,069) 190,947 31,491 41,369
(1) Trading derivatives have not been shown by contractual maturity because they are typically held for varying periods of time.(2) For the year ended 30 September 2012 all other assets have been allocated by contractual maturity. The 30 September 2011 equivalent balance by contractual maturity is $8,511 million for less than 12
months, $2,925 million for greater than 12 months and $13,134 million for no specific maturity for the Group, and $5,583 million for less than 12 months, $2,540 million for greater than 12 months and $75,028 million for no specific maturity for the Company.
(3) Life insurance contract liabilities do not have a fixed maturity date. Based on the Group’s assumptions as to likely withdrawals and claim patterns, $940 million (2011: $909 million) is estimated to be settled within 12 months from the balance sheet date.
(4) Life investment contract liabilities disclosed as ‘no specific maturity’ include investment-linked contracts of $53,371 million (2011: $50,707 million). The liability to policyholders for investment-linked contracts is linked to the performance and value of the assets that back those liabilities, and liquidity risk is borne by the policyholder based on the ability to liquidate assets that back those liabilities in a timely manner to meet redemption requirements. Non-linked investment contracts, such as term annuities, have contractual maturities.
(5) For the year ended 30 September 2012 all other liabilities have been allocated by contractual maturity. The 30 September 2011 equivalent balance by contractual maturity is $13,847 million for less than 12 months, $3,197 million for greater than 12 months and $13,281 million for no specific maturity for the Group, and $9,517 million for less than 12 months, $3,026 million for greater than 12 months and $47,438 million for no specific maturity for the Company.
Hedge accounting
(a) Fair value hedges
The Group hedges part of its existing interest rate and foreign currency risk resulting from potential movements in the fair value of fixed rate assets and liabilities attributable to both interest rate and foreign currency risk denominated both in local and foreign currencies using interest rate, cross currency interest rate and cross currency swaps. The fair value of these swaps is disclosed in Note 11.
(b) Cash flow hedges
The Group hedges a portion of the variability in future cash flows attributable to the interest rate risk of variable rate assets and liabilities at any given time using derivatives such as interest rate swaps, forward rate agreements and futures contracts. The Group also utilises derivatives to hedge a portion of the variability in future cash flows attributable to foreign exchange risk created by assets, liabilities and forecast transactions denominated in a currency other than an entity’s functional currency. The fair value of these hedges is disclosed in Note 11.
There were no forecast transactions for which cash flow hedge accounting had to be ceased as a result of the forecast transaction no longer being expected to occur in the current or the prior period.
(c) Hedges of net investments in foreign operations
Borrowings of GBP1,030 million (2011: GBP675 million) have been designated as a hedge of net investments in foreign operations with a GBP functional currency. The hedges have been designated to protect against the Group’s exposure to foreign exchange risk on investments. Gains or losses on the translation of these borrowings are transferred to equity to the extent that they offset any gains or losses on translation of the net investment in the foreign operations. For the year ended 30 September 2012 there was no hedge ineffectiveness (2011: $5 million gain) recognised in profit or loss related to net investment hedges.
41 Financial risk management (continued)

138 NATIONAL AUSTRALIA BANK
Notes to the financial statements
42 Fair value of financial instruments
(a) Fair value of financial instruments, including those carried at amortised cost
The tables below show a comparison of the carrying amounts, as reported on the balance sheet, and fair values of all financial assets and liabilities.
Fair value is the amount for which an asset could be exchanged, or a liability settled, between knowledgeable, willing parties in an arm’s length transaction. The estimated fair values are based on relevant information available for the last two years at 30 September and involve judgement. The methodologies and assumptions used in the fair value estimates are described in the footnotes to the tables.
There are various limitations inherent in this fair value disclosure particularly where prices may not represent the underlying value due to dislocation in the market. Not all of the Group’s financial instruments can be exchanged in an active trading market. The Group obtains the fair values for investment securities from quoted market prices where available. Where securities are unlisted and quoted market prices are not available, the Group obtains the fair value by means of discounted cash flows and other valuation techniques that are commonly used by market participants. These techniques address factors such as interest rates, credit risk and liquidity. The difference to fair value is relevant in a trading environment, but is not relevant to assets held to maturity and loans and advances.
2012 2011Carrying
valueFair
valueCarrying
valueFair
valueGroup Footnote $m $m $m $m
Financial assetsCash and liquid assets (a) 19,464 19,464 27,093 27,093 Due from other banks (a) 47,410 47,410 47,106 47,106 Trading derivatives (b) 40,899 40,899 48,466 48,466 Trading securities (c) 28,614 28,614 34,628 34,628 Investments - available for sale (c) 28,985 28,985 18,045 18,045 Investments - held to maturity (c) 9,762 9,488 12,787 12,089 Investments relating to life insurance business (d) 68,414 68,414 63,920 63,920 Other financial assets at fair value (e) 64,027 64,027 51,756 51,756 Hedging derivatives (b) 3,615 3,615 4,108 4,108 Loans and advances (f) 394,735 397,452 382,369 383,068 Due from customers on acceptances (a) 36,957 36,957 43,017 43,017 Other assets (a) 3,999 3,999 6,035 6,035
Total financial assets 746,881 749,324 739,330 739,331
Financial liabilitiesDue to other banks (a) 28,691 28,691 40,162 40,162 Trading derivatives (b) 45,127 45,127 47,889 47,889 Other financial liabilities at fair value (e) 21,732 21,732 23,726 23,726 Hedging derivatives (b) 6,348 6,348 4,550 4,550 Deposits and other borrowings (g) 419,921 420,968 402,964 403,092 Liability on acceptances (a) 7,801 7,801 10,633 10,633 Life policy liabilities (h) 56,584 56,584 53,608 53,608 Bonds, notes and subordinated debt (i) 103,372 104,073 99,768 99,775 Other debt issues (i) 1,783 1,783 2,494 2,494 External unitholders’ liability (d) 12,546 12,546 9,959 9,959 Other liabilities (a) 12,367 12,367 13,336 13,336
Total financial liabilities 716,272 718,020 709,089 709,224

2012 Annual Financial Report 139
Notes to the financial statements
42 Fair value of financial instruments (continued)
2012 2011Carrying
valueFair
valueCarrying
valueFair
valueCompany Footnote $m $m $m $m
Financial assetsCash and liquid assets (a) 13,586 13,586 22,532 22,532 Due from other banks (a) 35,322 35,322 36,853 36,853 Trading derivatives (b) 41,680 41,680 47,353 47,353 Trading securities (c) 25,741 25,741 31,513 31,513 Investments - available for sale (c) 25,605 25,605 14,516 14,516 Investments - held to maturity (c) 5,533 5,536 6,249 6,247 Other financial assets at fair value (e) 38,737 38,737 26,765 26,765 Hedging derivatives (b) 3,177 3,177 3,051 3,051 Loans and advances (f) 308,728 311,371 294,171 294,546 Due from customers on acceptances (a) 36,946 36,946 43,006 43,006 Due from controlled entities (j) 57,523 57,217 53,597 52,933 Other assets (a) 3,161 3,161 4,272 4,272
Total financial assets 595,739 598,079 583,878 583,587
Financial liabilitiesDue to other banks (a) 26,169 26,169 35,902 35,902 Trading derivatives (b) 43,947 43,947 46,048 46,048 Other financial liabilities at fair value (e) 4,675 4,675 3,444 3,444 Hedging derivatives (b) 5,921 5,921 4,317 4,317 Deposits and other borrowings (g) 336,355 337,217 317,156 317,308 Liability on acceptances (a) 7,790 7,790 10,622 10,622 Due to controlled entities (j) 46,629 46,629 45,653 45,653 Bonds, notes and subordinated debt (i) 94,677 95,320 89,648 89,668 Other debt issues (i) 1,288 1,288 1,939 1,939 Other liabilities (a) 7,402 7,402 8,485 8,485
Total financial liabilities 574,853 576,358 563,214 563,386
The fair value estimates are based on the following methodologies and assumptions:a) the carrying amounts of cash and liquid assets, due from and to other banks, due from customers on acceptances, liability on acceptances,
other assets and other liabilities, approximate their fair value as they are short-term in nature or are receivable or payable on demand;b) the fair values of trading and hedging derivative assets and liabilities, including foreign exchange contracts, interest rate swaps, interest rate
and currency option contracts, and currency swaps, are obtained from quoted closing market prices at balance date, discounted cash flow models or option pricing models as appropriate. The fair value of Synthetic Collateralised Debt Obligation (SCDO) risk mitigation derivatives are included;
c) the fair values of trading securities, investments - available for sale and investments - held to maturity are based on quoted closing market prices at balance date. Where securities are unlisted and quoted market prices are not available, the Group obtains the fair value by means of discounted cash flows and other valuation techniques that are commonly used by market participants. These techniques address factors such as interest rates, credit risk and liquidity. The fair value of the SCDO asset held by securitisation conduits as held to maturity reflects the Group’s exposure subsequent to the risk mitigation strategy;
d) the fair values of investments relating to life insurance business and external unitholders’ liability are based on quoted closing market prices at balance date. Where no quoted market value exists, various valuation methods have been adopted;
e) the fair values of other financial assets and liabilities at fair value are based on quoted closing market prices and data or valuation techniques appropriate to the nature and type of the underlying instrument;
f) the fair value of loans and advances that reprice within six months of balance date is assumed to equate to the carrying value. The fair value of all other loans and advances are calculated using discounted cash flow models based on the maturity of the loans and advances. The discount rates applied are based on interest rates at balance date for similar types of loans and advances, if the loans and advances were performing at balance date. The difference between estimated fair values of loans and advances and carrying value reflects changes in interest rates since loan or advance origination;
g) the fair value of deposits and other borrowings that are non-interest-bearing, at call or at a fixed rate that reprice within six months of balance date are assumed to equate to the carrying value. The fair value of other deposits and other borrowings is calculated using discounted cash flow models based on the deposit type and maturity;
h) life policy liabilities consist of policy liabilities from insurance contracts and policy liabilities from investment contracts. Policy liabilities from insurance contracts are measured predominantly using the projection method using assumptions outlined in Note 50 and the carrying amount approximates fair value. Policy liabilities from investment contracts are measured at fair value which is based on the value of the assets that back those liabilities;
i) the fair values of bonds, notes and subordinated debt and other debt issues are calculated based on a discounted cash flow model using a yield curve appropriate to the remaining maturity of the instruments and appropriate credit spreads; and
j) the fair values of amounts due from and to controlled entities approximate their carrying amounts as they are short-term in nature or are receivable or payable on demand, except for amounts due from securitisation conduits which are determined on a look through basis. The fair values of the securitisation conduits’ underlying assets are determined using the same basis as trading securities as described in footnote (c).
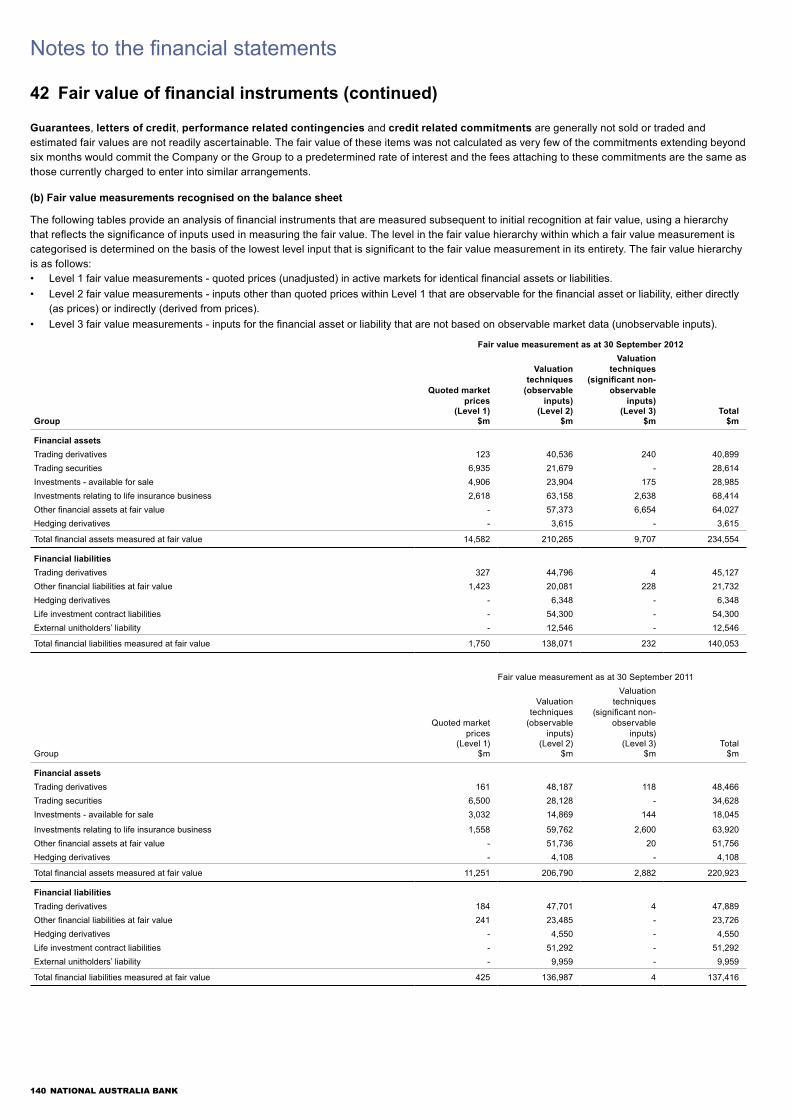
140 NATIONAL AUSTRALIA BANK
Notes to the financial statements
42 Fair value of financial instruments (continued)
Guarantees, letters of credit, performance related contingencies and credit related commitments are generally not sold or traded and estimated fair values are not readily ascertainable. The fair value of these items was not calculated as very few of the commitments extending beyond six months would commit the Company or the Group to a predetermined rate of interest and the fees attaching to these commitments are the same as those currently charged to enter into similar arrangements.
(b) Fair value measurements recognised on the balance sheet
The following tables provide an analysis of financial instruments that are measured subsequent to initial recognition at fair value, using a hierarchy that reflects the significance of inputs used in measuring the fair value. The level in the fair value hierarchy within which a fair value measurement is categorised is determined on the basis of the lowest level input that is significant to the fair value measurement in its entirety. The fair value hierarchy is as follows:• Level 1 fair value measurements - quoted prices (unadjusted) in active markets for identical financial assets or liabilities.• Level 2 fair value measurements - inputs other than quoted prices within Level 1 that are observable for the financial asset or liability, either directly
(as prices) or indirectly (derived from prices).• Level 3 fair value measurements - inputs for the financial asset or liability that are not based on observable market data (unobservable inputs).
Fair value measurement as at 30 September 2012
Quoted market prices
Valuation techniques (observable
inputs)
Valuation techniques
(significant non- observable
inputs)(Level 1) (Level 2) (Level 3) Total
Group $m $m $m $m
Financial assetsTrading derivatives 123 40,536 240 40,899 Trading securities 6,935 21,679 - 28,614 Investments - available for sale 4,906 23,904 175 28,985 Investments relating to life insurance business 2,618 63,158 2,638 68,414 Other financial assets at fair value - 57,373 6,654 64,027 Hedging derivatives - 3,615 - 3,615
Total financial assets measured at fair value 14,582 210,265 9,707 234,554
Financial liabilitiesTrading derivatives 327 44,796 4 45,127 Other financial liabilities at fair value 1,423 20,081 228 21,732 Hedging derivatives - 6,348 - 6,348 Life investment contract liabilities - 54,300 - 54,300 External unitholders’ liability - 12,546 - 12,546
Total financial liabilities measured at fair value 1,750 138,071 232 140,053
Fair value measurement as at 30 September 2011
Quoted market prices
Valuation techniques
(observable inputs)
Valuation techniques
(significant non- observable
inputs)(Level 1) (Level 2) (Level 3) Total
Group $m $m $m $m
Financial assetsTrading derivatives 161 48,187 118 48,466 Trading securities 6,500 28,128 - 34,628 Investments - available for sale 3,032 14,869 144 18,045
Investments relating to life insurance business 1,558 59,762 2,600 63,920 Other financial assets at fair value - 51,736 20 51,756 Hedging derivatives - 4,108 - 4,108
Total financial assets measured at fair value 11,251 206,790 2,882 220,923
Financial liabilitiesTrading derivatives 184 47,701 4 47,889 Other financial liabilities at fair value 241 23,485 - 23,726 Hedging derivatives - 4,550 - 4,550 Life investment contract liabilities - 51,292 - 51,292 External unitholders’ liability - 9,959 - 9,959
Total financial liabilities measured at fair value 425 136,987 4 137,416

2012 Annual Financial Report 141
Notes to the financial statements
42 Fair value of financial instruments (continued)
Fair value measurement as at 30 September 2012
Quoted market prices
Valuation techniques (observable
inputs)
Valuation techniques
(significant non- observable
inputs)(Level 1) (Level 2) (Level 3) Total
Company $m $m $m $m
Financial assetsTrading derivatives 123 41,317 240 41,680 Trading securities 5,272 20,469 - 25,741 Investments - available for sale 1,715 23,750 140 25,605 Other financial assets at fair value - 38,737 - 38,737 Hedging derivatives - 3,177 - 3,177
Total financial assets measured at fair value 7,110 127,450 380 134,940
Financial liabilitiesTrading derivatives 321 43,626 - 43,947 Other financial liabilities at fair value 1,420 3,255 - 4,675 Hedging derivatives - 5,921 - 5,921
Total financial liabilities measured at fair value 1,741 52,802 - 54,543
Fair value measurement as at 30 September 2011
Quoted market prices
Valuation techniques
(observable inputs)
Valuation techniques
(significant non- observable
inputs)(Level 1) (Level 2) (Level 3) Total
Company $m $m $m $m
Financial assetsTrading derivatives 158 47,077 118 47,353 Trading securities 5,634 25,879 - 31,513 Investments - available for sale 16 14,410 90 14,516 Other financial assets at fair value - 26,765 - 26,765 Hedging derivatives - 3,051 - 3,051
Total financial assets measured at fair value 5,808 117,182 208 123,198
Financial liabilitiesTrading derivatives 176 45,872 - 46,048 Other financial liabilities at fair value 239 3,205 - 3,444 Hedging derivatives - 4,317 - 4,317
Total financial liabilities measured at fair value 415 53,394 - 53,809
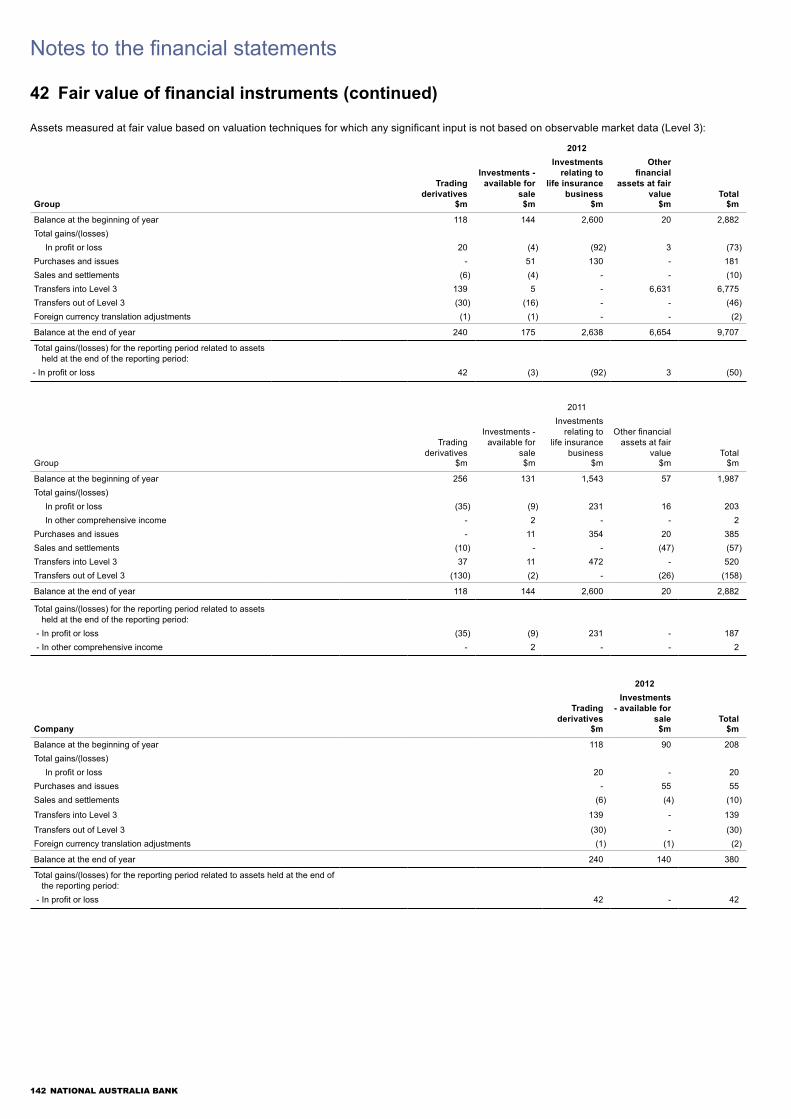
142 NATIONAL AUSTRALIA BANK
Notes to the financial statements
42 Fair value of financial instruments (continued)
Assets measured at fair value based on valuation techniques for which any significant input is not based on observable market data (Level 3):
2012
Trading
derivatives
Investments - available for
sale
Investments relating to
life insurance business
Other financial
assets at fair value Total
Group $m $m $m $m $m
Balance at the beginning of year 118 144 2,600 20 2,882 Total gains/(losses)
In profit or loss 20 (4) (92) 3 (73)Purchases and issues - 51 130 - 181 Sales and settlements (6) (4) - - (10)Transfers into Level 3 139 5 - 6,631 6,775 Transfers out of Level 3 (30) (16) - - (46)Foreign currency translation adjustments (1) (1) - - (2)
Balance at the end of year 240 175 2,638 6,654 9,707
Total gains/(losses) for the reporting period related to assets held at the end of the reporting period:
- In profit or loss 42 (3) (92) 3 (50)
2011
Trading
derivatives
Investments - available for
sale
Investments relating to
life insurance business
Other financial assets at fair
value TotalGroup $m $m $m $m $m
Balance at the beginning of year 256 131 1,543 57 1,987 Total gains/(losses)
In profit or loss (35) (9) 231 16 203 In other comprehensive income - 2 - - 2
Purchases and issues - 11 354 20 385 Sales and settlements (10) - - (47) (57)Transfers into Level 3 37 11 472 - 520 Transfers out of Level 3 (130) (2) - (26) (158)
Balance at the end of year 118 144 2,600 20 2,882
Total gains/(losses) for the reporting period related to assets held at the end of the reporting period:
- In profit or loss (35) (9) 231 - 187 - In other comprehensive income - 2 - - 2
2012
Trading
derivatives
Investments - available for
sale TotalCompany $m $m $m
Balance at the beginning of year 118 90 208 Total gains/(losses)
In profit or loss 20 - 20 Purchases and issues - 55 55 Sales and settlements (6) (4) (10)
Transfers into Level 3 139 - 139
Transfers out of Level 3 (30) - (30)Foreign currency translation adjustments (1) (1) (2)
Balance at the end of year 240 140 380
Total gains/(losses) for the reporting period related to assets held at the end of the reporting period:
- In profit or loss 42 - 42
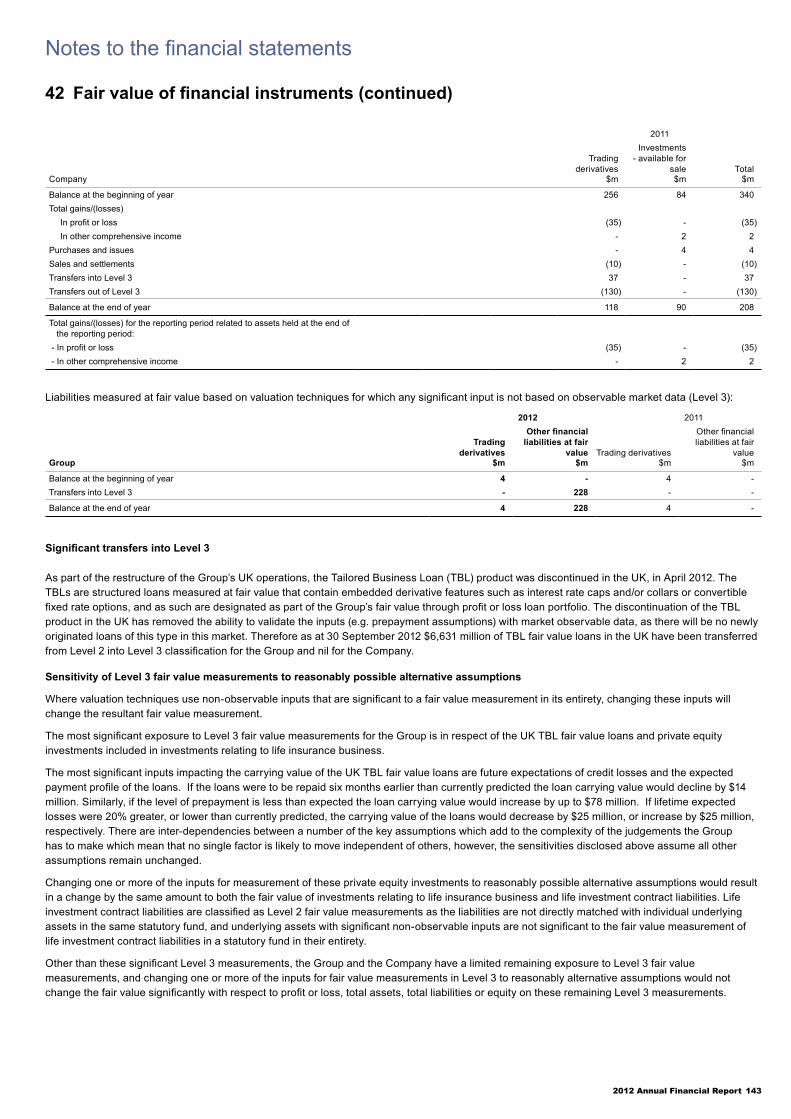
2012 Annual Financial Report 143
Notes to the financial statements
42 Fair value of financial instruments (continued)
2011
Trading
derivatives
Investments - available for
sale TotalCompany $m $m $m
Balance at the beginning of year 256 84 340 Total gains/(losses)
In profit or loss (35) - (35)In other comprehensive income - 2 2
Purchases and issues - 4 4 Sales and settlements (10) - (10)Transfers into Level 3 37 - 37 Transfers out of Level 3 (130) - (130)
Balance at the end of year 118 90 208
Total gains/(losses) for the reporting period related to assets held at the end of the reporting period:
- In profit or loss (35) - (35) - In other comprehensive income - 2 2
Liabilities measured at fair value based on valuation techniques for which any significant input is not based on observable market data (Level 3): 2012 2011
Trading
derivatives
Other financial liabilities at fair
value Trading derivatives
Other financial liabilities at fair
valueGroup $m $m $m $m
Balance at the beginning of year 4 - 4 - Transfers into Level 3 - 228 - -
Balance at the end of year 4 228 4 -
Significant transfers into Level 3
As part of the restructure of the Group’s UK operations, the Tailored Business Loan (TBL) product was discontinued in the UK, in April 2012. The TBLs are structured loans measured at fair value that contain embedded derivative features such as interest rate caps and/or collars or convertible fixed rate options, and as such are designated as part of the Group’s fair value through profit or loss loan portfolio. The discontinuation of the TBL product in the UK has removed the ability to validate the inputs (e.g. prepayment assumptions) with market observable data, as there will be no newly originated loans of this type in this market. Therefore as at 30 September 2012 $6,631 million of TBL fair value loans in the UK have been transferred from Level 2 into Level 3 classification for the Group and nil for the Company.
Sensitivity of Level 3 fair value measurements to reasonably possible alternative assumptions
Where valuation techniques use non-observable inputs that are significant to a fair value measurement in its entirety, changing these inputs will change the resultant fair value measurement.
The most significant exposure to Level 3 fair value measurements for the Group is in respect of the UK TBL fair value loans and private equity investments included in investments relating to life insurance business.
The most significant inputs impacting the carrying value of the UK TBL fair value loans are future expectations of credit losses and the expected payment profile of the loans. If the loans were to be repaid six months earlier than currently predicted the loan carrying value would decline by $14 million. Similarly, if the level of prepayment is less than expected the loan carrying value would increase by up to $78 million. If lifetime expected losses were 20% greater, or lower than currently predicted, the carrying value of the loans would decrease by $25 million, or increase by $25 million, respectively. There are inter-dependencies between a number of the key assumptions which add to the complexity of the judgements the Group has to make which mean that no single factor is likely to move independent of others, however, the sensitivities disclosed above assume all other assumptions remain unchanged.
Changing one or more of the inputs for measurement of these private equity investments to reasonably possible alternative assumptions would result in a change by the same amount to both the fair value of investments relating to life insurance business and life investment contract liabilities. Life investment contract liabilities are classified as Level 2 fair value measurements as the liabilities are not directly matched with individual underlying assets in the same statutory fund, and underlying assets with significant non-observable inputs are not significant to the fair value measurement of life investment contract liabilities in a statutory fund in their entirety.
Other than these significant Level 3 measurements, the Group and the Company have a limited remaining exposure to Level 3 fair value measurements, and changing one or more of the inputs for fair value measurements in Level 3 to reasonably alternative assumptions would not change the fair value significantly with respect to profit or loss, total assets, total liabilities or equity on these remaining Level 3 measurements.

144 NATIONAL AUSTRALIA BANK
Notes to the financial statements
43 Financial asset transfers and securitisations
The majority of financial asset transfers that do not qualify for derecognition are associated with repurchase agreements, covered bonds and securitisation program agreements. The following table sets out the carrying amount of financial assets that did not qualify for derecognition and their associated liabilities. The carrying amount of associated liabilities is net of derivatives used to manage currency risk associated with this liability. Where relevant, the table also sets out the net position of the fair value of financial assets where the counterparty to the associated liabilities has recourse only to the transferred assets:
2012 Repurchase agreements Covered bonds Securitisation
Group $m $m $m
Carrying amount of transferred assets 10,301 15,615 7,803 Carrying amount of associated liabilities 10,301 11,729 5,578
For those liabilities that have recourse only to the transferred assets Fair value of transferred assets 7,857 Fair value of associated liabilities 5,616
Net position 2,241
2012Repurchase agreements Covered bonds Securitisation
Company $m $m $m
Carrying amount of transferred assets 10,110 7,424 20,634 Carrying amount of associated liabilities 10,110 6,337 21,343
For those liabilities that have recourse only to the transferred assets Fair value of transferred assets 20,810 Fair value of associated liabilities 21,488
Net position (678)
2011Repurchase agreements Covered bonds Securitisation
Group $m $m $m
Carrying amount of transferred assets 13,984 4,461 6,394 Carrying amount of associated liabilities 13,984 2,653 5,676
2011Repurchase agreements Covered bonds Securitisation
Company $m $m $m
Carrying amount of transferred assets 11,745 - 19,930 Carrying amount of associated liabilities 11,745 - 20,956
(i) Repurchase agreements
Securities sold subject to repurchase agreements are retained in their respective balance sheet categories. The counterparty liability is included in amounts due to other banks and deposits and other borrowings, as appropriate, based upon the counterparty to the transaction.
(ii) Covered bonds
Certain residential mortgages have been assigned to a bankruptcy remote special purpose entity (SPE) associated with covered bond programs to provide security for the obligations payable on the covered bonds issued by the Group. Similarly to securitisation programs, the Group is entitled to any residual income after all payments due to covered bonds investors have been met. The Group retains all of the risks and rewards associated with the residential mortgages and where derivatives have not been externalised, interest rate and foreign currency risk are held in the Group. The covered bonds SPEs are consolidated, the residential mortgages are retained on the Group’s balance sheet and the covered bonds issued are included within debt securities on issue. The covered bond holders have dual recourse to the Bank or the covered pool assets.
(iii) Securitisation
Through its loan securitisation programs, the Group packages and sells loans (principally housing mortgage loans) as securities to investors through a series of securitisation vehicles. The Group is entitled to any residual income of the vehicles after all payments to investors and costs of the program have been met. The Group is considered to hold the majority of the residual risks and benefits of the vehicles.
The loans do not qualify for derecognition because the Company and Group remain exposed to the risks and rewards of ownership on an ongoing basis. The Company and Group continue to be exposed primarily to liquidity risk, interest rate risk and credit risk of the loans. The securitisation trusts are consolidated into the Group. The note holders have only recourse to the mortgage pool of assets.
In addition to its loan securitisation programs, the Group has various contractual relationships with entities that undertake securitisation of third party assets. The Group sponsors, manages and provides liquidity facilities and derivative contracts to these securitisation conduits.

2012 Annual Financial Report 145
Notes to the financial statements
44 Operating leases
Where the Group is the lessee, the future minimum lease payments under non-cancellable operating leases are:
Group Company
2012 2011 2012 2011$m $m $m $m
Due within one year 378 319 261 254 Due after one year but no later than five years 1,162 1,019 784 746 Due after five years 1,159 1,545 689 713
Total non-cancellable operating lease commitments 2,699 2,883 1,734 1,713
The Group leases various offices, branches and other premises under non-cancellable operating lease arrangements. The leases have various terms, escalation and renewal rights. There are no contingent rents payable. The Group also leases data processing and other equipment under non-cancellable lease arrangements.
The total of future minimum sub-lease payments to be received under non-cancellable sub-leases at 30 September 2012 is $50 million (2011: $24 million) for the Group and $50 million (2011: $23 million) for the Company. During the 2012 year, sub-lease payments received amounted to $16 million (2011: $16 million) for the Group and $10 million (2011: $9 million) for the Company and were netted against operating lease rental expense.
Where the Group is the lessor, the future minimum lease receipts under non-cancellable operating leases are:
Group Company
2012 2011 2012 2011$m $m $m $m
Due within one year 42 68 35 55 Due after one year but no later than five years 68 129 43 85 Due after five years 38 61 19 25
Total non-cancellable operating lease receivables 148 258 97 165
45 Investment commitmentsInvestment commitments contracted for as at the reporting date are set out below:
Group Company
2012 2011 2012 2011$m $m $m $m
Investment commitmentsStatutory funds 1,140 1,373 - -
Total investment commitments 1,140 1,373 - -

146 NATIONAL AUSTRALIA BANK
Notes to the financial statements
46 Related party disclosures
During the year, there have been dealings between the Company and its controlled entities and other related parties. The Company provides a range of services to related parties including the provision of banking facilities and standby financing arrangements. Other dealings include granting loans and accepting deposits, and the provision of finance. These transactions are normally entered into on terms equivalent to those that prevail on an arm’s length basis in the ordinary course of business.
Other transactions with controlled entities may involve leases of properties, plant and equipment, provision of data processing services or access to intellectual or other intangible property rights. Charges for these transactions are normally on an arm’s length basis and are otherwise on the basis of equitable rates agreed between the parties. The Company also provides various administrative services to the Group, which may include accounting, secretarial and legal. Fees may be charged for these services.
The Company currently issues employee share compensation to Group employees on behalf of Group subsidiaries. The equity-based payments expense relating to this compensation is recharged from the Company to the employing subsidiaries in the Group. For further details, refer to Note 37.
The aggregate of material amounts receivable from or payable to controlled entities and the Company, at balance date, is disclosed in the balance sheet of the Company. Refer to Note 21 for details of the Company’s investment in controlled entities. Refer to Note 39 for details of controlled entities. The Company has certain guarantees and undertakings with entities in the Group. For further details, refer to Note 40.
Loans made to subsidiaries are generally entered into on terms equivalent to those that prevail on an arm’s length basis, except that there are often no fixed repayment terms for the settlement of loans between parties. Outstanding balances are unsecured and are repayable in cash.
The aggregate amounts receivable from controlled entities for the last two years to 30 September were:Company
2012 2011$m $m
Balance at beginning of year 7,944 12,796 Net cash flows in amounts due from/(to) controlled entities 3,027 (4,791)Provisions for impairment of intercompany loans to securitisation conduits (213) (21)Net foreign currency translation movements and other amounts receivables 136 (40)
Balance at end of year 10,894 7,944
Material transactions with controlled entities for the last two years to 30 September included:Company
2012 2011$m $m
Net interest income 217 399 Net operating lease revenue 30 26 Net management fees 124 139 Dividend revenue 820 1,054
Superannuation plans
The following payments were made to superannuation plans sponsored by the Group:Group Company
2012 2011 2012 2011Payment to: $m $m $m $m
National Australia Bank Group Superannuation Fund A 210 200 210 200 Yorkshire and Clydesdale Bank Pension Scheme 372 168 199 3 National Australia Group Defined Contribution Pension Scheme (UK) 26 27 2 4 National Wealth Management Superannuation Plan 5 5 - - Bank of New Zealand Offices Provident Association (Division 2) 10 8 - -
Transactions between the Group and superannuation plans sponsored by the Group during the last two years were made on commercial terms and conditions.

2012 Annual Financial Report 147
Notes to the financial statements
46 Related party disclosures (continued)
Details of key management personnel (KMP) of the Group
The following persons were KMP of the Company and Group during the year ended 30 September 2012:
Name Position
Executive directorsCA Clyne Executive Director, Group Chief Executive OfficerMA Joiner Executive Director, FinanceOther senior executivesLJ Gray Group Executive, Personal BankingAP Hagger Group Executive, People, Marketing and CommunicationsMJ Healey Group Executive, Group Governance and LegalJC Healy Group Executive, Business BankingBF Munro Group Chief Risk OfficerRJ Sawers Group Executive, Wholesale BankingGR Slater Group Executive, Group Business ServicesAG Thorburn Group Executive, New Zealand and the United StatesDJ Thorburn Group Executive, United KingdomSJ Tucker Group Executive, NAB WealthNon-executive directorsMA Chaney Non-executive director, ChairmanPA Cross Non-executive directorDT Gilbert Non-executive directorKR Henry (1) Non-executive directorPJ Rizzo Non-executive directorJS Segal Non-executive directorJG Thorn Non-executive directorGA Tomlinson Non-executive directorJA Waller Non-executive directorGM Williamson (2) Non-executive directorAKT Yuen Non-executive director
(1) Dr Henry was appointed a non-executive director on 1 November 2011.(2) Sir Malcolm Williamson retired as a director of the Company on 7 June 2012 and as Chairman of National Australia Group Europe Limited and Clydesdale Bank PLC on 23 July 2012.
Details of directors of the Company who held office during the year are set out in the Report of the Directors.
Remuneration of KMP
Total remuneration of KMP of the Company and Group for the year ended 30 September:
Short-term benefits
Post- employment
benefitsOther long
term benefits Equity-based benefitsTermination
benefits Total
Cash salary fixed
Cash STI at risk
Non- monetary
fixed
Super- annuation
fixedShares at risk
Options and rights at risk
Company and Group $ $ $ $ $ $ $ $ $
KMP2012 15,729,402 5,522,400 606,064 646,760 153,090 10,610,675 6,874,054 - 40,142,445 2011 16,684,863 9,642,966 1,217,062 863,285 113,514 15,476,117 4,334,544 1,989,732 50,322,083
Performance options, performance rights and shareholdings of KMP are set out in Note 47 and the Remuneration report.
Loans to KMP and their related parties
Loans made to directors of the Company are made in the ordinary course of business on terms equivalent to those that prevail in arm’s length transactions.
Loans to other KMP of the Company and Group may be made on similar terms and conditions generally available to other employees of the Group. Loans to KMP of the Company and Group may be subject to restrictions under applicable laws and regulations including the Corporations Act 2001 (Cth).
Loans to KMP of the Company and Group at year end may, in some instances, be an estimate of the 30 September statement balances. Where estimates have been used at the end of 2011, the balance at the beginning of 2012 reflects the actual opening balance and, therefore, may differ from the prior year closing balance. Additionally, the balance as at the end of 2011 does not equal the balance at the beginning of 2012 because of changes to the KMP of the Group and Company between 2011 and 2012.
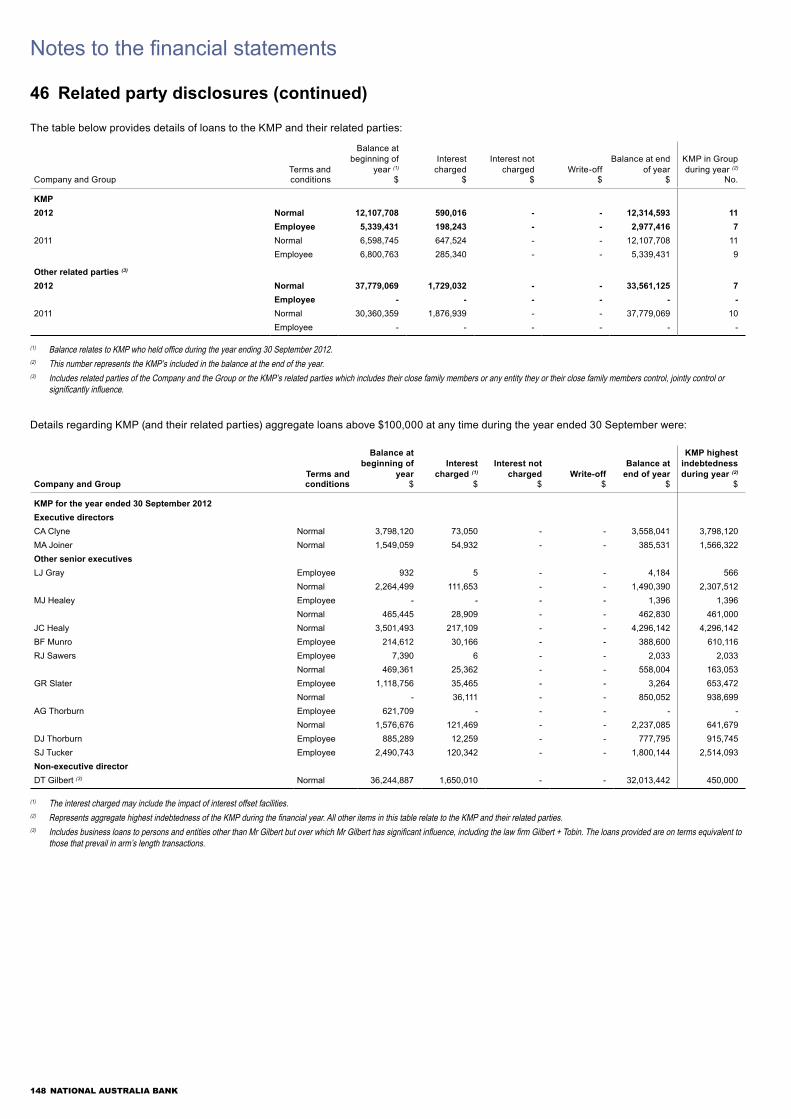
148 NATIONAL AUSTRALIA BANK
Notes to the financial statements
46 Related party disclosures (continued)
The table below provides details of loans to the KMP and their related parties:
Terms and
Balance at beginning of
year (1)Interest
chargedInterest not
charged Write-offBalance at end
of yearKMP in Group during year (2)
Company and Group conditions $ $ $ $ $ No.
KMP 2012 Normal 12,107,708 590,016 - - 12,314,593 11 Employee 5,339,431 198,243 - - 2,977,416 7 2011 Normal 6,598,745 647,524 - - 12,107,708 11 Employee 6,800,763 285,340 - - 5,339,431 9
Other related parties (3) 2012 Normal 37,779,069 1,729,032 - - 33,561,125 7 Employee - - - - - - 2011 Normal 30,360,359 1,876,939 - - 37,779,069 10 Employee - - - - - -
(1) Balance relates to KMP who held office during the year ending 30 September 2012.(2) This number represents the KMP’s included in the balance at the end of the year.(3) Includes related parties of the Company and the Group or the KMP’s related parties which includes their close family members or any entity they or their close family members control, jointly control or
significantly influence.
Details regarding KMP (and their related parties) aggregate loans above $100,000 at any time during the year ended 30 September were:
Terms and
Balance at beginning of
yearInterest
charged (1)Interest not
charged Write-offBalance at
end of year
KMP highest indebtedness during year (2)
Company and Group conditions $ $ $ $ $ $
KMP for the year ended 30 September 2012Executive directorsCA Clyne Normal 3,798,120 73,050 - - 3,558,041 3,798,120 MA Joiner Normal 1,549,059 54,932 - - 385,531 1,566,322 Other senior executivesLJ Gray Employee 932 5 - - 4,184 566
Normal 2,264,499 111,653 - - 1,490,390 2,307,512 MJ Healey Employee - - - - 1,396 1,396
Normal 465,445 28,909 - - 462,830 461,000 JC Healy Normal 3,501,493 217,109 - - 4,296,142 4,296,142 BF Munro Employee 214,612 30,166 - - 388,600 610,116 RJ Sawers Employee 7,390 6 - - 2,033 2,033
Normal 469,361 25,362 - - 558,004 163,053 GR Slater Employee 1,118,756 35,465 - - 3,264 653,472
Normal - 36,111 - - 850,052 938,699 AG Thorburn Employee 621,709 - - - - -
Normal 1,576,676 121,469 - - 2,237,085 641,679 DJ Thorburn Employee 885,289 12,259 - - 777,795 915,745 SJ Tucker Employee 2,490,743 120,342 - - 1,800,144 2,514,093 Non-executive directorDT Gilbert (3) Normal 36,244,887 1,650,010 - - 32,013,442 450,000
(1) The interest charged may include the impact of interest offset facilities.(2) Represents aggregate highest indebtedness of the KMP during the financial year. All other items in this table relate to the KMP and their related parties.(3) Includes business loans to persons and entities other than Mr Gilbert but over which Mr Gilbert has significant influence, including the law firm Gilbert + Tobin. The loans provided are on terms equivalent to
those that prevail in arm’s length transactions.

2012 Annual Financial Report 149
Notes to the financial statements
46 Related party disclosures (continued)
Terms and
Balance at beginning of
yearInterest
charged (1)Interest not
charged Write-offBalance at end of year
KMP highest indebtedness during year (2)
Company and Group conditions $ $ $ $ $ $
KMP for the year ended 30 September 2011Executive directorsCA Clyne Normal 3,688,948 224,449 - - 3,798,120 3,872,947 MA Joiner Normal 40,001 28,217 - - 1,549,059 1,641,798 Other senior executivesLJ Gray Employee 612 - - - 932 5,851
Normal 2,173,135 148,439 - - 2,264,499 2,356,970 MJ Healey Employee 461,102 - - - - 1,825
Normal 438 15,351 - - 465,445 461,000 JC Healy Employee 367,103 2,652 - - - 367,103
Normal - 205,770 - - 3,501,493 3,527,228 BF Munro Employee 172,929 11,227 - - 214,612 214,612 RJ Sawers Employee 3,535 - - - 7,390 11,020
Normal 724,176 32,724 - - 469,361 570,860 GR Slater Employee 1,667,162 73,403 - - 1,118,756 1,667,162
Normal 152,575 1,921 - - - 152,575 AG Thorburn Employee 634,644 35,761 - - 621,709 682,059
Normal 1,528,619 87,143 - - 1,576,676 29,778 DJ Thorburn Employee 992,612 18,103 - - 885,289 959,793 SJ Tucker Employee 2,501,064 144,194 - - 2,490,743 2,501,064 Non-executive directorDT Gilbert (3) Normal 28,621,272 1,780,080 - - 36,244,887 650,000
(1) The interest charged may include the impact of interest offset facilities.(2) Represents aggregate highest indebtedness of the KMP during the financial year. All other items in this table relate to the KMP and their related parties. (3) Includes business loans to persons and entities other than Mr Gilbert but over which Mr Gilbert has significant influence, including the law firm Gilbert + Tobin. The loans provided are on terms equivalent to
those that prevail in arm’s length transactions.
Other financial instrument transactions
During the year KMP of the Company and Group purchased an aggregate of 3,500 subordinated medium-term notes of the Company (NAB Subordinated Notes) each with an issue price of $100. These transactions with KMP of the Company and Group were made in the ordinary course of business and on terms equivalent to those that prevail in arm’s length transactions. As at 30 September 2012 these NAB Subordinated Notes were still held by the relevant KMP.
All other transactions with KMP of the Company and Group and their related parties are made on terms equivalent to those that prevail in arm’s length transactions. These transactions generally involve the provision of financial and investment services including services to eligible international assignees ensuring they are neither financially advantaged nor disadvantaged by their relocation. All such transactions that have occurred with KMP of the Company and Group and their related parties have been trivial or domestic in nature. In this context, transactions are trivial in nature when they are considered of little or no interest to the users of the Financial report in making and evaluating decisions about the allocation of scarce resources. Transactions are domestic in nature when they relate to personal household activities.

150 NATIONAL AUSTRALIA BANK
Notes to the financial statements
47 Equity instrument holdings of key management personnel
Equity instrument disclosures relating to key management personnel (KMP)
(i) Terms and conditions of performance options and performance rights grants
Performance options and performance rights granted by the Company to KMP of the Company and Group, including executive directors of the Company, are over ordinary shares under the Company’s National Australia Bank Executive Share Option Plan No.2 (option plan) and the National Australia Bank Performance Rights Plan (performance rights plan). No performance options or performance rights are granted to non-executive directors. The terms and conditions of each performance option and performance right granted to KMP during the year, including fair value, exercise period, exercise price, expiry date and performance conditions, are detailed in the Remuneration report. The Company moved to a policy of providing performance rights as long-term incentives from 2011.
Performance options holdings
The number of performance options over ordinary shares in the Company held during the financial year by each KMP of the Company and Group are set out below:
Performance optionsBalance at
beginning of year (1)
Granted during year as remuneration
Exercised during year
Lapsed or expired
during yearBalance at
end of yearVested
during year
Vested and exercisable at
end of yearName No. No. No. No. No. No. No.
KMP for the year ended 30 September 2012Executive directorsCA Clyne 213,667 - - (92,219) 121,448 59,013 53,947 MA Joiner 352,678 - (48,022) (93,312) 211,344 101,165 45,804 Other senior executivesLJ Gray 44,166 - - (44,166) - - - AP Hagger - - - - - - - MJ Healey 6,660 - - (6,660) - 1,348 - JC Healy 9,225 - - (9,225) - 1,867 - BF Munro 27,500 - - (27,500) - - - RJ Sawers 36,900 - - (36,900) - 7,468 - GR Slater 81,992 - - (81,992) - 12,544 - AG Thorburn 46,125 - - (46,125) - 9,334 - DJ Thorburn 96,992 - - (96,992) - 12,544 - SJ Tucker 89,575 - - (89,575) - 13,067 -
(1) Balance may include performance options granted prior to individuals becoming KMP.
Performance optionsBalance at
beginning of year (1)
Granted during year as remuneration
Exercised during year
Lapsed or expired during
yearBalance at end of year
Vested during year
Vested and exercisable at
end of yearName No. No. No. No. No. No. No.
KMP for the year ended 30 September 2011Executive directorsCA Clyne 281,712 - - (68,045) 213,667 23,405 23,405 MA Joiner 513,029 - - (160,351) 352,678 22,776 22,776 Other senior executivesLJ Gray 106,500 - - (62,334) 44,166 - - AP Hagger - - - - - - - MJ Healey 27,358 - - (20,698) 6,660 1,288 1,288 JC Healy 12,500 - - (3,275) 9,225 1,784 1,784 BF Munro 77,083 - - (49,583) 27,500 - - RJ Sawers 70,833 - - (33,933) 36,900 7,134 7,134 GR Slater 135,666 - - (53,674) 81,992 11,984 11,984 AG Thorburn 115,666 - - (69,541) 46,125 8,918 8,918 DJ Thorburn 159,333 - - (62,341) 96,992 11,984 11,984 SJ Tucker 195,666 - - (106,091) 89,575 12,484 12,484 Former executivesLM Peacock 838,209 - - (231,769) 606,440 39,427 39,427
MJ Ullmer 592,397 - - (145,958) 446,439 33,226 33,226
(1) Balance may include performance options granted prior to individuals becoming KMP.

2012 Annual Financial Report 151
Notes to the financial statements
47 Equity instrument holdings of key management personnel (continued)
Performance rights holdings
The number of performance rights over ordinary shares in the Company held during the financial year by each KMP of the Company and Group are set out below:
Performance rightsBalance at
beginning of year (1)
Granted during year as remuneration
Exercised during year
Lapsed or expired
during yearBalance at
end of yearVested during
year (2)
Vested and exercisable at
end of yearName No. No. No. No. No. No. No.
KMP for the year ended 30 September 2012Executive directorsCA Clyne 115,480 179,109 (100,572) (10,870) 183,147 100,572 - MA Joiner 4,186 67,663 (1,051) (3,135) 67,663 1,051 - Other senior executivesLJ Gray 11,042 50,749 - (11,042) 50,749 - - AP Hagger - 45,110 - - 45,110 - - MJ Healey 1,666 30,449 (660) (1,006) 30,449 337 - JC Healy 2,306 62,027 (913) (1,393) 62,027 467 - BF Munro 56,698 39,803 (49,823) (6,875) 39,803 49,823 - RJ Sawers 9,225 50,749 (3,651) (5,574) 50,749 1,867 - GR Slater 17,502 45,110 (3,136) (14,366) 45,110 3,136 - AG Thorburn 177,652 76,235 (74,467) (6,967) 172,453 74,467 - DJ Thorburn 24,248 36,016 (6,132) (18,116) 36,016 3,136 - SJ Tucker 19,272 56,387 (3,268) (16,004) 56,387 3,268 -
(1) Balance may include performance rights granted prior to individuals becoming KMP.(2) For details of performance rights that have vested during the year, refer to the Remuneration report.
Performance rightsBalance at
beginning of year (1)
Granted during year as remuneration
Exercised during year
Lapsed or expired during
yearBalance at end of year
Vested during year
Vested and exercisable at
end of yearName No. No. No. No. No. No. No.
KMP for the year ended 30 September 2011Executive directorsCA Clyne 175,714 - (23,658) (36,576) 115,480 3,478 - MA Joiner 40,365 - (1,004) (35,175) 4,186 1,004 - Other senior executivesLJ Gray 25,146 - - (14,104) 11,042 - - AP Hagger - - - - - - - MJ Healey 6,840 - - (5,174) 1,666 323 323 JC Healy 3,125 - - (819) 2,306 446 446 BF Munro 74,145 - (2,430) (15,017) 56,698 - - RJ Sawers 17,708 - - (8,483) 9,225 1,784 1,784 GR Slater 33,917 - (2,996) (13,419) 17,502 2,996 - AG Thorburn 145,230 59,116 (9,308) (17,386) 177,652 9,308 - DJ Thorburn 39,833 - - (15,585) 24,248 2,996 2,996 SJ Tucker 48,917 - (3,122) (26,523) 19,272 3,122 - Former executivesLM Peacock 119,055 - (6,982) (57,942) 54,131 6,982 -
MJ Ullmer 64,629 - (5,440) (36,490) 22,699 5,440 -
(1) Balance may include performance rights granted prior to individuals becoming KMP.

152 NATIONAL AUSTRALIA BANK
Notes to the financial statements
47 Equity instrument holdings of key management personnel (continued)
(ii) Shareholdings
The numbers of shares in the Company held (directly and nominally) by each KMP of the Company and Group or their related parties (their close family members or any entity they, or their close family members, control, jointly control or significantly influence) are set out below:
Balance at beginning of
year (1)
Granted during year as
remuneration (2)
Received during year on
exercise of performance
options or rights
Other changes during year
Balance at end of year (3)
Name No. No. No. No. No.
KMP for the year ended 30 September 2012Executive directorsCA Clyne 490,097 83,676 100,572 - 674,345 MA Joiner 448,163 30,990 49,073 (41,617) 486,609 Other senior executivesLJ Gray 158,581 22,430 - - 181,011 AP Hagger 164,982 17,462 - - 182,444 MJ Healey 113,978 16,150 660 2,115 132,903 JC Healy 352,968 27,414 913 - 381,295 BF Munro 120,623 19,938 49,823 - 190,384 RJ Sawers 161,775 22,430 3,651 (23,341) 164,515 GR Slater 144,856 15,950 3,136 (55,958) 107,984 AG Thorburn 50,221 40 74,467 (74,467) 50,261 DJ Thorburn 71,160 13,742 6,132 (72,549) 18,485 SJ Tucker 113,433 19,938 3,268 (31,770) 104,869 Non-executive directorsMA Chaney 28,373 - - - 28,373 PA Cross 18,645 - - - 18,645 DT Gilbert 19,190 - - - 19,190 KR Henry (4) - - - 2,000 2,000 PJ Rizzo 5,824 - - - 5,824 JS Segal 16,986 - - - 16,986 JG Thorn 12,333 - - - 12,333 GA Tomlinson 41,392 - - 1,199 42,591 JA Waller 4,000 - - - 4,000 AKT Yuen 5,059 - - - 5,059
Former directorGM Williamson (5) 9,407 - - - 9,407
(1) Balance may include shares held prior to individuals becoming KMP.(2) For details regarding the terms and conditions of shares granted as remuneration under employee share plans to KMP during the year, refer to the Remuneration report.(3) In addition to the above shareholdings, KMP may have investments in retail products, such as managed funds, with underlying holdings in shares of the Company.(4) Dr Henry was appointed a non-executive director on 1 November 2011.(5) Sir Malcolm Williamson retired as a director of the Company on 7 June 2012 and as Chairman of National Australia Group Europe Limited and Clydesdale Bank PLC on 23 July 2012.

2012 Annual Financial Report 153
Notes to the financial statements
47 Equity instrument holdings of key management personnel (continued)
Balance at beginning of
year (1)
Granted during year as
remuneration (2)
Received during year on
exercise of performance
options or rights
Other changes during year
Balance at end of year (3)
Name No. No. No. No. No.
KMP for the year ended 30 September 2011Executive directorsCA Clyne 254,565 211,874 23,658 - 490,097 MA Joiner 373,197 88,158 1,004 (14,196) 448,163 Other senior executivesLJ Gray 103,581 57,240 - (2,240) 158,581 AP Hagger 114,086 50,896 - - 164,982 MJ Healey 83,176 39,227 - (8,425) 113,978 JC Healy 213,269 77,946 - 61,753 352,968 BF Munro 67,688 50,505 2,430 - 120,623 RJ Sawers 118,441 61,747 - (18,413) 161,775 GR Slater 134,415 62,357 2,996 (54,912) 144,856 AG Thorburn 63,471 - 9,308 (22,558) 50,221 DJ Thorburn 64,860 24,601 - (18,301) 71,160 SJ Tucker 103,163 61,747 3,122 (54,599) 113,433 Former executivesLM Peacock 284,763 54,545 6,982 (78,913) 267,377 MJ Ullmer 246,282 91,915 5,440 (28,045) 315,592 Non-executive directorsMA Chaney 28,373 - - - 28,373 PA Cross 18,645 - - - 18,645 DT Gilbert 19,190 - - - 19,190 PJ Rizzo 5,824 - - - 5,824 JS Segal 16,986 - - - 16,986 JG Thorn 12,333 - - - 12,333 GA Tomlinson 40,428 - - 964 41,392 JA Waller 2,000 - - 2,000 4,000 GM Williamson 9,407 - - - 9,407 AKT Yuen 5,059 - - - 5,059
(1) Balance may include shares held prior to individuals becoming KMP.(2) For details regarding the terms and conditions of shares granted as remuneration under employee share plans to KMP during the year, refer to the Remuneration report.(3) In addition to the above shareholdings, KMP may have investments in retail products, such as managed funds, with underlying holdings in shares of the Company.
Holdings and transactions involving equity instruments, other than equity-based compensation, with KMP of the Company and Group or their related parties are set out below:
2012Balance at
beginning of year
Changes during year
Balance at end of year
Name No. No. No.
National Income SecuritiesDT Gilbert 1,253 - 1,253 JS Segal 180 - 180 GA Tomlinson 350 - 350
Perpetual Non-Cumulative Shares in BNZ Income Securities LtdJA Waller 250,000 - 250,000
2011Balance at
beginning of year
Changes during year
Balance at end of year
Name No. No. No.
National Income SecuritiesDT Gilbert 1,253 - 1,253 JS Segal 180 - 180 GA Tomlinson 350 - 350 MJ Ullmer 841 - 841
Perpetual Non-Cumulative Shares in BNZ Income Securities LtdJA Waller 250,000 - 250,000

154 NATIONAL AUSTRALIA BANK
Notes to the financial statements
48 Remuneration of external auditor
Group Company
2012 2011 2012 2011$’000 $’000 $’000 $’000
Amounts paid or due and payable to Ernst & Young Australia: (1)
Audit feesAudit and review of financial statements 10,987 11,178 7,118 6,966 Comfort letters 501 330 501 330
Total audit fees 11,488 11,508 7,619 7,296
Audit-related fees Regulatory 3,977 3,522 2,646 1,862 Non-regulatory 246 234 192 192
Total audit-related fees 4,223 3,756 2,838 2,054
All other fees 839 941 691 641
Total remuneration of Ernst & Young Australia 16,550 16,205 11,148 9,991
Amounts paid or due and payable to overseas practices of Ernst & Young: (1)
Audit feesAudit and review of financial statements 6,243 6,226 1,043 1,032 Comfort letters 160 19 - -
Total audit fees 6,403 6,245 1,043 1,032
Audit-related fees Regulatory 343 153 65 58 Non-regulatory 125 16 - -
Total audit-related fees 468 169 65 58
Total remuneration of overseas practices of Ernst & Young 6,871 6,414 1,108 1,090
(1) Amounts exclude goods and services tax, value-added tax or equivalent taxes.
Audit fees consist of fees for the audit of the annual consolidated financial statements of the Group and Company, including controlled entities that are required to prepare financial statements and the provision of comfort letters to underwriters in connection with securities offerings.
Audit-related fees have been divided into two sub-categories. Audit-related fees (regulatory) consist of fees for services required by statute or regulation that are reasonably related to the performance of the audit or review of the Group’s financial statements and which are traditionally performed by the external auditor. This sub-category includes engagements where the external auditor is required by statute, regulation or regulatory body to attest to the accuracy of the Group’s stated capital adequacy or other financial information or to attest to the existence or operation of specified financial controls.
Audit-related fees (non-regulatory) consist of fees for assurance and related services that are not required by statute or regulation but are reasonably related to the performance of the audit or review of the Group’s financial statements and which are traditionally performed by the external auditor.
A description of the Audit Committee’s pre-approval policies and procedures is set out in the Corporate governance section. Further details of the non-audit services provided by Ernst & Young to the Group during 2012 and the fees paid or due and payable for those services are set out in the Report of the Directors.

2012 Annual Financial Report 155
Notes to the financial statements
49 Fiduciary activities
The Group’s fiduciary activities consist of investment management and other fiduciary activities conducted as manager, custodian or trustee for a number of investments and trusts, including superannuation and approved deposit funds, and wholesale and retail investment trusts. The aggregate amounts of funds concerned, which are not included in the Group’s balance sheet, are as follows:
Group
2012 2011$m $m
Funds under management 17,981 18,035 Funds under trusteeship 7,309 6,440 Funds under custody and investment administration 722,774 676,077
Arrangements are in place to ensure that these activities are managed independently from all other activities of the Group.

156 NATIONAL AUSTRALIA BANK
Notes to the financial statements
50 Life insurance business disclosures
The Group conducts its life insurance business through a number of controlled entities including MLC Limited (MLC) in Australia and BNZ Life Insurance Limited in New Zealand. The reinsurance treaty with MLC Lifetime Ltd was recaptured in MLC on 1 October 2011.
This note is intended to provide detailed disclosures in relation to the life insurance business conducted through these controlled entities. Current year disclosures present MLC life insurance business post-recapture while prior year comparatives include MLC Lifetime as a separate entity in the Group.
Appropriately qualified actuaries have been appointed in respect of each life insurance business within the Group and they have reviewed and satisfied themselves as to the accuracy of the policy liabilities included in this Financial report, including compliance with the regulations of the Life Insurance Act 1995 (Cth) where appropriate.
(a) Risk management in life insurance business
The management of risks inherent in the life insurance business are governed by the requirements of the Life Insurance Act 1995 (Cth) and other Prudential Regulations, which include provisions to hold reserves against unmatched assets and liabilities. Insurance risk is generally managed through the use of claims management practices to ensure that only genuinely insured claims are admitted and paid, and ensuring premium rates and policy charges are priced at appropriate levels.
Insurance risk exposure arises in the life insurance business primarily through mortality (death) or morbidity (illness or injury) risks. There are no concentrations of insurance risk.
(b) Details of the solvency position of each life insurer in the Group
Australian life insurers
Under the Life Insurance Act 1995 (Cth), life insurers are required to hold reserves in excess of policy liabilities to meet certain solvency and capital adequacy requirements. These additional reserves are necessary to support the life insurer’s capital requirements under its business plan and to provide a cushion against adverse experience in managing long-term risks. In Australia, Australian Prudential Regulation Authority (APRA) has issued Prudential Standard LPS 2.04 “Solvency Standard” for determining the level of solvency reserves. This standard prescribes a minimum capital requirement for each statutory fund and the minimum level of assets required to be held in each statutory fund. Capital adequacy is determined in accordance with Prudential Standard LPS 3.04 “Capital Adequacy Standard”.
The summarised information provided below has been extracted from the financial statements prepared by each Australian life insurer in the Group for the purpose of fulfilling reporting requirements prescribed by local acts and prevailing prudential rules. For detailed solvency information on a statutory funds basis, users of this Financial report should refer to the financial statements prepared by each life insurer.
MLC MLC Lifetime
2012 2011 2012 2011$m $m $m $m
Solvency reserve as at 30 September 816 617 - 175 Assets available for solvency as at 30 September 1,542 1,089 - 404 Coverage of solvency reserve (times) 1.9 1.8 - 2.3
Non-Australian life insurers
The non-Australian life insurer in the Group is not governed by the Life Insurance Act 1995 (Cth) as it is a foreign-domiciled life insurance company. This company is required to meet and has met similar tests of capital adequacy and solvency based on the regulations of relevant local authorities.
(c) Actuarial methods and assumptions - Australian life insurers
(i) Policy liabilities
Policy liabilities have been calculated in accordance with Prudential Standard LPS 1.04 “Valuation of Policy Liabilities” issued by APRA (refer to Note 1(aa)). This measurement is consistent with the requirements of the applicable accounting standards, AASB 1038 “ Life insurance contracts”, and AASB 139 “Financial Instruments: Recognition and Measurement” and AASB 118 “Revenue” for life investment contracts.

2012 Annual Financial Report 157
Notes to the financial statements
50 Life insurance business disclosures (continued)
(ii) Types of business and profit carriers
The methods used, and in the case of life insurance contracts, the profit carriers used in order to achieve the systematic release of profit margins are:
Product type Actuarial method Profit carrier
Investment-linked Fair value n/aNon-investment-linked
Traditional business - participating Projection BonusesTraditional business - non-participating Projection ClaimsIndividual term life insurance Projection ClaimsIndividual disability income insurance Projection ClaimsGroup insurance Accumulation n/aAnnuity business Projection Annuity paymentsTerm deposits Accumulation n/aFixed rate options Accumulation n/aInvestment account Accumulation n/aNational credit card cover Accumulation n/a
(iii) Discount rates
These are the rates used to discount future cash flows to determine their present value. To the extent that policy benefits are contractually linked to the performance of assets held, the rate used is based on the market returns of those assets. For other policy liabilities, the rates used are based on risk-free rates. Rates shown are based on average duration.
2012 2011Discount rates % %
Traditional business - participatingOrdinary (1) 3.5 4.4Superannuation (1) 4.3 5.4
Traditional business - non-participating Ordinary (1) 3.9 5.0
Term life and disability income (excluding claims in payment) insurance 3.2 - 4.0 4.3 - 5.2Disability claims in payment 3.8 4.9Annuity business (2) 3.1 - 3.7 4.1 - 5.0
(1) After tax.(2) After investment expense of 0.20%.
(iv) Future expense inflation and indexation
Future maintenance expenses have been assumed to increase by inflation of 2.6% (2011: 2.6%) per annum. Future investment management fees have been assumed to remain at current rates. Benefits and/or premiums on certain policies are automatically indexed by the assumed growth in the consumer price index. The policy liabilities assume a future take-up of these indexation options based on recent experience. The assumed annual indexation rates for policy liabilities for outstanding disability income and salary continuance claims is 2.5% (2011: 2.6%).
(v) Rates of taxation
Rates of taxation in relation to the Australian life insurance business are outlined in Note 1(gg).

158 NATIONAL AUSTRALIA BANK
Notes to the financial statements
50 Life insurance business disclosures (continued)
(vi) Mortality and morbidity
Future mortality and morbidity assumptions are based on actuarial tables published by various bodies as indicated below, with adjustments to claim incidence and termination rates based on recent experience as follows:
Traditional business Male: 75% of IA 95-97 (1)
Female: 85% of IA 95-97 (1)
Term life insurance Male: 65 - 90% of IA 95-97 (1) for non-smokers with adjustments for smokers Female : 65 - 95% of IA 95-97 (1) for non-smokers with adjustments for smokers
Loan cover term life insurance Male/Female: 80 - 110% of IA 95-97 (1) for non-smokers with adjustments for smokers
Disability income insurance Male: Rates similar to 105 - 130% of incidence and 30 - 100% of termination rates of IAD 89-93 (2) Female: Rates similar to 75% of incidence and 30 - 100% of termination rates of IAD 89-93 (2)
Loan cover disability income insurance Male/Female: Rates similar to 115 - 150% for non-smokers and 145 - 185% for smokers of incidence and 100% of termination rates of IAD 89-93 (2)
Annuity business Male: 65% up to age 75 + 1% for each year onwards to maximum 100% of IM 92 (3) at age 110 Female: 47.5% up to age 75 + 1.5% for each year onwards to maximum 100% of IF 92 (3) at age 110
(1) IA 95-97 is a mortality table developed by the Institute of Actuaries of Australia based on Australian insured lives experience from 1995 to 1997.(2) IAD 89-93 is a disability table developed by the Institute of Actuaries of Australia based on Australian insured lives disability income business experience from 1989 to 1993.(3) IM 92 and IF 92 are mortality tables developed by the Institute of Actuaries and the Faculty of Actuaries based on UK annuitant lives experience from 1991 to 1994. The tables refer to male and female
lives, respectively and incorporate factors which allow for mortality improvements since the date of the investigation (there is no standard Australian annuitant mortality table).
(vii) Discontinuances
Assumed future annual rates of discontinuance for the major classes of business are as follows. Discontinuance rates may vary according to a range of policyholder variables. Rates shown generally reflect the weighted average within each range.
2012 2011Product type % %
Traditional business - participating
Ordinary 6 6Superannuation 7 7
Traditional business - non-participating Ordinary 6 6
Term life insurance 10 - 12 10 - 11
Disability insurance 11 - 12 11 - 12
Direct products (1) 17 - 35 30 - 32
(1) Rates for 2011 refers to loan cover product only.
(viii) Surrender values
Surrender values are based on the terms specified in policy contracts. The surrender value basis for traditional policies typically allows for recovery of policy acquisition and maintenance costs. In all cases, the surrender values specified in the contracts exceed those required by the Life Insurance Act 1995 (Cth).
(ix) Future participating benefits
For participating business, bonus rates are set such that over long periods, the returns to policyholders are commensurate with the investment returns achieved on relevant assets backing the policies, together with other sources of profit arising from this business. Pre-tax profits are split between policyholders and shareholders with the valuation allowing for shareholders to share in the pre-tax profits at the maximum rate of 20% (15% for certain policies issued before 1980). In applying the policyholders’ share of profits to provide bonuses, consideration is given to equity between generations of policyholders and equity between various classes and sizes of policies in force. Assumed future bonus rates included in policy liabilities are set such that the present value of policy liabilities equates to the present value of assets supporting the business together with assumed future investment returns, allowing for the shareholders’ right to participate in future pre-tax profits.
Assumed future annual bonus rates for the major classes of participating business are:Ordinary business Superannuation business
2012 2011 2012 2011% % % %
Bonus rate on sum assured 0.2 0.8 0.8 1.3Bonus rate on existing bonuses 0.2 0.8 0.8 1.3

2012 Annual Financial Report 159
Notes to the financial statements
50 Life insurance business disclosures (continued)
(d) Actuarial assumptions - non-Australian life insurers
The policy liabilities for the Group’s non-Australian life insurers have been determined by the respective entity’s actuary in accordance with the guidelines and standards mandated by their local authorities.
(e) Effects of changes in actuarial assumptions - Australian life insurers
2012 2011Increase/
(decrease) in future profit
margins
Increase/ (decrease)
in net policy liabilities
Increase/ (decrease)
in future profit margins
Increase/ (decrease)
in net policy liabilities
Assumption category $m $m $m $m
Market-related changes to discount rates (11) 99 36 23 Inflation rate - (6) - (2)Mortality and morbidity 27 (14) (164) (5)Discontinuance rates (211) - (36) - Maintenance expenses (4) - (26) - Other assumptions 9 - 147 -
Total (190) 79 (43) 16
(f) Sensitivity analyses
Sensitivity analyses are conducted to quantify the exposure to risk of changes in the key underlying variables such as risk discount rate, mortality, morbidity, discontinuances and expenses. The valuations included in the reported results and the best estimate of future performance are calculated using certain assumptions about these variables. The movement in any key variable will impact the performance and financial position and as such represents risk. The following table illustrates how changes in key assumptions (other than interest rates) would impact the reported profit and policy liabilities of the Group in respect of life insurance business.
2012
Gross (before reinsurance) Net (of reinsurance)
Variable Change in variable
Profit/ (loss) and
share- holder’s
equity $m
Policy liabilities
$m
Profit/ (loss) and
share- holder’s
equity $m
Policy liabilities
$m
Risk discount rate 1% increase in risk discount rate (20) (84) (32) (67)Inflation rate 0.5% increase in inflation rate (9) 43 (3) 33 Annuitant mortality 50% increase in rate of mortality improvements (12) 17 (12) 17 Mortality 10% increase in mortality rates - 1 - 1 Morbidity 10% increase in disability incidence rates - - - - Morbidity 10% decrease in disability termination rates (36) 51 (26) 37 Discontinuance rates 10% increase in discontinuance rates - 1 - 1 Maintenance expenses 10% increase in maintenance expenses (1) 3 (1) 3
2011
Gross (before reinsurance) Net (of reinsurance)
Variable Change in variable
Profit/ (loss) and
share- holder’s
equity $m
Policy liabilities
$m
Profit/ (loss) and
share- holder’s
equity $m
Policy liabilities
$m
Inflation rate 0.5% increase in inflation rate (7) 33 (7) 31 Annuitant mortality 50% increase in rate of mortality improvements (20) 28 (20) 28 Mortality 10% increase in mortality rates - 1 - 1 Morbidity 10% increase in disability incidence rates - - - - Morbidity 10% decrease in disability termination rates (31) 45 (25) 36 Discontinuance rates 10% increase in discontinuance rates - 1 - 1 Maintenance expenses 10% increase in maintenance expenses (1) 2 (1) 2

160 NATIONAL AUSTRALIA BANK
Notes to the financial statements
50 Life insurance business disclosures (continued)
(g) Terms and conditions of insurance contracts
The key terms and conditions of life insurance contracts that have a material effect on the amount, timing and uncertainty of future cash flows are outlined below:
Type of contract Nature of product Key variables affecting future cash flows
Term life and disability Payment of specified benefits on death or ill health of policyholder Mortality, morbidity, discontinuances
Life annuity contracts Regular income for the life of the insured in exchange for initial single premium
Mortality
Conventional with discretionary participating benefits Combination of life insurance and savings. Sum assured is specified and is augmented by annual reversionary bonuses
Mortality, lapse rates, investment earnings
(h) Other life insurance disclosures
Group2012 2011
Sources of operating profit $m $m
Life insurance contractsEmergence of shareholder planned margins 189 182 Experience profit/(loss) 28 18 Reversal of capitalised losses/(losses recognised) 7 (5)
Life investment contractsFees earned 140 128
Investment earnings on shareholder retained profits and capital 109 104
Group2012 2011
Schedule of expenses $m $m
Outward reinsurance expense 205 199 Claims expense 800 794 Policy acquisition expense (1)
Commission 227 222 Other 184 184
Policy maintenance expense (2)
Commission 272 262 Other 225 246
Investment management expense 5 5
(1) The Group policy acquisition expense includes $218 million (2011: $217 million) relating to life insurance contracts, of which $79 million (2011: $80 million) relates to commissions.(2) The Group policy maintenance expense includes $250 million (2011: $234 million) relating to life insurance contracts.

2012 Annual Financial Report 161
Notes to the financial statements
51 Capital adequacy
As an authorised deposit-taking institution (ADI), the Company is subject to regulation by Australian Prudential Regulation Authority (APRA) under the authority of the Banking Act 1959 (Cth). APRA has set minimum regulatory capital requirements for banks that are consistent with the Basel II Framework.
The Group’s capital structure comprises various forms of capital. For regulatory purposes, capital has two base elements, eligible Tier 1 and Tier 2 capital, from which certain deductions are made to arrive at net Tier 1 and net Tier 2 capital. Tier 1 capital is made up of largely what is presented in the financial statements being shareholders equity. From this a number of elements must be deducted such as goodwill. Tier 2 capital is the next group that when combined with Tier 1 capital represents the total capital available to support the Group from a regulatory view against unexpected losses. Tier 2 capital generally includes long-term subordinated debt.
APRA has set minimum ratios that compare the regulatory capital with risk-weighted assets (on and off balance sheet). Australian banks are required to maintain a minimum ratio of total eligible capital base to total risk-weighted assets of 8.0%, of which a minimum of 4.0% must be held in Tier 1 capital. The numerator of the ratio is the total capital base. The denominator of the ratio is the total risk-weighted asset exposure (i.e. the sum of all credit, operational, Interest Rate Risk in the Banking Book (IRRBB) and market risk-weighted exposure).
In addition to the minimum total capital base ratio described above, APRA sets a Prudential Capital Ratio at a level proportional to an ADI’s overall risk profile. A breach of the required ratios under the prudential standards may trigger legally enforceable directions by APRA, which can include a direction to raise additional capital or to cease business.
Under APRA’s Prudential Standards, life insurance and funds management entities activities are deconsolidated for the purposes of calculating capital adequacy and excluded from the risk based capital adequacy framework. The intangible component of the investment in these controlled entities is deducted from Tier 1 capital with the balance of the investment deducted 50% from Tier 1 and 50% from Tier 2 capital. Additionally, any profits from these activities included in the Group’s results are excluded from the determination of Tier 1 capital to the extent they have not been remitted to the Company.
In December 2010 the Basel Committee released its finalised standards for wide ranging regulatory reform of the capital and liquidity framework. In September 2012, APRA released its final capital standards relating to its implementation of Basel III that will take effect from 1 January 2013. Other areas of its capital reform package are yet to be finalised.
Capital ratios are monitored against internal capital targets that are set over and above minimum capital requirements set by the Principal Board (Board). The Group’s current Board approved Basel II Tier 1 target is above 8%. From 1 January 2013, the Group will move to the Basel III Common Equity Tier 1 (CET1) ratio target of above 7.5% and will look to operate at a comfortable buffer to this target. This compares to the Group’s estimated CET1 of 7.9% as at 30 September 2012. The Group will continue to regularly review capital levels in light of the outlook.
52 Events subsequent to balance date The UK Commercial Real Estate (CRE) business, comprising assets with balances before provisions of $8,723 million, was transferred from Clydesdale Bank PLC (Clydesdale) to the Company on 5 October 2012 as part of the UK Banking strategic review.
The portfolio of assets that has been transferred includes the majority of Clydesdale’s CRE exposures, together with some associated loans and other assets, and will be run-off as the assets reach maturity (subject to customers’ ability to refinance or repay). The assets were transferred at book value and proceeds from the transfer were largely used to repay intra-Group funding. Some residual UK CRE assets have been retained by Clydesdale.

162 NATIONAL AUSTRALIA BANK
Directors’ declarationThe directors of National Australia Bank Limited declare that:
1 (a) intheopinionofthedirectors,thefinancialstatementsandthenotestheretoassetoutonpages53to161andtheadditionaldisclosuresincludedintheauditedpagesoftheRemuneration report,complywithAustralianAccountingStandards(includingtheAustralianAccountingInterpretations),InternationalFinancialReportingStandardsasstatedinNote 1(b)tothefinancialstatements,andtheCorporations Act 2001 (Cth);
(b) intheopinionofthedirectors,thefinancialstatementsandnotestheretogiveatrueandfairviewofthefinancialpositionoftheCompanyandtheGroupasat30September2012,andoftheperformanceoftheCompanyandtheGroupfortheyearended30September2012;
(c) intheopinionofthedirectors,atthedateofthisdeclaration,therearereasonablegroundstobelievethattheCompanywillbeabletopayits debts as and when they become due and payable; and
(d) thedirectorshavebeengiventhedeclarationsrequiredbysection295AoftheCorporations Act 2001 (Cth); and
2 therearereasonablegroundstobelievethattheCompanyandcertaincontrolledentitieswill,asagroup,beabletomeetanyobligationsorliabilitiestowhichtheyareormaybecomesubjectbyvirtueofthedeedofcrossguaranteebetweentheCompanyandthosecontrolledentitiespursuanttoAustralianSecuritiesandInvestmentsCommissionClassOrder98/1418dated13August1998(refertoNotes 39 and 40tothefinancialstatements for further details).
Datedthis19thdayofNovember2012andsignedinaccordancewitharesolutionofthedirectors:
Michael A ChaneyChairman
Cameron A ClyneGroupChiefExecutiveOfficer

2012 Annual Financial Report 163
Liability limited by a scheme approved under Professional Standards Legislation
Independent auditor's report to the members of National Australia Bank Limited
Report on the financial report
We have audited the accompanying financial report of National Australia Bank Limited (the “Company”), which comprises the balance sheet as at 30 September 2012, the income statement, statement of comprehensive income, statement of changes in equity and cash flow statement for the year ended on that date, notes comprising a summary of significant accounting policies and other explanatory information, and the directors' declaration of the consolidated entity comprising the Company and the entities it controlled (the “Group”) at the year's end or from time to time during the financial year.
Directors' responsibility for the financial report
The directors of the Company are responsible for the preparation of the financial report that gives a true and fair view in accordance with Australian Accounting Standards and the Corporations Act 2001 and for such internal controls as the directors determine are necessary to enable the preparation of the financial report that is free from material misstatement, whether due to fraud or error. In Note 1, the directors also state, in accordance with Accounting Standard AASB 101 Presentation of Financial Statements, that the financial statements comply with International Financial Reporting Standards as issued by the International Accounting Standards Board.
Auditor's responsibility
Our responsibility is to express an opinion on the financial report based on our audit. We conducted our audit in accordance with Australian Auditing Standards. Those standards require that we comply with relevant ethical requirements relating to audit engagements and plan and perform the audit to obtain reasonable assurance about whether the financial report is free from material misstatement.
An audit involves performing procedures to obtain audit evidence about the amounts and disclosures in the financial report. The procedures selected depend on the auditor's judgment, including the assessment of the risks of material misstatement of the financial report, whether due to fraud or error. In making those risk assessments, the auditor considers internal controls relevant to the entity's preparation and fair presentation of the financial report in order to design audit procedures that are appropriate in the circumstances, but not for the purpose of expressing an opinion on the effectiveness of the entity's internal controls. An audit also includes evaluating the appropriateness of accounting policies used and the reasonableness of accounting estimates made by the directors, as well as evaluating the overall presentation of the financial report.
We believe that the audit evidence we have obtained is sufficient and appropriate to provide a basis for our audit opinion.
Independence
In conducting our audit we have complied with the independence requirements of the Corporations Act 2001. We have given to the directors of the Company a written Auditor’s Independence Declaration, a copy of which is included in the Report of the Directors.

164 NATIONAL AUSTRALIA BANK
Opinion
In our opinion:
a. the financial report of National Australia Bank Limited is in accordance with the Corporations Act 2001, including:
i giving a true and fair view of the financial position of the Company and the Group as at 30 September 2012 and of their performance for the year ended on that date; and
ii complying with Australian Accounting Standards and the Corporations Regulations 2001; and
b. the financial report also complies with International Financial Reporting Standards as issued by the International Accounting Standards Board.
Report on the remuneration report
We have audited the Remuneration Report included in pages 15 to 39 of the Report of the Directors for the year ended 30 September 2012. The directors of the Company are responsible for the preparation and presentation of the Remuneration Report in accordance with section 300A of the Corporations Act 2001. Our responsibility is to express an opinion on the Remuneration Report, based on our audit conducted in accordance with Australian Auditing Standards.
Opinion
In our opinion, the Remuneration Report of National Australia Bank Limited for the year ended 30 September 2012, complies with section 300A of the Corporations Act 2001.
Ernst & Young
AJ (Tony) Johnson Partner Melbourne 19 November 2012

2012 Annual Financial Report 165
Shareholder informationTwenty largest registered fully paid ordinary shareholders of the company as at 31 October 2012
Number of shares %
HSBC Custody Nominees 378,019,172 16.46 JP Morgan Nominees Australia Limited 305,042,132 13.28 National Nominees Limited 258,537,171 11.25 Citicorp Nominees Pty Limited 76,460,685 3.33 BNP Paribas Nominees Pty Limited 43,174,731 1.88 Citicorp Nominees Pty Limited, Colonial First State Inv A/C 36,402,076 1.58 JP Morgan Nominees Australia Limited, Cash Income A/C 27,300,364 1.19 National Australia Trustees 25,095,722 1.09 AMP Group 17,565,667 0.76 RBC Investor Services Australia Nominees Pty Limited, PIPOOLED A/C 12,651,822 0.55 HSBC Custody Nominees (Australia) Limited 11,112,058 0.48 BNP Paribas Nominees Pty Limited, DRP 9,896,837 0.43 UBS Wealth Management Australia Nominees Pty Limited 9,770,847 0.43 BNP Paribas Nominees Pty Limited, SMP A/C 9,658,042 0.42 Australia Foundation Investment Company Limited 9,342,065 0.41 Queensland Investment Corporation 7,938,149 0.35 HSBC Custody Nominees (Australia) Limited - GSCO ECA 7,015,517 0.31 Perpetual Trustee Aust Group 6,525,993 0.28 Argo Investments Limited 5,156,609 0.22 Navigator Australia Limited, Navigator Pers Plan Sett A/c 5,094,181 0.22
Total 1,261,759,840 54.92
Substantial shareholders
As at 31 October 2012 there were no persons with a substantial shareholding in the Company.
Distribution of fully paid ordinary shareholdingsNumber of
shareholders % of holdersNumber of
shares % of shares
Range (number)1 – 1,000 285,373 59.1 114,012,443 5.0 1,001 – 5,000 161,184 33.4 353,590,407 15.4 5,001 – 10,000 23,078 4.8 160,207,448 7.0 10,001 – 100,000 12,972 2.7 265,387,566 11.5 100,001 and over 414 0.0 1,404,049,090 61.1
Total 483,021 100.0 2,297,246,954 100.0
Less than marketable parcel of $500 14,425 119,991
Voting rights
Each ordinary shareholder present at a general meeting (whether in person or by proxy or representative) is entitled to one vote on a show of hands or, on a poll, one vote for each fully paid ordinary share held. Holders of partly paid shares voting on a poll are entitled to a number of votes based upon the proportion that the amount of capital call and paid up on the shares bears to the total issue price of the shares.

166 NATIONAL AUSTRALIA BANK
Shareholder informationTwenty largest registered National Income Securities (NIS) holders as at 31 October 2012
Number of securities %
National Nominees Limited 724,295 3.62 JP Morgan Nominees Australia Limited 607,021 3.04 Bow Lane Nominees Pty Limited 537,560 2.69 HSBC Custody Nominees (Australia) Limited 483,506 2.42 UBS Wealth Management Australia Nominees Pty Limited 330,994 1.65 Navigator Australia Limited, Navigator Pers Plan Sett A/C 290,033 1.45 Nulis Nominees (Australia) Limited, Navigator Mast Plan Sett A/C 275,607 1.38 Questor Financial Services Limited, TPS RF A/C 192,494 0.96 M F Custodians Limited 123,239 0.62 UBS Nominees Pty Limited, TP00014 10 A/C 104,198 0.52 BNP Paribas Nominees Pty Limited <Master Custody DRP> 88,194 0.44 JP Morgan Nominees Australia Limited, Cash Income A/C 75,102 0.38 Peninsula Harbour Pty Limited, Peninsula Harbour Unit A/C 73,000 0.37 RBC Investor Services Australia Nominees Pty Limited, GSENIP A/C 72,986 0.36 Australian Executor Trustees Limited, No 1 A/C 71,133 0.36 Perpetual Trustee Company Limited 69,740 0.35 HSBC Custody Nominees (Australia) Limited A/C 2 69,199 0.35 Citicorp Nominees Pty Limited 66,132 0.33 Custodial Services Limited, Beneficiaries Holdings A/C 59,452 0.30 Dudley Pines Pty Limited 57,816 0.29
Total 4,371,701 21.88
Distribution of NIS holdingsNumber of
holders % of holdersNumber of securities % of securities
Range (number)1 – 1,000 33,992 92.7 8,012,080 40.1 1,001 – 5,000 2,395 6.5 4,680,748 23.4 5,001 – 10,000 148 0.4 1,044,213 5.2 10,001 – 100,000 109 0.3 2,594,012 13.0 100,001 and over 10 0.1 3,668,947 18.3
Total 36,654 100.0 20,000,000 100.0
Less than marketable parcel of $500 52 240
Voting rights
Holders of the NIS preference shares are entitled to vote together with the holders of ordinary shares in the Company (to the extent that these shareholders are entitled to vote) on the basis of one vote per NIS preference share on a limited number of matters including any proposal to wind up the Company or any proposal to affect the rights attaching to the NIS preference shares.

2012 Annual Financial Report 167
Shareholder informationChairmanMr Michael A Chaney AO, BSc, MBA, Hon. LLD W. Aust, FAIM, FCID
Group Chief Executive OfficerMr Cameron A Clyne BA
Executive Director, FinanceMr Mark A Joiner ACA, MBA
Registered officeLevel 4, (UB4440) 800 Bourke Street DOCKLANDS VIC 3008 Australia Tel: 1300 367 647
AuditorErnst & Young 8 Exhibition Street MELBOURNE VIC 3000 Australia Tel: +61 3 9288 8000 Fax: +61 3 8650 7777
Company SecretaryMs Michaela J Healey LLB, FCIS
Shareholders’ centre websiteThe Group’s website at www.nabgroup.com has a dedicated separate section where shareholders can gain access to a wide range of information, including copies of recent announcements, annual financial reports as well as extensive historical information.
Shareholders’ centre information lineThere is a convenient 24 hours a day, 7 days a week automated service. To obtain the current balance of your ordinary shareholding and relevant dividend payment details, telephone 1300 367 647 (Australia) or +61 3 9415 4299 (outside Australia).
Contact detailsThese services are secured to protect your interests. In all communications with the Share Registry, please ensure you quote your security holder reference number (SRN), or in case of broker sponsored shareholders, your holder identification number (HIN).
Principal share register
Computershare Investor Services Pty Limited Yarra Falls 452 Johnston Street ABBOTSFORD VIC 3067 Australia
Postal address: GPO Box 2333 MELBOURNE VIC 3001 Australia
Local call: 1300 367 647 Fax: (03) 9473 2500
Telephone and fax (outside Australia): Tel: +61 3 9415 4299; Fax: +61 3 9473 2500 Email: [email protected] Website: www.nabgroup.com
UK share registerComputershare Investor Services PLC The Pavilions Bridgwater Road BRISTOL BS99 6ZZ United Kingdom
Tel: +44 870 703 0197 Fax: +44 870 703 6101
Email: [email protected] Website: www.nabgroup.com
United States ADR depositary, Transfer agent and registrarBNY Mellon Shareowner Services PO Box 358516 PITTSBURGH PA 15252-8516 United States of America
US Toll Free for Domestic calls Tel : 1-888-BNY-ADRS Tel : +1 201 680 6825 (outside US)
Email: [email protected] Website: www.bnymellon.com/shareowner

168 NATIONAL AUSTRALIA BANK
Shareholder informationOfficial quotationFully paid ordinary shares of the Company are quoted on the ASX.
The Group has also issued: • National Income Securities, medium-term notes and mortgage backed securities which are quoted on the ASX; • subordinated bonds and perpetual shares through BNZ Income Securities Limited and BNZ Income Securities 2 Limited which are quoted on the
NZDX of the New Zealand Exchange; • Trust Preferred Securities, National Capital Instruments, Perpetual Capital Notes, medium-term notes, mortgage backed securities, subordinated
bonds and covered bonds which are quoted on the Luxembourg Stock Exchange; • Trust Preferred Securities, medium-term notes and subordinated notes which are quoted on the Channel Islands Stock Exchange; • undated subordinated floating rate notes, mortgage backed securities and covered bonds which are quoted on the London Stock Exchange; and• medium-term notes which are quoted on the Swiss Stock Exchange.
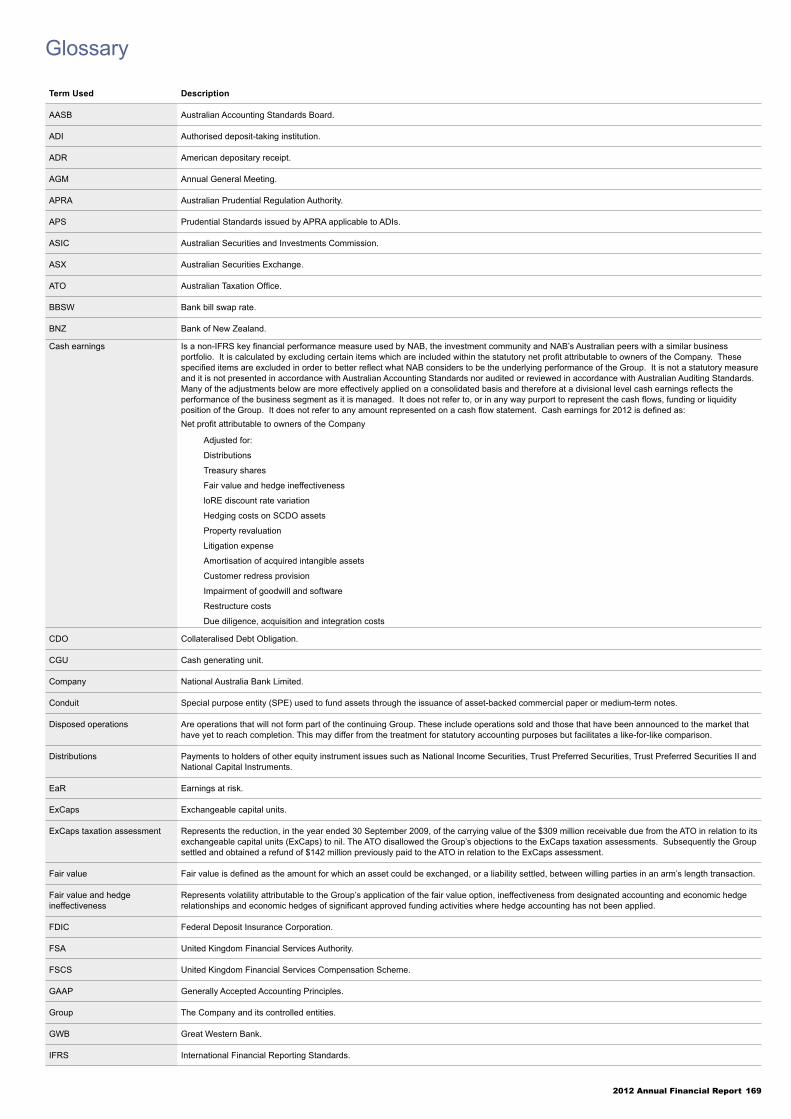
2012 Annual Financial Report 169
Glossary
Term Used Description
AASB Australian Accounting Standards Board.
ADI Authorised deposit-taking institution.
ADR American depositary receipt.
AGM Annual General Meeting.
APRA Australian Prudential Regulation Authority.
APS Prudential Standards issued by APRA applicable to ADIs.
ASIC Australian Securities and Investments Commission.
ASX Australian Securities Exchange.
ATO Australian Taxation Office.
BBSW Bank bill swap rate.
BNZ Bank of New Zealand.
Cash earnings Is a non-IFRS key financial performance measure used by NAB, the investment community and NAB’s Australian peers with a similar business portfolio. It is calculated by excluding certain items which are included within the statutory net profit attributable to owners of the Company. These specified items are excluded in order to better reflect what NAB considers to be the underlying performance of the Group. It is not a statutory measure and it is not presented in accordance with Australian Accounting Standards nor audited or reviewed in accordance with Australian Auditing Standards. Many of the adjustments below are more effectively applied on a consolidated basis and therefore at a divisional level cash earnings reflects the performance of the business segment as it is managed. It does not refer to, or in any way purport to represent the cash flows, funding or liquidity position of the Group. It does not refer to any amount represented on a cash flow statement. Cash earnings for 2012 is defined as:Net profit attributable to owners of the Company
Adjusted for:
Distributions
Treasury shares
Fair value and hedge ineffectiveness
loRE discount rate variation
Hedging costs on SCDO assets
Property revaluation
Litigation expense
Amortisation of acquired intangible assets
Customer redress provision
Impairment of goodwill and software
Restructure costs
Due diligence, acquisition and integration costs
CDO Collateralised Debt Obligation.
CGU Cash generating unit.
Company National Australia Bank Limited.
Conduit Special purpose entity (SPE) used to fund assets through the issuance of asset-backed commercial paper or medium-term notes.
Disposed operations Are operations that will not form part of the continuing Group. These include operations sold and those that have been announced to the market that have yet to reach completion. This may differ from the treatment for statutory accounting purposes but facilitates a like-for-like comparison.
Distributions Payments to holders of other equity instrument issues such as National Income Securities, Trust Preferred Securities, Trust Preferred Securities II and National Capital Instruments.
EaR Earnings at risk.
ExCaps Exchangeable capital units.
ExCaps taxation assessment Represents the reduction, in the year ended 30 September 2009, of the carrying value of the $309 million receivable due from the ATO in relation to its exchangeable capital units (ExCaps) to nil. The ATO disallowed the Group’s objections to the ExCaps taxation assessments. Subsequently the Group settled and obtained a refund of $142 million previously paid to the ATO in relation to the ExCaps assessment.
Fair value Fair value is defined as the amount for which an asset could be exchanged, or a liability settled, between willing parties in an arm’s length transaction.
Fair value and hedge ineffectiveness
Represents volatility attributable to the Group’s application of the fair value option, ineffectiveness from designated accounting and economic hedge relationships and economic hedges of significant approved funding activities where hedge accounting has not been applied.
FDIC Federal Deposit Insurance Corporation.
FSA United Kingdom Financial Services Authority.
FSCS United Kingdom Financial Services Compensation Scheme.
GAAP Generally Accepted Accounting Principles.
Group The Company and its controlled entities.
GWB Great Western Bank.
IFRS International Financial Reporting Standards.

170 NATIONAL AUSTRALIA BANK
Glossary
Term Used Description
Impaired Assets Consist of: - retail loans (excluding unsecured portfolio managed facilities) which are contractually past due 90 days with security insufficient to cover principal and arrears of interest revenue; - non-retail loans which are contractually past due and there is sufficient doubt about the ultimate collectibility of principal and interest; and - impaired off-balance sheet credit exposures where current circumstances indicate that losses may be incurred. Unsecured portfolio managed facilities are also classified as impaired assets when they become 180 days past due (if not written off).
Investments - AFS Investments - available for sale.
Investments - HTM Investments - held to maturity.
IoRE Investment earnings (net of tax) on shareholders retained profits and capital from life businesses, net of capital funding costs (IoRE), is comprised of three items: - investment earnings on surplus assets which are held in the Statutory Funds to meet capital adequacy requirements under the Life Insurance Act 1995 (Cth); - interest on deferred acquisition costs (net of reinsurance) included in insurance policy liabilities resulting from the unwind of discounting; and - less the borrowing costs of any capital funding initiatives.
IoRE discount rate variation The profit impact of a change in value of deferred acquisition costs (net of reinsurance) included in insurance policy liabilities resulting from a movement in the inflation adjusted risk-free discount rate.
IRRBB Interest rate risk in the banking book.
ISDA International Swaps and Derivatives Association.
LPS Prudential Standards issued by APRA applicable to life companies.
MoS Margin on Services.
NAB The Company and its controlled entities.
NCI National Capital Instrument.
Net interest margin Net interest income as a percentage of average interest earning assets.
Net profit attributable to owners of the Company
Represents the Group’s statutory profit after tax and reflects the amount of net profit that is attributable to owners.
Net profit attributable to non-controlling interest
Reflects the allocation of profit to non-controlling interests in the Group, and is adjusted from net profit to reflect the amount of net profit that is attributable to owners.
NIS National Income Securities.
Non-impaired assets 90+ days past due
Non-impaired assets 90+ days past due consist of well-secured assets that are more than 90 days past due and portfolio-managed facilities that are not well secured and between 90 and 180 days past due.
NWMSL National Wealth Management Services Limited.
NZ New Zealand.
NZDX New Zealand Debt Market.
NZX New Zealand Exchange Limited.
PPI Payment protection insurance.
Property revaluation Represents revaluation increments and decrements of land and buildings based on directors’ valuations to reflect fair value.
Return on equity (ROE) ROE is calculated as cash earnings divided by average shareholders’ equity, excluding non-controlling interests and other equity instruments and adjusted for treasury shares.
Risk-weighted assets (RWA) A quantitative measure of the Group’s risk, required by the APRA risk-based capital adequacy framework, covering credit risk for on- and off-balance sheet exposures, market risk, operational risk and interest rate risk in the banking book.
SCDO Synthetic Collateralised Debt Obligation.
SEC United States Securities and Exchange Commission.
Securitisation Structured finance technique which involves pooling and packaging cash-flow converting financial assets into securities that can be sold to investors.
Special Purpose Entity (SPE) An entity created to accomplish a narrow well-defined objective (e.g. securitisation of financial assets). An SPE may take the form of a corporation, trust, partnership or unincorporated entity. SPEs are often created with legal arrangements that impose strict limits on the activities of the SPE.
Tier 1 ratio Tier 1 capital as defined by APRA divided by risk-weighted assets.
Tier 2 ratio Tier 2 capital as defined by APRA divided by risk-weighted assets.
Total Business Return (TBR) Is a value management tool using the metrics of ROE and cash earnings growth to provide an assessment of relative value creation.
Total Shareholder Return (TSR) Is a concept used to compare the performance of different companies’ stocks and shares over time. It combines share price appreciation and dividends paid to show the total return to the shareholder. The absolute size of the TSR will vary with stock markets, but the relative position reflects the market perception of overall performance relative to a reference group.
Treasury shares Shares in the Company held by the Group’s life insurance business and in trust by a controlled entity of the Group to meet the requirements of employee incentive schemes. The unrealised mark-to-market movements arising from changes in the share price, dividend income and realised profit and losses arising from share sales from shares held by the Group’s life insurance business are eliminated for statutory reporting purposes.
UK United Kingdom.

2012 Annual Financial Report 171
Glossary
Term Used Description
US United States of America.
VaR Value at risk.
Weighted Average Number of Shares
Calculated in accordance with the requirements of AASB 133 ‘Earnings per Share’.

This page has been left blank intentionally.

National Australia Bank Limited Group Offices800 Bourke StreetDocklands Vic 3008AustraliaIf calling within Australia - 1300 889 398Tel: +61 3 8641 9083Fax: 1300 099 249 (within Australia)Fax: +61 3 8641 4927 (International only)
www.nabgroup.com.au
New York Branch28th Floor, 245 Park AvenueNew York NY 10167United States of AmericaTel: +1 212 916 9500Fax: +1 212 983 5252
National Australia Group Europe Limited88 Wood StreetLondon EC2V 7QQEnglandUnited KingdomTel: +44 (0)20 7710 2100
National Wealth Management Holdings LimitedGround Floor, MLC Building105 – 153 Miller StreetNorth Sydney NSW 2060AustraliaTel: +61 2 9957 8022Fax: +61 2 9964 3334
Hong Kong BranchLevel 27 One Pacific Place88 QueenswayHong KongTel: + 852 2822 9800Tel: + 852 2826 8111(HK Branch)Fax: + 852 2845 9251(HK Branch)
www.nabasia.com
London Branch88 Wood Street,London EC2V 7QQEnglandUnited KingdomTel: +44 (0)20 7710 2100
MLC LimitedGround Floor, MLC Building105 – 153 Miller StreetNorth Sydney NSW 2060AustraliaTel: +61 2 9957 8022Fax: +61 2 9964 3334MLC Adviser Hotline: 133652
www.mlc.com.au
Singapore Branch5 Temasek Boulevard#15-01 Suntec Tower FiveSingapore 038985Tel: + 65 6419 6800Fax: + 65 6338 0039
www.nabasia.com
National Australia Merchant Bank (S) Ltd.
5 Temasek Boulevard#15-01 Suntec Tower FiveSingapore 038985Tel: + 65 6419 6802Fax: + 65 6338 0039
www.nabasia.com
Clydesdale Bank PLC30 St Vincent PlaceGlasgow G1 2HLScotlandUnited KingdomTel: +44 141 248 7070Fax: +44 141 204 0828
www.cbonline.co.uk
National Australia Financial Management LimitedGround Floor, MLC Building105 – 153 Miller StreetNorth Sydney NSW 2060AustraliaTel: +61 2 9957 8022Fax: +61 2 9964 3334
Tokyo BranchMuromachi Higashi Mitsui Building2-2-1 Nihonbashi MuromachiChuo-kuTokyo 103-0022JapanTel: + 81 3 3241 8781Fax: + 81 3 3241 8951
www.nabasia.co.jp
Osaka Sub-BranchHanshin SankeiSakurabashi Building2-4-13 UmedaKita-kuOsaka 530-0001JapanTel : + 81 6 6456 3481Fax : + 81 6 6456 3482
www.nabasia.co.jp
Clydesdale Bank PLC trading as Yorkshire Bank20 Merrion WayLeeds LS2 8NZEnglandUnited KingdomTel: +44 113 807 2000
www.ybonline.co.uk
NAB Asset Servicing12/500 Bourke Street(GPO Box 1406)Melbourne Vic 3001AustraliaTel: +61 3 8641 1122Tel : +1300 738 036Fax: +61 1300 556 414SWIFT: NATAAU3303X
www.assetservicing.nabgroup.com
Beijing Representative Office2326 China World Tower OneChina World Trade CenterNo. 1 Jian Guo Men Wai AvenueBeijing 100004People’s Republic of ChinaTel: +86 10 6505 2255Fax: +86 10 6505 7156
www.nabasia.com
Shanghai BranchSite 4201 – 4204, 42th FloorOne Luijiazui68 Middle Yincheng RoadPudong New AreaShangai 200120People’s Republic of ChinaTel : + 86 21 2089 0288Fax : + 86 21 6100 0531
www.nabasia.com
Bank of New ZealandLevel 480 Queen StreetAuckland 1010New ZealandTel: +64 9 375 1300Fax: +64 9 375 1023
www.bnz.co.nz
Great Western Bank35 1st Avenue N.E.Watertown, SD 57201South DakotaUnited States of AmericaTel: +1 605 886 8401Fax: +1 605 886 7088
www.greatwesternbank.com
National Australia Trustees LimitedLevel 5800 Bourke StreetDocklands VIC 3008Correspondence to:Docklands 2506 UB(GPO Box 247)Melbourne Vic 3001AustraliaTel: 1800 036 172 (within Australia)Tel: +61 3 8634 1323 (International only)Fax: 1300 117 996 (within Australia)Fax: +61 3 8634 4455 (International only)
Indonesia Representative Office106E, 6th FloorSentral Senayan I8 Jalan Asia AfrikaGelora Bung KarnoJakarta 10270Republic of IndonesiaTel : + 62 21 572 4111Fax : + 62 21 572 4120
www.nabasia.com
Mumbai BranchNational Australia Bank901, 9th Floor,Nariman Bhavan, 227 Backbay ReclamationNariman PointMumbai 400 021IndiaPhone +91 22 6198 8200Fax +91 22 6198 8299
www.nabasia.com
Principal Establishments

Join us incutting paper useMany NAB Group shareholders have chosento receive electronic – rather than paper –communications through NAB’s PaperCutsprogram. Join them and help us cut paper useby following the prompts atwww.computershare.com.au/easyupdate/nab
www.nabgroup.comThis publication is printed on ReviveLaser paper stock. Revive Laser is 100%Forest Stewardship Council (FSC) certifiedpost-consumer recycled pulp and alsocertified Carbon Neutral under theAustralian National Carbon OffsetStandard. It is made in Australia by anISO 14001 (environmental managementsystem) certified mill. No chlorinebleaching occurs in the recycling process.The printer’s operation is accreditedto ISO 14001 and ISO 9001 (qualitymanagement system) standards andholds FSC (Chain of Custody) certification.
The full Paper Impact Statementcan be viewed at:
www.nabgroup.com/annualreport
76764A1112