
and main contributions from CYP1A2 and UGT1A1...
14
Full Terms & Conditions of access and use can be found at http://www.tandfonline.com/action/journalInformation?journalCode=ixen20 Download by: [Georgia Tech Library] Date: 01 January 2017, At: 08:18 Xenobiotica the fate of foreign compounds in biological systems ISSN: 0049-8254 (Print) 1366-5928 (Online) Journal homepage: http://www.tandfonline.com/loi/ixen20 Metabolism of the anthelmintic drug niclosamide by cytochrome P450 enzymes and UDP- glucuronosyltransferases: metabolite elucidation and main contributions from CYP1A2 and UGT1A1 Danyi Lu, Zhiguo Ma, Tianpeng Zhang, Xingwang Zhang & Baojian Wu To cite this article: Danyi Lu, Zhiguo Ma, Tianpeng Zhang, Xingwang Zhang & Baojian Wu (2016) Metabolism of the anthelmintic drug niclosamide by cytochrome P450 enzymes and UDP-glucuronosyltransferases: metabolite elucidation and main contributions from CYP1A2 and UGT1A1, Xenobiotica, 46:1, 1-13, DOI: 10.3109/00498254.2015.1047812 To link to this article: http://dx.doi.org/10.3109/00498254.2015.1047812 View supplementary material Published online: 11 Jun 2015. Submit your article to this journal Article views: 222 View related articles View Crossmark data Citing articles: 3 View citing articles
Transcript of and main contributions from CYP1A2 and UGT1A1...
Full Terms & Conditions of access and use can be found athttp://www.tandfonline.com/action/journalInformation?journalCode=ixen20
Download by: [Georgia Tech Library] Date: 01 January 2017, At: 08:18
Xenobioticathe fate of foreign compounds in biological systems
ISSN: 0049-8254 (Print) 1366-5928 (Online) Journal homepage: http://www.tandfonline.com/loi/ixen20
Metabolism of the anthelmintic drug niclosamideby cytochrome P450 enzymes and UDP-glucuronosyltransferases: metabolite elucidationand main contributions from CYP1A2 and UGT1A1
Danyi Lu, Zhiguo Ma, Tianpeng Zhang, Xingwang Zhang & Baojian Wu
To cite this article: Danyi Lu, Zhiguo Ma, Tianpeng Zhang, Xingwang Zhang & Baojian Wu(2016) Metabolism of the anthelmintic drug niclosamide by cytochrome P450 enzymes andUDP-glucuronosyltransferases: metabolite elucidation and main contributions from CYP1A2and UGT1A1, Xenobiotica, 46:1, 1-13, DOI: 10.3109/00498254.2015.1047812
To link to this article: http://dx.doi.org/10.3109/00498254.2015.1047812
View supplementary material Published online: 11 Jun 2015.
Submit your article to this journal Article views: 222
View related articles View Crossmark data
Citing articles: 3 View citing articles
http://informahealthcare.com/xenISSN: 0049-8254 (print), 1366-5928 (electronic)
Xenobiotica, 2016; 46(1): 1–13! 2015 Informa UK Ltd. DOI: 10.3109/00498254.2015.1047812
RESEARCH ARTICLE
Metabolism of the anthelmintic drug niclosamide by cytochrome P450enzymes and UDP-glucuronosyltransferases: metabolite elucidationand main contributions from CYP1A2 and UGT1A1
Danyi Lu*, Zhiguo Ma*, Tianpeng Zhang, Xingwang Zhang, and Baojian Wu
Division of Pharmaceutics, College of Pharmacy, Jinan University, Guangzhou, P.R. China
Abstract
1. Niclosamide is an old anthelmintic drug that shows potential in fighting against cancers.Here, we characterized the metabolism of niclosamide by cytochrome P450 enzymes (CYPs)and UDP-glucuronosyltransferases (UGTs) using human liver microsomes (HLM) andexpressed enzymes.
2. NADPH-supplemented HLM (and liver microsomes from various animal species) generatedone hydroxylated metabolite (M1) from niclosamide; and UDPGA-supplemented livermicrosomes generated one mono-O-glucuronide (M2). The chemical structures of M1(3-hydroxy niclosamide) and M2 (niclosamide-2-O-glucuronide) were determined throughLC–MS/MS and/or NMR analyses.
3. Reaction phenotyping revealed that CYP1A2 was the main enzyme responsible for M1formation. The important role of CYP1A2 in niclosamide metabolism was further confirmedby activity correlation analyses as well as inhibition experiments using specific inhibitors.
4. Although seven UGT enzymes were able to catalyze glucuronidation of niclosamide, UGT1A1and 1A3 were the enzymes showed the highest metabolic activities. Activity correlationanalyses demonstrated that UGT1A1 played a predominant role in hepatic glucuronidation ofniclosamide, whereas the role of UGT1A3 was negligible.
5. In conclusion, niclosamide was subjected to efficient metabolic reactions hydroxylation andglucuronidation, wherein CYP1A2 and UGT1A1 were the main contributing enzymes,respectively.
Keywords
CYP, glucuronidation, hydroxylation,niclosamide, reaction phenotyping, UGT
History
Received 28 March 2015Revised 29 April 2015Accepted 30 April 2015Published online 11 June 2015
Introduction
Poor pharmacokinetic property is one of the main causes to
the high rate of drug attrition (Kola & Landis, 2004; Prentis
et al., 1988). Drug metabolism, an indispensable component
of pharmacokinetics, is a main determinant to the drugability
of lead compounds (Costa et al., 2014). Extensive metabolism
tends to result in fast drug clearance (and very short half-life),
low bioavailability and therapeutic failures, whereas poor (or
undesired) metabolism would lead to drug accumulation (in
off-target tissues) and side effects. Knowing the enzymes
involved in the metabolism of a drug is also useful in
predicting variability (e.g. if the enzymes are polymorphic)
and potential drug–drug interactions with co-administered
drugs (or herbal remedies). Hence, it is of great importance
to determine the metabolic profiles and to establish the
relationships between metabolism and efficacy/toxicity for
drugs and drug candidates.
Drug metabolism is classified into phase I and phase II
metabolism. Phase II metabolism (conjugation) often occur on
metabolites produced by phase I oxidation but does occur
directly on parent drugs bearing appropriate functional
moieties such as hydroxyl group and carboxylic acid.
Cytochrome P450 enzymes (CYPs) are the principal phase I
enzymes that catalyze the oxidation and reduction reactions.
CYP enzymes are classified into 17 families and 39
subfamilies; the main enzymes contributing to drug metabol-
ism are often from the CYP1, 2 and 3 families, including
CYP1A2, 1B1, 2A6, 2C8, 2C9, 2C19, 2D6, 2E1 and 3A4
(Ortiz de Montellano, 2005). UDP-glucuronosyltransferases
(UGTs) mediated glucuronidation is responsible for clearance
of 35% of drugs that are metabolized by phase II enzymes
(Evans & Relling, 1999). The glucuronidation reaction occurs
via transfer of a glucuronic acid moiety to the substrates (Wells
et al., 2004). In humans, UGT enzymes are divided into four
families, UGT1, UGT2, UGT3 and UGT8 (Mackenzie et al.,
2005). Enzymes from UGT1A (with nine members) and 2B
families (with seven members) are the main contributors to
*These authors contributed equally to this work.
Address for correspondence: Baojian Wu, Ph.D., Division ofPharmaceutics, College of Pharmacy, Jinan University, 601 HuangpuAvenue West, Guangzhou 510632, P.R. China. E-mail: [email protected]
xenobiotic/drug metabolism. It has been reported that the CYP
and UGT enzymes in total contribute to metabolism of over
80% clinical drugs (Emoto et al., 2010). Therefore, it is of great
value to characterize the metabolism of drugs (and drug
candidates) by both CYPs and UGTs in humans.
The anthelmintic drug niclosamide has been used in
management of tapeworm infections for half a century
(Al-Hadiya, 2005). Niclosamide kills tapeworms through
inhibition of oxidative phosphorylation and stimulation of
adenosine triphosphatese activity in the mitochondria (Al-
Hadiya, 2005). In recent years, niclosamide has been identified
as a potential anticancer agent (Li et al., 2014; Pan et al., 2012).
The mechanisms for its anticancer action appear to be rather
complex. Niclosamide inhibits multiple signaling pathways
that regulate cancer progression such as the mTORC1
(Fonseca et al., 2012), NF-kB (Jin et al., 2010), and Notch
pathways (Wang et al., 2009). It also induces cell cycle arrest,
growth inhibition and apoptosis by targeting mitochondria
(Park et al., 2011). Moreover, niclosamide shows strong
inhibitory effects on the growth of cancer stem cells (Jin et al.,
2010; Li et al., 2014; Pan et al., 2012). It is also noted
that niclosamide is an effective bacterial killer against
Pseudomonas aeruginosa (Imperi et al., 2013).
Oral niclosamide is well tolerated in humans and animals
(Al-Hadiya, 2005). The good tolerability may be accounted
for by limited oral absorption of the drug (Al-Hadiya, 2005).
The exact reasons are unknown as to why niclosamide is
poorly bioavailable after oral uptake. Poor water solubility
may be a limiting factor to intestinal absorption of
niclosamide (Pan et al., 2012). In an early study, a reduced
metabolite was generated from niclosamide by mouse and
sheep liver homogenates (Douch & Gahagan, 1977). In a
latter study, the glucuronidated and sulfate metabolites were
found in fishes (Dawson et al., 1999) and rats (Griffiths &
Facchini, 1979) after exposure to niclosamide. However, no
specific data for metabolism of niclosamide in humans are
available in the literature.
Niclosamide is old anthelmintic drug that also shows
potential in fighting against cancers and bacteria (Imperi
et al., 2013; Li et al., 2014). In the present study, we aimed to
characterize the metabolism of niclosamide by cytochrome
P450 enzymes (CYPs) and UGTs using human liver micro-
somes (HLM) and expressed enzymes. The chemical struc-
tures of metabolites were identified through LC–MS/MS and/
or NMR analyses. Screening of the enzymes with metabolic
activities toward niclosamide was performed using commer-
cially available expressed enzymes (CYPs and UGTs).
Reaction phenotyping, activity correlation analysis and/or
inhibition experiments with specific inhibitors were employed
to determine the main enzymes contributing to hepatic
metabolism of niclosamide. Our study for the first time
revealed that niclosamide was subjected to efficient hydrox-
ylation and glucuronidation, wherein CYP1A2 and UGT1A1
were the main contributing enzymes, respectively.
Materials and methods
Materials
Expressed human CYP enzymes (CYP1A1, 1A2, 1B1, 2B6,
2C8, 2C9, 2C19, 2D6, 2E1, 3A4 and 3A5), UGT enzymes
(UGT1A1, 1A3, 1A4, 1A6, 1A7, 1A8, 1A9, 1A10, 2B4, 2B7,
2B15 and 2B17), pooled HLM, dog liver microsomes (DLM),
monkey liver microsomes (cynomolgus, MkLM), mouse liver
microsomes (MsLM), mini-pig liver microsomes (PLM), rat
liver microsomes (RLM) and fulvoxamine maleate were
purchased from BD Biosciences (Woburn, MA). Niclosamide
(purity>99%) was purchased from Xiya Chemical Technology
Co. Ltd. (Chengdu, China). b-Nicotinamide adenine dinucleo-
tide 20-phosphate reduced tetrasodium salt hydrate (NADPH),
uridine diphosphoglucuronic acid (UDPGA), alamethicin, D-
saccharic-1,4-lactone monohydrate, b-glucuronidase and 17b-
estradiol (or b-estradiol) were purchased from Sigma-Aldrich
(St. Louis, MO). b-Estradiol 3-glucuronide and chenodeoxy-
cholic acid 24-acyl-glucuronide were purchased from Toronto
Research Chemicals (Ontario, Canada). Phenacetin, 4-acet-
amidophenol, a-naphthoflavone, chenodeoxycholic acid and
apigenin were purchased from Aladdin Chemicals (Shanghai,
China). Individual HLMs (n¼ 14) obtained from healthy livers
were purchased from Rild Research Institute for Liver Diseases
(Shanghai, China). All other materials (typically analytical
grade or better) were used as received.
In vitro phase I metabolism assay
In vitro phase I metabolism of the test compounds was
performed as described (Fang et al., 2014). In brief, the
incubation medium (300ml) contained liver microsomes (or
expressed CYP enzymes), MgCl2 (5 mM), NADPH (1 mM)
and test compound in 50 mM potassium phosphate (pH 7.4).
The reaction was initiated by the addition of NADPH and
terminated by adding 75 ml ice-cold acetonitrile at predeter-
mined time points. The samples were vortexed and centrifuged
at 18 000g for 15 min. The supernatant was collected and
subjected to analysis by HPLC or UPLC-QTOF/MS. All
experiments were performed in triplicate. Control incubations
were performed without the cofactor NADPH. In all experi-
ments, niclosamide was dissolved in ethanol to obtain a 10 mM
stock solution and serially diluted to the required concentra-
tions with ethanol. The percentage of organic solvent in the
incubation system did not exceed 1%. Preliminary experiments
were performed to ensure that the metabolic rates were
determined under linear conditions with respect to incubation
time and protein concentration. The exact concentrations of
niclosamide and the incubation time for rate determination can
be found in Table S1 (Supplementary Materials).
Glucuronidation assay
The test compounds were incubated with liver microsomes
(or expressed UGT enzymes) to determine the rates of
glucuronidation as described in our previous publication
(Liu et al., 2014a). In brief, the incubation medium (300ml)
contained microsomes, MgCl2 (0.88 mM), saccharolactone
(4.4 mM), alamethicin (22 mg/ml), UDPGA (3.5 mM) and test
compound in 50 mM potassium phosphate (pH 7.4). The
reaction was initiated by incubation at 37 �C and terminated
by adding 75 ml ice-cold acetonitrile, followed by vortex
and centrifugation (15 min; 18 000g). The supernatant was
subjected to analysis by HPLC and/or UPLC-QTOF/MS.
Control incubations were performed without UDPGA.
All experiments were performed in triplicate. Preliminary
2 D. Lu et al. Xenobiotica, 2016; 46(1): 1–13
experiments were performed to ensure that the rates of
glucuronidation were determined under linear conditions with
respect to incubation time and protein concentration. The
exact concentrations of niclosamide and the incubation time
for determination of glucuronidation rates can be found in
Table S2 (Supplementary Materials).
To confirm formation of O-glucuronide, hydrolysis of the
metabolite in the incubation was performed using b-glucur-
onidase. The metabolite in incubation medium was generated
according to the glucuronidation assay protocol. Subsequently,
the incubation mixture was subjected to purification using
solid phase extraction (SPE, SuplcleanTM LC-C18, Supelco
Inc., Bellefone, PA) as described (Sun et al., 2014). The
purified sample from SPE (containing both parent compound
and glucuronide) was incubated with b-glucuronidase (25 U).
After 20 min (sufficient for complete hydrolysis of glucur-
onide), 50 ml ice-cold acetonitrile was added to the incubation
medium, followed by vortex and centrifugation (15 min;
18 000g). The supernatant was analyzed by HPLC. Control
experiment was performed in the absence of b-glucuronidase.
Structural identification of niclosamide metabolitesby UPLC-QTOF/MS and 1H NMR
Structural identification of phase I and UGT metabolites was
performed using UPLC-QTOF/MS. Chromatographic separ-
ation was performed using the Waters ACQUITY UPLC
system and BEH column (2.1 mm� 50 mm, 1.7 mm; Waters,
Milford, MA). Elution was performed using a gradient of
formic acid (0.1%) in water (mobile phase A) versus formic
acid (0.1%) in acetonitrile (mobile phase B) at a flow rate of
0.45 ml/min. The gradient elution program was 10% B at 0–
1 min, 10 to 95% B at 1–3 min and 95 to 10% B at 3.5–4 min.
Mass spectrometry analysis was performed on the Xevo G2
Q-TOF/MS (Waters) using the electrospray ionization source
(negative ion mode) as described (Liu et al., 2014b).
A collision energy of 20 eV was used for MS/MS scanning.
A large amount of phase I metabolite M1 was generated
according to the in vitro incubation protocol except for that
the incubation volume was scaled up to 500 ml. In brief,
niclosamide (25mM) was incubated with PLM (final protein
concentration, 0.25 mg/ml), 5 mM MgCl2 and 1 mM NADPH.
After incubation for 8 h, ice-cold acetonitrile (50 ml) was
added to precipitate the proteins. The incubation mixture was
centrifuged at 18 000 g for 15 min. The supernatant was
concentrated and injected to HPLC system. Niclosamide and
its metabolite M1 were separated by the Agilent TC-C18(2)
column (5 mm, 4.6 mm� 250 mm) using 75% acetonitrile–
0.1% formic acid in water as the mobile phase. Fractions
containing M1 were collected and dried in vacuo. The purity
of M1 was about 99% by HPLC-UV analysis. The purified
metabolite (M1) was dissolved in dimethyl sulfoxide-d6
(Euriso-Top, Saint-Aubin, France) for NMR analysis. 1H
NMR spectra of M1 were recorded on Bruker AV-500
spectrometer (Bruker, Rheinstetten, Germany) using tetra-
methylsilane as an internal standard.
Kinetic evaluation
The rates of metabolite formation were determined for
niclosamide at a series of concentrations according to the
in vitro metabolism assay protocols. The kinetic model,
Michaelis–Menten (Equation 1) or biphasic equation
(Equation 2) or substrate inhibition equation (Equation 3) or
Hill equation (Equation 4), was fitted to the data of formation
rates versus substrate concentrations. Model selection was
based on visual inspection of the characteristic Eadie–Hofstee
plots (Hutzler & Tracy, 2002). Model fitting and parameter
estimation were performed using the Graphpad Prism V5
software (San Diego, CA).
V ¼ Vmax � ½S�Km � ½S�
, ð1Þ
V ¼ Vmax 1 � ½S�Km1 � ½S�
þ Vmax 2 � ½S�Km2 � ½S�
, ð2Þ
V ¼ Vmax � ½S�Km � ½S� � 1þ ð½S�=KsiÞð Þ , ð3Þ
V ¼ Vmax � ½S�n
Sn50 þ ½S�
n , ð4Þ
where V is the rate of reaction, Vmax is the maximal velocity,
Km is the Michaelis constant, Ksi is the substrate inhibition
constant, S50 is the substrate concentration resulting in 50% of
Vmax and n is the Hill coefficient. The intrinsic clearance
(CLint) was derived by Vmax/Km and the maximal clearance
(CLmax) for the Hill equation model was obtained using
Equation (5).
CLmax ¼Vmax
S50
� n� 1
nðn� 1Þ1=n: ð5Þ
Quantification of drugs and their metabolites
Quantification of niclosamide and its metabolites were
performed with the HPLC system (Dionex Ultimate 3000
series, Thermo Scientific, Waltham, MA) consisting of a
quaternary pump, a degasser, an autosampler, a column heater
and a multichannel rapid scanning UV–Vis detector.
Niclosamide and its metabolites were separated by an
Agilent TC-C18(2) column (5 mm, 4.6 mm� 250 mm) guarded
with a precolumn at 40 �C. The injection volume was set to be
20 ml and the flow rate was 1.0 ml/min. It was noted that
different gradient programs were applied in analyses of
3-hydroxy niclosamide (M1) and niclosamide 2-glucuronide
(M2). Due to the lack of reference standard for M2, quanti-
fication of M2 was based on the standard curve of the parent
drug (niclosamide) and further calibrated using the correction
factor. The correction factor (K¼ 1.03) was derived exactly as
described (Sun et al., 2014). The analytical methods were
validated with respect to linearity (9.8–5000 nM), precision
(RSD 55%) and accuracy (95–105%). The lower limits
of quantification for M1 and M2 were 0.021 and 0.018 mM,
respectively. No matrix effects were detected for both
metabolites.
Concentrations of phenacetin and its metabolite
4-acetamidophenol were also determined with the same
HPLC system. Detailed analytical conditions are summarized
DOI: 10.3109/00498254.2015.1047812 In vitro characterization of niclosamide metabolism 3
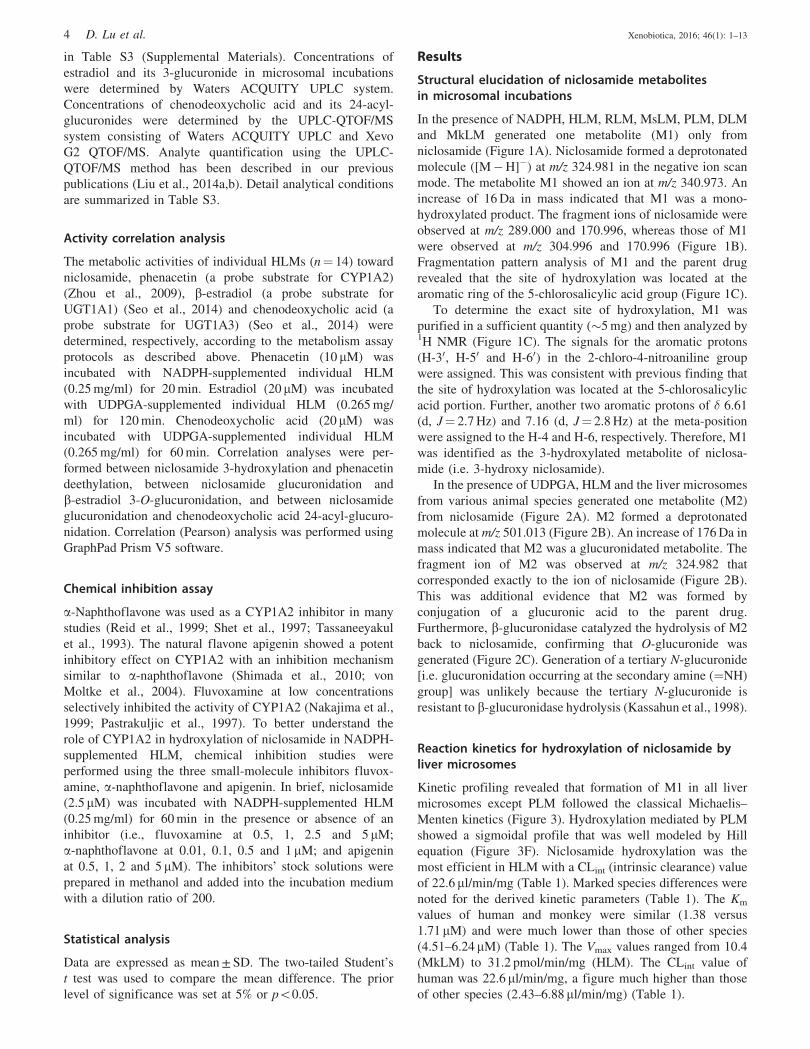
in Table S3 (Supplemental Materials). Concentrations of
estradiol and its 3-glucuronide in microsomal incubations
were determined by Waters ACQUITY UPLC system.
Concentrations of chenodeoxycholic acid and its 24-acyl-
glucuronides were determined by the UPLC-QTOF/MS
system consisting of Waters ACQUITY UPLC and Xevo
G2 QTOF/MS. Analyte quantification using the UPLC-
QTOF/MS method has been described in our previous
publications (Liu et al., 2014a,b). Detail analytical conditions
are summarized in Table S3.
Activity correlation analysis
The metabolic activities of individual HLMs (n¼ 14) toward
niclosamide, phenacetin (a probe substrate for CYP1A2)
(Zhou et al., 2009), b-estradiol (a probe substrate for
UGT1A1) (Seo et al., 2014) and chenodeoxycholic acid (a
probe substrate for UGT1A3) (Seo et al., 2014) were
determined, respectively, according to the metabolism assay
protocols as described above. Phenacetin (10 mM) was
incubated with NADPH-supplemented individual HLM
(0.25 mg/ml) for 20 min. Estradiol (20mM) was incubated
with UDPGA-supplemented individual HLM (0.265 mg/
ml) for 120 min. Chenodeoxycholic acid (20mM) was
incubated with UDPGA-supplemented individual HLM
(0.265 mg/ml) for 60 min. Correlation analyses were per-
formed between niclosamide 3-hydroxylation and phenacetin
deethylation, between niclosamide glucuronidation and
b-estradiol 3-O-glucuronidation, and between niclosamide
glucuronidation and chenodeoxycholic acid 24-acyl-glucuro-
nidation. Correlation (Pearson) analysis was performed using
GraphPad Prism V5 software.
Chemical inhibition assay
a-Naphthoflavone was used as a CYP1A2 inhibitor in many
studies (Reid et al., 1999; Shet et al., 1997; Tassaneeyakul
et al., 1993). The natural flavone apigenin showed a potent
inhibitory effect on CYP1A2 with an inhibition mechanism
similar to a-naphthoflavone (Shimada et al., 2010; von
Moltke et al., 2004). Fluvoxamine at low concentrations
selectively inhibited the activity of CYP1A2 (Nakajima et al.,
1999; Pastrakuljic et al., 1997). To better understand the
role of CYP1A2 in hydroxylation of niclosamide in NADPH-
supplemented HLM, chemical inhibition studies were
performed using the three small-molecule inhibitors fluvox-
amine, a-naphthoflavone and apigenin. In brief, niclosamide
(2.5mM) was incubated with NADPH-supplemented HLM
(0.25 mg/ml) for 60 min in the presence or absence of an
inhibitor (i.e., fluvoxamine at 0.5, 1, 2.5 and 5 mM;
a-naphthoflavone at 0.01, 0.1, 0.5 and 1 mM; and apigenin
at 0.5, 1, 2 and 5 mM). The inhibitors’ stock solutions were
prepared in methanol and added into the incubation medium
with a dilution ratio of 200.
Statistical analysis
Data are expressed as mean ± SD. The two-tailed Student’s
t test was used to compare the mean difference. The prior
level of significance was set at 5% or p50.05.
Results
Structural elucidation of niclosamide metabolitesin microsomal incubations
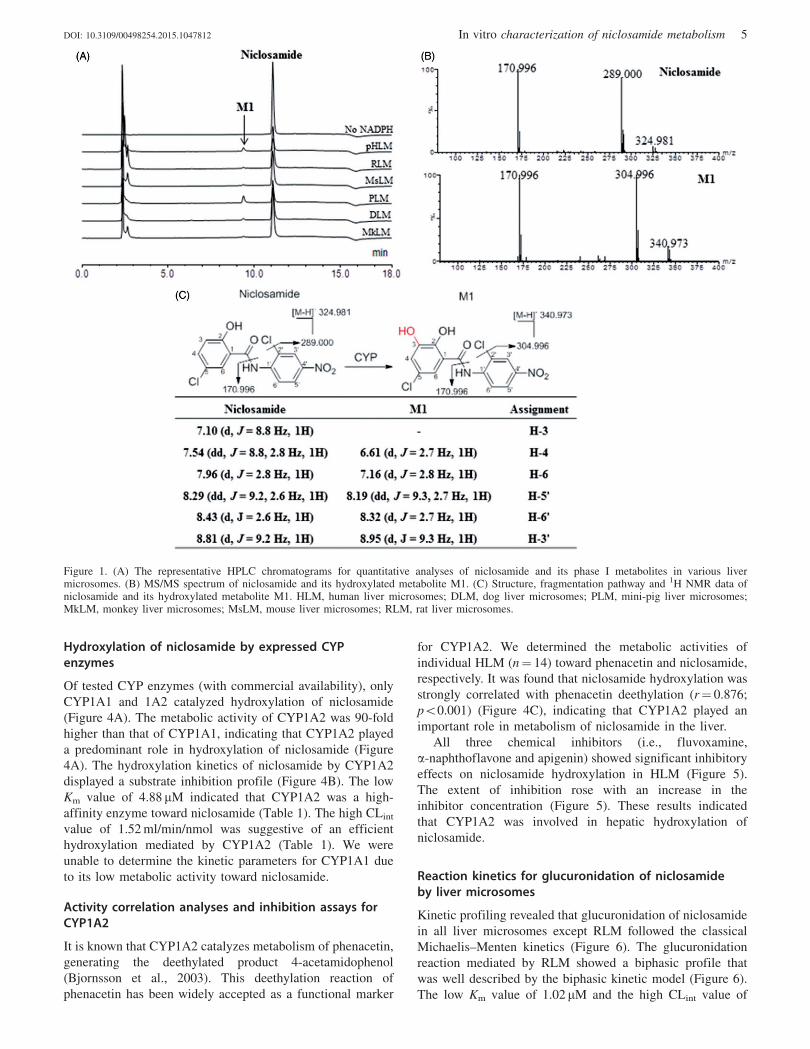
In the presence of NADPH, HLM, RLM, MsLM, PLM, DLM
and MkLM generated one metabolite (M1) only from
niclosamide (Figure 1A). Niclosamide formed a deprotonated
molecule ([M�H]�) at m/z 324.981 in the negative ion scan
mode. The metabolite M1 showed an ion at m/z 340.973. An
increase of 16 Da in mass indicated that M1 was a mono-
hydroxylated product. The fragment ions of niclosamide were
observed at m/z 289.000 and 170.996, whereas those of M1
were observed at m/z 304.996 and 170.996 (Figure 1B).
Fragmentation pattern analysis of M1 and the parent drug
revealed that the site of hydroxylation was located at the
aromatic ring of the 5-chlorosalicylic acid group (Figure 1C).
To determine the exact site of hydroxylation, M1 was
purified in a sufficient quantity (�5 mg) and then analyzed by1H NMR (Figure 1C). The signals for the aromatic protons
(H-30, H-50 and H-60) in the 2-chloro-4-nitroaniline group
were assigned. This was consistent with previous finding that
the site of hydroxylation was located at the 5-chlorosalicylic
acid portion. Further, another two aromatic protons of � 6.61
(d, J¼ 2.7 Hz) and 7.16 (d, J¼ 2.8 Hz) at the meta-position
were assigned to the H-4 and H-6, respectively. Therefore, M1
was identified as the 3-hydroxylated metabolite of niclosa-
mide (i.e. 3-hydroxy niclosamide).
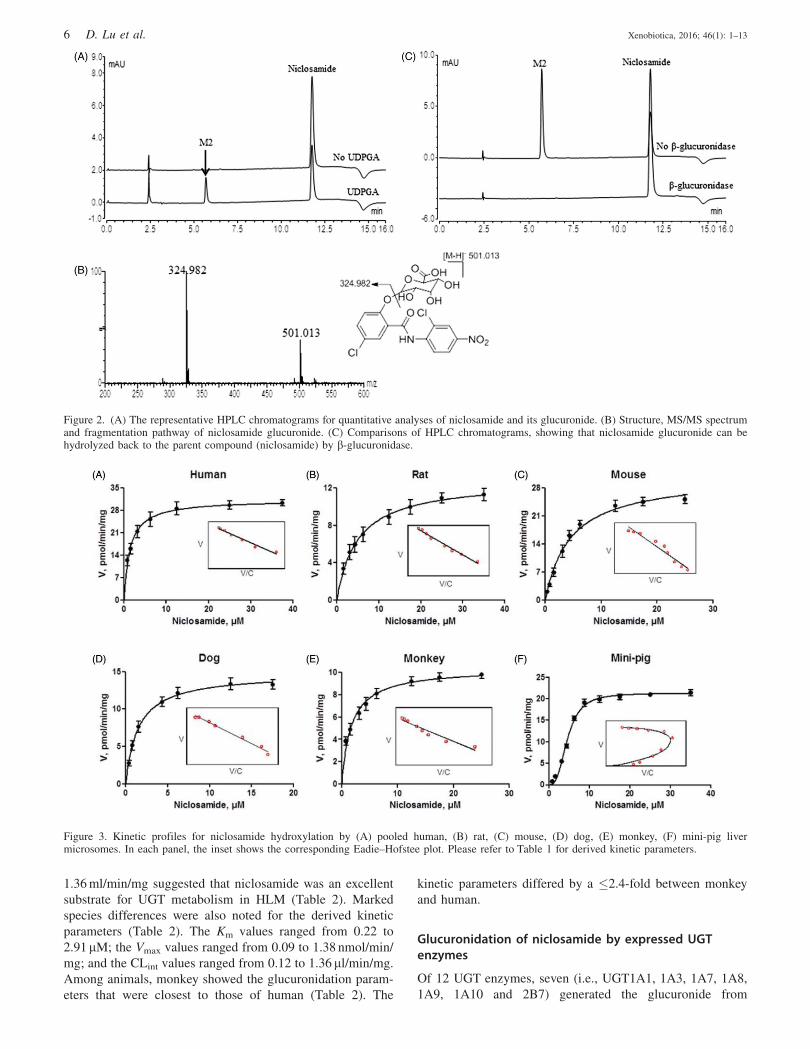
In the presence of UDPGA, HLM and the liver microsomes
from various animal species generated one metabolite (M2)
from niclosamide (Figure 2A). M2 formed a deprotonated
molecule at m/z 501.013 (Figure 2B). An increase of 176 Da in
mass indicated that M2 was a glucuronidated metabolite. The
fragment ion of M2 was observed at m/z 324.982 that
corresponded exactly to the ion of niclosamide (Figure 2B).
This was additional evidence that M2 was formed by
conjugation of a glucuronic acid to the parent drug.
Furthermore, b-glucuronidase catalyzed the hydrolysis of M2
back to niclosamide, confirming that O-glucuronide was
generated (Figure 2C). Generation of a tertiary N-glucuronide
[i.e. glucuronidation occurring at the secondary amine (¼NH)
group] was unlikely because the tertiary N-glucuronide is
resistant to b-glucuronidase hydrolysis (Kassahun et al., 1998).
Reaction kinetics for hydroxylation of niclosamide byliver microsomes
Kinetic profiling revealed that formation of M1 in all liver
microsomes except PLM followed the classical Michaelis–
Menten kinetics (Figure 3). Hydroxylation mediated by PLM
showed a sigmoidal profile that was well modeled by Hill
equation (Figure 3F). Niclosamide hydroxylation was the
most efficient in HLM with a CLint (intrinsic clearance) value
of 22.6 ml/min/mg (Table 1). Marked species differences were
noted for the derived kinetic parameters (Table 1). The Km
values of human and monkey were similar (1.38 versus
1.71 mM) and were much lower than those of other species
(4.51–6.24 mM) (Table 1). The Vmax values ranged from 10.4
(MkLM) to 31.2 pmol/min/mg (HLM). The CLint value of
human was 22.6 ml/min/mg, a figure much higher than those
of other species (2.43–6.88 ml/min/mg) (Table 1).
4 D. Lu et al. Xenobiotica, 2016; 46(1): 1–13
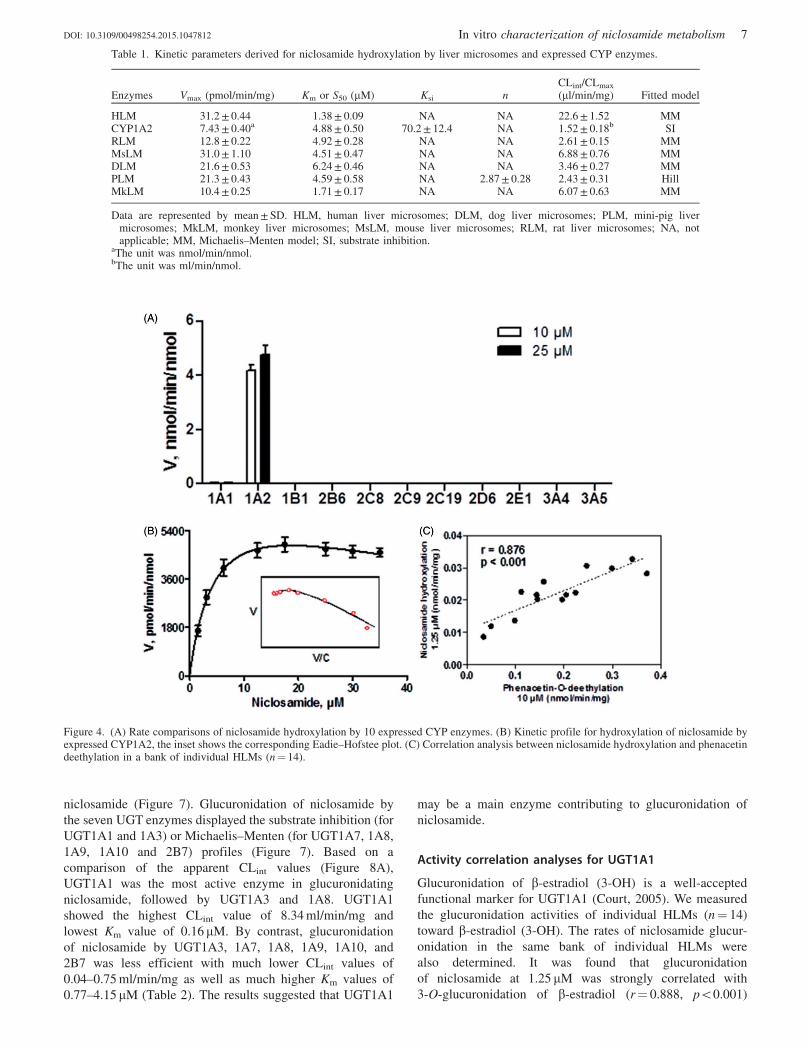
Hydroxylation of niclosamide by expressed CYPenzymes
Of tested CYP enzymes (with commercial availability), only
CYP1A1 and 1A2 catalyzed hydroxylation of niclosamide
(Figure 4A). The metabolic activity of CYP1A2 was 90-fold
higher than that of CYP1A1, indicating that CYP1A2 played
a predominant role in hydroxylation of niclosamide (Figure
4A). The hydroxylation kinetics of niclosamide by CYP1A2
displayed a substrate inhibition profile (Figure 4B). The low
Km value of 4.88 mM indicated that CYP1A2 was a high-
affinity enzyme toward niclosamide (Table 1). The high CLint
value of 1.52 ml/min/nmol was suggestive of an efficient
hydroxylation mediated by CYP1A2 (Table 1). We were
unable to determine the kinetic parameters for CYP1A1 due
to its low metabolic activity toward niclosamide.
Activity correlation analyses and inhibition assays forCYP1A2
It is known that CYP1A2 catalyzes metabolism of phenacetin,
generating the deethylated product 4-acetamidophenol
(Bjornsson et al., 2003). This deethylation reaction of
phenacetin has been widely accepted as a functional marker
for CYP1A2. We determined the metabolic activities of
individual HLM (n¼ 14) toward phenacetin and niclosamide,
respectively. It was found that niclosamide hydroxylation was
strongly correlated with phenacetin deethylation (r¼ 0.876;
p50.001) (Figure 4C), indicating that CYP1A2 played an
important role in metabolism of niclosamide in the liver.
All three chemical inhibitors (i.e., fluvoxamine,
a-naphthoflavone and apigenin) showed significant inhibitory
effects on niclosamide hydroxylation in HLM (Figure 5).
The extent of inhibition rose with an increase in the
inhibitor concentration (Figure 5). These results indicated
that CYP1A2 was involved in hepatic hydroxylation of
niclosamide.
Reaction kinetics for glucuronidation of niclosamideby liver microsomes
Kinetic profiling revealed that glucuronidation of niclosamide
in all liver microsomes except RLM followed the classical
Michaelis–Menten kinetics (Figure 6). The glucuronidation
reaction mediated by RLM showed a biphasic profile that
was well described by the biphasic kinetic model (Figure 6).
The low Km value of 1.02 mM and the high CLint value of
Figure 1. (A) The representative HPLC chromatograms for quantitative analyses of niclosamide and its phase I metabolites in various livermicrosomes. (B) MS/MS spectrum of niclosamide and its hydroxylated metabolite M1. (C) Structure, fragmentation pathway and 1H NMR data ofniclosamide and its hydroxylated metabolite M1. HLM, human liver microsomes; DLM, dog liver microsomes; PLM, mini-pig liver microsomes;MkLM, monkey liver microsomes; MsLM, mouse liver microsomes; RLM, rat liver microsomes.
DOI: 10.3109/00498254.2015.1047812 In vitro characterization of niclosamide metabolism 5
1.36 ml/min/mg suggested that niclosamide was an excellent
substrate for UGT metabolism in HLM (Table 2). Marked
species differences were also noted for the derived kinetic
parameters (Table 2). The Km values ranged from 0.22 to
2.91mM; the Vmax values ranged from 0.09 to 1.38 nmol/min/
mg; and the CLint values ranged from 0.12 to 1.36 ml/min/mg.
Among animals, monkey showed the glucuronidation param-
eters that were closest to those of human (Table 2). The
kinetic parameters differed by a �2.4-fold between monkey
and human.
Glucuronidation of niclosamide by expressed UGTenzymes
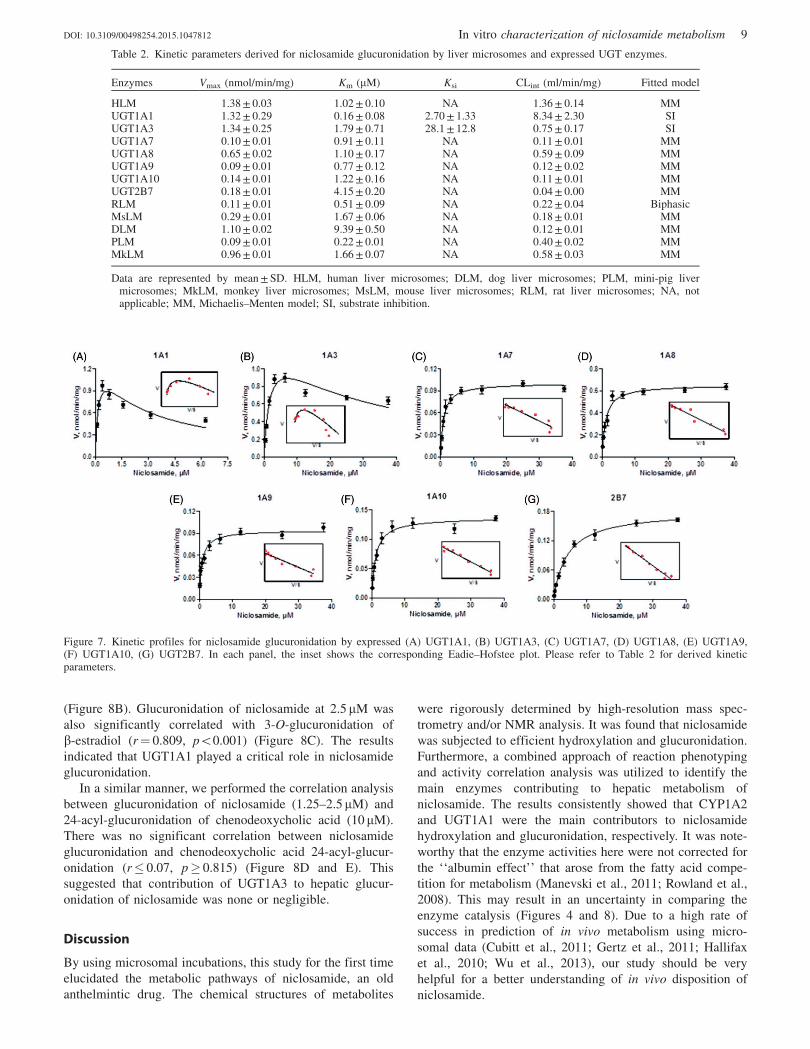
Of 12 UGT enzymes, seven (i.e., UGT1A1, 1A3, 1A7, 1A8,
1A9, 1A10 and 2B7) generated the glucuronide from
Figure 2. (A) The representative HPLC chromatograms for quantitative analyses of niclosamide and its glucuronide. (B) Structure, MS/MS spectrumand fragmentation pathway of niclosamide glucuronide. (C) Comparisons of HPLC chromatograms, showing that niclosamide glucuronide can behydrolyzed back to the parent compound (niclosamide) by b-glucuronidase.
Figure 3. Kinetic profiles for niclosamide hydroxylation by (A) pooled human, (B) rat, (C) mouse, (D) dog, (E) monkey, (F) mini-pig livermicrosomes. In each panel, the inset shows the corresponding Eadie–Hofstee plot. Please refer to Table 1 for derived kinetic parameters.
6 D. Lu et al. Xenobiotica, 2016; 46(1): 1–13
niclosamide (Figure 7). Glucuronidation of niclosamide by
the seven UGT enzymes displayed the substrate inhibition (for
UGT1A1 and 1A3) or Michaelis–Menten (for UGT1A7, 1A8,
1A9, 1A10 and 2B7) profiles (Figure 7). Based on a
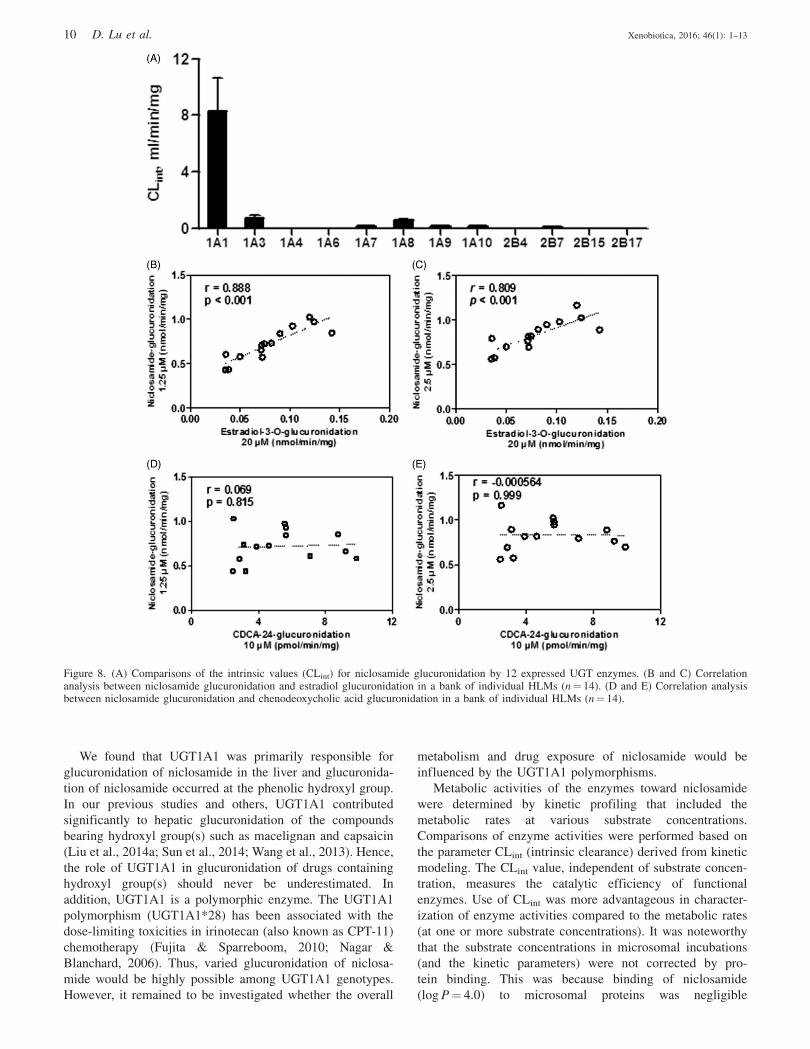
comparison of the apparent CLint values (Figure 8A),
UGT1A1 was the most active enzyme in glucuronidating
niclosamide, followed by UGT1A3 and 1A8. UGT1A1
showed the highest CLint value of 8.34 ml/min/mg and
lowest Km value of 0.16 mM. By contrast, glucuronidation
of niclosamide by UGT1A3, 1A7, 1A8, 1A9, 1A10, and
2B7 was less efficient with much lower CLint values of
0.04–0.75 ml/min/mg as well as much higher Km values of
0.77–4.15mM (Table 2). The results suggested that UGT1A1
may be a main enzyme contributing to glucuronidation of
niclosamide.
Activity correlation analyses for UGT1A1
Glucuronidation of b-estradiol (3-OH) is a well-accepted
functional marker for UGT1A1 (Court, 2005). We measured
the glucuronidation activities of individual HLMs (n¼ 14)
toward b-estradiol (3-OH). The rates of niclosamide glucur-
onidation in the same bank of individual HLMs were
also determined. It was found that glucuronidation
of niclosamide at 1.25 mM was strongly correlated with
3-O-glucuronidation of b-estradiol (r¼ 0.888, p50.001)
Figure 4. (A) Rate comparisons of niclosamide hydroxylation by 10 expressed CYP enzymes. (B) Kinetic profile for hydroxylation of niclosamide byexpressed CYP1A2, the inset shows the corresponding Eadie–Hofstee plot. (C) Correlation analysis between niclosamide hydroxylation and phenacetindeethylation in a bank of individual HLMs (n¼ 14).
Table 1. Kinetic parameters derived for niclosamide hydroxylation by liver microsomes and expressed CYP enzymes.
Enzymes Vmax (pmol/min/mg) Km or S50 (mM) Ksi nCLint/CLmax
(ml/min/mg) Fitted model
HLM 31.2 ± 0.44 1.38 ± 0.09 NA NA 22.6 ± 1.52 MMCYP1A2 7.43 ± 0.40a 4.88 ± 0.50 70.2 ± 12.4 NA 1.52 ± 0.18b SIRLM 12.8 ± 0.22 4.92 ± 0.28 NA NA 2.61 ± 0.15 MMMsLM 31.0 ± 1.10 4.51 ± 0.47 NA NA 6.88 ± 0.76 MMDLM 21.6 ± 0.53 6.24 ± 0.46 NA NA 3.46 ± 0.27 MMPLM 21.3 ± 0.43 4.59 ± 0.58 NA 2.87 ± 0.28 2.43 ± 0.31 HillMkLM 10.4 ± 0.25 1.71 ± 0.17 NA NA 6.07 ± 0.63 MM
Data are represented by mean ± SD. HLM, human liver microsomes; DLM, dog liver microsomes; PLM, mini-pig livermicrosomes; MkLM, monkey liver microsomes; MsLM, mouse liver microsomes; RLM, rat liver microsomes; NA, notapplicable; MM, Michaelis–Menten model; SI, substrate inhibition.
aThe unit was nmol/min/nmol.bThe unit was ml/min/nmol.
DOI: 10.3109/00498254.2015.1047812 In vitro characterization of niclosamide metabolism 7

Figure 5. Concentration-dependent inhibition effects of fluvoxamine (A), a-naphthoflavone (B) and apigenin (C) on the catalytic activity ofniclosamide hydroxylation by CYP1A2 in pHLM.
Figure 6. Kinetic profiles for niclosamide glucuronidation by (A) pooled human, (B) rat, (C) mouse, (D) dog, (E) monkey, (F) mini-pig livermicrosomes. In each panel, the inset shows the corresponding Eadie–Hofstee plot. Please refer to Table 2 for derived kinetic parameters.
8 D. Lu et al. Xenobiotica, 2016; 46(1): 1–13
(Figure 8B). Glucuronidation of niclosamide at 2.5mM was
also significantly correlated with 3-O-glucuronidation of
b-estradiol (r¼ 0.809, p50.001) (Figure 8C). The results
indicated that UGT1A1 played a critical role in niclosamide
glucuronidation.
In a similar manner, we performed the correlation analysis
between glucuronidation of niclosamide (1.25–2.5mM) and
24-acyl-glucuronidation of chenodeoxycholic acid (10 mM).
There was no significant correlation between niclosamide
glucuronidation and chenodeoxycholic acid 24-acyl-glucur-
onidation (r� 0.07, p� 0.815) (Figure 8D and E). This
suggested that contribution of UGT1A3 to hepatic glucur-
onidation of niclosamide was none or negligible.
Discussion
By using microsomal incubations, this study for the first time
elucidated the metabolic pathways of niclosamide, an old
anthelmintic drug. The chemical structures of metabolites
were rigorously determined by high-resolution mass spec-
trometry and/or NMR analysis. It was found that niclosamide
was subjected to efficient hydroxylation and glucuronidation.
Furthermore, a combined approach of reaction phenotyping
and activity correlation analysis was utilized to identify the
main enzymes contributing to hepatic metabolism of
niclosamide. The results consistently showed that CYP1A2
and UGT1A1 were the main contributors to niclosamide
hydroxylation and glucuronidation, respectively. It was note-
worthy that the enzyme activities here were not corrected for
the ‘‘albumin effect’’ that arose from the fatty acid compe-
tition for metabolism (Manevski et al., 2011; Rowland et al.,
2008). This may result in an uncertainty in comparing the
enzyme catalysis (Figures 4 and 8). Due to a high rate of
success in prediction of in vivo metabolism using micro-
somal data (Cubitt et al., 2011; Gertz et al., 2011; Hallifax
et al., 2010; Wu et al., 2013), our study should be very
helpful for a better understanding of in vivo disposition of
niclosamide.
Figure 7. Kinetic profiles for niclosamide glucuronidation by expressed (A) UGT1A1, (B) UGT1A3, (C) UGT1A7, (D) UGT1A8, (E) UGT1A9,(F) UGT1A10, (G) UGT2B7. In each panel, the inset shows the corresponding Eadie–Hofstee plot. Please refer to Table 2 for derived kineticparameters.
Table 2. Kinetic parameters derived for niclosamide glucuronidation by liver microsomes and expressed UGT enzymes.
Enzymes Vmax (nmol/min/mg) Km (mM) Ksi CLint (ml/min/mg) Fitted model
HLM 1.38 ± 0.03 1.02 ± 0.10 NA 1.36 ± 0.14 MMUGT1A1 1.32 ± 0.29 0.16 ± 0.08 2.70 ± 1.33 8.34 ± 2.30 SIUGT1A3 1.34 ± 0.25 1.79 ± 0.71 28.1 ± 12.8 0.75 ± 0.17 SIUGT1A7 0.10 ± 0.01 0.91 ± 0.11 NA 0.11 ± 0.01 MMUGT1A8 0.65 ± 0.02 1.10 ± 0.17 NA 0.59 ± 0.09 MMUGT1A9 0.09 ± 0.01 0.77 ± 0.12 NA 0.12 ± 0.02 MMUGT1A10 0.14 ± 0.01 1.22 ± 0.16 NA 0.11 ± 0.01 MMUGT2B7 0.18 ± 0.01 4.15 ± 0.20 NA 0.04 ± 0.00 MMRLM 0.11 ± 0.01 0.51 ± 0.09 NA 0.22 ± 0.04 BiphasicMsLM 0.29 ± 0.01 1.67 ± 0.06 NA 0.18 ± 0.01 MMDLM 1.10 ± 0.02 9.39 ± 0.50 NA 0.12 ± 0.01 MMPLM 0.09 ± 0.01 0.22 ± 0.01 NA 0.40 ± 0.02 MMMkLM 0.96 ± 0.01 1.66 ± 0.07 NA 0.58 ± 0.03 MM
Data are represented by mean ± SD. HLM, human liver microsomes; DLM, dog liver microsomes; PLM, mini-pig livermicrosomes; MkLM, monkey liver microsomes; MsLM, mouse liver microsomes; RLM, rat liver microsomes; NA, notapplicable; MM, Michaelis–Menten model; SI, substrate inhibition.
DOI: 10.3109/00498254.2015.1047812 In vitro characterization of niclosamide metabolism 9
We found that UGT1A1 was primarily responsible for
glucuronidation of niclosamide in the liver and glucuronida-
tion of niclosamide occurred at the phenolic hydroxyl group.
In our previous studies and others, UGT1A1 contributed
significantly to hepatic glucuronidation of the compounds
bearing hydroxyl group(s) such as macelignan and capsaicin
(Liu et al., 2014a; Sun et al., 2014; Wang et al., 2013). Hence,
the role of UGT1A1 in glucuronidation of drugs containing
hydroxyl group(s) should never be underestimated. In
addition, UGT1A1 is a polymorphic enzyme. The UGT1A1
polymorphism (UGT1A1*28) has been associated with the
dose-limiting toxicities in irinotecan (also known as CPT-11)
chemotherapy (Fujita & Sparreboom, 2010; Nagar &
Blanchard, 2006). Thus, varied glucuronidation of niclosa-
mide would be highly possible among UGT1A1 genotypes.
However, it remained to be investigated whether the overall
metabolism and drug exposure of niclosamide would be
influenced by the UGT1A1 polymorphisms.
Metabolic activities of the enzymes toward niclosamide
were determined by kinetic profiling that included the
metabolic rates at various substrate concentrations.
Comparisons of enzyme activities were performed based on
the parameter CLint (intrinsic clearance) derived from kinetic
modeling. The CLint value, independent of substrate concen-
tration, measures the catalytic efficiency of functional
enzymes. Use of CLint was more advantageous in character-
ization of enzyme activities compared to the metabolic rates
(at one or more substrate concentrations). It was noteworthy
that the substrate concentrations in microsomal incubations
(and the kinetic parameters) were not corrected by pro-
tein binding. This was because binding of niclosamide
(log P¼ 4.0) to microsomal proteins was negligible
Figure 8. (A) Comparisons of the intrinsic values (CLint) for niclosamide glucuronidation by 12 expressed UGT enzymes. (B and C) Correlationanalysis between niclosamide glucuronidation and estradiol glucuronidation in a bank of individual HLMs (n¼ 14). (D and E) Correlation analysisbetween niclosamide glucuronidation and chenodeoxycholic acid glucuronidation in a bank of individual HLMs (n¼ 14).
10 D. Lu et al. Xenobiotica, 2016; 46(1): 1–13
(fu¼ 97.5) according to the Hallifax and Houston model
(Hallifax & Houston, 2006; Zhou et al., 2010). The model
consisting of log P and microsomal protein concentration
has been shown to provide accurate predictions on fu
values for the compounds with intermediate lipophilicity
(log P¼ 2.5–5) (Gao et al., 2010). Also, comparative assess-
ment of several predictive models of fu has revealed that the
Halifax and Houston model is one of the best performing
prediction methods (Poulin & Haddad, 2011).
Systemic bioavailability of niclosamide was very low after
oral uptake of the drug (�10% in rats) (Chang et al., 2006).
Oral niclosamide is effective in management of tapeworms
that resides in the intestinal lumen (Al-Hadiya, 2005).
However, the low systemic bioavailability may be a concern
when it comes to the chemotherapy with niclosamide wherein
the intestinal lumen is not the target site. A better under-
standing of the causes to poor intestinal absorption of
niclosamide would help to find means to enhance the oral
bioavailability. Our study indicated that first-pass metabolism
in the liver and intestine would be a significant limiting factor
to oral absorption of niclosamide. Although the metabolism
data were unavailable with intestine microsomes, there is a
high possibility that niclosamide would be subjected to
intestinal glucuronidation. This is because the human intes-
tine abundantly expresses the catalytically active UGT
enzymes (e.g., UGT1A1, 1A8, 1A10 and 2B7) (Nakamura
et al., 2008; Ohno & Nakajin, 2009). Intestinal hydroxylation
should be negligible or none because CYP1A2 is not
expressed in human intestine (Paine et al., 2006).
In an early study, a reduced metabolite was generated from
niclosamide by mouse liver homogenate (Douch & Gahagan,
1977). However, no such metabolite was found in our
microsomal incubations (mouse and all other species). This
inconsistency may be accounted for by the differences in
enzyme sources. It was speculated that the reduction reaction
was catalyzed by the enzymes that were not expressed in the
microsomal organelles. By contrast, our finding that niclosa-
mide underwent efficient glucuronidation in various animals
was consistent with an early study in which the glucuroni-
dated metabolite was found in fish tissues after exposure to
niclosamide (Dawson et al., 1999). This may indicate that the
glucuronidation reaction was a universal detoxification
mechanism for niclosamide among animal species.
Three CYP1A2 inhibitors (i.e., fluvoxamine, a-naphtho-
flavone and apigenin) were selected to assess their inhibitory
effects on niclosamide hydroxylation in HLM. Fluvoxamine is
a selective inhibitor of CYP1A2, whereas the other two
inhibitors are dual inhibitors of both CYP1A1 and 1A2
(Pastrakuljic et al., 1997; Reid et al., 1999). Inhibition of
niclosamide metabolism by a-naphthoflavone (or fluvox-
amine) was essentially complete at concentrations of �0.5 mM
(or �1 mM). More than 80% of niclosamide metabolism was
inhibited by apigenin at concentrations of �1 mM (Figure 5).
The results were consistent with previous findings that
fluvoxamine, a-naphthoflavone and apigenin were rather
potent CYP1A2 inhibitors (Pastrakuljic et al., 1997; Reid
et al., 1999).
Hydroxylation of niclosamide mediated by HLM followed
Michaelis–Menten kinetics, whereas the reaction mediated by
the main active enzyme CYP1A2 displayed substrate
inhibition kinetics (Figures 3 and 4). Likewise, glucuronida-
tion of niclosamide mediated by HLM followed Michaelis–
Menten kinetics, whereas the reaction mediated by UGT1A1
(the main contributing enzyme) displayed substrate inhibition
kinetics (Figures 6 and 7). Similar observations have been
also noted in the study of Zhu et al. (2012). Glucuronidation
of magnolol by HIM showed substrate inhibition kinetics, but
UGT1A10 (one main contributor) displayed Michaelis–
Menten kinetics (Zhu et al., 2012). Although we were
unable to provide exact explanations for this apparent
‘‘conflict’’, the distinct kinetic profiles may be associated
with the differences in enzyme sources. HLM or HIM is
human tissue specific, whereas the recombinant enzymes
were prepared from insect cells overexpressing a particular
enzyme.
In conclusion, we have characterized the metabolism of
niclosamide by CYP and UGT enzymes using liver micro-
somes and expressed enzymes. NADPH-supplemented HLM
(and liver microsomes from various animal species) generated
one hydroxylated metabolite (M1) from niclosamide; and
UDPGA-supplemented liver microsomes generated one
mono-O-glucuronide (M2). The chemical structures of M1
and M2 were determined through LC–MS/MS and/or NMR
analyses. Reaction phenotyping revealed that CYP1A2 was
the main enzyme responsible for M1 formation. The import-
ant role of CYP1A2 in niclosamide metabolism was further
confirmed by activity correlation analysis as well as inhibition
experiments using specific inhibitors. Although seven UGT
enzymes were able to catalyze glucuronidation of niclosa-
mide, UGT1A1 and 1A3 were the enzymes showed the
highest metabolic activities. Activity correlation analyses
showed that UGT1A1 played a predominant role in hepatic
glucuronidation of niclosamide, whereas the role of UGT1A3
was negligible or none. This was the first report that
niclosamide was subjected to efficient hydroxylation and
glucuronidation, wherein CYP1A2 and UGT1A1 were the
main contributing enzymes, respectively.
Declaration of interest
This work was supported by the National Natural Science
Foundation of China (No. 81373496), the Program for Pearl
River New Stars of Science and Technology in Guangzhou
(No. 2014059), and the Doctoral Fund of Ministry of
Education of China (20134401120014). The authors report
no conflict of interest.
References
Al-Hadiya BM. (2005). Niclosamide: comprehensive profile. ProfilesDrug Subst Excip Relat Methodol 32:67–96.
Bjornsson TD, Callaghan JT, Einolf HJ, et al., Pharmaceutical Researchand Manufacturers of America (PhRMA) Drug Metabolism/ClinicalPharmacology Technical Working Group; FDA Center for DrugEvaluation and Research (CDER). (2003). The conduct of in vitro andin vivo drug–drug interaction studies: a Pharmaceutical Research andManufacturers of America (PhRMA) perspective. Drug Metab Dispos31:815–32.
Chang YW, Yeh TK, Lin KT, et al. (2006). Pharmacokinetics of anti-SARS-CoV agent niclosamide and its analogs in rats. J Food DrugAnal 14:329–33.
DOI: 10.3109/00498254.2015.1047812 In vitro characterization of niclosamide metabolism 11

Costa A, Sarmento B, Seabra V. (2014). An evaluation of the latestin vitro tools for drug metabolism studies. Expert Opin Drug MetabToxicol 10:103–19.
Court MH. (2005). Isoform-selective probe substrates for in vitro studiesof human UDP-glucuronosyltransferases. Methods Enzymol 400:104–16.
Cubitt HE, Houston JB, Galetin A. (2011). Prediction of human drugclearance by multiple metabolic pathways: integration of hepatic andintestinal microsomal and cytosolic data. Drug Metab Dispos 39:864–73.
Dawson VK, Schreier TM, Boogaard MA, Gingerich WH. (1999).Uptake, metabolism, and elimination of niclosamide by fish. In: SmithDJ, Gingerich WH, Beconi-Barker MG, eds. Xenobiotics in fish.Springer, 167–76.
Douch PG, Gahagan HM. (1977). The metabolism of niclosamideand related compounds by Moniezia expansa, Ascarislumbricoides var suum, and mouse- and sheep-liver enzymes.Xenobiotica 7:301–7.
Emoto C, Murayama N, Rostami-Hodjegan A, Yamazaki H. (2010).Methodologies for investigating drug metabolism at the early drugdiscovery stage: prediction of hepatic drug clearance and P450contribution. Curr Drug Metab 11:678–85.
Evans WE, Relling MV. (1999). Pharmacogenomics: translating func-tional genomics into rational therapeutics. Science 286:487–91.
Fang ZZ, Krausz KW, Nagaoka K, et al. (2014). In vivo effects of thepure aryl hydrocarbon receptor antagonist GNF-351 after oraladministration are limited to the gastrointestinal tract. Br JPharmacol 171:1735–46.
Fonseca BD, Diering GH, Bidinosti MA, et al. (2012). Structure–activityanalysis of niclosamide reveals potential role for cytoplasmic pH incontrol of mammalian target of rapamycin complex 1 (mTORC1)signaling. J Biol Chem 287:17530–45.
Fujita K, Sparreboom A. (2010). Pharmacogenetics ofirinotecan disposition and toxicity: a review. Curr Clin Pharmacol 5:209–17.
Gao H, Steyn SJ, Chang G, Lin J. (2010). Assessment of in silico modelsfor fraction of unbound drug in human liver microsomes. Expert OpinDrug Metab Toxicol 6:533–42.
Gertz M, Houston JB, Galetin A. (2011). Physiologically basedpharmacokinetic modeling of intestinal first-pass metabolism ofCYP3A substrates with high intestinal extraction. Drug MetabDispos 39:1633–42.
Griffiths LA, Facchini V. (1979). The major metabolites of niclosamide:identification by mass spectrometry. In: Frigerio A, ed. Recentdevelopments in mass spectrometry in biochemistry and medicine.Vol. 2. Springer, 121–6.
Hallifax D, Foster JA, Houston JB. (2010). Prediction of humanmetabolic clearance from in vitro systems: retrospective analysis andprospective view. Pharm Res 27:2150–61.
Hallifax D, Houston JB. (2006). Binding of drugs to hepatic microsomes:comment and assessment of current prediction methodology withrecommendation for improvement. Drug Metab Dispos 34:724–6;author reply 727.
Hutzler JM, Tracy TS. (2002). Atypical kinetic profiles in drugmetabolism reactions. Drug Metab Dispos 30:355–62.
Imperi F, Massai F, Ramachandran Pillai C, et al. (2013). New life for anold drug: the anthelmintic drug niclosamide inhibits Pseudomonasaeruginosa quorum sensing. Antimicrob Agents Chemother 57:996–1005.
Jin Y, Lu Z, Ding K, et al. (2010). Antineoplastic mechanisms ofniclosamide in acute myelogenous leukemia stem cells: inactivation ofthe NF-kappaB pathway and generation of reactive oxygen species.Cancer Res 70:2516–27.
Kassahun K, Mattiuz E, Franklin R, Gillespie T. (1998). Olanzapine10-N-glucuronide: a tertiary N-glucuronide unique to humans. DrugMetab Dispos 26:848–55.
Kola I, Landis J. (2004). Can the pharmaceutical industry reduce attritionrates? Nat Rev Drug Discov 3:711–15.
Li Y, Li PK, Roberts MJ, et al. (2014). Multi-targeted therapy of cancerby niclosamide: a new application for an old drug. Cancer Lett 349:8–14.
Liu W, Liu H, Sun H, et al. (2014b). Metabolite elucidation of the Hsp90inhibitor SNX-2112 using ultraperformance liquid chromatography/quadrupole time-of-flight mass spectrometry (UPLC-QTOF/MS).Xenobiotica 44:455–64.
Liu H, Sun H, Lu D, et al. (2014a). Identification of glucuronidation andbiliary excretion as the main mechanisms for gossypol clearance:in vivo and in vitro evidence. Xenobiotica 44:696–707.
Mackenzie PI, Bock KW, Burchell B, et al. (2005). Nomenclature updatefor the mammalian UDP glycosyltransferase (UGT) gene superfamily.Pharmacogenet Genomics 15:677–85.
Manevski N, Moreolo PS, Yli-Kauhaluoma J, Finel M. (2011).Bovine serum albumin decreases Km values of humanUDP-glucuronosyltransferases 1A9 and 2B7 and increases Vmaxvalues of UGT1A9. Drug Metab Dispos 39:2117–29.
Nagar S, Blanchard RL. (2006). Pharmacogenetics of uridinediphosphoglucuronosyltransferase (UGT) 1A family membersand its role in patient response to irinotecan. Drug Metab Rev 38:393–409.
Nakajima M, Nakamura S, Tokudome S, et al. (1999). AzelastineN-demethylation by cytochrome P-450 (CYP)3A4, CYP2D6, andCYP1A2 in human liver microsomes: evaluation of approach topredict the contribution of multiple CYPs. Drug Metab Dispos 27:1381–91.
Nakamura A, Nakajima M, Yamanaka H, et al. (2008). Expression ofUGT1A and UGT2B mRNA in human normal tissues and various celllines. Drug Metab Dispos 36:1461–4.
Ohno S, Nakajin S. (2009). Determination of mRNA expression ofhuman UDP-glucuronosyltransferases and application for localizationin various human tissues by real-time reverse transcriptase-polymer-ase chain reaction. Drug Metab Dispos 37:32–40.
Ortiz de Montellano PR. (2005). Cytochrome P450: structure, mechan-ism, and biochemistry. Springer Science & Business Media.
Paine MF, Hart HL, Ludington SS, et al. (2006). The human intestinalcytochrome P450 ‘‘pie’’. Drug Metab Dispos 34:880–6.
Pan JX, Ding K, Wang CY. (2012). Niclosamide, an old antihelminthicagent, demonstrates antitumor activity by blocking multiple signalingpathways of cancer stem cells. Chin J Cancer 31:178–84.
Park SJ, Shin JH, Kang H, et al. (2011). Niclosamide inducesmitochondria fragmentation and promotes both apoptotic andautophagic cell death. BMB Rep 44:517–22.
Pastrakuljic A, Tang BK, Roberts EA, Kalow W. (1997). Distinction ofCYP1A1 and CYP1A2 activity by selective inhibition using fluvox-amine and isosafrole. Biochem Pharmacol 53:531–8.
Poulin P, Haddad S. (2011). Microsome composition-based model as amechanistic tool to predict nonspecific binding of drugs in livermicrosomes. J Pharm Sci 100:4501–17.
Prentis RA, Lis Y, Walker SR. (1988). Pharmaceutical innovation by theseven UK-owned pharmaceutical companies (1964–1985). Br J ClinPharmacol 25:387–96.
Reid JM, Kuffel MJ, Miller JK, et al. (1999). Metabolicactivation of dacarbazine by human cytochromes P450: therole of CYP1A1, CYP1A2, and CYP2E1. Clin Cancer Res 5:2192–7.
Rowland A, Elliot DJ, Knights KM, et al. (2008). The ‘‘albumin effect’’and in vitro–in vivo extrapolation: sequestration of long-chainunsaturated fatty acids enhances phenytoin hydroxylation by humanliver microsomal and recombinant cytochrome P450 2C9. DrugMetab Dispos 36:870–7.
Seo KA, Kim HJ, Jeong ES, et al. (2014). In vitro assay of six UDP-glucuronosyltransferase isoforms in human liver microsomes, usingcocktails of probe substrates and liquid chromatography–tandem massspectrometry. Drug Metab Dispos 42:1803–10.
Shet MS, McPhaul M, Fisher CW, et al. (1997). Metabolism of theantiandrogenic drug (Flutamide) by human CYP1A2. Drug MetabDispos 25:1298–303.
Shimada H, Eto M, Ohtaguro M, et al. (2010). Differential mechanismsfor the inhibition of human cytochrome P450 1A2 by apigenin andgenistein. J Biochem Mol Toxicol 24:230–4.
Sun H, Wang H, Liu H, et al. (2014). Glucuronidation of capsaicin byliver microsomes and expressed UGT enzymes: reaction kinetics,contribution of individual enzymes and marked species differences.Expert Opin Drug Metab Toxicol 10:1325–36.
Tassaneeyakul W, Birkett DJ, Veronese ME, et al. (1993). Specificity ofsubstrate and inhibitor probes for human cytochromes P450 1A1 and1A2. J Pharmacol Exp Ther 265:401–7.
von Moltke LL, Weemhoff JL, Bedir E, et al. (2004). Inhibition ofhuman cytochromes P450 by components of Ginkgo biloba. J PharmPharmacol 56:1039–44.
12 D. Lu et al. Xenobiotica, 2016; 46(1): 1–13
Wang AM, Ku HH, Liang YC, et al. (2009). The autonomousnotch signal pathway is activated by baicalin and baicaleinbut is suppressed by niclosamide in K562 cells. J Cell Biochem106:682–92.
Wang LZ, Ramirez J, Yeo W, et al. (2013). Glucuronidation by UGT1A1is the dominant pathway of the metabolic disposition of belinostat inliver cancer patients. PLoS One 8:e54522.
Wells PG, Mackenzie PI, Chowdhury JR, et al. (2004). Glucuronidationand the UDP-glucuronosyltransferases in health and disease. DrugMetab Dispos 32:281–90.
Wu B, Dong D, Hu M, Zhang S. (2013). Quantitative prediction ofglucuronidation in humans using the in vitro–in vivo extrapolationapproach. Curr Top Med Chem 13:1343–52.
Zhou J, Tracy TS, Remmel RP. (2010). Glucuronidationof dihydrotestosterone and trans-androsterone by recombinantUDP-glucuronosyltransferase (UGT) 1A4: evidence formultiple UGT1A4 aglycone binding sites. Drug Metab Dispos 38:431–40.
Zhou SF, Yang LP, Zhou ZW, et al. (2009). Insights into the substratespecificity, inhibitors, regulation, and polymorphisms and the clinicalimpact of human cytochrome P450 1A2. AAPS J 11:481–94.
Zhu LL, Ge GB, Zhang HB, et al. (2012). Characterization of hepaticand intestinal glucuronidation of magnolol: application of the relativeactivity factor approach to decipher the contributions of multipleUDP-glucuronosyltransferase isoforms. Drug Metab Dispos 40:529–38.
Supplementary material available online
Supplementary Tables S1–S3.
DOI: 10.3109/00498254.2015.1047812 In vitro characterization of niclosamide metabolism 13


