Analysis of the Competitive Position and Competitiveness ...
154
Erasmus University Rotterdam MSc in Maritime Economics and Logistics 2019/2020 Analysis of the Competitive Position and Competitiveness of the Port of Manzanillo in the Containerized Cargo Industry by Kassandra Magana Elizondo Copyright © Kassandra Magana Elizondo
Transcript of Analysis of the Competitive Position and Competitiveness ...
Erasmus University Rotterdam
MSc in Maritime Economics and Logistics
2019/2020
Analysis of the Competitive Position and Competitiveness
of the Port of Manzanillo in the Containerized Cargo
Industry
by
Kassandra Magana Elizondo
Copyright © Kassandra Magana Elizondo

II
“The strongest competitive force or forces determine the profitability of an industry and
become the most important to strategy formulation. The most salient force, however, is
not always obvious.”
― Michael E. Porter

I
Acknowledgements
The experiences lived and the knowledge acquired during this year at MEL were the most pleasant
and challenging for me, I feel happy that I have accomplished one of my most ambitious dreams.
I am grateful for all the knowledge, tools, and skills that I have acquired, I am sure that great
professional opportunities will come for me. This year in The Netherlands I became a persistent,
energetic, proactive, and strong woman, which allowed me to face all the challenges that arose in
the year. But it also brought me valuable friendships, with which I have learned, laughed, and
enjoyed. The preparation and completion of this thesis required me a lot of commitment and effort,
definitely, it was a stage that I really enjoyed.
Now is the time to express my sincere and infinite gratitude to all the people who were part of this
exciting adventure. First of all, the deepest and most important gratitude goes to my parents,
Claudia Elizondo Pacheco and Omar Magaña Ceballos, for giving me life, a wonderful academic
preparation, tenderness, and infinite love. They are the people who encouraged and supported
me to overcome the difficulties of being in a country far away from my hometown and to pursue
my dreams.
My deepest thankfulness to Prof. Elvira Haezendonck, who supervised me with this thesis. Without
her valuable supervision, the achievement of this research would not have been possible. I am
infinitely grateful for her suggestions and ideas for the writing of the thesis. Thereby, I would like
to express my sincere appreciation for her generosity, kindness, and professionalism. Without a
doubt, I want to express my true gratitude to my professors, academics, and staff of MEL, who
were always with us throughout this professional journey.
Last but not least, I want to thank the staff of API Manzanillo in response to the interviews
conducted, I appreciate the support during this research period. I also want to express my
gratitude and love to my friends from Mexico and The Netherlands, people who always encourage
me and express love to continue working on my professional and personal goals.
Sincerely,
Kassandra Magana Elizondo
II
Abstract
The importance of planning strategies to achieve greater competitiveness has become more
evident in the context of seaports, this due to the intensification of global competition in the
container industry. For this reason, analyzing and determining the strategic competitive position
of ports together with their competitive advantages that distinguish them is essential. The port
sector is one of the key sources that stimulates the growth and development of the Mexican
economy. In each analytical procedure, the researcher takes into account the important role of
containerized cargo in the Mexican port sector and Manzanillo ’s ambition to become the leading
Latin American container port in the Pacific Ocean, with world-class and sustainable infrastructure
and operation. Hereby, this quantitative and qualitative research demonstrates the strong
relationship between the nature of the market structure of the container industry and Manzanillo ’s
competitive position vis-à-vis its competitors, namely the ports of Lázaro Cárdenas, Los Angles,
and Long Beach. To solve the research question addressed in this thesis, What competitive
determinants underly the competitive position of the port of Manzanillo in the container industry?,
the full SPA tool and Porter’s diamond model were executed, based on the primary and secondary
data collected in relation to the port sector in Mexico and the United States, along with relevant
information about the containerized industry. The results reveal that Manzanillo has positioned
itself positively as “High Potential”, which means that the port has a low market share but high
growth rates. Likewise, the findings reveal that the port of Manzanillo and the Mexican Port System
have a variety of competitive advantages, which has allowed the commercial evolution and
competitiveness of Manzanillo. Despite that, operational disadvantages are also identified, which
API Manzanillo and its port users must address and solve.
III
Table of Contents
Acknowledgements ........................................................................................................................ I
Abstract ........................................................................................................................................... II
Table of Contents .......................................................................................................................... III
List of Tables ................................................................................................................................ VI
List of Figures .............................................................................................................................. VII
List of Abbreviations ................................................................................................................... IX
1 Introduction ............................................................................................................................ 1
1.1 Research Background ...................................................................................................... 1
1.2 Problem Definition ............................................................................................................ 2
1.3 Aim of the Study ............................................................................................................... 3
1.4 Research Questions ......................................................................................................... 3
1.5 Data Collection ................................................................................................................. 4
1.6 Thesis Structure ............................................................................................................... 7
2 Literature Review ................................................................................................................... 9
2.1 Introduction ....................................................................................................................... 9
2.2 Defining Port Competition ................................................................................................ 9
2.3 Levels of Port Competition ............................................................................................. 11
2.4 Defining Port Competitiveness....................................................................................... 14
2.5 The Relationship between Port Competition and Competitiveness .............................. 15
2.6 Overview of the Theoretical Frameworks ...................................................................... 17
2.6.1 Frameworks for Analyzing Port Competition ............................................................. 17
2.6.2 Frameworks for Analyzing of Port Competitiveness.................................................. 19
2.6.3 Remarks on the Theoretical Frameworks .................................................................. 20
2.7 Conclusions of the Chapter ............................................................................................ 21
3 Methodology ......................................................................................................................... 23
3.1 Introduction ..................................................................................................................... 23
3.2 Strategic Positioning Analysis (SPA) ............................................................................. 23
3.2.1 Product Portfolio Analysis (PPA) ............................................................................... 24
3.2.1.1 PPA Level 1 ........................................................................................................ 26
IV
3.2.1.2 PPA Level 2 ........................................................................................................ 27
3.2.1.3 PPA Level 3 ........................................................................................................ 27
3.2.1.4 PPA Level 4 ........................................................................................................ 27
3.2.2 Shift-Share Analysis (SSA) ........................................................................................ 28
3.2.3 Product Diversification Analysis (PDA) ...................................................................... 31
3.2.4 A “Weighted” and “Unweighted” Analysis .................................................................. 32
3.3 Comments on the Chosen Methodologies .................................................................... 33
3.4 Porter’s Diamond Model................................................................................................. 34
3.4.1 Factor Conditions ....................................................................................................... 35
3.4.2 Demand Conditions .................................................................................................... 36
3.4.3 Related and Supporting Industries ............................................................................ 36
3.4.4 Firm’s strategy, structure, and rivalry ......................................................................... 37
3.4.5 The role of Government ............................................................................................. 37
3.4.6 The role of Chance ..................................................................................................... 37
3.4.7 Limitations of Porter’s diamond model....................................................................... 38
3.5 Conclusions of the Chapter ............................................................................................ 39
4 Multiple-Case Analysis ........................................................................................................ 41
4.1 Introduction ..................................................................................................................... 41
4.2 Data Collection ............................................................................................................... 42
4.3 Data Collection Issues ................................................................................................... 43
4.4 Overview of the Mexican Port System ........................................................................... 46
4.5 Port of Manzanillo........................................................................................................... 47
4.5.1 Geographic location of the Port of Manzanillo ........................................................... 47
4.5.2 Port Authority of Manzanillo (API Manzanillo) ........................................................... 48
4.5.3 Traffic Cargo Flow ...................................................................................................... 49
4.5.4 Hinterland ................................................................................................................... 50
4.5.5 Foreland ..................................................................................................................... 51
4.5.6 Maritime, highway, and railway connectivity.............................................................. 52
4.5.7 Port Infrastructure....................................................................................................... 54
4.5.8 Port Terminals and Facilities ...................................................................................... 55
4.5.9 Container Handling Facilities ..................................................................................... 55
4.5.10 Port Master Development Program (PMDP) 2015 – 2020 .................................... 56
4.5.11 Statistics of the Port of Manzanillo ......................................................................... 56
4.6 Competitors of the Port of Manzanillo............................................................................ 58
4.6.1 Overview of Port Competition of Manzanillo.............................................................. 59
4.6.2 Port of Lázaro Cárdenas ............................................................................................ 59
4.6.3 Port of Los Angeles .................................................................................................... 64
4.6.4 Port of Long Beach .................................................................................................... 68
4.7 Conclusions of the Chapter ............................................................................................ 71
V
5 Results and Interpretations ................................................................................................ 72
5.1 Introduction ..................................................................................................................... 72
5.2 Strategic Position Analysis (SPA) Results ..................................................................... 72
5.2.1 Comparative Traffic Structure .................................................................................... 72
5.2.2 Portfolio Analysis Applied to the Port Range ............................................................. 74
5.2.2.1 Portfolio of ports for total traffic (Level 1) ........................................................... 74
5.2.2.2 Portfolio of traffic categories for individual seaports (Level 2) .......................... 75
5.2.2.3 Portfolio of ports for individual traffic category (Level 3) ................................... 78
5.2.2.4 Portfolio of ports for individual traffic category, related to these category’s share
in port traffic and share in the range (Level 4) ................................................................... 80
5.2.2.5 Dynamic portfolio of ports .................................................................................. 82
5.2.3 Shift-Share Analysis Applied to the Port Range ........................................................ 84
5.2.3.1 Share-Effect ....................................................................................................... 84
5.2.3.2 Shift-Effect .......................................................................................................... 85
5.2.4 Diversification Analysis Applied to the Port Range: Diversification Index................. 88
5.3 Porter’s Diamond Results .............................................................................................. 90
5.3.1 National Porter’s diamond applied to the Port Sector of Manzanillo ......................... 91
5.3.2 Porter’s diamond interpretation: Port of Manzanillo .................................................. 92
5.3.3 National Porter’s diamond applied to the Port Sector of Lázaro Cárdenas .............. 96
5.3.4 Porter’s diamond interpretation: Port of Lázaro Cárdenas ........................................ 97
5.3.5 Regional Porter’s diamond applied to the Port Sector of Los Angeles ................... 100
5.3.6 Porter’s diamond interpretation: Port of Los Angeles .............................................. 101
5.3.7 Regional Porter’s diamond applied to the Port Sector of Long Beach.................... 105
5.3.8 Porter’s diamond interpretation: Port of Long Beach .............................................. 106
6 Discussion of the Results ................................................................................................. 109
6.1 Introduction ................................................................................................................... 109
6.2 SPA discussion: Port Competition ............................................................................... 109
6.3 Porter’s diamond discussion: Port Competitiveness ................................................... 111
7 Conclusions ........................................................................................................................ 115
7.1 Answering Research Questions................................................................................... 115
7.2 Research Limitations .................................................................................................... 120
7.3 Recommendation for Future Research........................................................................ 121
7.4 Final Conclusions ......................................................................................................... 122
Bibliography ............................................................................................................................... 124
Appendix ..................................................................................................................................... 135
VI
List of Tables
Table 1 Factor Conditions of Porter’s (1990) Diamond Model ..................................................... 36
Table 2 Diversification Analysis Index ........................................................................................... 88
Table 3 Port Statistics of Manzanillo 2007 – 2019 (in 1,000 MT) ............................................... 135
Table 4 Port Statistics of Lázaro Cárdenas 2007 – 2019 (in 1,000 MT) .................................... 135
Table 5 Port Statistics of Los Angeles 2007 – 2019 (in 1,000 MT) ............................................ 136
Table 6 Port Statistics of Long Beach 2007 – 2019 (in 1,000 MT) ............................................. 136
Table 7 Annual Container Throughput (TEUs) per Mexican Port (2014 – 2019) ....................... 137
Table 8 Comparison of the Annual Container Throughput (2009 – 2019) of the Ports of Los
Angeles, Long Beach, and Manzanillo ........................................................................................ 137
Table 9 Average Market Shares and Average Annual Growth Rates of the Port of Manzanillo 138
Table 10 Average Market Shares and Average Annual Growth Rates of the Port of Lázaro
Cárdenas ...................................................................................................................................... 138
Table 11 Average Market Shares and Average Annual Growth Rates of the Port of Los Angeles
...................................................................................................................................................... 139
Table 12 Average Market Shares and Average Annual Growth Rates of the Port of Long Beach
...................................................................................................................................................... 140
Table 13 Shift-share analysis of the Port of Manzanillo .............................................................. 141
Table 14 Shift-share analysis of the Port of Lázaro Cárdenas ................................................... 141
Table 15 Shift-share analysis of the Port of Los Angeles ........................................................... 141
Table 16 Shift-share analysis of the Port of Long Beach............................................................ 141
Table 17 Diversification indices Port of Manzanillo and Lázaro Cárdenas ................................ 142
Table 18 Diversification indices Port of Los Angeles and Long Beach ...................................... 142
VII
List of Figures
Figure 2.1 Three Levels Port Competition within a Port Range ................................................... 12
Figure 2.2 Four Levels of Port Competition within a Port Range ................................................. 13
Figure 2.3 Relation between Port Competition and Competitiveness .......................................... 15
Figure 3.1 Boston Consulting Group-Matrix ................................................................................. 25
Figure 3.2 BCG Matrix adapted for the Port Industry ................................................................... 26
Figure 3.3 Graphical Representation of SSA-Results .................................................................. 30
Figure 3.4 Porter’s Diamond Model .............................................................................................. 35
Figure 3.5 Porter’s Diamond Model extended for the Port Industry ............................................. 39
Figure 4.1 Map of the Mexican Port System................................................................................. 47
Figure 4.2 Geographic Location of the Port of Manzanillo ........................................................... 48
Figure 4.3 Total Throughput by Commodity (2007 – 2019) of the Port of Manzanillo ................. 50
Figure 4.4 Hinterland of the Port of Manzanillo ............................................................................ 51
Figure 4.5 Foreland of the Port of Manzanillo............................................................................... 52
Figure 4.6 Highway Corridors of Mexico and its connection with the Port of Manzanillo ............ 53
Figure 4.7 Rail Connectivity of the Port of Manzanillo .................................................................. 54
Figure 4.8 Annual Container Throughput (TEUs) per Mexican Port ............................................ 58
Figure 4.9 Geographic Location of the Port of Lázaro Cárdenas................................................. 60
Figure 4.10 Total Throughput by Commodity (2007 – 2019) of the Port of Lázaro Cárdenas .... 61
Figure 4.11 Hinterland of the Port of Lázaro Cárdenas ................................................................ 62
Figure 4.12 Foreland of the Port of Lázaro Cárdenas .................................................................. 63
Figure 4.13 Rail Connectivity of the Port of Lázaro Cárdenas ..................................................... 64
Figure 4.14 Geographic Location of the Ports of Los Angeles and Long Beach ......................... 65
Figure 4.15 Rail Connectivity of the Port of Los Angeles ............................................................. 66
Figure 4.16 Foreland of the Port of Los Angeles .......................................................................... 67
Figure 4.17 Comparison of the Total Container Throughput (2009 – 2019) of the Ports of Los
Angeles, Long Beach, and Manzanillo .......................................................................................... 68
Figure 4.18 Geographical Proximity between the Ports of Los Angeles and Long Beach .......... 69
Figure 4.19 Rail Connectivity of the Port of Long Beach.............................................................. 70
Figure 5.1 Comparative traffic structure in the port range (unweighted analysis) ....................... 73
Figure 5.2 Portfolio of ports with their total traffic in the port range (unweighted analysis) ......... 74
Figure 5.3 Traffic structure of the Port of Manzanillo (2007 – 2019) ............................................ 75
Figure 5.4 Traffic structure of the Port of Lázaro Cárdenas (2007 – 2019) ................................. 76
Figure 5.5 Traffic structure of the Port of Los Angeles (2007 – 2019) ......................................... 76
VIII
Figure 5.6 Traffic structure of the Port of Long Beach (2007 – 2019) .......................................... 77
Figure 5.7 Structure of container traffic in the port range (2007 – 2019) ..................................... 79
Figure 5.8 Analysis of total container traffic (versus total port traffic) of the port range (2007 –
2019) .............................................................................................................................................. 81
Figure 5.9 Dynamic analysis of the total traffic in the port range (2007 – 2019 in three time
periods) ........................................................................................................................................... 82
Figure 5.10 Dynamic analysis of the container traffic in the port range (2007 – 2019 in three time
periods) ........................................................................................................................................... 83
Figure 5.11 Shift-effect of total traffic in the port range (2007 – 2011) ........................................ 85
Figure 5.12 Shift-effect of total traffic in the port range (2011 – 2015) ........................................ 86
Figure 5.13 Shift-effect of total traffic in the port range (2015 – 2019) ........................................ 86
Figure 5.14 Porter’s diamond of the Port of Manzanillo. .............................................................. 91
Figure 5.15 Porter’s diamond of the Port of Lázaro Cárdenas. .................................................... 96
Figure 5.16 Porter’s diamond of the Port of Los Angeles........................................................... 100
Figure 5.17 Porter’s diamond of the Port of Long Beach. .......................................................... 105
IX
List of Abbreviations
AMANAC Asociación Mexicana de Agentes Navieros (Mexican Association of
Shipping Agents)
AMTI Asociación Mexicana del Transporte Intermodal, A.C. (Mexican
Association of Intermodal Transport)
ANTP Asociación Nacional de Transporte Privado, A.C. (National Association
of Private Transport)
API Lázaro Cárdenas Administración Portuaria Integral de Lázaro Cárdenas S.A. de C.V.
(Integral Port Administration of Lázaro Cárdenas)
API Manzanillo Administración Portuaria Integral de Manzanillo S.A. de C.V. (Integral
Port Administration of Manzanillo)
APL American President Lines Ltd.
APM Terminals Container terminal part of A.P. Moller - Maersk
ASCE American Society of Civil Engineers
ATOP Asociación de Terminales y Operadores Portuarios, A.C. (Association
of Terminals and Port Operators)
BA Benchmarking Analysis
BCG Boston Consulting Group
BNSF Burlington Northern Santa Fe Railway
CANACAR Cámara Nacional del Autotransporte de Carga (National Trucking
Chamber)
CG General Cargo
CGPyMM Coordinación General de Puertos y Marina Mercante (General
Coordination of Ports and Merchant Marine)
CMA CGM S.A. Compagnie Maritime d'Affrètement and Compagnie Générale Maritime
CMSA Contecon Manzanillo
COMCE Consejo Empresarial Mexicano de Comercio Exterior, Inversión y
Tecnología A. C. (Mexican Business Council for Foreign Trade)
CON Containers
COSCO China Ocean Shipping Company
CSCL China Shipping Container Lines
DB Dry Bulk
Evergreen Evergreen Marine Corporation
Ferromex Ferrocarril Mexicano, S.A.
FIDENA Fideicomiso de Formación y Capacitación para el Personal de la
Marina Mercante Nacional (Maritime Education Trust).
FSIDCN Fondo Sectorial de Investigación y Desarrollo en Ciencias Navales
(Sectorial Fund for Research and Development in Naval Sciences)
FTA Free Trade Agreement
GDP Gross Domestic Product
Hamburg Süd Hamburg Südamerikanische Dampfschifffahrts-Gesellschaft A/S & Co
KG
X
Hapag-Lloyd AG Hamburg-American Line and North German Lloyd
HHI Herfindahl-Hirschman Index
LA Los Angeles
LATAM Latin America
LB Liquid Bulk
LB Long Beach
LC Lázaro Cárdenas
LCL Less than Container Load
M Manzanillo
Maersk A.P. Møller – Mærsk A/S
MRT Metric Revenue Tons
MSA Market Share Analysis
MSC Mediterranean Shipping Company S.A.
MT Metric Tons
ONE Ocean Network Express
OOCL Orient Overseas Container Line
PCD Port Competitiveness Degree
PDA Product Diversification Analysis
PESTEL Political, Economic, Social, Technological, Environmental, and Legal
PIL Pacific International Lines
PMDP Programa Maestro de Desarrollo Portuario (Port Master Development
Program)
PPA Product Portfolio Analysis
R&D Research and Development
RMG Rail Mounted Gantry
Ro-Ro Roll on-Roll off
RT Revenue Tons
RTG Rubber Tired Gantry
SBU Strategic Business Unit
SCT Secretaría de Comunicaciones y Transportes (Secretariat of
Communications and Transport)
SPA Strategic Positioning Analysis
SSA Shift Distribution Analysis
STU Strategic Traffic Unit
SWOT Strengths, Weaknesses, Opportunities, and Threats
TEC I Specialized Container Terminal I
TEC II Specialized Container Terminal II
TEU Twenty-Foot Equivalent Unit
TIGER Transportation Investment Generating Economic Recovery
UP Union Pacific Railroad
US The United States
1
1 Introduction
The subject matter of this thesis is to analyze the strategic competitive position of the port of
Manzanillo, Mexico within the containerized cargo industry. Along with identifying and evaluating
the sources of competitive advantages of the containerized shipping industry in Mexico and
understanding the competitiveness of the port of Manzanillo in a global aspect. The study focuses
mainly on determining the port’s competitive position and the elements that drive its
competitiveness and commercial growth through a comparative analysis with the ports of Lázaro
Cárdenas, Los Angeles, and Long Beach, i.e. its competitors. Hereby, this chapter will present a
brief research background in the context of the Mexican port system within the containerization
industry. After this, a description of the problem definition will be made. Therefore, the objective
of this study will be introduced and the research question and sub-questions that the study pursues
to answer will be presented, followed by the explanation of the data collection used in the research.
In this way, the chapter concludes with a presentation of the structure of the thesis.
1.1 Research Background
Port activities generate a significant contribution to the economic development of countries,
allowing an increase in globalized transport trade (Mustafa, Khan, and Ahmed Farea, 2019).
However, the appearance of containerization revolutionized the shipping and port industry,
requiring special equipment and infrastructure for the correct and efficient handling of
containerized cargo. Seaports facilitate the transport of large volumes of goods worldwide, playing
a fundamental role in international trade, and generating intense competition among all users
(Bobadilla Falla and Venegas Camargo, 2018). Likewise, other factors that have caused this
intense competition are globalization, the vertical and horizontal integration of companies, and the
global reallocation of the workforce (Dang and Yeo, 2017). Thereby, it can be stated that
economies of the world with access to the sea, a properly structured port system, and efficient
hinterland connectivity offer wide competitive advantages for its commercial partners and port
users (SCT, 2008a).
The Mexican port system plays a fundamental role in the country’s economic growth, which links
it to the global markets, thus generating competitive advantages at the national, regional, and local
levels. The geographical location of Mexico gives it a significant advantage for the increment of its
port and commercial activities. According to the Secretariat of Communications and
2
Transportation1 (SCT), in 2030, Mexican seaports are expected to transport approximately 38%
of the country’s total merchandise, which has required improving the conditions of specialized
terminal infrastructures and the territorial expansion of certain ports located on the coasts of the
Pacific Ocean and the Gulf of Mexico in order to be able to perform high quality, efficient, and
effective services (SCT, 2008a).
Similarly, five of the 102 Mexican ports (i.e. ports of Manzanillo, Lázaro Cárdenas, Veracruz,
Altamira, and Ensenada) have stood out for their competitive capacity to handle different types of
cargo (i.e. dry bulk, liquid bulk, Ro-Ro, general cargo, and containers), nonetheless, due to the
globalized behavior of international trade and the high demand for containerized cargo, there has
been national and international competition between the different ports and terminals to capture
larger volumes of containers, and as a result to become world-leading and advanced ports (SCT,
2008a).
1.2 Problem Definition
Undoubtedly, Mexico’s geographical proximity and its commercial ties to the United States are
some of the competitive advantages of the Mexican seaports. In the case of the port of Manzanillo,
its strategic location on the Pacific coast has allowed it to occupy the number one place as the
leading port in container traffic coming mainly from Asia. The reality is that Manzanillo is a
fundamental piece in the country’s international trade, having the world-class infrastructure in its
specialized terminals, despite that, the key lies in the development of all the services that can be
used through it in order that the global trade can see Manzanillo as a competitive, functional,
efficient, and safe gateway. The Port Authority of Manzanillo2 is aware that for preeminent
competitiveness of the port, the level of productivity has to improve and the waiting times for
inspections and customs processes have to decrease, together with better integration between
the maritime transport, port operations, terminal infrastructure, hinterland connectivity, and the
multimodal transport system (SCT, 2008a).
Therefore, the value-added of this study is that not only the Port Authority of Manzanillo and the
Mexican government but also the port terminals together with the stakeholders will understand
that in order to maintain and increase the competitiveness of the port of Manzanillo, they must first
identify the current competitive position of the port within a specific market (i.e. container segment)
1 Secretaría de Comunicaciones y Transportes (SCT), a Federal Entity of the Government of Mexico. 2 Integral Port Administration of Manzanillo (Administración Portuaria Integral de Manzanillo, S.A. de C.V.).
3
and then determine strategies to achieve greater port competitiveness, through the intensification
of efforts for better integration of the port sector. The basis for the selection of the port of
Manzanillo is due to its natural vocation to be a dynamic and commercial port, a leader in the
traffic of container cargo on the Pacific Coast of Mexico, the vision of its port authority, its
competitive geographic location, and its strategic development plans for the coming years.
1.3 Aim of the Study
This multiple case study focuses on the comparative analysis of four of the main container ports
in the American continent located in the Pacific Rim. Having stated the above, the aim of this study
is to analyze the strategic competitive position of the port of Manzanillo within the containerized
cargo industry in comparison to its largest national competitor, the port of Lázaro Cárdenas, and
its two international competitors, the ports of Los Angeles and Long Beach, located in California,
US. Subsequently, the study is complemented with the identification of the main elements that
increase or decrease the competitiveness of the port of Manzanillo in the container industry and
port sector, by evaluating the four national determinants of competitive advantage proposed by
Michael E. Porter.
1.4 Research Questions
To achieve the objective of the study, it is necessary to carry out different levels of research, both
quantitative and qualitative. The first phase is to determine the competitive environment in which
the port of Manzanillo in Mexico operates. Secondly, the criteria underlying Manzanillo’s strategic
competitive position are analyzed in-depth, with solid arguments obtained from interviews with the
members of API Manzanillo, followed by a meticulous analysis of annual throughput statistics for
four categories of cargo traffic, i.e. containers, general cargo, dry bulk, and liquid bulk; of the four
seaports. Lastly, an evaluation of the elements that drive and affect the competitiveness of the
port of Manzanillo.
The contribution of this thesis aims to expand the existing knowledge base by combining different
analytical approaches and models to provide a comprehensive and valid answer to each research
question. Likewise, to provide recommendations for future competitive strategies for the port of
Manzanillo based on the reliable results obtained.
4
Hereby, the research question that raises in this thesis is: What competitive determinants
underly the competitive position of the port of Manzanillo in the container industry?
Additionally, to thoroughly investigate this question, the following sub-questions are defined to be
solved.
1) In terms of containerized cargo traffic, which are the main competitors of the port of
Manzanillo in the Pacific Rim?
2) What have been the strategies of the Port Authority and the terminal operators that have
prompted the port of Manzanillo to perform so well?
3) According to API Manzanillo, what type of port does Manzanillo want to become in the
coming years?
4) What is the strategic competitive position of the Port of Manzanillo in the traffic of
containers?
5) Does the port of Manzanillo have a strategy to diversify its cargo traffic portfolio? or Does
it specialize in handling only one type of cargo? If so, what type of cargo?
6) What are the competitive advantages of the port of Manzanillo that have allowed it to grow
its merchandise traffic volumes annually, especially containerized cargo?
7) What are the competitive advantages of Mexico in the global container industry?
1.5 Data Collection
Hox and Boeije (2005) state that to collect data, social scientists use different primary and
secondary data collection strategies. Nevertheless, it is essential to distinguish one from another,
the primary data is information that is collected for the specific research problem in hand, using
procedures that are better suited to the research problem. Every time primary data is collected,
new data is added to the existing store of social knowledge. As a consequence of this contribution,
more and more materials created by other investigations are made available for reuse by the
general research community, calling this secondary data (Hox and Boeije, 2005).
Using secondary data previously collected by other researchers, or for different purposes of the
current research, is typically data such as official statistics, administrative records, or other
accounts that organizations maintain updated continuously. Despite this, Hox and Boeije (2005)
mention that the use of secondary data can present some problems, such as locating reliable
sources of data, obtaining relevant data, and collecting data that meet the required quality (Hox
5
and Boeije, 2005). See Chapter 4, section 4.3 for more details about the issues and limitations
that the author faced during the collection of secondary data.
The three most common techniques of primary data collection are experiments and quasi-
experiments (strong causal inferences), surveys using structured questionnaires (a large number
of variables and large sample), and qualitative research design and interviews (a small sample)
(Hox and Boeije, 2005). For this study, the most relevant primary data collection strategy within
the qualitative research design was in-depth interviews, where a large amount of data was
collected from a fairly small sample, thereby, three interviews were conducted with members from
the port of Manzanillo community, i.e. employees of API Manzanillo:
• The General Director of API Manzanillo (position assumed in the period of 2013 – 2014):
Dr. Jesús Orozco Alfaro
• The Head of the Statistics department: Julieta Juárez Ochoa.
• The Executive Assistant of the Commercial department: Kevin Emmanuel Rubio Ceja.
The qualitative interview was used as the primary data collection technique for this study, the main
reason is due to the fact the interviewees had the floor to speak about their experiences, points of
view, and knowledge in relation to the port of Manzanillo. Rather than applying a rigidly
standardized instrument, the interview guides were used with a variety of topics and questions
that could be adjusted during the study. In this way, to proceed with the interviews, extensive
communication was previously carried out with the interviewees in order to explain the objectives
of the research and the information that the interviewer sought to obtain, noting that one of the
main purposes of the interviews was to identify national and international competitors of the port
of Manzanillo in the context of the container industry, since this information is critical for this
multiple case study, specifically, to achieve effective use of the selected methods, i.e. the Strategic
Positioning Analysis (SPA) and Porter’s diamond model. Subsequently, the interviews were
conducted using the Skype tool.
During the three interviews, valuable data were obtained, mainly information about the competitive
position of the port of Manzanillo vis-à-vis Mexican ports, the vision and mission of the Port
Authority, the elements of Mexico that have contributed to the growth of Manzanillo, the expected
growth in the traffic volume of containers, the logistics and hinterland connection problems that
the port presents, the modernization and expansion projects for the coming years, the strategies
of the Port Authority, the advantages and weaknesses of the port of Manzanillo, the port strategies
6
to diversify its cargo traffic portfolio, and a detailed explanation of those considered to be
competitors of the port of Manzanillo. As a result, the researcher was able to conclude that
Manzanillo’s main competitors in the context of the container industry are the ports of Lázaro
Cárdenas (Mexico), Los Angeles, and Long Beach (the US).
On the other hand, as the theory says, for correct preparation and planning strategies for the
collection of primary data, it is important to first collect secondary data, which allows to have a
clearer knowledge and to identify the information that is necessary to obtain from the interviewees.
(Hox and Boeije, 2005). Taking into account the above, the main sources of information used for
the collection of secondary data in this study were: (1) the eleven-year port statistics (2007 – 2019)
of the selected ports, since they are easy to retrieve, followed by this, (2) government records, i.e.
annual reports and master plans of the port of Manzanillo and its three competitors, which are
considered important and authentic sources of secondary data, and finally (3) the use of books,
journal articles, and scientific literature, traditional and reliable sources to collect data and prepare
an effective literature review.
This leads the author to conclude that the use of multiple methods or data sources in qualitative
research for the development of a comprehensive understanding of the phenomena is known as
“triangulation”. Triangulation is recognized as a qualitative research strategy to test validity through
the convergence of information from different sources (Carter et al., 2014). As described above,
the researcher used different sources to collect reliable primary and secondary data (i.e. data
triangulation), among the most important and necessary were interviews, port statistics, port
master plans, government records, journal articles, scientific literature, and books. The objective
of this data triangulation is to increase confidence in the research finding, confirming results
through the use of two or more independent sources of information. In other words, the
combination of findings from two or more rigorous approaches provides a complete picture of
results that any other approach could not achieve on its own (Heale and Forbes, 2013).
Thereby, in Chapter 4, section 4.2 of this study, the author presents a more in-depth description
of the uses that will be given to the primary and secondary data collected. Therefore, the data
necessary for the effective application of the SPA tool and Porter’s diamond model will be
explained.
7
1.6 Thesis Structure
Taking into consideration the above, the study has been structured in seven chapters; the content
of each one is described below:
Chapter 1 – Introduction to the study: This chapter presents the research background and the
identified problem derived from it. Followed by the aim of the study, the description of the research
question, and the sub-questions. The last section presents the different sources of data collection
and the selection of the competitors that will be used for the comparative analysis with the port of
Manzanillo.
Chapter 2 – Literature Review: Based on an extensive review of the available literature, this
chapter addresses in detail the definition of port competition along with its different levels.
Subsequently, the definition of port competitiveness and its relationship with the port competition
is described. The chapter ends with the discussion of certain theoretical frameworks commonly
used to analyze the competitive position of seaports and port competitiveness.
Chapter 3 – Methodology: The choice of the methodologies for this study are introduced in this
chapter. The SPA is the method chosen to analyze the competitive position of the port of
Manzanillo vis-à-vis its competitors within the containerized cargo industry, while Porter’s diamond
model will be used to identify the elements that drive or affect the competitiveness of the port of
Manzanillo and its competitors.
Chapter 4 – Multiple-Case Analysis: The chapter begins with the theoretical introduction of the
multiple case study, followed by the description of the primary and secondary data that have been
collected. Additionally, it will be explained certain issues that arose during the collection of
secondary data (i.e. port statistics). The chapter continues with the descriptive analysis of the
geographic, commercial, and relevant characteristics of the port of Manzanillo and its competitors,
namely the ports of Lázaro Cárdenas, Los Angeles, and Long Beach, all together with the
comparison of their annual container throughput. As a result, the competitive advantages of the
port of Manzanillo in the container segment will be identified.
Chapter 5 – Results and Interpretations: The results obtained from the implementation of the
SPA and Porter’s diamond model will be illustrated in this chapter. Followed by interpreting and
analyzing them, with the aim of identifying the competitive position and competitiveness of each
seaport in the range.
8
Chapter 6 – Discussion of the Results: As a complement to the previous chapter, this chapter
has the purpose of discussing in greater depth the competitive position and competitiveness of
the port of Manzanillo, this will allow the author to identify the competitive advantages and the
areas of opportunity that the port presents. Thus, the chapter will conclude by presenting
recommendations and strategies for API Manzanillo and the port users, in order to achieve greater
competitiveness for the port of Manzanillo in the container industry.
Chapter 7 – Conclusions: This chapter will present the final conclusions from the analysis and
discussion carried out previously. Similarly, based on the findings, the research questions and
sub-questions will be solved. The chapter concludes with the limitations of the research, along
with recommendations for future research.
9
2 Literature Review
2.1 Introduction
The aim of this chapter is to review the literature that forms the theoretical background of this
research. Thereby, based on the available literature, the definition of the port competition will be
present together with the different levels or types of competition. Subsequently, the definition of
port competitiveness and the analysis of its relationship with the port competition will be presented.
The chapter ends with a discussion of some of the frameworks commonly used to analyze the
port competition and competitiveness.
2.2 Defining Port Competition
Port competition is an important field of study of the transport economy. Throughout history,
seaports have allowed the exchange of large volumes of goods, causing the performance of ports
to have a direct effect on their competitiveness, as well as on job opportunities and investment
attraction (Meersman, Van de Voorde and Vanelslander, 2010). Hence, port authorities, terminal
operators, and related governments are the main parties interested in analyzing the competitive
position of their seaports (Mustafa, Khan, and Ahmed Farea, 2019).
Each seaport is different from the rest, the difference prevailing mainly in its roles, assets,
functions, and institutional organizations (Bichou and Gray, 2005). Based on the literature, it can
be found a variety of definitions for the port. For the purposes of this study, the definition of port
established by Notteboom (2001) will be used as a reference, in which it is established that a port
is a logistic and industrial center of an openly maritime nature, which plays an active role in the
global traffic system, characterized by spatial and functional clustering of activities that are directly
and indirectly involved in the transport of cargo and in the information processes (Notteboom and
Yim Yap, 2012).
Likewise, Notteboom et al. (2012) state that container ports serve as important nodes to facilitate
the efficient flow of containerized cargo. Container ports are distinguished from others by their
primary function, which is mainly to serve as a gateway port that acts as an interface between the
hinterland and deep-sea routings of containerized cargo, or differently, to serve as a transshipment
port that acts as an interface for the interchange between deep-sea routings of containerized
cargo. Moreover, the authors point out that productivity in cargo handling, excellent maritime, and
10
hinterland connections, and an efficient pace of expansion capacity are some of the aspects that
influence the attraction of containers to seaports (Notteboom and Yim Yap, 2012).
According to Goss (1990), the main economic function of a port is to benefit those whose trade
passes through them. This means that for proper operations, ports must count with three
fundamental elements: maritime access, good-handling capacity, and distributive capacity
(Meersman, Van de Voorde and Vanelslander, 2010). Thus, it can be implied that the port product
is a chain of interlinking functions, while the port as a whole is only one link in the overall complex
logistics chain (Suykens and Van de Voorde, 1998).
Without a doubt, seaports are essential to transport links in supply chain networks, nonetheless,
they are also fundamental elements for economic development and world shipping structure. It is
evident that evaluating the competition and competitiveness of the ports is necessary for better
performance and planning strategies (Kim, 2016). Despite this, to identify the competitive position
and competitiveness of ports, it is important first to understand their definitions with solid
foundations of scientific literature.
In the literature is widely recognized that there is not a single definition for port competition, in
accordance with Verhoeff (1981), Slack (1985), Van de Voorde and Winkelmas (2002), and
Notteboom and Yim Yap (2012) this is due to its complex and multifaceted nature. However,
Notteboom et al. (2012) argue that the nature and characteristics of the competition depend
directly on the type of port involved (e.g. gateway port, local port, transshipment port, container
port, etc.) and the type of cargo handled (e.g. containers, dry bulk, liquid bulk, Ro-Ro, etc.)
(Notteboom and Yim Yap, 2012).
Further, Verhoeff (1977) claims that the complex nature of port competition manifests itself
primarily in the number of levels that must be distinguished in relation to the competition.
Nevertheless, it is vital to understand that in practice it is not possible to separate the different
levels of competition as he has done in his analytical study. Consequently, competition at a certain
level also depends on those other levels. The second reason for this complexity is due to the fact
that a single port is not the same as another regarding its economic structure and its combination
of functions, as a result, each port performs differently. Last but not least, it arises from the
characteristics of the port services market, it is believed that a limited number of ports only serve
a certain partial market (Verhoeff, 1977).
11
By contrast, Heaver (1995) notes that terminals are the main aspect of a competitive strategy, not
ports. Regarding his argument, it can be said that port competition involves mainly competition for
trades, with terminals as competing physical units, transport concerns and industrial companies
as chain representatives of the respective trades, and port authorities as representatives of the
port sector committed to offering good working conditions (Notteboom and Yim Yap, 2012).
Although, certain scholars argue that port competition can be identified at different levels,
depending on certain economic factors and the competitive behaviors of port authorities, port
operators, port terminal operators, or the port as a whole. For the purposes of this research, the
author will describe below the most relevant levels of port competition found in the scientific
literature, in this way it will be possible to identify the levels of competition that the port of
Manzanillo presents vis-à-vis its competitors.
2.3 Levels of Port Competition
Indeed, Verhoeff (1981) was the first academic to study port competition in a structured way and
certainly, his contribution has influenced other scholars in the study of port competition. He divided
seaport competition into five geographic levels, including competition between seaports and other
terminals, competition among port ranges (ports located along the same coast), competition
between port clusters (a group of ports close to each other with common geographical
characteristics), competition among ports, and competition between private companies in a certain
port (Verhoeff, 1977).
Similarly, Verhoeff (1981) emphasizes that the determinants that influence competition would vary
from one level to another. In other words, the competition of individual companies within a port is
determined by factors of production, such as labor, capital, technology, and energy. Differently,
competition between ports, port clusters, and port ranges is affected by regional factors, such as
geographic location, infrastructure, degree of industrialization, government policy, port
performance, and costs generated by the transshipment, storage, and overland transport activities
(Meersman, Van de Voorde and Vanelslander, 2010).
Later, Slack (1985) attributed to the literature two dimensions to define port competition and
prevent market power, inter-port and intra-port competitive structures (Slack, 1985). On the
contrary, Van de Voorde and Winkelmans (2002) suggest that port competition should include
12
factors such as port traffic structures and port undertakings, port system, port authority expertise,
port innovation capability (technology), government intervention, etc.
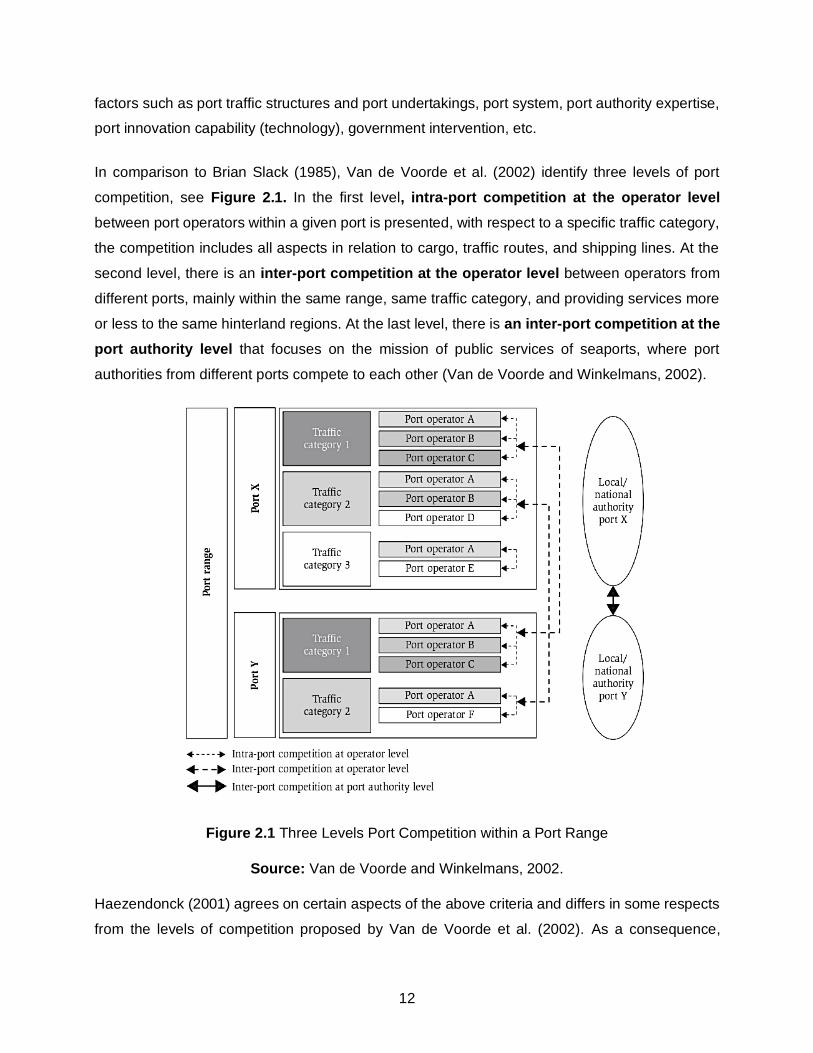
In comparison to Brian Slack (1985), Van de Voorde et al. (2002) identify three levels of port
competition, see Figure 2.1. In the first level, intra-port competition at the operator level
between port operators within a given port is presented, with respect to a specific traffic category,
the competition includes all aspects in relation to cargo, traffic routes, and shipping lines. At the
second level, there is an inter-port competition at the operator level between operators from
different ports, mainly within the same range, same traffic category, and providing services more
or less to the same hinterland regions. At the last level, there is an inter-port competition at the
port authority level that focuses on the mission of public services of seaports, where port
authorities from different ports compete to each other (Van de Voorde and Winkelmans, 2002).
Figure 2.1 Three Levels Port Competition within a Port Range
Source: Van de Voorde and Winkelmans, 2002.
Haezendonck (2001) agrees on certain aspects of the above criteria and differs in some respects
from the levels of competition proposed by Van de Voorde et al. (2002). As a consequence,
13
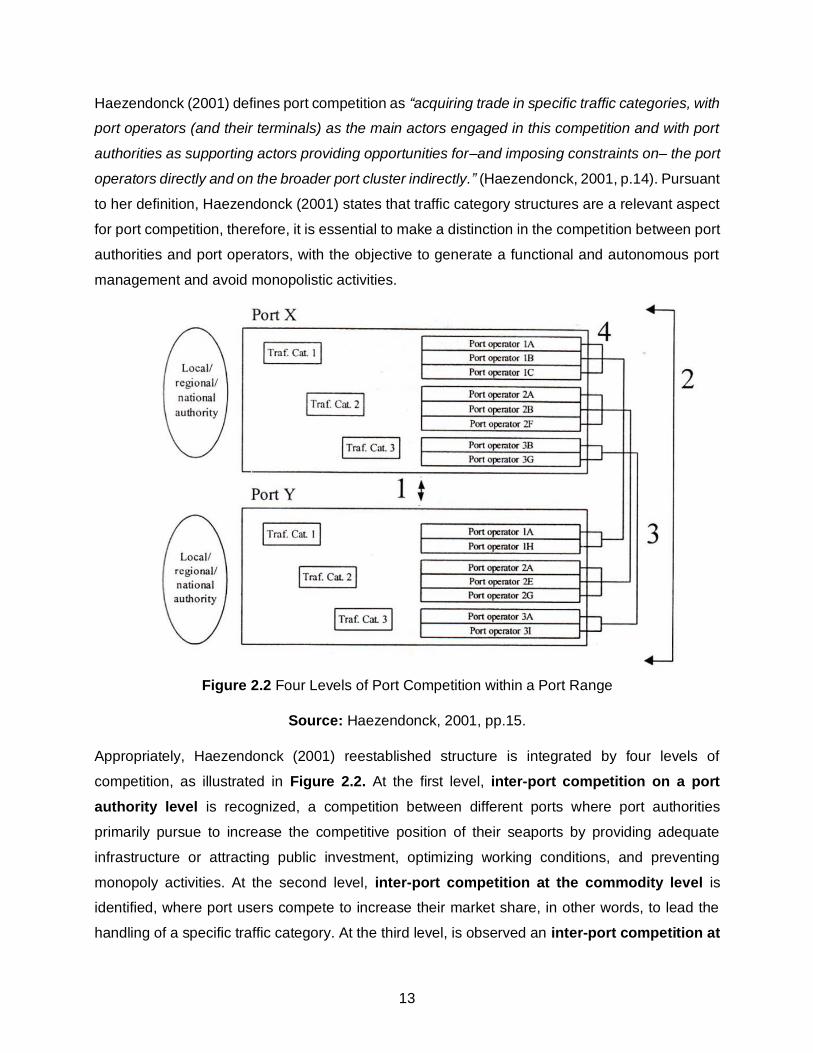
Haezendonck (2001) defines port competition as “acquiring trade in specific traffic categories, with
port operators (and their terminals) as the main actors engaged in this competition and with port
authorities as supporting actors providing opportunities for–and imposing constraints on– the port
operators directly and on the broader port cluster indirectly.” (Haezendonck, 2001, p.14). Pursuant
to her definition, Haezendonck (2001) states that traffic category structures are a relevant aspect
for port competition, therefore, it is essential to make a distinction in the competition between port
authorities and port operators, with the objective to generate a functional and autonomous port
management and avoid monopolistic activities.
Figure 2.2 Four Levels of Port Competition within a Port Range
Source: Haezendonck, 2001, pp.15.
Appropriately, Haezendonck (2001) reestablished structure is integrated by four levels of
competition, as illustrated in Figure 2.2. At the first level, inter-port competition on a port
authority level is recognized, a competition between different ports where port authorities
primarily pursue to increase the competitive position of their seaports by providing adequate
infrastructure or attracting public investment, optimizing working conditions, and preventing
monopoly activities. At the second level, inter-port competition at the commodity level is
identified, where port users compete to increase their market share, in other words, to lead the
handling of a specific traffic category. At the third level, is observed an inter-port competition at
14
the operator level, competition between operators of different ports, mainly within the same traffic
category. Last but not least, the fourth level consists of an intra-port cluster competition, a
competition that occurs between operators within a same port (Haezendonck, 2001, pp.6 – 38).
Distinctively, the World Bank (2000) mentions that two types of competition can be defined within
a port complex. First, an intra-port competition is found, in which two or more different terminal
operators within the same port compete for the same market. On the other hand, an intra-terminal
competition is perceived, where the companies that compete to provide the same services are
located within the same terminal (The World Bank, 2000). Chlomoudis and Pallis (1998) notice
that these two types of competition are part of a definition of an inclusive intra-port competition
among similar and/or complementary cargo traffic, which provides port services in the same port
complex (De Langen and Pallis, 2006).
Understanding the meaning and importance of port competition together with its different levels
that a port as a whole can present is a fundamental part of this study. The literary review presented
above, allowed the author to have more solid foundations to determine if the port of Manzanillo
presents internal competition (i.e. between container terminals) or if it faces external competition,
i.e. between port authorities or container terminals from other ports.
In addition to the different levels of competition that can occur within a specific industry, Notteboom
et al. (2012) express that the competitive position of a port is determined by its competitive offer
to the host of shippers and shipping lines for specific trade routes, geographic regions, and other
ports to which it is connected (Notteboom and Yim Yap, 2012). Despite, in the broadest dimension,
Haezendonck and Notteboom (2002) observe that the competitiveness of a port is determined by
the range of competitive advantages that the port acquires or creates over time.
2.4 Defining Port Competitiveness
Notteboom et al. (2012) mention that a seaport (e.g. a container port) has global competitiveness
if the port as a unit enjoys proximity to the main production and consumption centers (trade routes),
has excellent maritime and hinterland access (market connectivity), can reduce port costs by
increasing productivity, is able to persuade carriers and shippers regarding their cargo routes
(value-added to commercial activities), is capable to expand their capacity on time to satisfy
demand and has enough space for future expansions of territory, it allows users to compete
effectively with other modes of transport, it is qualified to face the challenges posed by the new
15
logistics business environment, it is able to capitalize on complementary and reinforcement of the
port cluster, the private sector has a greater participation in terminal operations, is perceived as a
key driver of the local economy, and it has a long tradition of supporting the port community
(Notteboom and Yim Yap, 2012).
Altogether, the factors observed by Notteboom et al. (2012) demonstrate the complexity to
establish a single definition of port competitiveness. When diverse port industry and community
users are integrated, the analysis of competitiveness becomes even more complex. Therefore,
the meaning, perception, interpretation, measurement, and implication of these competitiveness
determinants will surely be different for each of the port’s stakeholders. Notwithstanding, it is also
believed that the competitive offer depends not only on the terminal operators but also on the
performance of the entire port community (Notteboom and Yim Yap, 2012).
Port competitiveness has been also a field of study for various academics. When reviewing the
literature, it can be stated that port competitiveness is made up of determinants that have led to
competition between ports and competitive advantages. This means that competitiveness is the
aspect that influences shipping lines and shippers in the selection of a specific port, all under the
fulfillment of various competitive functions (Kim, 2016). Additionally, Kim (2016) argues that
competitiveness can be recognized as an indicator that identifies the opportunities and threats of
seaports. Given the above, it can be argued that competition requires competitiveness, which
means that in conditions where there is competition in the market (i.e. containerized cargo
industry), ports have to be competitive vis-à-vis their rivals. Thereby, stakeholders should ask
themselves which port is competitive towards which port and what are the elements that
distinguish it, this means, what are its competitive advantages (Jolić, Štrk, and Lešić, 2007).
2.5 The Relationship between Port Competition and Competitiveness
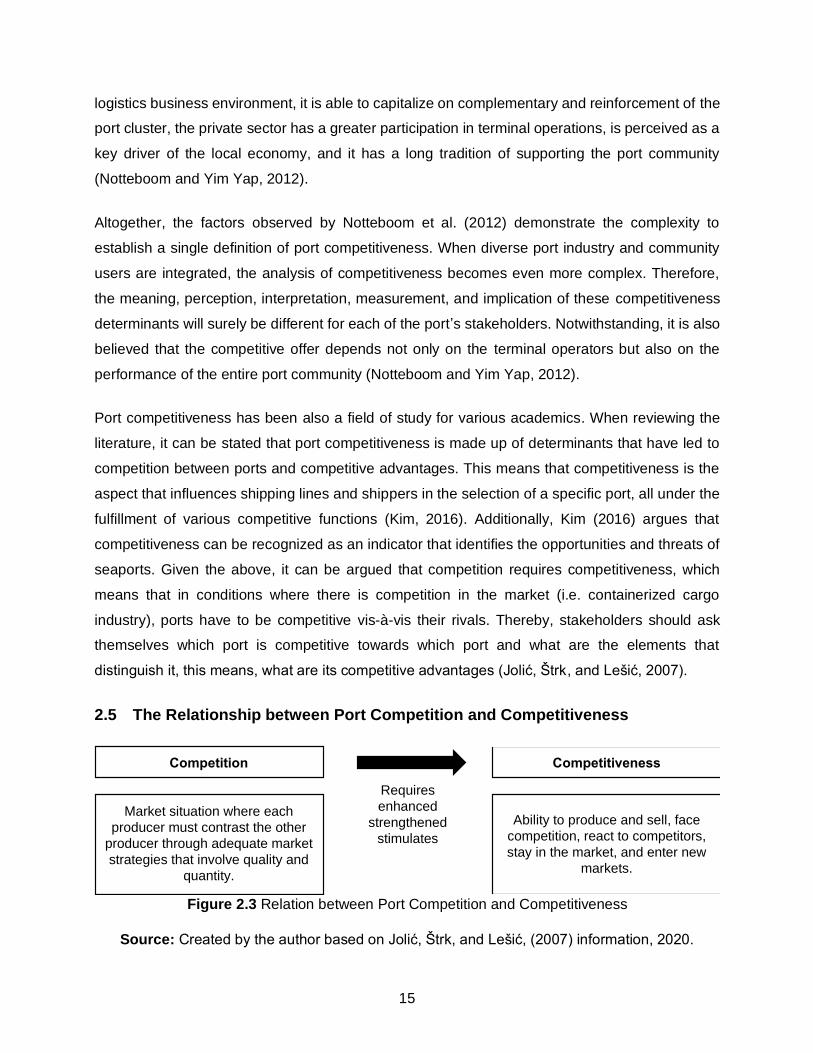
Figure 2.3 Relation between Port Competition and Competitiveness
Source: Created by the author based on Jolić, Štrk, and Lešić, (2007) information, 2020.
Competition Competitiveness
Market situation where each
producer must contrast the other
producer through adequate market
strategies that involve quality and
quantity.
Ability to produce and sell, face
competition, react to competitors,
stay in the market, and enter new
markets.
Requires
enhanced
strengthened
stimulates
16
Figure 2.3 provides a broader view of the relationship between the literary terms of port
competition and competitiveness, which are directly linked to improving and strengthening the
quality of port services and the position of the ports in the market where they operate (Jolić, Štrk
and Lešić, 2007). Following the same logic, Fleisher and Bensoussan (2007) define the
competitive position of an organization compared to its competitors in the same market or industry.
They argue that competitive positions allow companies to design tactical strategies to maintain or
improve their current positions or possibly withdraw from the current market. Thence, knowledge
of the competitive position of an organization vis-à-vis its rivals is essential. Day (1984) claims that
rivals are defined as organizations that can obstruct a company’s market objectives and
performance.
Regards seaports, the intense competition between them is believed to have been caused by the
trade globalization and the accelerated growth of the international economy, which has forced
ports to restructure their operations and management to increase their competitiveness and
market share (Dang and Yeo, 2017). Pardali and Michalopoulos (2008) identify that determining
the position of ports today is a crucial issue for the port industry worldwide, especially in container
ports, since container traffic has become a highly competitive market.
Panayides (2003) points out that design strategies to increase competitive advantages and
improve port performance are fundamental techniques for seaports. While, Basta and Morchio
(2008) argue that successful strategies should address the improvement of the entire set of port,
transport and logistics services, for an efficient and complete port function. Moreover, Van de
Voorde et al. (2002) mention that the competitiveness of a port may also be affected by the
participation of some interested parties.
However, Haezendonck, Verbeke and Coeck (2006) affirm that when planning strategies to
achieve higher competitiveness, those responsible, such as port authorities, port operators, and
port users, must first understand and analyze their strategic positioning and the dynamics of
international competition in seaports. For this reason, the following section aims to present in
general terms some of the frameworks that support the analysis of the competitive position and
competitiveness that seaports present nowadays. This next section is a fundamental part of the
study since after the analysis of different frameworks it will be possible to determine which are the
most effective methods that should be used in this multiple case study.
17
2.6 Overview of the Theoretical Frameworks
As mentioned before, the port sector is characterized by its great complexity due to the variety of
actors and decision-makers involved, i.e. carriers, shipping lines, port operators, port authorities,
among others. The complexity to study all the aspects justifies the multiple uses of frameworks for
an effective analysis of competitive position and port competitiveness. However, as Basta et al.
(2008) say, the choice of the methods to implement depends strongly on the objective of the
analysis and the broadness of the research field, i.e. analysis of individual ports or terminals (Basta
and Morchio, 2008).
Typically, the techniques use to analyze the competitive position of the ports and the determinants
of competitiveness are classified into quantitative and qualitative. According to Notteboom et al.
(2012), quantitative methods focus on measurable and comparable variables of port competition
in selected samples of ports and container terminals. Therefore, these techniques consider
operational, financial, and production indicators of the port’s performance that are directly related
to the efficiency of the use of resources, the productivity achieved by the assets used, and the
participation of the traffic handled. While, qualitative tools are potentially used to determine
competitiveness in an objective way, so the factors are generally covered by analyzes that are
descriptive in nature (Notteboom and Yim Yap, 2012). Hence, a general and systematic
description of different quantitative and qualitative frameworks will be present below.
2.6.1 Frameworks for Analyzing Port Competition
Market Share Analysis (MSA) is a framework used to study the competitive position of maritime
ports. In accordance to Michalopoulos, Pardalis, and Stathopoulou (2007), the model analyzes
the competitive positions of the selected ports on the basis of their determining market shares
(e.g. container traffic). Nevertheless, it is considered to be a fairly simple technique, since the
results will only indicate the degree of competition equivalent to its participation in the studied
market, for which some academics argue that it does not take into account basic competitive
factors (Michalopoulos, Pardalis, and Stathopoulou, 2007).
On the other hand, the Strategic Positioning Analysis (SPA), an analytical approach
implemented by Haezendonck, Verbeke, and Coeck (2006), stands out as a more complete and
complex analysis tool, which is integrated by three different methodologies to evaluate strategic
positioning of a port with reference to a range of selected ports. In other words, the SPA is a
18
comparative analysis that describes the performance of ports and traffic categories within ports in
terms of market share, growth rate, diversification, and added value (Haezendonck, Verbeke and
Coeck, 2006).
The main advantage of the SPA is the easy data collection and the reliability and certainty of the
information used since it does not require confidential information (e.g. financial or marketing
data), but mainly traffic flows of each respective port to study. In addition, this technique allows
the graphical representation of the results from the different methodologies, which grants the
researcher to conduct analyzes and accurate conclusions regarding the current position of the
port range. Nonetheless, it is important to remark that before carrying out this tool, the researcher
must have a correct and careful selection of the ports to be included, the traffic flow groups to be
studied, and the observation period to be used (Haezendonck, Verbeke and Coeck, 2006).
Similarly, the three methodologies that integrated the SPA are the Product Portfolio Analysis
(PPA), based on the analysis of market shares and their growth, the Shift-Share Analysis (SSA),
which simulates the effects that an acquisition, specialization, increase, or shrinkage of a certain
traffic cargo category would have on a port’s performance, and the Product Diversification Analysis
(PDA), which evaluates port traffic diversification and efficiency levels (Basta and Morchio, 2008).
A more comprehensive explanation of the three methodologies will be provided in Chapter 3,
section 3.2.
Meanwhile, Benchmarking Analysis (BA) is another popular and flexible framework for
determining the competitive position and competitiveness of the port, as both qualitative and
quantitative variables of a group of ports can be analyzed. In other words, BA is an adopted
method to benchmark competitors within the port industry, while its attractiveness is the
combination of both variables. Pardali and Michalopoulos3 (2008) suggested and applied a model
for the positioning of the port business in a competitive market based on the use of the
benchmarking technique. Three main attributes were identified during the conduction of this
framework, (1) the port business can estimate its competitiveness using the Port Competitiveness
Degree (PCD), (2) the results provided are an indirect method of estimating the port’s
performance, and (3) the model can be used as a strategic tool to identify the operational
3 The case study of the port of Piraeus in the Mediterranean port market.
19
weaknesses that must be faced in order to achieve the best relative performance vis-à-vis
competitors (Pardali and Michalopoulos, 2008).
The main advantage of the BA is that it can include a flexible number of variables, both qualitative
and quantitative, at the analyst’s discretion. As a result, it is possible to capture some of the
complexity that affects port and terminal operations and performance. For a better model
application, Pardali et al. (2008) determine two categories of variables, the features (FE) and the
quality criteria (QC), where each category has several subcategories such as, demand (D), supply
(S), labor (L), others (O), information systems (IS), application to ships (AS), application to cargo
(AC), and miscellaneous (MS). Given the above, this framework is highly applicable and easily
understandable, making it attractive to port authorities, port terminals, and other port users (Pardali
and Michalopoulos, 2008).
The performance of the ports analyzed is evaluated through the positioning process that includes
calculations such as benchmarking scores for each variable of features and quality criteria of each
port in the market, benchmarking scores of the average port in the market for each variable of
features and quality criteria, calculations of the best score of the ports in the market for each
variable of features and quality criteria, and the PCD (Pardali and Michalopoulos, 2008).
Therefore, the results obtained will determine the Leader-Port in the market using the criterion of
the maximum number of best scores and the PCD, it will also identify the differences between the
determined port and the average port in the market, as well as the differences with the leading
port of the market (Pardali and Michalopoulos, 2008).
2.6.2 Frameworks for Analyzing of Port Competitiveness
PESTEL is an acronym for six factors of change: Political, Economic, Social, Technological,
Environmental, and Legal. PESTEL analysis is a widely used tool to identify the macro-
environmental (i.e. external) factors faced by an organization and to understand its strategic risks.
Hence, it identifies the changes and effects of the external macroeconomic environment on the
competitive position of a company (Sammut‐Bonnici and Galea, 2015). In other words, the
PESTEL framework seeks to understand external factors and evaluate how business models (i.e.
container seaports) should evolve in order to adapt to their competitive environment. Similarly, the
academics affirm that the impacts of external factors are mitigated through strategies and the use
of new opportunities obtained as a result of the new competitive positions that may be generated
in the process (Sammut‐Bonnici and Galea, 2015).
20
Differently, for a national or regional analysis of port competitiveness, some scholars propose a
classic and influential framework, Porter’s diamond model (1990), a method that helps to
understand the environment and competitive advantages of a particular industry in a specific
country or region, due to certain available factors. Economic theory mentions that the comparative
advantage factors for countries or regions are land, location, natural resources, labor, and
population size (Deng, Yeo and Du, 2018). Porter’s diamond framework consists of four national
determinants of competitive advantages, i.e. factor conditions, demand conditions, related and
supporting industries, and firm strategy, structure and rivalry, where these factors interact with
each other to form the conditions where innovation and competitiveness occur (Bakan and Doğan,
2012). A more comprehensive explanation of the Porter’s diamond model will be provided in
Chapter 3, section 3.3.
Nonetheless, during the conduction of other studies, certain academics expanded the diamond
model with certain modifications. For example, Rugman and D’Cruz (1993) proposed to implement
the Double diamond model, an extension of Porter’s original framework, where both national
and foreign diamonds were considered, using this tool as a key to the analysis of port
competitiveness. Whereas Rugman and Verbeke (1993) suggest expanding Porter’s framework
to incorporate the modern theory of the multinational enterprise in a variant of SWOT analysis to
operationalize Porter’s diamond (Rugman and Verbeke, 1993).
Last but not least, SWOT Analysis is a strategic planning framework used to help organizations
to identify their Strengths, Weaknesses, Opportunities, and Threats related to competition in the
industry where they operate. In the context of the port sector, Ircha (2001) is one of the academics
who identified the SWOT analysis as an appropriate method for the competitive analysis of ports,
where it is possible to identify qualitative variables, such as external opportunities and threats and
internal strengths and weaknesses of the ports. The study carried out by Ircha (2001) provides a
complete understanding of the effects caused by internal and external changes in a port, as a
result, it is possible to define the elements or factors that positively or negatively affect the
competitiveness of the port, allowing the planning of new strategies and action plans (Ircha, 2001).
2.6.3 Remarks on the Theoretical Frameworks
It is important to note that the combined implementation of two types of analysis, i.e. quantitative
and qualitative, is of complementary interest. Given the circumstances that when measuring and
analyzing port competition, the researcher only obtains an overview of the current situation of the
21
analyzed port (i.e. the competitive position of the port vis-à-vis its competitors), while the analysis
of port competitiveness allows understanding the reason for the situation previously identified. In
other words, the analysis of port competitiveness will give the researcher much more information
about the strategic position and allow the development of strategies if necessary. Therefore, the
combination of both frameworks is a complementary function that allows a more complete study.
2.7 Conclusions of the Chapter
It can be concluded that each seaport is different from the rest, differentiating itself by its roles,
assets, functions, and institutional organizations (Bichou and Gray, 2005). However, Notteboom
et al. (2012) point out that container ports are distinguished to serve as a gateway port that acts
as an interface between the hinterland and deep-sea routings of containerized cargo, or as a
transshipment port that acts as an interface for the interchange between deep-sea routings of
containerized cargo. Considering those characteristics, Verhoeff (1981) analyze port competition
in a structured way, determining five geographic levels of competition. Van de Voorde et al. (2002)
identify three levels of port competition. In spite of this, Haezendonck (2001) agrees and disagrees
with previous studies, proposing a new structure composed of four levels of competition,
For the purposes of this study, the author will use as a reference the levels of port competition
proposed by Haezendonck (2001), in order to carry out a better analysis of this multiple case
study. On the other hand, as Haezendonck and Notteboom (2002) establish, the competitiveness
of a port is determined by the range of competitive advantages that the port acquires or creates
over time. Taking into account the above, it is concluded that competition requires
competitiveness, which means that under conditions of competition in the market, ports must be
competitive against their rivals.
In other words, port competitiveness is the ability of a port or specialized terminals to produce and
sell, to face internal and external competition, to react to the strategies of competitors, to compete
successfully in a specific market or industry, and even the power to enter new markets (Basta and
Morchio, 2008). Therefore, competition is the situation or position of the market (i.e. container
industry) where each producer (i.e. seaports) has to face their rivals through appropriate strategies
(i.e. quality, prices, safety, efficiency, etc.) , while competitiveness is the condition of the port
(Basta and Morchio, 2008). In summary, as Basta and Morchio (2008) mention, to face port
competition, a port has to be competitive.

22
Last but not least, Haezendonck et al. (2006) state that when planning competitive strategies, port
stakeholders must first understand and analyze their strategic positioning and the dynamics of
international competition in seaports. Therefore, the complexity to study all the aspects justifies
the multiple uses of frameworks for a correct analysis of competitive position and port
competitiveness. Without forgetting that the choice of the method to implement depends strongly
on the objective of the analysis and the broadness of the research field (Basta and Morchio, 2008).
Thereby, the following chapter will describe in more detail the methodologies chosen for this
multiple case study (i.e. the SPA method and Porter’s diamond model), together with an
explanation of the data necessary for the proper functioning of the models.
23
3 Methodology
3.1 Introduction
This chapter will present the methodologies chosen to carry out in this multiple case study in order
to properly solve the research question and sub-questions. It is important to note that some of the
sub-questions were answered during the interviews with the three API members (i.e. primary
data), while the rest of the sub-questions were answered based on the findings obtained when
applying the SPA technique and Porter’s diamond model. In other words, some sub-questions will
be answered through the interviews, while others through the quantitative and qualitative models,
confirming the answers through the information collected from the interviews.
Based on the scientific literature review, a detailed description of the methods to be implemented
will be presented, followed by the explanation of the procedures necessary for the correct use of
these analytical tools, together with the exposition of the primary and secondary data that will be
used. Hereby, the theoretical framework chosen to analyze the competitive position of the port of
Manzanillo vis-à-vis its competitors in the context of the container industry will be described in-
depth (i.e. the SPA). The chapter will end with the presentation of the qualitative model to be used
to identify the competitive advantages (i.e. competitiveness) of the port of Manzanillo in
comparison to its competitors (i.e. Porter’s diamond model).
3.2 Strategic Positioning Analysis (SPA)
As explained in Chapter 2, the SPA4 is a complete analysis technique, which is integrated by
three different methodologies in order to quantitatively describe the performance and evolution of
individual ports and traffic categories in terms of growth rate, market share, diversification, and
value added. Similarly, the SPA considers the position of the port with respect to the value added
originated by the different traffic categories (Haezendonck, Verbeke and Coeck, 2006).
Haezendonck, et al. (2006) used the SPA method, along with the growing participation matrix,
originally introduced in 1968 by the Boston Consulting Group (BCG), in order to analyze the
positioning of the nine most important seaports in the Hamburg – Le Havre range. Given that the
SPA is integrated by three interrelated analytical analyzes, the Product Portfolio Analysis (PPA),
4 Several authors have used this tool for the analysis of port competitiveness, among the most prominent can be noted: Haezendonck, Verbeke, Coeck (2006) and Winkelmans, Meersman, Van de Voorde, Van Hooydonk, Verbeke, Huybrecht (2002).
24
the Shift Distribution Analysis (SSA), and the Product Diversification Analysis (PDA), the results
obtained allow us to determine the competitive position of a port as compared to the other ports
in the port range considered (Haezendonck, Verbeke and Coeck, 2006).
For this study, the full implementation of the SPA tool will be carried out, with the purpose of
analyzing the competitive strategic position of the port of Manzanillo vis-à-vis its containerized
cargo competitors, i.e. the port of Lázaro Cárdenas located in Mexico, Los Angeles and Long
Beach, both located in California, US. Similarly, the traffic flow data concerns the actual throughput
of four different commodity categories (i.e. containers, general cargo, dry bulk, and liquid bulk) of
the selected ports during the 2007 – 2019 observation period. In this way, the data concerning
cargo traffic will be measured in metric tons.
3.2.1 Product Portfolio Analysis (PPA)
The PPA is in principle a model that can be applied to the port sector, which is based on the
“growth-shared matrix” originally developed by the BCG, in the field of strategic business planning.
The BCG matrix allows studying the performance and position of the business units, based on two
fundamental variables, (1) market share and (2) growth index. Moreover, its function is to
determine the current position of a specific business unit (e.g. seaport or traffic category) vis-à-vis
rivals (e.g. port competitors or traffic categories within ports) and its potential to increase their
market share (Haezendonck, Verbeke and Coeck, 2006).
Haezendonck et al. (2006) argue that the basic concepts of the BCG matrix can be easily
translated in terms of seaports. Hence, the Strategic Business Units (SBUs) of the BCG matrix
when applied in the port sector can come up as the different categories of traffic under
consideration (e.g. liquid bulk, dry bulk, containers, Ro-Ro, or general cargo), as a result, they will
be considered as “Strategic Traffic Units” (STUs). It is significant to note that the traffic flow for
each port is described in terms of relative market share and traffic growth (Haezendonck, Verbeke
and Coeck, 2006).
As illustrated in Figure 3.1, the BCG matrix is divided into four market positions, depending on
the position of the seaport, while the arrows indicate the “normal” evolution of the traffic flows of a
seaport. Under a conventional commercial context, “Question Marks” are those units with a high
growth rate and low market share, which have potential and require investments to increase their
market share. The “Stars” are characterized by a high market share and high growth rates, where
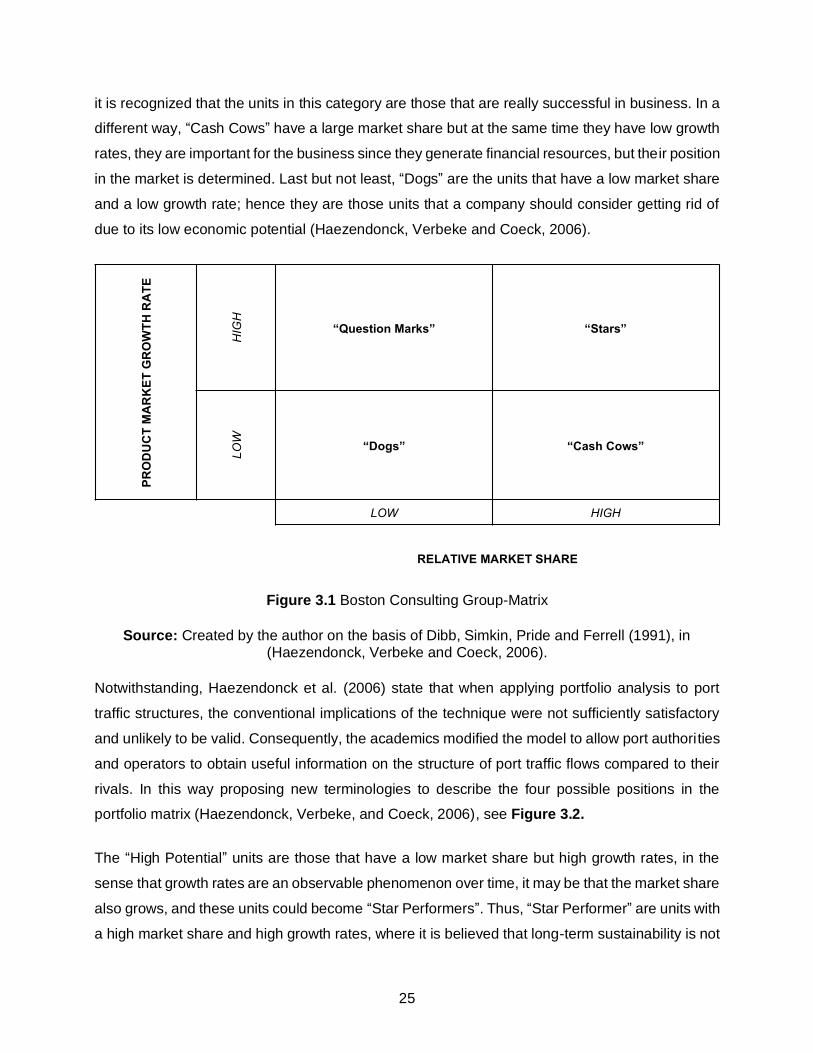
25
it is recognized that the units in this category are those that are really successful in business. In a
different way, “Cash Cows” have a large market share but at the same time they have low growth
rates, they are important for the business since they generate financial resources, but their position
in the market is determined. Last but not least, “Dogs” are the units that have a low market share
and a low growth rate; hence they are those units that a company should consider getting rid of
due to its low economic potential (Haezendonck, Verbeke and Coeck, 2006).
Figure 3.1 Boston Consulting Group-Matrix
Source: Created by the author on the basis of Dibb, Simkin, Pride and Ferrell (1991), in (Haezendonck, Verbeke and Coeck, 2006).
Notwithstanding, Haezendonck et al. (2006) state that when applying portfolio analysis to port
traffic structures, the conventional implications of the technique were not sufficiently satisfactory
and unlikely to be valid. Consequently, the academics modified the model to allow port authorities
and operators to obtain useful information on the structure of port traffic flows compared to their
rivals. In this way proposing new terminologies to describe the four possible positions in the
portfolio matrix (Haezendonck, Verbeke, and Coeck, 2006), see Figure 3.2.
The “High Potential” units are those that have a low market share but high growth rates, in the
sense that growth rates are an observable phenomenon over time, it may be that the market share
also grows, and these units could become “Star Performers”. Thus, “Star Performer” are units with
a high market share and high growth rates, where it is believed that long-term sustainability is not
PR
OD
UC
T M
AR
KE
T G
RO
WT
H R
AT
E
HIGH
“Question Marks” “Stars”
LOW
“Dogs” “Cash Cows”
LOW HIGH
RELATIVE MARKET SHARE

26
guaranteed in this position. While, “Mature Leaders” are those units that have a high market share
but a low growth rate. Lastly, the units of “Minor Performer” are those with low market share and
low growth rates, their functionality is not as good as the rest (Haezendonck, Verbeke and Coeck,
2006). Regarding the empirical analysis of this study, the competitive position of the traffic
categories for each container port will be analyzed based on this new proposed BCG matrix, see
Chapter 5.
Figure 3.2 BCG Matrix adapted for the Port Industry
Source: Created by the author based on Haezendonck, Verbeke and Coeck (2006) information, 2020.
Likewise, the portfolio analysis approach applied to the traffic structure of ports in a particular
range is made up of four “levels”, where instead of representing a hierarchy between STUs, they
are complementary and provide additional information (Haezendonck, Verbeke and Coeck, 2006).
Based on the four “levels”, a dynamic analysis is obtained in different periods of time, which allows
more specific conclusions to be drawn about the changes in the competitive position over time.
3.2.1.1 PPA Level 1
At the first level, the PPA compares the global market shares and total growth rates of the selected
ports. In other words, classifies the ports according to their overall traffic evolution within the
observation period. In this study, the portfolio is constituted by the port range determined
previously, i.e. the ports of Manzanillo, Lázaro Cárdenas, Los Angeles, and Long Beach. Similarly,
PR
OD
UC
T M
AR
KE
T G
RO
WT
H R
AT
E
HIGH
“High Potential” “Star Performer”
LOW
“Minor Performer” “Mature Leader”
LOW HIGH
RELATIVE MARKET SHARE
27
in line with the original construction of the BCG matrix, the horizontal axis shows the market shares
and the vertical axis shows the growth rate. Thus, the vertical line represents the average market
share of the port range, while the horizontal line represents the average growth rate recorded by
the port range (Haezendonck, Verbeke and Coeck, 2006).
3.2.1.2 PPA Level 2
At the second level, the PPA analyzes the traffic structure of each individual seaport in the range.
Unlike the first level, this one describes the share and growth rate of each category of traffic in the
port’s total traffic. For the purposes of the study, four categories of traffic were determined for each
port, i.e. containers, general cargo, dry bulk, and liquid bulk. As a result, the four categories of
traffic will be positioned in the matrix according to their average growth rate in the traffic structure,
as well as their share of the total traffic structure. This level allows the author to identify which
categories are stronger or weaker for each port (Haezendonck, Verbeke and Coeck, 2006).
3.2.1.3 PPA Level 3
At the third level, each commodity group in the range considers itself as a “portfolio of ports”, this
means, as a total volume of traffic that can be decomposed between all ports. Therefore, it is
necessary to choose one of the categories, for the general purpose of the study, the container
category is the one that will be analyzed at this level. As a result, with respect to the container
category, the ports of Manzanillo, Lázaro Cárdenas, Los Angeles and Long Beach will be ranked
according to their market share in the range and their growth rate in that category (Haezendonck,
Verbeke and Coeck, 2006).
3.2.1.4 PPA Level 4
The fourth level differs from the third level, in the sense that the X-axis represents the share of a
specific category within a port, rather than the share of this category in the range of ports. In the
context of the study, this level will show the structure of containerized cargo compared to the rest
of the port’s total traffic categories, adding a dimension of the container traffic category. Because
this level introduces an additional dimension to the portfolio analysis, the graphic representation
of the ports is illustrated with circular shapes, whose surface is proportional to the absolute volume
of traffic of the port considered in the total range (Haezendonck, Verbeke and Coeck, 2006).
28
The advantage of this level is that for each seaport in the range the position (of the containerized
cargo in the merchandise structure of a single port), the size (of the containerized cargo in relation
to the size of the same merchandise in the other ports in the range), and the growth rate (of
containerized cargo for the port in question) can be visualized simultaneously. From an analytical
point of view, the fourth level is the most relevant, however, the combination of the four levels
provides an eclectic set of perspectives on the competitive position of each seaport in the range
(Haezendonck, Verbeke and Coeck, 2006).
The results and interpretations of the PPA are presented in Chapter 5, section 5.2.2.
3.2.2 Shift-Share Analysis (SSA)
The SSA5 is recognized for its advantages and complementation to the PPA since it allows an
unbundling of the general evolution (growth or decrease) of the traffic volume of a port into various
components, i.e. the SSA enables to decompose the growth or decrease of a flow of traffic, in
three relevant elements: share-effect, commodity-shift, and competitiveness-shift (Haezendonck,
Verbeke and Coeck, 2006).
A negative result indicates an unfavorable position, while a positive figure reflects good
performance. The higher the positive number, the better the situation can be considered. In spite
of that, the results of an SSA can be influenced by the choice of ports, the relevant traffic
categories, the base year, and the observation period. On the other hand, the share-effect
indicates the estimated hypothetical growth of traffic in a port, assuming a constant market share.
This implies that the share-effect describes the change in the volume of traffic that would have
occurred in a case where all types of commodities had evolved in the same way. The difference
between the registered actual growth and the calculated share-effect reflects an increase or
decrease in the actual participation registered in the market and is represented by the shift-effect.
This effect indicates that a port has not evolved as expected based on the share-effect and is
divided into a commodity-shift and a competitiveness-shift (Haezendonck, Verbeke and Coeck,
2006).
In a particular traffic structure, the commodity-shift represents the degree of specialization of a
port in the best performing traffic categories. As a consequence, this effect considers the impact
5 De Lombaerde and Verbeke (1989) were pioneers in the application of the SSA technique in international port competition, analyzing the composition and evolution of port traffic flows.
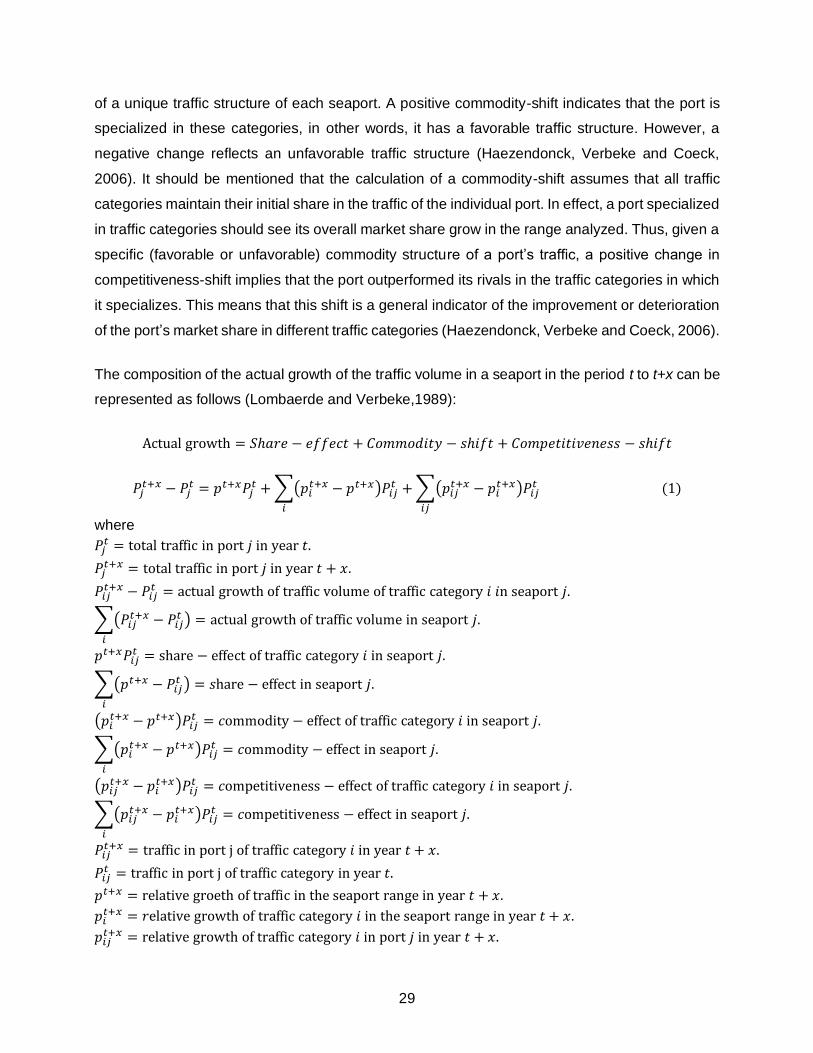
29
of a unique traffic structure of each seaport. A positive commodity-shift indicates that the port is
specialized in these categories, in other words, it has a favorable traffic structure. However, a
negative change reflects an unfavorable traffic structure (Haezendonck, Verbeke and Coeck,
2006). It should be mentioned that the calculation of a commodity-shift assumes that all traffic
categories maintain their initial share in the traffic of the individual port. In effect, a port specialized
in traffic categories should see its overall market share grow in the range analyzed. Thus, given a
specific (favorable or unfavorable) commodity structure of a port’s traffic, a positive change in
competitiveness-shift implies that the port outperformed its rivals in the traffic categories in which
it specializes. This means that this shift is a general indicator of the improvement or deterioration
of the port’s market share in different traffic categories (Haezendonck, Verbeke and Coeck, 2006).
The composition of the actual growth of the traffic volume in a seaport in the period t to t+x can be
represented as follows (Lombaerde and Verbeke,1989):
Actual growth = 𝑆ℎ𝑎𝑟𝑒 − 𝑒𝑓𝑓𝑒𝑐𝑡 + 𝐶𝑜𝑚𝑚𝑜𝑑𝑖𝑡𝑦 − 𝑠ℎ𝑖𝑓𝑡 + 𝐶𝑜𝑚𝑝𝑒𝑡𝑖𝑡𝑖𝑣𝑒𝑛𝑒𝑠𝑠 − 𝑠ℎ𝑖𝑓𝑡
𝑃𝑗𝑡+𝑥 − 𝑃𝑗
𝑡 = 𝑝𝑡+𝑥𝑃𝑗𝑡 + ∑(𝑝𝑖
𝑡+𝑥 − 𝑝𝑡+𝑥)𝑃𝑖𝑗𝑡 + ∑(𝑝𝑖𝑗
𝑡+𝑥 − 𝑝𝑖𝑡+𝑥)𝑃𝑖𝑗
𝑡
𝑖𝑗𝑖
(1)
where
𝑃𝑗𝑡 = total traffic in port 𝑗 in year 𝑡.
𝑃𝑗𝑡+𝑥 = total traffic in port 𝑗 in year 𝑡 + 𝑥.
𝑃𝑖𝑗𝑡+𝑥 − 𝑃𝑖𝑗
𝑡 = actual growth of traffic volume of traffic category 𝑖 𝑖n seaport 𝑗.
∑(𝑃𝑖𝑗𝑡+𝑥 − 𝑃𝑖𝑗
𝑡 ) = actual growth of traffic volume in seaport 𝑗.
𝑖
𝑝𝑡+𝑥𝑃𝑖𝑗𝑡 = share − effect of traffic category 𝑖 in seaport 𝑗.
∑(𝑝𝑡+𝑥 − 𝑃𝑖𝑗𝑡 ) = 𝑠hare − effect in seaport 𝑗.
𝑖
(𝑝𝑖𝑡+𝑥 − 𝑝𝑡+𝑥)𝑃𝑖𝑗
𝑡 = 𝑐ommodity − effect of traffic category 𝑖 in seaport 𝑗.
∑(𝑝𝑖𝑡+𝑥 − 𝑝𝑡+𝑥)𝑃𝑖𝑗
𝑡 = 𝑐ommodity − effect in seaport 𝑗.
𝑖
(𝑝𝑖𝑗𝑡+𝑥 − 𝑝𝑖
𝑡+𝑥)𝑃𝑖𝑗𝑡 = 𝑐ompetitiveness − effect of traffic category 𝑖 in seaport 𝑗.
∑(𝑝𝑖𝑗𝑡+𝑥 − 𝑝𝑖
𝑡+𝑥)𝑃𝑖𝑗𝑡
𝑖
= 𝑐ompetitiveness − effect in seaport 𝑗.
𝑃𝑖𝑗𝑡+𝑥 = traffic in port j of traffic category 𝑖 in year 𝑡 + 𝑥.
𝑃𝑖𝑗𝑡 = traffic in port j of traffic category in year 𝑡.
𝑝𝑡+𝑥 = relative groeth of traffic in the seaport range in year 𝑡 + 𝑥.
𝑝𝑖𝑡+𝑥 = 𝑟elative growth of traffic category 𝑖 in the seaport range in year 𝑡 + 𝑥.
𝑝𝑖𝑗𝑡+𝑥 = relative growth of traffic category 𝑖 in port 𝑗 in year 𝑡 + 𝑥.
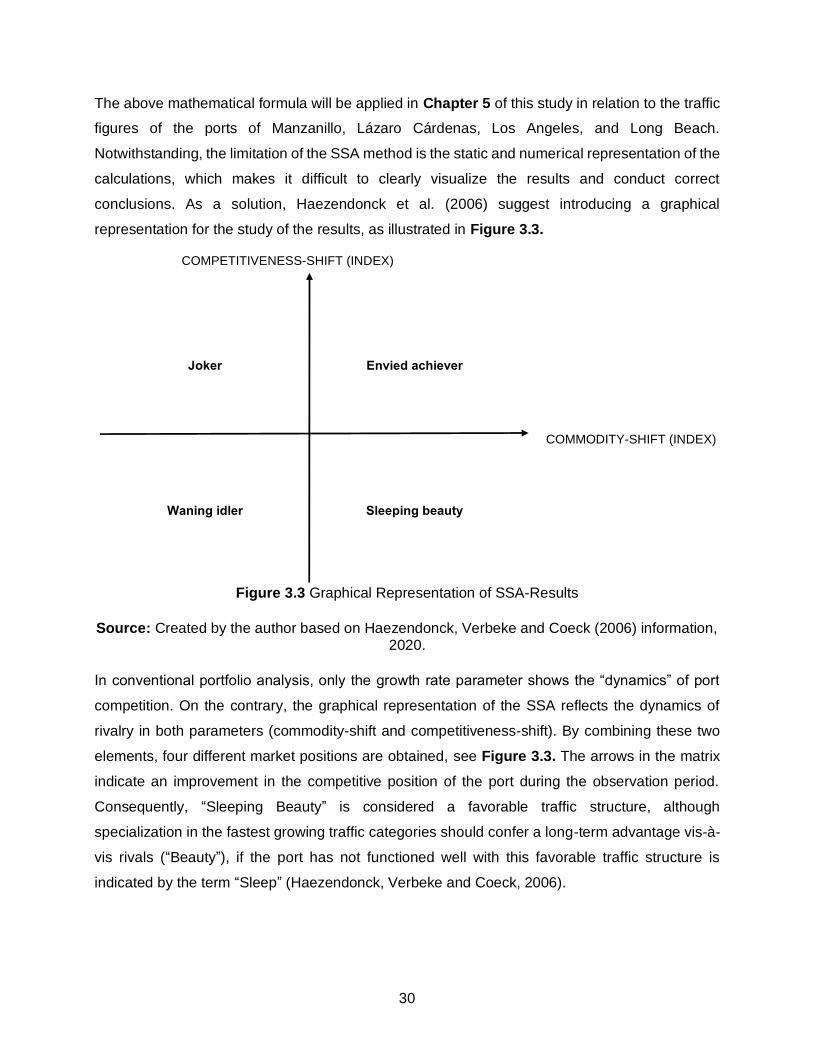
30
The above mathematical formula will be applied in Chapter 5 of this study in relation to the traffic
figures of the ports of Manzanillo, Lázaro Cárdenas, Los Angeles, and Long Beach.
Notwithstanding, the limitation of the SSA method is the static and numerical representation of the
calculations, which makes it difficult to clearly visualize the results and conduct correct
conclusions. As a solution, Haezendonck et al. (2006) suggest introducing a graphical
representation for the study of the results, as illustrated in Figure 3.3.
Figure 3.3 Graphical Representation of SSA-Results
Source: Created by the author based on Haezendonck, Verbeke and Coeck (2006) information, 2020.
In conventional portfolio analysis, only the growth rate parameter shows the “dynamics” of port
competition. On the contrary, the graphical representation of the SSA reflects the dynamics of
rivalry in both parameters (commodity-shift and competitiveness-shift). By combining these two
elements, four different market positions are obtained, see Figure 3.3. The arrows in the matrix
indicate an improvement in the competitive position of the port during the observation period.
Consequently, “Sleeping Beauty” is considered a favorable traffic structure, although
specialization in the fastest growing traffic categories should confer a long-term advantage vis-à-
vis rivals (“Beauty”), if the port has not functioned well with this favorable traffic structure is
indicated by the term “Sleep” (Haezendonck, Verbeke and Coeck, 2006).
Joker Envied achiever
Waning idler Sleeping beauty
COMPETITIVENESS-SHIFT (INDEX)
COMMODITY-SHIFT (INDEX)
31
Despite that, if the port improves its market position in these niches with rapid range growth, its
position will become an “Envied Achiever”, indicating that “envied” by its rivals due to its attractive
mix of initial traffic, and an “achiever” due to its effective leverage from this starting position. In
contrast, “Jokers” are ports characterized by an improvement in the competitive position, but they
face an unfavorable traffic structure, so the sustainability of a good market position is ambiguous
unless the port manages to become the “Mature Leader” in declining traffic categories. Ports
placed on the quadrant “Waning Idler” indicate that they have unfavorable competitive
performance along with unfavorable traffic structure. These ports should be viewed as declining
unless corrective action is taken (Haezendonck, Verbeke and Coeck, 2006).
Finally, an additional dimension (share-effect) can be added to the representation. A three-
dimensional representation where the total SSA-effect of the seaports is shown graphically during
a sequence of time periods considered relevant. The consideration of different time periods is
relevant since it can be concluded that the relative position of the ports in terms of shift-effects will
evolve over time (Haezendonck, Verbeke and Coeck, 2006). The results and analysis of the SSA
are presented in Chapter 5, section 5.2.3.
3.2.3 Product Diversification Analysis (PDA)
PDA is the last analytical approach that complements the SPA, it consists mainly of analyzing the
diversification of port traffic during a specific period (De Lombaerde and Verbeke, 1989). The
traffic diversification index determines the relative importance of the different traffic categories in
the total traffic volume of the seaport and assesses the composition of this traffic. For a better
analysis, it is necessary to apply the Herfindahl-Hirschman Index (HHI), used mainly to establish
the level of diversification of a seaport and to identify the relative importance of the different traffic
categories within the total traffic structure of each seaport (Haezendonck, Verbeke and Coeck,
2006). According to De Lombaerde et al. (1989), the algebraic expression of the diversification
index is represented as follows:
𝐷𝑗 =∑ 𝑃𝑖𝑗
2𝑛𝑖=1
[∑ 𝑃𝑖𝑗𝑛𝑖=1 ]
2 ≤ 1 (2)
where
𝐷𝑗 = diversification − index for port 𝑗.
𝑃𝑖𝑗 = traffic volume 𝑖 of port 𝑗.
32
The degree of concentration of the different traffic categories within the analyzed port is
represented by the index. This means, if the index reaches a value of 1, that the total traffic
structure of the modelling port is dominated by a specific traffic category. Differently, an equal
division of the total traffic volume over the studied categories would result in the lowest possible
diversification-index of 1 over n, with n representing the number of traffic categories under
consideration. In other words, a high diversification-index reflects a high degree of inequality,
indicating that the port is specialized in a niche, while a lower diversification-index reflects a
balance in volume between traffic categories (Haezendonck, Verbeke and Coeck, 2006). The
results and analysis of the PDA are presented in Chapter 5, section 5.2.4.
3.2.4 A “Weighted” and “Unweighted” Analysis
For a correct use of the SPA model, the “unweighted” and “weighted” values of the traffic structures
must be taken into account. According to Haezendonck et al. (2000), the rationale for a “weighted”
analysis is the existence of differences in value-added between traffic categories. To calculate
“weighted” traffic figures, it is necessary to apply a “weighting” coefficient. Determining a
differential value added created by various categories of traffic allows obtaining information on the
success of the seaport in attracting cargo that generates high value-added, such as container
traffic. Similarly, a “weighted” analysis provides positioning of the ports, taking into account their
performance in terms of “intrinsic cargo handling tons”. The “weighting” of the traffic data allows
us to focus on the well-being created in terms of contribution to the gross product of a city, region,
or nation, and together with links in terms of employment, production, and government income
(Verbeke and Debisschop, 1996)
Haezendonck et al. (2000) argue that conventional rules for “weighing” traffic categories such as
the “Bremen Rule” and the “Rotterdam Rule” lack transparency and have limited validity.
Therefore, the authors developed a “Range Rule”6 that allows appropriate use of the value-added
concept in comparative traffic studies that include all ports in Europe. Since the rule reflects the
differences in the value added between the different categories of traffic in European ports, in this
multiple case study it is not possible to apply the same rule, considering this to be one of the main
limitations. Consequently, the full implementation of the SPA together with the results to be
6 The “Range Rule” reflects that the value of 1 ton of conventional cargo equals that of approximately 1 ton of ro-ro, 3 tons of containers, 5 tons of dry bulk, and 12 tons of liquid bulk (Haezendonck, Verbeke and Coeck, 2006).
33
obtained will only be represented in the “unweighted” values of the four predetermined traffic
categories (i.e. annual port statistics represent in metric tons).
3.3 Comments on the Chosen Methodologies
The implementation of the SPA tool for the study of the port of Manzanillo vis-à-vis its port
competitors in the container segment will allow the author to obtain a conceptual understanding
of the dynamics of international port competition, based on the information available. Therefore,
applying the three methods together (i.e., PPA, SSA, and PDA) will indicate the overall strategic
position of the port range in conjunction with the range of traffic categories (i.e. Manzanillo’s
competitive position in the container traffic). Likewise, it will allow the formulation of hypotheses
and planning strategies for the effective development of the port.
On the other hand, the author identified the SPA as the ideal model to carry out this multiple case
study, due to the easy secondary data collection required. This means that the data to be used
concern the total traffic of four categories of traffic (i.e. containers, general cargo, dry bulk, and
liquid bulk) within the observation period of eleven years (2007 – 2019). It is worth mentioning that
for reasons of information limitation of certain ports, the total traffic will not be divided into exports
and imports but will only analyze the total metric tons per year. Following this, the SPA model
allows the graphical representation of the results, resulting in a more complete analysis of the
competitive position of Manzanillo and the rest of the ports. The results of SPA are illustrated in
Chapter 5, section 5.2.
After a comparative analysis of the results regards the market share structures, growth rate, and
portfolio diversification of the ports of Manzanillo, Lázaro Cárdenas, Los Angeles, and Long Beach
within the container industry, it is essential to identify the elements that affect or benefit the
competitiveness of the port of Manzanillo. To carry out this qualitative analysis, the author chose
to apply Porter’s diamond model in two levels, in the first instance, the model will be executed at
the national level to analyze the competitiveness of the two Mexican ports, i.e. the port of
Manzanillo (Colima) and the port of Lázaro Cárdenas (Michoacán), followed by the application at
a regional level, to identify the competitive elements of California, and determine the competitive
advantages of the ports of Los Angeles and Long Beach.
The performance of Porter’s diamond model at two different levels will allow the researcher to
have a broader vision and understanding of the factors that increase or decrease the
34
competitiveness of the port of Manzanillo compared to its container port competitors. Thus,
allowing recommendations on what should be done to increase Manzanillo ’s international
competitiveness in the container industry. In other words, in order for Manzanillo to be recognized
as the leading container handling port in the American continent, it is essential to determine the
current strategic position, identify elements of competitiveness, and plan strategies to increase
the competitiveness and competitive position of the port.
3.4 Porter’s Diamond Model
Michael E. Porter (1990) introduced in his book “Competitive Advantage of Nations”, a model that
examines why some states are more competitive and why some industries within states are more
competitive than others (Bakan and Doğan, 2012). Porter (1990) mentions that productivity is the
main factor for international competitiveness and that the standard of living of a country ’s
population can be improved as a direct result of an increase in this factor. The productivity consists
of increasing workers’ skills, developing technologies, producing quality products, and reducing
costs. At the national level, productivity can increase when the industries in a particular country
are “upgrade” to improve efficiency (Porter, 1998, p.5 – 7).
To establish theoretical foundations about the competitive advantages of an industry in a particular
country, Porter (1990) developed the diamond model, which consists of four national determinants
of competitive advantage in a particular industry: factor conditions, demand conditions, related
and supporting industries, and firm’s strategy, structure, and rivalry. In theory, Porter (1998)
establishes that these four sources of competitive advantage can produce fertile soil to build an
internationally competitive industry in a country. However, certain industries, in a particular
country, present strong diamonds, while other weaker diamonds. In addition to these four
determinants, two other indirect variables were added to the model; the chance and the
government (Porter, 1998, p.122 – 130), see Figure 3.4.
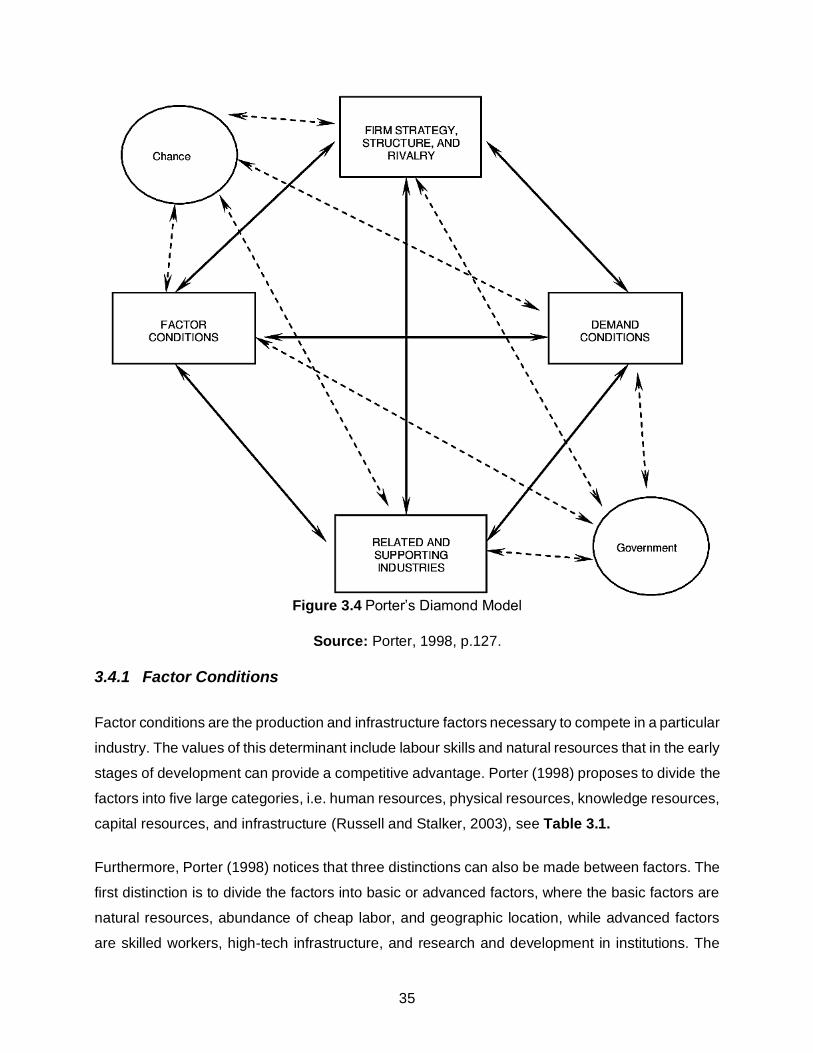
35
Figure 3.4 Porter’s Diamond Model
Source: Porter, 1998, p.127.
3.4.1 Factor Conditions
Factor conditions are the production and infrastructure factors necessary to compete in a particular
industry. The values of this determinant include labour skills and natural resources that in the early
stages of development can provide a competitive advantage. Porter (1998) proposes to divide the
factors into five large categories, i.e. human resources, physical resources, knowledge resources,
capital resources, and infrastructure (Russell and Stalker, 2003), see Table 3.1.
Furthermore, Porter (1998) notices that three distinctions can also be made between factors. The
first distinction is to divide the factors into basic or advanced factors, where the basic factors are
natural resources, abundance of cheap labor, and geographic location, while advanced factors
are skilled workers, high-tech infrastructure, and research and development in institutions. The
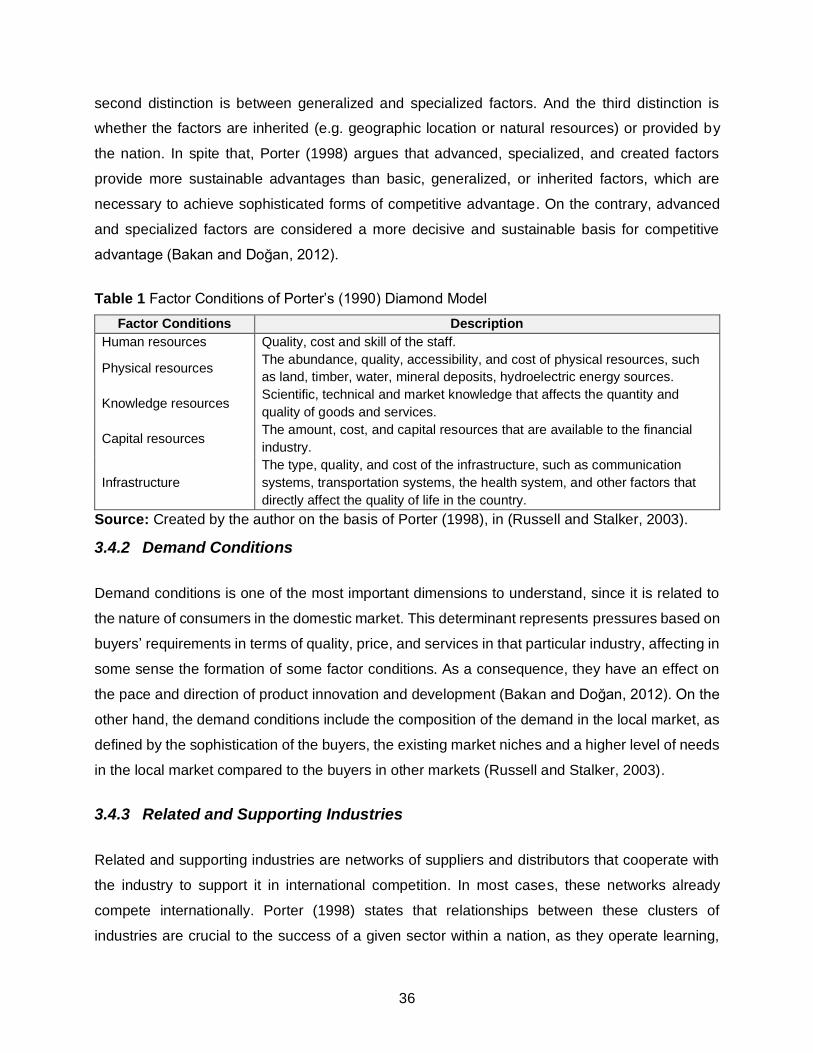
36
second distinction is between generalized and specialized factors. And the third distinction is
whether the factors are inherited (e.g. geographic location or natural resources) or provided by
the nation. In spite that, Porter (1998) argues that advanced, specialized, and created factors
provide more sustainable advantages than basic, generalized, or inherited factors, which are
necessary to achieve sophisticated forms of competitive advantage. On the contrary, advanced
and specialized factors are considered a more decisive and sustainable basis for competitive
advantage (Bakan and Doğan, 2012).
Table 1 Factor Conditions of Porter’s (1990) Diamond Model
Factor Conditions Description
Human resources Quality, cost and skill of the staff.
Physical resources The abundance, quality, accessibility, and cost of physical resources, such
as land, timber, water, mineral deposits, hydroelectric energy sources.
Knowledge resources Scientific, technical and market knowledge that affects the quantity and
quality of goods and services.
Capital resources The amount, cost, and capital resources that are available to the financial
industry.
Infrastructure
The type, quality, and cost of the infrastructure, such as communication
systems, transportation systems, the health system, and other factors that
directly affect the quality of life in the country.
Source: Created by the author on the basis of Porter (1998), in (Russell and Stalker, 2003).
3.4.2 Demand Conditions
Demand conditions is one of the most important dimensions to understand, since it is related to
the nature of consumers in the domestic market. This determinant represents pressures based on
buyers’ requirements in terms of quality, price, and services in that particular industry, affecting in
some sense the formation of some factor conditions. As a consequence, they have an effect on
the pace and direction of product innovation and development (Bakan and Doğan, 2012). On the
other hand, the demand conditions include the composition of the demand in the local market, as
defined by the sophistication of the buyers, the existing market niches and a higher level of needs
in the local market compared to the buyers in other markets (Russell and Stalker, 2003).
3.4.3 Related and Supporting Industries
Related and supporting industries are networks of suppliers and distributors that cooperate with
the industry to support it in international competition. In most cases, these networks already
compete internationally. Porter (1998) states that relationships between these clusters of
industries are crucial to the success of a given sector within a nation, as they operate learning,
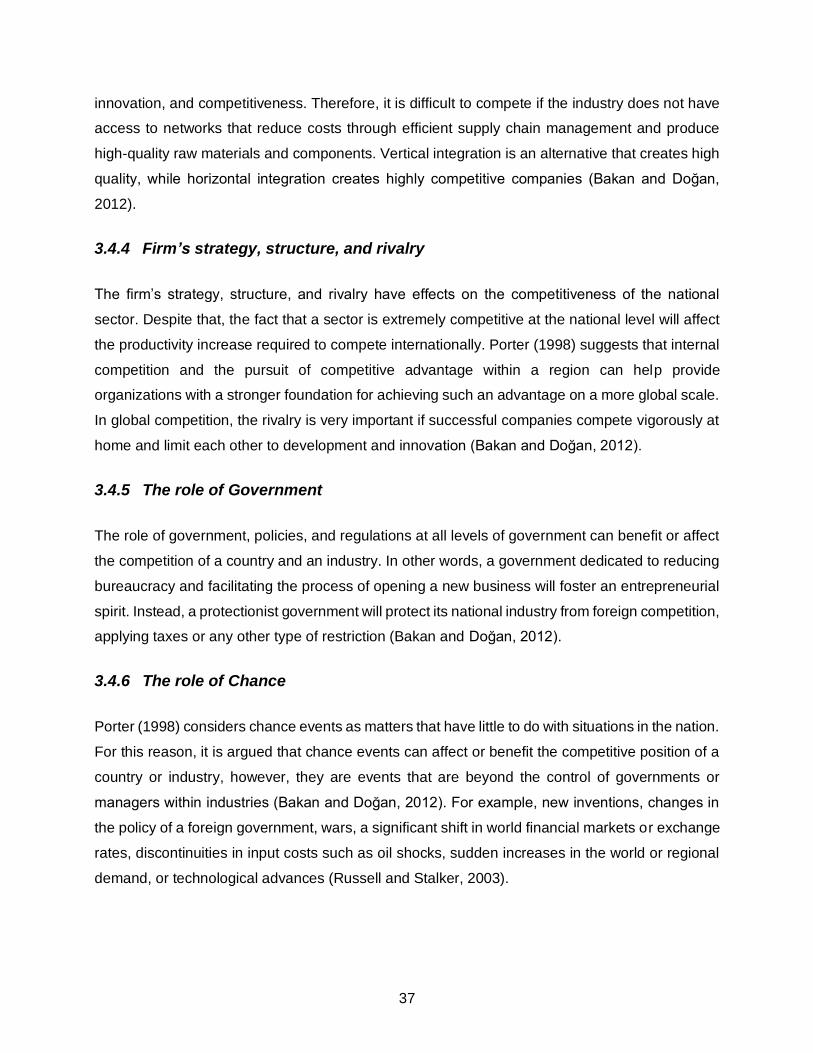
37
innovation, and competitiveness. Therefore, it is difficult to compete if the industry does not have
access to networks that reduce costs through efficient supply chain management and produce
high-quality raw materials and components. Vertical integration is an alternative that creates high
quality, while horizontal integration creates highly competitive companies (Bakan and Doğan,
2012).
3.4.4 Firm’s strategy, structure, and rivalry
The firm’s strategy, structure, and rivalry have effects on the competitiveness of the national
sector. Despite that, the fact that a sector is extremely competitive at the national level will affect
the productivity increase required to compete internationally. Porter (1998) suggests that internal
competition and the pursuit of competitive advantage within a region can help provide
organizations with a stronger foundation for achieving such an advantage on a more global scale.
In global competition, the rivalry is very important if successful companies compete vigorously at
home and limit each other to development and innovation (Bakan and Doğan, 2012).
3.4.5 The role of Government
The role of government, policies, and regulations at all levels of government can benefit or affect
the competition of a country and an industry. In other words, a government dedicated to reducing
bureaucracy and facilitating the process of opening a new business will foster an entrepreneurial
spirit. Instead, a protectionist government will protect its national industry from foreign competition,
applying taxes or any other type of restriction (Bakan and Doğan, 2012).
3.4.6 The role of Chance
Porter (1998) considers chance events as matters that have little to do with situations in the nation.
For this reason, it is argued that chance events can affect or benefit the competitive position of a
country or industry, however, they are events that are beyond the control of governments or
managers within industries (Bakan and Doğan, 2012). For example, new inventions, changes in
the policy of a foreign government, wars, a significant shift in world financial markets or exchange
rates, discontinuities in input costs such as oil shocks, sudden increases in the world or regional
demand, or technological advances (Russell and Stalker, 2003).
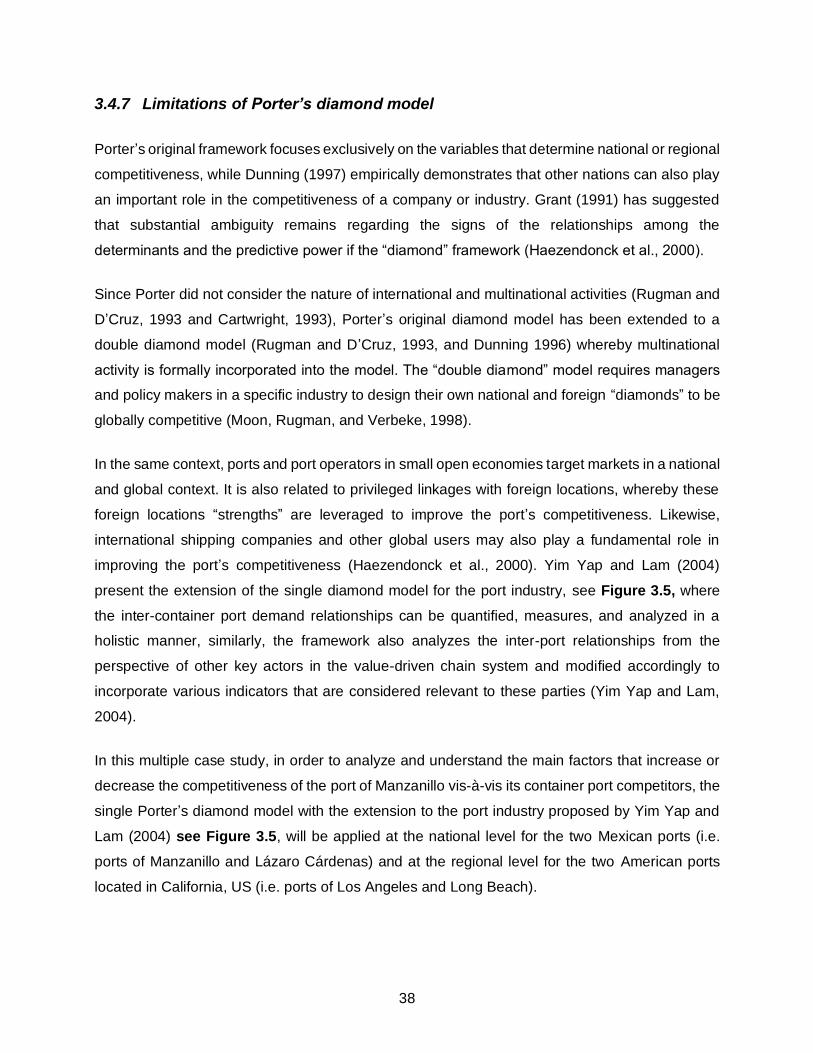
38
3.4.7 Limitations of Porter’s diamond model
Porter’s original framework focuses exclusively on the variables that determine national or regional
competitiveness, while Dunning (1997) empirically demonstrates that other nations can also play
an important role in the competitiveness of a company or industry. Grant (1991) has suggested
that substantial ambiguity remains regarding the signs of the relationships among the
determinants and the predictive power if the “diamond” framework (Haezendonck et al., 2000).
Since Porter did not consider the nature of international and multinational activities (Rugman and
D’Cruz, 1993 and Cartwright, 1993), Porter’s original diamond model has been extended to a
double diamond model (Rugman and D’Cruz, 1993, and Dunning 1996) whereby multinational
activity is formally incorporated into the model. The “double diamond” model requires managers
and policy makers in a specific industry to design their own national and foreign “diamonds” to be
globally competitive (Moon, Rugman, and Verbeke, 1998).
In the same context, ports and port operators in small open economies target markets in a national
and global context. It is also related to privileged linkages with foreign locations, whereby these
foreign locations “strengths” are leveraged to improve the port’s competitiveness. Likewise,
international shipping companies and other global users may also play a fundamental role in
improving the port’s competitiveness (Haezendonck et al., 2000). Yim Yap and Lam (2004)
present the extension of the single diamond model for the port industry, see Figure 3.5, where
the inter-container port demand relationships can be quantified, measures, and analyzed in a
holistic manner, similarly, the framework also analyzes the inter-port relationships from the
perspective of other key actors in the value-driven chain system and modified accordingly to
incorporate various indicators that are considered relevant to these parties (Yim Yap and Lam,
2004).
In this multiple case study, in order to analyze and understand the main factors that increase or
decrease the competitiveness of the port of Manzanillo vis-à-vis its container port competitors, the
single Porter’s diamond model with the extension to the port industry proposed by Yim Yap and
Lam (2004) see Figure 3.5, will be applied at the national level for the two Mexican ports (i.e.
ports of Manzanillo and Lázaro Cárdenas) and at the regional level for the two American ports
located in California, US (i.e. ports of Los Angeles and Long Beach).
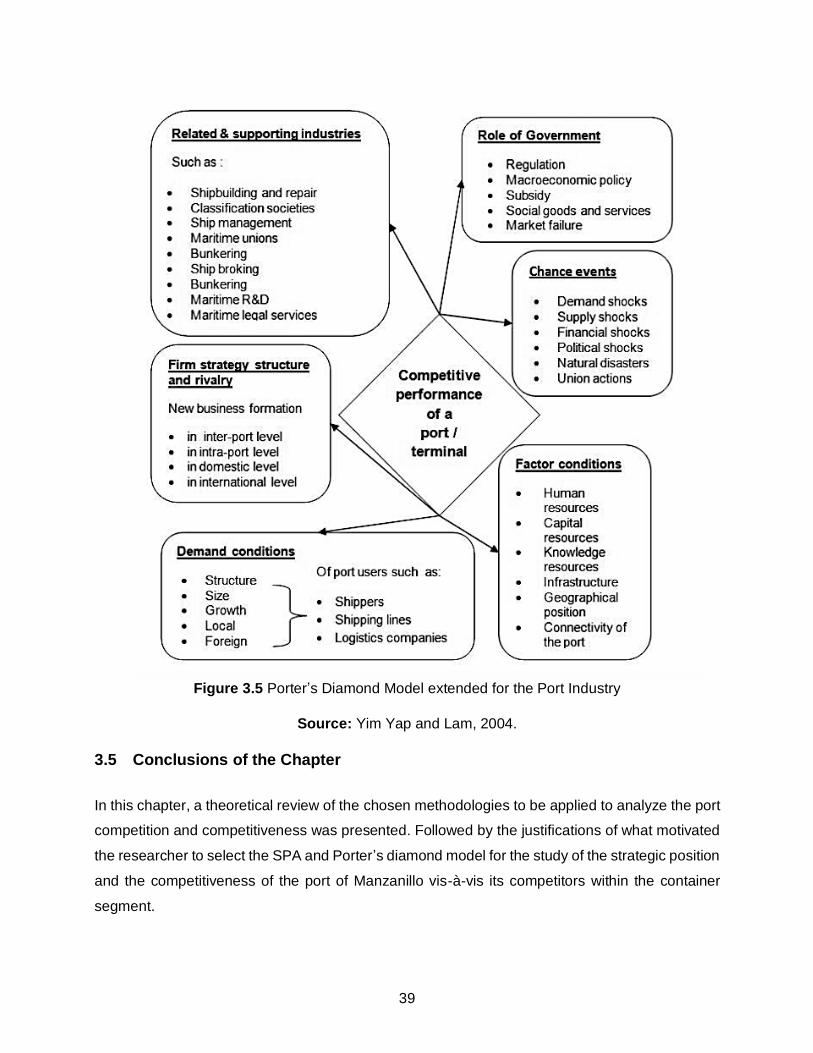
39
Figure 3.5 Porter’s Diamond Model extended for the Port Industry
Source: Yim Yap and Lam, 2004.
3.5 Conclusions of the Chapter
In this chapter, a theoretical review of the chosen methodologies to be applied to analyze the port
competition and competitiveness was presented. Followed by the justifications of what motivated
the researcher to select the SPA and Porter’s diamond model for the study of the strategic position
and the competitiveness of the port of Manzanillo vis-à-vis its competitors within the container
segment.
40
The next chapter is considered one of the most important and interesting of this thesis since it
presents the primary and secondary sources of data collection necessary for the effective
application of the SPA technique and Porter’s diamond model, as well as the description of certain
problems faced during data collection.
Additionally, a deep description of the multiple cases to be studied will be presented, exposing
relevant information about the ports of Manzanillo, Lázaro Cárdenas, Los Angeles, and Long
Beach, along with an analysis of their commercial growth in the eleven-year period of observation.
Likewise, the most relevant geographical and commercial characteristics of the four container
ports will be presented.
41
4 Multiple-Case Analysis
4.1 Introduction
Thomas (2011) states that a case study can be defined as an analysis of systems that are studied
with an integral vision by one or more methods. This means that the case study method is not
intended to analyze cases, but rather is a tool that helps define cases and explore their
environment (Cousin, 2005). Similarly, Creswell (2012) argues that “the case study method
explores a real-life, contemporary bounded system (one case) or multiple bounded systems
(cases) over time, through detailed and in-depth data collection that it involves multiple sources of
information.” (Creswell, 2012, p.97).
Researchers have to consider whether it is prudent to do a single or a multiple case study, all
under the interpretation of the phenomenon and the context of the research (Yin, 2003). When a
study involves more than one case, a multiple case study is essential in order to understand the
differences and similarities between the cases (Baxter and Jack, 2008). Typically, multiple case
studies were used to predict contrasting results for expected reasons or to predict similar results
in the studies (Yin, 2003). Thereby, the author can clarify whether the findings are valuable or not
(Eisenhardt, 1991). When the case studies are compared with each other, the researcher will
provide the literature with an important influence of the contrasts and similarities found (Vannoni,
2014). Another advantage of multiple case study is that they create a more compelling theory
when the suggestions are based on various empirical evidence. As a result, multiple cases allow
for a broader exploration of research questions and theoretical evolution (Eisenhardt and
Graebner, 2007).
Dyer and Wilkins (1991) say that the researcher’s ability to understand and describe the context
of the cases is a challenging task, in such a way that the reader can interpret and produce theory
in relation to the context described. One of the fundamental processes of the writer is to identify
the study audience and compare it to previously conducted reliable studies. Once this is done, the
writer must decide whether to do a single or a multiple case study (Gustafsson, 2017).
In this thesis, the author decided to do a multiple case study to comprehend the similarities and
differences between the ports of Manzanillo, Lázaro Cárdenas, Los Angeles and Long Beach, in
the context of the container industry. Therefore, the evidence generated from the multiple case
study will be solid and reliable, allowing the author to demonstrate whether or not the results are
valuable to the Port Authority of Manzanillo and the rest of the port users. Furthermore, the writer
42
firmly believes that the suggestions to be proposed will be based on different empirical evidence,
creating a more convincing theory.
In this manner, the aim of this chapter is to present the most relevant geographical, commercial,
and general characteristics of the four container ports (i.e. multiple cases) to be studied, namely
the ports of Manzanillo, Lázaro Cárdenas, Los Angeles, and Long Beach. Consequently, the
competitive advantages of the port of Manzanillo in the container industry compared to its
competitors will be identified. It is important to point out that the port range has been defined
according to the primary data collection, the homogeneity of the markets, the similar territorial
range, and the similarity in the traffic structure, as it was stated in section 1.5.
4.2 Data Collection
As described in section 1.5, to ensure the credibility of this study, it was significant to apply the
triangulation method of research data sources, thus, the data sources consulted by the author
correspond mainly to the interviews, scientific literature, journal articles, books, annual reports,
port statistics, and port master plans. The primary and secondary data collected throughout the
research were used in different ways but with the same purpose, to obtain reliable results that
allow an adequate answer to the research question and sub-questions.
For an effective application of the SPA, the author must first properly identify the competitors of
the port of Manzanillo within the container industry. To accomplish this step, as mentioned in
section 1.5, the researcher conducted three interviews with API Manzanillo employees (i.e.
primary data), which confirmed that the ports of Lázaro Cárdenas, Los Angeles, and Long Beach
are considered to be Manzanillo’s main competitors in the context of containerized cargo. What
justifies the competition between these ports, prevails merely in their installed capacity, their
strong network of suppliers, influence on internal demand, and the rivalry for the traffic of greater
volumes of containers from Southeast Asia, mainly China, South Korea, and Japan. Likewise,
these four ports have certain characteristics in common, such as their geographic location in the
Pacific Rim, their commercial partners, their long-term vision, their capacity for container traffic
and their public availability of information.
After determining the range of ports to be analyzed in the SPA tool, in Porter’s diamond model,
and in the multiple case study, it is important to proceed with secondary data collection. The
secondary data required for the SPA correspond to the total traffic flows of the four seaports,
43
where four different traffic categories are distinguished, i.e. containers, general cargo, dry bulk,
and liquid bulk. The values of port statistics must be measured in metric tons during a period of
eleven years (2007 – 2019). Similarly, for a better analysis, three consecutive periods must be
distinguished (i.e. 2007 – 2011, 2011 – 2015, and 2015 – 2019).
As Haezendonck, Verbeke, and Coeck (2006) mention, to effectively apply the three analytical
instruments (i.e. PPA, SSA, and PDA) it is important to collect reliable and accurate traffic figures,
such as port statistics, however, sometimes these data is not entirely reliable, due to the
differences in the definitions adopted by the different ports. In this research, the author faced these
small limitations in relation to the units of measurement used by American ports and the different
traffic categories established by Mexican ports. These data imperfections are described in more
depth in the following section 4.3. Fortunately, none of these limitations is critical, since the study
focuses mainly on the relative position of seaports and their evolution during the eleven years of
observation (Haezendonck, Verbeke and Coeck, 2006).
Followed by collecting port statistical data, it is necessary to proceed to study and understand the
current situation in which ports are found, i.e. to collect relevant information for the effective use
of Porter’s diamond model. Hereby, the following sections will present and analyze primary and
secondary data obtained mainly from interviews, port master plans, and government reports.
Consequently, relevant information in relation to developments, projections, strategies, and
problems of seaports will be obtained. The intention of doing a study of multiple cases is to identify
the advantages and disadvantages of each port, so the author firmly believes that it is essential
information for the correct design of Porter diamonds at the national and regional levels.
4.3 Data Collection Issues
The data regarding the total volumes of port traffic can be published in different units of
measurement, such as metric ton, freight ton, or revenue ton. However, each unit of measure is
different from each one, so it is not possible to convert it into a single standardized unit. Likewise,
on some occasions, ports only publish their statistics of annual container throughput measured in
units equivalent to twenty feet (TEU), a standardized measure of the maritime industry that is used
when counting cargo containers of different lengths (Port of Los Angeles, 2020b). Therefore, in
order to convert the statistical data from TEU to metric tons, the European Commission in the
Shipping MRV Regulation determined a standardized conversion factor, where a unit of TEU is
44
equivalent to 12 metric tons, while an empty TEU is equal to 2 metric tons (European Commission,
2017).
Taking into account the above, it is important to note that for the efficient implementation of the
SPA model, the port statistics of the four ports together with their four selected traffic categories
(i.e. containers, general cargo, dry bulk, and liquid bulk) must be measured in metric tons, if the
data is not represented in this unit of measure, the reliability of the results will be affected. If for
any reason, some of the ports selected in this study only provide annual container statistics
measured in TEU, it will be necessary to apply the conversion factor established by the European
Commission.
In the case of Mexican ports, the official websites of API Manzanillo and API Lázaro Cárdenas
have published their historical statistical data measured in metric tons, however, their annual
statistics are classified into five categories of traffic (i.e. containers, general cargo, mineral bulk,
agricultural bulk, and crude oil and derivatives). Because the author only determined four
categories of traffic in the SPA, the categories of mineral bulk and agricultural bulk were integrated
into one, i.e. dry bulk represents the sum of those two categories, while crude oil and its derivatives
are represented in the category of liquid bulk. On the other hand, the port authority of both ports
has published the annual container statistics in two units of measurements, i.e. TEU and metric
tons. Given the above, the data in metric tons were used only in the SPA model, while the values
in TEU were used to analyze the evolution of Manzanillo vis-à-vis its competitors (i.e. the graphs
illustrated in Chapter 4 correspond to these data).
While the author was analyzing and comparing the annual statistics of containers in TEU and
metric tons of the Mexican ports, she observed a peculiar characteristic that contradicts the
conversion factor determined by the European Commission. For the port of Manzanillo, when
dividing the total volume of containers in metric tons by the total volume in TEUs per year during
the eleven years of observation, it was identified that on average each container weighs 7.70
metric tons, while for the port of Lázaro Cárdenas by doing the same calculation, it was identified
that on average each container weighs 7.35 metric tons. Based on the information presented in
the Master plans7 of both ports, it is believed that one of the main reasons for this low weight per
container is due to the fact that approximately 40% of the total containers handled in Manzanillo
7 Port Master Development Program (PMDP).
45
and Lázaro Cárdenas correspond to transshipments, therefore, on some occasions certain
containers are empty, causing an imbalance in terms of weight in metric tons.
In a different way, during the collection of traffic flow data of the US ports, i.e. Los Angeles and
Long Beach, the author identified a different problem. The researcher observed that both ports do
not publish annual port statistics measured in metric tons, on the contrary, their statistical data is
only represented in TEU and metric tons of revenue (MRT). However, a ton of revenue (RT) is a
measure that is used for billing purposes, so the MRT measure represents a combination of metric
tons, cubic meters, and port revenue (Port of Los Angeles, 2019a), which it is not compatible or
comparable with the metric tonnage figures for the ports of Manzanillo and Lázaro Cárdenas.
Given the above, the author contacted the statistical departments of the ports of Los Angeles and
Long Beach by email in order to request support and an explanation of the situation.
Theresa Adams López, Director of Community Relations of the port of Los Angeles, explained to
the researcher that neither of the two US ports has a standard conversion factor to convert TEU
to metric tons, in the same way, she established that the ports do not receive information directly
from terminals or shipping lines on the content or actual weights of the cargo, but the United States
Customs is the authority responsible for that information. For more details on port statistics for Los
Angeles and Long Beach, Adams López recommended to the researcher consult the official
website of the United States Census Bureau, the official source for trade statistics. Taking into
consideration the above, the port statistics of Los Angeles and Long Beach used in the SPA
correspond to this new source of information. Fortunately, the United States Census Bureau does
publish statistics measured in metric tons for all four categories of traffic, so it was not necessary
to use the European Commission conversion factor.
Similarly, while the author analyzed and compared the annual container statistics in TEU and
metric tons of the ports of Los Angeles and Long Beach, she observed the same characteristic of
the Mexican ports that contradicts the conversion factor determined by the European Commission.
As previously explained, the total volume of containers in metric tons was divided by the total
volume in TEUs per year during the eleven years of observation, in this way it was identified that
for the port of Los Angeles, on average each container weighs 5.90 metric tons, while for the port
of Long Beach each container weighs 3.11 metric tons. This surprised and caught the author's
attention, so she decided to contact Theresa Adams López again. The Director of Community
Relations confirmed that on average a container in Los Angeles carries 5.8 metric tons of cargo,
while Long Beach 4 metric tons. This is due to two reasons, most of the containers exported by
46
ports contain agricultural products, while container imports correspond to empty containers
shipped from Asia. As a result, imports have a greater effect on the general average weight of
containers of the two American ports, which drastically unbalances the statistical reports, since
these ports register high volumes of TEU handled per year, but most of the time these are empty,
so in terms of weight it appears to be less volume.
4.4 Overview of the Mexican Port System
The International Transport Forum states that almost 90% of the merchandise commercialized in
the world is transported by sea, which facilitates trade and reduces logistics costs for many of the
users involved. Through constant development and modernization, the seaports have scaled-
down certain processes, making the supply chain more efficient (DICEX Integral Trade, 2019b).
Surprisingly, despite the size of the territory, geographic location, and economy, Mexico generates
a small volume percentage of cargo transported by sea. Overland transportation is the number
one modality for this country, due to the strong commercial relationship with the United States and
its geographic proximity. Nonetheless, experts consider that Mexico’s port system has a promising
future and potential growth, moreover, it is argued that with capital investments in modernization
and expansion, certain ports of the country would have a significant economical increment
(Netherlands Enterprise Agency, 2019).
Mexico has 102 functional ports and 15 terminals outside the port along its 11,500 km of coastline,
allowing the country to connect with more than 145 countries. The seaports of Lázaro Cárdenas,
Manzanillo, Ensenada, and Salina Cruz are the four main ports located on the western Pacific
coast. While, on the east coast facing the Gulf of Mexico are the ports of Veracruz, Altamira,
Coatzacoalcos, and Dos Bocas, see Figure 4.1. Despite that, Lázaro Cárdenas and Veracruz are
considered the two largest ports in the country in terms of territorial size (Netherlands Business
Agency, 2019).
In the last 10 years, Manzanillo has become the most dynamic port in the Pacific Coast of Mexico
and leader in the movement of containerized cargo in the Mexican port system. Nowadays, the
port of Manzanillo has containerized cargo handling as its strength, while Lázaro Cárdenas
focuses more on handling bulk minerals, however, this does not mean that over time this cannot
change. Furthermore, the competitive advantages that reinforce the port of Manzanillo are its
specialized terminals, safe social climate, favorable geographical position, and hinterland
connectivity. The port of Manzanillo is also recognized for its positive impact on the tourism sector,
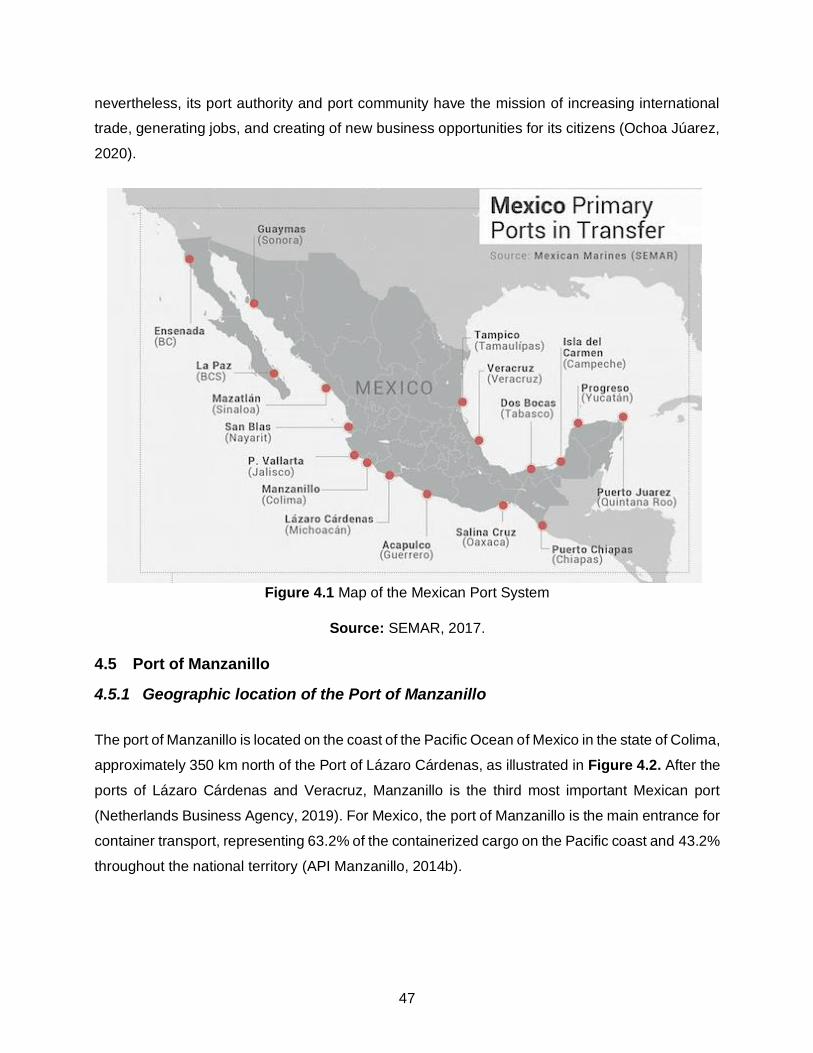
47
nevertheless, its port authority and port community have the mission of increasing international
trade, generating jobs, and creating of new business opportunities for its citizens (Ochoa Júarez,
2020).
Figure 4.1 Map of the Mexican Port System
Source: SEMAR, 2017.
4.5 Port of Manzanillo
4.5.1 Geographic location of the Port of Manzanillo
The port of Manzanillo is located on the coast of the Pacific Ocean of Mexico in the state of Colima,
approximately 350 km north of the Port of Lázaro Cárdenas, as illustrated in Figure 4.2. After the
ports of Lázaro Cárdenas and Veracruz, Manzanillo is the third most important Mexican port
(Netherlands Business Agency, 2019). For Mexico, the port of Manzanillo is the main entrance for
container transport, representing 63.2% of the containerized cargo on the Pacific coast and 43.2%
throughout the national territory (API Manzanillo, 2014b).
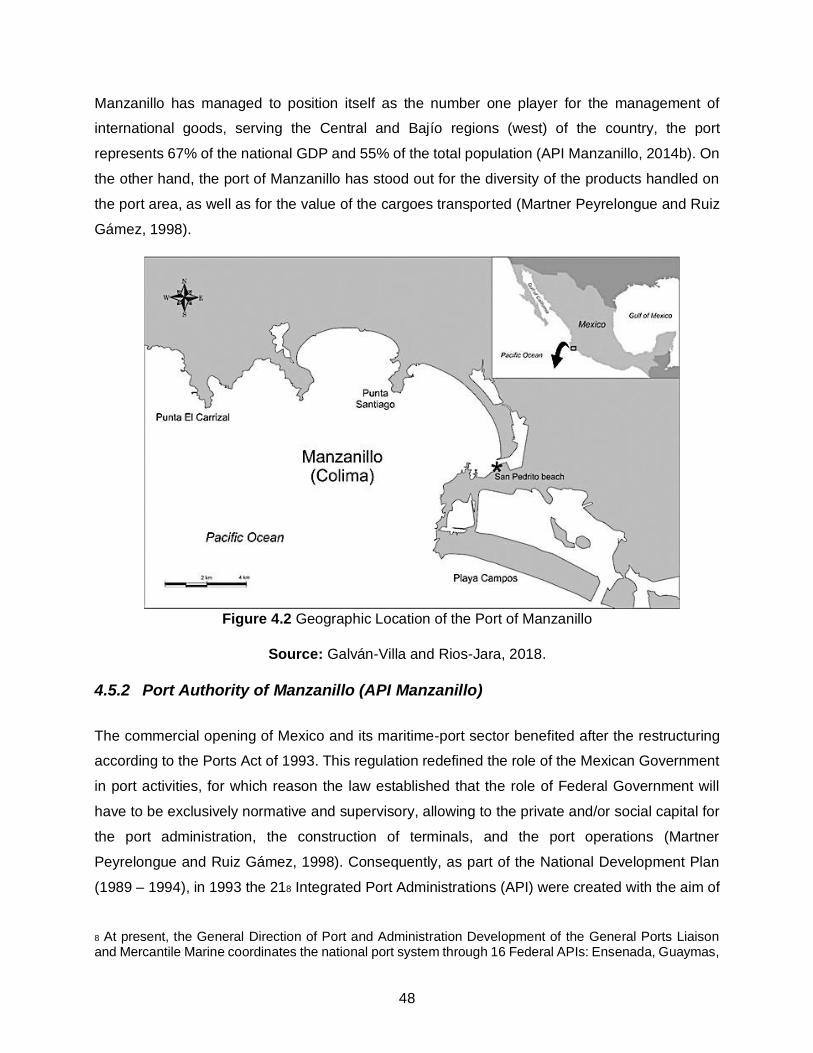
48
Manzanillo has managed to position itself as the number one player for the management of
international goods, serving the Central and Bajío regions (west) of the country, the port
represents 67% of the national GDP and 55% of the total population (API Manzanillo, 2014b). On
the other hand, the port of Manzanillo has stood out for the diversity of the products handled on
the port area, as well as for the value of the cargoes transported (Martner Peyrelongue and Ruiz
Gámez, 1998).
Figure 4.2 Geographic Location of the Port of Manzanillo
Source: Galván-Villa and Rios-Jara, 2018.
4.5.2 Port Authority of Manzanillo (API Manzanillo)
The commercial opening of Mexico and its maritime-port sector benefited after the restructuring
according to the Ports Act of 1993. This regulation redefined the role of the Mexican Government
in port activities, for which reason the law established that the role of Federal Government will
have to be exclusively normative and supervisory, allowing to the private and/or social capital for
the port administration, the construction of terminals, and the port operations (Martner
Peyrelongue and Ruiz Gámez, 1998). Consequently, as part of the National Development Plan
(1989 – 1994), in 1993 the 218 Integrated Port Administrations (API) were created with the aim of
8 At present, the General Direction of Port and Administration Development of the General Ports Liaison and Mercantile Marine coordinates the national port system through 16 Federal APIs: Ensenada, Guaymas,
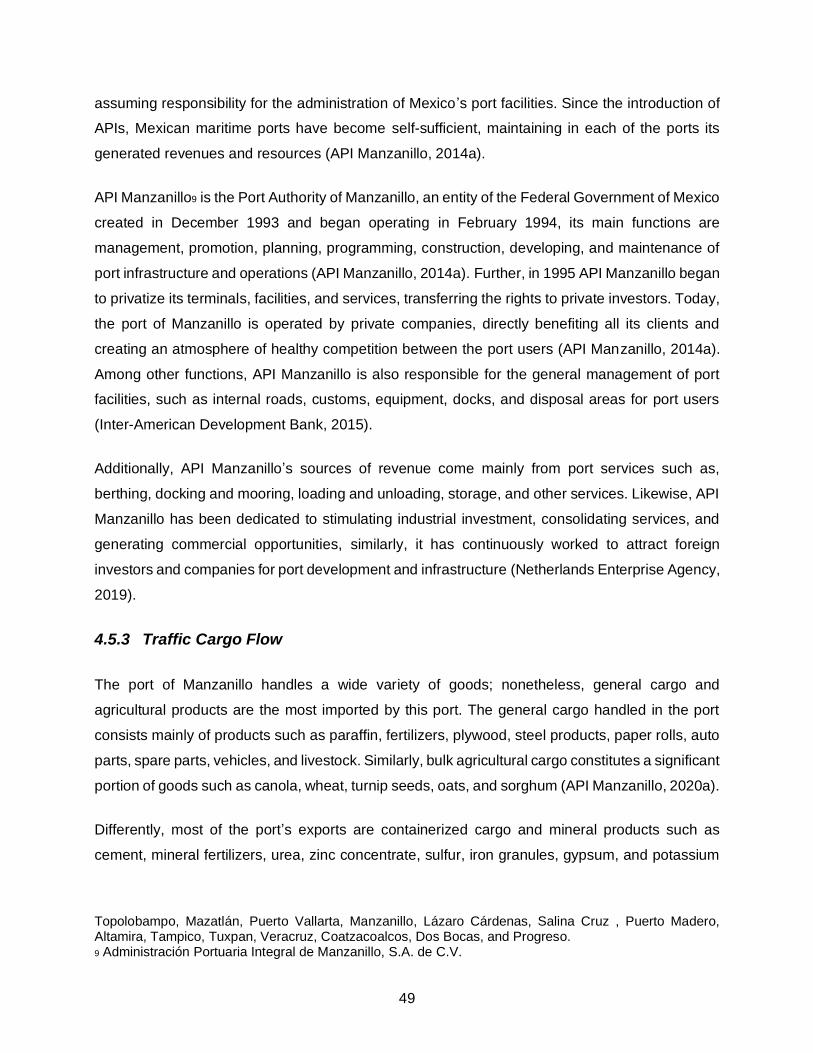
49
assuming responsibility for the administration of Mexico’s port facilities. Since the introduction of
APIs, Mexican maritime ports have become self-sufficient, maintaining in each of the ports its
generated revenues and resources (API Manzanillo, 2014a).
API Manzanillo9 is the Port Authority of Manzanillo, an entity of the Federal Government of Mexico
created in December 1993 and began operating in February 1994, its main functions are
management, promotion, planning, programming, construction, developing, and maintenance of
port infrastructure and operations (API Manzanillo, 2014a). Further, in 1995 API Manzanillo began
to privatize its terminals, facilities, and services, transferring the rights to private investors. Today,
the port of Manzanillo is operated by private companies, directly benefiting all its clients and
creating an atmosphere of healthy competition between the port users (API Manzanillo, 2014a).
Among other functions, API Manzanillo is also responsible for the general management of port
facilities, such as internal roads, customs, equipment, docks, and disposal areas for port users
(Inter-American Development Bank, 2015).
Additionally, API Manzanillo’s sources of revenue come mainly from port services such as,
berthing, docking and mooring, loading and unloading, storage, and other services. Likewise, API
Manzanillo has been dedicated to stimulating industrial investment, consolidating services, and
generating commercial opportunities, similarly, it has continuously worked to attract foreign
investors and companies for port development and infrastructure (Netherlands Enterprise Agency,
2019).
4.5.3 Traffic Cargo Flow
The port of Manzanillo handles a wide variety of goods; nonetheless, general cargo and
agricultural products are the most imported by this port. The general cargo handled in the port
consists mainly of products such as paraffin, fertilizers, plywood, steel products, paper rolls, auto
parts, spare parts, vehicles, and livestock. Similarly, bulk agricultural cargo constitutes a significant
portion of goods such as canola, wheat, turnip seeds, oats, and sorghum (API Manzanillo, 2020a).
Differently, most of the port’s exports are containerized cargo and mineral products such as
cement, mineral fertilizers, urea, zinc concentrate, sulfur, iron granules, gypsum, and potassium
Topolobampo, Mazatlán, Puerto Vallarta, Manzanillo, Lázaro Cárdenas, Salina Cruz , Puerto Madero, Altamira, Tampico, Tuxpan, Veracruz, Coatzacoalcos, Dos Bocas, and Progreso. 9 Administración Portuaria Integral de Manzanillo, S.A. de C.V.
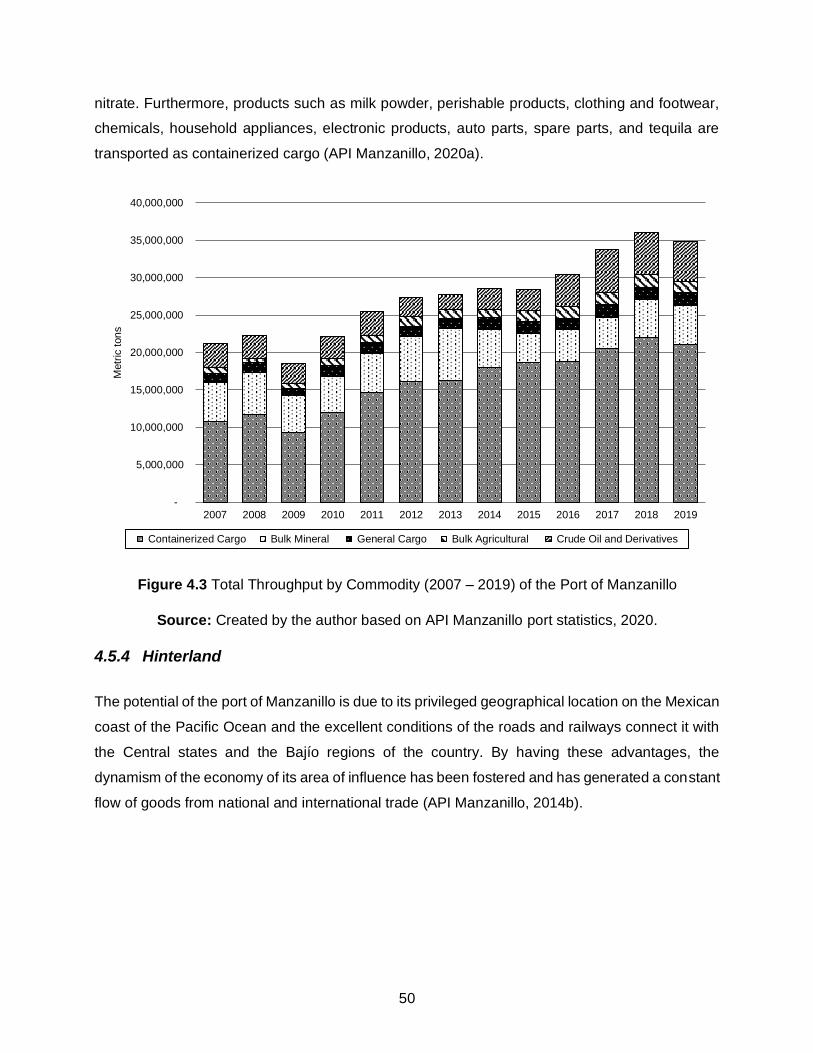
50
nitrate. Furthermore, products such as milk powder, perishable products, clothing and footwear,
chemicals, household appliances, electronic products, auto parts, spare parts, and tequila are
transported as containerized cargo (API Manzanillo, 2020a).
Figure 4.3 Total Throughput by Commodity (2007 – 2019) of the Port of Manzanillo
Source: Created by the author based on API Manzanillo port statistics, 2020.
4.5.4 Hinterland
The potential of the port of Manzanillo is due to its privileged geographical location on the Mexican
coast of the Pacific Ocean and the excellent conditions of the roads and railways connect it with
the Central states and the Bajío regions of the country. By having these advantages, the
dynamism of the economy of its area of influence has been fostered and has generated a constant
flow of goods from national and international trade (API Manzanillo, 2014b).
-
5,000,000
10,000,000
15,000,000
20,000,000
25,000,000
30,000,000
35,000,000
40,000,000
2007 2008 2009 2010 2011 2012 2013 2014 2015 2016 2017 2018 2019
Metr
ic t
on
s
Containerized Cargo Bulk Mineral General Cargo Bulk Agricultural Crude Oil and Derivatives
51
The hinterland of the port of Manzanillo comprises an area of influence integrated by 17 states of
the Mexican Republic, i.e. Colima, Aguascalientes, Coahuila, Federal District, Durango, State of
Mexico, Guanajuato, Hidalgo, Jalisco, Michoacán, Morelos, Nayarit, Nuevo León, Querétaro, San
Luis Potosí, Tamaulipas, and Zacatecas, as shown in Figure 4.4, which has positioned it as the
main entrance for containerized cargo in Mexico. Similarly, the Mexican states that make up the
internal zone of influence are characterized by being economically dynamic and with high long-
term growth prospects, representing 42.1% of Mexico’s gross domestic product (API Manzanillo,
2014b).
Figure 4.4 Hinterland of the Port of Manzanillo
Source: Created by the author based on API Manzanillo data, 2020.
4.5.5 Foreland
The port’s international area of influence is mainly oriented towards the west coast of the American
continent and the Pacific coast, with an international exchange of goods to the main countries
such as the United States, Canada, Panama, Ecuador, Costa Rica, Guatemala, El Salvador,
Nicaragua, Colombia, Chile, Peru, Japan, China, South Korea, Taiwan, India, Indonesia,
Malaysia, Singapore, Vietnam, Myanmar, Cambodia, Sri Lanka, Pakistan, the Philippines, South
Africa, Russia, Australia, and New Zealand (API Manzanillo, 2015), as illustrated in Figure 4.5.
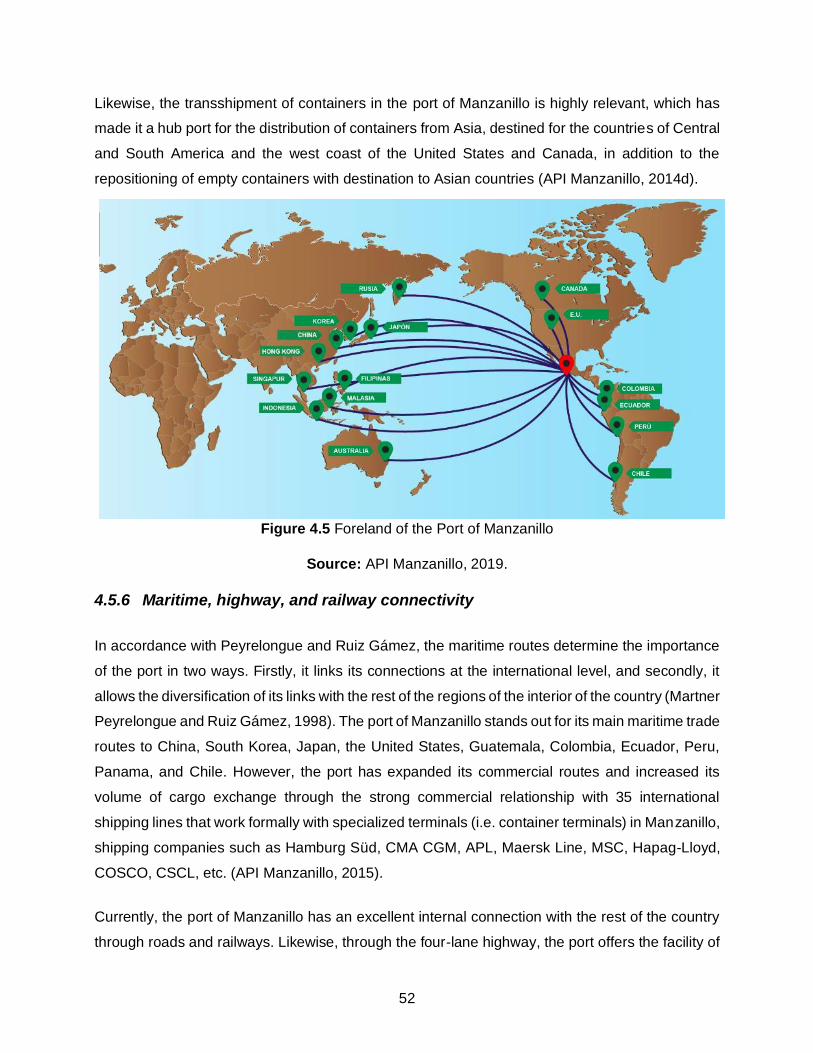
52
Likewise, the transshipment of containers in the port of Manzanillo is highly relevant, which has
made it a hub port for the distribution of containers from Asia, destined for the countries of Central
and South America and the west coast of the United States and Canada, in addition to the
repositioning of empty containers with destination to Asian countries (API Manzanillo, 2014d).
Figure 4.5 Foreland of the Port of Manzanillo
Source: API Manzanillo, 2019.
4.5.6 Maritime, highway, and railway connectivity
In accordance with Peyrelongue and Ruiz Gámez, the maritime routes determine the importance
of the port in two ways. Firstly, it links its connections at the international level, and secondly, it
allows the diversification of its links with the rest of the regions of the interior of the country (Martner
Peyrelongue and Ruiz Gámez, 1998). The port of Manzanillo stands out for its main maritime trade
routes to China, South Korea, Japan, the United States, Guatemala, Colombia, Ecuador, Peru,
Panama, and Chile. However, the port has expanded its commercial routes and increased its
volume of cargo exchange through the strong commercial relationship with 35 international
shipping lines that work formally with specialized terminals (i.e. container terminals) in Manzanillo,
shipping companies such as Hamburg Süd, CMA CGM, APL, Maersk Line, MSC, Hapag-Lloyd,
COSCO, CSCL, etc. (API Manzanillo, 2015).
Currently, the port of Manzanillo has an excellent internal connection with the rest of the country
through roads and railways. Likewise, through the four-lane highway, the port offers the facility of
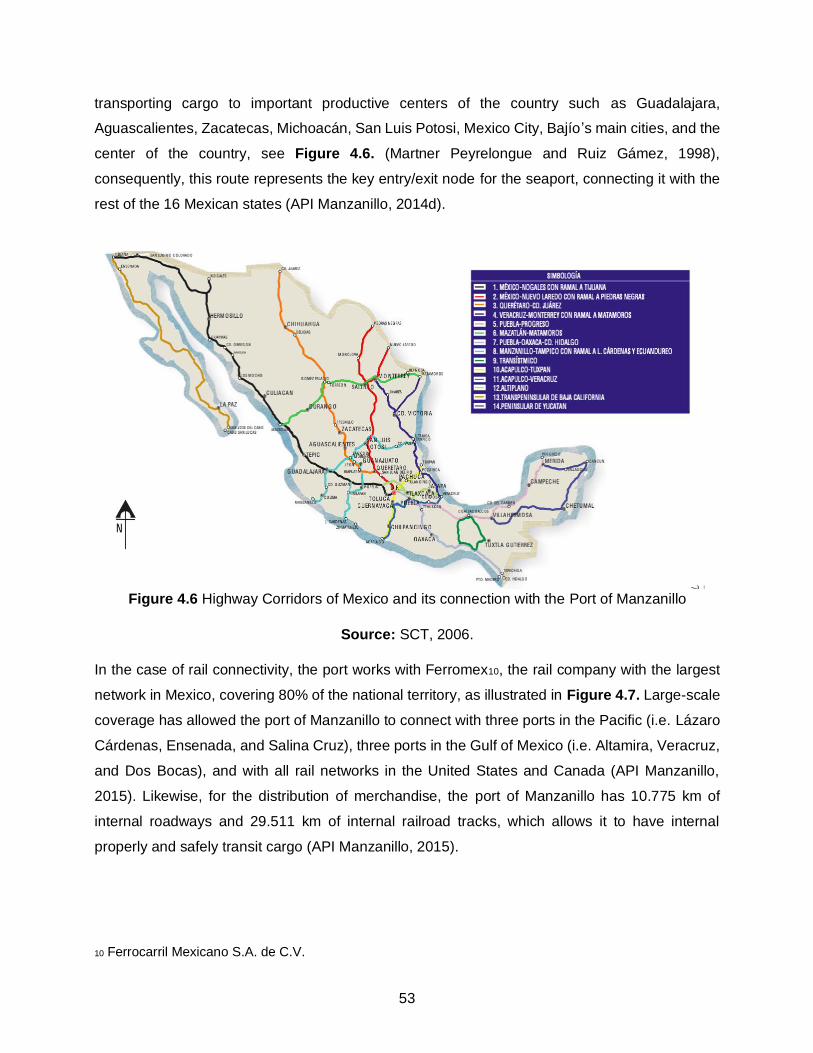
53
transporting cargo to important productive centers of the country such as Guadalajara,
Aguascalientes, Zacatecas, Michoacán, San Luis Potosi, Mexico City, Bajío’s main cities, and the
center of the country, see Figure 4.6. (Martner Peyrelongue and Ruiz Gámez, 1998),
consequently, this route represents the key entry/exit node for the seaport, connecting it with the
rest of the 16 Mexican states (API Manzanillo, 2014d).
Figure 4.6 Highway Corridors of Mexico and its connection with the Port of Manzanillo
Source: SCT, 2006.
In the case of rail connectivity, the port works with Ferromex10, the rail company with the largest
network in Mexico, covering 80% of the national territory, as illustrated in Figure 4.7. Large-scale
coverage has allowed the port of Manzanillo to connect with three ports in the Pacific (i.e. Lázaro
Cárdenas, Ensenada, and Salina Cruz), three ports in the Gulf of Mexico (i.e. Altamira, Veracruz,
and Dos Bocas), and with all rail networks in the United States and Canada (API Manzanillo,
2015). Likewise, for the distribution of merchandise, the port of Manzanillo has 10.775 km of
internal roadways and 29.511 km of internal railroad tracks, which allows it to have internal
properly and safely transit cargo (API Manzanillo, 2015).
10 Ferrocarril Mexicano S.A. de C.V.
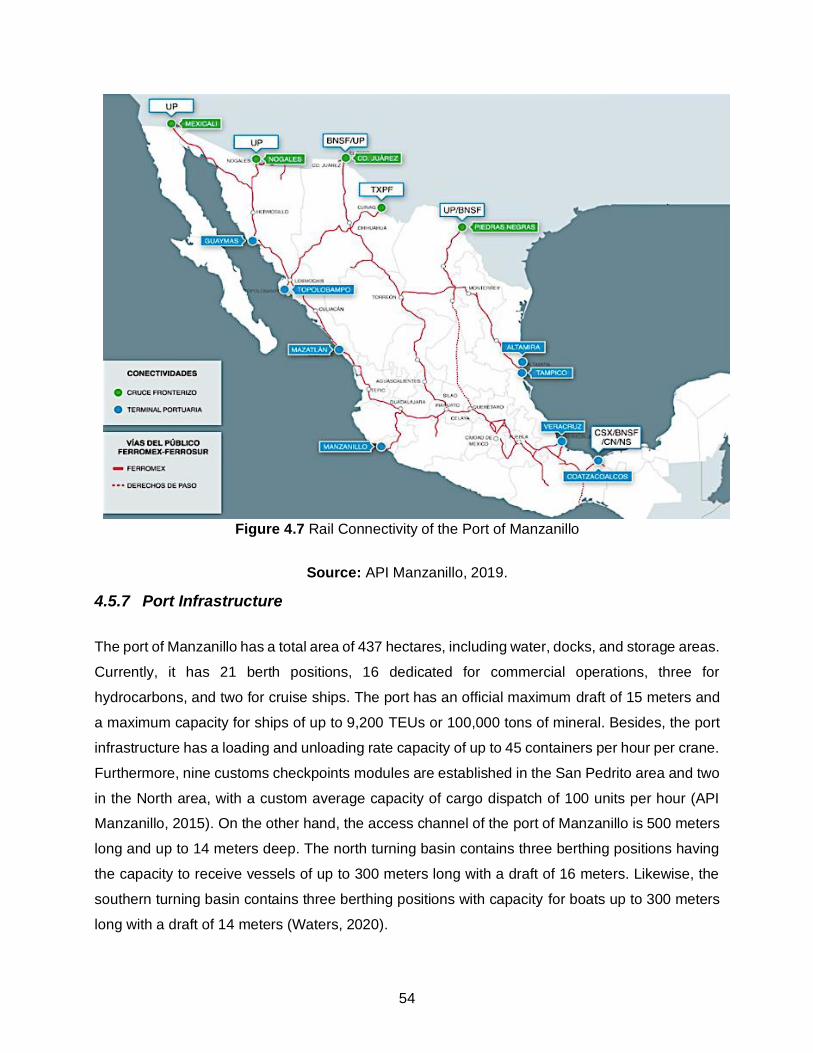
54
Figure 4.7 Rail Connectivity of the Port of Manzanillo
Source: API Manzanillo, 2019.
4.5.7 Port Infrastructure
The port of Manzanillo has a total area of 437 hectares, including water, docks, and storage areas.
Currently, it has 21 berth positions, 16 dedicated for commercial operations, three for
hydrocarbons, and two for cruise ships. The port has an official maximum draft of 15 meters and
a maximum capacity for ships of up to 9,200 TEUs or 100,000 tons of mineral. Besides, the port
infrastructure has a loading and unloading rate capacity of up to 45 containers per hour per crane.
Furthermore, nine customs checkpoints modules are established in the San Pedrito area and two
in the North area, with a custom average capacity of cargo dispatch of 100 units per hour (API
Manzanillo, 2015). On the other hand, the access channel of the port of Manzanillo is 500 meters
long and up to 14 meters deep. The north turning basin contains three berthing positions having
the capacity to receive vessels of up to 300 meters long with a draft of 16 meters. Likewise, the
southern turning basin contains three berthing positions with capacity for boats up to 300 meters
long with a draft of 14 meters (Waters, 2020).
55
4.5.8 Port Terminals and Facilities
Within the 437 hectares of total area, the port of Manzanillo has 14 private specialized terminals
and facilities for handling all types of cargo, providing high quality productivity, which has allowed
it to compete with other ports on the Pacific Coast of Mexico. As part of the concessions, terminal
users are responsible for maintaining their equipment and infrastructure for their day-to-day
operations, such as cranes and their office buildings. Similarly, terminals must follow the
environmental protocols established in the port’s general environmental management plan (Inter-
American Development Bank, 2015).
The port of Manzanillo has two specialized container terminals equipped with Super Post
Panamax cranes, two multipurpose facilities for handling general and containerized cargo, two
terminals specialized in refrigerated and perishable cargo, one terminal specialized in frozen cargo
(focused on frozen seafood), one terminal for the handling of minerals bulk with a capacity up to
2,000 tons per hour, a facility for handling steel products, two dedicated terminals for handling and
storage of cement bulk and raw materials, two terminals for the handling of agricultural bulk, a
terminal focused on the handling and storage of hydrocarbons (crude oil and derivatives), and a
terminal for the arrival of cruise ships managed by the Government of Colima and with a capacity
to receive two cruise ships up to 300 meters in length (Waters, 2020).
4.5.9 Container Handling Facilities
The port of Manzanillo has a total throughput capacity of 4,350,000 TEUs per year through the
performance of the two specialized container terminals operated by SSA Mexico and Contecon
Manzanillo (CMSA) (Inter-American Development Bank, 2015). The Specialized Container
Terminal I (TEC I) operated by SSA Mexico, is considered the leading terminal in the port and the
most equipped and sophisticated in Mexico. It has a yard capacity of 33,000 TEUs, an inspection
area with a daily capacity for 365 inspections, 5,500 m² of a warehouse consolidated cargo (LCL),
1,064 connections for refrigerated cargo, and two external courtyards with a capacity of 15,000
TEUs (SSA Mexico, 2020). Its main clients are shipping lines such as; APL, CMA CGM, COSCO,
Evergreen, Hamburg Sud, Hapag Lloyd, Maersk, MSC, ONE, PIL, and OOCL (SSA Mexico,
2020).
On the other hand, the second Specialized Container Terminal II (TEC II) operated by Contecon
Manzanillo has a loading and unloading capacity of three container ships simultaneously with a
56
maximum productivity of 120 containers per hour per vessel. It also has a capacity of 650,000
TEUs, along with a dedicated space for temperature-controlled, hazardous and general cargo and
empty containers (Contecon Manzanillo, 2020).
4.5.10 Port Master Development Program (PMDP) 2015 – 2020
The port development plans that are proposed to be carried out in the port of Manzanillo must be
reviewed by API Manzanillo which is responsible for managing and reporting all the Master plans
to the SCT11, the only federal entity with the power to analyze and approve the development plans
proposed, the process has a duration of up to five years. Moreover, the SCT is in charge of the
Mexican Port System through the General Coordination of Ports and Merchant Marine (CGPyMM),
the entity responsible for the port policy and promotion of Mexican ports in terms of world trade
(Netherlands Enterprise Agency, 2019).
Nowadays, the Port Master Development Program12 (PMDP) 2015 – 2020, aims to define the
strategic planning of the port of Manzanillo with a 20-year vision and to establish actions to be
carried out in a five-year execution period (API Manzanillo, 2014d). According to the PMDP,
Manzanillo’s natural vocation is to be a commercial port, with high competitiveness in handling
containerized cargo, due to its installed capacity and the specialization it has developed (API
Manzanillo, 2014d).
Correspondingly, the PMDP 2015 – 2020 states as a Vision: “To be the leading Latin American
container port in the Pacific Ocean, with world-class and sustainable infrastructure and
operations, linking from Mexico the productive multimodal logistics chain between America and
Asia.” (API Manzanillo, 2014d).
4.5.11 Statistics of the Port of Manzanillo
The annual reports of API Manzanillo indicate that in the last decade the port of Manzanillo has
undergone great transformations and economic growth, immersing itself in the process of
development of the industrialized world and the great demand of the maritime sector. Innovation
11 Secretariat of Communications and Transport. 12 Programa Maestro de Desarrollo Portuario 2015 – 2020.
57
and technology have generated a continuous increase in the size of container ships, causing an
increment in the global exchange of goods through containers (API Manzanillo, 2015).
Worldwide Standing
As reported by Lloyd’s List Intelligence, in 2018 the port of Manzanillo presented an annual
container throughput of 3,078,513 TEUs, increasing 8.8% compared to 2017 (2,830,370 TEUs),
and positioning it in 2019 in the 56th place in the global ranking, therefore that the port of Incheon
occupied the 55th place and the port of Said in the 57th rank. Similarly, the port of Manzanillo has
shown positive behaviors, rising its international position in the last ten years (Lloyd ’s List, 2019).
Latin America (LATAM) Standing
According to the Economic Commission for Latin America and the Caribbean, in 2018 the port of
Manzanillo increased its position to third place in terms of annual container throughput with an
increase of 11% compared to 2017. Manzanillo’s position is below the port of Colón, Panama who
held the first place and the port of Santos, Brazil in second place. Additionally, in 2017, total Latin
America and the Caribbean container throughput represented 6.6% of the global throughput
(ECLAC, 2019).
However, if it is analyzed the competitive position of the port of Manzanillo vis-à-vis all the ports
of the American continent located on the Pacific Rim, it can be observed that American ports such
as Los Angeles and Long Beach hold the first positions in terms annual container throughput
(Ochoa Júarez, 2020).
National Standing
In terms of territorial size, economic impact, and annual container throughput the five top container
ports in Mexico are port of Ensenada, Manzanillo, Lázaro Cárdenas, Altamira, and Veracruz, three
located on the western Pacific coast and two on the Gulf of Mexico (SCT, 2017). As informed in
the annual report of the SCT, the port of Manzanillo is positioned in the number one range in terms
of annual container throughput compared to the other four ports, as illustrated in Figure 4.8.
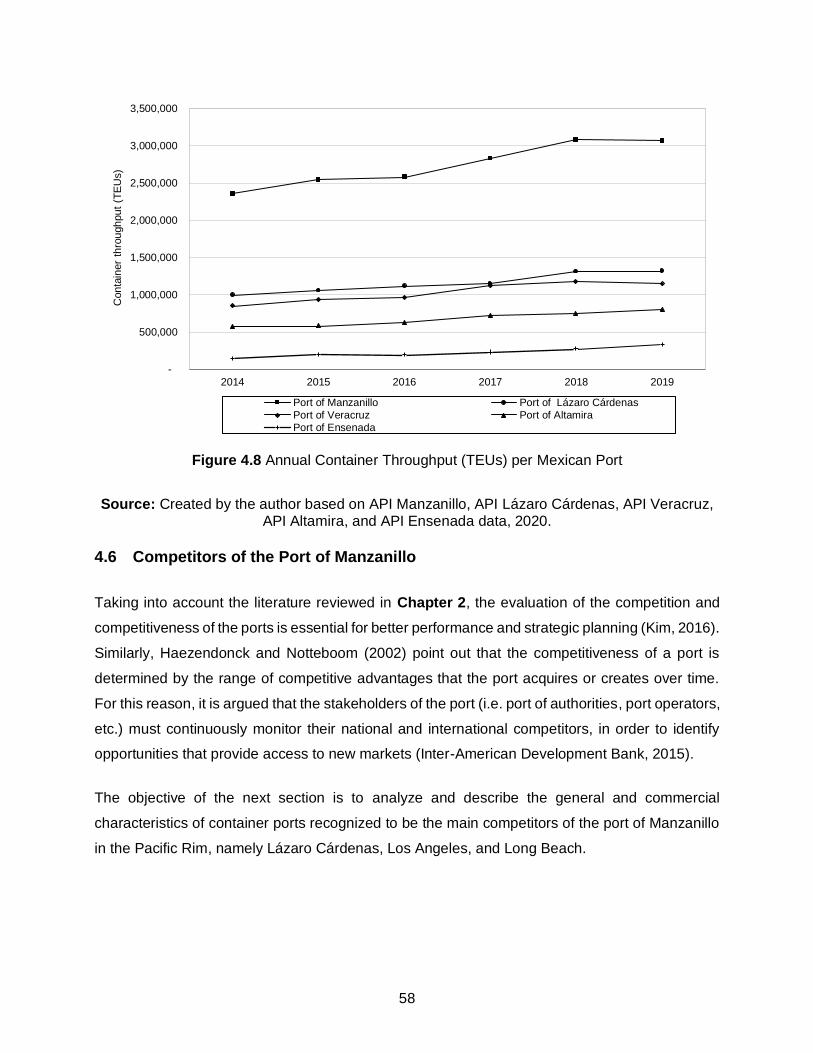
58
Figure 4.8 Annual Container Throughput (TEUs) per Mexican Port
Source: Created by the author based on API Manzanillo, API Lázaro Cárdenas, API Veracruz, API Altamira, and API Ensenada data, 2020.
4.6 Competitors of the Port of Manzanillo
Taking into account the literature reviewed in Chapter 2, the evaluation of the competition and
competitiveness of the ports is essential for better performance and strategic planning (Kim, 2016).
Similarly, Haezendonck and Notteboom (2002) point out that the competitiveness of a port is
determined by the range of competitive advantages that the port acquires or creates over time.
For this reason, it is argued that the stakeholders of the port (i.e. port of authorities, port operators,
etc.) must continuously monitor their national and international competitors, in order to identify
opportunities that provide access to new markets (Inter-American Development Bank, 2015).
The objective of the next section is to analyze and describe the general and commercial
characteristics of container ports recognized to be the main competitors of the port of Manzanillo
in the Pacific Rim, namely Lázaro Cárdenas, Los Angeles, and Long Beach.
-
500,000
1,000,000
1,500,000
2,000,000
2,500,000
3,000,000
3,500,000
2014 2015 2016 2017 2018 2019
Con
tain
er
thro
ugh
pu
t (T
EU
s)
Port of Manzanillo Port of Lázaro Cárdenas
Port of Veracruz Port of Altamira
Port of Ensenada
59
4.6.1 Overview of Port Competition of Manzanillo
On the Pacific Ocean coast, the ports of Manzanillo and Lázaro Cárdenas lead the most important
access of the Mexican economy to the international markets that flow through the Pacific basin.
Both ports are the main logistics platforms for the dynamism, competitiveness, and diversification
of Mexico’s international trade, which facilitates the operation of maritime trade routes with Asia,
Latin America, and the United States (API Manzanillo, 2014d). However, as Kevin Emmanuel
Rubio Ceja stated, in the last decade, both ports have demonstrated their ability to serve the
containerized cargo market in the center and west of the country. Despite that, in 1995, SSA
México terminal (i.e. TEC I), obtained the container handling concession at the port of Manzanillo,
causing that container cargo flows to be concentrated in this port, and resulting in a drastic drop
in the total volumes of the port of Lázaro Cárdenas (Rubio Ceja, 2020).
On the contrary, in the international aspect, the port of Manzanillo faces strong competition for the
traffic of containers vis-à-vis the ports of North America located on the west coast, i.e. the ports of
Los Angeles and Long Beach. The main reason is due to the high installed capacity, specialized
terminals, high rates of performance and productivity, and the constant frequency of arrival of
container ships in both American ports (Martner Peyrelongue and Ruiz Gámez, 1998).
According to Governmental reports, the port of Manzanillo has presented difficulties in achieving
the same high levels of port efficiency, as well as better connectivity with the interior of the country
and intermodal productive integration to capture the flow of containerized cargo. Similarly, it has
been determined that the containerized cargo flows through the port of Manzanillo to the central
and western regions of Mexico have turned out to be as economic as the operations of the US,
however, in the operational aspect, Manzanillo does not achieve the same high standards during
containerized cargo operations, presenting the need to improve coordination between customs
authorities that control, inspect and dispatch cargoes, in order to streamline and accelerate cargo
flow between the sea and landside (Martner Peyrelongue and Ruiz Gámez, 1998).
4.6.2 Port of Lázaro Cárdenas
Lázaro Cárdenas is a young and dynamic port located in the state of Michoacán on the western
coast of the Mexican Pacific, where Michoacán limits with the state of Guerrero, see Figure 4.9.
The geographical location of the port of Lázaro Cárdenas has provided considerable growth in the
flow of containers from Southeast Asia since its location classifies it as a viable alternative for
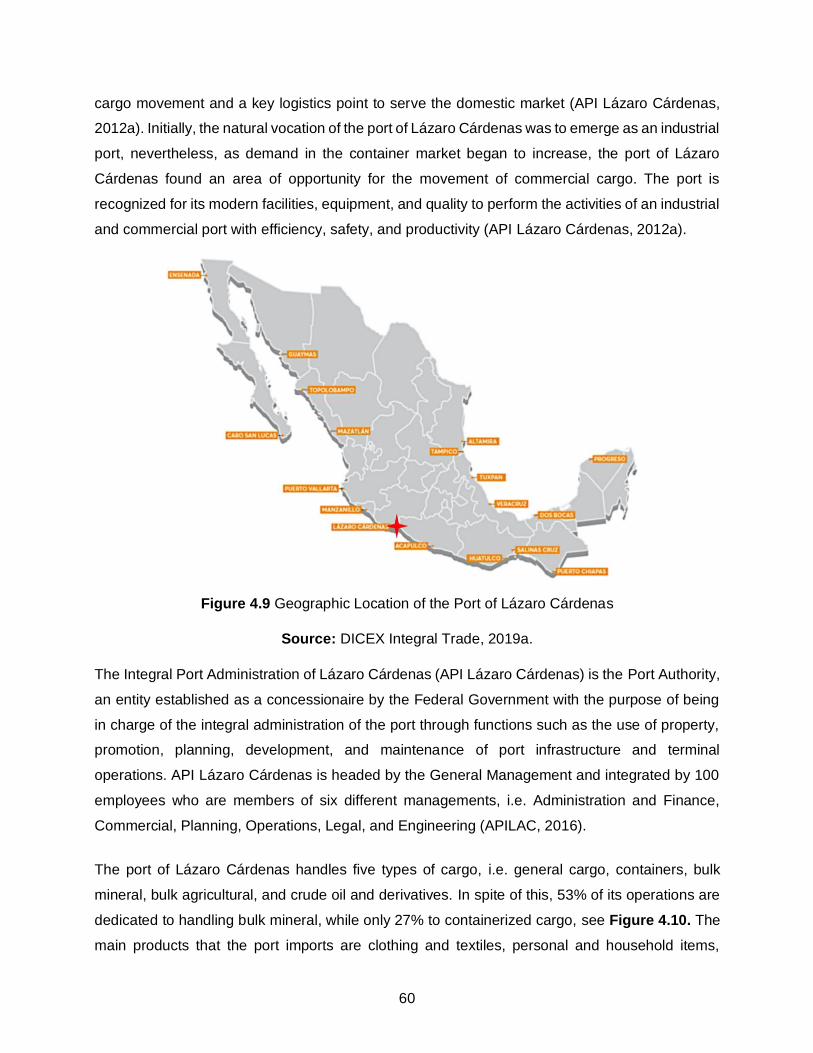
60
cargo movement and a key logistics point to serve the domestic market (API Lázaro Cárdenas,
2012a). Initially, the natural vocation of the port of Lázaro Cárdenas was to emerge as an industrial
port, nevertheless, as demand in the container market began to increase, the port of Lázaro
Cárdenas found an area of opportunity for the movement of commercial cargo. The port is
recognized for its modern facilities, equipment, and quality to perform the activities of an industrial
and commercial port with efficiency, safety, and productivity (API Lázaro Cárdenas, 2012a).
Figure 4.9 Geographic Location of the Port of Lázaro Cárdenas
Source: DICEX Integral Trade, 2019a.
The Integral Port Administration of Lázaro Cárdenas (API Lázaro Cárdenas) is the Port Authority,
an entity established as a concessionaire by the Federal Government with the purpose of being
in charge of the integral administration of the port through functions such as the use of property,
promotion, planning, development, and maintenance of port infrastructure and terminal
operations. API Lázaro Cárdenas is headed by the General Management and integrated by 100
employees who are members of six different managements, i.e. Administration and Finance,
Commercial, Planning, Operations, Legal, and Engineering (APILAC, 2016).
The port of Lázaro Cárdenas handles five types of cargo, i.e. general cargo, containers, bulk
mineral, bulk agricultural, and crude oil and derivatives. In spite of this, 53% of its operations are
dedicated to handling bulk mineral, while only 27% to containerized cargo, see Figure 4.10. The
main products that the port imports are clothing and textiles, personal and household items,
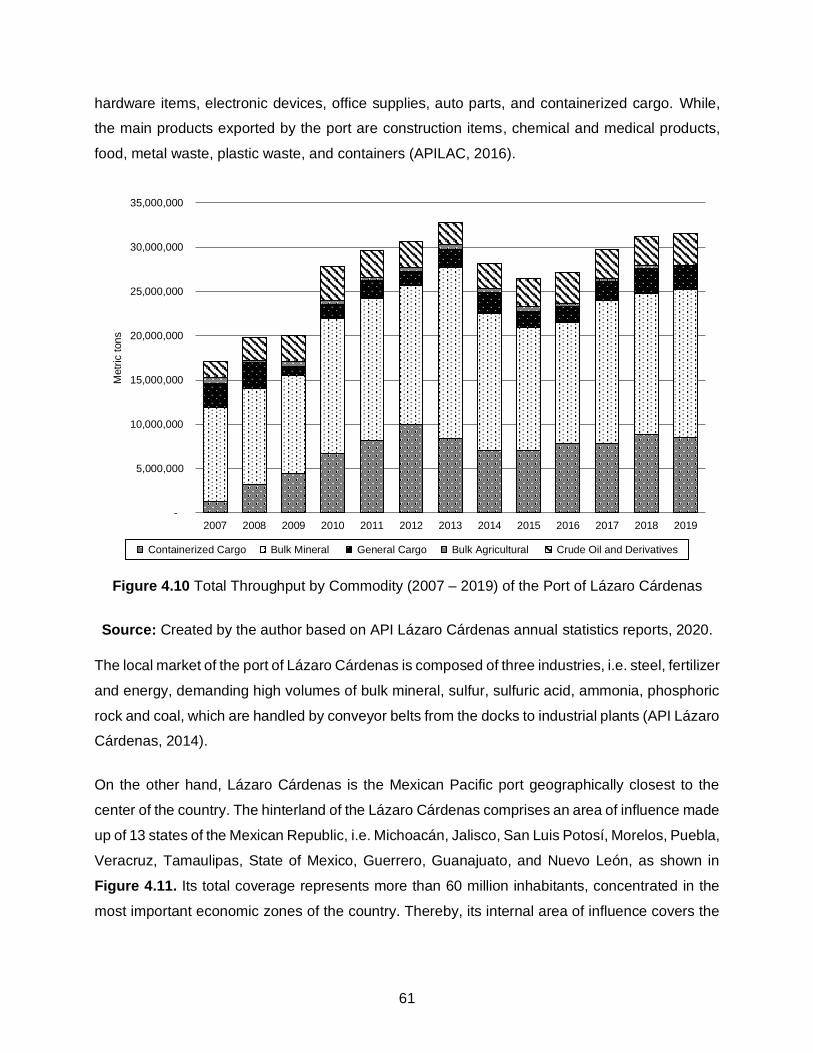
61
hardware items, electronic devices, office supplies, auto parts, and containerized cargo. While,
the main products exported by the port are construction items, chemical and medical products,
food, metal waste, plastic waste, and containers (APILAC, 2016).
Figure 4.10 Total Throughput by Commodity (2007 – 2019) of the Port of Lázaro Cárdenas
Source: Created by the author based on API Lázaro Cárdenas annual statistics reports, 2020.
The local market of the port of Lázaro Cárdenas is composed of three industries, i.e. steel, fertilizer
and energy, demanding high volumes of bulk mineral, sulfur, sulfuric acid, ammonia, phosphoric
rock and coal, which are handled by conveyor belts from the docks to industrial plants (API Lázaro
Cárdenas, 2014).
On the other hand, Lázaro Cárdenas is the Mexican Pacific port geographically closest to the
center of the country. The hinterland of the Lázaro Cárdenas comprises an area of influence made
up of 13 states of the Mexican Republic, i.e. Michoacán, Jalisco, San Luis Potosí, Morelos, Puebla,
Veracruz, Tamaulipas, State of Mexico, Guerrero, Guanajuato, and Nuevo León, as shown in
Figure 4.11. Its total coverage represents more than 60 million inhabitants, concentrated in the
most important economic zones of the country. Thereby, its internal area of influence covers the
-
5,000,000
10,000,000
15,000,000
20,000,000
25,000,000
30,000,000
35,000,000
2007 2008 2009 2010 2011 2012 2013 2014 2015 2016 2017 2018 2019
Metr
ic t
on
s
Containerized Cargo Bulk Mineral General Cargo Bulk Agricultural Crude Oil and Derivatives
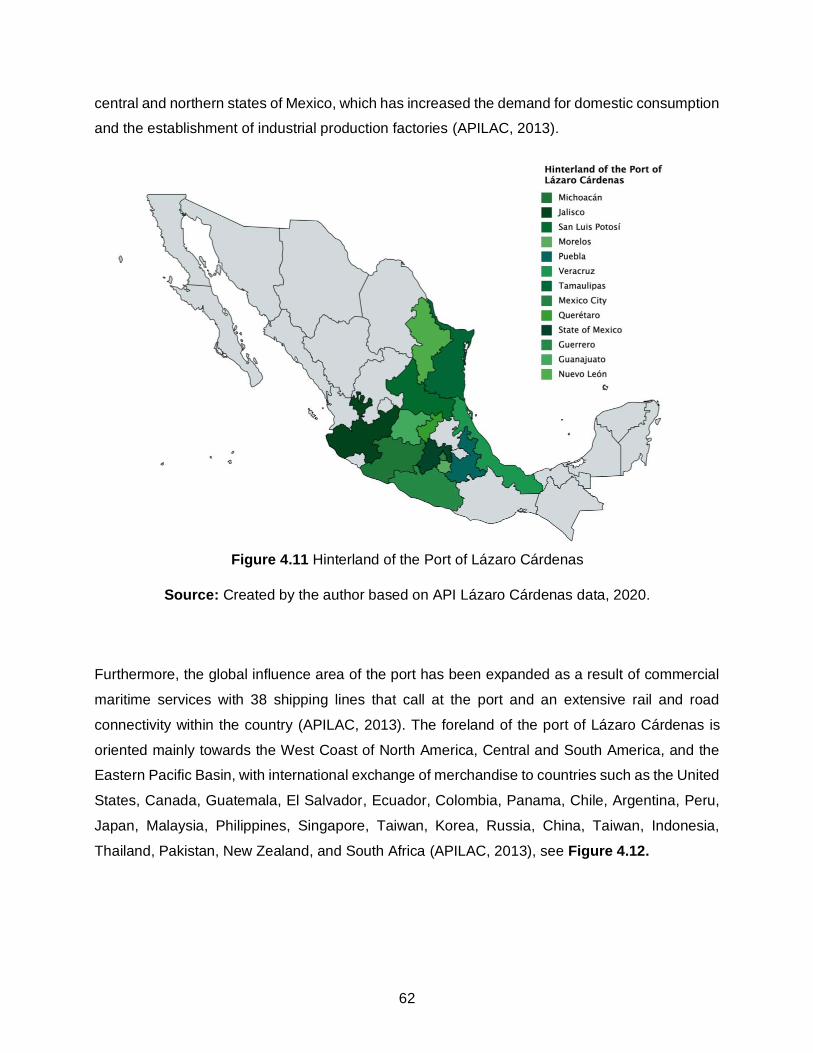
62
central and northern states of Mexico, which has increased the demand for domestic consumption
and the establishment of industrial production factories (APILAC, 2013).
Figure 4.11 Hinterland of the Port of Lázaro Cárdenas
Source: Created by the author based on API Lázaro Cárdenas data, 2020.
Furthermore, the global influence area of the port has been expanded as a result of commercial
maritime services with 38 shipping lines that call at the port and an extensive rail and road
connectivity within the country (APILAC, 2013). The foreland of the port of Lázaro Cárdenas is
oriented mainly towards the West Coast of North America, Central and South America, and the
Eastern Pacific Basin, with international exchange of merchandise to countries such as the United
States, Canada, Guatemala, El Salvador, Ecuador, Colombia, Panama, Chile, Argentina, Peru,
Japan, Malaysia, Philippines, Singapore, Taiwan, Korea, Russia, China, Taiwan, Indonesia,
Thailand, Pakistan, New Zealand, and South Africa (APILAC, 2013), see Figure 4.12.
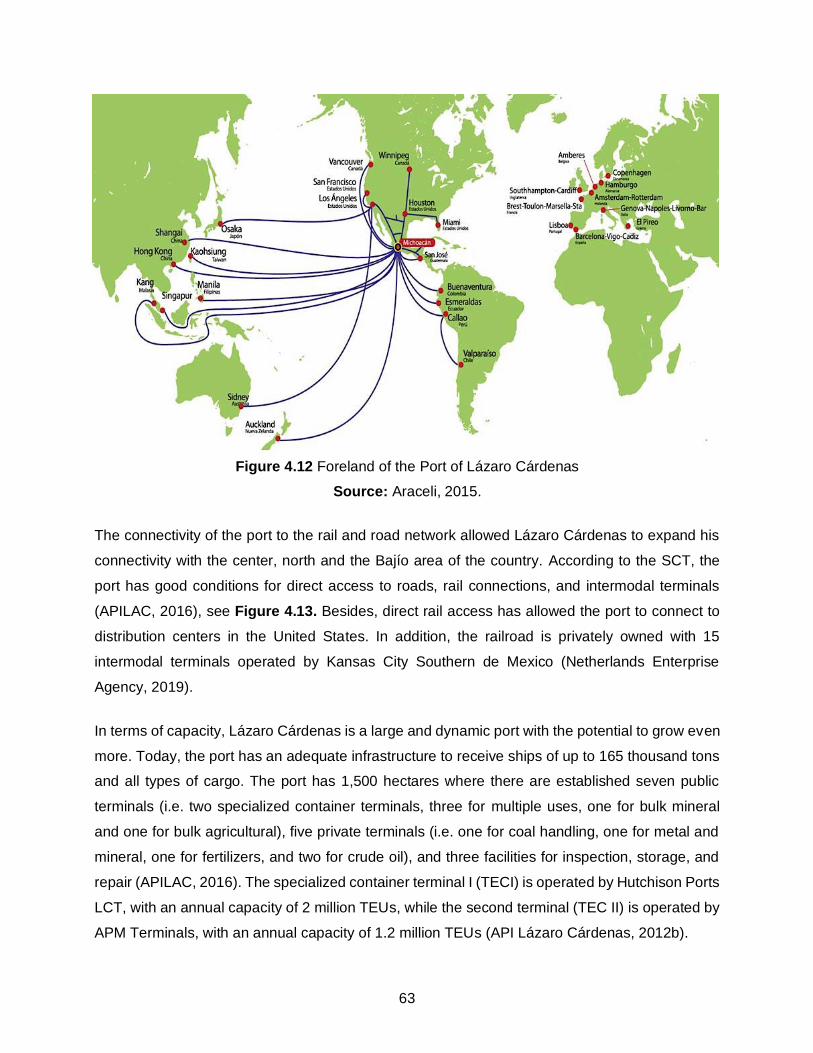
63
Figure 4.12 Foreland of the Port of Lázaro Cárdenas
Source: Araceli, 2015.
The connectivity of the port to the rail and road network allowed Lázaro Cárdenas to expand his
connectivity with the center, north and the Bajío area of the country. According to the SCT, the
port has good conditions for direct access to roads, rail connections, and intermodal terminals
(APILAC, 2016), see Figure 4.13. Besides, direct rail access has allowed the port to connect to
distribution centers in the United States. In addition, the railroad is privately owned with 15
intermodal terminals operated by Kansas City Southern de Mexico (Netherlands Enterprise
Agency, 2019).
In terms of capacity, Lázaro Cárdenas is a large and dynamic port with the potential to grow even
more. Today, the port has an adequate infrastructure to receive ships of up to 165 thousand tons
and all types of cargo. The port has 1,500 hectares where there are established seven public
terminals (i.e. two specialized container terminals, three for multiple uses, one for bulk mineral
and one for bulk agricultural), five private terminals (i.e. one for coal handling, one for metal and
mineral, one for fertilizers, and two for crude oil), and three facilities for inspection, storage, and
repair (APILAC, 2016). The specialized container terminal I (TECI) is operated by Hutchison Ports
LCT, with an annual capacity of 2 million TEUs, while the second terminal (TEC II) is operated by
APM Terminals, with an annual capacity of 1.2 million TEUs (API Lázaro Cárdenas, 2012b).
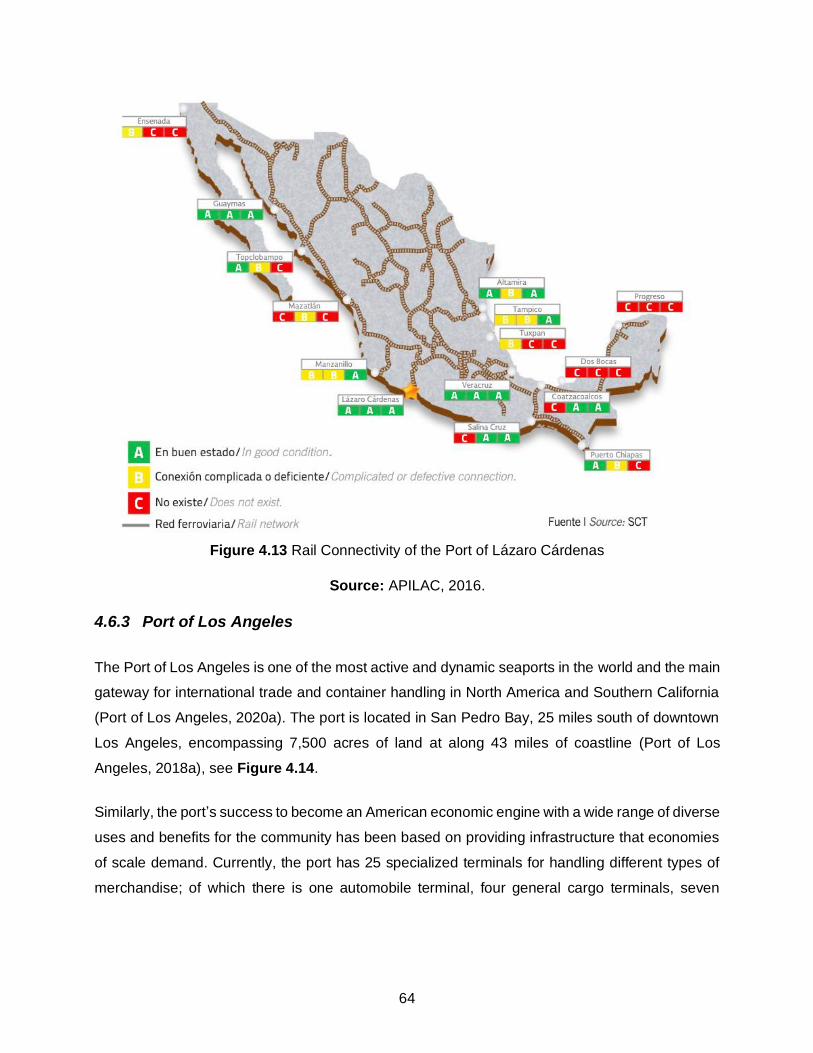
64
Figure 4.13 Rail Connectivity of the Port of Lázaro Cárdenas
Source: APILAC, 2016.
4.6.3 Port of Los Angeles
The Port of Los Angeles is one of the most active and dynamic seaports in the world and the main
gateway for international trade and container handling in North America and Southern California
(Port of Los Angeles, 2020a). The port is located in San Pedro Bay, 25 miles south of downtown
Los Angeles, encompassing 7,500 acres of land at along 43 miles of coastline (Port of Los
Angeles, 2018a), see Figure 4.14.
Similarly, the port’s success to become an American economic engine with a wide range of diverse
uses and benefits for the community has been based on providing infrastructure that economies
of scale demand. Currently, the port has 25 specialized terminals for handling different types of
merchandise; of which there is one automobile terminal, four general cargo terminals, seven
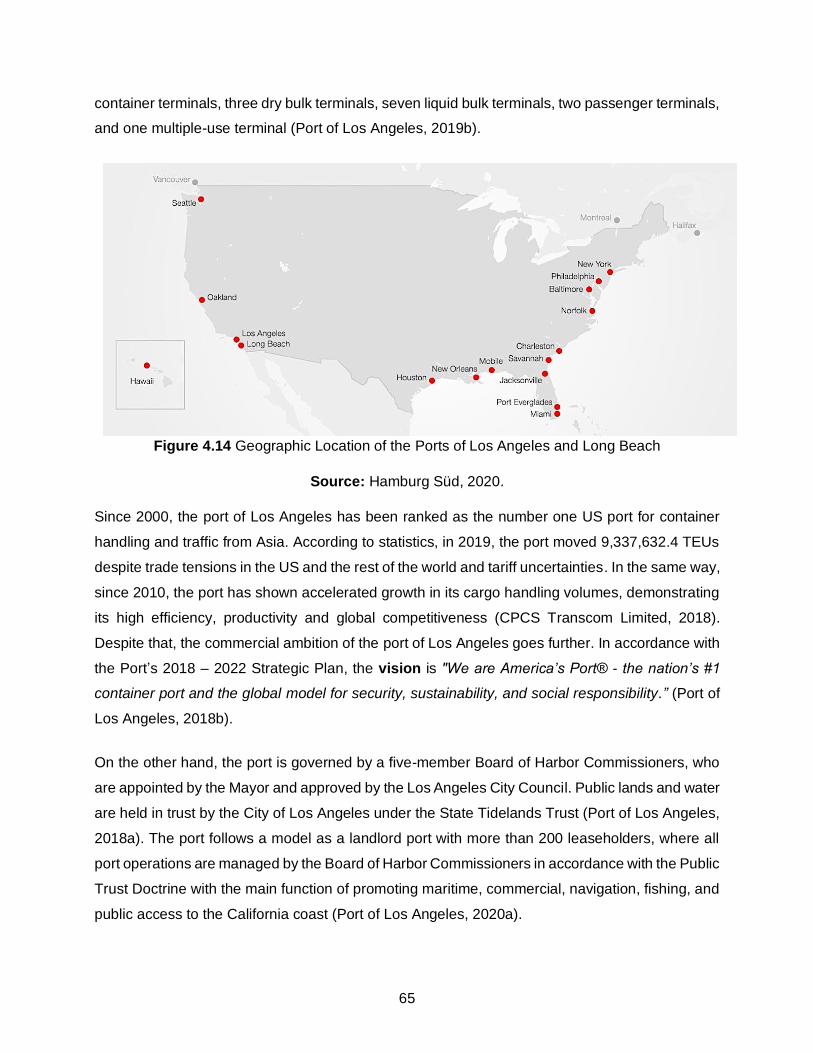
65
container terminals, three dry bulk terminals, seven liquid bulk terminals, two passenger terminals,
and one multiple-use terminal (Port of Los Angeles, 2019b).
Figure 4.14 Geographic Location of the Ports of Los Angeles and Long Beach
Source: Hamburg Süd, 2020.
Since 2000, the port of Los Angeles has been ranked as the number one US port for container
handling and traffic from Asia. According to statistics, in 2019, the port moved 9,337,632.4 TEUs
despite trade tensions in the US and the rest of the world and tariff uncertainties. In the same way,
since 2010, the port has shown accelerated growth in its cargo handling volumes, demonstrating
its high efficiency, productivity and global competitiveness (CPCS Transcom Limited, 2018).
Despite that, the commercial ambition of the port of Los Angeles goes further. In accordance with
the Port’s 2018 – 2022 Strategic Plan, the vision is "We are America’s Port® - the nation’s #1
container port and the global model for security, sustainability, and social responsibility.” (Port of
Los Angeles, 2018b).
On the other hand, the port is governed by a five-member Board of Harbor Commissioners, who
are appointed by the Mayor and approved by the Los Angeles City Council. Public lands and water
are held in trust by the City of Los Angeles under the State Tidelands Trust (Port of Los Angeles,
2018a). The port follows a model as a landlord port with more than 200 leaseholders, where all
port operations are managed by the Board of Harbor Commissioners in accordance with the Public
Trust Doctrine with the main function of promoting maritime, commercial, navigation, fishing, and
public access to the California coast (Port of Los Angeles, 2020a).
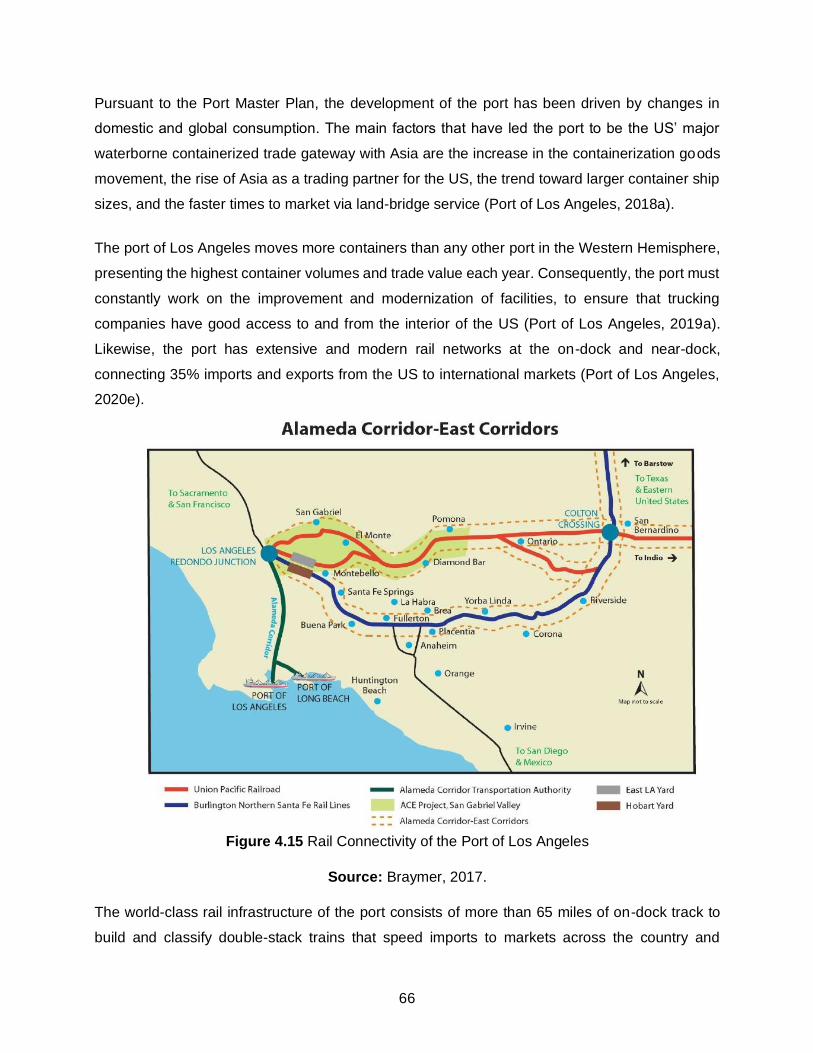
66
Pursuant to the Port Master Plan, the development of the port has been driven by changes in
domestic and global consumption. The main factors that have led the port to be the US’ major
waterborne containerized trade gateway with Asia are the increase in the containerization goods
movement, the rise of Asia as a trading partner for the US, the trend toward larger container ship
sizes, and the faster times to market via land-bridge service (Port of Los Angeles, 2018a).
The port of Los Angeles moves more containers than any other port in the Western Hemisphere,
presenting the highest container volumes and trade value each year. Consequently, the port must
constantly work on the improvement and modernization of facilities, to ensure that trucking
companies have good access to and from the interior of the US (Port of Los Angeles, 2019a).
Likewise, the port has extensive and modern rail networks at the on-dock and near-dock,
connecting 35% imports and exports from the US to international markets (Port of Los Angeles,
2020e).
Figure 4.15 Rail Connectivity of the Port of Los Angeles
Source: Braymer, 2017.
The world-class rail infrastructure of the port consists of more than 65 miles of on-dock track to
build and classify double-stack trains that speed imports to markets across the country and
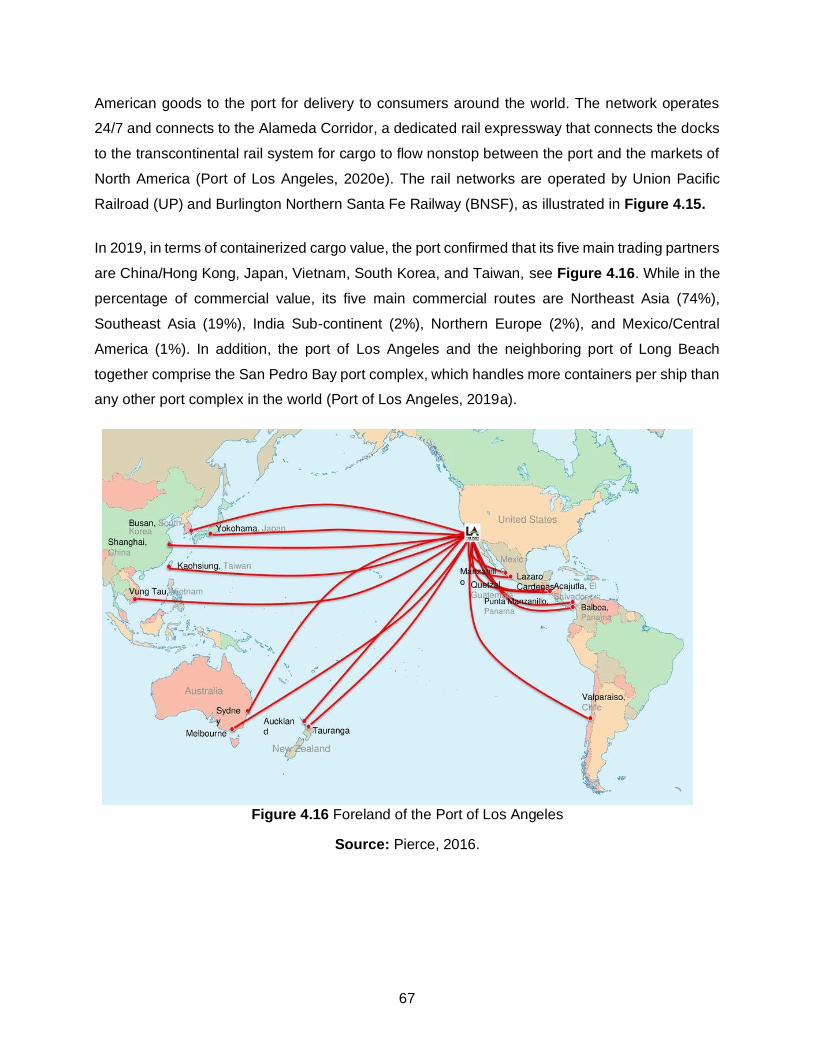
67
American goods to the port for delivery to consumers around the world. The network operates
24/7 and connects to the Alameda Corridor, a dedicated rail expressway that connects the docks
to the transcontinental rail system for cargo to flow nonstop between the port and the markets of
North America (Port of Los Angeles, 2020e). The rail networks are operated by Union Pacific
Railroad (UP) and Burlington Northern Santa Fe Railway (BNSF), as illustrated in Figure 4.15.
In 2019, in terms of containerized cargo value, the port confirmed that its five main trading partners
are China/Hong Kong, Japan, Vietnam, South Korea, and Taiwan, see Figure 4.16. While in the
percentage of commercial value, its five main commercial routes are Northeast Asia (74%),
Southeast Asia (19%), India Sub-continent (2%), Northern Europe (2%), and Mexico/Central
America (1%). In addition, the port of Los Angeles and the neighboring port of Long Beach
together comprise the San Pedro Bay port complex, which handles more containers per ship than
any other port complex in the world (Port of Los Angeles, 2019a).
Figure 4.16 Foreland of the Port of Los Angeles
Source: Pierce, 2016.
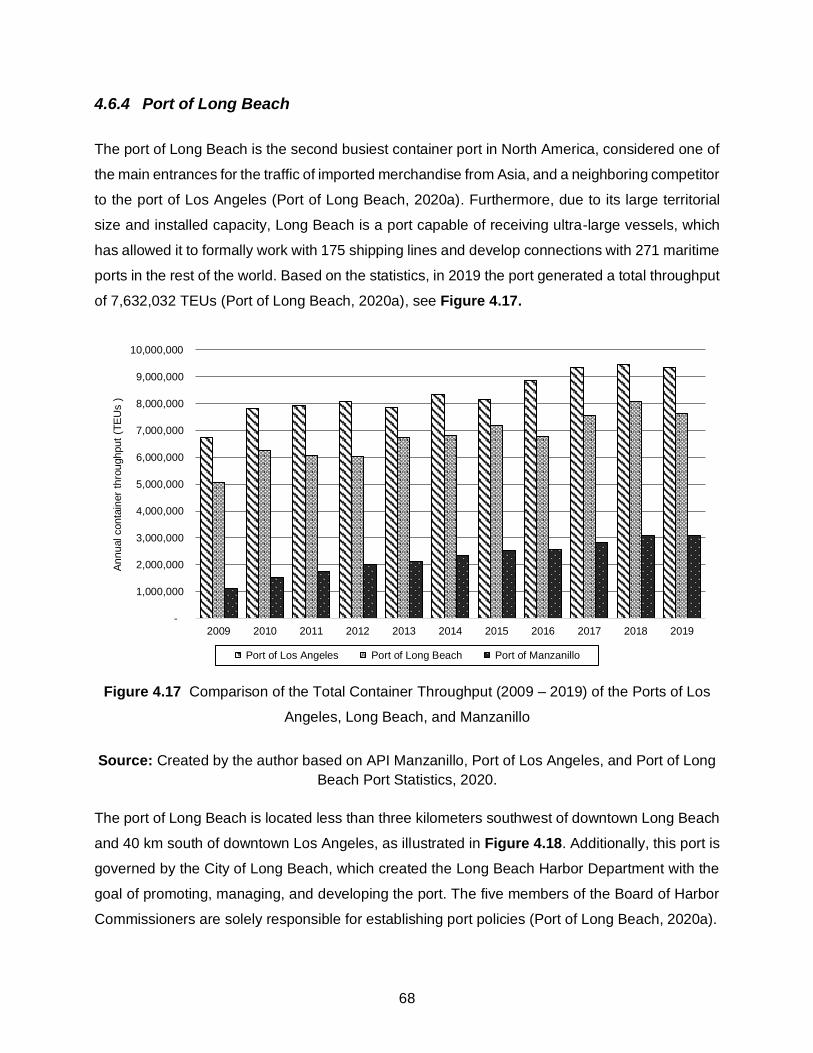
68
4.6.4 Port of Long Beach
The port of Long Beach is the second busiest container port in North America, considered one of
the main entrances for the traffic of imported merchandise from Asia, and a neighboring competitor
to the port of Los Angeles (Port of Long Beach, 2020a). Furthermore, due to its large territorial
size and installed capacity, Long Beach is a port capable of receiving ultra-large vessels, which
has allowed it to formally work with 175 shipping lines and develop connections with 271 maritime
ports in the rest of the world. Based on the statistics, in 2019 the port generated a total throughput
of 7,632,032 TEUs (Port of Long Beach, 2020a), see Figure 4.17.
Figure 4.17 Comparison of the Total Container Throughput (2009 – 2019) of the Ports of Los
Angeles, Long Beach, and Manzanillo
Source: Created by the author based on API Manzanillo, Port of Los Angeles, and Port of Long
Beach Port Statistics, 2020.
The port of Long Beach is located less than three kilometers southwest of downtown Long Beach
and 40 km south of downtown Los Angeles, as illustrated in Figure 4.18. Additionally, this port is
governed by the City of Long Beach, which created the Long Beach Harbor Department with the
goal of promoting, managing, and developing the port. The five members of the Board of Harbor
Commissioners are solely responsible for establishing port policies (Port of Long Beach, 2020a).
-
1,000,000
2,000,000
3,000,000
4,000,000
5,000,000
6,000,000
7,000,000
8,000,000
9,000,000
10,000,000
2009 2010 2011 2012 2013 2014 2015 2016 2017 2018 2019
An
nu
al con
tain
er
thro
ugh
pu
t (T
EU
s )
Port of Los Angeles Port of Long Beach Port of Manzanillo
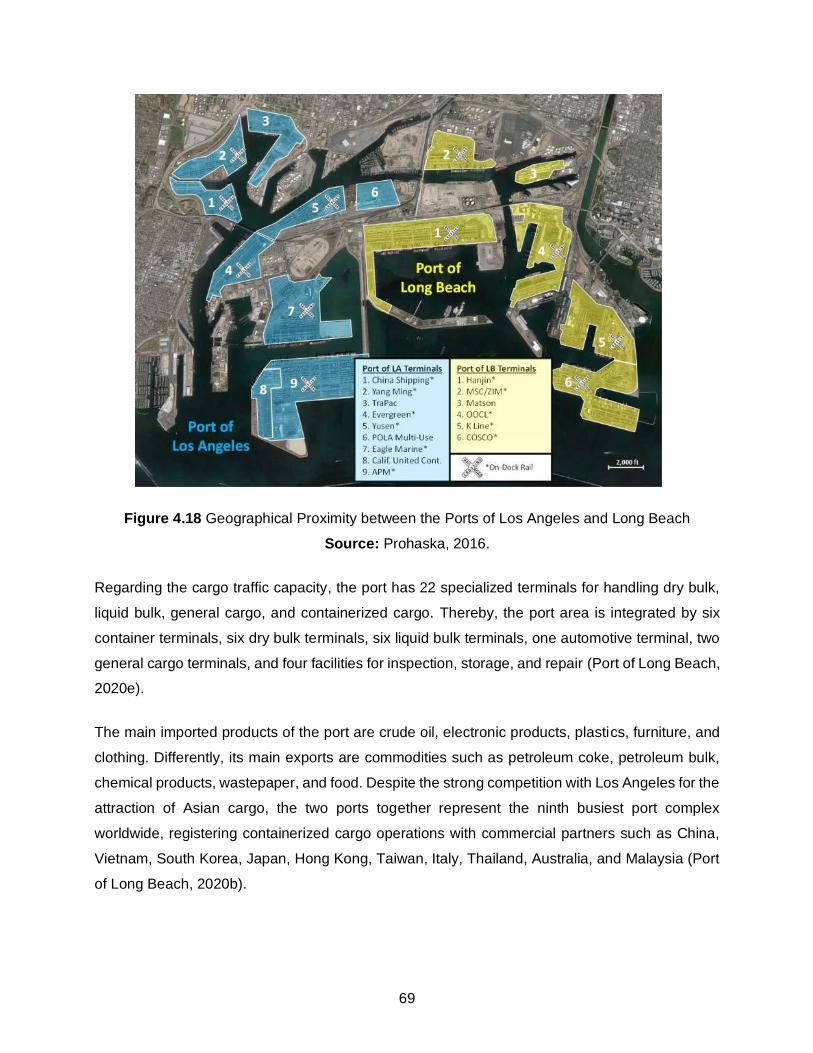
69
Figure 4.18 Geographical Proximity between the Ports of Los Angeles and Long Beach
Source: Prohaska, 2016.
Regarding the cargo traffic capacity, the port has 22 specialized terminals for handling dry bulk,
liquid bulk, general cargo, and containerized cargo. Thereby, the port area is integrated by six
container terminals, six dry bulk terminals, six liquid bulk terminals, one automotive terminal, two
general cargo terminals, and four facilities for inspection, storage, and repair (Port of Long Beach,
2020e).
The main imported products of the port are crude oil, electronic products, plastics, furniture, and
clothing. Differently, its main exports are commodities such as petroleum coke, petroleum bulk,
chemical products, wastepaper, and food. Despite the strong competition with Los Angeles for the
attraction of Asian cargo, the two ports together represent the ninth busiest port complex
worldwide, registering containerized cargo operations with commercial partners such as China,
Vietnam, South Korea, Japan, Hong Kong, Taiwan, Italy, Thailand, Australia, and Malaysia (Port
of Long Beach, 2020b).
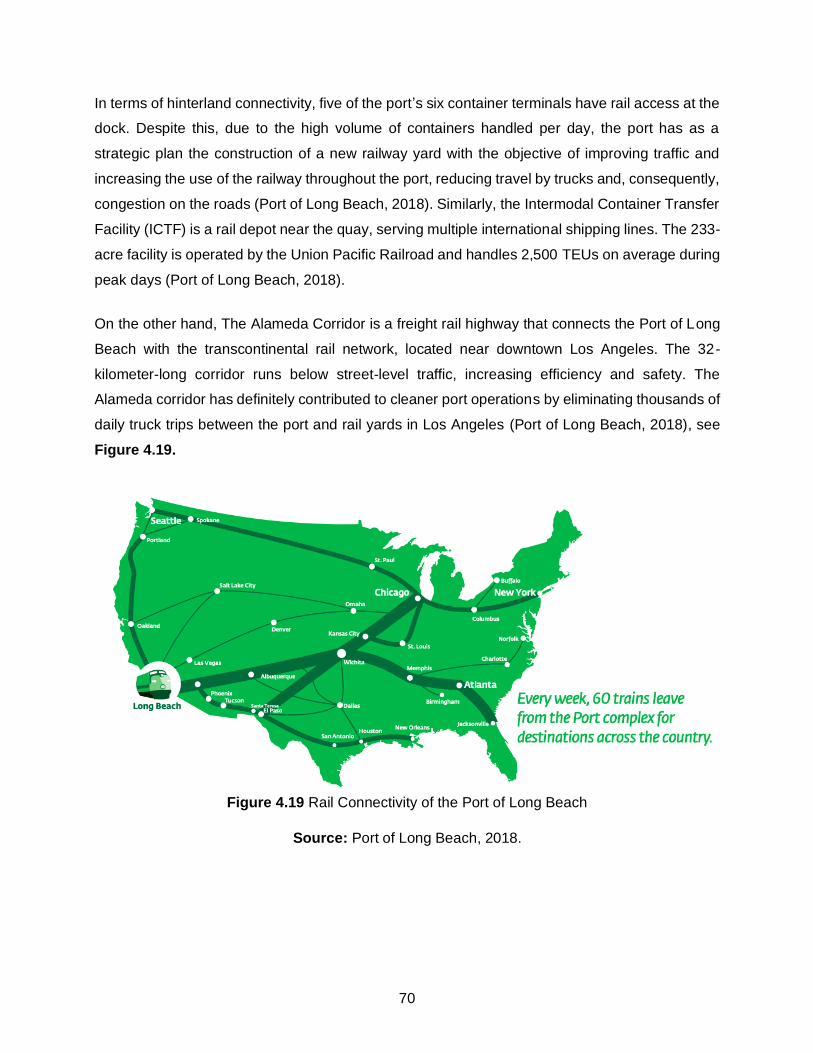
70
In terms of hinterland connectivity, five of the port’s six container terminals have rail access at the
dock. Despite this, due to the high volume of containers handled per day, the port has as a
strategic plan the construction of a new railway yard with the objective of improving traffic and
increasing the use of the railway throughout the port, reducing travel by trucks and, consequently,
congestion on the roads (Port of Long Beach, 2018). Similarly, the Intermodal Container Transfer
Facility (ICTF) is a rail depot near the quay, serving multiple international shipping lines. The 233-
acre facility is operated by the Union Pacific Railroad and handles 2,500 TEUs on average during
peak days (Port of Long Beach, 2018).
On the other hand, The Alameda Corridor is a freight rail highway that connects the Port of Long
Beach with the transcontinental rail network, located near downtown Los Angeles. The 32-
kilometer-long corridor runs below street-level traffic, increasing efficiency and safety. The
Alameda corridor has definitely contributed to cleaner port operations by eliminating thousands of
daily truck trips between the port and rail yards in Los Angeles (Port of Long Beach, 2018), see
Figure 4.19.
Figure 4.19 Rail Connectivity of the Port of Long Beach
Source: Port of Long Beach, 2018.
71
4.7 Conclusions of the Chapter
In conclusion, this comparative analysis allows the researcher to identify the most relevant
characteristics of the four maritime ports, in conjunction with the competitive advantages that each
one presents, in relation to the infrastructure conditions for competitiveness and their commercial
strategies. It should be noted that the ports of Manzanillo and Lázaro Cárdenas have increased
their commercial participation for containerized cargo traffic due to the high demand of the
commercial routes of Asia and North America, similarly, this trend has been observed since 2012
when the ports of Manzanillo and Lázaro Cárdenas represented 70% of the total containerized
cargo traffic in Mexico (Rubio Ceja, 2020).
On the other hand, as Notteboom et al. (2012) state, container ports serve as important nodes to
facilitate the efficient flow of containerized cargo, with the function to serve as a gateway port that
acts as an interface between the hinterland and deep-sea routings of containerized cargo, or as a
transshipment port that acts as an interface for the interchange between deep-sea routings of
containerized cargo (Notteboom and Yim Yap, 2012). Given the above, it is concluded that the
port of Manzanillo is a strategic point for the transshipment of containers bound for Central and
South America and the west coast of the United States and Canada. While, Lázaro Cárdenas has
the vocation of being a commercial and industrial port, identifying itself as a strategic point for the
traffic of mineral bulk and containers. Meanwhile, the ports of Los Angeles and Long Beach stand
out as US ports that handle more containers than any other port in the Western Hemisphere, being
the largest commercial gateway to North America. Considering the above, it is concluded that
these two ports serve as gateway ports that acts as an interface between the hinterland and deep-
sea routings of containerized cargo.
Last but not least, regarding the levels of competition, it is concluded that between the port of
Manzanillo and Lázaro Cárdenas is observed an inter-port competition at the operator level, a
competition between operators of both ports, mainly within the same traffic category, i.e.
containers, and dry bulk. Differently, between the ports of Los Angeles, Long Beach, and
Manzanillo an inter-port competition on a port authority level is identified, a competition
between the ports where port authorities primarily pursue to increase the competitive position of
their seaports by providing adequate infrastructure or attracting public investment, optimizing
working conditions, and preventing monopoly activities.
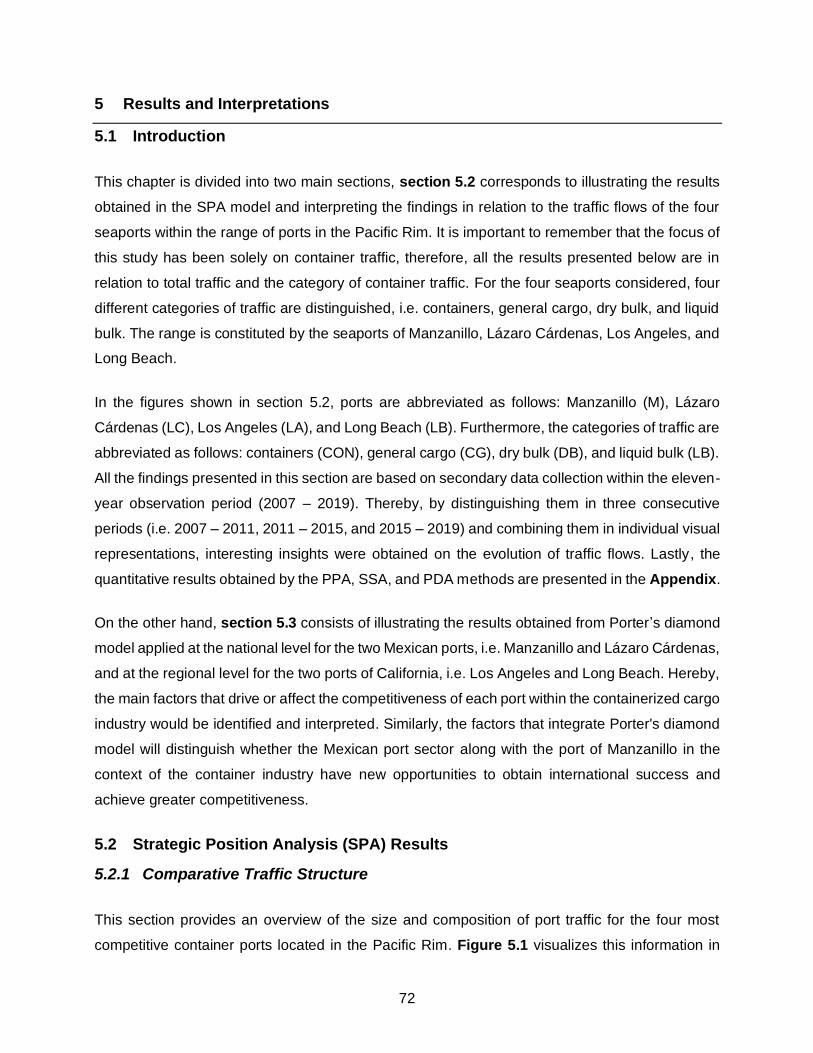
72
5 Results and Interpretations
5.1 Introduction
This chapter is divided into two main sections, section 5.2 corresponds to illustrating the results
obtained in the SPA model and interpreting the findings in relation to the traffic flows of the four
seaports within the range of ports in the Pacific Rim. It is important to remember that the focus of
this study has been solely on container traffic, therefore, all the results presented below are in
relation to total traffic and the category of container traffic. For the four seaports considered, four
different categories of traffic are distinguished, i.e. containers, general cargo, dry bulk, and liquid
bulk. The range is constituted by the seaports of Manzanillo, Lázaro Cárdenas, Los Angeles, and
Long Beach.
In the figures shown in section 5.2, ports are abbreviated as follows: Manzanillo (M), Lázaro
Cárdenas (LC), Los Angeles (LA), and Long Beach (LB). Furthermore, the categories of traffic are
abbreviated as follows: containers (CON), general cargo (CG), dry bulk (DB), and liquid bulk (LB).
All the findings presented in this section are based on secondary data collection within the eleven-
year observation period (2007 – 2019). Thereby, by distinguishing them in three consecutive
periods (i.e. 2007 – 2011, 2011 – 2015, and 2015 – 2019) and combining them in individual visual
representations, interesting insights were obtained on the evolution of traffic flows. Lastly, the
quantitative results obtained by the PPA, SSA, and PDA methods are presented in the Appendix.
On the other hand, section 5.3 consists of illustrating the results obtained from Porter’s diamond
model applied at the national level for the two Mexican ports, i.e. Manzanillo and Lázaro Cárdenas,
and at the regional level for the two ports of California, i.e. Los Angeles and Long Beach. Hereby,
the main factors that drive or affect the competitiveness of each port within the containerized cargo
industry would be identified and interpreted. Similarly, the factors that integrate Porter's diamond
model will distinguish whether the Mexican port sector along with the port of Manzanillo in the
context of the container industry have new opportunities to obtain international success and
achieve greater competitiveness.
5.2 Strategic Position Analysis (SPA) Results
5.2.1 Comparative Traffic Structure
This section provides an overview of the size and composition of port traffic for the four most
competitive container ports located in the Pacific Rim. Figure 5.1 visualizes this information in
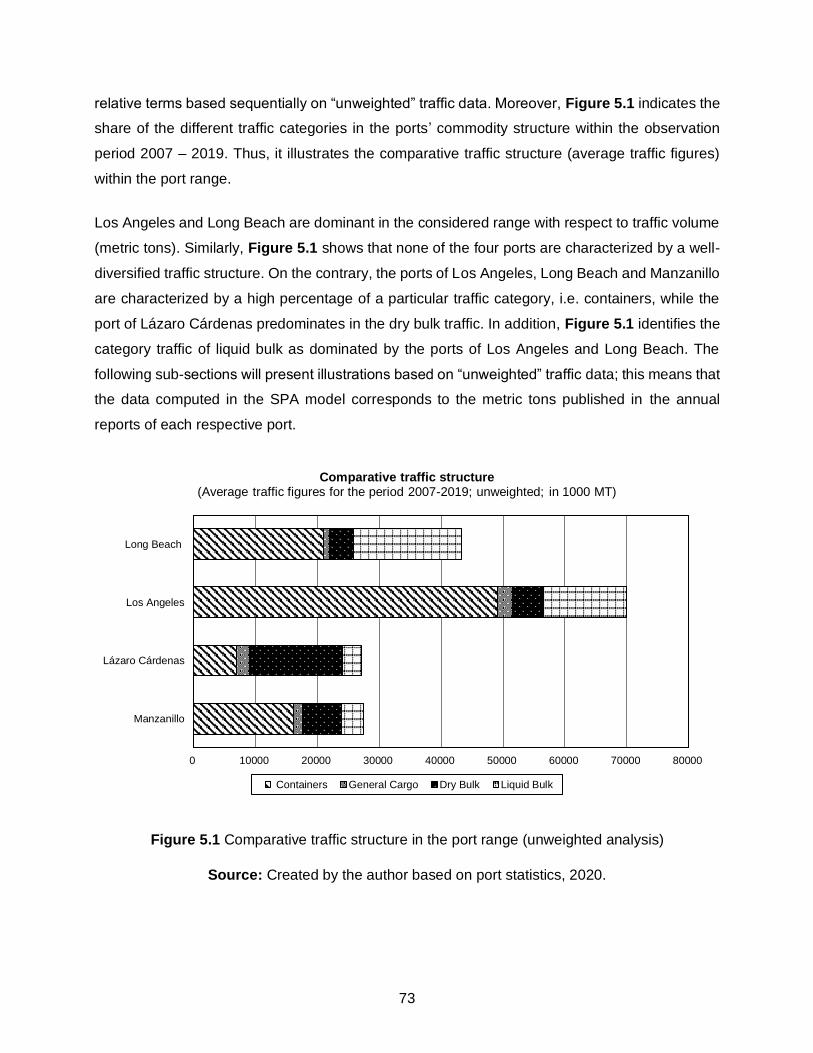
73
relative terms based sequentially on “unweighted” traffic data. Moreover, Figure 5.1 indicates the
share of the different traffic categories in the ports’ commodity structure within the observation
period 2007 – 2019. Thus, it illustrates the comparative traffic structure (average traffic figures)
within the port range.
Los Angeles and Long Beach are dominant in the considered range with respect to traffic volume
(metric tons). Similarly, Figure 5.1 shows that none of the four ports are characterized by a well-
diversified traffic structure. On the contrary, the ports of Los Angeles, Long Beach and Manzanillo
are characterized by a high percentage of a particular traffic category, i.e. containers, while the
port of Lázaro Cárdenas predominates in the dry bulk traffic. In addition, Figure 5.1 identifies the
category traffic of liquid bulk as dominated by the ports of Los Angeles and Long Beach. The
following sub-sections will present illustrations based on “unweighted” traffic data; this means that
the data computed in the SPA model corresponds to the metric tons published in the annual
reports of each respective port.
Figure 5.1 Comparative traffic structure in the port range (unweighted analysis)
Source: Created by the author based on port statistics, 2020.
0 10000 20000 30000 40000 50000 60000 70000 80000
Manzanillo
Lázaro Cárdenas
Los Angeles
Long Beach
Comparative traffic structure(Average traffic figures for the period 2007-2019; unweighted; in 1000 MT)
Containers General Cargo Dry Bulk Liquid Bulk
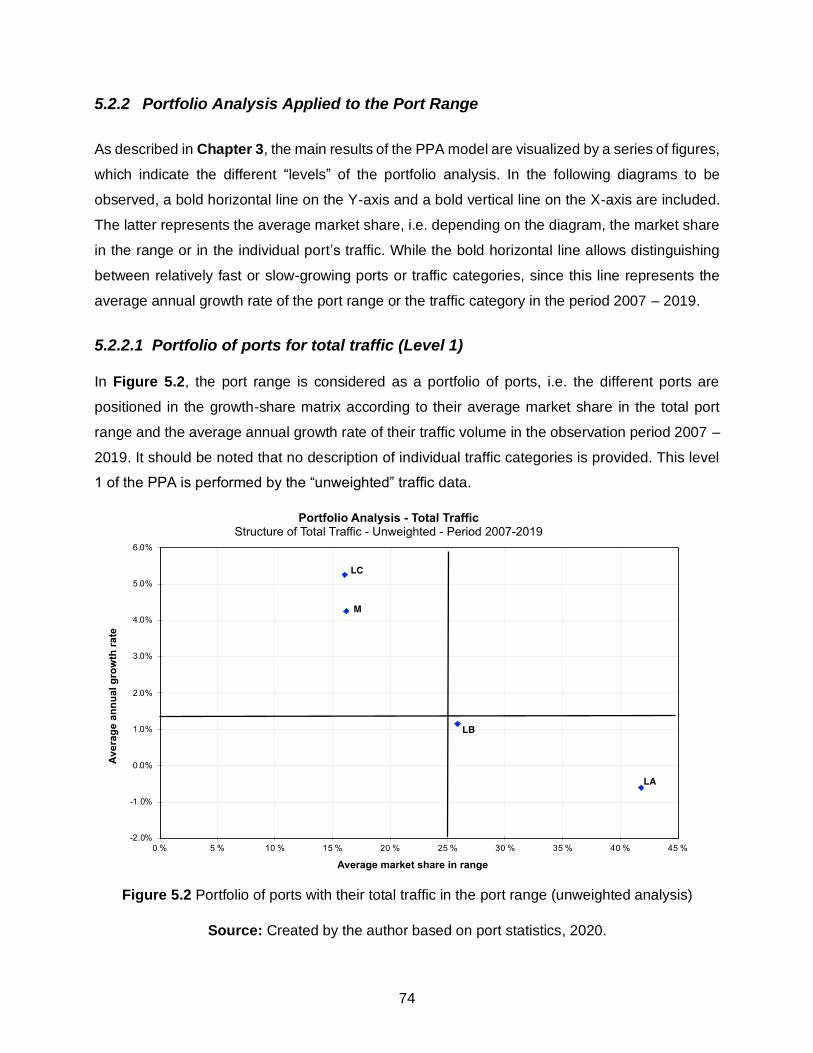
74
5.2.2 Portfolio Analysis Applied to the Port Range
As described in Chapter 3, the main results of the PPA model are visualized by a series of figures,
which indicate the different “levels” of the portfolio analysis. In the following diagrams to be
observed, a bold horizontal line on the Y-axis and a bold vertical line on the X-axis are included.
The latter represents the average market share, i.e. depending on the diagram, the market share
in the range or in the individual port’s traffic. While the bold horizontal line allows distinguishing
between relatively fast or slow-growing ports or traffic categories, since this line represents the
average annual growth rate of the port range or the traffic category in the period 2007 – 2019.
5.2.2.1 Portfolio of ports for total traffic (Level 1)
In Figure 5.2, the port range is considered as a portfolio of ports, i.e. the different ports are
positioned in the growth-share matrix according to their average market share in the total port
range and the average annual growth rate of their traffic volume in the observation period 2007 –
2019. It should be noted that no description of individual traffic categories is provided. This level
1 of the PPA is performed by the “unweighted” traffic data.
Figure 5.2 Portfolio of ports with their total traffic in the port range (unweighted analysis)
Source: Created by the author based on port statistics, 2020.
75
In this first level, under the “unweighted” analysis and the period 2007 – 2019, the average annual
growth rate in the port range reached 1.39%, see Figure 5.2. The annual growth rate has been
negative for the port of Los Angeles, while the ports of Manzanillo, Lázaro Cárdenas, and Long
Beach show a positive annual growth rate. On the other hand, only the ports of Manzanillo and
Lázaro Cárdenas are positioned as “High Potential”. Although the ports of Los Angeles and Long
Beach have a dominant position with a market share of 41.85% (LA) and 25.84% (LB), these ports
grew at a slower rate than the range as a whole and, therefore, they can be considered a “Mature
Leader” in the conventional BCG classification.
5.2.2.2 Portfolio of traffic categories for individual seaports (Level 2)
Figures 5.3, 5.4, 5.5, and 5.6 illustrate the PPA of the individual port traffic structure of the ports
of Manzanillo, Lázaro Cárdenas, Los Angeles, and Long Beach for “unweighted” total traffic data.
The four ports were selected for the visualization of this second level of the PPA since all the ports
presented a good performance in terms of the variable of the container category (i.e. the main
purpose of this multiple case study). However, the volume of traffic from individual seaports is
considered as a portfolio of four categories of traffic, i.e. containers, general cargo, dry bulk, and
liquid bulk. The relative participation of each category in the total traffic of the four ports (X-axis)
is related to their respective growth rate (Y-axis).
Figure 5.3 Traffic structure of the Port of Manzanillo (2007 – 2019) Source: Created by the author based on port statistics, 2020.
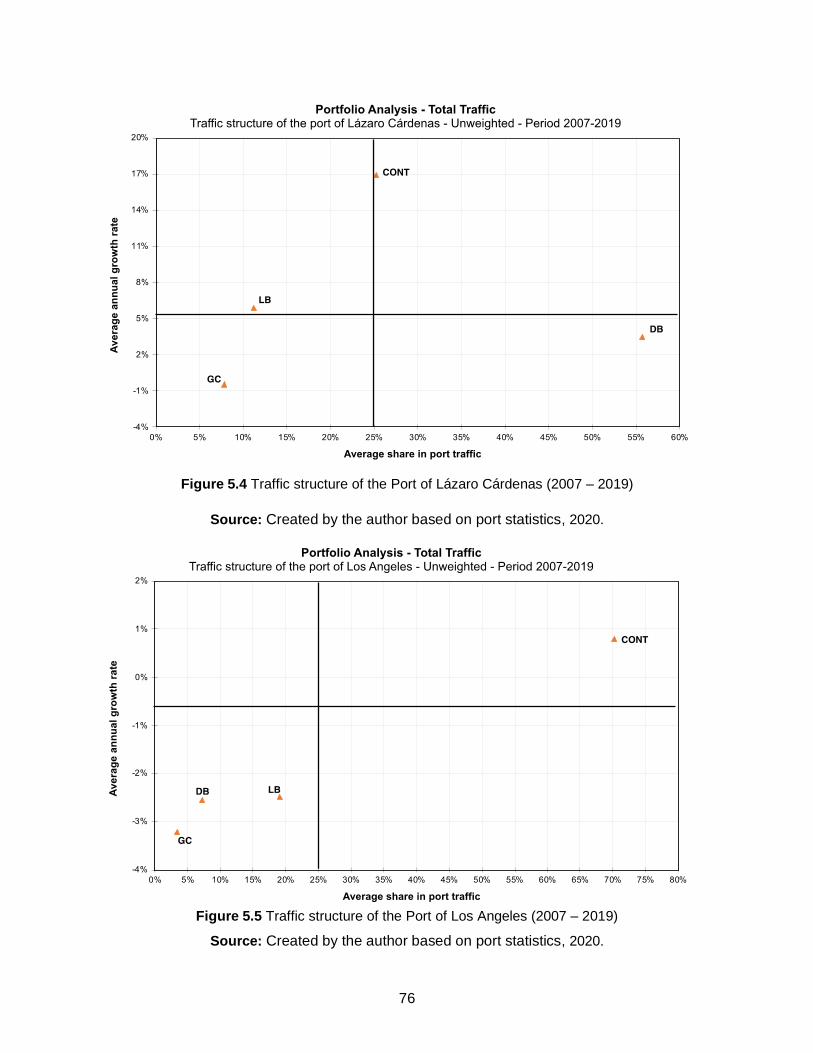
76
Figure 5.4 Traffic structure of the Port of Lázaro Cárdenas (2007 – 2019)
Source: Created by the author based on port statistics, 2020.
Figure 5.5 Traffic structure of the Port of Los Angeles (2007 – 2019)
Source: Created by the author based on port statistics, 2020.
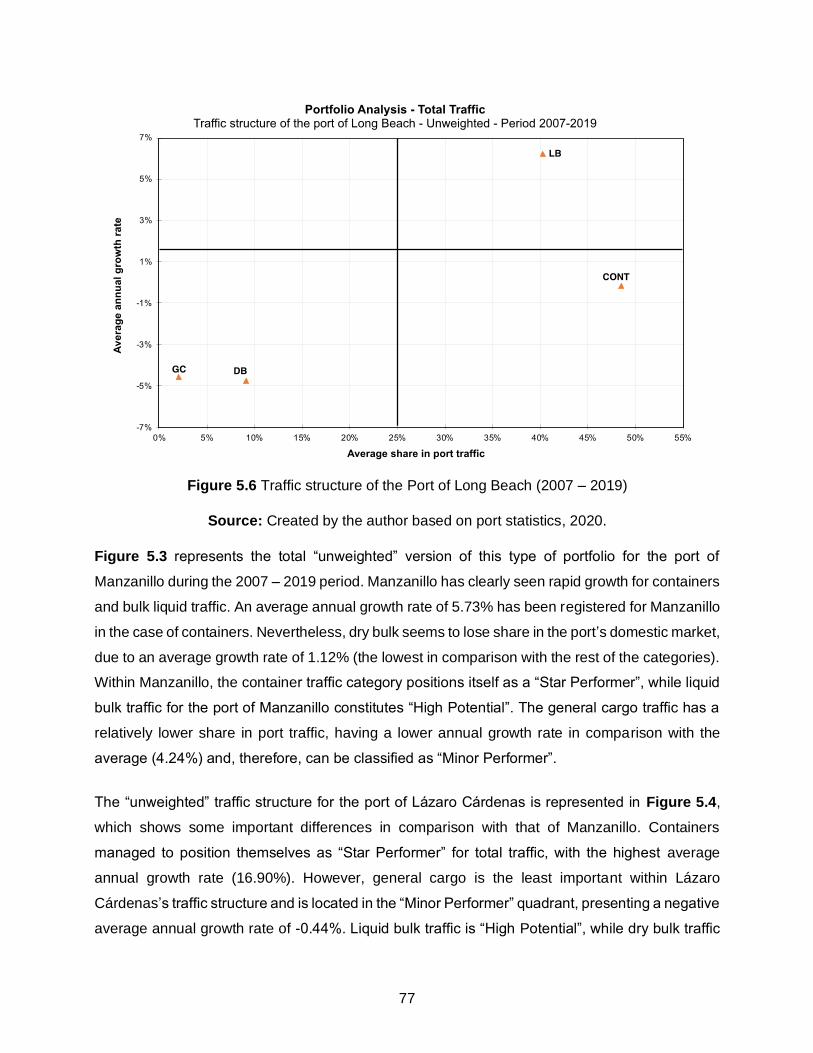
77
Figure 5.6 Traffic structure of the Port of Long Beach (2007 – 2019)
Source: Created by the author based on port statistics, 2020.
Figure 5.3 represents the total “unweighted” version of this type of portfolio for the port of
Manzanillo during the 2007 – 2019 period. Manzanillo has clearly seen rapid growth for containers
and bulk liquid traffic. An average annual growth rate of 5.73% has been registered for Manzanillo
in the case of containers. Nevertheless, dry bulk seems to lose share in the port’s domestic market,
due to an average growth rate of 1.12% (the lowest in comparison with the rest of the categories).
Within Manzanillo, the container traffic category positions itself as a “Star Performer”, while liquid
bulk traffic for the port of Manzanillo constitutes “High Potential”. The general cargo traffic has a
relatively lower share in port traffic, having a lower annual growth rate in comparison with the
average (4.24%) and, therefore, can be classified as “Minor Performer”.
The “unweighted” traffic structure for the port of Lázaro Cárdenas is represented in Figure 5.4,
which shows some important differences in comparison with that of Manzanillo. Containers
managed to position themselves as “Star Performer” for total traffic, with the highest average
annual growth rate (16.90%). However, general cargo is the least important within Lázaro
Cárdenas’s traffic structure and is located in the “Minor Performer” quadrant, presenting a negative
average annual growth rate of -0.44%. Liquid bulk traffic is “High Potential”, while dry bulk traffic
78
is the category with the highest average of market share (55.71%) but a low average annual
growth rate (3.44%) compared to traffic of containers, positioning the dry bulk category as “Mature
Leader” within the port.
Meanwhile, Figure 5.5 represents the total “unweighted” version of this type of portfolio for the
port of Los Angeles during the 2007 – 2019 period. Los Angeles has clearly seen steady growth
for container traffic, with an average annual growth rate 0.80%. General cargo, however, seems
to lose almost completely share in the port’s domestic market, due to a negative average growth
rate of -3.22%. Within Los Angeles, no traffic category positions itself as a “High Potential”, while
containers are the only category positioned in the “Star Performer” quadrant. The dry bulk and
liquid bulk categories have the closest average market share percentage to the average, however,
both categories along with the general cargo show a negative average annual growth rate,
positioning themselves as “Minor Performer” within the port.
Last but not least, Figure 5.6 corresponds to the total “unweighted” version of this level of the
portfolio for the port of Long Beach. In this port, totally different evolution can be observed from
the rest of the ports, this is mainly due to the fact that Long Beach is the only port where the
container traffic category is not positioned in the “Star Performer” quadrant, but rather in “Mature
Leader”, the main reason is due to its high average percentage of market share, but its average
annual growth rate is negative (-0.15%). Differently, the liquid bulk traffic category is positioned as
“Star Performer” within the port, along with an average annual growth rate of 6.25%. General
cargo and dry bulk, nevertheless, appear to lose internal market share in the port, due to their
negative average growth rate of -4.57% and -4.76%, positioning themselves as “Minor Performer”
within the port.
5.2.2.3 Portfolio of ports for individual traffic category (Level 3)
The results of the third level of the PPA are graphically illustrated in Figure 5.7. The four seaports
are now analyzed as a portfolio of ports for specific product groups. Here, the competitive position
of individual ports in the range is evaluated by the traffic category. For the purpose and general
focus of the study, the category of container traffic was selected for a more detailed description in
this chapter.
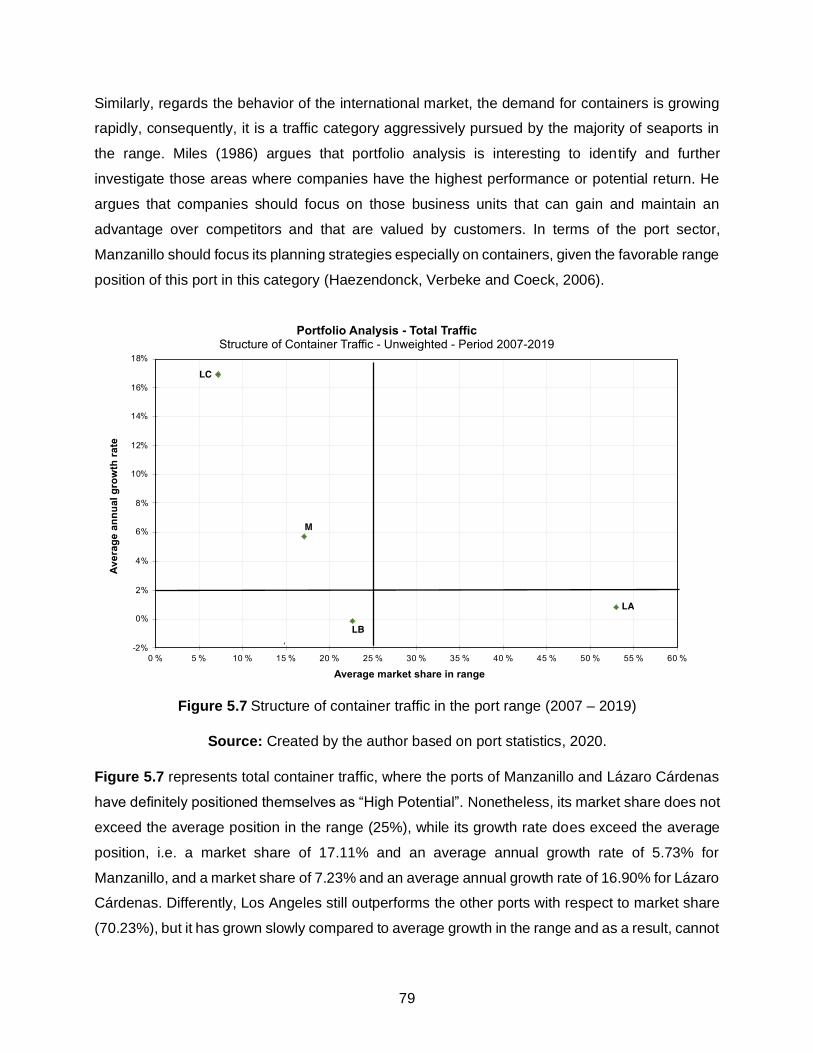
79
Similarly, regards the behavior of the international market, the demand for containers is growing
rapidly, consequently, it is a traffic category aggressively pursued by the majority of seaports in
the range. Miles (1986) argues that portfolio analysis is interesting to identify and further
investigate those areas where companies have the highest performance or potential return. He
argues that companies should focus on those business units that can gain and maintain an
advantage over competitors and that are valued by customers. In terms of the port sector,
Manzanillo should focus its planning strategies especially on containers, given the favorable range
position of this port in this category (Haezendonck, Verbeke and Coeck, 2006).
Figure 5.7 Structure of container traffic in the port range (2007 – 2019)
Source: Created by the author based on port statistics, 2020.
Figure 5.7 represents total container traffic, where the ports of Manzanillo and Lázaro Cárdenas
have definitely positioned themselves as “High Potential”. Nonetheless, its market share does not
exceed the average position in the range (25%), while its growth rate does exceed the average
position, i.e. a market share of 17.11% and an average annual growth rate of 5.73% for
Manzanillo, and a market share of 7.23% and an average annual growth rate of 16.90% for Lázaro
Cárdenas. Differently, Los Angeles still outperforms the other ports with respect to market share
(70.23%), but it has grown slowly compared to average growth in the range and as a result, cannot
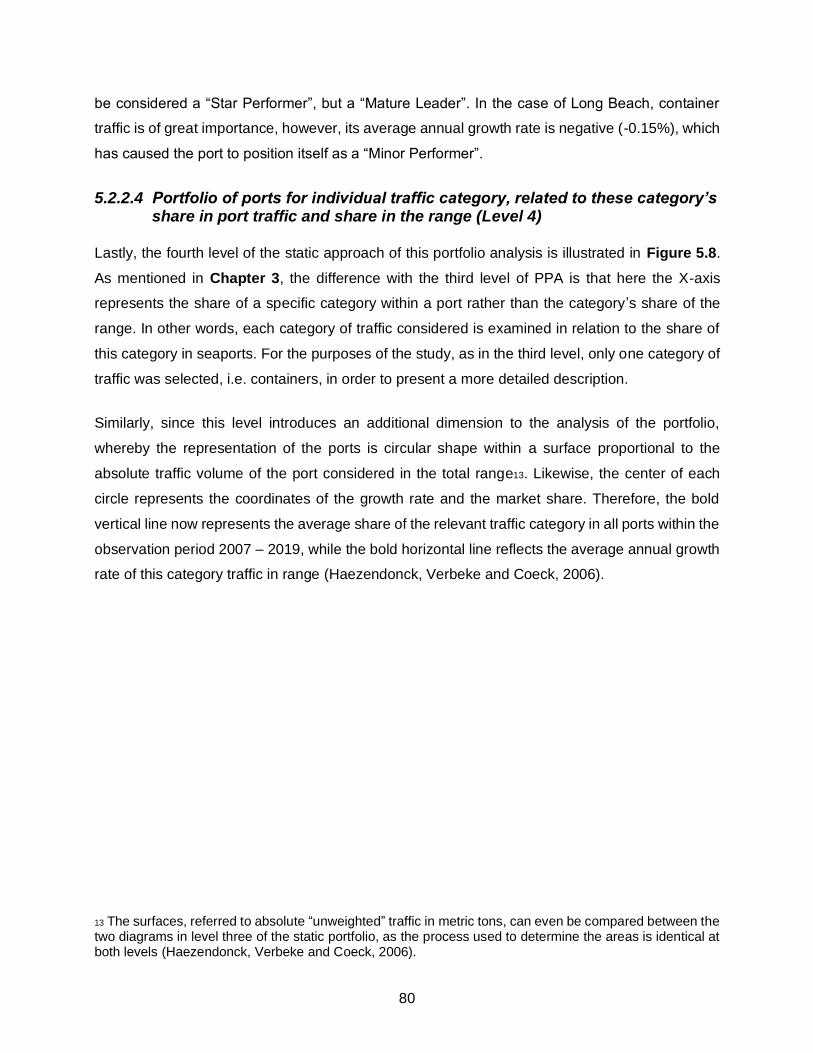
80
be considered a “Star Performer”, but a “Mature Leader”. In the case of Long Beach, container
traffic is of great importance, however, its average annual growth rate is negative (-0.15%), which
has caused the port to position itself as a “Minor Performer”.
5.2.2.4 Portfolio of ports for individual traffic category, related to these category’s share in port traffic and share in the range (Level 4)
Lastly, the fourth level of the static approach of this portfolio analysis is illustrated in Figure 5.8.
As mentioned in Chapter 3, the difference with the third level of PPA is that here the X-axis
represents the share of a specific category within a port rather than the category’s share of the
range. In other words, each category of traffic considered is examined in relation to the share of
this category in seaports. For the purposes of the study, as in the third level, only one category of
traffic was selected, i.e. containers, in order to present a more detailed description.
Similarly, since this level introduces an additional dimension to the analysis of the portfolio,
whereby the representation of the ports is circular shape within a surface proportional to the
absolute traffic volume of the port considered in the total range13. Likewise, the center of each
circle represents the coordinates of the growth rate and the market share. Therefore, the bold
vertical line now represents the average share of the relevant traffic category in all ports within the
observation period 2007 – 2019, while the bold horizontal line reflects the average annual growth
rate of this category traffic in range (Haezendonck, Verbeke and Coeck, 2006).
13 The surfaces, referred to absolute “unweighted” traffic in metric tons, can even be compared between the two diagrams in level three of the static portfolio, as the process used to determine the areas is identical at both levels (Haezendonck, Verbeke and Coeck, 2006).
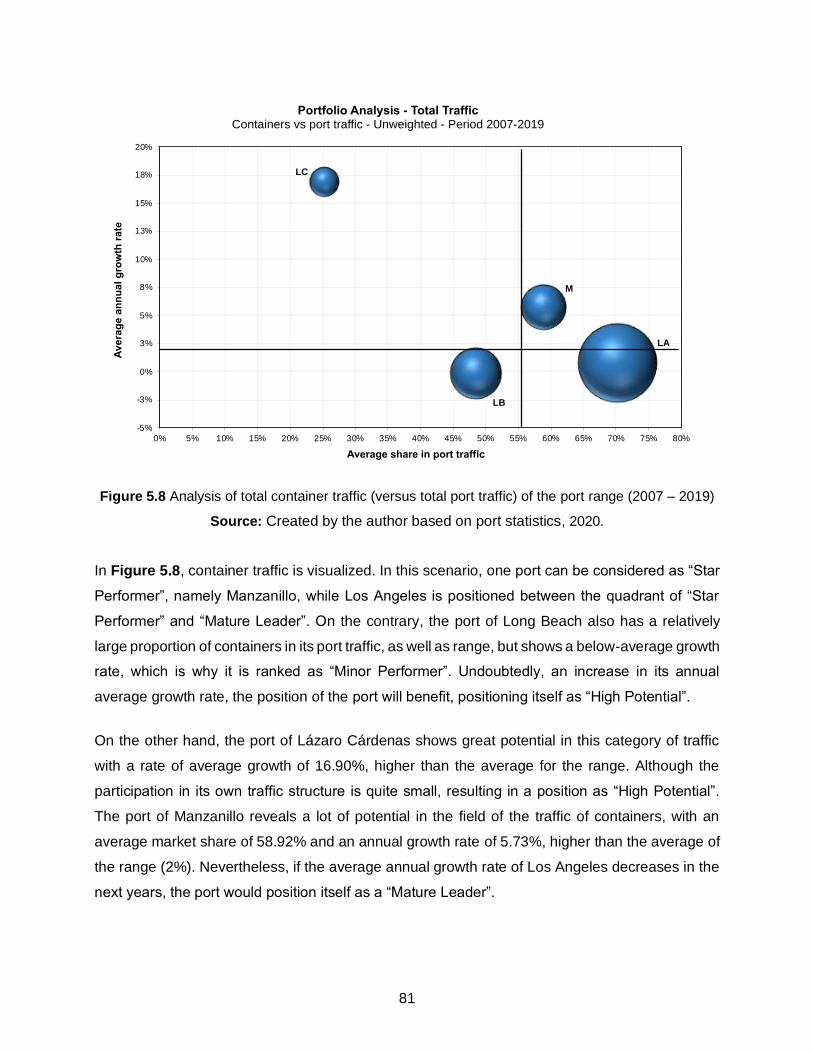
81
Figure 5.8 Analysis of total container traffic (versus total port traffic) of the port range (2007 – 2019)
Source: Created by the author based on port statistics, 2020.
In Figure 5.8, container traffic is visualized. In this scenario, one port can be considered as “Star
Performer”, namely Manzanillo, while Los Angeles is positioned between the quadrant of “Star
Performer” and “Mature Leader”. On the contrary, the port of Long Beach also has a relatively
large proportion of containers in its port traffic, as well as range, but shows a below-average growth
rate, which is why it is ranked as “Minor Performer”. Undoubtedly, an increase in its annual
average growth rate, the position of the port will benefit, positioning itself as “High Potential”.
On the other hand, the port of Lázaro Cárdenas shows great potential in this category of traffic
with a rate of average growth of 16.90%, higher than the average for the range. Although the
participation in its own traffic structure is quite small, resulting in a position as “High Potential”.
The port of Manzanillo reveals a lot of potential in the field of the traffic of containers, with an
average market share of 58.92% and an annual growth rate of 5.73%, higher than the average of
the range (2%). Nevertheless, if the average annual growth rate of Los Angeles decreases in the
next years, the port would position itself as a “Mature Leader”.
-5%
-3%
0%
3%
5%
8%
10%
13%
15%
18%
20%
0% 5% 10% 15% 20% 25% 30% 35% 40% 45% 50% 55% 60% 65% 70% 75% 80%
Av
era
ge a
nn
ua
l g
row
th r
ate
Average share in port traffic
Portfolio Analysis - Total TrafficContainers vs port traffic - Unweighted - Period 2007-2019
LA
M
LB
LC
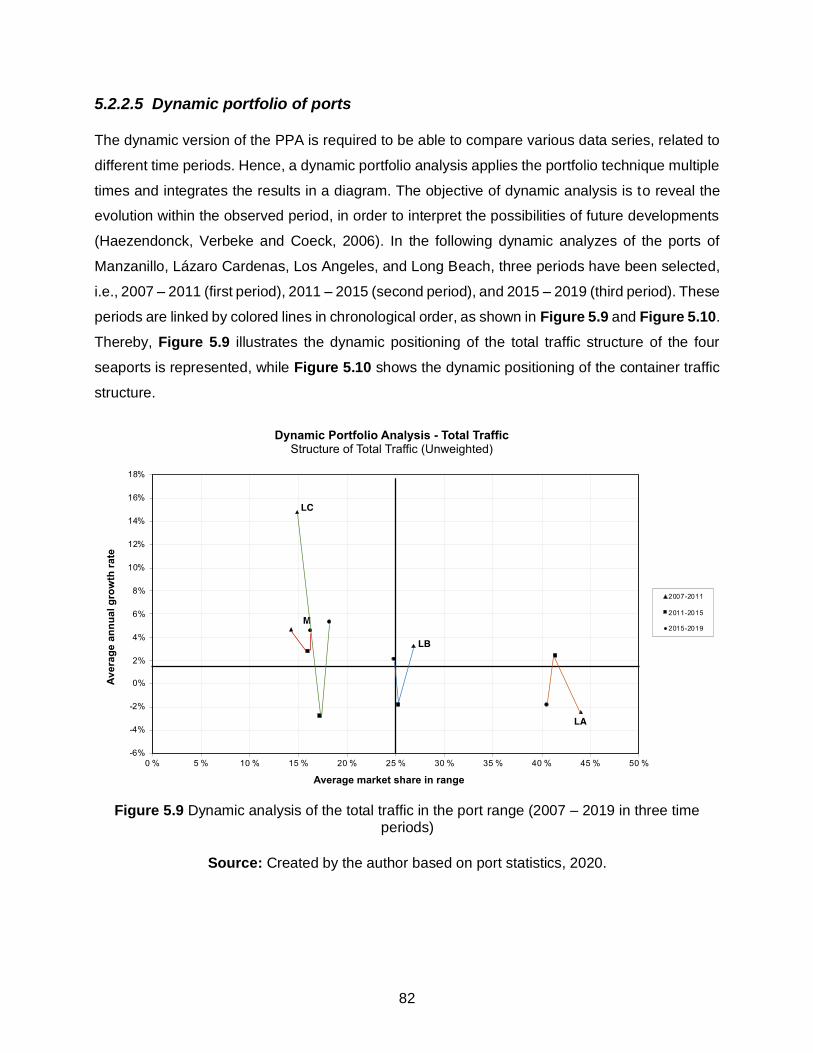
82
5.2.2.5 Dynamic portfolio of ports
The dynamic version of the PPA is required to be able to compare various data series, related to
different time periods. Hence, a dynamic portfolio analysis applies the portfolio technique multiple
times and integrates the results in a diagram. The objective of dynamic analysis is to reveal the
evolution within the observed period, in order to interpret the possibilities of future developments
(Haezendonck, Verbeke and Coeck, 2006). In the following dynamic analyzes of the ports of
Manzanillo, Lázaro Cardenas, Los Angeles, and Long Beach, three periods have been selected,
i.e., 2007 – 2011 (first period), 2011 – 2015 (second period), and 2015 – 2019 (third period). These
periods are linked by colored lines in chronological order, as shown in Figure 5.9 and Figure 5.10.
Thereby, Figure 5.9 illustrates the dynamic positioning of the total traffic structure of the four
seaports is represented, while Figure 5.10 shows the dynamic positioning of the container traffic
structure.
Figure 5.9 Dynamic analysis of the total traffic in the port range (2007 – 2019 in three time periods)
Source: Created by the author based on port statistics, 2020.
83
Figure 5.10 Dynamic analysis of the container traffic in the port range (2007 – 2019 in three time periods)
Source: Created by the author based on port statistics, 2020.
Figure 5.9 illustrates a dynamic analysis of the total traffic portfolio. The figure shows that Long
Beach obtained the position as “Star Performer” in the first observation period (2007 – 2011), while
Los Angeles obtained the same position in the second observation period (20011 – 2015),
however in the third period (20015 – 2019), both ports lost their favorable position, positioning Los
Angeles as “Mature Leader”, and Long Beach as “High Potential”. The port of Manzanillo
maintained the same strategic position in the three observation periods, i.e. positioning itself as
“High Potential”, but without a doubt, each period has shown improvements, which indicates that
in the future the port could achieve a position as “Star Performer”. In the case of Lázaro Cárdenas,
the port within the range has been balanced between the “Minor Performer” and “High Potential”
quadrants, showing improvements in the third period (2015 – 2019).
Differently, Figure 5.10 shows a dynamic analysis of the container traffic portfolio. Respect to
containers traffic, none of the four seaports has managed to reach a “Star Performer” position.
Los Angeles has lost market share (but still has a 52.98% market share in the range), while its
growth rate has been decreasing and increasing, consequently, its position in the third period
(2015 – 2019) is balanced between the limits of the quadrants “Mature Leader” and “Star
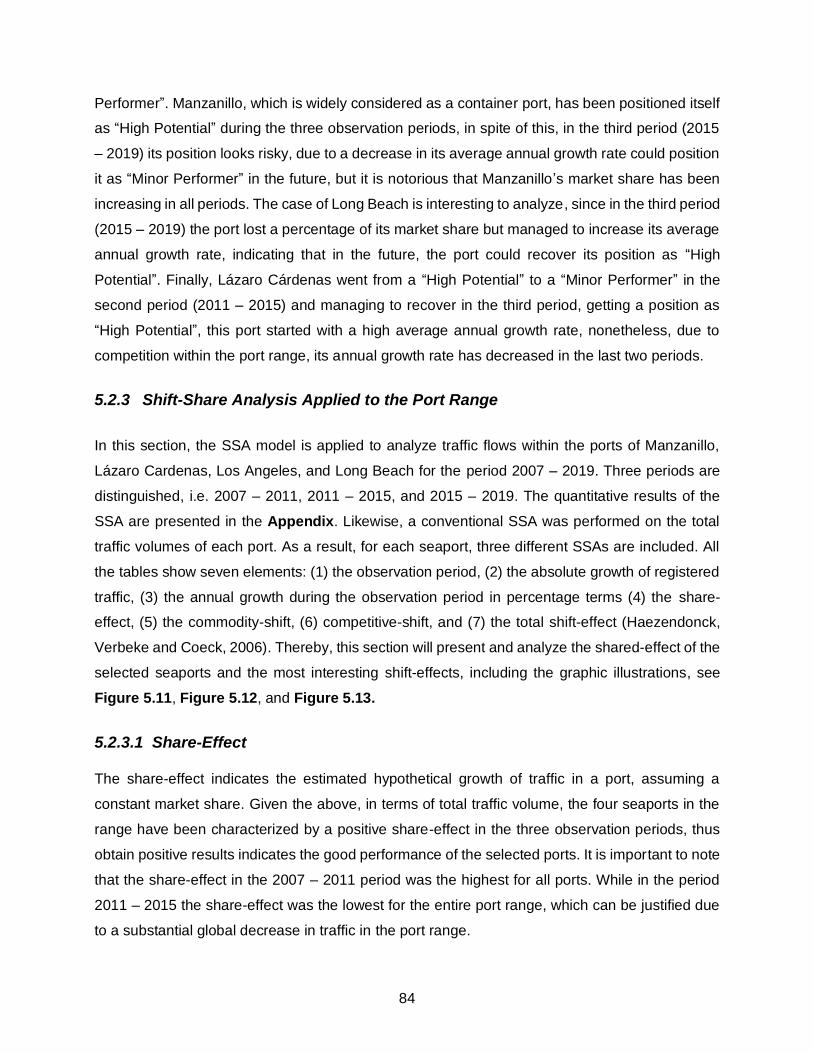
84
Performer”. Manzanillo, which is widely considered as a container port, has been positioned itself
as “High Potential” during the three observation periods, in spite of this, in the third period (2015
– 2019) its position looks risky, due to a decrease in its average annual growth rate could position
it as “Minor Performer” in the future, but it is notorious that Manzanillo’s market share has been
increasing in all periods. The case of Long Beach is interesting to analyze, since in the third period
(2015 – 2019) the port lost a percentage of its market share but managed to increase its average
annual growth rate, indicating that in the future, the port could recover its position as “High
Potential”. Finally, Lázaro Cárdenas went from a “High Potential” to a “Minor Performer” in the
second period (2011 – 2015) and managing to recover in the third period, getting a position as
“High Potential”, this port started with a high average annual growth rate, nonetheless, due to
competition within the port range, its annual growth rate has decreased in the last two periods.
5.2.3 Shift-Share Analysis Applied to the Port Range
In this section, the SSA model is applied to analyze traffic flows within the ports of Manzanillo,
Lázaro Cardenas, Los Angeles, and Long Beach for the period 2007 – 2019. Three periods are
distinguished, i.e. 2007 – 2011, 2011 – 2015, and 2015 – 2019. The quantitative results of the
SSA are presented in the Appendix. Likewise, a conventional SSA was performed on the total
traffic volumes of each port. As a result, for each seaport, three different SSAs are included. All
the tables show seven elements: (1) the observation period, (2) the absolute growth of registered
traffic, (3) the annual growth during the observation period in percentage terms (4) the share-
effect, (5) the commodity-shift, (6) competitive-shift, and (7) the total shift-effect (Haezendonck,
Verbeke and Coeck, 2006). Thereby, this section will present and analyze the shared-effect of the
selected seaports and the most interesting shift-effects, including the graphic illustrations, see
Figure 5.11, Figure 5.12, and Figure 5.13.
5.2.3.1 Share-Effect
The share-effect indicates the estimated hypothetical growth of traffic in a port, assuming a
constant market share. Given the above, in terms of total traffic volume, the four seaports in the
range have been characterized by a positive share-effect in the three observation periods, thus
obtain positive results indicates the good performance of the selected ports. It is important to note
that the share-effect in the 2007 – 2011 period was the highest for all ports. While in the period
2011 – 2015 the share-effect was the lowest for the entire port range, which can be justified due
to a substantial global decrease in traffic in the port range.
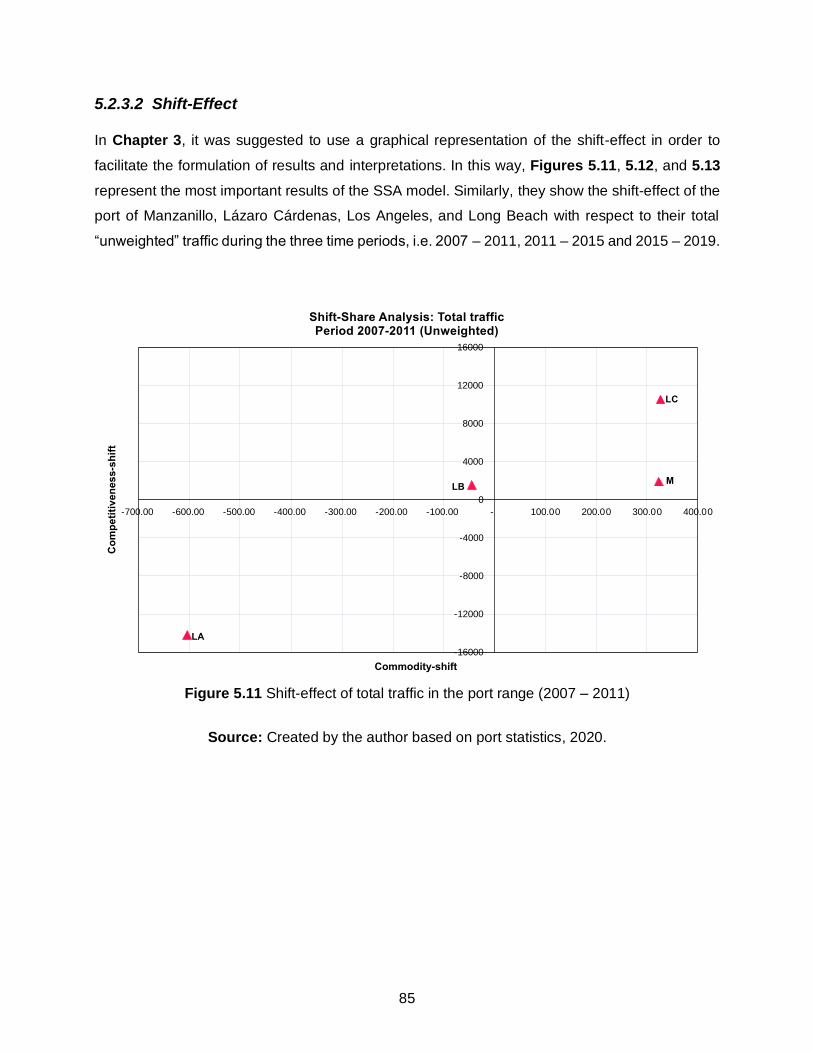
85
5.2.3.2 Shift-Effect
In Chapter 3, it was suggested to use a graphical representation of the shift-effect in order to
facilitate the formulation of results and interpretations. In this way, Figures 5.11, 5.12, and 5.13
represent the most important results of the SSA model. Similarly, they show the shift-effect of the
port of Manzanillo, Lázaro Cárdenas, Los Angeles, and Long Beach with respect to their total
“unweighted” traffic during the three time periods, i.e. 2007 – 2011, 2011 – 2015 and 2015 – 2019.
Figure 5.11 Shift-effect of total traffic in the port range (2007 – 2011)
Source: Created by the author based on port statistics, 2020.
-16000
-12000
-8000
-4000
0
4000
8000
12000
16000
-700.00 -600.00 -500.00 -400.00 -300.00 -200.00 -100.00 - 100.00 200.00 300.00 400.00
Co
mp
eti
tiv
en
ess-s
hif
t
Commodity-shift
Shift-Share Analysis: Total trafficPeriod 2007-2011 (Unweighted)
LA
LB
LC
M
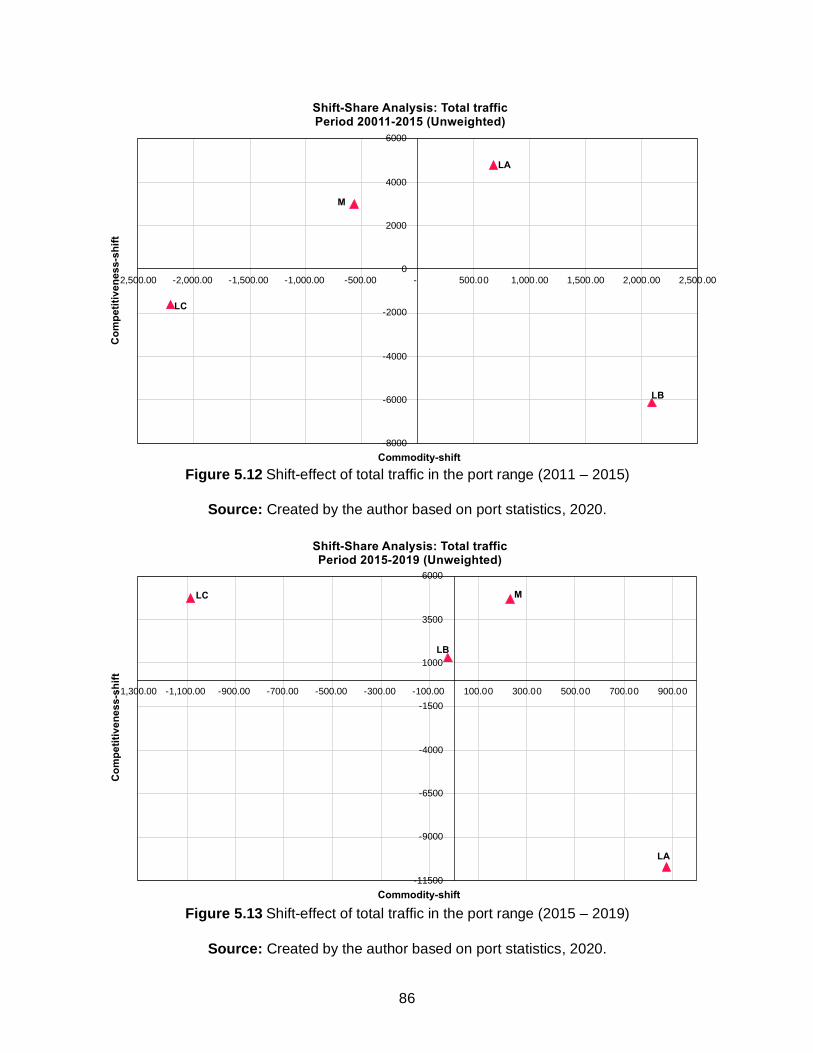
86
Figure 5.12 Shift-effect of total traffic in the port range (2011 – 2015)
Source: Created by the author based on port statistics, 2020.
Figure 5.13 Shift-effect of total traffic in the port range (2015 – 2019)
Source: Created by the author based on port statistics, 2020.
-8000
-6000
-4000
-2000
0
2000
4000
6000
-2,500.00 -2,000.00 -1,500.00 -1,000.00 -500.00 - 500.00 1,000.00 1,500.00 2,000.00 2,500.00
Co
mp
eti
tiv
en
ess-s
hif
t
Commodity-shift
Shift-Share Analysis: Total trafficPeriod 20011-2015 (Unweighted)
M
LA
LB
LC
-11500
-9000
-6500
-4000
-1500
1000
3500
6000
-1,300.00 -1,100.00 -900.00 -700.00 -500.00 -300.00 -100.00 100.00 300.00 500.00 700.00 900.00
Co
mp
eti
tiv
en
ess-s
hif
t
Commodity-shift
Shift-Share Analysis: Total trafficPeriod 2015-2019 (Unweighted)
LA
M
LB
LC
87
As illustrated in Figure 5.11 in the first period (2007 – 2011), only the ports of Manzanillo, Lázaro
Cárdenas, and Long Beach registered a positive competitiveness-shift, in spite of this, for the case
of Long Beach, the port was unfortunately overcompensated by a negative commodity-shift,
resulting to a position in the “Joker” quadrant. On the contrary, the ports of Manzanillo and Lázaro
Cárdenas were characterized by a very positive traffic structure, being the only ones recognized
as “Envied Achiever” in the range for that period. The port of Los Angeles shown a combination
of a negative traffic structure with a weakening competitive position, hence been classified as
“Waning Idlers”.
During the period 2011 – 2015, see Figure 5.12, the port of Los Angeles confirmed its “Envied
Achiever” position, combining a positive competitiveness-shift and commodity-shift, however,
Manzanillo had a negative commodity-shift, positioning itself as “Joker” within this time period.
The port of Lázaro Cárdenas was radically transformed into a “Waning Idler”, losing its favorable
competitive position, along with a rather negative commodity-shift. On the other hand, the port of
Long Beach had a positive commodity-shift, positioning itself as “Sleeping Beauty”.
The latest period (2015 – 2019) considered, see Figure 5.13, shows some notable results
regarding the competitive position and the commodity structure of seaports. Regarding the total
shift, Manzanillo managed to regain its position as “Envied Achiever”, characterized by a
commodity-shift and competitiveness-shift quite positive compared to the previous period,
indicating that it has a very favorable competitive position but still does not seem to be able to
focus more on traffic categories, in order to present higher growth rates. In the same period, the
port of Los Angeles lost its position as “Envied Achiever”, registering an unfavorable
competitiveness-shift but a positive commodity-shift, which led it to position itself as “Sleeping
Beauty”, losing its favorable competitive position.
Meanwhile, the ports of Lázaro Cárdenas and Long Beach were able to strengthen their
competitive position to a great extent, with a favorable competitiveness-shift but a negative
commodity-shift, therefore both ports were positioned as “Jokers”. In spite of this, the behavior of
Long Beach indicates the possibility of occupying the position as “Envied Achiever” under the
condition of building a positive commodity structure.
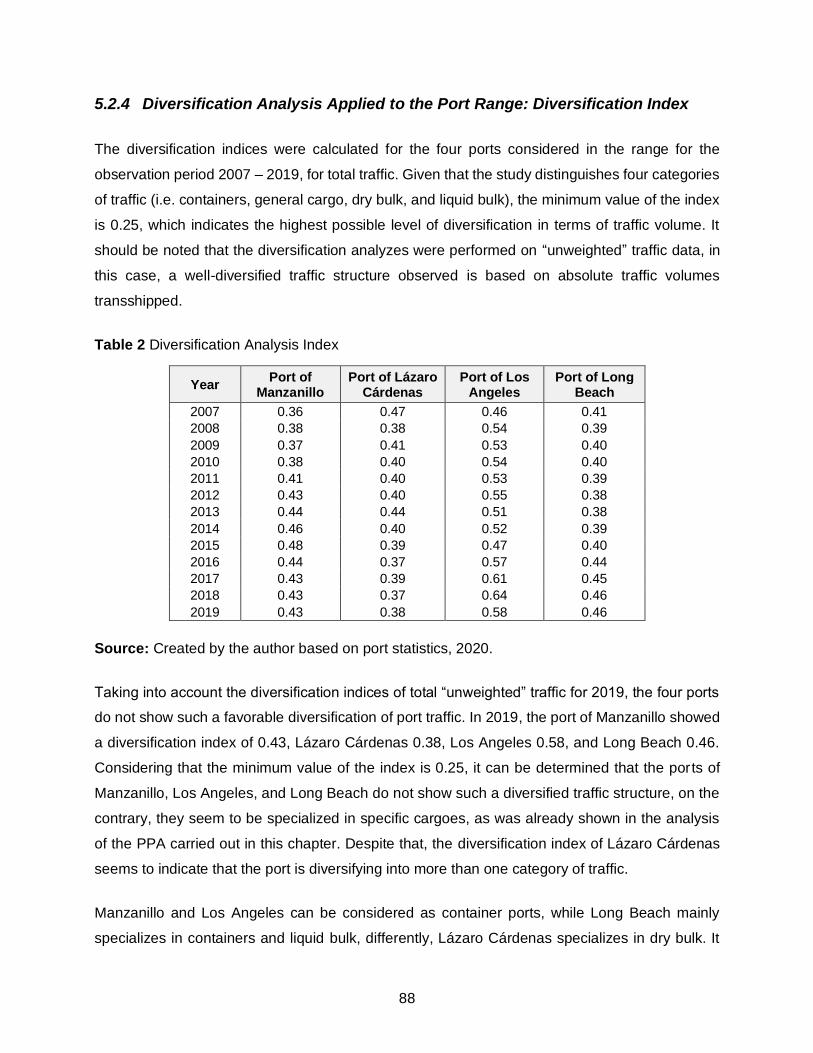
88
5.2.4 Diversification Analysis Applied to the Port Range: Diversification Index
The diversification indices were calculated for the four ports considered in the range for the
observation period 2007 – 2019, for total traffic. Given that the study distinguishes four categories
of traffic (i.e. containers, general cargo, dry bulk, and liquid bulk), the minimum value of the index
is 0.25, which indicates the highest possible level of diversification in terms of traffic volume. It
should be noted that the diversification analyzes were performed on “unweighted” traffic data, in
this case, a well-diversified traffic structure observed is based on absolute traffic volumes
transshipped.
Table 2 Diversification Analysis Index
Year Port of
Manzanillo Port of Lázaro
Cárdenas Port of Los
Angeles Port of Long
Beach
2007 0.36 0.47 0.46 0.41
2008 0.38 0.38 0.54 0.39
2009 0.37 0.41 0.53 0.40
2010 0.38 0.40 0.54 0.40
2011 0.41 0.40 0.53 0.39
2012 0.43 0.40 0.55 0.38
2013 0.44 0.44 0.51 0.38
2014 0.46 0.40 0.52 0.39
2015 0.48 0.39 0.47 0.40
2016 0.44 0.37 0.57 0.44
2017 0.43 0.39 0.61 0.45
2018 0.43 0.37 0.64 0.46
2019 0.43 0.38 0.58 0.46
Source: Created by the author based on port statistics, 2020.
Taking into account the diversification indices of total “unweighted” traffic for 2019, the four ports
do not show such a favorable diversification of port traffic. In 2019, the port of Manzanillo showed
a diversification index of 0.43, Lázaro Cárdenas 0.38, Los Angeles 0.58, and Long Beach 0.46.
Considering that the minimum value of the index is 0.25, it can be determined that the ports of
Manzanillo, Los Angeles, and Long Beach do not show such a diversified traffic structure, on the
contrary, they seem to be specialized in specific cargoes, as was already shown in the analysis
of the PPA carried out in this chapter. Despite that, the diversification index of Lázaro Cárdenas
seems to indicate that the port is diversifying into more than one category of traffic.
Manzanillo and Los Angeles can be considered as container ports, while Long Beach mainly
specializes in containers and liquid bulk, differently, Lázaro Cárdenas specializes in dry bulk. It
89
should be noted that all ports in the range show a fairly specialized “unweighted” traffic structure
since the beginning of the observation period 2007 – 2019, their indices appear much closer to
the maximum degree of specialization (index = 1), instead of the maximum possible diversification
(index = 0.25). This observation is interesting because as described in Chapter 4 of this study,
the four selected ports were already recognized for having specialization in containers, therefore,
at a certain point the results regarding the index diversification were to be expected.
Additionally, the evolution of diversification during the total volume within the observation period
2007 – 2019 shows interesting information, since as the years go by, the index of specialization
in containers for Manzanillo shows continuous increases. On the other hand, as the years go by,
the specialization index for Lázaro Cárdenas represents significant decreases, reducing its
specialization in dry bulk traffic, and looking for the opportunity to increase its traffic in containers,
maintaining strength in the traffic of both categories. This behavior was also reflected in the
analysis of the PPA and SSA models.
90
5.3 Porter’s Diamond Results
The purpose of carrying out a full execution of the SPA model (section 5.2) was to analyze the
strategic positioning and determine the performance and evolution of the four selected ports within
the four established traffic categories, in terms of market share, growth rate, and diversification.
As a result, it was possible to identify the competitive position of the four ports under consideration,
mainly with respect to containerized cargo. However, as mentioned in Chapter 2, the SPA model
only measures and analyzes port competition, in other words, it only brings a general overview of
the current situation of the analyzed ports, therefore it is essential to apply a second model, (i.e.
a qualitative method), which analyzes the port competitiveness of each seaport, in order to
understand the reason for this situation identified in the SPA model.
Given the above, in the following section 5.3, the results obtained from Porter’s diamond model
applied to each port will be illustrated, for which analysis and interpretation of the competitive
advantages that each port currently present, together with their disadvantages (i.e. areas for
improvement). It should be noted that in the following matrices, the sources that drive or affect the
competitiveness of each seaport in the context of the container industry were illustrated in different
colors.
Thereby, the green color represents the components that increase the competitiveness of the
port (i.e. positive conditions that the port owns), the orange color shows the elements that drive
the port’s competitiveness but must be improved in a short-term period (i.e. positive factors with a
tendency to be negative), the red color indicates the elements that affect the competitiveness of
the port (i.e. factors that the port does not have and must be implemented or improved), last but
not least, the black color points out the aspects that the port does not have or has in low quantity,
but, it does not affect the competitiveness of the port in the container industry.
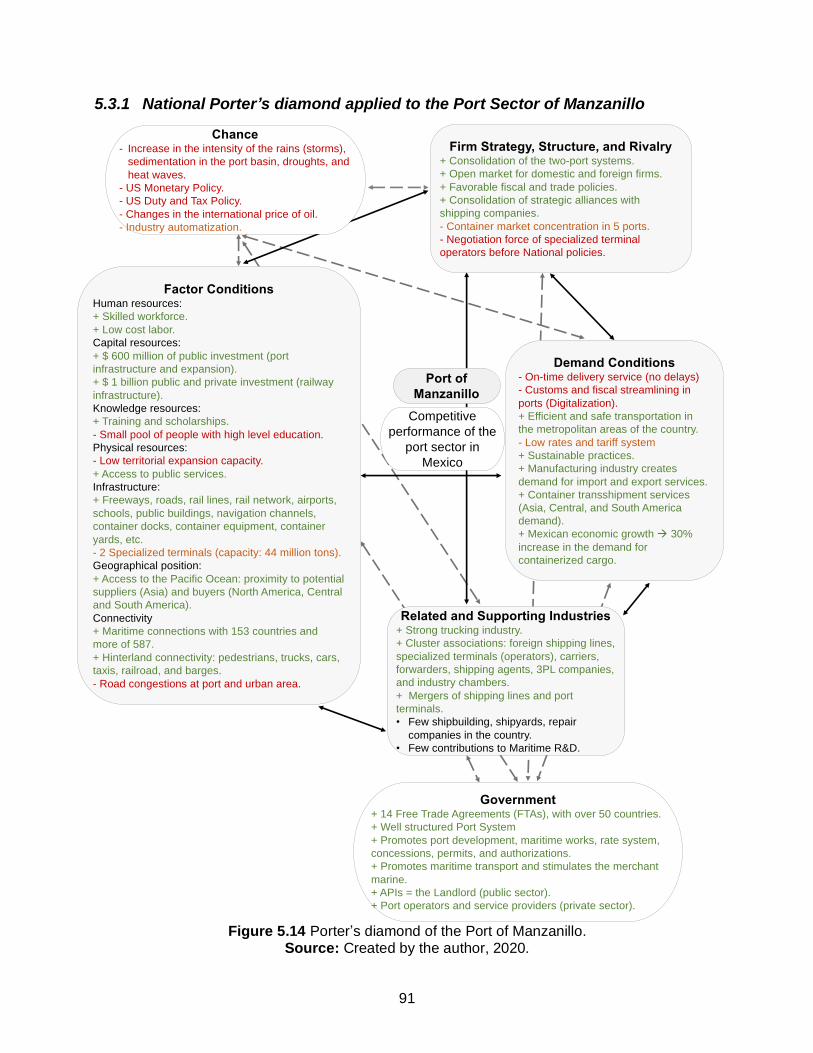
91
5.3.1 National Porter’s diamond applied to the Port Sector of Manzanillo
Figure 5.14 Porter’s diamond of the Port of Manzanillo. Source: Created by the author, 2020.
Firm Strategy, Structure, and Rivalry+ Consolidation of the two-port systems.
+ Open market for domestic and foreign firms.
+ Favorable fiscal and trade policies.
+ Consolidation of strategic alliances with
shipping companies.
- Container market concentration in 5 ports.
- Negotiation force of specialized terminal
operators before National policies.
Related and Supporting Industries+ Strong trucking industry.
+ Cluster associations: foreign shipping lines,
specialized terminals (operators), carriers,
forwarders, shipping agents, 3PL companies,
and industry chambers.
+ Mergers of shipping lines and port
terminals.
• Few shipbuilding, shipyards, repair
companies in the country.
• Few contributions to Maritime R&D.
Factor ConditionsHuman resources:
+ Skilled workforce.
+ Low cost labor.
Capital resources:
+ $ 600 million of public investment (port
infrastructure and expansion).
+ $ 1 billion public and private investment (railway
infrastructure).
Knowledge resources:
+ Training and scholarships.
- Small pool of people with high level education.
Physical resources:
- Low territorial expansion capacity.
+ Access to public services.
Infrastructure:
+ Freeways, roads, rail lines, rail network, airports,
schools, public buildings, navigation channels,
container docks, container equipment, container
yards, etc.
- 2 Specialized terminals (capacity: 44 million tons).
Geographical position:
+ Access to the Pacific Ocean: proximity to potential
suppliers (Asia) and buyers (North America, Central
and South America).
Connectivity
+ Maritime connections with 153 countries and
more of 587.
+ Hinterland connectivity: pedestrians, trucks, cars,
taxis, railroad, and barges.
- Road congestions at port and urban area.
Demand Conditions- On-time delivery service (no delays)
- Customs and fiscal streamlining in
ports (Digitalization).
+ Efficient and safe transportation in
the metropolitan areas of the country.
- Low rates and tariff system
+ Sustainable practices.
+ Manufacturing industry creates
demand for import and export services.
+ Container transshipment services
(Asia, Central, and South America
demand).
+ Mexican economic growth à 30%
increase in the demand for
containerized cargo.
Chance- Increase in the intensity of the rains (storms),
sedimentation in the port basin, droughts, and
heat waves.
- US Monetary Policy.
- US Duty and Tax Policy.
- Changes in the international price of oil.
- Industry automatization.
Government+ 14 Free Trade Agreements (FTAs), with over 50 countries.
+ Well structured Port System
+ Promotes port development, maritime works, rate system,
concessions, permits, and authorizations.
+ Promotes maritime transport and stimulates the merchant
marine.
+ APIs = the Landlord (public sector).
+ Port operators and service providers (private sector).
Competitive
performance of the
port sector in
Mexico
Port of
Manzanillo
92
5.3.2 Porter’s diamond interpretation: Port of Manzanillo
Factor conditions
For the port of Manzanillo to be able to compete nationally and internationally in the port sector,
particularly in the containerized cargo industry, seven factor conditions were identified, i.e. human
resources, capital resources, knowledge resources, physical resources, infrastructure, geographic
position, and connectivity. In Mexico, the port sector is distinguished by having a cheap14 but
qualified labor force to offer quality and efficient services (SCT, 2018). In 2018, the port of
Manzanillo reported having generated 12 thousand direct jobs and 30 thousand indirect jobs only
in port activities, making it one of the main economic activities of Colima. In terms of knowledge
resources, in 2018, it was reported that the National Nautical Education System increased the
student population to 1,766 students. Likewise, the Maritime Education Trust Fund (FIDENA)
added to its study plan the master’s degree in Administration of Shipping and Port Companies, in
order for students and future workforce to acquire specific competence in the maritime, port, or
logistics areas. Colima does not have public nautical institutions, but the local government
promotes post-professional programs and training plans to attract and increase specialized
professionals (SCT, 2018).
Differently, regards to capital resources, during the period 2017 – 2018, the Mexican government
invested 600 million US dollars in expansion and modernization projects of the port of Manzanillo.
In addition, a billion dollars were invested in public and rail infrastructure throughout the country,
of which 800 million US dollars corresponded to public investment and 200 million US dollars to
private investment (SCT, 2018). Manzanillo has access to public services, such as water systems,
sewerage, sewage, public lighting, waste cleaning, public safety and public health. However, the
port area has a very low capacity for territorial expansion, identifying it as a disadvantage.
Manzanillo and its surroundings enjoy a good quality public infrastructure, with access to
highways, railways, airports, schools, public buildings, navigation channels, container docks, port
equipment, port yards, warehouses, and customs areas. In the meanwhile, the port’s two
specialized terminals have a total handling capacity of 44 million tons and 4.35 million TEUs (SCT,
2018).
14 Minimum wage in Mexico is 123.22 Mexican pesos per hour (i.e. 5.61 US dollars per hour).
93
In relation to the geographical position, Mexico has access to two oceans, i.e. the Pacific and the
Atlantic, and to two seas, i.e. the Caribbean and the Gulf of Mexico. It has more than 11 thousand
kilometers of coastline and 102 seaports, in which 16 are administered by the Federal
Government, concentrating 100% of the containerized cargo and 80% of the commercial cargo
(SCT, 2018). The location of the port of Manzanillo gives it a strategic and competitive proximity
to potential suppliers (Asia) and buyers (North, Central and South America). Last but not least,
the port of Manzanillo has hinterland connectivity by sea, road and rail, despite this, a high traffic
congestion is identified to enter and leave the port area and urban zones since trucks and vehicles
must drive the entire city to access the port, causing delays. The disadvantage is urban saturation,
which limits the possibilities for road expansion (Carranza, 2018).
Demand conditions
According to API Manzanillo, in the long term, the growth of the Mexican economy is projected to
be quite favorable, expecting an increment in the demand for container traffic, minerals, crude oil,
and others. Manzanillo’s domestic market consists mainly of iron ore traffic (i.e. dry bulk) and
container transshipments. The exchange of goods from Southeast Asia, specifically from China,
Japan, and South Korea, represent a high percentage of the total volume of containers handled
in the port, thus being its main commercial partners (API Manzanillo, 2014d). Buyers’ requirements
are characterized by efficient port and customs operations, with low port fees, and on-time
services. In the container market, it is observed that the port of Manzanillo lacks certain standards
demanded by domestic and foreign consumers, reporting delays in administrative procedures and
inspections, insufficient coordination between customs authorities, and road congestion, all of this
affecting the competitiveness of the port (SCT, 2008c).
Despite these areas for improvement, Manzanillo is recognized for offering the lowest and most
competitive port fees in Latin America. Nevertheless, in terms of tariffs for port infrastructure use,
API Manzanillo together with the rest of the Mexican ports must adopt a new productivity rate
scheme, in order to promote the arrival of certain vessels and cargo, such as container ships, Ro-
Ro, bulk carriers, cruise ships, etc. (SCT, 2018). Respect to sustainability, the port does not
generate a harmful impact on the environment or the community, distinguishing itself by the correct
monitoring of environmental regulations (SCT, 2008c).
94
Related and supporting industries
The Mexican port system has commercial relationships with foreign firms, such as shipping lines,
carriers, port operators, freight forwarders, ship agents, etc. In spite of this, overland transportation
is one of the strongest industries in the country, registering 1,099,371 trucks and 154,306 trucking
companies (API Manzanillo, 2014d). Besides, Mexico has strong support in the port sector by
national associations, organizations, and chambers, such as ANTP, COMCE, CANACAR,
AMANAC, ATOP, and AMTI. Their main functions include legal advice, promotion of national and
international trade, protection of the interests of members, dialogue with authorities, promotion of
the harmonious and orderly development of the maritime industry. Regards the construction,
modernization, and maintenance of vessels, Mexico is not considered specialized, nowadays, it
only has been registered five builders and shipyards, five naval repair centers, six support groups
for afloat units, and three general workshops. Additionally, the Sectorial Fund for Research and
Development in Naval Sciences (FSIDCN) is the only institute in charge of R&D of the maritime
sector (SCT, 2016).
Firm’s strategy, structure, and rivalry
The maritime sector in Mexico is not characterized by extreme competition or monopolistic
activities between national ports. On the contrary, since 2018, efforts have been made to
consolidate the port systems of the Gulf of Mexico and the Pacific Ocean, to strengthen ports as
the strongest link in the logistics chains (SCT, 2018). Notwithstanding, the port system categorizes
its maritime ports as commercial, industrial, tourist or fishing, differentiating them from one
another. As a consequence, a concentration of the container market is observed in only five ports
in the country, which has favored Manzanillo competitive position, classifying it as the main
Mexican port in the container traffic of the Pacific coast (SCT, 2008c).
Meanwhile, the SCT assures that Mexico has an open market for national and foreign transport
and logistics companies. Shipping line companies that work formally with Mexico have stood out
for alliances and mergers with port terminals, promoting the development of better private
infrastructure (SCT, 2016). As a result, the port industry has been oriented towards the growth of
the private sector, characterized by having an attractive regulatory and commercial environment
(SCT, 2018). In the case of Manzanillo, the port has stood out for being more competitive and
attractive in container traffic compared to Lázaro Cárdenas, showing better links with multimodal
transport, greater operating financial situations, and lower port fees. Additionally, each API has
95
rights granted by national policies to negotiate promotional rates with different container terminal
companies, in order to win concessions and obtain greater benefits (SCT, 2008c).
The government
The government plays a favorable role in the port sector, directly benefiting the country’s
competitiveness within the containerized cargo industry. One of the main competitive advantages
is the 14 Free Trade Agreements (FTAs) that allow Mexico to have commercial relations with more
than 50 countries, and access to more than 60% of the world's gross domestic product (Cortés
Pérez, 2016). The port sector is managed by the General Coordination of Ports and Merchant
Marine15 (CGPyMM), a federative entity in charge of promoting maritime transport and the
merchant marine. The CGPyMM is made up of the General Direction of Ports16 (authority in the
country’s ports responsible for port development, maritime works, tariff system, concessions,
permits, and authorizations), the Merchant Navy Administration17 (in charge of promoting maritime
transport and stimulating the merchant marine), and the General Direction of Port and
Administration Development of the General Ports Liaison and Mercantile Marine18 (responsible for
promoting the development of the national port system, promoting the efficiency, and profitability
of the 16 APIs19) (Cortés Pérez, 2016). Among other competitive advantages, API acts as a
landlord port authority, responsible for asset management and commercial relations, while all
specialized infrastructure, port services, port terminals and innovative developments are
controlled by the private sector (Cortés Pérez, 2016).
The chance
Chances events that can affect Mexico’s competitive position, especially to the port of Manzanillo
in the context of the container industry, are events outside the control of the government, such as
the increase in the intensity of rains (causing flooding in internal connections on highways and
railways), increased sedimentation in the port basin (causing damage to infrastructure and port
equipment). Likewise, the US Monetary Policy, the US Duty and Tax Policy, changes in the
international price of oil, or even automation in port terminals (technological advances).
15 Coordinación General de Puertos y Marina Mercante. 16 Dirección General de Puertos. 17 Dirección General de Marina Mercante. 18 Dirección General de Fomento y Administración Portuaria. 19 Administración Portuaria Integral.
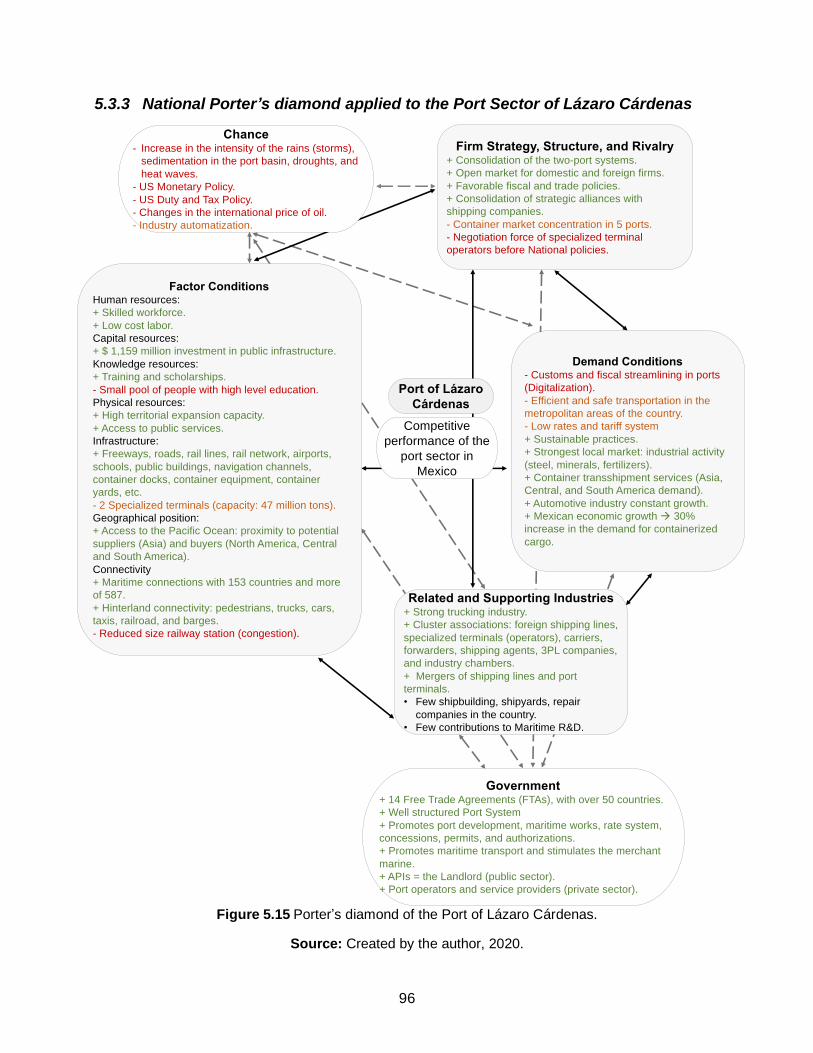
96
5.3.3 National Porter’s diamond applied to the Port Sector of Lázaro Cárdenas
Figure 5.15 Porter’s diamond of the Port of Lázaro Cárdenas.
Source: Created by the author, 2020.
Firm Strategy, Structure, and Rivalry+ Consolidation of the two-port systems.
+ Open market for domestic and foreign firms.
+ Favorable fiscal and trade policies.
+ Consolidation of strategic alliances with
shipping companies.
- Container market concentration in 5 ports.
- Negotiation force of specialized terminal
operators before National policies.
Related and Supporting Industries+ Strong trucking industry.
+ Cluster associations: foreign shipping lines,
specialized terminals (operators), carriers,
forwarders, shipping agents, 3PL companies,
and industry chambers.
+ Mergers of shipping lines and port
terminals.
• Few shipbuilding, shipyards, repair
companies in the country.
• Few contributions to Maritime R&D.
Factor ConditionsHuman resources:
+ Skilled workforce.
+ Low cost labor.
Capital resources:
+ $ 1,159 million investment in public infrastructure.
Knowledge resources:
+ Training and scholarships.
- Small pool of people with high level education.
Physical resources:
+ High territorial expansion capacity.
+ Access to public services.
Infrastructure:
+ Freeways, roads, rail lines, rail network, airports,
schools, public buildings, navigation channels,
container docks, container equipment, container
yards, etc.
- 2 Specialized terminals (capacity: 47 million tons).
Geographical position:
+ Access to the Pacific Ocean: proximity to potential
suppliers (Asia) and buyers (North America, Central
and South America).
Connectivity
+ Maritime connections with 153 countries and more
of 587.
+ Hinterland connectivity: pedestrians, trucks, cars,
taxis, railroad, and barges.
- Reduced size railway station (congestion).
Demand Conditions- Customs and fiscal streamlining in ports
(Digitalization).
- Efficient and safe transportation in the
metropolitan areas of the country.
- Low rates and tariff system
+ Sustainable practices.
+ Strongest local market: industrial activity
(steel, minerals, fertilizers).
+ Container transshipment services (Asia,
Central, and South America demand).
+ Automotive industry constant growth.
+ Mexican economic growth à 30%
increase in the demand for containerized
cargo.
Chance- Increase in the intensity of the rains (storms),
sedimentation in the port basin, droughts, and
heat waves.
- US Monetary Policy.
- US Duty and Tax Policy.
- Changes in the international price of oil.
- Industry automatization.
Government+ 14 Free Trade Agreements (FTAs), with over 50 countries.
+ Well structured Port System
+ Promotes port development, maritime works, rate system,
concessions, permits, and authorizations.
+ Promotes maritime transport and stimulates the merchant
marine.
+ APIs = the Landlord (public sector).
+ Port operators and service providers (private sector).
Competitive
performance of the
port sector in
Mexico
Port of Lázaro
Cárdenas
97
5.3.4 Porter’s diamond interpretation: Port of Lázaro Cárdenas
In the case of Lázaro Cárdenas, the elements that the port owns to compete in the port sector,
especially in the container industry, are mostly the same as for the port of Manzanillo. The main
reason is due to the fact that Porter’s diamond model was implemented at the national level (i.e.
Mexico), consequently, many competitive advantages identified for the port of Manzanillo also
apply for the port of Lázaro Cárdenas, despite that, some differences were identified, which will
be described below.
Factor conditions
Mexico is characterized by having a cheap labor force compared to developed countries;
nonetheless, this has not limited the port of Lázaro Cárdenas from having a trained and expert
workforce to offer quality services. In 2018, the port generated 32 thousand direct and indirect
jobs, identifying the maritime sector as one of the main sources of the Michoacán economy.
Regarding knowledge resources, Lázaro Cárdenas does not have Mercantile Nautical institutions
established in the state, but the local government is committed to promoting post-professional
programs and training for high-level education (SCT, 2018).
In terms of capital resources, during the period 2014 – 2018, the Mexican government invested
1,159 million US dollars in expansion and modernization projects in the port of Lázaro Cárdenas
and the urban area of the state of Michoacán. As a result, 75% of the local population benefited,
modernizing roads, tunnels, bridges, rural areas, and equipment of specialized terminals in
containers and dry bulk (SCT, 2018). Similarly, Lázaro Cárdenas has access to public services,
such as water systems, sewerage, wastewater, public lighting, waste cleaning, public safety, and
public health. Unlike Manzanillo, the port of Lázaro Cárdenas has a high capacity for territorial
expansion. Lázaro Cárdenas joys good conditions of public infrastructure, such as highways,
railways, airports, schools, public buildings, navigation channels, container docks, port equipment,
and port yards. In the meantime, the port’s two specialized terminals have a total handling capacity
of 47 million tons (SCT, 2018).
The geographical location of the port Lázaro Cárdenas also allows it to have competitive
advantages and proximity to potential suppliers (Asia) and buyers (North, Central, and South
America). However, in terms of hinterland connectivity, the KCSM railway station 16 kilometers
from the customs/exit of the port is small in size, which generates a high level of congestion and
98
bottlenecks. The urban zones also present traffic conflicts with the railway crossing (Carranza,
2018).
Demand conditions
Lázaro Cárdenas’s domestic market is mainly made up of iron ore and sulfur traffic (i.e. dry bulk)
and the handling of containers and general cargo. Additionally, the port is considered a logistics
platform for the diversification of the country’s foreign trade, generating increases in trade routes
with Asia, North America, Central and South America. The port’s domestic market demands high-
quality, safe and low-cost services, nevertheless, the port fees in Lázaro Cárdenas are higher than
in Manzanillo. Moreover, some areas of the state do not have sufficient road safety, which puts
the distribution of high-value cargo at risk (API Lázaro Cárdenas, 2014).
Pursuant to API Lázaro Cárdenas, in the long term, the automotive and container industry is
expected to show an increment, detecting these markets as an area of opportunity. For the reason
that the Mexican economy has expectations of accelerated growth, the port forecasts a growth of
3.5% of GDP, which will increase the country’s exports and commercial activities of the port (API
Lázaro Cárdenas, 2014).
Related and supporting industries
The national associations, organizations and chambers grant the same benefits to the port of
Lázaro Cárdenas, in commercial, legal, and security aspects. The port has a large cluster of
companies of the maritime sector, which strengthens the competitiveness of the port, companies
such as truckers, shippers, carriers, terminal operators, engineers, construction firms, freight
forwarders, equipment suppliers, ship agents, insurance agencies, logistics solution firms, and
storage facilities (APILAC, 2016).
Firm’s strategy, structure, and rivalry
The Mexican port system has laws and regulations to avoid monopolistic practices, as a result,
seaports present healthy competition in the handling of different cargoes (SCT, 2018). In spite of
this, the volume handled by the ports of Manzanillo and Lázaro Cárdenas together represents
94.8% of the total container traffic on the Pacific coast (API Lázaro Cárdenas, 2014). On the other
hand, the consolidation of the port systems of the Gulf of Mexico and the Pacific Ocean gives
competitive advantages to the port of Lázaro Cárdenas, expecting growth in the volume of traffic
99
cargo. Mexico offers a commercial environment with low entry barriers for national and
international companies. Similarly, the consolidation of strategic alliances between shipping lines
and port operators have increased the attraction of new and more foreign firm to the country (SCT,
2018).
The government
The role of the government is the same for all ports in Mexico, which makes it possible to establish
that the port of Lázaro Cárdenas enjoys the same advantages as Manzanillo. The Mexican
government’s vision is the strategic development of port infrastructure, with the objective of
promoting better services and connectivity within and outside the country. Similarly, to increase
the productivity and competitiveness of all the country’s seaports. In order to achieve it, the
Mexican government is committed to investing in infrastructure and logistics platforms, allowing
the distribution of national goods at a lower cost (SCT, 2018).
The chance
Climate change is one of the main aspects that affect the competitiveness of the port of Lázaro
Cárdenas, it has been reported that the intensification of storms and hurricanes cause negative
impacts on trade and damage to port infrastructure. Differently, a change in foreign direct
investment in Mexico would affect the development of the port and transportation sector, some of
the reasons would be caused by political changes in the United States. Additionally, the imposition
of import tariffs by the United States are events that directly affect Mexico’s trade, since almost
80% of Mexican exports are destined to North America. From another point of view, a trade war
between the United States and China could generate negative effects in Mexico, for the simple
reason of being two nations with a strong commercial exchange, causing instability between the
economies.
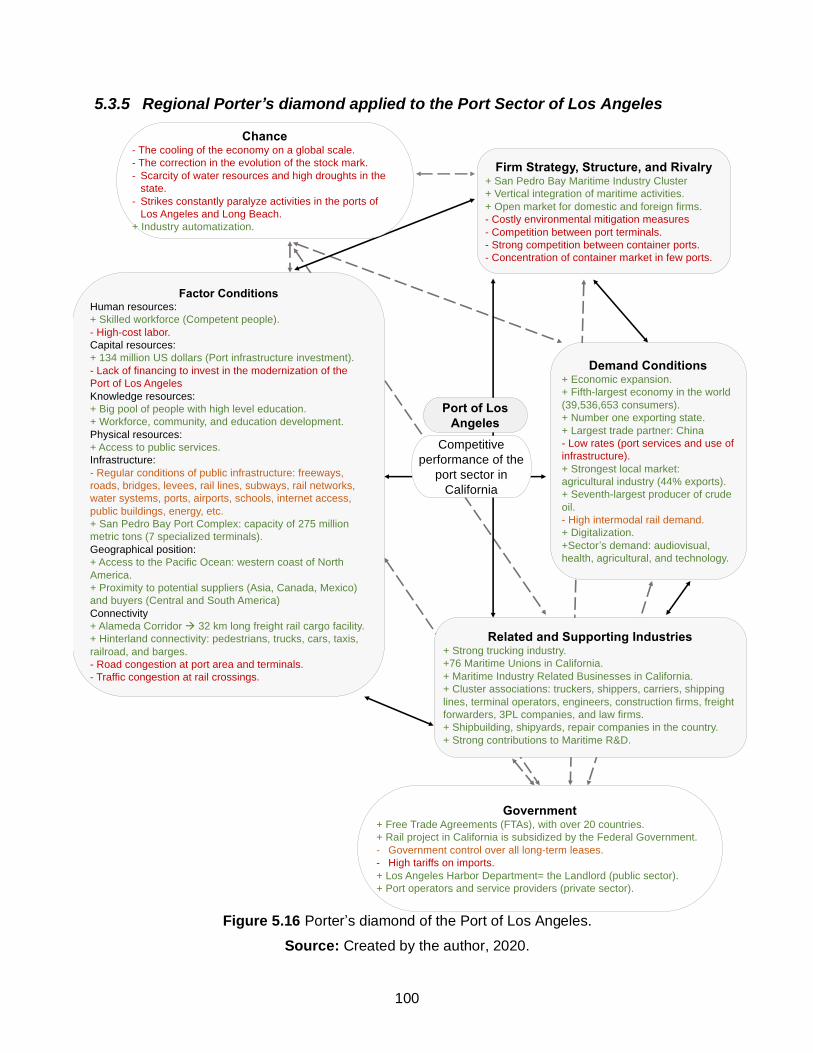
100
5.3.5 Regional Porter’s diamond applied to the Port Sector of Los Angeles
Figure 5.16 Porter’s diamond of the Port of Los Angeles.
Source: Created by the author, 2020.
Firm Strategy, Structure, and Rivalry+ San Pedro Bay Maritime Industry Cluster
+ Vertical integration of maritime activities.
+ Open market for domestic and foreign firms.
- Costly environmental mitigation measures
- Competition between port terminals.
- Strong competition between container ports.
- Concentration of container market in few ports.
Related and Supporting Industries+ Strong trucking industry.
+76 Maritime Unions in California.
+ Maritime Industry Related Businesses in California.
+ Cluster associations: truckers, shippers, carriers, shipping
lines, terminal operators, engineers, construction firms, freight
forwarders, 3PL companies, and law firms.
+ Shipbuilding, shipyards, repair companies in the country.
+ Strong contributions to Maritime R&D.
Factor ConditionsHuman resources:
+ Skilled workforce (Competent people).
- High-cost labor.
Capital resources:
+ 134 million US dollars (Port infrastructure investment).
- Lack of financing to invest in the modernization of the
Port of Los Angeles
Knowledge resources:
+ Big pool of people with high level education.
+ Workforce, community, and education development.
Physical resources:
+ Access to public services.
Infrastructure:
- Regular conditions of public infrastructure: freeways,
roads, bridges, levees, rail lines, subways, rail networks,
water systems, ports, airports, schools, internet access,
public buildings, energy, etc.
+ San Pedro Bay Port Complex: capacity of 275 million
metric tons (7 specialized terminals).
Geographical position:
+ Access to the Pacific Ocean: western coast of North
America.
+ Proximity to potential suppliers (Asia, Canada, Mexico)
and buyers (Central and South America)
Connectivity
+ Alameda Corridor à 32 km long freight rail cargo facility.
+ Hinterland connectivity: pedestrians, trucks, cars, taxis,
railroad, and barges.
- Road congestion at port area and terminals.
- Traffic congestion at rail crossings.
Demand Conditions+ Economic expansion.
+ Fifth-largest economy in the world
(39,536,653 consumers).
+ Number one exporting state.
+ Largest trade partner: China
- Low rates (port services and use of
infrastructure).
+ Strongest local market:
agricultural industry (44% exports).
+ Seventh-largest producer of crude
oil.
- High intermodal rail demand.
+ Digitalization.
+Sector’s demand: audiovisual,
health, agricultural, and technology.
Chance- The cooling of the economy on a global scale.
- The correction in the evolution of the stock mark.
- Scarcity of water resources and high droughts in the
state.
- Strikes constantly paralyze activities in the ports of
Los Angeles and Long Beach.
+ Industry automatization.
Government+ Free Trade Agreements (FTAs), with over 20 countries.
+ Rail project in California is subsidized by the Federal Government.
- Government control over all long-term leases.
- High tariffs on imports.
+ Los Angeles Harbor Department= the Landlord (public sector).
+ Port operators and service providers (private sector).
Competitive
performance of the
port sector in
California
Port of Los
Angeles
101
5.3.6 Porter’s diamond interpretation: Port of Los Angeles
Factor conditions
California along with the port of Los Angeles have quite important factor conditions, which have
allowed them to compete and stand out in the port sector, particularly in the container segment.
California is considered the fifth largest economy in the world, recognized for having a costly20 but
competent and specialized workforce. Nowadays, the port of Los Angeles has generated 150,000
jobs within the port area and 529,000 jobs in counties near the port, similarly, nationwide it has
generated a total of 1.6 million jobs. Consequently, California has 1,767 labor unions, with around
2,504,000 members (Port of Los Angeles, 2019a).
In reference to capital resources, California has federal funding programs for the development and
modernization of ports. Since 2009, the Transportation Investment Generating Economic
Recovery (TIGER) program has invested 829 million US dollars for port infrastructure projects, of
which 134 million US dollars were awarded to California ports. Because California handles 38%
of the national volume of containers, urban public infrastructure requires constant maintenance
and modernization, however, according to the American Society of Civil Engineers (ASCE) report,
the California government does not have sufficient funds to perform the necessary maintenance
on public and port infrastructure. At the moment, the Port of Los Angeles requires an investment
of 2 billion US dollars (ASCE, 2019).
Similarly, the maritime sector is one of the economic sources of the state, thus being one of the
industries with high knowledge resources. In California, about 38 educational institutions promote
high-level education for specialization in ports, international business, and logistics, identifying this
one of the competitive advantages of the port of Los Angeles. Moreover, California has access to
public infrastructure and physical resources such as airports, ports, roads, highways, railways,
bridges, tunnels, schools, water systems, wastewater, public lighting, energy, parks and
recreational areas, telecommunications, etc. Nevertheless, due to the rapid growth of its
population, California’s infrastructure is reported to be in mediocre conditions and requires
immediate attention. Pursuant to ASCE, mediocre conditions mean public infrastructure in regular
conditions, showing signs of deterioration and deficiencies in functionality (ASCE, 2019).
20 California minimum wage of 12.00 US dollars per hour.
102
Despite the downsides, the San Pedro Bay port complex (which includes the Los Angeles Long
Beach ports) generates a tremendous economic impact, with a total handling capacity of 275
million metric tons (Port of Los Angeles, 2020a). One of the competitive advantages that has
allowed it to be recognized as the largest commercial gateway in North America in terms of
container volume is due to its geographic location. In other words, California enjoys great benefits
as it is located on the edge of the Pacific Ocean on the western coast of North America, with
strategic proximity to potential suppliers (Asia) and buyers (Canada, Mexico, Central, and South
America) (Port of Los Angeles, 2019a).
Regarding the hinterland connectivity, the state has the necessary infrastructure to connect and
distribute goods by rail, road, or sea. The Alameda Corridor is the long freight rail cargo facility,
that connects the transcontinental rail lines near downtown Los Angeles, to the ports of Long
Beach and Los Angeles. This intermodal railroad has improved the efficiency of containerized
cargo transportation from the two ports to the national rail system, being recognized as one of
California’s most competitive advantages (Merk and Notteboom, 2015).
The appointment system in the specialized terminals of the port of Los Angeles is considered to
be ineffective. According to Merk and Notteboom (2015), most terminal operators do not have
effective operating strategies, i.e. in many cases, truckers do not have pick-up or delivery
appointments, which generates bottlenecks and congestion inside and outside the port area.
Similarly, the railway system also presents congestion due to the high demand for container traffic.
On the other hand, Los Angeles is one of the ports with the most negative impact on the
environment (Merk and Notteboom, 2015).
Demand conditions
In accordance with the commercial and economic projections of Los Angeles, the total volume
handled by the port will have high long-term growth, therefore, in 2030 a high and growing demand
for containers, dry bulk, liquid bulk, and general cargo is projected. Despite this, according to the
Port of Los Angeles Master Plan, the determinants that control the demand for cargo volumes
depend on the individual requirements of each commercial route, in conjunction with the
development of the global industry, thus forecasts have a tendency to change (Puerto de Los
Angeles, 2018a).
103
Similarly, California has a notable economic expansion, positioning itself as the number one state
exporter of agricultural products, crude oil, and manufactured products. Hence, the imports and
exports through the port of Los Angeles will once again be driven by the growth in demand for
end-use products, by Asia, Canada, and Mexico (Port of Los Angeles, 2018a). Consequently,
containerized trade with China is projected to remain the largest and fastest-growing segment
over the period 2020 – 2030. Containers from Southeast Asia will become the second-largest
source of imports for California and the United States. While US exports to Japan will increase at
a lower volume (Port of Los Angeles, 2018a).
Differently, regarding the price and quality of the services offered by the port of Los Angeles, it
can be argued that they are not competitive enough in comparison to the Mexican ports. Most
California’s ports, especially Los Angeles and Long Beach, are known for having high intermodal
rail fees, expensive port and infrastructure fees, high cargo handling fees, and expensive leasing
fees. However, the Port Master Plan establishes that it has been projected that port fees will be
more expensive than normal, this due to the automation of specialized container terminals and
the high costs of the maritime intermodal transport system (Port of Los Angeles, 2018a).
Related and supporting industries
California has a large number of businesses related to the maritime industry, which has directly
benefited the competitiveness of the port of Los Angeles in the container market. In this way, the
supply chain of the port of Los Angeles is made up of different types of entities, companies,
resources, technology, and activities essential to offer quality services to the end consumer,
among them are shipping lines, trucking companies, carriers, equipment suppliers, ship agents,
legal services, insurance agencies, logistics companies, rail operators, terminal operators,
engineers, and storage facilities (Port of Los Angeles, 2020d).
Firm’s strategy, structure, and rivalry
The ports of Los Angeles and Long Beach are classified as the two main gateways of
containerized imports from Asia, propelling the local and national economy. Nevertheless, the
container industry presents continuous and dynamic global competition, which has generated
negative impacts on these two ports. Consequently, Los Angeles is currently facing strong
competition from the East Coast and Gulf Coast ports (Nacht, Henry and Martin, 2019).
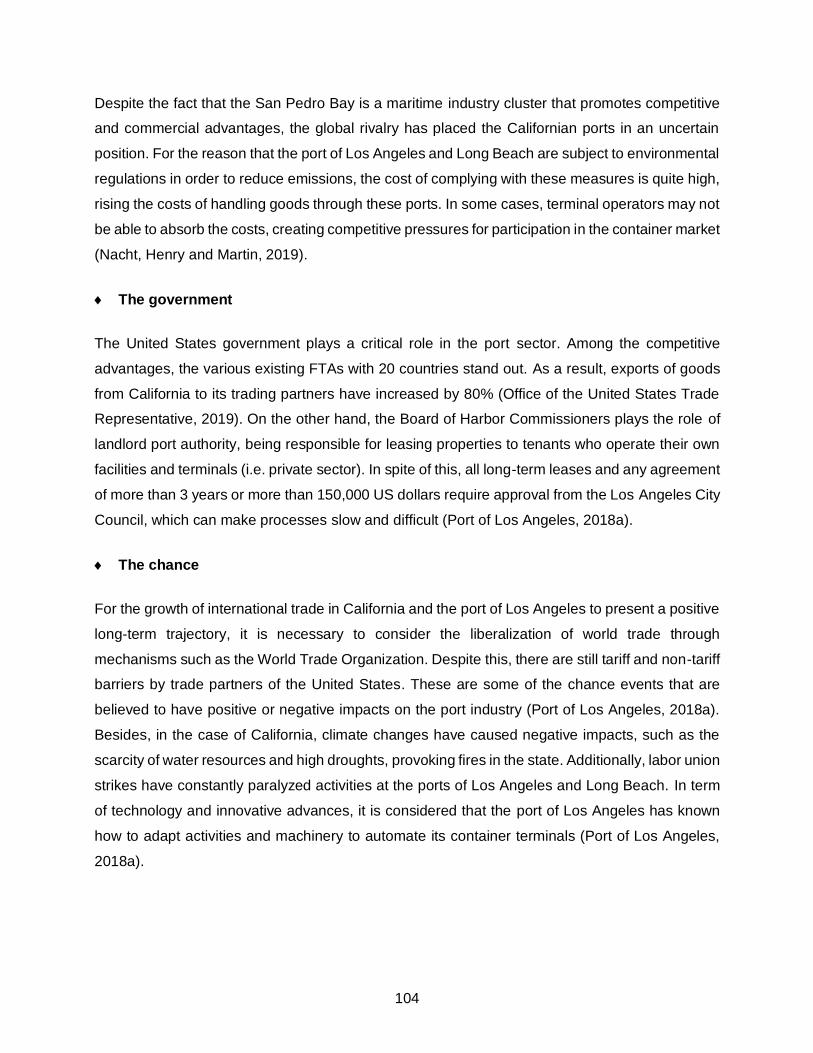
104
Despite the fact that the San Pedro Bay is a maritime industry cluster that promotes competitive
and commercial advantages, the global rivalry has placed the Californian ports in an uncertain
position. For the reason that the port of Los Angeles and Long Beach are subject to environmental
regulations in order to reduce emissions, the cost of complying with these measures is quite high,
rising the costs of handling goods through these ports. In some cases, terminal operators may not
be able to absorb the costs, creating competitive pressures for participation in the container market
(Nacht, Henry and Martin, 2019).
The government
The United States government plays a critical role in the port sector. Among the competitive
advantages, the various existing FTAs with 20 countries stand out. As a result, exports of goods
from California to its trading partners have increased by 80% (Office of the United States Trade
Representative, 2019). On the other hand, the Board of Harbor Commissioners plays the role of
landlord port authority, being responsible for leasing properties to tenants who operate their own
facilities and terminals (i.e. private sector). In spite of this, all long-term leases and any agreement
of more than 3 years or more than 150,000 US dollars require approval from the Los Angeles City
Council, which can make processes slow and difficult (Port of Los Angeles, 2018a).
The chance
For the growth of international trade in California and the port of Los Angeles to present a positive
long-term trajectory, it is necessary to consider the liberalization of world trade through
mechanisms such as the World Trade Organization. Despite this, there are still tariff and non-tariff
barriers by trade partners of the United States. These are some of the chance events that are
believed to have positive or negative impacts on the port industry (Port of Los Angeles, 2018a).
Besides, in the case of California, climate changes have caused negative impacts, such as the
scarcity of water resources and high droughts, provoking fires in the state. Additionally, labor union
strikes have constantly paralyzed activities at the ports of Los Angeles and Long Beach. In term
of technology and innovative advances, it is considered that the port of Los Angeles has known
how to adapt activities and machinery to automate its container terminals (Port of Los Angeles,
2018a).
105
5.3.7 Regional Porter’s diamond applied to the Port Sector of Long Beach
Figure 5.17 Porter’s diamond of the Port of Long Beach.
Source: Created by the author, 2020.
Firm Strategy, Structure, and Rivalry+ San Pedro Bay Maritime Industry Cluster
+ Vertical integration of maritime activities.
+ Open market for domestic and foreign firms.
- Costly environmental mitigation measures
- Competition between port terminals.
- Strong competition between container ports.
- Concentration of container market in few ports.
Related and Supporting Industries+ Strong trucking industry.
+76 Maritime Unions in California.
+ Maritime Industry Related Businesses in California.
+ Cluster associations: truckers, shippers, carriers, shipping
lines, terminal operators, engineers, construction firms, freight
forwarders, 3PL companies, and law firms.
+ Shipbuilding, shipyards, repair companies in the country.
+ Strong contributions to Maritime R&D.
Factor ConditionsHuman resources:
+ Skilled workforce (Competent people).
- High-cost labor.
Capital resources:
+ 134 million US dollars (Port infrastructure
investment).
- Lack of financing to invest in the modernization of the
Port of Long Beach
Knowledge resources:
+ Big pool of people with high level education.
+ Workforce, community, and education development.
Physical resources:
+ Access to public services.
Infrastructure:
- Regular conditions of public infrastructure: freeways,
roads, bridges, levees, rail lines, subways, rail
networks, water systems, ports, airports, schools,
internet access, public buildings, energy, etc.
+ San Pedro Bay Port Complex: capacity of 275 million
metric tons (6 specialized terminals).
Geographical position:
+ Access to the Pacific Ocean: western coast of North
America.
+ Proximity to potential suppliers (Asia, Canada,
Mexico) and buyers (Central and South America)
Connectivity
+ Alameda Corridor à 32 km long freight rail cargo
facility.
+ Hinterland connectivity: pedestrians, trucks, cars,
taxis, railroad, and barges.
- Road congestion at port area and terminals.
- Traffic congestion at rail crossings.
Demand Conditions+ Economic expansion.
+ Fifth-largest economy in the world
(39,536,653 consumers).
+ Number one exporting state.
+ Largest trade partner: China
- Low rates (port services and use of
infrastructure).
+ Strongest local market: agricultural
industry (44% exports)
+ Seventh-largest producer of crude
oil.
- High intermodal rail demand.
+ Digitalization.
+Sector’s demand: audiovisual,
health, agricultural, and technology.
Chance- The cooling of the economy on a global scale.
- The correction in the evolution of the stock mark.
- Scarcity of water resources and high droughts in the
state.
- Strikes constantly paralyze activities in the ports of
Los Angeles and Long Beach.
+ Industry automatization.
Government+ Free Trade Agreements (FTAs), with over 20 countries.
+ Rail project in California is subsidized by the Federal Government.
+The Long Beach City Charter grants the Long Beach Board of Harbor
Commissioners the final say on long term leases and agreements.
- High tariffs on imports.
+ Long Beach City Council = the Landlord (public sector).
+ Port operators and service providers (private sector).
Competitive
performance of the
port sector in
California
Port of Long
Beach
106
5.3.8 Porter’s diamond interpretation: Port of Long Beach
Practically the elements that drive or affect the competitiveness of the port of Long Beach in the
port sector, mainly in the container industry, are mostly the same as for the port of Los Angeles.
There are two reasons, firstly it is due to the great geographic proximity between these two ports,
hence certain factors appear to be the same, and secondly, it is due to the fact that Porter ’s
diamond model was implemented at a regional level (i.e. California). Despite the similarities, the
forecasted demand for the port of Long Beach is slightly different than for Los Angeles, which will
be described below.
Factor conditions
The port of Long Beach workforce has fueled economic growth in the region. Similarly, since it is
the second-busiest container seaport in the United States, port activity has generated 51,090
direct jobs. Port-related jobs have increased by 70% since 2004, mainly due to increased cargo
volume, generating jobs such as dock workers, crane operators, maintenance workers,
entrepreneurs, engineers, and technology specialists of the port information (Port of Long Beach,
2019). Under other conditions, the port’s Community Assistance Program aims to reduce the
impacts of the port activities in the city, by investing in projects to minimize impacts in relation to
air, noise, water, and traffic (Port of Long Beach, 2020b).
Respect physical resources and infrastructure, the port of Long Beach points out that the rail
network and intermodal facilities require public and private investment for expansion and
modernization, allowing it to adapt to future volumes of intermodal cargo. Additionally, channels,
turning basins, berths, and wharves also require extensions, reconfigurations, and modernization
to ensure the safe operation of ultra-large container ships (Port of Long Beach, 2020b). Among
the benefits of improving the quality of rail facilities is the reduction of traffic and truck congestion,
increasing the speed of containerized cargo moving through rail facilities. The port of Long Beach
states that the main reason for road congestion and bottlenecks is caused by the thousands of
trucks that transit in and out of the port terminals. Improving the flow of truck traffic is a priority for
this port, along with reducing emissions and negative impacts on the port’s ecosystem and
community (Port of Long Beach, 2020b).
107
Demand conditions
In order to supply the growing demand for cargo traffic such as containers, liquid bulk, dry bulk,
Ro-Ro, and general cargo, the port of Long Beach must ensure and guarantee that its existing
specialized terminals offer the correct and efficient operations. Like Los Angeles, this port
identifies that the increase in the US population and the growth of demand in the markets of
Southeast Asia, exert competitive pressures, both in installed capacity, carriers, change of
commercial routes, and low and competitive prices (Port of Long Beach, 2020b).
Additionally, the forecast for demand growth at the ports of Long Beach and Los Angeles
represents a 4% annual growth rate in container traffic, with 98% of container throughput coming
from international sources. Given the above, the port of Long Beach ensures that its container
handling capacity is approximately 13.6 million TEUs, having enough installed capacity to meet
the projected demand. However, the port indicates that it needs to expand the capacity of its
container yards, to generate better performance and productivity (Port of Long Beach, 2020b).
Related and supporting industries
The port of Long Beach notes that an industrial cluster is a geographic concentration of
interconnected companies, suppliers, associations, and institutions in a particular field (i.e. port
sector), sharing infrastructure, labor markets, and services, in order to gain competitive
advantages. For this reason, Long Beach has constantly worked to expand its variety of
commercial relationships with different national and foreign companies. However, the trucking
industry has stood out from the rest, reporting 136,950 registered trucking companies in California
(Fields and Hacegaba, 2013).
Furthermore, the port of Long Beach claims to have the capacity to handle containerized cargo or
other types of cargo, under the support of commercial providers such as truckers, shippers,
carriers, terminal operators, rail companies, shipping lines, ship agents, maritime labor unions,
commercial chambers, freight forwarders, legal services, ship finance agents, etc. (Fields and
Hacegaba, 2013).
Firm’s strategy, structure, and rivalry
The port of Long Beach handles imports and exports from more than 150 countries, despite this,
the ports located in the different countries of the Pacific Rim have stood out as new and potential
108
competitors for this port. The factors behind this trend are due to the growth of world trade, the
introduction of ultra-large container ships, and the same productivity of the port and its intermodal
service providers (Port of Long Beach, 2020b). Strong competition with its neighbor, the port of
Los Angeles, and the West Coast ports and even ports on the U.S. East and Gulf coasts, are
actors that directly affect the future growth of cargo volumes through the port of Long Beach. The
reality is that the port of Long Beach only handles 45% of the total cargo that is handled through
the San Pedro Bay port complex. As a result, the port’s participation in the container market varies
every year, which makes it difficult to ensure a competitive position in terms of volumes (Port of
Long Beach, 2020b). On the other hand, the port argues that future competition in the container
market will come from foreign ports, which shows that since 2006 a large part of the containers is
diverted to more efficient ports with a lower level of congestion (Port of Long Beach, 2020b).
The government
The Long Beach General Plan is a policy document that determines the goals, policies, and
directions the City must follow, implying that any decision will affect or benefit the port of Long
Beach. Moreover, the General Plan is concerned with the good use of land, transportation,
housing, conservation, noise, open space, and security (Port of Long Beach, 2020b). Additionally,
Long Beach continuously participates in regional planning of the Southern California Association
of Governments, the entity responsible for developing regional approaches to growth
management, transportation solutions, and economic development (Port of Long Beach, 2020b).
Differently, most of the land in the Long Beach Harbor District is owned by the port, while few
hectares within the port area are privately owned or leased by the Federal Government. Despite
this, the port does not directly operate the cargo handling facilities but is responsible for leasing
the land to private companies dedicated to the movement of goods, terminal operations, tugboats,
and distribution (Port of Long Beach, 2020b).
The chance
Changes in the world economy and trade policy, technological advances, and automation
developments are the main chance events that the port of Long Beach identifies as factors that
could affect the port’s competitiveness. Likewise, it remarks that the evolution of the size and
capacity of container ships is a consequence of technological changes, forcing ports to increase
installed capacity and expand port territory, actions that imply high investments and time (Port of
Long Beach, 2020b).
109
6 Discussion of the Results
6.1 Introduction
This chapter is intended to present an in-depth discussion on Manzanillo’s competitive position
and competitiveness vis-à-vis its competitors, namely the ports of Lázaro Cárdenas, Los Angeles,
and Long Beach. The SPA model analyzed the first competitive level proposed by Haezendonck
(2001), i.e. it analyzed the inter-port competition on a port authority level. Thereby, the PPA,
SSA, and PDA tools were used to analyze the competition between the four seaports mention
above, where their port authorities primarily pursue to increase the competitive position of their
seaports by providing adequate infrastructure or attracting public investment, optimizing working
conditions, and preventing monopoly activities.
While Porter’s diamond model analyzed two levels of competition proposed by Haezendonck
(2001), i.e. an inter-port competition on a port authority level and an inter-port competition
at the commodity level (categorized as the second level of competition), where port users from
different seaports compete to increase their market share, i.e. to lead the traffic of containerized
cargo.
6.2 SPA discussion: Port Competition
In Chapter 5, the SPA tool was carried out, providing indications of the general competitive
position and evolution of the ports of Manzanillo, Lázaro Cárdenas, Los Angeles, and Long Beach,
within the traffic categories of containers, general cargo, dry bulk, and liquid bulk. According to
Haezendonck et al. (2006), the term “competitive” is relevant, since this instrument provides an
evaluation of the comparative positioning of the four seaports. By integrating several tools within
the same model, i.e. PPA, SSA, and PDA, it allows an integrative description of the competitive
position of the individual ports, as well as the evolution of their position during the eleven years of
the period of observation.
This section aims to discuss the competitive position of the port of Manzanillo within the container
traffic category, vis-à-vis its three competitors. The author decided to focus specifically on
Manzanillo since the main objective of this research is to identify the strategic position of this port.
In general terms, the PPA results indicate that most of the time in the category of container traffic,
the port of Manzanillo has been positioned as “High Potential”, which means that the port has a
low market share but high growth rates. Hereby, Manzanillo can be classified as an individual
port with a high potential in the container industry. In this sense, growth rates are an
observable phenomenon over time, giving the probability that the market share will also grow,
110
positioning the port as “Star Performer”. It can be stated, that the port of Manzanillo within the
category of container traffic could reach high market share and high growth rates in the coming
years.
More in detail, level 1 of the PPA verifies that the port of Manzanillo has a lower market share for
total traffic compared to the big players, i.e. Los Angeles and Long Beach, despite that, its average
annual growth rate is quite favorable (4.24%), which gives it the advantage of continuing to grow
and increase its market share in the future. Following this, level 2 of the PPA confirms that within
the four categories of traffic (i.e. container, general cargo, dry bulk, and liquid bulk), the containers
are the category with the highest market share of the port, as well as the commodity with the
highest average annual growth rate. Concluding that the port of Manzanillo has positive
commercial behavior and strategic position.
Additionally, level 3 of the PPA indicates that Manzanillo’s competitive position within total
container traffic is favorable compared to its competitors. Its average market share is close to
the average (17.11%) and its average annual growth rate (5.73%) is fairly positive but lower than
its national competitor, i.e. Lázaro Cárdenas (16.90%). Furthermore, Manzanillo’s growth potential
is positive, but the strong competition with Los Angeles and Long Beach is present. However,
given that level 4 of the PPA analyzes the share of containers within the port of Manzanillo rather
than the category’s share of the range, on this occasion Manzanillo plays an important role
worldwide, positioning itself as a “Star Performer”, this means that the port has a high market
share and high growth rates in container traffic, which strongly boosts its competitive position.
Therefore, it can be established that containers are the most competitive traffic category for
the port. It is important to note that Manzanillo has an encouraging competitive position, but a
lower volume of traffic compared to the ports of Los Angeles and Long Beach. Despite this, its
participation in the container market is 58.92% of the total traffic volume.
The dynamic portfolio analysis showed the evolution of the four maritime ports within a period of
eleven years observed. In terms of the total traffic of the four cargo categories, Manzanillo
presents a positive evolution, increasing its market share over the years, nevertheless, the
results illustrate that it remains to be a developing port, presenting the potential to achieve long-
term sustainability. Similarly, compared to the ports of Los Angeles or Long Beach, Manzanillo
has not yet reached to stand out in the same level of global competition as them, despite
that, at the national level, Manzanillo distinguishes itself. Regarding container traffic, Manzanillo
plays an important role globally, positioning itself once again as “High Potential”, i.e. with a small
market share, but a positive average annual growth rate, boosting its competitive position.
111
On the other hand, taking into account the methodology described in Chapter 3 and the results
illustrated in Chapter 5, it is possible to state that during two observation periods of the SSA i.e.
2007 – 2011 and 2015 – 2019, the port of Manzanillo presented a positive commodity-shift, which
reflects that Manzanillo is specialized in the fastest growing traffic categories, i.e. container.
In like manner, the port has developed a favorable traffic structure during those two periods.
Nonetheless, in the period 2011 – 2015, it presented a negative commodity-shift, which reflects
an unfavorable traffic structure for this port. Despite that, during the three periods, Manzanillo
presented a positive competitiveness-shift, which implies that the port did better than expected. It
can be argued, that Manzanillo outperformed its rivals in the traffic containers. Hereby, it
can be concluded that the port Manzanillo has an overall improvement in the port’s market share
in different traffic categories.
Last but not least, based on the diversification indices of the port of Manzanillo, it can be mentioned
that the port has a strong degree of concentration in containers, but that does not take away
the opportunity to diversify its portfolio in the other three categories, i.e. general cargo, dry bulk,
and liquid bulk. Since Manzanillo is cataloged as the port container leader in the Pacific coast of
Mexico, gives the justification that its traffic structure is dominated by one specific traffic
category, i.e. containers. However, it is interesting to note that Los Angeles and Long Beach are
also ports with a strong degree of concentration in containers, but surprisingly the port of Lázaro
Cárdenas has a lower diversification index, which reflects the balance in volume among traffic
categories.
6.3 Porter’s diamond discussion: Port Competitiveness
As defined in Chapter 2, competition requires competitiveness, which means that, under
conditions of global competition within the container market, ports must be competitive vis-à-vis
their rivals. Therefore, as Goss (1990) asserts, the main economic function of a port is to benefit
those whose trade passes through it. This means that for their proper operations, ports must have
three fundamental elements: maritime access, good-handling capacity, and distributive capacity
(Meersman, Van de Voorde and Vanelslander, 2010).
Likewise, as Porter (1990) points out, productivity is the main factor of international
competitiveness, which consists merely of the skills of workers, the development of technologies,
the production of quality products, and the reduction of costs (Porter, 1998, p. 5 – 7). When
analyzing Porter’s diamond at the national level, it is determined that Manzanillo is a dynamic,
functional, and productive port for handling containers and other types of commodities,
112
however, there are operational aspects that must be improved, such as road congestion in entry
and exit from the port and urban areas, delays in administrative procedures and inspections,
insufficient coordination between customs authorities, and territorial limits of port expansion. If
these problems are not improved, the international competitiveness of the port will be drastically
affected.
Additionally, Heaver (1995) argues that terminals are also the main aspects of a competitive
strategy, i.e. port competition involves mainly competition for trades, with terminals as competing
physical units, transport concerns and industrial companies as chain representatives of the
respective trades (Notteboom and Yim Yap, 2012). Taking into account the above, it can be
established that Manzanillo has sufficient companies and networks of suppliers and distributors
that cooperate with the port industry and support it in international competition. Despite that, the
disadvantages prevail in operational terms and inefficient hinterland connectivity. On the
other hand, if the port of Manzanillo wants to face the growing demand for containers, it must also
work on expansion, modernization, and maintenance projects of its container terminals and private
infrastructure, since compared to its American competitors, Manzanillo only has two terminals
capable of handling containers, while Los Angles and Long Beach together have 15 terminals.
The previous analysis allows the researcher to conclude that the competitive position of a port is
determined by its competitive offer of services, connectivity, and infrastructure. While the
competitiveness of the port is determined by the range of competitive advantages that the port
acquires or creates over time (Haezendonck and Notteboom, 2002). Therefore, the author
concludes that the competitive position of the port of Manzanillo is directly related to its market
share, i.e. the strategic position that the port has acquired is through its containerized cargo flows
and other commodities, in spite of this, increasing its competitiveness in the global market will
allow to the port to improve its strategic position globally.
In other words, the factors that strengthen the competitiveness of the port of Manzanillo are mainly
the factor conditions, the related and supporting industries, the firm’s strategy, structure, and
rivalry, and the role of the government. While the elements of demand conditions, i.e. the
requirements of buyers in terms of quality, price, and services in the container industry, have not
yet been fully met since certain operational aspects show to be Manzanillo's competitive
disadvantages.
Hereby, it is concluded that the competitive advantages that the port of Manzanillo has are mainly
its geographical position on the Pacific coast, its rail network, its good quality of highways, its
113
network of local and foreign suppliers, its two specialized terminals containers, and its safe social
climate. To strengthen its competitiveness, it is necessary to solve or improve the operational
problems mentioned above, therefore, the following section presents three strategies or
recommendations that the researcher believes that API Manzanillo (i.e. the port authority) together
with the terminal operators should address.
1. Streamline customs and tax procedures in the port of Manzanillo
The adoption of new information technologies will allow the exchange of information in real-time
between the customs agents, prosecutors, and port operators involved in the handling and
inspection of the containerized cargo in the port of Manzanillo (Cortés Pérez, 2016). Digitization
strategies and initiatives allow better control and management of port information, which makes
logistics processes more efficient. Similarly, digital solutions increase the added value of the port,
through transparent, fast, efficient, and safe activities (Cortés Pérez, 2016). Thus, it can be stated
that this strategy will reduce delays in administrative, customs, and inspection procedures. In
addition, it will improve coordination between authorities and port users (i.e. truckers, shippers,
terminal operators, shipping lines, etc.).
2. Modernization, expansion, and conservation of transport infrastructure
An essential aspect of being a competitive port is having a public and private infrastructure that
generates the lowest production costs, as well as providing efficient and safe inland connectivity
(Cortés Pérez, 2016). As identified in Porter’s diamond model, Manzanillo presents road
congestion at the entrance and exit of the port and urban areas. Therefore, because the port and
the Mexican economy have expectations of high growth in international trade and container traffic,
it is essential to solve this issue. In order for the port to offer time guarantees to its clients and
efficient port services, the SCT and CGPyMM must develop and implement projects to modernize
and expand public infrastructures inside and outside the port, such as roads, highways, in and out
port gates, new transit routes, and bridges. Similarly, terminal operators must respond to the
challenges of global competition, modernizing and expanding the installed capacity and yards of
the two specialized container terminals (Cortés Pérez, 2016).
3. Tariff System
Lastly, as indicated by the SCT, Mexican ports must implement a new productivity rate scheme.
The implementation of a new standardized rate system will allow API Manzanillo to establish
promotional rates for the use of port infrastructure and port services, the purpose is to promote
114
mainly the arrival of container ships, i.e. containerized cargo. Consequently, a tariff scheme will
result in the establishment of rates according to the total costs, in the same way, it will allow the
port to be more attractive for its clients and more competitive vis-à-vis its rivals (SCT, 2018).
To conclude this section, it is important to point out that global competition has generated changes
in the way of participation of those who intervene in international logistics chains, i.e. seaports,
port terminals, authorities, transport companies, etc. Hence, it is believed that the same dynamism
of international competition has caused technological innovations, modernization in specialized
infrastructure, increased specialization of the workforce, increment financial interest, alliances of
service providers, and environmental and safety regulations. Maintaining the strategic position
and competitiveness of the port of Manzanillo is a challenging task, which requires dedication and
anticipation from API Manzanillo, the Mexican government, and all the port users involved (SCT,
2008b).
115
7 Conclusions
Port of Manzanillo is a fundamental piece in the economy and international trade of Mexico.
Undoubtedly, the port has a world-class infrastructure in its specialized container terminals, enjoys
a good quality of highways and rail networks, and is driven by a competent national and
international network of suppliers, however, the key to success lies in the development and
integration of all the services that can be used through it, as well as the efficiency in the
connectivity and distribution of the goods, as a result, global players can identify Manzanillo as a
competitive, functional, efficient, and safe gateway. Taking into account the above, through
scientific literary reviews, interviews, secondary data collection, and the execution of both
quantitative and qualitative methods (i.e. the SPA and Porter’s diamond model), it was possible
for the author to determine the positive competitive position in which the port of Manzanillo is
currently set within the container industry, along with the factors that drive or affect its
competitiveness.
The main contribution of this study was the strategic combination of primary and secondary data
that allowed the researcher to develop and provide strategic recommendations to API Manzanillo
(i.e. port authority) in order to achieve a higher level of competitiveness to the port of Manzanillo
and Mexico within of the container industry. Certainly, evaluating and analyzing Manzanillo ’s
competitive position allows us to understand its market share in the containerized industry, this
being a good indicator to study the evolution of the port in a given period of time. However, the
evaluation of Manzanillo’s competitiveness makes it possible to determine the port’s capacity to
react to competitive threats from the external environment, i.e. from the ports of Lázaro Cárdenas,
Los Angeles, and Long Beach. Once these key factors have been identified, the objective is to
define strategies that help to maintain or increase the market share of the port of Manzanillo and
consequently raise the level of competitiveness.
7.1 Answering Research Questions
This section aims to present the empirical findings of the research question and sub-questions
presented in Chapter 1, all on solid foundations acquired during the literary review of Chapter 2,
the collection of primary data (i.e. interviews), the collection of secondary data (i.e. annual reports,
port statistics, master plans, journal articles, scientific literature, and books), and the execution of
the SPA technique and Porter’s diamond model.
116
Additionally, it is important to remember that the approach of this study has been solely focused
on container traffic, therefore, all the answers and arguments are related to the competition and
competitiveness of the port of Manzanillo in the context of the containerized cargo industry.
1. Research question: What competitive determinants underly the competitive position of the
port of Manzanillo in the container industry?
In this study, during the observation period of eleven years (2007 – 2019), the port of Manzanillo
stood out for being the most dynamic port on the Pacific Coast of Mexico within the container
segment. Similarly, according to the results of the SPA, Manzanillo shows a positive competitive
position in the container market, with a low market share, but a high annual growth rate. It also
demonstrated its positive specialization and commercial increase in the containerized cargo
category, together with a fairly high diversification index, which reaffirms its specialization in this
traffic category.
Taking Notteboom and Yim Yap (2012) as reference, it is established that the determinants of
competitiveness that have driven this strategic position of Manzanillo are mainly its proximity to
the production and consumption centers of the Central and Bajío (western) regions of Mexico, the
good conditions of the highways and rail network, its low production costs, its commercial power
in carriers and shippers, its ability to satisfy current demand, its healthy competition within the port
area, its ability to face the challenges posed by the new business logistics environment, strong
participation of the private sector in container terminal operations, and the perception of the port
as a key driver of the local and national economy.
The competitive position of the port of Manzanillo is also driven by regional factors (i.e. competitive
advantages), such as its geographic location, its public and private infrastructure, government
policies and its performance in the container segment compared to the rest of the Mexican ports.
However, it is important to remember that the complexity of the port sector affects the way in which
other port users perceive, interpret, measure, and imply these determinants of competitiveness
(Notteboom and Yim Yap, 2012).
2. Sub-research question: In terms of containerized cargo traffic, which are the main
competitors of the port of Manzanillo in the Pacific Rim?
In order to answer this first sub-question, three interviews were conducted with experts in the port
sector of Mexico, i.e. three members of API Manzanillo supported this research. Similarly, to
117
confirm the certainty of the findings, secondary data was collected and used, such as annual
reports, port statistics, and port master plans. Thus, it is determined that the main container cargo
competitor in Mexico is the port of Lázaro Cárdenas, located in the state of Michoacán 300 km
away from Manzanillo, followed by two US ports located in the state of California, namely, the
ports from Los Angeles and Long Beach. According to the interviews, what justifies the strong
international competition between these ports, prevails merely in their installed capacity, a strong
network of suppliers, influence on domestic demand, and the competition of import and export
containers from Southeast Asia, mainly China, South Korea, and Japan.
3. Sub-research question: What have been the strategies of the Port Authority and the terminal
operators that have prompted the port of Manzanillo to perform so well?
The interviews were the main source of information to answer this sub-question, along with the
PMDP21 2015 – 2020 of Manzanillo. Hereby, it was concluded that the development plans by the
Mexican Government are a key aspect of the port’s success, the strong public and private
investment in the Manzanillo port sector, the concessions with container terminals operated by
international companies, the private infrastructure (world-class quality), the modernization of deep
drafts, and the expansion of berths to receive large container ships have been the main strategies
of API Manzanillo and its port operators. In addition, the interviewees stated that vertical
integration between the different stakeholders has allowed the port to operate containerized cargo
more efficiently.
4. Sub-research question: According to API Manzanillo, what type of port does Manzanillo want
to become in the coming years?
Through interviews with members of the port of Manzanillo and the collection of secondary data,
such as Government reports and port master plans, it is concluded that Manzanillo together with
its stakeholders have the vision of being recognized as “The leading Latin American container
port in the Pacific Ocean, with world-class and sustainable infrastructure and operations, linking
from Mexico the productive multimodal logistics chain between America and Asia.” (API
Manzanillo, 2014d).
21 Port Master Development Program 2015 – 2020 of the port of Manzanillo.
118
Likewise, the commercial projection and vision of the port of Manzanillo were confirmed with the
results obtained from the SPA. As stated in Chapter 5, the port of Manzanillo is characterized by
a high percentage of a particular traffic category, i.e. containers. Likewise, Manzanillo has clearly
shown rapid growth for container traffic, with an average annual growth rate of 5.73% and a market
share of 7.23% at level 3 of the PPA. Meanwhile, at level 4 of the PPA, Manzanillo has positioned
itself as “Star Performer”, which means that the port in the container segment presents a high
market share and high growth rate, however it is believed that long-term sustainability is not
guaranteed in this position. The findings indicate that Manzanillo can be classified as an individual
port with a high potential in the container industry, reaffirming the vision and ambition of this
maritime port.
5. Sub-research question: What is the strategic competitive position of the port of Manzanillo
in the container segment?
This question is solved through the results obtained by the full implementation of the SPA
(composed of three analytical tools: PPA, SSA, and PDA) and is complemented with the collection
of secondary data, such as annual reports, port statistics, and the PMDP 2015 – 2020 of
Manzanillo. Given the above, it is concluded that the port of Manzanillo has a positive competitive
position as “High Potential”, which means that the port has a low market share but high growth
rates. Consequently, Manzanillo is classified as an individual port with high potential in the
container industry. Likewise, its growth rates are an observable phenomenon over time, giving the
probability that its market share will also increase, achieving a position in the future as “Star
Performer”. In other words, the port of Manzanillo within the category of container traffic could
achieve high market share and high growth rates in the coming years.
Moreover, during two observation periods in the SSA, i.e. 2007 – 2011 and 2015 – 2019, the port
presented a positive competitiveness-shift and commodity-shift, which reflects that Manzanillo has
a positive competitive position and is specializing in the fastest growing traffic, i.e. container.
Therefore, it is concluded that the Manzanillo has an overall improvement in the port’s market
share in different traffic categories but especially containers. Additionally, the annual port statistics
of Manzanillo (i.e. secondary data) shows the evolution that the port has had in the container
traffic, since during the eleven years of observation the port has experienced an important growth
of volume, positioning itself as the leading port on the Pacific coast in Mexico.
119
6. Sub-research question: Does the port of Manzanillo have a strategy to diversify its cargo
traffic portfolio? or Does it specialize in handling only one type of cargo? If so, what type of
cargo?
The Product Diversification Analysis (PDA) was the main tool used to answer this sub-question,
while the interviews were necessary to confirm the results obtained. Since the study distinguishes
four categories of traffic (i.e. containers, general cargo, dry bulk and liquid bulk), the minimum
value of the index is 0.25, which indicates the highest possible level of diversification in terms of
traffic volume. Taking the above into account, Manzanillo’s diversification indices22 show that the
port is specialized in a specific cargo, i.e. containers. Reaffirming the above, in 2019 the port
presented a diversification index of 0.43, a value that is much closer to the maximum degree of
specialization (index = 1) instead of a maximum possible diversification (index = 0.25). Therefore,
Manzanillo’s indices reflect a high degree of inequality, concluding that nowadays the port of
Manzanillo is specialized in container traffic.
Similarly, the interviewees argue that the port has installed capacity to serve different markets,
such as mineral bulk, agricultural bulk, general cargo, automobiles, oil derivatives products,
natural gas, and containers, despite that, the same domestic and foreign market has forced it to
specialize in containers. In addition, they also point out that this does not take away the possibility
that the port may diversify its portfolio in the future.
7. Sub-research question: What are the competitive advantages of the port of Manzanillo that
have allowed it to grow its merchandise traffic volumes annually, especially containerized
cargo?
The secondary data described in Chapter 4 and the results obtained from Porter’s diamond model
at the national level were the sources of information necessary to answer this question. Hence, it
is concluded that the competitive advantages of the port of Manzanillo that have allowed it to
annually increase its volumes of container traffic and its competitiveness are: its geographical
position, good quality of highways, rail network, zone of influence23, national and international
network of suppliers, public and private infrastructure, two specialized container terminals, and its
safe social climate.
22 Corresponding to the total “unweighted” traffic during the eleven years (2007 – 2019). 23 42.1% of Mexico’s gross domestic product.
120
The privileged geographic location on the Pacific coast and the excellent conditions of the roads
and railways connect the port with the central states and the Bajío regions of Mexico, which have
fostered the dynamism of the Mexican economy and increased the traffic of containers (API
Manzanillo, 2014b). Besides, the port of Manzanillo has expanded its trade routes and increased
its cargo volume through commercial relationships with international shipping lines, truckers,
carriers, port terminals, port operators, ship agents, freight forwarders, equipment suppliers,
insurance agencies, etc.
On the other hand, within the 437 hectares of total area, the port has 14 private terminals and
facilities for handling all types of cargo, of which two are dedicated solely to the handling of
containers, allowing it to compete with other ports in the Pacific Rim. Thus, through the two
container terminals (i.e. SSA México and Contecon Manzanillo) the port has a total throughput
capacity of 4,350,000 TEUs per year (Inter-American Development Bank, 2015).
8. Sub-research question: What are the competitive advantages of Mexico in the global
container industry?
To solve this last sub-research question, it was necessary to collect secondary data and executed
Porter’s diamond model at a national level. Hereby, the results determine that Mexico’s
competitive advantages in the container industry are mainly its geographical position with access
to the Pacific and Atlantic oceans and the Caribbean, Cortés, and Gulf of Mexico seas, giving it
strategic proximity to potential suppliers (Asia, Europe, Oceania) and buyers (North America,
Central, and South America), its more than 11 thousand kilometers of coastline and 102 seaports,
the restructuring of the national port system with the administration of API, its capital resources
for investment in public infrastructure, its 14 FTAs with more than 50 countries, the consolidation
of the port systems of the Gulf of Mexico and the Pacific coast, its low barriers to entry into the
transportation industry, and an attractive regulatory and business environment.
7.2 Research Limitations
Regarding the empirical analysis carried out in this research, the author faced different limitations
in this study, which are presented below:
The primary data of this study were collected only through three interviews conducted with
two active members and one inactive member of API Manzanillo (i.e. Port Authority),
thereby, the analysis of the information only focused on the perspective of the port
121
authority in relation to the performance, productivity, and competitiveness of the port
without considering the points of view of the port operators or other port users
(stakeholders). In addition, part of the limitation that arose during the interviews was the
distance and time zone, therefore, all the interviews were conducted through digital tools
(i.e. email and Skype), limiting the possibility to meet physically the operations and
environment of the port. As a consequence, the primary data collection was based solely
on the responses, points of view, and knowledge obtained by the three interviewees.
The official websites of the two American ports (i.e. Los Angeles and Long Beach) do not
publish the annual port statistics in metric tons, on the contrary, their statistical data are
only represented in TEU and metric revenue tons (MRT). However, a revenue ton (RT) is
a measure that is used for billing purposes, thus the MRT measure represents a
combination of metric tons, cubic meters, and port revenue (Port of Los Angeles, 2019a),
which is not compatible or comparable with the metric tonnage figures of the ports of
Manzanillo and Lázaro Cárdenas. Since the author faced this limitation, she contacted the
statistics departments of both ports, in order to request support. As a solution, the author
collected these secondary data (i.e. port statistics) through a database of the American
Government, known as the “U.S. Census Bureau”, where all statistical and commercial
data are compiled and published by the US Customs. Consequently, the port statistics for
Los Angeles and Long Beach used to execute the SPA model correspond to those
mentioned above.
Last but not least, given that the ports of Manzanillo and Lázaro Cárdenas do not publish
their port statistics specifying the volume corresponding to exports, imports. or
transshipments, but only publish the total annual volume per year, the data entered in the
SPA tool are only equivalent to the total annual traffic of each of the four ports. As a
consequence, the results obtained represent the evolution of the four ports in terms of
total traffic, without being able to carry out a more in-depth analysis in terms of import or
export volumes. Fortunately, this limitation does not affect the reliability of the results,
since the main objective of the study is to analyze in general terms the competitive position
and commercial evolution of Manzanillo compared to its competitors.
7.3 Recommendation for Future Research
Despite the limitations faced, the author has done great effort to produce valid and reliable results.
In this way, it is firmly believed that the limitations of the research and the final results obtained
regarding the competitive position and competitiveness of the port of Manzanillo open up
122
opportunities for future research. Therefore, below the researcher presents a number of
recommendations:
The observation period to be determined for the efficient use of the SPA method can be
extended to 15 – 25 years, which will lead to more precise analysis.
This study focused specifically on container traffic; nonetheless, other categories of traffic
deserve attention for future research.
Develop “weighting” coefficients for the ports of Mexico and the United States, in order to
be able to properly use the concept of added value in comparative studies of the
merchandise traffic of the ports to be analyzed.
The same analysis of this research can be performed by focusing only on port actors,
such as shipping lines, terminal operators, and ship agents. Or else, future research could
carry out a combined analysis, considering the participation of port authorities and their
stakeholders.
7.4 Final Conclusions
It is possible to state that this study took into account the important difference between the world’s
seaports, each differentiating itself by its roles, assets, functions and institutional organizations
(Bichou and Gray, 2005). The author carried out an analytical research based on the main
functions of container ports, followed by the correct definition of port competition and the levels of
competition that can be identified within or outside the same seaport. Similarly, it was considered
that the competitiveness of a port is determined by the range of competitive advantages that the
port acquires or creates over time (Haezendonck and Notteboom, 2002).
Hereby, based on the reviewed scientific literature and the performance of quantitative and
qualitative analyzes, this thesis has determined the strategic position of the port of Manzanillo
(Mexico) in its competitive environment during the observation period of eleven years (2007 –
2019) vis-à-vis its main competitors located in the Pacific Rim, within the container segment. With
solid and reliable results, it is concluded that Manzanillo has reached a positive competitive
position as “High Potential” within the containerized cargo industry, presenting low market share
but high growth rates. This port evolution is the result of the strategic and competitive planning of
the Government of Mexico and API Manzanillo, whose long-term vision is to be recognized as a
leading port in container traffic, mainly in trade with Asia.

123
In addition, this competitive position has been achieved through the continuous modernization and
expansion of the port, investment in infrastructure outside and within the port, the development of
road and rail networks, vertical integration between all the industries of the port sector, and growth
of the Mexican Economy. Without a doubt, the port of Manzanillo is a fundamental piece in the
shipping industry and the country’s economy, therefore, the analysis of the aspects that promote
or affect the competitiveness of the port is a basic task for its port authority and all the port users.
124
Bibliography
Alarcon, N. (2015). Maritime routes of America. [image online]. Available at: https://es.slideshare.net/noelia101010/geografia-48166095 [Accessed 3 Aug. 2020].
API Altamira (2020). Port Statistics. [online] Gobierno de México. Available at: https://www.puertoaltamira.com.mx/esps/0000214/estadisticas [Accessed 26 May 2020].
API Ensenada (2019). Port Statistics. [online] Gobierno de México. Available at: https://www.puertoensenada.com.mx/esps/0000633/estadisticas-publicas [Accessed 26 May 2020].
API Lázaro Cárdenas (2012a). About us. [online] Gobierno de México. Available at: https://www.puertolazarocardenas.com.mx/plc25/nosotros-somos [Accessed 6 Aug. 2020].
API Lázaro Cárdenas (2012b). Port Infrastructure. [online] Gobierno de México. Available at: https://www.puertolazarocardenas.com.mx/plc25/infraestructura.
API Lázaro Cárdenas (2014). Port Master Development Program (PMDP) Lazaro Cardenas 2015-2020. [online] API Lazaro Cardenas, Gobierno de México, pp.1–70. Available at: https://www.puertolazarocardenas.com.mx/Docs%20pdf/marcolegal/pmdp%202015_2020.pdf [Accessed 22 Jun. 2020].
API Lázaro Cárdenas (2020). Port Statistics. [online] Gobierno de México. Available at: https://www.puertolazarocardenas.com.mx/plc25/estadisticas [Accessed 26 May 2020].
API Manzanillo (2014a). General Information. [online] Gobierno de México. Available at: https://www.puertomanzanillo.com.mx/engs/0020207/general-information [Accessed 20 Jul. 2020].
API Manzanillo (2014b). Hinterland. [online] Gobierno de México. Available at: https://www.puertomanzanillo.com.mx/engs/0020202/hinterland [Accessed 17 May 2020].
API Manzanillo (2014c). Location. [online] Gobierno de México. Available at: https://www.puertomanzanillo.com.mx/engs/0020201/location [Accessed 19 May 2020].
API Manzanillo (2014d). Port Master Development Program (PMDP) Manzanillo 2015-2020. [online] API Manzanillo, Manzanillo: Gobierno de México, pp.1–74. Available at: http://www.puertomanzanillo.com.mx/upl/sec/2498465408096887489bc3c57a5b76e27f6d4865.pdf [Accessed 22 Jun. 2020].
API Manzanillo (2015). Port of Manzanillo - Port Handbook 2014 - 2015. [online] Gobierno de México, Mexico: Gobierno de México, pp.1–53. Available at: http://www.puertomanzanillo.com.mx/esps/2110569/handbook [Accessed 20 May 2020].
API Manzanillo (2019). The logistics infrastructure of western Mexico to boost exports. [image online]. Available at: https://docplayer.es/112543028-La-infraestructura-logistica-del-occidente-de-mexico-para-el-impulso-de-las-exportaciones-administracion-portuaria-integral-de-manzanillo.html [Accessed 3 Aug. 2020].
125
API Manzanillo (2020a). Merchandise. [online] Gobierno de México. Available at: https://www.puertomanzanillo.com.mx/esps/2110535/mercancias [Accessed 19 May 2020].
API Manzanillo (2020b). Port Statistics. [online] Gobierno de México. Available at: http://www.puertomanzanillo.com.mx/esps/0000209/estadisticas [Accessed 26 May 2020].
API Veracruz (2019). Port Statistics. [online] Gobierno de México. Available at: https://www.puertodeveracruz.com.mx/wordpress/estadisticas-2/ [Accessed 26 May 2020].
APILAC (2013). Hinterland and Foreland. [online] Gobierno de México. Available at: https://www.puertolazarocardenas.com.mx/plc25/hinterland-y-foreland [Accessed 4 Aug. 2020].
APILAC (2016). Handbook Port of Lázaro Cárdenas. [online] Issuu, pp.1–148. Available at: https://issuu.com/puertolazarocardenas/docs/handbook_puerto_lc [Accessed 4 Aug. 2020].
Araceli, P. (2015). Port of Lázaro Cárdenas. [image online]. Available at: https://slideplayer.es/slide/2732795/ [Accessed 5 Aug. 2020].
ASCE (2019). REPORT CARD FOR CALIFORNIA’S INFRASTRUCTURE. [online] American Society of Civil Engineers, United States: American Society of Civil Engineers, pp.1–132. Available at: infrastructurereportcard.org/wp-content/uploads/2018/10/FullReport-CA_051019.pdf [Accessed 24 Aug. 2020].
Bakan, İ. and Doğan, İ.F. (2012). COMPETITIVENESS OF THE INDUSTRIES BASED ON THE PORTER’S DIAMOND MODEL: AN EMPIRICAL STUDY. ARPAPRESS, [online] Vol. 11(Issue 3), pp.441–455. Available at: https://www.arpapress.com/Volumes/Vol11Issue3/IJRRAS_11_3_10.pdf [Accessed 23 Jul. 2020].
Basta, M. and Morchio, E. (2008). Competitiveness, growth and logistics implications: The case of the port of Genoa. ResearchGate, [online] Vol.22(Issue 1), pp.115–134. Available at: https://www.researchgate.net/publication/242575417_Competitiveness_growth_and_logistics_implications_The_case_of_the_port_of_Genoa [Accessed 28 Jul. 2020].
Baxter, P. and Jack, S. (2008). Qualitative Case Study Methodology: Study Design and Implementation for Novice Researchers. The Qualitative Report, [online] Vol. 13(Issue. 4), pp.544–556. Available at: https://nsuworks.nova.edu/tqr/vol13/iss4/2/ [Accessed 2 Aug. 2020].
Bichou, K. and Gray, R. (2005). A critical review of conventional terminology for classifying seaports. Elsevier, [online] Vol. 39(Issue 1), pp.75–92. Available at: https://www.sciencedirect.com/science/article/pii/S0965856404001089 [Accessed 27 Jul. 2020].
Bobadilla Falla, J.D. and Venegas Camargo, A. (2018). LA IMPORTANCIA DE LOS PUERTOS DENTRO DE LA ECONOMIA EN COLOMBIA Y SUS PAISES FRONTERIZOS. Punto de vista, [online] Vol. 9(Issue 13), pp.1–14. Available at: https://go.gale.com/ps/anonymous?id=GALE%7CA556468075&sid=googleScholar&v=2.1&it=r&linkaccess=abs&issn=0123580X&p=IFME&sw=w [Accessed 22 Jul. 2020].
Braymer, N.T. (2017). Rail Service as a Public, Private Partnership. [image online]. Available at: https://ntbraymer.wordpress.com/2017/11/10/rail-service-as-a-public-private-partnership/ [Accessed 6 Aug. 2020].
126
Carranza, O. (2018). Port Analysis. [online] Gobierno de México, México: Ministry of Economy., pp.1–380. Available at: https://www.gob.mx/cms/uploads/attachment/file/323755/An_lisis3-5.pdf [Accessed 28 Aug. 2020].
Carter, N., Bryant-Lukosius, D., DiCenso, A., Blythe, J. and Neville, A.J. (2014). The Use of Triangulation in Qualitative Research. Oncology Nursing Forum, [online] Vol. 41(Issue 5), pp.545–547. Available at: https://www.researchgate.net/profile/Irfan_Abro2/post/What_is_triangulation_of_data_in_qualitative_research_Is_it_a_method_of_validating_the_information_collected_through_various_methods/attachment/5e591bb63843b0499feacb8c/AS%3A863551384219650%401582898102483/download/Triangulation.pdf [Accessed 4 Aug. 2020].
Cartwright, W.R. (1993). Multiple Linked “Diamonds” and the International Competitiveness of Export-Dependent Industries: The New Zealand Experience. Management International Review, Vol. 33(Issue 2), pp.55–70.
Chlomoudis, C.I. and Pallis, A.A. (1998). Ports, Flexible Specialisation, and Employment Patterns. World Conference on Transport Research, Vol. 8(Issue 1), pp.777–780.
Contecon Manzanillo (2020). Stages of development and capabilities. [online] Contecon Manzanillo. Available at: http://www.contecon.mx/web/inic-etdc/etapas-de-desarrollo-y-capacidades/ [Accessed 22 May 2020].
Cortés Pérez, A. (2016). Mexican Port System (FIRST LATIN AMERICAN AND CARIBBEAN REGIONAL MEETING OF PORT LOGISTICS COMMUNITIES). [online] SCT, Panama: SCT, pp.1–24. Available at: http://s017.sela.org/media/2303885/14-sistema-portuario-mexicano.pdf [Accessed 18 Aug. 2020].
Cousin, G. (2005). Case Study Research. Journal of Geography in Higher Education, Vol. 29(Issue 3), pp.421–427.
CPCS Transcom Limited (2018). Port Performance and Terminal Operator Numbers. [online] CPCS, Canada: CPCS Transcom Limited, pp.1–38. Available at: https://aeic-iaac.gc.ca/050/documents/p80054/130086E.pdf [Accessed 20 Jul. 2020].
Creswell, J.W. (2012). Qualitative Inquiry and Research Design: Choosing Among Five Approaches. 1 st ed. SAGE Publications, p.97.
Dang, V.L. and Yeo, G.T. (2017). A Competitive Strategic Position Analysis of Major Container Ports in Southeast Asia. Elsevier, [online] Vol. 33(Issue 1), pp.19–25. Available at: https://www.sciencedirect.com/science/article/pii/S2092521217300032 [Accessed 22 Jul. 2020].
Day, G.S. (1984). Strategic Market Planning: The Pursuit of Competitive Advantage. West Publishing Company.
De Langen, P.W. and Pallis, A.A. (2006). ANALYSIS OF THE BENEFITS OF INTRA-PORT COMPETITION. International Journal of Transport Economics, [online] Vol. 33(Issue 1), pp.69–85. Available at: https://www.researchgate.net/profile/Athanasios_Pallis3/publication/23746014_Analysis_Of_The_Benefits_Of_Intra-Port_Competition/links/02e7e51c0ccd56e2fd000000/Analysis-Of-The-Benefits-Of-Intra-Port-Competition.pdf [Accessed 27 Jul. 2020].
127
De Lombaerde, P. and Verbeke, A. (1989). Assessing international seaport competition: A tool for strategic decision making. International Journal of Transport Economics, Vol. 15(Issue 2), pp.175–192.
Deng, A., Yeo, A. and Du, L. (2018). A Study on Gwadar Port International Competitiveness using Porter’s Diamond Model. World Journal of Innovative Research (WJIR), Vol. 4(Issue 1), pp.01–07.
DGMM (2016). REGULAR MARITIME TRANSPORTATION SERVICES IN MEXICO 2016. [online] SCT, Mexico: SCT, pp.1–154. Available at: https://www.gob.mx/cms/uploads/attachment/file/175209/Sev_Trans_Mar_2016_ultimo.pdf [Accessed 18 Aug. 2020].
DICEX Integral Trade (2019a). Mexican port system. [online image] DICEX Integral Trade. Available at: https://dicex.com/en/seaports-and-their-role-in-mexico/ [Accessed 5 Aug. 2020].
DICEX Integral Trade (2019b). Seaports and their role in Mexico. [online] DICEX Integral Trade. Available at: https://dicex.com/en/seaports-and-their-role-in-mexico/ [Accessed 19 May 2020].
Dunning, J.H. (1996). The geographical sources of the competitiveness of firms: Some results of a new survey. University of Reading, pp.1–29.
Dunning, J.H. (1997). A Business Analytic Approach to Governments and Globalization. Oxford: Oxford University Press, pp.115–131.
Dyer, W.G. and Wilkins, A.L. (1991). Better Stories, Not Better Constructs, To Generate Better Theory: A Rejoinder to Eisenhardt. The Academy of Management Review, Vol. 16(Issue 3), p.613.
ECLAC (2019). Port activity report of Latin America and the Caribbean 2018. [online] ECLAC - United Nations. Available at: https://www.cepal.org/en/notes/port-activity-report-latin-america-and-caribbean-2018 [Accessed 26 May 2020].
Eisenhardt, K.M. (1991). Better Stories and Better Constructs: The Case for Rigor and Comparative Logic. The Academy of Management Review, Vol. 16(Issue 3), pp.620–627.
Eisenhardt, K.M. and Graebne, M.E. (2007). Theory Building From Cases: Opportunities And Challenges. Academy of Management Journal, Vol. 50(Issue 1), pp.25–32.
European Commission (2017). The Shipping MRV Regulation – Determination of cargo carried. [online] European Commission, European Sustainable Shipping Forum Sub-group on Shipping MRV Monitoring: European Commission, pp.1–10. Available at: https://ec.europa.eu/clima/sites/clima/files/docs/0108/20170517_guidance_cargo_en.pdf [Accessed 4 Sep. 2020].
Fields, T. and Hacegaba, N. (2013). The Case for an Industry Cluster at the Port of Long Beach. [online] Los Angeles Area Chamber of Commerce, Long Beach: Los Angeles Area Chamber of Commerce, pp.1–25. Available at: https://lachamber.com/clientuploads/globalinitiatives_committee/Industry%20Clusters%20Presentation%20for%20LA%20Chamber%20GIC_9.21.pdf [Accessed 25 Aug. 2020].
128
Fleisher, C.S. and Bensoussan, B.E. (2007). BUSINESS AND COMPETITIVE ANALYSIS: Effective Application of New and Classic Methods. 1st ed. FT Press.
Galván-Villa, C.M. and Rios-Jara, E. (2020). Location of the port of Manzanillo. [image online]. Available at: https://www.researchgate.net/publication/321304160_First_detection_of_the_alien_snowflake_coral_Carijoa_riisei_Duchassaing_and_Michelotti_1860_Cnidaria_Alcyonacea_in_the_port_of_Manzanillo_in_the_Mexican_Pacific [Accessed 3 Aug. 2020].
Goss, R.O. (1990). Economic policies and seaports: Are port authorities necessary? Maritime Policy & Management, [online] Vol. 17(Issue 4), pp.257–271. Available at: https://www.tandfonline.com/doi/abs/10.1080/03088839000000032 [Accessed 27 Jul. 2020].
Grant, R.M. (1991). Porter’s ‘competitive advantage of nations’: An assessment. Strategic Management Journal, Vol. 12(Issue 7), pp.535–548.
Gustafsson, J. (2017). Single case studies vs. multiple case studies: A comparative study. DiVA, [online] Vol. 1(Issue 1), pp.1–15. Available at: https://www.diva-portal.org/smash/get/diva2:1064378/FULLTEXT01.pdfig [Accessed 4 Aug. 2020].
Haezendonck, E. (2001). Essays on Strategy Analysis for Seaports. 1st ed. Garant Publishers, pp.6–38.
Haezendonck, E. and Notteboom, T. (2002). The competitive advantage of seaports. In M. Huybrechts, H. Meersman, E. Van de Voorde, E. Van Hooydonk, A. Verbeke and W. Winkelmands (eds.), Port Competitiveness: An Economic and Legal Analysis of the Factors Fetermining the Competitiveness of Seaports, pp.67–88. Antwerp: De Boeck.
Haezendonck, E., Pison, G., Rousseeuw, P., Struyf, A. and Verbeke, A. (2000). The Competitive Advantage of Seaport. IJME, Vol. 2(Issue 2), pp.69–82.
Haezendonck, E., Verbeke, A. and Coeck, C. (2006). Strategic Positioning Analysis for Seaports. Elsevier, [online] Vol. 16(Issue 1), pp.141–169. Available at: https://www.sciencedirect.com/science/article/pii/S0739885906160072 [Accessed 27 Jul. 2020].
Hamburg Süd (2020). Ports & Terminals. [image online]. Available at: https://www.hamburgsud-line.com/liner/en/liner_services/country_information/united_states/usa_ports_terminals_depots_united_states/index.html [Accessed 6 Aug. 2020].
Heale, R. and Forbes, D. (2013). Understanding triangulation in research. BMJ Journals, [online] Vol. 16(Issue 98), p.4. Available at: https://ebn.bmj.com/content/16/4/98.short [Accessed 4 Aug. 2020].
Heaver, T.D. (1995). The implications of increased competition among ports for port policy and management. Maritime Policy & Management, [online] Vol. 22(Issue 2), pp.125–133. Available at: https://www.tandfonline.com/doi/abs/10.1080/03088839500000045 [Accessed 27 Jul. 2020].
Hox, J.J. and Boeije, H.R. (2005). Data Collection, Primary vs. Secondary. Elsevier, [online] Vol.1(Issue 1), pp.593–599. Available at: https://dspace.library.uu.nl/bitstream/handle/1874/23634/hox_05_data+collection,primary+versus+secondary.pdf?sequence=1 [Accessed 3 Aug. 2020].
129
Inter-American Development Bank (2015). Port of Manzanillo: Climate Risk Management (Executive Summary). [online] Inter-American Development Bank, Mexico: Inter-American Development Bank, pp.1–76. Available at: https://publications.iadb.org/en/port-manzanillo-climate-risk-management-executive-summary [Accessed 20 May 2020].
Ircha, M.C. (2001). Port strategic planning: Canadian port reform. Maritime Policy & Management, Vol. 28(Issue 2), pp.125–140.
Jolić, N., Štrk, D. and Lešić, A. (2007). Strategic positioning – instrument of port system competitiveness analysis. [online] CROSBI Croatian scientific bibliography, 2nd International Conference on Ports and Waterways – POWA, pp.62–71. Available at: https://bib.irb.hr/datoteka/310616.62-71.pdf [Accessed 28 Jul. 2002].
Júarez Ochoa, J. (2020). Interview on Port competitiveness (API Manzanillo). Interviewed by Kassandra Magana Elizondo. [online]. 03 Aug.
Kim, R. (2016). A Study on Competitiveness Analysis of Ports in Korea and China by Entropy Weight TOPSIS. Elsevier, [online] Vol. 32(Issue 4), pp.187–194. Available at: https://www.sciencedirect.com/science/article/pii/S2092521216300773 [Accessed 28 Jul. 2020].
Lloyd’s List (2019). One Hundred Ports 2019 - Port of Manzanillo. [online] Lloyd’s List. Available at: https://lloydslist.maritimeintelligence.informa.com/LL1128124/56-Manzanillo-Mexico [Accessed 26 May 2020].
Martner Peyrelongue, C.D. and Ruiz Gámez, G. (1998). INTEGRACIÓN MODAL Y COMPETITIVIDAD EN EL PUERTO DE MANZANILLO, COLIMA. SCT, [online] Vol. 99(Issue 1), pp.1–89. Available at: https://www.imt.mx/archivos/Publicaciones/PublicacionTecnica/pt99.pdf [Accessed 20 Jul. 2020].
Meersman, H., Van de Voorde, E. and Vanelslander, T. (2010). Port Competition Revisited. Port Competition Revisited, [online] Vol. 2(Issue 1), pp.210–232. Available at: http://www.vliz.be/imisdocs/publications/248321.pdf [Accessed 27 Jul. 2020].
Merk, O. and Notteboom, T. (2015). Port Hinterland Connectivity. [online] OECD, THE INTERNATIONAL TRANSPORT FORUM: OECD, pp.1–35. Available at: https://www.itf-oecd.org/sites/default/files/docs/dp201513.pdf [Accessed 25 Aug. 2020].
Michalopoulos, V., Pardalis, A. and Stathopoulou, C. (2007). Estimating Port Competition: The Case of the Mediterranean Sea. In: Annual Meeting of the International Association of Maritime Economists. Athens, Greece.
Miles, A.W. (1986). Renaissance of the portfolio. Perspectives. San Francisco: The Boston Consulting Group.
Moon, C.H., Rugman, A. and Verbeke, A. (1998). A generalized double diamond approach to the global competitiveness of Korea and Singapore Author & abstract. Elsevier, Vol. 7(Issue 2), pp.135–150.
Mustafa, F.S., Khan, R.U. and Ahmed Farea, A.O. (2019). Analysis of Competition and Portfolio Structure: A Case Study of Arabian Sea Container Ports. International Journal of Traffic and Transportation Engineering, [online] Vol. 8(Issue 2), pp.39–47. Available at: http://article.sapub.org/10.5923.j.ijtte.20190802.03.html [Accessed 23 Jul. 2020].
130
Nacht, M., Henry, L. and Martin, J. (2019). Sustainable Communities: Social Sustainability, Environmental Sustainability and Financial Sustainability. [online] Port of Los Angeles, Port of Los Angeles: Port of Los Angeles, pp.1–19. Available at: https://kentico.portoflosangeles.org/getmedia/1431a70a-e8e5-4b4b-8c27-5847019e398c/7-5-19_apmt-socal-port-sustainability-report [Accessed 25 Aug. 2020].
Netherlands Enterprise Agency (2019). Opportunities for Port Development and Maritime sector in Mexico. [online] Netherlands Enterprise Agency, Netherlands Enterprise Agency, pp.1–25. Available at: https://www.rvo.nl/sites/default/files/2019/05/opportunities-for-port-development-and-maritime-sector-in-mexico.pdf [Accessed 20 May 2020].
Notteboom, T. (2001). Spatial and functional integration of container port systems and hinterland networks in Europe. Organisation for Economic Co-operation and Development (OECD), Organisation for Economic Co-operation and Development (OECD), pp.5–55.
Notteboom, T. and Yim Yap, W. (2012). Port Competition and Competitiveness. Blackwell Publishing Ltd, [online] Vol. 1(Issue 1), pp.549–570. Available at: http://www.vliz.be/imisdocs/publications/ocrd/258122.pdf [Accessed 27 Jul. 2020].
Office of the United States Trade Representative (2019). California. [online] Office of the United States Trade Representative. Available at: https://ustr.gov/map/state-benefits/ca [Accessed 25 Aug. 2020].
Orozco Alfaro, J. (2020). Interview on Port competitiveness (API Manzanillo). Interviewed by Kassandra Magana Elizondo. [online]. 20 Jul.
Panayides, P.M. (2003). Competitive strategies and organizational performance in ship management. Maritime Policy & Management, Vol. 30(Issue 2), pp.123–140.
Pardali, A. and Michalopoulos, V. (2008). Determining the position of container handling ports, using the benchmarking analysis: The case of the Port of Piraeus. Maritime Policy & Management, [online] Vol. 35(Issue 3), pp.271–284. Available at: https://www.researchgate.net/publication/233463592_Determining_the_position_of_container_handling_ports_using_the_benchmarking_analysis_The_case_of_the_Port_of_Piraeus [Accessed 30 Jul. 2020].
Pierce, S. (2016). SBA Export Outreach Team Annual Meeting. [image online]. Available at: https://slideplayer.com/slide/11864979/ [Accessed 4 Aug. 2020].
Port of Long Beach (2018). Facilities Guide. [online] Port of Long Beach, City of Long Beach Harbor Department, pp.1–16. Available at: https://polb.com/business/port-operations-and-facilities/#facilities-guides-tidetables [Accessed 6 Aug. 2020].
Port of Long Beach (2019). PORT OF LONG BEACH POWERS 20% OF LOCAL JOBS. [online] Port of Long Beach. Available at: https://www.polb.com/port-info/news-and-press/port-of-long-beach-powers-20-of-local-jobs-02-26-2019/ [Accessed 25 Aug. 2020].
Port of Long Beach (2020a). About the Port. [online] Port of Long Beach. Available at: https://www.polb.com/port-info [Accessed 21 Jul. 2020].
131
Port of Long Beach (2020b). Draft Port Master Plan. [online] Port of Long Beach, Port of Long Beach, pp.1–166. Available at: https://thehelm.polb.com/download/432/draft-master-plan-update/8571/draft-port-master-plan-update-july-2019.pdf [Accessed 6 Aug. 2020].
Port of Long Beach (2020c). PORT FACTS & FAQS. [online] Port of Long Beach. Available at: https://www.polb.com/port-info/port-facts-faqs#facts-at-a-glance [Accessed 21 Jul. 2020].
Port of Long Beach (2020d). Port Statistics - Tonnage Summary. [online] Port of Long Beach. Available at: https://www.polb.com/business/port-statistics/#tonnage-summary [Accessed 21 Jul. 2020].
Port of Long Beach (2020e). Terminals Map. [online] Port of Long Beach. Available at: https://www.polb.com/port-info/map/ [Accessed 13 Aug. 2020].
Port of Los Angeles (2018a). Port Master Plan. [online] Port of Los Angeles, Port of Los Angeles, pp.1–93. Available at: https://kentico.portoflosangeles.org/getmedia/adf788d8-74e3-4fc3-b774-c6090264f8b9/port-master-plan-update-with-no-29_9-20-2018 [Accessed 6 Aug. 2020].
Port of Los Angeles (2018b). PORT OF LOS ANGELES 2018-2022 STRATEGIC PLAN. [online] Port of Los Angeles. Available at: https://www.portoflosangeles.org/business/strategic-plan#:~:text=Our%20Vision,%2C%20sustainability%2C%20and%20social%20responsibility. [Accessed 6 Aug. 2020].
Port of Los Angeles (2019a). FACTS AND FIGURES. [online] Port of Los Angeles. Available at: https://www.portoflosangeles.org/business/statistics/facts-and-figures [Accessed 6 Aug. 2020].
Port of Los Angeles (2019b). Terminals Map. [online] Port of Los Angeles. Available at: https://kentico.portoflosangeles.org/getmedia/07e1377d-b452-4ecb-a629-9a0c69410805/pola_terminals_map_2019 [Accessed 13 Aug. 2020].
Port of Los Angeles (2020a). About the Port of Los Angeles. [online] Port of Los Angeles. Available at: https://www.portoflosangeles.org/about [Accessed 21 Jul. 2020].
Port of Los Angeles (2020b). CONTAINER STATISTICS. [online] Port of Los Angeles. Available at: https://www.portoflosangeles.org/business/statistics/container-statistics [Accessed 21 Jul. 2020].
Port of Los Angeles (2020c). CONTAINER TERMINALS. [online] Port of Los Angeles. Available at: https://www.portoflosangeles.org/business/terminals/container [Accessed 6 Aug. 2020].
Port of Los Angeles (2020d). Port of Los Angeles Supply Chain. [online] Port of Los Angeles. Available at: https://www.portoflosangeles.org/business/supply-chain [Accessed 25 Aug. 2020].
Port of Los Angeles (2020e). RAIL. [online] Port of Los Angeles. Available at: https://www.portoflosangeles.org/business/supply-chain/rail [Accessed 6 Aug. 2020].
Port of Los Angeles (2020f). Tonnage Data (1971-2019). [online] Port of Los Angeles. Available at: https://www.portoflosangeles.org/business/statistics/tonnage-statistics [Accessed 21 Jul. 2020].
132
Porter, M.E. (1990). The competitive Advantage of Nations. [online] Paris School of Economics, Harvard Business Review, pp.1–21. Available at: http://www.economie.ens.fr/IMG/pdf/porter_1990_-_the_competitive_advantage_of_nations.pdf [Accessed 31 Jul. 2020].
Porter, M.E. (1998). The Competitive Advantage of Nations. New York: Free Press, pp.6–130.
Prohaska, R. (2016). Map of Port of Long Beach and Port of Los Angeles showing 15 container terminals. [image online]. Available at: https://www.researchgate.net/publication/309032575_Heavy-Duty_Vehicle_Port_Drayage_Drive_Cycle_Characterization_and_Development/figures [Accessed 5 Aug. 2020].
Rubio Ceja, K.E. (2020). Interview on Port competitiveness (API Manzanillo). Interviewed by Kassandra Magana Elizondo. [online]. 20 Jul.
Rugman, A. and D’Cruz, J.R. (1993). The “Double diamond” model of international competitiveness: the Canadian experience. Management International Review, Vol. 33(Issue 1), pp.17–39.
Rugman, A.M. and Verbeke, A. (1993). How to operationalize porter’s diamond of international competitiveness. John Wiley & Sons, Inc., [online] Vol. 35(Issue4), pp.283–299. Available at: https://www.academia.edu/9831217/How_to_operationalize_porters_diamond_of_international_competitiveness [Accessed 11 Aug. 2020].
Russell, W. and Stalker, R. (2003). Porter’s Diamond Model Approach: Assessing the competitiveness of British Columbia’ Lumber Industry’s Exports to India. [Thesis] CORE, University of Northern British Columbia, pp.1–57. Available at: https://core.ac.uk/download/pdf/84874357.pdf [Accessed 31 Jul. 2020].
Sammut‐Bonnici, T. and Galea, D. (2015). PEST analysis. Wiley Encyclopedia of Management,
Vol. 12, pp.1–7.
SCT (2006). Corredores carreteros. [image online]. Available at: https://www.gob.mx/cms/uploads/attachment/file/67636/CAP-04.pdf [Accessed 3 Aug. 2020].
SCT (2008a). CURRENT SITUATION OF THE PORT NATIONAL SYSTEM. [online] SCT, Mexico: SCT, http://www.sct.gob.mx/fileadmin/CGPMM/PNDP2008/doc/pndp/pndp-sac.pdf. Available at: http://www.sct.gob.mx/fileadmin/CGPMM/PNDP2008/doc/pndp/pndp-sac.pdf [Accessed 22 Jul. 2020].
SCT (2008b). General Structuring of the Port System. [online] SCT, Mexico: SCT, pp.1–29. Available at: http://www.sct.gob.mx/fileadmin/CGPMM/PNDP2008/htm/pndp/PRODELI/Fase_2/III_Estructuracion_VII.pdf [Accessed 26 Aug. 2020].
SCT (2008c). Port Competitiveness. [online] SCT, Mexico: Gobierno de México, pp.1–63. Available at: http://www.sct.gob.mx/fileadmin/CGPMM/PNDP2008/htm/pndp/PRODELI/Fase_1/VIII_Competitividad.pdf [Accessed 24 Aug. 2020].
133
SCT (2016). Regular Maritime Transportation Services in Mexico 2016. [online] Gobierno de Mexico, Mexico: Gobierno de Mexico, pp.1–154. Available at: https://www.gob.mx/cms/uploads/attachment/file/175209/Sev_Trans_Mar_2016_ultimo.pdf [Accessed 24 Aug. 2020].
SCT (2017). National port system. [online] Gobierno de México. Available at: http://www.sct.gob.mx/puertos-y-marina/puertos-de-mexico/ [Accessed 4 Aug. 2020].
SCT (2018). Sixth Work Report. [online] Gobierno de México, Mexico: Gobierno de México, pp.1–136. Available at: https://www.gob.mx/cms/uploads/attachment/file/387594/6to._Informe_de_Labores.pdf [Accessed 24 Aug. 2020].
Secretaría de Marina (2018). Naval Constructions. [online] Gobierno de Mexico. Available at: https://www.gob.mx/semar/es/articulos/construcciones-navales?idiom=es [Accessed 18 Aug. 2020].
SEMAR (2017). Mexican port system. [image online]. Available at: https://www.insightcrime.org/news/analysis/mexico-marines-regain-control-ports/ [Accessed 3 Aug. 2020].
Slack, B. (1985). Containerization, inter-port competition, and port. Maritime Policy & Management, [online] Vol. 12(Issue 4), pp.293–303. Available at: https://www.tandfonline.com/doi/abs/10.1080/03088838500000043 [Accessed 27 Jul. 2020].
SSA Mexico (2020). SSA Mexico - Port of Manzanillo. [online] SSA Mexico. Available at: https://www.ssamexico.com/manzanillo.aspx [Accessed 22 May 2020].
Suykens, F. and Van de Voorde, E. (1998). A quarter a century of port management in Europe: objectives and tools. Maritime Policy & Management, [online] Vol. 25(Issue 3), pp.251–261. Available at: https://www.tandfonline.com/doi/abs/10.1080/03088839800000037 [Accessed 27 Jul. 2020].
The World Bank (2000). Port Reform Toolkit - Module 6 Port Regulation Module. [online] World Bank Group, The World Bank, pp.5–6. Available at: https://ppiaf.org/sites/ppiaf.org/files/documents/toolkits/Portoolkit/Toolkit/pdf/modules/06_TOOLKIT_Module6.pdf [Accessed 27 Jul. 2020].
Thomas, G. (2011). A Typology for the Case Study in Social Science Following a Review of Definition, Discourse, and Structure. Qualitative Inquiry, Vol. 17(Issue 6), pp.511–521.
USA Trade Census (2020). HS Port-level Data. [online] U.S. Census Bureau. Available at: https://usatrade.census.gov/index.php?do=login [Accessed 11 Aug. 2020].
Van de Voorde, E. and Winkelmans, W. (2002). A General Introduction to Port Competition and Management. In: Port Competitiveness. An Economic and Legal Analysis of the Factors Determining the Competitiveness of Seaports. Antwerp: De Boeck., pp.1–16.
Vannoni, M. (2014). What Are Case Studies Good for? Nesting Comparative Case Study Research Into the Lakatosian Research Program. Cross-Cultural Research, Vol. 49(Issue 4), pp.331–357.
134
Verbeke, A. and Debisschop, K. (1996). A note on the use of port economic impact studies for the evaluation of large scale port projects. International Journal of Transport Economics, Vol. 23(Issue 3), pp.247–266.
Verhoeff, J.M. (1977). SEAPORT COMPETITION: AN ANALYSIS OF ITS NATURE. International Journal of Transport Economics, [online] Vol. 4(Issue 3), pp.271–284. Available at: https://www.jstor.org/stable/24712618?read-now=1&seq=1#page_scan_tab_contents [Accessed 27 Jul. 2020].
Verhoeff, J.M. (1981). Seaport competition: some fundamental and political aspects. Maritime Policy & Management, [online] Vol. 8(Issue 1), pp.49–60. Available at: https://www.tandfonline.com/doi/abs/10.1080/03088838100000022 [Accessed 27 Jul. 2020].
Waters, M.E. (2020). Port of Manzanillo. [online] World Port Source. Available at: http://www.worldportsource.com/ports/commerce/MEX_Puerto_de_Manzanillo_234.php [Accessed 19 May 2020].
Yim Yap, W. and Lam, J.S.L. (2004). An interpretation of inter-container port relationships from the demand perspective. Maritime Policy & Management, Vol. 31(Issue 4), pp.337–355.
Yin, R.K. (2003). A Review of Case Study Research: Design and Methods. Sage Publications, Vol. 1(Issue 1), pp.93–95.
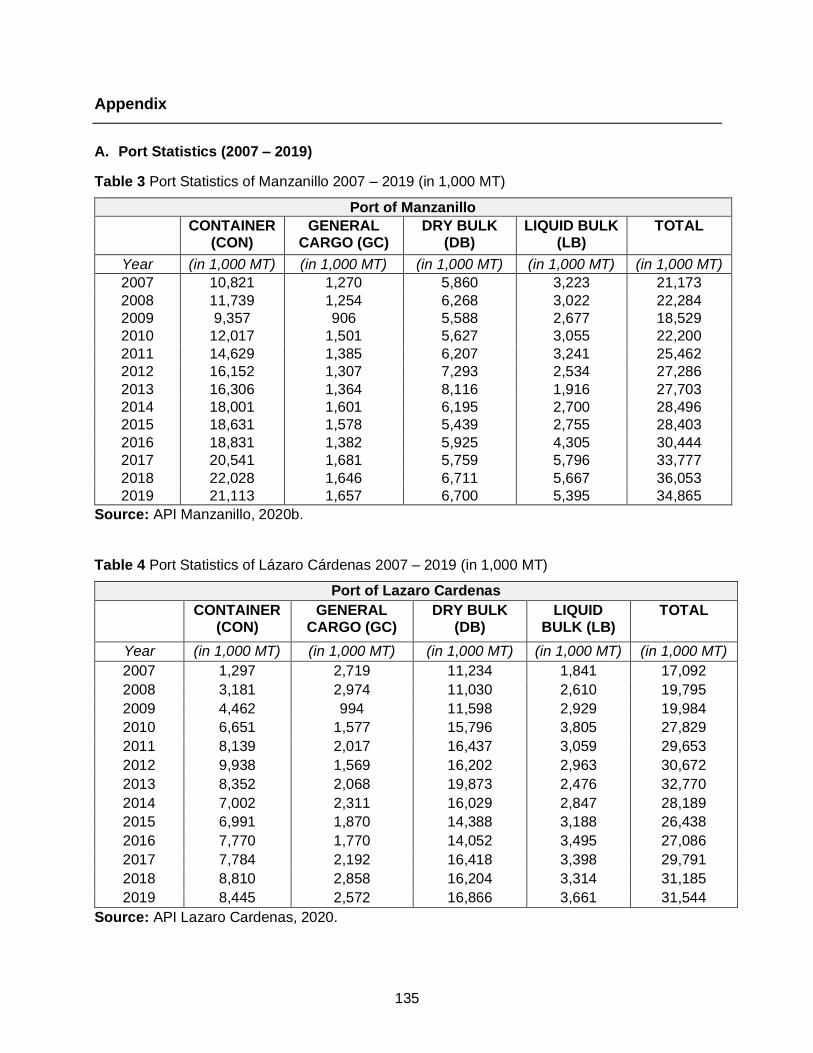
135
Appendix
A. Port Statistics (2007 – 2019)
Table 3 Port Statistics of Manzanillo 2007 – 2019 (in 1,000 MT)
Port of Manzanillo CONTAINER
(CON) GENERAL
CARGO (GC) DRY BULK
(DB) LIQUID BULK
(LB) TOTAL
Year (in 1,000 MT) (in 1,000 MT) (in 1,000 MT) (in 1,000 MT) (in 1,000 MT)
2007 10,821 1,270 5,860 3,223 21,173
2008 11,739 1,254 6,268 3,022 22,284
2009 9,357 906 5,588 2,677 18,529
2010 12,017 1,501 5,627 3,055 22,200
2011 14,629 1,385 6,207 3,241 25,462
2012 16,152 1,307 7,293 2,534 27,286
2013 16,306 1,364 8,116 1,916 27,703
2014 18,001 1,601 6,195 2,700 28,496
2015 18,631 1,578 5,439 2,755 28,403
2016 18,831 1,382 5,925 4,305 30,444
2017 20,541 1,681 5,759 5,796 33,777
2018 22,028 1,646 6,711 5,667 36,053
2019 21,113 1,657 6,700 5,395 34,865
Source: API Manzanillo, 2020b.
Table 4 Port Statistics of Lázaro Cárdenas 2007 – 2019 (in 1,000 MT)
Port of Lazaro Cardenas CONTAINER
(CON) GENERAL
CARGO (GC) DRY BULK
(DB) LIQUID
BULK (LB) TOTAL
Year (in 1,000 MT) (in 1,000 MT) (in 1,000 MT) (in 1,000 MT) (in 1,000 MT)
2007 1,297 2,719 11,234 1,841 17,092
2008 3,181 2,974 11,030 2,610 19,795
2009 4,462 994 11,598 2,929 19,984
2010 6,651 1,577 15,796 3,805 27,829
2011 8,139 2,017 16,437 3,059 29,653
2012 9,938 1,569 16,202 2,963 30,672
2013 8,352 2,068 19,873 2,476 32,770
2014 7,002 2,311 16,029 2,847 28,189
2015 6,991 1,870 14,388 3,188 26,438
2016 7,770 1,770 14,052 3,495 27,086
2017 7,784 2,192 16,418 3,398 29,791
2018 8,810 2,858 16,204 3,314 31,185
2019 8,445 2,572 16,866 3,661 31,544
Source: API Lazaro Cardenas, 2020.
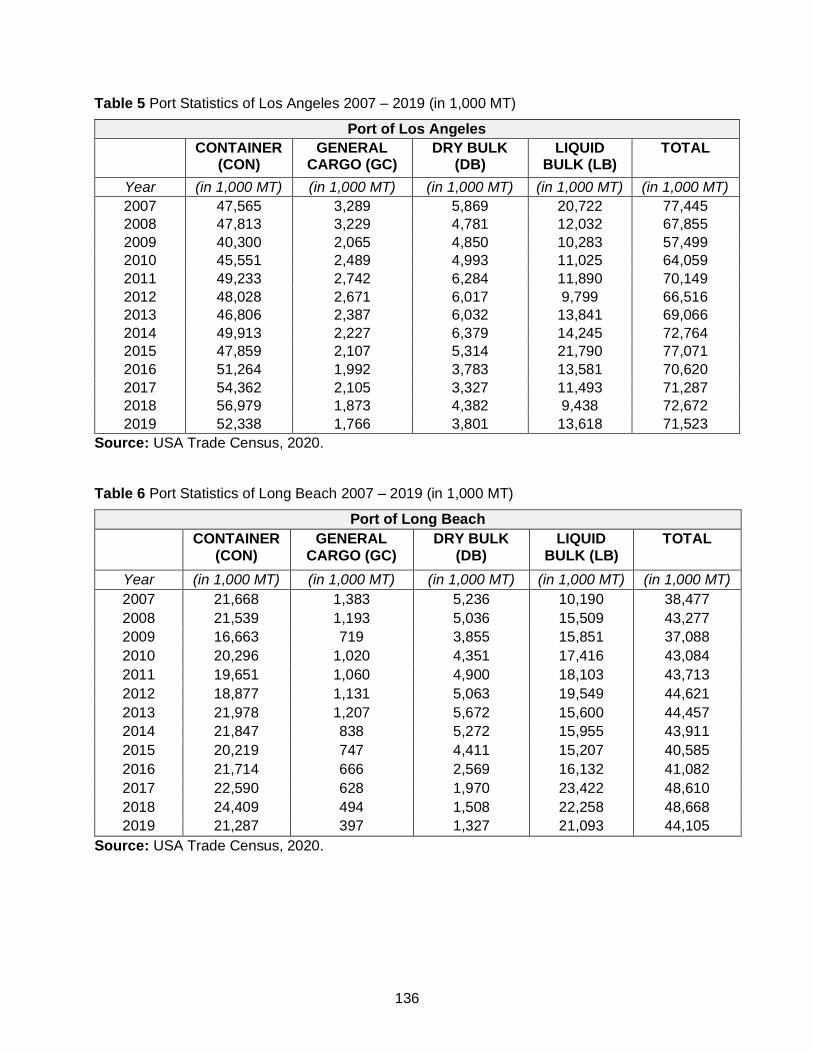
136
Table 5 Port Statistics of Los Angeles 2007 – 2019 (in 1,000 MT)
Port of Los Angeles CONTAINER
(CON) GENERAL
CARGO (GC) DRY BULK
(DB) LIQUID
BULK (LB) TOTAL
Year (in 1,000 MT) (in 1,000 MT) (in 1,000 MT) (in 1,000 MT) (in 1,000 MT)
2007 47,565 3,289 5,869 20,722 77,445
2008 47,813 3,229 4,781 12,032 67,855
2009 40,300 2,065 4,850 10,283 57,499
2010 45,551 2,489 4,993 11,025 64,059
2011 49,233 2,742 6,284 11,890 70,149
2012 48,028 2,671 6,017 9,799 66,516
2013 46,806 2,387 6,032 13,841 69,066
2014 49,913 2,227 6,379 14,245 72,764
2015 47,859 2,107 5,314 21,790 77,071
2016 51,264 1,992 3,783 13,581 70,620
2017 54,362 2,105 3,327 11,493 71,287
2018 56,979 1,873 4,382 9,438 72,672
2019 52,338 1,766 3,801 13,618 71,523
Source: USA Trade Census, 2020.
Table 6 Port Statistics of Long Beach 2007 – 2019 (in 1,000 MT)
Port of Long Beach CONTAINER
(CON) GENERAL
CARGO (GC) DRY BULK
(DB) LIQUID
BULK (LB) TOTAL
Year (in 1,000 MT) (in 1,000 MT) (in 1,000 MT) (in 1,000 MT) (in 1,000 MT)
2007 21,668 1,383 5,236 10,190 38,477
2008 21,539 1,193 5,036 15,509 43,277
2009 16,663 719 3,855 15,851 37,088
2010 20,296 1,020 4,351 17,416 43,084
2011 19,651 1,060 4,900 18,103 43,713
2012 18,877 1,131 5,063 19,549 44,621
2013 21,978 1,207 5,672 15,600 44,457
2014 21,847 838 5,272 15,955 43,911
2015 20,219 747 4,411 15,207 40,585
2016 21,714 666 2,569 16,132 41,082
2017 22,590 628 1,970 23,422 48,610
2018 24,409 494 1,508 22,258 48,668
2019 21,287 397 1,327 21,093 44,105
Source: USA Trade Census, 2020.
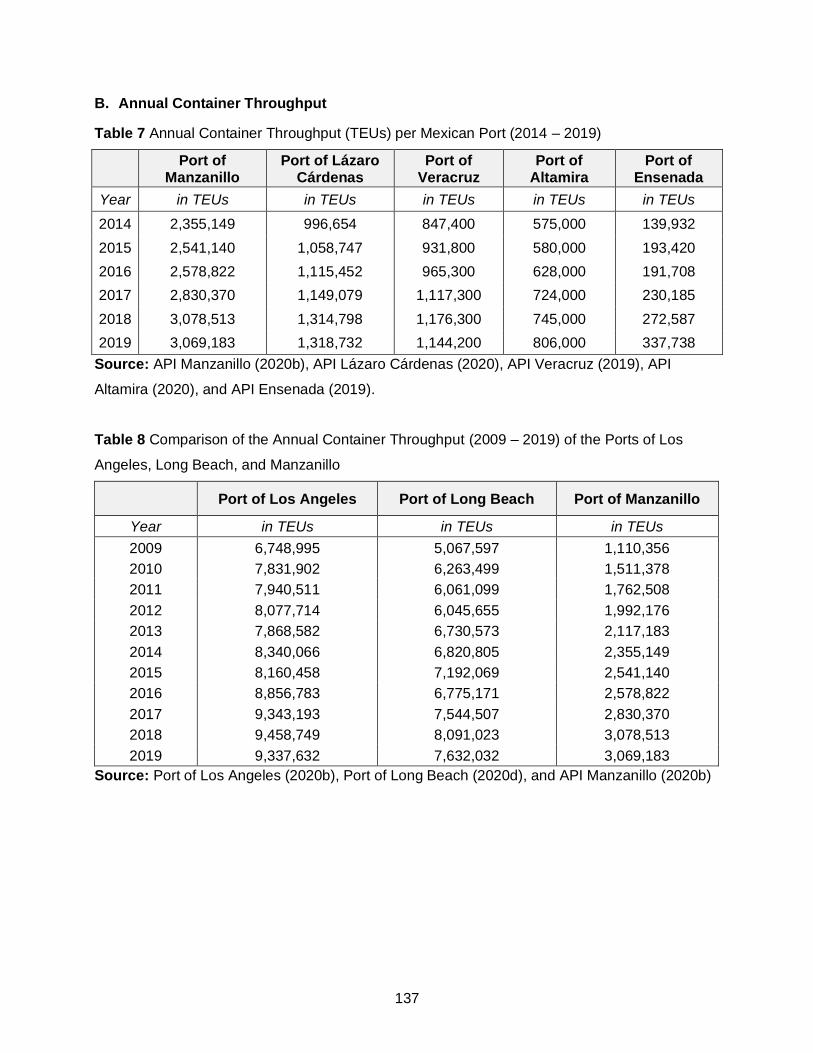
137
B. Annual Container Throughput
Table 7 Annual Container Throughput (TEUs) per Mexican Port (2014 – 2019)
Port of Manzanillo
Port of Lázaro Cárdenas
Port of Veracruz
Port of Altamira
Port of Ensenada
Year in TEUs in TEUs in TEUs in TEUs in TEUs
2014 2,355,149 996,654 847,400 575,000 139,932
2015 2,541,140 1,058,747 931,800 580,000 193,420
2016 2,578,822 1,115,452 965,300 628,000 191,708
2017 2,830,370 1,149,079 1,117,300 724,000 230,185
2018 3,078,513 1,314,798 1,176,300 745,000 272,587
2019 3,069,183 1,318,732 1,144,200 806,000 337,738
Source: API Manzanillo (2020b), API Lázaro Cárdenas (2020), API Veracruz (2019), API
Altamira (2020), and API Ensenada (2019).
Table 8 Comparison of the Annual Container Throughput (2009 – 2019) of the Ports of Los
Angeles, Long Beach, and Manzanillo
Port of Los Angeles Port of Long Beach Port of Manzanillo
Year in TEUs in TEUs in TEUs
2009 6,748,995 5,067,597 1,110,356
2010 7,831,902 6,263,499 1,511,378
2011 7,940,511 6,061,099 1,762,508
2012 8,077,714 6,045,655 1,992,176
2013 7,868,582 6,730,573 2,117,183
2014 8,340,066 6,820,805 2,355,149
2015 8,160,458 7,192,069 2,541,140
2016 8,856,783 6,775,171 2,578,822
2017 9,343,193 7,544,507 2,830,370
2018 9,458,749 8,091,023 3,078,513
2019 9,337,632 7,632,032 3,069,183
Source: Port of Los Angeles (2020b), Port of Long Beach (2020d), and API Manzanillo (2020b)
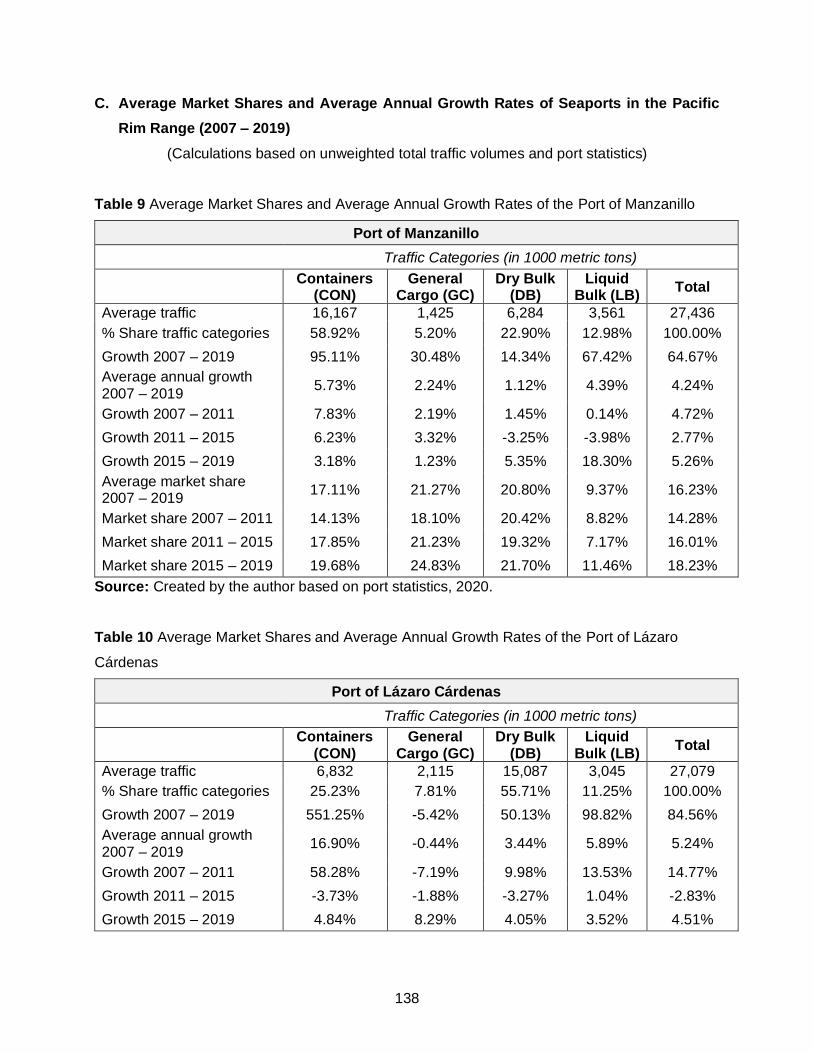
138
C. Average Market Shares and Average Annual Growth Rates of Seaports in the Pacific
Rim Range (2007 – 2019)
(Calculations based on unweighted total traffic volumes and port statistics)
Table 9 Average Market Shares and Average Annual Growth Rates of the Port of Manzanillo
Port of Manzanillo
Traffic Categories (in 1000 metric tons)
Containers
(CON) General
Cargo (GC) Dry Bulk
(DB) Liquid
Bulk (LB) Total
Average traffic 16,167 1,425 6,284 3,561 27,436
% Share traffic categories 58.92% 5.20% 22.90% 12.98% 100.00%
Growth 2007 – 2019 95.11% 30.48% 14.34% 67.42% 64.67%
Average annual growth 2007 – 2019
5.73% 2.24% 1.12% 4.39% 4.24%
Growth 2007 – 2011 7.83% 2.19% 1.45% 0.14% 4.72%
Growth 2011 – 2015 6.23% 3.32% -3.25% -3.98% 2.77%
Growth 2015 – 2019 3.18% 1.23% 5.35% 18.30% 5.26%
Average market share 2007 – 2019
17.11% 21.27% 20.80% 9.37% 16.23%
Market share 2007 – 2011 14.13% 18.10% 20.42% 8.82% 14.28%
Market share 2011 – 2015 17.85% 21.23% 19.32% 7.17% 16.01%
Market share 2015 – 2019 19.68% 24.83% 21.70% 11.46% 18.23%
Source: Created by the author based on port statistics, 2020.
Table 10 Average Market Shares and Average Annual Growth Rates of the Port of Lázaro
Cárdenas
Port of Lázaro Cárdenas
Traffic Categories (in 1000 metric tons)
Containers
(CON) General
Cargo (GC) Dry Bulk
(DB) Liquid
Bulk (LB) Total
Average traffic 6,832 2,115 15,087 3,045 27,079
% Share traffic categories 25.23% 7.81% 55.71% 11.25% 100.00%
Growth 2007 – 2019 551.25% -5.42% 50.13% 98.82% 84.56%
Average annual growth 2007 – 2019
16.90% -0.44% 3.44% 5.89% 5.24%
Growth 2007 – 2011 58.28% -7.19% 9.98% 13.53% 14.77%
Growth 2011 – 2015 -3.73% -1.88% -3.27% 1.04% -2.83%
Growth 2015 – 2019 4.84% 8.29% 4.05% 3.52% 4.51%
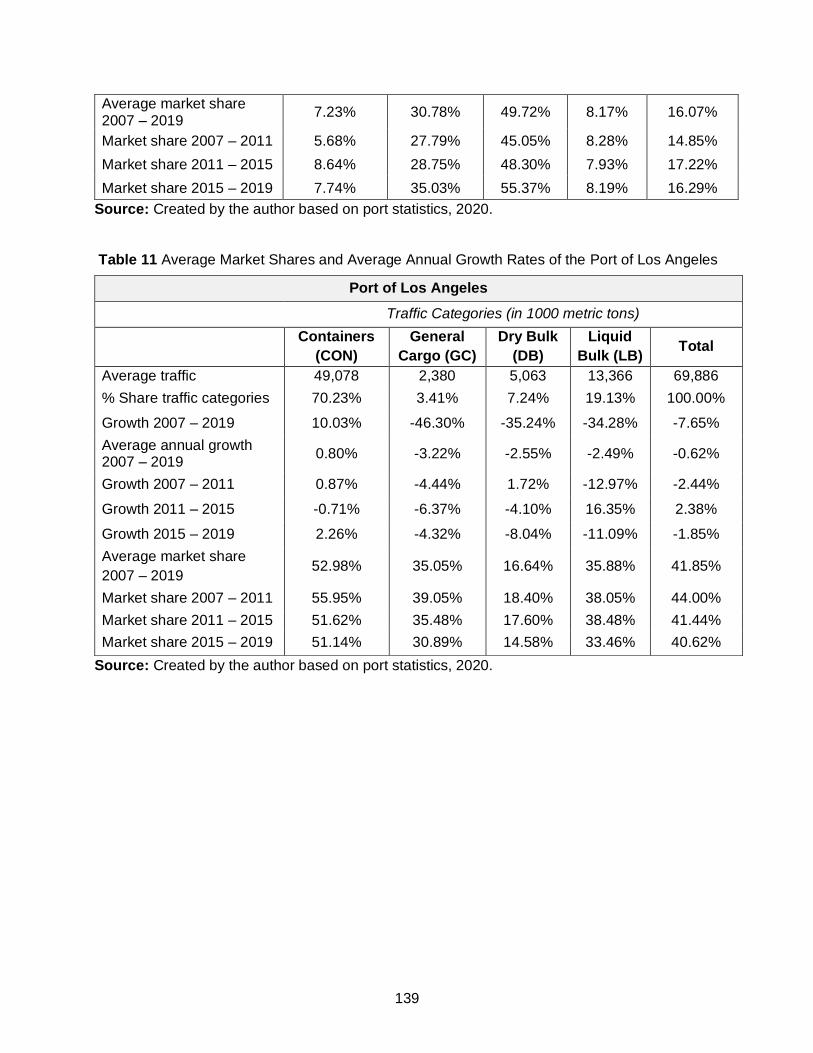
139
Average market share 2007 – 2019
7.23% 30.78% 49.72% 8.17% 16.07%
Market share 2007 – 2011 5.68% 27.79% 45.05% 8.28% 14.85%
Market share 2011 – 2015 8.64% 28.75% 48.30% 7.93% 17.22%
Market share 2015 – 2019 7.74% 35.03% 55.37% 8.19% 16.29%
Source: Created by the author based on port statistics, 2020.
Table 11 Average Market Shares and Average Annual Growth Rates of the Port of Los Angeles
Source: Created by the author based on port statistics, 2020.
Port of Los Angeles
Traffic Categories (in 1000 metric tons)
Containers
(CON)
General
Cargo (GC)
Dry Bulk
(DB)
Liquid
Bulk (LB) Total
Average traffic 49,078 2,380 5,063 13,366 69,886
% Share traffic categories 70.23% 3.41% 7.24% 19.13% 100.00%
Growth 2007 – 2019 10.03% -46.30% -35.24% -34.28% -7.65%
Average annual growth 2007 – 2019
0.80% -3.22% -2.55% -2.49% -0.62%
Growth 2007 – 2011 0.87% -4.44% 1.72% -12.97% -2.44%
Growth 2011 – 2015 -0.71% -6.37% -4.10% 16.35% 2.38%
Growth 2015 – 2019 2.26% -4.32% -8.04% -11.09% -1.85%
Average market share
2007 – 2019 52.98% 35.05% 16.64% 35.88% 41.85%
Market share 2007 – 2011 55.95% 39.05% 18.40% 38.05% 44.00%
Market share 2011 – 2015 51.62% 35.48% 17.60% 38.48% 41.44%
Market share 2015 – 2019 51.14% 30.89% 14.58% 33.46% 40.62%
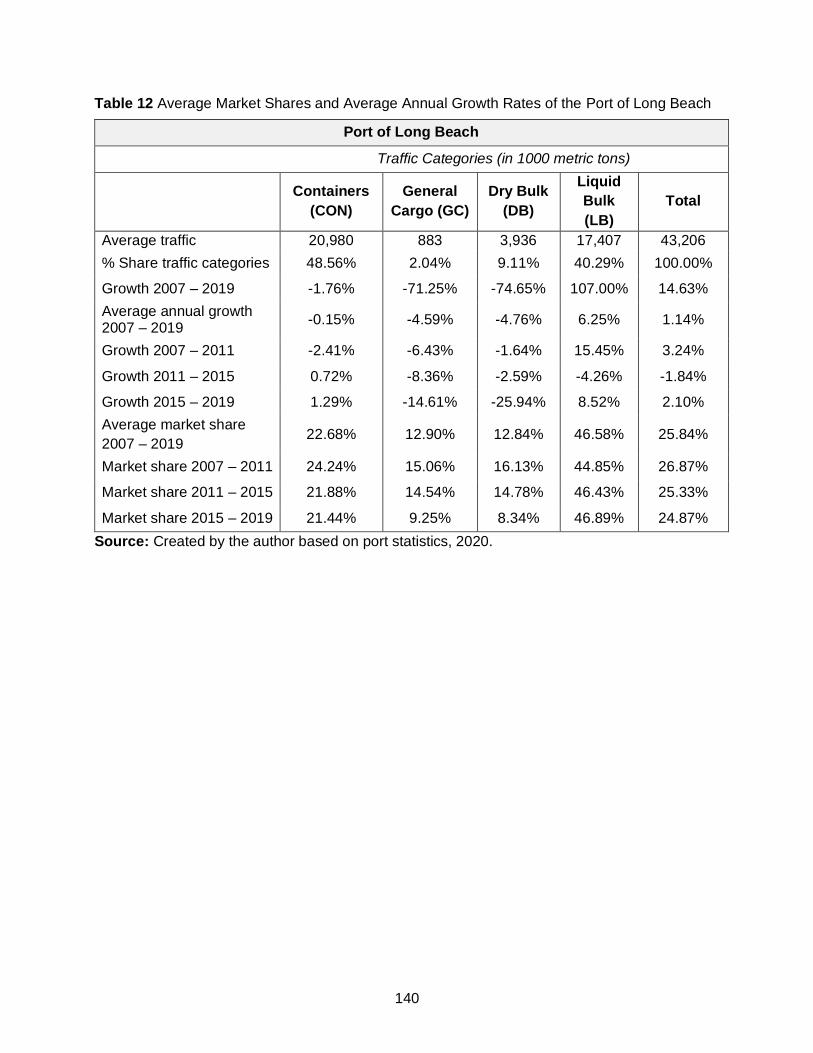
140
Table 12 Average Market Shares and Average Annual Growth Rates of the Port of Long Beach
Port of Long Beach
Traffic Categories (in 1000 metric tons)
Containers
(CON)
General
Cargo (GC)
Dry Bulk
(DB)
Liquid
Bulk
(LB)
Total
Average traffic 20,980 883 3,936 17,407 43,206
% Share traffic categories 48.56% 2.04% 9.11% 40.29% 100.00%
Growth 2007 – 2019 -1.76% -71.25% -74.65% 107.00% 14.63%
Average annual growth 2007 – 2019
-0.15% -4.59% -4.76% 6.25% 1.14%
Growth 2007 – 2011 -2.41% -6.43% -1.64% 15.45% 3.24%
Growth 2011 – 2015 0.72% -8.36% -2.59% -4.26% -1.84%
Growth 2015 – 2019 1.29% -14.61% -25.94% 8.52% 2.10%
Average market share
2007 – 2019 22.68% 12.90% 12.84% 46.58% 25.84%
Market share 2007 – 2011 24.24% 15.06% 16.13% 44.85% 26.87%
Market share 2011 – 2015 21.88% 14.54% 14.78% 46.43% 25.33%
Market share 2015 – 2019 21.44% 9.25% 8.34% 46.89% 24.87%
Source: Created by the author based on port statistics, 2020.
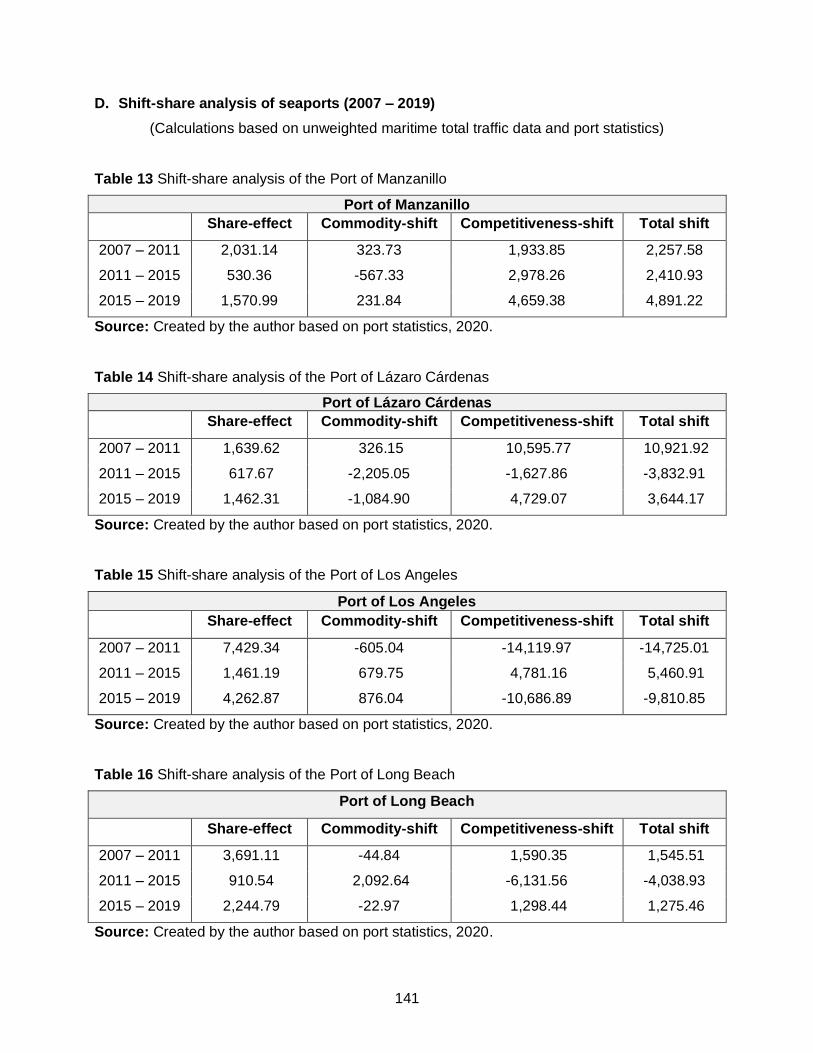
141
D. Shift-share analysis of seaports (2007 – 2019)
(Calculations based on unweighted maritime total traffic data and port statistics)
Table 13 Shift-share analysis of the Port of Manzanillo
Port of Manzanillo
Share-effect Commodity-shift Competitiveness-shift Total shift
2007 – 2011 2,031.14 323.73 1,933.85 2,257.58
2011 – 2015 530.36 -567.33 2,978.26 2,410.93
2015 – 2019 1,570.99 231.84 4,659.38 4,891.22
Source: Created by the author based on port statistics, 2020.
Table 14 Shift-share analysis of the Port of Lázaro Cárdenas
Port of Lázaro Cárdenas
Share-effect Commodity-shift Competitiveness-shift Total shift
2007 – 2011 1,639.62 326.15 10,595.77 10,921.92
2011 – 2015 617.67 -2,205.05 -1,627.86 -3,832.91
2015 – 2019 1,462.31 -1,084.90 4,729.07 3,644.17
Source: Created by the author based on port statistics, 2020.
Table 15 Shift-share analysis of the Port of Los Angeles
Port of Los Angeles
Share-effect Commodity-shift Competitiveness-shift Total shift
2007 – 2011 7,429.34 -605.04 -14,119.97 -14,725.01
2011 – 2015 1,461.19 679.75 4,781.16 5,460.91
2015 – 2019 4,262.87 876.04 -10,686.89 -9,810.85
Source: Created by the author based on port statistics, 2020.
Table 16 Shift-share analysis of the Port of Long Beach
Port of Long Beach
Share-effect Commodity-shift Competitiveness-shift Total shift
2007 – 2011 3,691.11 -44.84 1,590.35 1,545.51
2011 – 2015 910.54 2,092.64 -6,131.56 -4,038.93
2015 – 2019 2,244.79 -22.97 1,298.44 1,275.46
Source: Created by the author based on port statistics, 2020.
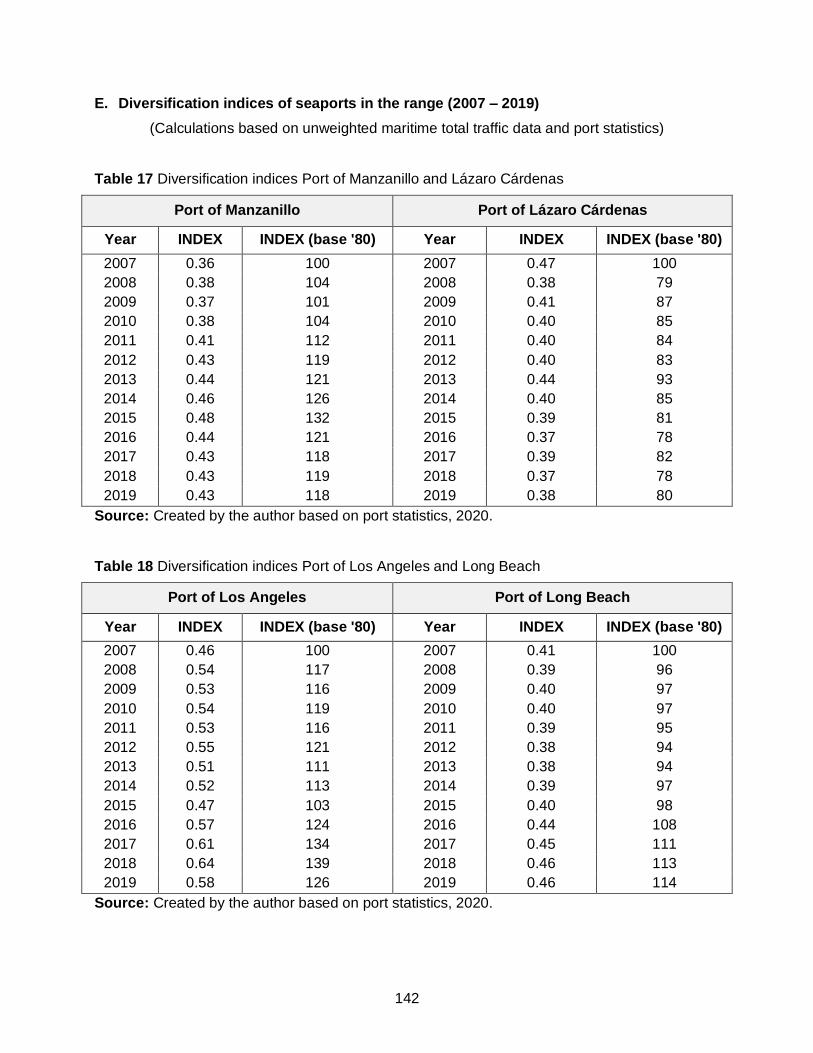
142
E. Diversification indices of seaports in the range (2007 – 2019)
(Calculations based on unweighted maritime total traffic data and port statistics)
Table 17 Diversification indices Port of Manzanillo and Lázaro Cárdenas
Port of Manzanillo Port of Lázaro Cárdenas
Year INDEX INDEX (base '80) Year INDEX INDEX (base '80)
2007 0.36 100 2007 0.47 100
2008 0.38 104 2008 0.38 79
2009 0.37 101 2009 0.41 87
2010 0.38 104 2010 0.40 85
2011 0.41 112 2011 0.40 84
2012 0.43 119 2012 0.40 83
2013 0.44 121 2013 0.44 93
2014 0.46 126 2014 0.40 85
2015 0.48 132 2015 0.39 81
2016 0.44 121 2016 0.37 78
2017 0.43 118 2017 0.39 82
2018 0.43 119 2018 0.37 78
2019 0.43 118 2019 0.38 80
Source: Created by the author based on port statistics, 2020.
Table 18 Diversification indices Port of Los Angeles and Long Beach
Port of Los Angeles Port of Long Beach
Year INDEX INDEX (base '80) Year INDEX INDEX (base '80)
2007 0.46 100 2007 0.41 100
2008 0.54 117 2008 0.39 96
2009 0.53 116 2009 0.40 97
2010 0.54 119 2010 0.40 97
2011 0.53 116 2011 0.39 95
2012 0.55 121 2012 0.38 94
2013 0.51 111 2013 0.38 94
2014 0.52 113 2014 0.39 97
2015 0.47 103 2015 0.40 98
2016 0.57 124 2016 0.44 108
2017 0.61 134 2017 0.45 111
2018 0.64 139 2018 0.46 113
2019 0.58 126 2019 0.46 114
Source: Created by the author based on port statistics, 2020.