An Update on the MRSEC Cross-site REU Assessment with the Undergraduate Research Student Self...
21
An Update on the MRSEC Cross-site REU Assessment with the Undergraduate Research Student Self Assessment Instrument Tim Weston University of Colorado, Boulder ATLAS Assessment and Research
-
Upload
donald-robbins -
Category
Documents
-
view
214 -
download
0
Transcript of An Update on the MRSEC Cross-site REU Assessment with the Undergraduate Research Student Self...
An Update on the MRSEC Cross-site REU Assessment with theUndergraduate Research Student Self Assessment Instrument
Tim WestonUniversity of Colorado, BoulderATLAS Assessment and Research
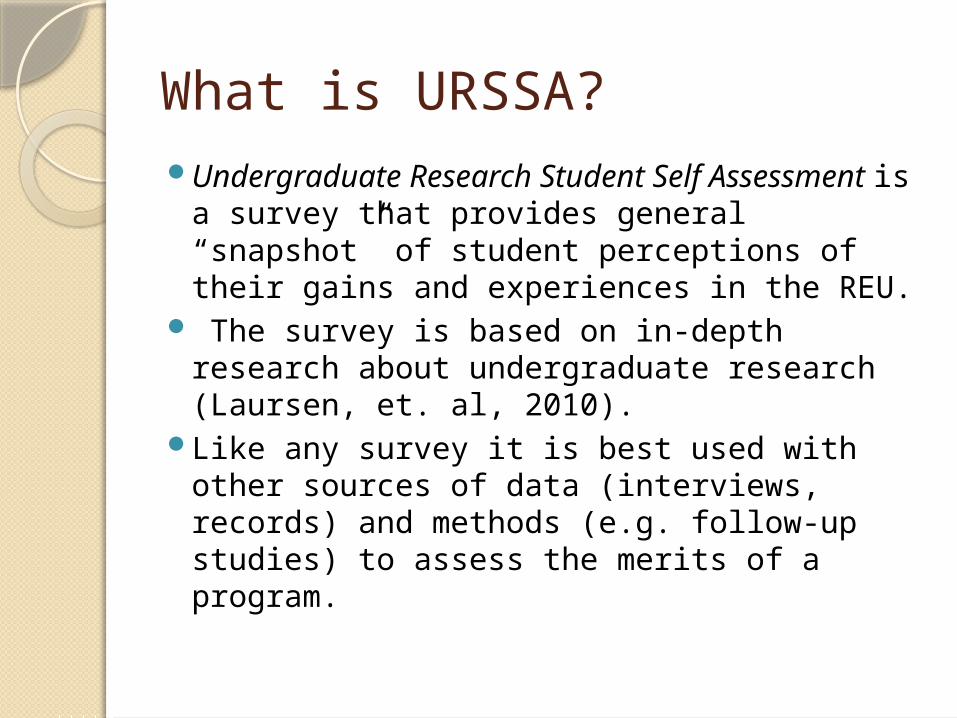
What is URSSA?Undergraduate Research Student Self
Assessment is a survey that provides general “snapshot” of student perceptions of their gains and experiences in the REU.
The survey is based on in-depth research about undergraduate research (Laursen, et. al, 2010).
Like any survey it is best used with other sources of data (interviews, records) and methods (e.g. follow-up studies) to assess the merits of a program.
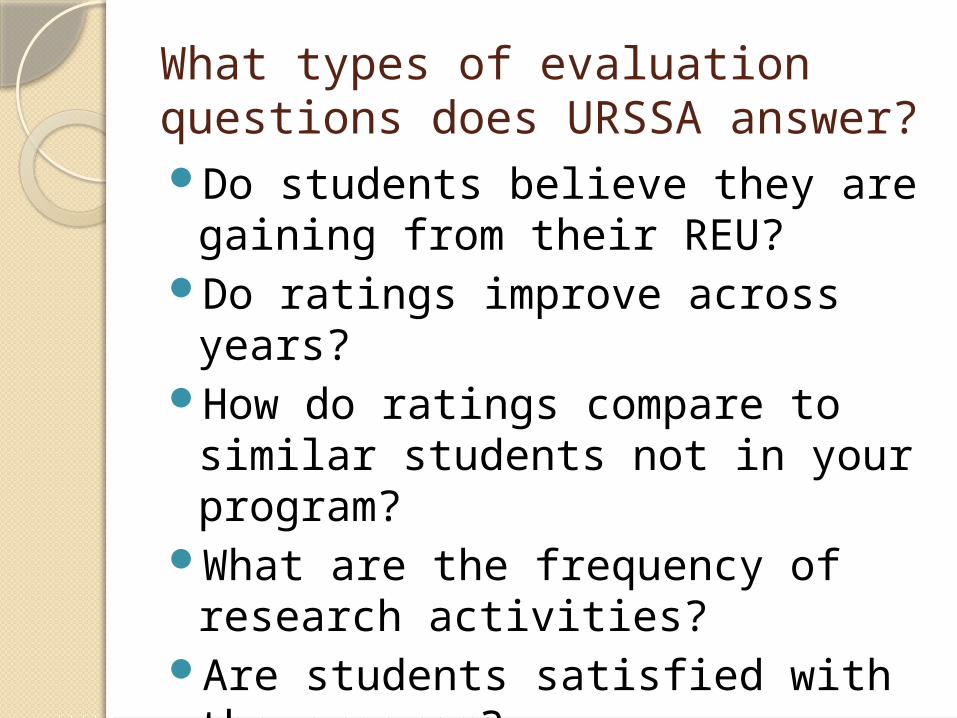
What types of evaluation questions does URSSA answer?Do students believe they are
gaining from their REU?Do ratings improve across years?How do ratings compare to
similar students not in your program?
What are the frequency of research activities?
Are students satisfied with the program?
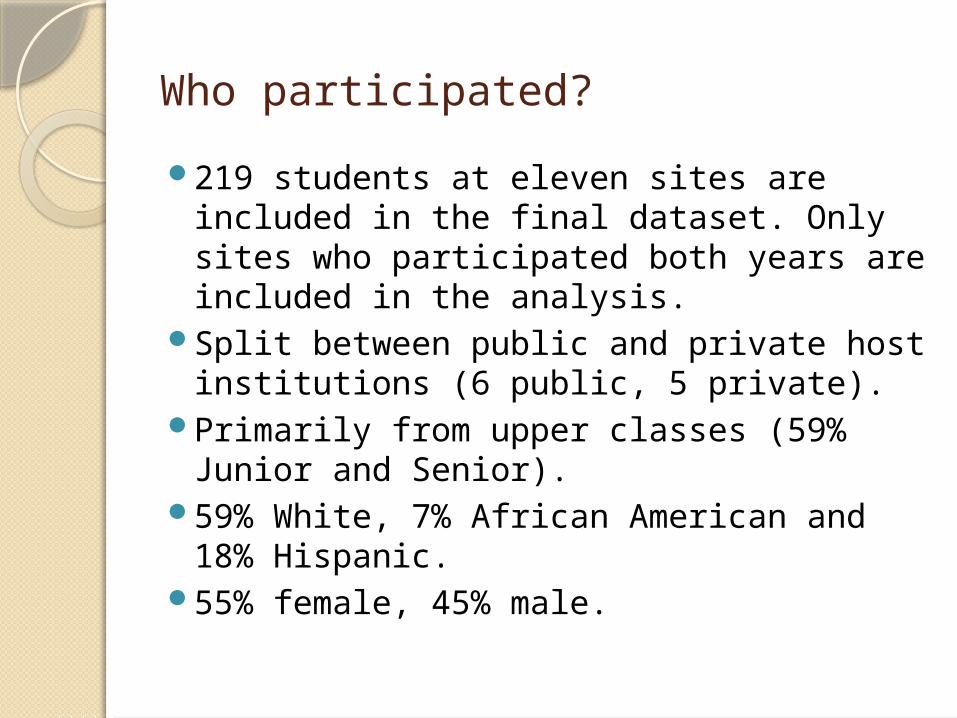
Who participated?
219 students at eleven sites are included in the final dataset. Only sites who participated both years are included in the analysis.
Split between public and private host institutions (6 public, 5 private).
Primarily from upper classes (59% Junior and Senior).
59% White, 7% African American and 18% Hispanic.
55% female, 45% male.
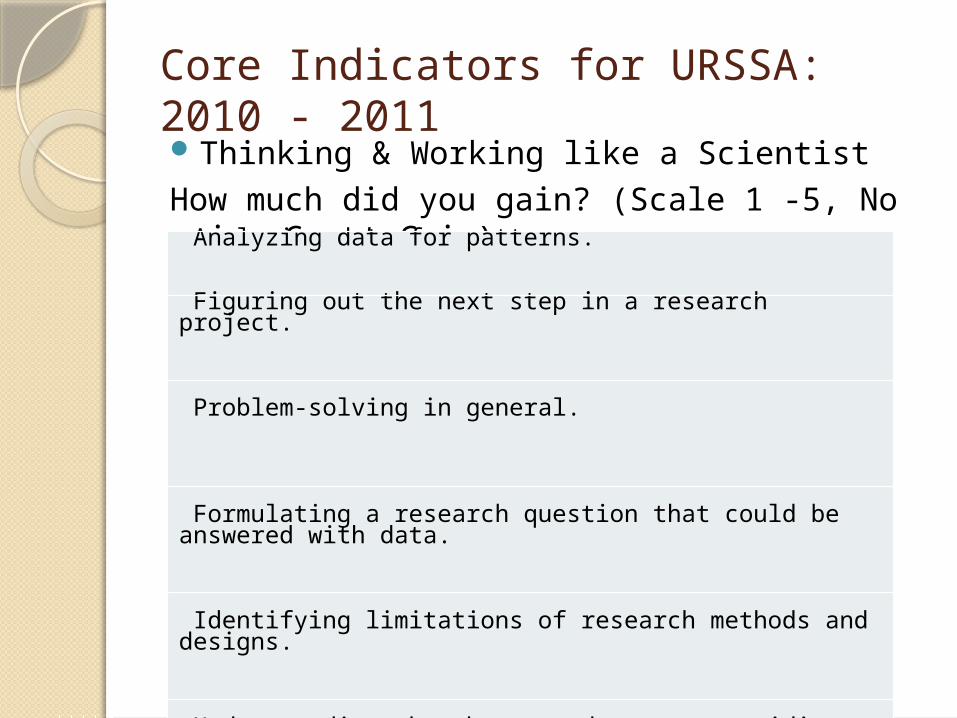
Core Indicators for URSSA: 2010 - 2011Thinking & Working like a ScientistHow much did you gain? (Scale 1 -5, No gain –Great Gain) Analyzing data for patterns. Figuring out the next step in a research project.
Problem-solving in general.
Formulating a research question that could be answered with data.
Identifying limitations of research methods and designs.
Understanding the theory and concepts guiding my research project.
Understanding the connections among scientific disciplines.
Understanding the relevance of research to my coursework. Understanding the importance of ethics and the responsible conduct of research.
Understanding how data are collected.
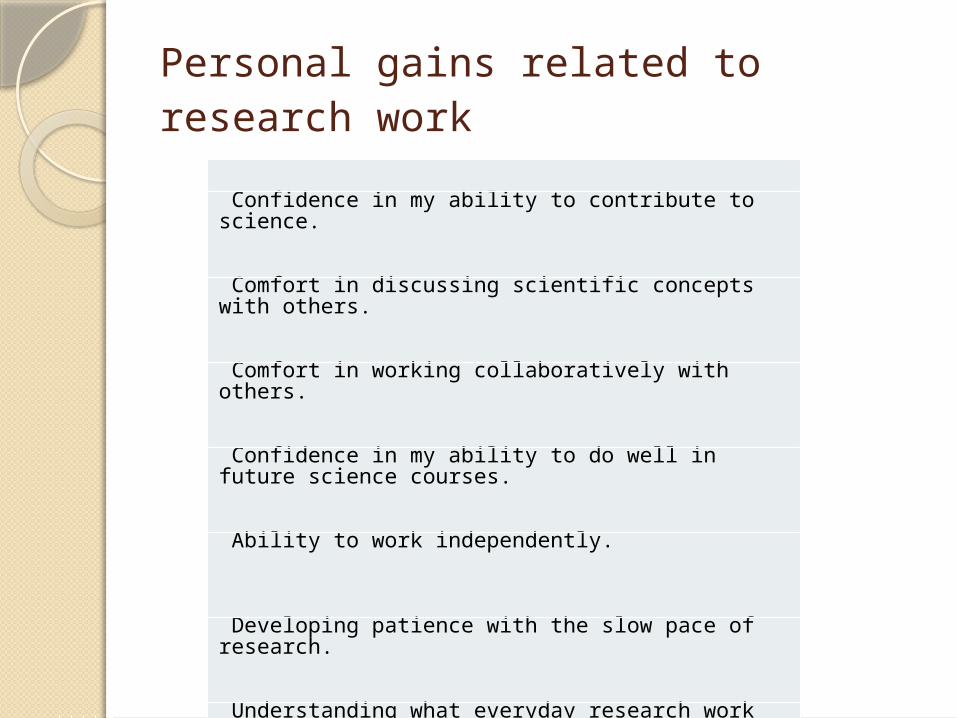
Personal gains related to research work
Confidence in my ability to contribute to science. Comfort in discussing scientific concepts with others. Comfort in working collaboratively with others. Confidence in my ability to do well in future science courses. Ability to work independently. Developing patience with the slow pace of research. Understanding what everyday research work is like. Taking greater care in conducting procedures in the lab or field.
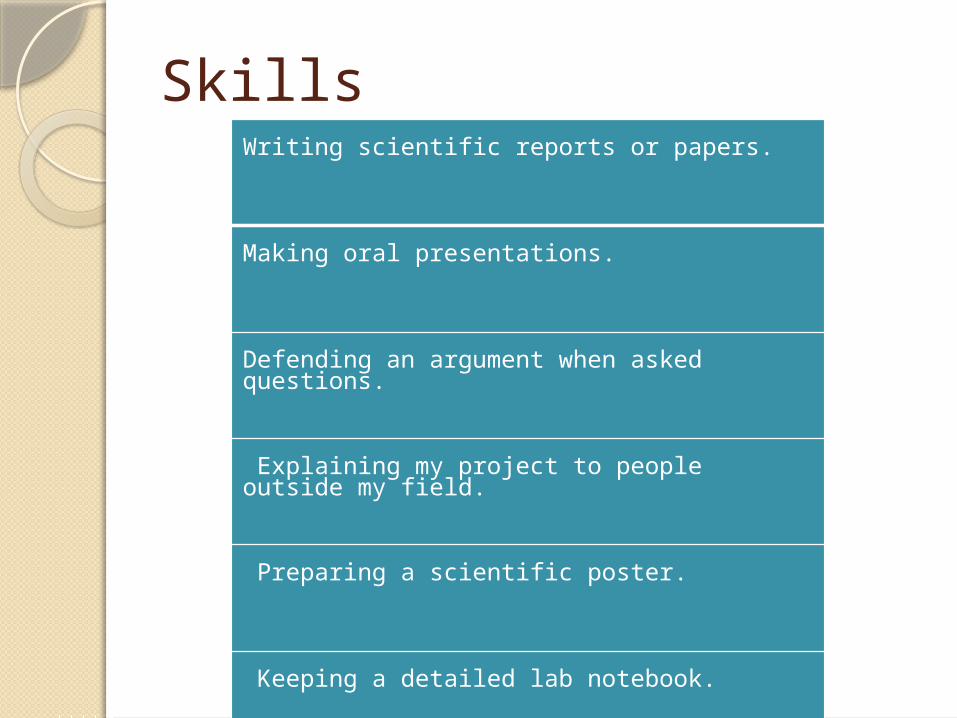
Skills Writing scientific reports or papers. Making oral presentations.
Defending an argument when asked questions.
Explaining my project to people outside my field.
Preparing a scientific poster.
Keeping a detailed lab notebook.
Conducting observations in the lab or field.
Using statistics to analyze data.
Calibrating instruments needed for measurement.
Understanding journal articles. Conducting database or internet searches.
Managing my time.
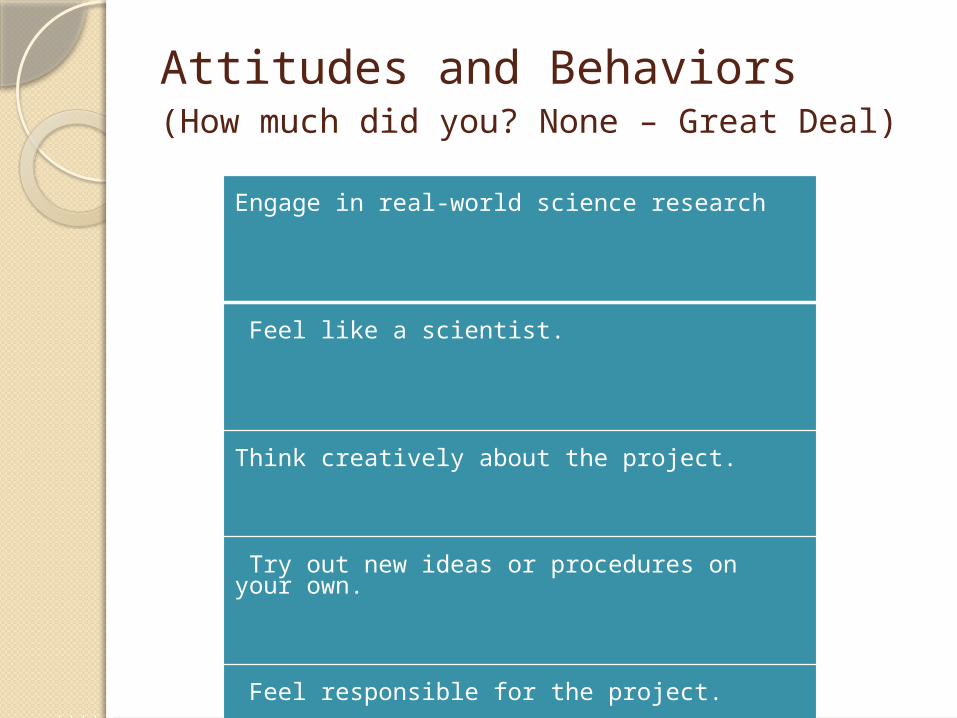
Attitudes and Behaviors(How much did you? None – Great Deal)
Engage in real-world science research
Feel like a scientist. Think creatively about the project.
Try out new ideas or procedures on your own.
Feel responsible for the project. Work extra hours because you were excited about the research. Interact with scientists from outside your school. Feel a part of a scientific community.
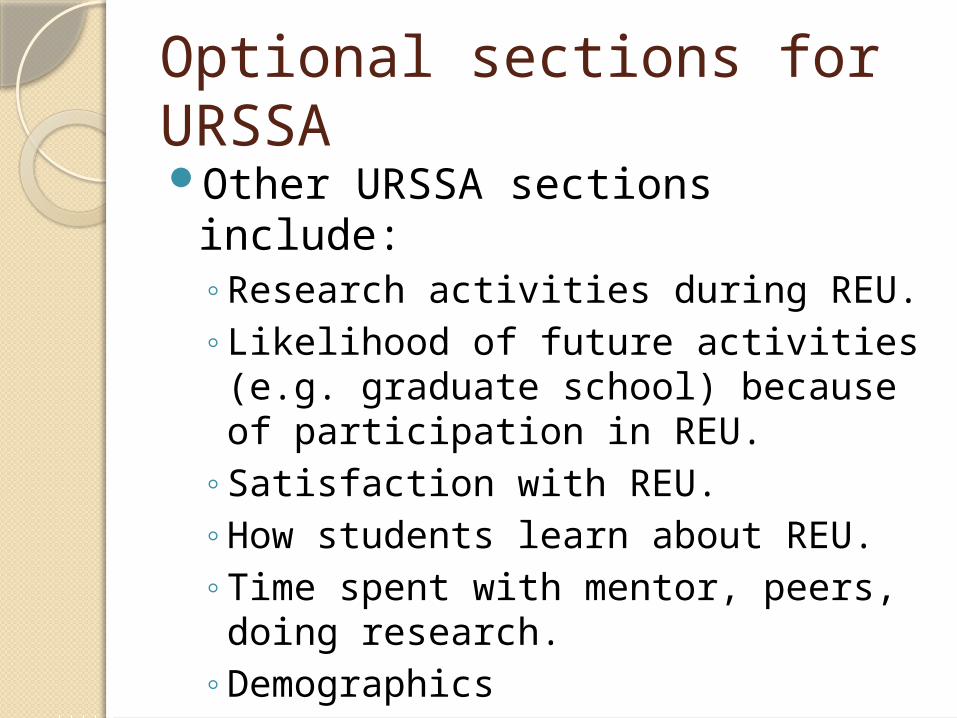
Optional sections for URSSAOther URSSA sections include:
◦Research activities during REU.◦Likelihood of future activities (e.g.
graduate school) because of participation in REU.
◦Satisfaction with REU.◦How students learn about REU.◦Time spent with mentor, peers,
doing research.◦Demographics
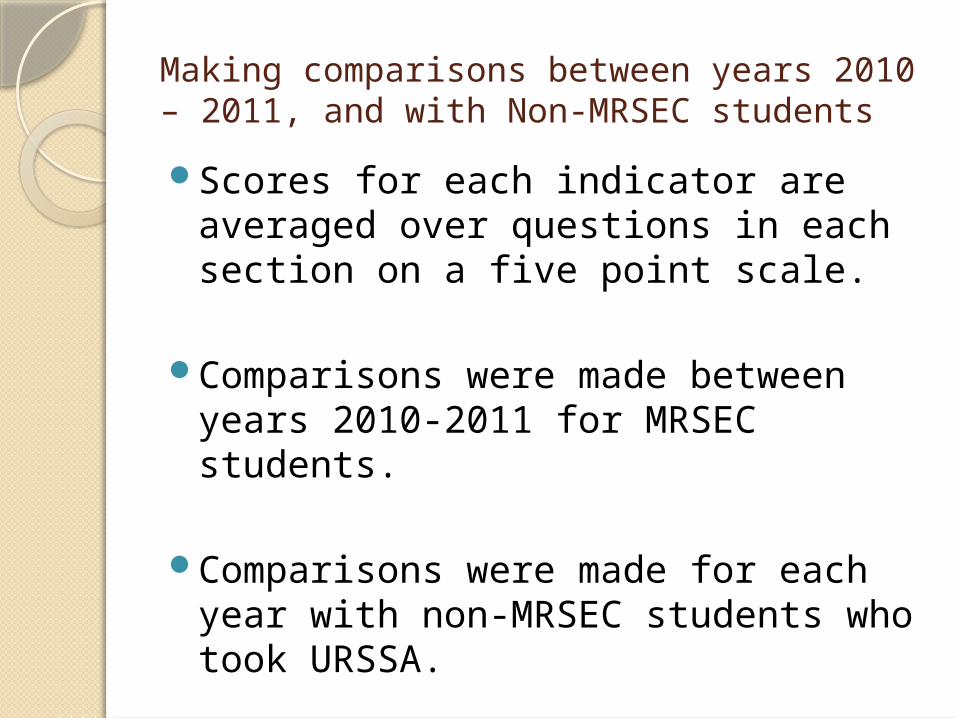
Making comparisons between years 2010 – 2011, and with Non-MRSEC students
Scores for each indicator are averaged over questions in each section on a five point scale.
Comparisons were made between years 2010-2011 for MRSEC students.
Comparisons were made for each year with non-MRSEC students who took URSSA.
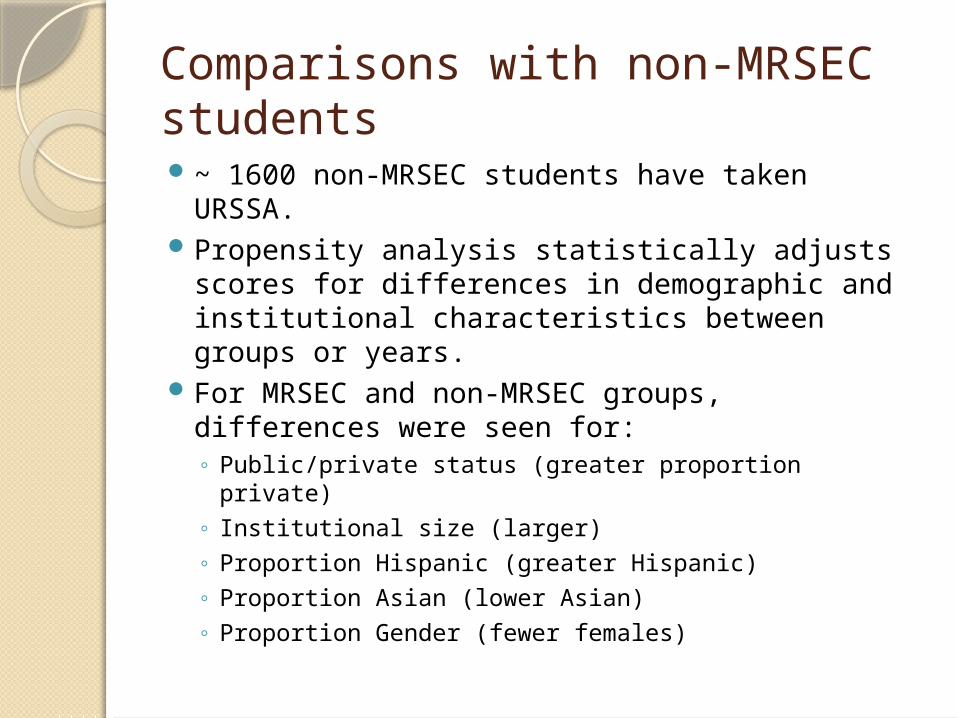
Comparisons with non-MRSEC students~ 1600 non-MRSEC students have taken
URSSA.Propensity analysis statistically adjusts scores
for differences in demographic and institutional characteristics between groups or years.
For MRSEC and non-MRSEC groups, differences were seen for:◦ Public/private status (greater proportion private)◦ Institutional size (larger)◦ Proportion Hispanic (greater Hispanic)◦ Proportion Asian (lower Asian)◦ Proportion Gender (fewer females)
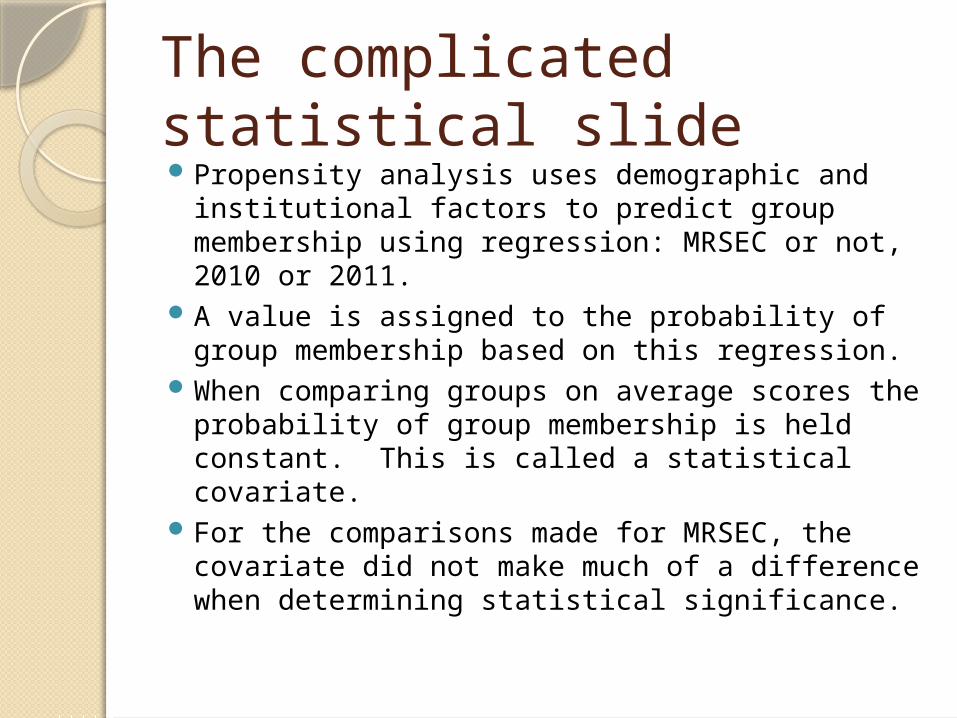
The complicated statistical slidePropensity analysis uses demographic and
institutional factors to predict group membership using regression: MRSEC or not, 2010 or 2011.
A value is assigned to the probability of group membership based on this regression.
When comparing groups on average scores the probability of group membership is held constant. This is called a statistical covariate.
For the comparisons made for MRSEC, the covariate did not make much of a difference when determining statistical significance.
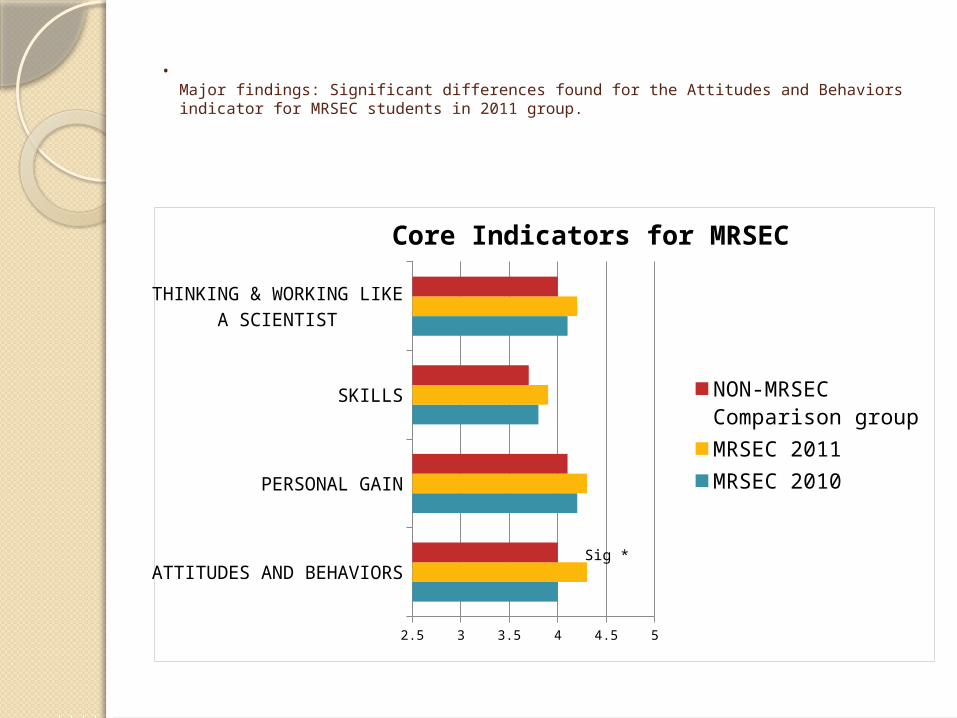
•Major findings: Significant differences found for the Attitudes and Behaviors indicator for MRSEC students in 2011 group.
ATTITUDES AND BEHAV-IORS
PERSONAL GAIN
SKILLS
THINKING & WORKING LIKE A SCIENTIST
2.5 3 3.5 4 4.5 5
Core Indicators for MRSEC
NON-MRSEC Compar-ison groupMRSEC 2011MRSEC 2010
Sig *

Hispanic and first year students report greater gains.Hispanic students report gaining
more on all core gains items than white students (.3 to .5 greater).
First Year students report higher scores on Personal Gains items than Sophomores or Juniors (.2 to .3 greater).
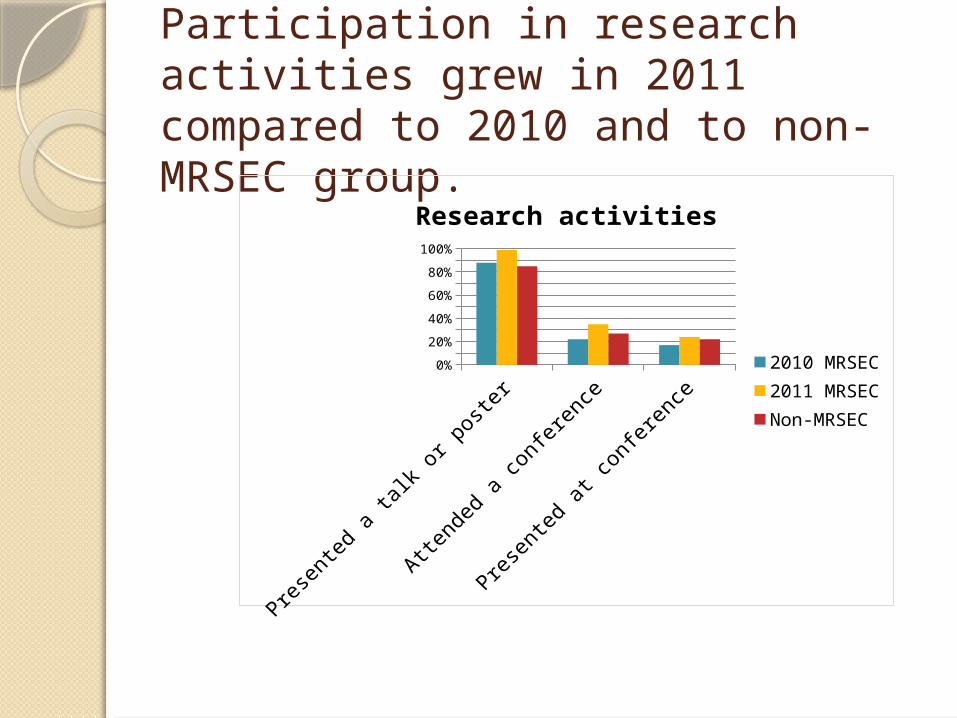
Participation in research activities grew in 2011 compared to 2010 and to non-MRSEC group.
Pres
ente
d a
talk o
r pos
ter
Atte
nded
a con
fere
nce
Pres
ente
d at
con
fere
nce
0%
20%
40%
60%
80%
100%
Research activities
2010 MRSEC2011 MRSECNon-MRSEC

Satisfaction ratings were high for MRSEC studentsSatisfaction with time spent with mentor
(4.0), time spent doing meaningful research (4.2), and overall research experience (4.5) was high and constant over the two years for the MRSEC groups.
Satisfaction ratings for MRSEC were
similar to those of non-MRSEC REU’s.
Satisfaction was relatively uniform over sites.
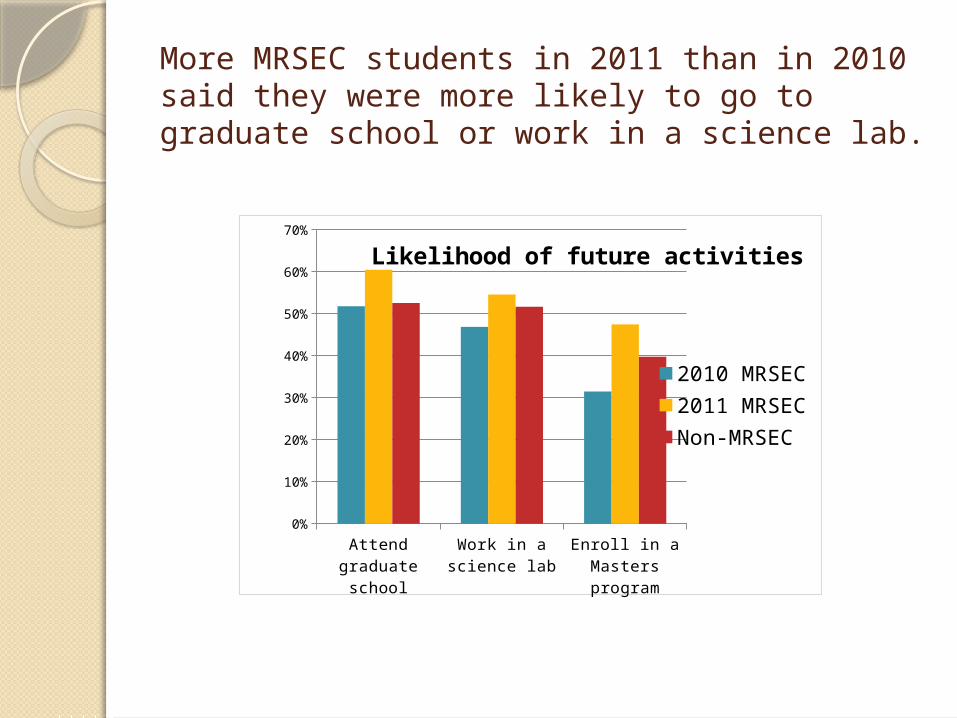
More MRSEC students in 2011 than in 2010 said they were more likely to go to graduate school or work in a science lab.
Attend grad-uate school
Work in a science lab
Enroll in a Masters program
0%
10%
20%
30%
40%
50%
60%
70%
Likelihood of future activities
2010 MRSEC2011 MRSECNon-MRSEC
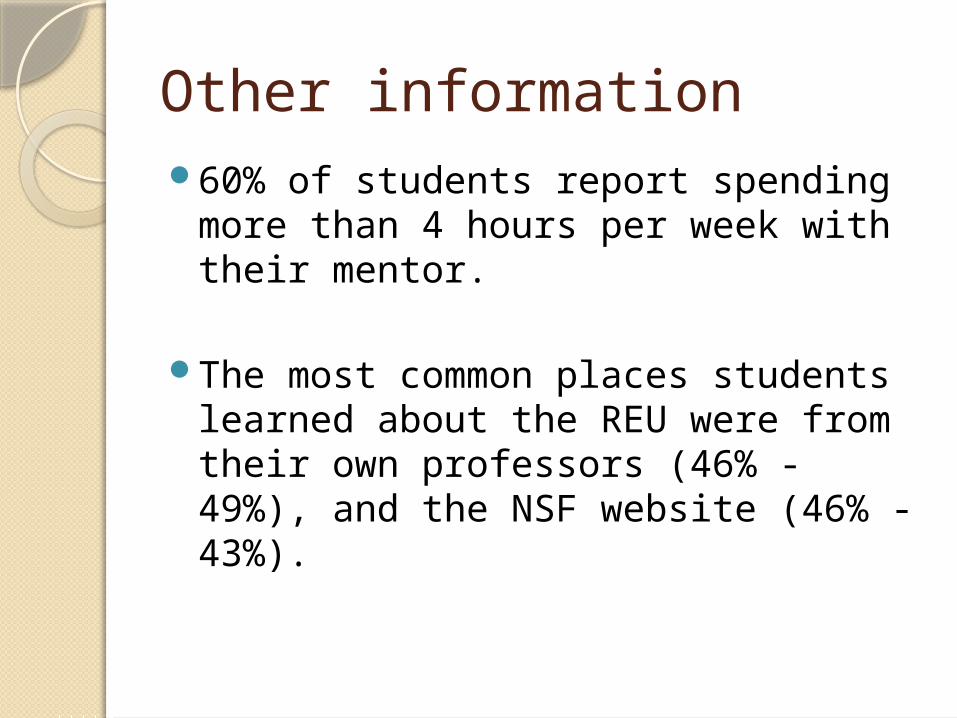
Other information60% of students report spending more
than 4 hours per week with their mentor.
The most common places students learned about the REU were from their own professors (46% - 49%), and the NSF website (46% - 43%).
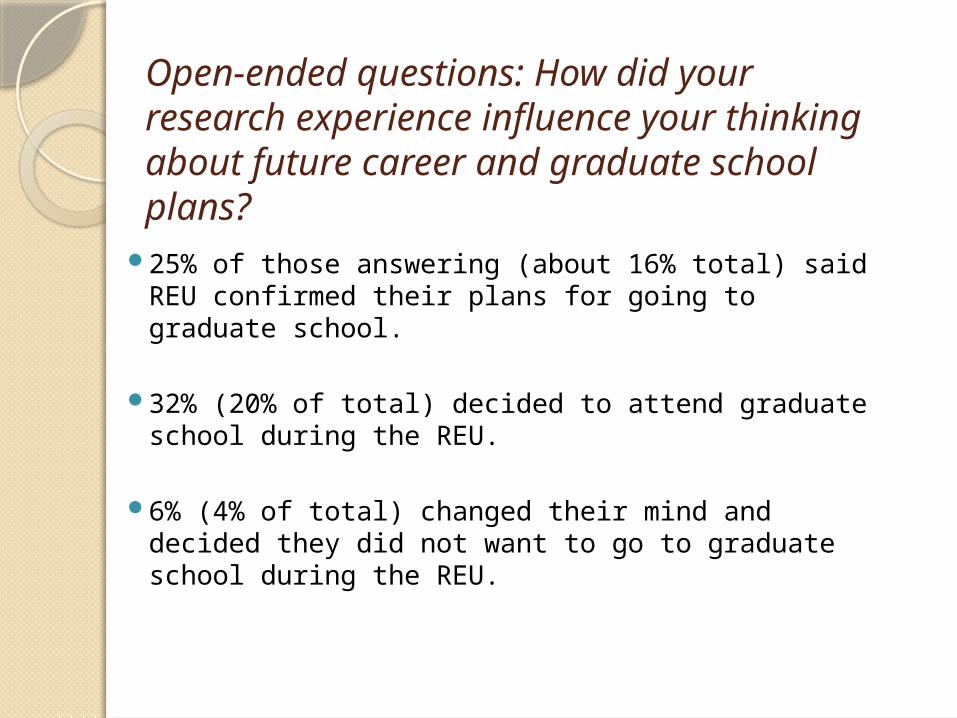
Open-ended questions: How did your research experience influence your thinking about future career and graduate school plans?
25% of those answering (about 16% total) said REU confirmed their plans for going to graduate school.
32% (20% of total) decided to attend graduate school during the REU.
6% (4% of total) changed their mind and decided
they did not want to go to graduate school during the REU.
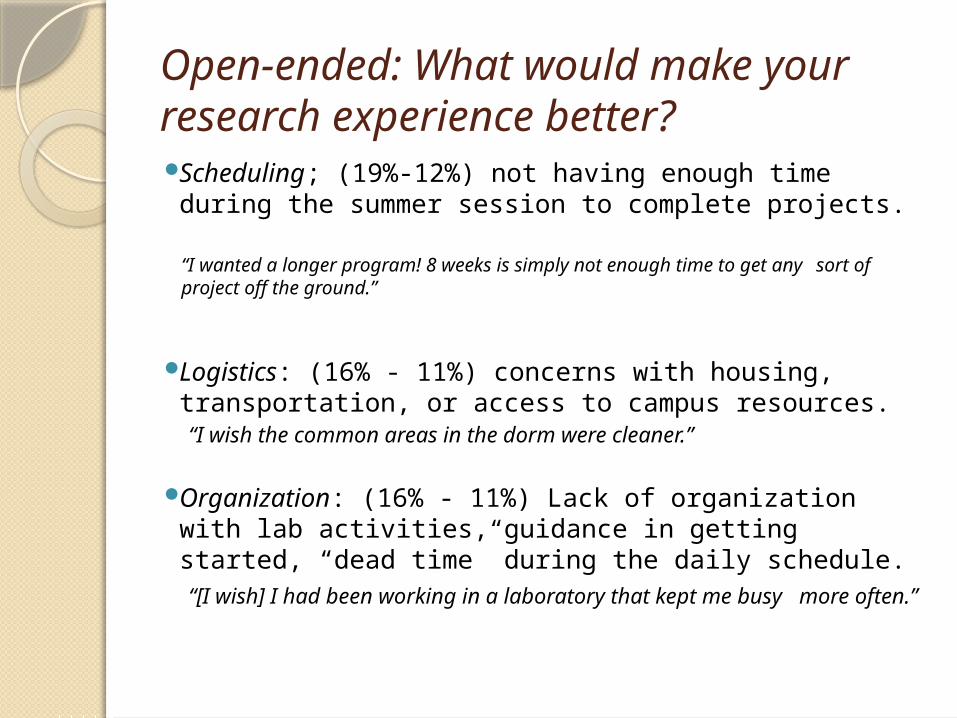
Open-ended: What would make your research experience better?Scheduling; (19%-12%) not having enough time
during the summer session to complete projects.
“I wanted a longer program! 8 weeks is simply not enough time to get any sort of project off the ground.”
Logistics: (16% - 11%) concerns with housing,
transportation, or access to campus resources. “I wish the common areas in the dorm were cleaner.” Organization: (16% - 11%) Lack of organization with
lab activities, guidance in getting started, “dead time” during the daily schedule.
“[I wish] I had been working in a laboratory that kept me busy more often.”
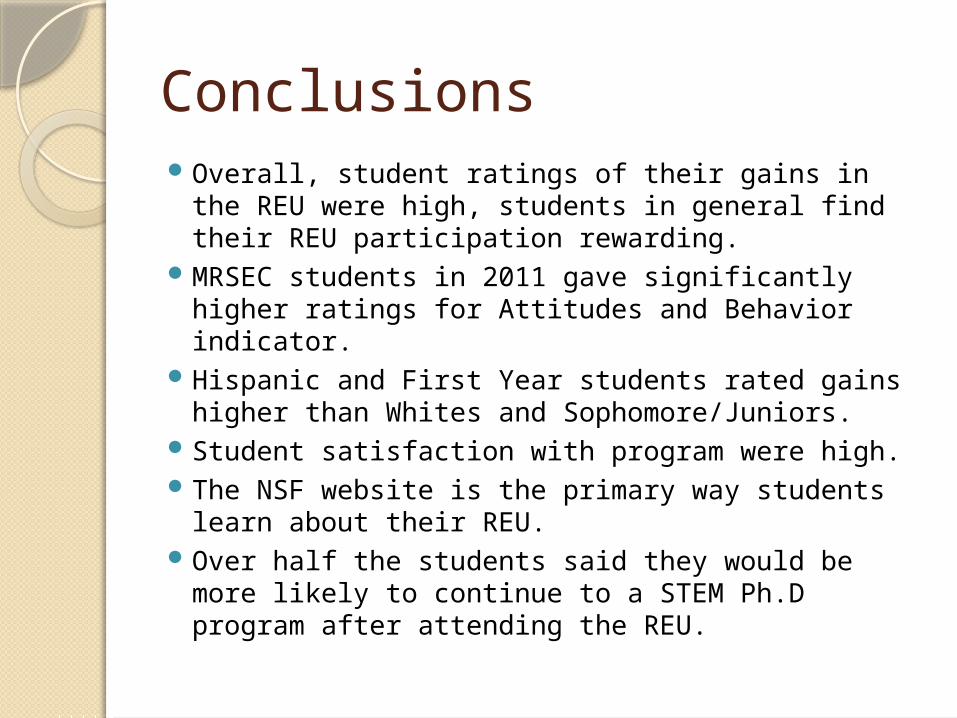
ConclusionsOverall, student ratings of their gains in the REU
were high, students in general find their REU participation rewarding.
MRSEC students in 2011 gave significantly higher ratings for Attitudes and Behavior indicator.
Hispanic and First Year students rated gains higher than Whites and Sophomore/Juniors.
Student satisfaction with program were high. The NSF website is the primary way students
learn about their REU.Over half the students said they would be more
likely to continue to a STEM Ph.D program after attending the REU.