An overview of traffic sign detection methods · An overview of traffic sign detection methods...
9
An overview of traffic sign detection methods Karla Brki´ c Department of Electronics, Microelectronics, Computer and Intelligent Systems Faculty of Electrical Engineering and Computing Unska 3, 10000 Zagreb, Croatia Email: [email protected] Abstract—This paper reviews the popular traffic sign detection methods prevalent in recent literature. The methods are divided into three categories: color-based, shape-based, and learning- based. Color-based detection methods from eleven different works are studied and summarized in a table for easy reference. Three shape-based detection methods are presented, and a recent method based on Hough transform is studied in detail. In the section on learning-based detection, we review the Viola Jones detector and the possibility of applying it to traffic sign detection. We conclude with two case studies which show how the presented methods are used to design complex traffic sign detection systems. I. I NTRODUCTION Recent increases in computing power have brought com- puter vision to consumer-grade applications. As computers offer more and more processing power, the goal of real- time traffic sign detection and recognition is becoming fea- sible. Some new models of high class vehicles already come equipped with driver assistance systems which offer automated detection and recognition of certain classes of traffic signs. Traffic sign detection and recognition is also becoming inter- esting in automated road maintenance. Every road has to be periodically checked for any missing or damaged signs, as such signs pose safety threats. The checks are usually done by driving a car down the road of interest and recording any observed problem by hand. The task of manually checking the state of every traffic sign is long, tedious and prone to human error. By using techniques of computer vision, the task could be automated and therefore carried out more frequently, resulting in greater road safety. To a person acquainted with recent advances in computer vision, the problem of traffic sign detection and recognition might seem easy to solve. Traffic signs are fairly simple objects with heavily constrained appearances. Just a glance at the well-known PASCAL visual object classes challenge for 2009 indicates that researchers are now solving the problem of detection and classification of complex objects with a lot of intra-class variation, such as bicycles, aeroplanes, chairs or animals (see figure 1). Contemporary detection and classifi- cation algorithms will perform really well in detecting and classifying a traffic sign in an image. However, as research comes closer to commercial applications, the constraints of the problem change. In driver assistance systems or road inventory systems, the problem is no longer how to efficiently detect and recognize a traffic sign in a single image, but how to reliably detect it in hundreds of thousands of video frames without any false alarms, often using low-quality cheap sensors available in mass production. To illustrate the problem of false alarms, consider the following: one hour of video shot at 24 frames per second consists of 86400 frames. If we assume that in the video under consideration traffic signs appear every three minutes and typically span through 40 frames, there are a total of 800 frames which contain traffic signs and 85600 frames which do not contain any signs. These 85600 frames without traffic signs will be presented to our detection system. If our system were to make an error of 1 false positive per 10 images, we would still be left with 8560 false alarms in one hour, or two false alarms every second, rendering the system completely unusable for any serious application! To make the problem even harder, we cannot expect the vehicle on which a commercial traffic sign detection system will be deployed to be equipped with a very high-resolution camera or other helpful sensors, as the addition of such sensors increases production costs. Fig. 1: Labeled examples from the PASCAL visual object classes challenge 2009. [1] This paper presents an overview of basic traffic sign de- tection methods. Using the presented methods as commercial stand-alone solutions is impossible, as they fail to provide the required true positive and false positive rates. However, combining the methods has a synergistic effect, so they are commonly used as building blocks of larger detection systems. In this paper, the traffic sign detection methods are divided into three categories: color-based methods, shape-based methods and methods based on machine learning. After introducing the methods, we present two traffic sign detection systems which use them. A. Traffic sign classes - the Vienna convention Before investigating common traffic sign detection methods, it is useful to briefly review the data on which these methods operate, i.e. the classes of traffic signs. In 1968, an interna- tional treaty aiming to standardize traffic signs across different
Transcript of An overview of traffic sign detection methods · An overview of traffic sign detection methods...

An overview of traffic sign detection methodsKarla Brkic
Department of Electronics, Microelectronics, Computer and Intelligent SystemsFaculty of Electrical Engineering and Computing
Unska 3, 10000 Zagreb, CroatiaEmail: [email protected]
Abstract—This paper reviews the popular traffic sign detectionmethods prevalent in recent literature. The methods are dividedinto three categories: color-based, shape-based, and learning-based. Color-based detection methods from eleven differentworks are studied and summarized in a table for easy reference.Three shape-based detection methods are presented, and a recentmethod based on Hough transform is studied in detail. In thesection on learning-based detection, we review the Viola Jonesdetector and the possibility of applying it to traffic sign detection.We conclude with two case studies which show how the presentedmethods are used to design complex traffic sign detection systems.
I. INTRODUCTION
Recent increases in computing power have brought com-puter vision to consumer-grade applications. As computersoffer more and more processing power, the goal of real-time traffic sign detection and recognition is becoming fea-sible. Some new models of high class vehicles already comeequipped with driver assistance systems which offer automateddetection and recognition of certain classes of traffic signs.Traffic sign detection and recognition is also becoming inter-esting in automated road maintenance. Every road has to beperiodically checked for any missing or damaged signs, assuch signs pose safety threats. The checks are usually doneby driving a car down the road of interest and recording anyobserved problem by hand. The task of manually checkingthe state of every traffic sign is long, tedious and prone tohuman error. By using techniques of computer vision, the taskcould be automated and therefore carried out more frequently,resulting in greater road safety.
To a person acquainted with recent advances in computervision, the problem of traffic sign detection and recognitionmight seem easy to solve. Traffic signs are fairly simpleobjects with heavily constrained appearances. Just a glance atthe well-known PASCAL visual object classes challenge for2009 indicates that researchers are now solving the problemof detection and classification of complex objects with a lotof intra-class variation, such as bicycles, aeroplanes, chairs oranimals (see figure 1). Contemporary detection and classifi-cation algorithms will perform really well in detecting andclassifying a traffic sign in an image. However, as researchcomes closer to commercial applications, the constraints of theproblem change. In driver assistance systems or road inventorysystems, the problem is no longer how to efficiently detect andrecognize a traffic sign in a single image, but how to reliablydetect it in hundreds of thousands of video frames without anyfalse alarms, often using low-quality cheap sensors available
in mass production. To illustrate the problem of false alarms,consider the following: one hour of video shot at 24 framesper second consists of 86400 frames. If we assume that inthe video under consideration traffic signs appear every threeminutes and typically span through 40 frames, there are atotal of 800 frames which contain traffic signs and 85600frames which do not contain any signs. These 85600 frameswithout traffic signs will be presented to our detection system.If our system were to make an error of 1 false positive per 10images, we would still be left with 8560 false alarms in onehour, or two false alarms every second, rendering the systemcompletely unusable for any serious application! To make theproblem even harder, we cannot expect the vehicle on which acommercial traffic sign detection system will be deployed to beequipped with a very high-resolution camera or other helpfulsensors, as the addition of such sensors increases productioncosts.
Fig. 1: Labeled examples from the PASCAL visual objectclasses challenge 2009. [1]
This paper presents an overview of basic traffic sign de-tection methods. Using the presented methods as commercialstand-alone solutions is impossible, as they fail to providethe required true positive and false positive rates. However,combining the methods has a synergistic effect, so they arecommonly used as building blocks of larger detection systems.In this paper, the traffic sign detection methods are divided intothree categories: color-based methods, shape-based methodsand methods based on machine learning. After introducing themethods, we present two traffic sign detection systems whichuse them.
A. Traffic sign classes - the Vienna conventionBefore investigating common traffic sign detection methods,
it is useful to briefly review the data on which these methodsoperate, i.e. the classes of traffic signs. In 1968, an interna-tional treaty aiming to standardize traffic signs across different
countries, the so-called Vienna Convention on Road Signs andSignals, was signed [2]. To date there are 52 countries whichhave signed the treaty, among which 31 are in Europe. TheVienna Convention classifies road signs into seven categories,designated with letters A-H: danger warning signs (A), prioritysigns (B), prohibitory or restrictive signs (C), mandatory signs(D), information, facilities, or service signs (F), direction,position, or indication signs (G) and additional panels (H).Examples of Croatian traffic signs for each of the categoriesare shown in figure 2.
Fig. 2: Examples of traffic signs. From left to right: a dangerwarning sign, a prohibitory sign, a priority sign, a mandatorysign, an information sign, a direction sign and an additionalpanel.
In spite of appearances of traffic signs being strictly pre-scribed by the Vienna convention, there still exist variationsbetween countries which have signed the treaty. The varia-tions are seemingly irrelevant for a human, but might posesignificant challenges for a computer vision algorithm. Foran example, see table I, where variations of two traffic signsacross six different European countries are shown. Therefore,contemporary traffic sign detection systems are still country-specific.
TABLE I: Two traffic signs, as defined by regulations of sixdifferent European countries. Notice the subtle differences thatdon’t present a problem for a human, but might influence theperformance of a detection algorithm.
Croatia Germany Spain France Italy Poland
B. Evaluating traffic sign detection methods
Research concerning traffic sign detection is often hard tocompare, as different researchers approach the problem withdifferent application areas and constraints in mind. Traffic signdetection methods are inherently dependent on the nature datafor which they were developed. Some factors in which themethods differ are the following:
• Input type: videos or static images?• Scope of the method: is the method applicable for a single
traffic sign class or for multiple classes?• Filming conditions: is the data shot in broad daylight, in
nighttime or both? Are there adverse weather conditionssuch as rain, snow, fog?
• Sensor type: high resolution or low resolution camera,grayscale or color? Multiple cameras? Other sensors?
• Processing requirements: should the signs be detected inrealtime or is offline processing acceptable?
• Acceptable true positive and false positive rates: deter-mined by the nature of the problem.
The nature of the problem, the availability of sensors andthe target application determine which method to use. Forexample, color-based detection is pointless if we are workingwith a grayscale camera. On the other hand, it might be veryuseful if we are trying to detect traffic signs in high resolutioncolor images taken in broad daylight with a high qualitycamera. Shape-based detection might not work if we are usinga camera with interlacing. Learning-based approaches mightbe a perfect solution if we have a lot of labeled data, but ifno labeled data is available we cannot use them.
II. COLOR-BASED DETECTION METHODS
The prevalent approach in detecting traffic signs based oncolor is very obvious - one finds the areas of the image whichcontain the color of interest, using simple thresholding or moreadvanced image segmentation methods. The resulting areas arethen either immediately designated as traffic signs, or passedon to subsequent stages as traffic sign location hypotheses(i.e. regions of interest). The main weakness of such anapproach lies in the fact that color tends to be unreliable -depending on the time of day, weather conditions, shadowsetc. the illumination of the scene can vary considerably. RGBcolor space is considered to be very sensitive to illumination,so many researchers choose to carry out the color-basedsegmentation in other color spaces, such as HSI or L*a*b.
A. Color spaces: a short review
To understand why some color spaces are consideredillumination-sensitive and some not, we briefly review thetheory of color spaces. A color space is defined using a colormodel. In general, a color model is an abstract mathematicalmodel which defines how colors can be represented as tuplesof numbers. All the valid tuples constitute a color space. Com-mon dimensionality of tuples is three to four. There is a myriadof color spaces which differ in the basic colors used. Someof the most pupular are RGB (red-green-blue) color space,HSI (hue-saturation-intesity) color space, L*a*b (lightness-color opponent dimensions), CMYK (cyan-magenta-yellow-black) color space, CIECAM97 color space.
Fig. 3: Obtaining two different shades of orange by mixing red,green and blue components. By just looking at the differencesbetween the channels it would be hard to conclude that thecolors are similar.
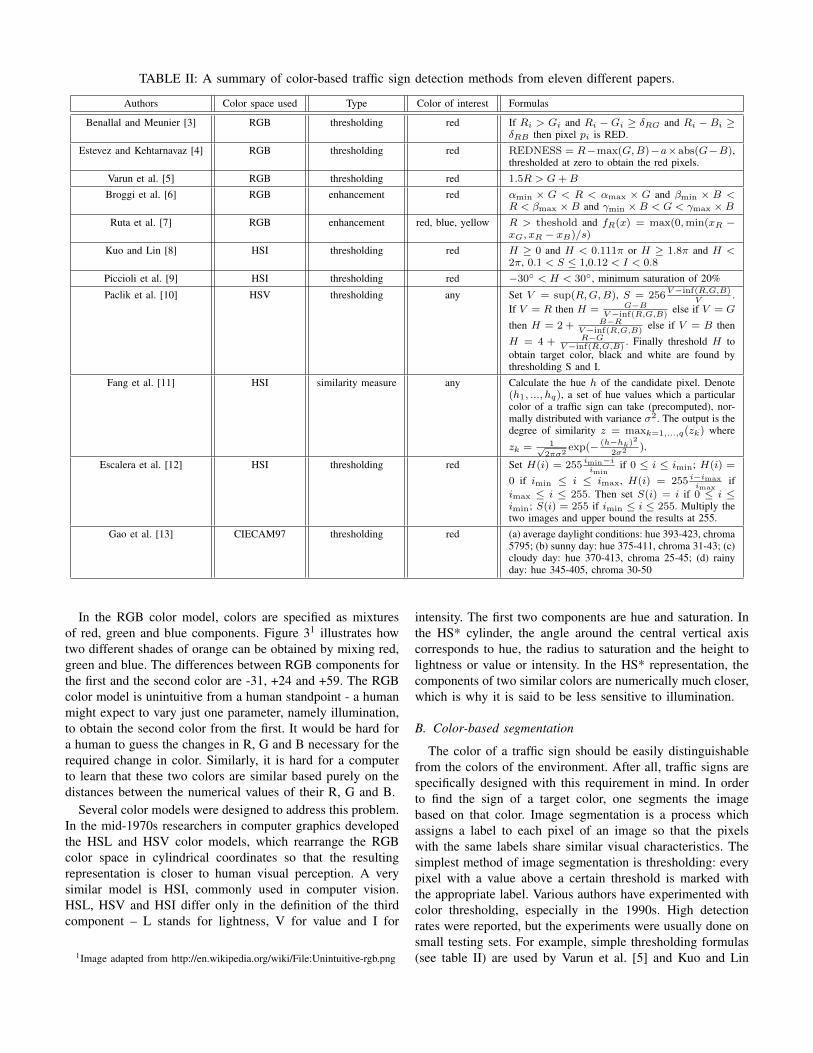
TABLE II: A summary of color-based traffic sign detection methods from eleven different papers.
Authors Color space used Type Color of interest Formulas
Benallal and Meunier [3] RGB thresholding red If Ri > Gi and Ri − Gi ≥ δRG and Ri − Bi ≥δRB then pixel pi is RED.
Estevez and Kehtarnavaz [4] RGB thresholding red REDNESS = R−max(G,B)−a×abs(G−B),thresholded at zero to obtain the red pixels.
Varun et al. [5] RGB thresholding red 1.5R > G+B
Broggi et al. [6] RGB enhancement red αmin × G < R < αmax × G and βmin × B <R < βmax ×B and γmin ×B < G < γmax ×B
Ruta et al. [7] RGB enhancement red, blue, yellow R > theshold and fR(x) = max(0,min(xR −xG, xR − xB)/s)
Kuo and Lin [8] HSI thresholding red H ≥ 0 and H < 0.111π or H ≥ 1.8π and H <2π, 0.1 < S ≤ 1,0.12 < I < 0.8
Piccioli et al. [9] HSI thresholding red −30◦ < H < 30◦, minimum saturation of 20%
Paclik et al. [10] HSV thresholding any Set V = sup(R,G,B), S = 256V−inf(R,G,B)
V.
If V = R then H = G−BV−inf(R,G,B)
else if V = G
then H = 2 + B−RV−inf(R,G,B)
else if V = B then
H = 4 + R−GV−inf(R,G,B)
. Finally threshold H toobtain target color, black and white are found bythresholding S and I.
Fang et al. [11] HSI similarity measure any Calculate the hue h of the candidate pixel. Denote(h1, ..., hq), a set of hue values which a particularcolor of a traffic sign can take (precomputed), nor-mally distributed with variance σ2. The output is thedegree of similarity z = maxk=1,...,q(zk) where
zk = 1√2πσ2
exp(− (h−hk)2
2σ2 ).
Escalera et al. [12] HSI thresholding red Set H(i) = 255 imin−iimin
if 0 ≤ i ≤ imin; H(i) =
0 if imin ≤ i ≤ imax, H(i) = 255 i−imaximax
ifimax ≤ i ≤ 255. Then set S(i) = i if 0 ≤ i ≤imin; S(i) = 255 if imin ≤ i ≤ 255. Multiply thetwo images and upper bound the results at 255.
Gao et al. [13] CIECAM97 thresholding red (a) average daylight conditions: hue 393-423, chroma5795; (b) sunny day: hue 375-411, chroma 31-43; (c)cloudy day: hue 370-413, chroma 25-45; (d) rainyday: hue 345-405, chroma 30-50
In the RGB color model, colors are specified as mixturesof red, green and blue components. Figure 31 illustrates howtwo different shades of orange can be obtained by mixing red,green and blue. The differences between RGB components forthe first and the second color are -31, +24 and +59. The RGBcolor model is unintuitive from a human standpoint - a humanmight expect to vary just one parameter, namely illumination,to obtain the second color from the first. It would be hard fora human to guess the changes in R, G and B necessary for therequired change in color. Similarly, it is hard for a computerto learn that these two colors are similar based purely on thedistances between the numerical values of their R, G and B.
Several color models were designed to address this problem.In the mid-1970s researchers in computer graphics developedthe HSL and HSV color models, which rearrange the RGBcolor space in cylindrical coordinates so that the resultingrepresentation is closer to human visual perception. A verysimilar model is HSI, commonly used in computer vision.HSL, HSV and HSI differ only in the definition of the thirdcomponent – L stands for lightness, V for value and I for
1Image adapted from http://en.wikipedia.org/wiki/File:Unintuitive-rgb.png
intensity. The first two components are hue and saturation. Inthe HS* cylinder, the angle around the central vertical axiscorresponds to hue, the radius to saturation and the height tolightness or value or intensity. In the HS* representation, thecomponents of two similar colors are numerically much closer,which is why it is said to be less sensitive to illumination.
B. Color-based segmentation
The color of a traffic sign should be easily distinguishablefrom the colors of the environment. After all, traffic signs arespecifically designed with this requirement in mind. In orderto find the sign of a target color, one segments the imagebased on that color. Image segmentation is a process whichassigns a label to each pixel of an image so that the pixelswith the same labels share similar visual characteristics. Thesimplest method of image segmentation is thresholding: everypixel with a value above a certain threshold is marked withthe appropriate label. Various authors have experimented withcolor thresholding, especially in the 1990s. High detectionrates were reported, but the experiments were usually done onsmall testing sets. For example, simple thresholding formulas(see table II) are used by Varun et al. [5] and Kuo and Lin

[8]. External factors such as illumination changes, shadows,adverse weather conditions can greatly impact the success ofcolor-based detection techniques. This significantly reducesthe potential of color thresholding as a stand-alone solutionfor detection. In recent research, color thresholding commonlyfinds is purpose as a preprocessing step to extract regions ofinterest [14], [15].
Influences of daily illumination changes are recognizedby Benallal and Meunier [3]. They present an interestingexperiment in which they observe the color of a red STOPthrough 24 hours. They show that the red color component isdominant between approximately 6.30 am and 9 pm. Duringthat time, the differences δRG and δRB between the red colorcomponent and the green and blue components remain high,the red color having a value of approximately 85 above thegreen and the blue components. Based on this experiment, theypropose formulas for color segmentation intended to correctlysegment the red, green and blue signs (see table II).
Estevez and Kehtarnavaz [4] present an algorithm for de-tecting and recognizing a small subset of traffic signs whichcontain red components. The first stage of their algorithm iscolor segmentation, used to localize red edge areas. The for-mula for the segmentation, given in table II, relies on a tunableparameter α which can be tuned to varying sensitivities basedon intensity levels, in order to avoid illumination sensitivity.Average intensity values are obtained by sparsely sampling thetop line of the image, usually corresponding to the sky. Fromthese values one can speculate about the weather conditionsand choose the proper value of α. The exact values of α chosenare not given in the paper.
Broggi et al. [6] propose a way of overcoming the colordependency on the light source. The default way to determinethe light source color is to find a white object in the sceneand compute the difference between the image white and the-oretical white (RGB values 255, 255, 255). In road sequencesone cannot count on having a white reference point, but theroad is usually gray. Broggi et al. therefore find a piece ofroad (it is unclear whether this is an automated procedure orit needs to be done by hand) and estimate the light sourcecolor by assuming that the road should be gray. They thenperform chromatic equalization, similar to gamma correctionbut with the linearization of gamma function.
Ruta et al. [7] use color-based segmentation as a startingstage in traffic sign recognition. They first segment the imagebased on fixed thresholds (which are not listed in the paper),and then enhance the obtained colors using formulas shownin table II.
Escalera et al. [12] present an approach for detecting redin HSI color space. The input image is first converted fromRGB to HSI. For each pixel, values of hue and saturationare re-calculated so that the range of saturated red hues isemphasized. This is done by using a lookup table describedin table II. The authors assume that the values of hue andsaturation are scaled to the range of 0 to 255. The resultinghue and saturation are then multiplied and the result is upperbounded by 255. Thus the response image is obtained. The
authors state that the values are multiplied so that the twocomponents can correct each other - if one component iswrong, the assumption is that the other one will not be wrong.
Fang et al. [11] classify colors based on their similarity withpre-stored hues. The idea is that the hues in which a traffic signappears are stored in advance, and the color label is calculatedas the similarity measure with all available hues, so that theclassification which is most similar is chosen.
Paclik et al. [10] present approximative formulas for con-verting RGB to HSI. The desired color is then obtained bychoosing an appropriate threshold for hue, while black andwhite are found by thresholding the saturation and intensitycomponents.
Gao et al. [13] use the CIECAM97 color model. Theimages are first transformed from RGB to CIE XYZ values,and then to LCH (Lightness, Chroma, Hue) space using theCIECAM97 model. The authors state that the lightness valuesare similar for red and blue signs and the background, soonly hue and chroma measures are used in the segmentation.Authors consider four distinct cases: average daylight viewingconditions, as well as conditions during sunny, cloudy andrainy weather. Using the acceptable ranges, sign candidatesare segmented using a quad-tree approach, meaning that theimage is recursively divided into quadrants until all elementsare homogeneous or the predefined grain size is reached.
For an another view on traffic sign detection by color, see areview paper by Nguwi and Kouzani [16], in which the color-based detection methods are divided into seven categories.
III. SHAPE-BASED DETECTION
Several approaches for shape-based detection of trafficsigns are recurrent in literature. Probably the most commonapproach is using some form of Hough transform. Approachesbased on corner detection followed by reasoning or approachesbased on simple template matching are also popular.
Generalized Hough transform is a technique for findingarbitrary shapes in an image. The basic idea is that, usingan edge image, each pixel of the edge image votes for wherethe object center would be if that pixel were at the objectboudary. The technique originated early in the history ofcomputer vision. It was extended and modified numeroustimes and there are many variants. Here we will presentwork by Loy and Barnes, as it was intended specifically fortraffic sign detection and was used independently in severaldetection systems. Loy and Barnes [17] propose a generalregular polygon detector and use it to detect traffic signs. Thedetector is based on their fast radial symmetry transform, andthe overall approach is similar to Hough transform. First thegradient magnitude image is built from the original image.The gradient magnitude image is then thresholded so that thepoints with low magnitudes, which are unlikely to correspondto edges, are eliminated. Each remaining pixel then votes forthe possible positions of the center of a regular polygon. Onepixel casts its vote at multiple locations distributed along a linewhich is perpendicular to the gradient of the pixel and whosedistance to the pixel is equal to the expected radius of the

regular polygon (see figure 4). Notice that there are actuallytwo lines which satisfy these requirements, one in the directionof the gradient and the other in the opposite direction. Bothcan be used if we don’t know in advance whether signs will belighter or darker than the background. The length of the voting
Fig. 4: Locations on which a pixel votes for the object center.The parts of the line which are black indicate negative votes.Image from [17].
line is bounded by the expected radius of the regular polygon.The votes towards the end of the line have negative weights,to minimize the influence of straight lines in an image whichare too long to be polygon edges. The resulting vote image islabeled Or.
In addition to the vote image, another image called equian-gular image is built. The proposed procedure favors equian-gular polygons by utilizing the following property: if thegradient angles of edge pixels of an n-sided regular polygonare multiplied by n, the resulting angles will be equal (seefigure 5). For instance, cosider an equiangular triangle forwhich we sample one gradient angle value at each side.Suppose that we obtain gradient values of 73◦, 193◦ and313◦. The gradients are spaced at 360◦/n = 120◦. Then73◦ × 3 = 219◦ and 193◦ × 3 = 579◦, 579◦ − 360◦ = 219◦.Similarly 313◦ × 3 = 939◦, 939◦ − 2 × 360◦ = 219◦. Foreach pixel which voted for the polygon center, a unit vector isconstructed. The slope of the unit vector is made equal to thegradient angle of the pixel multiplied by the number of sides ofthe sought regular polygon. The pixel then again casts its voteon locations determined by the voting line, except that thistime the vote takes the form of the constructed unit vector.The votes are cast in a new image called the equiangularimage. Each point in this image represents a vector whichis the sum of all contributing votes. The votes coming fromedges of equiangular polygons will have the same slope, so themagnitudes of vote vectors in equiangular polygon cenroidsshould be the largest.
Fig. 5: Multiplying the gradient angles of a triangle by 3. Theresulting angles are equal. Image from [17].
Finally, the vote image and the norm of the equiangularimage are combined to produce the overall response. Compu-tational complexity of this method is O(Nkl), where l is themaximum length of the voting line, N is the number of pixelsin an image and k is the number of radii being considered. Themain weakness of the approach is that the radius of the soughtpolygon should be known in advance, which is not always easyto accomplish. This can be solved by trying out multiple radii,but it might be too expensive in terms of processing time.
Another interesting approach in finding shapes of interestis to use a corner detector and then hypothesise about thelocations of regular polygons by observing the relations be-tween corners. Paulo and Correia [18] detect triangular andrectangular signs by first applying the Harris corner detectorto a region of interest, and then searching for existence ofcorners in six predefined control areas of the region. The shapeis determined based on the configuration of the control regionsin which corners are found. Control areas are shown in figure6.
Fig. 6: Predefined control areas from [18]. The shape isdetermined by the existence of corners in the control areas.
Gavrila [19] uses distance transform based template match-ing for shape detection. First, edges in the original imageare found. Second, a distance transform (DT) image is built(see figure 7). A DT image is an image in which each pixelrepresents the distance to the nearest edge. To find the shapeof interest, the basic idea is to match a template (for instance,a regular triangle) against the DT image. In order to find theoptimal match, the template is rotated, scaled and translated.One might consider attempting to match the template with theraw edge image instead, but by matching with DT image theresulting similarity measure is much smoother. In Gavrila’sextension of this basic idea, the edges are differented byorientation, so that separate DT images are computed fordistinct edge orientation intervals and templates are separatedinto parts based on orientations of their edges. The overallmatch measure is a sum of match measures between DTimages and templates of specific orientations. Gavrila alsouses a template hierarchy, with the idea that similar templatesare grouped into prototypes, and, once the prototype has beenfound, the process finds the best template within the prototype.This saves computation costs.
IV. DETECTION BASED ON MACHINE LEARNING
In the approaches outlined above, the prior knowledge ofthe problem (the expected color and shape of a traffic sign) ismanually encoded into the solution. However, this knowledgecould also be discovered using machine learning.

Fig. 7: Building the distance transform image. From left to right: the original image, the edge image and the distance transformimage. The template for which the DT image is searched is a simple triangle. Images from [19].
Research by Viola and Jones [20] presented a significantmilestone in computer vision. Viola and Jones developed analgorithm capable of detecting objects very reliably and inreal time. The detector is trained using a set of positive andnegative examples. While originaly intended for face detection,various other researchers have succesfully applied the detectorto a lot of other object classes. Among others, traffic signswere successfully detected.
The detector of Viola and Jones is an attentional cascadeof boosted Haar-like classifiers. It combines two concepts: (i)AdaBoost and (ii) Haar-like classifiers. Haar-like classifiersare built using simple rectangular features which representdifferences of sums of specific pixels in an image. Each featureis paired with a threshold, and the decision of the so-builtclassifier is determined by comparing the value of the featurewith the threshold. Four feature types used in the original paperare shown in figure 8. Viola and Jones propose a very fastmethod of computation for such features which utilizes theso-called integral image. The value of each feature can becomputed in less then ten array references.
Fig. 8: Haar-like features used in training the detector.
AdaBoost is a technique for combining a number of weakclassifiers into a strong one. It has been proven to convergeto the optimal solution with a sufficient number of weakclassifiers. AdaBoost assigns weights to weak classifiers basedon their quality, and the resulting strong classifier is a linearcombination of weak classifiers with the appropriate weights.
Viola and Jones group multiple strong classifiers constructedby AdaBoost into an attentional cascade, which enables fasterprocessing. The strong classifier in the first stage of thecascade is chosen so that it discards a number of falsepositives, while preserving almost all true positives of thetraining set. For example, the OpenCV implementation de-faults to the minimum hit rate of 0.995 and maximum falsepositive rate of 0.5 per cascade stage. Subsequent stages of the
cascade follow the same numerical limitations. Each stage istrained so that the false positives of the previous stage arelabeled as negatives and added to the training set. Hence,subsequent stages are trained to correct the errors of previousstages, while preserving the high true positive rates. Using thecascade enables faster processing, as obvious false positivesare discarded early on.
The process of the detection is carried out by sliding adetection window across the image. Within the window, theresponse of the cascade is calculated. After completing onepass over the image, the size of the detection window isincreased by some factor (OpenCV defaults to 1.2, meaningthat the scale of the window will be increased by 20%). Thewindow size is increased until some predefined size is reached.Increasing the detection window by a smaller percentage yieldsbetter detection rates, but increases the total processing time.
(a) (b) (c)
(d) (e) (f)
Fig. 9: Examples of sign images used for training the Viola-Jones detector in [21]: (a) a normal sign, (b) shadow, (c) colorinconsistency, (d) interlacing, (e) motion blur and interlacing,(f) occlusion.
In our work [21] we experimented with using the Viola-Jones detector for triangular traffic sign detection. The detectorwas trained using about 1000 images of relatively poor quality.Some especially problematic images are shown in figure 9.The obtained detector achieved a very high true positive rate(ranging from 90% to 96%, depending on the training set
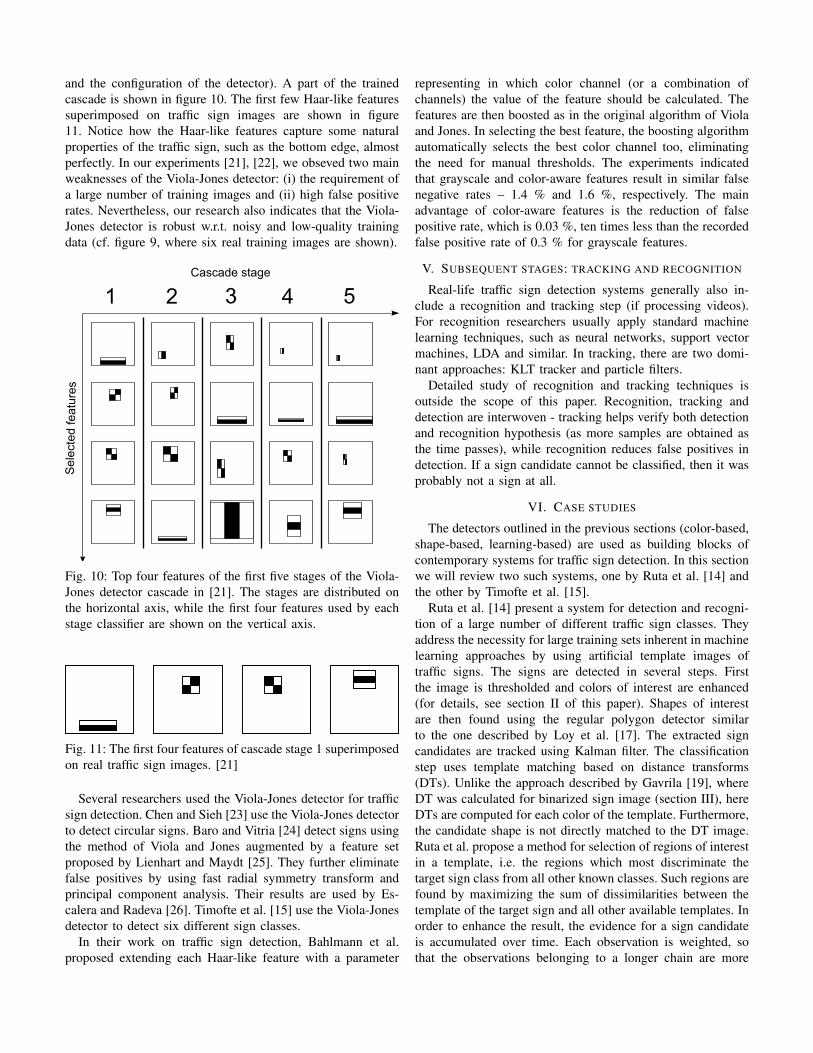
and the configuration of the detector). A part of the trainedcascade is shown in figure 10. The first few Haar-like featuressuperimposed on traffic sign images are shown in figure11. Notice how the Haar-like features capture some naturalproperties of the traffic sign, such as the bottom edge, almostperfectly. In our experiments [21], [22], we obseved two mainweaknesses of the Viola-Jones detector: (i) the requirement ofa large number of training images and (ii) high false positiverates. Nevertheless, our research also indicates that the Viola-Jones detector is robust w.r.t. noisy and low-quality trainingdata (cf. figure 9, where six real training images are shown).
Cascade stage
Sel
ecte
d fe
atur
es
1 2 3 4 5
Fig. 10: Top four features of the first five stages of the Viola-Jones detector cascade in [21]. The stages are distributed onthe horizontal axis, while the first four features used by eachstage classifier are shown on the vertical axis.
Fig. 11: The first four features of cascade stage 1 superimposedon real traffic sign images. [21]
Several researchers used the Viola-Jones detector for trafficsign detection. Chen and Sieh [23] use the Viola-Jones detectorto detect circular signs. Baro and Vitria [24] detect signs usingthe method of Viola and Jones augmented by a feature setproposed by Lienhart and Maydt [25]. They further eliminatefalse positives by using fast radial symmetry transform andprincipal component analysis. Their results are used by Es-calera and Radeva [26]. Timofte et al. [15] use the Viola-Jonesdetector to detect six different sign classes.
In their work on traffic sign detection, Bahlmann et al.proposed extending each Haar-like feature with a parameter
representing in which color channel (or a combination ofchannels) the value of the feature should be calculated. Thefeatures are then boosted as in the original algorithm of Violaand Jones. In selecting the best feature, the boosting algorithmautomatically selects the best color channel too, eliminatingthe need for manual thresholds. The experiments indicatedthat grayscale and color-aware features result in similar falsenegative rates – 1.4 % and 1.6 %, respectively. The mainadvantage of color-aware features is the reduction of falsepositive rate, which is 0.03 %, ten times less than the recordedfalse positive rate of 0.3 % for grayscale features.
V. SUBSEQUENT STAGES: TRACKING AND RECOGNITION
Real-life traffic sign detection systems generally also in-clude a recognition and tracking step (if processing videos).For recognition researchers usually apply standard machinelearning techniques, such as neural networks, support vectormachines, LDA and similar. In tracking, there are two domi-nant approaches: KLT tracker and particle filters.
Detailed study of recognition and tracking techniques isoutside the scope of this paper. Recognition, tracking anddetection are interwoven - tracking helps verify both detectionand recognition hypothesis (as more samples are obtained asthe time passes), while recognition reduces false positives indetection. If a sign candidate cannot be classified, then it wasprobably not a sign at all.
VI. CASE STUDIES
The detectors outlined in the previous sections (color-based,shape-based, learning-based) are used as building blocks ofcontemporary systems for traffic sign detection. In this sectionwe will review two such systems, one by Ruta et al. [14] andthe other by Timofte et al. [15].
Ruta et al. [14] present a system for detection and recogni-tion of a large number of different traffic sign classes. Theyaddress the necessity for large training sets inherent in machinelearning approaches by using artificial template images oftraffic signs. The signs are detected in several steps. Firstthe image is thresholded and colors of interest are enhanced(for details, see section II of this paper). Shapes of interestare then found using the regular polygon detector similarto the one described by Loy et al. [17]. The extracted signcandidates are tracked using Kalman filter. The classificationstep uses template matching based on distance transforms(DTs). Unlike the approach described by Gavrila [19], whereDT was calculated for binarized sign image (section III), hereDTs are computed for each color of the template. Furthermore,the candidate shape is not directly matched to the DT image.Ruta et al. propose a method for selection of regions of interestin a template, i.e. the regions which most discriminate thetarget sign class from all other known classes. Such regions arefound by maximizing the sum of dissimilarities between thetemplate of the target sign and all other available templates. Inorder to enhance the result, the evidence for a sign candidateis accumulated over time. Each observation is weighted, sothat the observations belonging to a longer chain are more

relevant. The idea behind this approach is that when a trafficsign is first detected it is too small for the classification to workreliably, so later appearances of the sign are more valuable.Experimental results indicate rates of correctly detected andrecognized traffic signs ranging from 79.4 % for circular signswith red rim to 97.3 % for blue circular signs.
Fig. 12: Pruning the 3D hypotheses using the MDL principle.The shorter set of hypotheses (right) is preferred over thelonger one (left). Image from [15].
Timofte et al. [15] present a complex system for traffic signdetection and recognition. For the data acquisition they use avan with eight high-resolution cameras, two on the each side ofthe van. The detection is carried out in two phases: (i) single-view phase and (ii) multi-view phase. In the single-view phase,the image is first thresholded to find the colors of interest.Also, a tranformation similar to generalized Hough transformis used for finding the shapes of interest. This step is very fast,and yields very few false negatives. To verify that the extractedcandidates are traffic signs, the Viola-Jones detector is ran onthe obtained bounding boxes. For additional verification theyemploy an SVM classifier which operates on normalized RGBchannels, pyramids of HOGs and discriminative Haar-likefeatures selected by AdaBoost. To recognize the class of thetraffic sign, six one-vs-all SVMs are used, each correspondingto one class of traffic signs (triangular, triangular upside-down,circular with red rim, circular blue, rectangular, diamond-shaped). In the multi-view phase, first the data collected duringthe single-view phase is integrated into hypotheses. Every pairof detections taken from different views is considered. Thepair is checked for geometrical consistency (the position ofthe hypothesis is backprojected to 2D and checked against theimage candidates) and visual consistency (pairs of detectionswith the same basic shape are favored). Next, the set of allhypotheses is pruned using the minimum description length(MDL) principle. The idea is to find the smallest possible setof 3D hypotheses which matches the known camera positionsand calibrations and is supported by detection evidence. For anillustration, see figure 12. In the end, the set of 2D observationsforming a 3D hypothesis is classified by an SVM classifier.The majority of votes determines the final type assigned to thehypothesis, i.e. the exact type of the traffic sign.
VII. CONCLUSION
In this paper, we have presented traffic sign detectionmethods which are often used as building blocks of complexdetection systems. The methods were divided into color-based,
shape-based and learning-based. We have shown how theoutlined methods are used in two state-of-the-art traffic signdetection systems.
We think that the complexity of traffic sign detectionsystems will diminish in the future, as technology advances.With the advancement of technology, high quality sensors willbecome cheaper and more available in mass production. Ifin the future every car is equipped with a high resolutioncolor camera, a GPS receiver and an odometer, an infraredcamera and other sensors, the problem of traffic sign detectionwill be infinitely more simple then it is now. However, theadvancement will probably proceed slowly, because of thepersistent need to minimize production costs.
REFERENCES
[1] M. Everingham, L. Van Gool, C. K. I. Williams, J. Winn,and A. Zisserman, “The PASCAL Visual Object ClassesChallenge 2009 (VOC2009) Results,” http://www.pascal-network.org/challenges/VOC/voc2009/workshop/index.html.
[2] Inland transport comitee, Convention on road signs and signals. Eco-nomic comission for Europe, 1968.
[3] M. Benallal and J. Meunier, “Real-time color segmentation of roadsigns,” Electrical and Computer Engineering, 2003. IEEE CCECE 2003.Canadian Conference on, vol. 3, pp. 1823–1826 vol.3, May 2003.
[4] L. Estevez and N. Kehtarnavaz, “A real-time histographic approachto road sign recognition,” Image Analysis and Interpretation, 1996.,Proceedings of the IEEE Southwest Symposium on, pp. 95–100, Apr1996.
[5] S. Varun, S. Singh, R. S. Kunte, R. D. S. Samuel, and B. Philip, “Aroad traffic signal recognition system based on template matching em-ploying tree classifier,” in ICCIMA ’07: Proceedings of the InternationalConference on Computational Intelligence and Multimedia Applications(ICCIMA 2007). Washington, DC, USA: IEEE Computer Society, 2007,pp. 360–365.
[6] A. Broggi, P. Cerri, P. Medici, P. Porta, and G. Ghisio, “Real time roadsigns recognition,” Intelligent Vehicles Symposium, 2007 IEEE, pp. 981–986, June 2007.
[7] A. Ruta, Y. Li, and X. Liu, “Detection, tracking and recognition of trafficsigns from video input,” Oct. 2008, pp. 55 –60.
[8] W.-J. Kuo and C.-C. Lin, “Two-stage road sign detection and recogni-tion,” Multimedia and Expo, 2007 IEEE International Conference on,pp. 1427–1430, July 2007.
[9] G. Piccioli, E. D. Micheli, P. Parodi, and M. Campani, “Robustmethod for road sign detection and recognition,” Image and VisionComputing, vol. 14, no. 3, pp. 209 – 223, 1996. [Online]. Avail-able: http://www.sciencedirect.com/science/article/B6V09-3VVCMCX-4/2/0f2793e7828195ecb68735a80a9ef904
[10] P. Paclık, J. Novovicova, P. Pudil, and P. Somol, “Road sign classificationusing laplace kernel classifier,” Pattern Recogn. Lett., vol. 21, no. 13-14,pp. 1165–1173, 2000.
[11] C.-Y. Fang, S.-W. Chen, and C.-S. Fuh, “Road-sign detection andtracking,” vol. 52, no. 5, pp. 1329–1341, Sep. 2003.
[12] A. D. L. Escalera, J. M. A. Armingol, and M. Mata, “Traffic signrecognition and analysis for intelligent vehicles,” Image and VisionComputing, vol. 21, pp. 247–258, 2003.
[13] X. Gao, L. Podladchikova, D. Shaposhnikov, K. Hong, and N. Shevtsova,“Recognition of traffic signs based on their colour and shape featuresextracted using human vision models,” Journal of Visual Communicationand Image Representation, vol. 17, no. 4, pp. 675–685, 2006.
[14] A. Ruta, Y. Li, and X. Liu, “Real-time traffic sign recognition from videoby class-specific discriminative features,” vol. 43, no. 1, pp. 416–430,2010.
[15] R. Timofte, K. Zimmermann, and L. Van Gool, “Multi-view traffic signdetection, recognition, and 3d localisation,” Snowbird, Utah, 2009, pp.69–76.
[16] Y.-Y. Nguwi and A. Z. Kouzani, “Detection and classification of roadsigns in natural environments,” Neural Comput. Appl., vol. 17, no. 3,pp. 265–289, 2008.
[17] G. Loy, “Fast shape-based road sign detection for a driver assistancesystem,” in In IEEE/RSJ International Conference on Intelligent Robotsand Systems (IROS, 2004, pp. 70–75.
[18] C. Paulo and P. Correia, “Automatic detection and classification of trafficsigns,” in Image Analysis for Multimedia Interactive Services, 2007.WIAMIS ’07. Eighth International Workshop on, June 2007.
[19] D. Gavrila, “Traffic sign recognition revisited,” in DAGM-Symposium,1999, pp. 86–93.
[20] P. Viola and M. Jones, “Robust real-time object detection,” in Interna-tional Journal of Computer Vision, 2001.
[21] K. Brkic, A. Pinz, and S. Segvic, “Traffic sign detection as a componentof an automated traffic infrastructure inventory system,” Stainz, Austria,May 2009.
[22] K. Brkic, S. Segvic, Z. Kalafatic, I. Sikiric, and A. Pinz, “Generativemodeling of spatio-temporal traffic sign trajectories,” held in conjuctionwith CVPR2010, San Francisco, California, Jun. 2010.
[23] S.-Y. Chen and J.-W. Hsieh, “Boosted road sign detection and recog-nition,” Machine Learning and Cybernetics, 2008 International Confer-ence on, vol. 7, pp. 3823–3826, July 2008.
[24] X. Baro and J. Vitria, “Fast traffic sign detection on greyscale images,”Recent Advances in Artificial Intelligence Research and Development,pp. 69–76, October 2004.
[25] R. Lienhart and J. Maydt, “An extended set of Haar-like features forrapid object detection,” in IEEE ICIP 2002, 2002, pp. 900–903.
[26] S. Escalera and P. Radeva, “Fast greyscale road sign model matchingand recognition,” Recent Advances in Artificial Intelligence Researchand Development, pp. 69–76, 2004.


![Automatic Traffic Signs and Panels Inspection System ......Despite the fact that many works have been developed in the field of traffic sign detection and recognition [6]–[13],](https://static.fdocuments.us/doc/165x107/61494b1d080bfa6260148465/automatic-trafic-signs-and-panels-inspection-system-despite-the-fact-that.jpg)