An Introduction to Heavy-Duty Diesel Engine Frictional...
13
2003-01-3225 An Introduction to Heavy-Duty Diesel Engine Frictional Losses And Lubricant Properties Affecting Fuel Economy – Part I Allen Comfort U.S Army Research, Engineering, and Development Command Copyright © 2003 SAE International ABSTRACT This paper examines sources and contributions of friction in heavy-duty diesel engines. Current and past work done on the characterization of diesel engine friction will be reviewed. It is also a goal to analyze each component system from a basic mechanics viewpoint highlighting some of the key friction producing phenomena. Different regimes of lubricated friction will be illustrated using a generic Stribeck diagram, with a focus on loading and relative velocities. Part II of this study will review lubricant effects on individual engine component friction as well as present data generated using commercial and military qualified lubricants in various bench tests, fired engine screening tests, and a modified version of the SAE J1321 Fuel Consumption Test using Army equipment. INTRODUCTION The commercial trucking industry has long been at the mercy of fluctuating fuel prices. It has been estimated that up to 30% of the operating costs of a typical commercial trucking fleet is from the purchase of fuel [1]. Fuel consumption is also a large logistical burden for the U.S. military. Fuel efficient combat and tactical vehicles result in carrying less fuel on the battle field, which requires less storage and transportation, less man power to drive and unload, less filtration, pumping and other processes, and a greater range of operation for vehicles with the same amount of fuel. Indeed, better fuel efficiency has a cascading effect felt throughout the logistics and acquisition cycles for both industry and the military. Increasing demand, as well as the frequent instability of foreign crude supply have led to a steady increase in the cost of diesel fuel over the past sevaral decades. Figure 1 shows the average diesel fuel prices in the United States since 1978 [2]. 0.4 0.6 0.8 1 1.2 1.4 1.6 1978 1982 1986 1990 1994 1996 2000 2001 Year Dollars per gallon Fig. 1. Average diesel fuel price from 1978 through 2001[2]. After the 1973 oil embargo, U.S. consumers demanded greater fuel efficiency from their vehicles. In response to this need, passenger car and lubricant manufacturers worked together to develop a gasoline engine test to measure the lubricant’s energy conserving property. The familiar American Petroleum Institute (API) “donut” symbol on engine oil bottles identifies these oils as “Energy Conserving” if they result in a prescribed increase in fuel economy compared to the reference oil. Unfortunately, this same effort has never taken place for heavy-duty diesel engine lubricants, leaving industry and government fleet operators with no alternative but to trust the claims of individual oil formulators and marketers or rely on the highly variable results of comparison truck tests. Although fuel economy improvements have been made over the last several decades using advances in fuel injection rate/timing, combustion chamber design, and fuel/air ratio control. The lack of a precise and repeatable industry standardized fired engine test method for determining the fuel efficiency of heavy-duty engine oils could be deferring a further reduction by as much 4% compared to a conventional SAE 15W-40 [3]. This is unfortunate, since, a reduction in fuel usage of as little as 1 or 2% could lead to significant cost savings and major reductions in emissions for both large commercial and government fleets. In fact, this potential
Transcript of An Introduction to Heavy-Duty Diesel Engine Frictional...
2003-01-3225
An Introduction to Heavy-Duty Diesel Engine Frictional Losses And Lubricant Properties Affecting Fuel Economy – Part I
Allen Comfort U.S Army Research, Engineering, and Development Command
Copyright © 2003 SAE International
ABSTRACT
This paper examines sources and contributions of friction in heavy-duty diesel engines. Current and past work done on the characterization of diesel engine friction will be reviewed. It is also a goal to analyze each component system from a basic mechanics viewpoint highlighting some of the key friction producing phenomena. Different regimes of lubricated friction will be illustrated using a generic Stribeck diagram, with a focus on loading and relative velocities. Part II of this study will review lubricant effects on individual engine component friction as well as present data generated using commercial and military qualified lubricants in various bench tests, fired engine screening tests, and a modified version of the SAE J1321 Fuel Consumption Test using Army equipment.
INTRODUCTION
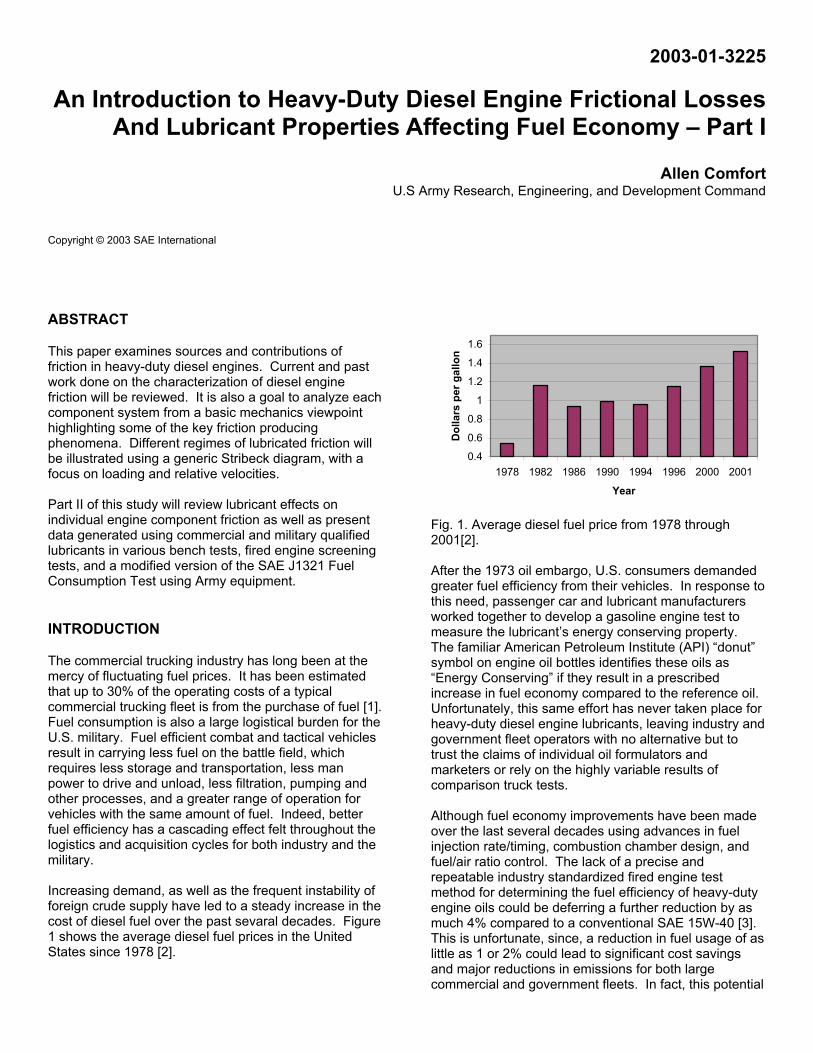
The commercial trucking industry has long been at the mercy of fluctuating fuel prices. It has been estimated that up to 30% of the operating costs of a typical commercial trucking fleet is from the purchase of fuel [1]. Fuel consumption is also a large logistical burden for the U.S. military. Fuel efficient combat and tactical vehicles result in carrying less fuel on the battle field, which requires less storage and transportation, less man power to drive and unload, less filtration, pumping and other processes, and a greater range of operation for vehicles with the same amount of fuel. Indeed, better fuel efficiency has a cascading effect felt throughout the logistics and acquisition cycles for both industry and the military. Increasing demand, as well as the frequent instability of foreign crude supply have led to a steady increase in the cost of diesel fuel over the past sevaral decades. Figure 1 shows the average diesel fuel prices in the United States since 1978 [2].
0.4
0.6
0.8
1
1.2
1.4
1.6
1978 1982 1986 1990 1994 1996 2000 2001
Year
Dol
lars
per
gal
lon
Fig. 1. Average diesel fuel price from 1978 through 2001[2]. After the 1973 oil embargo, U.S. consumers demanded greater fuel efficiency from their vehicles. In response to this need, passenger car and lubricant manufacturers worked together to develop a gasoline engine test to measure the lubricant’s energy conserving property. The familiar American Petroleum Institute (API) “donut” symbol on engine oil bottles identifies these oils as “Energy Conserving” if they result in a prescribed increase in fuel economy compared to the reference oil. Unfortunately, this same effort has never taken place for heavy-duty diesel engine lubricants, leaving industry and government fleet operators with no alternative but to trust the claims of individual oil formulators and marketers or rely on the highly variable results of comparison truck tests. Although fuel economy improvements have been made over the last several decades using advances in fuel injection rate/timing, combustion chamber design, and fuel/air ratio control. The lack of a precise and repeatable industry standardized fired engine test method for determining the fuel efficiency of heavy-duty engine oils could be deferring a further reduction by as much 4% compared to a conventional SAE 15W-40 [3]. This is unfortunate, since, a reduction in fuel usage of as little as 1 or 2% could lead to significant cost savings and major reductions in emissions for both large commercial and government fleets. In fact, this potential
was identified as early as 1977 when the Society of Mechanical Engineers Research Committee on Lubrication identified the need for increased R&D of low viscosity engine and axle lubricants as an area where the application of new tribological knowledge was expected to yield major benefits [4]. Furthermore, on-going improvements in diesel engine performance and emissions combined with the diesel’s inherent efficiency over spark ignition engines is expected to increase the role of the diesel engine in future U.S. passenger car and light truck markets, further increasing the need to discriminate between energy conserving diesel engine oils. In this paper some of the current and past work done on the characterization of diesel engine friction will be reviewed. The goal is to analyze each component system using basic mechanics and highlight some of the overarching principles. Finally, it’s the purpose of this paper to describe heavy duty diesel engine friction generally and not go into exhaustive detail. Therefore, the focus will be on the variables of load and the relative velocities between moving parts to define the lubrication regime experienced by each component. COMPONENT FRICTION AND LUBRICANT REGIME
In order to maximize the fuel economy of an engine lubricant one must first understand the source of the friction. Engine friction, and friction in general, can roughly be compartmentalized into two groups: coulomb friction (dry friction) which occurs when asperities come into contact between two surfaces moving relative to each other and fluid friction which develops between adjacent layers of fluid moving at different velocities. The actual degree of friction in engine components can seldom be put into either of these categories, and instead lies somewhere between these two extremes. That is to say, there is a continuum between dry friction and fluid friction and the placement on this continuum is dependent on such factors as: component geometry, surface roughness, relative velocities of the moving surfaces, normal loads, and various rheological properties of the lubricant. This continuum approach is exemplified by what’s commonly known as a Stribeck curve. Figure 2 shows a generic example of such a curve.
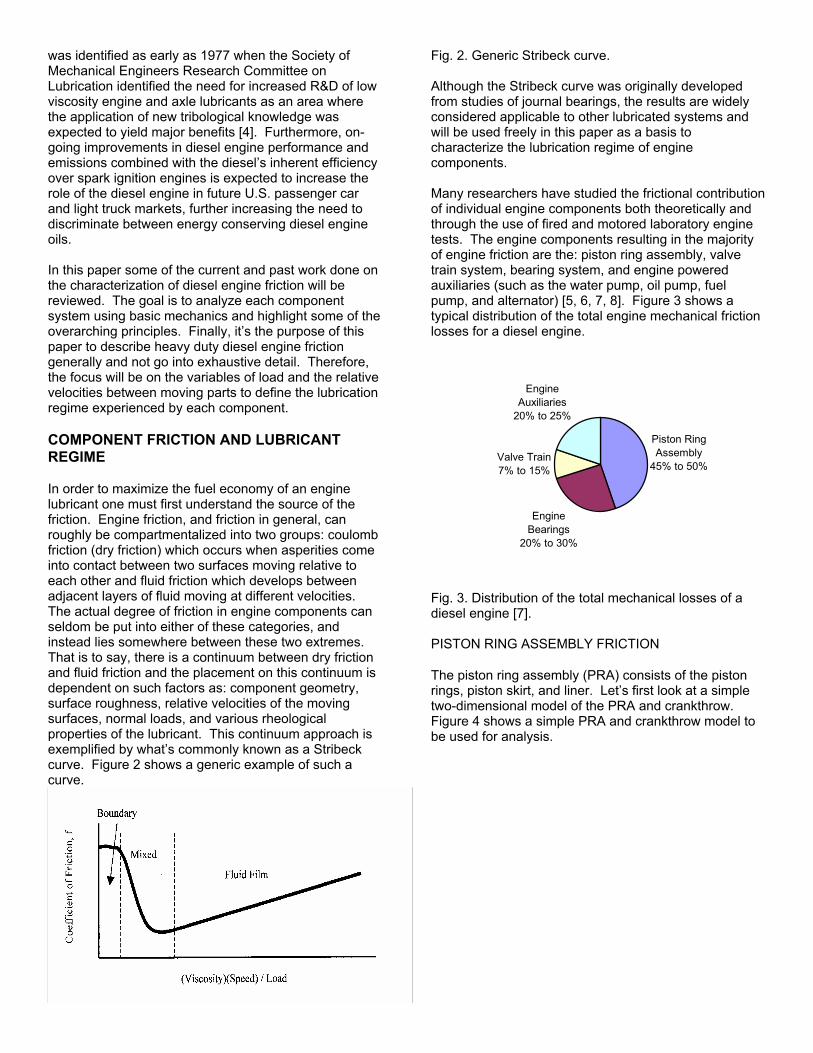
Fig. 2. Generic Stribeck curve. Although the Stribeck curve was originally developed from studies of journal bearings, the results are widely considered applicable to other lubricated systems and will be used freely in this paper as a basis to characterize the lubrication regime of engine components. Many researchers have studied the frictional contribution of individual engine components both theoretically and through the use of fired and motored laboratory engine tests. The engine components resulting in the majority of engine friction are the: piston ring assembly, valve train system, bearing system, and engine powered auxiliaries (such as the water pump, oil pump, fuel pump, and alternator) [5, 6, 7, 8]. Figure 3 shows a typical distribution of the total engine mechanical friction losses for a diesel engine.
Engine Auxiliaries
20% to 25%
Valve Train7% to 15%
Engine Bearings
20% to 30%
Piston Ring Assembly
45% to 50%
Fig. 3. Distribution of the total mechanical losses of a diesel engine [7]. PISTON RING ASSEMBLY FRICTION
The piston ring assembly (PRA) consists of the piston rings, piston skirt, and liner. Let’s first look at a simple two-dimensional model of the PRA and crankthrow. Figure 4 shows a simple PRA and crankthrow model to be used for analysis.

Fig. 4. 2-D model of piston and crankthrow assembly.
The velocity and acceleration of the piston relative to the liner can be easily modeled by examining the system in figure 4 as undergoing general plane motion. This is an important analysis since the velocity of the piston relative to the liner is the driving force for momentum transfer within the lubricating fluid film and hence is related to shear stress and shear rate within this film. Furthermore, examination of the Stribeck curve reveals that relative velocity is a major factor in determining what lubrication regime the PRA will fall within during any particular moment in its cycle. Applying the law of sines in figure 4 yields
lrφθ sinsin
= (1)
and relates the two angles θ and φ to the length of the connecting rod, l, and the crank radius, r. The length from the main journal centerline to the piston pin centerline can then be described as
φθ coscos rly += (2)
Differentiating Eq. 2 with respect to time provides the velocity of the piston with respect to the liner,
φφθθ sinsin ′−′−=′= rlyv (3)
Equations 1 – 3 allows one to calculate the relative velocity with respect to the liner for any engine operating at a set speed. For example, the US Army’s Family of Medium Tactical Vehicles are powered by Caterpillar 3126 diesel engines having a crank throw radius of 63.5 mm and a connecting rod length of 199.9 mm. Figure 5 shows the relative velocity of the piston with respect to the liner versus the crank angle.
-15.00
-10.00
-5.00
0.00
5.00
10.00
15.00
0 90 180 270 360
Crank Angle (degrees)
Velo
city
(m/s
)
Fig. 5. Relative velocity of the piston with respect to the liner vs. crank angle at 1800 rpm.
A few conclusions about the type of friction occurring in the PRA may be drawn from the velocity profile of figure 5. First, the velocity of the piston is zero at both top dead center (TDC) and bottom dead center (BDC). By comparison with the Stribeck curve of figure 2 the lubricant regime would be boundary and some asperity contact would presumably occur. Also the coefficient of friction would increase during this stage resulting in increased friction forces. Second, the piston velocity obtains its maximum somewhere around 75 degrees and again around 285 degrees (relatively close to mid stroke). It is fairly safe to presume that at these points the lubrication regime is hydrodynamic and has reached a local maximum in friction coefficient. To the left and right of these points we would expect to have a transition to mixed lubrication from hydrodynamic lubrication. Here the friction coefficient drops off quickly from its maximum and obtains its lowest value, as a very thin fluid film is being sheared but asperities are still separated. This general behavior has been reported in the literature for both fired and motored engine friction studies. Figure 6 shows data from a single cylinder diesel engine operating at 1250 rpm using the “floating bore” technique to measure friction.
Fig. 6. PRA friction force vs. crank angle at 1250 rpm. Single cylinder engine using “floating bore” [9].
TDCBDC
It’s clear during the intake and exhaust stroke in figure 6 that the friction is quite high close to TDC and BDC but drops off quickly as the piston gains speed, only to increase as sliding velocity, and hence, shear rate increases. This is followed by the expected decrease in frictional force as the piston again begins to slow. This behavior is masked in the compression and expansion stroke due to increases in in-cylinder pressure.
Figure 6 helps point out another source of increased friction, that due to increases in in-cylinder pressures. It’s generally agreed by researchers that increases in in-cylinder pressure during the compression and expansion stroke lead directly to increased normal force between the piston ring and the liner [10, 11, 12, 13] causing a shift to the left on the Stribeck curve of figure 2. This increased load combined with reduced piston speed near TDC firing causes metal-to-metal asperity contact and high friction. Figure 7demonstrates this increase around TDC firing for a fired engine test as compared to a motored engine test (i.e. engine driven by dynamometer).
Fig. 7. Effect of in-cylinder pressure on friction PRA friction at 500 rpm. 5.0 L engine [12].
Although other factors such as the number of piston rings; piston ring profiles, width, and tension; and piston skirt length and profile are all capable of influencing PRA friction [5,8,11], it’s clear that these factors serve only to superimpose themselves on the effects inherent to the nature of PRA reciprocating motion (relative velocity) and in-cylinder pressure fluctuations due to combustion (load) already discussed. Therefore, for the purposes of this paper, the effect of these other factors will not be reviewed, but instead the interested reader can refer to the cited references.
VALVE TRAIN FRICTION
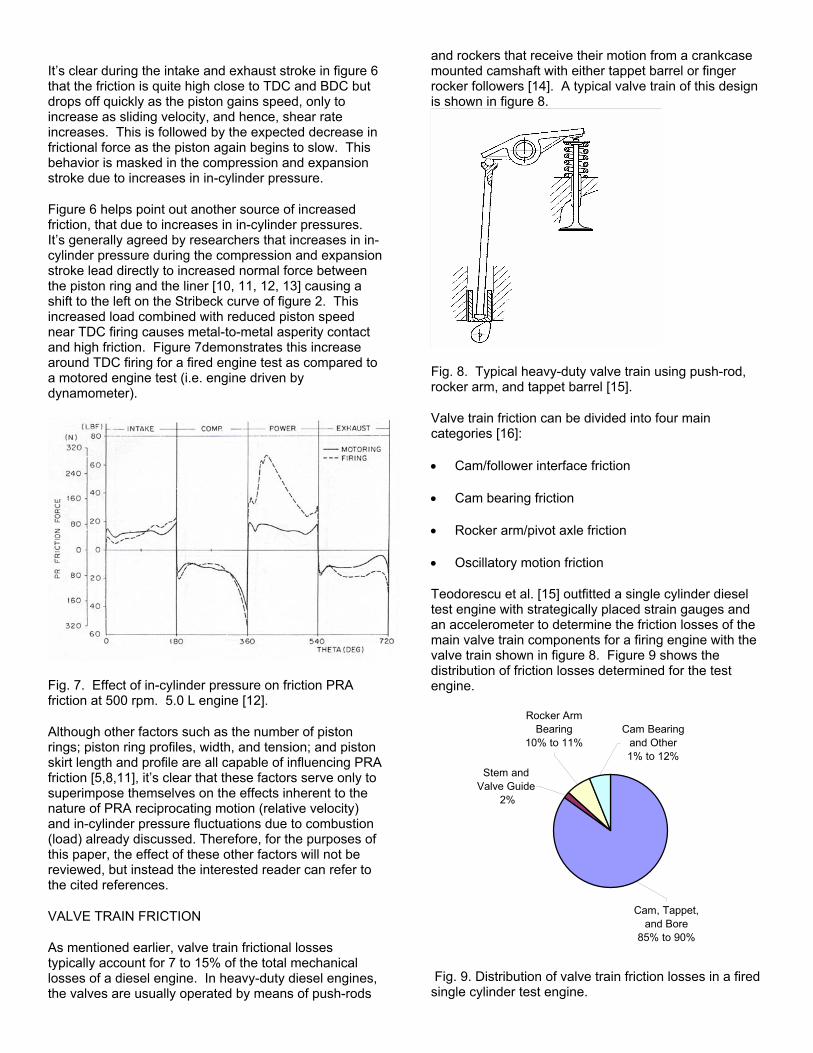
As mentioned earlier, valve train frictional losses typically account for 7 to 15% of the total mechanical losses of a diesel engine. In heavy-duty diesel engines, the valves are usually operated by means of push-rods
and rockers that receive their motion from a crankcase mounted camshaft with either tappet barrel or finger rocker followers [14]. A typical valve train of this design is shown in figure 8.
Fig. 8. Typical heavy-duty valve train using push-rod, rocker arm, and tappet barrel [15].
Valve train friction can be divided into four main categories [16]:
• Cam/follower interface friction
• Cam bearing friction
• Rocker arm/pivot axle friction
• Oscillatory motion friction
Teodorescu et al. [15] outfitted a single cylinder diesel test engine with strategically placed strain gauges and an accelerometer to determine the friction losses of the main valve train components for a firing engine with the valve train shown in figure 8. Figure 9 shows the distribution of friction losses determined for the test engine.
Cam Bearing and Other1% to 12%
Rocker Arm Bearing
10% to 11%
Stem and Valve Guide
2%
Cam, Tappet, and Bore
85% to 90%
Fig. 9. Distribution of valve train friction losses in a fired single cylinder test engine.
It’s fair to assume that this distribution will vary depending on the valve train configuration used.
Cam/Follower Interface Friction
In most, if not all valve train designs, the cam/follower interface is considered to be the most dominant source of valve train friction [6, 14, 15]. Although cam profiles vary in design they’re all responsible for converting rotary motion into the oscillating motion of the opening and closing of exhaust and inlet valves. Of more importance from a friction standpoint is the type of following mechanism. One of two types is used depending on the design: flat followers (which aren’t necessarily flat) or roller followers.
Cam/Flat Followers Interface
Flat followers are distinguished from roller followers by the characteristic that the motion at the interface is one of sliding contact instead of rolling contact. There are two velocities that are important kinematic features to the lubrication regime for any cam-follower system [17, 18,19, 20]. They are
1. The velocity of the point of contact along the cam surface, Vc.
2. The velocity of the point of contact along the follower surface, Vf.
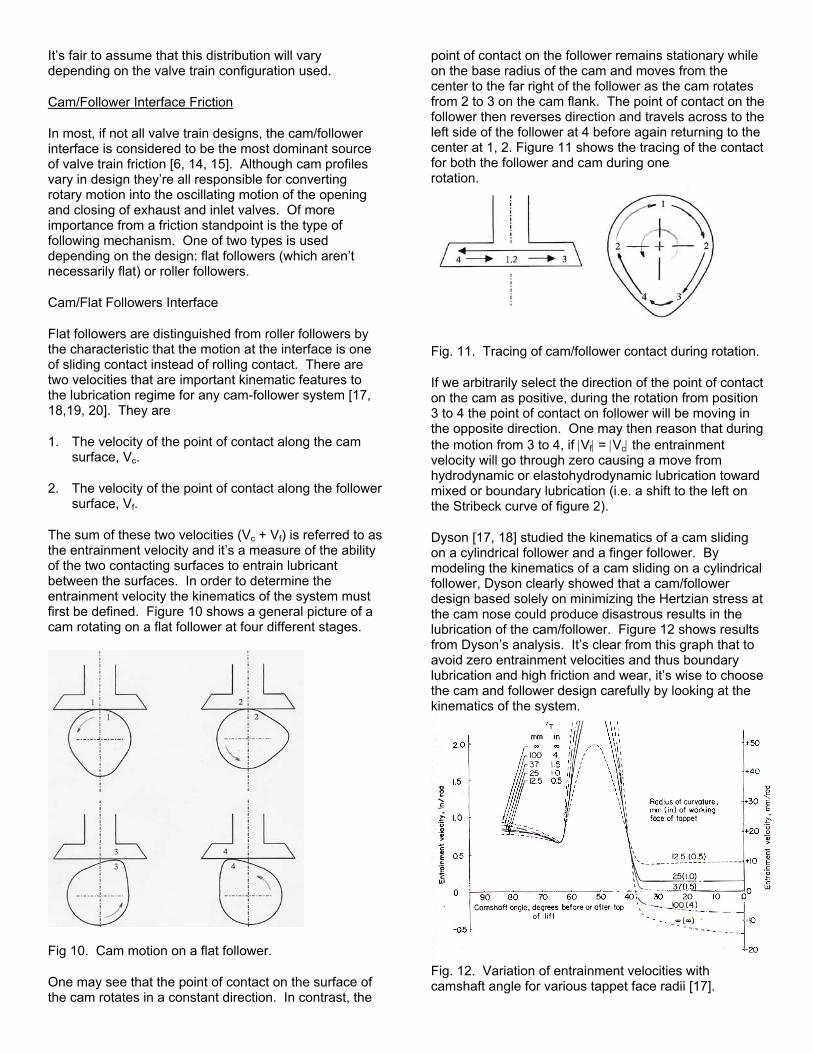
The sum of these two velocities (Vc + Vf) is referred to as the entrainment velocity and it’s a measure of the ability of the two contacting surfaces to entrain lubricant between the surfaces. In order to determine the entrainment velocity the kinematics of the system must first be defined. Figure 10 shows a general picture of a cam rotating on a flat follower at four different stages.
Fig 10. Cam motion on a flat follower.
One may see that the point of contact on the surface of the cam rotates in a constant direction. In contrast, the
point of contact on the follower remains stationary while on the base radius of the cam and moves from the center to the far right of the follower as the cam rotates from 2 to 3 on the cam flank. The point of contact on the follower then reverses direction and travels across to the left side of the follower at 4 before again returning to the center at 1, 2. Figure 11 shows the tracing of the contact for both the follower and cam during one rotation.
Fig. 11. Tracing of cam/follower contact during rotation.
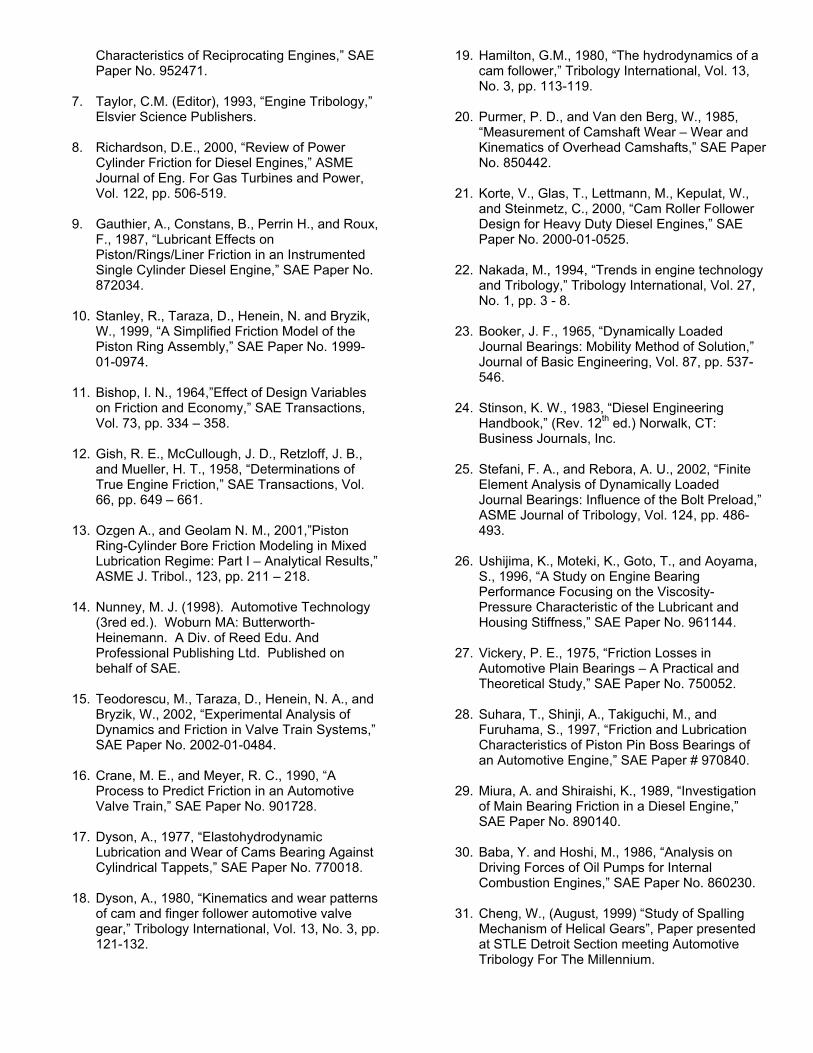
If we arbitrarily select the direction of the point of contact on the cam as positive, during the rotation from position 3 to 4 the point of contact on follower will be moving in the opposite direction. One may then reason that during the motion from 3 to 4, if |Vf| = |Vc| the entrainment velocity will go through zero causing a move from hydrodynamic or elastohydrodynamic lubrication toward mixed or boundary lubrication (i.e. a shift to the left on the Stribeck curve of figure 2).
Dyson [17, 18] studied the kinematics of a cam sliding on a cylindrical follower and a finger follower. By modeling the kinematics of a cam sliding on a cylindrical follower, Dyson clearly showed that a cam/follower design based solely on minimizing the Hertzian stress at the cam nose could produce disastrous results in the lubrication of the cam/follower. Figure 12 shows results from Dyson’s analysis. It’s clear from this graph that to avoid zero entrainment velocities and thus boundary lubrication and high friction and wear, it’s wise to choose the cam and follower design carefully by looking at the kinematics of the system.
Fig. 12. Variation of entrainment velocities with camshaft angle for various tappet face radii [17].

In a follow-up investigation Dyson extended his analysis to a cam rotating on a finger follower [18]. He modeled the kinematics of finger follower designs from three different engines. Figure 13 shows the results of his analysis for one engine.
Fig. 13. Surface velocities and entrainment velocities as a function of camshaft angle. [18]
Dyson compared these graphs with the wear patterns on the cams taken from the engine and found high correlation between wear at both the zeros of the entrainment velocity and also at the points of contact on the followers which remain almost stationary during the closing and opening of the cam ramps (i.e. between ±72° and ±62° in figure 13).
Using the Stribeck diagram to characterize the lubrication regime, it’s important to examine the load between the cam and its follower. Making use of a free body diagram for a generic direct acting cam/follower system and examining only those forces acting vertically, the general equation of motion for the cam/follower assembly may be written as:
W = m(a - g) + k(li + l) ± FT/B (5)
where W is the force of the cam on the follower, m is the mass of follower system, k is the spring constant, li is the preload lift, l is the lift, FT/B is the friction force between the tappet and bore, g is the acceleration of gravity, and a is the acceleration of the follower. The positive sign on the friction force corresponds to the closing of the valve while the negative sign corresponds to the opening of the valve.
Fig. 14. Free body/kinetic diagram for the total load on a cam (valve opening).
By adopting the tappet lift and acceleration curves used by Dyson [17,18] and a follower mass, spring constant, and preload lift (in this case adopted from Hamilton [19]) and neglecting the friction between the tappet and bore, one can roughly model the total cam load over the duration of its rotation. Figure 15 shows the variation of the load for a cam rotating at a constant 600 rpm.
-30-101030507090
110130
-90 -70 -50 -30 -10 10 30 50 70 90
Degrees after top of lift
Load on cam (W) Follower Acceleration (mm/rad^2)
Fig. 15. Cam load and acceleration as a function of camshaft angle. m = 0.64 kg, k = 12.8 N/mm, and li = 1 mm.
From figure 15 you can see the cam load clearly has three local maximums. The maximum at the top of lift is expected because this is where maximum lift occurs and therefore the greatest spring compression and spring force. The other two maximums are due to inertia effects from the acceleration of the follower during the opening and deceleration during it’s closing. It’s also interesting to note the relative magnitudes of the load caused by the inertia and those caused by the spring. By simply reducing the mass of the follower one can drastically alter the loads. Figure 16 shows the results of halving the mass of the follower.

-30
-10
10
30
50
70
90
-90 -70 -50 -30 -10 10 30 50 70 90
Degrees after top of lift
Load on cam (W) Follower Acceleration (mm/rad^2)
Fig. 16. Cam load and acceleration as a function of camshaft angle. m = 0.32 kg, k = 12.8 N/mm, and li = 1 mm.
Reducing the mass has the effect of reducing the forces experienced from the acceleration and deceleration of the follower, but it also causes increases in the load at maximum lift. This may seem counterintuitive at first, however, the greater inertia of the more massive system actually acts against the increasing force of the compressed spring, effectively reducing its magnitude at maximum lift. This variation of load due to the inertia effects of the reciprocating follower may explain some of the unexplained wear patterns found in Dyson’s analysis [18]. In particular, Dyson observed an unexplained wear trough on the follower of one engine at +48 degrees. This is exactly were one may expect a maximum in the action/reaction force between the cam and follower due to the sudden deceleration of the follower. Furthermore, the model Dyson used for calculation of the EHL minimum oil film thickness was based on a model of line contact between two rotating cylinders that did not take into account variations in load during the contact.
Cam/Roller Follower Interface
Although the sliding contact follower is well established in engine design and has the added benefits of ease of manufacture and, in general, low complexity and mass. The requirements for heavy-duty diesel engines have led to the use of roller followers, usually designed as roller tappets or roller levers [21]. It’s not surprising that the main benefit of rolling versus sliding contact is the lower friction under the same loading conditions. Figure 17 shows a comparison of cam drive torque as a function of engine speed for three different valve train designs.
Fig. 17. Cam drive torque vs. engine speed for different valve train designs [22].
Although the numerical magnitude of the cam drive torque is not shown, it’s clear that the roller follower design drastically reduces the required drive torque. Theoretically, if a perfectly rigid cylinder rolls along another perfectly rigid and smooth body and encounters no friction due to air resistance, the motion will continue indefinitely. In actuality, no surface is completely rigid or smooth. A force, or rolling resistance, due to the elastic deformation of the contacting surfaces must be overcome (figure 18). Part of this force is returned to the cylinder upon restoration, but not all.
Fig. 18. Rolling contact resistance.
The less deformation, the less resistance to rolling. Therefore, the lowest frictional force is found from materials with high modulus of elasticity.
Another source of frictional loss is due to regions of slip. A perfectly rigid body rolling on a perfectly rigid surface has a single point of zero velocity occurring at the point of contact. Any position on the rolling body of less or greater than this distance will be experiencing relative motion. In a deformed rolling surface this causes

regions of forward and backward slip. In the case of the cam rotating against a roller follower, it is the ratio of rolling to sliding that determines whether the lubricant action is hydrodynamic or elastohydrodynamic.
A third type of frictional loss in the roller follower system is due to the roller-pin interface friction [21]. Although most designs are typically sleeve bearings some designs use needle bearings. In view of the previous discussion concerning rolling versus sliding contact it is not surprising that the needle bearing requires less cam drive torque, especially at low engine speeds. Furthermore, the lower frictional resistance of the rolling contact presumably leads to less slip between the cam and the follower.
BEARING FRICTION
Bearing friction comes from many different sources including the crankshaft main bearings, connecting rod big-end bearings, connecting rod small-end bearings, camshaft bearings, and rocker arm bearings. As previously discussed engine bearings typically represent 20 to 30% of the total engine frictional losses. Of the many different bearings in a diesel engine none are more critical or highly stressed than the connecting rod big/small-end bearings and the crankshaft main bearings.
Big-End Bearing Friction
The connecting rod big-end bearings are subject to varying loads, speeds, and angular velocities throughout the cycle of engine operation. In these bearings the journal rotates steadily while the sleeve oscillates back and forth [23]. The magnitude of these bearing loads at any point is the resultant of three main forces [24]:
1. Combustion gas force
2. Inertia force of the reciprocating parts
3. Centrifugal force on the crankpin created by the big-end of the connecting rod
In order to better understand the effect of these forces on the crankpin a free body diagram of the forces acting on the piston pin is shown in figure 19.
Fig. 19. Free body/kinetic diagram of forces acting on piston pin.
The general equation of motion can be solved for the force directed along the connecting rod and thrust force,
Fcr = (Fgp – mtrap)/cosθ,
Ft = Fcr sinθ (5)
Here, Fgp is the force due to the combustion gas pressure, Ft is the side thrust force, mtr is the total reciprocating mass, and ap is the acceleration of the piston. Fcr and the centrifugal force due to rotation of the big-end of the connecting rod can be combined together to form a resultant force vector that has the magnitude and direction of the force experienced by the crankpin from the connecting rod (see figure 20).
Fig. 20. Resultant force vector acting on the crankpin.
The magnitude is
22cnfcrB FFF += (7)
where Fcnf is the centrifugal force on the crankpin created by the big-end of the connecting rod and is equal to
Fcnf = mcrrω2 (8)
and mcr is the mass of the connecting rod participating in the rotating motion, r is the crank radius, and ω is the angular velocity of the rotating crank. It’s interesting to note that the Fcnf is proportional to the square of the crankshaft angular velocity. This explains a major

difference between the loading of a diesel engine connecting rod big-end, where the loading is primarily in the upper half of the bearing, and the gasoline engine connecting rod big-end, where the brunt of the loading is in the lower half of the connecting rod bearing [14]. Since diesel engines typically run at much lower speeds than gasoline engines, the primary load on the connecting rod bearings is due to the combustion gas force, Fgp.
Plotting -FB as a function of crank angle creates a polar diagram of the force acting against the bearing. A typical polar diagram for a 4-cycle diesel engine is shown in figure 21.
Fig. 21. Polar diagram for a 4-cycle diesel engine big-end connecting rod [24].
As one may expect, the largest loads occur just after top dead center on the power stroke due to combustion gas force, Fgp and again around top dead center of the exhaust stroke (360°) due to the centrifugal force, Fcnf. The absolute magnitude of these forces is highly dependent on the engine speed.
Based upon the polar diagram of figure 21, or one qualitatively similar, one may expect lubricating film pressures to roughly match this loading profile. Indeed, Stefani and Rebora [25] modeled peak film pressures for a marine diesel engine operating at 600 rpm (figure 22). Their results show an interesting amplification of peak film pressures when the bearing is modeled as a rigid structure instead of a more realistic elastic structure. Of more importance to this analysis is the correlation between theoretical loading based on force analysis and the peak film pressure found in the bearings.
Fig. 22. Variation of peak film pressure for rigid and elastic bearings vs. crank angle [25].
A careful examination of the general behavior in figure 21 and the elastic bearing results of figure 22 reveal fairly good correlation if one makes adjustments to the polar diagram for an engine operating at slow speeds (i.e. small centrifugal contribution). The importance of peak film pressure and bearing deformation lies in its effect on the lubricating oils’ viscosity. The piezoviscosity effect is an increase in lubricant viscosity with pressure, sometimes modeled with use of the Barus’ equation (µ = µ0 eαp) [26]. Periods of high loading in the bearing results in significant increases in viscosity, this is at once both beneficial and detrimental. The increased viscosity increases load carrying capacity of the bearing while at the same time causing increased fluid friction.
Because both the connecting rod big-end bearing and the journal rotate at different velocities and at times, in different directions, this bearing’s kinematics is not as simple as that for a plain journal bearing. Letting ωj, ωb, and ωL be the absolute angular velocity of the journal, bearing, and load vector respectively, the “hydrodynamic” velocity or significant angular velocity is defined as [27]
ϖ = ωj + ωb - 2ωL (9)
Similar in nature to the relative velocity between the piston rings and liner and the entrainment velocity of the cam/follower interface, the hydrodynamic velocity is a measure of the tendency of the relative motions of the journal and bearing to pump lubricant into the wedge shaped space providing the lubricant pressure to separate the journal and bearing.
Without the appropriate cylinder pressure vs. crank angle and rotating inertial mass, the magnitude of the hydrodynamic velocity cannot be accurately calculated.

It is instructional to note, however, that although the journal rotates in a constant direction the connecting rod bearing oscillates sometimes in the same direction and sometimes in the opposite direction (see Figure 24).
Fig. 23. Oscillating motion of the connecting rod bearing vs. the crankshaft journal.
Therefore, like the case of zero entrainment velocity, the possibility of zero hydrodynamic velocity exists and hydrodynamic theory predicts zero load capacity. In fact, in the bearing that Booker [23] analyzed, he reported this occurring a dozen times over the course of a single four stroke engine cycle. Although one might expect lubricant film rupture and heavy asperity contact during these periods, this is generally not the case due to the “squeeze film” effect. When two lubricated surfaces with no relative motion are quickly forced toward one another the lubricant film is instantaneously compressed and its viscosity increases making it difficult to flow from between the surfaces. As long as the state of zero relative motion is only fleeting the surfaces will remain separated. The “squeeze film” effect is also encountered in the piston pin boss bearing and between piston ring and liner during TDC/BDC. Figure 24 shows some interesting results from the work of Suhara et al [28].
Fig. 24. Results of friction force, cylinder pressure vs. crank angle and corresponding Stribeck curve [28].
At point 3, 180 degrees after compression TDC, the connecting rod is reversing directions and there is an instantaneous zero relative velocity (U = 0) and a squeeze film is created. This is evident by the fact that even after this position the coefficient of friction continues to rise even as the relative velocity increases.
Main Journal Bearing Friction
Main bearing loads are combinations of the resultant loads acting on the crankpin and the inertial loads from the counterbalancing weights. The resultant force, FB, that acts on the crankpin will ultimately be transferred to the main bearing given that a couple is added to the crankshaft at the main bearing whose moment is equal to the moment of FB about the main bearing. In this way the resultant FB represents the main bearing load produced by one cylinder and is absorbed by the main bearings adjacent to the crank. This load does not include that of the unbalance or balanced crankshaft and the actual load experienced by any particular main bearing is dependent on engine design.
Miura and Shiraishi [29] outfitted an in-line direct injection six-cylinder diesel engine and measured main bearing friction and journal locus. They observed that the bearing locus, and thus the oil film thickness was determined by bearing load with the thinnest oil film occurring shortly after firing top dead center. Furthermore, they observed that the instantaneous peaks in friction coincided with that for the minimum oil film thickness. Finally, Miura and Shiraishi observed that while using SAE 30 oil the peak friction torque at an oil temp of 30°C was three times that of the oil at 90°C. If one assumed the peaks in friction were due to boundary lubrication than these results are contradictory. On the other hand, if one assumes that these peaks in friction are due to the piezoviscosity

effect then the resulting increase in frictional torque is consistent.
Unlike the rather complicated kinematics of the connecting rod big-end bearing, main bearing kinematics is simplified by a non-rotating bearing. In this way the “hydrodynamic” velocity reduces to
ϖ = ωj - 2ωL (10)
and again represents the tendency of the motion of the journal to pump lubricant between the bearing surfaces.
ENGINE AUXILIARY POWER LOSSES
Engine auxiliaries comprise about 20% of the total engine friction losses. Engine auxiliary power losses come from such built-in accessories as coolant pumps, oil pumps and fuel injection pumps as well as those that are external such as fans, generators, air conditioning, and power-steering pumps. Of these components the oil pump will be the focus since the fuel pump, whether in-line or distributor type, are cam driven against roller followers and the basic friction losses are closely related to those covered in the valve train friction section, while the power to drive the coolant pump is rather low in comparison with the power required to drive the other auxiliaries.
Oil Pump Friction Losses
Oil pumps are generally of two types: external gear or internal gear (trochoidal type). Examples of these are given in figure 25.
Fig. 25. Left, external gear pump, right, internal gear pump. [14]
Friction occurring in these types of oil pumps will fall within the following categories [30]
• Fluid friction losses
• Intermeshing friction losses
• Bearing friction losses
External Gear Pump
The external type oil pump delivers oil by trapping it between the outer wall of the pump housing and the
contra-rotating teeth of either spur gears or helical gears, carrying it around the periphery of the gears to the discharge. Fluid friction losses therefore stem from the fluid viscosity as the oil is sheared at the boundaries of the housing and the gear teeth, as well as from turbulent dissipation at the inlet and outlet. An examination of gear kinematics can give some insight into the frictional losses created by the meshing of the gear teeth. Figure 26 shows the rolling/sliding conditions on the gear tooth.
Fig. 26. Gear tooth rolling and sliding contact. [31]
Contact occurring at the pitch line of the two intermeshing gears results in rolling motion and under sufficient loads an elastohydrodynamic lubrication regime would exist. Contact occurring above or below the pitch circles will result in a sliding interaction between the intermeshing gear teeth and under the relatively low loads, and high angular velocities should result in full film lubrication.
A force analysis on the spur gear will show that the horizontal and vertical components of the resultant forces acting on the gear teeth will result in equal and opposite reactions at the bearing. Unlike spur gears, the intermeshing action of helical gears will also produce a thrust force due to the out of plane (normal) tooth force. If one assumes that the loads occurring at the gear teeth are proportional to the discharge pressure of the pump then one might expect increased discharge pressures to lead to a shift from right to left along the Stribeck curve resulting in an appropriate change in the lubricating regime and friction coefficient.
Internal Gear Pump
The internal gear pump delivers fluid by moving the oil between two converging sets of rotors/gears one of which, the inner rotor, is mounted eccentrically to the other. Although intermeshing of the rotors/gears is similar to the external gear pump the location of the oil inlet and discharge is in a plane parallel to the sides of the rotors, therefore high discharge pressures can create significant thrust forces and moments. Baba and Hoshi [30] studied the contributions of friction for these types of gear pumps and found that the fluid friction loss

followed by the thrust friction loss accounted for the highest majority of total driving force losses.
CONCLUSION
• Diminishing supply, social unrest in countries rich in fossil fuel, increasing demand, as well as higher fuel qualities needed for exhaust after treatment devices have led to higher fuel prices.
• Relatively small increases in fuel economy can lead to large savings for both commercial and government fleets. Unfortunately, little effort has been made towards developing a standardized HD Diesel engine test that can be used to measure an oils energy conserving properties.
• Knowledge of the different sources and regimes of engine friction is important for both the engine designer and the oil formulator, as well as the engine oil specification writer looking to maximize his equipment’s fuel economy.
• Experimental data from motored and fired engine tests indicate that the majority of engine friction is a result of the piston ring assembly, followed by the engine bearings/seals, various engine accessories, and finally, valve train friction.
• PRA friction may best be characterized by the simple reciprocating motion of the piston within the liner, leading to areas of mixed and boundary lubrication at TDC and BDC followed by stretches of hydrodynamic lubrication in between. The high in-cylinder pressure due to combustion promotes higher friction due to greater normal forces between the rings and liner.
• Major sources of valve train friction include the cam/follower interface, cam bearings/seals, rocker arm axles/pivots, and friction between tappets and their bores. The cam interface, tappet and bore friction account for the majority of this friction and can be significantly reduced by the use of roller followers in place of a sliding interface.
• Several different kinds of bearings exist throughout an engine. Loads on main bearings and big-end bearings vary in both magnitude and direction because they result from in-cylinder pressures, as well as, inertial loads from piston/connecting rod accelerations and decelerations. High loadings in these bearings can be supported along with low friction due to complete separation of moving parts by a thick lubricant film. This lubricating film is a function of the relative motions of the bearing with its journal and can be characterized by the
hydrodynamic velocity of the bearing system. In cases where the hydrodynamic velocity instantaneously reduces to zero, the squeeze film effect presumably limits asperity contact.
• Engine auxiliary losses come from several different engine components but were limited to those considered internal to the engine including the fuel pump, coolant pump, and oil pump. Fuel pumps, whether in-line or distributor type, operate by reciprocating motion driven by a cam/roller follower mechanism. Therefore, the basic frictional characteristics are similar to a combination of the PRA and valve train friction losses. Friction losses in oil pumps of the external or internal type generally fall within fluid friction losses, intermeshing friction losses, or bearing friction losses. Due to the low loads and high operating speeds of these pumps the majority of the friction losses are due to fluid friction.
ACKNOWLEDGMENTS
I’d like to acknowledge the members of the Fuels and Lubricants Technology Team for their support and encouragement, particularly Mr. Ralph Mowery for not letting me take it easy and Mr. Luis Villahermosa for allowing me additional work time to pursue this endeavor. I’d also like to acknowledge the support of Oakland University through the University Student Research Scholar program for providing me with the incentive to take on this challenging subject. Finally, I’d like to thank my wife for her continued patience and support.
REFERENCES
1. Taylor, R.I., 2000, “Heavy Duty Diesel Engine Fuel Economy: Lubricant Sensitivities,” SAE Paper No. 2000-01-2056.
2. Transportation Energy Data Book: Edition 22 -
2002, Chapter 5, Table 5.1. 3. Kennedy, S., Ragomo, M. A., Lohuis, J. R., and
Richman, W. H., 1995, “A Synthetic Diesel Engine Oil with Extended Laboratory Test and Field Performance,” SAE Paper No. 952553.
4. Pinkus, O. and Wilcock, D.F., 1977, “Strategy for
Energy Conservation Through Tribology,” Sponsored by ASME Research Committee on Lubrication.
5. Taraza, D., Henein, N., and Bryzik, W, 2000,
“Frictional Losses in Multi-Cylinder Diesel Engines,” SAE Paper No. 2000-01-0921.
6. Wakuri, Y., Soejima, M, Ejima, Y, Hamatake, T.,
and Kitahara, T., 1995, “Studies on Friction
Characteristics of Reciprocating Engines,” SAE Paper No. 952471.
7. Taylor, C.M. (Editor), 1993, “Engine Tribology,”
Elsvier Science Publishers.
8. Richardson, D.E., 2000, “Review of Power Cylinder Friction for Diesel Engines,” ASME Journal of Eng. For Gas Turbines and Power, Vol. 122, pp. 506-519.
9. Gauthier, A., Constans, B., Perrin H., and Roux,
F., 1987, “Lubricant Effects on Piston/Rings/Liner Friction in an Instrumented Single Cylinder Diesel Engine,” SAE Paper No. 872034.
10. Stanley, R., Taraza, D., Henein, N. and Bryzik,
W., 1999, “A Simplified Friction Model of the Piston Ring Assembly,” SAE Paper No. 1999-01-0974.
11. Bishop, I. N., 1964,”Effect of Design Variables
on Friction and Economy,” SAE Transactions, Vol. 73, pp. 334 – 358.
12. Gish, R. E., McCullough, J. D., Retzloff, J. B.,
and Mueller, H. T., 1958, “Determinations of True Engine Friction,” SAE Transactions, Vol. 66, pp. 649 – 661.
13. Ozgen A., and Geolam N. M., 2001,”Piston
Ring-Cylinder Bore Friction Modeling in Mixed Lubrication Regime: Part I – Analytical Results,” ASME J. Tribol., 123, pp. 211 – 218.
14. Nunney, M. J. (1998). Automotive Technology
(3red ed.). Woburn MA: Butterworth-Heinemann. A Div. of Reed Edu. And Professional Publishing Ltd. Published on behalf of SAE.
15. Teodorescu, M., Taraza, D., Henein, N. A., and
Bryzik, W., 2002, “Experimental Analysis of Dynamics and Friction in Valve Train Systems,” SAE Paper No. 2002-01-0484.
16. Crane, M. E., and Meyer, R. C., 1990, “A
Process to Predict Friction in an Automotive Valve Train,” SAE Paper No. 901728.
17. Dyson, A., 1977, “Elastohydrodynamic
Lubrication and Wear of Cams Bearing Against Cylindrical Tappets,” SAE Paper No. 770018.
18. Dyson, A., 1980, “Kinematics and wear patterns
of cam and finger follower automotive valve gear,” Tribology International, Vol. 13, No. 3, pp. 121-132.
19. Hamilton, G.M., 1980, “The hydrodynamics of a cam follower,” Tribology International, Vol. 13, No. 3, pp. 113-119.
20. Purmer, P. D., and Van den Berg, W., 1985,
“Measurement of Camshaft Wear – Wear and Kinematics of Overhead Camshafts,” SAE Paper No. 850442.
21. Korte, V., Glas, T., Lettmann, M., Kepulat, W.,
and Steinmetz, C., 2000, “Cam Roller Follower Design for Heavy Duty Diesel Engines,” SAE Paper No. 2000-01-0525.
22. Nakada, M., 1994, “Trends in engine technology
and Tribology,” Tribology International, Vol. 27, No. 1, pp. 3 - 8.
23. Booker, J. F., 1965, “Dynamically Loaded
Journal Bearings: Mobility Method of Solution,” Journal of Basic Engineering, Vol. 87, pp. 537-546.
24. Stinson, K. W., 1983, “Diesel Engineering
Handbook,” (Rev. 12th ed.) Norwalk, CT: Business Journals, Inc.
25. Stefani, F. A., and Rebora, A. U., 2002, “Finite
Element Analysis of Dynamically Loaded Journal Bearings: Influence of the Bolt Preload,” ASME Journal of Tribology, Vol. 124, pp. 486-493.
26. Ushijima, K., Moteki, K., Goto, T., and Aoyama,
S., 1996, “A Study on Engine Bearing Performance Focusing on the Viscosity-Pressure Characteristic of the Lubricant and Housing Stiffness,” SAE Paper No. 961144.
27. Vickery, P. E., 1975, “Friction Losses in
Automotive Plain Bearings – A Practical and Theoretical Study,” SAE Paper No. 750052.
28. Suhara, T., Shinji, A., Takiguchi, M., and
Furuhama, S., 1997, “Friction and Lubrication Characteristics of Piston Pin Boss Bearings of an Automotive Engine,” SAE Paper # 970840.
29. Miura, A. and Shiraishi, K., 1989, “Investigation
of Main Bearing Friction in a Diesel Engine,” SAE Paper No. 890140.
30. Baba, Y. and Hoshi, M., 1986, “Analysis on
Driving Forces of Oil Pumps for Internal Combustion Engines,” SAE Paper No. 860230.
31. Cheng, W., (August, 1999) “Study of Spalling
Mechanism of Helical Gears”, Paper presented at STLE Detroit Section meeting Automotive Tribology For The Millennium.