An Evaluation of Traditional and Emerging Remote Sensing
20
Prepared in cooperation with the U.S. Environmental Protection Agency An Evaluation of Traditional and Emerging Remote Sensing Technologies for the Detection of Fugitive Contamination at Selected Superfund Hazardous Waste Sites By E. Terrence Slonecker and Gary B. Fisher Open-File Report 2011–1050 U.S. Department of the Interior U.S. Geological Survey
Transcript of An Evaluation of Traditional and Emerging Remote Sensing

Prepared in cooperation with the U.S. Environmental Protection Agency
An Evaluation of Traditional and Emerging Remote Sensing Technologies for the Detection of Fugitive Contamination at Selected Superfund Hazardous Waste Sites
By E. Terrence Slonecker and Gary B. Fisher
Open-File Report 2011–1050
U.S. Department of the Interior U.S. Geological Survey

U.S. Department of the Interior KEN SALAZAR, Secretary
U.S. Geological Survey Marcia K. McNutt, Director
U.S. Geological Survey, Reston, Virginia: 2011
For more information on the USGS—the Federal source for science about the Earth, its natural and living resources, natural hazards, and the environment—visit http://www.usgs.gov or call 1–888–ASK–USGS
For an overview of USGS information products, including maps, imagery, and publications, visit http://www.usgs.gov/pubprod
To order this and other USGS information products, visit http://store.usgs.gov
Suggested citation: Slonecker, E.T., and Fisher, G.B., 2011, An evaluation of traditional and emerging remote sensing technologies for the detection of fugitive contamination at selected Superfund hazardous waste sites: U.S. Geological Survey Open-File Report 2011–1050, 16 p., available only at http://pubs.usgs.gov/of/2011/1050/.
Any use of trade, product, or firm names is for descriptive purposes only and does not imply endorsement by the U.S. Government.
Although this report is in the public domain, permission must be secured from the individual copyright owners to reproduce any copyrighted material contained within this report.

iii
Contents Executive Summary .............................................................................................................................................. 1 Introduction ........................................................................................................................................................... 2 Background ........................................................................................................................................................... 3 Remote Sensing of Hazardous Waste .............................................................................................................. 3
Remote Sensing Data Collection and Analysis ........................................................................................... 5 Site Visit and Field Sampling .......................................................................................................................... 7 Analysis and Quality Control ........................................................................................................................... 8 Criteria for Elevated Metal Concentrations ................................................................................................. 8
Results of Analysis ............................................................................................................................................... 9 Summary and Conclusions ............................................................................................................................... 12 References Cited ................................................................................................................................................ 14
Figures 1. Locations of the five Superfund test sites in Maryland and Virginia ............................................ 2 2. Hyperspectral image showing the volume of data collected by the Jet Propulsion
Laboratory’s Airboard Visible/Infrared Imaging Spectrometer over Moffet Field, Calif. ........... 4 3. When processed, the image cube can be analyzed with conventional spectroscopic
analysis methods .................................................................................................................................... 5 4. The combined hyperspectral techniques used in this report ......................................................... 6 5. The solar-reflected electromagnetic spectrum coverage of the ARCHER and Analytical
Spectral Devices Inc. instruments ...................................................................................................... 7 6. Soil sampling and field X-ray fluorescence screening .................................................................... 8 7. Hyperspectral anomaly detection results showing anomalies along the northern border of
the Middletown Road Dump ............................................................................................................... 10 8. Drums and debris along the northern border of the Middletown Road Dump .......................... 11 9. Leachate discharging into a local waterway along the north side of the Middletown Road
Dump ....................................................................................................................................................... 11 10. The correlation between hyperspectral band ratios and soil zinc concentrations at the
Rhinehart Tire Fire site ......................................................................................................................... 12
Table 1. Listing for the background, residential, and industrial risk-based concentrations of
selected metals ....................................................................................................................................... 9

iv
Conversion Factors Multiply By To obtain
Length
inch (in.) 25.4 millimeter (mm)
foot (ft) 0.3048 meter (m)
mile (mi) 1.609 kilometer (km)
Area
acre 4,047 square meter (m2)
acre 0.4047 hectare (ha)
Acronyms and Abbreviations ARCHER Airborne Real-Time Cueing Hyperspectral Enhanced Reconnaissance CERCLA Comprehensive Environmental Response Compensation and Liability Act (“Superfund”)EPA U.S. Environmental Protection AgencyMAWP Mid-Atlantic Wood PreserversNPL National Priorities Listppm parts per million RBC risk-based concentrationSSF synchronous scanning fluorescenceUSGS U.S. Geological SurveyXRF X-ray fluorescence
1
An Evaluation of Traditional and Emerging Remote Sensing Technologies for the Detection of Fugitive Contamination at Selected Superfund Hazardous Waste Sites
By E. Terrence Slonecker and Gary B. Fisher
Executive Summary This report summarizes the remote sensing and in-situ data collection and analysis
at five delisted Superfund sites in Maryland and Virginia. These sites were imaged with a hyperspectral remote sensing instrument and then visited for field sampling and verification. The purpose of this research was to determine if remote sensing technology, especially hyperspectral remote sensing, could be a useful tool in postclosure monitoring of hazardous waste sites. Two forms of hyperspectral remote sensing were employed in this study. First an aircraft-based visible-to-near infrared hyperspectral imaging sensor known as Airborne Real-Time Cueing Hyperspectral Enhanced Reconnaissance (ARCHER) was used to collect hyperspectral imagery over all five sites. Second, because the ARCHER sensor does not collect data in the full range of the solar-reflected electromagnetic spectrum, soil and sediment samples were also analyzed in the laboratory with an Analytical Spectral Devices Inc. full range spectrometer for the potential detection of contaminants.
Field work consisted of the collection of soil samples; a general inspection of site conditions; informal interviews with local officials, residents, and property owners; and the collection of sediment and water samples where conditions indicated possible contaminants. Laboratory analysis consisted of hyperspectral data collection and analysis, image processing techniques, and X-ray fluorescence analysis of soil and sediments for metals. Analysis of soil and water samples for hydrocarbons was conducted using synchronous scanning fluorescence (SSF) spectroscopy.
Basic remote sensing proved to be valuable in identifying and characterizing current site status and morphological changes in site size and activity. Hyperspectral imagery was effective in identifying drums, waste metal, containers, and leachate through an anomaly detection routine.
Hyperspectral analysis in the laboratory was used to successfully detect hydrocarbons in the soil. SSF spectroscopy confirmed the hydrocarbon detection. An experimental analysis of hyperspectral band ratios provided some correlation with heavy-metal concentrations in the soil.
Vegetation stress from chemical and (or) metal pollution could not be fully addressed because acquisition of the imagery occurred during the fall and winter.

2
Elevated concentration of zinc was spatially correlated with a photochemical reflectance index of vegetation at one site. Additional research is needed to fully identify the capabilities of imaging spectrometry relative to the post-closure monitoring of hazardous waste sites.
Introduction This report represents a remote sensing research effort conducted by the U.S.
Geological Survey (USGS) in cooperation with the U.S. Environmental Protection Agency (EPA) for the EPA Office of Inspector General. The objective of this investigation was to explore the efficacy of remote sensing as a technology for post-closure monitoring of hazardous waste sites as defined under the Comprehensive Environmental Response Compensation and Liability Act of 1980 (CERCLA; Public Law 96–510, 42 U.S.C. §9601 et seq.), also known as “Superfund.”
Five delisted Superfund sites in Maryland and Virginia (fig. 1) were imaged with a hyperspectral sensor and visited for collection of soil, water, and spectral samples and inspection of general site conditions.
Figure 1. Locations of the five Superfund test sites in Maryland and Virginia.
The five delisted Superfund sites are:
1. Mid-Atlantic Wood Preservers in Harmans, Md., Superfund identification no. MDD064882889
2. Middletown Road Dump in Annapolis, Md., Superfund identification no. MDD980705099
3. Dixie Caverns Landfill in Roanoke County, Va., Superfund identification no. VAD980552095
4. Matthews Electroplating in Roanoke County, Superfund identification no. VAD980712970
3
5. Rhinehart Tire Fire Dump in Frederick County, Va., Superfund identification no. VAD980831796
This report evaluates traditional and hyperspectral imagery and field spectroscopic measurement techniques in the characterization and analysis of fugitive (anthropogenic, uncontrolled) contamination at previously remediated hazardous waste disposal sites.
Background In 2007, the EPA Office of Inspector General issued Evaluation Report 2007–P–
00039, “Limited Investigation Led to Missed Contamination at Ringwood Superfund Site” (U.S. Environmental Protection Agency, 2007). This report documented problems of insufficient characterization and clean up at the Ringwood, N.J., National Priority List (NPL) Superfund site.
The site was contaminated with paint sludge and placed on the NPL in 1983. After a removal remedy and monitoring plan was implemented, the site was removed from the NPL in 1994, and two subsequent 5-year reviews, concluded in 2003, were conducted with findings of no significant pollution. However, local residents continued to discover waste products, including paint sludge, in the area. A reevaluation of the site and surrounding area was required by the EPA in 1998, and an additional 24,000 metric tons of paint sludge and soil contaminated with heavy metals was removed by the principal responsible parties after 2004. A further reevaluation of the site and surrounding area was required by the EPA in 2003, and in 2006, the Ringwood site became the first Superfund site ever to be placed back onto the NPL.
A key finding of the evaluation report was that the failure to detect the extent of contamination at the Ringwood site might have been avoided if the EPA had made greater use of available aerial photographs. Morphological characteristics of the landscape and landscape changes, as documented on historical aerial photographs, could have been used to detect the much larger extent of paint sludge and contamination than was thought to exist after the initial remedial investigation (Baker, 1984; U.S. Environmental Protection Agency, 2007).
Remote Sensing of Hazardous Waste Remote sensing is increasingly advancing the understanding of environmental
processes, conditions, and changes affecting human and ecological health. Advancements in sensor technology and processing algorithms have resulted in technical capabilities that can record and identify Earth surface materials based on the interaction of electromagnetic energy with the molecular structure of the material being sensed (Goetz and others, 1985; Green and others, 1998; Clark, 1999; Clark and others, 2009). Hyperspectral remote sensing records reflected and emitted electromagnetic energy in hundreds of very narrow wavelengths, resulting in data that can be analyzed with the same chemical spectroscopic techniques that have been used by chemists and astronomers for decades. In addition, new analytical techniques are constantly being developed and refined that permit the identification and analysis of key environmental processes, such as photosynthesis and nutrient cycling.
Spectral reflectance of vegetation and other landscape conditions has received renewed interest by the remote sensing community during the past decade because of the

4
development of hyperspectral imaging technology. Many of the early and definitive studies in spectral reflectance (Horler and others, 1980; Chang and Collins, 1983; Milton and others, 1989) used spectroscopic measurement instruments in a laboratory setting. These instruments measured reflected energy and produced spectra that could be analyzed using standard spectroscopic techniques. The collection of hyperspectral imagery in very narrow bandwidths across the solar-reflected part of the electromagnetic spectrum results in a digital file of hundreds of bands of coregistered imagery, sometimes called a “image cube” (fig. 2). After processing, this image cube represents an imagery version of the same energy and matter interactions measured in the laboratory and can be analyzed with a variety of standard and emerging statistical methods in spectroscopy and remote sensing. Reflected spectral patterns can be used to identify certain compounds, materials, and conditions (fig. 3) based on the interaction of photons with the molecular structure of the target material (Vane and Goetz, 1988; Green and others, 1998; Clark, 1999). Spectroscopic analysis techniques can now be employed outside of the laboratory through the use of hyperspectral remote sensing and imaging techniques and portable field spectroradiometers.
Figure 2. Hyperspectral image showing the volume of data collected by the Jet Propulsion Laboratory’s Airborne Visible/Infrared Imaging Spectrometer over Moffet Field, Calif., collected on August 20, 1992, from a height of 20,000 meters. Hyperspectral images are collections of hundreds of bands of coregistered imagery. Each band collects reflected energy in a slightly different band location and results in what is often called an “image cube.” Image from the Jet Propulsion Laboratory (http://aviris.jpl.nasa.gov/html/aviris.cube.html).

5
Figure 3. When processed, the image cube can be analyzed with conventional spectroscopic analysis methods, hence the term “imaging spectroscopy.” Image from the Jet Propulsion Laboratory (http://aviris.jpl.nasa.gov/html/aviris.concept.html).
Remote Sensing Data Collection and Analysis
Remote sensing data were collected in two forms. Initially, hyperspectral data from the Civil Air Patrol’s Airborne Realtime Cueing Hyperspectral Enhanced Reconnaissance (ARCHER) system were collected for each site between September 2009 and April 2010. Collection dates and times were not always optimal owing to a number of administrative, programmatic, and meteorological delays. However, the ARCHER system represents a low-cost alternative for high-resolution spatial and spectral remote sensing data.
Subsequently, soil samples were screened in the laboratory with a full-range field spectrometer for potential hydrocarbon and organic signatures that have been demonstrated to exist in the near-infrared region by Cloutis (1989), King and Clark (1989), Allen and Krekeler (2010), and Slonecker and others (2010). Figure 4 shows the different data collection strategies. Although the presence of hydrocarbons and other organic material is unlikely under a postclosure site scenario, the combination of ARCHER imagery and laboratory spectroscopic analysis represents a full analysis of potential signatures for hazardous waste that might exist in the solar-reflected portion of the electromagnetic spectrum from 400 to 2,500 nanometers (nm). Figure 5 shows the coverage of the two sensors in the electromagnetic spectrum.

6
A B
C
D E
Figure 4. The combined hyperspectral techniques used in this report. A, The Airborne Real-Time Cueing Hyperspectral Enhanced Reconnaissance (ARCHER) sensor

7
[photograph from Civil Air Patrol (2009)]; B, a Civil Air Patrol aircraft [photograph from Civil Air Patrol (2009)]; C, imagery and spectra from the ARCHER sensor [photograph from Civil Air Patrol (2009)]; D, full-range spectroscopy in the laboratory with Analytical Spectral Devices Inc. spectroradiometers (photograph by Gary B. Fisher, U.S. Geological Survey); and E, an example spectrograph prepared for this study from the ARCHER system.
Figure 5. The solar-reflected electromagnetic spectrum coverage of the Airborne Real-Time Cueing Hyperspectral Enhanced Reconnaissance (ARCHER) and Full Range Field Spectrometer instruments. IR, infrared; UV, ultraviolet.
ARCHER is a hyperspectral data collection, analysis, and visualization system developed for the Civil Air Patrol. It combines cutting-edge hyperspectral imaging technology with advanced real-time data processing capabilities and is a remote sensing technology that works by analyzing an object’s reflected light. The system uses a special camera that faces down through a quartz glass portal in the belly of the aircraft, which is typically flown at a standard mission altitude of 2,500 feet [800 meters (m)], at 100-knot (50-meters per second) ground speed and results in imagery with 1-m spatial resolution.
ARCHER combines a visible and near-infrared hyperspectral imaging system, a high-resolution visible panchromatic imaging sensor, and an integrated geopositioning and inertial navigation unit; the navigation unit is capable of acquiring and correcting data onboard and in real time, precisely georegistering collected imagery, and detecting and cueing acquired targets. ARCHER can automatically scan detailed imagery for the signature of an object being sought (such as a missing aircraft or unique metallic objects), for abnormalities in the surrounding area or for changes from previously recorded spectral signatures (Civil Air Patrol, 2009).
Site Visit and Field Sampling
Field visits for site inspection and sample collection and analysis were conducted in March and April 2010, except for the Mid-Atlantic Wood Preservers site, which was visited in August 2010. Arrangements for site visits were coordinated through the EPA regional office and with the appropriate land owners and administrators. During visits, sites were reviewed for general conditions and visual appearance. Visits were conducted to any specific site areas of interest based on the remote sensing analysis, and soil samples were screened and collected for metals via portable X-ray fluorescence (XRF) technology (fig. 6).

8
Figure 6. Soil sampling and field X-ray fluorescence (XRF) screening. Photograph by Gary B. Fisher, U.S. Geological Survey.
Analysis and Quality Control
Soil samples were reprocessed in the laboratory using XRF methods. After soil samples were air-dried, disaggregated, and sieved through a #10 (2-millimeter) mesh, they were reprocessed with an XRF for a minimum of 3 minutes. Approximately 10 percent of the soil samples were sent to an outside laboratory for confirmatory analysis by use of standard laboratory inductively coupled plasma (ICP) methods.
Soil samples were also analyzed with a full range field spectrometer for the presence of hydrocarbons in the soil. The spectrometer provides an analysis of spectral qualities in the near-infrared range, beyond the spectral range of the ARCHER instrument, and a complete analysis in the solar-reflected spectrum. A limited number of water and soil samples were collected for hydrocarbon analysis based on site-specific conditions. These samples were analyzed by the USGS Crustal Geophysics and Geochemistry Science Center Laboratory in Reston, Va., for the presence of hydrocarbons based on synchronous scanning fluorescence technology (Pharr and others, 1992). A complete description of the field work, sampling, and quality control procedures can be found in Slonecker and Fisher (2009).
Criteria for Elevated Metal Concentrations
Heavy metals were contaminants of concern at all five sites being evaluated. The ability of remote sensing technology to detect metal concentrations in soils was an important aspect of this study. All soils were analyzed in the laboratory with a full range
9
field spectrometer to evaluate the relation between reflectance and soil metal concentrations. XRF technology was used to screen soil metals in the field and later to evaluate the concentration of metals in the laboratory.
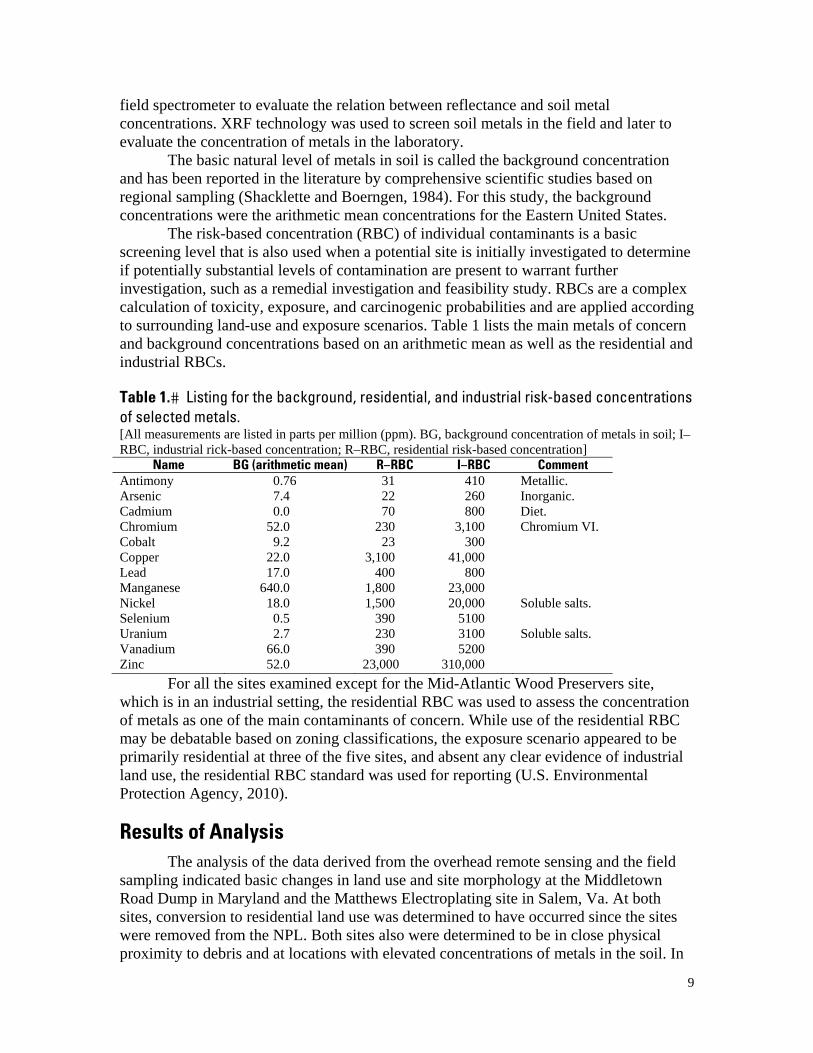
The basic natural level of metals in soil is called the background concentration and has been reported in the literature by comprehensive scientific studies based on regional sampling (Shacklette and Boerngen, 1984). For this study, the background concentrations were the arithmetic mean concentrations for the Eastern United States.
The risk-based concentration (RBC) of individual contaminants is a basic screening level that is also used when a potential site is initially investigated to determine if potentially substantial levels of contamination are present to warrant further investigation, such as a remedial investigation and feasibility study. RBCs are a complex calculation of toxicity, exposure, and carcinogenic probabilities and are applied according to surrounding land-use and exposure scenarios. Table 1 lists the main metals of concern and background concentrations based on an arithmetic mean as well as the residential and industrial RBCs.
Table 1.� Listing for the background, residential, and industrial risk-based concentrations of selected metals. [All measurements are listed in parts per million (ppm). BG, background concentration of metals in soil; I–RBC, industrial rick-based concentration; R–RBC, residential risk-based concentration]
Name BG (arithmetic mean) R–RBC I–RBC Comment Antimony 0.76 31 410 Metallic. Arsenic 7.4 22 260 Inorganic. Cadmium 0.0 70 800 Diet. Chromium 52.0 230 3,100 Chromium VI. Cobalt 9.2 23 300 Copper 22.0 3,100 41,000 Lead 17.0 400 800 Manganese 640.0 1,800 23,000 Nickel 18.0 1,500 20,000 Soluble salts. Selenium 0.5 390 5100 Uranium 2.7 230 3100 Soluble salts. Vanadium 66.0 390 5200 Zinc 52.0 23,000 310,000
For all the sites examined except for the Mid-Atlantic Wood Preservers site, which is in an industrial setting, the residential RBC was used to assess the concentration of metals as one of the main contaminants of concern. While use of the residential RBC may be debatable based on zoning classifications, the exposure scenario appeared to be primarily residential at three of the five sites, and absent any clear evidence of industrial land use, the residential RBC standard was used for reporting (U.S. Environmental Protection Agency, 2010).
Results of Analysis The analysis of the data derived from the overhead remote sensing and the field
sampling indicated basic changes in land use and site morphology at the Middletown Road Dump in Maryland and the Matthews Electroplating site in Salem, Va. At both sites, conversion to residential land use was determined to have occurred since the sites were removed from the NPL. Both sites also were determined to be in close physical proximity to debris and at locations with elevated concentrations of metals in the soil. In

10
addition, site expansion and additional waste disposal activity were detected at the Middletown Road Dump site. The basic temporal coverage of overhead imagery was an indicator of basic site condition, activity, morphology, and in some cases, the extent of waste disposal (U.S. Environmental Protection Agency, 2007). However, overhead remote sensing is limited in its usefulness when the site has been completely altered into new land use and land cover, as was the case at the Mid-Atlantic Wood Preservers site.
Hyperspectral imagery analysis conducted in the laboratory and from remote imagery shows promise for remote detection of spectral features related to site status. Hyperspectral analysis was used to detect unusual landscape features, or anomalies, at several sites and was especially important at Middletown Road Dump (figs. 7–9) and Matthews Electroplating. These anomaly features were detected as areas that did not match the spectral background and proved to be debris, drums, and reddish leachate being discharged from the waste area into a local stream at the Middletown Road Dump. At the Matthews Electroplating site, the anomalies were determined to be containers, old bumpers, and other scrap metal objects likely left over from the original electroplating site.
Figure 7. Hyperspectral anomaly detection results showing anomalies along the northern border of the Middletown Road Dump. The image on left was derived from the Airborne Real-Time Cueing Hyperspectral Enhanced Reconnaissance (ARCHER) system, and the image on the right shows the analysis of the ARCHER image.

11
Figure 8. Drums and debris along the northern border of the Middletown Road Dump. Photograph by Gary B. Fisher, U.S. Geological Survey.
A B
Figure 9. Leachate discharging into a local waterway along the north side of the Middletown Road Dump. A, Discharge from underneath the dump site showing leachate

12
and a hydrocarbon sheen on the surface of the water; B, Leachate for the dump impacting the substrate of a nearby receiving stream. Photographs by Gary B. Fisher, U.S. Geological Survey.
Hyperspectral analysis of soils in the laboratory confirmed that hydrocarbons were seeping from the general location of the dump and being discharged into a local stream at the Middletown Road Dump. No other hydrocarbons were detected at any of the other four sites. Hyperspectral analysis of soils in the laboratory also indicated a statistical correlation between the concentration of zinc present in the soil and a spectral band ratio of 610:500 nm (fig. 10).
Through XRF analysis of soil metal concentrations, elevated metal readings were discovered at four of the sites and exceeded some of the RBCs for residential land use. The land use and zoning at the time of the remedial activity, which was often in excess of 20 years ago, could have been different and led to the use of other standards for exposure at that time.
Figure 10. The regression between hyperspectral band ratios and soil zinc concentrations at the Rhinehart Tire Fire site.
Summary and Conclusions Remote sensing technology is an emerging and often underutilized technology for
monitoring landscape activity. Basic overhead imaging and emerging hyperspectral remote sensing technologies were shown to have the potential to be of value in postclosure monitoring of hazardous waste sites.
Routine aerial imaging has been shown to have value in describing basic site morphology, changes in land use, and important indicators of site activity. Hyperspectral analysis conducted in the laboratory and from remote imagery also shows promise for remote detection of spectral features related to contamination and site status. Hyperspectral anomaly detection from the ARCHER imagery proved to be useful at

13
several of the sites where fugitive drums, metal containers, and discolored effluent discharges were readily identified on the imagery. ARCHER itself could be useful as a new tool for hazardous waste site monitoring at all stages of development, especially at locations where disposal or dumping activity may have been renewed, as was the case at the Middletown Road Dump.
The spectroscopic identification of soil hydrocarbons was an unusual and unexpected development in this research because hydrocarbons and organic chemicals generally evaporate or decompose relatively quickly and would not be expected to be part of an active pollution profile 10 to 20 years after site closure. However, in a scenario of renewed disposal activity, the presence of fugitive hydrocarbons is possible and detectable by hyperspectral monitoring. A goal of future research in this area could be the utilization of a full range hyperspectral imager, such as Airborne Visible/Infrared Imaging Spectrometer (AVIRIS) or SpecTIR, LLC’s High-Resolution Imager (HRI), to determine if hydrocarbons can be detected in hazardous waste site scenarios and what the parameters of the remote sensing and spectral collections might be. This experimental result serves as proof of concept for pollutant detection in a real-world situation.
The experimental correlation discovered between the laboratory spectral band ratios and concentrations of zinc in the soil at the Rhinehart Tire Fire site was based on recently published work by Choe and others (2008), where similar statistical correlations between metals and spectral band ratios of soil reflectance were demonstrated. It is interesting that zinc at other sites, most notably Dixie Caverns, did not show this type of correlation. This is possibly owing to different types of soils or the range of contaminant concentrations, which were much higher at the Rhinehart site. This potential monitoring capability needs further research and development.
Leaf-off or senescent conditions preclude many of the plant pigment and vegetation health parameters that can be extracted and possibly correlated with known levels of landscape contamination (Slonecker and others, 2010). However, the photochemical reflectance index (PRI) provided a general spatial correlation with high soil zinc concentrations at the Rhinehart site, and recent scientific literature shows that the PRI index has been used successfully to indicate high soil metal concentration (Thorhaug and others, 2006; Slonecker, 2007; Götze and others, 2010). Vegetation indicators are likely to be an important area of future research in the hyperspectral detection of fugitive contamination.
One of the major problems encountered in this research was the difficulty in obtaining hyperspectral imagery, delaying the project by nearly a year and resulting in off-season data collections. Prior to this research effort, the availability of hyperspectral data was limited to a handful of government and commercial sources. Initial attempts to acquire hyperspectral data led to the establishment of an interagency agreement between the USGS, the U.S. Air Force, and the Civil Air Patrol, through which affordable hyperspectral imagery can be acquired on a routine basis.
Although hyperspectral imagery offers potential in this type of landscape evaluation, the full potential of the resource could not be fully evaluated with this study because of the problems in acquiring hyperspectral data and in the seasonal timing of acquisitions. Imagery was acquired during the first available window regardless of seasonal considerations. This resulted in autumn and winter acquisitions that negated the use of vegetation as an indicator of soil contamination.

14
In addition to the seasonal acquisition problems mentioned above, there is also a lack of a strong signature library for hazardous waste in the environment. Because this work involved delisted Superfund sites, contaminant concentration levels were likely to be low, if present at all, making development of a direct or indirect hyperspectral signature problematic because detection strategies are limited to marginal levels of contamination. To address this issue, additional development of hyperspectral signatures at active hazardous waste sites or known areas of fugitive contamination where unique signatures and sensitivities could be developed and transferred to an operational setting is
needed, as is additional research in the following areas. • Hyperspectral and field analysis.—The technical findings of this report reveal
encouraging results for remote monitoring of site conditions. Many of the initial programmatic obstacles, such as the acquisition of hyperspectral imagery, have now been solved, and several new Superfund sites have already been imaged during summer conditions.
• Laboratory and field hyperspectral signature development.—The ability of hyperspectral technologies to be used to detect hazardous waste site conditions is only in its infancy, and laboratory and field work could be important in the creation of a library of monitoring signatures for future use. Part of the problem with delisted sites is that most of the chemical contamination, if present at all, exists at marginal levels at or below the RBCs. Developmental work in the laboratory and at hazardous waste sites that have not yet been remediated could potentially provide a wider range of contamination conditions and permit stronger development of hyperspectral signatures.
• Mid- and thermal-infrared analysis.—Full-range solar-reflected (400- to 2,500-nm) hyperspectral analysis is available by sensors such as AVIRIS and SpecTIR’s HRI; this technology could make possible the evaluation of airborne hyperspectral detection of key environmental contaminants, such as hydrocarbons and other organic chemicals, and the detection of soil metals. Thermal infrared analyses are available by overhead instruments, such as the Airborne Hyperspectral Imager (AHI) and the Spatially Enhanced Broadband Array Spectrograph System (SEBASS), and could bring a whole new level of spectroscopic analysis in a range of the spectrum where many organic chemicals and metals have detectable fingerprints. In the realm of detecting fugitive contaminants, this could be an important capability for the future.
References Cited Allen, C.S., and Krekeler, M.P.S., 2010, Reflectance spectra of crude oils and refined
petroleum products on a variety of common substrates, in Gilbreath, C.G., and Hawley, G.T., eds., Active and passive signatures: Proceedings of the International Society for Optics and Photonics, v. 7687, [unpaginated].
Baker, S.J., 1984, Historical aerial photographic analysis, Ringwood mines and landfills: U.S. Environmental Protection Agency Report TS–PIC–83044, 2 vols.
Chang, S.H., and Collins, William, 1983, Confirmation of the airborne biogeophysical mineral exploration technique using laboratory methods: Economic Geology, v. 78, no. 4, p. 723–736.
Choe, Eunyoung, Meer, Freek van der, Ruitbeek, Frank van, Werff, Harald van der, Smeth, Boudewijn de, and Kim, K.-W., 2008, Mapping of heavy metal pollution in stream sediments using combined geochemistry, field spectroscopy, and hyperspectral

15
remote sensing—A case study of the Rodalquilar mining area, SE Spain: Remote Sensing of Environment, v. 11, no. 7, p. 3222–3233.
Civil Air Patrol, 2009, ARCHER— CAP advanced technologies: Civil Air Patrol presentation, 21 p. (Accessed April 14, 2011, at http://www.capmembers.com/media/cms/ARCHER_For_Commanders_Jun_09_CE3C28CEC0754.pdf.)
Clark, R.N., 1999, Spectroscopy of rocks and minerals, and principles of spectroscopy, chap. 1 of Manual of remote sensing, v. 3 of Rencz, A.N., ed., Remote Sensing for the Earth Sciences: Ney York, John Wiley and Sons, p. 3–58.
Clark, R.N., Curchin, J.M, Hoeffen, T.M., and Swayze, G.A., 2009, Reflectance spectroscopy of organic compounds—1. Alkanes: Journal of Geophysical Research, v. 114, no. E03001, p. 19.
Cloutis, E.A., 1989, Spectral remote sensing of hydrocarbons—Remote sensing implications: Science, v. 245, no. 4914, p. 165–168.
Goetz, A.F.H., Vane, Gregg, Solomon, J.E., and Rock, B.N., 1985, Imaging spectroscopy for earth remote sensing: Science, v. 228, no. 4704, p.1147–1153.
Götze, Christian, Jung, András, Merbach, Ines, Wennrich, Rainer, and Gläßer, Cornelia, 2010, Spectrometric analyses in comparison to the physiological condition of heavy metal stressed floodplain vegetation in a standardised experiment: Central European Journal of Geosciences, v. 2, no. 2, p. 132–137.
Green, R.O., Eastwood, M.L., Sarture, C.M., Chrien, T.G., Aronsson, M., Chippendale B.J., Faust, J.A. Pavri, B.E. Chovit, C.J., Solis, M., Olah, M.R. and Williams, O, 1998, Imaging spectroscopy and the airborne visible/infrared imaging spectrometer (AVIRIS), Remote Sensing of Environment, v. 65, no. 3, p. 227–248.
Horler, D.N.H., Barber, J. and Barringer, A.R., 1980, Effects of heavy metals on the absorbance and reflectance spectra of plants: International Journal of Remote Sensing, v. 1, no. 2, p. 121–136.
King, T.V.V., and Clark., R.N., 1989, Reflectance spectroscopy (0.2 to 20 microns) as an analytical method for the detection of organics, in Proceedings of the First International Symposium—Field Screening Methods for Hazardous Waste Site Investigations: U.S. Environmental Protection Agency, p. 485–488.
Milton, N.M., Ager, C.M., Eiswert, B.A., and Power, M.S., 1989, Arsenic- and selenium-induced changes in spectral reflectance and morphology of soybean plants: Remote Sensing of Environment, v. 30, no. 3, p. 263–269.
Pharr, D.Y., McKenzie, J.K., and Hickman, A.B., 1992, Fingerprinting petroleum contamination using synchronous scanning fluorescence spectroscopy: Groundwater, v. 30, no. 4, p. 484–489.
Shacklette, H.T., and Boerngen, J.G., 1984, Element concentrations in soils and other surficial materials of the conterminous United States: U.S. Geological Survey Professional Paper 1270, 105 p. (Accessed April 14, 2011, at http://pubs.usgs.gov/pp/1270/pdf/PP1270_508.pdf.)
Slonecker, E.T., 2007, Remote sensing investigations of fugitive soil arsenic and its effects on vegetation reflectance: George Mason University PhD dissertation, 240 p.
Slonecker, E.T., and Fisher, G.B., 2009, Research Implementation and Quality Assurance Project plan—An evaluation of hyperspectral remote sensing technologies for the detection of fugitive contamination at selected Superfund hazardous waste sites: U.S.

16
Geological Survey Open File Report 2009–1048, 18 p., available only online at http://pubs.usgs.gov/of/2009/1048/.
Slonecker, E.T., Fisher, G.B., Aiello, D.P., and Haack, B.N., 2010, Visible and infrared remote sensing of hazardous waste—A review: Remote Sensing, v. 2, no. 11, p. 2474–2508.
Thorhaug, Anitra, Richardson, A.D., and Berlyn, G.P., 2006, Spectral reflectance of Thalassia testudinum (Hydrocharitaceae) seagrass—Low salinity effects: American Journal of Botany, v. 93, no. 1, p. 110–117.
U.S. Environmental Protection Agency, 2007, Limited investigation led to missed contamination at Ringwood Superfund site: U.S. Environmental Protection Agency, Office of Inspector General Report no. 2007–P–00039, 17 p.
U.S. Environmental Protection Agency, 2010, Generic tables—Risk-based concentration tables—Mid-Atlantic risk assessment: U.S. Environmental Protection Agency, accessed April 14, 2011, at http://www.epa.gov/reg3hwmd/risk/human/rb-concentration_table/Generic_Tables/index.htm.
Vane, Gregg, and Goetz, A.F.H., 1988, Terrestrial imaging spectroscopy: Remote Sensing of Environment, v. 24, no. 1, p. 1–29.