Americans’ Attitudes Toward Life Insurance · Retirement - Insurance - Investments 4 Key Findings...
46
Products and services offered through the ING family of companies Americans’ Attitudes Toward Life Insurance Survey Findings (General U.S. Adult Population) May, 2008
Transcript of Americans’ Attitudes Toward Life Insurance · Retirement - Insurance - Investments 4 Key Findings...

Products and services offered through the ING family of companies
Americans’ Attitudes Toward Life Insurance
Survey Findings(General U.S. Adult Population)
May, 2008

Retirement - Insurance - Investments 2
Methodology• Telephone survey of over 1,000 randomly-selected adults aged 18 and over
nationwide created and conducted by Ipsos Public Affairs• National, randomly-selected sample representative of the general adult population
residing in the United States• Most questions from 1,004 interviews conducted October 23-26, 2007• Additional questions from 1,006 interviews conducted January 7-11, 2008 to supplement
the original survey
• The margin of sampling error with a 95% confidence level for results based on all respondents is +/-3.1%.
• The data was weighted to ensure the sample's regional and age/sex composition reflects that of the actual U.S. population according to Census data.
• Sums of percentages do not always add up to exactly 100% because of rounding• Generations are defined as follows:
• Pre boomers - born between 1901- 1945 (ages 62+)• Baby boomers - born between 1946- 1964 (ages 43-61)• Generation X - born between 1965- 1974 (ages 33-42)• Generation Y - born after 1974 (ages 18-32)
Methodology

Products and services offered through the ING family of companies
Key Findings

Retirement - Insurance - Investments 4
Key Findings
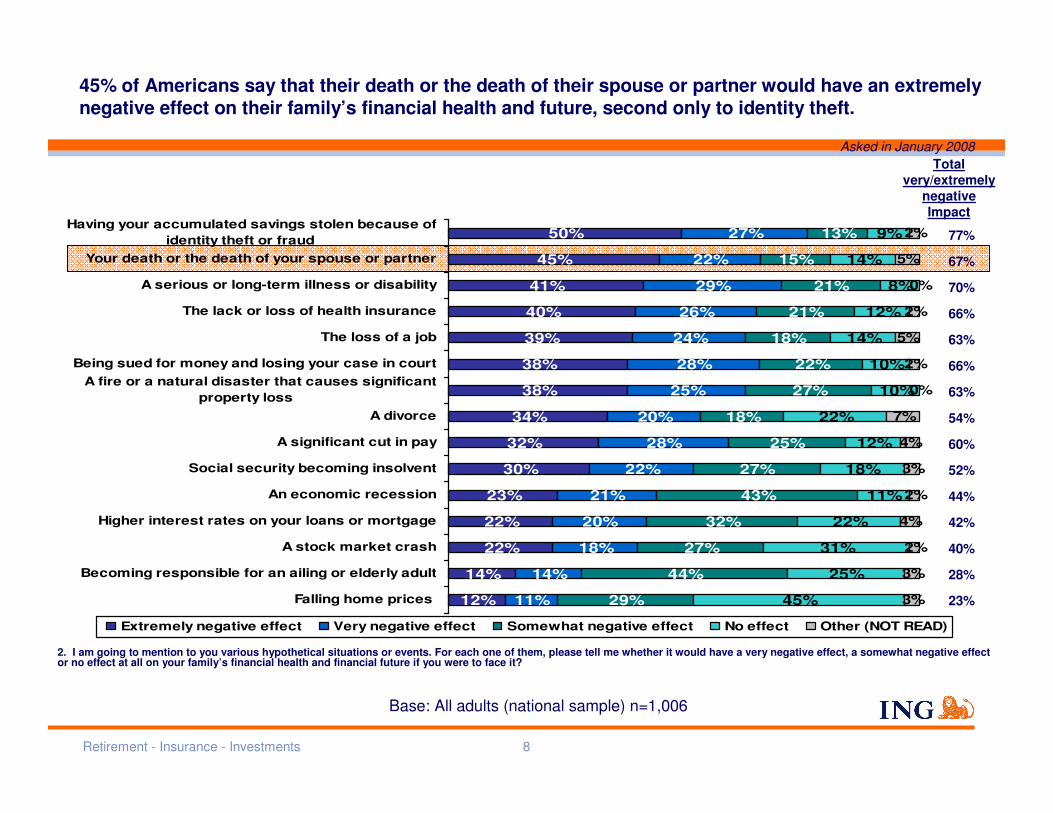
• One’s death or the death of one’s spouse ranks third among 15 situations in terms of having an extremely or very negative impact on one’s family’s financial health and financial future.
• Identity theft or fraud and a serious illness or disability are the only two scenarios that rank higher in having a highly negative impact.
• Two thirds of Americans (67%) say that their death or the death of their spouse would have an extremely or very negative impact on their families’ financial health and financial future.
• Fewer than half of Americans say that an economic recession, higher interest rates on their loans or mortgage, a stock market crash, becoming responsible for an ailing or elderly adult, or falling home prices would have an extremely or very negative impact on their families’ financial well-being.
• Seven in ten adults say life insurance is something they would not do without, reflecting the proportion of adults who say they have life insurance (71%). However, nearly nine in ten say that someone in their situation should have life insurance.
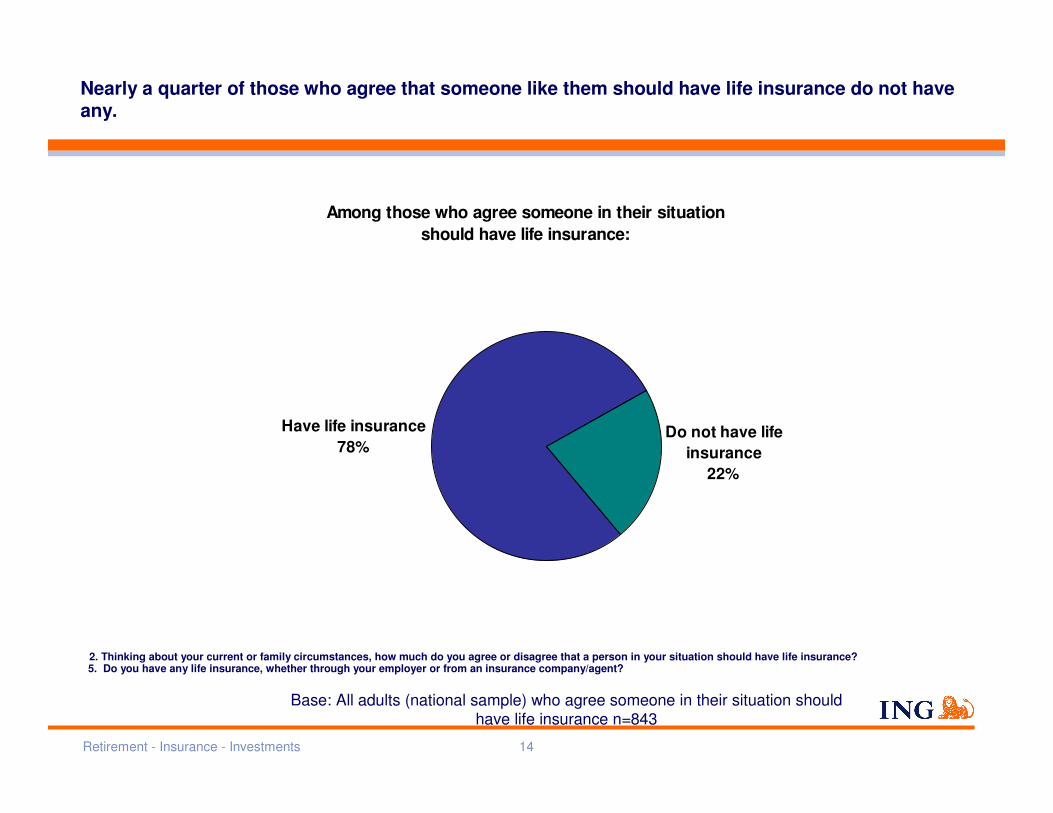
• Almost a quarter (22%) of those who believe that someone like them should have life insurance do not have any.
• Many of those who do not think they need life insurance say they already have enough saved or that they do not have any beneficiaries.
• Life insurance is most widely associated with money for loved ones and for covering funeral costs when one dies.

Retirement - Insurance - Investments 5
Key Findings
• Contacting an agent – either through a referral from a friend or family member, calling directly, or using the Yellow pages – are the top three things that adults say they would do first if they were interested in obtaining life insurance.
• Some of the most important factors when purchasing life insurance are using an agent one can trust who clearly answers all questions and being treated like a valued customer. Assurance that one is getting a good value is also a top factor.
• When deciding how much life insurance is needed, Americans most often turn to their insurance agent or financial advisor, their friends or family, or just choose the standard option offered by their employer.
• Among those who have life insurance, 67% purchased some through an insurance company or agent, nearly as many (66%) get their insurance through their employer or union, and nearly half (46%) purchased some through a group or association of which they are a member.
• Among those who get life insurance through an employer or a union, 46% say it is paid in full by the employer or union, 28 % pay for it themselves and 26% say that both they and their employer or union pays for some of it.
• Among those who purchased life insurance through an agent or company, 56% have a permanent policy and 55% have a term policy.

Retirement - Insurance - Investments 6
Key Findings
• Among those who purchased life insurance through an agent or company, 52% asked for a certain type when they went to purchase it while 44% only asked for life insurance in general.
• Americans tend to find electronics easier to figure out than financial matters. More say they find life insurance policies difficult to figure out (41%) than say so of DVD recorders (23%) and cell phone plans (35%).
• Talking about life insurance with an agent is challenging for most Americans, as just 17% would choose this over other potentially uncomfortable situations, including bungee jumping, having a performance review at work and taking out a mortgage.
• Fitting general perceptions of life insurance, majorities say that they would need their funeral costs, a year or two of household expenses, and their children’s future education costs to be taken care of should they die suddenly.
• Younger Americans tend look to life insurance for taking care of a wider range of needs compared with older Americans, including funeral costs, children’s future education costs, and several years of household expenses

Products and services offered through the ING family of companies
Perceptions of Financial Health
Retirement - Insurance - Investments 8
50%
45%
41%
40%
39%
38%
38%
34%
32%
30%
23%
22%
22%
14%
12%
27%
22%
29%
26%
24%
28%
25%
20%
28%
22%
21%
20%
18%
14%
11%
13%
15%
21%
21%
18%
22%
27%
18%
25%
27%
43%
32%
27%
44%
29%
9%
14%
8%
12%
14%
10%
10%
22%
12%
18%
11%
22%
31%
25%
45%
2%
5%
0%
2%
5%
2%
0%
7%
4%
3%
2%
4%
2%
3%
3%
Having your accumulated savings stolen because ofidentity theft or fraud
Your death or the death of your spouse or partner
A serious or long-term illness or disability
The lack or loss of health insurance
The loss of a job
Being sued for money and losing your case in court A fire or a natural disaster that causes significant
property lossA divorce
A significant cut in pay
Social security becoming insolvent
An economic recession
Higher interest rates on your loans or mortgage
A stock market crash
Becoming responsible for an ailing or elderly adult
Falling home prices
Extremely negative effect Very negative effect Somewhat negative effect No effect Other (NOT READ)
2. I am going to mention to you various hypothetical situations or events. For each one of them, please tell me whether it would have a very negative effect, a somewhat negative effect or no effect at all on your family’s financial health and financial future if you were to face it?
45% of Americans say that their death or the death of their spouse or partner would have an extremely negative effect on their family’s financial health and future, second only to identity theft.
Base: All adults (national sample) n=1,006
Total very/extremely
negative Impact
77%
67%
70%
66%
63%
66%
63%
54%
60%
52%
44%
42%
40%
28%
23%
Asked in January 2008

Retirement - Insurance - Investments 9
52%
47%
43%
38%
55%
39%
51%
37%
46%
44%
21%
25%
22%
18%
22%
21%
22%
21%
21%
23%
9%
17%
18%
15%
14%
15%
15%
13%
17%
10%
13%
8%
14%
20%
7%
19%
9%
21%
14%
15%
4%
4%
3%
9%
3%
6%
3%
9%
3%
7%
Generation Y
Generation X
Baby boomers
Pre boomers
Parents of Children under 18
No children under 18
Married
Unmarried
Has Life Insurance
No Life Insurance
Extremely negative effect Very negative effect Somewhat negative effect No effect Other (NOT READ)
2. I am going to mention to you various hypothetical situations or events. For each one of them, please tell me whether it would have a very negative effect, a somewhat negative effect or no effect at all on your family’s financial health and financial future if you were to face it?
One’s death or the death of a spouse or partner is more likely to have a negative financial impact of younger Americans and parents. Those with life insurance are slightly more likely that those without life insurance to think it would have a negative impact.
Base: All adults (national sample) n=1,004
Asked in January 2008Rank among 15 situations as having an extremely or very
negative impact:
Tied for 1st
4th
Tied for 3rd
7th
1st
6th
2nd
Tied for 8th
4th
Tied for 3rd

Retirement - Insurance - Investments 10
3. In general, do you think you do a better job saving and protecting your money than your parents do or did?
A majority of Americans think that they do a better job saving and protecting their money than their friends and their parents.
Base: All adults (national sample) n=1,006
Asked in January 2008
58%
40%
3%
65%
30%
5%
Yes No (NOT READ) Not Sure
Better than parents Better than friends/acquaintances
4. In general, do you think you do a better job saving and protecting your money than your friends and acquaintances do?
Products and services offered through the ING family of companies
Perceptions of and Need for Life Insurance

Retirement - Insurance - Investments 12
1. Life insurance brings to mind different things to different people. So, tell me if you agree or disagree if the following phrases apply to the words "life insurance." How about…
Nine in ten Americans agree that life insurance is “money for loved ones if you die.” Seven in ten agree that it is “something they would not do without.”
Base: All adults (national sample) n=1,004
70%
57%
50%
27%
16%
15%
8%
19%
27%
21%
23%
17%
17%
8%
5%
8%
14%
18%
23%
22%
18%
5%
7%
13%
29%
43%
43%
65%
1%
1%
1%
4%
2%
3%
1%
Money for loved ones ifyou die
Money to pay for thefuneral
Something I wouldn’t dowithout
Boring paperwork andsmall print
Regular payments forsomething I'll never use
Something I don'tunderstand
Something only older andwealthy people need
Agree strongly Agree somewhat Disagree somewhat Disagree strongly (DK/NS)
Net agree:
89%
84%
71%
16%
32%
33%
49%

Retirement - Insurance - Investments 13
2. Thinking about your current or family circumstances, how much do you agree or disagree that a person in your situation should have life insurance?
Over two thirds strongly agree that a person in their current or family situation should have life insurance.
Base: All adults (national sample) n=1,004
Strongly agree, 68%
Somewhat agree, 17%
Strongly disagree, 6%
Somewhat disagree, 8%
Don't know, 0%
Net agree: 86%
Retirement - Insurance - Investments 14
Nearly a quarter of those who agree that someone like them should have life insurance do not have any.
2. Thinking about your current or family circumstances, how much do you agree or disagree that a person in your situation should have life insurance?
Base: All adults (national sample) who agree someone in their situation should have life insurance n=843
Among those who agree someone in their situation should have life insurance:
Have life insurance78%
Do not have life insurance
22%
5. Do you have any life insurance, whether through your employer or from an insurance company/agent?

Retirement - Insurance - Investments 15
2. Thinking about your current or family circumstances, how much do you agree or disagree that a person in your situation should have life insurance?
Younger adults, full-time workers, parents and spouses are most likely to agree that someone in their situation should have life insurance.
Base: All adults (national sample) n=1,004
81%
93%
89%
79%
91%
80%
74%
89%
92%
86%
74%
19%
7%
11%
21%
9%
20%
26%
11%
8%
13%
26%
Those without children under 18
Parents (child age 0-17)
Married
Unmarried
Employed full-time
Employed part-time
Retired
Generation Y
Generation X
Baby Boomers
Pre-Boomers
Disagree Agree

Retirement - Insurance - Investments 16
3. Why do you disagree that someone in your current or family circumstances should have life insurance?
21%
21%
10%
10%
9%
9%
4%
4%
2%
11%
13%
2%
2%
I already have enough saved for my family.
I have no family, no one to take care of, leave money to
I can't afford life insurance, too expensive
My family w ill take care of each other, don't need me
I'd rather spend my money on things I can enjoy while I'malive
I am too young to worry about it
I don't want to be worth more dead than alive
I don't trust insurance companies, I've heard they often don'tpay
I don't trust insurance agents
No need
Children are grown and don't need it
Other
(DK/NS)
Already having enough saved and not having anyone to leave money to are the top reasons for notneeding life insurance.
Base: All adults (national sample) who disagree someone in their situation should have life insurance in Q2 n=157
Few significant differences across demographic groups emerge when it comes to reasons for not needing life insurance. However, this is partially due to the small base sizes.

Retirement - Insurance - Investments 17
4. Thinking about your own circumstances, I'm going to read you a list of things that a life insurance policy could pay for if you die suddenly and I want you to tell me if you absolutely need to have this thing taken care of, somewhat need this taken care of, don't really need to have this taken care of or don't need to have this taken care of at all?
Funeral costs, household expenses and children’s education are the top reasons for needing life insurance.
Base: All adults (national sample) who agree someone in their situation should have life insurance in Q2 n=843
69%
53%
50%
37%
29%
18%
19%
26%
21%
29%
31%
22%
6%
11%
7%
18%
18%
24%
6%
10%
21%
15%
21%
35%
0
1%
1%
0
1%
1%
The costs of the funeral
One or two years of householdexpenses
Future education costs foryour children (like college)
At least ten years of householdexpenses for your family
Only enough to be able to sayyou left something for your
family -- a gift of sorts
Enough so that no one in yourfamily ever needs to work
again
Absolutely need Somewhat need Don't really need Don't need at all (DK/NS)
Net need:
88%
79%
71%
40%
60%
66%

Retirement - Insurance - Investments 18
4. Thinking about your own circumstances, I'm going to read you a list of things that a life insurance policy could pay for if you die suddenly and I want you to tell me if you absolutely need to have this thing taken care of, somewhat need this taken care of, don't really need to have this taken care of or don't need to have this taken care of at all?
Gen Y’ers and Gen X’ers are more likely than Boomers, and especially Pre-Boomers, to have a variety of needs that life insurance would take care of.
Base: All adults (national sample) who agree someone in their situation should have life insurance in Q2 n=843
Net Need Taken Care of95%
87% 87%
72%
60%
43%
91% 88% 90%
74%
62%
45%
86%79%
65% 66%59%
40%
76%
53%
36%
50%
58%
27%
The costs of thefuneral
One or two years ofhouseholdexpenses
Future educationcosts for yourchildren (like
college)
At least ten years ofhousehold
expenses for yourfamily
Only enough to beable to say you leftsomething for your
family -- a gift ofsorts
Enough so that noone in your familyever needs to work
again
Generation Y Generation X Baby Boomers Pre-Boomers

Products and services offered through the ING family of companies
Who Has Life Insurance?

Retirement - Insurance - Investments 20
5. Do you have any life insurance, whether through your employer or from an insurance company/agent?
No28%
Yes71%
Seven in ten adults report having life insurance.
Base: All adults (national sample) n=1,004
Retirement - Insurance - Investments 21
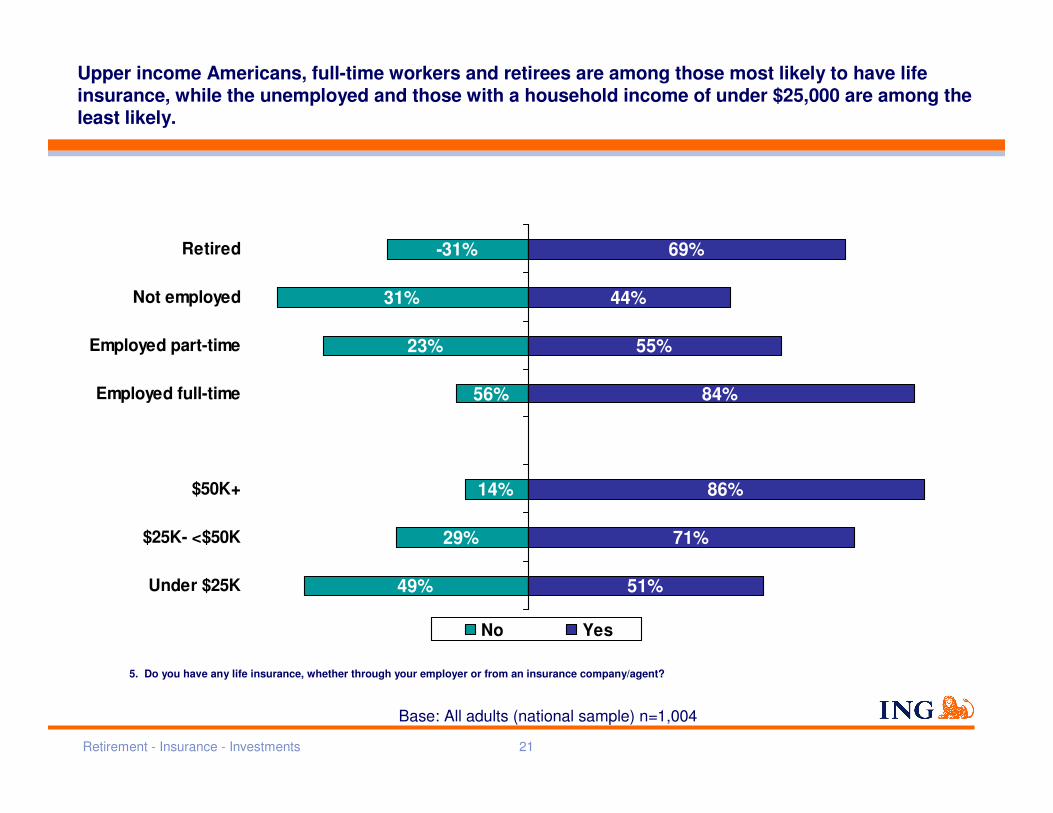
5. Do you have any life insurance, whether through your employer or from an insurance company/agent?
Upper income Americans, full-time workers and retirees are among those most likely to have life insurance, while the unemployed and those with a household income of under $25,000 are among the least likely.
Base: All adults (national sample) n=1,004
-31%
51%
71%
86%
84%
55%
44%
69%
49%
29%
14%
56%
23%
31%
Under $25K
$25K- <$50K
$50K+
Employed full-time
Employed part-time
Not employed
Retired
No Yes

Retirement - Insurance - Investments 22
6. Do you have your life insurance…
67%
76%
Purchased throughan insurance agentor from insurance
company, includinga company online
Through anemployer, union,
group and/or assn.
Two in three report obtaining their life insurance through an insurance agency or company. Three in four report obtaining life insurance through an employer or union.
Base: All adults (national sample) who have life insurance n=754

Retirement - Insurance - Investments 23
6. Do you have your life insurance…
67%
63%
67%
69%
70%
60%
84%
88%
75%
56%
77%
72%
Generation Y
Generation X
Baby Boomers
Pre-Boomers
Married
Unmarried
Purchased through aninsurance agent or frominsurance company,including a company online
Obtained through anemployer, union, groupand/or assn.
Gen X policyholders are more likely than others to get their life insurance through work and less likely (along with those who are unmarried) to have purchased it through an agent or company.
Base: All adults (national sample) who have life insurance n=754
Retirement - Insurance - Investments 24
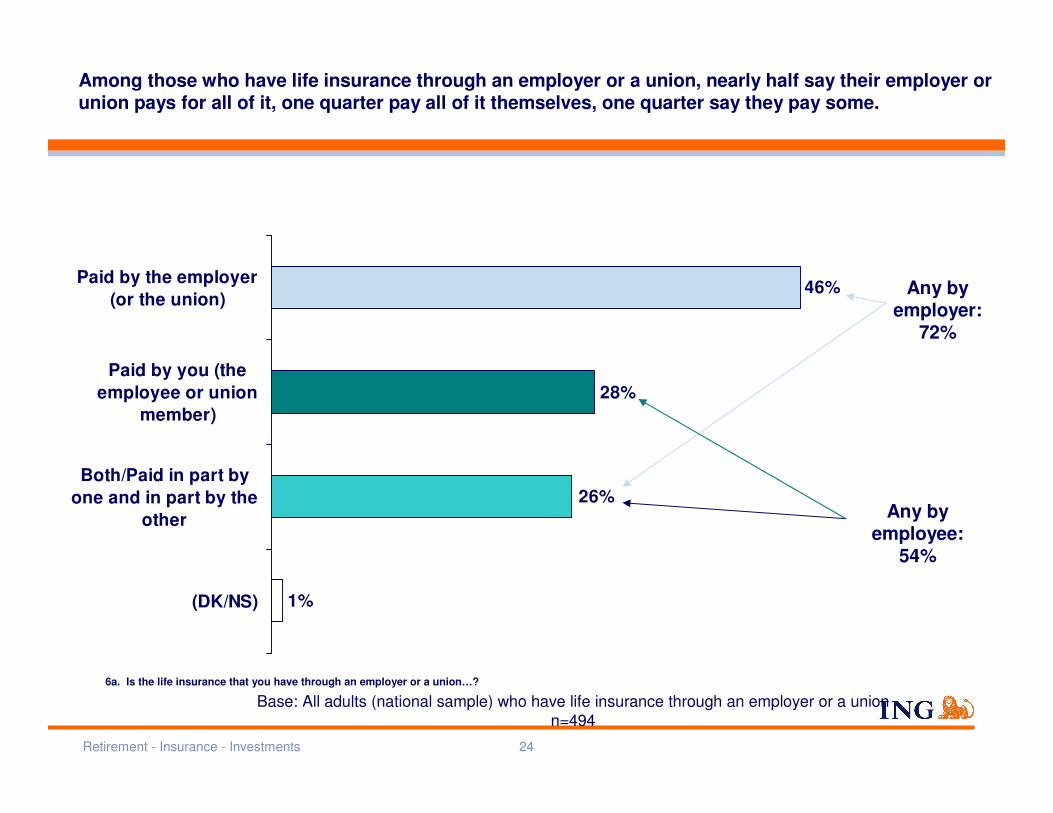
6a. Is the life insurance that you have through an employer or a union…?
1%
46%
26%
28%
Paid by the employer(or the union)
Paid by you (theemployee or union
member)
Both/Paid in part byone and in part by the
other
(DK/NS)
Among those who have life insurance through an employer or a union, nearly half say their employer or union pays for all of it, one quarter pay all of it themselves, one quarter say they pay some.
Base: All adults (national sample) who have life insurance through an employer or a union n=494
Any by employer:
72%
Any by employee:
54%

Retirement - Insurance - Investments 25
8. There are two main types of life insurance policies. One is “permanent” insurance, such as whole or universal life insurance, which builds a cash-value over time like an investment or savings account. The other is “term” insurance, which provides life insurance coverage for a certain period of time, generally, 15, 20 or 30 years, and does not have any cash value. Which kind of life insurance do you have?
38%
37%
18%
1%
0
6%
Permanent only
Term (ortemporary) only
Both permanentand term
(NOT READ)Other
(NOT READ)Nothing
(DK/NS)
Among those who obtained life insurance through an agent or company, as many have a permanent as have a term policy. Nearly one in five report having both types.
Base: All adults (national sample) who have purchased their life insurance through an insurance company or agent n=513
Total term: 55%
Total permanent: 56%

Retirement - Insurance - Investments 26
34%
41%
31%
50%
28%
44%
34%
45%42%
46%41%
28%30%
21%
45%
35%
13%
20%17%19%18%
21%19%
11%
Generation Y
Generation X
Baby Boomers
Pre-Boomers
Parents (child
0-17)
Those with
out child
ren under 18
Married
Unmarried
Permanent only
Term Only
Both Permanent and Term
8. There are two main types of life insurance policies. One is “permanent” insurance, such as whole or universal life insurance, which builds a cash-value over time like an investment or savings account. The other is “term” insurance, which provides life insurance coverage for a certain period of time, generally, 15, 20 or 30 years, and does not have any cash value. Which kind of life insurance do you have?
Permanent policies are most prevalent among Pre-Boomers while Boomers, Gen X’ers and parents are those most likely to have a term policy.
Base: All adults (national sample) who have purchased their life insurance through an insurance company or agent n=513

Products and services offered through the ING family of companies
Obtaining Life Insurance
Retirement - Insurance - Investments 28
15%14%
13%11%
9%7%
6%5%5%
3%2%2%2%2%2%2%
6%6%
Ask friends/relatives for agent's name, call
Call an agent
Lookup for an ins. co./agent in Yellow Pages
Search the internet/go online
Go to car/homeowners ins. agt
Ask friends/relatives for a life ins. co. name
Search for info on specific known brands
Check w/ employer if more life ins. available thru work
Review consumer advice/info on LI, then proceed
Would never buy LI/not interested
Apply/purchase online
Randomly shop prices via telephone
Compare prices
Decide based on cost/ what is cheapest
Talk to friends/ family
Decide how much insurance I want
Other
(DK/NS)
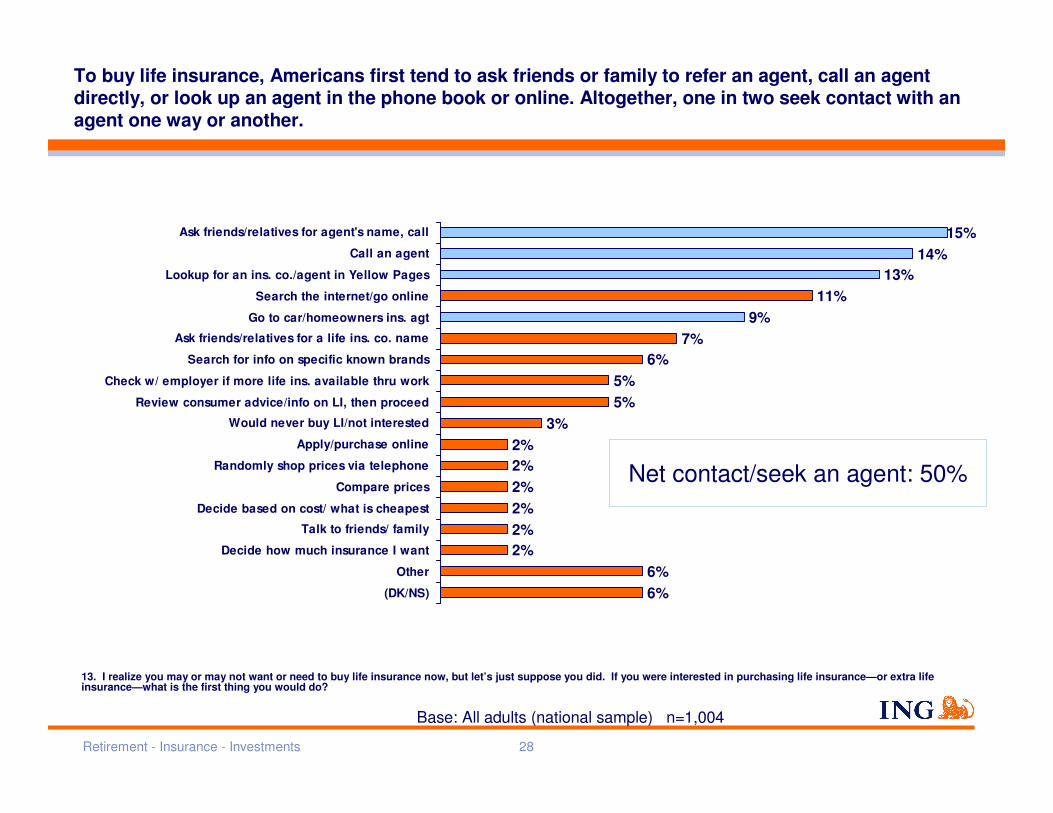
13. I realize you may or may not want or need to buy life insurance now, but let’s just suppose you did. If you were interested in purchasing life insurance—or extra life insurance—what is the first thing you would do?
To buy life insurance, Americans first tend to ask friends or family to refer an agent, call an agent directly, or look up an agent in the phone book or online. Altogether, one in two seek contact with an agent one way or another.
Base: All adults (national sample) n=1,004
Net contact/seek an agent: 50%

Retirement - Insurance - Investments 29
13. I realize you may or may not want or need to buy life insurance now, but let’s just suppose you did. If you were interested in purchasing life insurance—or extra life insurance—what is the first thing you would do?
Pre-boomers and Boomers are those most likely to call an agent or look in the Yellow Pages. Younger adults are those most likely to check with their employer and to go online.
Base: All adults (national sample) n=1,004
• Those in the Northeast (22%) and college graduates (19%) are more likely than others to ask friends or relatives for an agent's name, and then call that agent
• Those in the Midwest (21%), Pre-Boomers (19%), Baby Boomers (16%), those aged 55+ (18%) and whites (16%) are more likely than others to call an agent directly
• Generation Y’ers (11%), those with a household income of $50,000 or more (8%), college graduates (9%), and those aged 18-34 (9%) are more likely than others to check with their employer and learn whether more life insurance is available through work
• Those aged 35 to 54 (15%), Southerners (15%), those with a household income under $25,000 (16%), Pre-Boomers (17%) and Baby Boomers (15%) are among those more likely to look for an insurance company or agent in the Yellow Pages
• Generation Y’ers (11%) and Gen X’ers (9%) are tend to ask friends or relatives for a life insurance company name more than others
• Generation Y’ers (16%) are also more likely to search the internet than others
• Not knowing what they would do is more prevalent among those with a household income under $25,000 (11%), those who are not employed (11%), those with a high school education or less (10%), those without life insurance (9%), in the West (10%) and in the Northeast (9%).

Retirement - Insurance - Investments 30
33%
23%
21%
9%
8%
1%
1%
2%
1%
0
1%
Consulted with an insurance agent or a financial advisor
Discussed with family members and/or friends
Just chose a standard option available through work
Just guessed
Used a life insurance calculator or a guide to life ins.
Don't recall being asked or making a decision
Someone else decided
(NOT READ) I decided on my own
(NOT READ) Other
(NOT READ) None
(DK/NS)
Base: All adults (national sample) who have life insurance n=754
10. Generally speaking, when the time came for you to decide how much life insurance you needed, which one of the following did you rely on the most?
One third of Americans who have life insurance consulted with an insurance agent or financial advisor to decide how much coverage they needed.

Retirement - Insurance - Investments 31
14. I am going to mention to you various ways to purchase life insurance. For each of them, please tell me how likely you would be to use it if you were purchasing life insurance this month. Would you be very likely, somewhat likely, somewhat unlikely or very unlikely to ….?
The most likely way to buy life insurance is to go to one’s homeowners or car insurance agent.
Base: All adults (national sample) n=1,004
38%
37%
30%
26%
20%
16%
29%
26%
24%
28%
23%
20%
11%
12%
12%
12%
13%
15%
21%
24%
33%
33%
42%
48%
1%
0
1%
0
2%
0
Go to an insurance agent who already assists you withyour homeowners or car insurance
Go to a life insurance agent who can meet with you,explain the details and compare prices for you
Go online to compare prices
Request information to be mailed to your home
Purchase additional insurance through your employer
Go online to apply or complete most of the paperwork
Very likely Somewhat likely Somewhat unlikely Very unlikely (DK/NS)
Net likely:
67%
63%
36%
43%
54%
54%

Retirement - Insurance - Investments 32
14. I am going to mention to you various ways to purchase life insurance. For each of them, please tell me how likely you would be to use it if you were purchasing life insurance this month. Would you be very likely, somewhat likely, somewhat unlikely or very unlikely to go online to compare prices?
Younger adults, parents and college graduates are more likely than others to go online to compare prices.
Base: All adults (national sample) n=1,004
65%
66%
51%
33%
65%
46%
46%
55%
61%38%
45%
54%
53%
34%
66%
49%
34%
35%Generation Y
Generation X
Baby Boomers
Pre-Boomers
Parents (child 0-17)
Those without children under 18
High school education or less
Some college
College degree
Unlikely Likely

Retirement - Insurance - Investments 33
14. I am going to mention to you various ways to purchase life insurance. For each of them, please tell me how likely you would be to use it if you were purchasing life insurance this month. Would you be very likely, somewhat likely, somewhat unlikely or very unlikely to go online to compare prices?
Nearly half of younger adults say they would be likely to go online to apply or complete most of the paperwork vs. one in three Boomers and one in five Pre-Boomers.
Base: All adults (national sample) n=1,004
45%
47%
33%
20%
44%
31%68%
56%
80%
67%
53%
55%Generation Y
Generation X
Baby Boomers
Pre-Boomers
Parents (child 0-17)
Those without children under 18
Unlikely Likely

Retirement - Insurance - Investments 34
6. Do you have your life insurance…
Likely to compare prices online, but not to apply online 22%
Likely to both compare prices and
apply online 31%
DK 6%
Unlikely to both compare prices and to apply online 41%
Base: All adults (national sample) who have life insurance n=754
Average age: 52
Average age: 42Average age: 44
While 41% are unlikely to go online at all as part of the life insurance purchasing, 22% would go online to compare prices and apply offline and 31% would both compare prices and apply online. The average of the three groups ranges from 42 to 51.
Retirement - Insurance - Investments 35
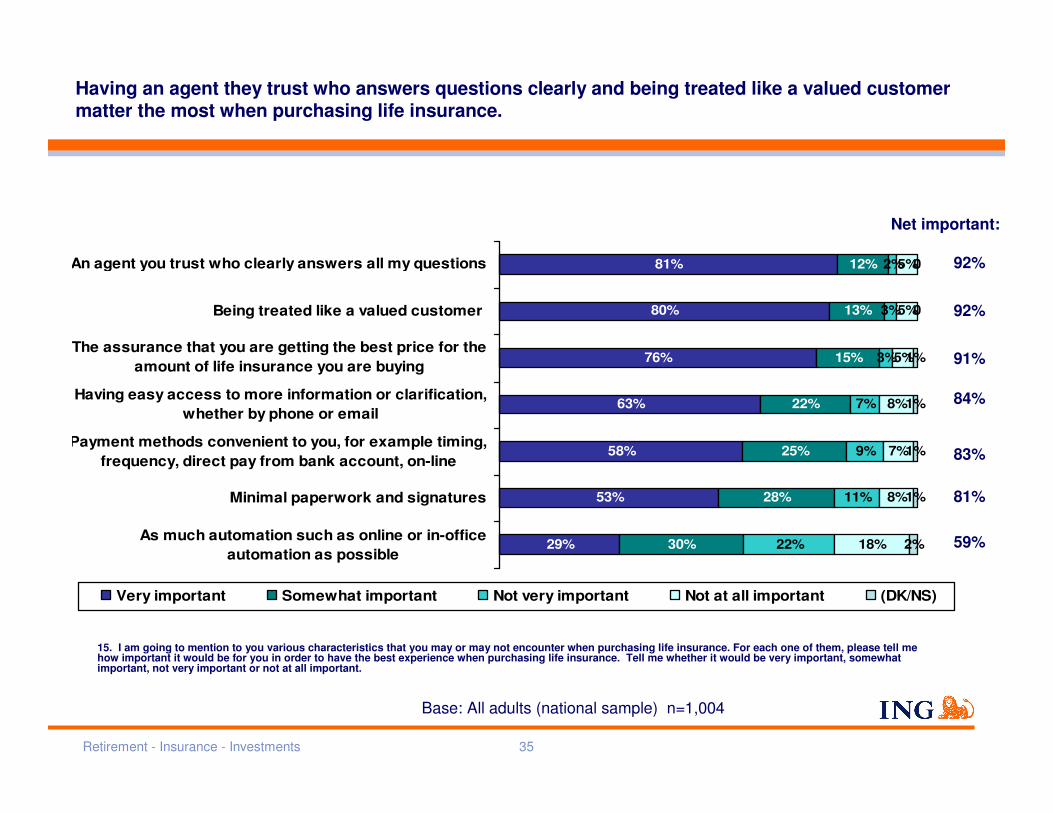
15. I am going to mention to you various characteristics that you may or may not encounter when purchasing life insurance. For each one of them, please tell me how important it would be for you in order to have the best experience when purchasing life insurance. Tell me whether it would be very important, somewhat important, not very important or not at all important.
Having an agent they trust who answers questions clearly and being treated like a valued customer matter the most when purchasing life insurance.
Base: All adults (national sample) n=1,004
81%
80%
76%
63%
58%
53%
29%
12%
13%
15%
22%
25%
28%
30%
2%
3%
3%
7%
9%
11%
22%
5%
5%
5%
8%
7%
8%
18%
0
0
1%
1%
1%
1%
2%
An agent you trust who clearly answers all my questions
Being treated like a valued customer
The assurance that you are getting the best price for theamount of life insurance you are buying
Having easy access to more information or clarification,whether by phone or email
Payment methods convenient to you, for example timing,frequency, direct pay from bank account, on-line
Minimal paperwork and signatures
As much automation such as online or in-officeautomation as possible
Very important Somewhat important Not very important Not at all important (DK/NS)
Net important:
92%
92%
59%
81%
84%
91%
83%

Retirement - Insurance - Investments 36
15. I am going to mention to you various characteristics that you may or may not encounter when purchasing life insurance. For each one of them, please tell me how important it would be for you in order to have the best experience when purchasing life insurance. Tell me whether it would be very important, somewhat important, not very important or not at all important.
Younger adults tend to find automation to be more important than do Pre-Boomers. Parents of children under 18, married adults, and those who are likely to compare prices and apply online are also more likely to find automation to be important.
Base: All adults (national sample) n=1,004
65%
71%
59%
38%
67%
53%
63%
53%
78%
43%54%
45%
20%
6%
36%
8%
44%
33%
59%
39%
29%
33%Generation Y
Generation X
Baby Boomers
Pre-Boomers
Parents (child 0-17)
Those without children under 18
Married
Unmarried
Likely to compare prices and apply online
Unlikely to compare prices or apply online
Unimportant Important

Products and services offered through the ING family of companies
Familiarity with and Understanding of Life Insurance
Retirement - Insurance - Investments 38
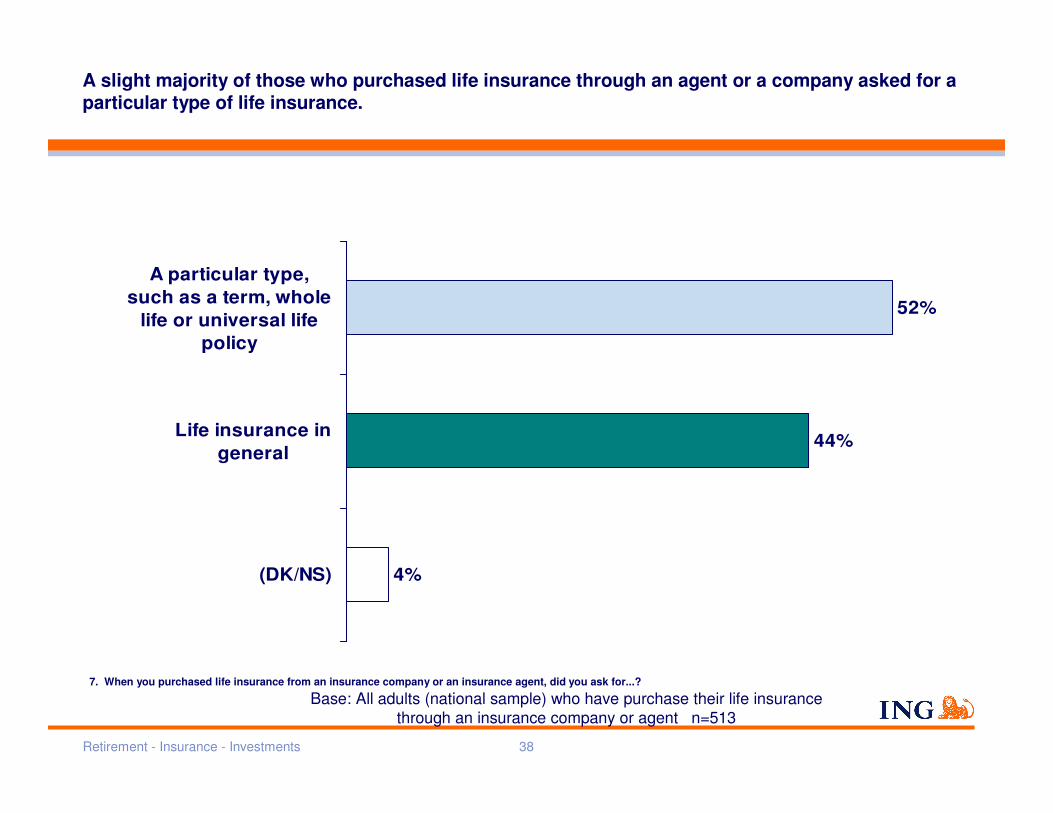
7. When you purchased life insurance from an insurance company or an insurance agent, did you ask for...?
52%
44%
4%
A particular type,such as a term, whole
life or universal lifepolicy
Life insurance ingeneral
(DK/NS)
A slight majority of those who purchased life insurance through an agent or a company asked for a particular type of life insurance.
Base: All adults (national sample) who have purchase their life insurance through an insurance company or agent n=513

Retirement - Insurance - Investments 39
7. When you purchased life insurance from an insurance company or an insurance agent, did you ask for...?
When buying life insurance from an agent or company, most of those who have a $50K+ household income, are aged 35-54 or are married asked for a particular type, while most of those who are less affluent, younger or unmarried did not.
Base: All adults (national sample) who have purchase their life insurance through an insurance company or agent n=513
41%
61%
49%
38%
41%
61%
57%
39%57%
39%
37%
52%
57%
48%
36%
54%Age 18-34
Age 35-54
Age 55+
HH income under $25K
HH income $25K- <$50K
HH income $50K+
Married
Unmarried
Life Insurance in General Particular Type of Insurance

Products and services offered through the ING family of companies
Comfort Level with Life Insurance

Retirement - Insurance - Investments 41
12. For each of the following, please tell whether you find each very easy, somewhat easy, somewhat difficult or very difficult to figure out how they work. How about …?
Four in ten say that they find life insurance difficult to figure out – more difficult than DVD recorders, and cell phone plans.
Base: All adults (national sample) n=1,004
44%
31%
28%
22%
21%
19%
16%
12%
30%
27%
36%
27%
32%
38%
29%
27%
16%
23%
22%
25%
27%
30%
30%
37%
7%
15%
13%
16%
14%
10%
18%
20%
3%
4%
2%
10%
6%
2%
8%
4%
DVD recorders
Weight loss diet plans
Cell phone plans
GPS devices
A new car lease
Life insurance
Time shares
Mutual Funds
Very easy Somewhat easy Somewhat difficult Very difficult (DK/NS)
Net easy:
74%
58%
63%
39%
57%
53%
49%
45%
Net diff.:
23%
38%
35%
57%
41%
41%
41%
48%

Retirement - Insurance - Investments 42
63%
64%
64%
50%
56%
36%
36%
36%
50%
42%
34%
Life insurance through agent
Life insurance NOT throughagent
Likely to compare price andapply online
Likely to compare prices butnot apply online
Unlikely to compare price orapply online
Difficult to figure out how life insurance worksEasy to figure out how life insurance works
12. For each of the following, please tell whether you find each very easy, somewhat easy, somewhat difficult or very difficult to figure out how they work. How about …?
There is very little difference between those who have life insurance through an employer, union and/or group and those who obtained their insurance through an agent or company when it comes to ease of understanding life insurance. However, those who are likely to both compare prices and to apply online are more likely to find life insurance easy to figure out than are those who bought life insurance through an agent or would not apply online.
Base: All adults (national sample) n=1,004

Retirement - Insurance - Investments 43
20%
19%
17%
13%
12%
10%
4%
6%
Go bungee-jumping
Stand in front of a crowd to make a speech
Talk about life insurance with an insuranceagent
Sit through a job performance review withyour supervisor
Fill out a college application
Take out a mortgage on a new home
Call a medical insurance company aboutplanned surgery
(DK/NS)
Base: All adults (national sample) n=1,004
11. If you had to do one, and only one, of the following, which would you rather do?
More would choose bungee-jumping or making a speech over talking about life insurance with an insurance agent.

Products and services offered through the ING family of companies
Appendix

Retirement - Insurance - Investments 45
Demographics (Weighted Sample)
Gender Male 48%Female 52%
Age 18-34 30%35-54 39%
55+ 30%
Generation Generation Y'ers 26%Generation X'ers 18%
Baby Boomers 36%Pre-Boomers 18%
Household Under $25K 21%Income $25K- <$50K 22%
$50K+ 41%
Region Northeast 19%Midwest 22%
South 36%West 22%
Marital Status Married 63%Unmarried 36%
Parental Status Parent (child under 18) 41%No children under 18 59%
Education HS or less 33%Some College 31%
College Degree 35%
Employment Full Time 52%Status Part Time 10%
Not Emp. 16%Retired 21%
Race/Ethnicity Hispanic 13%Non-Hispanic White 69%Non-Hispanic Black 10%Non-Hispanic Other 7%

Retirement - Insurance - Investments 46
6. Do you have your life insurance…
Agent + Employer/Union
16%
DK/Unsp. 4%
Group/Assn. ONLY 6%
Employer/Union ONLY 14%
Agent ONLY20%Agent +
Employer/Union + Group/Assn.
23%
Agent + Group/Assn.6%
Employer/Union + Group/Assn.
11%
Among Americans who have life insurance, 58%% have some from at least two source types (e.g., from an agent and from an employer or union, or from an agent and from a group or association).
Base: All adults (national sample) who have life insurance n=754
Net via Agent: 67%
Net via Employer or Union: 66%
Net via Group or Assn.: 46%
Net via ONE type only: 38%
Net via 2 or 3 types: 58%