ALTRAN Interim financial report 2018
58
INTERIM FINANCIAL REPORT 30 JUNE 2018
Transcript of ALTRAN Interim financial report 2018

INTERIM FINANCIAL REPORT
30 JUNE 2018

SIGNIFICANT EVENTS OVER THE 1__________
PERIOD 1Finalisation and financing of the acquisition of 1.1Aricent 2Launch of the new strategic plan: The High 1.2Road, Altran 2022 3
HALF-YEAR ACTIVITY REPORT2__________ 5Group performance2.1 6Group financial structure2.2 14Outlook2.3 16Other information2.4 16
INTERIM CONDENSED 3_________
CONSOLIDATED FINANCIAL STATEMENTS AT JUNE 30, 2018 17Consolidated balance sheet1 18Consolidated Income Statement2 20Consolidated Statement of Comprehensive 3Income 21Consolidated Statement of Changes in 4Shareholders’ Equity 22Consolidated Statement of Cash flows5 23Explanatory notes6 25
STATUTORY AUDITORS’ REPORT ON 4__________
THE INTERIM FINANCIAL INFORMATION 51
STATEMENT OF RESPONSIBILITY FOR 5__________
THE HALF-YEAR FINANCIAL REPORT 53
As a global leader in Engineering and R&D services (ER&D) (1), Altran offers its clients a new way to innovate by developing the productsand services for tomorrow. Altran works alongside its clients on every link in the value chain of their project, from conception toindustrialization. For over 30 years, Altran has provided its expertise to key players in the following sectors: Automotive; Aerospace,Defence & Rail; Energy, Industry and Life Sciences; Communications; Software and Internet; Finance and Public Sector.
Source: HfS Engineering services Top 20: Leading Engineering Service Providers 2016.(1)

1ALTRAN ____ Interim financial report 2018
1__ SIGNIFICANT EVENTS OVER THE PERIOD
FINALISATION AND FINANCING OF THE ACQUISITION OF 1.1ARICENT 2
LAUNCH OF THE NEW STRATEGIC PLAN: THE HIGH ROAD, 1.2ALTRAN 2022 3

2 ALTRAN ____ Interim financial report 2018
1 SIGNIFICANT EVENTS OVER THE PERIOD
Finalisation and financing of the acquisition of Aricent
Finalisation and financing of the acquisition 1.1 __of Aricent
On March 20, 2018, Altran finalised the acquisition of the Aricentgroup, thus creating the global leader in ER&D services. Thisannouncement was made once the necessary approvals had beenobtained from the competition authorities and the conditionsprecedent provided for by the agreement signed onNovember 29, 2017 between Altran and group of investors led byKKR had been met.
Founded in 1991, Aricent has a workforce of around 10,500employees and operates 24 engineering centres and designstudios catering to some 360 clients worldwide.
Aricent differentiates itself from other market players by thefollowing features:
the iconic frog brand, offering the world-renowned expertise ofj
its 600 employees in design, customer experience andprototyping and meeting, through integration into thecompany’s engineering services, the new needs of clients in theER&D services market;a high level of industry expertise in three main industries withj
solid growth potential: telecom, semiconductors and softwaredevelopment;recognised digital expertise and solutions, historically based onj
a portfolio of intellectual property rights (for example, softwarebuilding blocks) enhanced over the years and strategicallypositioned on emerging technologies such as artificialintelligence, cognitive systems and the Internet of Things (IoT);an industrialised service delivery model mainly by leveragingj
almost 8,500 engineers in India offering a broad range ofexpertise;proven know-how in the implementation of significantj
outsourcing contracts with top-tier clients; andthe status as a partner of choice for its clients, with which Aricentj
has successfully developed long-standing relations.Altran is now aiming to devise new global standards for the ER&Dservice sector. The Group will offer services of unprecedentedmagnitude and variety:
an unrivalled size: ER&D service sector leader with revenues ofj
just under €3bn, nearly 45,000 employees in around 30countries and exceptional market positioning;a leading position in key industries: Aeronautics, Automotive,j
Semiconductors, Software & Internet, Telecoms, Electronics andIndustry, Life Sciences and Energy;
an industrialised and globalised engineering services model: aj
unique portfolio of expertise, local to customers due to worldtechnology and innovation centres and GDC (Global DeliveryCenters) with 15,000 employees, in India, North Africa, Easternand Southern Europe; andcutting-edge expertise in critical technological fields:j
development of innovative products, digital transformation,mechanical and systems engineering, digital & software, andunique design skills thanks to frog.
To finance this acquisition, Altran successively used:
external financingj
A Senior Facilities Agreement was signed on February 15, 2018between the Altran group and a number of banks, providingthe Company with several loans:
a term loan of a total amount of €2,125m divided into two-tranches, one of €1,880m and the other of $300m (“TermLoan B”);a bridging loan of €250m (the “Bridge Facility”); and-a new multi-currency revolving credit facility of €250m (the-“Revolving Credit Facility”), replacing the existing similarfacility of €500m signed on July 27, 2017.
On March 20, 2018, i.e. the day of the closing of the acquisitionof Aricent, the Term Loan B and the Bridge Facility were fullydrawn and used to (i) pay the acquisition price for Aricent($2.1bn), (ii) to pay the fees and costs associated with theacquisition of Aricent, and (iii) to repay part of the Altrangroup’s existing debt (including approximately €273m ofmedium and long-term debt).
The loan agreement contains the usual clauses for this type offinancing, which involve compliance by the Group with certainobligations detailed in note 6.12 "Net debt" to the interimcondensed consolidated financial statements.
a capital increasej
A capital increase with preferential subscription rights forexisting shareholders was launched on March 22, 2018 andfinalised on April 17, 2018, for a final gross amount ofapproximately €750m (resulting in the creation of 81,220,840new shares).
Net income from the capital increase enabled Altran to repaythe Bridge Facility in full and part of Term Loan B as describedabove.
1
SIGNIFICANT EVENTS OVER THE PERIOD
Launch of the new strategic plan: The High Road, Altran 2022
3ALTRAN ____ Interim financial report 2018
Launch of the new strategic plan: The High 1.2 __Road, Altran 2022
On June 28, 2018, Altran announced the launch of The High Road,Altran 2022, its new five-year strategic plan aimed at raising theprofile of its service model and extending its presence in keysectors and regions to respond to demand from its clients and tocurrent major technological breakthroughs.
The High Road, Altran 2022 is banking on market growth ofaround 9% a year forecast for the ER&D market, which is likely toincrease from €155bn in 2017 to €240bn in 2022, with growthpatterns varying from region to region.
In 2022, at the end of the five-year period, the roll-out of The HighRoad, Altran 2022 strategic plan is likely to generate:
revenues of around €4bn (on a like-for-like basis);j
an operating margin of around 14.5%;j
a Free Cash Flow (inclusive of financial costs) of around 9% ofj
revenues;a debt ratio of less than 1.5x; andj
an earnings per share doubled (compared with the 2017j
reported value of €0.68/share).The High Road, Altran 2022 involves three strategic areas:
cutting edge and mutually beneficial service models: clientsj
make the distinction between activities that create a competitiveedge and those that do not. They also single out activities thathave an immediate impact on their performances from thosethat do not. Altran will have to adapt its models to meetsegment-specific needs. The Group anticipates growth fromhigh value-added services of well-known brands and entitiessuch as, Cambridge Consultants and Synapse, the developmentof innovative products, frog in design, the portfolio of WorldClass Centers and even the Group’s software components. TheIndustrialized GlobalShore© model will ensure that clients mayaccess all the advantages offered by a pool of global talent andgreater cost-competitiveness. The number of near- and offshoreengineers deployed in service centres will approximately hit25,000 mark and will increase industrialization;focusing on high-growth industries: revenues from Softwarej
and Internet, Semiconductors and Electronics, Automotive andCommunications are likely to increase by approximately €750mbetween 2017 and 2022. The fact that some of its sectors arenow core sectors for technology and make new generationinnovations such as driverless cars, the Internet of Things and5G possible, means that they are creating significantcross-industry opportunities;
region in 2022 (a rise from 50% in respect of the $800machieved in 2017) by creating cutting-edge positioning insoftware engineering and aggressive expansion in theAutomotive industry due to synergies with Aricent;consolidating European leadership by focusing on acceleratedorganic growth; and launching a selective expansionprogramme in Asia.
geographical leadership: demonstrating Altran’s leadership inj
North America by achieving revenues of around $1.2bn in the
The Group defined four operational catalysts to provide astructure for the implementation of the strategic plan:
convergence programme: gradual, allowing strategy executionj
without risk, its main objective being the materialization ofsynergies and the preparation of the roll-out of a joint Altranand Aricent operational model;organisation: new operational organisation, based onj
execution by region, supported by industry leaders andcross-functional Group teams for the provision of services,transformation, technology and innovation;a leadership resource: Altran has nurtured, including via thej
acquisition of Aricent, a unique pool of industry leaders, madeup of seasoned Executive Directors with additional skills,corporate cultures and experience, and used to managingmajor corporate transformations;operational excellence: Altran confirmed, once again, thatj
operational excellence has been a Group priority and the driverof a significant increase in its margins.
The Group intends to distribute its financial resources evenlybetween creating value for shareholders, reinvesting in theCompany and taxes and financial obligations:
the Group’s financial strategy prioritizes debt reduction, thej
target being to achieve a debt ratio of less than 2.5x by 2020and less than 1.5x by 2022. This target will be achieved by usingfree cash flows to gradually pay back debt whilst maintaining acash balance in excess of €250m and compensatingshareholders in the same way as before;powerful drivers are boosting the expansion of the Group’sj
Free Cash Flow: (i) an improved operating margin, includingsynergies and cost savings, capital intensity of around 2% ofrevenues with a corresponding increase in our working capitalrequirement; (ii) financial expenses should fall in proportion toour debt repayment, whilst Aricent’s cash liabilities will dropyear-on-year and will come to an end in 2021. Lastly, the fiscalstructure will be reviewed and the Group is likely to benefitfrom a more favourable fiscal environment.

4 ALTRAN ____ Interim financial report 2018
1 SIGNIFICANT EVENTS OVER THE PERIOD

5ALTRAN ____ Interim financial report 2018
2__ HALF-YEAR ACTIVITY REPORT
GROUP PERFORMANCE2.1 6Income analysis for the first half of 2018 and the first half of 20172.1.1 6Analysis of income on ordinary activities (revenues) and operating margin by 2.1.2operating segment for the first half of 2018 and the first half of 2017 12
GROUP FINANCIAL STRUCTURE2.2 14Consolidated cash flows2.2.1 14Free Cash Flow2.2.2 15Group net debt2.2.3 16
OUTLOOK2.3 16
OTHER INFORMATION2.4 16

6 ALTRAN ____ Interim financial report 2018
2 HALF-YEAR ACTIVITY REPORT
Group performance
Group performance2.1 __
Income analysis for the first half of 2018 and the first half of 20172.1.1
The table below shows the Group’s financial performance for the first half of 2018 and the first half of 2017.
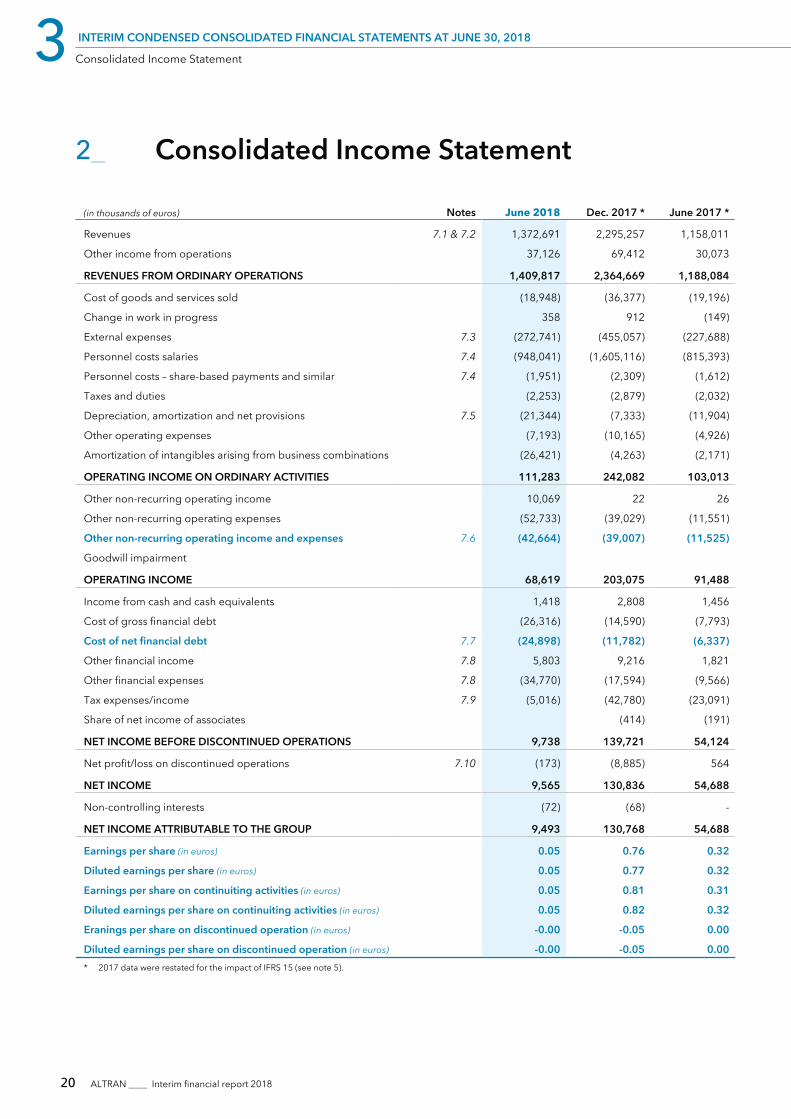
(in millions of euros) 1st half of 2018 1st half of 2017 * %
Revenues 1,372.7 1,158.0 +18.5%
Net operating expenses (1,234.2) (1,050.5) +17.5%
Operating margin 138.5 107.5 +28.8%
% of revenues 10.1% 9.3% 0.8 pt
Other expenses (69.9) (16.0) n.a.
Operating income 68.6 91.5 -25.0%
Net financial expenses (53.8) (14.1) +281.6%
Income tax (5.0) (23.1) -78.4%
Share of net income of associates 0.0 (0.2) n.a.
Net income before discontinued operations 9.8 54.1 -81.9%
Net income from discontinued operations (0.2) 0.6 -133.3%
Non-controlling interests (0.1) 0.0 n.a.
NET INCOME (GROUP SHARE) 9.5 54.7 -82.6%
Earnings per share (in euros) 0.05 0.32
Diluted earnings per share (in euros) 0.05 0.322017 data were restated for the impact of IFRS 15 (see note 5 “Year-on-year comparability” of interim condensed consolidated financial statements).*
Revenues2.1.1.1Growth in revenuesIn the first half of 2018, the Group’s consolidated revenues was up€214.7m (or +18.5%), rising from €1,158.0m to €1,372.7m.
This increase in revenues was partly due to a scope impact of+14.9% related to the acquisitions made by the Group, of whichPricol Technologies in the first half of 2017, Global Edge Softwareand Information Risk Management in the second half of 2017 andIRM on March 20, 2018.
The reported growth was impacted by the negative foreignexchange rate impact of -1.4%, primarily relating to theappreciation of the euro against the USD (+11.8%) and against theIndian rupee (+11.8%) based on average foreign exchange ratesfor the first half of 2018 compared with average foreign exchangerates for the first half of 2017.
The Group generated organic growth of +5.0% over the period.Organic revenues growth is calculated as follows: Reportedgrowth less (i) effect of consolidation scope changes as a result ofacquisitions and disposals as well as (ii) foreign exchange rateimpact.
Reported growth 18.5%
Scope impact 14.9%
Foreign exchange rate impact -1.4%ORGANIC GROWTH 5.0%
Reported growth was also affected by fewer working days in thefirst half of 2018, which amounted to 124.6 days, compared with124.7 days in the first half of 2017 (i.e. down 0.2%).
Economic growth, which corresponds to organic growth, restatedfor the working days effect, stood at +5.2% for the first half of2018.
Organic growth 5.0%
Working days impact -0.2%ECONOMIC GROWTH 5.2%

2
HALF-YEAR ACTIVITY REPORT
Group performance
7ALTRAN ____ Interim financial report 2018
Breakdown of revenues by type of industry *The diagram below breaks down revenues by type of industry forthe first half of 2018.
22%Aerospace,
Defence and Rail
22%Automotive
19%Energy, Industriesand Life Sciences
11%Hi-techand Software
10%Finance andPublic Sector
16%Communications
1.4 bn RevenuesS1 2018
* Indicative, unaudited data
The increase in Group revenues over the period was mainly theresult of Altran’s strong business momentum in the followingindustries:
Communicationsj
Business growth in this area was driven by Altran’s strategicpositioning in relation to the market’s main growth drivers, suchas seeking to improve the efficiency of telecommunicationsnetwork operators (digitisation, Cloud), or tests carried outwithin the context of developing the network for thechangeover to 5G, particularly through its World Class Center.
The acquisition of Aricent enabled the Group to increase itsexposure and expertise in this sector in order to speed up theimplementation of its strategy as an international player in thisconcentrated market.
Hi-tech and Softwarej
The Group’s strong growth in this segment was driven by itsfocus on small and medium-sized US West Coast businesses(start-ups), as well as by the major digital player (GAFAM)vertical integration, enabling Altran to offer its full range ofservices, from software development to electronic componentsdesign and support activities.
The acquisition of Aricent also strengthened Altran’s marketoffering and accelerated its growth.
The following industries continued to be the main contributors toGroup revenues in the first half of 2018:
Automotivej
In the first half of 2018, the European automotive marketcontinued to grow. Passenger vehicle registrations were up by2.9% (1) in the first half of 2018, whilst the number ofregistrations of commercial and heavy goods vehicles was upby 4.7% (1) over the same period. This momentum fosteredcontinued spending in Research and Development (R&D), tofurther strategic areas such as connectivity technologies,autonomous vehicles, the transition from combustion to electricengines, and the design and development of car-derived utilityvehicles. Market growth also contributed to changes inindustrial processes (Internet of Things (IoT), ApplicationLifecycle Management). As in 2017, Altran’s Automotivebusiness was bolstered by these trends in the first half of 2018.
The continued success of Altran’s highly competitiveIndustrialized GlobalShore© model, combined with itsautomotive project integration know-how, reinforced its marketpositioning among major automotive manufacturers in thishigh-growth segment. This enabled the Group to win a numberof large-scale projects in 2018.
Aerospace, Defence & Railj
Aeronautics: robust/strong manufacturing activity (about-35,000 new aicrafts should be delivered by 2036(2)) provesthe success of civil aeronautics to be a sustainable trend.Major aircraft and parts manufacturers, whose product policyhas now reached a certain level of maturity, are seeking toramp up their production of industrial equipment andsupport their product sales through tie-ins and incrementalinnovation. Against this backdrop, Altran succeeded inretaining its European leadership in the field of productdevelopment and continued to diversify its offering to includeproduction engineering business lines. This diversificationprovided the Group with strategic positioning throughout theentire value chain (industry 4.0, supply chain, industrialtransfers, innovation, etc.),Aerospace and Defence: Altran’s business remained steady-in these two industries with its positioning focused on themodernisation of products and services, against a backdropof increased demand and digitisation,Rail: continuing on from 2017, Altran consolidated its-position with industry leaders, maintaining its commitment totransformation projects, outsourcing development activities(such as the autonomous train) and the digitisation ofindustrial services.
Growth in number of vehicles registered in the first half of 2018 in the European Union and countries of the European Free Trade Association. Source: European Manufacturers’ (1)Association (ACEA). Publication dated July 25, 2018.Source: https://www.airbus.com/aircraft/market/global-market-forecast.html(2)
8 ALTRAN ____ Interim financial report 2018
2 HALF-YEAR ACTIVITY REPORT
Group performance
Net operating expenses2.1.1.2Net operating expenses for the period break down as follows:
(in millions of euros) 1st half of 2018 1st half of 2017 *
Cost of revenues (995.6) (843.6)
o/w amortization of large software deals (7.3) -
Selling, General & Administrative expenses (SG&A) (238.6) (206.9)NET OPERATING EXPENSES (1,234.2) (1,050.5)
2017 data were restated for the impact of IFRS 15 (see note 5 “Year-on-year comparability” of interim condensed consolidated financial statements).*
The table below provides details of net operating expenses for the first half of 2018 and the first half of 2017, by type of operatingexpense.
(in millions of euros)
1st half of 2018 1st half of 2017 (a)
Cost of revenues SG&A Total
Cost of revenues SG&A Total
Other income from operations 37.1 0.0 37.1 30.1 0.0 30.1
Cost of goods and services sold (15.7) (3.3) (19.0) (16.9) (2.3) (19.2)
Change in work in progress 0.4 0.0 0.4 (0.1) 0.0 (0.1)
External expenses (203.7) (69.0) (272.7) (167.5) (60.2) (227.7)
Personnel costs salaries (b) (795.9) (152.1) (948.0) (682.6) (132.8) (815.4)
Taxes and duties 0.0 (2.3) (2.3) 0.0 (2.0) (2.0)
Depreciation, amortization and net provisions (b) (14.2) (8.3) (22.5) (4.4) (6.8) (11.2)
Other operating expenses (3.6) (3.6) (7.2) (2.1) (2.8) (4.9)
COST OF REVENUES (995.6) (843.6)
SG&A (238.6) (206.9)
NET OPERATING EXPENSES (1,234.2) (1,050.5)2017 data were restated for the impact of IFRS 15 (see note 5 “Year-on-year comparability” of interim condensed consolidated financial statements).(a)Excluding the impact of share-based compensation not covered by the definition of net operating expenses.(b)
Other income from operationsOther income from operations mainly comprises operating grants(including the French research tax credit – crédit impôt recherche)and self-constructed assets. In the first half of 2018, these were up€7.0m (or +23.3%), rising from €30.1m to €37.1m.
Cost of goods and services soldCost of goods and services sold mainly comprises purchases notheld in inventory, including materials, supplies and projectequipment. These were down €0.2m (or -1.0%), falling from€19.2m for the first half of 2017 to €19.0m for the first half of 2018.
External expenses
(in millions of euros) 1st half of 2018 1st half of 2017 * Variation
Revenues 1,372.7 1,158.0 +18.5%
Total external expenses (272.7) (227.7) +19.8%
% of revenues 19.9% 19.7% +0.2 pt
o/w outsourcing (102.8) (91.9) +11.9%
% of revenues 7.5% 7.9% -0.4 pt2017 data were restated for the impact of IFRS 15 (see note 5 “Year-on-year comparability” of interim condensed consolidated financial statements).*
External expenses were up by €45.0m (or +19.8%) over the period, rising from €227.7m in the first half of 2017 to €272.7m in the firsthalf of 2018.

2
HALF-YEAR ACTIVITY REPORT
Group performance
9ALTRAN ____ Interim financial report 2018
The increase is mainly due to:
operating leases (mainly property leases) amounting to €11.3m;j
outsourcing expenses amounting to €10.9m; andj
transportation and travel expenses amounting to €7.7m.j
Personnel costs salaries
(in millions of euros) 1st half of 2018 1st half of 2017 (a) Variation
Revenues 1,372.7 1,158.0 +18.5%
Personnel costs salaries (b) (948.0) (815.4) +16.3%
% of revenues 69.1% 70.4% -1.3 pt2017 data were restated for the impact of IFRS 15 (see note 5 “Year-on-year comparability” of interim condensed consolidated financial statements).(a)Excluding the impact of share-based compensation not covered by the definition of net operating expenses.(b)
Personnel costs salaries were up €132.6m (or +16.3%) over the levels, including the acquisition of Aricent. The table below showsperiod, rising from €815.4m in the first half of 2017 to €948.0m in the total headcount at end of period and average headcount forthe first half of 2018. This increase reflects Group trends in staff the first half of 2018 and the first half of 2017.
06/30/2018 12/31/2017 06/30/2017
Total headcount at end of period 45,526 33,665 30,821
06/30/2018 12/31/2017 06/30/2017
Average headcount 41,491 31,109 30,355
At June 30, 2018, the Group had a total of 45,526 employees (up35.2%), representing an increase of 11,861 employees comparedwith the year ended December 31, 2017 and up 47.7% (+14,705employees) compared with June 30, 2017.
On a like-for-like basis, the Group’s total headcount was up 3.3%(+1,111 employees) compared with December 31, 2017 and 8.8%(+2,714 employees) compared with June 30, 2017.
The acquisition of Aricent alone increased the headcount by31.8% (+10,719 employees) in the first half of 2018.
Depreciation, amortization and net provisionsDepreciation, amortization and net provisions (excluding theimpact of share-based compensation not covered by thedefinition of net operating expenses) was up €11.3m (or+100.9%), rising from €11.2m in the first half of 2017 to €22.5m inthe first half of 2018.
relating to property, plant and equipment comprised office and ITequipment, and general furniture and fixtures.
Depreciation expense relating to intangible assets mainlycomprised the amortization of software. Depreciation expense
Operating margin2.1.1.3The operating margin is an Alternative Performance Measure(APM) used, alongside other indicators, to measure the Group’soperating performance.
The operating margin is defined as the difference between, on theone hand, revenues, and on the other, net operating expenses asdetailed in note 2.1.1.2 above.
The Group’s operating margin was up €31.0m (or +28.9%), risingfrom €107.5m in the first half of 2017 to €138.5m in the first half of2018. The operating margin ratio was up 80 basis points, risingfrom 9.3% to 10.1% over the period.
The table below shows the reconciliation between the Group’soperating income on ordinary activities and the operating marginfor the first half of 2018 and the first half of 2017.
(in millions of euros) 1st half of 2018 1st half of 2017
OPERATING INCOME ON ORDINARY ACTIVITIES 111.3 103.0
Share-based compensation (0.8) (2.3)
o/w personnel costs – share-based payments and similar (2.0) (1.6)
o/w depreciation, amortization and net provisions 1.2 (0.7)
Amortization of intangibles arising from business combinations (26.4) (2.2)OPERATING MARGIN 138.5 107.5
10 ALTRAN ____ Interim financial report 2018
2 HALF-YEAR ACTIVITY REPORT
Group performance
Other expenses2.1.1.4 well as non-recurring items likely to alter the understanding of theGroup’s operating performance.
Other expenses include share-based compensation items,amortization of intangibles arising from business combinations, as
Other expenses for the first half of 2018 and the first half of 2017were as follows:
(in millions of euros) 1st half of 2018 1st half of 2017
Share-based compensation (0.8) (2.3)
Amortization of intangibles arising from business combinations (26.4) (2.2)
Restructuring costs (14.8) (7.3)
Costs and ligations related to acquisitions and legal reorganizations (27.5) (2.6)
Litigations and miscellenaeous (0.4) (1.6)OTHER EXPENSES (69.9) (16.0)
Share-based compensationThe total cost of share-based payments and long-term, multi-yearshare-based compensation plans amounted to €0.8m in the firsthalf of 2018 compared with €2.3m in the first half of 2017 andmainly related to free-share plans set up on March 11, 2015,June 1, 2016 and April 28, 2017 (see note 7.4 "Personnel cost" ofinterim condensed consolidated financial statements).
Amortization of intangibles arising from business combinationsIn the first half of 2018, amortization of intangibles arising frombusiness combinations mainly related to fixed-term intangibleassets recognised upon the allocation of the Aricent purchaseprice of €24.4m.
Restated for this expense, amortization primarily related tocustomer relations recognised for acquisitions made in previousfinancial years. These amounted to €2.0m, compared with €2.2min the first half of 2017.
Non-recurring operating income and expensesOver the period, non-recurring operating income and expensescomprised (see also note 7.6 "Non-recurring operating incomeand expenses" of interim condensed consolidated financialstatements):
acquisition-related costs of €27.5m (compared with €2.6m forj
the first half of 2017), including an expense of €31.6m forAricent and income of €5.0m relating to confirmation, in the firsthalf of 2018, of the successful outcome of a dispute over aprevious acquisition;a net impact of -€14.8m for restructuring plans (compared withj
-€7.3m for the first half of 2017); anddisputes and other non-recurring expenses of €0.4mj
(compared with €1.6m in the first half of 2017).
Net income2.1.1.5Net financial expensesOver the period, net financial expenses break down as follows:
(in millions of euros) 1st half of 2018 1st half of 2017
Interest expenses on borrowings (25.2) (4.3)
Other interest income and expenses 0.3 (2.0)
Cost of net financial debt (24.9) (6.3)
Other financial items (28.9) (7.8)NET FINANCIAL EXPENSES (53.8) (14.1)
In the first half of 2018 the Cost of net financial debt rose by€18.6m (increasing from €6.3m to €24.9m).
The Cost of net financial debt in the first half of 2018 related:
to interest income of €1.4m (almost unchanged from the firstj
half of 2017), from the investment of cash and cashequivalents; and
to bond-related interest expense and the cost of other financingj
operations amounting to €26.3m (compared with €7.8m in thefirst half of 2017), primarily comprising:
interest and expense relating to the Bridge Facility repaid in-the first half and amounting to €3.1m,interest and expense relating to the bond repaid over the-period amounting to €2.4m,

2
HALF-YEAR ACTIVITY REPORT
Group performance
11ALTRAN ____ Interim financial report 2018
amortised interest and expense relating to the €18.6m Term-Loan B taken out over the period,amortised interest and expense relating to the €1.0m-Revolving Credit Facility subscribed for over the period, andinterest on factoring transactions amounting to €1.0m.-
Other financial income and expenses changed as follows:
Other financial income was up €4.0m over the period, rising from€1.8m for the first half of 2017 to €5.8m for the first half of 2018.This increase was mainly due to the rise in foreign exchange gains(€5.4m in the first half of 2018 compared with €1.6m in the firsthalf of 2017).
Other financial expenses were up €25.2m (rising from a totalexpense of €9.6m for the first half of 2017 to a net expense of€34.8m for the first half of 2018).
The increase is mainly due to the following:
penalties for early repayment of the €17.2m bond;j
unamortised issue costs of €6.2m;j
foreign exchange losses of €7.0m (up from €4.4m in the firstj
half of 2017); andfinancial expense for discounting of €2.8m (up from €0.3m inj
the first half of 2017).Income taxTax expense on income before income taxes of €14.8m for thefirst half of 2018 stood at €5.0m after application of an estimatedeffective tax rate (TEI) for 2018 (including “secondary” taxes suchas the CVAE in France or the IRAP in Italy).
Net income (Group share) and earnings per shareIn the first half of 2018, net income (Group share) (includingresidual income from the disposal of the Utilities business in theUSA) was down €45.2m, falling from €54.7m to €9.5m. Earningsper share for the first half of 2018 stood at €0.05.

12 ALTRAN ____ Interim financial report 2018
2 HALF-YEAR ACTIVITY REPORT
Group performance
Analysis of income on ordinary activities (revenues) and 2.1.2operating margin by operating segment for the first half of 2018 and the first half of 2017
In accordance with IFRS 8, the Group discloses the segmentationof its business activity in line with internal management reportsreviewed by the Group’s Chief Operating Decision Maker(CODM).
Since January 1, 2018, the criterion used by the Group to assessperformance by operating segment has been the operatingmargin, as defined in note 2.1.1.3 "Operating margin" of thehalf-year activity report.
The Group’s operating segments for the period were as follows:
France: France, Luxembourg, Morocco and Tunisia;j
Europe: Germany, Austria, Belgium, Netherlands, Czechj
Republic, Romania, United Kingdom, Scandinavia, Slovakia,Switzerland, Spain, Italy, Portugal, Turkey;Americas: North and South America, India and Ukraine; andj
Asia: Asia and Oceania.j
“France” includes the operating subsidiaries and the Group’sheadquarters (with the management bodies and Group-wideservices).
The tables below provide a breakdown of revenues and operating margin by operating segment for the first half of 2018 and the firsthalf of 2017.
(in millions of euros)
1st half of 2018 1st half of 2017 *
VariationOrganicgrowth
Economicgrowth
Totalrevenues
% ofrevenues
Totalrevenues
% ofrevenues
France 484.5 35.3% 470.8 40.7% +2.9% +3.5% +4.3%
Europe 619.5 45.1% 594.9 51.4% +4.1% +5.7% +5.7%
Germany & Austria 144.5 10.5% 139.0 12.0% +4.0% +6.9% +7.1%
Iberia 130.2 9.5% 116.0 10.0% +12.2% +12.3% +12.1%
Italy 117.8 8.6% 108.9 9.4% +8.2% +8.1% +7.3%
Belgium & Netherlands 79.4 5.8% 84.0 7.3% -5.5% -4.9% -4.1%
United Kingdom 98.9 7.2% 94.0 8.1% +5.2% +3.7% +3.7%
Scandinavia 32.6 2.4% 36.0 3.1% -9.4% +3.1% +3.1%
Switzerland 16.1 1.2% 17.0 1.5% -5.3% +3.1% +3.9%
Americas 252.2 18.4% 77.1 6.7% +227.1% +10.5% +9.7%
Asia 16.5 1.2% 15.2 1.3% +8.6% -2.3% -3.5%TOTAL 1,372.7 100% 1,158.0 100% +18.5% +5.0% +5.2%
2017 data were restated for the impact of IFRS 15 (see note 5 “Year-on-year comparability” of interim condensed consolidated financial statements).*
(in millions of euros)
1st half of 2018 1st half of 2017 *
France Europe Americas Asia Group France Europe Americas Asia Group
REVENUES 484.5 619.5 252.2 16.5 1,372.7 470.8 594.9 77.1 15.2 1,158.0
% of revenues 35.3% 45.1% 18.4% 1.2% 100.0% 40.7% 51.4% 6.7% 1.3% 100.0%
OPERATING MARGIN 55.2 47.4 36.0 (0.1) 138.5 55.2 47.3 4.8 0.2 107.5
Operating margin (%) 11.4% 7.7% 14.3% -0.6% 10.1% 11.7% 8.0% 6.2% 1.3% 9.3%2017 data were restated for the impact of IFRS 15 (see note 5 “Year-on-year comparability” of interim condensed consolidated financial statements).*

2
HALF-YEAR ACTIVITY REPORT
Group performance
13ALTRAN ____ Interim financial report 2018
France2.1.2.1In the first half of 2018, the Group’s consolidated revenuesgenerated in France was up €13.7m (or +2.9%), rising from€470.8m to €484.5m, or economic growth of 4.3%. The maingrowth sectors were Aerospace, Defence & Rail, as well as Energy,Industry and Life Sciences, as a result of clients and partners’strong growth in these industries.
Altran continued its “nearshoring” development strategy in theAutomotive segment in Morocco and continued to increase itsdiversification ability, particularly in Aeronautics.
The contribution of France to consolidated Group revenues overthe period fell from 40.7% to 35.3% due to the Group’sinternational acquisition strategy and, in particular, the acquisitionof Aricent in the first half of 2018.
The operating margin in France was stable in the first half of 2018at €55.2m. It had, however, fallen by 30 basis points, droppingfrom 11.7% in the first half of 2017 to 11.4% in the first half of2018, reflecting an ambitious recruitment campaign to promotelong-term revenues growth in the region.
Europe2.1.2.2In the first half of 2018, the Group’s consolidated revenues was up€24.6m (or +4.1%), rising from €594.9m to €619.5m, or economicgrowth of 5.7%. Growth also included a scope impact of €5.3m (or+€0.9%) relating to the half-year contribution made byInformation Risk Management (IRM) in the United Kingdom,having been consolidated on August 1, 2017.
Europe’s contribution to the Group’s consolidated revenuesdropped over the period, falling from 51.4% in the first half of2017 to 45.1% in the first half of 2018.
Growth in Europe was primarily driven by trends in SouthernEuropean countries:
in Italy, the positive upturn recorded in 2017 continued into thej
first half of 2018 and was reflected by economic growth of 7.3%as a result, in particular, of signing major Communications andFinance and Public Sector contracts;in Iberia, economic growth of 12.1% was recorded, driven byj
growth in the Aeronautics industry in Spain and in theCommunications sector in Portugal.
In a German market that is always highly competitive, Altranrecorded sustained economic growth of 7.1% due, in particular, towinning a major Automotive industry contract.
In the United Kingdom, Altran performed well in the Aeronauticsand Automotive sectors, driven by multi-year projects withinternational operators.
Recruitment difficulties impacted business in Belgium and in theNetherlands. Action plans designed to revive growth are beingimplemented in these countries.
Between the first half of 2017 and the first half of 2018, theoperating margin increased by €0.1m (or +0.2%), rising from€47.3m to €47.4m, despite increased price pressure as a result ofa more competitive climate in Europe.
Americas2.1.2.3The Americas region mainly comprises the United States and Indiasince their performances must be interpreted together, as a largenumber of US projects are carried out in India.
In the first half of 2018, the Group’s revenues for the Americasregion was up €175.1m, rising from €77.1m to €252.2m, oreconomic growth of 9.7%. The region’s growth includes a scopeimpact of €176.0m corresponding to Aricent’s contribution sincethe acquisition date on March 20, 2018, and to a lesser extent, tothe whole half-year contribution made by Pricol Technologies andGlobal Edge Software, consolidated, respectively, fromFebruary 1, 2017 and from October 1, 2017.
These acquisitions increased the contribution made by theAmericas region to the Group’s consolidated revenues over theperiod, rising from 6.7% to 18.4%.
On a like-for-like basis, the region benefited from strong growth insemiconductor equipment manufacturing with the Group’s largeinternational clients. India is an important growth driver in thissector, because clients often outsource entire branches of theirdevelopment processes, as well as verification and approvaltesting. After an unfavourable economic cycle, Altran’s business inthe United States recorded a positive economic growth driven bythe Group’s fierce competitiveness due to its “nearshore” base inUkraine.
The Americas region operating margin increased by €31.2m overthe half year, rising from €4.8m to €36.0m. The changes inperimeter, especially Aricent acquisition, made a majorcontribution to the profitability of the Americas region and, morewidely, the profitability of the Altran group.
Asia2.1.2.4In the first half of 2018 revenues for the Asia region were up€1.3m (or +8.6%), rising from €15.2m in 2017 to €16.5m in 2018,but recorded negative economic growth of 3.5%.
Business in China suffered in the Automotive sector, but madesignificant gains in the Communications sector.
Between the first half of 2017 and the first half of 2018, theoperating margin fell by €0.3m, dropping from €0.2m to -€0.1m.The region’s profitability was impacted by costs incurred tosupport long-term business growth.

14 ALTRAN ____ Interim financial report 2018
2 HALF-YEAR ACTIVITY REPORT
Group financial structure
Group financial structure2.2 __The main financing requirements of the Group consist of workingcapital requirement, capital expenditure (particularly relating toacquisitions), payment of interest expenses on loans andrepayment of these loans.
operating performance, which to some extent depends oneconomic, financial, competitive, market, regulatory and otherfactors. The majority of these factors are beyond the Group’scontrol. The Group uses its cash and cash equivalents to financeits daily funding requirements. The Group’s cash is denominatedThe Group’s main source of regular liquidity consists of its cash in euros.flows from operating activities. The Group’s ability to generate
future cash flows from operating activities will depend on its future
Consolidated cash flows2.2.1
The table below provides a summary of the Group’s cash flows for the first half of 2018 and the first half of 2017.
(in millions of euros) 1st half of 2018 1st half of 2017
Cash flows before net interest expenses and taxes 139.0 96.7
Change in working capital requirement (177.6) (72.7)
NET OPERATING CASH FLOWS (38.6) 24.0
NET CASH FLOWS FROM OPERATING ACTIVITIES (167.3) 15.9
NET CASH FLOWS FROM INVESTING ACTIVITIES (1,838.8) (63.7)
NET CASH FLOWS FROM FINANCING ACTIVITIES 1,861.2 (32.1)
Net cash flows from operating 2.2.1.1activities (including net interest paid)
Net cash flows from operating activities were down €183.2mbetween the first half of 2017 and the first half of 2018, at-€167.3m (compared with €15.9m in 2017).
The change is mainly due to the following:
cash flows before net interest expenses and taxes (defined asj
operating income, plus goodwill impairment and amortizationof intangibles arising from business combinations, depreciation,amortization and net operating provisions, income andexpenses relating to share-based payments, gains or losses ondisposals, and other income and expense) of €139.0m, up€42.3m on the first half of 2017;a decline of -€104.9m in working capital requirement over thej
period can mainly be explained by a decrease in trade andother payables of €-29.1m during the first semester of 2018(compared to €+5.5m over the same period in 2017), and bythe negative impact of important fixed-price projects for whichinvoice milestones are usually defined in the initial contract; andnet interest paid (€25.0m, up €23.2m on the same period inj
2017) corresponding to funding of the acquisition of Aricent inthe first half of 2018, the cash impact of other financial incomeand expenses of €83.2m, corresponding to interest on the earlyrepayment of bond loans and taxes paid (€20.1m, or up €7.1mon the first half of 2017).
Net cash flows from investing 2.2.1.2activities
A significant part of the Group’s cash flows is used to financecapital expenditure, which mainly comprises investments in thefollowing:
scope of consolidation changes (-€1,765.5m over the period)j
mainly corresponding to the acquisition of Aricent (includingrelated costs);property, plant and equipment: the most significant investmentsj
made in the first half of 2018 relate to the extension ofCambridge Consultants’ premises amounting to €10.2m and, toa lesser extent, to the acquisition of office and computerequipment and furniture in the different countries where theGroup operates;intangible assets: in line with the first half of 2017, the Groupj
has been investing, in particular, in an innovative, open softwareplatform for the next generation of intelligent vehicles andmachines (in partnership with Jaguar and Land Rover), in tooland method development projects relating to productdevelopment cycles as part of multi-sector R&D in Spain, and inthe development of platforms, products and solutions relatingto the Internet of Things (IoT) in France. The development androllout of ERP and ERM software, has also contributed to capitalexpenditure in intangible assets.
Cash flows used in investing activities in the first half of 2018amounted to -€1,838.8m, up €1,775.1m on the same period in2017.

2
HALF-YEAR ACTIVITY REPORT
Group financial structure
15ALTRAN ____ Interim financial report 2018
Net cash flows from financing 2.2.1.3activities
Cash amount from financing activities is mainly related to thefunding of the acquisition of Aricent, as reported in chapter 1“Significant events over the period”.
In the first half of 2018, net cash flows from financing activitiesstood at €1,861.2m (compared with -€32.1m for the first half of2017) and comprised:
proceeds from new loans of €2,136.3m, including the drawingj
of Term Loan B net of loan issue costs of €2,077.4m;
the capital increase finalised on April 17, 2018 for €718.8m net;j
-€751.5m in loan payments, including repayment of the balancej
of the outstanding bond loan (-€249.4m) and part of TermLoan B (-€497.5m) following the capital increase;-€60.9m in dividend payments in the first half of 2018j
(compared with -€41.5m in the first half of 2017);other flows from financing operations amounting to -€181.4m,j
including the repayment of -€149.4m in relation to commercialpapers.
Free Cash Flow2.2.2
Free Cash Flow is an alternative indicator used by the Company tomeasure performance. The definition has changed and now refersto the cash flow generated by Group operations after payment oftaxes, investments needed by the Company to carry out itsbusiness, and payment of net interest. It represents the cash flowavailable to repay debt, pay out dividends or carry out specifictransactions, in particular growth-related operations.
Free Cash Flow is calculated as follows: operating margin plusdepreciation, amortization and net operating provisions pluscurrent income and expense with no cash impact plusnon-recurring income and expense with a cash impact, plus/minuschanges in working capital requirement, minus capitalexpenditure necessary for operations, net of disposals, minus netinterest and financial expense paid, minus tax paid.
Free Cash Flow is broken down as follows:
(in millions of euros) 1st half of 2018 1st half of 2017 * Variation
Operating margin 138.5 107.5 31.0
Depreciation, amortization and changes in provisions 25.1 11.3 13.8
Non-cash P&L items (0.2) (3.6) 3.4
Non recurring items (cash impact) (24.4) (18.5) (5.9)
Cash flows before net interest expenses and taxes 139.0 96.7 (42.3)
Change in working capital requirement (168.8) (63.0) (105.8)
Capital expenditures (69.4) (28.5) (40.9)
o/w payments of large software deals (32.0) 0.0 (32.0)
Net interest and financial expense paid (105.5) (5.9) (99.6)
Tax paid (20.1) (13.0) (7.1)
FREE CASH FLOW (224.8) (13.7) (211.1)
% of revenues -16.4% -1.2% +15.2 pt* 2017 data were restated for the impact of IFRS 15 (see note 5 “Year-on-year comparability” of interim condensed consolidated financial statements).

16 ALTRAN ____ Interim financial report 2018
2 HALF-YEAR ACTIVITY REPORT
Outlook
Group net debt2.2.3
Group net debt at June 30, 2018 and at June 30, 2017 is shown in the table below:
(in millions of euros) 06/30/2018 12/31/2017 Variation
Bonds 0.0 253.3 (253.3)
Long-term credit line 1,593.3 1.2 1,592.1
Short-term credit line 312.5 469.5 (157.0)
o/w factoring 54.5 63.0 (8.5)
Gross financial debt 1,905.8 724.0 1,181.8
Cash and cash equivalent 208.2 372.9 (164.7)NET DEBT 1,697.6 351.1 1,346.5
The analysis of net debt by categories and by contractual annualmaturity is descried in note 6.12 "Net debt" of interim condensedconsolidated financial statements.
The table below shows the change in Group net debt in the firsthalf of 2018 and the first half of 2017.
(in millions of euros) 1st half of 2018 1st half of 2017
Free Cash Flow (224.8) (13.7)
Financial Investments / Divestments (1.2) (2.6)
Net cash flows from acquisitions (1,768.5) (32.1)
Capital increase 718.8 0.0
Dividends (60.9) (41.5)
Share buy-back 0.1 (1.0)
Discontinued operations (0.2) 6.6
Change in Factoring (23.6) (76.5)
Others 13.8 (14.3)NET DEBT VARIATION (1,346.5) (175.1)
In the first half of 2018, Group net debt rose by €1,346.5m(increasing from €351.1m at December 31, 2017 to €1,697.6m atJune 30, 2018).
This change was mainly due to external financing for theacquisition of Aricent as reported in chapter 1 “Significant eventsover the period”.
Outlook2.3 __The Altran Group had announced medium-term outlook when its strategic plan The High Road, Altran 2022 was presented onJune 28, 2018.
Other information2.4 __Financial risk monitoring, related-party disclosures and scope of consolidation changes are described in the notes to the interimcondensed consolidated financial statements. Operational risks are described in the 2017 Registration Document, in chapter 2.1 “Riskfactors”.

17ALTRAN ____ Interim financial report 2018
3_ INTERIM CONDENSED CONSOLIDATED FINANCIAL STATEMENTS AT JUNE 30, 2018
CONSOLIDATED BALANCE SHEET1 18
CONSOLIDATED INCOME STATEMENT2 20
CONSOLIDATED STATEMENT OF COMPREHENSIVE INCOME3 21
CONSOLIDATED STATEMENT OF CHANGES IN SHAREHOLDERS’ 4EQUITY 22
CONSOLIDATED STATEMENT OF CASH FLOWS5 23
EXPLANATORY NOTES6 25Accounting policiesNote.1 25Scope of consolidationNote.2 26Seasonal nature of the activityNote.3 26Risks and uncertaintiesNote.4 26Year-on-year comparabilityNote.5 27Notes relating to certain balance sheets itemsNote.6 30Notes to the income statementNote.7 43Follow-up of significant litigation and contingent liabilitiesNote.8 49Off-balance sheet commitmentsNote.9 49Information on related partiesNote.10 49Events subsequent to the reporting dateNote.11 49

18 ALTRAN ____ Interim financial report 2018
3 INTERIM CONDENSED CONSOLIDATED FINANCIAL STATEMENTS AT JUNE 30, 2018
Consolidated balance sheet
Consolidated balance sheet1 _
(in thousands of euros) Notes
June 2018 Dec. 2017 *
Gross value
Amort. and Prov.
Net Value
Net value
Net Goodwill 6.1 2,470,151 (188,444) 2,281,707 901,762
Intangible assets 6.2 917,421 (168,817) 748,604 89,989
Land and buildings 67,043 (8,526) 58,517 41,336
Other property, plant and equipment 260,425 (179,418) 81,007 50,851
Property, plant and equipment 6.3 327,468 (187,944) 139,524 92,187
Non-current financial assets 6.4 60,046 (4,015) 56,031 39,239
Deferred tax assets 7.9 118,498 (17,803) 100,695 96,231
Non-current tax assets 6.5 158,763 (96) 158,667 117,245
Other non-current assets 6.5 23,615 (5,150) 18,465 4,766
TOTAL NON-CURRENT ASSETS 4,075,962 (572,269) 3,503,693 1,341,419
Inventory and work in progress 6.6 2,178 (33) 2,145 2,086
Advances to suppliers 2,211 - 2,211 303
Trade receivables and related accounts 6.7 452,665 (8,014) 444,651 357,901
Other receivables 6.9 322,142 (427) 321,715 134,869
Trade accounts and other receivables 777,018 (8,441) 768,577 493,073
Assets linked to customer contracts 6.8 289,600 - 289,600 128,432
Current financial assets 6.10 11,742 (505) 11,237 12,954
Cash equivalents 6.12 5,911 - 5,911 203,911
Cash 6.12 202,243 - 202,243 169,015
TOTAL CURRENT ASSETS 1,288,692 (8,979) 1,279,713 1,009,471
TOTAL ASSETS 5,364,654 (581,248) 4,783,406 2,350,8902017 data were restated for the impact of IFRS 15 (see note 5).*

3
INTERIM CONDENSED CONSOLIDATED FINANCIAL STATEMENTS AT JUNE 30, 2018
Consolidated balance sheet
19ALTRAN ____ Interim financial report 2018
(In thousands of euros) Notes June 2018 Dec. 2017
Capital 6.11 128,511 87,900
Share premium 1,040,350 351,331
Reserves attributable to parent company shareholders 458,294 399,286
Foreign currency translation reserve 13,767 (48,678)
Net income for the year 9,493 130,768
Non-controlling interests (51,188) (30,100)
Shareholder’s equity 1,599,227 890,507
Bank loans and borrowings (> 1 year) 1,595,540 7
Other non-current financial liabilities (2,223) 1,180
Non-current financial liabilities 6.12 1,593,317 1,187
Non-current provisions for contingencies and liabilities 6.13 89,034 47,661
Non-current employee benefits 6.14 61,077 38,941
Non-current liabilities for fixed assets 6.16 66,845 93
Deferred tax liabilities 7.9 174,022 19,270
Non-current liabilities for securities 6.17 - 32,853
Other long-term liabilities 15,393 5,579
Other non-current liabilities 406,371 144,397
TOTAL NON-CURRENT LIABILITIES 1,999,688 145,584
Trade payables and related accounts 6.15 162,058 135,918
Taxes payable 222,892 111,087
Current employee benefits 6.14 251,553 214,464
Current liabilities for fixed assets 6.16 71,402 4,277
Other current liabilities 8,282 6,550
Trade accounts and other payables 716,187 472,296
Liabilities linked to customer contracts 81,481 96,389
Provisions for short-term risks and charges 6.13 17,538 17,056
Current liabilities for securities 6.17 56,809 6,249
Current financial liabilities 6.12 312,476 722,809
Other current liabilities 386,823 746,114
TOTAL CURRENT LIABILITIES 1,184,491 1,314,799
TOTAL SHAREHOLDERS’ EQUITY AND LIABILITIES 4,783,406 2,350,8902017 data were restated for the impact of IFRS 15 (see note 5).*
20 ALTRAN ____ Interim financial report 2018
3 INTERIM CONDENSED CONSOLIDATED FINANCIAL STATEMENTS AT JUNE 30, 2018
Consolidated Income Statement
Consolidated Income Statement2 _
(in thousands of euros) Notes June 2018 Dec. 2017 * June 2017 *
Revenues 7.1 & 7.2 1,372,691 2,295,257 1,158,011
Other income from operations 37,126 69,412 30,073
REVENUES FROM ORDINARY OPERATIONS 1,409,817 2,364,669 1,188,084
Cost of goods and services sold (18,948) (36,377) (19,196)
Change in work in progress 358 912 (149)
External expenses 7.3 (272,741) (455,057) (227,688)
Personnel costs salaries 7.4 (948,041) (1,605,116) (815,393)
Personnel costs – share-based payments and similar 7.4 (1,951) (2,309) (1,612)
Taxes and duties (2,253) (2,879) (2,032)
Depreciation, amortization and net provisions 7.5 (21,344) (7,333) (11,904)
Other operating expenses (7,193) (10,165) (4,926)
Amortization of intangibles arising from business combinations (26,421) (4,263) (2,171)
OPERATING INCOME ON ORDINARY ACTIVITIES 111,283 242,082 103,013
Other non-recurring operating income 10,069 22 26
Other non-recurring operating expenses (52,733) (39,029) (11,551)
Other non-recurring operating income and expenses 7.6 (42,664) (39,007) (11,525)
Goodwill impairment
OPERATING INCOME 68,619 203,075 91,488
Income from cash and cash equivalents 1,418 2,808 1,456
Cost of gross financial debt (26,316) (14,590) (7,793)
Cost of net financial debt 7.7 (24,898) (11,782) (6,337)
Other financial income 7.8 5,803 9,216 1,821
Other financial expenses 7.8 (34,770) (17,594) (9,566)
Tax expenses/income 7.9 (5,016) (42,780) (23,091)
Share of net income of associates (414) (191)
NET INCOME BEFORE DISCONTINUED OPERATIONS 9,738 139,721 54,124
Net profit/loss on discontinued operations 7.10 (173) (8,885) 564
NET INCOME 9,565 130,836 54,688
Non-controlling interests (72) (68) -
NET INCOME ATTRIBUTABLE TO THE GROUP 9,493 130,768 54,688
Earnings per share (in euros) 0.05 0.76 0.32
Diluted earnings per share (in euros) 0.05 0.77 0.32
Earnings per share on continuiting activities (in euros) 0.05 0.81 0.31
Diluted earnings per share on continuiting activities (in euros) 0.05 0.82 0.32
Eranings per share on discontinued operation (in euros) -0.00 -0.05 0.00
Diluted earnings per share on discontinued operation (in euros) -0.00 -0.05 0.002017 data were restated for the impact of IFRS 15 (see note 5).*

3
INTERIM CONDENSED CONSOLIDATED FINANCIAL STATEMENTS AT JUNE 30, 2018
Consolidated Statement of Comprehensive Income
21ALTRAN ____ Interim financial report 2018
Consolidated Statement of Comprehensive 3 _Income
(In thousands of euros) June 2018 Dec. 2017 June 2017
CONSOLIDATED NET INCOME 9,565 130,836 54,688
Financial instruments (1,871) 630 352
Exchange rate differences 54,916 (32,761) (19,646)
Other comprehensive income net of tax that may subsequently be reclassified to profit 53,045 (32,131) (19,294)
Employee benefits – Revised IAS 19 - 1,105 -
Other comprehensive income net of tax that will not be reclassified to profit - 1,105 -
Other comprehensive income for the year, net of tax 53,045 (31,026) (19,294)
TOTAL COMPREHENSIVE INCOME FOR THE YEAR 62,610 99,810 35,394
o/w attributable to:
owners of the Groupj 61,539 100,142 35,538
Non-controlling interestsj 1,071 (332) (144)
(in thousands of euros)
June 2018 Dec. 2017 June 2017
Pre-tax Tax Net Pre-tax Tax Net Pre-tax Tax Net
Financial instruments (2,522) 651 (1,871) 960 (330) 630 537 (185) 352
Exchange rate differences 63,963 (9,047) 54,916 (36,998) 4,237 (32,761) (23,089) 3,443 (19,646)
Other comprehensive income net of tax that may subsequently be reclassified to profit 61,441 (8,396) 53,045 (36,038) 3,907 (32,131) (22,552) 3,258 (19,294)
Employee benefits – Revised IAS 19 - - - (1,105) 2,210 1,105 - - -
Other comprehensive income net of tax that will not be reclassified to profit - - - (1,105) 2,210 1,105 - - -
OTHER COMPREHENSIVE INCOME FOR THE YEAR 61,441 (8,396) 53,045 (37,143) 6,117 (31,026) (22,552) 3,258 (19,294)

22 ALTRAN ____ Interim financial report 2018
3 INTERIM CONDENSED CONSOLIDATED FINANCIAL STATEMENTS AT JUNE 30, 2018
Consolidated Statement of Changes in Shareholders’ Equity
Consolidated Statement of Changes in 4 _Shareholders’ Equity
(in thousands of euros)Number of
shares Capital Premium Resources
Change infair value
& other
Exchangerate
differences Net profit
TotalGroupshare
Minorityinterests Total
DECEMBER 31, 2016 172,699,074 87,900 392,306 271,588 (630) (12,223) 122,483 861,426 913 862,339
Comprehensive income for the year - - - 3,443 352 (22,945) 54,688 35,538 (144) 35,394
Capital increase - - - - - - - - 2,022 2,022
Share-based payments - - 1,612 - - - - 1,612 - 1,612
Change in treasury shares (36,382) - (905) - - - - (905) - (905)
Net income appropriation - - - 122,483 - - (122,483) - - -
Dividends paid - - (41,459) - - - - (41,459) - (41,459)
Other changes - - - 39 - - - 39 244 283
JUNE 30, 2017 172,662,692 87,900 351,554 397,553 (278) (35,168) 54,688 856,251 3,035 859,286
Comprehensive income for the year - - - 1,899 278 (13,653) 76,080 64,604 (188) 64,416
Capital increase - - - - - - - - (148) (148)
Share-based payments - - 440 - - - - 440 - 440
Change in treasury shares (68,268) - (662) - - - - (662) - (662)
Net income appropriation - - - - - - - - - -
Dividends paid - - (1) - - - - (1) - (1)
Other changes - - - (168) - 143 - (25) (32,799) (32,824)
DECEMBER 31, 2017 172,594,424 87,900 351,331 399,284 - (48,678) 130,768 920,607 (30,100) 890,507
Comprehensive income for the year - - - (9,047) (1,871) 62,964 9,493 61,539 1,071 62,610
Capital increase 81,220,840 40,611 688,348 - - - - 728,959 - 728,959
Share-based payments - - 689 - - - - 689 - 689
Change in treasury shares (6,508) - (17) - - - - (17) - (17)
Net income appropriation - - - 130,768 - - (130,768) - - -
Dividends paid - - - (60,914) - - - (60,914) - (60,914)
Other changes - - - 70 - (518) - (448) (22,159) (22,607)
JUNE 30, 2018 253,808,756 128,511 1,040,351 460,161 (1,871) 13,768 9,493 1,650,415 (51,188) 1,599,227

3
INTERIM CONDENSED CONSOLIDATED FINANCIAL STATEMENTS AT JUNE 30, 2018
Consolidated Statement of Cash flows
23ALTRAN ____ Interim financial report 2018
Consolidated Statement of Cash flows5 _
(in thousands of euros) June 2018 Dec. 2017 June 2017
OPERATING INCOME FROM CONTINUING ACTIVITIES 68,619 203,075 91,489
Goodwill impairment and amortization of customer-relationship intangible assets 26,421 4,263 2,171
OPERATING INCOME BEFORE GOODWILL IMPAIRMENT 95,040 207,338 93,660
Depreciation, amortization and net operating provisions 11,944 10,286 3,051
Income and expenses relating to share-based payments 689 2,309 1,612
Gains or losses on disposals 42 (233) 278
Other gains and charges 31,272 5,476 (1,928)
CASH FLOWS BEFORE NET INTEREST EXPENSES AND TAXES 138,987 225,176 96,673
Change in inventory and work in progress (448) (341) 73
Change in trade accounts and other receivables (148,068) (24,139) (78,268)
Change in trade accounts and other payables (29,121) 19,852 5,505
Change in working capital requirement (177,637) (4,628) (72,690)
NET CASH FLOWS FROM OPERATIONS (38,650) 220,548 23,983
Interest paid (26,455) (12,709) (3,299)
Interest received 1,420 2,797 1,454
Tax paid (20,104) (44,866) (12,998)
Cash impact of other financial income and expenses (83,242) (1,773) 126
Net cash flows from discontinued operations (248) (2,966) 6,660
NET CASH FLOWS FROM OPERATING ACTIVITIES (167,279) 161,031 15,926
Cash outflows for acquisitions of property, plant & equipment and intangible assets (69,431) (57,973) (28,679)
Proceeds from disposals of property, plant & equipment and intangible assets 44 436 142
Cash outflows for acquisitions of financial assets (unconsolidated investments) (1,242) (2,801) (2,575)
Proceeds from disposals of financial assets (unconsolidated investments) - 801 -
Earn-out disbursements 100 (425) -
Impact of scope-of-consolidation changes (1,765,505) (108,684) (31,044)
Dividend received 52
Change in loans and advances granted (2,888) (2,719) (2,313)
Other flows from investing activities 88 1,800 848
Net cash from investments made from discontinued operations - 104 (75)
NET CASH FLOWS FROM INVESTING ACTIVITIES (1,838,782) (169,461) (63,696)

24 ALTRAN ____ Interim financial report 2018
3 INTERIM CONDENSED CONSOLIDATED FINANCIAL STATEMENTS AT JUNE 30, 2018
Consolidated Statement of Cash flows
(in thousands of euros) June 2018 Dec. 2017 June 2017
Amounts received from shareholders during the capital increase 718,785 - -
Proceeds from the exercise of stock options - (257) -
Treasury share transactions (purchase/sales) 109 (1,646) (1,014)
Liquidity contract (170) 105 166
Dividends paid during the period (60,914) (41,460) (41,460)
Proceeds from new loans 2,136,280 874 -
Reimbursement of loans (751,522) (127,371) (89,089)
Other flows from financing activities (181,407) 81,557 99,295
Net cash from financing activities of from discontinued operations - - -
NET CASH FLOWS FROM FINANCING ACTIVITIES 1,861,161 (88,198) (32,102)
Impact of variations in exchange rates (20,900) (8,776) (3,495)
Impact of changes in accounting principles 1,028 - -
CHANGES IN NET CASH (164,772) (105,404) (83,367)
Opening cash balance 372,926 478,330 478,330
Closing cash balance 208,154 372,926 394,963
CHANGES IN NET CASH (164,772) (105,404) (83,367)
The reconciliation between the total amount of cash and cash equivalents in the balance sheet, and net cash and cash equivalents in thetable above, can be broken down as follows:
(in thousands of euros) June 2018 Dec. 2017 June 2017
Cash equivalents 5,911 203,911 254,036
Cash 202,243 169,015 140,927
NET CASH AND CASH EQUIVALENTS 208,154 372,926 394,963

3
INTERIM CONDENSED CONSOLIDATED FINANCIAL STATEMENTS AT JUNE 30, 2018
Explanatory notes
25ALTRAN ____ Interim financial report 2018
Explanatory notes6 _
Accounting policiesNote.1
Accounting policiesThe half-year consolidated financial statements at June 30, 2018are drawn up in accordance with the standard IAS 34 “InterimFinancial Information” which allows the presentation of a selectionof notes attached thereto. These half-year consolidated financialstatements must then be read together with the notes to theGroup’s consolidated financial statements at December 31, 2017included in the 2017 Registration Document filed with the Autoritédes marchés financiers (French Financial Markets Authority) onMarch 21, 2018 under number D18-0154.
The international accounting standards applied in the half-yearcondensed financial statements at June 30, 2018 are those thatare mandatory in the European Union on this date. The Group didnot apply, in advance, the standards, amendments to thestandards or interpretations whose application is not mandatory atJune 30, 2018.
Except for the impact of the new standards applicable fromJanuary 1, 2018, including IFRS 15 and IFRS 9, the accountingprinciples considered are identical to those used for preparing theconsolidated annual financial statements at December 31, 2017.
Use of estimatesAs indicated in paragraph 1.5 (chapter 6.2 – Consolidatedfinancial statements at December 31, 2017) on page 214 of the2017 Registration Document, the preparation of the Company’sfinancial statements requires the use of estimates andassumptions that may have an impact on the carrying amount ofcertain balance sheet and income statement items, as well as thedisclosures in certain notes to the financial statements. Altranregularly reviews these estimates and assessments to take intoaccount past experience and other factors considered relevantwith regard to the economic environment. Estimates, assumptionsand assessments are made based on available information or theactual situation when the financial statements are prepared.Consequently, they may subsequently differ from reality,especially considering persistent macro-economic uncertainties.
Estimates mainly concern provisions, assumptions used toprepare business plans for carrying out impairment tests on theGroup’s intangible assets presenting indications of loss of value,the recognition of deferred tax assets net of liabilities, long-termemployee benefits and the recognition of revenue fromfixed-priced contracts.
Impacts related to the entry of new standards, amendments and interpretationsIFRS 15The new standard IFRS 15 replaces IAS 18 – Revenue fromordinary operations and IAS 11 – Construction contracts, anddraws up a new model in five steps, which is applicable to incomefrom contracts concluded with clients.
As per this standard, applicable as of January 1, 2018, the incomeis recognised to reflect the transfer of goods and servicespromised to clients for amounts that reflect the consideration thatan entity expects to receive in exchange of these goods andservices.
In 2016, Altran set up a task force on IFRS 15 issues.
The transition project was coordinated by the Group’s teams andcomprised several phases. These included identifying contracttypes per country, raising awareness, training the financial, legaland operating teams in the countries concerned, and performingdiagnostics and analyses on complex contracts (the latter directlyby the country teams).
The main topics identified pursuant to IFRS 15 concerning Altran’sbusiness and which were subject of a specific analysis, are asfollows:
timing of revenue recognition (recognition at completion forj
certain contracts). No identified impact considering thefollowing elements (i) the majority of contracts are performedon a time and materials (T&M) basis, (ii) fixed-rate contracts aregenerally short-term in nature, (iii) the right to payment forperformance completed to date can generally be justified by(iii.1) the regular invoicing of services, and by (iii.2) the contractterms and local legislation;presentation of expenses (excluding margins) reinvoiced toj
customers, which must be presented under revenues inaccordance with IFRS 15 Under IAS 18, they were deductedfrom personnel costs. These expenses amounted to €12m forthe 2017 financial year (€6.1m at June 30, 2017);other specific areas for analysis, with no identified impact: costsj
of setting up significant contracts and accounting treatment ofthe transition phases at the beginning of contracts with no clientdeliverables, distinguishing between the agent and theprincipal in subcontracted and jointly-performed contracts;recognising license fees.
Altran has adopted the retroactive transition method for IFRS 15.As a result, the financial statements for 2018 are presented onlyunder the IFRS 15 standard and 2017 was restated.
IFRS 9Altran carried out an analysis on the quality of its client portfolioover the last 10 financial years. As Altran works with majorEuropean clients, the Group did not record substantial paymentlosses over the period analysed and therefore no IFRS 9 impactwas identified.
The Group resorted to exchange rate and interest rate hedginginstruments. The IFRS 9 recommendation on these instrumentswas taken into account in the method used to recognise the fairvalue.
Approval of the half-year financial statementsThe half-year consolidated financial statements at June 30, 2018were approved by the Board of Directors of Altran Technologieson September 5, 2018.

26 ALTRAN ____ Interim financial report 2018
3 INTERIM CONDENSED CONSOLIDATED FINANCIAL STATEMENTS AT JUNE 30, 2018
Explanatory notes
Scope of consolidationNote.2The consolidated financial statements include the financialstatements of Altran Technologies and its 118 subsidiaries. TheGroup fully consolidates all its subsidiaries.
Acquisitions: In the 1st half of 2018, Altran finalised the acquisitionof the Aricent Group.
The Group acquired full ownership of Aricent TechnologiesCayman on March 20, 2018 from a group of investors led by KKR.
The acquisition-related costs, amounting to €28.9m, have beenrecognised as non-recurring expenses.
Goodwill recognised in the financial statements amounts to€1,370.2m (including a €73.7m unrealised foreign currencytranslation loss).
Contributed balance-sheet items can be summarised as follows:fixed assets of €257.1m, non-current assets of €513.3m, trade andother receivables of €590.5m, cash amounting to €36.8m,non-current liabilities of €1,365.0m, and trade and other currentpayables of €674.5m.
The contribution of this acquisition, since March 20, 2018, to therevenue represents €162m, €3.0m as current operating income,€24.4m as amortisation of intangible rights from the businesscombination.
The completion of this transaction in March 2018 had a net impactof -€1,731.5m on the group’s cash flow of which:
-€896.0m as payment for the securities of Aricent Technologiesj
Cayman;-€822.9m as repayment for the pre-existing debt;j
-€49.4m as payment towards transaction costs;j
+€36.8m as net cash acquired on March 20, 2018.j
If the acquisition took place on January 1st, 2018, Aricent'scontribution to the group's main aggregates would have been:
revenues = €271.0m;j
current operating income = -€8.7m, including -€42.0m forj
amortization of the intangible rights arising from businesscombinations.
The Group is not in a position to provide accurate restated figuresbeyond the current operating income, in particular the netincome. The complexity and the numerous transactions to restatewould have required too much resource.
The contribution over 6 months corresponds to:
the contribution to the Group's consolidated financialj
statements since the acquisition date of March 20, 2018;the estimated contribution from 1 January to March 19, 2018.j
The estimated contribution of the Aricent group was based on thefollowing elements:
aggregates of Aricent over the period, corrected by changes inj
nature of expenses between current operating income andnon-recurring income;extrapolation of the impact of the allocation of the exercisej
price, taking into account:depreciation of the customer relationship,-depreciation of technologies,-amortization of backlogs,-amortization of insurance premiums,-changes in valuation of provisions for risks and charges.-
Merger: To streamline its consolidation scope, the Groupperformed a number of mergers, particularly in India, theNetherlands, Germany and the Czech Republic.
Seasonal nature of the activityNote.3The Group’s activity is not subject to seasonality and can be carried out in a relatively even manner between each half-year. Theprincipal factors that can have an impact are the number of working days (more in the second half-year compared to the first half-year)and leave taken.
Risks and uncertaintiesNote.4The risks and uncertainties have not changed significantly since the closing of the financial statements for the year ended December 31,2017 (pages 44 to 59 of the 2017 Registration Document), outside the acquired scope.

3
INTERIM CONDENSED CONSOLIDATED FINANCIAL STATEMENTS AT JUNE 30, 2018
Explanatory notes
27ALTRAN ____ Interim financial report 2018
Year-on-year comparabilityNote.5
IFRS 15: “Revenues from ordinary operations drawn from the contracts concluded 5.1with customers”
IFRS 15 is a mandatory standard applied to the financial years beginning on or after January 1, 2018. The Altran group has adopted theretroactive transition method for IFRS 15. As a result, the information presented for 2017 has been restated.
The expenses reinvoiced to customers, excluding margins, are now recognised under revenues in accordance with IFRS 15, whereasunder IAS 18, they were deducted from external costs.
For effects in figures, please refer to 5.2.
28 ALTRAN ____ Interim financial report 2018
3 INTERIM CONDENSED CONSOLIDATED FINANCIAL STATEMENTS AT JUNE 30, 2018
Explanatory notes
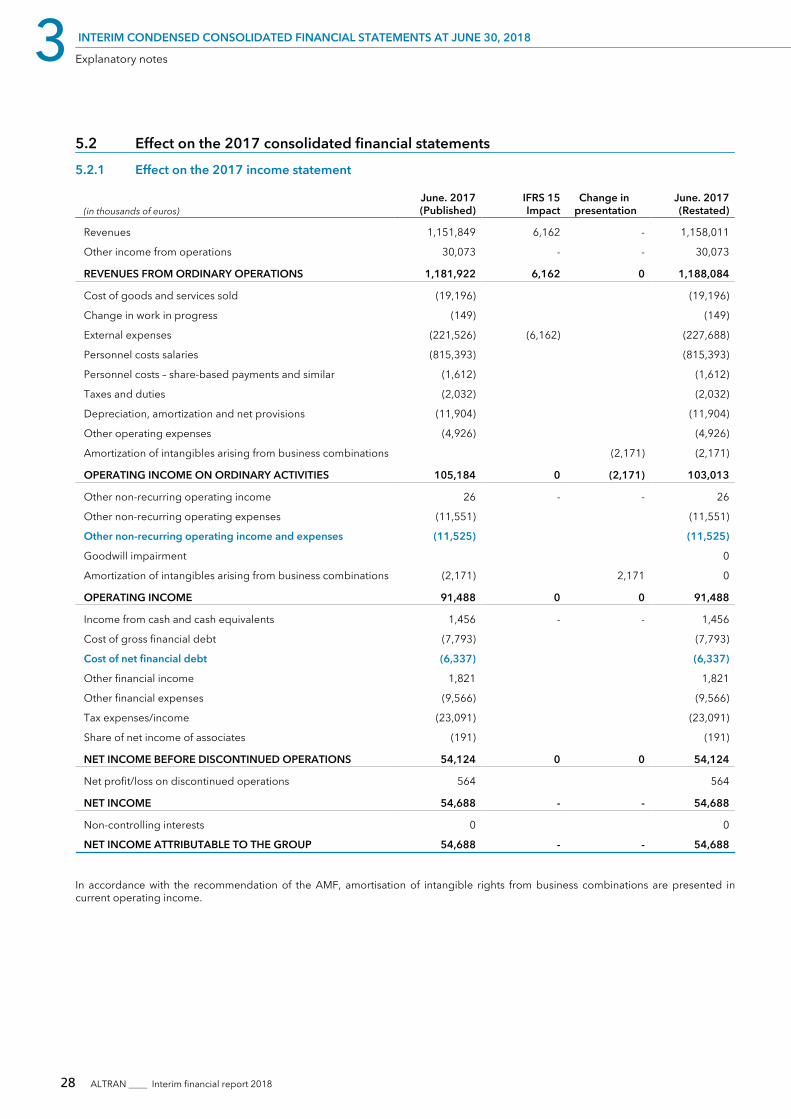
Effect on the 2017 consolidated financial statements5.2Effect on the 2017 income statement5.2.1
(in thousands of euros)June. 2017(Published)
IFRS 15 Impact
Change in presentation
June. 2017(Restated)
Revenues 1,151,849 6,162 - 1,158,011
Other income from operations 30,073 - - 30,073
REVENUES FROM ORDINARY OPERATIONS 1,181,922 6,162 0 1,188,084
Cost of goods and services sold (19,196) (19,196)
Change in work in progress (149) (149)
External expenses (221,526) (6,162) (227,688)
Personnel costs salaries (815,393) (815,393)
Personnel costs – share-based payments and similar (1,612) (1,612)
Taxes and duties (2,032) (2,032)
Depreciation, amortization and net provisions (11,904) (11,904)
Other operating expenses (4,926) (4,926)
Amortization of intangibles arising from business combinations (2,171) (2,171)
OPERATING INCOME ON ORDINARY ACTIVITIES 105,184 0 (2,171) 103,013
Other non-recurring operating income 26 - - 26
Other non-recurring operating expenses (11,551) (11,551)
Other non-recurring operating income and expenses (11,525) (11,525)
Goodwill impairment 0
Amortization of intangibles arising from business combinations (2,171) 2,171 0
OPERATING INCOME 91,488 0 0 91,488
Income from cash and cash equivalents 1,456 - - 1,456
Cost of gross financial debt (7,793) (7,793)
Cost of net financial debt (6,337) (6,337)
Other financial income 1,821 1,821
Other financial expenses (9,566) (9,566)
Tax expenses/income (23,091) (23,091)
Share of net income of associates (191) (191)
NET INCOME BEFORE DISCONTINUED OPERATIONS 54,124 0 0 54,124
Net profit/loss on discontinued operations 564 564
NET INCOME 54,688 - - 54,688
Non-controlling interests 0 0
NET INCOME ATTRIBUTABLE TO THE GROUP 54,688 - - 54,688
In accordance with the recommendation of the AMF, amortisation of intangible rights from business combinations are presented incurrent operating income.

3
INTERIM CONDENSED CONSOLIDATED FINANCIAL STATEMENTS AT JUNE 30, 2018
Explanatory notes
29ALTRAN ____ Interim financial report 2018
(in thousands of euros)Dec. 2017
(Published)IFRS 15 Impact
Change in presentation
Dec. 2017(Restated)
Revenues 2,282,195 13,062 - 2,295,257
Other income from operations 69,412 - - 69,412
REVENUES FROM ORDINARY OPERATIONS 2,351,607 13,062 0 2,364,669
Cost of goods and services sold (36,377) (36,377)
Change in work in progress 912 912
External expenses (441,995) (13,062) (455,057)
Personnel costs salaries (1,605,116) (1,605,116)
Personnel costs – share-based payments and similars (2,309) (2,309)
Taxes and duties (2,879) (2,879)
Depreciation, amortization and net provisions (7,333) (7,333)
Other operating expenses (10,165) (10,165)
Amortization of intangibles arising from business combinations 0 (4,263) (4,263)
OPERATING INCOME ON ORDINARY ACTIVITIES 246,345 0 (4,263) 242,082
Other non-recurring operating income 22 - - 22
Other non-recurring operating expenses (39,029) (39,029)
Other non-recurring operating income and expenses (39,007) (39,007)
Goodwill impairment 0 0
Amortization of intangibles arising from business combinations (4,263) 4,263 0
OPERATING INCOME 203,075 0 0 203,075
Income from cash and cash equivalents 2,808 - - 2,808
Cost of gross financial debt (14,590) (14,590)
Cost of net financial debt (11,782) (11,782)
Other financial income 9,216 - - 9,216
Other financial expenses (17,594) (17,594)
Tax expenses/income (42,780) (42,780)
Share of net income of associates (414) (414)
NET INCOME BEFORE DISCONTINUED OPERATIONS 139,721 0 0 139,721
Net profit/loss on discontinued operations (8,885) 0 0 (8,885)
NET INCOME 130,836 - - 130,836
Non-controlling interests (68) (68)
NET INCOME ATTRIBUTABLE TO THE GROUP 130,768 - - 130,768
In accordance with the recommendation of the AMF, amortisation of intangible rights from business combinations are presented incurrent operating income.
30 ALTRAN ____ Interim financial report 2018
3 INTERIM CONDENSED CONSOLIDATED FINANCIAL STATEMENTS AT JUNE 30, 2018
Explanatory notes
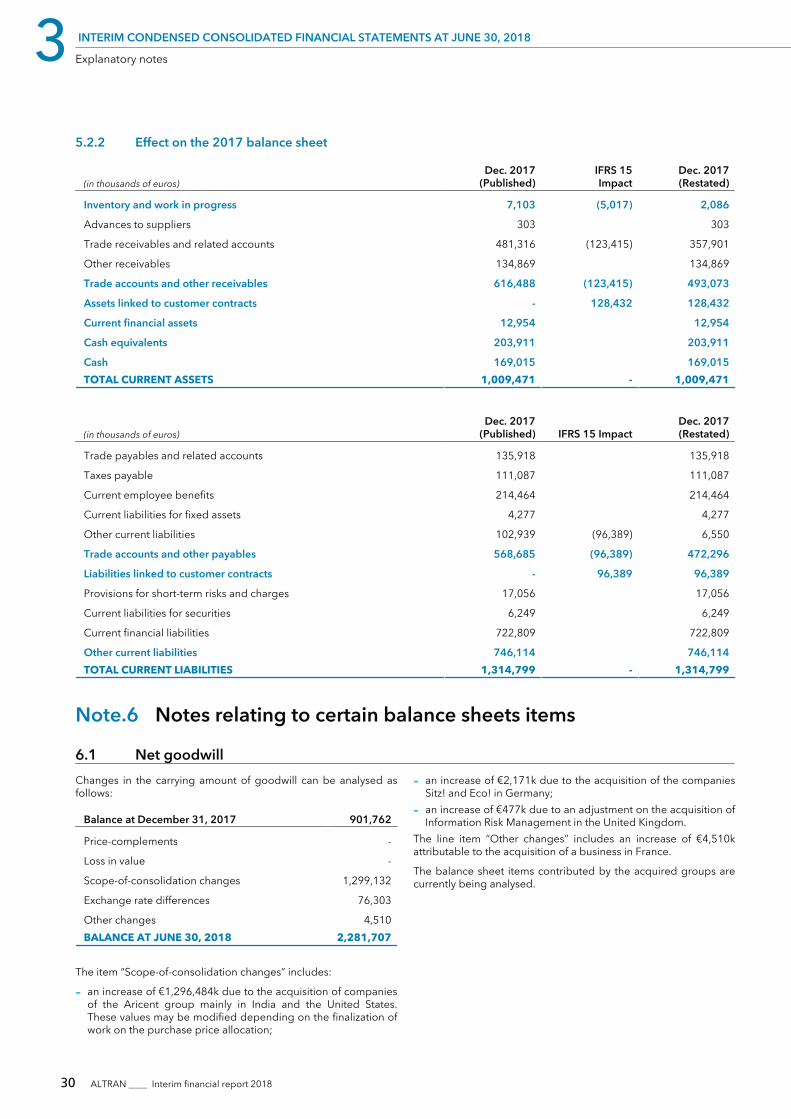
Effect on the 2017 balance sheet5.2.2
(in thousands of euros)Dec. 2017
(Published)IFRS 15 Impact
Dec. 2017(Restated)
Inventory and work in progress 7,103 (5,017) 2,086
Advances to suppliers 303 303
Trade receivables and related accounts 481,316 (123,415) 357,901
Other receivables 134,869 134,869
Trade accounts and other receivables 616,488 (123,415) 493,073
Assets linked to customer contracts - 128,432 128,432
Current financial assets 12,954 12,954
Cash equivalents 203,911 203,911
Cash 169,015 169,015TOTAL CURRENT ASSETS 1,009,471 - 1,009,471
(in thousands of euros)Dec. 2017
(Published) IFRS 15 ImpactDec. 2017(Restated)
Trade payables and related accounts 135,918 135,918
Taxes payable 111,087 111,087
Current employee benefits 214,464 214,464
Current liabilities for fixed assets 4,277 4,277
Other current liabilities 102,939 (96,389) 6,550
Trade accounts and other payables 568,685 (96,389) 472,296
Liabilities linked to customer contracts - 96,389 96,389
Provisions for short-term risks and charges 17,056 17,056
Current liabilities for securities 6,249 6,249
Current financial liabilities 722,809 722,809
Other current liabilities 746,114 746,114TOTAL CURRENT LIABILITIES 1,314,799 - 1,314,799
Notes relating to certain balance sheets itemsNote.6
Net goodwill6.1Changes in the carrying amount of goodwill can be analysed asfollows:
Balance at December 31, 2017 901,762
Price-complements -
Loss in value -
Scope-of-consolidation changes 1,299,132
Exchange rate differences 76,303
Other changes 4,510BALANCE AT JUNE 30, 2018 2,281,707
The item “Scope-of-consolidation changes” includes:
an increase of €1,296,484k due to the acquisition of companiesj
of the Aricent group mainly in India and the United States.These values may be modified depending on the finalization ofwork on the purchase price allocation;
an increase of €2,171k due to the acquisition of the companiesj
Sitz! and Eco! in Germany;an increase of €477k due to an adjustment on the acquisition ofj
Information Risk Management in the United Kingdom.The line item “Other changes” includes an increase of €4,510kattributable to the acquisition of a business in France.
The balance sheet items contributed by the acquired groups arecurrently being analysed.

3
INTERIM CONDENSED CONSOLIDATED FINANCIAL STATEMENTS AT JUNE 30, 2018
Explanatory notes
31ALTRAN ____ Interim financial report 2018
The cash-generating units (CGUs) that have contributed the mostto goodwill are listed below:
Main contributors (in thousands of euros)
Aricent 1,370,215
Germany/Austria/Czech Republic (a) 172,879
United States/Canada (b) 156,085
France 142,716
Netherlands 106,058
Italia 60,300
Spain 50,768
Tessella 48,293
United Kingdom 41,079
Cambridge (c) 32,507
India 31,096
Synapse (c) 26,653
Belgium 12,434
Others 30,624TOTAL 2,281,707
The goodwill of Microsys Technologies, the Canadian subsidiary of Altran (a)Concept Tech (Austria), is included in the Germany/Austria/Czech Republic CGU.The goodwill of Lohika, American subsidiary of Altran US is included in the (b)USA/Canada CGU.The CGU Synapse formerly associated with the Cambridge CGU is now part (c)of a full-fledged CGU.The CGU France now includes Luxembourg(d)
The item “Others” mainly includes the goodwill of other recentlyacquired entities that have not yet been allocated to a CGU andthe less significant CGUs.
The CGU Aricent is provisional
The Cash Generating Units (CGU) presenting indicators of loss ofvalue at June 30, 2018 were subject to an impairment test, whichdid not lead to the recognition of impairment in the incomestatement.
For carrying out the impairment tests, a revenue growth rate toinfinity of 2% was considered, unchanged from the testsperformed in 2017, and a post-tax discount rate per CGU (WACC)presented below:
Discount rate
June 2018 Dec. 2017
Germany/Austria/Czech Republic 6,62% 6,50%
USA/Canada 7,50% 7,20%
Sensitivity tests were performed for Cash Generating Units with indications of loss of value. The additional impairment of goodwill,which could result therefrom, concerning the Germany/Austria/Czech Republic CGU and the USA/Canada CGU, is summed up in thetable below (in thousands of euros):
Perpetual growth rate WACC +1.00%
2.00% CGU Germany/Austria/Czech Republic 0 10,583
1.00% CGU Germany/Austria/Czech Republic 0 36,277
1.00% CGU United States/Canada 0 2,139
Furthermore, based on the assumptions considered, a 3 point decrease in the EBIT rate used in the business plans would lead to a€116m impairment of goodwill for the Germany/Austria/Czech Republic CGU.

32 ALTRAN ____ Interim financial report 2018
3 INTERIM CONDENSED CONSOLIDATED FINANCIAL STATEMENTS AT JUNE 30, 2018
Explanatory notes
Intangible assets6.2
(in thousands of euros)Intangible
rightsDevelopment
costs Software Other Total
At December 31, 2017
Gross value at opening 54,204 21,407 78,758 10,730 165,099
Amortization and provisions (19,742) (5,241) (49,250) (877) (75,110)
Net value at opening 34,462 16,166 29,508 9,853 89,989
Changes during the period:
Acquisitions 12 5,912 2,604 3,015 11,543
Disposals - - - - -
Net amortization and provisions (21,324) (5,964) (12,663) (376) (40,327)
Change in consolidation scope 346,085 52,755 252,291 12 651,143
Exchange rate differences 19,473 2,877 13,978 (11) 36,317
Other changes - - 685 (746) (61)
Assets held for sale - - - - -
TOTAL CHANGES (NET VALUE) 344,246 55,580 256,895 1,894 658,615
At June 30, 2018
Gross value at June 30 420,318 83,062 400,933 13,108 917,421
Amortization and provisions (41,610) (11,316) (114,530) (1,361) (168,817)
Net value at June 2018 378,708 71,746 286,403 11,747 748,604
At Group level, expenses towards development costs in theamount of €5,912k were activated during the 1st half of 2018. Theaccumulated gross value of the development costs at June 30,2018 is €83,062k.
The changes in scope include the following intangible assetscreated as part of Aricent’s business combination adjustments:
development costs of €52,755k for technologies contributed;j
customer relations for €239,266k;j
a trademark for €43,421k;j
order books for €63,388k;j
and mainly the IBM licences contributed by Aricent.j
These values may be modified depending on the finalization ofwork on the purchase price allocation.
For the first half of 2018, net allowances for amortization ofintangible assets amounted to €40,327k, of which:
€13,907k are included in net depreciation, amortization andj
provisions; and€26,421k in amortization of intangible rights.j

3
INTERIM CONDENSED CONSOLIDATED FINANCIAL STATEMENTS AT JUNE 30, 2018
Explanatory notes
33ALTRAN ____ Interim financial report 2018
Tangible assets6.3
(in thousands of euros) Land Constructions
Generalfacilities,
fixtures andfurnishings
Office &computer
equipment &furniture Other Total
At december 31, 2017
Gross value at opening 1,088 47,416 57,257 82,259 5,019 193,039
Depreciation and provisions (7,168) (30,435) (60,541) (2,708) (100,852)
Net value at opening 1,088 40,248 26,822 21,718 2,311 92,187
Changes during the period
Acquisitions 2 10,368 2,086 7,572 6,554 26,582
Disposals (742) (163) (41) (946)
Net depreciation and provisions (453) (3,592) (7,288) (397) (11,730)
Change in consolidation scope 5,853 715 12,045 13,018 1,152 32,783
Exchange rate differences 31 (120) 376 199 103 589
Other changes 785 758 940 (2,424) 59
Assets held for sale -
TOTAL CHANGES (NET VALUE) 5,886 11,295 10,931 14,278 4,947 47,337
At June 30, 2018
Gross value at June 30 6,974 60,069 83,436 164,084 12,905 327,468
Depreciation and provisions (8,526) (45,683) (128,088) (5,647) (187,944)
Net value at June 30 6,974 51,543 37,753 35,996 7,258 139,524
The Group owns land and property, primarily in the United Kingdom, the Czech Republic and India, for a total net value of €44,459k,€5,432k and €6,590k, respectively.
None of the property, plant and equipment that has been fully depreciated and is still in use has a significant carrying amount.
For the 1st half of 2018, net depreciation amounted to -€11,730k of which -€11,753k was included in depreciation, amortisation andprovisions, and €23k in other non-recurring operating expenses.

34 ALTRAN ____ Interim financial report 2018
3 INTERIM CONDENSED CONSOLIDATED FINANCIAL STATEMENTS AT JUNE 30, 2018
Explanatory notes
Non-current financial assets6.4
(in thousands of euros) June 2018 Dec. 2017
Available for sale
Cambridge Consultants incubator 2,010 1,595
2,010 1,595
Loans and credits generated by the Group
Construction-effort loans 18,659 16,551
Deposits and guarantees 25,397 9,960
Other receivables 262 677
44,318 27,188
Other financial assets
Other equity investments 9,703 10,456
Investments in associates -
9,703 10,456
TOTAL 56,031 39,239
During the 1st half of 2018, the changes relating to the non-currentfinancial assets is notably explained by:
the increase in equity interests held by Cambridge Consultantsj
Limited in the start-up Evonetix for €415k;the increase of “construction-effort” loans for €2,108k;j
the increase in deposits and guarantees for €15,437k.j
Other non-current assets and taxes6.5Other non-current assets mainly comprise:
accrued income and prepaid expenses due in more than 1 yearj
in respect of insurance for €11,846k;non-current trade receivables amounting to €546k;j
non-current tax receivables amounting to €158,667k.j
Inventories6.6
(in thousands of euros)June2018
Dec.2017 *
Raw materials 2,070 1,977
Finished and semi-finished goods 108 141
Provisions for inventories (33) (32)TOTAL 2,145 2,086
2017 data were restated for the impact of IFRS 15 (see note 5).*
Trade receivables and related accounts, net of provisions for impairment6.7Trade receivables are due within one year.
(in thousands of euros)
June 2018 Dec. 2017 *
Total MaturedNot
matured Total MaturedNot
matured
Trade receivables and related accounts, net 444,651 94,135 350,516 357,901 69,264 288,637
* 2017 data were restated for the impact of IFRS 15 (see note 5).
Changes in provisions for trade receivables and related accounts (in thousands of euros):
Dec. 2017 Additions Reversals
Exchangerate
differences
Scope ofconso-
lidationchanges
Otherchanges June 2018
(5,638) (457) 1,898 (127) (3,762) 72 (8,014)

3
INTERIM CONDENSED CONSOLIDATED FINANCIAL STATEMENTS AT JUNE 30, 2018
Explanatory notes
35ALTRAN ____ Interim financial report 2018
Overdue trade receivables, net of impairment, can be analysed asfollows:
(in thousands of euros)June2018
Dec.2017 *
Less than one month overdue 46,564 43,529
Between one and three months overdue 26,128 12,790
More than three months overdue 21,443 12,945TOTAL TRADE RECEIVABLES 94,135 69,264
2017 data were restated for the impact of IFRS 15 (see note 5).*
The Group had factoring facilities amounting to €366m atJune 30, 2018. The amount of receivables transferred under thefactoring arrangements amounted to €198.2m.
The recognition of receivables assigned without recourse had thefollowing effect on the financial statements (in thousands ofeuros):
AssetsJune2018
Dec.2017
Trade receivables and related accounts (130,711) (156,314)
Security deposit 8,248 10,303(122,463) (146,011)
LiabilitiesJune2018
Dec. 2017
Current financial liabilities (122,463) (146,011)(122,463) (146,011)
The Group is responsible for recovering the receivablestransferred that are not guaranteed by the factor. Thesereceivables are recognised under assets, with an offsetting entryunder “Current financial liabilities” (see note 6.12).
The recognition of these items had the following effect on thefinancial statements (in thousands of euros):
AssetsJune2018
Dec. 2017
Trade receivables and related accounts 67,455 83,674
o/w unfunded portion of trade receivables and cancellation of deposits (12,944) (20,707)
54,511 62,967
LiabilitiesJune2018 Dec. 2017
Current financial liabilities 54,511 62,96754,511 62,967
Assets and liabilities related to client 6.8contracts
(in thousands euros)June2018
Dec.2017 *
Inventory and work in progress 5,412 5,017
Clients – Invoices to be issued 284,188 123,415ASSETS LINKED TO CUSTOMER CONTRACTS 289,600 128,432
2017 data were restated for the impact of IFRS 15 (see note 5).*
(in thousands euros)June2018
Dec.2017 *
Advances to suppliers 10,812 10,020
Clients – Credit memos to be issued 10,129 12,329
Deferred income 60,540 74,040LIABILITIES LINKED TO CUSTOMER CONTRACTS 81,481 96,389
2017 data were restated for the impact of IFRS 15 (see note 5).*
Other receivables6.9This line item includes tax receivables, prepaid expenses,personnel and social security receivables and other operatingreceivables.
Its development is mainly due to the entry of the Aricent group.
Current financial assets6.10This line item includes deposits and guarantees with maturitiesshorter than one year (such as the security deposit for thenon-recourse factoring contracts amounting to €8,248k).
Shareholders’ equity and earnings 6.11per share
The following calculations are based on the average half-yearlyprice in 2018, per Altran Technologies share, of €12.92.
At June 30, 2018, the Altran Technologies share capital amountedto €128,510,552.50 divided into 257,021,105 ordinary shares.During the period ended June 30, 2018, the weighted averagenumber of ordinary shares outstanding amounted to 205,929,446and the weighted average number of ordinary and dilutive sharesamounted to 206,644,885.
Breakdown of share capital NumberNominal
value
Number of shares at January 1 175,800,265 €0.50
Capital increase 81,220,840 €0.50
Cancellation of treasury shares (3,212,349) €0.50NUMBER OF SHARES AT JUNE 30 (EXCLUDING TREASURY SHARES) 253,808,756 €0.50

36 ALTRAN ____ Interim financial report 2018
3 INTERIM CONDENSED CONSOLIDATED FINANCIAL STATEMENTS AT JUNE 30, 2018
Explanatory notes
(in thousands of euros) June 2018 Dec. 2017
Net income (Altran Technologies) 9,493 130,768
Effect of dilutive share-based payments 689 2,309
Ordinary shares (weighted average number) 205,929,446 172,760,172
Dilutive options granted 715,439 641,181
Earnings per share (in euros) 0.05 0.76
Diluted earnings per share (in euros) 0.05 0.77
(in thousands of euros) June 2018 Dec. 2017
Net income (Altran Technologies) on continuing activities 9,666 139,653
Effect of dilutive share-based payments 689 2,309
Ordinary shares (weighted average number) 205,929,446 172,760,172
Dilutive options granted 715,439 641,181
Earnings per share (in euros) 0.05 0.81
Diluted earnings per share (in euros) 0.05 0.82
(in thousands of euros) June 2018 Dec. 2017
Net income (Altran Technologies) on discontinued operations (173) (8,885)
Effect of dilutive share-based payments
Ordinary shares (weighted average number) 205,929,446 172,760,172
Dilutive options granted 715,439 641,181
Earnings per share (in euros) -0.00 -0.05
Diluted earnings per share (in euros) -0.00 -0.05
The following instruments, having a strike price lower than theaverage price of the 1st half of 2018 with estimated dilutive effectat this time, concern:
the free share plan set up on March 11, 2015, covering aj
maximum of 291,779 free shares;the free share plan set up on June 1, 2016, covering a maximumj
of 235,108 free shares;
the free share plan set up on April 28, 2017, covering aj
maximum of 188,552 free shares.The characteristics of the Group’s free share plans are provided inparagraph 7.4.
Net debt6.12Net debt is the difference between total financial liabilities and cash and cash equivalents.
(in thousands of euros) June 2018 Dec. 2017
Cash and cash equivalents 208,154 372,926
Net cash 208,154 372,926
Bank loans and borrowings (> 1 year) 1,595,540 54
Other non-current financial liabilities (2,223) 1,133
Current bonds - 253,340
Current bank loans and borrowings (2,651) 174
Bank overdrafts 311,483 469,300
Other current financial liaibilities 3,644 (5)
GROSS FINANCIAL DEBT 1,905,793 723,996
NET DEBT (1,697,639) (351,070)

3
INTERIM CONDENSED CONSOLIDATED FINANCIAL STATEMENTS AT JUNE 30, 2018
Explanatory notes
37ALTRAN ____ Interim financial report 2018
The Group’s net debt increased from €1,346,569k at December 31, 2017 to €1,697,639k at June 30, 2018.
(in thousands of euros) Dec. 2017 Cash flow
Non-cash flow
June 2018Change in
factoring
Scope ofconsoli-
dationchanges
Fair valuechanges
Exchangerate
differences Others
Cash and cash equivalents 372,926 (164,772) 208,154
NET CASH 372,926 (164,772) 0 0 0 0 0 208,154
Bonds (> 1 year) 0 0
Bank loans and borrowings (> 1 year) 54 1,631,115 471 5,381 (41,481) 1,595,540
Other non-current financial liabilities 1,133 2,702 767 5,072 (509) (11,388) (2,223)
Current bonds 253,340 (250,000) (3,340) 0
Current bank loans and borrowings 174 (290) 353 32 (2,920) (2,651)
Bank overdrafts 469,300 (181,407) 23,562 4 24 311,483
Other current financial liaibilities (5) 1,231 1,507 3,847 (29) (2,907) 3,644
GROSS FINANCIAL DEBT 723,996 1,203,351 23,562 3,098 8,919 4,879 (62 012) 1,905,793
NET DEBT (351,070) (1,368,123) (23,562) (3,098) (8,919) (4,879) 62,012 (1,697,639)
Bank loans and borrowingsBank loans and borrowings can be broken down as follows:
(in thousands of euros) June 2018 Dec. 2017
Banking facilties 6,472 6,333
Factored debts 54,511 62,967
Commercial paper 250,500 400,000SHORT-TERM LOANS AND BANK OVERDRAFTS 311,483 469,300
Factored debts relate to unsecured receivables assigned to the factor, which amounted to €344m at June 30, 2018, compared with€344m at December 31, 2017.
Cash equivalentsAt June 30, 2018, the market value of cash equivalents amounted to €5,911k, and can be broken down as follows:
(in thousands of euros) June 2018 Déc. 2017
Certificates of deposit and other 1,116 203,911
Sicav and FCP 4,795TOTAL 5,911 203,911

38 ALTRAN ____ Interim financial report 2018
3 INTERIM CONDENSED CONSOLIDATED FINANCIAL STATEMENTS AT JUNE 30, 2018
Explanatory notes
Net debt maturity scheduleThe table below shows the breakdown of the Group’s net debt per category and contractual maturity, including accrued interest, andtaking into account the effect of hedging instruments:
(in thousands of euros) <1 year 1-2 yrs 2-3 yrs 3-4 yrs 4-5 yrs > 5 yrs
Bonds (> 1 year) - - - - - -
Bank loans and borrowings (> 1 year) - (4,806) (5,081) (5,201) (4,874) 1,615,502
Other non-current financial liabilities - 907 225 (3,943) - 588
Non-current financial liabilities 0 (3,899) (4,856) (9,144) (4,874) 1,616,090
Current bonds -
Current bank loans and borrowings (2,651)
Bank overdrafts 311,483
Other current financial liabilities 3,644
Current financial liabilities 312,476 - - - - -TOTAL 312,476 (3,899) (4,856) (9,144) (4,874) 1,616,090
The maturity of the financial liabilities at June 30, 2018 can bebroken down as follows:
less than one year: 16.40%;j
one to five years: -1.19%;j
more than five years: 84.80%.j
Principal changes in credit linesThe Group renegotiated its medium-term credit agreement, so allprior commitments were repaid in March 2018.
Term Loan B and revolving credit facility – bank consortiumOn February 15, 2018, Altran signed a syndicated senior securedTerm Loan B for a maximum of €2,125m (including €1,880m and$300m), with a bank consortium, as well as a revolving creditfacility for €250m. This syndicated loan was used to pay Aricent’sacquisition price and to repay the Group’s medium and long termdebt early.
The key characteristics of these loans are as follows:
for Term Loan B: maturity at 7 years from the date ofj
disbursement of the funds, i.e. on March 20, 2025;for the revolving credit facility: maturity at 5 years, i.e. onj
March 20, 2023;these credits include a right to partial or total repayment, at anyj
time, for a minimum amount of €1m or $1m;in fine amortisation of Term Loan B (€);j
quarterly amortization of Term Loan B ($) by 0.25% of thej
amount due, followed by repayment in fine;interests on Term Loan B and the revolving credit facility arej
payable in arrears according to a term of 1, 3 or 6 months asagreed by the borrower and the lender. The interest due dateson Term Loan B were fixed at March 20, June 20, September 20and December 20;maximum remuneration on Term Loan B: EURIBOR +3.25% (€)j
and LIBOR +2.75% ($);maximum remuneration on the revolving credit facility:j
EURIBOR +3.25%;only the provision of the revolving credit facility is subject to thej
upkeep of the Net Financial Debt/EBITDA ratio of less than orequal to 5.25 at the end of each quarter until maturity and thisonly if more than €100m are drawn on this revolving credit lineat the end of each quarter;the EBITDA considered for the calculation of the covenant is thej
last consolidated and audited EBITDA for a 12-month periodadjusted on a pro forma basis to include (on a 12-month basis)the EBITDA relating to any Eligible Company acquired in thecontext of an External Growth Operation carried out during thesaid period;the net financial debt corresponds to the net financial debt toj
which the sellers’ loans and the price supplement clauserelating to an external growth operation are added.
The Group made an early repayment of €500m towards TermLoan B over the period.
The margin level will be revised on a quarterly basis dependingon the consolidated ratio of financial leverage (net financialdebt/EBITDA).

3
INTERIM CONDENSED CONSOLIDATED FINANCIAL STATEMENTS AT JUNE 30, 2018
Explanatory notes
39ALTRAN ____ Interim financial report 2018
Applicable marginTerm Loan B
(€)Term Loan B
($)Revolving
credit
Ratio > = 4.00 3.25% per year 2.75% per year 3.25% per year
Ratio < 4.00 3.00% per year 2.50% per year 3.00% per year
Ratio < 3.50 2.75% per year 2.25% per year 2.75% per year
Ratio < 3.00 2.75% per year 2.25% per year 2.50% per year
The Term Loan B is accompanied by compliance clauses, detailsof the principal ones whereof are as follows:
the Company is required, within a maximum period of 90 daysj
as from March 20, 2018 (i.e. the date of closing of theAcquisition), to enter into interest rate hedging contracts(hedging) so that exposure to fluctuations in variable interestrates do not represent more than 50% of the principal amountof the Term Loan;the Company’s dividend distribution capacity might bej
restricted since, beyond a leverage ratio of 2.5x, part of theexcess cash flow (as defined in the Senior Facilities Agreement)must be used for the early repayment of the loans under theSenior Facilities Agreement: 25% is to be used for the earlyrepayment of the loans if the leverage ratio is between 2.5x and3.0x and 50% is to be used for the early repayment of theseloans if the leverage ratio is above 3.0x;
lastly, the Group will be subject to certain restrictions, inj
particular as regards new significant acquisitions and disposalsof assets, significant investments or new loans.
In addition, a number of real or personal sureties have beengranted by the Company and some of its subsidiaries to lenders inthe context of the new financing contracts.
In particular, the Company has pledged securities held by it insome of its subsidiaries (including the shares it holds in GlobalManagement Treasury Services (GMTS), a subsidiary of theCompany, where most of the Altran group’s cash is held centrally),and its bank accounts and the largest claims it holds for othercompanies of the Altran group. In addition, GMTS has alsopledged its bank accounts and the largest claims it holds for othercompanies of the Altran group.
The Company and its largest subsidiaries have also guaranteeddebtors commitments to the lenders for new financing.
Details of the amortisation table of medium-term credit lines at the Group’s disposal are as follows:
(in millions of euros)June2018
Dec.2018
June2019
Dec.2019
June2020
Dec.2020
June2021
Dec.2021
June2022
Dec.2022
June2023
Dec.2023
June2024
Dec.2024
June2025
TLB (Eur) 1,880.0 1,880.01,880.0 1,880.01,880.0 1,880.01,880.0 1,880.0 1,880.0 1,880.0 1,880.0 1,880.0 1,880.0 1,880.0
TLB (USD) 299.3 298.5 297.0 295.5 294.1 292.6 291.1 289.7 288.2 286.8 285.4 283.9 282.5 281.1 0.0
Banking pool revolving loan 250.0 250.0 250.0 250.0 250.0 250.0 250.0 250.0 250.0 250.0 0.0 0.0 0.0 0.0 0.0
Ratio of financial leverageThe pro forma ratio (last 12 months) of the financial leverage is as follows:
June 2018
Net financial debt/pro forma EBITDA (financial leverage) 4.24
Derivative financial instruments
Interest rate derivativesThe majority of the bank loans and borrowings have been contracted at variable interest rates, indexed mainly to EURIBOR or LIBOR.The Group has a hedging policy to mitigate risk in accordance with the credit agreement.
Start date Maturity date Type Fixed rate Nominal Initial rate Currency
Mogan Stanley 06/20/18 03/18/22 CAP 0.47% 400,000,000 Euribor3M EUR
Goldman Sachs 06/20/18 03/18/22 CAP 0.46% 400,000,000 Euribor3M EUR
CA 06/20/18 03/18/22 CAP 0.46% 200,000,000 Euribor3M EUR
CA 06/20/18 03/18/22 CAP 3.10% 250,000,000 Libor3M USD

40 ALTRAN ____ Interim financial report 2018
3 INTERIM CONDENSED CONSOLIDATED FINANCIAL STATEMENTS AT JUNE 30, 2018
Explanatory notes
At year end, Altran recognised changes in the fair value of interest rate CAP under:
other comprehensive income, for a net amount of -€1,704k, of which -€2,297k in gross value, and €593k in deferred taxes.j
the CAP fair value is booked in the net debt for €6,320k.j
Foreign exchange derivativesCash pooling exposes the Group to foreign exchange rate risk. Foreign exchange rate risk is hedged by foreign exchange rate swapsfor the most important currencies.
All information relating to liquidity risk is described in paragraph 2.1.5 of the chapter “Risk factors” of the 2017 Registration Document.
The main features of these derivatives are presented below:
Start date Maturity date Type Fixed rate Nominal Initial rate Currency
06/27/18 10/04/18 Forward sale 0,0968 53,900,000 Spot rate SEK
04/03/18 07/05/18 Forward sale 0,6305 4,700,000 Spot rate CAD
04/03/18 07/04/18 Forward sale 0,0393 193,000,000 Spot rate CZK
04/03/18 07/05/18 Forward purchase 1,1413 13,150,000 Spot rate GBP
04/03/18 07/05/18 Forward sale 1,1360 7,500,000 Spot rate GBP
05/04/18 08/24/18 Forward purchase 0,8344 19,800,000 Spot rate USD
04/04/18 08/24/18 Forward sale 0,8236 116,852,405 Spot rate USD
04/03/18 07/05/18 Forward purchase 0,8514 6,000,000 Spot rate CHF
06/20/18 07/05/18 Forward sale 0,8678 6,000,000 Spot rate CHF
At June 30, 2018, the fair value of the forward portion of the swaps (purchase or sale) is as follows (in thousands of euros):
Type Currency June 2018 Dec. 2017
Forward sale CZK 166 36
Forward purchase CHF 88
Forward sale CHF 18
Forward sale CAD (95) 7
Forward purchase GBP (140) 16
Forward sale GBP 45 (3)
Forward sale SEK 56
Forward purchase USD 402
Forward sale USD (3,729) (706)TOTAL FINANCIAL LIABILITIES (3,197) 108
The fair value of foreign exchange derivative instruments was recorded as financial income under foreign exchange income.

3
INTERIM CONDENSED CONSOLIDATED FINANCIAL STATEMENTS AT JUNE 30, 2018
Explanatory notes
41ALTRAN ____ Interim financial report 2018
Sensitivity analysis of net exposure to foreign exchange rate riskA 10% appreciation in the euro at June 30, 2018 would have the following effects:
(in thousands of euros) Asset Liability
Netforeign
currencyposition
Currencyrate as at
06/30/18
Netposition in eurobefore
hedging
Derivativeinstru-ments
Netposition in euro
afterhedging
Profitand loss
Gain/Loss
EquityGain/
Loss
Currency
USD 2,053.0 (7.0) 2,046.0 0.8578 1,755.0 (83.2) 1,671.8 0.0 167.0
GBP 82.6 (5.3) 77.3 1.1286 87.2 6.4 93.6 0.0 9.3
CHF 0.6 (1.0) (0.4) 0.8644 (0.3) (0.3) 0.0 0.0
SEK 53.9 53.9 0.0957 5.2 (5.2) 0.0 0.0 0.0
SGD 113.1 113.1 0.6291 71.1 71.1 0.1 7.1
MXN 3.4 3.4 0.0437 0.1 0.1 0.0 0.0
NOK 6.6 6.6 0.1051 0.7 0.7 0.0 0.0
CAD 4.9 4.9 0.6476 3.2 (3.0) 0.1 0.0 0.0
CZK 450.7 450.7 0.0384 17.3 (7.4) 9.9 0.0 1.0
MAD 22.6 22.6 0.0903 2.0 2.0 0.0 0.2
TRY 0.8 0.8 0.1873 0.1 0.1 0.0 0.0
INR 1,447.1 1,447.1 0.0125 18.1 18.1 0.0 1.8
AED 3.4 0.0 3.4 0.2330 0.8 0.8 0.0 0.0
Provisions and contingent liabilities6.13Changes in short and long-term provisions over the period can be broken down as follows:
(in thousands of euros) Dec. 2017 AdditionsReversals
(used)reversals
(not used)
Exchangerate
differences
Scope ofconsoli-
dationchanges
Otherchanges June 2018
Provisions for labor disputes 923 217 (84) (171) - - - 885
Provisions for other disputes 299 - - - - - - 299
Provisions for subsidiary risk 167 - - - 5 - - 172
Provisions for warranties - - - - - - - -
Provision for legal disputes and tax penalties - - - - 269 17,657 - 17,926
Provisions for other contingencies 41,160 241 (15,012) (500) 1,398 6,164 (393) 33,058
Provision for restructuring 4,823 219 (719) - (9) - 500 4,814
Provisions for other liabilities 289 3,319 (966) - 370 27,995 873 31,880
TOTAL NON-CURRENT PROVISIONS 47,661 3,996 (16,781) (671) 2,033 51,816 980 89,034
Provisions for labor disputes 5,839 914 (617) (588) - - - 5,548
Provisions for other disputes 354 2 (253) (18) 1 - 32 118
Provisions for warranties 43 58 (12) - 36 923 - 1,048
Provisions for legal disputes and tax penalties - - - - - - - -
Provision for losses on completion 517 34 (290) (29) (7) - - 225
Provisions for other contingencies 3,247 83 (1,355) (321) 78 1,428 737 3,897
Provisions for restructuring 5,871 4,211 (2,108) (1,002) (13) - (500) 6,459
Provisions for other liabilities 1,185 - (60) - (8) - (874) 243
TOTAL CURRENT PROVISIONS 17,056 5,302 (4,695) (1,958) 87 2,351 (605) 17,538
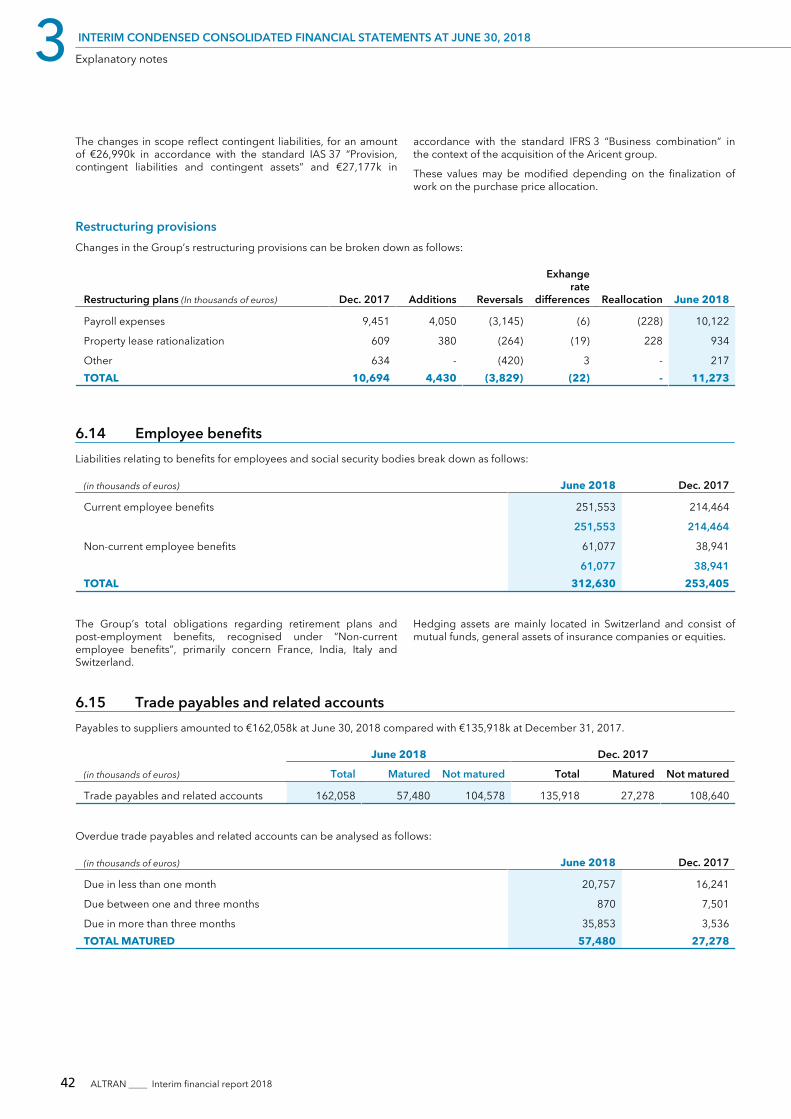
42 ALTRAN ____ Interim financial report 2018
3 INTERIM CONDENSED CONSOLIDATED FINANCIAL STATEMENTS AT JUNE 30, 2018
Explanatory notes
The changes in scope reflect contingent liabilities, for an amount accordance with the standard IFRS 3 “Business combination” inof €26,990k in accordance with the standard IAS 37 “Provision, the context of the acquisition of the Aricent group.contingent liabilities and contingent assets” and €27,177k in These values may be modified depending on the finalization of
work on the purchase price allocation.
Restructuring provisionsChanges in the Group’s restructuring provisions can be broken down as follows:
Restructuring plans (In thousands of euros) Dec. 2017 Additions Reversals
Exhangerate
differences Reallocation June 2018
Payroll expenses 9,451 4,050 (3,145) (6) (228) 10,122
Property lease rationalization 609 380 (264) (19) 228 934
Other 634 - (420) 3 - 217TOTAL 10,694 4,430 (3,829) (22) - 11,273
Employee benefits6.14Liabilities relating to benefits for employees and social security bodies break down as follows:
(in thousands of euros) June 2018 Dec. 2017
Current employee benefits 251,553 214,464
251,553 214,464
Non-current employee benefits 61,077 38,941
61,077 38,941TOTAL 312,630 253,405
The Group’s total obligations regarding retirement plans andpost-employment benefits, recognised under “Non-currentemployee benefits”, primarily concern France, India, Italy andSwitzerland.
Hedging assets are mainly located in Switzerland and consist ofmutual funds, general assets of insurance companies or equities.
Trade payables and related accounts6.15Payables to suppliers amounted to €162,058k at June 30, 2018 compared with €135,918k at December 31, 2017.
(in thousands of euros)
June 2018 Dec. 2017
Total Matured Not matured Total Matured Not matured
Trade payables and related accounts 162,058 57,480 104,578 135,918 27,278 108,640
Overdue trade payables and related accounts can be analysed as follows:
(in thousands of euros) June 2018 Dec. 2017
Due in less than one month 20,757 16,241
Due between one and three months 870 7,501
Due in more than three months 35,853 3,536TOTAL MATURED 57,480 27,278

3
INTERIM CONDENSED CONSOLIDATED FINANCIAL STATEMENTS AT JUNE 30, 2018
Explanatory notes
43ALTRAN ____ Interim financial report 2018
Suppliers of fixed assets6.16Payables to suppliers of fixed assets amounted to €138,247k including €66,845k with maturity of more than one year. They correspondto the acquisition of licences from IBM.
Current liabilities for securities6.17Current liabilities for securities comprise outstanding earn-outs, which amounted to €56,809k compared with €39,102k at the end ofDecember 2017.
Fair value6.18
(In thousands of euros)Fair
value
June 2018 Dec. 2017
Amor-tized cost
Fairvalue inincome
statement
Fair valuein share-holders’
equity
Accoun-ting
value
Fair valueof
elementsbooked atamortized
cost
Amor-tizedcost
Fairvalue inincome
statement
Fair valuein share-holders’
equity
Accoun-ting
value
Fair valueof
elementsbooked atamortized
cost
Assets
Unconsolidated investments Level 3 9,703 - 2,010 - 10,456 - 1,595 10,456
Equity-accounted investments Level 3 - - - - - - - -
Loans and receivables Level 2 25,659 18,659 - - 10,637 16,551 - 10,637
Cash equivalentsLevels 1
& 2 - 5,911 - - - 203,911 - -
Derivative instruments Level 2 - - - - - - - -
TOTAL ASSETS 35,362 24,570 2,010 0 0 21,093 220,462 1,595 - 21,093
Liabilities
Bonds Level 1 - - - - 250,000 - - 249,696
Convertible bonds Level 1 1,636,691 - - - - - - -
Derivative instruments Level 2 - 5,716 (6,320) - - (650) - -
TOTAL PASSIF 1,636,691 5,716 (6,320) 0 0 250,000 (650) - - 249,696
The fair value of other financial assets and liabilities recognised at amortised cost approximates their carrying amount.
Notes to the income statementNote.7
Segment information at June 30, 20187.1In accordance with IFRS 8 “Operating Segments”, the Group isrequired to disclose segment financial information based oninternal management reports, which the Chief Operating DecisionMaker (CODM) uses to assess the performance of each operatingsegment and allocate resources.
The zones are defined as follows:
France: France, Morocco, Luxembourg and Tunisia;j
Europe: Germany, Austria, Belgium, Netherlands, Czechj
Republic, Romania, United Kingdom, Scandinavia, Slovakia,Switzerland, Spain, Italy, Portugal, Turkey;Americas: North and South America, India and Ukraine;j
Asia: Asia, Oceania.j

44 ALTRAN ____ Interim financial report 2018
3 INTERIM CONDENSED CONSOLIDATED FINANCIAL STATEMENTS AT JUNE 30, 2018
Explanatory notes
Segment information
At June 30, 2018(in millions of euros) France Europe Americas Asia
Inter-segmentelim. Total
Revenues
External 485 619 252 17 1,373
Inter-segment 37 19 6 1 (63) -
TOTAL REVENUES 522 638 258 18 (63) 1,373
Total operating income 543 655 258 17 (63) 1,410
Total operating expenses (489) (609) (247) (17) 63 (1,299)
Operating income on ordinary activities 54 46 11 0 0 111
OPERATING INCOME ON ORDINARY ACTIVITIES (%) 10.3% 7.2% 4.3% 0.0% 0.0% 8.1%
Assets by region 3,590 1,018 2,613 67 (2,505) 4,783TOTAL ASSETS 3,590 1,018 2,613 67 (2,505) 4,783
At June 30, 2017 *(in millions of euros) France Europe Americas Asia
Inter-segmentelim. Total
Revenues
External 471 595 77 15 1,158
Inter-segment 31 19 5 1 (56) -
TOTAL REVENUES 502 614 82 16 (56) 1,158
Total operating income 521 625 82 16 (56) 1,188
Total operating expenses (468) (579) (78) (16) 56 (1,085)
Operating income on ordinary activities 53 46 4 0 0 103
OPERATING INCOME ON ORDINARY ACTIVITIES (%) 10.6% 7.5% 4.9% 0.0% 0.0% 8.9%
Assets by region 1,996 938 149 28 (772) 2,339TOTAL ASSETS 1,996 938 149 28 (772) 2,339
2017 data were restated for the impact of IFRS 15 (see note 5).*
France includes the operating subsidiaries and the Group’sheadquarters (with the management bodies and Group-wideservices).
Altran continues to grow with a displayed growth of 18.5% of itsrevenue which amounts to €1,372.7m compared to €1,158m inthe 1st half of 2017 including a net favourable effect related:
changes in the scope of consolidation: +14.9%;j
change in working days: -0.2%;j
changes in exchange rates: -1.4%.j
The Group’s operating income was down by 0.8 points andamounted to €111m and 8.1% of revenues.
Revenues7.2The following is a breakdown of revenue:
(in thousands of euros) June 2018 June 2017 * % Change
Sales of goods 13,792 9,322 +48.0%
Sales of services 1,357,969 1,148,401 +18.2%
Royalties 930 288 +222.9%TOTAL 1,372,691 1,158,011 +18.5%
2017 data were restated for the impact of IFRS 15 (see note 5).*

3
INTERIM CONDENSED CONSOLIDATED FINANCIAL STATEMENTS AT JUNE 30, 2018
Explanatory notes
45ALTRAN ____ Interim financial report 2018
External expenses7.3The following is a breakdown of external expenses at June 30, 2018:
(in thousands of euros) June 2018 June 2017 * % Change
Outsourcing 102,779 91,902 +11.8%
Operating leases and related expenses 47,369 36,117 +31.2%
Training 7,126 6,503 +9.6%
Professional fees and external services 15,949 14,801 +7.8%
Transport and travel expenses 50,810 43,124 +17.8%
Other purchases and external services 48,708 35,241 +38.2%TOTAL 272,741 227,688 +19.8%
2017 data were restated for the impact of IFRS 15 (see note 5).*
Details of the analysis of the changes are provided in the business report in paragraph 2.1 “Group performance” under “Externalexpenses”.
Personnel costs7.4The following is a breakdown of personnel costs, including CICE (French payroll tax credits), at June 30, 2018:
(in thousands of euros) June 2018 June 2017 % Change
Salaries & payroll 945,208 813,478 +16.2%
Expenses relating to share-based compensation 1,951 1,612 +21.0%
Non-current employee benefits 1,719 1,236 +39.1%
Employee benefit provisions 1,114 679 +64.1%TOTAL 949,992 817,005 +16.3%

46 ALTRAN ____ Interim financial report 2018
3 INTERIM CONDENSED CONSOLIDATED FINANCIAL STATEMENTS AT JUNE 30, 2018
Explanatory notes
Share-based paymentsThe total cost of share-based payments amounted to €689k at June 30, 2018 compared with €1,612k at June 30, 2017 and mainlyrelated to free-share plans set up on March 11, 2015, June 1, 2016 and April 28, 2017.
The key characteristics of the plans are as follows:
Free shares 2015
Free shares 2016
Free shares 2017
Date of General Meeting 06/01/2012 04/29/2016 04/29/2016
Date of Board of Directors Meeting 03/11/2015 06/01/2016 04/28/2017
Total number of shares available for allocation on the date of attribution 291,959 519,395 437,366
o/w available to corporate officers 0 0 0
o/w available to 10 highest paid employees 116,750 231,583 157,681
Balance at 12/31/2017 116,750 80,844 60,404
Issue date of free shares 03/11/201910/03/2019 at the latest 04/28/2020
End of lock-in period for free shares 03/11/201910/03/2019 at the latest 04/28/2020
Reference share price (in euros) €8.53 €13.35 €15.88
Valuation method used Binomial Binomial Binomial
Number of shares available for allocation at 12/31/2017 261,959 247,166 195,144
Rights created in 2018 29,820 24,030 19,270
Rights forfeited in 2018
Rights granted in 2018
Performance stock valuation (36,088) (25,862)
Number of shares available for allocation at 06/30/2018 291,779 235,108 188,552
Depreciation, amortisation and net provisions7.5
(in thousands of euros) June 2018 June 2017 % Change
Depreciation and amortization of property, plant & equipment and intangible assets (25,660) (11,507) +123.0%
Provisions for current assets 1,526 (553) -375.9%
Provisions for contingencies and liabilities 1,670 858 +94.6%
Provisions for contingencies and liabilities – Share based compensation 1,120 (702) -259.5%TOTAL (21,344) (11,904) +79.3%

3
INTERIM CONDENSED CONSOLIDATED FINANCIAL STATEMENTS AT JUNE 30, 2018
Explanatory notes
47ALTRAN ____ Interim financial report 2018
Non-recurring operating income and expenses7.6
(in thousands of euros) June 2018 June 2017
Proceeds from disposals of property, plant & equipment and intangible assets (17) (278)
Proceeds from divestment & liquidation of consolidated investments 684 -
Business divestiture (15) 14
Cost and litigations related to acquisitions and legal reorganizations (27,525) (2,616)
Trade disputes (52) (1,048)
Labor disputes (275) 9
Legal disputes - (119)
Non-recurring costs relating to the Strategic Plan - (226)
Restructuring costs (net of change in provisions) (14,810) (7,264)
Other (654) 3TOTAL (42,664) (11,525)
Non-recurring operating expense amounted to -€42,664k including:
the costs related to acquisitions and legal reorganisation: -€27,525k;j
a net impact of -€14,810k reflecting the net effect of the restructuring plans, an analysis by nature of which is presented below:j
Restructuring costs
Breakdown of net expenses
(in thousands of euros) June 2018 June 2017
Salaries (13,267) (6,739)
Property lease rationalization + fittings write-offs (1,590) (289)
Other 47 (236)TOTAL (14,810) (7,264)
Cost of net financial debt7.7The cost of net financial debt of -€24,898k includes interests on loans in the amount of -€22,842k and interests on bank overdrafts andmedium-term credits of -€1,075k.
(in thousands of euros) June 2018 June 2017
Income from cash and cash equivalents
Interest income from cash and cash equivalents 1,418 1,456
Proceeds from disposal of cash equivalents - -
1,418 1,456
Cost of gross financial debt
Interest expense relating to bonds (2,399) (4,317)
Interest expense relating to loans (22,842)
Interest expense relating to other financing operations (1,075) (3,476)
(26,316) (7,793)
COST OF NET FINANCIAL DEBT (24,898) (6,337)

48 ALTRAN ____ Interim financial report 2018
3 INTERIM CONDENSED CONSOLIDATED FINANCIAL STATEMENTS AT JUNE 30, 2018
Explanatory notes
Other financial proceeds and expenses7.8
(in thousands of euros) June 2018 June 2017
Financial income
Financial gains from conversion to present value 251 247
Forex gains 5,441 1,561
Write-offs 11 0
Reversals of provisions for impairment of unconsolidated investments and other non-current financial assets 33 9
Other financial income 67 4
5,803 1,821
Financial expenses
Loss on disposal of unconsolidated investments and other financial asset (2) -
Impairment of unconsolidated investments and other non-current financial assets - (4,540)
Employee benefit provisions (897) (335)
Forex losses (7,040) (4,422)
Financial expense on measurement to present value (2,789) (264)
Other financial expenses (24,042) (5)
(34,770) (9,566)
Other financial expenses include €6,233k in expenses relating tothe setting-up of Term Loan B, and €17,710k in expenses relatingto the repayment of previous loans (including €17,484k forbonds). The foreign exchange income is impacted by the fairvalue of exchange rate instruments.
Tax expenses7.9Tax expense on income before income taxes of €14.8m for thefirst half of 2018 stood at €5m after application of an estimatedeffective tax rate (ETR) for the full financial year (including“secondary” taxes such as the French CVAE and the Italian IRAP).
7.10 Income from discontinued operationsIn accordance with IFRS 5:
income statement items relating to the Utilities business in the Unitedj
States, which is being sold, have been reported under the line item“Net income (loss) from discontinued operations” for the 2017 and2018 reporting periods, after eliminating intra-Group items,
The following table shows the change in net income (loss) from discontinued operations:
(in millions of euros) June 2018 June 2017
Revenues - (13.9)
Operating income on ordinary activities - 1.0
Operating income (0.2) 0.9
Financial income - -
Tax expenses/income 0.1 (0.3)NET INCOME ON DISCONTINUED OPERATIONS (0.1) 0.6

3
INTERIM CONDENSED CONSOLIDATED FINANCIAL STATEMENTS AT JUNE 30, 2018
Explanatory notes
49ALTRAN ____ Interim financial report 2018
Follow-up of significant litigation and contingent liabilitiesNote.8Significant litigation and contingent liabilities, as reported to shareholders during the approval of the financial statements for the yearended December 31, 2017 (pages 54 to 57 and 240 to 241 of the 2017 Registration Document), did not change notably on the date ofapproval of the financial statements for the 1st half of 2018.
Off-balance sheet commitmentsNote.9Changes in off-balance sheet commitments are presented below:
(in thousands of euros) June 30, 2018 < 1 year 1-5 years > 5 years 31 Dec. 2017
Commitments granted:
Pledges, security deposits and guarantees
for recurring operationsj 29,286 6,352 7,442 15,492 31,533
for financing operationsj 2,147,204 9,181 423 2,137,601 16,536
Operating lease (property, furniture) 1 828 1 828
minimum future payments j 259,725 66,991 137,732 55,002 229,061
Non-compete clause concerning former employees
gross amountj 1,428 1,428 1,316
social security contributionsj 400 400 370
Commitments received
Pledges, security deposits and guarantees
for recurring operationsj 4,398 1,541 2,204 653 5,206
for financing operationsj - -
Information on related partiesNote.10Nil.
Events subsequent to the reporting dateNote.11The following significant events occurred between June 30, 2018and September 5, 2018, when the Group’s financial statementswere approved by the Board of Directors of Altran Technologies:
Aricent – Discovery of a financial incident prior to the change ofcontrol
involving about $10m and relating to the period from the3rd quarter of 2017 to the 1st quarter of 2018.
On July 13, 2018, the Group announced that an anomaly relatedto purchase orders that proved to be fictitious was discovered atAricent, in the context of the first closing of accounts since thetakeover by Altran (half-yearly closing at June 30, 2018). Thisaction was the act of an individual and concerned one client,
Since the incident was limited to the pre-acquisition period(March 20, 2018), the Group did not note any significant impacton the first half of the 2018 financial year.
The strategic rationale of Aricent’s acquisition is strong and is notaffected by this incident. Altran launched an external in-depthinvestigation to confirm that this event is an isolated case;Aricent's internal procedures will be updated following theconclusions of this investigation.

50 ALTRAN ____ Interim financial report 2018
3 INTERIM CONDENSED CONSOLIDATED FINANCIAL STATEMENTS AT JUNE 30, 2018

ALTRAN ____ Interim financial report 2018 51
4__ STATUTORY AUDITORS’ REPORT ON THE INTERIM FINANCIAL INFORMATION

52 ALTRAN ____ Interim financial report 2018
4 STATUTORY AUDITORS’ REPORT ON THE INTERIM FINANCIAL INFORMATION
For the period from January 1 to June 30, 2018
This is a free translation into English of the Statutory Auditors’ report on the interim financial information that is issued in French and isprovided solely for the convenience of English speaking users. This report includes information relating to the specific verification ofinformation given in the Group’s interim management report. This report on the interim financial information should be read inconjunction with, and construed in accordance with, French law and professional auditing standards applicable in France.
To the Shareholders,
In compliance with the assignment entrusted to us by yourShareholders’ Meeting and in accordance with the requirementsof Article L. 451-1-2 III of the French monetary and financial code(Code monétaire et financier), we hereby report to you on:
the review of the accompanying condensed interimj
consolidated financial statements of Altran Technologies for theperiod from January 1 to June 30, 2018; andthe verification of the information contained in the interimj
management report.These condensed interim consolidated financial statements arethe responsibility of the Board of Directors. Our role is to expressa conclusion on these financial statements based on our review.
I Conclusion on the financial statements
responsible for financial and accounting matters, and applyinganalytical and other review procedures. A review is substantiallymore limited in scope than an audit conducted in accordance withprofessional standards applicable in France. Consequently, areview does not guarantee that the financial statements taken as awhole reflect all significant matters that might be identified in anaudit. Accordingly, we do not express an audit opinion.
We conducted our review in accordance with professionalstandards applicable in France. A review of interim financialinformation involves making inquiries with the persons
Based on our review, nothing has come to our attention thatcauses us to believe that these condensed interim consolidatedfinancial statements have not been prepared in accordance withIFRS standard, IAS 34, as adopted by the European Unionapplicable to interim financial information.
II Specific verificationWe have also verified the information presented in the interimmanagement report on the condensed consolidated interimfinancial statements subject to our review. We have no matters toreport as to its fair presentation and its consistency with thecondensed consolidated interim financial statements.
La Défense and Neuilly-sur-Seine, September 6, 2018
The Statutory Auditors
Mazars Deloitte & Associés
Jean-Luc BARLET Ambroise DEPOUILLY

53ALTRAN ____ Interim financial report 2018
5__ STATEMENT OF RESPONSIBILITY FOR THE HALF-YEAR FINANCIAL REPORT

54 ALTRAN ____ Interim financial report 2018
5 STATEMENT OF RESPONSIBILITY FOR THE HALF-YEAR FINANCIAL REPORT
I hereby certify that, to the best of my knowledge, the condensed consolidated financial statements for the last half-year were preparedin accordance with applicable accounting standards and provide a true and fair view of the assets, financial position and profit and lossof the Company and of all the companies included in the scope of consolidation, and that this Half-Year Activity Report is a true and fairview of material events arising in the six months in question, their impact on the financial statements, the main related-party transactionsas well as a description of the material risks and main uncertainties for the remaining six months of the financial year.
Neuilly-sur-Seine, September 6, 2018
Dominique Cerutti
Chairman and Chief Executive Officer

The English language version of this text is a free translation from the original, which was prepared in French. All possible care has been taken to ensure that the translation is an accurate representation of the original. However in all matters of interpretation of information, views or opinion, the original French language version of the document takes precedence over the translation.

ALTRAN TECHNOLOGIES French public limited company governed by a Board of Directors and with a share capital of €128,510,552.50
96, avenue Charles de Gaulle 92200 Neuilly-sur-Seine