Altman Z-Score Not Just for Bankruptcy
21
AMPROS CORPORATION Putting it All Together Altman Z-Score: Not Just for Bankruptcy From Z-Score to “Green Zone” Survivability Dan Hauschild 8/19/2013 Football has its red zone and end zone, now business has the “Green Zone”. Executives, owners, and investors have a multitude of financial ratios at their disposal for measuring and evaluating continuing business success. The Z-Score is a single metric incorporating five critical measures of business performance. Now, from the Altman Z-Score are Green Zone speedometer charts and guidelines to assist in managing for business survivability - not just survival, but for business growth and profitability!
-
Upload
rg-segaran -
Category
Documents
-
view
59 -
download
3
description
Altman Z score can be used as a Financial Tool to predict any future problems of defaults in paying back the credits what they take from Banks and / or Credit sales by any other companies.
Transcript of Altman Z-Score Not Just for Bankruptcy

AMPROS CORPORATION
Putting it All Together
Altman Z-Score: Not Just for Bankruptcy
From Z-Score to “Green Zone” Survivability
Dan Hauschild 8/19/2013
Football has its red zone and end zone, now business has the “Green Zone”. Executives, owners, and investors have a multitude of financial ratios at their disposal for measuring and evaluating continuing business success. The Z-Score is a single metric incorporating five critical measures of business performance. Now, from the Altman Z-Score are Green Zone speedometer charts and guidelines to assist in managing for business survivability - not just survival, but for business growth and profitability!

Altman Z-Score: Not Just for Bankruptcy
Copyright 2013 AMPros Corporation, All Rights Reserved Page 2
Altman Z-Score: Not Just for Bankruptcy
Copyright 2013 AMPros Corporation, All Rights Reserved Page 3
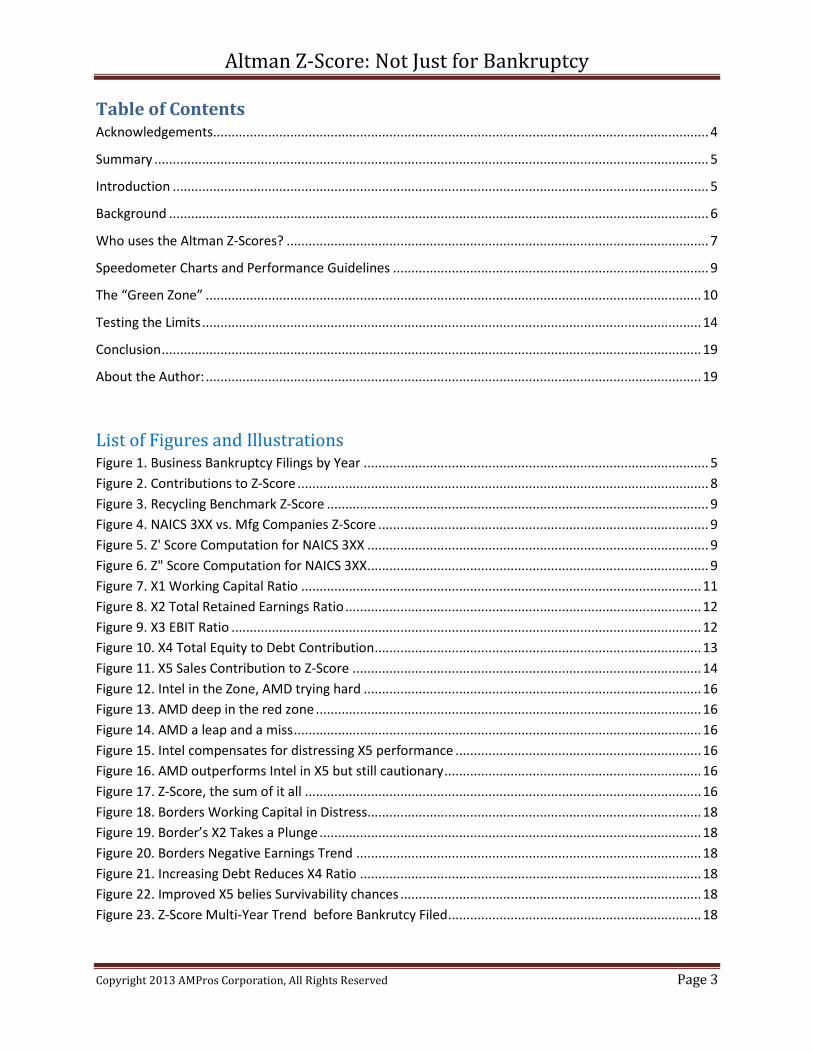
Table of Contents Acknowledgements ....................................................................................................................................... 4
Summary ....................................................................................................................................................... 5
Introduction .................................................................................................................................................. 5
Background ................................................................................................................................................... 6
Who uses the Altman Z-Scores? ................................................................................................................... 7
Speedometer Charts and Performance Guidelines ...................................................................................... 9
The “Green Zone” ....................................................................................................................................... 10
Testing the Limits ........................................................................................................................................ 14
Conclusion ................................................................................................................................................... 19
About the Author: ....................................................................................................................................... 19
List of Figures and Illustrations Figure 1. Business Bankruptcy Filings by Year .............................................................................................. 5
Figure 2. Contributions to Z-Score ................................................................................................................ 8
Figure 3. Recycling Benchmark Z-Score ........................................................................................................ 9
Figure 4. NAICS 3XX vs. Mfg Companies Z-Score .......................................................................................... 9
Figure 5. Z' Score Computation for NAICS 3XX ............................................................................................. 9
Figure 6. Z" Score Computation for NAICS 3XX ............................................................................................. 9
Figure 7. X1 Working Capital Ratio ............................................................................................................. 11
Figure 8. X2 Total Retained Earnings Ratio ................................................................................................. 12
Figure 9. X3 EBIT Ratio ................................................................................................................................ 12
Figure 10. X4 Total Equity to Debt Contribution ......................................................................................... 13
Figure 11. X5 Sales Contribution to Z-Score ............................................................................................... 14
Figure 12. Intel in the Zone, AMD trying hard ............................................................................................ 16
Figure 13. AMD deep in the red zone ......................................................................................................... 16
Figure 14. AMD a leap and a miss ............................................................................................................... 16
Figure 15. Intel compensates for distressing X5 performance ................................................................... 16
Figure 16. AMD outperforms Intel in X5 but still cautionary ...................................................................... 16
Figure 17. Z-Score, the sum of it all ............................................................................................................ 16
Figure 18. Borders Working Capital in Distress........................................................................................... 18
Figure 19. Border’s X2 Takes a Plunge ........................................................................................................ 18
Figure 20. Borders Negative Earnings Trend .............................................................................................. 18
Figure 21. Increasing Debt Reduces X4 Ratio ............................................................................................. 18
Figure 22. Improved X5 belies Survivability chances .................................................................................. 18
Figure 23. Z-Score Multi-Year Trend before Bankrutcy Filed ..................................................................... 18
Altman Z-Score: Not Just for Bankruptcy
Copyright 2013 AMPros Corporation, All Rights Reserved Page 4
Acknowledgements The author thanks the following for their thoughtful, critical and helpful critique. Many others also
provided positive feedback and their input is greatly appreciated.
Lori Tapani, CPA, Co-Owner, Co-President Wyoming Machine, Inc.
John Drow, Senior Vice President, Dougherty & Company, LLC
Gary Gardner, VP Human Resources (retired) Valspar Corporation, Founder HRIC Inc., Executive
Compensation Specialist
Andrew Thom, CPA, CFE, Business Partner ABDO, EICK & MEYERS, LLP
Special thanks to De Knudson, former City Councilor, City of Sioux Falls, SD, Teacher of the
English language and long time friend for her editorial comments, suggestions and literary
improvements

Altman Z-Score: Not Just for Bankruptcy
Copyright 2013 AMPros Corporation, All Rights Reserved Page 5
Altman Z-Score: Not Just for Bankruptcy
Summary The power and resilience of the Altman Z-Score has been demonstrated for over four decades. A major
reason for the durability and relevance of the Z-Score is that it incorporates within a single measure five
measures representing business Profitability, Liquidity, Efficiency, Productivity and Leverage or
Coverage. The Altman Z-Score remains a robust and relevant tool for predicting bankruptcy one to two
years in advance. Importantly, the trends for the ratios contributing to the calculation of Z-Score
provide a means to evaluate current performance before the Z-Score computation indicates the
business is in trouble.
In the present work, “Green Zone” guidelines are developed and illustrated in speedometer charts for
each ratio. Green Zone trend charts subsequently present multi-year trends for several companies.
Comparison of the Green Zone guidelines to real business experiences and previous work by other
authors including the father of the Z-Score, Dr. Edward Altman, lends credence to the new guidelines.
Management, owners, and investors have a multitude of financial ratios at their disposal for measuring
and evaluating continuing business operations. This author recommends the Z-Score as a periodic first
look tool and prescribes the Green Zone guidelines to assist in managing for business survivability - not
just survival, but for business growth and profitability!
Introduction Bankruptcy, foreclosures, unemployment are all too familiar terms and headline news over the past
several years. The economy is slowly recovering, but the loss of jobs and businesses will be with us for
years to come. In this article, the focus is on survivability - not just to survive but also to thrive and
grow. We look “under the hood” of the Altman Z-Score formulations for insight and survivability
guidance. Speedometer charts display the “Green Zone” and boundaries of financial performance for
the Altman Z-Score contributing ratios. Subsequently, trend charts compare survivability performance
for four publicly traded companies.
From 2008 through 2012, U.S. Bankruptcy Courts
processed 247,597 business bankruptcies, Figure 1.
For each business bankruptcy there were 26.3 non-
business bankruptcy filings or in total 6,522,928.
Over 69% of both business and non-business filings
were for Chapter 7 liquidation of assets. That is,
businesses were dissolved assets were sold and jobs
were lost. Non-business Chapter 7 liquidation of
assets primarily includes individuals and households.
38,651
58,724 58,322
49,895
42,008
2008 2009 2010 2011 2012
Business Bankruptcy Filings
Figure 1. Business Bankruptcy Filings by Year
Altman Z-Score: Not Just for Bankruptcy
Copyright 2013 AMPros Corporation, All Rights Reserved Page 6
People lost their jobs and, in many cases, their houses and means of supporting their families.
The reasons for bankruptcy are varied, but ultimately cash inflow was not sufficient to meet the cash
outflow demands of creditors and lenders.
There are tools available, if not crystal balls, to help provide guidance to businesses. Altman Z-Score is
one such tool that should be in every business management toolbox. We show that Z-Score is not just
for predicting bankruptcy but also for navigating the performance pitfalls for existing businesses. It is a
critical tool for emerging entrepreneurial ventures or those in the early stages of developing business
plans and seeking financial support. It is also useful as a tool for due diligence in merger and acquisition
endeavors.
We critically examine the Altman Z-Score for application to business survivability and growth, but first, a
little background.
Background Actually, the Altman Z-Score exists in three forms. The original version developed by Edward Altman in
1968 was for predicting bankruptcy potential in publicly held manufacturing businesses. The Z-Score
formulation successfully predicted bankruptcy with 90% accuracy within one year of filing and 80%
accuracy two years in advance. While this was an impressive accomplishment, there was criticism that
the original Z-Score did not work very well with privately held companies. Dr. Altman then created two
new forms of the bankruptcy prediction formula. These were identified as Z’ (Z prime) and Z” (Z double
prime) although they are also referred to as Z (A) and Z (B). Z’ was developed for privately-held
industrial companies and Z” developed for non-manufacturing and service companies.
Dr. Altman developed a fourth bankruptcy predictor, ZETA®, in 1977 that modifies and incorporates
additional factors into the formula. ZETA® is said to predict the potential for bankruptcy with a high
degree of accuracy up to five years in advance. However, the formula is proprietary and of limited
availability to business management and owners.
Many have criticized the Z-Scores as being inadequate. Some critics claim different and purportedly
better ways to predict bankruptcy. However, the Altman Z-Score has withstood the test of time and
some 45 years after its first use is still relevant and widely used as a bankruptcy predictor. No one, to
this author’s knowledge, has proposed Z-Score for survivability.
We are concerned with business survivability and growth using tools that anticipate potential problems.
The Altman Z-Score expressions are as follow:
Z-Score = (X1*1.2) + (X2*1.4) + (X3*3.3) + (X4*0.6) + (X5*0.999) for public manufacturing businesses
Z’ Score = (X1*0.717) + (X2*0.847) + (X3*3.107) + (X4*0.42) + (X5*0.998) for private industrial businesses
Z” Score = (X1*6.56) + (X2*3.26) + (X3*6.72) + (X4*1.05) for private non-manufacturing companies

Altman Z-Score: Not Just for Bankruptcy
Copyright 2013 AMPros Corporation, All Rights Reserved Page 7
Where:
X1 = Working Capital / Total Assets
X2 = Total Retained Earnings / Total Assets
X3 = E.B.I.T. / Total Assets
X4 = Market Value Equity / Total Debt for Public Companies or Owners’ Equity / Total Liabilities for Private Businesses
X5 = Net Revenue / Total Assets
Note that the underlying ratios are fundamentally the same for each formula. Income statement and
balance sheet information combine to calculate the ratios but vary as to which information originates
from the balance sheet. Publicly traded businesses incorporate market equity to debt ratio while
privately held enterprises use book value of equity to debt.
Although there are individual formulas for different business types, the original Z-Score expression
receives the most press and common usage. Each score has a unique range of defined values for
bankruptcy likelihood. The following table presents the Altman range of score predictors.
Z-Score Z’ Score Z” Score
< 1.8 Bankruptcy Likely
>=1.8 – 2.99 Zone of Uncertainty
>=3.0 Bankruptcy Unlikely
<1.23 Bankruptcy Likely
>=1.23 – <2.9 Zone of Uncertainty
>=2.9 Bankruptcy Unlikely
<1.1 Bankruptcy Likely
>=1.1 – <2.6 Zone of Uncertainty
>=2.6 Bankruptcy Unlikely
Who uses the Altman Z-Scores? The answer might surprise. Business creditors and lenders are the primary consumers of Z-Score
information. Some business accountants also routinely look at the Z-Score for their business clients.
Well-informed investors frequently use Z-Score to check on the financial strength and health of
businesses considered for potential investments.
One perhaps surprising user of Z-Score is the U.S. Environmental Protection Agency (U.S. EPA). The U.S.
EPA applied financial ratio analysis and Z-Score evaluation to companies and multi-facility firms in
industries such as pharmaceutical, waste treatment, pulp and paper industries, and transportation
equipment cleaning and industrial laundries. The U.S. EPA uses pre- and post- compliance Z-Score
results to estimate financial impact caused by regulatory compliance investments.
The U.S. EPA also funded a “Recycling Industry Benchmarking and Performance Measurement” effort
carried out by AMPros Corporation. Participating recycling businesses provided confidential financial
and operational information. AMPros Corporation subsequently consolidated the business financial
information via AMPros’ ProfitizeIt® software tools, and created numerous financial performance ratio
benchmarks including Z-Score for survivability.
Feedback from several of the participants indicated they used the Benchmarking report to acquire
funding support from the Small Business Administration, alter pricing strategies or to improve their
operations. According to individual Z-Score results, 18% of the benchmark participants were in danger
of bankruptcy while 45% were in an excellent performance category.
Altman Z-Score: Not Just for Bankruptcy
Copyright 2013 AMPros Corporation, All Rights Reserved Page 8
For more information and discussion, the Benchmarking report is available at www.amproscorp.com.
It was evident from the Benchmarking report that Z-Score was a potential tool for business survivability.
AMPros analyzed the Z-Score ratio components and established, through descriptive statistical analysis,
a range of limits for each contributing Z-Score ratios. The business financials used consisted of both
public and private companies with a range of Z-Scores from negative to very large values, Figure 2.
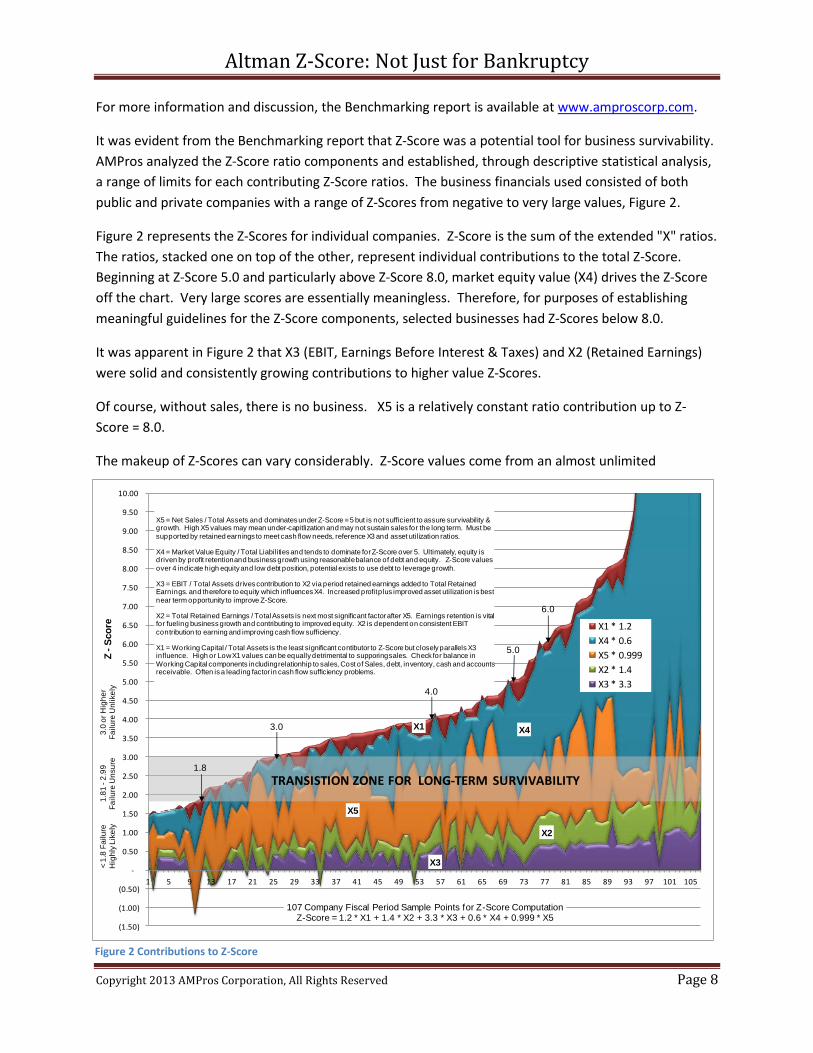
Figure 2 represents the Z-Scores for individual companies. Z-Score is the sum of the extended "X" ratios.
The ratios, stacked one on top of the other, represent individual contributions to the total Z-Score.
Beginning at Z-Score 5.0 and particularly above Z-Score 8.0, market equity value (X4) drives the Z-Score
off the chart. Very large scores are essentially meaningless. Therefore, for purposes of establishing
meaningful guidelines for the Z-Score components, selected businesses had Z-Scores below 8.0.
It was apparent in Figure 2 that X3 (EBIT, Earnings Before Interest & Taxes) and X2 (Retained Earnings)
were solid and consistently growing contributions to higher value Z-Scores.
Of course, without sales, there is no business. X5 is a relatively constant ratio contribution up to Z-
Score = 8.0.
The makeup of Z-Scores can vary considerably. Z-Score values come from an almost unlimited
(1.50)
(1.00)
(0.50)
-
0.50
1.00
1.50
2.00
2.50
3.00
3.50
4.00
4.50
5.00
5.50
6.00
6.50
7.00
7.50
8.00
8.50
9.00
9.50
10.00
1 5 9 13 17 21 25 29 33 37 41 45 49 53 57 61 65 69 73 77 81 85 89 93 97 101 105
X1 * 1.2
X4 * 0.6
X5 * 0.999
X2 * 1.4
X3 * 3.3
TRANSISTION ZONE FOR LONG-TERM SURVIVABILITY
< 1
.8 F
ailu
re
Hig
hly
Lik
ely
1.8
1 -
2.9
9
Fa
ilu
re U
nsu
re3
.0 o
r H
igh
er
Fa
ilu
re U
nlike
lyZ
-S
co
re
X5 = Net Sales / Total Assets and dominates under Z-Score = 5 but is not sufficient to assure survivability & growth. High X5 values may mean under-capitlization and may not sustain sales for the long term. Must be
supported by retained earnings to meet cash flow needs, reference X3 and asset utilization ratios.
X4 = Market Value Equity / Total Liabilities and tends to dominate for Z-Score over 5. Ultimately, equity is driven by profit retention and business growth using reasonable balance of debt and equity. Z-Score values
over 4 indicate high equity and low debt position, potential exists to use debt to leverage growth.
X3 = EBIT / Total Assets drives contribution to X2 via period retained earnings added to Total Retained Earnings. and therefore to equity which influences X4. Increased profit plus improved asset utilization is best
near term opportunity to improve Z-Score.
X2 = Total Retained Earnings / Total Assets is next most significant factor after X5. Earnings retention is vital for fueling business growth and contributing to improved equity. X2 is dependent on consistent EBIT
contribution to earning and improving cash flow sufficiency.
X1 = Working Capital / Total Assets is the least significant contibutor to Z-Score but closely parallels X3 influence. High or Low X1 values can be equally detrimental to supporing sales. Check for balance in
Working Capital components including relationhip to sales, Cost of Sales, debt, inventory, cash and accounts receivable. Often is a leading factor in cash flow sufficiency problems.
107 Company Fiscal Period Sample Points for Z-Score ComputationZ-Score = 1.2 * X1 + 1.4 * X2 + 3.3 * X3 + 0.6 * X4 + 0.999 * X5
1.8
3.0
4.0
5.0
6.0
X5
X4X1
X3
X2
Figure 2 Contributions to Z-Score

Altman Z-Score: Not Just for Bankruptcy
Copyright 2013 AMPros Corporation, All Rights Reserved Page 9
combination of positive and/or negative contributing ratio values.
Healthy companies can have one or two negative or poor performance ratio contributions, and an
apparently risky company can have some positive components. Ignored, the negative components do
not self-correct. Without all ratios contributing positively, a business can quickly find itself in an
unsustainable situation and fighting for survival.
Speedometer Charts and Performance Guidelines The objective for the current Z-Score critical examination is its potential use in providing management
guidance for business survivability. The data used for this effort included financial information from the
North American Industrial Classification System (NAICS) and specifically from the manufacturing
industrial segments, including classifications 32 – 33. In fact, the data used includes all of the 3xx
industrial segments. Eighty-eight of the companies included in the Recycling Benchmark study with Z-
Scores <=8.0 (Figure 2 above) were used for comparison to the NAICS results.
All data conformed to descriptive statistics analysis at the confidence level (95%). The guideline limits
and results presented below are in the form of “speedometer” charts. Four color zones define each
chart. Red is for values falling into the danger or distressed zone; yellow is the cautionary zone; green
represents a nominal safe zone; finally, blue is the zone of superior performance although some caution
Figure 3 Recycling Benchmark Z-Score
Figure 4 NAICS 3XX vs. Mfg Companies Z-Score
Figure 5 Z' Score Computation for NAICS 3XX
Figure 6 Z" Score Computation for NAICS 3XX
4.005.46
1
2
34
5
6
7
Z-Score Performance
Recycling Companies vs Benchmark Mfg Companies
Benchmark= Dark Blue Arrow
Recycling Companies = Red Arrow
< 1.8 Bankruptcy Likely; Red Zone
>= 1.8 - 2.99 Uncertain; Yellow Zone
>= 3.0 Bankruptcy Unlikely; Green / Blue Zones
3.743.97
1
2
34
5
6
7
Z-Score Performance
NAICS 3XX vs 88 Mfg Companies
NAICS = Dark Blue Arrow: n = 1826
88 Companies = Red Arrow: n = 88
< 1.8 Bankruptcy Likely; Red Zone
>= 1.8 - 2.99 Uncertain; Yellow Zone
>= 3.0 Bankruptcy Unlikely; Green / Blue Zones
3.313.19
1
2
34
5
6
7
Z'-Score Performance
NAICS 3XX vs 88 Mfg Companies
NAICS = Dark Blue Arrow: n = 1826
88 Companies = Red Arrow: n = 88
< 1.23 Bankruptcy Likely; Red Zone
>= 1.23 - < 2.9 Uncertain; Yellow Zone
>= 2.9 Bankruptcy Unlikely; Green / Blue Zones
3.965.24
1
2
34
5
6
7
Z"-Score Performance
NAICS 3XX vs 88 Mfg Companies
NAICS = Dark Blue Arrow: n = 1826
88 Companies = Red Arrow: n = 88
< 1.1 Bankruptcy Likely; Red Zone
<= 1.1 - < 2.6 Uncertain: Yellow Zone
>= 2.6 Bankruptcy Unlikely; Green / Blue Zones

Altman Z-Score: Not Just for Bankruptcy
Copyright 2013 AMPros Corporation, All Rights Reserved Page 10
is warranted.
The speedometer chart limits for the Z-Score red, yellow and green color zones is set by the ranges
defined by Dr. Altman with the exception that there appeared to be a logical break at Z-Score 5.0. The
maximum Z-Score was 8.0 to avoid distortion by very high market equity contributions to scores above
this limit.
Figures 3, 4, 5 & 6 provide a comparative view and link from the Benchmarking report Z-Score results to
the present data set along with illustration of computed results for the Altman Z-Score, Z’ Score and Z”
Score charts.
Figure 3 illustrates that the overall Z-Score for recycling companies was 5.46 (red arrow) while the target
improvement goal for those poorly performing companies was to achieve a nominal 4.00 Z-Score (dark
blue arrow). Note that as part of the Recycling Industry Benchmarking report, each company received
confidential, individualized feedback and recommended actions to improve their business operations.
Figures four through six compare 88 public companies used as part of the Recycling Benchmark study to
the results from the NAICS data. Over 1,800 financial data points contribute to the analysis and the
guidelines presented in subsequent charts.
A red arrow represents the "88 companies" in each chart below and subsequent pages. The value
represented by the red arrow is in the upper left corner of each chart. The blue arrow represents NAICS
results. The corresponding value for the blue arrow is in the upper right corner of each chart.
Within each chart are range limits for the Z-Score results per Dr. Altman or as appropriate the “Green
Zone” limit for the Z-Score contributing ratio.
The financial data used in the Benchmarking report and NAICS are contemporary and, at this writing,
eight to nine years old. One might argue the data is too old and not relevant to today’s businesses.
Before dismissing the suggested guidelines as being irrelevant, consider that Dr Altman developed the Z-
Score originally in 1968 and subsequent versions in the 1970’s. The Z-Score guidelines were accurate in
predicting bankruptcy then and continue to do so now, some 45 years later. If the Z-Score limits and
guidelines continue to be valid, then so must be the underlying ratios that contribute to the Z-Score
result.
The “Green Zone” One can argue the relative importance as to one ratio over another. Valid arguments can be that EBIT is
the most important ratio factor or that Retained Earnings should be first. The argument might further
expand, that without Sales there can be no EBIT, therefore no Retained Earnings, and ultimately no
Equity. We make no assertion on relative importance except for the need and desire to achieve
business financial performance that falls within the Green Zone for each Z-Score contributing ratio.
NOTE: Data for computing the Z-Score ratios come from both the Income Statement and Balance Sheet
and represent a single point in time. To get a proper sense of performance whether historical or for Pro

Altman Z-Score: Not Just for Bankruptcy
Copyright 2013 AMPros Corporation, All Rights Reserved Page 11
Forma projections, one must look at the trend over at least three business cycles or operating periods.
Subsequent sections of this document provide performance trends for several companies.
Interpret performance results by the ratio value and change over time. If performance initially was in
the green zone but progresses into the yellow and nearing the red zone, then there is cause for taking
management action in those operational areas that contribute to the deteriorating ratio value.
If performance ratios are all in the green zone, the company Z-Score will be in the green zone between
3.0 and 5.0. Alternatively, if all ratios are in the yellow zone, the company is in the zone of uncertainty
and perhaps headed toward the red zone indicating business distress and potential bankruptcy.
Management action to improve the red and/or yellow zone Z-Score contributing ratios is required to
achieve a green or blue zone performance ranking.
A “safe” company may have a Z-Score between 3.0 and 5.0, but that does not mean the company is
financially sound. It may have one or two contributing ratios in the yellow or even red zone. The ratios
are indicators as to potential problems within the business that need further management attention. If
all ratios are in the blue zone, the business may be the best in class that all others would like to emulate.
Figure 7 is Working Capital to Total Assets (X1). Note that the 88 public manufacturing companies have
performance at the low end of the green zone but only slightly below the 0.23 value for NAICS 3XX
performance result. The result from the 88 companies is in relatively close agreement and comparison
with the NAICS working capital ratio results.
Figure 7 X1 Working Capital Ratio
Guiding Principles:
X1 = Working Capital / Total Assets is the least significant contributor to Z-Score but closely parallels X3 influence. High or Low X1 values can be equally detrimental to supporting sales. Check for balance in Working Capital components including relationship to sales, Cost of Sales, debt, inventory, cash and accounts receivable. Often is a leading factor in cash flow sufficiency problems. Caution is advised for very high X1 values.
Target Green Zone ratios
Z-Score = 0.181 – 0.314
Z’ Score = 0.176 – 0.355
Z” Score = 0.149 – 0.294
Some guiding principles are included alongside the speedometer chart. For X1, if it is has a negative
value then action must be immediately taken to correct the working capital situation. A negative value
indicates current assets are less than current liabilities. Put another way, there are not enough current
assets available to meet the current obligations of the company and is a sign of financial weakness.
Next up is X2, Figure 8, Total Retained Earnings to Total Assets ratio. It is an indication of how
management supports the business with cumulative earnings over time. Dividend practices and
earnings payout directly affect this ratio. Corporate structure also has an impact as earnings may be
treated differently under subchapter S versus “C” corporation or LLC or other proprietorship
organizations and/or structures.
0.230.19
-0.15
-0.10
0.00
0.100.20 0.30
0.40
0.50
0.60
X1 = Working Capital / Total Assets
Z Green Zone = 0.181 - 0.317
Z' Green Zone = 0.176 - 0.355
Z" Green Zone = 0.149 - 0.294
NAICS 3XX = Dark Blue Arrow
Public Companies = Red Arrow

Altman Z-Score: Not Just for Bankruptcy
Copyright 2013 AMPros Corporation, All Rights Reserved Page 12
Dr. Altman asserts that the most important ratio over time is Total Retained Earnings / Total Assets. He
may be right because it is one driver of business growth potential. However, keep in mind that you
cannot have retained earnings without productive sales results and EBIT contribution from operations.
As with the X1 component, there is good correspondence between the 88 manufacturing company X2
ratio and NAICS results, 0.31 and 0.34 respectively. The interpretation is that the suggested Green Zone
value range is reasonable.
Note that the Green Zone range of values for each form of the Altman Z-Score is also included with each
financial measure guiding principles.
X3, EBIT / Total Assets ratio, Figure 9, is the most important contributing ratio in the opinion of this
author. Negative values indicate profit loss before interest and taxes are considered. This adverse
circumstance must be corrected.
Many companies experience a loss at some time or other so a single period result may not be
detrimental, but a continuing trend of losses directly affects business long-term survivability. Creditors
and lenders lose faith and make borrowing money more difficult. Retained earnings consumption
and/or additional debt are required to sustain the business.
This one ratio (X3) has an immediate impact on all the other Z-Score contributing ratios. For
survivability, the business practitioner must look at pricing strategies, expense and cost reduction
Figure 8 X2 Total Retained Earnings Ratio
Guiding Principles:
X2 = Total Retained Earnings / Total Assets is next most significant factor after X5. Earnings retention is vital for fueling business growth and contributing to improved equity. X2 is dependent on consistent EBIT contribution to earnings and improving cash flow sufficiency. Examine payout and dividend policies if this ratio deteriorates and moves into the yellow zone.
Target Green Zone ratios
Z-Score = 0.275 – 0.454
Z’ Score = 0.269 – 0.513
Z” Score = 0.227 – 0.425
Figure 9 X3 EBIT Ratio
Guiding Principles:
X3 = EBIT / Total Assets drives contribution to X2 via period retained earnings added to Total Retained Earning and therefore to equity which influences X4. Increased profit plus improved asset utilization such as multiple shift operation is best near term opportunity to improve Z-Score. Examination of product pricing strategies and expense reduction may be in order.
Target Green Zone ratios
Z-Score = 0.088 – 0.146
Z’ Score = 0.086 – 0.165 Z” Score = 0.072 – 0.137
0.340.31
0.7
0.8-0.1
0.0
0.1
0.20.3 0.4
0.5
0.6
X2 = Total Ret. Earnings / Total Assets
Z Green Zone = 0.275 - 0.454
Z' Green Zone = 0.269 - 0.513
Z" Green Zone = 0.227 - 0.425
NAICS 3XX = Dark Blue Arrow
Public Companies = Red Arrow
0.10 0.11
0.0
0.05
0.1 0.15
0.2
0.25
X3 = EBIT / Total Assets
Z Green Zone = 0.088 - 0.146
Z' Green Zone = 0.086 - 0.165
Z" Green Zone = 0.072 - 0.137
NAICS 3XX = Dark Blue Arrow
Public Companies = Red Arrow

Altman Z-Score: Not Just for Bankruptcy
Copyright 2013 AMPros Corporation, All Rights Reserved Page 13
opportunities, reduced earnings payout and when possible to use debt leverage to fuel growth and
improved operational performance.
Shoot for the X3 Green Zone, and many of the other Z-Score ratio contributions will follow along with
improved results.
Note once again the good correspondence between the publicly owned manufacturing companies and
the NAICS X3 ratios of 0.10 and 0.11 respectively.
X4, the Equity to Debt ratio, Figure 10, depends on the value used for the equity component. Public
companies use the market equity value as reflected in its stock market trading value. Private companies
tend to have a lower ratio and rely on owners’ equity; defined as Total Assets minus Total Liabilities.
Some experts even suggest modifying the X4 coefficient depending on gross margin trends.
By definition, Total Assets = Total Liabilities + Total Equity. Total Liabilities may be very small resulting in
very large values for X4, Total Equity / Total Debt. Negatives values for X4 indicate Total Liabilities
exceed Total Assets, which is a very serious situation. Debt management and improved operational
performance in the other four Z-Score ratios substantially influence this ratio.
The dichotomy between the public companies is apparent in Figure 10 where the green zone is occupied
by the red arrow with a value of 2.17 versus the NAICS value of 0.58. Private companies typically have a
lower ratio. Manage and improve the other Z-Score component ratios will tend to move this
performance metric toward the green zone.
Figure 10 X4 Total Equity to Debt Contribution
Guiding Principles:
X4 = Market Value Equity / Total Liabilities and tends to dominate for Z-Score over 5. Ultimately, equity is driven by profit retention and business growth using reasonable balance of debt and equity. High X4 values and Z-Score values over 4 indicate high equity and low debt position, potential exists to use debt to leverage growth. View high ratios with some caution especially for public companies as the market may over value and thereby over rate the company.
Target Green Zone ratios
Z-Score = 1.022 – 2.784
Z’ Score = 0.446 – 0.881
Z” Score = 0.377 – 0.730
Businesses with high X4 values may be able to use debt to leverage additional investment in assets and
stimulate future growth and profitability.
Andrew Thom of ABDO, EICK & MEYERS, LLP, comments. “At a certain point a too high X4 value should
begin to reflect negatively on a company because that means the company is either not returning profits
to shareholders for personal reinvestment or the company is not using its retained profits to fuel its own
growth and expansion through R/D and new ventures. While managing an improving Z-Score can be an
excellent indicator of the overall health of a company, a targeted long-term Z-Score by management
0.582.17
-1
0
0.51 1.5 2
2.5
3
3.5
4
X4 = Total Equity / Total Debt
Z Green Zone = 1.022- 2.784
Z' Green Zone = 0.446 - 0.881
Z" Green Zone = 0.377 - 0.730
NAICS 3XX = Dark Blue Arrow
Public Companies = Red Arrow

Altman Z-Score: Not Just for Bankruptcy
Copyright 2013 AMPros Corporation, All Rights Reserved Page 14
could be used as a measuring stick to determine what level of profits to reinvest, what debt level should
be taken on, and how much equity to return to shareholders.”
X5, Net Sales to Total Assets, Figure 11. This ratio is driven by numerous factors including competition
and product pricing strategies as well as market demand for the business products. Commodity type
products with a lot of competing companies tend to drive this ratio value down. Niche or market
leading innovation products tend to demand higher prices that raise this Z-Score ratio.
However, a very large ratio can mean the company is undercapitalized, or it might have highly
productive assets that have also been highly depreciated. Automated versus labor intensive processes
also have a direct impact on this productivity ratio. One is well advised to examine other financial ratios
such as fixed asset utilization and other productivity ratios.
The NAICS X5 ratio values are superior to that of the public companies, 2.28 versus 1.56 respectively.
The higher value NAICS green zone is the recommended target or goal values. High value but non-
productive assets negatively affect this ratio. It may also be artificially high because of very productive
but highly depreciated assets. It is good practice to consider the Depreciated Asset ratio in concert with
the X5 ratio when evaluating ongoing performance as well as for developing Pro Forma financial
statements and forecasts.
Testing the Limits Now that we have Green Zones defined for all the Z-Score component ratios, a question remains. Are
these data relevant to today’s business environment? One can easily test it by going on line and looking
up publicly-owned company financial data at sites such as Morningstar or Market Watch then plug their
data into the Z-Score computation as well as compare the trend for each ratio to the associated Green
Zone guidelines provided above. Of course, data from privately held companies is not generally
available to the public.
If you don’t know which Z-Score formula to use for any given company including your own, calculate all
three Z-Scores and compare the trends over time. But also keep in mind that the Green Zone guideline
values do not depend on which Z-Score formula is used for bankruptcy prediction. We are interested in
Figure 11 X5 Sales Contribution to Z-Score
Guiding Principles:
X5 = Net Sales / Total Assets and dominates under Z-Score = 5 but is not sufficient to assure survivability and growth. High X5 values may mean under-capitalization and may not sustain sales for the long term. Must be supported by retained earnings to meet cash flow needs, reference X3 and asset utilization ratios. Also, be aware that highly depreciated assets can be very productive and can result in misleading, high ratio value. Always check the Depreciated Asset ratio when making comparisons.
Target Green Zone ratios
Z-Score = 1.839 – 3.043
Z’ Score = 1.797 – 3.440
Z” Score = 1.518 – 2.850
2.281.56
0.5
1
1.5
2 2.5
3
3.5
4X5 = Net Sales / Total Assets
Z Green Zone = 1.839 - 3.043
Z' Green Zone = 1.797 - 3.440
Z" Green Zone = 1.518 - 2.850
NAICS 3XX = Dark Blue Arrow
Public Companies = Red Arrow

Altman Z-Score: Not Just for Bankruptcy
Copyright 2013 AMPros Corporation, All Rights Reserved Page 15
survivability and growth, so the recommendation is to focus on managing the “naked” Z-Score
contributing ratios to achieve results that will be positive and sustainable.
Let’s do a quick test on the Green Zone recommendations referencing a recent article in The Motley
Fool by Timothy Green, March 18, 2013. In this article Mr Green posits the question “Are These
Companies On the Path to Bankruptcy?” He uses the original form of the Z-Score computation to
compare three companies, Advance Micro Devices (AMD), Radio Shack and Groupon. His financial data
was sourced from Morningstar.
Two of the companies are examined below, AMD and Radio Shack, since Groupon has only two year’s of
operation. Only the Z-Score contributing ratio portion of Mr Green’s article is reproduced here for the
two companies in question. In addition, a column is added that includes a brief comment on the year to
year trend.
In the first table, and without delving further into AMD operations, it is apparent from the Z-Score
contributing ratios that it is performing predominantly in the yellow to red zones. Both X5, Sales on
Total Assets and X3, EBIT to Total Assets need significant improvement. The Z-Score is indicating that
AMD is performing similar to companies that have gone bankrupt. Survivability is questionable although
it has good products that are in demand by the cost conscious consumer.
AMD Ratio 2008 2009 2010 2011 2012 Comment on Trend and Performance Zone
X1 0.02 0.23 0.39 0.29 0.22 Trending down but okay for now
X2 (0.81) (0.65) (1.10) (1.00) (1.54) Solid Red performance trending lower – not good
X3 (0.25) 0.07 0.17 0.07 (0.26) Yellow trending toward Red performance – not good
X4 0.17 0.60 1.45 1.48 0.56 Trending yellow performance – not good
X5 0.76 0.60 1.31 1.33 1.36 Trending yellow performance – needs improvement
Z-Score (1.09) 0.55 1.66 1.40 (1.08) Solidly in Red Zone – not good
Radio Shack five-year performance data is presented in the next table along with some trend comments.
The basic multi-year performance trend appears to be superior to AMD but is trending lower. The
comparison between AMD and Radio Shack as presented may not be appropriate using the Z-Score.
AMD is a publicly held manufacturing company while Radio Shack is a publicly held non-manufacturing
company. The Z” Score may be more appropriately applied to Radio Shack instead of the original
Altman Z-Score bankruptcy predictor formula.
Intel Corporation, a direct competitor of AMD, was added to The Motley Fool mix of companies to test
the Green Zone guidelines. Financial data for Intel was also obtained from Morningstar online.
Radio Shack Ratio 2008 2009 2010 2011 2012 Comment on Trend and Performance Zone
X1 0.51 0.56 0.40 0.53 0.44 Trending toward Green from solid Blue performance
X2 0.94 0.96 0.69 0.70 0.59 Trending toward Green from solid Blue performance
X3 0.14 0.15 0.17 0.07 (0.03) Trending solid Green into Red Zone – not good
X4 1.01 1.78 1.40 0.52 0.19 Trending solid Green in Yellow Zone – not good
X5 1.85 1.76 2.06 2.01 1.85 Green Zone but low end
Z-Score 4.84 5.34 4.91 4.17 3.23 Trending from high end Green to Low end of Zone
Z” Score 3.87 4.18 4.04 3.41 2.65 Trending from solid Green to Yellow cautionary Zone

Altman Z-Score: Not Just for Bankruptcy
Copyright 2013 AMPros Corporation, All Rights Reserved Page 16
Speedometer charts are not suitable for comparing multiple period trend information; therefore, a
different type of chart is employed that reproduce the speedometer chart colored performance zones.
One notable difference is that the vertical axis, range of performance values, was expanded to
accommodate the range of business performance exhibited by AMD, Radio Shack and Intel. Expanding
the vertical axis compresses the middle zones, but this merely amplifies when a company such as AMD is
really in a distressed situation.
Examining the grouping of performance ratios charts, Figures 12 through 17, conveys the story. All
three companies have been trending down over the past couple years, but Radio Shack and Intel have
Figure 12 Intel in the Zone, AMD trying hard Figure 13 AMD deep in the red zone
Figure 14. AMD a leap and a miss Figure 15. Intel compensates for distressing X5 performance
Figure 16 AMD outperforms Intel in X5 but still cautionary Figure 17 Z-Score, the sum of it all
0.02
0.23
0.29
0.22
0.510.56
0.40 0.530.44
0.24 0.26 0.35
0.20
0.22
-0.05
0.00
0.05
0.10
0.15
0.20
0.25
0.30
0.35
0.40
0.45
0.50
0.55
0.60
2008 2009 2010 2011 2012
X1 Working Capital / Total Assets
AMDRadio ShackIntel
-0.81-0.65
-1.10-1.00 -1.54
0.94 0.960.69 0.7
0.59
0.52 0.50 0.520.42 0.38
-1.65
-1.40
-1.15
-0.90
-0.65
-0.40
-0.15
0.10
0.35
0.60
0.85
1.10
2008 2009 2010 2011 2012
X2 Total Ret. Earnings / Total Assets
AMDRadio ShackIntel
-0.25
0.070.17
0.07
-0.26
0.14
0.15
-0.03
0.180.25
0.250.17
-0.30
-0.25
-0.20
-0.15
-0.10
-0.05
0.00
0.05
0.10
0.15
0.20
0.25
0.30
2008 2009 2010 2011 2012
X3 EBIT / Total Assets
AMDRadio ShackIntel
0.17
0.61.45
1.48
0.561.01
1.781.40
0.52
0.19
5.07
7.03
6.22
4.04 2.41
-1.00
0.00
1.00
2.00
3.00
4.00
5.00
6.00
7.00
2008 2009 2010 2011 2012
X4 Market Equity / Total Debt
AMDRadio ShackIntel
0.760.60
1.31 1.331.36
1.85 1.762.06 2.01
1.85
0.74 0.66 0.69 0.76 0.630.00
0.50
1.00
1.50
2.00
2.50
3.00
3.50
4.00
2008 2009 2010 2011 2012
X5 Net Sales / Total Assets
AMDRadio ShackIntel
-1.07
0.56
1.671.40
-1.06
4.845.34
4.904.17
3.22
5.38
6.23 6.39
4.81
3.44
-2.0
-1.0
0.0
1.0
2.0
3.0
4.0
5.0
6.0
7.0
8.0
2008 2009 2010 2011 2012
Z Score Trend Comparison
AMDRadio ShackIntel
Altman Z-Score: Not Just for Bankruptcy
Copyright 2013 AMPros Corporation, All Rights Reserved Page 17
generally been riding along in the blue and green zones. AMD has been lagging behind though trying
hard, unsuccessfully, to get up into the green zone. The Z-Score indicates that AMD is in a distressed
situation. The zones of performance show that AMD is experiencing red zone performance in two critcal
areas, earnings on assets employed and retained earnings. Sales are in the cautionary performance
zone while working capital seems to be in the green zone, but the trend is negative.
To follow up on The Motley Fool question but focused on survivability rather than bankruptcy, how
would you apply the Green Zone trends and guidelines? If you were AMD’s CEO, where would you focus
your improvement actions? Would you strive for the Green Zone? Could the Green Zone guidelines
have been helpful several years ago?
What opportunity for improvement is indicated for Intel? It is a strong company with desirable market
position and products. However, the sales on assets is in distress and needs improvement to offset the
decline in market equity.
Still not convinced that the Green Zone guidelines presented in the speedometer and trend line charts
could contribute to business survivability? Test the limits with one more group of trend charts and more
real company performance information.
An on-line article written by the CI Staff of Computerized Investing, “The Altman Z-Score”, states “The
biggest calamity that can befall equity investors is corporate bankruptcy, which wipes out the equity of a
firm and knocks the stock’s investment value down to zero.” In this article, the Altman Z-Score is
applied to analyze a company that went bankrupt. Border’s Group, parent to former Border’s Book
Stores and other brand name subsidiaries, filed for bankruptcy in February 2011 and later that year for
liquidation. The prior five-years of financial information is presented by the CI Staff to illustrate Border’s
performance trend prior to filling bankruptcy.
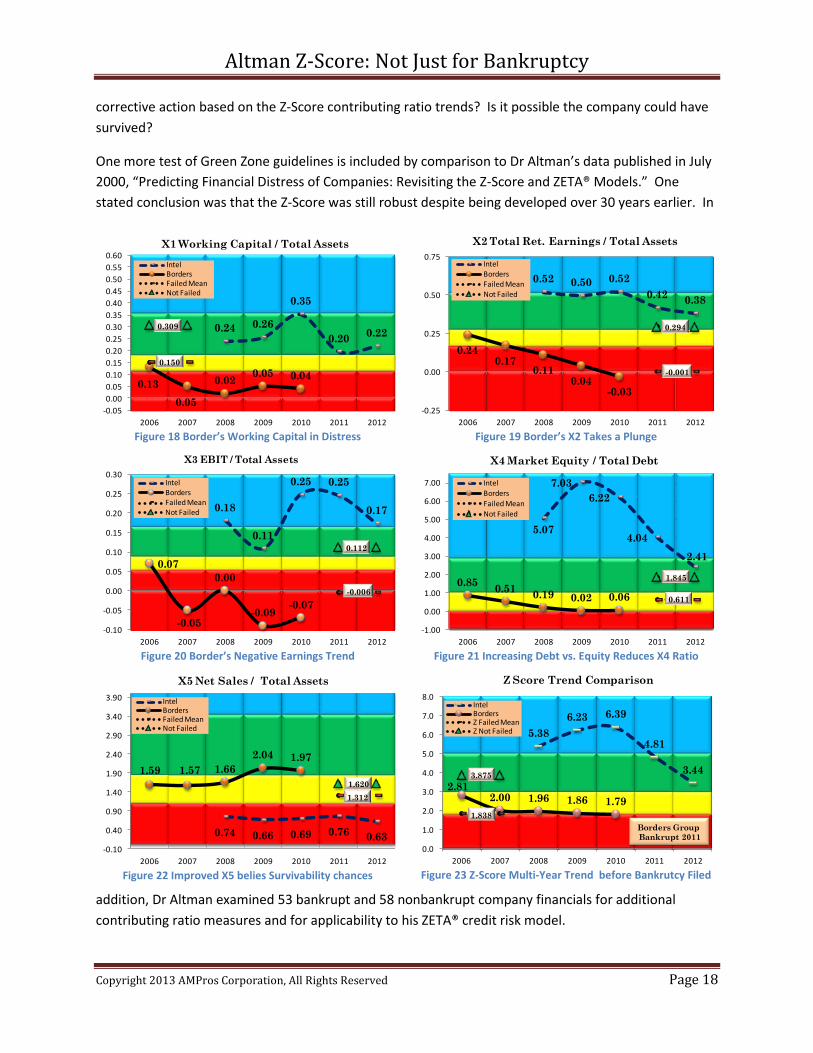
The Z-Score contributing ratios are incorporated into the Green Zone trend charts, Figures 18 through
23, for comparison to the Intel Corporation multi-year performance presented in the previous chart
group.
Z-Score was originally developed to aid in predicting the potential bankruptcy. When the score drops to
1.81 or below, the company is said to be highly stressed and bankruptcy is likely. Figure 23 clearly
shows the Z-Score trend was in the Yellow cautionary zone and bordering on the Red zone for several
years before Border’s Group filed bankruptcy.
Was there any indication that something was wrong before they went off the cliff that might have
helped them survive? The answer is unequivocally YES!
Refer to Figures 18 through 23. Examine the contributing ratios trends for working capital, retained
earnings and EBIT. All ratios were in the red zone and trending downward for five years before
bankruptcy. The low equity to debt ratio indicates the company was increasingly dependent on debt
and/or consuming retained earnings to maintain operations. What if the management team took
Altman Z-Score: Not Just for Bankruptcy
Copyright 2013 AMPros Corporation, All Rights Reserved Page 18
corrective action based on the Z-Score contributing ratio trends? Is it possible the company could have
survived?
One more test of Green Zone guidelines is included by comparison to Dr Altman’s data published in July
2000, “Predicting Financial Distress of Companies: Revisiting the Z-Score and ZETA® Models.” One
stated conclusion was that the Z-Score was still robust despite being developed over 30 years earlier. In
addition, Dr Altman examined 53 bankrupt and 58 nonbankrupt company financials for additional
contributing ratio measures and for applicability to his ZETA® credit risk model.
Figure 18 Border’s Working Capital in Distress Figure 19 Border’s X2 Takes a Plunge
Figure 20 Border’s Negative Earnings Trend Figure 21 Increasing Debt vs. Equity Reduces X4 Ratio
Figure 22 Improved X5 belies Survivability chances Figure 23 Z-Score Multi-Year Trend before Bankrutcy Filed
0.24 0.26
0.35
0.200.22
0.13
0.05
0.020.05 0.04
0.150
0.309
-0.05
0.00
0.05
0.10
0.15
0.20
0.25
0.30
0.35
0.40
0.45
0.50
0.55
0.60
2006 2007 2008 2009 2010 2011 2012
X1 Working Capital / Total Assets
IntelBordersFailed MeanNot Failed
0.52 0.50 0.52
0.420.38
0.240.17
0.110.04
-0.03
-0.001
0.294
-0.25
0.00
0.25
0.50
0.75
2006 2007 2008 2009 2010 2011 2012
X2 Total Ret. Earnings / Total Assets
IntelBordersFailed MeanNot Failed
0.18
0.11
0.25 0.25
0.17
0.07
-0.05
0.00
-0.09-0.07
-0.006
0.112
-0.10
-0.05
0.00
0.05
0.10
0.15
0.20
0.25
0.30
2006 2007 2008 2009 2010 2011 2012
X3 EBIT / Total Assets
IntelBordersFailed MeanNot Failed
5.07
7.03
6.22
4.04
2.41
0.850.51
0.19 0.02 0.06 0.611
1.845
-1.00
0.00
1.00
2.00
3.00
4.00
5.00
6.00
7.00
2006 2007 2008 2009 2010 2011 2012
X4 Market Equity / Total Debt
Intel
Borders
Failed Mean
Not Failed
0.74 0.66 0.69 0.76 0.63
1.59 1.57 1.66
2.04 1.97
1.312
1.620
-0.10
0.40
0.90
1.40
1.90
2.40
2.90
3.40
3.90
2006 2007 2008 2009 2010 2011 2012
X5 Net Sales / Total Assets
IntelBordersFailed MeanNot Failed
5.38
6.23 6.39
4.81
3.44
2.812.00 1.96 1.86 1.79
1.838
3.875
0.0
1.0
2.0
3.0
4.0
5.0
6.0
7.0
8.0
2006 2007 2008 2009 2010 2011 2012
Z Score Trend Comparison
IntelBordersZ Failed MeanZ Not Failed
Borders Group Bankrupt 2011

Altman Z-Score: Not Just for Bankruptcy
Copyright 2013 AMPros Corporation, All Rights Reserved Page 19
Appendix A of the Altman article, presents several measures, along with associated statistics, including
the Z-Score contributing ratio mean value for both failed and non failed companies. These ratio mean
values are plotted on the relevant trend chart, Figures 18 through 23. Compare these published ratios
to the Green Zone guidelines presented in this article.
Overall, the ratio mean values from Dr Altman’s article fall into Green Zone for non-bankrupt companies
and Yellow or Red Zone for the failed and bankrupt businesses. The “failed” mean value for the Z-Score
in the present guideline development was 1.602 versus 1.838 reported in the Dr Altman’s July 2000
article. Similarly, the “non failed” Z-Score mean was 3.881 in the present work versus 3.785 in the July
2000 article.
Conclusion The power and resilience of the Altman Z-Score has been demonstrated for over four decades. A major
reason for the durability and relevance of the Z-Score is that it incorporates within a single measure five
measures representing business Profitability, Liquidity, Efficiency, Productivity and Leverage or
Coverage. Each measure individually and collectively yields insight to business performance and
expectations for sustainable growth and in fact survivability over time. The Altman Z-Score puts
everything under one measure which predicts potential bankruptcy. AMPros Corporation looked under
the hood of the Z-Score and the contributing ratio values. A range of operating values, color coded by
performance zone, was developed for business management and investment guidance.
We conclude that the recommended “Green Zone” performance metric values are relevant and should
be adopted as part of the tool set for evaluating business performance, improvement and survivability.
Lori Tapani, Co-President and Co-Owner, Wyoming Machine states that “monitoring and making
adjustments to business operations based on these Green Zone metrics can help with growth,
profitability and prosperity over the long haul – much more than pure survival.”
Are the Z-Score and contributing ratios the only financial ratios needed? Absolutely not, but utilizing
these results and guidelines is a good place to evaluate business survivability and focus for action. Use
the guidelines for establishing goals in forecasting budgets or developing business plans and proforma
financial statements. The guidelines provide some additional benchmarks for due diligence in business
mergers and acquisitions. In particular, these guidelines are helpful to those striving for financial
investments and funding whether needed for a start up or to expand an existing business.
The Green Zone is business’ End Zone.
Questions and comments may be directed to [email protected] or through LinkedIn®.
About the Author: Dan Hauschild is co-founder of AMPros Corporation, a business consultancy dedicated to assisting
businesses improve operations and financial performance as well as developing business plans and
Altman Z-Score: Not Just for Bankruptcy
Copyright 2013 AMPros Corporation, All Rights Reserved Page 20
strategies for new and emerging businesses. His 40 plus year career is divided almost evenly between
being inside manufacturing operations at a major manufacturing company and outside as a consultant
and entreprenuer. He has turned his training in chemistry, science, business and manufacturing
technology into a disciplined approach to financial analysis and improvement of business operations.
Disclaimer: The advice and guidelines presented are based on business and market information and do
not constitute legal or accounting advice or counsel. AMPros Corporation has no control over the
actions of those applying these guidelines and assume no responsbility for such actions. Other factors
may come into play such as managements misstatement of company financial conditions or fraud which
would distort the results from application of the suggested guidelines. In other words, garbage in;
garbage out. i
ProfitizeIt® is a registered trademark of AMPros Corporation. All other marks and rights, such as ZETA®, are the property of their respective owners. Financial ratio analysis and computation was performed with AMPros Corporation’s ProfitizeIt® financial analysis software tools.
Descriptive Statistics analyses were performed and charts developed using Microsoft® EXCEL®;
References and Sources United States Courts, “Bankruptcy Filings Down in Fiscal Year 2012”, November 07, 2012,
http://news.uscourts.gov
U.S. Environmental Protection Agency, report Section Six “Analysis of Firm-Level Impacts”
Hauschild, Dan, “Final Report Recycling Industry Benchmarking and Performance
Measurement”, January 2005
Green, Timothy, “Are These Companies on The Path to Bankruptcy?”, The Motley Fool, March
18, 2013
Altman, Edward I., “Predicting the Financial Distress of Companies: Revisiting the Z-Score and
ZETA® Models”, July 2000, online Internet search
CI Staff, “The Altman Z-Score”, Computerized Investing;
www.aaii.com/computerizedinvesting/article/the-altman-z-score.
Financial Statements for AMD, Radio Shack and Intel from Morningstar online at
www.morningstar.com
Other Reading:
Kyd, Charley, “Predict Business Bankruptcy Using Z Scores with Excel”, August 2008; www.exceluser.com.
Wisehart, Donald P., “Tools & Databases, The Z-Score ‘Crystal Ball’”, February 2010, NACVA Ambassadors’ QuickRead, www.nacva.com
Wikipedia, “Altman Z-Score”, http://en.wikipedia.org/wiki/Altman_Z-Score
The Accounts Receivable Network, “The Z-Score Family, Now Including an App”, www.thearnetwork.com/accounts_receivable/modules
QFinance, Operations Management Calculations, “Z-Score”, www.qfinance.com
Environmental Opportunities, “Altman Z-Score Described”, from Sourcing Decision Support, Inc.

Altman Z-Score: Not Just for Bankruptcy
Copyright 2013 AMPros Corporation, All Rights Reserved Page 21
This Page Written Upon So That It Will Not Be Blank