Borders and Barriers: Perspectives on Aging and Alternative ...
ALTERNATIVE PERSPECTIVES ON THEOVERREPRESENTATION OF NATIVEPEOPLES IN CANADIAN CORRECTIONALINSTITUTIONS: THE CASE S T U D Y OFALBERTA
Xavier Cattarinich607 Woodpark Crescent S.W.Calgary, AlbertaCanada, T2W 2S1
Abstract / Résumé
Alternative hypotheses for the overrepresentation of Native peoples inCanadian correctional institutions, emphasizeage and socialclass insteadof race as the most salient variables. These are evaluated by means of ananalysis of existing statistics. The author's data disconfirms the age hy-pothesis, but indicate that the social class hypothesis may hold merit.
Des contre-propositions mettent de I'emphase sur I'âge et le statut socialplutôt que sur la race du forçat comme principales variables explique lenombre disproportionné d'autochtones dans les prisons canadiennes. Cesvariables sont étudiées à travers une analyse des statistiques actuelles.Les données de I'auteur ne supportent pas I'hypothèse qui met en valeurle jeune âge des forçats autochtones, mais elles indiquent que le statutsocial de ceux-ci joue un rôle dans le phénomène.
The Canadian Journal o fNative Studies XVI, 1(1996):15-36.
16 Xavier Cattarinich
I n t r o d u c t i o n and R e v i e w o f the L i t e r a t u r e
The overrepresentation of Native peoples (i.e., Status and non-StatusIndians, Mét is and Inui t ) in Canadian correctional institutions, when com-p a r e d to the proportion of the general Canadian populat ion they represent,is a phenomenon wh ich has been widely documented over the past twodecades in the academic literature as well as in government reports(Aboriginal Justice Inquiry of Manitoba, 1991; Badcock, 1976; CanadianCorrections Association, 1967; C a w s e y Report, 1991a; C l a r k et al., 1989;Department of Justice, 1991; Finkler, 1976; Law R e f o r m Commission ofC a n a d a , 1 9 9 1 ; R o y a l C o m m i s s i o n on A b o r i g i n a l P e o p l e s , 1 9 9 3 ;Schmeiser, 1974). Statistics show that in 1991-1992, Native offendersaccounted for 11% of total admissions to federal penitent iar ies and 24% ofadmissions to provincial penitent iar ies nat ional ly , while the Native popula-t ion only represented perhaps 2.3% of the total Canadian populat ion(Canadian C e n t r e for Justice Statistics, 1993:74; Statistics Canada, 1993a).The proportion is even higher in the west , part icular ly in the prai r ieprovinces. In Manitoba (1991-1992), Native people accounted for 38% offederal and 50% of provincial inmate admissions, w h i l e representing ap-proximately 9% of the total provincial populat ion; in Saskatchewan, theyaccounted for 55% of federal and 66% of provincial inmate admissions,w h i l e also representing approximately 9% of the total provincial populat ion;and in Alberta, they accounted for 22% of federal and 33% of provincialinmate admissions, w h i l e representing about 4% of the total provincialpopulat ion (Canadian C e n t r e for Justice Statistics, 1993:106, 119-20; Sta-tistics Canada, 1993a). ¹ It is commonly acknowledged, however , thatoff ic ial statistics underestimate the true leve ls of Aboriginal incarceration inCanada. 2
When interpreted liberally, the differences b e t w e e n racial composit ionratios in the inmate and general populat ions can easi ly lead one to concludeei ther that Native people engage in criminal behaviour more frequent ly thando non-Natives, or that Native people are the vict ims of discrimination inthe criminal justice s y s t e m . T h e s e conceptualizations, of course, are notmutual ly exclusive.
R e s e a r c h by H a g a n (1974a; 1974b; 1975a; 1975b) in Alberta implicitlysupports the f o r m e r v i e w . H a g a n ' s analysis
.. .chal lenges popular conceptions about criminal justice. Forexample, it is frequent ly argued that Native and l o w e r socio-economic defendants receive dif ferential treatment from thecou r t s . However , our analysis reveals that when legal variablesare held constant, differences in sentences are min ima l . L e g a l

Alternative Perspectives 17
variables--prior convict ions and the number and type ofc h a r g e s - - a r e found to be salient at all s t a g e s of the sentencingprocess .
O t h e r variables are also s h o w n to inf luence sentencing. At theprosecution stage, presence of defence counsel, initial p lea,and charge alterat ion are important. Simi lar ly , at the pre-sen-tencing stage, the probation officer's perception of demeanor,assessmen t of success prospects, and recommendation forsentence are influential. However , the extent to wh i ch theseare race or class-connected is not large (1975a:v).
Questions st i l l remain, however , as to just how general izable Hagan'sf indings might be. For instance, W y n n e and Hartnagel (1975:153), b a s e don an analysis of Edmonton courtroom data, found that race (i.e., beingNative) acts as an intervening var iable under certain condit ions and affectsthe a c c u s e d ' sc h a n c e of successfully negot iat ing a plea. They conclude thatthe i r results
. . .appear to offer some s u p p o r t for the posit ion... that theminori ty g r o u p defendant is disadvantaged in the p rocess ofcriminal justice administrat ion, at l e a s t with respect to thata s p e c t of the p rocess examined here (Ibid.).
H a g a n himsel f notes that in rural a reas , "[p]robation officers...sentenceIndian and Mét is offenders severely, w i t h o u t the just i f icat ion of correlatedlegal variables (i .e., pr ior record, offense seriousness, and number ofc h a r g e s ) " (1977a:609). R e s e a r c h by Hann and H a r m a n (1986) also s e e m sto s u p p o r t assertions that Native inmates are more l ike ly to be denied parolethan non-Natives.
Morse and Lock (1988:84) found that Aboriginal inmates attr ibute thesedisparit ies to discriminatory practices inherent within the entire criminaljustice s y s t e m . Unfortunately, they provided no data with wh i ch one couldc o m p a r e these att i tudes with t hose of non-Native inmates and with t hoseof Native people in the general populat ion. Though Morse and L o c k ' sresearch f o c u s s e d on perceptions, the Aboriginal Justice Inquiry of Mani-toba (1991) asserted that t hese perceptions have a def in i te basis in real i ty,that "the justice sys tem discriminates against Aboriginal peop le at v i r tual lye v e r y point" (1991:86). Th is general conclusion has been echoed by C l a r ket al. in Nova Scot ia and the C a w s e y R e p o r t (1991a) in Alberta as well.Nevertheless, one must be aware that discrimination can take d i v e r s efo rms , and may also vary in the way it is def ined by different people atdif ferent t imes (Hagan, 1977b).
Despite conf l ic t ing findings, all the research cited a b o v e may hold onef law in c o m m o n :
18 Xavier Cattarinich
Reliance on the s t a n d a r d of aboriginal populat ion ratios, i .e. ,inmate v e r s u s general populations, has obscured other waysof understanding over-representation. For example, if onechanged the standard to aboriginal and non-aboriginal agedistribution in the general populat ion, the "over-representation"picture might look qui te dif ferent. Higher birth rates and l o w e rlife expectancy s u g g e s t s a relat ively larger aboriginal 14-25year old age group. The aboriginal percentage of this g r o u p ishigher than the aboriginal percentage of the general popula-t ion. Th is is also the g r o u p with the highest part ic ipat ion rate inthe criminal justice s y s t e m ; so it w o u l d not be surprising to seehigh aboriginal representation a m o n g offenders of this group.W h e t h e r this g r o u p w o u l d be disproport ionately represented isanother question...
Simi lar ly , if one fo l l ows the theoretical approach of the crit icalcriminologists and uses c lass ( b a s e d on socioeconomic level )as the s t a n d a r d and predictor of who goes to jail, aboriginalpeop le may well be stat ist ical ly under-represented. Given thesame economic real i ty, non-aboriginal offence rates w o u l d nodoubt be much higher. T h e r e are, then, dif ferent ways to lookat the over-representation i s s u e and relying solely on popula-t ion ratios may limit the analysis (LaPrairie, 1990:429-30, i ta l icsin original).
Indeed, th is possibil i ty had been out l ined ear l ier by Bienvenue and Lat i f(1974:114) with regards to the disproportionate rates of a r res t experiencedby Natives in Winnipeg; and Satzewich and Wotherspoon have founds u p p o r t for th is c l ass (rather than racial ly) b a s e d hypothesis about theoverrepresentation of Native people in prisons, referring to data wh ich
.. . indicate that nat ive and non-native offenders share somec o m m o n experiences b a s e d on c lass and gender charac-teristics, ref lect ive in part icular of a s e g m e n t of the populat ionfor wh i ch on ly marginal and intermit tent employment is l ike ly(1993:191).
The question th is paper intends to add ress is: to what extent are age andsocial c l ass more useful variables than race when attempting to understandthe overrepresentation of Native people in the correctional inst i tut ions ofAlberta?
If we adopt LaPrairie's reasoning, we can s t a t e our hypotheses asfo l l ows :
H1: the degree to wh ich race, i .e. , being Native, will be associated withoverrepresentation in correctional inst i tut ions will decl ine when we
Alternative Perspectives 19
c o m p a r e the age distr ibution of Natives in the general populat ionwith the age distr ibution of the total inmate populat ion.
H2: the d e g r e e to wh ich race (i .e., being Native) will be associated withoverrepresentation in correctional inst i tut ions will decl ine when wecontrol for the s o c i a l c l ass of Native people in the general popula-t ion.
M e t h o d o l o g y
For the p u r p o s e s of this art ic le, race will indicate w h e t h e r an indiv idualis Native (that is, Status or non-Status Indian, Métis, or Inuit) or non-Native(anyone else). It should be noted that this dist inct ion is b a s e d on legaldef in i t ions rather than biological characteristics (Frideres, 1993: chapter 2).Age refers to how old a person is in years. Social c lass refers to thesocioeconomic status one occupies in the hierarchy of society. L e v e l ofrepresentation refers to the extent to wh i ch m e m b e r s of a part icular racialgroup, age group, or s o c i a l c l ass are identified in disproportionate numbersin inst i tut ional admission rates when compared to the proportion of thegeneral populat ion they represent.
Th is paper's unit of analysis will be populat ion ratios within provincialcorrectional inst i tut ions in Alberta as well as within the province's generalpopulat ion.3 Existing statistics col lected in the work ing papers of theC a w s e y R e p o r t (1991b) will provide comparative, quant i tat ive data on theage of Native and non-Native offenders admit ted to provincial penitent iar iesin Alberta, and will be compared with 1991 Canadian C e n s u s data describ-ing the general populat ion, Native and non-Native, of the province. Sinceo t h e r extra-legal attr ibutes of inmate populat ions are rarely col lected (Ca-nadian Corrections Association, 1967:21; Rahim, 1977; R o b e r t Paiement,Department of Justice, personal communicat ion, 1994), and if col lected,then not published or made accessible to the pub l ic for a variety of reasons ,we must rely on the observations of o t h e r authors to gain a relat ive idea ofthe c lass composit ion of the inmate populat ion. T h e s e observations will be"compared" once aga in with 1991 C e n s u s data describing the c lass com-posit ion of the general populat ion, using income leve ls and unemploymentr a t e s as broad indicators of social c lass .
Problems related to measurement val id i ty must inev i tab ly a r i se whenindicators are used this way. Though income leve ls and unemploymentrates may be relat ively high in face val id i ty, and they may att i m e s convergewith other indicators wh i ch purport to m e a s u r e social , c lass , e.g., education,occupational status ,. . . , they are most certainly lacking in content val id i ty(Hartnagel, 1992:114-118; Neuman, 1994:130-134). 4 Despite the i r short-
20 Xavier Cattarinich
comings, the indicators selected to m e a s u r e social c l ass and the methodsof comparison out l ined a b o v e should suffice for the purposes of this paper.
Another problem associated with the operat ional izat ion of the variableshas to do with the imperfect overlap b e t w e e n the C a w s e y Report's (1991 b)data and C e n s u s data in t e r m s of age categories. 5 Nevertheless, t hesecategories cannot be more closely approximated, and one should notexpect the results of the f i r s t hypothesis to be altered too dramat ical ly bythis incongruity. As the data will be presented as percentages, it willef fect ively become standardized.
Data Analysis
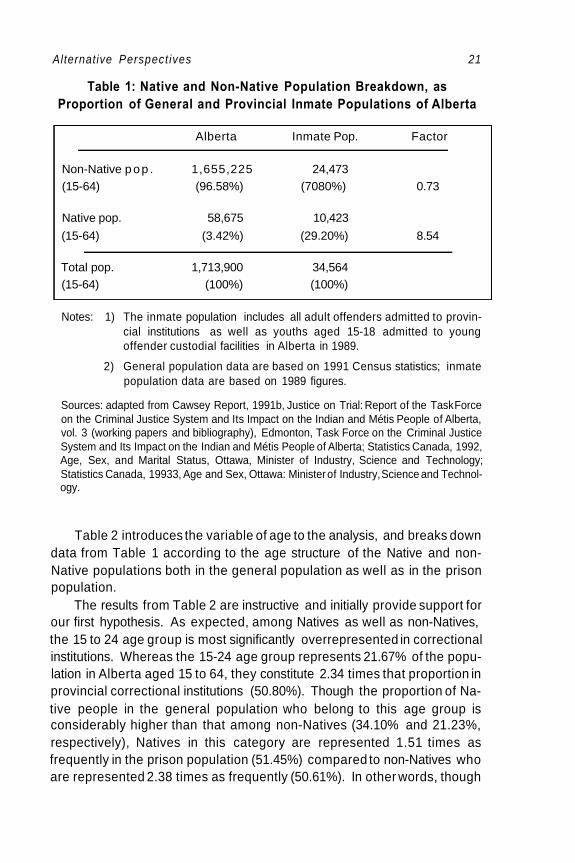
The data in Tab le 1 exp ress the proportions of Native and non-Nativepeople b e t w e e n the ages of 15 and 64 represented in the general populat ionof Alberta as well as in the provincial correctional inst i tut ions of Alberta.Only the populat ion that fa l l s in the 15 to 64 age r a n g e is being consideredhere s i n c e people beyond th is range cannot be incarcerated in adu l tinst i tut ions b e c a u s e of legal r e a s o n s (for t hose who are under 18 y e a r s ofage). L imi t ing the analysis to the 1 5 - 6 4 age range should also permi t moreaccurate comparisons b e t w e e n Aboriginal C e n s u s data (which, u n l e s so the rw ise indicated, often excludes people over the age of 64 in itsstatistics) and prison populat ion data (the incarceration of people over 64y e a r s of age is, stat ist ical ly speaking, extremely rare). The just i f icat ions forinc luding offenders b e t w e e n the ages of 15 and 17 who have been admit tedto other custodial facilities were discussed in the methodology section ofthis paper, and need not be repeated here (see note 5 supra).
Tab le 1 represents what has unt i l now been the conventional way ofdetermining the extent to wh i ch a part icularg r o u p is overrepresented in theprison populat ion, that is to say, by simply comparing general populat ionratios to inmate populat ion ratios.
The numbers in Tab le 1 indicate that even though Native peoplesrepresent 3.42% of the populat ion aged 15 to 64 in Alberta, they represent29.20% of t hose incarcerated in provincial institutions. Conversely, non-Native people represent 95.68% of the populat ion aged 15 to 64 in Alberta,w h i l e on ly representing 70.80% of t hose incarcerated in provincial inst i tu-tions. According to the conventional method of analysis, the fact that Nativepeoples constitute 8.54 t i m e s thei r proportion of the general populat ion inprisons, compared to 0.73 t i m e s for non-Natives, w o u l d lead most ob-se r ve r s to conclude that Aboriginal peoples are severely overrepresentedin correctional institutions.
Alternative Perspect ives 21
Table 1: Native and Non-Native Population Breakdown, as Proportion of General and Provincial Inmate Populations of Alberta
Notes: 1) The inmate population includes all adult offenders admitted to provin- cial institutions as well as youths aged 15-18 admitted to young offender custodial facilities in Alberta in 1989.
2) General population data are based on 1991 Census statistics; inmate population data are based on 1989 figures.
Sources: adapted from Cawsey Report, 1991b, Justice on Trial: Report of the Task Force on the Criminal Justice System and Its Impact on the Indian and Métis People of Alberta, vol. 3 (working papers and bibliography), Edmonton, Task Force on the Criminal Justice System and Its Impact on the Indian and Métis People of Alberta; Statistics Canada, 1992, Age, Sex, and Marital Status, Ottawa, Minister of Industry, Science and Technology; Statistics Canada, 19933, Age and Sex, Ottawa: Minister of Industry, Science and Technol- ogy.
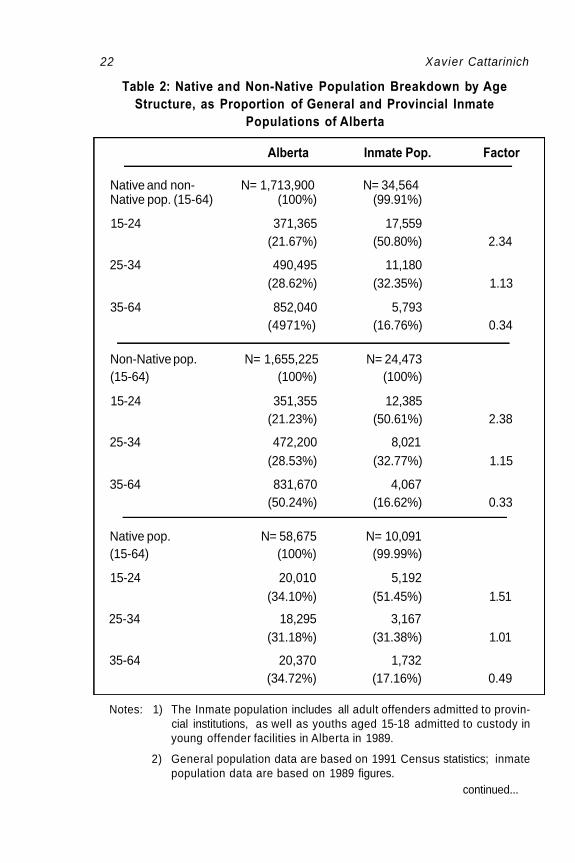
Table 2 introduces the variable of age to the analysis, and breaks down data from Table 1 according to the age structure of the Native and non- Native populations both in the general population as well as in the prison population.
The results from Table 2 are instructive and initially provide support for our first hypothesis. As expected, among Natives as well as non-Natives, the 15 to 24 age group is most significantly overrepresented in correctional institutions. Whereas the 15-24 age group represents 21.67% of the popu- lation in Alberta aged 15 to 64, they constitute 2.34 times that proportion in provincial correctional institutions (50.80%). Though the proportion of Na- tive people in the general population who belong to this age group is considerably higher than that among non-Natives (34.10% and 21.23%, respectively), Natives in this category are represented 1.51 times as frequently in the prison population (51.45%) compared to non-Natives who are represented 2.38 times as frequently (50.61%). In other words, though
Alberta Inmate Pop. Factor
Non-Native p o p . 1,655,225 24,473 (15-64) (96.58%) (7080%) 0.73
Native pop. 58,675 10,423
(15-64) (3.42%) (29.20%) 8.54
Total pop. 1,713,900 34,564 (15-64) (100%) (100%)
22 Xavier Cattarinich
Table 2: Native and Non-Native Population Breakdown by Age Structure, as Proportion of General and Provincial Inmate
Populations of Alberta
Notes: 1) The Inmate population includes all adult offenders admitted to provin- cial institutions, as well as youths aged 15-18 admitted to custody in young offender facilities in Alberta in 1989.
2) General population data are based on 1991 Census statistics; inmate population data are based on 1989 figures.
continued...
Alberta Inmate Pop. Factor
Native and non- N= 1,713,900 N= 34,564 Native pop. (15-64) (100%) (99.91%)
15-24 371,365 17,559 (21.67%) (50.80%) 2.34
25-34 490,495 11,180 (28.62%) (32.35%) 1.13
35-64 852,040 5,793 (4971%) (16.76%) 0.34
Non-Native pop. N= 1,655,225 N= 24,473 (15-64) (100%) (100%)
15-24 351,355 12,385 (21.23%) (50.61%) 2.38
25-34 472,200 8,021 (28.53%) (32.77%) 1.15
35-64 831,670 4,067 (50.24%) (16.62%) 0.33
Native pop. N= 58,675 N= 10,091 (15-64) (100%) (99.99%)
15-24 20,010 5,192 (34.10%) (51.45%) 1.51
25-34 18,295 3,167 (31.18%) (31.38%) 1.01
35-64 20,370 1,732 (34.72%) (17.16%) 0.49
Alternative Perspectives 23
3) Percentages may not add up due to rounding.
Sources: adapted from Cawsey Report, 1991b, Justice on Trial: Report of the Task Force on the Criminal Justice System and Its Impact on the Indian and Métis People of Alberta, vol. 3 (working papers and bibliography), Edmonton, Task Force on the Criminal Justice System and Its Impact on the Indian and Métis People of Alberta; Statistics Canada, 1992, Age, Sex, and Marital Status, Ottawa, Minister of Industry, Science and Technology; Statistics Canada, 1993a, Age and Sex, Ottawa: Minister of Industry, Science and Tech- nology.
people of this age group as a whole tend to be overrepresented in correc- tional institutions, this pattern of overrepresentation is less pronounced for Natives than it is for non-Natives.
When one analyzes the results for the 25 to 34 age group, the level of representation decreases dramatically, from a factor of 2.34 times to 1.13 times for the total population (people aged 25 to 34 constitute 32.35% of the prison population as opposed to 28.62% of the general population aged 15 to 64). Non-Natives continue to be more frequently represented (32.77% of the non-Native prison population, compared to 28.53%, or 1.15 times more than the general population) than Natives, who are evenly repre- sented in this category (31-38% of the Native prison population, compared to 31.18%, or 1.01 times that in the general population aged 15 to 64).
In the older (35 to 64) age category, though the proportion of Natives who are incarcerated is higher than that among non-Natives as well as the provincial average, all members of this age group are by far underrepre- sented. 16.76% of the total prison population is a part of this age group, compared to 49.71%, or 0.34 times that in the general population aged 15 to 64. Among non-Natives, 16.62% of the prison population, compared to 50.24%, or 0.33 times that in the general population aged 15 to 64, are members of this age group. Among Natives, 17.16% of the prison popula- tion, compared to 34.72%, or 0.49 times that in the general population aged 15 to 64, are members of this age group.
Our first hypothesis seems to have been confirmed by the data in Table 2: when age is introduced as a control variable, the importance of race declines significantly when predicting the levels of representation associ- ated with particular groups in correctional institutions. Furthermore, under these conditions, Natives are considerably underrepresented in correc- tional institutions (as far as comparisons with non-Natives are concerned) in most cases, which was not specifically predicted by the hypothesis. This contravenes popular perceptions about the situation in the provincial insti-
24 Xavier Cattarinich
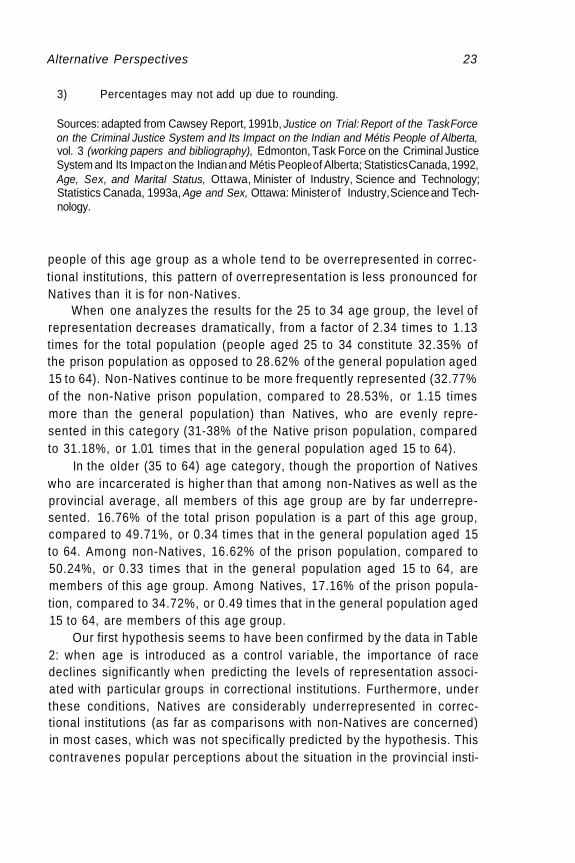
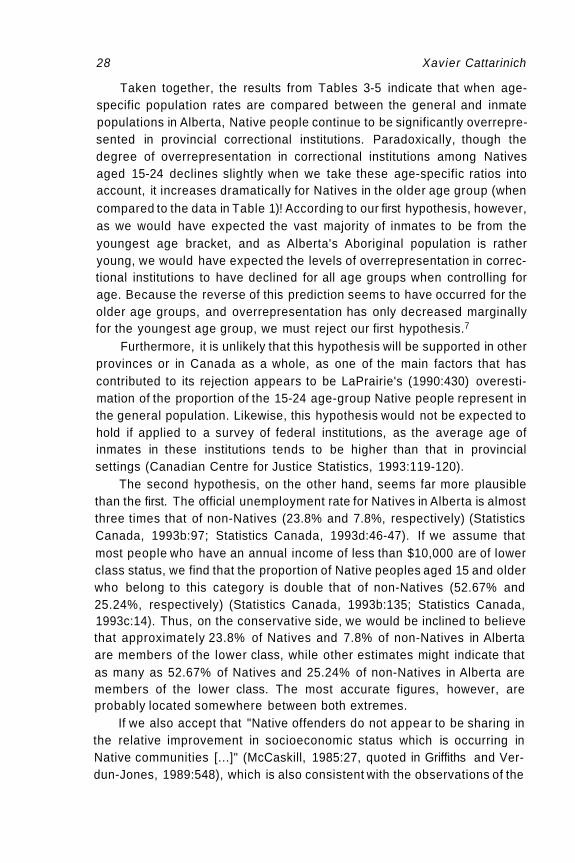
Table 3: Age Group Representation of General and Provincial Inmate Populations by Race
Notes: 1) The inmate population includes all adult offenders admitted to provin- cial institutions, as well as youths aged 15-18 admitted to custody in young offender facilities in Alberta in 1989.
2) General population data are based on 1991 Census statistics; inmate population data are based on 1989 figures.
3) Percentages may not add up due to rounding.
Sources: adapted from Cawsey Report, 1991 b, Justice on Trial: Report of the Task Force on the Criminal Justice System and Its Impact on the In.an and Métis People of Alberta, vol. 3 (working papers and bibliography). Edmonton, Task Force on the Criminal Justice System and Its Impact on the Indian and Métis People of Alberta; Statistics Canada, 1992, Age, Sex, and Marital Status. Ottawa, Minister of Industry, Science and Technology; Statistics Canada, 1993a, Age and Sex, Ottawa: Minister of Industry, Science and Technol- ogy.
tutions of Alberta at the very least, and perhaps about Canadian prisons in general.
The problem with the data in Table 2, however, is that it only reveals the age structure within the respective Native and non-Native groups, it
% of Alberta % of Inmate pop. Factor
Age
Native pop.
15-24 20,010 5,192 (5.39%) (29.54%) 5.48
25-34 18,295 3,167 (3.73%) (28.33%) 7.60
35-64 20,370 1,732 (2.39%) (29.90%) 12.51
Non-Native pop.
15-24 351,355 12,385
(94.61%) (70.46%) 0.74
25-34 472,200 8,021 (96.27%) (71.74%) 0.75
35-64 831,670 4,067
(97.61%) (70.13%) 0.72
Alternative Perspectives 25
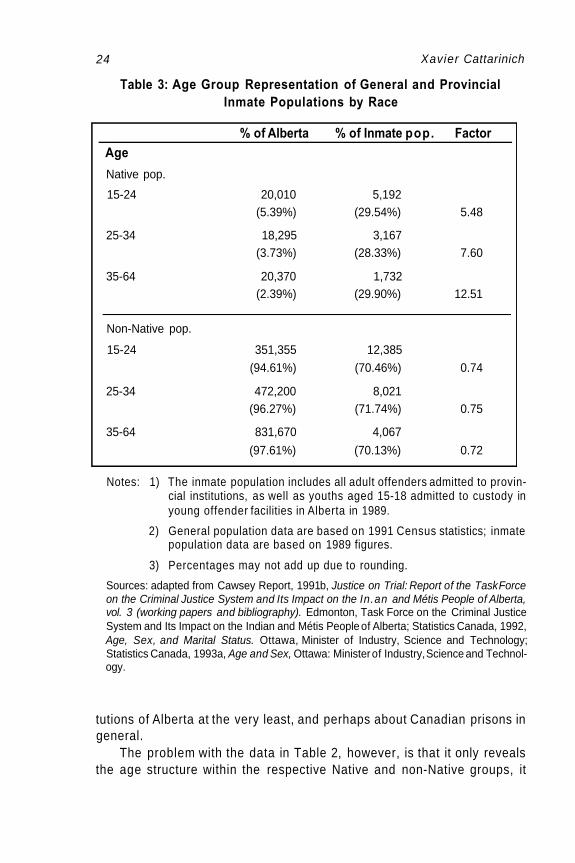
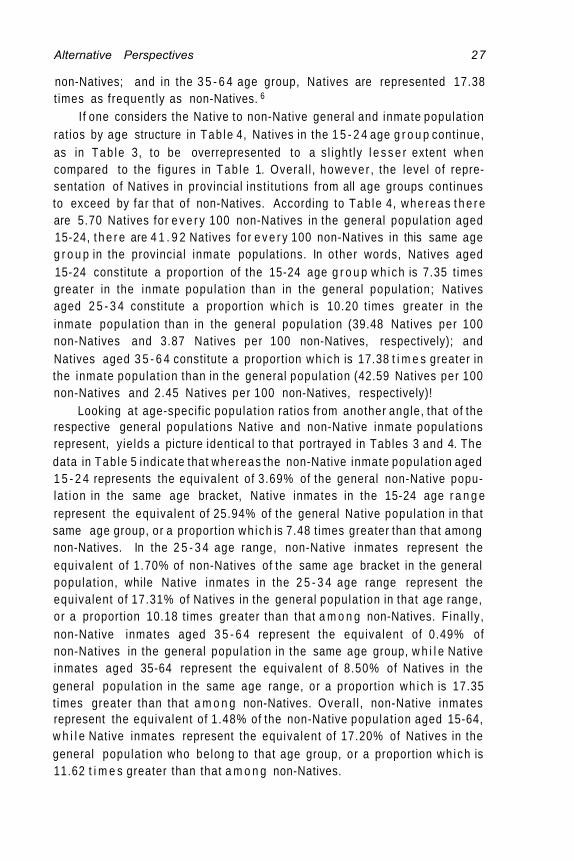
does not compare age-specific population ratios between the Native and non-Native groups. Relying solely on the data from Table 2 to test our first hypothesis would severely limit the analysis. Three tables will be used to compare the age-specific population ratios between groups from a variety of angles. Table 3 will indicate the proportion of each age group Natives and non-Natives represent in the inmate population, and will compare these figures with the corresponding proportions in the general population. Table 4 will compare the Native to non-Native ratio for each age group in both the inmate as well as the general populations of Alberta. Table 5 will indicate what proportion of their corresponding group in the general population Native and non-Native inmates represent, according to age structure.
The data in Tables 3-5 project very different images of the Native "overrepresentation situation" when compared to the data in Table 2. In fact, the data in Tables 3-5 will illustrate that while initial examination may have provided support for the first hypothesis, a more thorough investigation combining a variety of angles will refute it. Whereas our within-group analysis in Table 2 revealed that Natives in the 15-24 age range are
Table 4: Native to Non-Native Population Ratios, General and Provincial Inmate Populations
Notes: 1) Numbers to the left of the slash refer to the number of Natives per 100 non-Natives
2) The inmate population includes all adult offenders admitted to provin- cial institutions as well as youths aged 15-18 admitted to young offender custodial facilities in Alberta in 1989
3) General population data are based on 1991 Census statistics; inmate population data are based on 1989 figures.
Sources: adapted from Cawsey Report, 1991b, Justice on Trial: Report of the Task Force on the Criminal Justice System and Its Impact on the Indian and Métis People of Alberta, vol. 3 (working papers and bibliography), Edmonton, Task Force on the Criminal Justice System and Its Impact on the Indian and Métis People of Alberta; Statistics Canada, 1992, Age, Sex, and Marital Status, Ottawa, Minister of Industry, Science and Technology; Statistics Canada, 1993a, Age and Sex, Ottawa: Minister of Industry, Science and Technol- ogy.
Alberta Inmate Pop. Factor
Age
15-24 5.70/100 41 92/100 7.35
25-34 3.87/100 39.48/100 10.20
35-64 2.45/100 42.59/100 17.38
26 Xavier Cattarinich
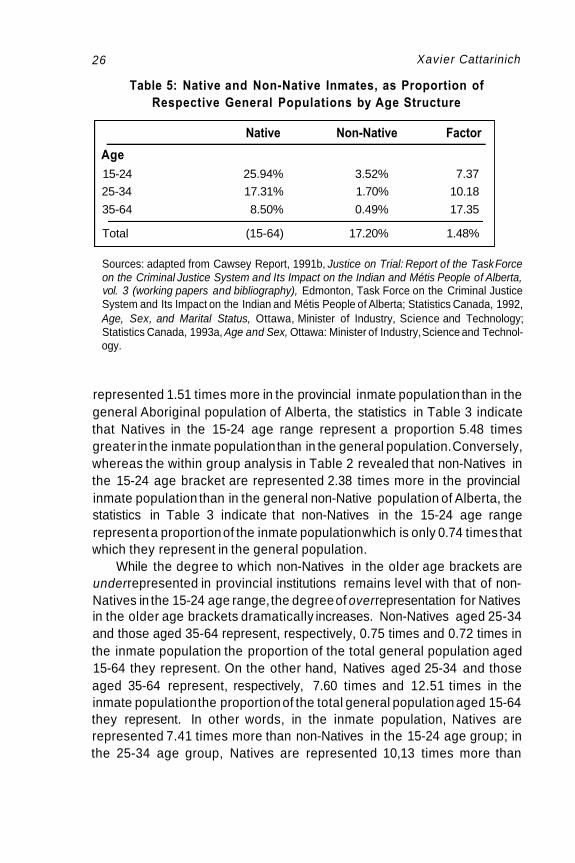
Table 5: Native and Non-Native Inmates, as Proportion of Respective General Populations by Age Structure
Sources: adapted from Cawsey Report, 1991b, Justice on Trial: Report of the Task Force on the Criminal Justice System and Its Impact on the Indian and Métis People of Alberta, vol. 3 (working papers and bibliography), Edmonton, Task Force on the Criminal Justice System and Its Impact on the Indian and Métis People of Alberta; Statistics Canada, 1992, Age, Sex, and Marital Status, Ottawa, Minister of Industry, Science and Technology; Statistics Canada, 1993a, Age and Sex, Ottawa: Minister of Industry, Science and Technol- ogy.
represented 1.51 times more in the provincial inmate population than in the general Aboriginal population of Alberta, the statistics in Table 3 indicate that Natives in the 15-24 age range represent a proportion 5.48 times greater in the inmate population than in the general population. Conversely, whereas the within group analysis in Table 2 revealed that non-Natives in the 15-24 age bracket are represented 2.38 times more in the provincial inmate population than in the general non-Native population of Alberta, the statistics in Table 3 indicate that non-Natives in the 15-24 age range represent a proportion of the inmate population which is only 0.74 times that which they represent in the general population.
While the degree to which non-Natives in the older age brackets are under represented in provincial institutions remains level with that of non- Natives in the 15-24 age range, the degree of over representation for Natives in the older age brackets dramatically increases. Non-Natives aged 25-34 and those aged 35-64 represent, respectively, 0.75 times and 0.72 times in the inmate population the proportion of the total general population aged 15-64 they represent. On the other hand, Natives aged 25-34 and those aged 35-64 represent, respectively, 7.60 times and 12.51 times in the inmate population the proportion of the total general population aged 15-64 they represent. In other words, in the inmate population, Natives are represented 7.41 times more than non-Natives in the 15-24 age group; in the 25-34 age group, Natives are represented 10,13 times more than
Native Non-Native Factor
Age 15-24 25.94% 3.52% 7.37
25-34 17.31% 1.70% 10.18
35-64 8.50% 0.49% 17.35
Total (15-64) 17.20% 1.48%
Alternative Perspectives 27
non-Natives; and in the 3 5 - 6 4 age group, Natives are represented 17.38t imes as frequent ly as non-Natives. 6
I f one considers the Native to non-Native general and inmate populat ionratios by age structure in Tab le 4, Natives in the 1 5 - 2 4 age g r o u p continue,as in Tab le 3, to be overrepresented to a sl ight ly l e s s e r extent whencompared to the figures in Tab le 1. Overal l , however , the level of repre-sentation of Natives in provincial inst i tut ions from all age groups continuesto exceed by far that of non-Natives. According to Tab le 4, whereas t h e r eare 5.70 Natives for e v e r y 100 non-Natives in the general populat ion aged15-24, t h e r e are 4 1 . 9 2 Natives for e v e r y 100 non-Natives in this same ageg r o u p in the provincial inmate populations. In other words, Natives aged15-24 constitute a proportion of the 15-24 age g r o u p wh ich is 7.35 t imesgreater in the inmate populat ion than in the general populat ion; Nativesaged 2 5 - 3 4 constitute a proportion wh ich is 10.20 t imes greater in theinmate populat ion than in the general populat ion (39.48 Natives per 100non-Natives and 3.87 Natives per 100 non-Natives, respectively); andNatives aged 3 5 - 6 4 constitute a proportion wh ich is 17.38 t i m e s greater inthe inmate populat ion than in the general populat ion (42.59 Natives per 100non-Natives and 2.45 Natives per 100 non-Natives, respectively)!
Looking at age-specif ic populat ion ratios from another angle, that of therespective general populat ions Native and non-Native inmate populat ionsrepresent, y ields a picture ident ical to that portrayed in Tables 3 and 4. Thedata in Tab le 5 indicate that whereas the non-Native inmate populat ion aged1 5 - 2 4 represents the equivalent of 3.69% of the general non-Native popu-la t ion in the same age bracket, Native inmates in the 15-24 age r a n g erepresent the equivalent of 25.94% of the general Native populat ion in thatsame age group, or a proportion wh ich is 7.48 t imes greater than that amongnon-Natives. In the 2 5 - 3 4 age range, non-Native inmates represent theequivalent of 1.70% of non-Natives of the same age bracket in the generalpopulat ion, while Native inmates in the 2 5 - 3 4 age range represent theequivalent of 17.31% of Natives in the general populat ion in that age range,or a proportion 10.18 t imes greater than that a m o n g non-Natives. Final ly,non-Native inmates aged 3 5 - 6 4 represent the equivalent of 0.49% ofnon-Natives in the general populat ion in the same age group, w h i l e Nativeinmates aged 35-64 represent the equivalent of 8.50% of Natives in thegeneral populat ion in the same age range, or a proportion wh ich is 17.35t imes greater than that a m o n g non-Natives. Overal l , non-Native inmatesrepresent the equivalent of 1.48% of the non-Native populat ion aged 15-64,w h i l e Native inmates represent the equivalent of 17.20% of Natives in thegeneral populat ion who belong to that age group, or a proportion wh ich is11.62 t i m e s greater than that a m o n g non-Natives.
28 Xavier Cattarinich
Taken together, the results from Tables 3-5 indicate that when age- specific population rates are compared between the general and inmate populations in Alberta, Native people continue to be significantly overrepre- sented in provincial correctional institutions. Paradoxically, though the degree of overrepresentation in correctional institutions among Natives aged 15-24 declines slightly when we take these age-specific ratios into account, it increases dramatically for Natives in the older age group (when compared to the data in Table 1)! According to our first hypothesis, however, as we would have expected the vast majority of inmates to be from the youngest age bracket, and as Alberta's Aboriginal population is rather young, we would have expected the levels of overrepresentation in correc- tional institutions to have declined for all age groups when controlling for age. Because the reverse of this prediction seems to have occurred for the older age groups, and overrepresentation has only decreased marginally for the youngest age group, we must reject our first hypothesis. 7
Furthermore, it is unlikely that this hypothesis will be supported in other provinces or in Canada as a whole, as one of the main factors that has contributed to its rejection appears to be LaPrairie's (1990:430) overesti- mation of the proportion of the 15-24 age-group Native people represent in the general population. Likewise, this hypothesis would not be expected to hold if applied to a survey of federal institutions, as the average age of inmates in these institutions tends to be higher than that in provincial settings (Canadian Centre for Justice Statistics, 1993:119-120).
The second hypothesis, on the other hand, seems far more plausible than the first. The official unemployment rate for Natives in Alberta is almost three times that of non-Natives (23.8% and 7.8%, respectively) (Statistics Canada, 1993b:97; Statistics Canada, 1993d:46-47). If we assume that most people who have an annual income of less than $10,000 are of lower class status, we find that the proportion of Native peoples aged 15 and older who belong to this category is double that of non-Natives (52.67% and 25.24%, respectively) (Statistics Canada, 1993b:135; Statistics Canada, 1993c:14). Thus, on the conservative side, we would be inclined to believe that approximately 23.8% of Natives and 7.8% of non-Natives in Alberta are members of the lower class, while other estimates might indicate that as many as 52.67% of Natives and 25.24% of non-Natives in Alberta are members of the lower class. The most accurate figures, however, are probably located somewhere between both extremes.
If we also accept that "Native offenders do not appear to be sharing in the relative improvement in socioeconomic status which is occurring in Native communities [...]" (McCaskill, 1985:27, quoted in Griffiths and Ver- dun-Jones, 1989:548), which is also consistent with the observations of the
Alternative Perspectives 29
Mét is and Non-Status Indian C r i m e and Justice Commission (1977), andwhen we consider that "Native inmates with relat ively high leve ls of educa-t ional complet ion are st i l l more l ike ly to be unemployed than employed atthe t ime of arrest" (Morse and Lock , 1988:19), then we can reasonablya r g u e that the majori ty (if not all) of Native offenders are of l o w e r c lassstatus. 8 If we c o m p a r e the proportion of the inmate populat ion Nativeoffenders represent and a s s u m e they are all of l o w e r c lass s t a t u s with theproportion of Natives in the general populat ion who belong to this categoryas indicated by income leve ls and unemployment rates, we find that Nativepeoples are definitely not overrepresented in the correctional institutions ofAlberta, and may, if we use even an intermediate m e a s u r e of social c l ass(i .e., a number somewhere b e t w e e n the extremes established by unem-ployment rates and income levels), be underrepresented, as LaPrair ie(1990:430) has suggested. Non-Natives, on the other hand, even if we usethe highest estimate (i .e., income under $10,000) of the general populat ionwho are of l o w e r social c l ass status, w o u l d be, at the very least, representeda l m o s t t h r e e t i m e s as frequent ly in the inmate populat ion compared to thegeneral populat ion. On the other hand, as we have stated at the beginningof this paper, the Aboriginal Justice Inquiry of Manitoba (1991:102) andB a r k w e l l and Longc laws (1991:101) asser t that off ic ial statistics underesti-mate the true leve ls of Aboriginal overrepresentation in correctional inst i tu-tions. T h u s , the proportion of Natives in prison cou ld st i l l be h igher than thatof Natives in the general populat ion who are of l o w e r c lasss ta tus . The pointcou ld also be moot, however , considering that leve ls of unemploymenta m o n g Aboriginal peop le are also underestimated (Aboriginal Justice In-quiry of Manitoba, 1991:92-93).
Conclusion
The p u r p o s e of this p a p e r was to examine the overrepresentation ofAboriginal peop le in the correctional inst i tut ions of Alberta from an alterna-t ive perspective to that wh i ch has tradi t ional ly been used. Unt i l now, theconventional way to approach the problem has been to emphasize the raceof the offender as the most important var iable when accounting for thedisproportionate numbers of Natives in correctional institutions, by limitingcomparisons strict ly to Aboriginal and non-Aboriginal general populat ionand inmate populat ion ratios. Th is project, on the other hand, attempted toverify the hypotheses p r o p o s e d by LaPrair ie (1990:429-430), wh i ch sug-gest that the age and the s o c i a l c l ass of the offender are perhaps meresalient variables than race when accounting for the overrepresentation ofNative people in the correctional inst i tut ions of Alberta. T h e s e hypotheses
30 X a v i e r Cattarinich
were veri f ied by examining age-specif ic populat ion ratios in the Aboriginaland non-Aboriginal general and provincial inmate populat ions from a varietyof angles, and then comparing them.
Our analysis of existing statistics rejected the age hypothesis. The initialwithin-group analysis noted that when we control for age, the level ofrepresentation dramat ical ly decreases for Native people, to the point w h e r eNatives in the older age categories are clear ly underrepresented, w h i l et hose in the 15-24 age g r o u p are st i l l overrepresented (as predicted), butconsiderably less so than non-Natives. This effect disappears, however ,when between-group comparisons are made. Indeed, contrary to the hy-pothesis, wh i ch predicted that leve ls of overrepresentation a m o n g Nativesfrom all age g r o u p sw o u l d d e c r e a s e b e c a u s e of the size of the "crime prone"15-24 age g r o u p in the Native populat ion, though the level of overrepresen-tat ion of Natives in the 15-24 age group decl ined s o m e w h a t , it s o a r e d forthe older age categories. LaPrairie's (1990:430) overestimation of theproportion of the overal l 1 5 - 2 4 age g r o u p Natives represent explains muchof th is hypothesis' disconfirmation, but does little to exp la in the soaringincarceration rates for Natives in the older age ranges. Th is will have to beaddressed by further research.
Rather, we have suggested that the relat ionship b e t w e e n a l o w e r c lassstatus and the excessively high leve ls of incarceration experienced byNatives should be understood within the broader context of the s e c o n dhypothesis, wh i ch pertains to the inherent presence of c l ass conf l ict withinthe criminal justice s y s t e m . Unfortunately, the data analyzed to test thes e c o n d hypothesis is inconclusive. This is main ly due to the imprecision ofthe indicators used to m e a s u r e social c lass . Despite its l imitat ions, our dataanalysis and the s o u r c e s we introduced in our discussion of the resultsnevertheless sugges t that overrepresentation of Native people in correc-t ional inst i tut ions may decrease, to the point w h e r e they may very well beunderrepresented, if we make social c l ass the focal point of subsequentanalyses. Th is w o u l d be expected b e c a u s e the inmate populat ion is pre-dominant ly of l o w e r c lass status (Greenaway, 1980; Reiman, 1990), and ag r e a t proportion of the general Native populat ion is equal ly d r a w n from thel o w e r strata of s o c i e t y ( s e e , for example, Grif f i ths and Verdun-Jones,1989:548; Hylton, 1982:125-127; Kel lough, 1980:352; Mét is and Non-Status Indian C r i m e and Justice Commission, 1977; Morse and Lock ,1988:19; Satzewich and Wotherspoon, 1993:55-58).
Yet if it does indeed turn out that c l ass is the key var iable for expla in ingthe overrepresentation of Native people in the prison s y s t e m , one questionwith serious impl icat ions will have to be pondered, though certainly not forthe f i r s t t ime. Why is it that a part icular s e g m e n t of society wh i ch is
Alternative Perspectives 31
dist inguishable from the others by r a c e - - i s presently, and has been histori-cal ly, relegated predominant ly to the bottom echelon of the societal hierar-chy?
Notes1. Populat ion figures may vary depending upon the off ic ial s o u r c e s one
consults (Frideres, 1993:127).
2. According to B a r k w e l l and Longclaws,
T h e r e are a number of r e a s o n s for this: the estimates are b a s e dupon self- ident i f icat ion and many non-status and Mét is indi-v iduals are reluctant to declare Aboriginal roots for fear ofencountering prejudice and/or b e c a u s e of a sociological iden-tification trauma. In addi t ion, the Ministry has noted someinaccuracy in data col lect ion (1991:101).
R a n d o m and systematic e r r o r s in data col lect ion have also been notedby the C a n a d i a n Corrections Association (1967:21) and R a h i m(1977:2).
3. The reader should note that general populat ion ratios are b a s e d onthe n u m b e r of people enumerated at a specif ic point in t ime, that is tosay, on " c e n s u s day" in 1991. The inmate populat ion ratios, on theother hand, are b a s e d on the n u m b e r of people admit ted to provincialcorrectional centres in Alberta over a one year period (in this c a s e ,over the 1989 calendar y e a r ) . The inmate populat ion ratios do notinclude ind iv idua ls who were already serving t ime prior to 1989.
4. T h e r e are also a n u m b e r of weaknesses associated with the analysisof existing off ic ial statistics as the exclusive method from wh ich to drawconclusions (for a review of t hese weaknesses, see N e u m a n ,1994:275-78).
5. Statistics from the work ing p a p e r s of the C a w s e y R e p o r t (1991b)classify adu l t offenders into the "18-21", "22-25", "26-35", and "36+"age g r o u p s . Aboriginal C e n s u s data, however , classify people into the"0-4", "5-14", "15-24", "25-34", "35-54", and "55+" age g r o u p s . In orderto p e r f o r m more accurate comparisons, age g r o u p s in the prisonpopulat ion will f i r s t be collapsed into the "18-25", "26-35" and "36+"categories. Though the f o c u s of this paper is on the populat ion in adu l tcorrectional centres, we will add data, wh i ch is also from the work ingpapers of the C a w s e y R e p o r t (1991 b), on the populat ion in the y o u n goffender fac i l i t ies of Alberta who are 15 and older, thus expanding thef i r s t category to the "15-25" age group. This will a l low us to c o m p a r ewith greater confidence the age structure of the prison populat ion withthat of the general populat ion of Alberta, and especial ly, the extent to
32 Xavier Cattarinich
wh ich the "15-24" age g r o u p might be overrepresented in correctionalinstitutions.
6. 1 5 - 2 4 age group: 5.48 (Native) / 0.74 non-Native = 7.412 5 - 3 4 age group: 7.60 (Native) / 0.75 non-Native = 10.133 5 - 6 4 age group: 12.51 (Native) / 0.72 non-Native =17.38
7. The author intends to add ress the question of why Natives in the olderage g r o u p s are so dramat ical ly overrepresented in the prison popula-t ion in a forthcoming art ic le.
8. The majori ty of all incarcerated offenders are of l o w e r c lass back-g r o u n d (Greenaway, 1980; Reiman, 1990).
References
Aboriginal Justice Inquiry of Manitoba1991 Reportofthe Aboriginal Justice Inquiry of Manitoba (vol.1): the
Justice System and Aboriginal People. Winnipeg: Publ ic InquiryInto the Administrat ion of Justice and Aboriginal people.
B a d c o c k , Wi l l iam T.1976 Problems of Native Offenders in the Correctional System. Ca-
nadian Journal of Criminology and Corrections 18(4):281-289.
Barkwell, Lawrence J. and Lyle N. Longc laws1991 The Current Status of Mét is People in the Federal Correctional
System, pp. 101-112 in Samuel W. Corrigan and Lawrence J.B a r k w e l l (Editors): The Struggle for Recognition: CanadianJustice and the Métis Nation. Winnipeg: Pemmican Publ ica-tions, Inc.
Bienvenue, Rita M. and A.H. La t i f1974 Ar res ts , Dispositions and Recidivism: A Comparison of Indians
and W h i t e s . Canadian Journal of Criminology and Corrections16(2):105-116.
C a n a d a1991 Aboriginal People and Justice Administration: A Discussion
Paper. O t t a w a : Department of Justice.
Canadian C e n t r e for Justice Statistics1993 Adult Correctional Services in Canada. O t t a w a : Minister of
Industry, Science and Technology.
Canadian Corrections Association1967 Indiansand the Law. Ottawa: The Canadian W e l f a r e Counci l .
Alternative Perspectives 33
Cawsey Report
1991a Justice on Trial." R e p o r t o f the Task F o r c e on the CriminalJustice S y s t e m and its Impac t on the Indian and M é t i s Peopleof Alberta, Vo lume 1 ( m a i n report). Edmonton: Task Force onthe Criminal Justice System and its Impact on the Indian andMétis People of Alberta.
1991b Justice on Trial: R e p o r t of the Task F o r c e on the CriminalJustice S y s t e m and its Impac t on the Indian and Métis Peopleof Alberta, Vo lume 3 (working p a p e r s and bibl iography). Ed-monton: Task Force on the Criminal Justice and its Impact onthe Indian and Métis People of Alberta.
Clark, Scott, G.S. Clark and Associates Ltd.1989 The M i ' k m a q and Criminal Justice in Nova Scotia. Nova Scotia:
Royal Commission on the Donald Marshall, Jr., Prosecution.
Department of Justice
1991 Aboriginal People and Justice Administration. A DiscussionP a p e r . Ottawa: Canada.
Finkler, Harold W.
1976 Inui t and the Administration of Justice in the Northwest Territo-r i e s : the Case of Frobisher Bay. Ottawa: Minister of Indian andNorthern Affairs.
Frideres, JamesS.
1993 Native Peoples in Canada: C o n t e m p o r a r y Confl icts. FourthEdition. Scarborough: Prentice Hall Canada Inc.
Greenaway, W.K.
1980 Crime and Class: Unequal Before the Law, in John Harp andJohn R. Hofley (Editors.): Structured Inequali ty in Canada.Scarborough: Prentice-Hall of Canada Ltd.
Griffiths, Curt Taylor, and S.N. Verdun-Jones1989 Canadian Criminal Justice. Vancouver: Butterworths.
Hagan, John
1977a Criminal Justice in Rural and Urban Communities: A Study ofthe Bureaucratization of Justice. Social F o r c e s 55:597-611.
1977b Finding 'Discrimination': A Question of Meaning. Ethnici ty4:177-87.
34 X a v i e r Cattarinich
1975a The Alberta CriminalJustice Project: A Summary Report. Un-published report in the Department of Sociology, University ofAlberta.
1975b The Social and Legal Construction of Criminal Justice. SocialProblems 22(5):620-637.
1974a CriminalJusticeand Native People: A Studyof Incarceration ina Canadian Province. Canadian Review of Sociology and An-thropology, Special issue (August):220-236.
1974b Extra-Legal Attributes and Criminal Sentencing. Law andSoci-ety Review 8:357-383.
Hann, Robert, and W.G. Harman1986 Race and Parole, edited version of Robert Hann and W.G.
Harman, Full Parole Release: an Historical Descriptive Analysis(working paper prepared for the Solicitor General of Canada[1986-31], 1986), Chapters 1, 2, and 5, reprinted in Robert A.Silverman and Marianne O. Nielsen (Editors) [1994] AboriginalPeoples and Canadian Criminal Justice. Toronto: HarcourtBrace and Company, Canada.
Hartnagel, Timothy1992 Correlatesof Criminal Behaviour, in RickLinden (Editor): Crimi-
nology: A Canadian Perspective, Second Edition. Toronto: Har-court Brace Jovanovich Canada Inc.
Hylton, John H.1982 The Native Offender in Saskatchewan: Some Implications for
Crime Prevention Programming. Canadian Journal of Criminol-ogy 24:121-131.
Kellough, Gail1980 From Colonialism to Imperialism: the Experience of the Cana-
dian Indian, in John Harp and John R. Hofley (Editors): Struc-tured Inequality in Canada. Scarborough: Prentice-Hall ofCanada Ltd.
LaPrairie, CarolP.1990 The Role of Sentencing in the Over-Representation of Aborigi-
nal People in Correctional Institutions. Canadian Journal ofCriminology 32(3):429-440.
Law Reform Commission of Canada1991 Reporton Aboriginal Peoples and CriminalJustice: Equality,
Respect, and the Search for Justice. Ottawa: Canada.
Alternative Perspectives 35
Métis and Non-Status Indian Crime and Justice Commission1977 Report of the Métis and Non-Status Indian Crime and Justice
Commission. Cutler: Woodland Studio.
Morse, Bradford and Linda Lock1988 Native Offenders' Perceptions ofthe CriminalJustice System.
Ottawa: Minister of Supply and Services Canada.
Neuman, W. Lawrence1994 Social Research Methods: Qualitative and Quantitative Ap-
proaches, Second Edition. Boston: Allyn and Bacon.
Rahim, M.A.1977 Guideto Statistics on Native Offenders. Ottawa: SolicitorGen-
eral of Canada.
Reiman, Jeffrey1990 The Rich GetRicherandthe Poor Get Prison: Ideology, Class,
and Ctiminal Justice, Third Edition. NewYork: Macmillan Pub-lishing Company.
Royal Commission on Aboriginal Peoples1993 Aboriginal Peoples and the Justice System: Report of the
National Round Table on Aboriginal Justice Issues. Ottawa:Minister of Supply and Services Canada.
Satzewich, Vic and T. Wotherspoon1993 First Nations: Race, Class, and Gender Relations. Scarbor-
ough: Nelson Canada.
Schmeiser, Douglas1974 The Native Offender and the Law. Ottawa: Law Reform Com-
mission of Canada.
Statistics Canada1993a Age and Sex. Ottawa: Minister of Science, Industry and Tech-
nology.
1993b Schooling, Work and Related, Activities, Income, Expenses andMobility. Ottawa: Minister of Industry, Science and Technology.
1993c Selected Income Statistics. Ottawa: Minister of Industry, Sci-ence and Technology.
1993d LabourForce Activity. Ottawa: Minister of Industry, Science andTechnology.

36 Xavier Cattarinich
1992 Age, Sex, and Marital Status. Ottawa: Minister of Industry,Science and Technology.
Wynne, Derek F. and T. F. Hartnagel1975 Race and Plea Negotiation: An Analysis of Some Canadian
Data. Canadian Journal of Sociology 2:147-155.