New Perspectives on Alternative Investments
24
New Perspectives on Alternative Investments For professional clients only For the Institute and Faculty of Actuaries
Transcript of New Perspectives on Alternative Investments

New Perspectives on Alternative Investments
For professional clients only
For the Institute and Faculty of Actuaries

Introduction
Today’s speakers and topics are as follows:
Ian Kitchenham, BlackRock Alternative Investors
• Defining “alternative” investments
Ted Logan, Hedge Fund Solutions
• Measuring performance and the importance of selection
Mark Long, Real Estate
• Investment features across a broad asset class
Sverker Akerblom, Renewable Power Group
• Providing secure income from an alternative source
For professional clients / qualified investors only 2

What are alternative investments?
1. Not “traditional”, i.e. stocks, bonds or cash
Returns not directly linked to returns available
from a publicly traded asset
2. Asset(s) where the return is, at least partially, a
function of factors that are not easily observable
Examples can include ‘illiquidity premium’ or
‘alpha skill’
3. A different way of investing in “traditional” assets
For example, hedge funds and traditional long-only equity investors may both trade
publicly available shares but hedge funds can look to make profits when share prices
fall by short selling
For professional clients / qualified investors only 3

Alternatives cover a broad range of investments
Private Equity
Buyout
Distressed
Venture Capital
Growth Capital
Mezzanine
Infrastructure
Core
Value Add
Debt
Renewables
Real Estate
Core
Value-Add
Opportunistic
Mezzanine Debt
Hedge Funds
Relative Value
Event Driven
Fundamental L/S
Direct Sourcing
Global Macro /
Directional
Trading
Commodities
Energy
Metals
Agriculture
Other Softs
Short-Term
Opportunities
Intermediate-Term
Opportunities Long-Term
Opportunities
For professional clients / qualified investors only 4

Institutional investors are expected to increase allocations across alternative asset classes
Alternatives industry is about $6 trillion and expected to grow at 12% annually
Allocation to alternatives is increasing
Source: BCG Global Asset Management 2013 Capitalizing on The Recovery; McKinsey/Institutional Investor Global Survey on Institutional Investing, 2011
Alternatives Industry AUM ($tn)
Private Equity Hedge Funds Real Estate Infra & Commodities
3.1%
6.2% 6.8%
2009 2010 2013E
4.2%
6.4% 6.8%
2009 2010 2013E
4.1%
5.9% 6.5%
2009 2010 2013E
1.0%
3.3% 3.5%
2009 2010 2013E
Infrastructure
Commodities
$3
$5 $6
$10
2005 2008 2012 2016E
+12%
5

Why are investors allocating to alternatives?
We believe investors are finding new appeal in alternatives as a necessary source of
investment returns in a low yield, low growth, high volatility environment...
Low correlation with traditional asset classes to combat persistent volatility
Diversified income to combat low yield as clients seek new opportunities outside traditional assets
Illiquidity premium opportunities to capture
…and investors are overcoming the myths and concerns of alternative investing
Risk factor portfolio analysis and allocation brings alternatives to the core of client investments
Liability matching and long term income modeling is improving
Transparency and infrastructure can be provided by partnering with institutional quality managers
6
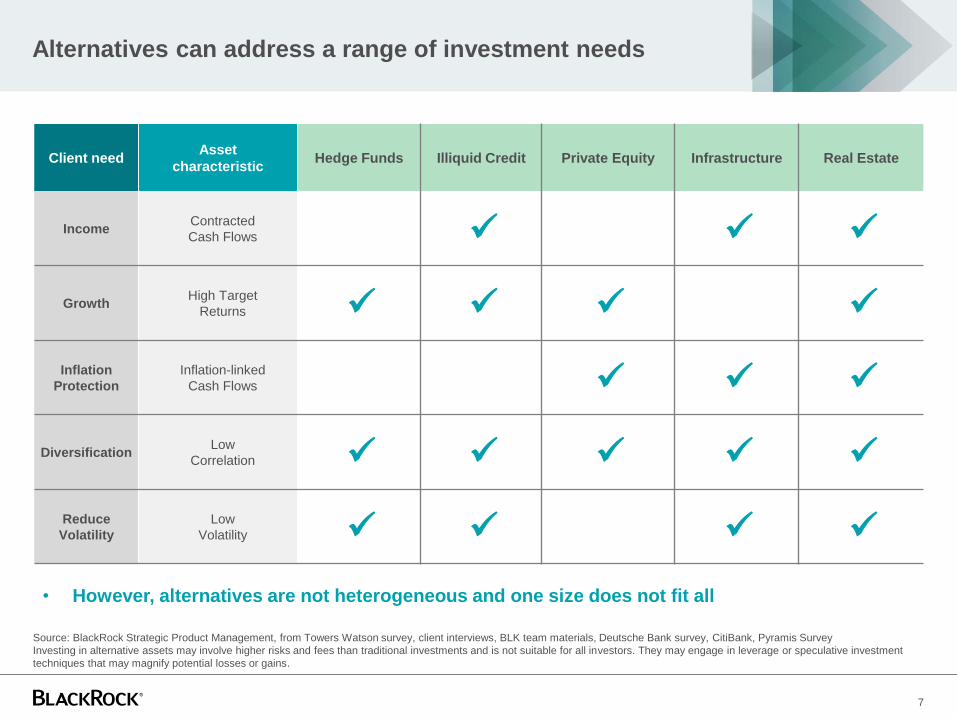
Alternatives can address a range of investment needs
Client need Asset
characteristic Hedge Funds Illiquid Credit Private Equity Infrastructure Real Estate
Income Contracted
Cash Flows
Growth High Target
Returns
Inflation
Protection
Inflation-linked
Cash Flows
Diversification Low
Correlation
Reduce
Volatility
Low
Volatility
Source: BlackRock Strategic Product Management, from Towers Watson survey, client interviews, BLK team materials, Deutsche Bank survey, CitiBank, Pyramis Survey
Investing in alternative assets may involve higher risks and fees than traditional investments and is not suitable for all investors. They may engage in leverage or speculative investment
techniques that may magnify potential losses or gains.
7
• However, alternatives are not heterogeneous and one size does not fit all

1,000
1,500
2,000
2,500 Equity Style: World Equity
Equity Style: Growth
Equity Style: Financial Leverage
Equity Style: Liquidity
Equity Style: Momentum
Equity Style: Size
Equity Style: Size Nonlinearity
Equity Style: Value
Equity Style: Volatility
Inflation
Non US IR x Eur Gov
Equity Industry
Corporate
Other Spreads
Equity Country
FX
Specific
Other
US IR
Identifying a suitable allocation can be challenging
8
Example Secure Income asset
Risk Contribution by Factor
Example Secure Income
asset Risk Contribution by
Macro Factor
-200
0
200
400
600
800
1000
1200
Ris
k C
on
trib
uti
on
(b
ps
)
Idiosyncratic
Inflation
Discount &InterestRates
PowerPrices
Total Risk
-200
0
200
400
600
800
1000
1200
Ris
k C
on
trib
uti
on
(b
ps
)
Idiosyncratic
Euro Inflation
GBP Inflation
USD Inflation
EU Utility IGSpreads
UK Utility IGSpreads
US Electric IGSpreads
FRF Spreads
DEM InterestRates
GBP InterestRates
USD InterestRates
EuropeanPower Prices
US PowerPrices
Total Risk
Risk factor modelling provides
a common language…
…that allows efficient portfolio
construction at a scheme-wide level
Cash
Treasury bonds
Index linked treasury bonds
Overseas government bonds
Domestic swaps
Corporate bonds
Oversees corporate bonds
Domestic equities
Developed overseas equities
Emerging market equities
Emerging market bonds
High yield
Property
Alternatives
Asset allocation: Example Pension Scheme
Risk decomposition: Example Pension Scheme
Standalone
risk
Overall risk
(inc. diversification)

Hedge Funds

The challenges facing pension plans today
10
Solution
Market and liability risk volatility
Low return/ yield makes achieving objectives difficult
Effective diversification is challenging due to high correlation in
traditional asset classes
Increased requirements for governance and transparency
Questions
Problem
Can I generate returns with a different profile than traditional equity
and fixed income?
What risks do I need/need to avoid?
How can I do this in a cost-efficient way?
Risk-based approach to replace ‘performance chasing’ as basis for
asset allocation decisions

Hedge Funds diversify by risks, not returns
11
Traditional Portfolios
Hedge Fund Strategies
Sources of Risk and Return
Risks are the input, returns are the output
Hedge funds seek to generate different returns via a different set of risks than traditional, long-only investments
Idiosyncratic risks (alpha) are difficult to replicate
ALPHA
BETA E.g.: Equity market movement,
Interest rates, foreign currency,
Commodity prices
E.g.: Approval of M&A deal, plan
of reorganization,
model risks

Selection can enhance portfolio alpha
12
Equity
Hedge
Event
Driven Macro
Relative
Value Total
Perc
entile
s 90% 17.8% 15.2% 19.6% 14.4% 17.6%
75% 9.2% 9.8% 10.5% 8.3% 9.1%
50% 1.7% 4.3% 2.0% 4.0% 2.5%
25% -6.7% -0.5% -4.3% -0.6% -4.1%
10% -16.1% -7.4% -12.0% -6.0% -12.2%
Interdecile range 33.9% 22.6% 31.6% 20.4% 29.8%
Interquartile range 16.0% 10.3% 14.9% 8.9% 13.2%
Fund Count 744 167 350 287 1548
1st Quartile
3rd Quartile
9th Decile
1st Decile
Median
Hedge funds do offer alpha
Highest return ≠ highest alpha
Selecting the right managers can enhance the alpha
Dispersion of Hedge Fund Manager Alpha
(2013 to end Nov)
Contribution to Hedge Fund Index Performance by Risk Type
(2013 to end Nov)
-4%
1%
6%
11%
16%
21%
Traditional Beta Non-Traditional Beta
Alpha Index Rtn
-20%
-15%
-10%
-5%
0%
5%
10%
15%
20%
Source: HFR, Inc., BlackRock

Real Estate

Broad range of Real Estate strategies and vehicles
1.DTZ Research, BlackRock; as of December 2013
2.BlackRock
Performance attributes vary2 d
$12 trillion market of distinct strategies1
Equity Debt
Pri
va
te
Pu
bli
c
Opportunistic
High-yield / Mezzanine
Senior whole loans /
First mortgages
Real estate securities CMBS
Client needs Real estate investment strategies
Potential returns
% of return from
income
Liquidity
Diversification
properties
Volatility
Inflation hedging
Lower ● ● ● ● ● ● Higher
CMBS Core RE securities
Mezzanine Value-added Opportunistic
Value-added
Core
$4.2 tn $5.8 tn
$900 bn $1.5 tn

0
1
2
3
4
5
6
7
UK Property FTSE 100 10 Yr Gilt
Net
init
ial yie
ld /
Div
. yie
ld /
Red
em
pti
on
yie
ld
Current yield 20 year average
Property delivers a higher level of income1
Income and diversification
15
-0.3
-0.2
-0.1
0.0
0.1
0.2
0.3
0.4
0.5
0.6
UK Property :Gilts
UK Property :FTSE
10 Yr Gilt :FTSE
Co
rre
lati
on
co
-eff
icie
nt
19
81
-20
13
33 years
20 years
Property offers strong diversification benefits2
1 IPD UK Monthly Index March 2013
1 IPD UK Annual Index Dec 2013

Characteristics of underlying real estate equity investments
16
+ • Smoothing
• Heterogeneity
• Illiquidity
• Lack of divisibility
• Management intensive
• Diversification benefits
• Real asset – inflation hedging
• High level of income
• Asset-Liability matching
-

Types of Real Estate investments: Equity
Core Value Added Opportunistic
Traditional property types
Fully leased / minimal
leasing risk
Minimal development risk
Well diversified
Balanced alternative
strategies
Asset Repositioning and
refurbishment
Leasing risk
Prime & secondary markets
Listed securities (REITs)
No specific diversification
requirement
Full scale development
and redevelopment
projects
Often low income
distribution
Back-end loaded return
Typically High Leverage
Multi-asset diversifier
Stable Income
Open-end funds
& Separate Accounts
Diversification plus alpha
Income and Growth
Open-end, Closed-end funds
& Separate Accounts
Alpha generation
Income & capital growth
Closed-end funds
Increased risk/return
For professional clients / qualified investors only 17
Total return 8-10%
50-80% income
Total return 6-8%
80%+ rental income
Total return 10%+
>50% capital

Renewable income investing

What are Infrastructure investments?
Source: BlackRock (April 2014)
Investor Needs Investor Benefits Infrastructure Assets
Capital Preservation
Stable Cash Flows
Inflation Linkage
A defensive asset class that
can preserve capital
Diversification Effects
Infrastructure assets often have
implicit or explicit inflation
protection
A key return attribute of
infrastructure assets is high
and stable income
Low correlation of
infrastructure investments with
traditional assets
Sectors Characteristics
Essential Services
Capital Intensive
Long Life Span
Local Monopoly
Energy
Transport
Water/Waste
Communication
Social
Risk / return characteristics vary significantly between different infrastructure assets 19

Renewable Power – UK Market Opportunity
20 Significant investment opportunity in both operational and new build renewable energy projects
Sources
2012 Capacity: Wind Statistics - RenewableUK (4 Jul 2013), PV Statistics – DECC (Nov 2012), Capacity Forecast –
National Grid (Sep 2012)
2020 Capacity: DECC UK Renewable Energy Roadmap 2011 (and 2012 update), average of central scenario range
Note: Enterprise value assumes £2m/MW for Onshore Wind, £3m/MW for Offshore Wind and £1.4m/MW for Solar PV
-
5.0
10.0
15.0
20.0
25.0
30.0
35.0
40.0
45.0
2012 2020
Onshore Wind Offshore Wind
Solar PV
Cumulative MW installed
UK Renewable Capacity & Investments
£2bn
£10bn
£13bn
£25bn
£20bn
£44bn
£23bn
£87bn
12%
34%
% of UK Installed Capacity
£bn values – total investment
UK Energy Shortfall
Source: UK Power Consultant (Q4 2013)
Material conventional plant closures:
• c.9GW of fossil plants recently closed (2012-2013), with material additional
closures expected
Rising electricity prices:
• Shortfall in supply will likely lead to significant increases in UK power prices
Potential for
supply / demand
gap
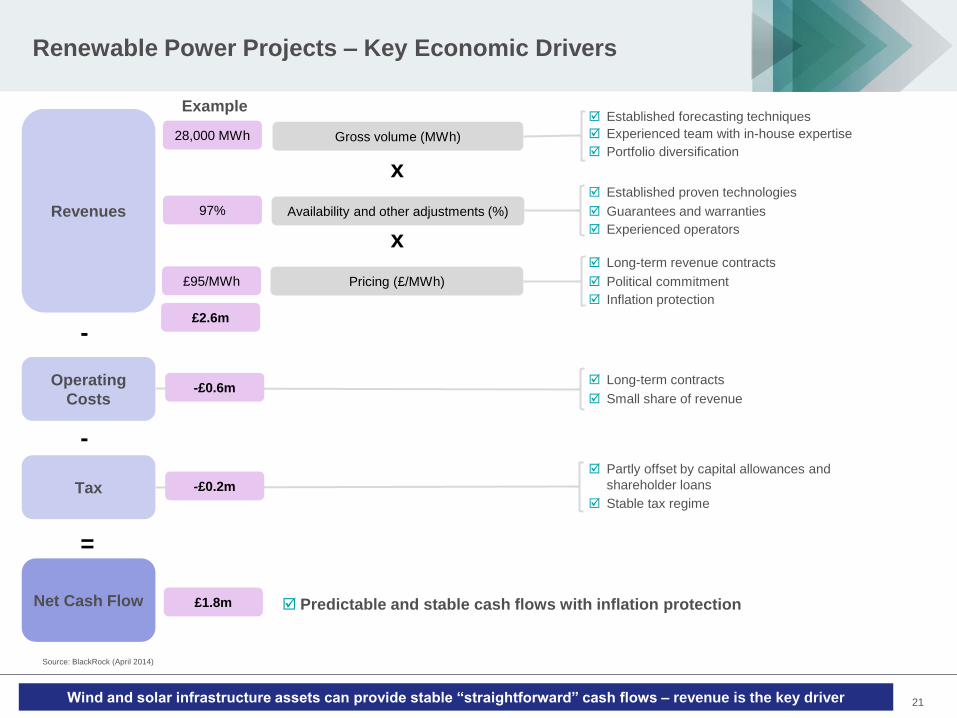
Renewable Power Projects – Key Economic Drivers
21
Revenues
Operating
Costs
Tax
Net Cash Flow
=
-
-
Gross volume (MWh)
Availability and other adjustments (%)
Pricing (£/MWh)
x
x
Established forecasting techniques
Experienced team with in-house expertise
Portfolio diversification
Established proven technologies
Guarantees and warranties
Experienced operators
Long-term revenue contracts
Political commitment
Inflation protection
Long-term contracts
Small share of revenue
Partly offset by capital allowances and
shareholder loans
Stable tax regime
Predictable and stable cash flows with inflation protection
Wind and solar infrastructure assets can provide stable “straightforward” cash flows – revenue is the key driver
28,000 MWh
Example
97%
£95/MWh
-£0.6m
£2.6m
-£0.2m
£1.8m
Source: BlackRock (April 2014)

Portfolio Analysis – Illustrative £400m UK Portfolio
22 Portfolio would generate an 8%+ gross IRR, with benefit of inflation protection
Technology Split
50%
20%
30%
Onshore Wind Offshore Wind
Solar PV
Construction Exposure
70%
30%
Operating Construction
Revenue Split
38% 22%
22% 49%
9% 5%
32% 24%
0%
20%
40%
60%
80%
100%
120%
£400m £1,000m
ROCs FiT Fixed PPA Power price
Fund Size
Estimated Gross Cash Yield and Net Asset Value
-
100
200
300
400
500
600
0%
2%
4%
6%
8%
10%
12%
201
4
201
5
201
6
201
7
201
8
201
9
202
0
202
1
202
2
202
3
202
4
202
5
202
6
202
7
202
8
202
9
203
0
203
1
203
2
203
3
203
4
203
5
203
6
203
7
203
8
203
9
204
0
204
1
204
2
204
3
204
4
204
5
204
6
Cash Yield
NAV
Source: BlackRock Renewable Power model (January 2014)
Note: Based on £400m investment size. Additional assumptions
available upon request. The manager cannot guarantee that the
intended target rate will be achieved. In addition, over time the
target rate is subject to change
Source: BlackRock Renewable Power model (October 2013)
Note: % of committed capital based on £400m fund size
Source: BlackRock Renewable Power model (January 2014) Source: BlackRock Renewable Power model (January 2014)
c.100MW
c.100MW
c.30MW

Disclaimer
Issued by BlackRock Investment Management (UK) Limited, authorised and regulated by the Financial Conduct Authority (“FCA”). Registered office: 12 Throgmorton
Avenue, London, EC2N 2DL. Tel: 020 7743 3000. Registered in England No. 2020394. For your protection telephone calls are usually recorded. BlackRock is a
trading name of BlackRock Investment Management (UK) Limited. This material is for distribution to Professional Clients (as defined by the FCA Rules) and should
not be relied upon by any other persons.
Past performance is not a guide to future performance. The value of investments and the income from them can fall as well as rise and is not guaranteed. You may
not get back the amount originally invested. Changes in the rates of exchange between currencies may cause the value of investments to diminish or increase.
Fluctuation may be particularly marked in the case of a higher volatility fund and the value of an investment may fall suddenly and substantially. Levels and basis of
taxation may change from time to time.
Any research in this document has been procured and may have been acted on by BlackRock for its own purpose. The results of such research are being made
available only incidentally. The views expressed do not constitute investment or any other advice and are subject to change. They do not necessarily reflect the
views of any company in the BlackRock Group or any part thereof and no assurances are made as to their accuracy.
The document may contain “forward-looking statements” which can be identified by the use of forward-looking terminology as well as simulated performance intended
for illustrative purposes only. Due to various risks and uncertainties inherent in the capital markets or otherwise facing the asset management industry, actual events
or results or the actual performance of an investment opportunity that may be offered by BlackRock relating to this presentation may differ materially from those
reflected or contemplated in such forward-looking statements. The information contained in this presentation is proprietary and confidential and may contain
commercial or financial information, trade secrets and/or intellectual property of BlackRock and its respective affiliates
This document is for information purposes only and does not constitute an offer or invitation to anyone to invest in any BlackRock funds and has not been prepared in
connection with any such offer.
The opinions expressed are as of November 2013 and may change as subsequent conditions vary. The information and opinions contained in this material are
derived from proprietary and non-proprietary sources deemed by BlackRock to be reliable, are not necessarily all inclusive and are not guaranteed as to accuracy.
There is no guarantee that any forecasts made will come to pass. Any investments named within this material may not necessari ly be held in any accounts managed
by BlackRock. Reliance upon information in this material is at the sole discretion of the reader.
The product described does not exist and the purpose of these materials is to assist in product development and to ascertain market interest; these materials do not
constitute an offer to sell, or a solicitation of an offer to sell, securities in any jurisdiction or to any person.
23