Airport Systems Planning & Design / RdN Forecasting Dr. Richard de Neufville Professor of...
26
Airport Systems Planning & Design / RdN Forecasting Dr. Richard de Neufville Professor of Engineering Systems and Civil and Environmental Engineering Massachusetts Institute of Technology
-
Upload
allyson-booker -
Category
Documents
-
view
219 -
download
1
Transcript of Airport Systems Planning & Design / RdN Forecasting Dr. Richard de Neufville Professor of...

Airport Systems Planning & Design / RdN
Forecasting
Dr. Richard de Neufville
Professor of Engineering Systems and
Civil and Environmental Engineering
Massachusetts Institute of Technology
Airport Systems Planning & Design / RdN
Forecasting In Practice
Objective: To present procedure.Topics:
1. Premises
2. Many Assumptions underlie forecast methods
3. Basic mechanics of forecast methods
4. Principles for Practice
5. Recommended Procedure
6. Mexico City Example
7. Current International Considerations
8. Summary

Airport Systems Planning & Design / RdN
Premises
Forecasting is an Art,
not a Science -- too many assumptions
not a statistical exercise -- too many solutions
Forecasts are Inherently Risky

Airport Systems Planning & Design / RdN
Assumptions behind any forecasting exercise
Span of data -- number of periods or situations (10 years? 20? 30?)
Variables -- which ones in formula (price? income? employment? etc)
Form of variables -- total price? price relative to air? To ground?
Form of equation -- linear? log-linear? translog?

Airport Systems Planning & Design / RdN
Common forms of forecasting equations
Linear Pax = Population[a +b(Income)+c(Yield)…]
Exponential Pax = {a [Yield]b}{c [population] d} {etc…}
Exponential in Time Pax = a [e]rt
where r =rate per period and t = number of periods
Airport Systems Planning & Design / RdN
Fundamental Mathematics of Regression Analysis
Linear equations Logarithm of exponential form => linear
Define “fit” = sum of squared differences of equation
and data, (y1-y2)2
=> absolute terms, bell-shaped distribution
Optimize fit differentiate fit, solve for parameters R-squared measures fit (0 < R2 <1.0)
Airport Systems Planning & Design / RdN
Ambiguity of Results -- Many ‘good’ results possibleCommon variables (employment,
population, income, etc) usually grow exponentially ~ a(e)rt
They are thus direct functions of each other a(e)rt =[(a/b)(e)(r/p)t]b(e)pt
Easy to get ‘good’ fit See Miami example
Airport Systems Planning & Design / RdN
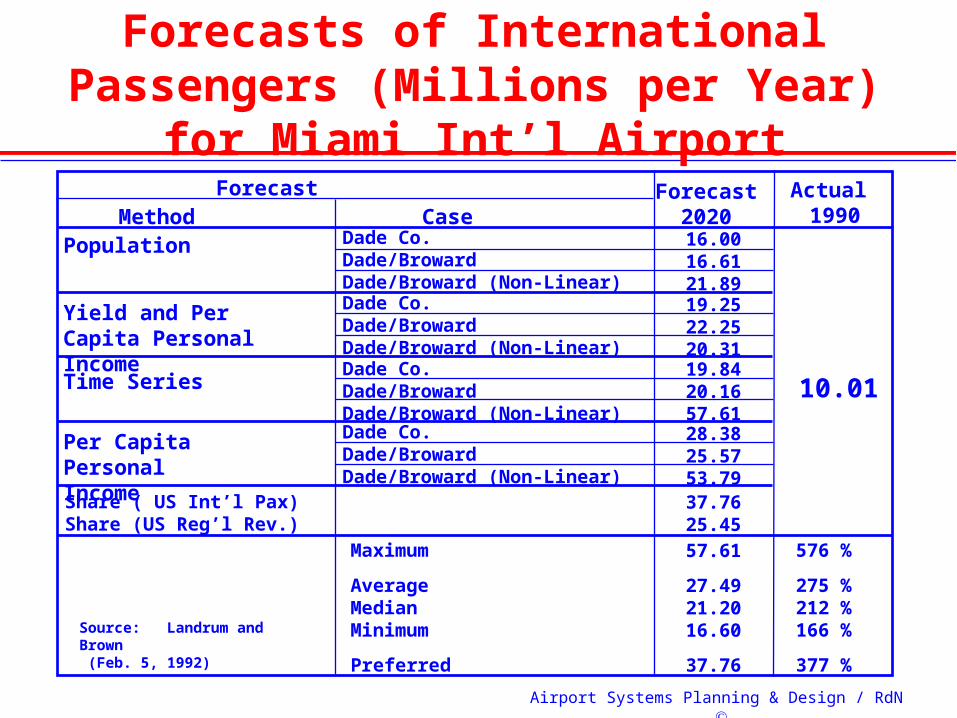
Forecasts of International Passengers (Millions per Year) for Miami Int’l Airport
Dade Co.Dade/BrowardDade/Broward (Non-Linear)Dade Co.Dade/BrowardDade/Broward (Non-Linear)Dade Co.Dade/BrowardDade/Broward (Non-Linear)Dade Co.Dade/BrowardDade/Broward (Non-Linear)
Population
Yield and Per Capita Personal Income
Time Series
Per Capita Personal Income
Share ( US Int’l Pax)Share (US Reg’l Rev.)
Maximum
AverageMedianMinimum
Preferred
ForecastMethod Case
16.0016.6121.89
Forecast 2020
Actual 1990
19.2522.2520.3119.8420.1657.6128.3825.5753.79
57.61
27.4921.2016.60
37.76
37.7625.45
10.01
576 %
275 %212 %166 %
377 %
Source: Landrum and Brown (Feb. 5, 1992)

Airport Systems Planning & Design / RdN
Forecasts of Domestic Passengers (Millions per year) for Miami Int’l Airport
Dade Co.Dade/BrowardDade/Broward (Non-Linear)Dade Co.Dade/BrowardDade/Broward (Non-Linear)Dade Co.Dade/BrowardDade/Broward (Non-Linear)Dade Co.Dade/BrowardDade/Broward (Non-Linear)
Population
Yield and Per Capita Personal Income
Time Series
Per Capita Personal Income
Share of US TrafficMaximum
AverageMedianMinimum
Preferred
ForecastMethod Case
13.9615.3517.74
Forecast 2020
Actual 1990
19.8719.6919.1317.4118.6740.0526.5824.3442.40
42.40
22.9719.6913.96
15.35
23.48
9.92
427 %
232 %198 %141 %
155 %
Source: Landrum and Brown (Feb. 5, 1992)

Airport Systems Planning & Design / RdN
Note Use of “preferred” forecast
Forecasts obtained statistically often “don’t make sense”
Forecasters thus typically disregard these results substituting intuition (cheap) for math (very expensive)
E.g.: NE Systems Study (SH&E, 2005)“The long-term forecast growth… was
inconsistent with…expectations…[and] were revised to… more reasonable levels”

Airport Systems Planning & Design / RdN
Domestic Pax for Miami update for 2004
Forecast Method and Variant Actual
Method Data Used (form)
Forecast
2020 1990 2000
Dade Country 13.96
Dade and Broward 15.35Population
Dade and Broward (non-linear) 17.74
Dade County 19.87
Dade and Broward 19.69
Yield and Per
Capita Personal
Income Dade and Broward (non-linear) 19.13
Dade County 17.41
Dade and Broward 18.67Time Series
Dade and Broward (non-linear) 40.05
Dade County 26.58
Dade and Broward 24.34
Per Capita
Personal Income
Dade and Broward (non-linear) 42.40
Share of US 23.48
Maximum 42.40
Average 22.97
Medium 19.69
Minimum 13.96
9.92 17.4
Preferred 15.35
Actual2004: ~ 16.0

Airport Systems Planning & Design / RdN
Principles for forecasting in practice
Detailed Examination of DataStatistics are often inconsistent, wrong, or
otherwise inappropriate for extrapolation
Extrapolation for Short Term,About five years
Scenarios for Long Term,Allowing for basic changes
Ranges on Forecasts,As wide as experience indicates is appropriate
Airport Systems Planning & Design / RdN
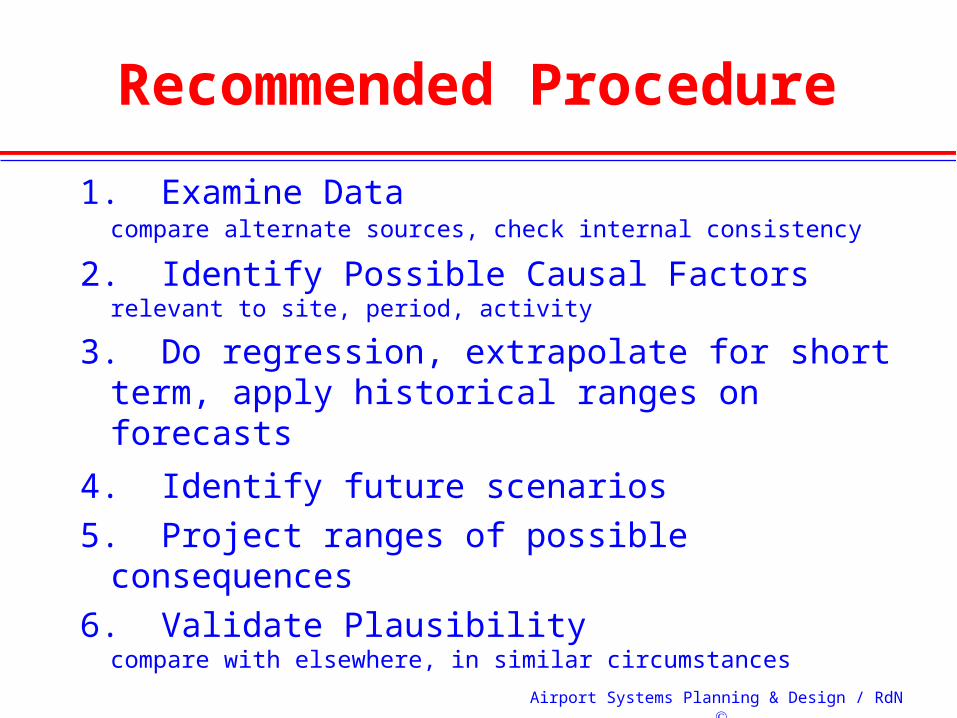
Recommended Procedure
1. Examine Datacompare alternate sources, check internal consistency
2. Identify Possible Causal Factorsrelevant to site, period, activity
3. Do regression, extrapolate for short term, apply historical ranges on forecasts
4. Identify future scenarios
5. Project ranges of possible consequences
6. Validate Plausibilitycompare with elsewhere, in similar circumstances

Airport Systems Planning & Design / RdN
Passengers, Mexico City International Airport (AICM)
0
2
4
6
8
1960 1968 1976
Air
Passe
ng
ers
Th
rou
gh
Me
xic
o C
ity
(millio
ns)
.
Total National International

Airport Systems Planning & Design / RdN
Mexico City -- Data Problems
Typographical ErrorSeen by examination of primary data(Compare with Los Angeles)
Double CountingIntroduced in series by a new category of data
New Definitions of CategoriesDetected by anomalies in airline performance (pax per aircraft) for national, internat’l traffic
These problems occur anywhere

Airport Systems Planning & Design / RdN
Passengers Through AICM (Corrected Version)
8
6
4
2
1960 1968 1976
Co
rrec
ted
Air
Pas
sen
ger
sT
hro
ug
h M
exic
o C
ity
(106 )
Total
National
International

Airport Systems Planning & Design / RdN
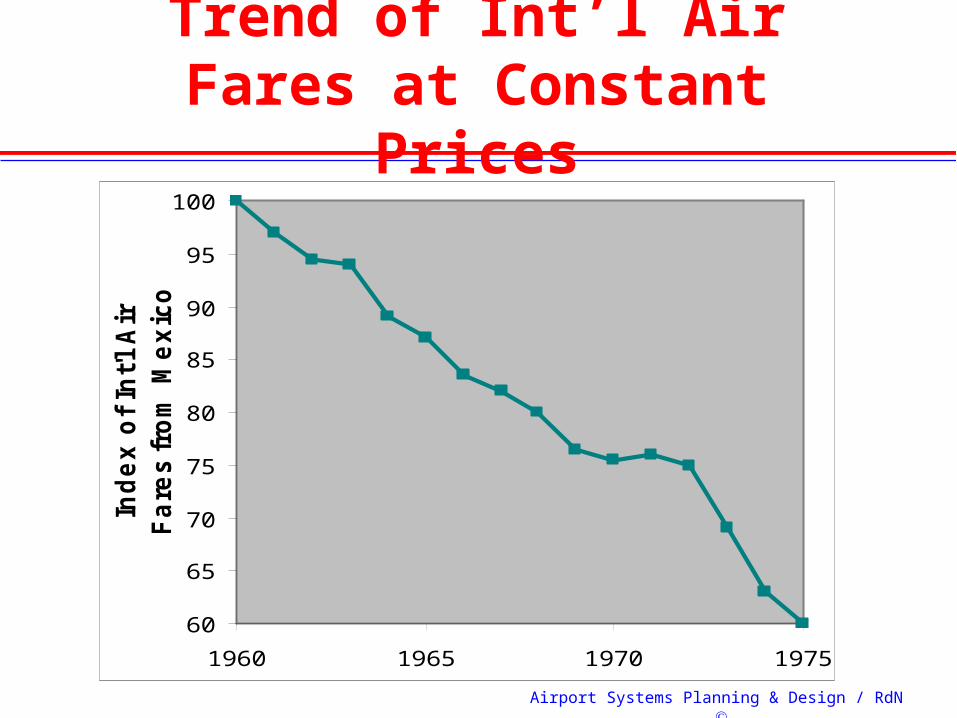
Mexico City -- Causes of Trends
Economic BoomPost 1973 oil prosperity
Recessions ElsewhereAffecting international traffic
Population GrowthFare Cuts
Relative to other commodities

Airport Systems Planning & Design / RdN
Population Increase of Mexico City’s Met. Area
0
2.5
5
7.5
10
12.5
1960 1968 1976Pop
ula
tion
of
Mexic
o C
ity (
Million
s)
Airport Systems Planning & Design / RdN
Trend of Int’l Air Fares at Constant Prices
60
65
70
75
80
85
90
95
100
1960 1965 1970 1975
Ind
ex
of
Int'l
Air
.
Fa
res
fro
m M
ex
ico
.

Airport Systems Planning & Design / RdN
Mexico City -- Note
Traffic formula based on these variables (or others) does not solve forecasting problem.
Formula displaces problem, from traffic to other variables.
How do we forecast values of other variables?
Airport Systems Planning & Design / RdN
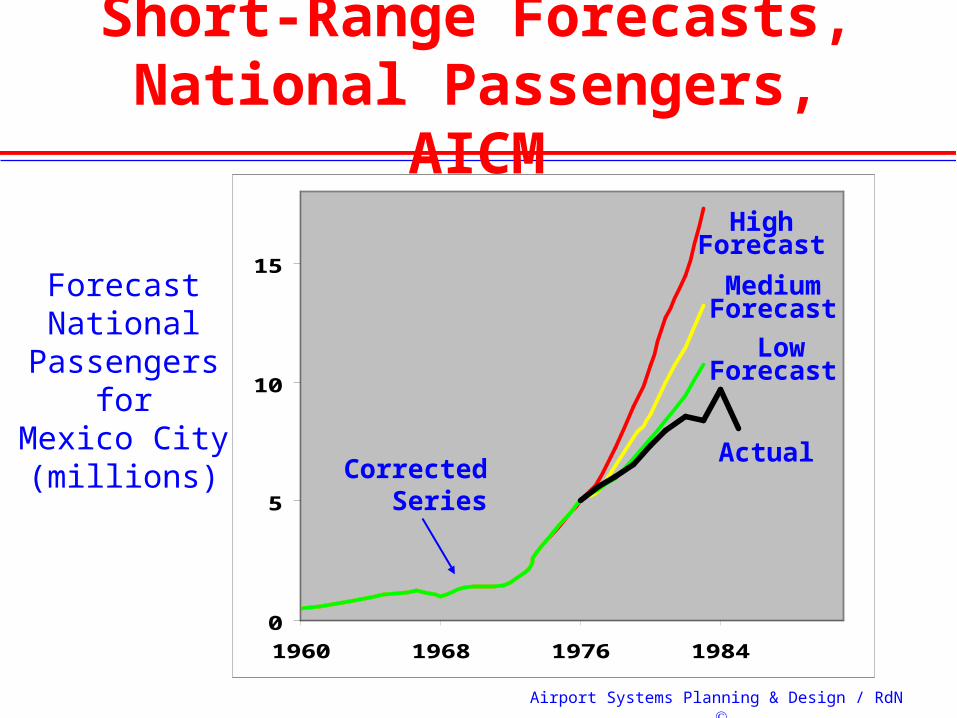
Short-Range Forecasts, National Passengers, AICM
0
5
10
15
1960 1968 1976 1984
HighForecast
MediumForecast
LowForecast
ActualCorrected Series
ForecastNational
Passengersfor
Mexico City(millions)

Airport Systems Planning & Design / RdN
Short-Range Forecasts, International Pax. AICM
0
1.5
3
4.5
1960 1968 1976 1984
ForecastInternationalPassengers
forMexico City
(millions)
High Forecast
Med. Forecast
Low Forecast
Actual
Corrected Series

Airport Systems Planning & Design / RdN
Mexico City -- Elements of Long-range Scenarios
Demographics Rate of Population Increase Relative Size of Metropolis
Economic FutureFuel Prices and General CostsTechnological, Operational
ChangesTiming of Saturation
Airport Systems Planning & Design / RdN
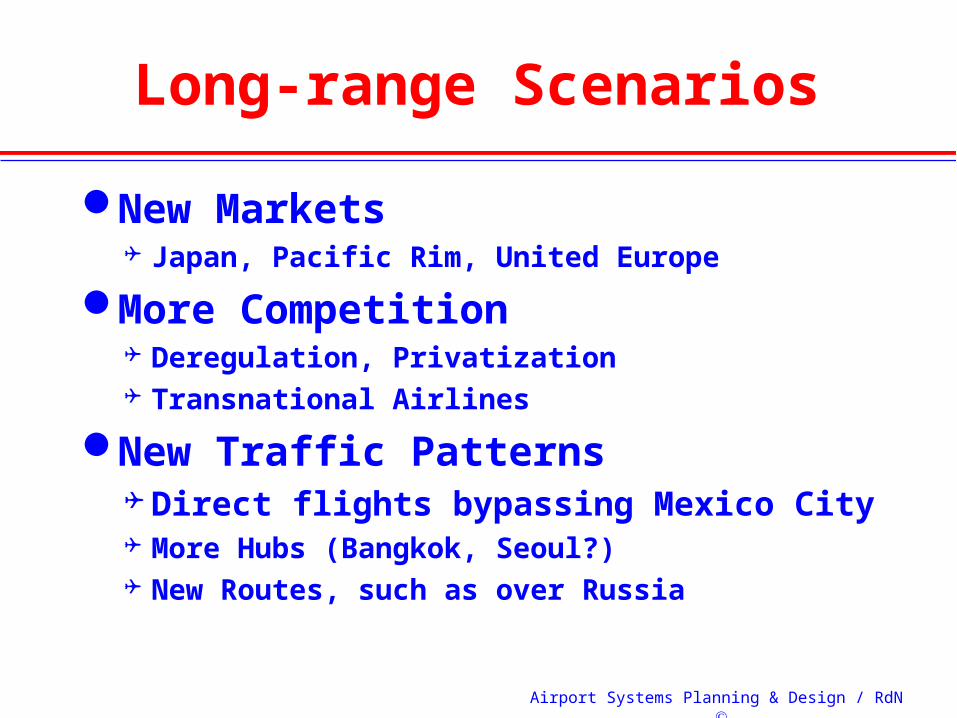
Long-range Scenarios
New Markets Japan, Pacific Rim, United Europe
More Competition Deregulation, Privatization Transnational Airlines
New Traffic Patterns Direct flights bypassing Mexico City More Hubs (Bangkok, Seoul?) New Routes, such as over Russia

Airport Systems Planning & Design / RdN
Long Term AICM Forecasts, validated by data elsewhere
0
5
10
15
20
25
30
1960 1976 1992
Pa
ss
en
ge
rs (
mil
lio
ns
)
Mexico CityForecast(High)
Mexico CityForecast(Mid)
Mexico CityForecast(Low)
Los Angeles
London
Osaka

Airport Systems Planning & Design / RdN
Summary
Forecasting is not a Science too many assumptions too much ambiguity
Regression analysis for short term Apply historical ranges on projections
Scenarios for Long range compare with experience elsewhere
STRESS UNCERTAINTY